Advanced Technical Analysis – Candlesticks part 2
This article is a continuation from part 1, where we learned that the Japanese candlestick is the most widely used technical tool used by traders across the globe. Japanese candlesticks were invented in the early 15th century by the Japanese government of the time. They were used to record price movements on Japan’s rice exchange. At this time, rice was not only the primary dietary staple, but it was also a unit of exchange. Candlesticks are used in trading most of the asset classes. However, they are a particular favorite in the Forex community.
Example A
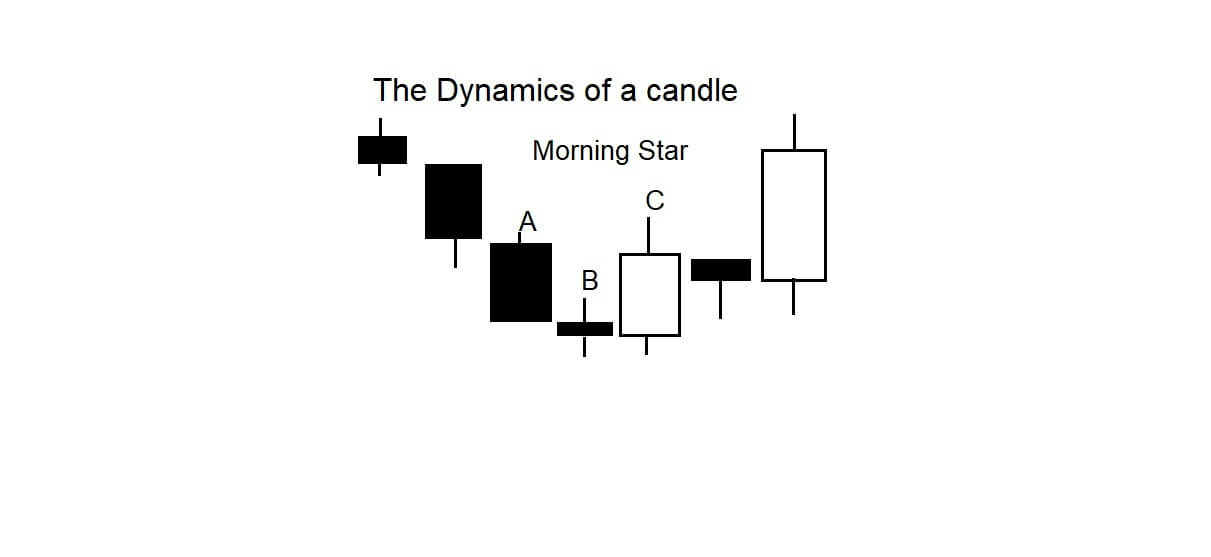
Example A is the Morning Star set up. We can see that this is a reversal pattern formation of the Evening Star from part one. This three candlestick formation, as seen as A, B, and C, features a descending candlestick at position A, followed by a spinning top, B, which usually denotes a possible change in direction, followed by an ascending candlestick C, and where this is the beginning of the upward move in this example. Keep an eye out for these three candlestick formation setups in the form of the Morning and Evening Star, which usually means that a change in trend is imminent.
Example B
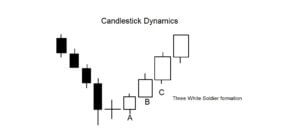
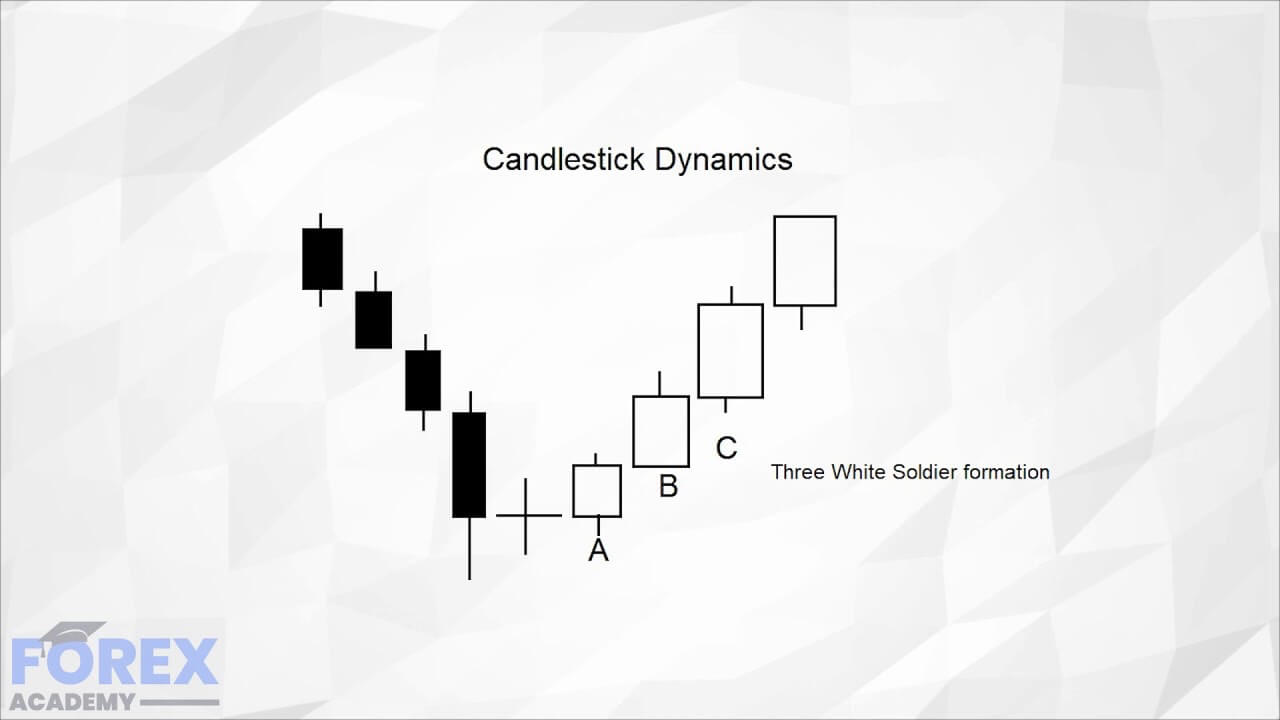
In Example B we have a downward trend which ends with a spinning top, and then a triple formation of the A, B, C, ascending candles which is known as three white soldiers and typically shows the end of a bearish trend, and confirmation that a strong uptrend is underway.
For the three white soldiers to be confirmed the first candlestick at position A, must be a reversal candlestick, and candlestick be the second candlestick should be bigger than candlestick A. Also, candlestick C should be at least the same size as B, with small or no shadows.
Example C
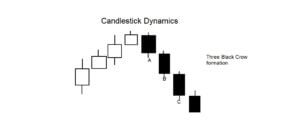
Example C, is a bearish reversal, and helps traders to define a downward trend. The A, B, C, formation is known as Three Black Crows. For this formation to be confirmed, the first candlestick at position A needs to be a reversal, and candlestick B must be larger than candlestick A, with small or no shadows. And where candlestick C, should be at least the same size or bigger than candlestick B, with small or no shadows.
Example D
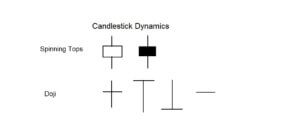
Example D shows some examples of spinning tops. These candlesticks will typically have long legs and short bodies and tell traders that there is a lack of volume and liquidity in the market. These types of candlesticks can often be found when the market is consolidating, through a lack of direction, and where traders are waiting for a new time zone to open, or perhaps the release of economic data, and therefore, this type of candlestick should be treated with caution.
The second type of candlesticks we can see are known as Doji. These are considered by traders as neutral. They show very thin trading conditions, with a lack of volatility, and offer no clues as to future directional trends.
Example E
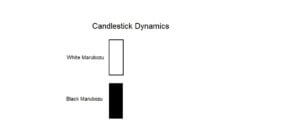
Example E, is the bullish White Marubozu. This will always have a large ascending body with no shadows. It tells traders that a large amount of liquidity has gone into the market during this particular time frame and that it was a strong move and was possibly caused by a breakout, or due to an economic or fundamental news release. This type of candlestick would usually be found during an upward trend and would suggest that the buyers have control and that, therefore, a continuation to the upside is very much on the cards. On the flip side, the bearish, Black Marubozu candlestick is directly opposite to its white counterpart and tells traders that the sellers are currently in control and that a continuation to the downside may follow.
Example F
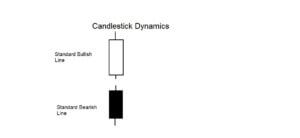
Example F, is of a standard bullish line candlestick, which tells traders that buyers are mostly in control during this time frame. There is a little bit of pullback from the top and the bottom, as defined by the shadows, but overall a good amount of liquidity has gone into the market during this time frame, and this is therefore considered to be a strong move to the upside. The standard, bearish line, just below, is a strong bearish candle and tells traders that a reasonable amount of liquidity is going into the market during this time frame and that the sellers are mostly in control. The standard bullish and bearish candlesticks are favored by traders because they confirm liquidity is present, and they typify a continuation in trend.
Example G
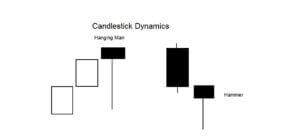
In example G, we can see umbrella shapes, the first of which is a hanging man, because it is formed at the top of a trend, and is the same shape as a hammer. The second shape is a hammer, but which is defined by it appearing at the bottom of a trend. These shapes often depict a change in direction
While candlestick shapes and formations give traders and wealth of information and are extremely useful in predicting trends, periods of consolidation, and showing the possible end of a trend, they are, at the end of the day, just technical indicators and are not 100% reliable. Therefore they should be used with caution and in conjunction with other technical tools in order to increase the odds in a trader’s favor. Always remember the smaller the real body, the weaker the trend, and that this will typically reflect consolidation in the market, when uncertainty exists, and perhaps where traders are squaring positions or looking for a potential reversal or a correction. Lengthening shadows usually show the existence of weakness in a trend and also tell traders that a possible reversal in trend is on the horizon.