Buying & Selling The Forex Market – The Path To Financial Freedom
There is an old adage in the financial markets: buy at the bottom and sell at the top.
This might be better applied to the second-hand car or housing markets than the financial markets. In truth, it is meaningless in the Forex market, but it has strong connotations.
Within the Forex market, a currency pair, in theory, has no top and no bottom! Rather one currency can be valued against another currency as having an intrinsic value that fluctuates either below, above, or at parity with the counter currency within the pair being traded.

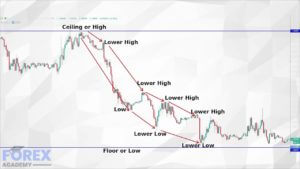
Therefore within the Forex market, we have a multitude of various levels that can be broken down into floors and ceilings, which are also known as areas of support and resistance. And so as traders, we look to buy and sell currency pairs from areas of support up to areas of resistance, or to sell them from areas of resistance to areas of support. We then look for continuations or signs that we should exit our trades.
Source: Our own YouYube presentation here.
The absolute best way to ascertain where these areas of floors and ceilings are is by way of technical analysis. Traders then use trend lines and other technical tools on their charts in order to highlight where the price action of a pair will bottom or top out and reverse. Of course, traders would love to execute a trade and have it roll on in their favor for a couple of hundred pips every trade. In reality, it hardly ever happens like this. Even the most reliable technical analysis, set-ups will not work 100-percent of the time. What really matters most is that a trader’s methodology or style means that they consistently win more trades than they lose and that each winning trade is greater than each losing trade. And therefore, traders must incorporate tight stop losses while utilizing their tried and tested trading criteria.
Now let’s break down a buy trade to its bare bones. But before we do so, let’s just go back to our adage for one moment: buy at the top and sell at the bottom. As traders in the Forex market, we have to establish where the multitude of tops and bottoms are in order to give us an advantage in our trading. When you break trading down into its base elements, traders simply like to push an asset as far as it will go. In other words, in Forex, they buy a currency pair until it runs out of steam and stalls at a ceiling, and then after a period of consolidation, they will either continue buying it, or they will reverse the process and start selling it far as they can.
Example A
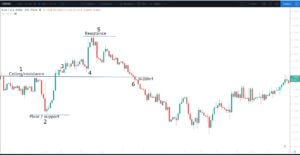
Let’s turn our attention to example ‘A.’ This is a 4-hour chart of the EURUSD pair. Always read a chart from left to right because it tells a story. Here we can see that price action was unable to go rise above the ceiling or resistance level at position 1. Traders then pushed the pair down by selling it to the area of support at position 2. Price action then goes up to the previous ceiling, and this time punches through at position 3. Price action moves a little bit higher before falling back at position 4 and where our previous ceiling has now become an area of support. Traders now start buying the pair all the way up to another area of resistance labeled 5. When they could not push it any higher price action moves down to the previous area of support at position 6 and this time punches through. We then find a continuation trend to the downside.
Example B
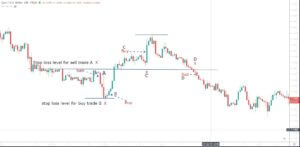
Let’s take a look at the example ‘B,’ which is the same as our previous chart of the EURUSD pair, but where we have Incorporated some potential buy and sell levels. Again, using our levels of support and resistance, we are looking for opportunities when the market pulls away from these levels. At position ‘A,’ we find that the market is moving below the area of resistance, which presents a selling opportunity and where a stop loss marked ‘X’ is placed just a few pips above the resistance line.
When price stalls to the downside, we are presented with a buying opportunity at position ‘B,’ and where our stop loss should be placed a few pips underneath the lowest candlestick at the support area.
At position ‘C’ price action fails back to the support area, we get a second buy opportunity as marked by the arrow and where traders would typically place a stop loss just under the previous resistance level and which has now become a support level. Now it could be that traders are still long having bought the pair at position ‘B.’ But later in the chart, when buyers lose momentum we see price action fall below the support line we have a sell opportunity at position ‘D’ and where our stop loss should be placed a few pips above this level of resistance.
So when it comes to buying and selling a currency pair, we look for defined areas of support and resistance and, more importantly, areas where traders push through these levels, which is typically when we might see a continuation in price action in either direction.