
Price action traders combine multiple time frames to trade. In most cases, they use a time frame to determine the trend and use the next one to trigger an entry. The most important factor in using multiple time frames is the combination. Usually, the combinations are Daily Chart with H4 Chart, H4 Chart with H1 Chart, H1 Chart with 15M Chart, and 15M Chart with 5M Chart. In today’s lesson, we are going to demonstrate an example of the combination of Daily and H4 Chart produces an entry.

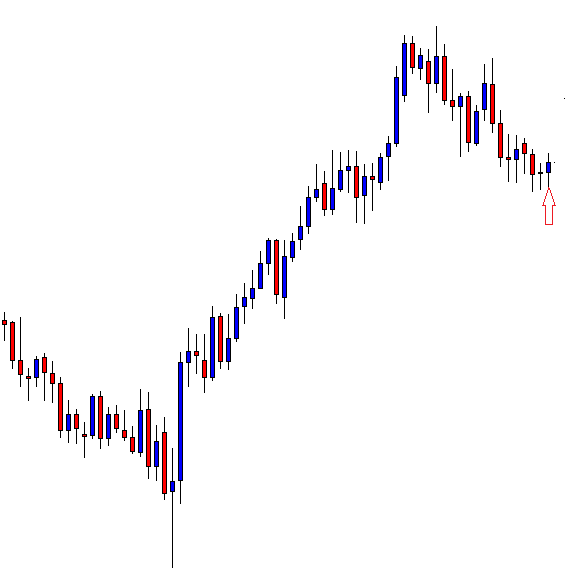
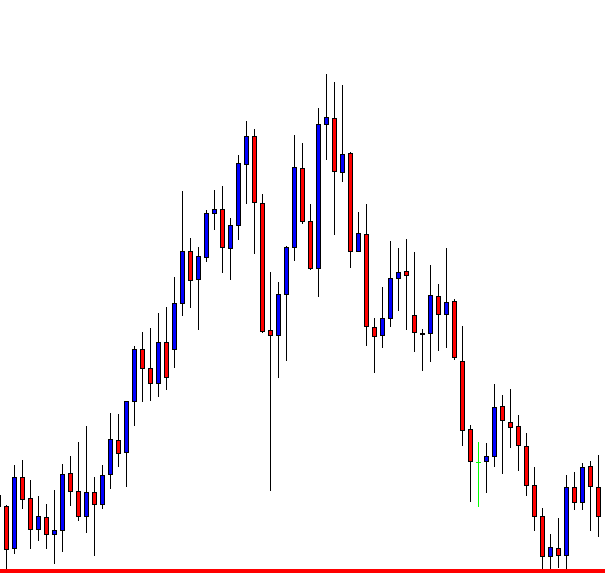
This is a daily chart. In an uptrend, the price had a pullback. It produces a Doji candle followed by an engulfing candle (arrowed). The buyers may want to draw a support level here. Please note, it is not a Morning Star.
It is neither a Moring Star nor a Double Bottom. The price heads towards the North with good buying momentum. Many of us may think we miss an opportunity. The pair may have offered entries on minor time frames, but the daily chart does not provide anything yet.
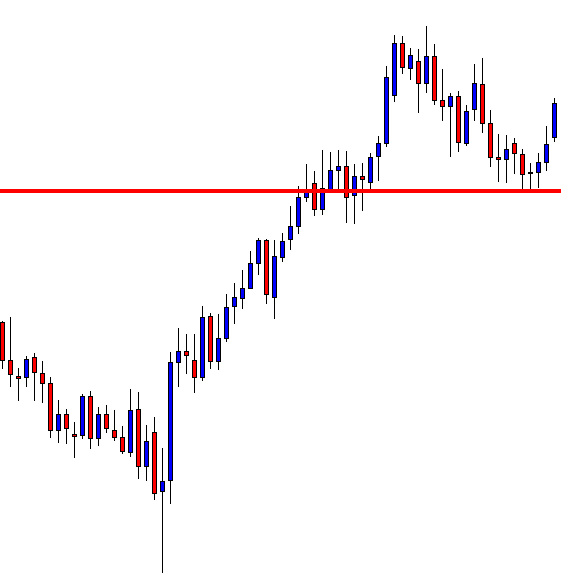
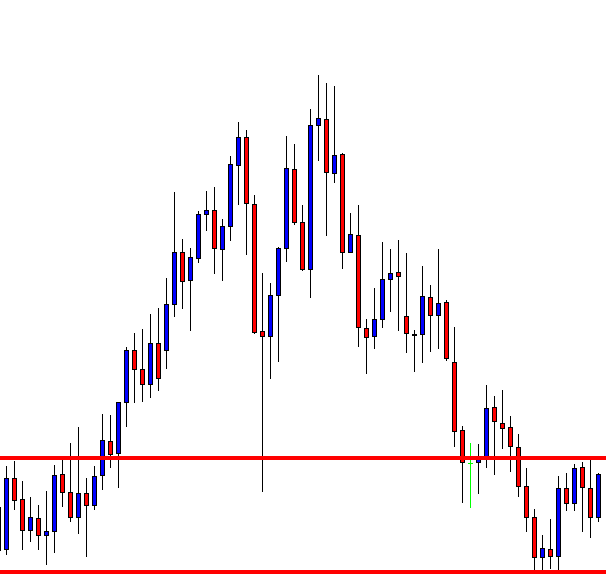
Here we are. The price heads towards the support again. As far as the Daily chart is concerned, the price had a bounce at the level earlier. Thus, if the level produces a daily bullish reversal candle, the buyers are going to get themselves busy to look for long opportunities. Let us proceed to find out what happens next.

The last bearish candle closes within the marked level. This is a sign that the price may obey the support. However, we never know unless it produces a bullish daily reversal candle.
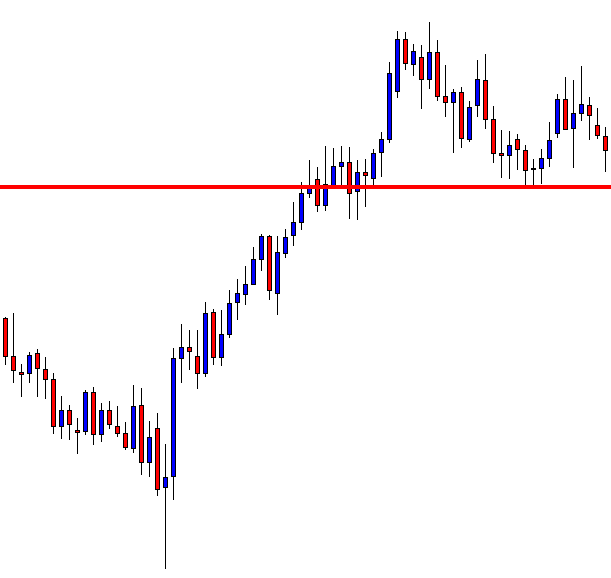
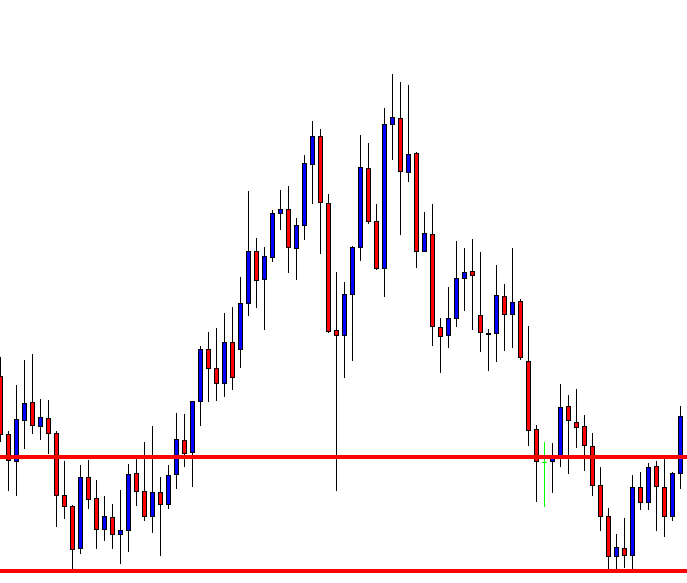
Here we are. The level produces an Inside Bar. It is not a robust bullish reversal candle. Nevertheless, it is a reversal candle. Do you know what the price action traders do next? They flip over to the H4 chart. Have a look at the H4 chart.
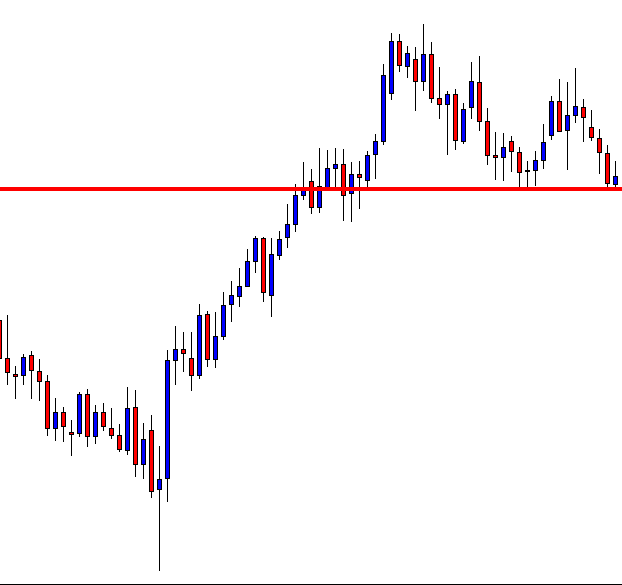
Since we are analyzing the daily chart, the trigger chart shall be the H4 chart. The H4 chart shows that the price is on consolidation. The buyers need to wait for bullish momentum.
The chart produces an H4 bullish reversal candle, although the resistance is still intact. Thus, the buyers need a breakout at that level. They must wait for it.
Here it comes. A Marubozu bullish candle breaches the resistance. The buyers may trigger a long entry right after the candle closes. Let us proceed to find out what the price does next.
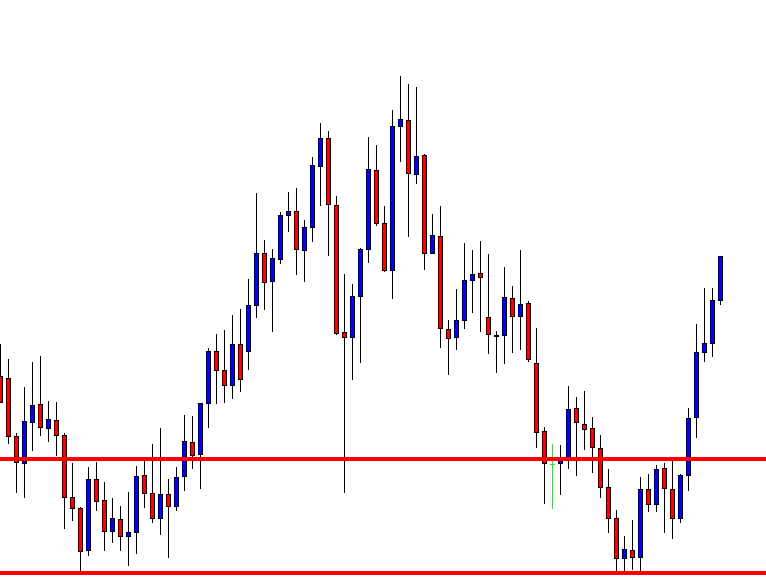
As expected, the price heads toward the North with good buying momentum. There is enough space for the price to travel. It may go further North as well. Anyway, let us concentrate on what we have learned from these examples.
- Using multiple time frames is one of the key components of price action trading.
- The right combination of multiple time frames is essential.
We are going to learn more about using multiple time frames in our forthcoming lessons. Stay tuned.