Categories
Crypto Market Analysis

Daily Crypto Review, July 10 – Tether and Bitfinex on Trial for $850 million? Tether Holders: Watch Out!

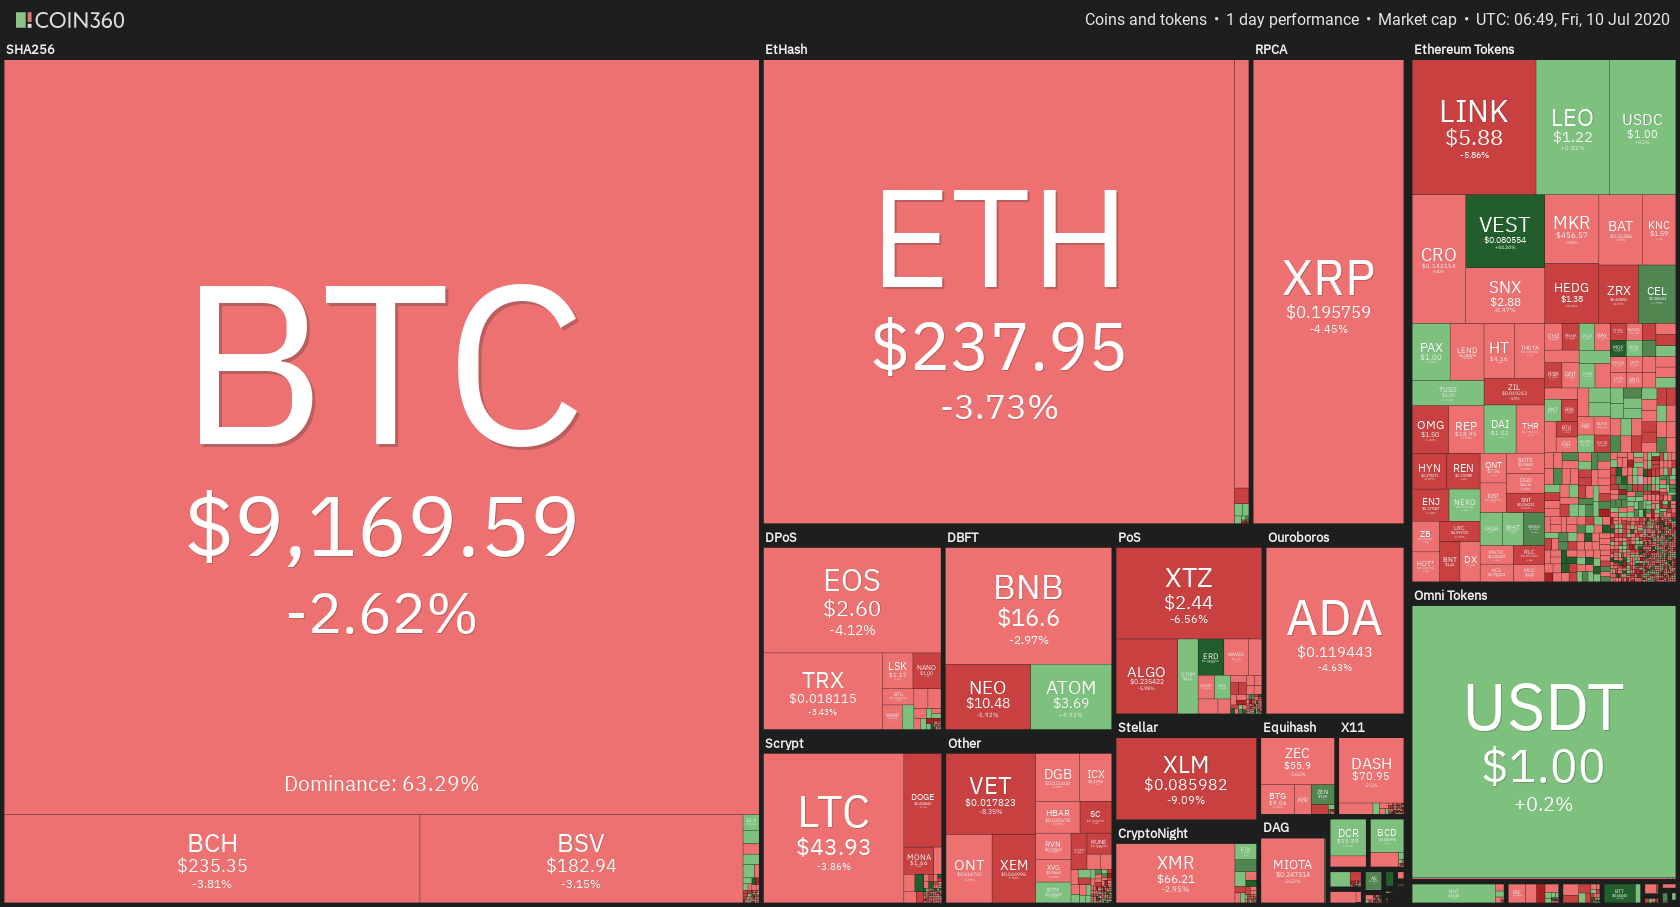
The cryptocurrency market was mostly in the red in the past 24 hours, with Bitcoin currently trading for $9,169, which represents a decrease of 2.62% on the day. Meanwhile, Ethereum lost 3.73% on the day, while XRP lost 4.45%.

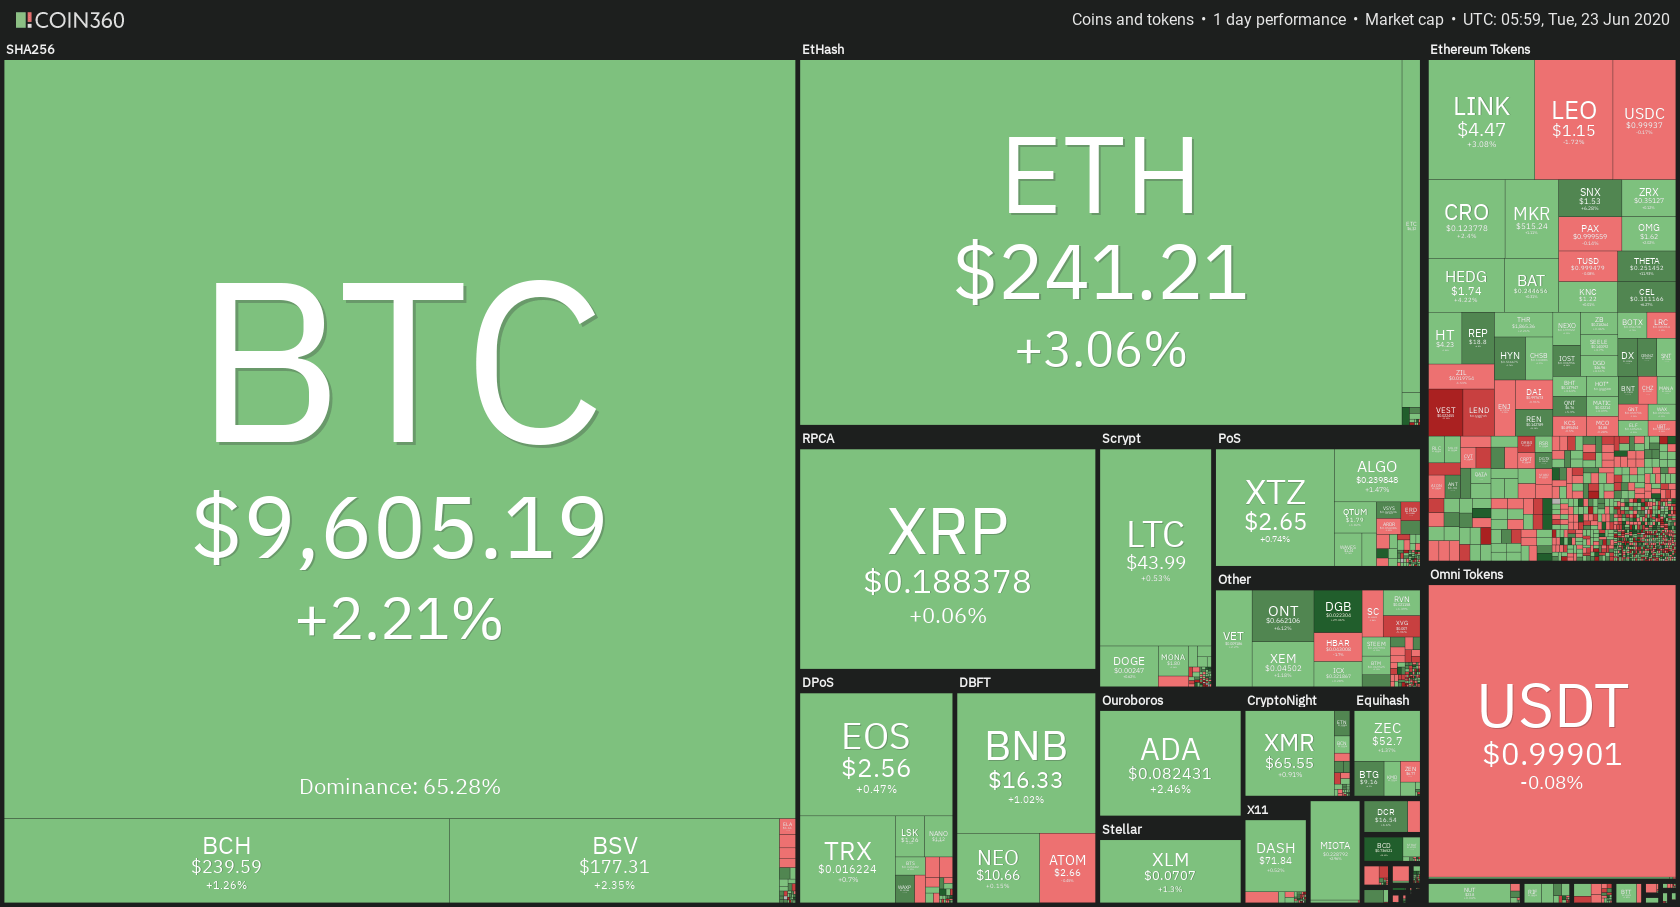
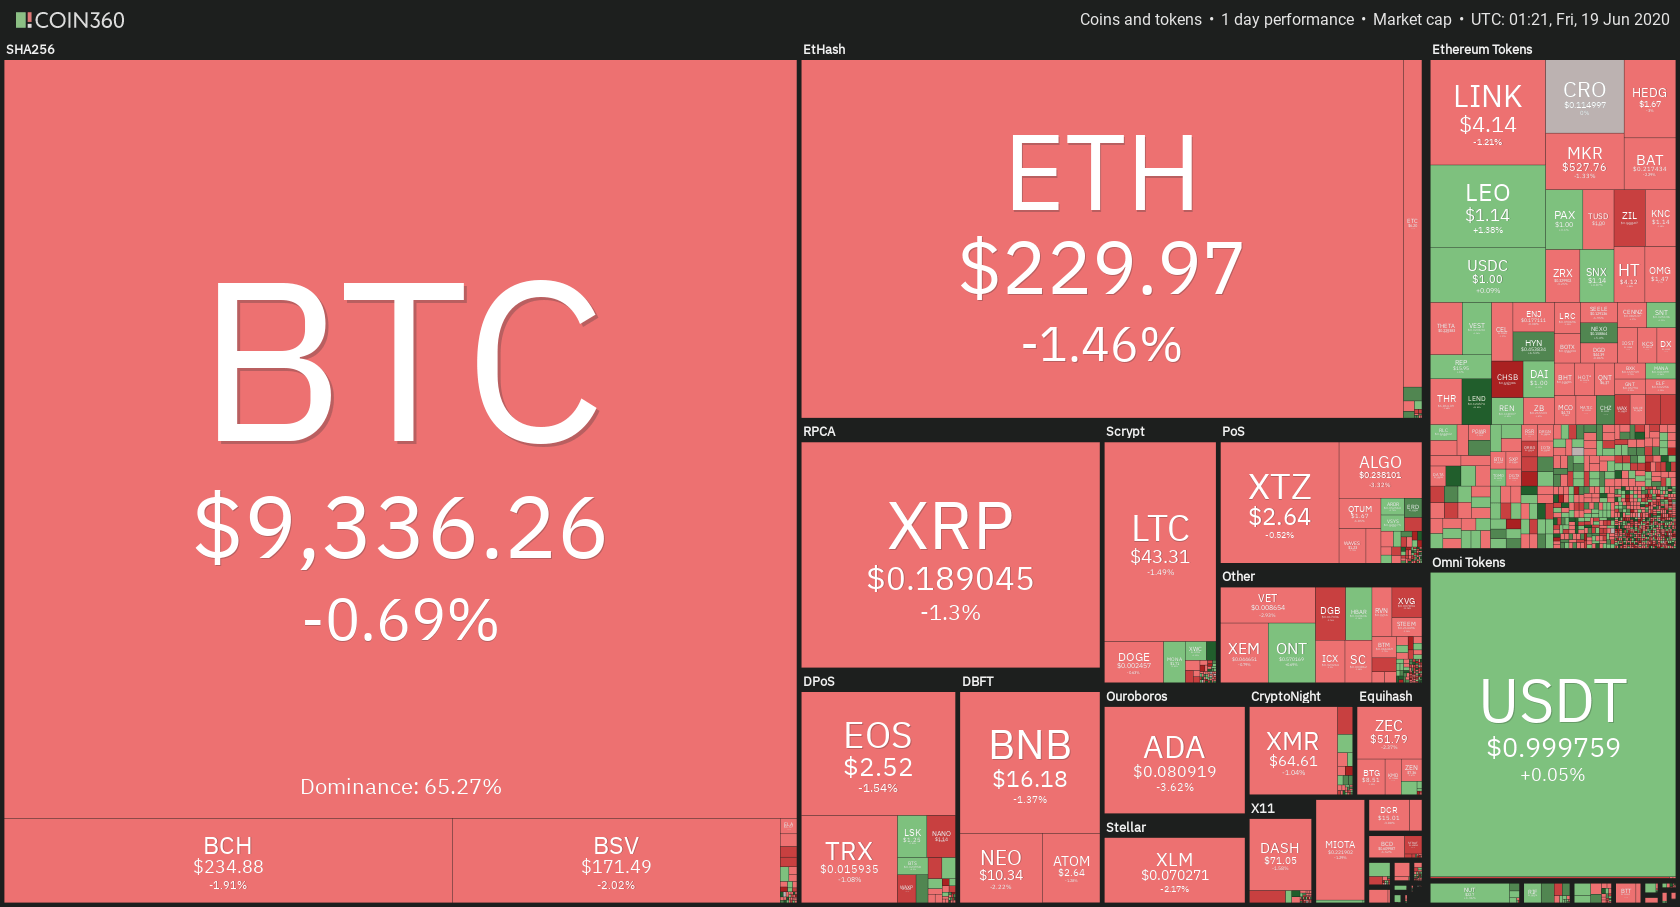
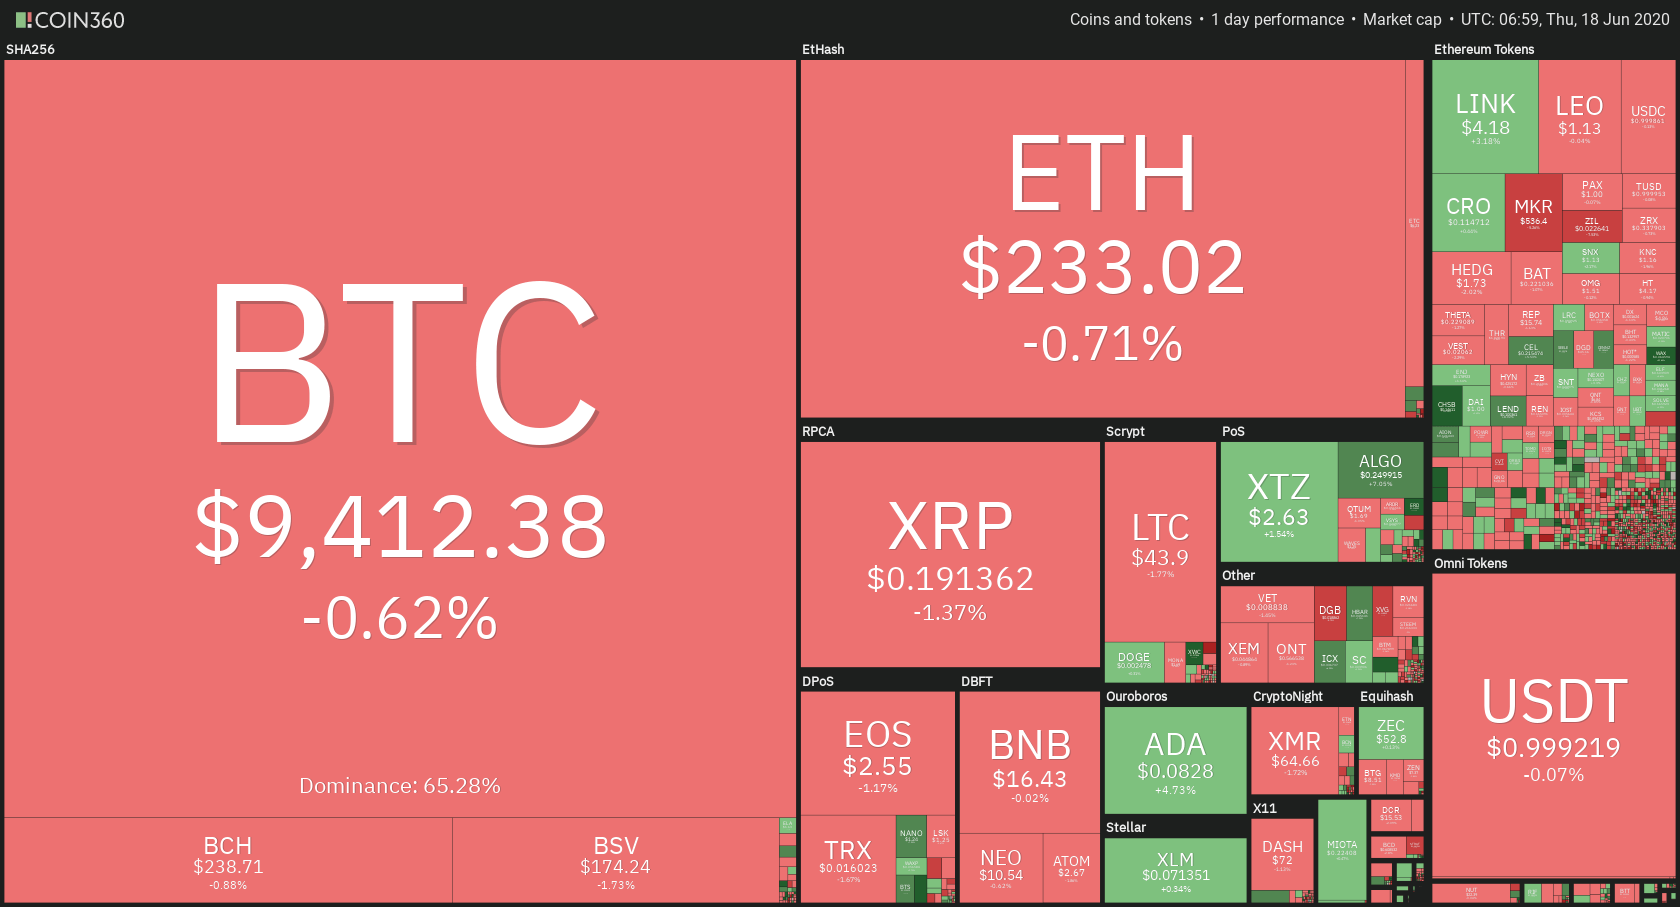
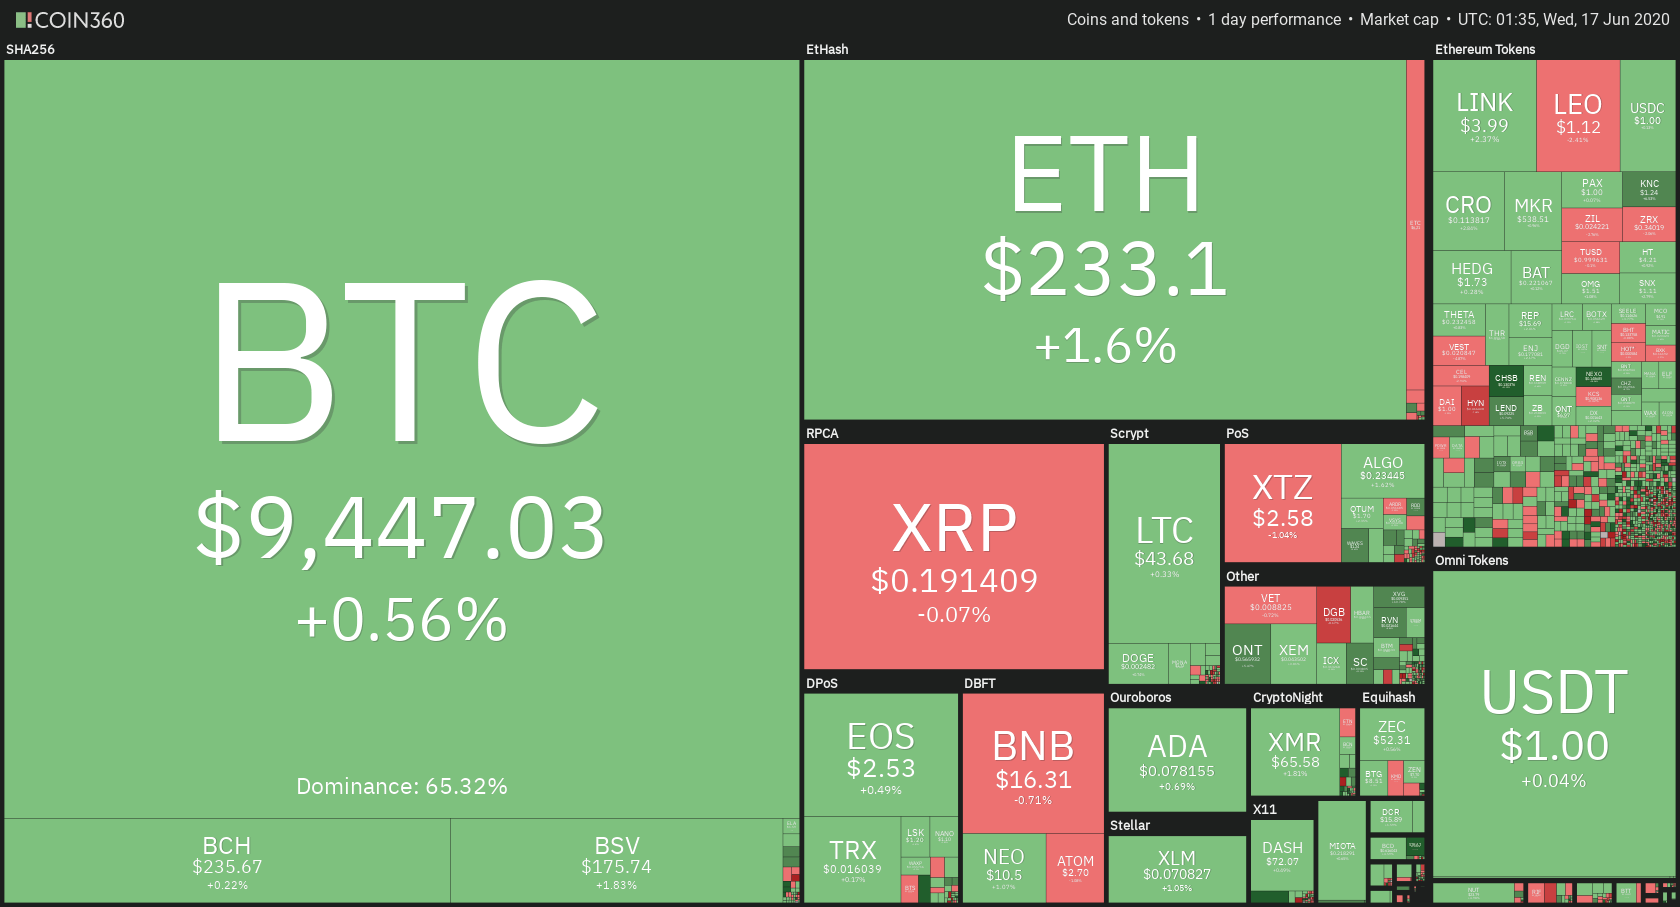
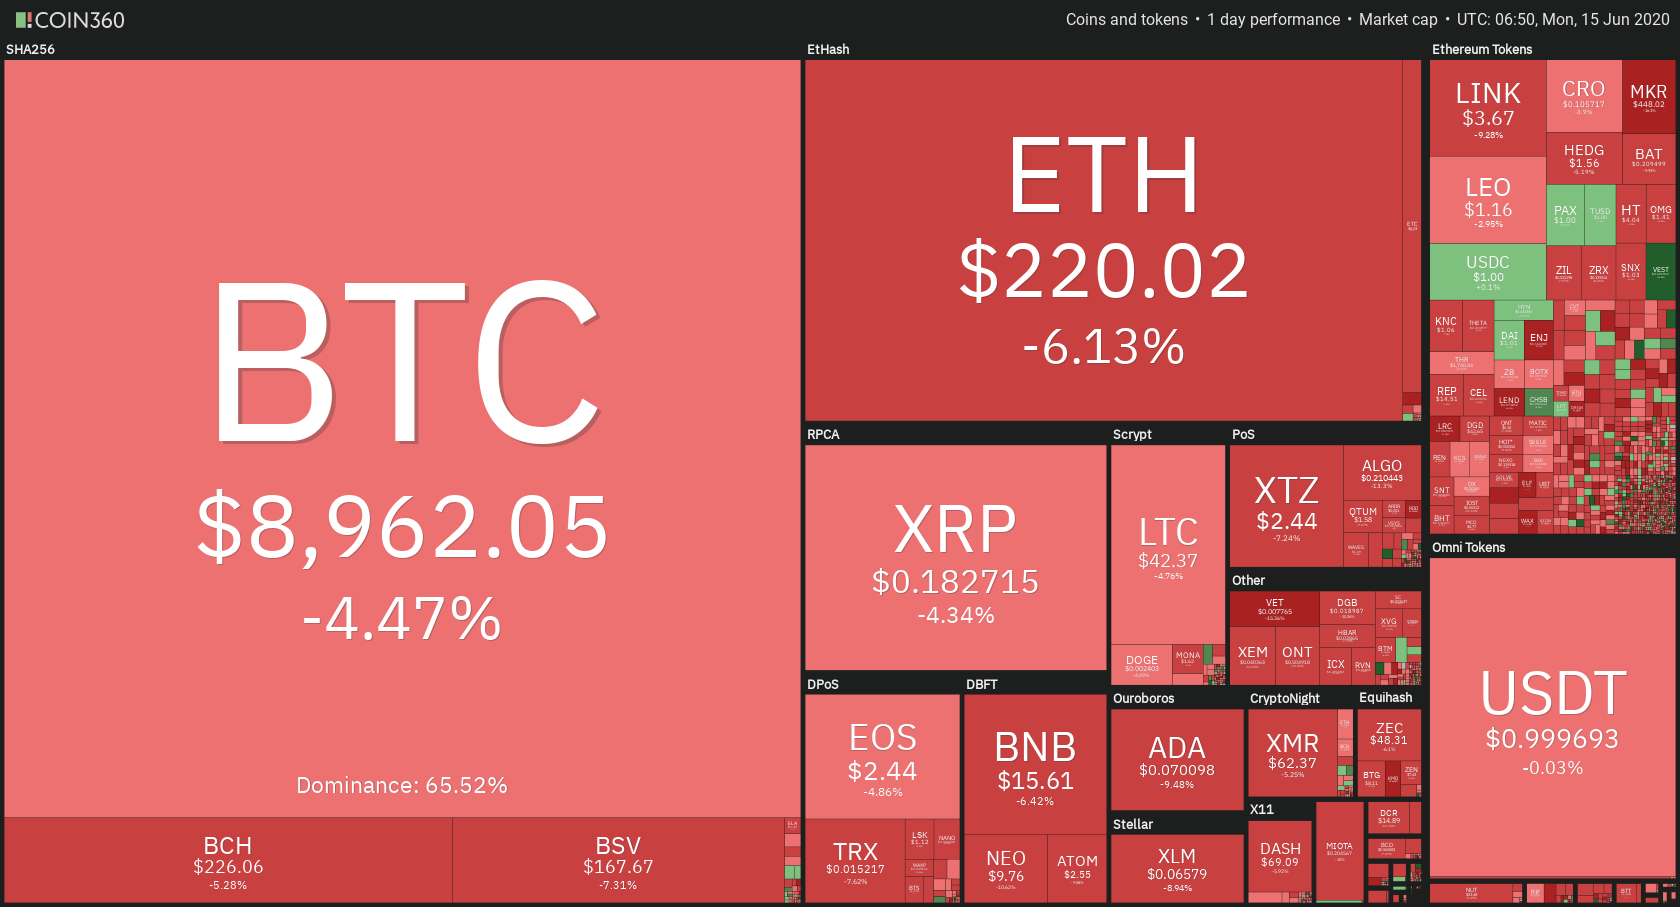
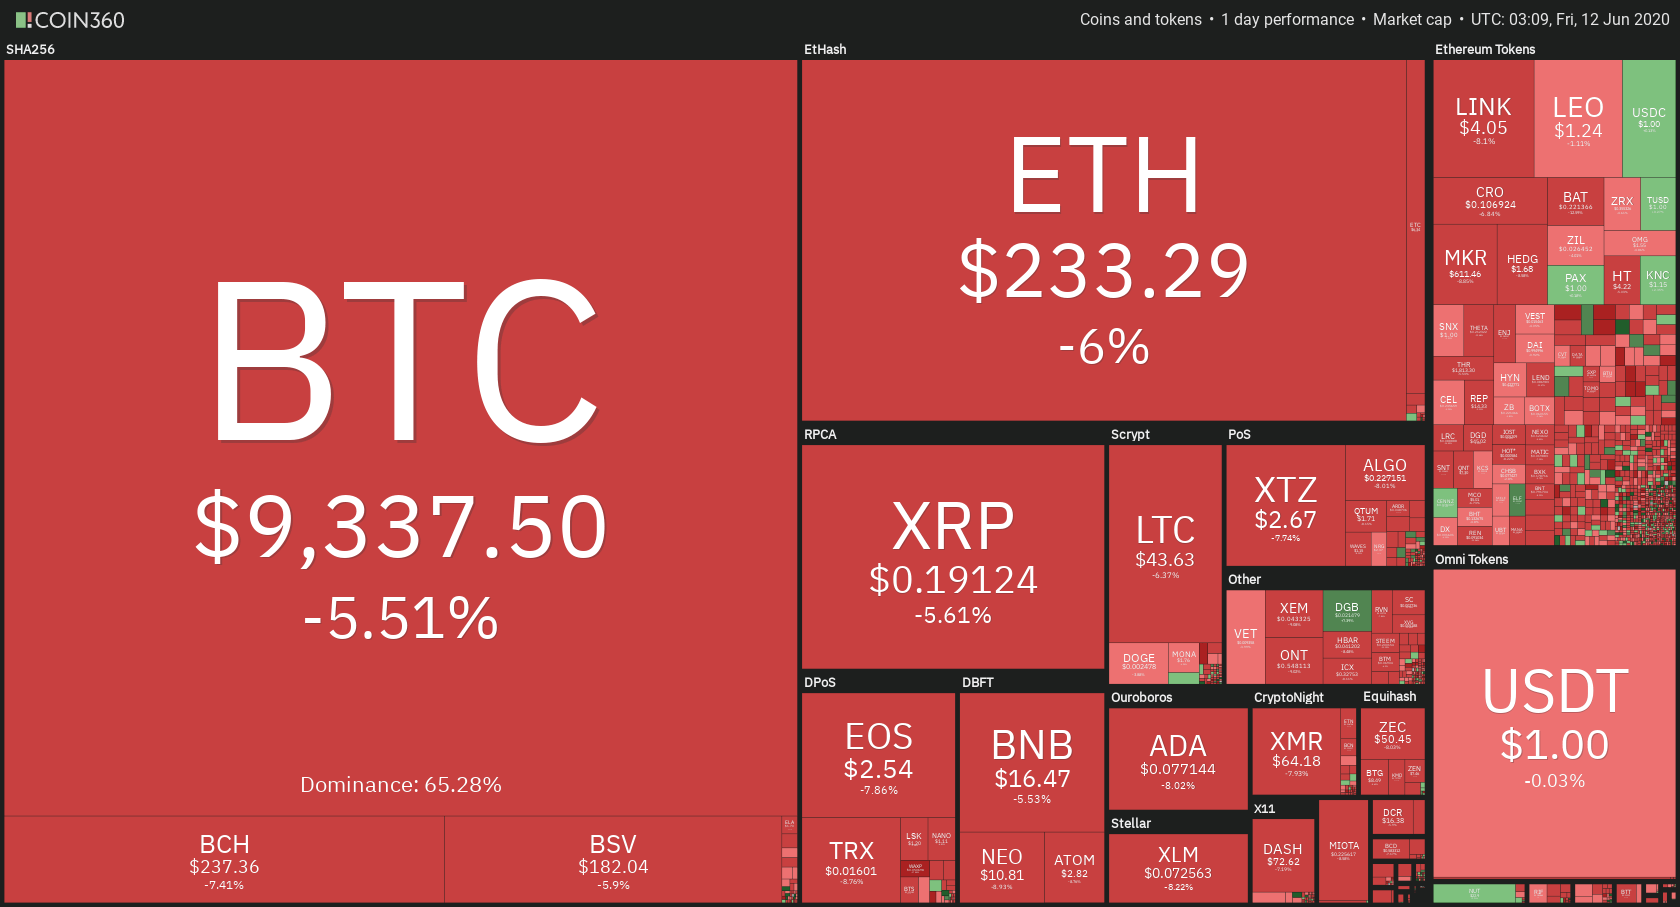
 Daily Crypto Sector Heat Map

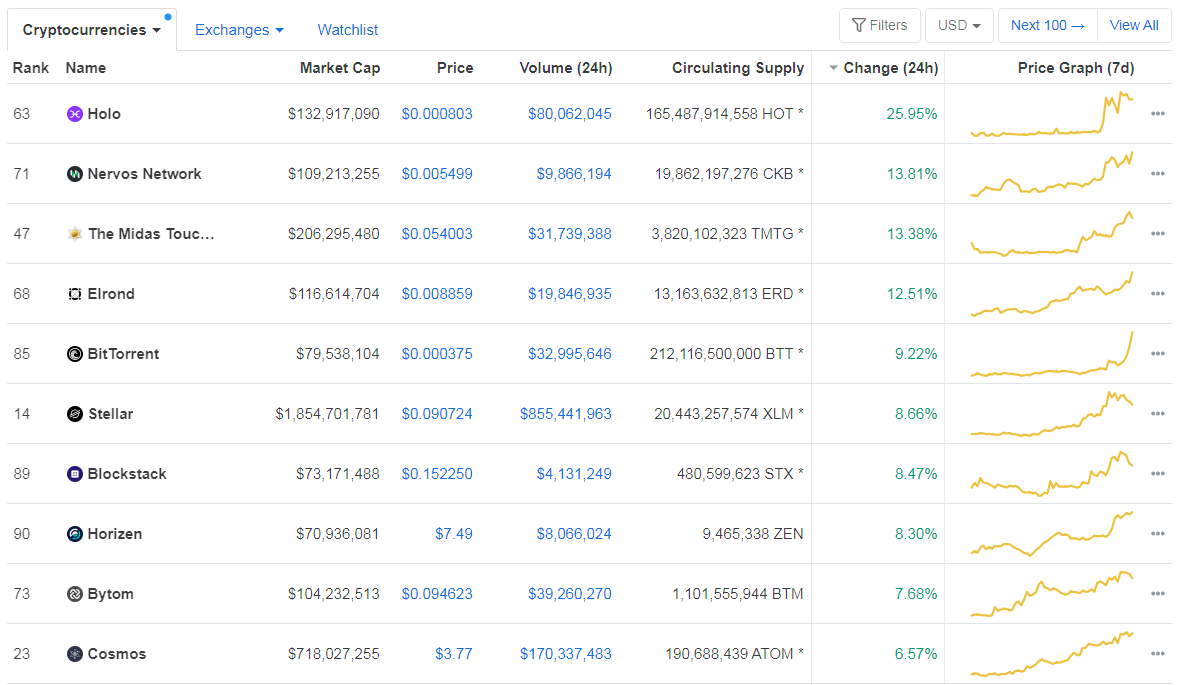
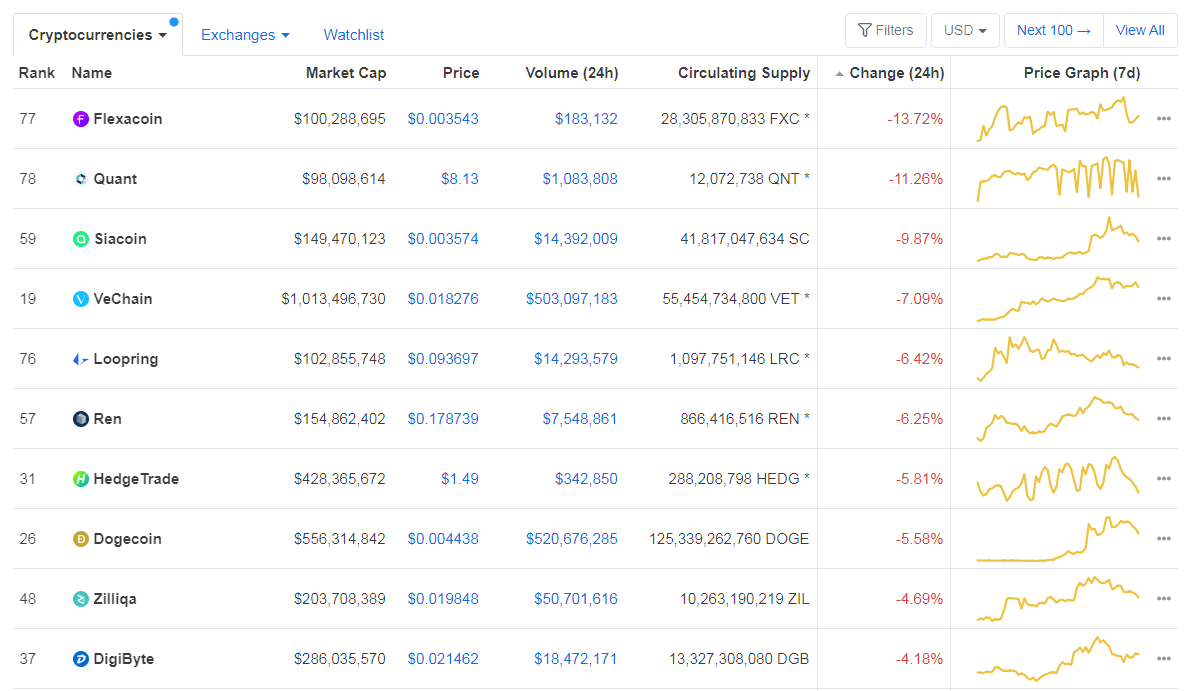
When talking about top100 cryptocurrencies, Holo gained 25.95% on the day, making it by far the most prominent daily gainer. Nervos Network (13.81%) and The Midas Touch (13.38%) also did great. On the other hand, Flexacoin has lost 13.72%, making it the most prominent daily loser. It is followed by Quant’s loss of 11.26% and Siacoin’s loss of 9.81%.

Top 10 24-hour Performers (Click to enlarge)

Bottom 10 24-hour Performers (Click to enlarge)

Bitcoin’s dominance level decreased slightly since we last reported, with its value currently at 63.29%. This value represents a 0.1% difference to the downside when compared to yesterday’s value.

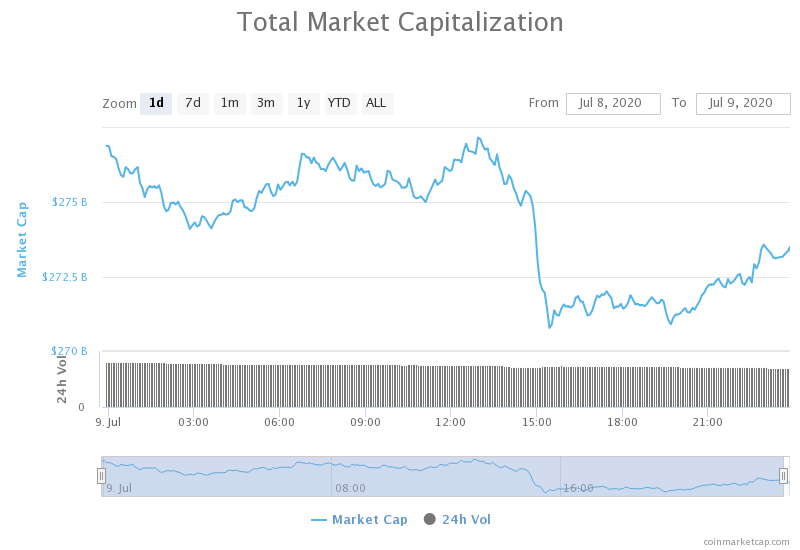
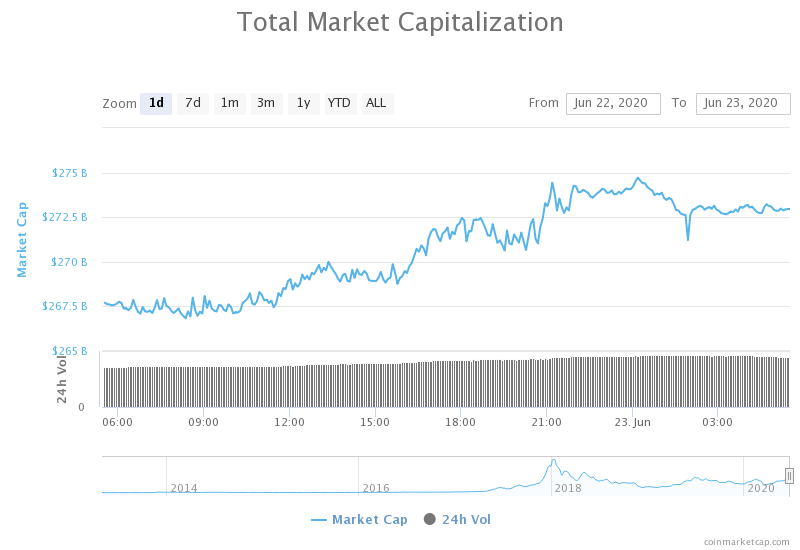
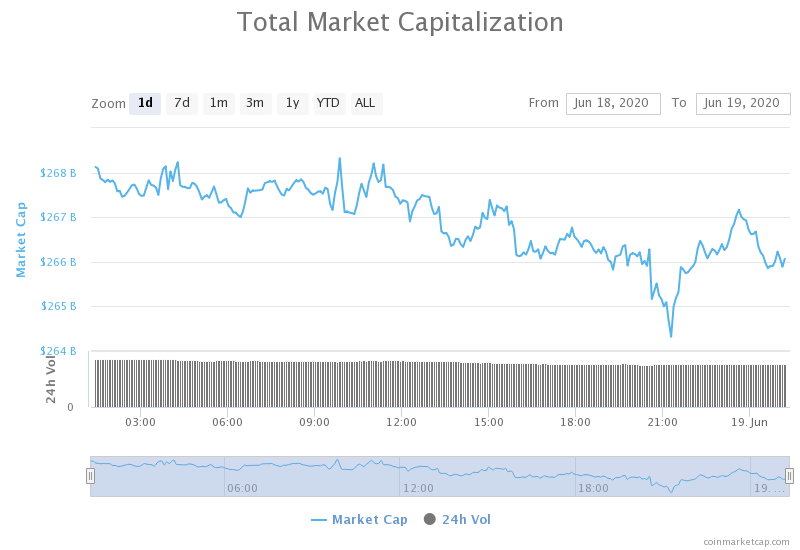
Daily Crypto Market Cap Chart

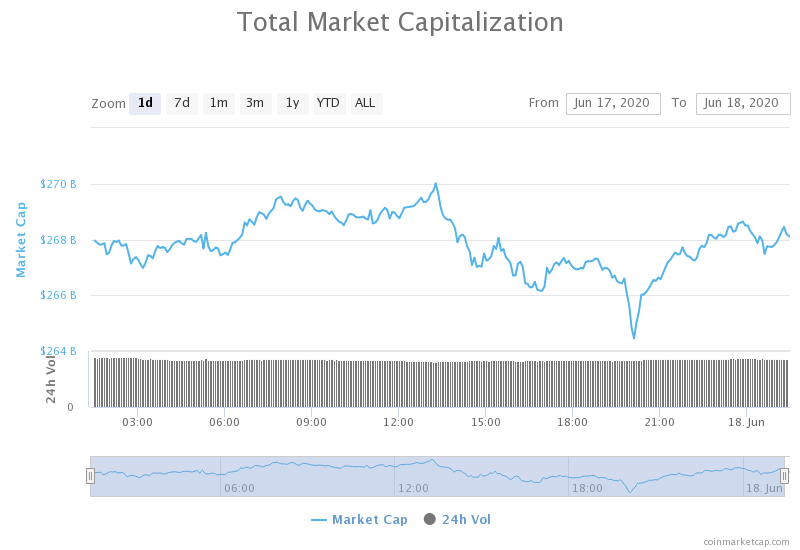
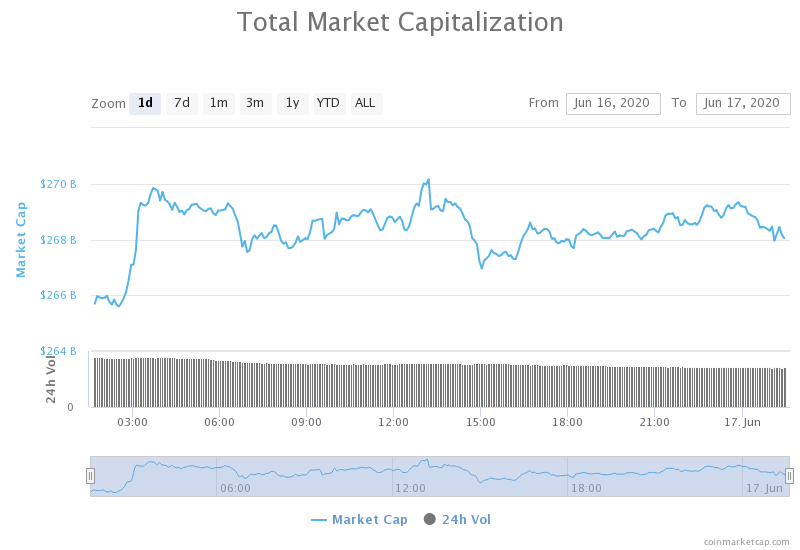
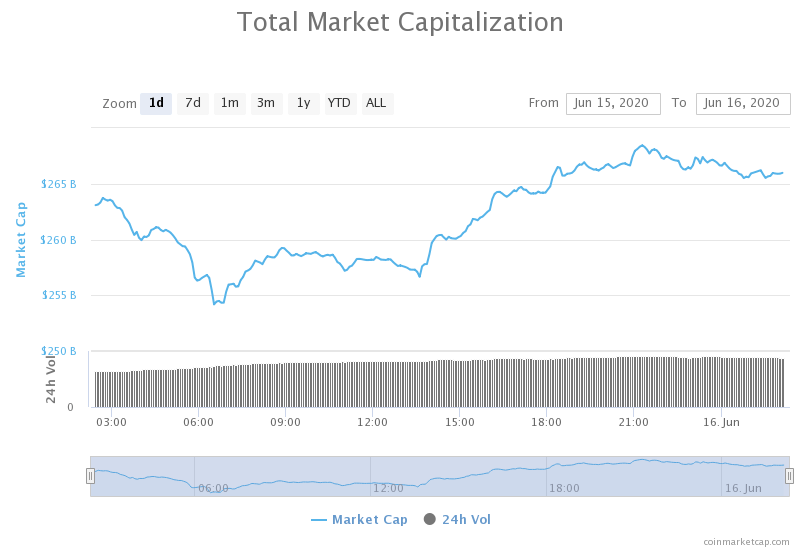
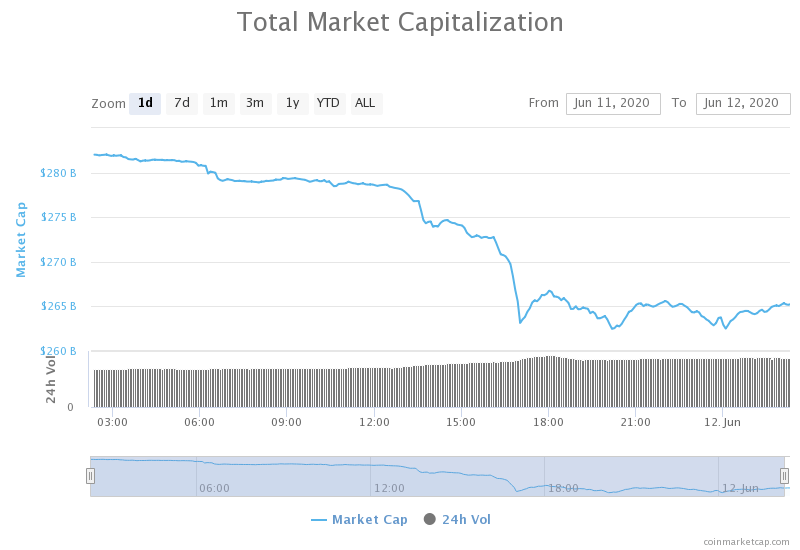
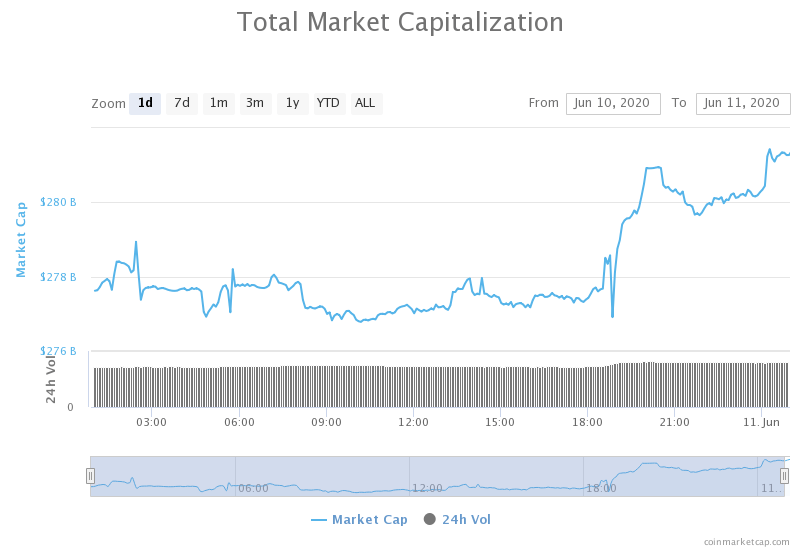
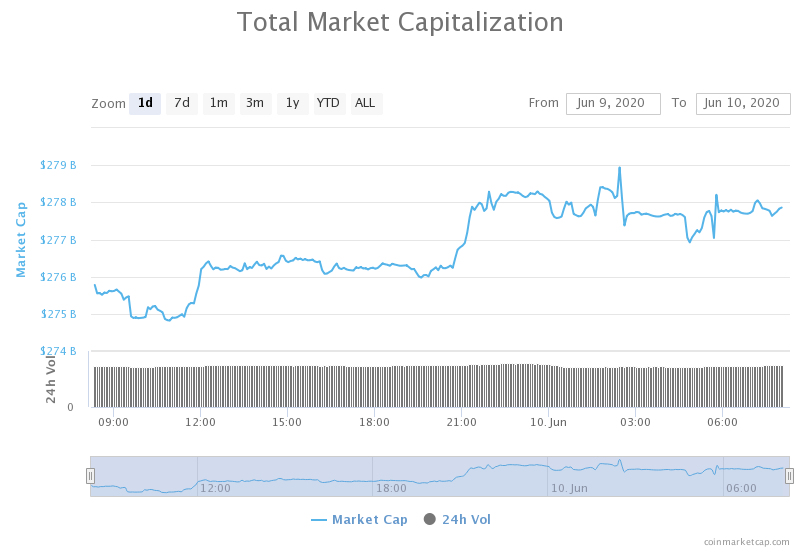
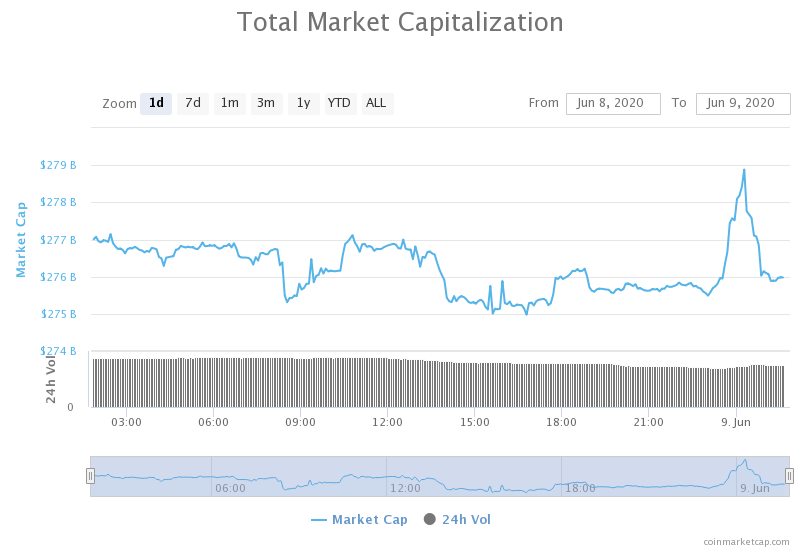
The cryptocurrency market capitalization decreased when compared to when we last reported, with the market’s current value being $273.13 billion. This value represents a decrease of $2.57 billion when compared to the value it had yesterday.

_______________________________________________________________________

What happened in the past 24 hours?

_______________________________________________________________________

_______________________________________________________________________

Technical analysis

_______________________________________________________________________

Bitcoin

The largest cryptocurrency by market capitalization had a red day, as bears pushed the price back down towards the $9,000. The descending line Bitcoin broke previously fell under the bearish pressure, and Bitcoin started rushing towards the downside. The bearish move got stopped by the $9,120 level, which held up quite nicely. However, bears have not reached exhaustion, which means that the $9,120 level is not safe yet.

BTC trades should look for the retracement move for a safe trade.

BTC/USD 4-hour Chart

Technical factors:

  • Price is below its 50-period EMA and its 21-period EMA
  • Price at the lower B.B.
  • RSI at the lower levels (37.8)
  • Increased volume

Key levels to the upside          Key levels to the downside

1: $9,580                                 1: $9,251

2: $9,735                                 2: $9,120

3: $9,870                                  3: $8,980

Ethereum

Ethereum made a move towards the downside as well, falling below the ascending line it previously broke, as well as below the $240 level. The move was (for now) stopped by the 4-hour 50-period moving average, and ETH seems to be starting a consolidation phase near the $240 level.

Ethereum traders should look for an opportunity in trading pullbacks from the moving averages or horizontal levels. They should also pay close attention to Bitcoin’s movement, as BTC is mostly the main factor that causes ETH’s volatility.

ETH/USD 4-hour Chart

Technical Factors:

  • Price above the 50-period EMA and below the 21-period EMA
  • Price slightly below the middle B.B. (20-period SMA)
  • RSI near the middle (45.8)
  • Increased volume

Key levels to the upside          Key levels to the downside

1: $240                                    1: $228

2: $251.4                                 2: $225.4

3: $260                                     3: $217.7

Ripple

The third-largest cryptocurrency by market cap ended up in the red as well. After bulls reaching exhaustion at $0.212, bears took over and caused the price to reach the lows of $0.192, therefore breaking $0.205 and $0.2 support levels. XRP has strong support at the $0.19 line (both the horizontal support line and the 50-period moving average are there), so there is almost no chance XRP will move down (unless BTC makes a sharp move down).

XRP traders can look for an opportunity to trade in a range, as XRP is pretty much bound within $0.19 to $0.20 range unless BTC makes a move.

XRP/USD 4-hour Chart

Technical factors:

  • XRP in a mid-term descending trend (though it broke the trend in the short-term)
  • XRP lacks strong support levels below $0.178
  • Price is below the 21 and above the 50-period EMA
  • Price slightly below the middle B.B. (20-period SMA)
  • RSI is neutral (50.6)
  • Increased volume

Key levels to the upside          Key levels to the downside

1: $0.205                                  1: $0.2

2: $0.214                                  2: $0.19

3: $0.227                                 3:$0.178


Categories
Crypto Market Analysis

Daily Crypto Review, July 9 – TikTokers Causing Dogecoin’s Surge; Cryptos Make Another Move Up

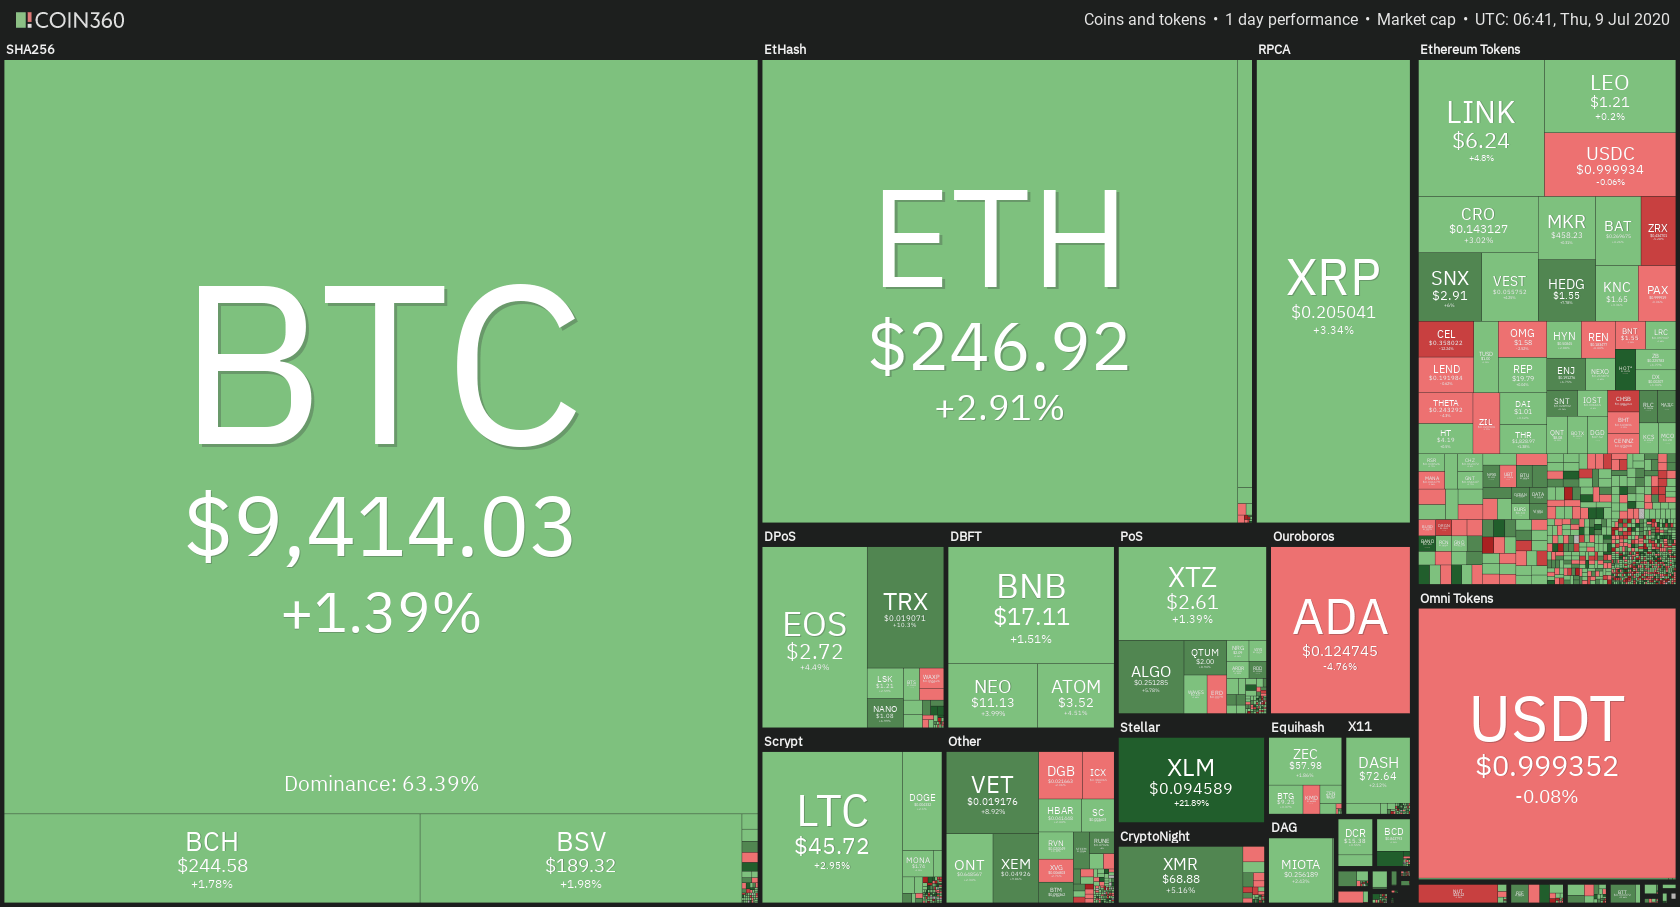
The cryptocurrency market made another slight move towards the upside in the past 24 hours. Bitcoin is currently trading for $9,414, which represents an increase of 1.39% on the day. Meanwhile, Ethereum gained 2.91% on the day, while XRP gained 3.34%.

 Daily Crypto Sector Heat Map

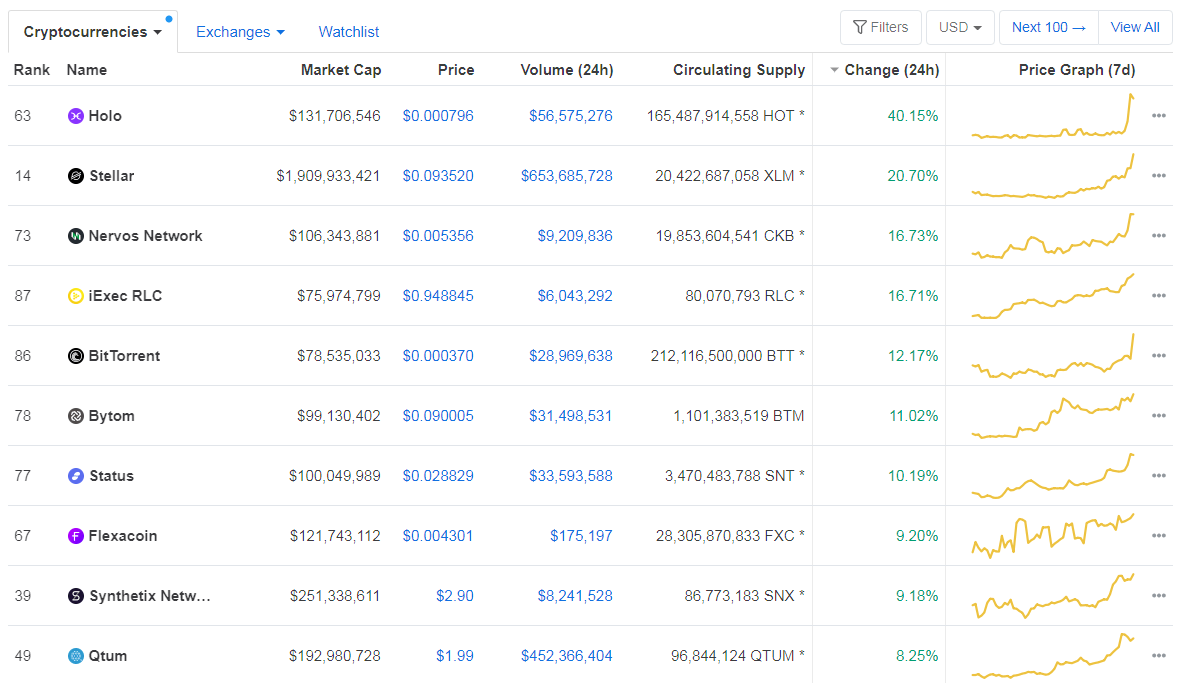
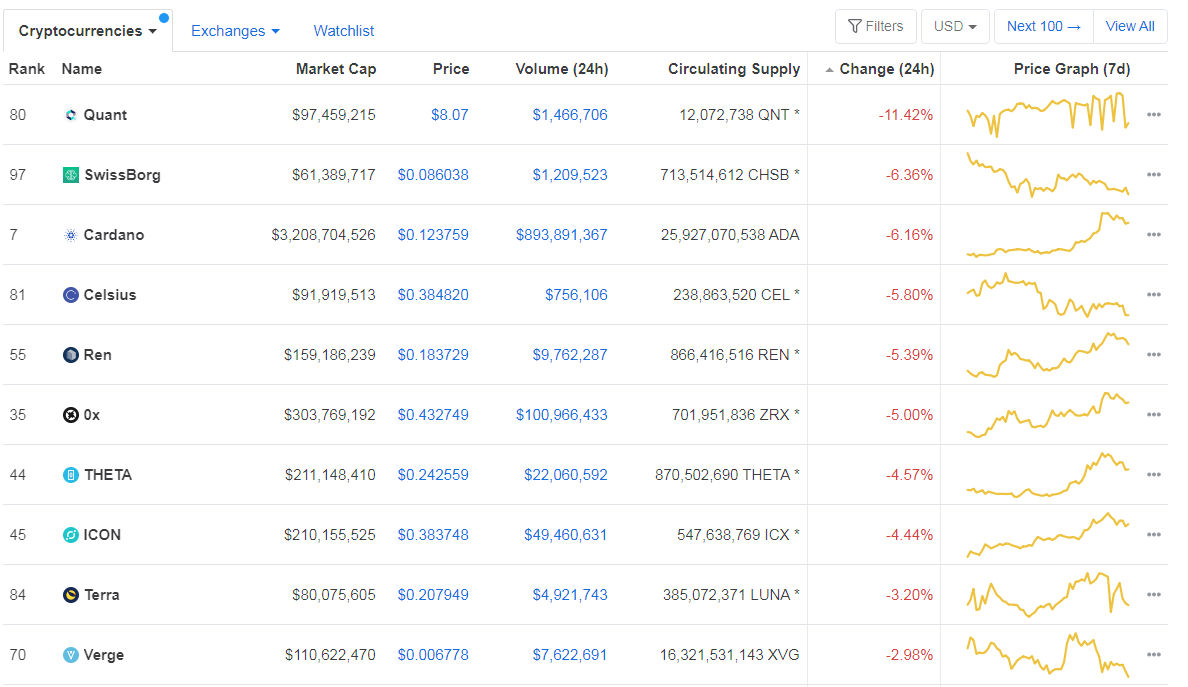
When talking about top100 cryptocurrencies, Holo gained 40.15% on the day, making it by far the most prominent daily gainer. Stellar (20.70%) and Nervos Network (16.73%) also did great. On the other hand, Quant has lost 11.42%, making it the most prominent daily loser. It is followed by SwissBorg’s loss of 6.36% and Cardano’s loss of 6.16%.


Top 10 24-hour Performers (Click to enlarge)

Bottom 10 24-hour Performers (Click to enlarge)

Bitcoin’s dominance level increased since we last reported, with its value currently at 63.39%. This value represents a 0.14% difference to the upside when compared to yesterday’s value.

Daily Crypto Market Cap Chart

The cryptocurrency market capitalization increased slightly when compared to when we last reported, with the market’s current value being $275.70 billion. This value represents an increase of $3.55 billion when compared to the value it had yesterday.

_______________________________________________________________________

What happened in the past 24 hours?

_______________________________________________________________________

_______________________________________________________________________

Technical analysis

_______________________________________________________________________

Bitcoin

The largest cryptocurrency by market capitalization has made another move towards the upside as bulls gathered up. The price managed to push above the descending trend line and reach just shy of $9,500 before returning down to test the newly conquered line as a support level. The line was tested successfully, and Bitcoin seems like it’s consolidating at the $9,400 level.

As mentioned yesterday, the descending line forced a move on Bitcoin, which ended up in BTC crossing to the upside. As with most BTC trades, trading confirmations and pullbacks are the safest way to profit.

BTC/USD 4-hour Chart

Technical factors:

  • Price is above its 50-period EMA and its 21-period EMA
  • Price is between the upper B.B. and middle line (20-period SMA)
  • RSI at the upper levels (65.5)
  • Increased volume (returning to average)

Key levels to the upside          Key levels to the downside

1: $9,580                                 1: $9,251

2: $9,735                                 2: $9,120

3: $9,870                                  3: $8,980

Ethereum

Ethereum made a move towards the upside as well. In fact, it broke a much stronger resistance level than Bitcoin. The ascending resistance level was broken as volume skyrocketed, but the price fell back under it during the confirmation period. However, Ethereum passed to the upside again, where it is now. It is important to note that this price level is unstable because it has not been properly confirmed, as well as because the line is moving sharply towards the upside, which Ethereum might not be able to follow for a long period of time.

Ethereum traders should look for an opportunity to trade around the ascending line (possibly when ETH falls back under it again).

ETH/USD 4-hour Chart

Technical Factors:

  • Price above the 50-period EMA and the 21-period EMA
  • Price slightly below the upper B.B.
  • RSI almost in the overbought territory (68)
  • Increased volume

Key levels to the upside          Key levels to the downside

1: $240                                    1: $228

2: $251.4                                 2: $225.4

3: $260                                     3: $217.7

Ripple

The third-largest cryptocurrency by market cap had much more uniformed moves. After days of almost no volume and volatility, the past couple of days have been extremely interesting for XRP’s price. XRP managed to break the $0.19 resistance (now support) yesterday, while its most recent spike brought its price above $0.2. However, the move got stopped at the $0.205 resistance level a couple of times, so XRP is now trading within a small range.

XRP traders can look for an opportunity to trade now since XRP is trading within a range bound by $0.2 and $0.205.

XRP/USD 4-hour Chart

Technical factors:

  • XRP in a mid-term descending trend (though it broke the trend in the short-term)
  • XRP lacks strong support levels below $0.178
  • Price is above the 21 and 50-period EMA
  • Price slightly below the upper B.B.
  • RSI is in the overbought territory (71)
  • Increased volume

Key levels to the upside          Key levels to the downside

1: $0.205                                  1: $0.2

2: $0.214                                  2: $0.19

3: $0.227                                 3:$0.178


Categories
Crypto Market Analysis

Daily Crypto Review, July 8 – BTC Will Never Be Private; XRP Skyrocketing

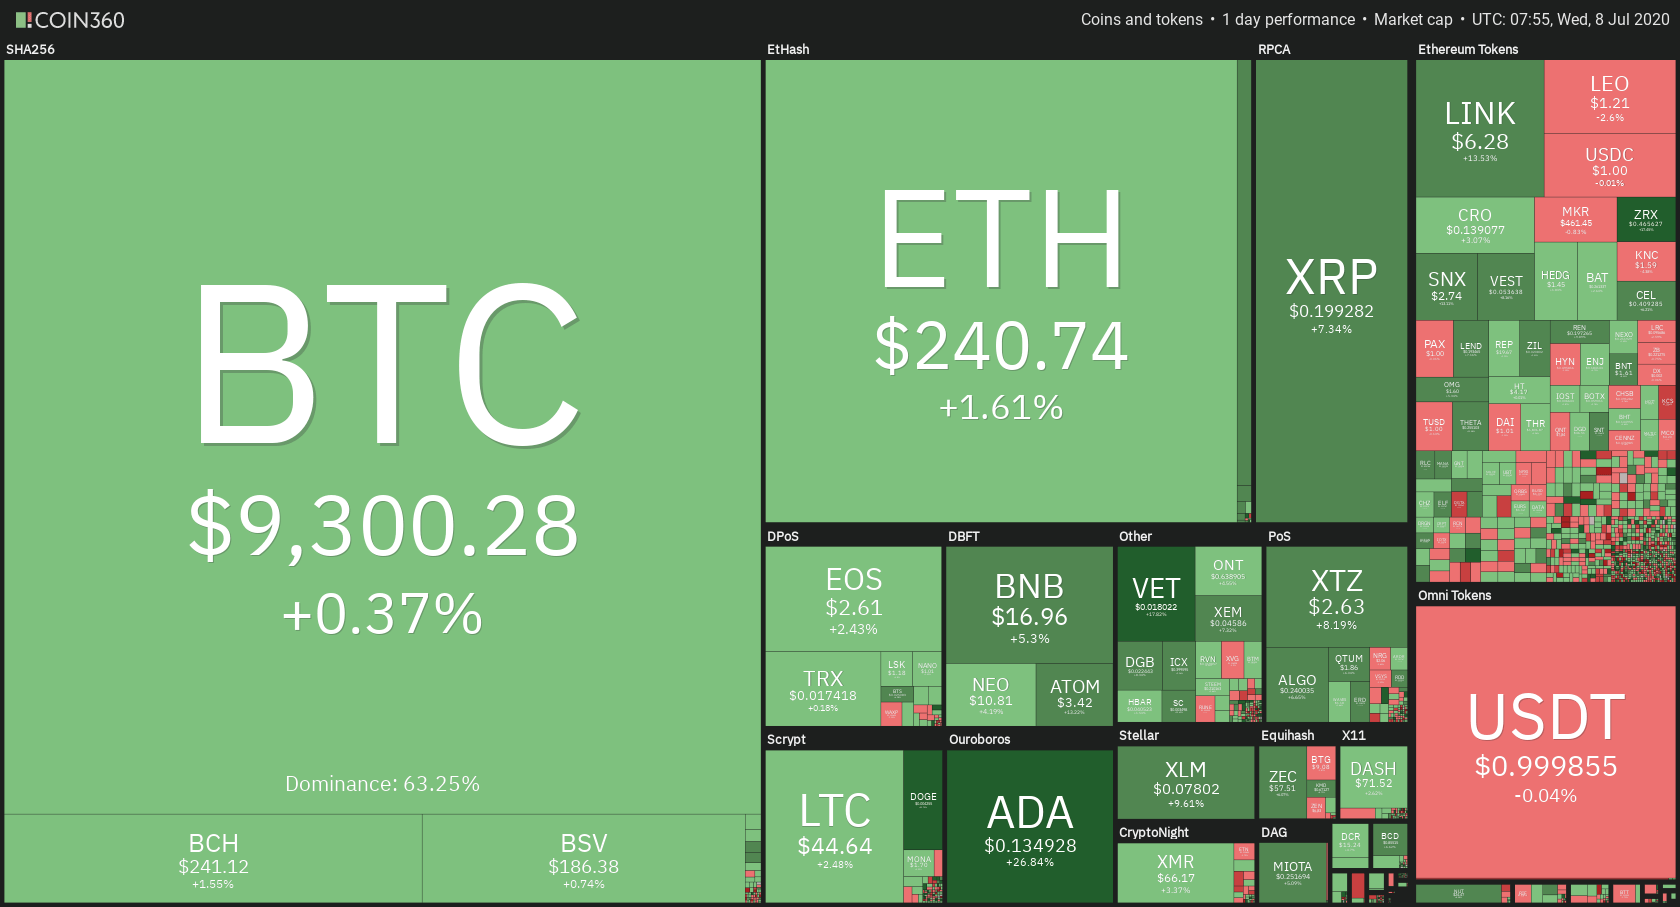
The cryptocurrency market has had more of a steady day as cryptos were trying to find a level to consolidate at. Bitcoin is currently trading for $9,300, which represents an increase of 0.37% on the day. Meanwhile, Ethereum gained 1.61% on the day, while XRP gained 2.43%.

 Daily Crypto Sector Heat Map

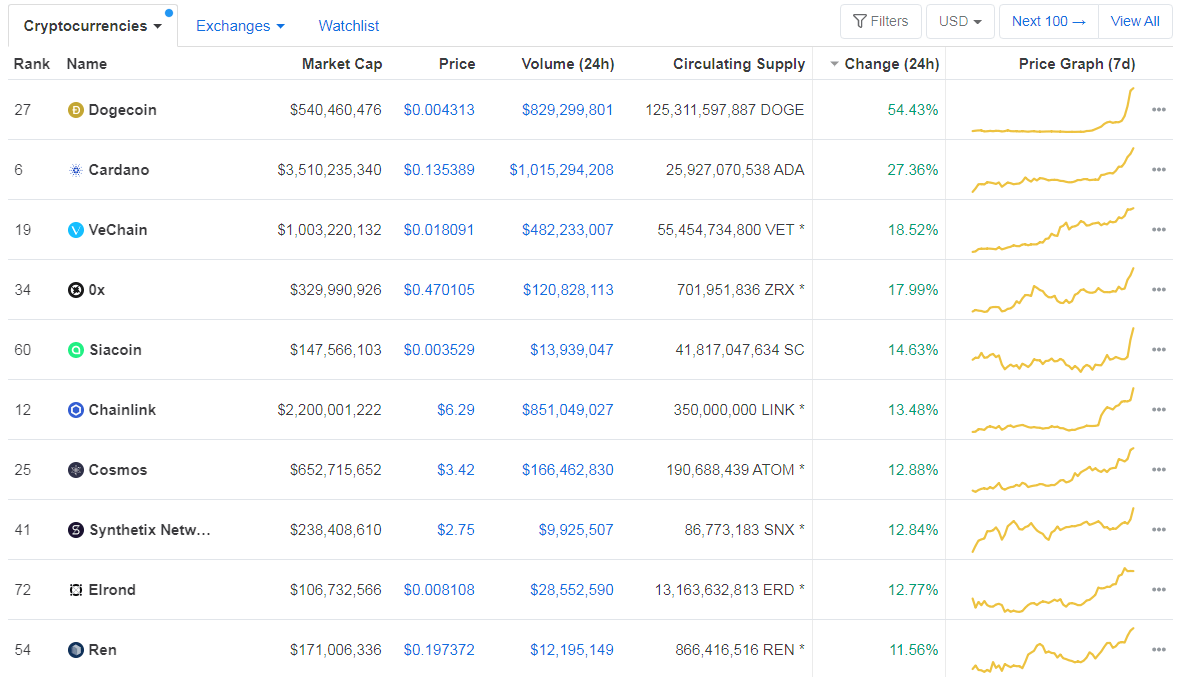
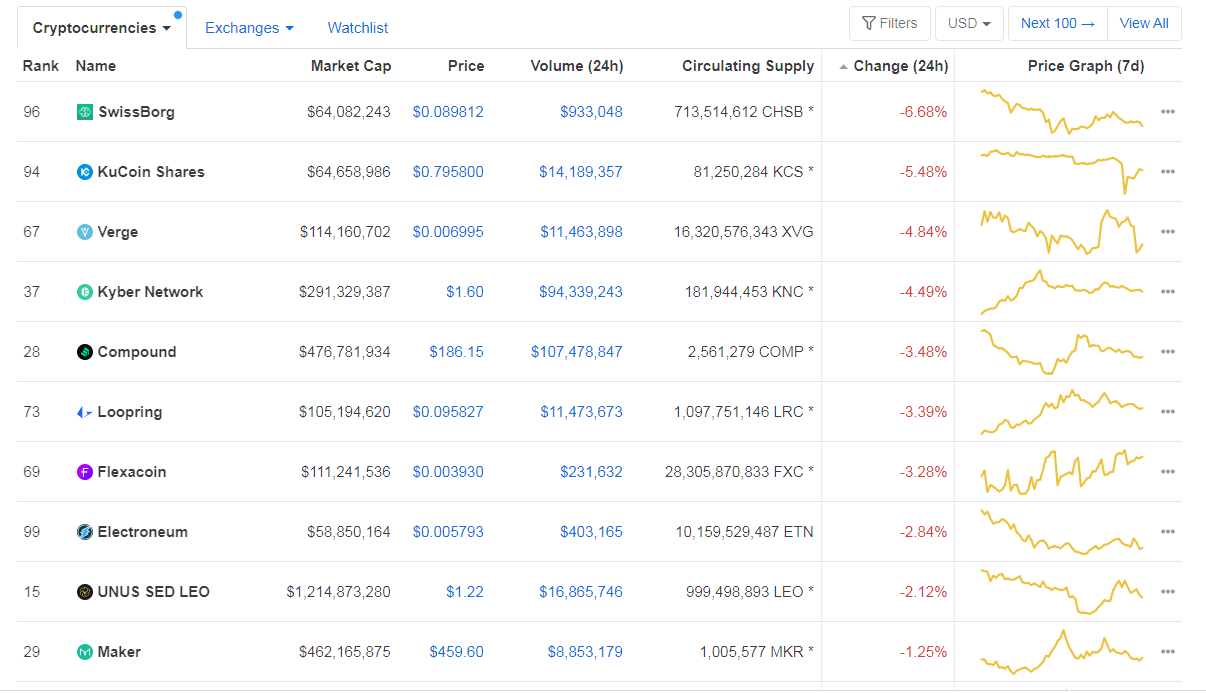
When talking about top100 cryptocurrencies, Dogecoin gained 54.43% on the day, making it by far the most prominent daily gainer. Cardano (27.36%) and VeChain (18.52%) also did great. On the other hand, SwissBorg has lost 6.68%, making it the most prominent daily loser. It is followed by KuCoin Shares’s loss of 5.48% and Verge’s loss of 4.84%.

Top 10 24-hour Performers (Click to enlarge)

Bottom 10 24-hour Performers (Click to enlarge)

Bitcoin’s dominance level decreased since we last reported, with its value currently at 63.25%. This value represents a 0.88% difference to the downside when compared to yesterday’s value.

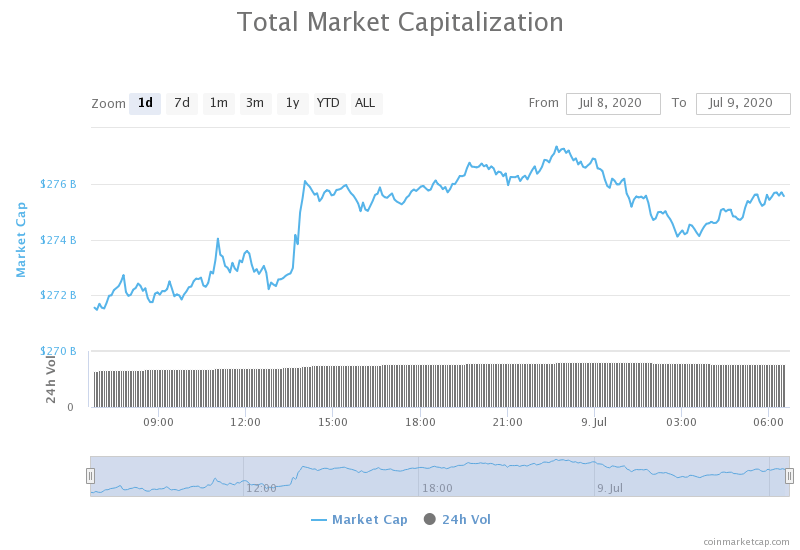
Daily Crypto Market Cap Chart

The cryptocurrency market capitalization increased slightly when compared to when we last reported, with the market’s current value being $272.15 68.74 billion. This value represents an increase of $3.41 billion when compared to the value it had yesterday.

_______________________________________________________________________

What happened in the past 24 hours?

_______________________________________________________________________

_______________________________________________________________________

Technical analysis

_______________________________________________________________________

Bitcoin

The largest cryptocurrency by market capitalization has spent the day trying to find a place to consolidate at, as it seems like the move towards the upside ended as soon as BTC approached the descending line). While Bitcoin found support at $9,251, its support level and resistance level will soon clash, and Bitcoin will have to make a move.

Traders should look for what happens with Bitcoin’s price when the descending line forces a move on BTC.

BTC/USD 4-hour Chart

Technical factors:

  • Price is above its 50-period EMA and its 21-period EMA
  • Price is between the upper B.B. and middle line (20-period SMA)
  • RSI at the upper levels (61)
  • Average Volume

Key levels to the upside          Key levels to the downside

1: $9,251                                 1: $9,120

2: $9,580                                 2: $8,980

3: $9,735                                  3: $8,820

Ethereum

Ethereum’s is in a slightly different spot when compared to Bitcoin. While its price advances have been stopped by the non-horizontal resistance level, Ethereum’s resistance line is going towards the upside. That opens up a lot of possibilities as ETH isn’t forced to make a move, but might rather choose to follow the line up.

Ethereum traders should look for an opportunity in range trading between the immediate support and resistance levels.

ETH/USD 4-hour Chart

Technical Factors:

  • Price above the 50-period EMA and the 21-period EMA
  • Price slightly below the upper B.B.
  • RSI almost in the overbought territory (67)
  • Increased volume

Key levels to the upside          Key levels to the downside

1: $240                                    1: $228

2: $251.4                                 2: $225.4

3: $260                                     3: $217.7

Ripple

The third-largest cryptocurrency by market cap had an extremely volatile day. XRP managed to skyrocket from $0.183 all the way to $0.2 in one 4-hour candle. The move got stopped by the $0.2 resistance, under which XRP is currently consolidating. While it is highly likely that the move will end here, we might see an attempt of breaking $0.2 yet again.

XRP traders should wait and see what XRP does and look for retracements.

XRP/USD 4-hour Chart

Technical factors:

  • XRP in a mid-term descending trend (though it broke the trend in the short-term)
  • XRP lacks strong support levels below $0.178
  • Price is above the 21 and 50-period EMA
  • Price at the upper B.B.
  • RSI is in the overbought territory (79)
  • Increased volume

Key levels to the upside          Key levels to the downside

1: $0.19                                    1: $0.178

2: $0.2                                      2: $0.147

3: $0.205


Categories
Crypto Videos

Free Crypto Indicator! Trade Like Institutional Traders Thanks To Coinmetro!


Trade Like Institutional Traders – Institutional Market Sentiment Data Now Available

CoinMetro, an Estonian exchange, has made their cryptocurrency sentiment analysis tool available to everyone, rather than just institutional traders. This tool is the same one that crypto hedge funds use.
Even though the tool seems rather simplistic, CoinMetro CEO Kevin Murcko said that the key thing to note here is that regular traders get access to exactly the same data that institutions are getting.

CoinMetro will handle regulation

Murcko also said that CoinMetro has a huge advantage over the other exchanges because of how they handle regulation. The days of the Wild Wild West are coming to an end – he said – and CoinMetro will benefit from this change.

Binance’s days are numbered

At the same time, he also believes the additional regulation will bring increased costs, and that this will force many exchanges out of the market. He said that if the regulatory oversight gets tighter, the cost of running the business will get much higher. Most cryptocurrency exchanges are profitable only because they can gouge their customers, and once regulations come, they will face real competition.
Murcko also expressed his opinion on Binance, where he said that, while it is more compliant than many other exchanges, its days are numbered in his opinion.

Categories
Crypto Exchanges Cryptocurrencies

Only 19% of Bitcoin’s Supply is Traded 

Only 3.5 million, an equivalent of 19% of Bitcoin’s circulating supply is moved around by traders, while the rest is being HODLed by investors, a new report by blockchain analysis company Chainalysis reveals. Another 20% of the total supply is considered ‘lost’ or in dead-end addresses and lost/forgotten wallets. And, of course, the millions of dollars worth of Bitcoin reserved by Bitcoin’s creator Satoshi Nakamoto.

Blockchain analysis is the art of examining, clustering, and modeling information on blockchains and distributed ledgers. We can draw useful market insights from blockchain analysis and see how cryptocurrencies such as Bitcoin are moving around, and what role various players are occupying in the ecosystem.

That said, let’s look at Chainalysis’s recent report and more of its revelations about the biggest cryptocurrency. First off, as of June 2020, around 18.6 million Bitcoins have been mined. But where is this Bitcoin? The report broke it down into three categories: 

  • About 60% is held by individuals or investor organizations. These entities have never sold more than 25% of their holdings. Chainalysis calls this Bitcoin ‘held for long-term investment.’
  • 20% more hasn’t moved from its current addresses in at least five years, or more. Chainalysis calls this ‘lost’ Bitcoin.
  • The remaining 19% – an equivalent of 3.5 million Bitcoin, is what’s currently being actively traded all over the world.

The company refers to the long-term held Bitcoin as ‘digital gold,’ saying: “The data shows that the majority of Bitcoin is held by those who treat it as digital gold: an asset to be held for the long term.” 

Further, the report established that so far this year, a total of 340,000 people are actively exchanging the currency every week. It identified two types of traders: retail and professional. Retail traders are those who deposit less than $10,000 worth of BTC in exchanges at a time. But these traders (retail) also account for 96% of all BTC inflows to exchanges on a weekly basis.

However, per the report, institutional investors control the biggest share of the crypto market’s liquidity – being responsible for almost 85% of the value in USD of Bitcoin transferred to exchanges. The researchers also believe these institutional investors are largely responsible for the dip in Bitcoin’s value in March 2020, before the COVID-19 crisis intensified in North America. This is because they are responsible for large market moves.

Four Exchanges Are Dominating Bitcoin’s Liquidity

The report also reveals that few exchanges are dominating the currency’s liquidity since 2018. These are the four biggest – Binance, Huobi, Coinbase, and Bitfinex – and they collectively make up nearly 40% of all Bitcoin received by exchanges in 2020. 36% went to the next ten largest exchanges, with the rest of the hundreds of exchanges getting 24%.

The study also looked into the three types of exchanges and how much Bitcoin was flowing through each. Among crypto-to-crypto (C2C), crypto-to-fiat (C2F), and fiat-to-crypto (F2C) exchanges. C2F exchanges accounted for 42% of all BTC moving through exchanges, while C2C made up 18%. The study surmised that C2F exchanges dominate because most new users first purchase crypto in these exchanges. Also, most traders usually trade Bitcoin for fiat in these exchanges. Even traders who prefer C2C exchanges have to cash out through C2F exchanges. 

Categories
Crypto Market Analysis

Daily Crypto Review, July 7 – Institutions Rushing Into Crypto; Lightning Network Vulnerability?

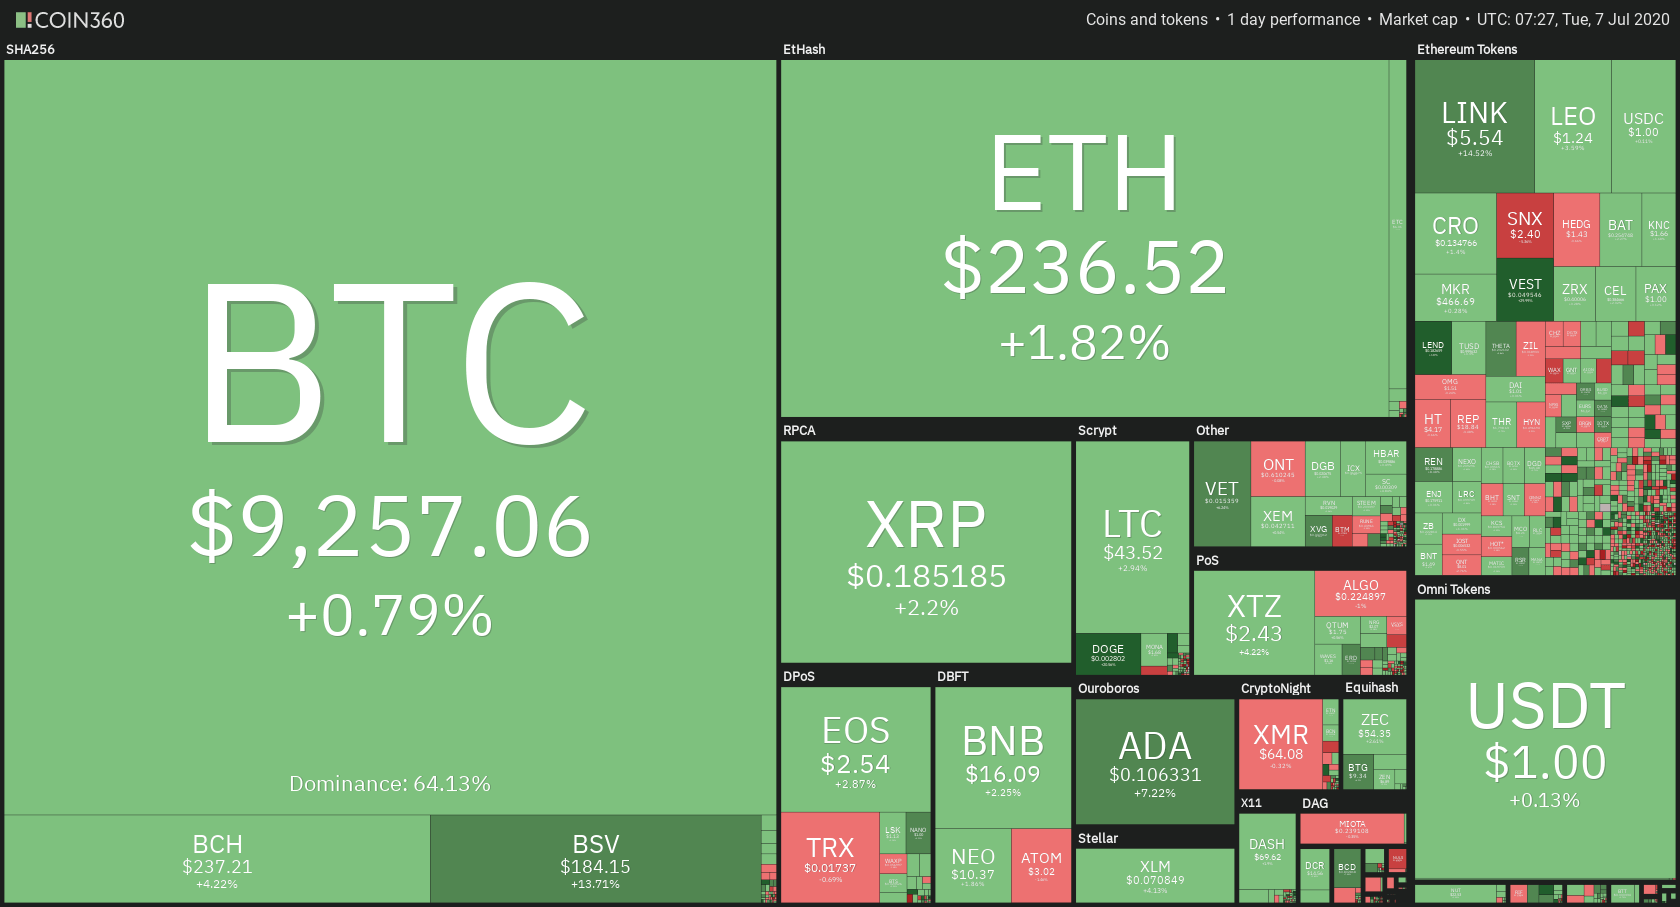
The cryptocurrency market has had a pretty volatile day, with most cryptos trying to make a move towards the upside. Bitcoin is currently trading for $9,257, which represents an increase of 0.79% on the day. Meanwhile, Ethereum gained 1.82% on the day, while XRP gained 2.2%.

 Daily Crypto Sector Heat Map

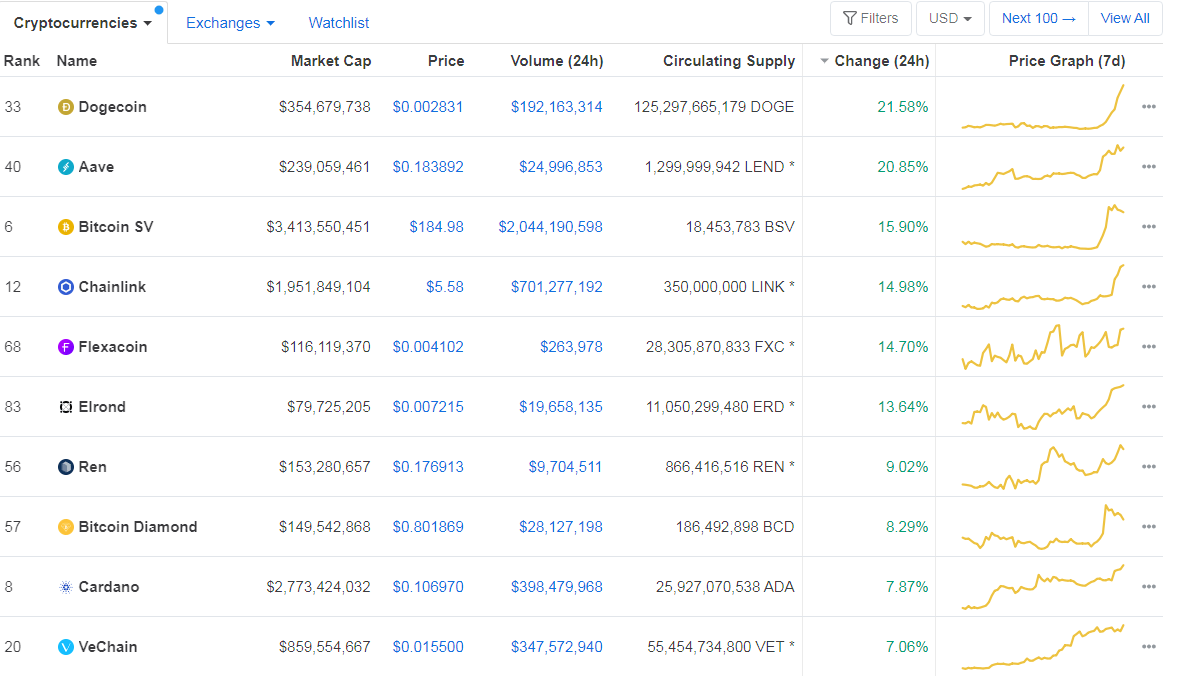
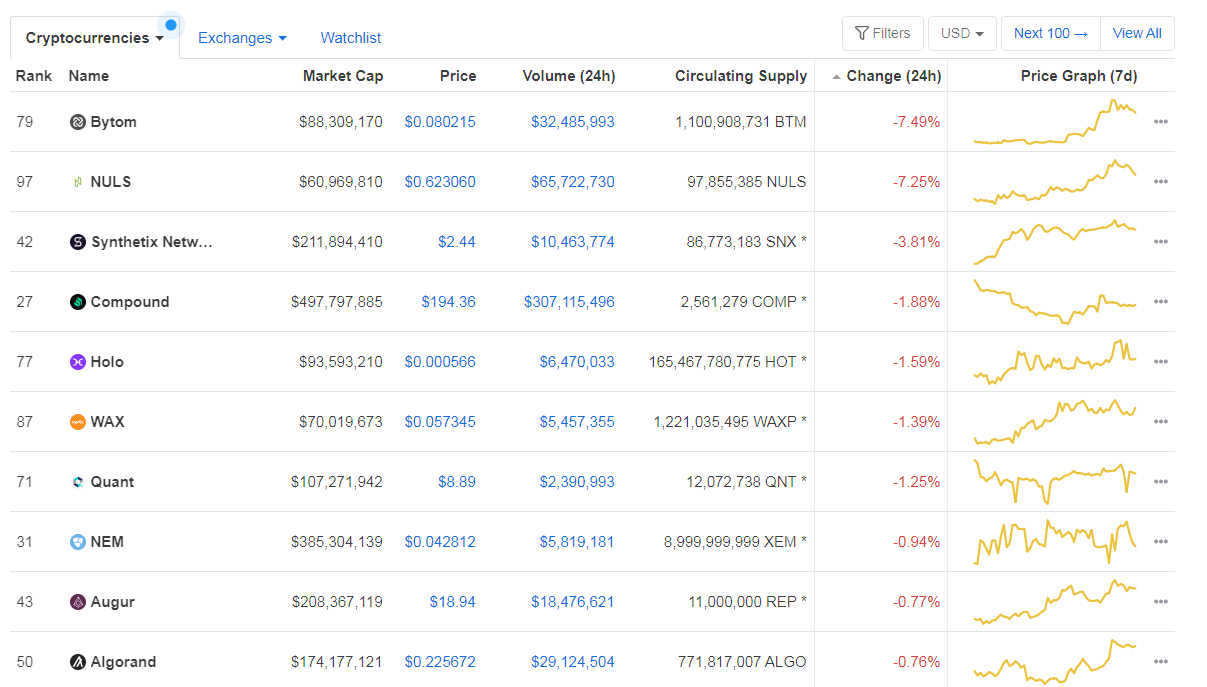
When talking about top100 cryptocurrencies, Dogecoin gained 21.58% on the day, making it by far the most prominent daily gainer. Aave (20.85%) and Bitcoin SV (15.90%) also did great. On the other hand, Bytom has lost 7.49%, making it the most prominent daily loser. It is followed by NULS’s loss of 7.25% and Synthetix Network’s loss of 3.81%.

Top 10 24-hour Performers (Click to enlarge)

Bottom 10 24-hour Performers (Click to enlarge)

Bitcoin’s dominance level decreased since we last reported, with its value currently at 64.13%. This value represents a 0.68% difference to the downside when compared to yesterday’s value.

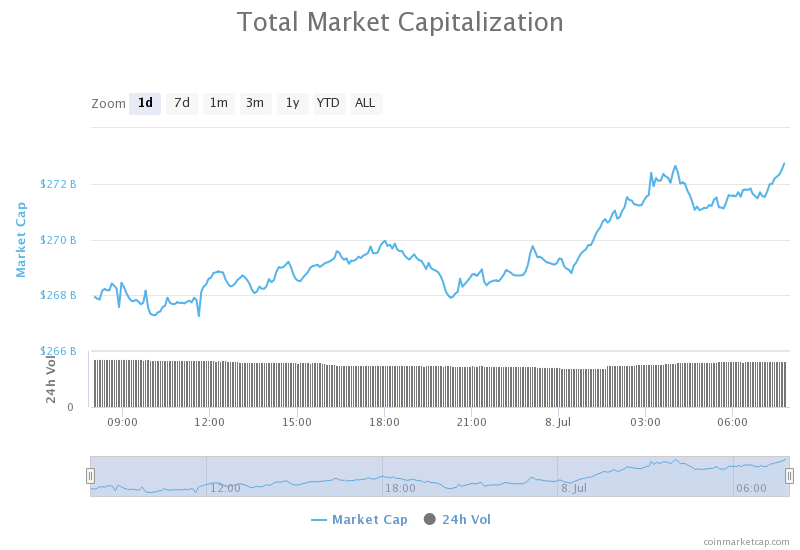
Daily Crypto Market Cap Chart

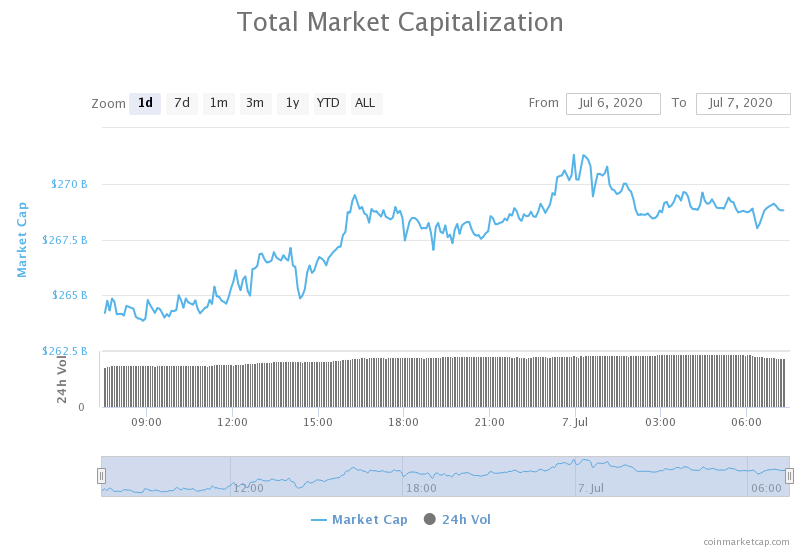
The cryptocurrency market capitalization increased slightly when compared to when we last reported, with the market’s current value being $268.74 billion. This value represents an increase of $4.43 billion when compared to the value it had yesterday.

_______________________________________________________________________

What happened in the past 24 hours?

_______________________________________________________________________

_______________________________________________________________________

Technical analysis

_______________________________________________________________________

Bitcoin

The largest cryptocurrency by market capitalization has spent the day being quite volatile, even though it only had an average volume. Bitcoin tried to push past its $9,251 resistance level, which it did for a brief period, but then failed as the price reached a descending resistance line (dating June 01). The bulls got stopped from rising the price, and the price came back to the $9,251 level. It is still unsure whether it will end up above or below the level.

Bitcoin traders should look for whether the price will end up creating a confirmation of a move above or below the $9,251 and go from there.

BTC/USD 4-hour Chart

Technical factors:

  • Price is above its 50-period EMA and its 21-period EMA
  • Price is below the top B.B.
  • RSI at the upper levels (58.49)
  • Average Volume

Key levels to the upside          Key levels to the downside

1: $9,251                                 1: $9,120

2: $9,580                                 2: $8,980

3: $9,735                                  3: $8,820

Ethereum

Ethereum’s price movements followed Bitcoin’s almost to a tea. The second-largest cryptocurrency by market cap rose in price as bull presence intensified, reaching the price of $244 before starting to go back down. The price returned below the $240 level and is now consolidating at the $236 levels. Unlike Bitcoin, Ethereum has quite a bit of volume, which may indicate that its move isn’t over.

Ethereum traders should look for an opportunity in trading when ETH’s price hits the support levels (moving averages, horizontal support levels, etc.).

ETH/USD 4-hour Chart

Technical Factors:

  • Price above the 50-period EMA and the 21-period EMA
  • Price slightly below the upper B.B.
  • RSI almost in the overbought territory (62.8)
  • Increased volume

Key levels to the upside          Key levels to the downside

1: $228                                    1: $225.4

2: $240                                    2: $217.7

3: $251.4                                  3: $198

Ripple

The third-largest cryptocurrency by market cap broke the $0.178 resistance level as well as secured its position above it yesterday. However, the bulls wanted more, and XRP continued its “gain season.” However, it was stopped in its tracks by the $0.19 level. XRP is now consolidating between $0.178 and $0.19.
XRP traders should wait and see how XRP reacts to indicators (moving averages) and go from there.

XRP/USD 4-hour Chart

Technical factors:

  • XRP in a mid-term descending trend (though it broke the trend in the short-term)
  • XRP lacks strong support levels below $0.178
  • Price is above the 21 and 50-period EMA
  • Price is slightly below the upper B.B.
  • RSI is in the overbought territory (64.6)
  • Increased volume

Key levels to the upside          Key levels to the downside

1: $0.19                                    1: $0.178
2: $0.2                                      2: $0.147

3: $0.205


Categories
Crypto Daily Topic

FATF Meets, Travel Rule on the Agenda

The Financial Action Task Force (FATF) met on Wednesday (June 24th) to discuss a wide range of topics, from anti-money laundering and counter-terrorist financing, as well as the ‘travel rule’ that was instituted last year. It was the first time that the FATF meeting was held virtually. 

Why Is the Meeting Relevant to the Crypto Community? 

The crypto community took notice of the meeting because of the ‘travel rule’ that requires virtual asset service providers (VASPs) to collect and share customer information (both originators and beneficiaries) as part of an effort to combat cryptocurrency-related crime. 

The plenary meeting would give FATF member states room to report on progress achieved so far in the implementation of the rule. Elsa Madrolle, the General Manager of International of CoolBitx, a blockchain solutions company, told CoinDesk that the majority of member states have yet to implement the guidelines. “Since the FATF published its guidance last year, out of the 200+ countries that comprise of the FATF’s member jurisdictions, only around 10% of regulators have published frameworks and legislation fully aligned with the new guidance.” 

Siân Jones, a senior partner at virtual assets consulting company XReg Consulting, told the publication that countries such as the US, Europe, Switzerland, and Singapore will be recognized for progress in crypto, as has the industry generally. 

The Implications of the Travel Rule

As more countries implement the travel rule in the future, the crypto community will be asking what implications this has for the crypto space. Blockchains and cryptocurrencies were created to embody the ideals of decentralized finance – a system that’s anonymous and free of government or regulatory agencies’ censorship. 

Crypto publication magazine Forkast News spoke to several experts to get a clearer understanding of the ramifications of the rule. Associate professor of management at Stetson University, Jon Carrick, believes that this regulation might actually be a good thing for the industry in the long run. “Now that cryptocurrency has become more mainstream, most users will not be upset; in fact, many might like knowing that the currency is being regulated. In fact, the regulation could give cryptocurrencies more credibility, which could make more people comfortable in using it.” 

Carrick belongs to the school of thought that for crypto to be widely adopted, it has to make some concessions. Some of these include trading some of its independence for mainstream acceptance.  

For now, the outcomes of the FATF meeting remain in closed doors. But the crypto community will be watching to see what ramifications they have on the crypto space.  

Categories
Crypto Videos

Binance Is Now 10x Faster After the Biggest Update In It’s History – Ready For The Next Bullrun!

Binance 10x Faster After the Biggest Update in its History

Binance just completed its largest upgrade on June 28, making the platform even faster, announced Binance’s founder and CEO Changpeng Zhao, better known as CZ.

CZ’s thoughts on the update and the next bull run

The largest trading platform in the world has reportedly re-written all code and switched its matching engine to a new programming language, all in an attempt to make it faster and more suitable for even the most demanding traders. It’s said to be Binance’s biggest upgrade in two years. The trading platform can perform ten times faster for traders for the next bull run.


CZ added that, in theory, the platform could handle 100x their current volume. But when real volumes hit, he said that there would probably be some other peripheral systems that may temporarily cause a bottleneck. However, he is certain that they would be fixed quickly.
Although Bitcoin’s price dropped below $9,000 for the second time this week, traders seem bullish and are continuing to buy on each dip.

Categories
Crypto Videos

Grayscale Will Own 3.4% of All Bitcoin By January! The Monopoly Continues!

Grayscale Owning 3.4% of All Bitcoin by January – What’s Happening!?

It is not a secret that Grayscale Investments has been buying a lot of crypto lately. The company has purchased almost half a billion dollars worth of Bitcoin since the block reward halving in May. On top of that, Grayscale bought around three times the BTC block reward for the past week.
According to a June 25 tweet coming from crypto analyst Kevin Rooke, Grayscale bought 19,879 Bitcoin — worth $184 million worth — just in the last week. This brings Grayscale’s total number of coins to roughly 400,000.
Rooke added that “Grayscale *alone* has taken all BTC mined and 14,000 more BTC on top of that since the halving.”

Grayscale becoming a crypto giant

At this moment, there are 18.415 million BTC in circulation, while the rest are presumed lost. Grayscale managed to buy 53,588 BTC in total since the May 11 halving, which would equate to an average of 1,190 BTC per day. If Grayscale keeps buying at this same daily rate, it will own exactly 3.4% (or 625,069 BTC) of the world’s BTC supply by January 2021 and 10% of the world’s BTC supply by the time of the next halving in 2024.

Grayscale and the rest of the cryptocurrencies


Besides buying enormous amounts of Bitcoin, Grayscale is investing in Ethereum as well. Grayscale’s Ethereum Fund owns $396 million in Ether. Grayscale had, as one report shows, purchased $110 million worth of Ethereum in 2020 as of June 5.

Categories
Crypto Market Analysis

Daily Crypto Review, July 6 – Cryptos Skyrocket on Increased Volume; Bitcoin vs. the S&P 500

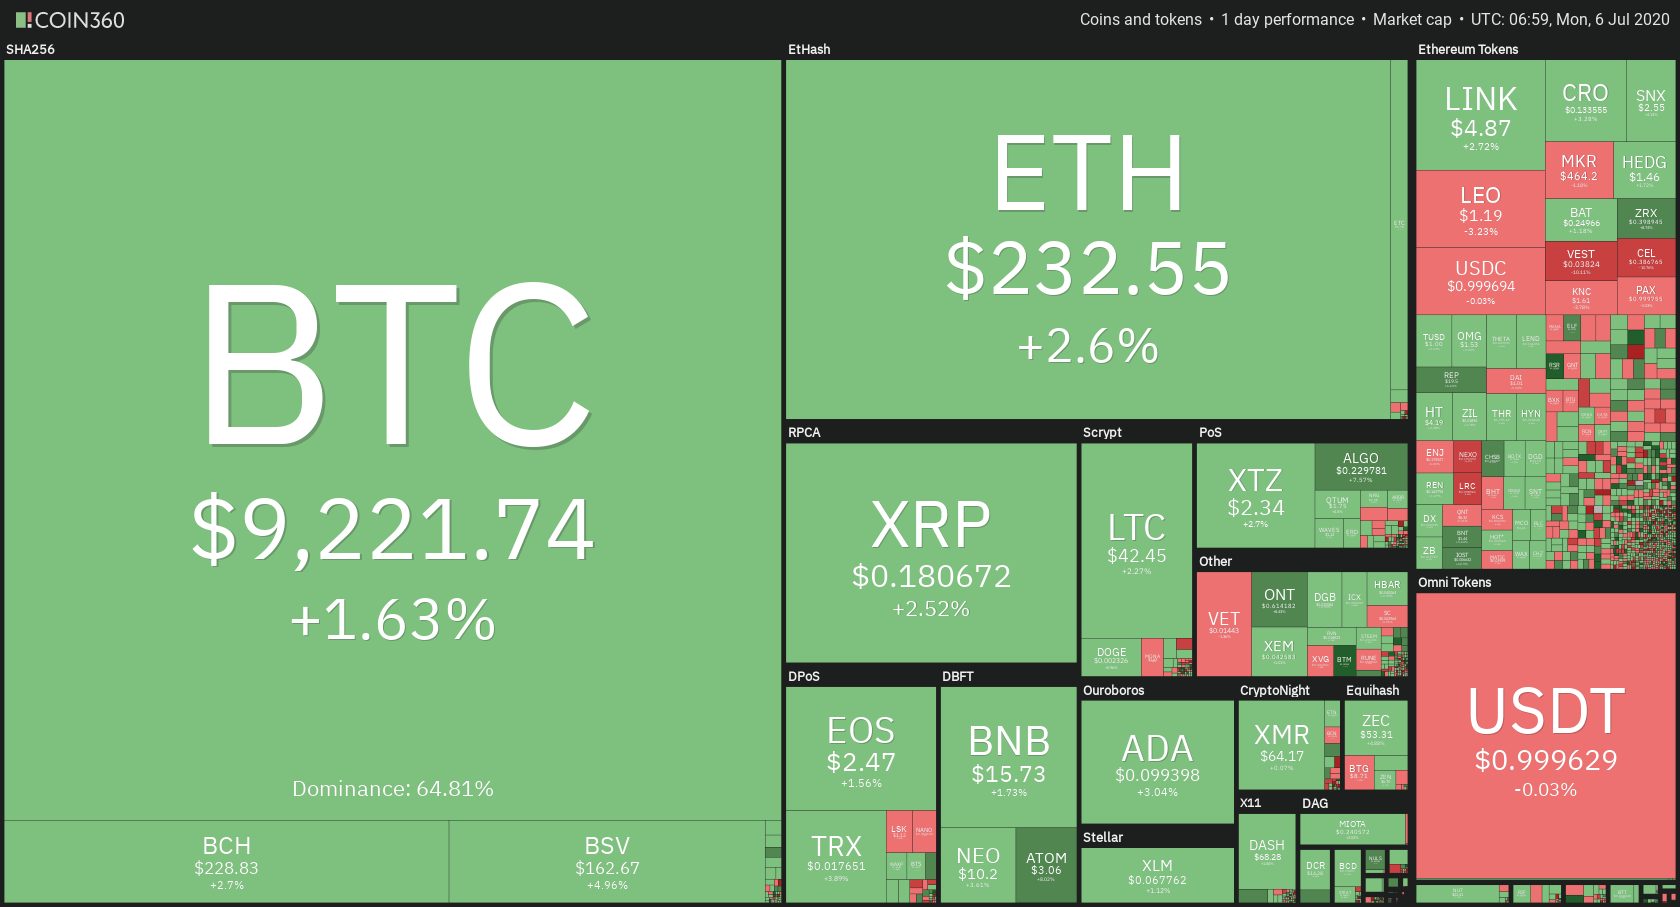
The cryptocurrency market has had a relatively slow weekend until 12 hours ago when the volatility skyrocketed, and cryptocurrencies started moving. Bitcoin is currently trading for $9,221, which represents an increase of 1.63% on the day. Meanwhile, Ethereum gained 2.6% on the day, while XRP gained 2.52%.

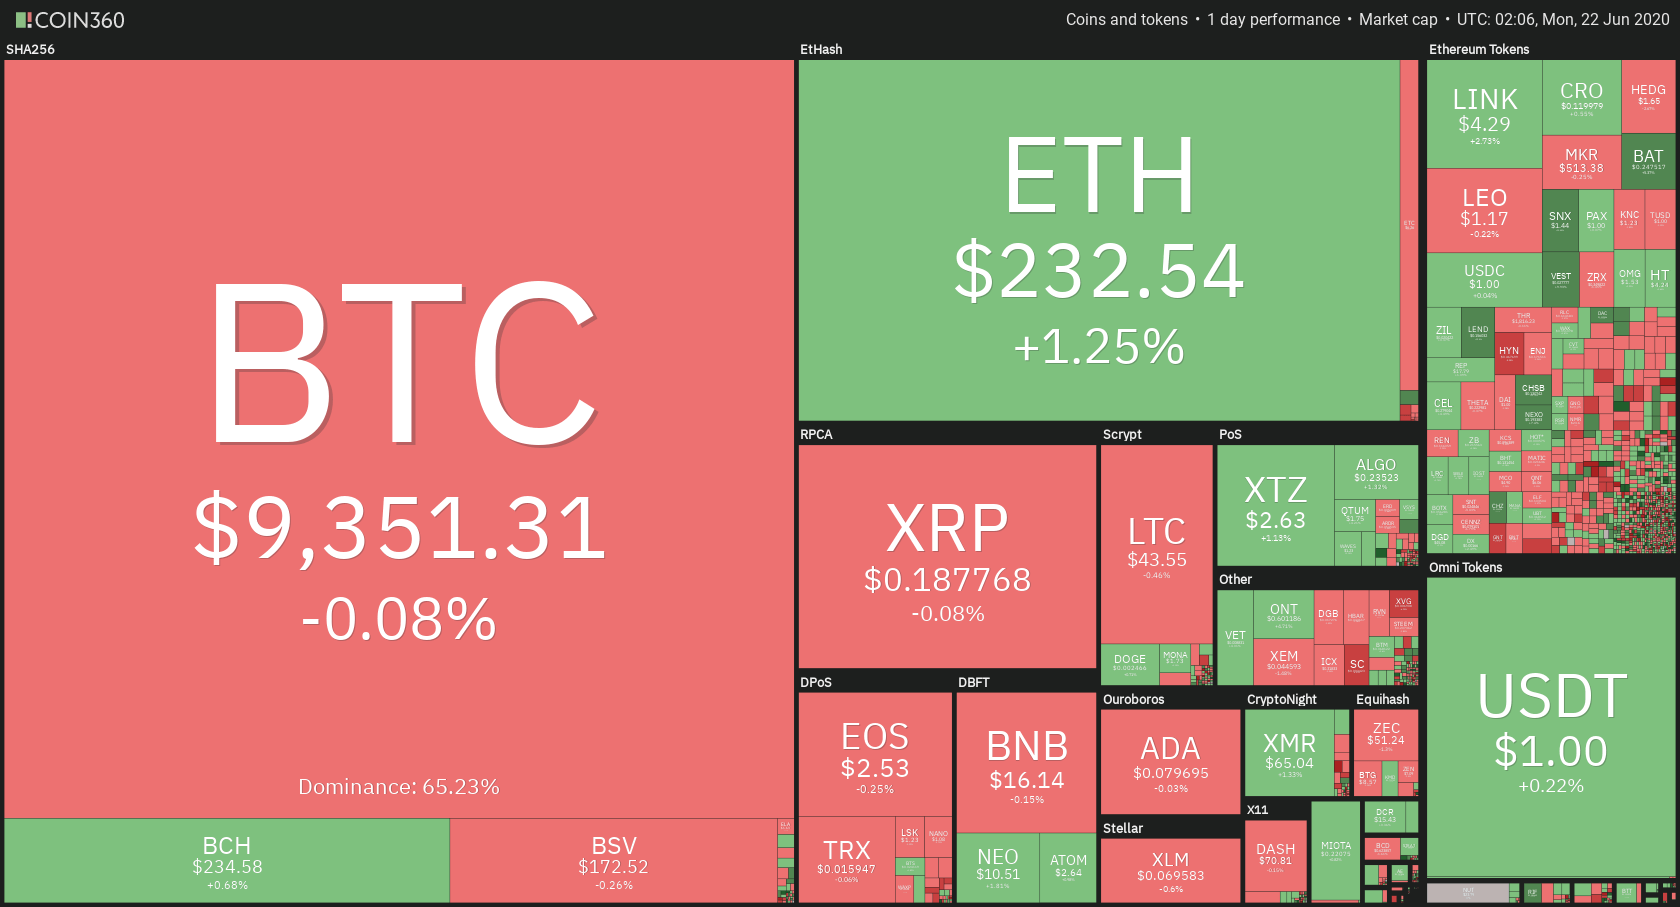
 Daily Crypto Sector Heat Map

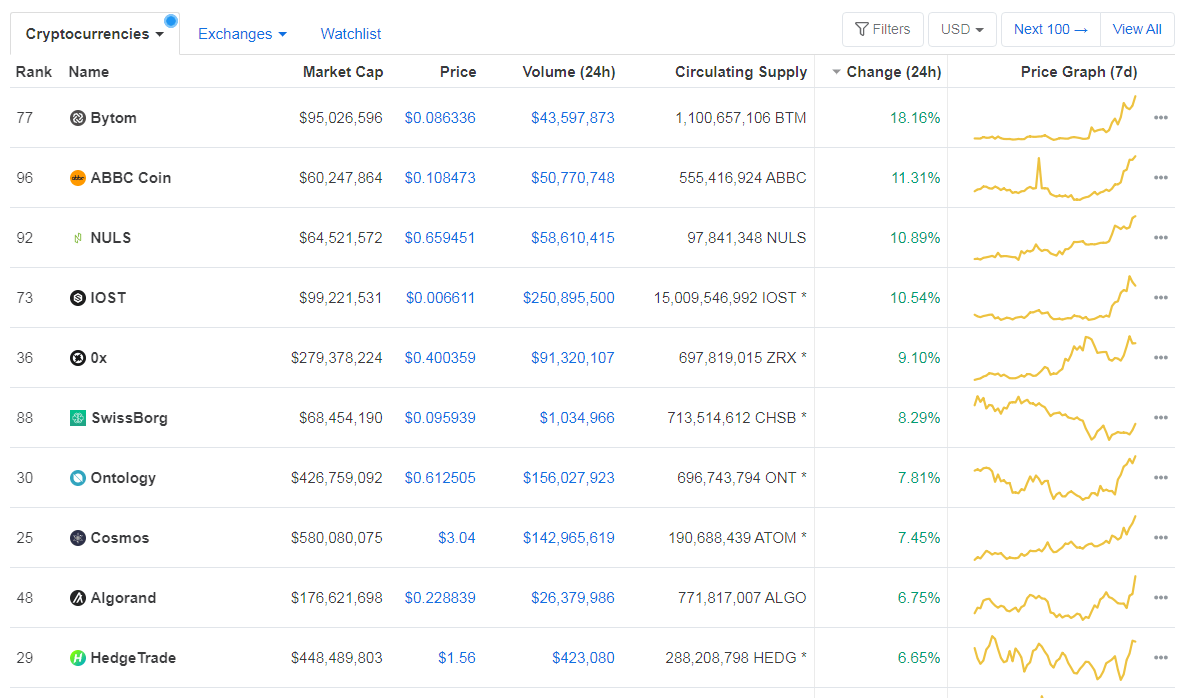
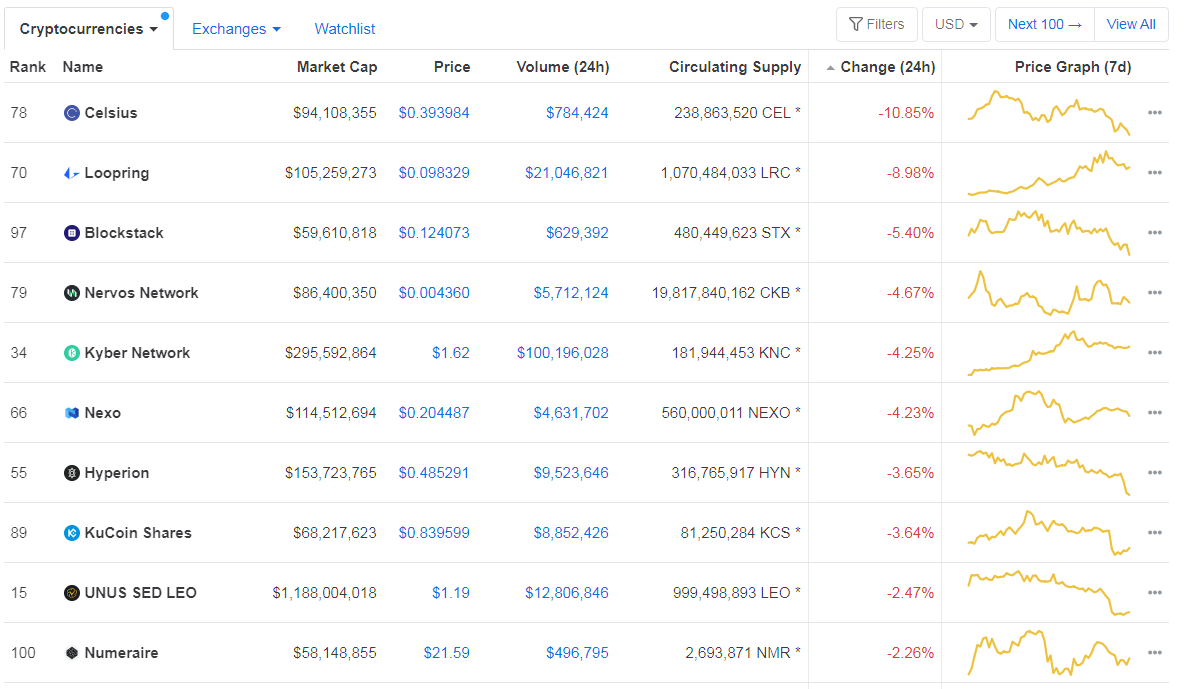
When talking about top100 cryptocurrencies, Bytom gained 18.16% on the day, making it by far the most prominent daily gainer. ABBC Coin (11.31%) and NULS (10.89%) also did great. On the other hand, Celsius has lost 10.85%, making it the most prominent daily loser. It is followed by Loopring’s loss of 8.98% and Blockstack’s loss of 5.40%.

Top 10 24-hour Performers (Click to enlarge)

Bottom 10 24-hour Performers (Click to enlarge)

Bitcoin’s dominance level decreased since we last reported, with its value currently at 64.81%. This value represents a 0.32% difference to the downside when compared to Friday’s value.

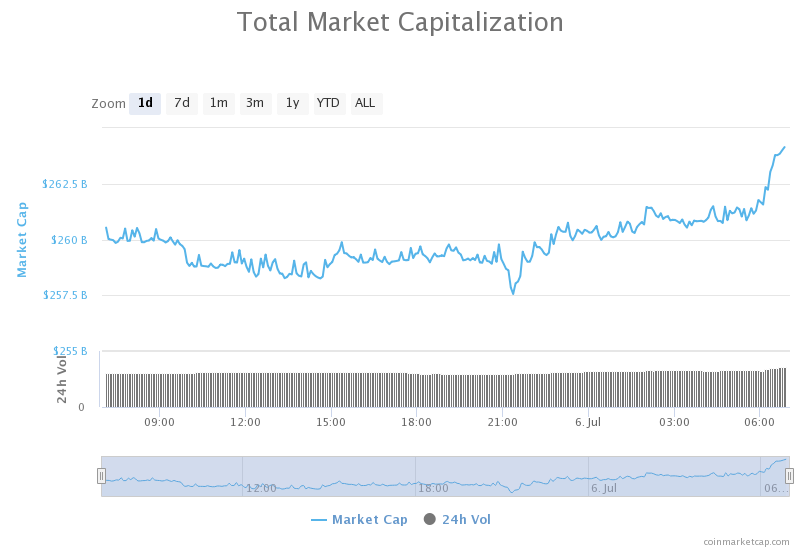
Daily Crypto Market Cap Chart

The cryptocurrency market capitalization increased slightly when compared to when we last reported, with the market’s current value being $264.31 billion. This value represents an increase of $3.72 billion when compared to the value it had on Friday.

_______________________________________________________________________

What happened in the past 24 hours?

_______________________________________________________________________

_______________________________________________________________________

Technical analysis

_______________________________________________________________________

Bitcoin

The largest cryptocurrency by market capitalization has spent the weekend without too much volatility, mostly trading within a range bound by $8,980 and $9,120. There were a couple of occasions where the price tried to pass below the support level and one time that it tried to break above the resistance. However, the volatility skyrocketed in the past 12 hours, as Bitcoin first dropped significantly, reaching $8,900, only to recover and push to $9,200.

Bitcoin seems to be stopped at the $9,251 resistance level, and people should look for how the price movement unfolds after that. Trading when Bitcoin moves within a range, or trading breakout confirmations and pullbacks is the easiest way to net a profit.

BTC/USD 4-hour Chart

Technical factors:

  • Price is above its 50-period EMA and its 21-period EMA
  • Price is above the top B.B.
  • RSI at the upper levels (62.4)
  • Increased Volume

Key levels to the upside          Key levels to the downside

1: $9,251                                 1: $9,120

2: $9,580                                 2: $8,980

3: $9,735                                  3: $8,820

Ethereum

Ethereum’s price movements looked a lot like Bitcoin’s, except that it made an even bigger gain on the daily. The second-largest cryptocurrency by market cap had strong support at $225.4 from which it bounced up, reaching $235. However, the momentum dwindled, and Ethereum is unsure of whether it will continue its move up. For now, the price is consolidating at around $233.

Ethereum traders should look for an opportunity in trading pullbacks or confirmations from ETH contesting the trend (if it manages to reach the bottom trend line).

ETH/USD 4-hour Chart

Technical Factors:

  • Price above the 50-period EMA and the 21-period EMA
  • Price above the upper B.B.
  • RSI almost in the overbought territory (67.2)
  • Increased volume

Key levels to the upside          Key levels to the downside

1: $228                                    1: $225.4

2: $240                                    2: $217.7

3: $251.4                                  3: $198

Ripple

The third-largest cryptocurrency by market cap finally gathered enough bull presence to make a move towards the upside. Sparked up by Bitcoin’s movements, XRP broke out of the descending trend (for now) and reached past the $0.178 support level. While the move seems to be over, due to buyer exhaustion, XRP managed to reach $0.182 levels, which should make it safe from immediately falling under $0.178 (at least in the short term).

XRP/USD 4-hour Chart

Technical factors:

  • XRP in a mid-term descending trend (though it broke the trend in the short-term)
  • XRP lacks strong support levels below $0.178
  • Price is above the 21 and 50-period EMA
  • Price is above the upper B.B.
  • RSI is in the overbought territory (71.2)
  • Increased volume

Key levels to the upside          Key levels to the downside

1: $0.178                                    1: $0.147

2: $0.19                                    

3: $0.2


Categories
Crypto Market Analysis

Daily Crypto Review, July 3 – IRS Wants to Track Lightning Transactions and Privacy Coins; Cryptocurrencies Facing Boundaries

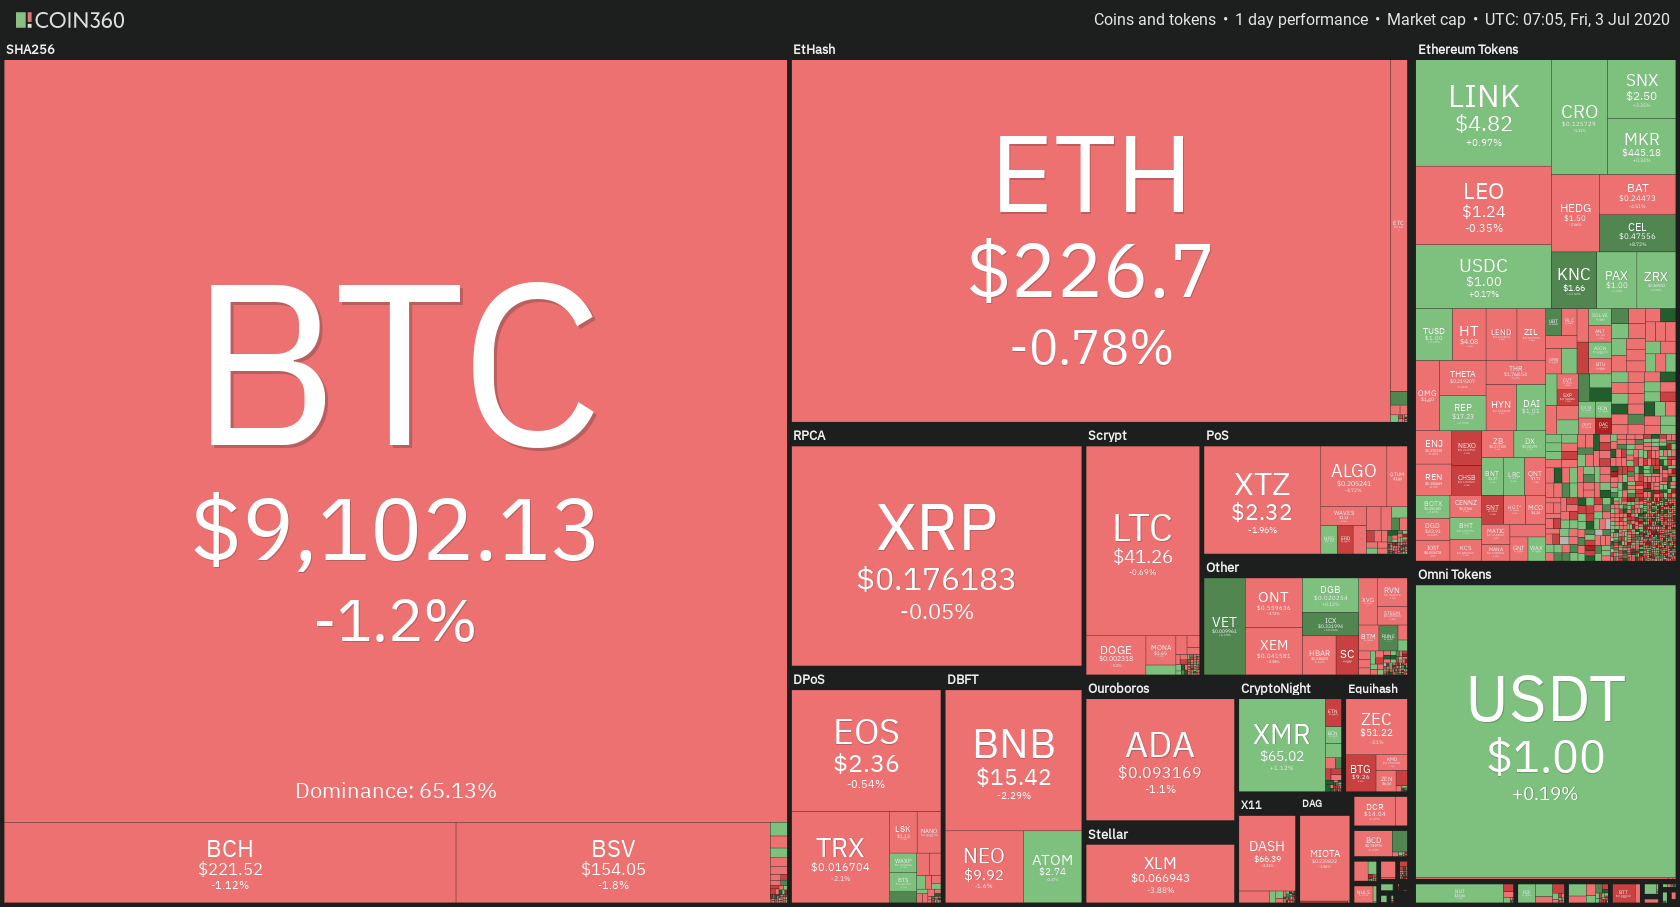
The cryptocurrency market has gone through the day trying to make moves to the upside, but mostly ending up in the red. Bitcoin is currently trading for $9,102, which represents a decrease of 1.2% on the day. Meanwhile, Ethereum lost 0.78% on the day, while XRP lost 0.05%.

 Daily Crypto Sector Heat Map

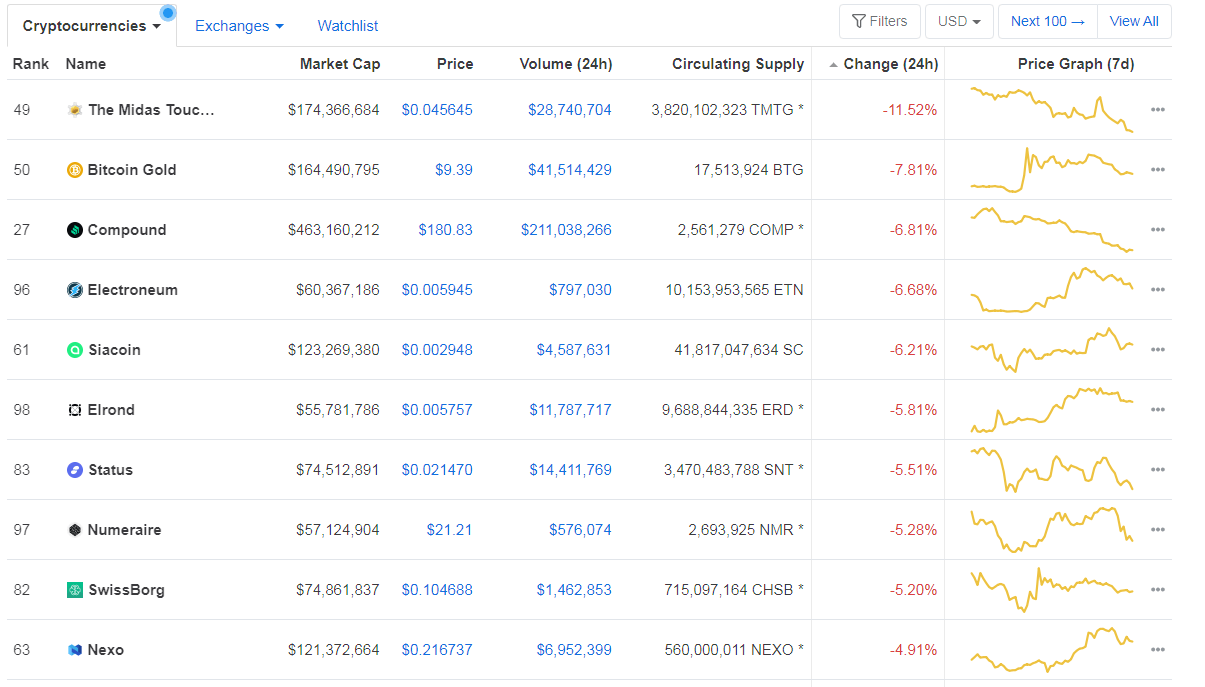
When talking about top100 cryptocurrencies, Kyber Network gained 13.60% on the day, making it by far the most prominent daily gainer. ICON (10.43%) and VeChain (6.68%) also did great. On the other hand, The Midas Touch has lost 11.52%, making it the most prominent daily loser. It is followed by Bitcoin Gold’s loss of 7.81% and Compound’s loss of 6.81%.

Top 10 24-hour Performers (Click to enlarge)

Bottom 10 24-hour Performers (Click to enlarge)

Bitcoin’s dominance level decreased slightly since we last reported, with its value currently at 65.13%. This value represents a 0.17% difference to the downside when compared to yesterday’s value.

Daily Crypto Market Cap Chart

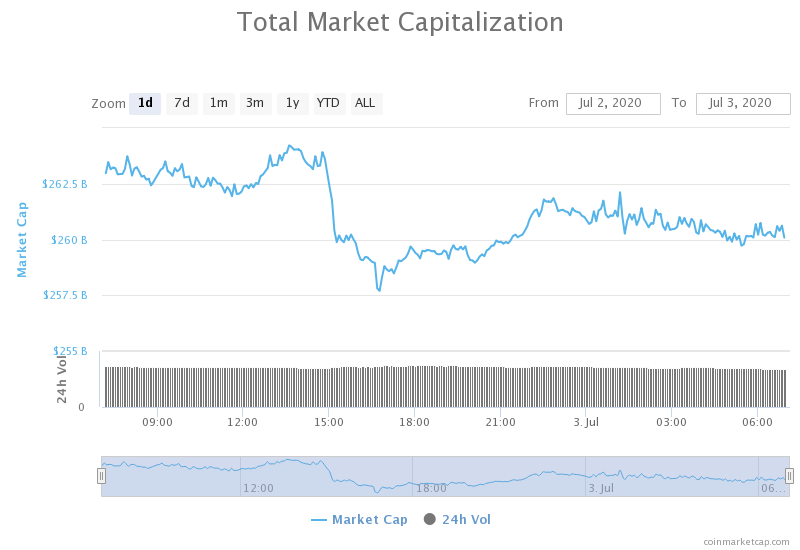
The cryptocurrency market capitalization decreased slightly when compared to yesterday, with the market’s current value being $260.59 billion. This value represents a decrease of $2 billion when compared to the value it had yesterday.

_______________________________________________________________________

What happened in the past 24 hours?

_______________________________________________________________________

_______________________________________________________________________

Technical analysis

_______________________________________________________________________

Bitcoin

The largest cryptocurrency by market capitalization has spent the past day struggling to keep its current level after failing to break $9,251. As the volume increased greatly, Bitcoin managed to approach $9,251 and contest it, but only for a short period of time before falling all the way to $8,935. Its price is now stabilizing at around $9,050.

As we said in our yesterday’s article, traders should be wary of trading Bitcoin just based on its momentum as you never without confirmation. They should rather watch for confirmations or pullbacks and trade those (and those that did had a great trade yesterday).

BTC/USD 4-hour Chart

Technical factors:

  • Price is below its 50-period EMA and its 21-period EMA
  • Price is between the Lower B.B and the Middle B.B. (20period SMA)
  • RSI below the middle point (44.4)
  • Increased Volume (Coming back to normal)

Key levels to the upside          Key levels to the downside

1: $9,251                                 1: $9,120

2: $9,580                                 2: $8,980

3: $9,735                                  3: $8,820

Ethereum

Ethereum had quite a bad day, as Bitcoin’s move towards the downside pulled its price down as well, making it leave the ascending trade channel it was in. After falling out of the channel, Ethereum found support in the $225.4 support level, which held up nicely. The price is now moving up, possibly contesting the channel soon.

Ethereum traders should look for an opportunity in trading pullbacks or confirmations from ETH contesting the trend.

ETH/USD 4-hour Chart

Technical Factors:

  • Price below the 50-period EMA and the 21-period EMA
  • Price at the Middle B.B. (20-period SMA)
  • RSI below the middle point (48.8)
  • Increased volume (Coming back to normal)

Key levels to the upside          Key levels to the downside

1: $228                                    1: $225.4

2: $240                                    2: $217.7

3: $251.4                                  3: $198

Ripple

The third-largest cryptocurrency by market cap is continuing its path towards the downside by following the descending trading channel. XRP doesn’t have enough volume to tackle any resistance levels, and it seems that it is just bouncing off of the bottom and top channel lines.

There aren’t many XRP trading opportunities at the moment, but traders could sneak in a trade or two tradings this ranging move XRP is performing.

XRP/USD 4-hour Chart

Technical factors:

  • XRP in a mid-term (and short-term) descending trend
  • XRP lacks strong support levels below $0.178
  • The upside is guarded by the 21 and 50-period EMA
  • Price is at the Middle B.B. (20 SMA)
  • RSI is below the middle point (47.9)
  • Average (extremely low) volume

Key levels to the upside          Key levels to the downside

1: $0.178                                    1: $0.147
2: $0.19                                    

3: $0.2


Categories
Crypto Market Analysis

Daily Crypto Review, July 2 – Paypal Using Crypto? Bitcoin Preparing For a Move

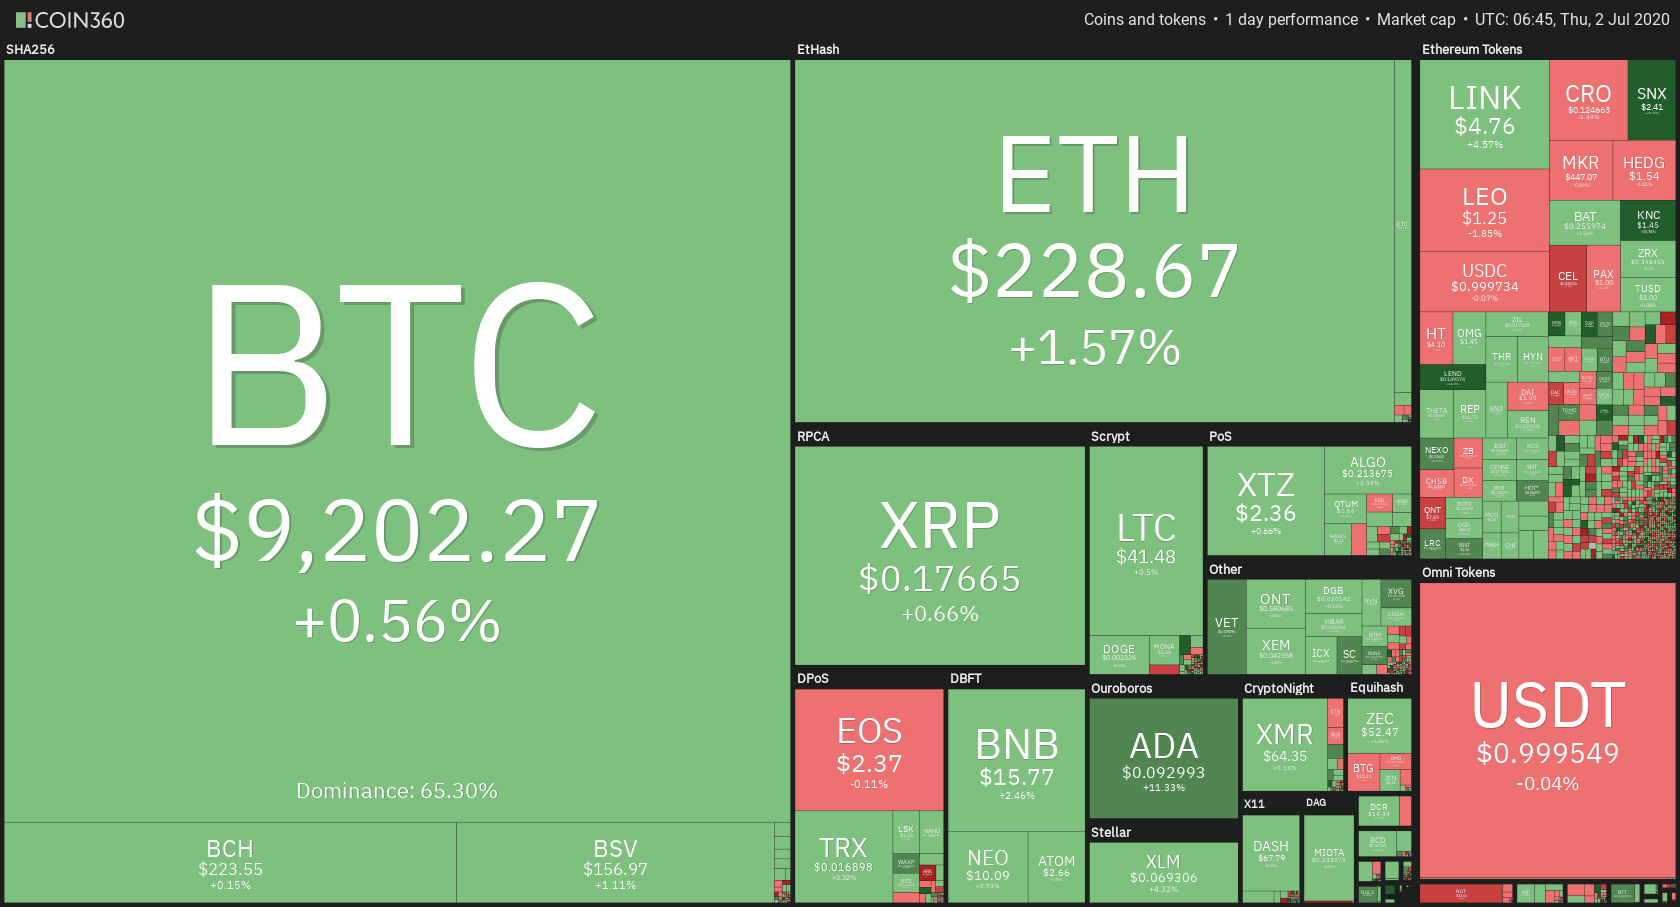
The cryptocurrency market has spent the day attempting to break its immediate resistance levels. Bitcoin is currently trading for $9,202, which represents an increase of 0.56% on the day. Meanwhile, Ethereum gained 1.57% on the day, while XRP gained 0.66%.

 Daily Crypto Sector Heat Map

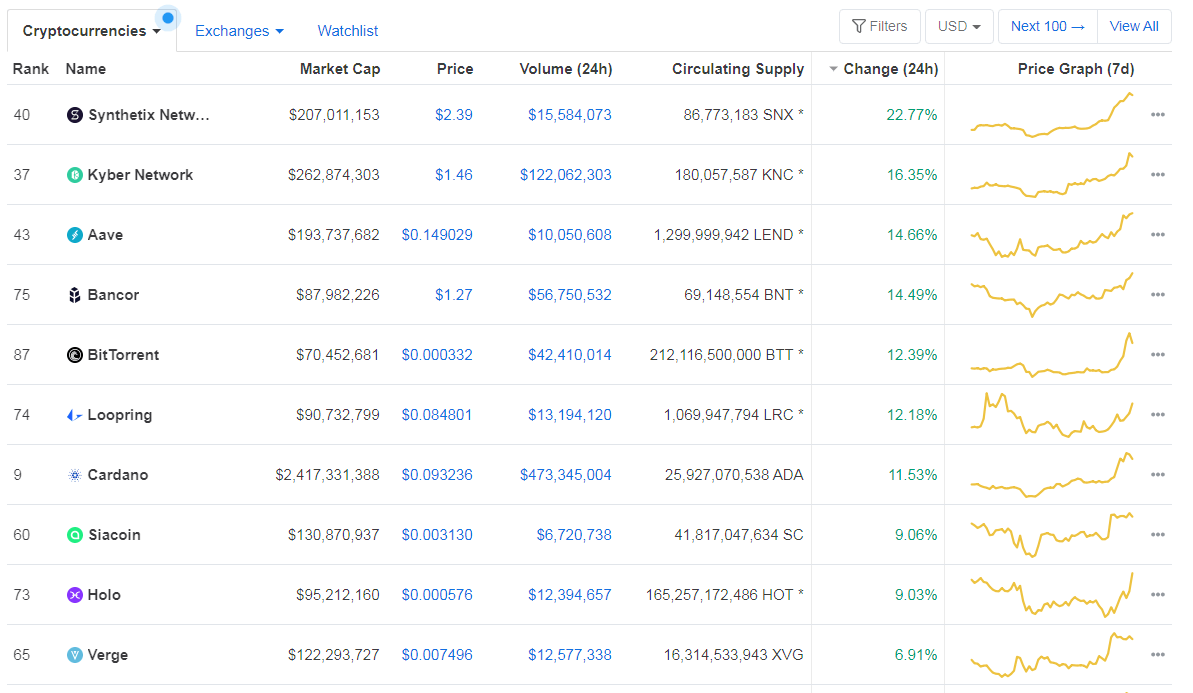
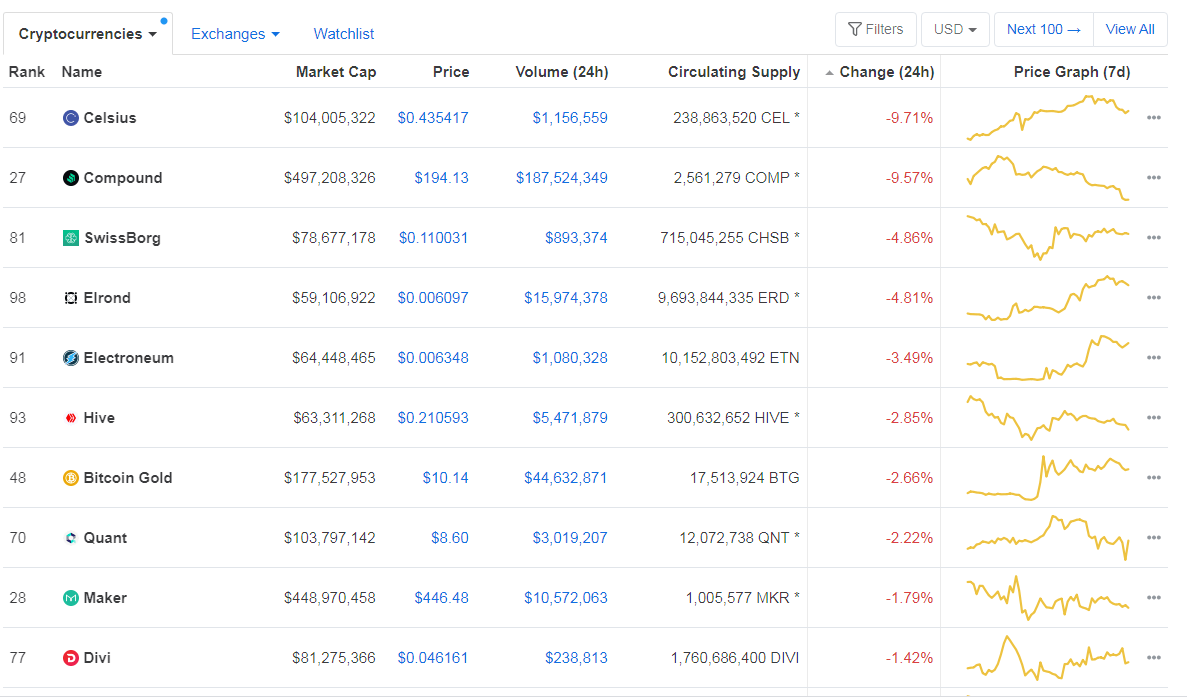
When talking about top100 cryptocurrencies, Synthetix Network gained 22.77% on the day, making it by far the most prominent daily gainer. Kyber Network (16.35%) and Aave (14.66%) also did great. On the other hand, Celsius has lost 9.71%, making it the most prominent daily loser. It is followed by Compound’s loss of 9.57% and SwissBorg’s loss of 4.86%.

Top 10 24-hour Performers (Click to enlarge)

Bottom 10 24-hour Performers (Click to enlarge)

Bitcoin’s dominance level decreased slightly since we last reported, with its value currently at 65.30%. This value represents a 0.06% difference to the downside when compared to yesterday’s value.

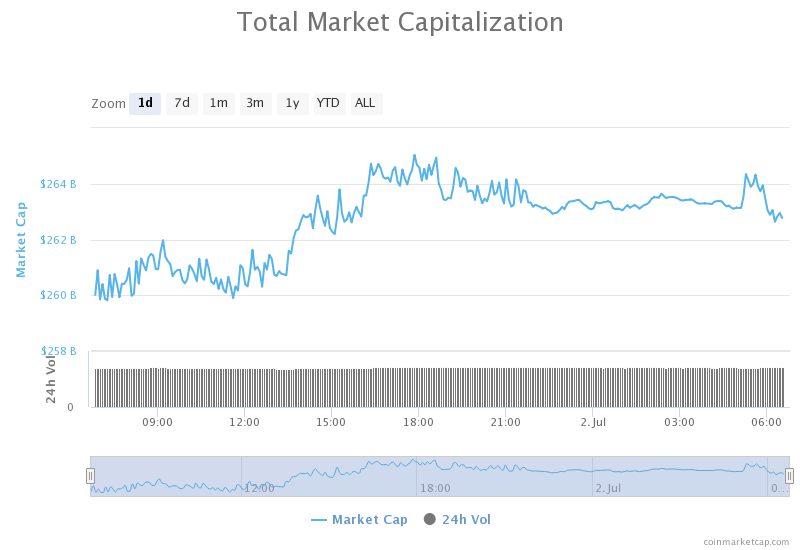
Daily Crypto Market Cap Chart

The cryptocurrency market capitalization increased slightly when compared to yesterday, with the market’s current value being $262.59 billion. This value represents an increase of $3.11 billion when compared to the value it had yesterday.

_______________________________________________________________________

What happened in the past 24 hours?

_______________________________________________________________________

_______________________________________________________________________

Technical analysis

_______________________________________________________________________

Bitcoin

The largest cryptocurrency by market capitalization has spent the past day trying to reach above its $9,251 resistance level. As the volume increased, Bitcoin managed to tackle this level, but only for a short period of time. The price didn’t manage to stay above $9,251, and Bitcoin moved below it yet again. It is now consolidating right below it.

Traders should be wary of trading Bitcoin just based on its momentum. They should rather watch for confirmations or pullbacks and trade those.

BTC/USD 4-hour Chart

Technical factors:

  • Price is above its 50-period EMA and its 21-period EMA
  • Price is above the Middle B.B. (20period SMA)
  • RSI above the middle point (55.5)
  • Increased Volume (Coming back to normal)

Key levels to the upside          Key levels to the downside

1: $9,251                                 1: $9,120

2: $9,580                                 2: $8,980

3: $9,735                                  3: $8,820

Ethereum

Ethereum was also ready to move to the upside in the past 24 hours, which it did a bit more successfully than Bitcoin. The second-largest cryptocurrency by market capitalization gathered up buyers and tried to reach higher levels (though not necessarily to break any resistance levels like $240 is too far away. However, it got stopped in its tracks around the $233 mark, where the price hit the newly-formed trend upper line.

Ethereum traders should have an easy time trading within the boundaries of the newly-formed trend.

ETH/USD 4-hour Chart

Technical Factors:

  • Price above the 50-period EMA and the 21-period EMA
  • Price right above Middle B.B. (20-period SMA)
  • RSI above the middle point (52.7)
  • Increased volume

Key levels to the upside          Key levels to the downside

1: $228                                    1: $225.4

2: $240                                    2: $217.7

3: $251.4                                  3: $198

Ripple

The third-largest cryptocurrency by market cap is continuing its path towards the downside by following the descending trend line. XRP doesn’t have enough volume to tackle the $0.178 level at the moment, so its moves are either to the downside or right to the resistance level.

There aren’t many XRP trading opportunities at the moment, but most of them are completely straightforward, as they are always accompanied by sharp increases in volume.

XRP/USD 4-hour Chart

Technical factors:

  • XRP in a mid-term descending trend
  • XRP lacks strong support levels below $0.178
  • The upside is guarded by the 21 and 50-period EMA
  • Price in a narrow range between the Middle B.B. (20 SMA) and Lower B.B.
  • RSI is below the middle point (47)
  • Average (extremely low) volume

Key levels to the upside          Key levels to the downside

1: $0.178                                    1: $0.147

2: $0.19                                    

3: $0.2


Categories
Crypto Market Analysis

Daily Crypto Review, July 1 – BoA Treating Crypto as Cash; XRP Continuing its Downtrend

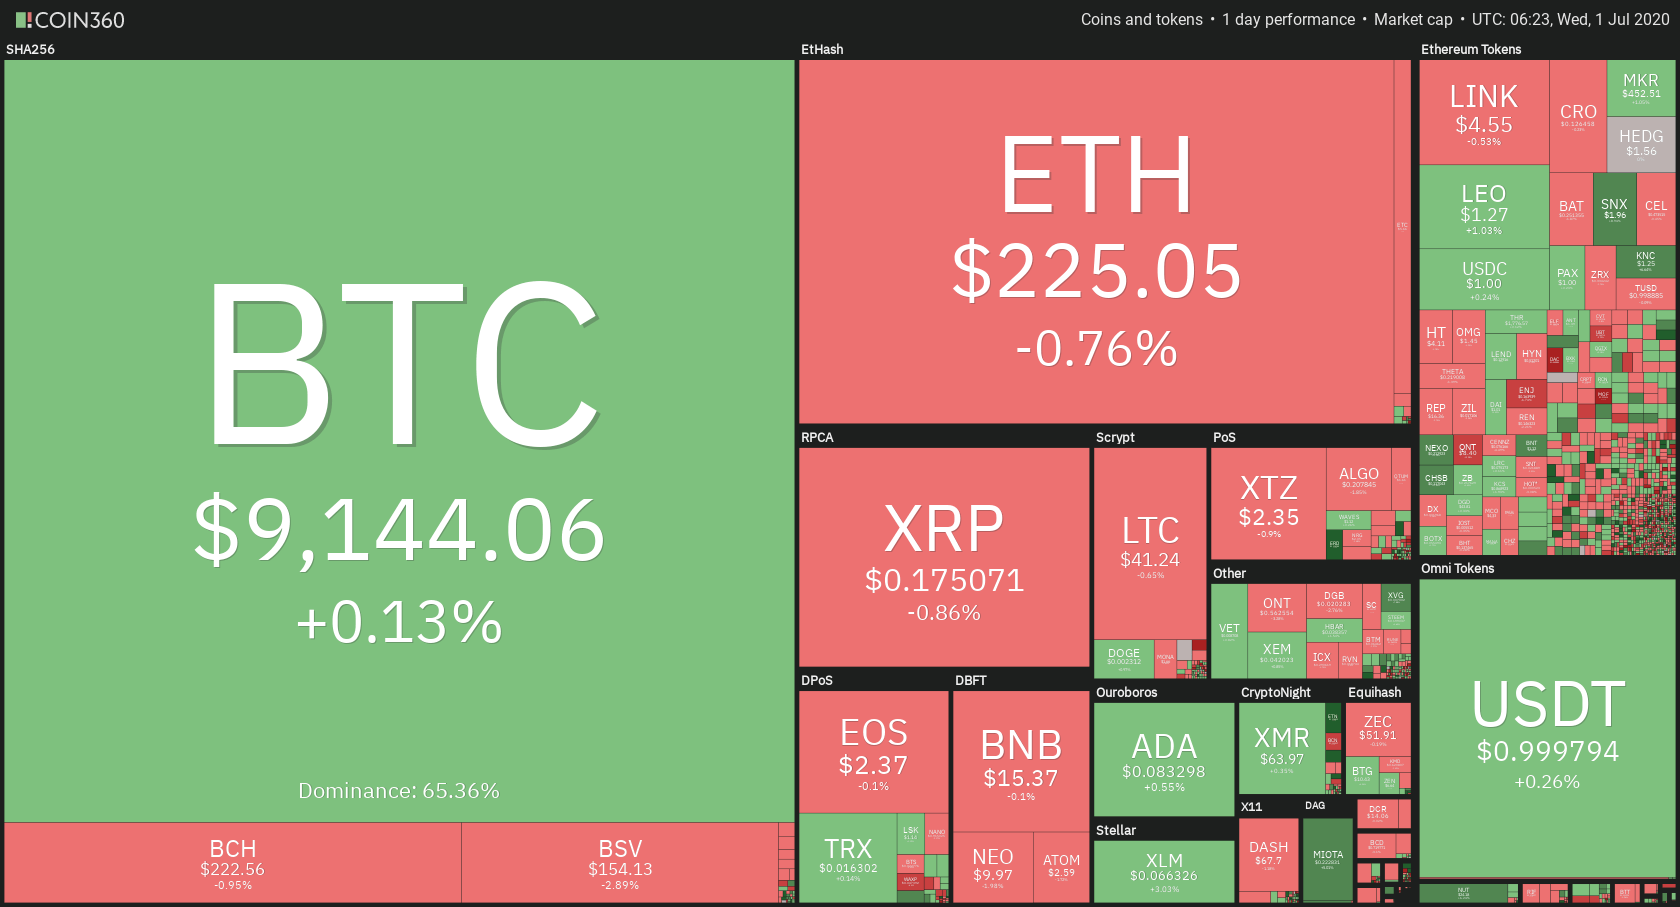
The cryptocurrency market has had a slow day, with most cryptos seeking consolidation. Bitcoin is currently trading for $9,144, which represents an increase of 0.13% on the day. Meanwhile, Ethereum lost 0.76% on the day, while XRP lost 0.86%.

 Daily Crypto Sector Heat Map

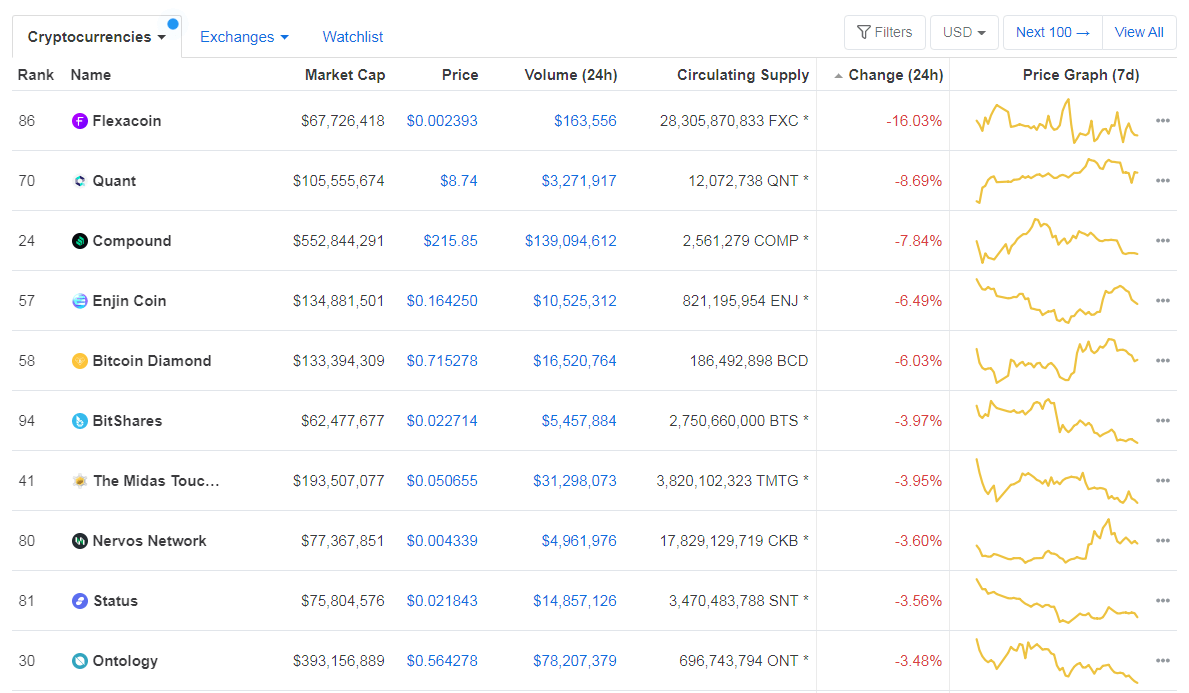
When talking about top100 cryptocurrencies, Electroneum gained 16.39% on the day, making it by far the most prominent daily gainer. Elrond (15.22%) and SwissBorg (10.43%) also did great. On the other hand, Flexacoin has lost 16.03%, making it the most prominent daily loser. It is followed by Quant’s loss of 8.69% and Compound’s loss of 7.84%.

Top 10 24-hour Performers (Click to enlarge)

Bottom 10 24-hour Performers (Click to enlarge)

Bitcoin’s dominance level decreased slightly since we last reported, with its value currently at 65.36%. This value represents a 0.04% difference to the downside when compared to yesterday’s value.

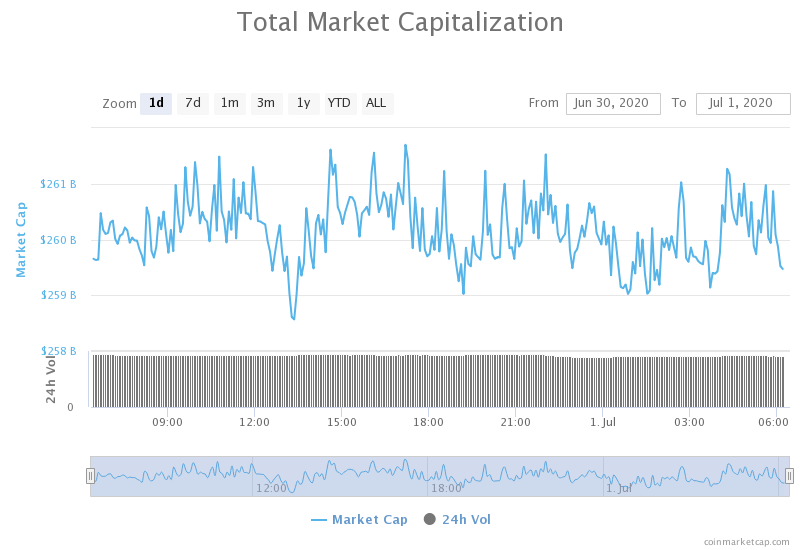
Daily Crypto Market Cap Chart

The cryptocurrency market capitalization stayed at almost precisely the same place when compared to yesterday, with the market’s current value being $259.48 billion. This value represents a decrease of $1.76 billion when compared to the value it had yesterday.

_______________________________________________________________________

What happened in the past 24 hours?

_______________________________________________________________________

_______________________________________________________________________

Technical analysis

_______________________________________________________________________

Bitcoin

The largest cryptocurrency by market capitalization took another day to find a place at which to consolidate. Low Volume and low volatility gave us a day with seemingly no movement, but the lack of action is more likely produced by the support and resistance levels rather than the absence of Volume. Bitcoin is trading in an extremely tight range, bound by the 50-period moving average to the upside and $9,120 to the downside.

Trading in such a narrow range is impossible for more extended periods, so traders should be aware of any volume increases accompanied by one of these levels being broken.

BTC/USD 4-hour Chart

Technical factors:

  • Price is below its 50-period EMA and above its 21-period EMA
  • Price above the Middle B.B. (20period SMA)
  • RSI near the middle point (48)
  • Average Volume

Key levels to the upside          Key levels to the downside

1: $9,251                                 1: $9,120

2: $9,580                                 2: $8,980

3: $9,735                                  3: $8,820

Ethereum

The second-largest cryptocurrency by market capitalization retreated to the support level of $225.4 over the course of the day. While the Volume is extremely low, bears seem to be in slight control over Ethereum, which is why the immediate support level is continuously being tested.

Ethereum traders should position their next trade based on the break confirmation (to the upside or downside) of the $225.4 level.

ETH/USD 4-hour Chart

Technical Factors:

  • Price below the 50-period EMA and the 21-period EMA
  • Price right above Middle B.B. (20-period SMA)
  • RSI near the middle point (46)
  • Extremely low Volume

Key levels to the upside          Key levels to the downside

1: $228                                    1: $225.4

2: $240                                    2: $217.7

3: $251.4                                  3: $198

Ripple

The third-largest cryptocurrency by market cap is continuing its path towards the downside by following the descending trend line. After failing to regain its position above the $0.178 level, XRP started dropping in price. The price drop was (for now) stopped by the lower Bollinger band. However, any move towards the upside will not only have to tackle the $0.178 level, but the 21-period and 50-period moving averages as well.

There aren’t many XRP trading opportunities at the moment, but most of them are completely straightforward, as they are always accompanied by sharp increases in Volume.

XRP/USD 4-hour Chart

Technical factors:

  • XRP in a mid-term descending trend
  • XRP lacks strong support levels below $0.178
  • The upside is guarded by the 21 and 50-period EMA
  • Price in a narrow range between the Middle B.B. (20 SMA) and Lower B.B.
  • RSI is below the middle point (39)
  • Lower than average Volume

Key levels to the upside          Key levels to the downside

1: $0.178                                    1: $0.147

2: $0.19                                    

3: $0.2


Categories
Cryptocurrencies

What is Mona Coin? Here’s All

Cryptocurrency is a radical idea. From the decentralization and autonomy beliefs that underpin it, to its revolutionary technology that enables permanent, transparent, and employs ultra-modern cryptography to safeguard transactions. It makes sense, therefore, that thousands of cryptocurrencies have been created to actualize these beliefs in countless industries.

Even countries are now adopting national cryptocurrencies in order to derive the massive value they have to offer. 

MonaCoin, which calls itself “The first Japanese Cryptocurrency,” is one such cryptocurrency. And though it’s not exactly an official national cryptocurrency, i.e., it’s not government-sponsored or affiliated in any way, it’s one that has been created with the notion in mind. 

The cryptocurrency is quite popular there, being featured on Tokyo TV. Someone even famously bought land with it back in 2014. 

So, what’s Mona Coin all about? Read on to discover more about this interesting project. 

Understanding MonaCoin

Launched in 2013, MonaCoin is a cryptocurrency predominantly used in Japan. The name is inspired by “Mona” or “Monā,” a popular internet meme based on a cat-like character created with ASCII characters. The existence and work on the currency were announced on 2channel, an anonymous and the most popular online community in Japan. It was created by “Mr.Watanabe” – whose real identity has remained a mystery just like Bitcoin’s Satoshi Nakamoto. 

MonaCoin was created as a peer-to-peer electronic cash system, just like Bitcoin, and it’s targeted to Japanese citizens. The coin has found a degree of acceptance in the country, being accepted for payment in several stores. The coin is approved by Japan’s Financial Services Agency and is traded in several exchanges. 

MonaCoin: An History

MonaCoin’s development began in 2013, officially being born on January 1, 2014. The coin was not pre-mined.

At block height 937440, the MonaCoin blockchain executed a soft fork to implement Segwit, a technology meant to improve scalability on blockchains. The team also has the Lightning Network, another scalability solution for payment-focused cryptocurrencies. 

It’s theorized that MonaCoin’s creation reflects a Japanese culture to have a native version of popular things from around the globe. It’s a desire for the Japanese to have their own version of popular products and services that they can take pride in both as being homemade and also one that’s expressed in the Japanese language. 

Who’s on the MonaCoin Team?

This is not an easy question to answer, given the founder of the project has remained pseudonymous, perhaps in homage to Satoshi Nakamoto. The creator only identifies by “Mr. Watanabe,” and the rest of the team is also anonymous. However, many people speculate that the creators are Japanese.

Additionally, the project doesn’t have a publicly available roadmap. However, its implementation of technologies such as Segwit and the Lightning Network reveals that the team clearly likes to stay on top of things. Follow MonaCoin’s development here

MonaCoin Economics

Here’s a breakdown of MonaCoin as of June 15, 2020. The coin was trading at $1.67, with a #62 market rank. It has a market cap of $110, 072, 984, as well as a 24-hour volume of $7,736,469 and a circulating and total supply of 65,729,675. MonaCoin’s all-time high was $20.23 (Dec 06, 2017) , and its all-time low was $.0.019599 (Jan 14,2015). 

Buying and Storing MonaCoin 

As you would expect, Japan-based exchanges, like Bitbank and Zaif, are the ones with the majority of MonaCoin’s trading volume. However, you can also find the coin in exchanges like Upbit and Bittrex. 

MonaCoin has its own wallets that are available for Windows, Mac, and Linux. It also supports its own Electrum Wallet as a Coinomi wallet for Android. 

Final Words

MonaCoin is a cryptocurrency made by the Japanese for Japan. It’s popular in the country and is enjoying quite a bit of acceptance there. And while the project’s creators remain tight-lipped about their identities, the important thing is that they have delivered, and continue to deliver, a cryptocurrency that the Japanese and the entire blockchain and crypto community can be proud about. 

Categories
Crypto Market Analysis

Daily Crypto Review, Jun 30 – Crypto Debit Cards are Dead? Crypto Market Preparing For a Move

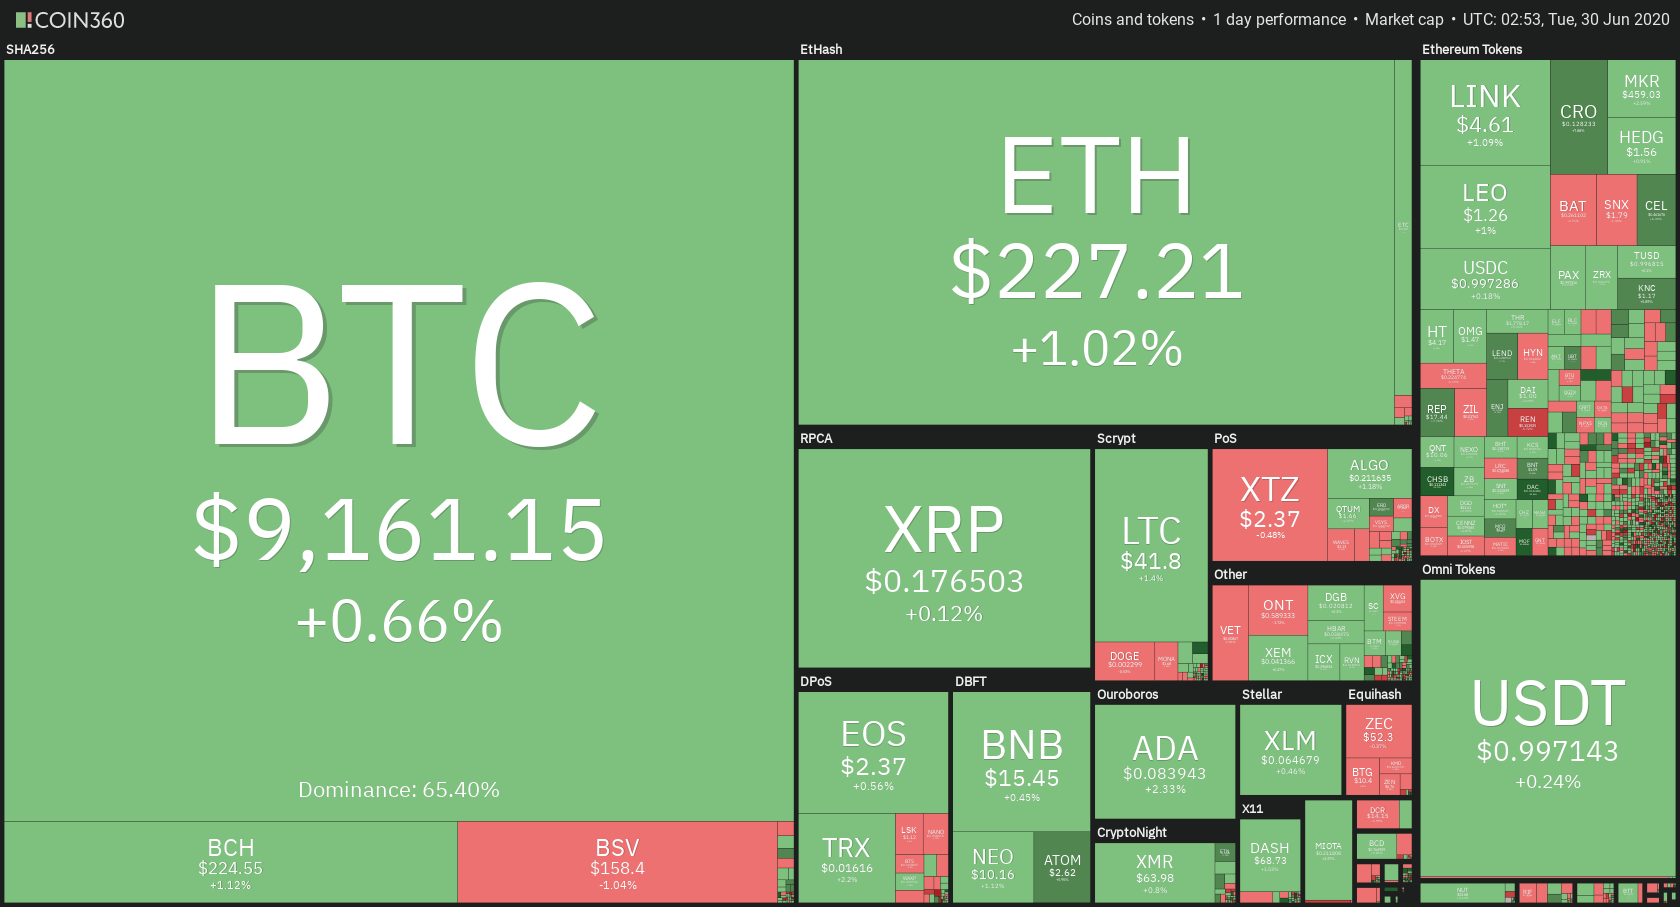
The cryptocurrency market has had a slow day, with most cryptos seeking consolidation after a turbulent weekend. Bitcoin is currently trading for $9,161, which represents an increase of 0.66% on the day. Meanwhile, Ethereum gained 1.02% on the day, while XRP gained 0.12%.

 Daily Crypto Sector Heat Map

When talking about top100 cryptocurrencies, SwissBorg gained 18.17% on the day, making it by far the most prominent daily gainer. Elrond (12.74%) and Flexacoin (10.34%) also did great. On the other hand, The Midas Touch has lost 6.55%, making it the most prominent daily loser. It is followed by Ren’s loss of 5.09% and Bitcoin Gold’s loss of 4.36%.

Top 10 24-hour Performers (Click to enlarge)

Bottom 10 24-hour Performers (Click to enlarge)

Bitcoin’s dominance level increased slightly since we last reported, with its value currently at 65.4%. This value represents a 0.15% difference to the upside when compared to yesterday’s value.

Daily Crypto Market Cap Chart

The cryptocurrency market capitalization stayed at exactly the same place when compared to yesterday, with the market’s current value being $261.24 billion. This value represents an increase of $1.82 billion when compared to the value it had yesterday.

_______________________________________________________________________

What happened in the past 24 hours?

_______________________________________________________________________

_______________________________________________________________________

Technical analysis

_______________________________________________________________________

Bitcoin

The largest cryptocurrency by market capitalization took the time to recover after a pretty volatile weekend. The price surpassed yesterday’s price, but not by much. Even so, the 21-period moving average is tackled, and Bitcoin is now using it as a support rather than a resistance level. However, its moves to the upside were stopped by the 50-period moving average as well as the $9,251 resistance level.

Traders should closely pay attention to how well Bitcoin reacts to immediate support and resistance levels, as well as to the 21-period and 50-period moving averages.


BTC/USD 4-hour Chart

Technical factors:

  • Price is below its 50-period EMA and above its 21-period EMA
  • Price above the Middle B.B. (20period SMA)
  • RSI near the middle point (52)
  • Slightly above-average Volume

Key levels to the upside          Key levels to the downside

1: $9,251                                 1: $9,120

2: $9,580                                 2: $8,980

3: $9,735                                  3: $8,820

Ethereum

Ethereum had an interesting day, as its price was not so stagnant. The second-largest cryptocurrency by market cap made a move to the upside in order to confirm breaking of $225.4 to the upside. After this was done successfully, the move got stopped in between the 21-period moving average to the downside and the 20-period SMA to the upside.

Ethereum traders should pay attention to support and resistance levels more than the moving averages, as it seems that Ethereum respects clear horizontal levels a bit more.

ETH/USD 4-hour Chart

Technical Factors:

  • Price below the 50-period EMA and above the 21-period EMA
  • Price right below Middle B.B. (20-period SMA)
  • RSI near the middle point (51)
  • Average (low) Volume

Key levels to the upside          Key levels to the downside

1: $228                                    1: $225.4

2: $240                                    2: $217.7

3: $251.4                                  3: $198

Ripple

The third-largest cryptocurrency by market cap had a slow day, even with slightly elevated volume. XRP tried to break the $0.178 resistance level over the course of the day but failed to do so many times. As both 21period EMA and 20-period SMA are currently at the $0.178 level, XRP’s price might slowly go down as these moving average lines lower.

There aren’t many XRP trading opportunities at the moment, but most of them are completely straightforward, as they are always happening with sharp increases in volume. If XRP goes down, It is heavily guarded by the descending line which can be traded off of.

XRP/USD 4-hour Chart

Technical factors:

  • XRP in a mid-term descending trend
  • XRP lacks strong support levels below $0.178
  • The upside is guarded by the 21 and 50-period EMA
  • Price slightly below the Middle B.B. (20 SMA)
  • RSI is below the middle point (44)
  • Average Volume

Key levels to the upside          Key levels to the downside

1: $0.178                                    1: $0.147

2: $0.19                                    

3: $0.2


Categories
Crypto Videos

Are Baby Boomers Now Actually Investing in Bitcoin?


Are Baby Boomers Actually Investing in Bitcoin?


San Franciscan Bitcoin Broken River Financial posted a statistic showing that their trading volume increase happened because of baby boomers. They said that baby boomers are responsible for as much as 77% of their volume growth.

Paul Tudor Jones effect

While most surveys so far concluded that younger generations are more susceptible to investing in Bitcoin, the data provided by River Financial says otherwise. Alex Leishman, the company’s co-founder, and CEO, told Bloomberg that Bitcoin is, as the time passes, becoming more mainstream and that many investors are following in the footsteps of the famous Paul Tudor Jones.

All the money comes from older generations

Many analysts have noticed that the institutional interest in Bitcoin in 2020 is on the rise, with Grayscale leading the “heard” and buying as much as the new supply, if not more.

Although millennials accepted the premise of cryptocurrencies in the first place, it is extremely important that the crypto market gets accepted by the older generations. Households in the older group possess 10 to 30 times more wealth as the millennial demographic on average. If the info posted by River Financials indicates more baby boomers coming into the crypto market, investors could expect a great year in terms of returns.

Categories
Crypto Market Analysis

Daily Crypto Review, Jun 29 – Grayscale Buying Bitcoin Non-Stop: Preparing For a Bull Run or Whales Dumping BTC?

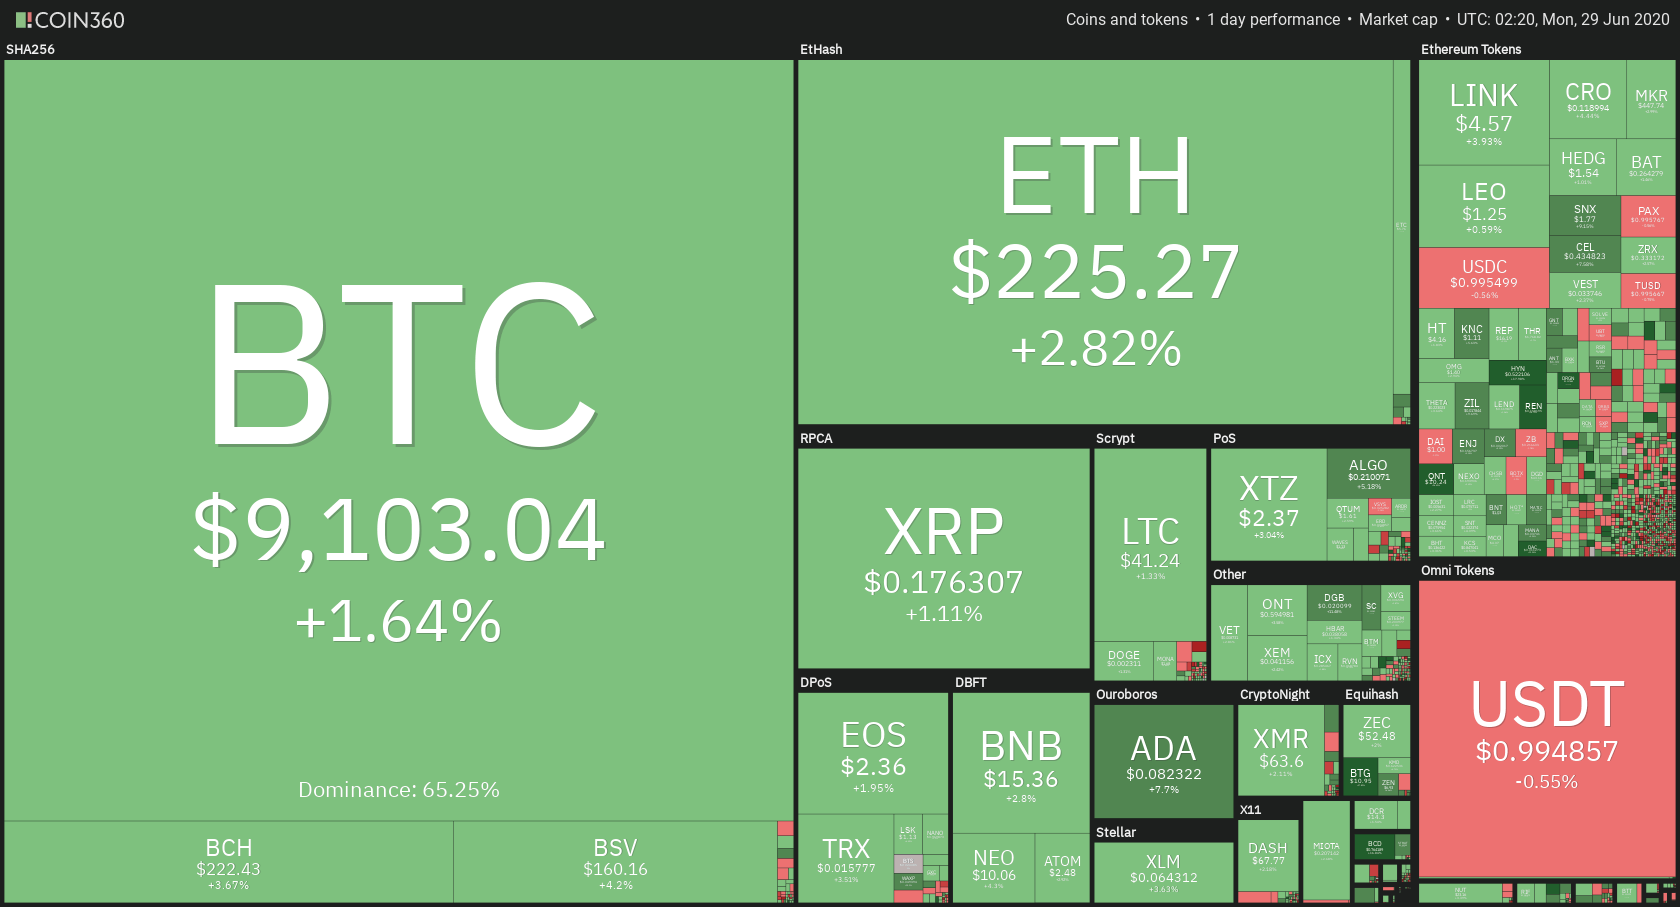
The cryptocurrency market has had a somewhat turbulent weekend. Most cryptocurrencies’ prices tumbled on Jan 27 as Bitcoin led the move to the downside but quickly started gaining bullish momentum and recovered over the rest of the weekend. Bitcoin is currently trading for $9,103, which represents an increase of 1.64% on the day. Meanwhile, Ethereum gained 2.82% on the day, while XRP gained 1.11%.

 Daily Crypto Sector Heat Map

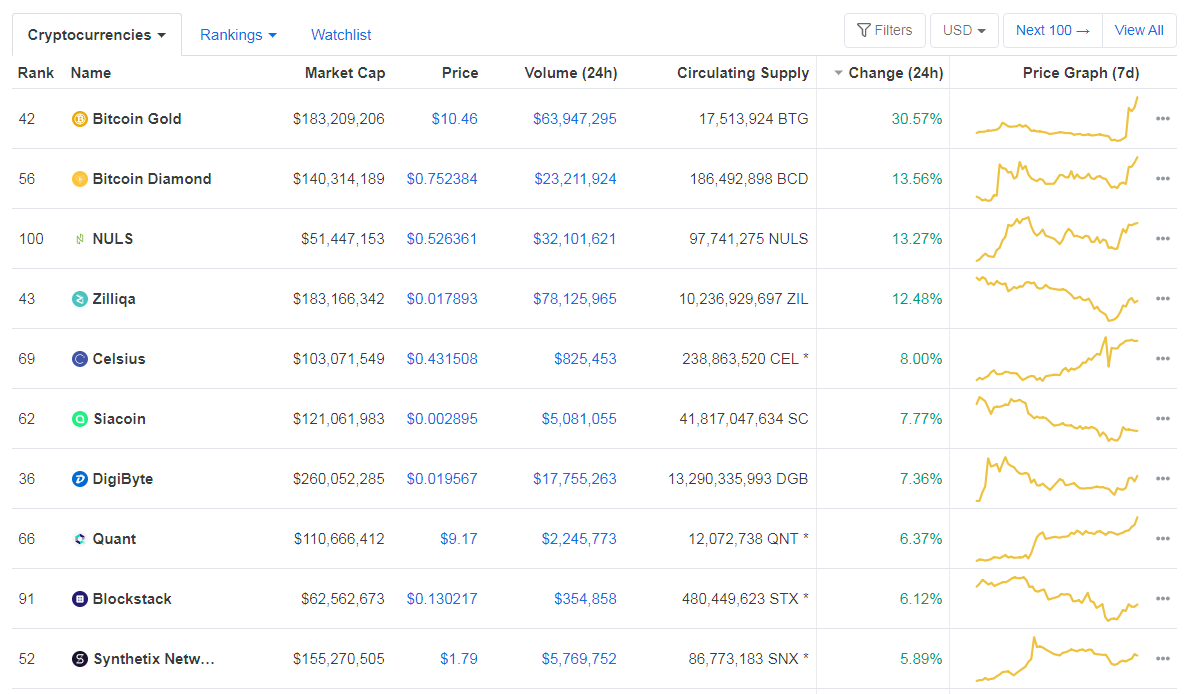
When talking about top100 cryptocurrencies, Bitcoin Gold gained an astonishing 30.57 on the day, making it by far the most prominent daily gainer. Celsius (13.56%) and NULS (13.27%) also did great. On the other hand, Flexacoin has continued extremely bad performance, and is the worst daily performer once again, with a daily loss of 22.66%. It is followed by SwissBorg’s loss of 4.08% and BAT’s loss of 3.72%.

Top 10 24-hour Performers (Click to enlarge)

Bottom 10 24-hour Performers (Click to enlarge)

Bitcoin’s dominance level increased slightly since we last reported, with its value currently at 65.25%. This value represents a 0.22% difference to the upside when compared to Friday’s value.

Daily Crypto Market Cap Chart

The cryptocurrency market capitalization stayed at exactly the same place when compared to Friday, with the market’s current value being $259.88 billion. This value represents an increase of $1.52 billion when compared to the value it had on Friday.

_______________________________________________________________________

What happened in the past 24 hours?

_______________________________________________________________________

_______________________________________________________________________

Technical analysis

_______________________________________________________________________

Bitcoin

The largest cryptocurrency by market capitalization had quite a volatile weekend. It dropped heavily in price on Saturday as a response to the PlusToken Ponzi scheme sell-off. The price reached a low of $8,820 before bouncing back. Bitcoin bulls managed to bring the price back above $9,000 and further until the price has collided with the 4-hour 21-period moving average.

Traders should closely pay attention to how well Bitcoin reacts to immediate support and resistance levels, as well as to the 21-period and 50-period moving averages when recovering from bearish moves or consolidating after bullish moves.

BTC/USD 4-hour Chart

Technical factors:

  • Bitcoin is creating lower lows
  • Price is below its 21 and 50-period EMA
  • Price at the Middle B.B. (20period SMA)
  • RSI near the middle point (47)
  • Below-average Volume

Key levels to the upside          Key levels to the downside

1: $9,251                                 1: $9,120

2: $9,580                                 2: $8,980

3: $9,735                                  3: $8,820

Ethereum

Ethereum followed Bitcoin’s initiative throughout the weekend and mirrored its moves (with more or less strength). The price drop on Saturday brought the price to the $217.7 support level before slowly returning to its previous levels before the price drop. Ethereum is now fighting for the $225.4 level, which it is currently above.

As mentioned in our previous articles, Ethereum doesn’t have much initiative at the moment except for following Bitcoin’s moves. Traders can use that to either trade within a range while Bitcoin isn’t moving or to trade ETH with the trend as it is (on average) making larger moves in the same direction than Bitcoin.

ETH/USD 4-hour Chart

Technical Factors:

  • Price gain stopped by the 21 and 50-period EMA
  • Price right below the Middle B.B. (20-period SMA)
  • RSI near the middle point (46)
  • Average (low) Volume

Key levels to the upside          Key levels to the downside

1: $228                                    1: $225.4

2: $240                                    2: $217.7

3: $251.4                                  3: $198

Ripple

The third-largest cryptocurrency by market cap followed Bitcoin all throughout the weekend (in both its move to the downside and upside) but also followed its descending path. XRP fell right to the descending trend line, which held up nicely and triggered a price bounce. This line has proven itself as strong support. However, XRP fell below the $0.178 in the process, and the price bounce couldn’t bring it back above it.

There aren’t many XRP trading opportunities, but most of them are completely straightforward as they are always happening with sharp increases in Volume.

XRP/USD 4-hour Chart

Technical factors:

  • XRP in a mid-term descending trend
  • XRP lacks strong support levels below $0.178
  • The upside is guarded by the 21 and 50-period EMA
  • Price slightly below the Middle B.B. (20 SMA)
  • RSI is below the middle point (43)
  • Average Volume

Key levels to the upside          Key levels to the downside

1: $0.178                                    1: $0.147

2: $0.19                                    

3: $0.2


Categories
Crypto Market Analysis

Daily Crypto Review, Jun 26 – Bitcoin’s Move Towards the Upside Stopped. What Should Traders Do?

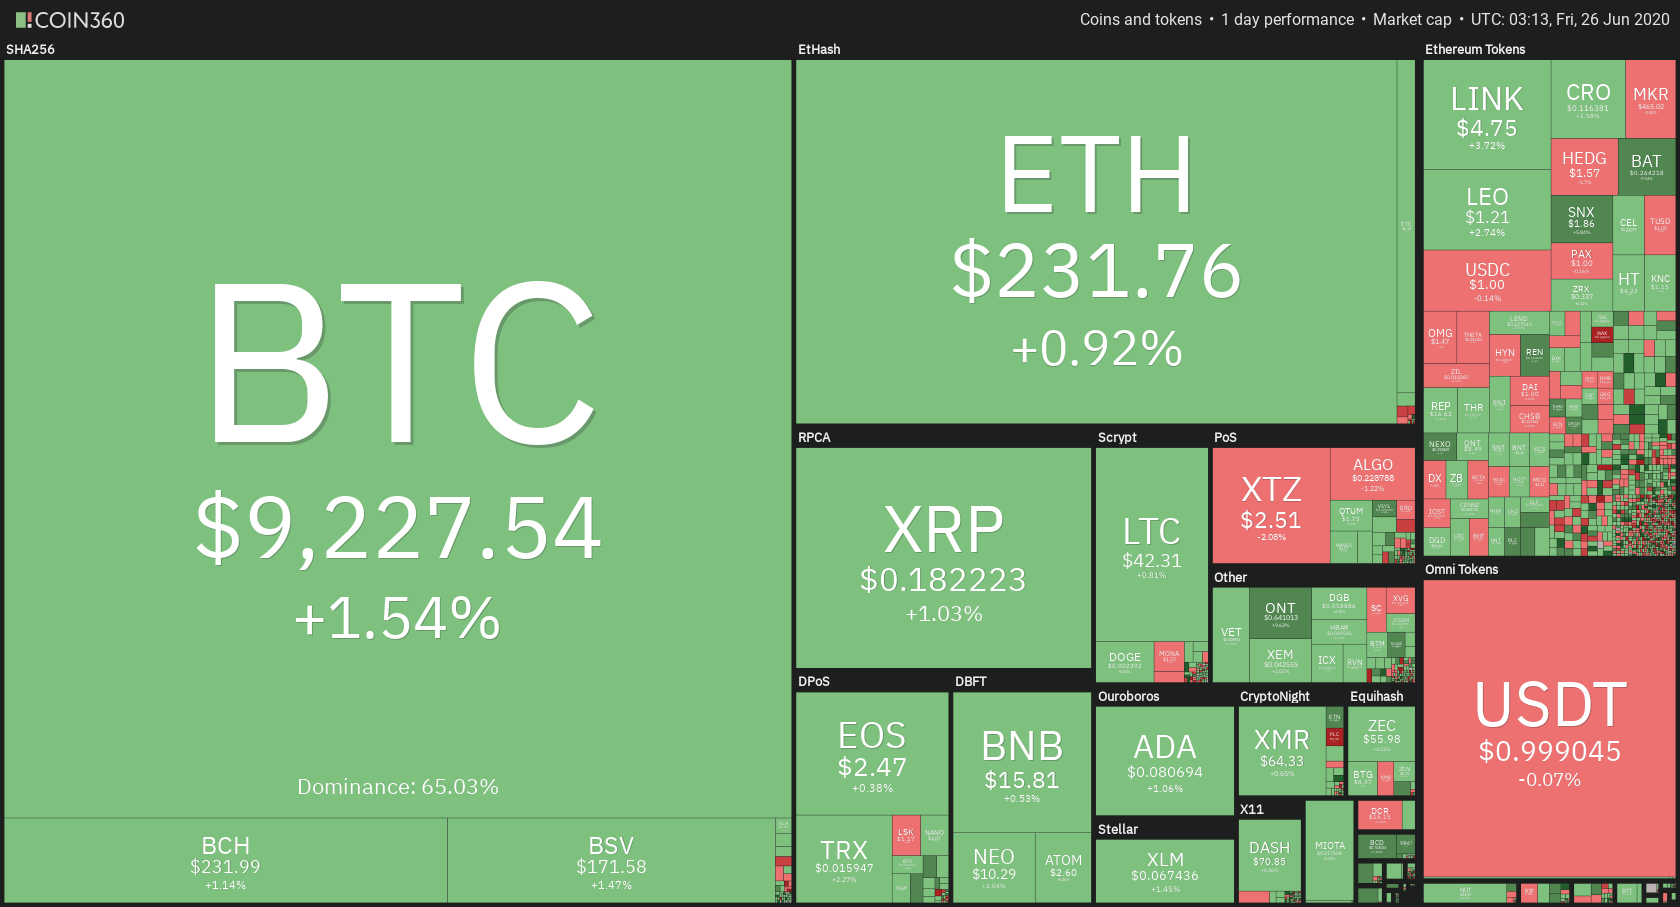
The cryptocurrency market has spent the past 24 hours mostly consolidating or being slightly in the green, as the bull initiative wasn’t strong enough to push cryptos (mostly Bitcoin as the “pack leader”) higher. Bitcoin is currently trading for $9,227, which represents an increase of 1.54% on the day. Meanwhile, Ethereum gained 0.92% on the day, while XRP lost gained 1.03%.

 Daily Crypto Sector Heat Map

When talking about top100 cryptocurrencies, Compound came back from the biggest daily losers (yesterday) to a daily gain of 13.84 today. Celsius (8.27%) and Ren (8.16) also did great. Flexacoin was by far the worst daily performer, with a loss of 18.09%, then followed by SwissBorg’s loss of 5.38% and Seele-N’s loss of 5.31%.

Top 10 24-hour Performers (Click to enlarge)

Bottom 10 24-hour Performers (Click to enlarge)

Bitcoin’s dominance level increased slightly since we last reported, with its value currently at 65.03%. This value represents a 0.1% difference to the upside when compared to yesterday’s value.

Daily Crypto Market Cap Chart

The cryptocurrency market capitalization stayed at exactly the same place when compared to yesterday, with the market’s current value being $261.4 billion. This value represents an increase of $0.01 billion when compared to the value it had yesterday.

_______________________________________________________________________

What happened in the past 24 hours?

_______________________________________________________________________

_______________________________________________________________________

Technical analysis

_______________________________________________________________________

Bitcoin

The largest cryptocurrency by market capitalization spent the past 24 hours trying to recover and re-enter the triangle formation it fell from just a day ago. However, the bottom triangle line, combined with the 21-period moving average, stopped it in its tracks. With that being said, Bitcoin did gain some value on the day. However, that wasn’t enough to pass the $9,251 and confirm the breakthrough. The $9,120 level, which was problematic yesterday, was, however, tackled, and Bitcoin is now sitting strong above it.

Traders should closely pay attention to the future short-term development of Bitcoin. When no major volume spikes happen, Bitcoin is very responsive to its support/resistance levels as well as its moving averages. Traders can use that to their advantage.

BTC/USD 4-hour Chart

Technical factors:

  • Triangle Formation re-entering failed
  • Price is below its 21 and 50-period EMA
  • Price is between the Lower BB and Middle line (20period SMA)
  • RSI near the middle point (42)
  • Slightly elevated volume

Key levels to the upside          Key levels to the downside

1: $9,251                                 1: $9,120

2: $9,580                                 2: $8,980

3: $9,735                                  3: $8,820

Ethereum

Ethereum bounced back from its lower Bollinger Band and tried to make a move towards the upside, but got stopped in its tracks by the 21 and 50-period moving averages. The second-largest cryptocurrency by market cap seems to have acknowledged these lines and couldn’t make a move past them, therefore returning to a slightly lower price. Ethereum is still trading within a large range, bound by $228 (and $225.4 as stronger support) support level and the moving averages + $240 level to the upside.

If Bitcoin doesn’t make any sharp move, which will prompt Ethereum into moving, traders can take advantage of clear support and resistance levels and trade-off of them.

ETH/USD 4-hour Chart

Technical Factors:

  • Price gain stopped by the 21 and 50-period EMA
  • Price between the Lower BB and Middle line (20-period SMA)
  • RSI near the middle point (43)
  • Average Volume

Key levels to the upside          Key levels to the downside

1: $240                                    1: $228

2: $251.4                                 2: $225.4

3: $260                                     3: $217.7

Ripple

The third-largest cryptocurrency by market cap traded mostly sideways over the course of the day. It managed to bounce off from the lower Bollinger Band and strengthen its position around the $0.183 but failed to even attempt a move towards the upside as the upside seems to be guarded by the descending 21 and 50-period moving averages. However, the good thing is that XRP is stable and does not look like it will drop below $0.178 any time soon.

There aren’t many XRP trading opportunities, but most of them are straightforward as they are always happening with increased volume, and are one-sided and without many retracements. Traders might find a good, simple, and clean trade on XRP/USD here and there.

XRP/USD 4-hour Chart

Technical factors:

  • XRP in a mid-term descending trend
  • XRP lacks strong support levels below $0.178
  • The upside is guarded by the 21 and 50-period EMA
  • Price slightly above the Lower BB
  • RSI is below the middle point (42)
  • Elevated volume (returning to normal)

Key levels to the upside          Key levels to the downside

1: $0.19                                    1: $0.178

2: $0.2                                      2: $0.147

3: $0.205


Categories
Crypto Market Analysis

Daily Crypto Review, Jun 25 – Craig Wright Plays the Autism Card; Crypto Market Crumbling

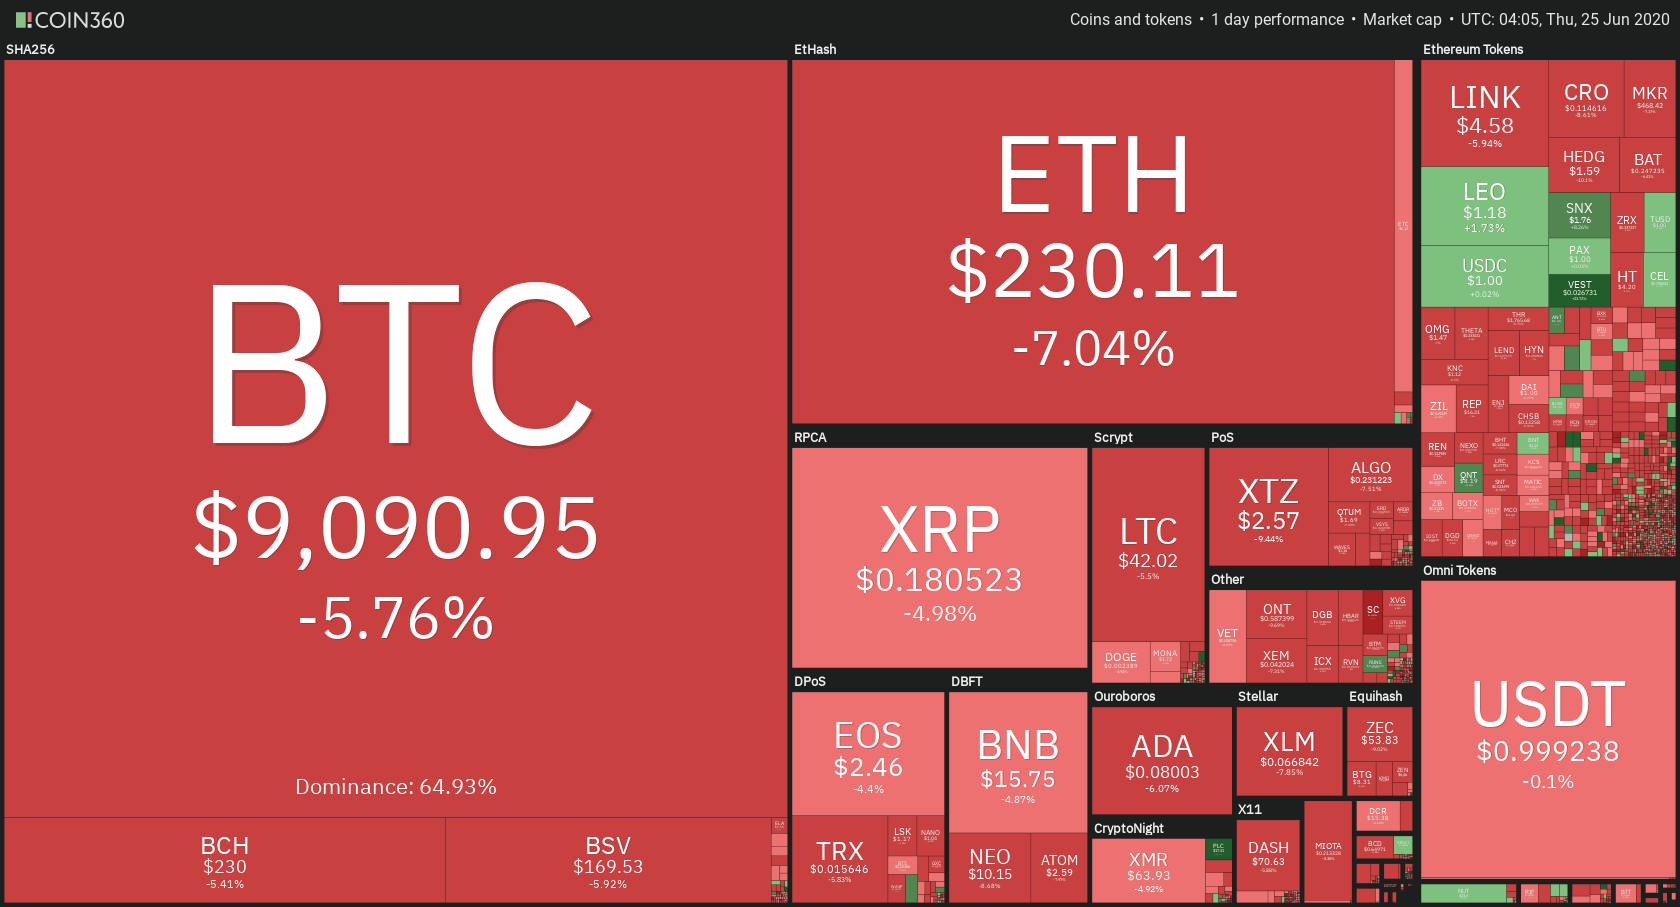
The cryptocurrency market has spent the past 24 hours, either establishing its current levels or gaining a bit of value. Bitcoin is currently trading for $9,090, which represents a decrease of 5.76% on the day. Meanwhile, Ethereum lost 7.04% on the day, while XRP lost 4.98%.

Daily Crypto Sector Heat Map

Cryptocurrencies below the top50 did the best in the past 24 hours, with Quant gaining 19.69%, Flexacoin 19.53%, and Synthetix Network 13.15%. Seele-N was by far the worst daily performer, with a loss of 22.69%, followed by Compound’s loss of 12.70% and Siacoin’s loss of 10.27%.

  Top 10 24-hour Performers (Click to enlarge)

Bottom 10 24-hour Performers (Click to enlarge)

Bitcoin’s dominance level decreased slightly since we last reported, with its value currently at 64.93%. This value represents a 0.18% difference to the downside when compared to yesterday’s value.

Daily Crypto Market Cap Chart

The cryptocurrency market capitalization decreased greatly when compared to yesterday, with the market’s current value being $261.39 billion. This value represents a decrease of $14.46 billion when compared to the value it had yesterday.

_______________________________________________________________________

What happened in the past 24 hours?

_______________________________________________________________________

_______________________________________________________________________

Technical analysis

_______________________________________________________________________

Bitcoin

The largest cryptocurrency by market capitalization spent the past 24 hours falling sharply after not being able to pass the $9,735 level. Bears came into play after bears exhausted themselves on trying to push beyond the immediate resistance of $9,735, which made it easy for them to drastically bring Bitcoin’s price down. The most recent price drop brought it to the $8,980 support level, but Bitcoin quickly recovered to above-$9,000 levels. Bitcoin is trading on increased volume, while its RSI grazed the oversold territory without entering it.

The short-term future of Bitcoin will be decided on how it tackles the $9,120 level (if it ends up above or below it).

BTC/USD 4-hour Chart

Technical factors:

  • Triangle Formation broken to the downside
  • Price is below its 21 and 50-period EMA
  • Price is on top of the Lower BB
  • RSI near the oversold territory
  • Elevated Volume

Key levels to the upside          Key levels to the downside

1: $9,251                                 1: $9,120

2: $9,580                                 2: $8,980

3: $9,735                                  3: $8,820

Ethereum

Ethereum lost quite a bit of its value as well (in fact, even more than Bitcoin). The second-largest cryptocurrency by market cap dropped from the high of $250 all the way down to $227. It is currently trying to find a spot to consolidate at (the most probable consolidation price would be around $230). Ethereum is currently trading on elevated volume, with its RSI dropping to below-40 levels.

ETH/USD 4-hour Chart

Technical Factors:

  • Price below 21 and 50-period EMA
  • Price just above the Lower BB
  • RSI under the value of 40
  • Elevated Volume

Key levels to the upside          Key levels to the downside

1: $240                                    1: $228

2: $251.4                                 2: $225.4

3: $260                                     3: $217.7

Ripple

Just taking a look at the XRP/USD chart, we can see that the third-largest cryptocurrency by market cap has an extremely bearish outlook. XRP followed the overall crypto market trend and dropped in price in the past 24 hours, therefore losing the opportunity to contest (and possibly pass) the $0.19 resistance level. However, XRP did not fall under its $0.178 resistance, as the buying pressure was strong enough to hold the bears. XRP is currently recuperating from the drop at the $0.18 level.

XRP/USD 4-hour Chart

Technical factors:

  • XRP in a mid-term descending trend
  • XRP lacks strong support levels below $0.178
  • Price is below its 21 and 50-period EMA
  • Price is on top of the Lower BB
  • RSI in the oversold territory
  • Elevated Volume

Key levels to the upside          Key levels to the downside

1: $0.19                                    1: $0.178

2: $0.2                                      2: $0.147

3: $0.205


Categories
Cryptocurrencies

Your Guide to Nano Cryptocurrency 

Bitcoin brought to us the idea of money that could upset traditional finance through decentralization, faster speeds, and uncensorability. However, as the cryptocurrency gained wide adoption, it couldn’t handle the demand that followed, leading to disenchantment among users. 

Nano is a cryptocurrency that takes the idea of Bitcoin and makes it better. With its new tech known as block-lattice, it tackles the problem of scalability and high transaction fees associated with Bitcoin. 

Understanding Nano

Initially released in 2015, Nano is a cryptocurrency that aims to provide a fast, scalable, and low-latency payment solution. Nano aims to solve some of the critical problems with Bitcoin, which have prohibited the latter from adoption for many uses.  Nano outlines these problems as follows: 

  • Poor scalability caused by limited block size, making for high transaction fees
  • High latency making for an average confirmation time of 164 minutes
  • Power inefficiency, causing the Bitcoin network to consume and estimated 27.28Twh annually, with 260Kwh for every transaction

By utilizing its proprietary scalability technology known as block-lattice, Nano aims to solve these problems and provide feeless, split-second transactions. And this without Bitcoin’s work-intensive overhead and power-hungry verification mechanism. 

Nano Rebrand

Nano is formerly known as RaiBlocks. The project rebranded in January 2018 to remove the confusion over how the name was pronounced, as well as to attain a name that better resonated with fans. The project announced the rebrand in a January 21, 2018 blog post.

“(“Is it, ray or rye?,” “Ditch the Blocks!,” “Just call it Rai!”). Feedback from the community suggested that improvements could be made to better resonate with the public and a mainstream audience. Because of this, our team made the decision to rebrand.”

How Nano Works

Instead of using a blockchain, Nano uses a directed acyclic graph (DAG) algorithm, together with a technology called block-lattice. 

Block lattice architecture works like the blockchain in some ways, but it also deviates quite significantly in others. With a block-lattice, every account has its own blockchain, known as an account-chain. Only an account-chain owner can make changes to their individual chain, which means they can update their ledger asynchronously (at a different time) to the rest of the network. 

This means a node doesn’t have to rely on confirmation from the rest of the network. For this to be possible, funds sent through the Nano network must have two transactions: a sender transaction and a receiver transaction. For a transaction to be confirmed, the recipient must sign a block confirming receipt. If it’s only the sender’s block that is signed, the transaction can not be settled. Transactions take place via ‘User Datagram Protocol’ (UDP) packets, which is a communication protocol that minimizes computing costs and allows for transactions to be sent even when the recipient is offline.

Benefits of Block-Lattice 

By utilizing a block-lattice architecture, the Nano network is able to reap these benefits: 

#1. Low latency

Thanks to every account having its own chain, they can update at their own time to the larger network. Also, the dual transaction model removes the need for miners, enabling fast and zero-fees transactions.

#2. Scalability 

Transactions on the Nano take place outside of the main chain and via UDP packets. This eliminates block capacity issues since nodes do not maintain a comprehensive copy of all transactions on the network. This also makes for a lightweight network and hence faster transactions, unlike with a Bitcoin ledger where every new block has to be stored on the blockchain, causing sluggish transactions.

Nano’s Consensus Mechanism and Energy Efficiency

Nano secures its network via a delegated proof of stake (DPoS) model. If any conflict arises in regards to transactions, the network relies on the delegates who vote on which transaction is valid. This model is more advantageous than Bitcoin’s proof-of-work mechanism in several ways.

First, without miners, Nano doesn’t have to deal with potential mining attacks and the centralization issue that arises when some mining communities dominate the network. Also, Nano delegates hold a stake in a network, which in itself is an incentive to protect the network. Anything less would mean compromising Nano’s legitimacy and their (delegates’) assets while at it.

Additionally, the block-lattice infrastructure means that delegates only need to intervene when there is a discrepancy. This means running a node on Nano is way less energy-consuming. 

Who’s on the Nano Team?

Nano was conceived by Colin LeMahieu, who went ahead to create the project. LeMahieu holds a degree in Computer Science and has experience in software engineering, having worked for companies such as Dell, AMD, and Qualcomm. 

George Coxon is Chief Operating Officer, who has years of experience in asset trading and is a former intern at Saxo bank. Coxon holds a degree in evolutionary anthropology from the University of Liverpool.

Nano Tokenomics

As of June 14, 2020, Nano is trading at $1.09, while ranking at #53. The coin has a market cap of $145, 639, 985, with a 24-hour volume of $8, 099, 884, and a circulating, total, and maximum supply of 133, 248, 297. The coin’s all-time high was $37.62 (January 02, 2018), while its all-time low was $0.006658 (March 10, 2017). 

Where to Buy and Store Nano

You can find Nano in a variety of exchanges, including Binance, Kraken, Huobi, OKEx, DigiFinex, CoinBene, Bitvavo, Coindeal, HitBTC, and WazirX. On these exchanges, you’ll find Nano paired with proxy coins such as BTC, ETH, USDT, and also Fiat currencies like USS and the Euro.

Nano provides two online wallets known as NanoWallet and NanoVault, and also options for mobile (NanoWalletCompany, Canoe, and NanoBlocks). 

Great third-party wallets include Ledger Nano S, Ledger Nano X, and Natrium.

Final Thoughts

In a market saturated with cryptocurrencies, all seeking to improve on Bitcoin’s shortcomings, Nano has managed to come up with a unique and working product. It facilitates feeless, instant transactions, which makes it a very welcome idea in a fast and dynamic world. Its environmentally friendly consensus mechanism is also eyebrow-raising – in the best way. If cryptocurrency ever hopes to achieve mainstream adoption, Bitcoin’s myriad issues have first to be dispensed with. Nano does a great job of this. 

Categories
Crypto Market Analysis

Daily Crypto Review, Jun 24 – Italy Ready For The Digital Euro; Ethereum Rushing Towards Next Resistance Level

The cryptocurrency market has spent the past 24 hours, either establishing its current levels or gaining a bit of value. Bitcoin is currently trading for $9,639, which represents an increase of 0.36% on the day. Meanwhile, Ethereum gained 2.69% on the day, while XRP gained 0.87%.

DxChain Token took the position of today’s biggest daily gainer, with gains of 21.87%. Compound lost 17.50% of its daily value, making it the biggest daily loser.

Bitcoin’s dominance level decreased slightly since we last reported, with its value currently at 65.11%. This value represents a 0.17% difference to the downside when compared to yesterday’s value.

The cryptocurrency market capitalization increased slightly when compared to yesterday, with the market’s current value being $275.85 billion. This value represents an increase of $2.66 billion when compared to the value it had yesterday.

What happened in the past 24 hours

Is Italy implementing a digital Euro?

The Italian Banking Association has announced its willingness to support the implementation of a digital Euro. The IBA had approved guidelines governing its position on the digital currency as well as central bank digital currencies in general.

The ABI announced that monetary stability, as well as respecting regulations related to a digital Euro, are two of its top priorities.

_______________________________________________________________________

Technical analysis

_______________________________________________________________________

Bitcoin

The largest crypto by market capitalization spent the past 24 hours mostly stabilizing around the $9,600 level after taking over the $9,580 resistance (now support) level. The support level got tested and held up a couple of times, confirming that Bitcoin will (for the time being) trade within a range bound by it as well as the $9,735 resistance level.


Bitcoin’s volume is slowly decreasing while its RSI level is reaching the value of 60.

Key levels to the upside          Key levels to the downside

1: $9,735                                 1: $9,580

2: $9,870                                 2: $9,251

3: $10,010                                3: $9,120

Ethereum

Unlike Bitcoin, Ethereum spent the day reaching for new highs and trying to get to the $251.4 resistance level. The second-largest cryptocurrency by market capitalization managed to increase its value by over 2% on the day. Its volume is, however, lowering, while its RSI level on the 4-hour chart crossed into overbought territory. This might indicate a pause in the bullish move until Ethereum gathers enough strength to attempt a breakthrough the $251.4 resistance.


Key levels to the upside          Key levels to the downside

1: $251.4                                 1: $240

2: $260                                    2: $228

3: $225.4

Ripple

While XRP did not gain much percentage-wise, its move towards the upside is an extremely important one. The third-largest cryptocurrency by market cap is trying to get back above the $0.19 level, which will determine its position in the short-term. While the move initially moved above the resistance, XRP’s RSI is approaching overbought, while its volume is decreasing, signifying exhaustion.


Key levels to the upside          Key levels to the downside

1: $0.19                                      1: $0.178

2: $0.2                                  

3: $0.205


Categories
Crypto Guides

Brief Introduction To The Revolutionary ‘Neo’ Blockchain

Introduction

Neo is an open-source, decentralized blockchain platform founded in 2014 by Da HongFei and Erik Zhang. These are the same duo who started Shanghai-based blockchain R&D company’ OnChain.’ Neo is often known as Ethereum of China due to its similarities, but the project has its own set of goals, which we will be looking further in this article.

Neo is formerly known as Antshares, and the rebranding happened in 2017. Since the rebranding, the company’s motive is to achieve a smart economy using blockchain technology and an essential feature of blockchain smart contracts to issue and manage digitized assets.

Neo wants to achieve a smart economy by giving digital identity to digitize assets and further use automation in the management of digital assets using smart contracts and henceforth achieving a smart economy using a distributed network.

Digital Assets + Digital Identity + Smart Contracts = Smart Economy.

Let us look into the three components that make up the smart economy in detail below:

Digital Assets

Digital Assets are anything that exists in a binary format and with a right to use. The right to use property is essential for a digital asset to exist. Any asset that can be stored digitally can be said as a digital asset. Some examples of digital assets include logos, images, illustrations, presentations, spreadsheets, etc. Assets can be easily digitized on the neo platform is a transparent, trustworthy, and auditable manner. The Neo platform allows the linking of a physical asset with a digital avatar using digital identity, which is valid by law. Thus, the platform protects the assets.

Two forms of digital assets

Global Assets: These are assets that are recognized by all smart contracts and clients.

Contract Assets: These are assets that are only recognized by specific smart contracts and cannot be used in other contracts

Digital Identity

Identity can be defined as a set of attributes that relate to an entity. Neo enables the creation of identity information of individuals, organizations, and entities in an electronic form, thus making it digital. It does this by verifying identity using fingerprints, facial recognition, voice recognition, and SMS. For the smooth functioning of digital assets, digital identity is essential. Neo uses X.509 digital identity standard, which is a widely accepted digital issuance model.

Smart Contracts

Smart contracts are any piece of self-execution code when a predefined specific set of instructions are met. Smart contracts are immutable and should be able to run on multiple nodes without compromising its integrity. Neo requires three essential features for smart contracts; they are deterministic, terminable, and isolated. Smart contracts can be codes in any mainstream coding language like C#, Java, Go.

Key Characteristics of Neo

🔗 Neo uses dBFT, Delegated Byzantine Fault tolerance model for consensus mechanism. In dBFT consensus, nodes are chosen by Neo holders to generate blocks and validate the transactions. In turn, they have to hold certain Neo tokens as a threshold and maintain some performance requirements.

🔗 Neo’s transaction speeds are considered to be one of the highest among the available with 1000 TPS. High transactions per second lead to centralization by only a few users mining and validating the transactions.

🔗 The platform supports all the mainstream coding languages for smart contracts, which helps prevent developers from learning new languages to work on the platform.

Neo has two local tokens, Neo and Gas. Neo is used to create blocks and manage the network while Gas is the fuel that powers transactions in the Neo system.

Many Governments across the world are trying to incorporate blockchain functionalities into the day to day activities of the running of the government to achieve a smart economy. Neo, with its faster transaction speeds and with its core fundamentals, enable the goal to accomplish in a much quicker fashion.

Categories
Crypto Market Analysis

Daily Crypto Review, Jun 23 – Bitcoin Logo and Name Trademarked. Defender of Bitcoin or Just Another Scammer?

The crypto market has spent the past 24 hours testing (and surpassing) its immediate resistance levels. Bitcoin is currently trading for $9,605, which represents an increase of 2.21% on the day. Meanwhile, Ethereum gained 3.06% on the day, while XRP gained 0.06%.

DigiByte took the position of today’s biggest daily gainer, with gains of 24.92%. Flexacoin lost 15.62% of its daily value, making it the biggest daily loser.

Bitcoin’s dominance level stayed at the same place since our last report, with its value currently at 65.28%. This value represents a 0.05% difference to the upside when compared to yesterday’s value.

The cryptocurrency market capitalization increased when compared to yesterday, with the market’s current value being $273.19 billion. This value represents an increase of $7 billion when compared to the value it had yesterday.

What happened in the past 24 hours

Bitcoin defender or a scammer? Bitcoin name logo trademarked

The Bitcoin name and logo have been trademarked in Spain by Ignacio Rubio Menéndez, a compliance expert and lawyer. He explained that he now owns the logo and the word ‘bitcoin’ that is registered at the national level. When asked why he bothered with doing this, he explained that he wants to protect Bitcoin, at least in Spain. He claims he will stand up to anyone that will try to abuse the logo or the name of the cryptocurrency he bases his business on.

Whether he will use his (now) right justly or abuse it, only time will tell.

_______________________________________________________________________

Technical analysis

_______________________________________________________________________

Bitcoin

The largest crypto by market capitalization spent the past 24 hours testing its immediate resistance level of $9,580. In fact, there was no actual “testing,” as Bitcoin skyrocketed and went past the resistance level in an instant. The move passed through $9,735 as well, but quickly came back below it. Bitcoin is now trying to find a price to consolidate at, and it will most likely test $9,580 as a support level.


Key levels to the upside          Key levels to the downside

1: $9,735                                 1: $9,580

2: $9,870                                 2: $9,251

3: $10,010                                3: $9,120

Ethereum

Ethereum followed in the footsteps of Bitcoin and used the momentum it created to push its price past the $240 level. On top of that, the price gain it made surpassed Bitcoin by half a percent. The second-largest cryptocurrency by market cap stopped its bullish move at around $247 and then started consolidating slightly below that price. The $240 level will be tested in the near future, so traders can expect a solid and easy trade, in whichever direction ETH goes.


Key levels to the upside          Key levels to the downside

1: $251.4                                 1: $240

2: $260                                    2: $228

3: $225.4

Ripple

Unlike Bitcoin and Ethereum, XRP did not have such a good day. While the price technically did end up in the green when compared to 24 hours ago, the price gain is negligible. The third-largest cryptocurrency by market cap didn’t have enough buying pressure to pass the $0.19 resistance level it fell under a couple of days ago.


XRP’s volume is extremely low, meaning that traders don’t really have many opportunities to trade it.

Key levels to the upside          Key levels to the downside

1: $0.19                                      1: $0.178

2: $0.2                                  

3: $0.205


Categories
Forex Videos

Decentralised Exchanges Are the Future! Where are you putting your money!


Decentralized Exchanges Are the Future


Decentralized exchange tokens’ year-to-date returns are more than five times higher than that of their centralized counterparts, according to the latest report on Decentralized Finance by the cryptocurrency research platform Messari.

Decentralized exchange tokens have increased 241% on average in 2020, while centralized exchange tokens managed to gain only 44%. The report said that Kyber’s token was leading the charge with a massive increase of more than 420%.

Decentralized vs. Centralized exchanges

Spot volumes on Decentralized Exchanges have increased from $5 million all the way to $25 million, therefore increasing the DEX’s share of overall trading volume to 0.5%, doubling its share before 2020. While they are still quite insignificant when compared with centralized exchanges, decentralized exchanges are growing at a much faster rate than centralized exchanges are. After all, decentralized exchanges are the only type of exchange that does not stray away from the initial goal of cryptocurrencies.

The main advantage of DEXs

While the volumes of top centralized exchanges are still unmatched, there is one simple advantage do DEXs, which is that they don’t rely on the existence of a centralized entity, which could prove to be a more scalable solution, both economically and in terms of user trust.

Categories
Crypto Videos

Bitcoin’s $20K All Time High Was Actually Fake!

One Crypto Analyst Claims That Bitcoin’s $20K All-Time High Was Actually Fake


Timothy Peterson, an advisor from Cane Island Alternative Advisors’, has claimed that Bitcoin’s near-$20,000 all-time high from December 2017 was actually “fake.”

In a tweet posted on June 11, Peterson said that it took almost seven years for people to accept that Bitcoin’s price was manipulated in 2013, referencing a recent Japanese court ruling upholding data tampering charges against Mark Karpeles, who was the former Mt. Gox CEO.
He then followed this statement up with another trivial one, saying, “How long before people understand that BTC was manipulated again in 2017 and again in 2019?”

What actually happened?

Peterson is not promoting the conspiracy theory of Bitcoin $20,000 all-time high never happening, but that it rather likely happened due to manipulation.
When he was asked what defines a ‘real’ all-time high in his mind, he responded that it was his math that said that these weren’t real all-time highs, rather than it all being “in his mind.”
He said that only if an all-time high is supported by fundamentals as measured by active addresses, hash rate, and transaction counts, it can be legitimate. Otherwise, the price is not sustainable.

What can we expect?

Peterson defended recent comments he made comparing the current Bitcoin price moves to the ones BTC made just before the 2013 bull run. If we talk about a proportionate bull run today, we could see Bitcoin’s price to hit $75,000 within weeks.
On the other hand, Peterson refutes any claims that a$75,000 Bitcoin is his prediction. Instead, he claimes to have simply posed the hypothetical question of whether the history will repeat itself?
Peterson, however, did recently predict that Bitcoin’s price will rise to $1 million by 2027, which he concluded based on an organically increasing number of users.

Categories
Crypto Market Analysis

Daily Crypto Review, Jun 22 – COVID-19 Test Results Stored on the Blockchain; Ethereum Chasing $240

The crypto market has spent the past weekend being quite stable. Bitcoin is currently trading for $9,351, which represents a decrease of 0.08% on the day. Meanwhile, Ethereum gained 1.25% on the day, while XRP lost 0.08%.

Compound took the position of today’s biggest daily gainer, with gains of 14.26%. Golem lost 9.21% of its daily value, making it the biggest daily loser.

Bitcoin’s dominance level stayed at the same place since our last report, with its value currently at 65.23%. This value represents a 0.04% difference to the downside when compared to yesterday’s value.

The cryptocurrency market capitalization stayed at almost the same place as yesterday, with the market’s current value being $266.19 billion. This value represents a decrease of $1.78 billion when compared to the value it had yesterday.

What happened in the past 24 hours

COVID-19 testing on blockchain

Blockchain tracking platform called VeChain made a Twitter announcement on June 20, saying that its blockchain-based platform that performs medical data management has gone live, and that it will store COVID-19 testing results. The platform, called E-NewHealthLife, was deployed in and for the Mediterranean Hospital in the Republic of Cyprus.

Cyprus citizens who go to this hospital’s COVID-19 laboratory will have their medical as well as test records on the blockchain.

_______________________________________________________________________

Technical analysis

_______________________________________________________________________

Bitcoin

The largest crypto by market capitalization spent the weekend moving within a range, bound by the support level of $9,251 and the resistance level of $9,580. The support level was tested a couple of times over the weekend, but there was no real initiative in breaking it to the downside.


Bitcoin’s volume is slowing down and reducing while its RSI level is rising slightly (52).

Key levels to the upside          Key levels to the downside

1: $9,580                                 1: $9,251

2: $9,735                                 2: $9,120

3: $9,870                                  3: $8,980

Ethereum

Unlike Bitcoin, Ethereum wasn’t so static over the weekend. While the second-largest cryptocurrency did start the weekend slowly, the most recent volume increase and price spike show its potential to possibly approach the $240 level. However, it is unlikely that Ethereum will pass the level by itself (without the help of Bitcoin), so traders can watch what Bitcoin does and trade accordingly.


Key levels to the upside          Key levels to the downside

1: $240                                    1: $228

2: $251.4                                 2: $225.4

3: $198                                    3: $217.6

Ripple

The third-largest cryptocurrency by market cap has broken its immediate support level of $0.19 on Friday, and has maintained its position over the weekend. Even though XRP managed to gain some value in the past hours, it is still extremely unlikely that it will go above the $0.19 resistance level.


XRP’s volume is extremely low, while its RSI level increased to 48.

Key levels to the upside          Key levels to the downside

1: $0.19                                      1: $0.178

2: $0.2                                  

3: $0.205


Categories
Cryptocurrencies

Beginner’s Guide to Bancor (BNT) 

In the stiff competition of cryptoverse, it’s easy for big-name cryptocurrencies such as Bitcoin and Ethereum to hog nearly all the limelight and market activity, leaving lesser-known projects scrambling for half the attention. 

That also means the projects’ intended purpose might get lost in the peripheries – to the detriment of the blockchain and crypto sphere. 

Bancor is a blockchain project that seeks to provide liquidity for illiquid cryptos by providing an instant conversion platform where users can obtain their desired tokens at little or no fees. Also, the conversion needs no second party, eliminating counterparty risk. 

This piece is an in-depth exploration of the Bancor platform, as well as its native token, BNT. 

What is Bancor? 

Bancor is a blockchain-powered protocol that facilitates the direct and instant exchange between different cryptocurrencies. This kind of exchange would remove the need for centralized exchanges such as Coinbase. 

Bancor aims to solve the problem of illiquidity that characterizes the current cryptocurrency market. With popular coins like Bitcoin and Ethereum, illiquidity is not an issue since there’s always a ready market looking to acquire or exchange them. However, for thousands of other coins and tokens that are yet to attract as much attention –  a market is definitely an issue. 

A cryptocurrency’s liquidity is determined by the lack of or the presence of a ready market. A crypto with high liquidity is one that you can easily buy or sell at any time, and the reverse is true for one with low liquidity. 

The Bancor team believes that the vast majority of cryptos that have low liquidity are being excluded from the internet of value. As such, it has created a protocol that can integrate those tokens and make them more accessible. It envisages a future where millions of cryptocurrencies are effective – and readily tradable. 

How Does Bancor Work? 

#1. Smart Tokens and the Bancor Protocol

Bancor employs smart contracts to create ‘Smart Tokens’ to achieve an alternative to the usual way of trading. A standard paper transaction involves two parties exchanging tokens. By contrast, the Bancor protocol utilizes a trading mechanism based on smart tokens, and a transaction does not have to involve a second party. 

Bancor’s protocol is designed to convert directly between different ERC20 tokens – without the need or involvement of a second party or third-party vendors like crypto exchanges. 

This is how it works: smart tokens are linked to smart contracts that act as the reserves of other ERC20 tokens. The smart tokens then process conversions internally, depending on currently held reserves and the volume of exchange requests. 

You can think of smart tokens as coins that hold the monetary value of other tokens. On the Bancor network, they play much the same role as that of a Central Bank that holds foreign currency reserves and oversees conversions between them as and when required.

The Bancor protocol supports all cryptos that are Ethereum/ERC-20 compatible. Any single token created on Bancor is ERC20 compliant, and hence it is compatible with all other tokens on the network. 

#2. Bancor’s Liquidity 

Bancor enables liquidity for tokens by eliminating the need for transacting parties to match so that an exchange can take place. Instead, you can make conversions at any time on the network. 

The network utilizes a Constant Reserve Ratio (CRR) in smart contracts to ensure liquidity. CRR is a mechanism that makes sure the smart tokens are holding reserves at any time. 

As tokens go through various smart contracts (from a user request to conversion, to receiving), transactions are calculated through a complex mix of algorithms. These algorithms are designed to oversee conversion between different currencies without depleting the reserves.

#3. Converting Tokens 

Users can access Bancor and convert between available tokens through the network’s web application. 

A standard token conversion would follow more or less of this process: After selecting the tokens, you want to exchange, click “convert.” The protocol will kick off a series of requests to various smart contracts. The first request converts the token you’re holding to a smart token that holds reserves for that token. The smart token is then dated for another that holds reserves for the token that you want to acquire. When these conversions are through, you receive your desired token.

The Bancor Network Token 

Bancor has its own native currency called the Bancor Network Token (BNT). BNT is the default reserve currency held as a reserve by all smart tokens. As such, BNT reduces the number of conversions that are needed to arrive at the end token. 

What Are Some Use Cases for the Bancor Protocol?

The Bancor team provides several use cases of the protocol. Let’s take a look at some of them. 

  • The smart tokens can improve the functionality for any cryptocurrency 
  • Community tokens get a chance to thrive, allowing the group, institution, city, etc. to use it for collaborations
  • Businesses can create high-liquidity tokens to power loyalty systems

The Bancor Team

The Bancor Team comprises a core team of five based in Zug, Switzerland: Bernard Lietaer, Eyal Hertzog, Guy Benartzi, Guido Schmitz-Krummacher, and Tim Draper. 

Bernard Lietaer is an economist and civil engineer who believes that communities should be able to create and possess their own local currencies. 

Eyal Hertzog is the lead architect of the project and co-founder of video-sharing company Metacafe, as well as Appcoin, a project that utilizes user-generated marketplaces and community currencies. 

Guy Benartzi is the founder of the gaming company Mytopia and co-founder of Israel-based development studio Particle Code. 

Guido Schmitz-Krummacher is a notable figure in the crypto space and is a member of the executive board of the crypto project Tezos (XTZ). 

Tim Draper is a venture capitalist and founder of venture capital firm Draper Associates. 

What’s the Market Look Like for Bancor (BNT)? 

As of June 10, 2020, Bancor is trading at $0.769842, while ranking at #106 in the crypto market. It has a market cap of $53, 233, 437, a 24-hour volume of $26, 330, 312, a circulating supply of 69, 148, 554 add a total supply of the same volume. It has an all-time high $10.00 (January 10, 2018) at an all-time low of $0.117415 (March 13, 2020).

Where to Buy and Store BNT

You can acquire Bancor tokens directly by converting it from another supported token on the Bancor web app. If not, you can obtain it from a BNT-supporting exchange such as OKEx, Binance, HitBTC, Bittrex, Liqui, Upbit, AEX, and Tidex. 

You can store BNT on any ERC20/Ethereum compatible wallet, including MyEtherWallet, MetaMask, ethaddress, Parity, Guarda, Trust Wallet, imToken and others. 

Final Words

Bancor is about bringing utility to thousands of cryptos so they can carve out a place in the global crypto market. With Bancor, users have a secure, trustless platform where they can obtain and liquidate relatively illiquid tokens. With this novel and crucial purpose, the Bancor network is only set to expand on the future. 

Categories
Crypto Market Analysis

Daily Crypto Review, Jun 19 – Bitcoin Mid-Term Bullish vs. Bearish Outlook – Explained

The crypto market has spent the past 24 hours being on a slow downward-facing path. Bitcoin is currently trading for $9,336, which represents a decrease of 0.69% on the day. Meanwhile, Ethereum lost 1.46% on the day, while XRP lost 1.37%.

Aave took the position of today’s biggest daily gainer, with gains of 26.09%. SwissBorg lost 16.61% of its daily value, making it the biggest daily loser.

Bitcoin’s dominance level stayed at the same place since our last report, with its value currently at 65.27%. This value represents a 0.01% difference to the downside when compared to yesterday’s value.

The cryptocurrency market capitalization stayed at almost the same place as yesterday, with the market’s current value being $266.19 billion. This value represents a decrease of $1.78 billion when compared to the value it had yesterday.

What happened in the past 24 hours

Russia lifting ban on Telegram

After many years of unsuccessful efforts to ban Telegram in Russia, the local authorities have finally decided to fully cancel the ban. Russia’s Federal Service for Supervision of Communications, IT, and Mass Media, better-known as Roskomnadzor, has lifted the two-year-long ban imposed on Telegram.

The authority has removed requirements that restrict the access to the Telegram messenger in an agreement with the Prosecutor General of Russia.

_______________________________________________________________________

Technical analysis

_______________________________________________________________________

Bitcoin

The largest crypto by market capitalization spent the past 24 hours slowly moving towards the downside, ultimately testing its support level of $9,251. The bullish trend that Bitcoin was in (on the 1-day chart) was broken to the downside with the most recent Bitcoin drop. In order for BTC movements to still be considered bullish in the long run, its price needs to be above 9,120 on June 30. On the other hand, even though the outlook is not exactly bullish at the moment, Bitcoin seems to have some good support in its $9,251 level as well as the 1-day 50-period moving average.


If, on the other hand, Bitcoin makes a higher high at above $10,500, bull run will be almost certain, and people should consider pulling more of their portfolio into crypto.

Key levels to the upside          Key levels to the downside

1: $9,580                                 1: $9,251

2: $9,735                                 2: $9,120

3: $9,870                                  3: $8,980

Ethereum

Ethereum keeps creating lower highs and slowly moving lower throughout the day. The second-largest cryptocurrency by market cap is on its way to test the $228 once again. As this support level is a new one, it might not hold as well, and the price is likely to fall towards $225.4 level.


Ethereum’s long-term outlook will greatly depend on how Bitcoin moves, so there is no reason to discuss it at the moment.

Key levels to the upside          Key levels to the downside

1: $240                                    1: $228

2: $251.4                                 2: $225.4

3: $198                                    3: $217.6

Ripple

XRP has also spent the day slowly moving to the downside, but with one major difference. The third-largest cryptocurrency by market cap has, unlike Bitcoin and Ethereum, broken its immediate support level. While the $0.19 support level isn’t completely beaten and there is still time for the price to recover, it is likely that the price will remain below it due to the lack of volume and initiative when it comes to either buying or selling XRP at the moment.


Key levels to the upside          Key levels to the downside

1: $0.2                                      1: $0.19

2: $0.205                                  2: $0.178

3: $0.214


Categories
Crypto Market Analysis

Daily Crypto Review, Jun 18 – Binance Pool the Biggest Miner of Craig Wright’s Bitcoin SV – What’s Actually Happening?

The crypto market has spent the past 24 hours testing its support levels after failing to break the resistance levels during yesterday’s price increase. Bitcoin is currently trading for $9,412, which represents a decrease of 0.62% on the day. Meanwhile, Ethereum lost 0.71% on the day, while XRP lost 1.37%.

SwissBorg took the position of today’s biggest daily gainer, with gains of 31.95%. DigiByte lost 7.95% of its daily value, making it the most prominent daily loser.

Bitcoin’s dominance stayed at the same place since our last report, with its value currently at 65.28%. This value represents a 0.04% difference to the downside when compared to yesterday’s value.

The cryptocurrency market capitalization stayed at the same place as yesterday, with the market’s current value being $267.97 billion. This value represents a decrease of $0.02 billion when compared to the value it had yesterday.

What happened in the past 24 hours

Binance Pool mining the most Bitcoin SV – Why?

Only a year after removing Bitcoin SV from its exchange, news came out that Binance (through its Binance Pool) produces more Bitcoin SV blocks through mining than any other pool. Many people would jump to the conclusion that Binance knows something we don’t, but that really isn’t the case.

Even though Binance Pool is undoubtedly the largest miner of Bitcoin Satoshi’s Vision blocks at the moment (with 26.39% of total Bitcoin SV mining on June 17), it is not Binance who is mining them, but rather the users of the Pool. However, Binance is profiting from the mining operations by imposing a 2.5% pool fee. That being said, it is highly unlikely that Binance will return Bitcoin SV to its exchange, or that its stance on the controversial coin changed.

_______________________________________________________________________

Technical analysis

_______________________________________________________________________

Bitcoin

The largest cryptocurrency by market capitalization spent the past 24 hours testing its support levels, right after failing to break the $9,580 resistance. While the $9,251 level showed strength, bouncing the price back immediately, Bitcoin is still moving down slightly. If nothing changes in terms of volume and market sentiment in general, Bitcoin might have another go at testing this support level.


Bitcoin’s volume has decreased slightly when compared to the previous days, while its RSI level is at 50.

Key levels to the upside          Key levels to the downside

1: $9,580                                 1: $9,251

2: $9,735                                 2: $9,120

3: $9,870                                  3: $8,980

Ethereum

Ethereum made the same move as Bitcoin and had no initiative when it came to a non-correlated movement today. After failing to reach its resistance level of $240, ETH started moving towards the downside. It, however, got stopped by the (possibly) new support level of $228, bouncing the price slightly up towards $235. The price stopped after reaching $235 and started moving sideways, possibly threatening the downside once again.


Key levels to the upside          Key levels to the downside

1: $240                                    1: $228

2: $251.4                                 2: $225.4

3: $198                                    3: $217.6

Ripple

XRP had a slightly different movement when compared to BTC and ETH, but with the same sentiment. The third-largest cryptocurrency by market cap failed to reach $0.2 successfully, therefore making the possibility of breaking the resistance almost none-existent in the short-term. This triggered the bears to test the support level of $0.19, which (after some fighting) managed to hold its position. XRP is now trading just above the support line, preparing for the next move.


Key levels to the upside          Key levels to the downside

1: $0.2                                      1: $0.19

2: $0.205                                  2: $0.178

3: $0.214


Categories
Cryptocurrencies

Komodo Project: Everything you’ll need to know about this Privacy Coin

One of the pain points of the pioneering blockchain – Bitcoin, is its pseudonymity of transactions that make it possible (although hard) for an interested third party to track down the real-world identities of individuals. In an era when privacy is more valuable than ever, such a state of affairs is doomed to be unsatisfactory to many. 

This is why many succeeding blockchains have attempted to provide a bit more privacy. One of those is the Komodo blockchain, which is a fork of the ZCash blockchain – itself a privacy blockchain. 

Komodo aims to be a blockchain powerhouse of sorts. It’s a decentralized exchange, an atomic swap, and a decentralized ICO platform. 

In this guide, we discover more about what Komodo is all about, along with the platform’s token.

What is Komodo? 

Komodo is a privacy coin and blockchain project that aims to be a faster, more secure alternative to the traditional blockchain. It’s a platform that allows crypto developers to launch ICOs as well as their blockchains. Besides, the Komodo platform hosts a decentralized exchange as well as an anonymizer that keeps transactions private. 

Komodo is built off of ZCash, another privacy coin, and inherits some of its privacy features such as the ZK-SNARK technology. These privacy features enable users to spend, send, and receive funds without leaving a trackable trail. This, when combined with Komodo’s anonymization tool Jumblr, provides the utmost privacy for users. 

Who is the Team Behind Komodo? 

In keeping with the privacy theme of the Komodo ecosystem, the project’s architects have chosen to remain pseudonymous. The project’s lead identifies by “jl777” Lee, and the  chief technology officer as “ca333.”

How Does the Komodo Platform Work? 

The Komodo platform encompasses several components that make up its entire ecosystem. The team would like you to know that they call “features” what others call “revolutionary.” With that, let’s look at Komodo’s features. 

#1. BarterDEX

BarterDEX is a decentralized, atomic swap-enabled exchange. Atomic swaps mean directly exchanging one token for another instead of relying on proxy tokens like on centralized exchanges. This reduces counterparty risk. 

BarterDEX also deals with the problem of low liquidity that is common with decentralized exchanges. It does this by utilizing ‘liquidity provider nodes’ (LP nodes), which stabilize the market by making it easier for traders to conduct trades. 

#2. Jumblr

Komodo utilizes an open-source and decentralized anonymizer known as Jumblr to obscure transactions’ trail. This renders it impossible for third parties to track down your identity. 

The process works as follows. The anonymizer redirects your Komodo (KMD) tokens from all non-private addresses into several (private) zk-SNARK addresses. These obscured addresses remove any trail from the transactions. Then, the tokens are rerouted towards a new address that you have chosen. Jumblr is also connected to BarterDEX. This means you can also add an extra layer of privacy to your trades. 

#3. Delayed Proof-of-Work (dPoW)

Komodo uses a hybrid consensus mechanism known as Delayed Proof-of-Work (dPoW) to maintain the network. In a ‘Komodo twist,’ the dPoW relies on an original consensus algorithm with no specification on what it could be. Such an algorithm can either be Proof-of-Work or Proof-of-Stake. This hybrid mechanism allows the Komodo platform to capitalize on the security provided by the hashing power of another blockchain. 

The dPoW mechanism uses two nodes: notary and normal nodes. Just like in a delegated Proof-of-Stake mechanism, stakeholders are responsible for choosing notary nodes who will determine the validity of transactions. In Komodo, 64 notary spots can be filled at any given time, but 13 of those are enough to secure the network. These nodes are tasked with the responsibility to notarize blocks from the dPoW chain onto the secondary blockchain. 

Like we noted earlier, a dPoW network can be built on top of a secondary algorithm. Komodo’s dPoW is built on Bitcoin’s Proof-of-Work algorithm for the latter’s strong hash rate, which enables a robust, secure network. And transactions taking place using dPoW do not have to pay transaction fees for using the secondary blockchain. 

#4. Decentralized Initial Coin Offerings (dICOs)

Komodo also supports decentralized Initial Coin offerings (dICOs). A dICO is in many ways similar to the traditional ICO, but avoids much of the pitfalls associated with a centralized system. By just a few Komodo commands, you can get started on your own blockchain and kickstart an ICO. 

Below are the advantages of a dICO: 

  • You can distribute your new coins among community members without them being scooped up by whales.
  • The benefits of the entire Komodo platform, including the BarterDEX
  • Removal of a single point of failure which is prone to attack and could jeopardize the initiative
  • Users can participate anonymously, thanks to the Jumblr anonymizer.

What’s the Komodo (KMD) Token?

The KMD token is the native currency of the Komodo platform. It powers transactions on the Komodo platform; and will gain more usefulness as more functionalities are built upon it. 

As of May 31, 2020, KMD is trading at $.0633420, while ranking at #78 in the market. It has a market cap of $76, 012, 370, a 24-hour volume of &6, 207, 821, a circulating and total supply of 120, 003, 181, and a maximum supply of 200, 000, 000. It has an all-time high of $10.00 (Dec 21, 2017) and an all-time low of $0.002143 (March 13, 2017).

Where to Buy and Store KMD

You can purchase KMD directly or trade another cryptocurrency for it on a variety of reputable exchanges such as Bittrex, Binance, Cointree, Changelly, Huobi, HitBTC, Shapeshift and Bitit. 

When it comes to storage, you have numerous options. You can opt for Komodo’s own Agama wallet, Komodo OceanQT, or paper wallet. If you’re more tech-savvy, you can also go for the Komodo CLI (Command Line Interface). Other options include third-party wallets such as Zerus wallet, Guarda Wallet, and Ledger. 

Conclusion

Komodo is a project that’s flipping the script on what a blockchain system can be all about. From being a decentralized ICO platform to featuring an anonymizer to hosting a decentralized exchange. The platform’s Jumblr technology combined with ZCash’s ZK-SNARK ensures utter privacy for users, and you can easily kickstart your blockchain project by executing a few commands on the platform.  As the platform continues to evolve, fans of the project can expect more exciting things. 

Categories
Crypto Videos

Craig Wright Admitted to Hacking MT. GOX!

Craig Wright Admitted to Hacking Mt. Gox?


Craig Wright’s legal team seems to have alleged that Wright controls one of the BTC addresses that is affiliated with the Mt. Gox hack.

Riccardo Spagni, one of the faces of the anonymous Monero coin, which is also known as Fluffy Pony, posted a tweet indicating Craig Wright’s affiliation with the Mt. Gox-related Bitcoin wallet.

Spagni tweeted, “Just so we’re clear, Craig Wright has openly admitted (through his lawyers) to be the person that stole 80,000 BTC from Mt. Gox.” Spagni also included court documents in the post.
The documents he posted indicate that the ‘1Feex’ address is the address where the stolen Mt. Gox funds were sent.

Mt. Gox address included among the Tulip Trust addresses


As a part of an ongoing legal battle, Craig Wright claims to have at least partial ownership of the Tulip Trust, which is a list of numerous Bitcoin wallet addresses that hold roughly 1.1 million Bitcoin. The aforementioned Bitcoin was allegedly mined by Wright and his business associate, Dave Kleiman, in Bitcoin’s earliest days.

Dave Kleiman passed away in 2013, leaving Wright completely unable to move the funds on his own. Spagni’s claim alongside the court document screenshots presented indicate that one of the alleged Tulip Trust wallet addresses contain stolen funds from the 2014 Mt. Gox hack.

Categories
Crypto Videos

Is There No Way to Cash Out From Grayscale? #Fail


Is There No Way to Cash Out From Grayscale’s BTC Trust

Qiao Wang, an investor, analyst as well as head of product at the crypto market data firm Messari, raised some major criticism about the way Grayscale’s Bitcoin Trust is set up.
In his tweet dating June 11, Wang cited Grayscale’s official website, which says that “Grayscale Bitcoin Trust does not (at the moment) operate a redemption program, which means it may halt creations from time to time.” Wang suggested that the absence of a redemption mechanism might result in GBTC trading at a discounted rate compared to the net asset value.


He later explained that, when an exchange-traded fund (ETF for short) trades at a discounted rate compared to the fund’s underlying assets, traders performing arbitrage can buy the contract on an exchange and then redeem it for the assets that back it.
“Without the ability to redeem Bitcoin, you are just donating your money to Grayscale.” – Wang said.

Grayscale’s growth since the Bitcoin halving

Recent news clearly shows that Grayscale’s cryptocurrency holdings are growing at an extraordinary rate. Grayscale has bought Bitcoin one and a half times faster than the miners were producing since May 11, which is the date of the Bitcoin block reward halving.
On top of that, Grayscale’s director of investor relations, Ray Sharif-Askary, has recently announced that Grayscale has also been aggressively buying Ethereum as well.

Categories
Crypto Daily Topic

Coinbase in a Deal to Sell Crypto Surveillance Tools to US Feds

Coinbase, the largest cryptocurrency exchange in the US, has offered to procure Coinbase Analytics, its analytics platform, to US agencies, including the Internal Revenue Service (IRS) and the Drug Enforcement Administration (DEA). The Block broke the story on June 5th. 

Records seen by the publication indicate the DEA and the IRS have entered into licensing agreements with Coinbase for an analytics tool called Coinbase Analytics. Documents relating to the deal were publicly published in April and May for the IRS and the DEA, respectively.

Coinbase Analytics is closely tied to the company’s entire ecosystem. According to a publicly available job posting, the Senior Product Manager for Coinbase Analytics “collaborates” with the “Coinbase Consumer, Coinbase Pro, and Coinbase Custody” plus Coinbase’s payments and cryptocurrency division. 

However, Coinbase has denied any relationship between Coinbase Analytics and its internal customer records. In an email to CoinDesk, a spokesperson for the exchange wrote:” Coinbase Analytics data is fully sourced from online publicly-available data, and does not include any personally identifiable information for anyone, regardless of whether or not they use Coinbase.” 

Coinbase and Neutrino

Worth noting is the IRS announcement that mentions the connection between Coinbase Analytics and Neutrino, an intelligence company controversially acquired by Coinbase in 2019. The purchase evoked controversy because Neutrino’s founders were linked to an Italian spyware entity known as the Hacking Team. 

The IRS document notes: “As law enforcement techniques evolve and other cryptocurrencies gain acceptance, criminals are using other types of cryptocurrencies, not just Bitcoin, to facilitate their crimes. In addition to the Bitcoin Blockchain, Coinbase Analytics (fka Neutrino) allows for the analysis and tracking of cryptocurrency flows across multiple blockchains that criminals are currently using. Coinbase Analytics also provides some enhanced law enforcement sensitive capabilities that are not currently found in other tools on the market. This action will result in a Firm Fix Priced purchase order, Period of Performance: One base year from date of award with one 12-month option.”

Public records show that Coinbase is yet to be granted the awards, neither does the company appear in USASpending.gov, a government directory for contract awards.

Coinbase confirmed to The Block that it indeed developed the product with the assistance of Neutrino. It added that it’s willing to offer Analytics to financial and regulatory agencies and that the tool can also be used for internal investigations. “It’s an important tool to meet our regulatory requirements and protect our customers’ funds,” said the company.

DEA’s interest in this technology seems to be informed by Coinbase Analytics’s high-level accuracy. The federal organization states that the tool has “some of the most conservative heuristics used in commercial blockchain tracing tools,” a “critical” component that can avoid false positives.

Backlash From the Crypto Community

The backlash from the crypto community and the exchange’s users was swift. Indeed, users are walking away in droves and looking for alternatives. Data from Glassnode indicates that the walkout was further compounded by recent outages on Coinbase during Bitcoin’s spike. Users on the platform withdrew 22, 000 more Bitcoin than they deposited two days earlier before the Coinbase Analytics story broke.

Crypto Twitter Chimes In

Crypto Twitter is weighing heavily on the matter. Influential crypto trader Matt Odell scathingly tweeted, “if you use Coinbase, you should delete your account.” Odell’s sentiments were echoed by many others who expressed concern on whether exchange could be trusted to keep user data private. 

Another crypto entrepreneur Josh Rager conducted a Twitter poll of 5,000 people that revealed  2/3 of Coinbase users were willing to ditch the exchange. Amplifying the thoughts and feelings of many, Rager opined that “Millions of dollars seem to be leaving Coinbase as we speak. Investors and traders are no longer limited to Coinbase or  Bitmex. If you screw over customers, take part in shady deals, or don’t improve the product, customers can now go elsewhere to trade/invest.”

Jameson Loop, another notable crypto personality, expressed his displeasure, saying: “This is no surprise, our distrust in you is strengthened, we will make your analytics software obsolete.” 

Many users chimed in to decry the decision, adding queen bees uses to delete the exchange. The hashtag #DeleteCoinbase was appearing on the top 10 Twitter trends. 

Categories
Crypto Market Analysis

Daily Crypto Review, Jun 17 – Craig Wright Called a Thief or a Fraud by the Ex CEO of Mt. Gox

The crypto market has taken its time to consolidate throughout the day, as well as possibly test nearest resistance levels. Bitcoin is currently trading for $9,447, which represents an increase of 0.56% on the day. Meanwhile, Ethereum gained 1.6% on the day, while XRP lost 0.07%.

SwissBorg took the position of today’s biggest daily gainer, with gains of 30.87%. DigiByte lost 6.96% of its daily value, making it the most prominent daily loser.

Bitcoin’s dominance stayed at the same place since we last reported, with its value currently at 65.32%. This value represents a 0.2% difference to the downside when compared to yesterday’s value.

The cryptocurrency market capitalization increased over the course of the day, with the market’s current value being $267.99 billion. This value represents an increase of $2.35 billion when compared to the value it had yesterday.

What happened in the past 24 hours

Craig Wright called a liar or a thief by Mark Karpeles

Former CEO of Mt. Gox Mark Karpeles claims that the 80,000 Bitcoin that Dr. Craig Wright lays claim to was actually stolen from the Mt. Gox exchange in March 2011. This claim isn’t just empty words, as cryptocurrency experts side with Karpeles. The Bitcoin residing at one of the addresses that Craig Wright listed among the numerous addresses he supposedly owns was stolen from Mt. Gox.

Karpeles said, “This was confirmed in 2011, and records are a part of court documents available publicly.”

_______________________________________________________________________

Technical analysis

_______________________________________________________________________

Bitcoin

The largest cryptocurrency by market capitalization spent the past 24 hours trying to consolidate above $9,251 as well as to test the $9,580 resistance level for a brief amount of time. The resistance was strong, and Bitcoin couldn’t break it, which continued its consolidation within a range bound by $9,251 and $9,580.


Bitcoin’s volume decreased after the recovery bull run ended, while its RSI level currently stagnates at around 51.

Key levels to the upside Key levels to the downside

1: $9,580 1: $9,251

2: $9,735 2: $9,120

3: $9,870 3: $8,980

Ethereum

Ethereum seems to have had a solid day, not only recovering from the plunge but slowly rising in price as well. However, the most recent sentiment shows that bears are testing how far they can go. Whether bears manage to drive ETH’s price down a bit or not, there’s still a long way until the $225.4 support level.


Ethereum’s volume lower and lower as the time passes, while its RSI level hovers below the value of 50.

Key levels to the upside Key levels to the downside

1: $240 1: $225.4

2: $251.4 2: $217.6

3: $198

Ripple

XRP had a decent day as well, as the price drop ended after the price hit the red descending line and bounced from it. The third-largest cryptocurrency by market cap managed to get back above $0.19 (which is, as we mentioned yesterday, a big deal for XRP) and consolidate above it. The line got tested once, without much success for the bears.


XRP’s volume is a bit below the weekly average (after excluding the volume bumps for upward and downward spikes), while its RSI level is just below 50.

Key levels to the upside Key levels to the downside

1: $0.2 1: $0.19

2: $0.205 2: $0.178

3: $0.214


Categories
Forex Service Review

Gunbot Crypto Trading Bot Review

Gunbot is a crypto trading robot that places automatic trades based on a computer-generated algorithm. The software was created by a man named Gunther De Niro and launched in December of 2016. The current version of the software is Gunbot 18:3:9 for Windows, Linux, Mac, and ARM.

Overview

Gunbot was designed to be an easy to use automated trading bot that follows a simple procedure – buying cryptocurrency at a lower price and selling at a higher rate, thus earning profits for users with a minimal effort on their part. Gunbot is fairly effective at analyzing markets and making profitable trades and the service places a great deal of importance on trading strategies. Gunbot comes with several precoded strategies and even allows users to combine some of them. If you’re of more of a beginner status, you can select from a simple pre-set trading strategy, or you can build your own strategy.

There are some limitations though, the cheapest account only offers “emotionless” trading strategies, while accounts that cost 0.05 BTC and up offer all of the trading strategies. Gunbot can trade Bitcoin, Ethereum, Litecoin, and multiple other cryptocurrencies. You can choose from multiple trading indicators like candlesticks and the EMA, plus more. Since the software is automatic, you could allow Gunbot to run any time day or night, but the potential to make huge profits is rather limited based on the fact that this is a cryptocurrency-based trading robot.

Traders can trade on the Poloniex trading exchange and other similar exchanges without installing additional programs. The software works on Windows, Linux, and Mac computers. Gunbot also stores data locally so that others won’t be able to view information about how you trade, but one issue that may arise with the download-based software is the 10GB of ram that is needed to complete the installation. This would likely only affect you if you’re running the software on an older computer.

Service Cost

The software charges a one-time license fee with free updates for life. Prices are currently being advertised at a 50% discount off their regular rate. No word on whether this is just a marketing tactic, or if the sale will expire in the future. Take a look at each account’s current price below.

  • Starter Account: 0.02 BTC
  • Gunbot Account: 0.05 BTC
  • Gunbot Pro Account: 0.075 BTC
  • Gunbot Ultimate Account: 0.125 BTC

Bitcoin is always fluctuating, but the entry-level deposit falls into a $100 USD range on the Starter account thanks to the sale, give or take a few dollars. This is cheaper than the account’s regular $200 price, so now could be a good time to jump on the offer. There is also a BackTesting add-on for 0.0125 BTC and a TradingView add-on for a one-time payment of 0.0499 BTC. Of course, there are other providers out there that offer free services. Gunbot doesn’t currently offer a free demo account. Overall, the registration process is confusing, so the addition of demos could be especially helpful.

Conclusion

Gunbot shows some signs of being a legitimate trading robot that manages to earn a small profit for traders. Since the cryptocurrency market is known for being highly volatile, the robot can only make a profit during times when the market is stable. The software is complicated in some ways and seems to be better suited for traders that have more advanced knowledge trading with cryptocurrencies, as registration can be complicated and there are some technical aspects to think about.

After taking a look at feedback from others that have tried Gunbot, we learned that other traders were also struggling with figuring out how to set up their account and get started. However, many of them mentioned that the service has excellent support staff who are willing to walk traders through the confusing process. Once traders got everything set up and running, they documented that they did start to make profits using the bot. If you aren’t easily frustrated, then it’s worth investing some time into the bot.

This Forex service can be found at the following web address: https://www.gunbot.com

Categories
Crypto Market Analysis

Daily Crypto Review, Jun 16 – BTC Whale Count Back To Dec 2017 Levels; BTC Back Above $9,000

The crypto market has taken the day to restore its price level to the pre-drop of June 15. Bitcoin is currently trading for $9,386, which represents an increase of 1.46% on the day. Meanwhile, Ethereum lost 0.05% on the day, while XRP gained 1.85%.

Verge took the position of today’s biggest daily gainer, with gains of 21.03%. Flexacoin lost 13.05% of its daily value, making it the most prominent daily loser.

Bitcoin’s dominance stayed at exactly the same place since we last reported, with its value currently at 65.52%. This value represents a 0% difference when compared to yesterday’s value.

The cryptocurrency market capitalization increased over the course of the day, with the market’s current value being $265.64 billion. This value represents an increase of $11.37 billion when compared to the value it had yesterday.

What happened in the past 24 hours

Bitcoin whales returning to pre-December 2017 pump levels

The number of investors that are holding an immense amount of Bitcoin (otherwise known as Bitcoin whales) is starting to approach the level that the crypto community hadn’t seen since the 2017 levels when Bitcoin rallied to $20,000.

According to Glassnode’s report dating June 15, we can see steady growth in the number of Bitcoin whales (traders holding over 1000 BTC) since April 2019.

_______________________________________________________________________

Technical analysis

_______________________________________________________________________

Bitcoin

The largest cryptocurrency by market capitalization managed to return to its pre-price drop level, reaching back above $9,000. Bitcoin has skipped the $9,120 and $9,251 levels as well, currently stabilizing between $9,251 and $9,580.


Bitcoin’s volume increased during the rally but returned to the previous levels, while the RSI level increased to 50.

Key levels to the upside                    Key levels to the downside

1: $9,580                                           1: $9,120

2: $9,735                                           2: $9,251

3: $9,870                                            3: $8,980

Ethereum

Ethereum also had a correction over the day, bouncing above the $225.4 and trying to consolidate. However, the price action looks like the $225.4 level will be tested to the downside. If it stays strong, traders will have a chance to possibly enter a strong position towards the upside from there.


Ethereum’s volume increased both during the price spike as well as in general. Its RSI level is currently at 43.5.

Key levels to the upside                    Key levels to the downside

1: $240                                               1: $225.4

2: $251.4                                           2: $217.6

                                                           3: $198

Ripple

XRP moved back above the $0.19 during the day, which represents a great bullish sign for it. Unlike with Bitcoin and Ethereum, XRP doesn’t have many support levels below $0.178, and dropping below it would be extremely bearish. However, the recent price increase returned XRP’s price to pre-price drop levels.


XRP’s volume returned to average after a slight increase due to the price increase, while its RSI level came to 50.

Key levels to the upside                    Key levels to the downside

1: $0.2                                              1: $0.19

2: $0.205                                            2: $0.178

3: $0.214                                          


Categories
Crypto Market Analysis

Daily Crypto Review, Jun 15 – Bitcoin Under $9,000; What Happens Next?

The crypto market has been relatively stable over the weekend only to drop in the past couple of hours. Bitcoin fell under $9,000, which brought other cryptos’ prices down. Bitcoin is currently trading for $8,962, which represents a decrease of 4.47% on the day. Meanwhile, Ethereum lost 6.13% on the day, while XRP lost 4.34%.

Flexacoin took the position of today’s biggest daily gainer, with gains of 18.57%. Loopring lost 17.68% of its daily value, making it the most prominent daily loser.

Bitcoin’s dominance stayed at the same place since we last reported, with its value currently at 65.52%. This value represents a 0.24% difference to the upside when compared to Friday’s value.

The cryptocurrency market capitalization decreased over the course of the weekend, with the market’s current value being $254.27 billion. This value represents a decrease of $10.24 billion when compared to the value it had on Friday.

What happened in the past 24 hours

Bitcoin transaction fee average decreased by 91%

The average fee for Bitcoin transactions has dropped under the $1 mark, meaning it is back to levels previously seen only before the Bitcoin reward halving.

According to data shown by the crypto analytics website BitInfoCharts, Bitcoin transaction fees decreased by 91% from May 20 until June 14. With the fees going down from $6.65 to $0.56, we can certainly see the improvement in the tx fee department of Bitcoin.

_______________________________________________________________________

Technical analysis

_______________________________________________________________________

Bitcoin

The largest cryptocurrency by market capitalization had a slow weekend of consolidation after the 11 June price drop. While many analysts were suggesting a bull run, Bitcoin dropped in price yet again, this time below $9,000. The move reached $8,900 before stabilizing between $9,980 and $9,120 level.


Bitcoin’s volume seems to be following a pattern of decreasing its volume from day to day until a spike happens, which brings its volume up.

Key levels to the upside                    Key levels to the downside

1: $9,120                                           1: $8,980

2: $9,251                                           2: $8,820

3: $9,580                                            3: $8,650

Ethereum

Ethereum has been pretty stable over the weekend and had low volatility as well as volume. Bitcoin’s move towards the downside dragged it down as well, pulling the price down to $217 levels. The $217.6 level held greatly, stopping the bearish move in its tracks.


Ethereum’s volume increased from almost non-existent to almost the levels of the June 11 price drop.

Key levels to the upside                    Key levels to the downside

1: $225.4                                            1: $217.6

2: $240                                              2: $198

3: $251.4                                            3: $193.6

Ripple

XRP spent the weekend performing slightly worse than the aforementioned Ethereum and Bitcoin, slowly losing value as it went towards the $0.19 level. However, the most recent price drop brought its price to $0.182 levels, where it was stopped by the long-term descending trend line.


XRP’s volume increased slightly as the bearish move occurred, while its RSI level entered the oversold territory.

Key levels to the upside                    Key levels to the downside

1: $0.19                                             1: $0.178

2: $0.2 

3: $0.205                                          


Categories
Forex Assets

Trading The ‘LINK/USD’ Crypto Fiat Pair & Analyzing The Costs Involved

Introduction

Chainlink is a decentralized oracle network whose purpose is to connect smart contracts with the real world. LINK is its native digital currency, which is used to node operators on the Chainlink decentralized oracle network. LINK has a market capitalization of $1.5 billion and stands 14th on CoinMarketCap. LINK can be bought using fiat currency as well as traded against other cryptocurrencies like BTC and ETH.

Understanding LINK/USD

The price of LINK/USD depicts the value of the US Dollar equivalent to one Chainlink. It is quoted as 1 LINK per X USD. For example, if the market price of LINK/USD is 4.36166, then each LINK will be worth so many dollars.

LINK/USD specifications

Spread

Spread is nothing but the arithmetic difference between the buying and selling price of the cryptocurrency. Unlike forex brokers, these prices are decided by the traders and not the exchange. Hence, the spread constantly varies in exchange as well as across exchanges.

Fee

Typically, there are three types of the fee charged by exchanges including

  • Execution fee (Taker or Maker) – twice, for opening and closing the trade
  • 30-day trading volume fee
  • Margin opening fee, if applicable

Example

  • Long 1,000 LINK/USD at $4.45509
  • 30-day volume fee is $0
  • Order is executed as Taker
  • With Leverage

Total cost of the order = 1,000 x $4.45509 = $4455.09

Assuming the taker fee to be 0.26%, the opening fee will be – $4455.09 x 0.26% = $11.58

The margin opening fee of 0.02% is charged for opening the position using leverage – $4455.09 x 0.02% = $0.89

If the order is closed at $4.50000, the total cost of closing will be – 1,000 x $4.50000 = $4500.00. And the fee for closing will turn to be – $4500.00 x 0.26% = $11.70

Thus, the total fee will be the sum of all the fees – $11.58 + $0.89 + $11.70 = $24.17

Trading Range in LINK/USD

Chainlink is traded in cryptocurrency exchanges and not forex brokers. So, there is no concept of pip and pip value. Instead, the value of the crypto is directly taken into account.

A trading range is the tabular representation of the approximate value movement of the pair, which is obtained through the Average True Range (ATR) indicator. In layman terms, the numbers in the table depict the amount of US dollars a trader will gain or lose in a given time frame. The following table shows the value of the price movement for 1,000 quantities LINK/USD.

Note: the above values are for trading 1,000 units of LINK/USD. If X units of the pair are traded, then the ATR values will be,

(ATR value from the table / 1,000) x X units

Procedure to assess ATR values

  1. Add the ATR indicator to your chart.
  2. Set the period to 1
  3. Add a 200-period SMA to this indicator.
  4. Shrink the chart so you can assess an extensive period
  5. Select your desired timeframe
  6. Measure the floor level and set this value as the min
  7. Measure the level of the 200-period SMA and set this as the average
  8. Measure the peak levels and set this as Max.

LINK/USD Cost as a Percent of the Trading Range

Below are two tables representing cost variations for different time frames in terms of a percentage for taker execution and maker execution.

Taker Execution Model

Opening = $11.58 | Margin fee = $0.89 | Closing = $11.70 | 30-day volume = $0

Total fee = Opening + Margin fee + Closing + 30-day volume = $11.58 + $0.89 + $11.70 + $0 = $24.17

Maker Execution Model

Opening = $7.12 | Margin fee = $0.89 | Closing = $7.2 | 30-day volume = $0

Total fee = Opening + Margin fee + Closing + 30-day volume = $7.12 + $0.89 + $7.2 + $0 = $15.21

*Assuming maker fee to be 0.16% the trade value.

Interpretation of Cost as a Percent of the Trading Range

Let us directly understand the table with an example.

1H time frame

ATR value = 41.92

Cost percentage = 57.66%

4H time frame

ATR value = 92.32

Cost percentage = 26.18%

Comparing ATR values, we infer that more profit can be generated in the 4H time frame ($92.32) than in the 1H time frame ($41.92). But, a critical point to note is that the cost is the same for both the trades. A fee that is paid to gain $92.32, the equal fee must be paid to gain $41.92. This difference is represented using the cost percentage. Thus, the percentage in the 1H time frame is higher than that in the 4H time frame, indicating that the relative costs are higher.

Trading the LINK/USD

LINK can be traded against USD and few cryptocurrencies as well. However, LINK/USD is seen to have the highest trading volume. Comparing the liquidity with other cryptocurrency pairs like BTC/USD, ETH/USD, and XRP/USD, LINK/USD is less liquid.

From the above comprehension of the cost percentage, we understood that the costs remain the same irrespective of the time frame you trade. Thus, to relatively reduce the costs, we must focus on the columns of the table. The effective way to trade this pair is to enter the market when the volatility is at or above the average values. For example, if you are a day trader who trades the 1H time frame, you must make sure that the volatility is above the average level. In doing so, you will be able to extract more from the market for the same total fee. Cheers!

Categories
Forex Assets

Analyzing The ‘XMR/USD’ Crypto Fiat Pair

Introduction

Monero is a private and secure cryptocurrency that was launched 18th of April 2014 as a fork of ByteCoin. It is an open-source digital currency built on a blockchain, making it opaque. With Monero, the holder will have full control over their investment and funds, and nobody will have access to their balance and transactions.

Monero is traded in exchanges under the ticker XMR. It is under the top 20 in terms of market capitalization according to data from CoinMarketCap. It can be traded against USD as well as for cryptocurrencies Bitcoin, Ethereum, Tether, etc.

Understanding XMR/USD

The price of XMR/USD depicts the value of the US Dollar equivalent to one Monero. It is quoted as 1 XMR per X USD. For example, if the market price of XMR/USD is 64.67, then each XMR will be worth about 65 dollars.

XMR/USD specifications

Spread

Spread is the basic difference between the bid and the ask price of the cryptocurrency. These prices are put up by the clients and not exchange. Thus, the spread constantly varies in and across exchanges.

Fee

The types of fees in cryptocurrency exchanges vary from that of equity broker and forex brokers. Most crypto exchanges charge the following fees:

  • Execution fee (Taker or Maker) – twice, for opening and closing the trade
  • 30-day trading volume fee
  • Margin opening fee, if applicable

Example

  • Short 100 XMR/USD at $64.82
  • 30-day volume fee is $0
  • Order is executed as Taker
  • With Leverage

Total cost of the order = 100 x $64.82 = $6482

Assuming the taker fee to be 0.26%, the opening fee will be – $6482 x 0.26% = $16.85

Since the trade is opened with leverage, there is 0.02% of margin opening fee collected – $6482 x 0.02% = $1.29

If the position is squared off at $60.00, the total cost of closing will be – 100 x $60.00 = $6000.  The fee for the same can be calculated as – $6000 x 0.26% = $15.60

The algebraic sum of all the fee will yield the total fee as –

$16.85 + $1.29 + $15.60 = $33.74

Trading Range in XMR/USD

A trading range is the number of units the cryptocurrency pair moves in a specific time frame, represented in US dollars as the quote currency for the pair is USD. The values basically depict the volatility in different time frames.

The following table is the trading range for 100 quantities of XMR/USD.

Note: the above values are for trading 100 units of XMR/USD. If X units of the pair are traded, then the ATR values will be,

(ATR value from the table / 1,000) x X units

Procedure to assess ATR values

  1. Add the ATR indicator to your chart.
  2. Set the period to 1
  3. Add a 200-period SMA to this indicator.
  4. Shrink the chart so you can assess a large time period
  5. Select your desired timeframe
  6. Measure the floor level and set this value as the min
  7. Measure the level of the 200-period SMA and set this as the average
  8. Measure the peak levels and set this as Max.

XMR/USD Cost as a Percent of the Trading Range

This cost as a percent represents relative the fee on the trade by considering the volatility and time frames. The percentage values are calculated by finding the ratio of each ATR value and the total fee.

Taker Execution Model

Opening = $16.85 | Margin fee = $1.29 | Closing = $15.60 | 30-day volume = $0

Total fee = Opening + Margin fee + Closing + 30-day volume = $16.85 + $1.29 + $15.60 = $33.74

Maker Execution Model

Opening = $10.37 | Margin fee = $1.29 | Closing = $9.6 | 30-day volume = $0

Total fee = Opening + Margin fee + Closing + 30-day volume = $10.37 + $1.29 + $9.6 + $0 = $21.26

*Assuming maker fee to be 0.16% the trade value.

Trading the XMR/USD

XMR is ranked 16 in market capitalization with a denominator over a thousand. It offers enough liquidity and volume for retail traders to participate in this pair. However, it is comparatively lesser than coins like Bitcoin, Ethereum, Ripple, Bitcoin Cash, etc.

As far as the analysis for this pair is concerned, it is no different from analyzing other cryptocurrencies and forex pairs. Hence, you can confidently apply those concepts in Monero as well.

The cost percentages in the above tables represent how expensive or cheap trade is going to be based on the profit you make or the loss you incur. The larger the percentage, the higher is the fee. Note that we are referring to the relative fee, not the absolute fee. Irrespective of the time frame and volatility, the fee will be the same but will vary relatively. For example, a short-term trader who makes $50 on trade must pay the same fee as a long-term trader who makes $1000.

Thus, to effectively reduce your relative costs, you must understand the volatility of the market. The concept is simple; one can make money only if there is enough movement in the market. Thus, before taking a trade, you must know the current volatility of the market using the ATR indicator. If the values are above the average, then you’re good to go. But, values near the minimum value indicates that there is not much movement in the market, and it could not reach your target point within the expected time.

Categories
Crypto Market Analysis

Daily Crypto Review, Jun 12 – BTC Plunging To Two-Week Lows; Binance Launching BTC Futures Contracts

The crypto market has plunged over the course of the day, bringing the overall crypto market to a two-week low point. Bitcoin is currently trading for $9,337, which represents a decrease of 5.51% on the day. Meanwhile, Ethereum lost 6% on the day, while XRP lost 5.61%.

DigiByte took the position of today’s biggest daily gainer, with gains of 5.14%. Loopring lost 20.86% of its daily value, making it the most prominent daily loser.

Bitcoin’s dominance stayed at the same place since we last reported, with its value currently at 65.28%. This value represents a 0.6% difference to the downside when compared to yesterday’s value.

The cryptocurrency market capitalization decreased greatly over the course of the day, with the market’s current value being $264.51 billion. This value represents a decrease of $16.72 billion when compared to the value it had yesterday.

What happened in the past 24 hours

500 Crypto Companies in Estonia losing their permits

Estonia is one of the European Union’s most crypto-friendly countries when it comes to regulation. However, due to the $220 billion scandal regarding money laundering through crypto, Estonia started cracking down on many licensed cryptocurrency companies. So far, over 500 companies have lost their permits.

Honorable Mention

Cryptocurrency exchange powerhouse Binance has just launched a new Bitcoin futures product. The launch came through despite institutional investors visibly showing uncertainty about the future of cryptocurrencies.

In a blog post that came directly from Binance on June 11, the company revealed its quarterly futures contracts product is going live. The first contracts will have a settlement due in September.

_______________________________________________________________________

Technical analysis

_______________________________________________________________________

Bitcoin

The largest cryptocurrency by market capitalization has spent the day plunging to its two-week lows, falling as low as $9,070. The $9,251 line has, however, held up, and BTC is now consolidating above it. The downward-facing move should be over for now as RSI stepped into oversold while the volume faded.


Bitcoin’s volume increased multiple-fold over the course of the price dump but has since returned to its average levels.

Key levels to the upside                    Key levels to the downside

1: $9,580                                           1: $9,251

2: $9,735                                           2: $9,120

3: $9,870                                            3: $8,980

Ethereum

Ethereum followed Bitcoin’s initiative to move towards the downside and fell as low as $225. However, the $225.4 support line held up and stopped the move from going any further. Ethereum has recovered slightly and is now trading at a $233 level.


Ethereum’s volume increased drastically during the peak of the move but has since returned to normal. Its RSI level has entered the oversold territory but has (again) returned above it once the pressure faded.

Key levels to the upside                    Key levels to the downside

1: $240                                               1: $225.4

2: $251.4                                           2: $217.6

3: $260                                               3: $198

Ripple

XRP did not stray away from other cryptocurrencies in terms of market direction. The third-largest cryptocurrency by market cap has broken the range it was trading in for a long time as it fell below the $0.2 support level. The downward-facing move reached $0.184 before going up. XRP is still trying to find equilibrium and a place to consolidate at, and it is still uncertain whether that will be above or below the $0.19 level.


Key levels to the upside                    Key levels to the downside

1: $0.2                                               1: $0.19

2: $0.205                                           2: $0.178

 3: $0.214                                          


Categories
Crypto Market Analysis

Daily Crypto Review, Jun 11 – Chinese Crypto Traders’ Bank Accounts Getting Frozen; BTC Attempting To Break $10,000

The crypto market has spent the day with increased volatility as Bitcoin was trying to pass the $10,000 mark.  While the level got rejected once again, the price increase did happen. Bitcoin is currently trading for $9,941, which represents an increase of 1.69% on the day. Meanwhile, Ethereum gained 2.18% on the day, while XRP gained 0.81%.

Aave took the position of today’s biggest daily gainer, with gains of 20.26%. WAX lost 20.34% of its daily value, making it the most prominent daily loser.

Bitcoin’s dominance increased since we last reported, with its value currently at 65.34%. This value represents a 0.14% difference to the upside when compared to yesterday’s value.

The cryptocurrency market capitalization increased slightly over the course of the day, with the market’s current value being $281.26 billion. This value represents an increase of $3.57 billion when compared to the value it had yesterday.

What happened in the past 24 hours

Are Chinese bank accounts getting frozen by the government?

Almost 4,000 Chinese bank accounts have reportedly been frozen by the local government due to cryptocurrency trading. According to a report published on Monday, the Chinese police force froze the bank accounts of thousands of OTC traders from the Chinese province of Guangdong.

The report stated that the authorities started freezing bank accounts on Thursday. While the law enforcement is claiming that they are freezing only accounts tied to illicit activities, retail investors saw their bank account frozen after buying cryptocurrency on credible crypto exchanges.

_______________________________________________________________________

Technical analysis

_______________________________________________________________________

Bitcoin

The largest cryptocurrency by market capitalization has spent the day preparing for a move towards the upside. The price attempted to break the $10,000 threshold several times, each time being unsuccessful. However, even though the price point got rejected, Bitcoin gained some value and managed to pass $9,870 (which is being tested at the time of writing).


If Bitcoin manages to pass $10,000, it can face resistance above the $10,300 level.

Key levels to the upside                    Key levels to the downside

1: $10,010                                         1: $9,870

2: $10,355                                         2: $9,735

                                                           3: $9,580

Ethereum

Ethereum also made a move towards the upside while attempting to break its resistance level of $251.4. While the break is (so far) unsuccessful, it seems like the second-largest cryptocurrency by market cap has strong support in both the $240 level and the 21-period moving average, which means that the price will not dramatically fall without a fight.


Ethereum’s volume increased drastically during the peak of the move towards the upside but started to fade as the $251.4 level kept resisting.

Key levels to the upside                    Key levels to the downside

1: $251.4                                            1: $240

2: $260                                              2: $225.4

                                                           3: $217.6

Ripple

XRP stayed in its tight range over the course of the day, bound by the $0.2 support and $0.205 resistance level. While its price increased slightly, XRP didn’t make a determined move towards the upside (like Bitcoin and Ethereum did).


While scalp traders might enjoy the ranging moves, a confirmed break to either the upside or downside will benefit any trader as the move would most likely be easy to spot and profit from.

Key levels to the upside                    Key levels to the downside

1: $0.205                                           1: $0.2

2: $0.214                                           2: $0.19

 3: $0.227                                                        


Categories
Crypto Videos

How To Get Money Back on Your Nike purchases! Just Do It!

How To Get Money Back on Your Nike Purchases – Crypto Edition


US footwear giant Nike has recently entered a new affiliate partnership that allows its customers to earn up to 3% from their online purchases with crypto.

The partnership with the London-based financial technology firm Plutus​ is now offering rewards through its debit card when its users shop Nike’s online store. When using this card, you can get 3% back in crypto and 9% cash reward from those purchases.

Who can use this card

In order to receive these rewards, customers must be using the Plutus Visa Card while doing their online shopping. As Plutus currently operates only within the United Kingdom and the European Economic Area, only people from these regions would be able to get the card.
The rewards on your purchases are generated in Plutus’s native token called Pluton. At the moment, this token is trading at $1.75, with a current market capitalization of around $1.5 million.

The future

By connecting with Nike to provide crypto rewards, Plutus is making yet another step towards bringing cryptocurrencies into everyday life. The team-up with Nike came months after Plutus introduced a similar feature for the major travel websites – Airbnb and Skyscanner. Unfortunately, the development had to be paused as the coronavirus spread intensified.
As time passes, more companies such as this one will bring crypto into everyday lives of people, making it more accessible and easy to use.

Categories
Crypto Market Analysis

Daily Crypto Review, Jun 10 – Crypto Ransomware Cartels Forming; Market Preparing For A Move

The crypto market has spent the day without much movement and with low volatility.  Bitcoin is currently trading for $9,737, which represents an increase of 0.54% on the day. Meanwhile, Ethereum gained 0.18% on the day, while XRP lost 0.78%.

Swiss Borg took the position of today’s biggest daily gainer, with gains of 18.23%. HedgeTrade lost 7.87% of its daily value, making it the most prominent daily loser.

Bitcoin’s dominance decreased since we last reported, with its value currently at 65.20%. This value represents a 0.92% difference to the downside when compared to yesterday’s value.

The cryptocurrency market capitalization increased slightly over the course of the day, with the market’s current value being $277.69 billion. This value represents an increase of $1.61 billion when compared to the value it had yesterday.

What happened in the past 24 hours

Crypto Ransomware Cartel?

Ransomware attacks started happening all over the world recently. They were performed by well-known cybercriminal groups, which are reportedly teaming up and creating cartel-style alliances, all with the idea to pressure their respective victims into paying the ransom requests.

The central feature to show that this is happening is that the gang notes that Ragnar Locker, which is a ransomware group, provided this info, as the title of the blog post they have posted says: “MAZE CARTEL Provided by Ragnar.”

_______________________________________________________________________

Technical analysis

_______________________________________________________________________

Bitcoin

The largest cryptocurrency by market capitalization has spent the day without much movement. As we noted yesterday, the $9,735 level was breached to the downside but was not confirmed (the lack of confirmation made us think that the move might be corrected soon). Bitcoin regained its price as well as the $9,375 level. There aren’t many opportunities for traders at the moment, but scalp traders might use the fact that Bitcoin is fluctuating around $9,735 and testing support and resistance levels above and below it.


Key levels to the upside                    Key levels to the downside

1: $9,870                                           1: $9,735

2: $10,010                                         2: $9,580

                                                           3: $9,250

Ethereum

Ethereum had no movement throughout the day, as it stayed within a one-dollar range. The second-largest cryptocurrency by market capitalization is secured by the 21-period moving average on its downside, while it has absolutely no volume to even try to test the upper levels.


Ethereum’s volume is extremely low while its RSI level is flat for a couple of days, sitting at 53.

Key levels to the upside                    Key levels to the downside

1: $251.4                                            1: $240

2: $260                                              2: $225.4

                                                           3: $217.6

Ripple

XRP slowly moved towards the $0.2 downside and tested the level after failing to break $0.205 due to the lack of volume. The third-largest cryptocurrency by market cap is in an inverse spot to Ethereum, as both the 21-period and 50-period moving averages are guarding the upside rather than the downside. XRP will require a substantial increase in volume in order to break this range. On top of that, unless it gets “pulled” up by Bitcoin or fundamentals, XRP is most likely to go under $0.2.


Key levels to the upside                    Key levels to the downside

1: $0.205                                           1: $0.2

2: $0.214                                           2: $0.19

 3: $0.227                                                        


Categories
Crypto Daily Topic

How to use Cryptocurrency Trading Pairs as an Investment Strategy

Trading crypto-assets is a tad different from trading such other assets as commodities and stocks. Even though they almost share the same trading platform and trading tools, there is a striking difference in how the operations are executed in each market. 

In the securities market, for instance, you can easily buy equities directly for fiat currency through your broker account. While the same can be done in the crypto-market, buying cryptocurrencies directly for fiat currency is limited only to a few cryptos. Unless you plan on limiting your trading to these few digital currencies, you’ll have to exchange one crypto for acquiring another one. 

As such, most digital currencies aren’t traded in isolation – or rather can’t be traded against fiat currency, as is the case with stocks and commodities. This is where the cryptocurrency pair trading concept comes into play. 

How Does Cryptocurrency Pair Trading work? 

Well, pair trading isn’t unique to the cryptocurrency market. It’s a trading strategy borrowed from the stock market, where traders pick two highly correlated equities and go long on one while shorting the other when the pair’s price diverges. 

BTC/ETH crypto pair - Forex Academy

In the crypto-market, pair trading is less complicated. All you have to do is buy crypto using fiat currency. Once you’ve acquired the crypto, you can exchange it for or trade it against other cryptocurrencies. In this case, the cryptocurrency which you bought for fiat currency is referred to as the base currency. In most exchanges, Bitcoin, Ethereum, and Litecoin are the most preferred base currencies as they can easily be bought using domestic currencies. Litecoin is primarily preferred because of its fast transactions and affordable fees. 

Dogecoin is also used as a base currency, especially when trading low market cap coins where it might be burdensome to trade them with large-cap coins like Bitcoin. Dogecoin is also preferred due to its relatively stable value, minimizing the volatility risk. Nonetheless, the rule of thumb when choosing a base currency is to go for one that has the highest number of trading pairs. For this reason, it’s recommended to stick to BTC and ETH as your go-to base currencies since most cryptos have pegged their value on these two currencies. Besides, both BTC and ETH are listed in virtually every exchange. 

Tether (USDT) is also among the most used base currencies. It’s questionable management; notwithstanding, the currency is one of the most stable digital assets since its value is pegged to the United States dollar. This makes Tether not only ideal for pair trading but also a store of value for investors to safeguard funds they don’t want to subject to the crypto market’s aggressive price swings. 

Trading Cryptocurrency Pairs 

Cryptocurrency pairs are usually denoted as one against the other. For instance, ETH/LTC pair means that you’re buying Ethereum and selling Litecoin (LTC) at the same time. Selling the pair means that you are selling Ethereum and buying Litecoin simultaneously. Note that some exchanges may have different cryptocurrency pair listings, so be sure to check if the pair you intend to trade is on offer/listed.  

Additionally, some cryptocurrencies cannot be exchanged directly for others. You may have to execute a few pairs of trades before getting hold of the cryptocurrency you desire. This creates an opportunity for complex arbitrage trading, where you can exchange multiple currencies and pocket price differences. This strategy may, however, be considered too risky, especially for new traders. In such a case, consider using third-party apps for seamless trading across a multitude of crypto pairs. 

Does Liquidity Affect Crypto Pair Trading?

Much like any other crypto trading strategy, liquidity influences crypto pair-trading. Essentially, liquidity means the ability of a currency pair to be sold or bought on demand. A currency on high demand has high liquidity, meaning more opportunities on the market. You can buy/sell in significant amounts without much variances in its exchange rate. Even on a bearish market, crypto on high demand will always have buyers. So, you won’t have to settle for the exchange rate too low to attract buyers. 

Note that not all currency pairs are liquid. Their liquidity depends on whether they are paired with cryptos that are on high demand. This is why BTC, ETH, USDT, and LTC are the ideal base currencies due to their constant demand. It’s also why exchanges with a limited number of trades tie their liquidity to one of these major base currencies.  

Risks of Crypto Pair Trading

The best thing about crypto pair trading is that it is market-neutral or non-directional. This means that by pair trading, you generate profits regardless of whether the market is rallying or correcting. Yet, there are several risks and drawbacks investors need to be aware of when using this strategy, including:

I) Execution risk 

While it’s easy to use the pair trading strategy, you may fail to execute the trade at an optimal price value. This is especially true when trading crypto pairs with a small market cap, whose valuation is more dynamic and unstable. 

II) Correlation Breakdown 

Similar to the stock market, pair trading in the crypto-market has to be between two correlated digital assets. Correlation is usually determined arithmetically on a scale of -1 to +1, whereby +1 indicates a perfect positive correlation, while -1 indicates a perfect negative correlation. If the value is 0, it means there isn’t a correlation between the two assets. 

Considering the crypto market’s volatility, the correlation between assets can unexpectedly break down, and the trade may turn sour as assets move in different directions. 

III) Security Risk 

The security aspect of pair trading has more to do with the trading platform rather than the strategy itself. If you are an avid follower of the digital assets market, you probably know that holding your crypto funds in an exchange is a bad idea. Plus, when using a crypto exchange to execute this trading strategy, you risk losing your assets to hackers.

The safest platform for executing this strategy is a Contract for Difference (CFD) broker platform. With this platform, you enter a trade without owning the underlying asset (cryptocurrency). It’s ideally a bet between the seller and trader to trade the underlying asset at prices stipulated in the contract. With CFD trading, you never have to worry about storing the asset or losing it to hackers.

Conclusion 

Pair trading, being a market-neutral strategy, is well poised for application in the volatile crypto market. On the downside, however, if you are planning on making bank on the next bull run, you should probably avoid pair trading since you won’t earn higher profits in a rally than you would during a bearish market. 

Additionally, the strategy is best suited for intermediate and experienced traders who are already familiar with analyzing prices and market fundamentals. If you are looking to earn regular returns regardless of market trends, you too should consider using the pair trading strategy. Note, however, that even though pair trading is relatively safe, only invest what you can afford to lose and operate within tolerable risk levels. 

Categories
Cryptocurrencies

Cryptocurrency Tax Guide – How to File and Pay Taxes on Crypto Earnings

The longest-held sentiment among crypto enthusiasts is that Bitcoin and other cryptocurrencies will one day be recognized as a medium of exchange by governments. If that were to happen, it would not only accelerate the maturation of the cryptocurrency market but also promote world-wide adoption of virtual currencies. 

Unfortunately, tax authorities, particularly Internal Revenue Service (IRS) in the United States and Australian Taxation Office (ATO), regard cryptocurrencies as assets or intangible properties and not a currency since it’s not issued by a central bank. The asset classification of cryptos means that all gains and transactions made using cryptocurrencies are subject to property taxation principles. 

How are Cryptocurrencies Taxed? 

Crypto tax_Forex Academy

To avoid landing in the bad books of the law as a cryptocurrency user/investor, it’s necessary to understand the very instances in which crypto taxation laws take effect. This way, you’ll be in a position to report income and pay the resulting tax correctly. 

For starters, tax authorities have made it mandatory for users to report all their cryptocurrency transactions no matter how negligible they seem. These transactions include the purchase, selling of, investing in, or paying for goods and services using any digital currency.

Merchants or businesses that accept payments in the form of cryptocurrencies are required by the law to report the value of the received cryptos. The value should be expressed as their fiat currency equivalent at the time the payment was received. In these cases, as a cryptocurrency user, you’ll incur capital gains, either long-term or short-term.

For the investors, taxable gains apply if the digital currency’s market value increases from the time of investment up to the time of tax filing. A taxable loss, on the other hand, applies when the fair market value is lower than the adjusted basis of the virtual currency. 

Additionally, cryptocurrency miners are subject to cryptocurrency taxation. For instance, after successfully mining Bitcoins, you ought to include the fair market value of the mined coins in your annual gross income. Wages paid in cryptocurrency are also taxed based on the fair market value on the coins on the date of receipt. 

Note that failing to comply with the tax laws can result in penalties, high interests, or even criminal prosecution. As such, it’s advisable to maintain an accurate record of all your crypto transactions. 

Special Considerations

It is important to acknowledge that in some countries, cryptocurrencies aren’t classified as property. This, however, doesn’t mean that they aren’t taxed. On the contrary, they are subjected to a different type of taxation policies. Let’s take a quick look at how various countries approach digital assets: 

  • The European Union 

A few years ago, the European Court of Justice ruled that Bitcoin can be exchanged without VAT in the European Union. Although this judgment doesn’t mean Bitcoin is recognized as a legal tender in any of the EU countries, it places Bitcoin on a level playing field with other traditional currencies.

While the VAT exemption applies to all countries in the European Union, cryptocurrency transactions are still subject to other forms of taxes, such as capital gains. For instance, in France, crypto-to-crypto transactions aren’t taxed, but when exchanged for fiat currency, the income tax law applies. Also, if a cryptocurrency is used to acquire an asset or service, VAT is applied. 

  • The United Kingdom 

In the UK, the law isn’t quite clear about cryptocurrency taxation. One thing is certain, though, all virtual currencies are treated as foreign currencies, and as such, they’re subject to tax gains and losses. The UK tax authority, Her Majesty’s Revenue, and Customs states that each crypto transaction will be judged based on its own individual facts and circumstances. So, users may be subjected to a variety of tax policies depending on how they use the crypto. 

What to Consider When Planning Your Cryptocurrency Taxes 

As far as crypto taxation is concerned, there are several measures you can take if you hope to remain on the good side of the law. These include:

  • Make use of Tax Tools 

Maintaining cryptocurrency tax compliance requires accurate record-keeping of all transactions. This may not be a big deal to casual traders and investors who engage in minimal crypto transactions. But, for active cryptocurrency traders and miners, it makes sense to invest in software programs to help you track and record the numerous transactions. Some of these tools can calculate your tax liabilities, prepare, and even file your tax returns. 

  • Donate Your Cryptos 

Donating a percentage of your crypto investment reduces your tax liability. Once you have donated your digital assets, the charitable fund sells them to an exchange for fiat cash. Consequently, you enjoy tax relief in that particular year of donation. 

  • Be Mindful of the Holding Period 

Short term gains taxes apply when you hold your cryptocurrency investment for less than a year, while long term gains taxes apply when you hold your investment for more than a year. Depending on your investment goals, these two periods can work for or against you.

Cashing out your cryptos too soon subjects you to frequent short term gain taxes that may eat into your profits. At the same time, holding your investments for too long results in accumulation of long term gain taxes, which might also take a massive chunk off your returns. 

Ideally, you should aim to strike a balance between holding for the short term and the long term. If the earned returns are enough to cover the taxes, then you may consider cashing out. If the returns aren’t enough, then consider holding your investments for a bit longer. 

  • Record Your Loss Too

Just like any other investment, the crypto market doesn’t always offer high returns all-year-round. Luckily, tax authorities are aware of this fact, which is why they allow investors to file tax losses to offset gains. So, be sure to record any losses incurred as a result of market trends.

Conclusion

Cryptocurrency taxation is a rather intricate affair given that the regulatory framework governing the taxation process differs significantly depending on the jurisdiction. As such, consulting a cryptocurrency tax advisor when planning for your taxation is highly recommended. It’s also a good idea to keep tabs on the taxation authority to stay updated on any change of policies or new rules. 

Categories
Crypto Market Analysis

Daily Crypto Review, Jun 09 – Bitcoin Gaining 700% Soon? Analyst Estimates BTC At $75,000

The crypto market has spent the day mostly with low volatility, except for the past few hours when the price bounced up and down quickly before returning to its original values.  Bitcoin is currently trading for $9,700, which represents a decrease of 0.56% on the day. Meanwhile, Ethereum lost 0.04% on the day, while XRP gained 0.16%.

Kyber Network took the position of today’s biggest daily gainer, with gains of 9.7%. Divi lost 23.7% of its daily value, making it the most prominent daily loser.

Bitcoin’s dominance increased slightly since we last reported, with its value currently at 66.12%. This value represents a 0.87% difference to the upside when compared to yesterday’s value.

The cryptocurrency market capitalization decreased slightly over the weekend, with the market’s current value being $276.08 billion. This value represents a decrease of $0.24 billion when compared to the value it had yesterday.

What happened in the past 24 hours

Bitcoin soon at $75,000?

Bitcoin analysis from Timothy Peterson (Cane Island Alternative Advisor) shows a strong possibility of BTC going to $75,000. The analysis is based on finding an uncanny similarity to Bitcoin’s chart movement in 2013. Peterson called this similarity “almost perfect.”

Peterson tracked Bitcoin’s price recovery from its 3,600 lows from mid-March, which (as he noted) looks almost exactly like the price action from seven years ago. If the price action from seven years ago can be translated into the future, Bitcoin should move 700% to the upside, giving it a price of around $75,000.

_______________________________________________________________________

Technical analysis

_______________________________________________________________________

Bitcoin

The largest cryptocurrency by market capitalization has spent the day mostly without any large price fluctuations. The market has been slow except for one single candle which tried to break both the upside and downside key levels but failing to do either completely.


Bitcoin’s volume is on the same levels as over the past week, while its RSI level fell to 50. The key level of $9,735 will be moved to the “upside” once the break is confirmed.

Key levels to the upside                    Key levels to the downside

1: $9,870                                           1: $9,735

2: $10,010                                         2: $9,580

                                                           3: $9,250

Ethereum

Ethereum had quite a slow day as well, with its price making a move only in a recent couple of candles. While one candle was strictly bullish, the other one had large wicks to both the upside and downside. The 21-period moving average seems to be holding the price quite well.


Ethereum’s volume increased in the past few candles, while its RSI level came down to 54.

Key levels to the upside                    Key levels to the downside

1: $251.4                                            1: $240

2: $260                                              2: $225.4

                                                           3: $217.6

Ripple

XRP made a move towards the upside and spent the whole day trying to break the $0.205 resistance level. However, the move was unsuccessful, triggering a severe drop, which even broke the $0.2 support level for a few minutes. However, the bulls came back almost instantly and picked up where they left off, threatening the $0.205 resistance level once again.


A break above $0.205 with an increase in volume (or a confirmation of breaking $0.205) could be a good trading opportunity for scalp traders.

Key levels to the upside                    Key levels to the downside

1: $0.205                                           1: $0.2

2: $0.214                                           2: $0.19

 3: $0.227                                                        


Categories
Crypto Videos

Regulators vs Bitcoin! The Only Thing Standing In Bitcoin’s Way


Regulators vs. Bitcoin (double standard?)

Bitcoin exchange-traded funds have faced unfair pushback from US regulators, said director and digital asset specialist of VanEck, Gabor Gurbacs.
He claims that there’s a constant double standard against Bitcoin and other digital assets.

SEC Bitcoin ETF denials 

Law or auction gavel and bitcoins on a wooden desk, dark background

A Bitcoin ETF is a financial product that is officially traded on mainstream stock markets. The ETF shares are representing exposure to Bitcoin’s price, and they can be cash-backed or BTC-backed. Trading via ETFs basically allows for Bitcoin exposure through traditional market methods and brokers.
The US Securities and Exchange Commission has denied a massive number of Bitcoin ETFs over the past couple of years. VanEck submitted one of the most notable Bitcoin ETF proposals that ultimately got denied by the SEC after facing many delays.
For the Bitcoin ETF to be approved, regulators say that they need proof that Bitcoin has true price action and not action through market manipulation. However, when comparing Bitcoin’s situation to another available traditional market ETFs, the argument about true price action just doesn’t hold water.

Gurbacs defends Bitcoin price action

Bitcoin holds relatively efficient price discovery, which is even better than certain commodities already on the market, said Gurbacs. He also noted that he revealed proof of such data to the regulators. VanEck, together with its daughter company called MV Index Solutions, developed regulated indices in hopes of appealing to regulators.
Gurbacs added that, while he sees improvement in understanding this technology from the regulators, they have not come around yet. We have seen Wilshire Phoenix facing one of the most recent Bitcoin ETF denials from the regulators in February 2020.

Categories
Crypto Videos

China Embracing Blockchain & New Technology!

China Embracing Blockchain – A City Launching Blockchain-Powered Notary Program

The city of Suzhou wants to implement a program that would use real-time notarial tracing functions, and that would be powered by blockchain. This pilot program would, as reported in the local news, provide a wide range of notary services in the city of Suzhou, China.
The authorities of Suzhou announced that this program will hopefully help millions of citizens with accessing legal and government offices via the internet. The announcement was made on June 5.
The pilot platform will cover personal freedom, health, life, property rights, and more.

All of the materials will be uploaded and available through the cloud. Both audio and video records will be distributed and shared among notaries involved for legal purposes, therefore facilitating the use of real-time tracing functions.
This network will be called “Suzhou Notary Chain,” and it will allow the administrative law enforcement unit to use this system for online notarization as well as for carrying out the entire process through shared files stationed on the cloud platform.
Unlike the highly-conventional method of storing audio and video files only within a law enforcement database, this blockchain-based notary services platform will be used to process everything from recording to distribution. in theory. This should guarantee “easy data storage, non-tampering, high security, as well as traceability.”

China’s blockchain adoption

China continues to take bold steps towards blockchain technology adoption. It is slowly starting to implement related systems within different sectors of the economy, making it one of the leading countries in the sector. However, China’s stance on cryptocurrency is still not as open as people would like.

Categories
Cryptocurrencies

Decentralized Vs. Centralized Exchanges: Which One Should You Trust?

What comes to your mind when you hear the word cryptocurrency? 

Probably it’s the distributed and consensus ledger technology that forms the basis of the whole crypto universe. 

As such, it would seem counter-intuitive if other solutions built around this ledger technology end up diluting its decentralized aspect. Yet, the ratio of centralized exchanges’ trading volume to that of decentralized exchanges suggests that traders prefer the former to the latter. 

Well, there are many halftones between the two concepts – decentralized and centralized – with an arguable belief that not everything is always black and white. Besides, if the power of decentralization was to transverse all aspects of our everyday life, wouldn’t it send us into disarray? So, the real question here should be, to what extent should an exchange be decentralized? 

Decentralized Exchanges Explained 

Much like cryptocurrencies, decentralized crypto exchanges (DEXs), seek to create a trustless environment where buyers and sellers can transact freely. Instead of using matching buy and sell orders in a central book, DEXs utilize smart contracts to link traders directly to each other, eliminating the need for a third-party. In this way, these types of exchanges don’t hold users’ assets or any other personal data. They only serve as a matching and routing layer for trade orders. 

Decentralised_Forex Academy

Generally, there are two types of decentralized crypto exchanges: currency-centric and currency-neutral. Currency-centric exchanges are tied down to one specific blockchain network escrowing its native currency, e.g., Ethereum, Waves, Tron, and any other blockchain that has smart contract capabilities. Currency-neutral exchanges, on the other hand, tend to be more versatile. This means that they can be built on various blockchain networks and are therefore not tied to one specific digital coin ecosystem. 

How Decentralized Exchanges Work

Regardless of their differences, all decentralized exchanges work pretty much the same way. A client brings their funds like ETH, which are stored in the exchange’s network in the form of proxy tokens, in this case, DEX-ETH. Ideally, these tokens serve as collateral for the actual coins stored by the exchange. 

To execute a trade, the client sends an order to sell their tokens in exchange for, say DEX-BTC tokens, which also represent the actual BTC owned by the other party. The smart contract then matches and processes the orders, after which the proxy tokens are exchanged between the two parties. The seller gets the DEX-BTC while the buyer receives the DEX-ETH tokens. After receiving tokens, both parties can convert them to the actual currency, ETH and BTC, using the same trading channel or a different one.

Advantages and disadvantages of Decentralized Exchanges 

Given their architecture, one of the biggest advantages that rises to the forefront is security. The exchanges don’t hold customers’ funds in a central reserve and are thus not vulnerable to hacks or theft. At the same time, decentralized exchanges don’t require a user’s personal information, which also goes a long way in improving security and anonymity in line with the purpose of crypto.

A DEX eliminates the need for a middleman between traders, helping reduce the trading fees. Additionally, traders who like keeping up with crypto market trends, you might consider using decentralized exchanges. This is especially true if you invest in an Initial Coin Offering (ICO). Often, ICOs find their way into DEXs prior to centralized exchanges. 

Despite their numerous advantages, decentralized exchanges have their shortcomings. To start with, they require a higher degree of technical know-how to use efficiently. They also lack essential trading features, which makes them intimidating to new crypto traders. 

Due to the small number of users on DEXs, they have a relatively low trading volume. This translates to limited liquidity in addition to difficulties in finding a matching order since there’s a limited number of traders on the platform.

Decentralized exchanges also suffer from slow transactions. The slow speed of transactions may not be a big deal to small-scale traders, but it can be detrimental to trading giants with high-volume transactions. 

Also, by their very nature, DEXs have no physical location or proof of existence. Therefore it would be difficult to launch a complaint should an issue arise. 

Centralized Exchanges Explained 

Unlike their counterparts, centralized exchanges, also known as CEXs, function similarly to traditional stock exchanges. Essentially, they act as a middle-party between crypto traders and, in exchange, collect a small fee on every successful trade. 

Centralised_orex Academy

These exchanges are structured in such a way that they own their users’ private keys (or wallets), meaning that all transactions have to be executed in the mechanisms laid out by the central authority. Their having access to users’ wallets is a double-edged sword.

First, in case of a lost password, a user can easily recover their funds by simply contacting the exchange’s support team. At the same time, centralized exchanges are prone to hacks and thefts since they store client funds in a centralized database. But even with this downside, CEXs continue to attract a higher number of users than decentralized exchanges. 

Such popularity can be attributed to the seamless fiat to cryptocurrency trades carried out on the centralized exchanges. As such, it is easier for a new crypto trader to enter the market. Moreover, centralized exchanges boast of useful trading features like the stop losses, margin trading, and lending, which are not available on decentralized exchanges. 

Thanks to their high number of users, centralized exchanges have higher liquidity than DEXs. The liquidity is further enhanced by the fact that most CEXs accept fiat currencies and can even be linked to debit cards or bank accounts. 

To Centralize or Not to Centralize? 

Currently, centralized exchanges control the lion’s share of the global cryptocurrency trading volume. Although they deserve it due to the convenience they offer, they have watered down the idea of decentralization in the blockchain and crypto industry. Perhaps as decentralized exchanges continue to grow, there will be a major shift to these platforms since they maintain users’ privacy and security, which is becoming increasingly important as more centralized exchanges fall victim to hacks. 

Categories
Crypto Market Analysis

Daily Crypto Review, Jun 08 – Cryptos Preparing For The Next Move – What To Expect?

The crypto market has spent this weekend mostly with low volatility and one Bitcoin’s sudden price spike, which triggered the market for a short while.  Bitcoin is currently trading for $9,755, which represents an increase of 0.59% on the day. Meanwhile, Ethereum gained 0.42% on the day, while XRP lost 0.7%.

Loopring took the position of today’s biggest daily gainer, with gains of 21.23%. IOST lost 3.13% of its daily value, making it the most prominent daily loser.

Bitcoin’s dominance increased slightly since we last reported, with its value currently at 65.25%. This value represents a 0.11% difference to the upside when compared to Friday’s value.

The cryptocurrency market capitalization decreased slightly over the weekend, with the market’s current value being $276.32 billion. This value represents an increase of $1.33 billion when compared to the value it had on Friday.

What happened in the past 24 hours

Another ransomware attack targeting the aerospace industry

ST Engineering Aerospace’s subsidiary (located in the US) suffered a ransomware attack that extracted somewhere around 1.5TB of sensitive data from their database. This Singapore-based company was, as the report says, attacked by the well-known ransomware organization called Maze.

The report shows that the data stolen by these criminals is related to many things, including contract details with various governments, organizations, as well as airlines across the globe.

_______________________________________________________________________

Technical analysis

_______________________________________________________________________

Bitcoin

The largest cryptocurrency by market capitalization has spent the weekend without much turbulence. The price was on a slow downward-facing path, testing and slowly breaking narrow ranges until bulls seem to have had enough. The price then jumped up from $9,350 to $9,820 before coming back to the levels it is at at the moment. The $9,735 level is currently being tested.


Bitcoin’s volume was decreasing gradually throughout the weekend until the most recent rise, which caused the price to go up.

Key levels to the upside                    Key levels to the downside

1: $9,870                                           1: $9,735

2: $10,010                                         2: $9,580

                                                           3: $9,250

Ethereum

Ethereum’s chart looks similar to Bitcoin’s chart, though the moves to both the upside and downside aren’t as pronounced. The second-largest cryptocurrency by market cap gradually decreased in price until the bulls stepped in and brought the price from $235 to $245. The bottom of this descending mini-trend was seemingly the 50-period moving average.


Ethereum’s volume increased during the upswing but quickly returned to its usual (low) levels.

Key levels to the upside                    Key levels to the downside

1: $251.4                                            1: $240

2: $260                                              2: $225.4

                                                           3: $217.6

Ripple

XRP has spent the weekend trading within a narrow range, bound by $0.2 support and $0.205 resistance level. Both of these levels got tested, but none showed any definitive signs of breaking. XRP’s future price direction will most likely be determined by Bitcoin’s next move.


Key levels to the upside                    Key levels to the downside

1: $0.205                                           1: $0.2

2: $0.214                                           2: $0.19

 3: $0.227