
The cryptocurrency market has had a somewhat turbulent weekend. Most cryptocurrencies’ prices tumbled on Jan 27 as Bitcoin led the move to the downside but quickly started gaining bullish momentum and recovered over the rest of the weekend. Bitcoin is currently trading for $9,103, which represents an increase of 1.64% on the day. Meanwhile, Ethereum gained 2.82% on the day, while XRP gained 1.11%.

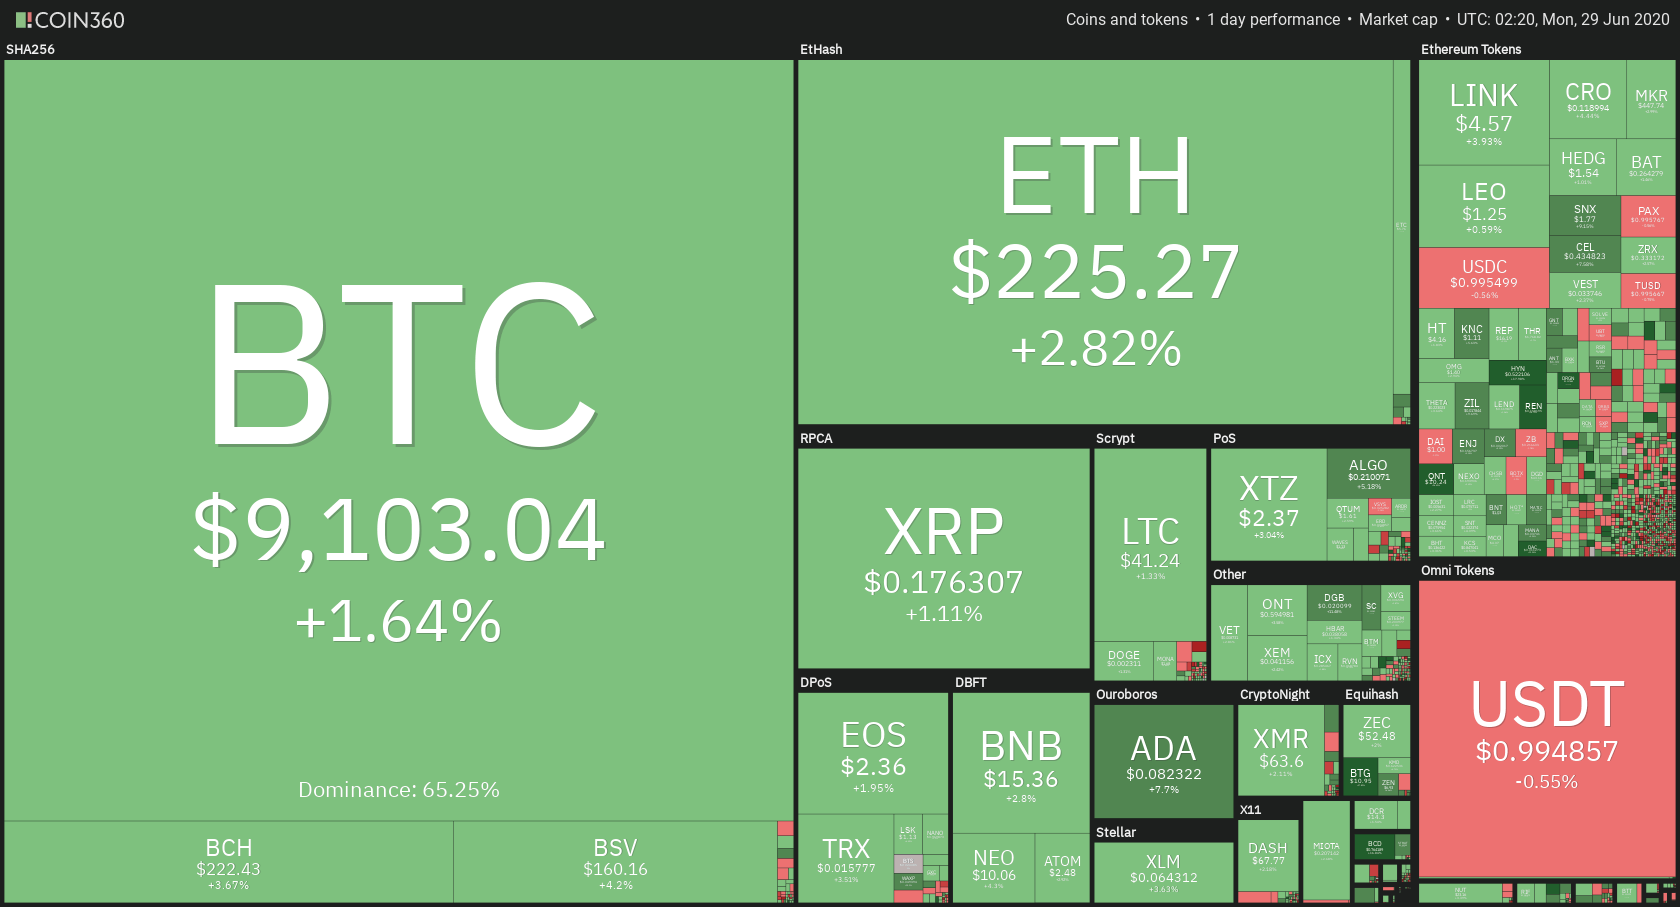
Daily Crypto Sector Heat Map
When talking about top100 cryptocurrencies, Bitcoin Gold gained an astonishing 30.57 on the day, making it by far the most prominent daily gainer. Celsius (13.56%) and NULS (13.27%) also did great. On the other hand, Flexacoin has continued extremely bad performance, and is the worst daily performer once again, with a daily loss of 22.66%. It is followed by SwissBorg’s loss of 4.08% and BAT’s loss of 3.72%.
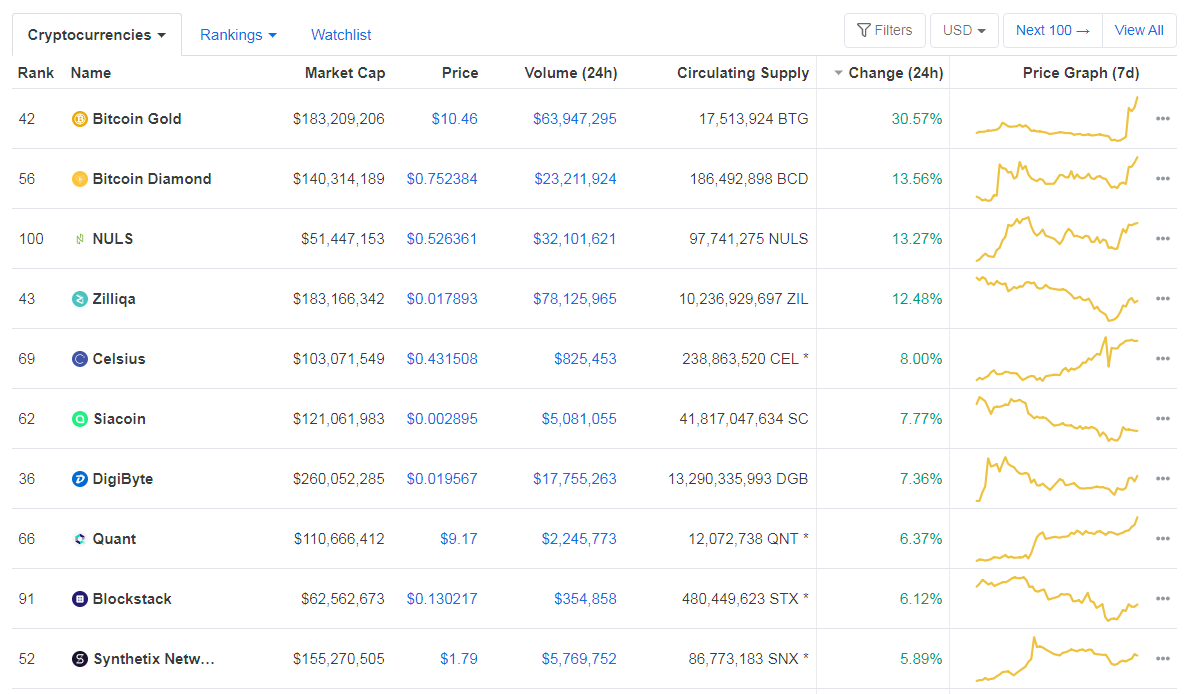
Top 10 24-hour Performers (Click to enlarge)
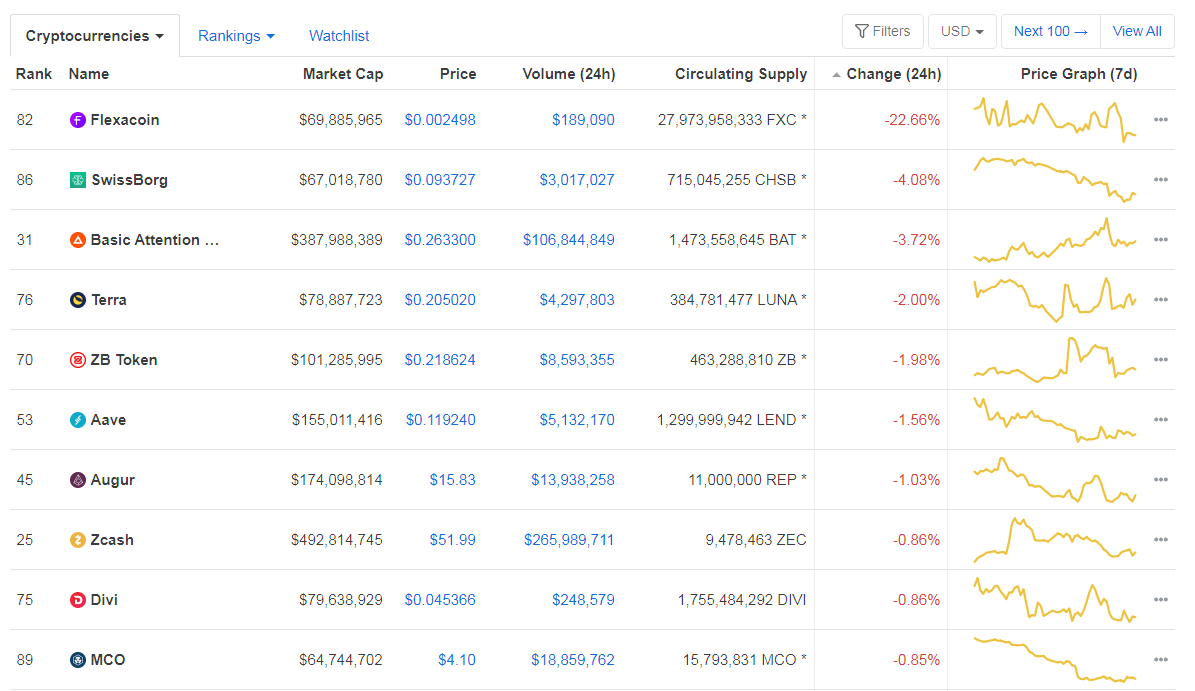
Bottom 10 24-hour Performers (Click to enlarge)
Bitcoin’s dominance level increased slightly since we last reported, with its value currently at 65.25%. This value represents a 0.22% difference to the upside when compared to Friday’s value.
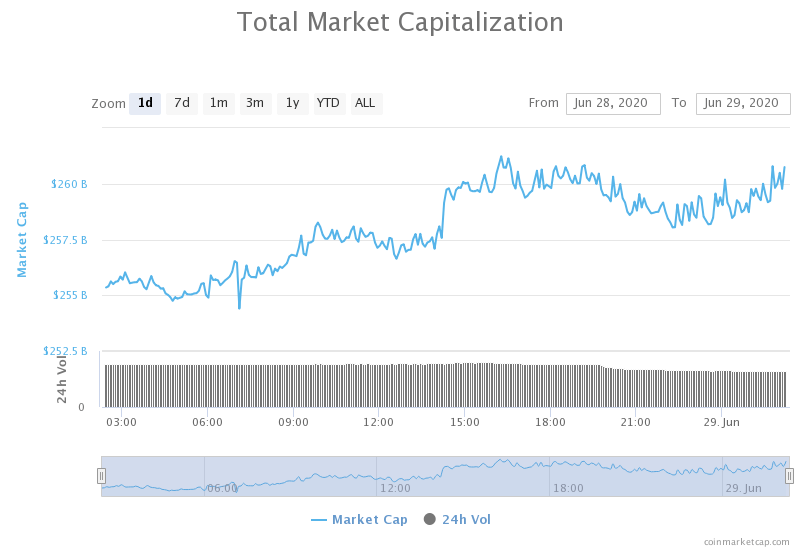
Daily Crypto Market Cap Chart
The cryptocurrency market capitalization stayed at exactly the same place when compared to Friday, with the market’s current value being $259.88 billion. This value represents an increase of $1.52 billion when compared to the value it had on Friday.
_______________________________________________________________________
What happened in the past 24 hours?
_______________________________________________________________________
- Whales might be dumping Bitcoin on Grayscale, and a fund manager calls it “very bearish” (Cryptoslate)
- Crypto Cards Affected as U.K. Regulator Suspends Wirecard Subsidiary (Cointelegraph)
- Wright Decision & Paypal Allowing Crypto: Bad Crypto News of the Week (Cointelegraph)
- LocalBitcoins Says Its Transactions From Darknet Markets Dropped 70% (Cointelegraph)
- ‘Blockchain’ and ‘cryptocurrency’ dominate active trademarks in U.S. government database (The Block)
- Vanguard’s Blockchain Platform for Foreign Exchange Will Go Live in Q3 2020 (Coindesk)
- Top Cryptocurrencies Face Trouble as PlusToken Dumps on the Market (Cryptobriefing)
- BitMEX Launching Services for Corporate Customers (Cointelegraph)
- Ripple co-founder: America is “ceding control” to China by regulating only Bitcoin and Ethereum (Cointelegraph)
- At This Rate Grayscale Will Own 3.4% of All Bitcoin by January (Cointelegraph)
_______________________________________________________________________
Technical analysis
_______________________________________________________________________
Bitcoin
The largest cryptocurrency by market capitalization had quite a volatile weekend. It dropped heavily in price on Saturday as a response to the PlusToken Ponzi scheme sell-off. The price reached a low of $8,820 before bouncing back. Bitcoin bulls managed to bring the price back above $9,000 and further until the price has collided with the 4-hour 21-period moving average.
Traders should closely pay attention to how well Bitcoin reacts to immediate support and resistance levels, as well as to the 21-period and 50-period moving averages when recovering from bearish moves or consolidating after bullish moves.
BTC/USD 4-hour Chart
Technical factors:
- Bitcoin is creating lower lows
- Price is below its 21 and 50-period EMA
- Price at the Middle B.B. (20period SMA)
- RSI near the middle point (47)
- Below-average Volume
Key levels to the upside Key levels to the downside
1: $9,251 1: $9,120
2: $9,580 2: $8,980
3: $9,735 3: $8,820
Ethereum
Ethereum followed Bitcoin’s initiative throughout the weekend and mirrored its moves (with more or less strength). The price drop on Saturday brought the price to the $217.7 support level before slowly returning to its previous levels before the price drop. Ethereum is now fighting for the $225.4 level, which it is currently above.
As mentioned in our previous articles, Ethereum doesn’t have much initiative at the moment except for following Bitcoin’s moves. Traders can use that to either trade within a range while Bitcoin isn’t moving or to trade ETH with the trend as it is (on average) making larger moves in the same direction than Bitcoin.
ETH/USD 4-hour Chart
Technical Factors:
- Price gain stopped by the 21 and 50-period EMA
- Price right below the Middle B.B. (20-period SMA)
- RSI near the middle point (46)
- Average (low) Volume
Key levels to the upside Key levels to the downside
1: $228 1: $225.4
2: $240 2: $217.7
3: $251.4 3: $198
Ripple
The third-largest cryptocurrency by market cap followed Bitcoin all throughout the weekend (in both its move to the downside and upside) but also followed its descending path. XRP fell right to the descending trend line, which held up nicely and triggered a price bounce. This line has proven itself as strong support. However, XRP fell below the $0.178 in the process, and the price bounce couldn’t bring it back above it.
There aren’t many XRP trading opportunities, but most of them are completely straightforward as they are always happening with sharp increases in Volume.
XRP/USD 4-hour Chart
Technical factors:
- XRP in a mid-term descending trend
- XRP lacks strong support levels below $0.178
- The upside is guarded by the 21 and 50-period EMA
- Price slightly below the Middle B.B. (20 SMA)
- RSI is below the middle point (43)
- Average Volume
Key levels to the upside Key levels to the downside
1: $0.178 1: $0.147
2: $0.19
3: $0.2
Related posts
 Daily Crypto Review, Sept 10 – Ethereum Double-Digit Gains; Crypto – S&P500 Correlation nears All-Time-Highs
 Daily Crypto Review, Oct 1 – Bitcoin Fighting for $10,850; Ethereum Bulls Rallying Against All Odds
 Daily Crypto Review, Oct 8 – DeFi Bubble Popped: Token Prices Shatter on Low Trading Volumes
 Daily Crypto Review, Nov 2 – Ethereum’s Price Explodes; Bitcoin’s Whitepaper Celebrates its 12th Birthday