
The cryptocurrency market has had a slow day, with most cryptos seeking consolidation. Bitcoin is currently trading for $9,144, which represents an increase of 0.13% on the day. Meanwhile, Ethereum lost 0.76% on the day, while XRP lost 0.86%.

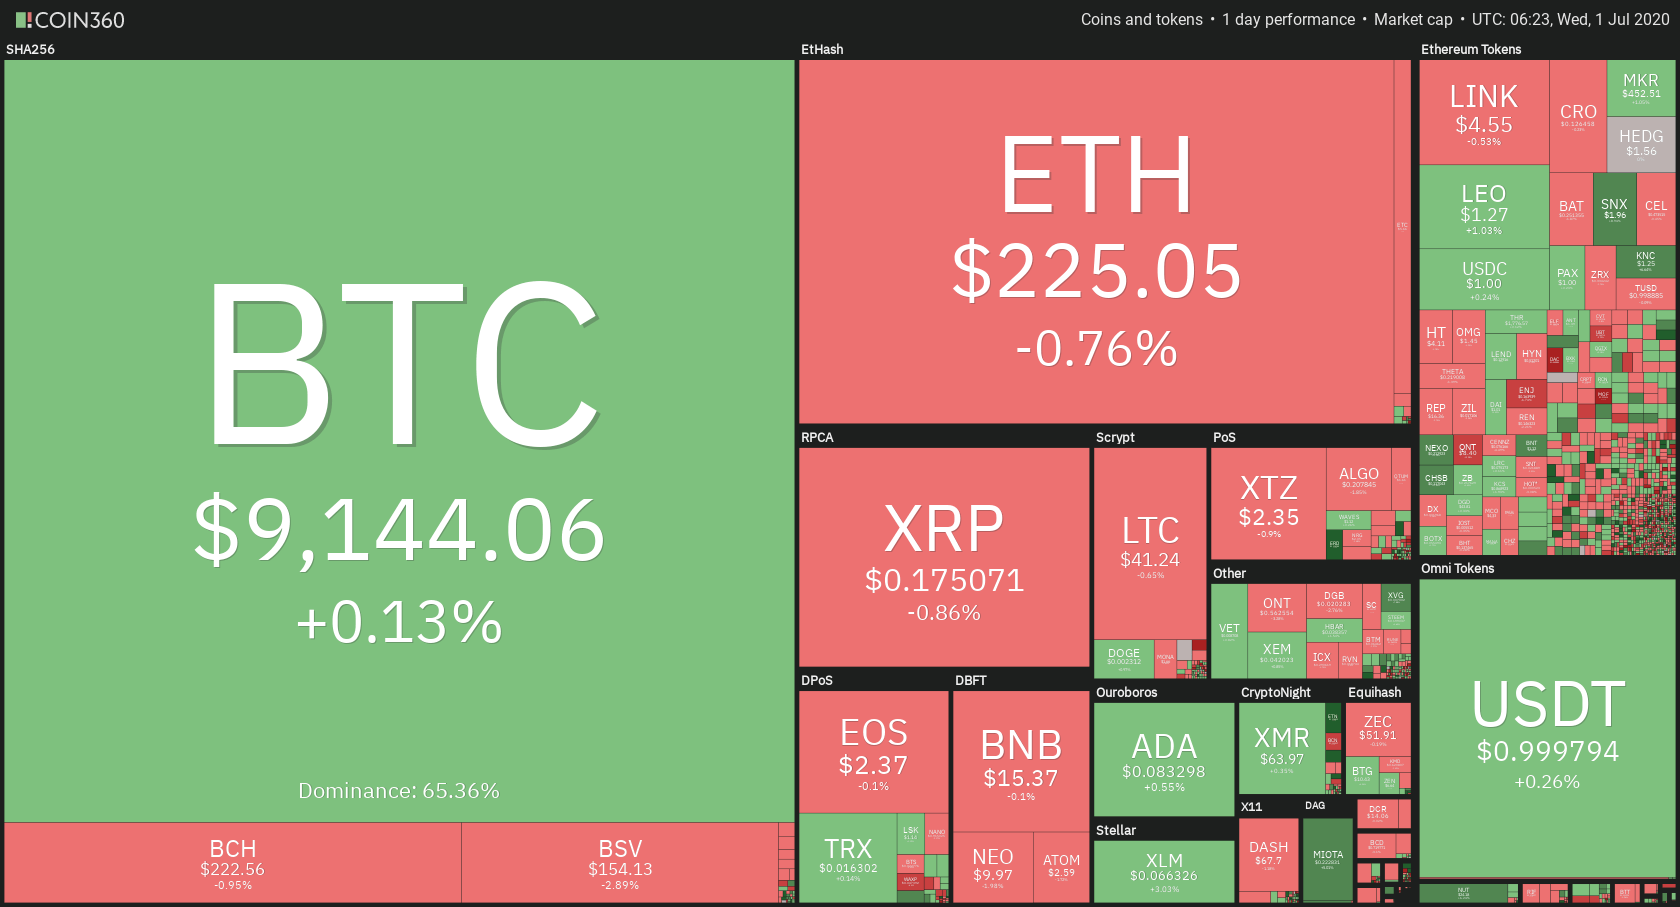
Daily Crypto Sector Heat Map
When talking about top100 cryptocurrencies, Electroneum gained 16.39% on the day, making it by far the most prominent daily gainer. Elrond (15.22%) and SwissBorg (10.43%) also did great. On the other hand, Flexacoin has lost 16.03%, making it the most prominent daily loser. It is followed by Quant’s loss of 8.69% and Compound’s loss of 7.84%.

Top 10 24-hour Performers (Click to enlarge)
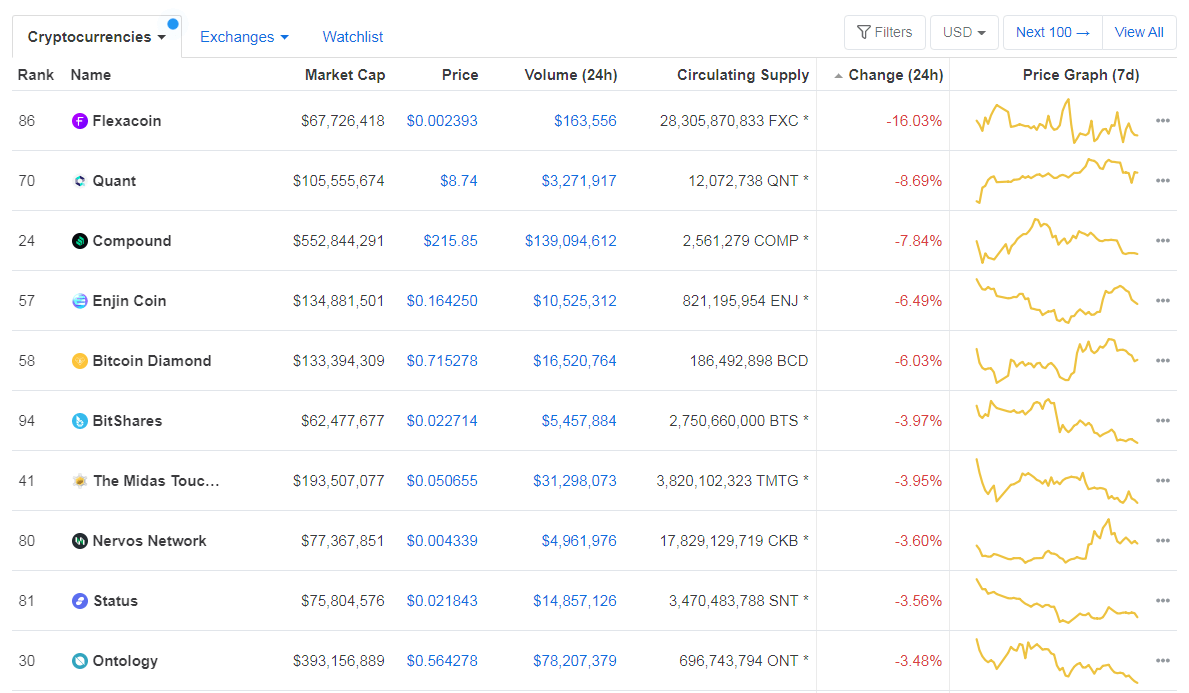
Bottom 10 24-hour Performers (Click to enlarge)
Bitcoin’s dominance level decreased slightly since we last reported, with its value currently at 65.36%. This value represents a 0.04% difference to the downside when compared to yesterday’s value.
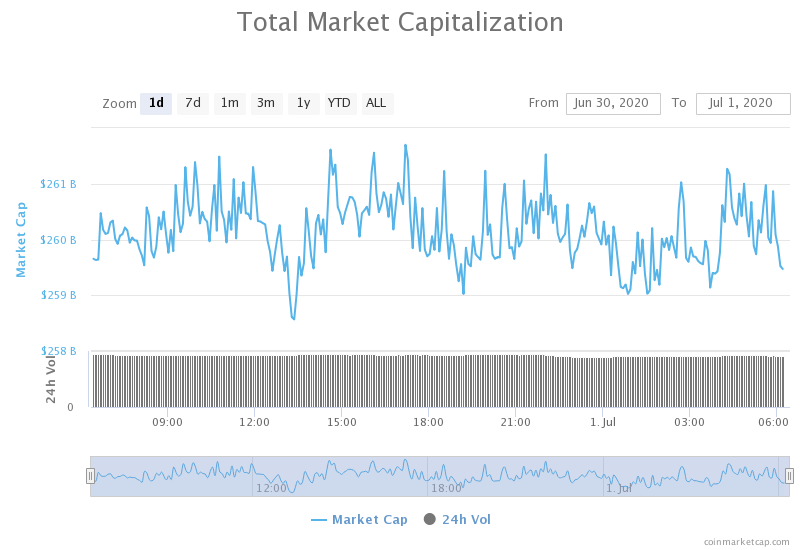
Daily Crypto Market Cap Chart
The cryptocurrency market capitalization stayed at almost precisely the same place when compared to yesterday, with the market’s current value being $259.48 billion. This value represents a decrease of $1.76 billion when compared to the value it had yesterday.
_______________________________________________________________________
What happened in the past 24 hours?
_______________________________________________________________________
- Bank of America is treating Bitcoin, Ether as “cash,” will let you purchase crypto with credit cards (Cryptoslate)
- CFTC guidance on digital asset’ delivery’ went into effect last week — here’s why it matters (The Block)
- Grayscale Bitcoin Trust Is Screwing Retail (and Institutions) on Fees (Cryptobriefing)
- Blockstream Bug Opened Liquid Network to $16 Million Bitcoin Theft (Cryptobriefing)
- An estimated 1.9 million U.K. residents hold digital assets, according to FCA study (The Block)
- Ethereum Developers Delay Berlin Hard Fork to Stem Client Centralization Concerns (Coindesk)
- The number of crypto whales is rising. Here’s where they’re coming from (Cryptoslate)
- Nvidia Files Motion to Dismiss $1B Class Action Over Crypto GPU Sales (Cointelegraph)
- Survey Shows 42% of Investors Expect a $15K Bitcoin Price in 2020 (Cointelegraph)
- ETH Scalability Isn’t Going to Be an Issue Soon, Suggests Vitalik Buterin (Cointelegraph)
_______________________________________________________________________
Technical analysis
_______________________________________________________________________
Bitcoin
The largest cryptocurrency by market capitalization took another day to find a place at which to consolidate. Low Volume and low volatility gave us a day with seemingly no movement, but the lack of action is more likely produced by the support and resistance levels rather than the absence of Volume. Bitcoin is trading in an extremely tight range, bound by the 50-period moving average to the upside and $9,120 to the downside.
Trading in such a narrow range is impossible for more extended periods, so traders should be aware of any volume increases accompanied by one of these levels being broken.
BTC/USD 4-hour Chart
Technical factors:
- Price is below its 50-period EMA and above its 21-period EMA
- Price above the Middle B.B. (20period SMA)
- RSI near the middle point (48)
- Average Volume
Key levels to the upside Key levels to the downside
1: $9,251 1: $9,120
2: $9,580 2: $8,980
3: $9,735 3: $8,820
Ethereum
The second-largest cryptocurrency by market capitalization retreated to the support level of $225.4 over the course of the day. While the Volume is extremely low, bears seem to be in slight control over Ethereum, which is why the immediate support level is continuously being tested.
Ethereum traders should position their next trade based on the break confirmation (to the upside or downside) of the $225.4 level.
ETH/USD 4-hour Chart
Technical Factors:
- Price below the 50-period EMA and the 21-period EMA
- Price right above Middle B.B. (20-period SMA)
- RSI near the middle point (46)
- Extremely low Volume
Key levels to the upside Key levels to the downside
1: $228 1: $225.4
2: $240 2: $217.7
3: $251.4 3: $198
Ripple
The third-largest cryptocurrency by market cap is continuing its path towards the downside by following the descending trend line. After failing to regain its position above the $0.178 level, XRP started dropping in price. The price drop was (for now) stopped by the lower Bollinger band. However, any move towards the upside will not only have to tackle the $0.178 level, but the 21-period and 50-period moving averages as well.
There aren’t many XRP trading opportunities at the moment, but most of them are completely straightforward, as they are always accompanied by sharp increases in Volume.
XRP/USD 4-hour Chart
Technical factors:
- XRP in a mid-term descending trend
- XRP lacks strong support levels below $0.178
- The upside is guarded by the 21 and 50-period EMA
- Price in a narrow range between the Middle B.B. (20 SMA) and Lower B.B.
- RSI is below the middle point (39)
- Lower than average Volume
Key levels to the upside Key levels to the downside
1: $0.178 1: $0.147
2: $0.19
3: $0.2
Related posts
 Daily Crypto Review, Apr 10 – Canada launching a BTC fund; Cryptos retesting support levels
 Daily Crypto Review, Apr 24 – Bitcoin transaction fees jumping up by 50% in the past 24 hours; Cryptos making new gains
 Daily Crypto Review, May 1 – XRP supported by the first Crypto Bank; Crypto market consolidating after a sharp move up
 Daily Crypto Review, May 4 – Bitcoin Hash Rate reached All-Time Highs before the Halving