
The cryptocurrency market has gone through the day trying to make moves to the upside, but mostly ending up in the red. Bitcoin is currently trading for $9,102, which represents a decrease of 1.2% on the day. Meanwhile, Ethereum lost 0.78% on the day, while XRP lost 0.05%.
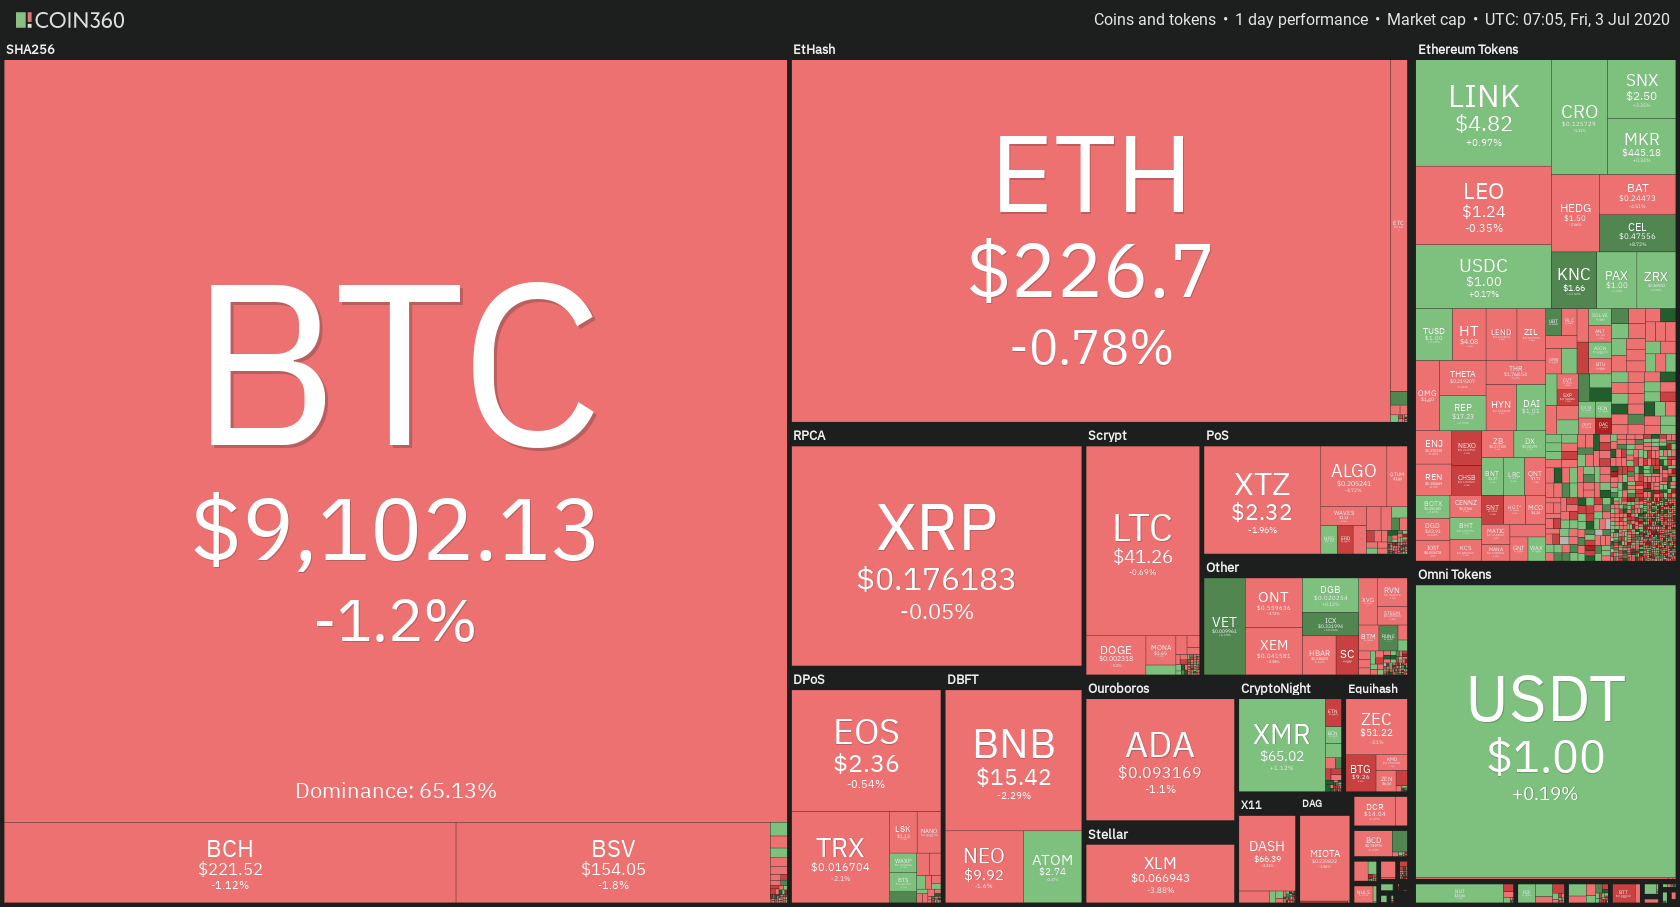
Daily Crypto Sector Heat Map
When talking about top100 cryptocurrencies, Kyber Network gained 13.60% on the day, making it by far the most prominent daily gainer. ICON (10.43%) and VeChain (6.68%) also did great. On the other hand, The Midas Touch has lost 11.52%, making it the most prominent daily loser. It is followed by Bitcoin Gold’s loss of 7.81% and Compound’s loss of 6.81%.

Top 10 24-hour Performers (Click to enlarge)
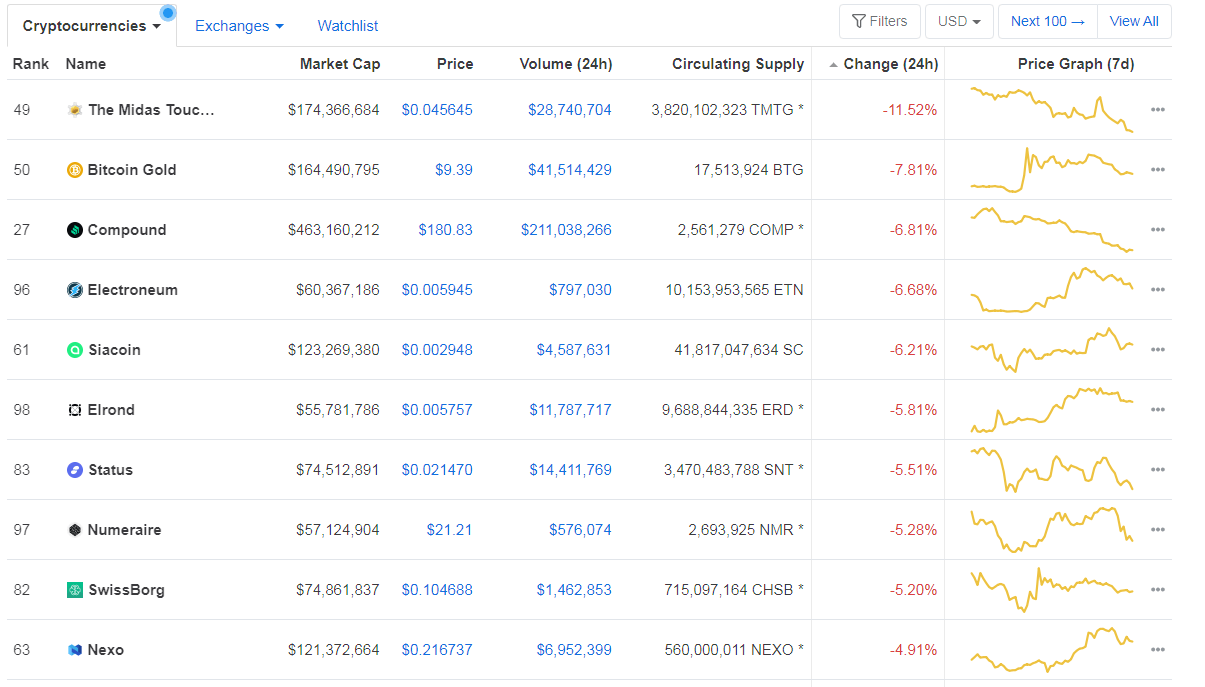
Bottom 10 24-hour Performers (Click to enlarge)
Bitcoin’s dominance level decreased slightly since we last reported, with its value currently at 65.13%. This value represents a 0.17% difference to the downside when compared to yesterday’s value.
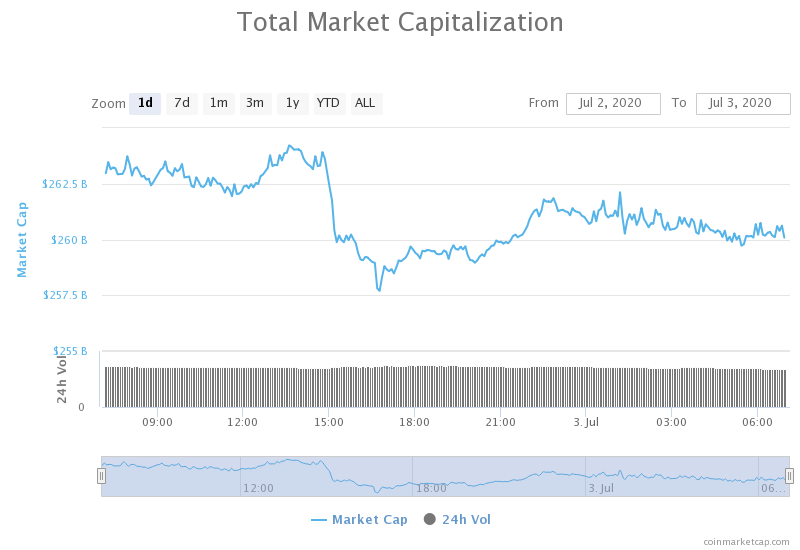
Daily Crypto Market Cap Chart
The cryptocurrency market capitalization decreased slightly when compared to yesterday, with the market’s current value being $260.59 billion. This value represents a decrease of $2 billion when compared to the value it had yesterday.
_______________________________________________________________________
What happened in the past 24 hours?
_______________________________________________________________________
- IRS Wants to Track ‘Nefarious’ Privacy Coin and Lightning Transactions (Cointelegraph)
- The Wirecard saga, what comes next and what it means for the crypto space (The Block)
- Authorities Take Down Biggest Criminal Chat Network Yet (Cointelegraph)
- Bank of Japan Will Begin Experimenting With a Digital Yen (Cointelegraph)
- Bitcoin Miners Saw 23% Revenue Drop in June (Coindesk)
- Bitcoin Wallets were Letting People Get Scammed with Faulty Balances (Cryptobriefing)
- Ripple Is Becoming a Dumping Ground for Bitcoin Spam Transactions (Cryptobriefing)
- Six projects score blockchain innovation prizes in European Commission-funded program (The Block)
- Amazon CEO Bezos Now Has More Money Than Bitcoin’s Market Cap (Cointelegraph)
- Tech Entrepreneur Offers Bitcoin Bounty in Campaign Against Vox (Cointelegraph)
_______________________________________________________________________
Technical analysis
_______________________________________________________________________
Bitcoin
The largest cryptocurrency by market capitalization has spent the past day struggling to keep its current level after failing to break $9,251. As the volume increased greatly, Bitcoin managed to approach $9,251 and contest it, but only for a short period of time before falling all the way to $8,935. Its price is now stabilizing at around $9,050.
As we said in our yesterday’s article, traders should be wary of trading Bitcoin just based on its momentum as you never without confirmation. They should rather watch for confirmations or pullbacks and trade those (and those that did had a great trade yesterday).
BTC/USD 4-hour Chart
Technical factors:
- Price is below its 50-period EMA and its 21-period EMA
- Price is between the Lower B.B and the Middle B.B. (20period SMA)
- RSI below the middle point (44.4)
- Increased Volume (Coming back to normal)
Key levels to the upside Key levels to the downside
1: $9,251 1: $9,120
2: $9,580 2: $8,980
3: $9,735 3: $8,820
Ethereum
Ethereum had quite a bad day, as Bitcoin’s move towards the downside pulled its price down as well, making it leave the ascending trade channel it was in. After falling out of the channel, Ethereum found support in the $225.4 support level, which held up nicely. The price is now moving up, possibly contesting the channel soon.
Ethereum traders should look for an opportunity in trading pullbacks or confirmations from ETH contesting the trend.
ETH/USD 4-hour Chart
Technical Factors:
- Price below the 50-period EMA and the 21-period EMA
- Price at the Middle B.B. (20-period SMA)
- RSI below the middle point (48.8)
- Increased volume (Coming back to normal)
Key levels to the upside Key levels to the downside
1: $228 1: $225.4
2: $240 2: $217.7
3: $251.4 3: $198
Ripple
The third-largest cryptocurrency by market cap is continuing its path towards the downside by following the descending trading channel. XRP doesn’t have enough volume to tackle any resistance levels, and it seems that it is just bouncing off of the bottom and top channel lines.
There aren’t many XRP trading opportunities at the moment, but traders could sneak in a trade or two tradings this ranging move XRP is performing.
XRP/USD 4-hour Chart
Technical factors:
- XRP in a mid-term (and short-term) descending trend
- XRP lacks strong support levels below $0.178
- The upside is guarded by the 21 and 50-period EMA
- Price is at the Middle B.B. (20 SMA)
- RSI is below the middle point (47.9)
- Average (extremely low) volume
Key levels to the upside Key levels to the downside
1: $0.178 1: $0.147
2: $0.19
3: $0.2
Related posts
 Daily Crypto Review, May 28 – “We Are All Satoshi” – Craig Wright Exposed?
 Daily Crypto Review, Jun 19 – Bitcoin Mid-Term Bullish vs. Bearish Outlook – Explained
 Daily Crypto Review, July 15 – Fidelity Goes All-In On Bitcoin; BTC Difficulty At Historic Heights
 Daily Crypto Review, Nov 12 – Bitcoin Formed a Triple Top? Ethereum Accidentally Hard Forks