
The cryptocurrency market has had a pretty volatile day, with most cryptos trying to make a move towards the upside. Bitcoin is currently trading for $9,257, which represents an increase of 0.79% on the day. Meanwhile, Ethereum gained 1.82% on the day, while XRP gained 2.2%.
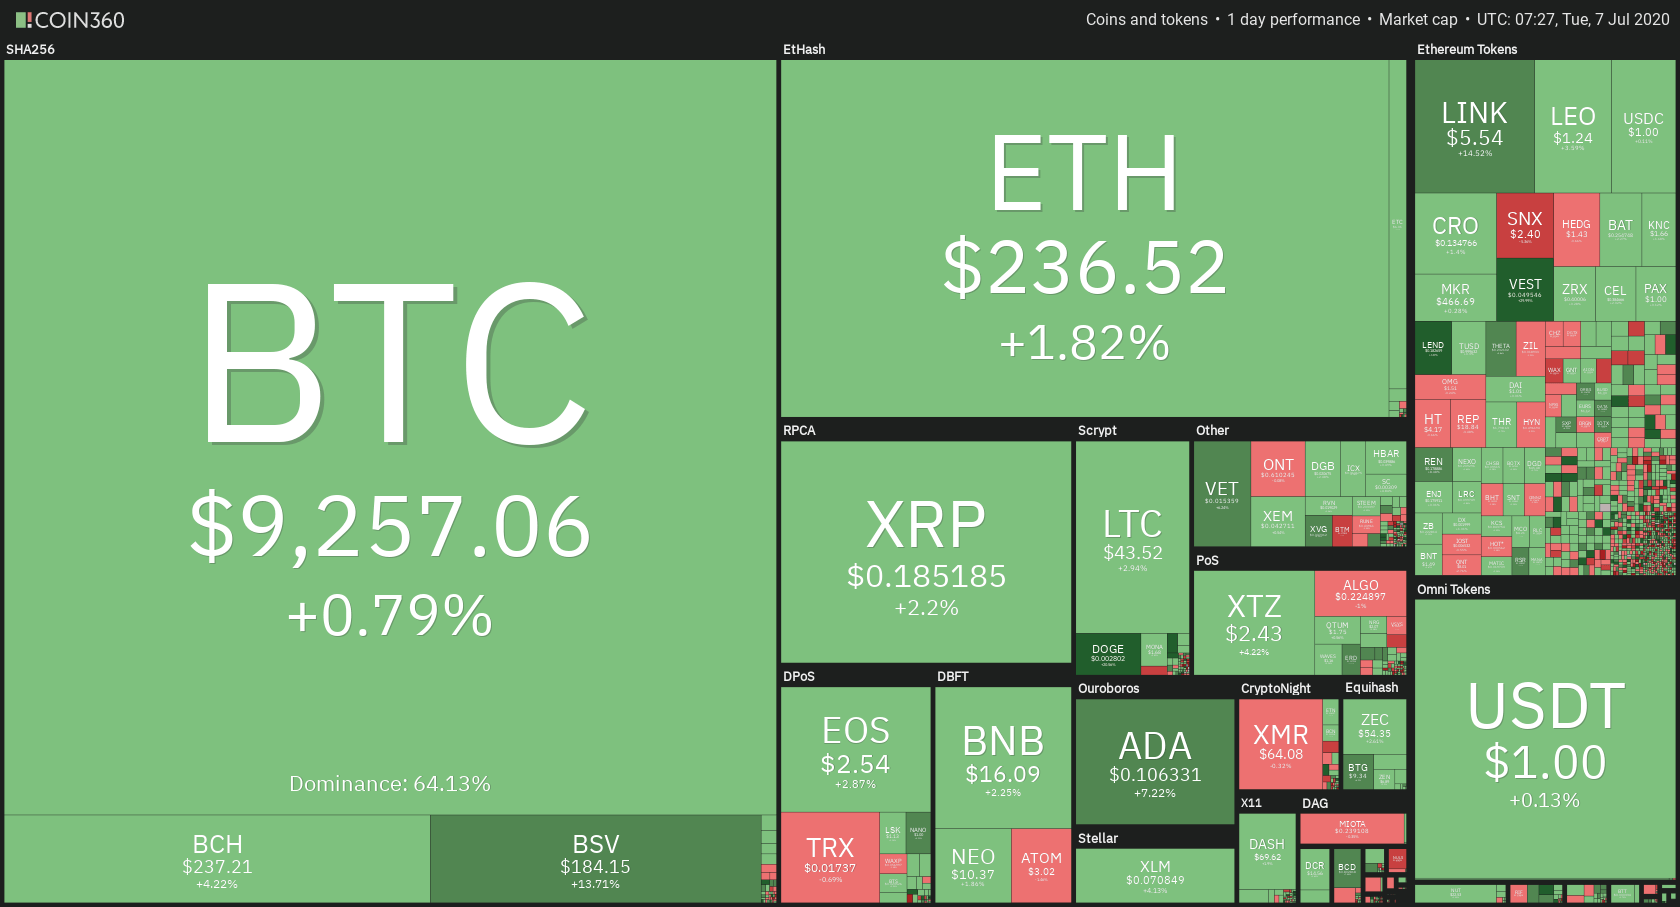
Daily Crypto Sector Heat Map
When talking about top100 cryptocurrencies, Dogecoin gained 21.58% on the day, making it by far the most prominent daily gainer. Aave (20.85%) and Bitcoin SV (15.90%) also did great. On the other hand, Bytom has lost 7.49%, making it the most prominent daily loser. It is followed by NULS’s loss of 7.25% and Synthetix Network’s loss of 3.81%.
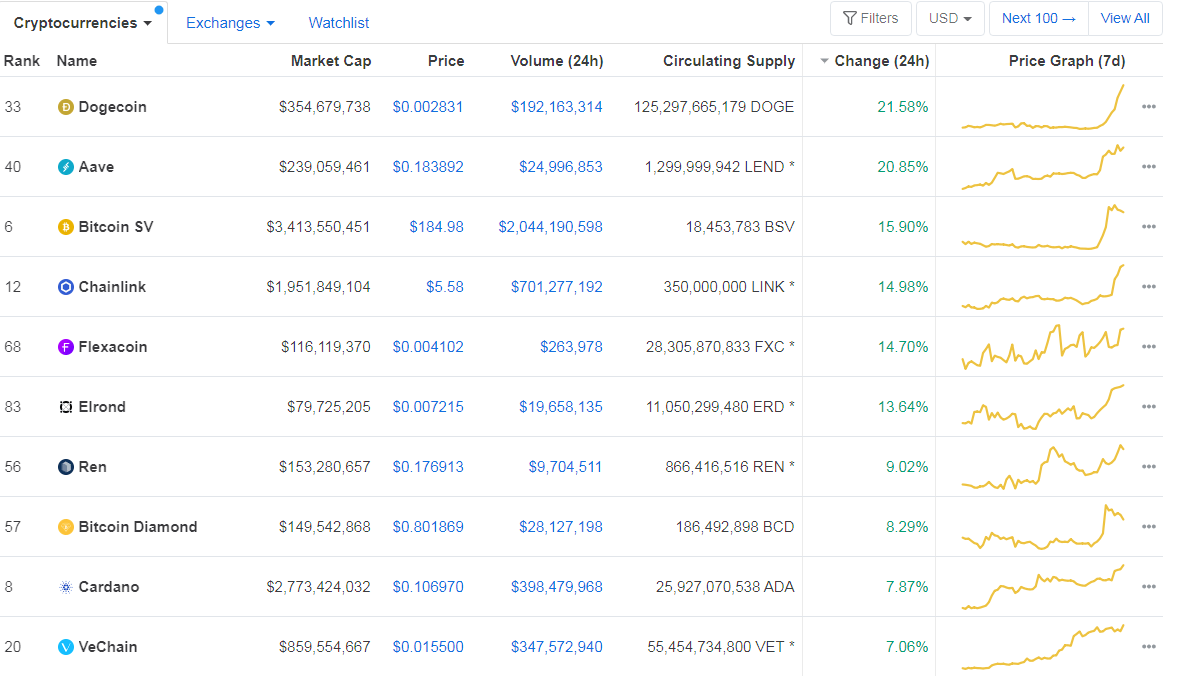
Top 10 24-hour Performers (Click to enlarge)
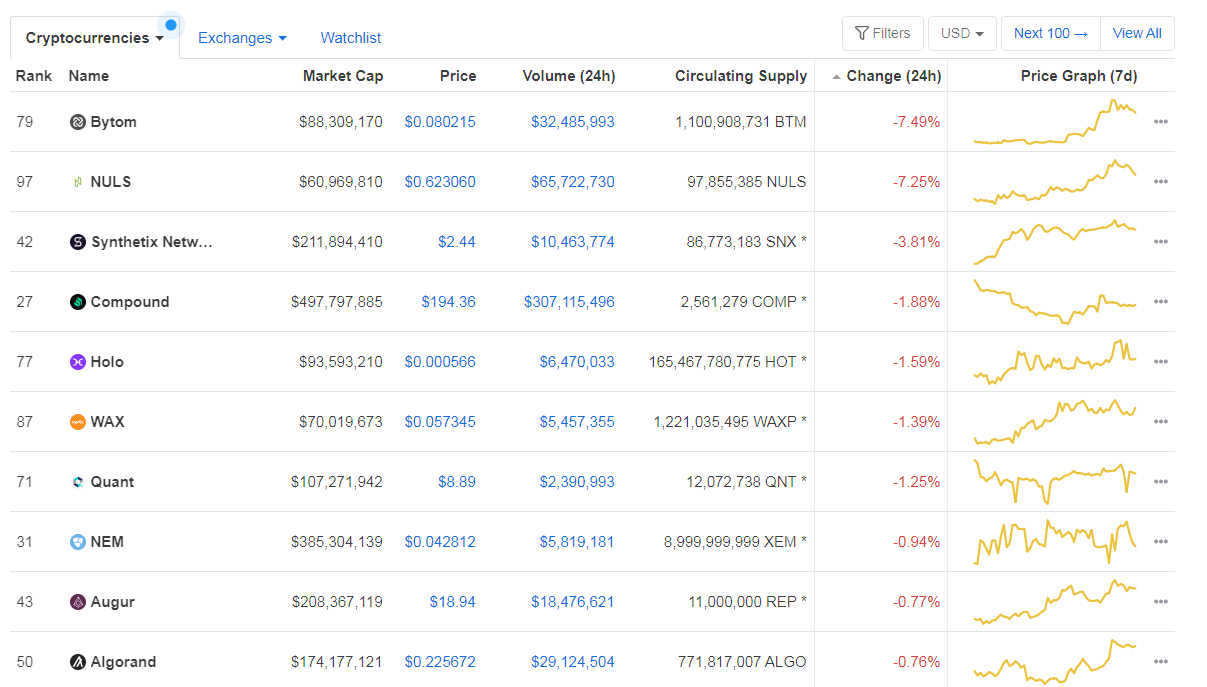
Bottom 10 24-hour Performers (Click to enlarge)
Bitcoin’s dominance level decreased since we last reported, with its value currently at 64.13%. This value represents a 0.68% difference to the downside when compared to yesterday’s value.
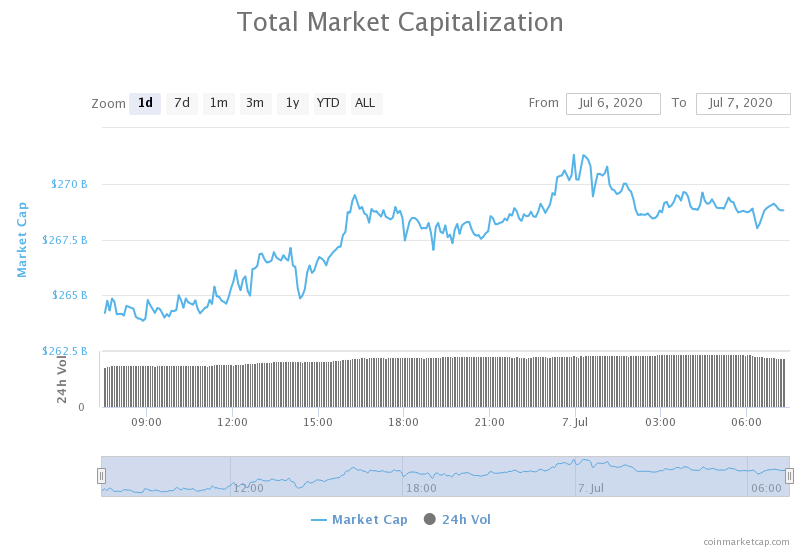
Daily Crypto Market Cap Chart
The cryptocurrency market capitalization increased slightly when compared to when we last reported, with the market’s current value being $268.74 billion. This value represents an increase of $4.43 billion when compared to the value it had yesterday.
_______________________________________________________________________
What happened in the past 24 hours?
_______________________________________________________________________
- Record Bitcoin Options Market Volume Shows Institutions Keen on Crypto (Cointelegraph)
- App Connects Bitcoin and Lightning Payments Directly to Your Bank Account (Cointelegraph)
- Block.One Co-Founder Brock Pierce Files to Run for US President (Coindesk)
- Mercedes Maker Daimler Tests Blockchain for Supply-Chain Data Sharing (Coindesk)
- Bitcoin’s Lightning Network Is Vulnerable to ‘Looting’: New Research Explains (Coindesk)
- Data shows that mass adoption is still nowhere to be found (The Block)
- The demand for WBTC has been soaring lately. Here’s why. (The Block)
- IPOs Are ‘Really Not Worth It’ Says Tim Draper (Cointelegraph)
- Expedia Partners With Crypto Service Travala.com for Crypto Bookings (Cointelegraph)
- Enterprise Friendly Blockchain Tapping Into Wine Supply Chain Business (Cointelegraph)
_______________________________________________________________________
Technical analysis
_______________________________________________________________________
Bitcoin
The largest cryptocurrency by market capitalization has spent the day being quite volatile, even though it only had an average volume. Bitcoin tried to push past its $9,251 resistance level, which it did for a brief period, but then failed as the price reached a descending resistance line (dating June 01). The bulls got stopped from rising the price, and the price came back to the $9,251 level. It is still unsure whether it will end up above or below the level.
Bitcoin traders should look for whether the price will end up creating a confirmation of a move above or below the $9,251 and go from there.
BTC/USD 4-hour Chart
Technical factors:
- Price is above its 50-period EMA and its 21-period EMA
- Price is below the top B.B.
- RSI at the upper levels (58.49)
- Average Volume
Key levels to the upside Key levels to the downside
1: $9,251 1: $9,120
2: $9,580 2: $8,980
3: $9,735 3: $8,820
Ethereum
Ethereum’s price movements followed Bitcoin’s almost to a tea. The second-largest cryptocurrency by market cap rose in price as bull presence intensified, reaching the price of $244 before starting to go back down. The price returned below the $240 level and is now consolidating at the $236 levels. Unlike Bitcoin, Ethereum has quite a bit of volume, which may indicate that its move isn’t over.
Ethereum traders should look for an opportunity in trading when ETH’s price hits the support levels (moving averages, horizontal support levels, etc.).
ETH/USD 4-hour Chart
Technical Factors:
- Price above the 50-period EMA and the 21-period EMA
- Price slightly below the upper B.B.
- RSI almost in the overbought territory (62.8)
- Increased volume
Key levels to the upside Key levels to the downside
1: $228 1: $225.4
2: $240 2: $217.7
3: $251.4 3: $198
Ripple
The third-largest cryptocurrency by market cap broke the $0.178 resistance level as well as secured its position above it yesterday. However, the bulls wanted more, and XRP continued its “gain season.” However, it was stopped in its tracks by the $0.19 level. XRP is now consolidating between $0.178 and $0.19.
XRP traders should wait and see how XRP reacts to indicators (moving averages) and go from there.
XRP/USD 4-hour Chart
Technical factors:
- XRP in a mid-term descending trend (though it broke the trend in the short-term)
- XRP lacks strong support levels below $0.178
- Price is above the 21 and 50-period EMA
- Price is slightly below the upper B.B.
- RSI is in the overbought territory (64.6)
- Increased volume
Key levels to the upside Key levels to the downside
1: $0.19 1: $0.178
2: $0.2 2: $0.147
3: $0.205
Related posts
 Daily Crypto Review, Sept 2 – Ethereum Pushing Towards $500; Decentralized Exchanges Volume Surges
 Daily Crypto Review, Sept 4 – Bitcoin at $10,000: What Happened? Detailed Price Level Analysis
 Daily Crypto Review, Sept 8 – Peter Schiff Buying More Bitcoin; Investors Keep Buying BTC Despite Downside Potential
 Daily Crypto Review, Sept 29 – Bitcoin’s Fail to Break $11,000 Causes a Red Day for Crypto: What’s Next?