Categories
Crypto Market Analysis

What Influences the Cryptocurrency Market?

If you’re going to invest in cryptocurrency, you need to have a good understanding of the driving forces behind prices in the market. Many different things can affect the prices you’ll see, but many of these influences are different than those that affect stocks and currencies. Therefore, it is important for investors to know what to watch for to make the best trading decisions.

Announcements or Changes

Many cryptocurrency providers are constantly working to improve their products. For example, the Bitcoin halving event is set to take place in May of 2020. When cryptocurrency goes through updates or transitions, this affects the price. This can go in one of two ways: successful updates may drive the price up as more traders feel confident in the cryptocurrency, or failed projects and technical problems with updates may lead some to walk away from the product altogether.

Supply & Demand

Supply and demand is a common influence behind the price of stocks, forex, and cryptocurrencies. This concept generally revolves around the fact that an abundance of something causes a decrease in value, while a shortage increases the value. During the COVID-19 pandemic, some grocers raised the price of meat or other items more than 50% because hoarding and reduced production caused a shortage of those products. While that price inflation was technically illegal in our example, this is how supply and demand affect the price of cryptocurrencies. Mining also influences supply and demand.

Bad Publicity

Bitcoin received harsh criticism when it was discovered that many consumers were using it to purchase illegal drugs or to pay for other illegal online services thanks to it being more private than traditional banking. When drama or unbecoming stories break, it can cause a decrease in the currency’s value and cause some investors to walk away. On the other hand, good publicity can have the opposite effect.

Market News

Like with any type of asset, the news is one of the main influences behind prices. In the case of cryptocurrency, news can give us insight into what is going to happen. A bad economy or decrease in the value of a major currency can push many traders to invest in cryptocurrency instead. This is something that you’ll want to keep a close eye on because of how significantly it can affect the prices.

High Profile Investors

Often referred to as ‘whale investors’, this category usually includes corporations or individuals with a lot of capital. These investors have a large influence on the market because they either invest a large sum into the market or sell a large amount. If these investors buy, it means that they believe the market will go up, while selling indicates the opposite. Many of these investors have more resources at their disposal, so it is a good idea to pay attention to their moves so that you can benefit.

Other Influences

There are a few other factors that can affect the price of cryptocurrency:

Hard Forks: This involves a blockchain being split in two, like when Bitcoin was split with Bitcoin Cash or Ethereum and Ethereum Classic. If there is any drama behind the split, then this can be a cause for concern.

Competitors: If a new cryptocurrency hits the market or an existing one improves their services it can draw some investors away from other options.

How it can be used: If a cryptocurrency has multiple uses, investors may be more likely to buy.

Security: Any cyber-attacks or hacking problems with a cryptocurrency will make traders more fearful of investment or it will cause investors to sell, which will cause the price to go down.

Categories
Crypto Market Analysis

Daily Crypto Review, August 10 – Chainlink Surpasses LTC’s Market Cap Despite Major Bearish Signals

The cryptocurrency market had an interesting weekend, with Bitcoin pushing towards 12,000 and actually passing it at the time of writing. Bitcoin is currently trading for $12,003, which represents an increase of 2.24% on the day. Meanwhile, Ethereum gained 0.18% on the day, while XRP lost 0.11%.

 Daily Crypto Sector Heat Map

When talking about top100 cryptocurrencies, Balancer gained 45.17% on the day, making it the most prominent daily gainer. Band Protocol (32.27%) and Nervos Network(26.64%) also did great. On the other hand, Flexacoin lost 16.27%, making it the most prominent daily loser. It is followed by Decentraland’s loss of 9.91% and Elrond’s loss of 6.81%.

Top 10 24-hour Performers (Click to enlarge)

Bottom 10 24-hour Performers (Click to enlarge)

Bitcoin’s dominance level has increased slightly since we last reported, with its value currently at 61.78%. This value represents a 0.28% difference to the upside when compared to Friday’s value.

Daily Crypto Market Cap Chart

The cryptocurrency market capitalization has increased since we last reported. Its current value is $362.67 billion, which represents an increase of $3.77 billion when compared to Friday’s value.

_______________________________________________________________________

What happened in the past 24 hours?

_______________________________________________________________________

_______________________________________________________________________

Technical analysis

_______________________________________________________________________

Bitcoin

Bitcoin has spent the weekend pushing towards $12,000 and finally passing it in a major push just a couple of hours ago. However, the price didn’t fully (or at all) establish itself above the major mark. Bitcoin will need to confirm its position above $12,000 (and confidently) before being considered as officially above it. For now, this level is still a resistance level.

BTC traders should look for an opportunity to make a trade when BTC confirms its position above or below $12,000.

BTC/USD 4-hour Chart

Technical factors:
  • Price is currently above its 50-period EMA, as well as its 21-period EMA
  • Price above its top B.B.
  • RSI is elevated (65.89)
  • Volume elevated (on the increase)
Key levels to the upside          Key levels to the downside

1: $12,000                                 1: $11,630

2: $12,330                                 2: $11,460

3: $13180                                   3: $11,090

Ethereum

Unlike Bitcoin, Ethereum spent the weekend without much movement towards the upside. However, the second-largest cryptocurrency by market cap did fall back to the $361 level and tested its support, which held up quite nicely. Once the price bounced back to its previous highs, it continued slowly moving towards the upside, but without any real strength. Ethereum still has a way to go before it reaches past $400.

Traders should look for a trade opportunity when Ethereum increases its volume.

ETH/USD 4-hour Chart

Technical Factors:
  • Price is above its 21-period EMA and its 50-period EMA
  • Price is slightly below its top B.B.
  • RSI is elevated (58.51)
  • Volume increasing slightly
Key levels to the upside          Key levels to the downside

1: $400                                     1: $361

2: $415                                     2: $340

3: $496                                      3: $302

Ripple

XRP had quite a turbulent weekend, with its price failing to stay above the previously broken triangle formation levels. This happened as, even though XRP managed to break the triangle formation to the upside, it did not reach past the $0.31 resistance level. Instead, bears stepped into the market and brought the price down to below $0.285 levels (at one point). However, the $0.285 level held up and XRP has confirmed its position above this support.

Traders can look for an opportunity to trade when XRP reaches the $0.31 mark and decides if it will reach above it or fall below once again.

XRP/USD 4-hour Chart

Technical factors:
  • Price is above its 21-period and 50-period EMA
  • Price is slightly above its middle B.B. (20-period SMA)
  • RSI is neutral (51.45)
  • Low volume
Key levels to the upside          Key levels to the downside

1: $0.31                                     1: $0.285  

2: $0.32                                     2: $0.266

3: $0.3328                                3: $0.245


Categories
Cryptocurrencies

What’s Crypto.com All About?

Blockchain and cryptocurrency are two emerging techs that can no longer be ignored. By enabling trustless, immutable, and decentralized financial solutions, blockchain is laying the foundation for a new generation of better and inclusive financial applications. 

Crypto.com is an effort to push the world’s adoption of cryptocurrency. The platform has a motto: “put currency in every wallet.” Its main offering and what majorly contributes to this effort is its Monaco (MCO) visa card. Through the Visa card, Crypto.com hopes to solve the issue of traditional systems not accepting payment in crypto. And those that do, they do so through slow and often expensive processes which bar many people from using cryptocurrency.

Crypto.com hopes to solve this by offering “the best way to pay and be paid in crypto, anywhere, any crypto, for free.” 

What’s Crypto.com?

Crypto.com is a cryptocurrency and payment platform whose goal is to advance the worldwide adoption of crypto. Founded in 2016, the platform houses a range of products – from an exchange to crypto Visa cards, to a wallet and a crypto investment platform. 

According to the team, “We strongly believe that decentralization is an important part of a better society for everyone, and by accelerating the world transition to cryptocurrency we are helping the world move in this direction. We will achieve this by building on one side, a network of cryptocurrency projects, and on the other side, focus on developing merchants’ ability to accept crypto as a form of payment.”

Crypto.com’s Go-to-Market Strategy

Crypto.com has a clear vision of how it wants to accomplish this. It has four “disruptive forces” to this end: 

  • Great offers for users to incentivize the usage of cryptocurrency
  • Zero transaction fees for merchants
  • A seamless experience for users
  • A decentralized and trustless protocol to process transactions

What Does Crypto.com Offer?

Why should you care about Crypto.com? Well, that’s because it offers several great financial benefits for users. Signing up for Crypto.com gives you access to the following features: 

  • MCO Visa card through which you can spend crypto anywhere in the world
  • Crypto.com app that allows you to buy, exchange, send and track crypto
  • Crypto Credit feature that enables you spent money on credit through your MCO Visa card
  • Crypto Earn that allows you to earn up to 20% interest by depositing crypto
  • Crypto.com Exchange, a crypto exchange that has deep liquidity, competitive fees, and favorable execution prices

Crypto.com’s Native Tokens: MCO and CEO

The Crypto.com ecosystem utilizes a dual-token system. The tokens in question are MCO and CEO.

The MCO Token

The MCO token plays the following roles in the ecosystem: 

  • Allows users to own visa cards by staking in the tokens
  • Allows users to get cashbacks (depending on the card tier) on spending
  • Allows users to earn extra rewards like Netflix, Spotify, and Amazon Prime and other benefits when they stake more tokens
  • Receive MCO at 6% p.a. for 500 and 8% p.a. for 5,000 and 50,000 amount in stake, respectively

The CRO Token  

The CRO token has the following utilities:

  • Facilitate cross-assets currency settlements on Crypto.com
  • Reward nodes for validating and processing transactions
  • As payment for transacting in CRO
  • As a 50% discount to users when they purchase crypto on the crypto.com exchange
  • Get users to access to Crypto.com’s Syndicate platform

Crypto.com Exchange

Crypto.com has an in-house exchange that was launched in November 2019. Let’s look at some of the features of the exchange:

  • The Vortex Liquidity System that allows users access to a global trading platform
  • A 100% trading fee discount depending on your trading volume for the last 30 days and the amount of staked CRO
  • 0% trading fee for the first 90 days
  • Earn up to 20% interest just by depositing crypto
  • A Matching Engine in an Order Management System that provides a fast and efficient trading environment
  • Intuitive and interactive environment powered by a unified REST and Websocket API

Crypto.com Fees

Crypto.com charges a maker and taker fee starting at 0.2% and a transparent, competitive fee structure. However, staking CRO tokens grants you cheaper fees a 20% ROI on the staked amount. 

Crypto.com’s MCO Visa cards

Crypto.com provides five tiers of Visa cards that you can choose depending on your budget and needs. Let’s go through each of them:

Midnight Blue: This card is beginner level. With the Midnight’ Blue card, you get 1% cashback. There is a withdrawal limit of $200, a withdrawal fee of 2%, and an interbank fee of 0.5%. You don’t need to own MCO tokens to own Midnight Blue.

Ruby Steel: With this card, you get a 2% cashback when you stake 50 MCO tokens and a 1% cashback when you don’t. Also, when you stake, you get a $4,000 interbank exchange rate limit and no limits on ATM withdrawal. 

Jade Green/Royal Indigo: This tier is unlocked by staking 500 MCO tokens. With either of these cards, you get a 3% cashback, and if you don’t stake an MCO, you get a 1.5% cashback. 

Icy White: When you stake 5,000 MCO tokens, you get a 4% cashback and stand a chance to earn bonus interest. This level has a $20,000 interbank exchange rate limit of $20,000 and an ATM withdrawal limit of $1,000. No-staking gains you a 1.75% cashback. 

Obsidian Black: This is the highest level available. Staking 50,000 MCO grants you 5% cashback and unlimited interbank exchange rates, and an ATM withdrawal limit of $1,000. Not staking gives you a 2% cashback. 

Depending on the tier, there are also various benefits ranging from free access to Netflix, Spotify, Amazon Prime, airport lounge access, an exclusive merchandise welcome pack, and rebates on Airbnb and Expedia.

Tokenomics of Crypto.com

Now, let’s check in on how Crypto.com stacks up in the market. As of July 29, 2020, the cryptocurrency was the 9th largest in the world, with a market cap of 2.95 billion. Its 24-hour volume was $115, 652, 263, and it had a circulating supply of 18, 466, 210, 046, and a total supply of 100 billion. Crypto.com’s highest ever price was $0.168761, while its lowest ever was $0.011487 (Dec 17, 2018). 

Buying and Storing Crypto.com

You can purchase Crypto.com from several exchanges, including OKEx, Huobi Global, HitBTC, Bittrex, BitMart, DigiFinex, BitHumb, Gate.io, CoinDCX, Sistemcoin, CoinTiger, and KuCoin.

Crypto.com has provided its own wallet, the Crypto.com Wallet, which is “designed to give you full control and secured custody of your crypto.” If you’re using user-custodied wallets such as Ledger and MyEtherWallet, you can migrate your existing wallet to the Crypto.com wallet using a 12/2824 recovery phrase. Following the import, you can continue managing your crypto using the Crypto.com Wallet.

Closing Thoughts

In its small way, Crypto.com is doing its part in promoting the wide-scale use of crypto. With the MCO Visa card, say goodbye to not being able to spend crypto your funds. And the bonus is if you stake in the MCO token, you unlock loads of possibilities with what you can do with the card. Multiply your crypto holdings just by putting it to work for you. Build an investment portfolio without breaking a sweat. Get lots of benefits by using the native exchange platform. No matter your needs, there’s something for everyone on Crypto.com!

Categories
Crypto Market Analysis

Daily Crypto Review, August 7 – Goldman Sachs Launching its Own Stablecoin; DeFi Platforms Traffic Surging

The cryptocurrency market ended up mostly in the green, with Bitcoin continuing its path towards $12,000. Bitcoin is currently trading for $11,831, which represents an increase of 1.34% on the day. Meanwhile, Ethereum lost 0.18% on the day, while XRP gained 1.4%.


 Daily Crypto Sector Heat Map

When talking about top100 cryptocurrencies, Balancer gained 23.90% on the day, making it the most prominent daily gainer. Aave (20.29%) and Decentraland (15.99%) also did great. On the other hand, Aurora lost 12.10%, making it the most prominent daily loser. It is followed by Ampleforth’s loss of 7.98% and The Midas Touch’s loss of 5.50%.

Top 10 24-hour Performers (Click to enlarge)

Bottom 10 24-hour Performers (Click to enlarge)

Bitcoin’s dominance level has increased slightly since we last reported, with its value currently at 61.50%. This value represents a 0.02% difference to the upside when compared to yesterday’s value.

Daily Crypto Market Cap Chart

The cryptocurrency market capitalization has increased since we last reported. Its current value is $358.90 billion, which represents an increase of $5.42 billion when compared to the value it had yesterday.

_______________________________________________________________________

What happened in the past 24 hours?

_______________________________________________________________________

_______________________________________________________________________

Technical analysis

_______________________________________________________________________

Bitcoin

The largest cryptocurrency by market capitalization kept increasing in price slowly throughout the day as sentiment turned even more bullish. However, the path towards $12,000 will not be easy, as the sell wall at the resistance is not small. On the other hand, if Bitcoin fails to break $12,000, it will create a double top and most likely fall down towards $11,630 and then $11,460 as well.

BTC traders should look for an opportunity to make a trade when BTC breaks $12,000 or fails to break it.

BTC/USD 4-hour Chart

Technical factors:
  • Price is currently above its 50-period EMA, as well as its 21-period EMA
  • Price is near its top B.B.
  • RSI is elevated (65.50)
  • Volume elevated (stable)
Key levels to the upside          Key levels to the downside

1: $11,630                                 1: $11,460

2: $12,000                                 2: $11,090

                                                  3: $10,855

Ethereum

Ethereum spent the day flattening out its movement and mostly trading sideways. The second-largest cryptocurrency by market capitalization stayed below the $400 mark and couldn’t get past it. However, with volume dying down and such low volatility, we may expect an attempt to break the $400 (and then $415) level soon.

Traders should look for a trade opportunity when Ethereum increases its volume.

ETH/USD 4-hour Chart

Technical Factors:
  • Price is above its 21-period EMA and its 50-period EMA
  • Price is slightly above its middle B.B. (20-period SMA)
  • RSI is elevated (58.42)
  • Descending volume
Key levels to the upside          Key levels to the downside

1: $400                                     1: $362

2: $415                                     2: $340

3: $496                                      3: $302

Ripple

XRP broke out from its triangle formation to the upside, but couldn’t reach past $0.31 mark. However, the pullback from a failed move didn’t discredit XRP’s break from the triangle formation, as the cryptocurrency managed to stay above the triangle. With the confirmed break, traders can expect XRP to either stay near $0.31 or push above it in the short-term unless some other catalyst sparks a movement to the downside.

Traders can look for an opportunity to trade when XRP breaks $0.31.

XRP/USD 4-hour Chart

Technical factors:
  • Price is above its 21-period and 50-period EMA
  • Price is below its middle B.B. (20-period SMA)
  • RSI is neutral (55.99)
  • Low volume
Key levels to the upside          Key levels to the downside

1: $0.31                                     1: $0.285  

2: $0.32                                     2: $0.266

3: $0.3328                                3: $0.245


Categories
Crypto Videos

Americans Trading Depreciating Dollar For Bitcoin!


Americans Trading Depreciating Dollars For Booming Bitcoin

A Bloomberg article that came out recently claims that Americans are foregoing the largest fiat currency, the US dollar, for more speculative assets such as stocks, gold, as well as Bitcoin.

High saving rates, low yields

As the COVID-19 lockdown continues in the US, the personal savings rate of Americans is at a historic high. On the other hand, the yield offered to them by financial institutions on savings accounts is close to zero. Meanwhile, assets like Bitcoin, equities, and gold, all made double-digit gains since March.

The article talks about a 28-year-old Californian who said that he is soon going to take out his $15,000 savings that were held in a high-yield savings account at Ally Bank and convert them into Bitcoin.

USD July performance

If we look at USD from an objective standpoint, the reality is even worse than what Bloomberg article suggests. The dollar is rapidly depreciating against almost every single leading fiat currencies. As a matter of fact, according to the Financial Times, July is by far the worst month USD had in a decade.

With yet another round of stimulus checks just around the corner, as well as most of the US still affected by COVID-19 restrictions, it is quite possible that this problem will most likely only get worse. Americans may have more depreciating USD on their hands in the short term, which they could seek to convert into higher-yielding assets, such as crypto. However, as they say, there is no such thing as a free lunch, as higher rewards always bring higher risks.

Categories
Crypto Videos

Grayscale Can Now Publicly Trade BCH and LTC! FINRA Approved!

Grayscale Can Now Publicly Trade BCH and LTC – Approved by FINRA

Crypto fund manager giant Grayscale Investments will now make Bitcoin Cash and Litecoin available for public trading. This will be done through shares of the firm’s cryptocurrency trusts.

A July 20 announcement stated that Grayscale got verified by the Financial Industry Regulatory Authority (FINRA for short) to transact shares of the firm’s Bitcoin Cash Trust as well as Litecoin Trust. The two stocks will be available for public trading very soon. They will go under the tickers BCHG and LTCN.

Grayscale reported that it has 2,725,300 shares in its BCH Trust for $5.8 million assets under management, as well as 509,400 shares of the LTC Trust totaling $2 million as of June 30.
Publicly traded tokens
Grayscale’s trust will provide a means of investing in crypto without actually having to hold the tokens. According to the investment firm, this investing strategy avoids “the challenges of buying and storing digital Bitcoin Cash or Litecoin directly.”

Shares of BCH and LTC are the fourth and fifth public offerings that came from Grayscale. The firm previously received approval to list shares of Bitcoin, Ethereum, and Ethereum Classic. Horizen, Stellar Lumens, XRP, and Z-cash, are available for trading through Grayscale’s trust directly.

At the time of writing, Bitcoin Cash and Litecoin are valued at $251.11 and $48.37, respectively. According to CoinMarketCap, BCH is rated as the fifth largest token by market cap, while LTC is the eight.

Categories
Crypto Market Analysis

Daily Crypto Review, August 6 – ‘Ethereum Is a Ponzi Scheme’ – Adam Back; ETC Suffers Yet Another 51% Attack

The cryptocurrency market ended up mostly in the green, with (of course) a few exceptions. Bitcoin is currently trading for $11,665, which represents an increase of 3,46% on the day. Meanwhile, Ethereum gained 1.6% on the day, while XRP gained 1.41%.

 Daily Crypto Sector Heat Map

When talking about top100 cryptocurrencies, Band Protocol gained 36.21% on the day, making it the most prominent daily gainer. Travala.com (24%) and Bancor (22.19%) also did great. On the other hand, Nexohas lost 21.32%, making it the most prominent daily loser. It is followed by The Midas Touch’s loss of 8.47% and THORChain’s loss of 7.70%.

Top 10 24-hour Performers (Click to enlarge)

Bottom 10 24-hour Performers (Click to enlarge)

Bitcoin’s dominance level has increased since we last reported, with its value currently at 61.48%. This value represents a 0.31% difference to the upside when compared to yesterday’s value.

Daily Crypto Market Cap Chart

The cryptocurrency market capitalization has increased since we last reported. Its current value is $353.48 billion, which represents an increase of $12.09 billion when compared to the value it had yesterday.

_______________________________________________________________________

What happened in the past 24 hours?

_______________________________________________________________________

_______________________________________________________________________

Technical analysis

_______________________________________________________________________

Bitcoin

The largest cryptocurrency by market capitalization continued its move towards the upside after a few days of indecisiveness and consolidation. Bitcoin saw a slight increase in volume, which brought the price above the $11,460 resistance level and up to $11,820. However, the move stopped there (for now), and Bitcoin is currently consolidating above the $11,460 level, testing it as support.

BTC traders should look for an opportunity to make a trade when BTC confirms or fails to confirm its position with $11,460.

BTC/USD 4-hour Chart

Technical factors:
  • Price is currently above its 50-period EMA, as well as its 21-period EMA
  • Price is near its top B.B
  • RSI is elevated (62.37)
  • Volume is increasing
Key levels to the upside          Key levels to the downside

1: $11,460                                 1: $11,090

2: $11,630                                 2: $10,855

 3: $12,000                                 3: $10,505

Ethereum

Ethereum seems to be back on its steady upwards path, which began on July 21. The second-largest cryptocurrency by market cap rose steadily throughout the day, trying to reach past the $415 resistance. While the price did not yet reach this mark, it did increase slightly, supported by the 21 and 50-period moving averages.

Traders should look for a trade opportunity within the range ETH is currently in.

ETH/USD 4-hour Chart

Technical Factors:
  • Price is above its 21-period EMA and its 50-period EMA
  • Price is slightly above its middle B.B. (20-period SMA)
  • RSI is elevated (60.26)
  • Descending volume
Key levels to the upside          Key levels to the downside

1: $415                                     1: $362

2: $496                                     2: $340

                                                  3: $302

Ripple

XRP experienced sideways movement on low volume throughout the day. The third-largest cryptocurrency by market capitalization was trading near the top of its triangle formation, unable to break it yet. However, the decreasing volume, as well as the price approaching the 80% mark of the formation, indicate a move which will take XRP out of the triangle formation. While it is too early to speculate, XRP seems to have a better chance of breaking to the upside.

Traders can look for an opportunity to trade when XRP breaks its triangle formation.

XRP/USD 4-hour Chart

Technical factors:
  • Price is above its 21-period and 50-period EMA
  • Price is below the middle B.B. (20-period SMA)
  • RSI is neutral (55.62)
  • Low volume
Key levels to the upside          Key levels to the downside

1: $0.32                                    1: $0.285  

2: $0.3328                                2: $0.266

                                               3: $0.245


Categories
Cryptocurrencies

Most Important Cryptocurrencies Apart From Bitcoin Part 2

1. Tether (USDT)

Tether was one of the pioneers of a new class of cryptocurrency known as stablecoins. Stablecoins are cryptocurrencies that avoid the legendary volatility of cryptocurrencies by being pegged to real-life assets. The cryptocurrency industry, including Bitcoin itself, is known for unpredictable price swings that can wash out gains in a matter of hours. This volatility is also the reason why cryptocurrencies have been slow at real-life adoption since users fear making losses. Stablecoins such as Tether exists to provide cryptocurrency users with both security and speed of cryptocurrencies with the stability of Fiat currency. 

Launched in 2014 by Tether Holdings, the project describes itself as a “blockchain-enabled platform designed to facilitate the use of Fiat currencies in a digital manner.” What this means is that Tether users also get to sidestep the complexity sometimes associated with crypto. As of July 18, 2020, Tether’s per-token value is $0. 997473, with a market cap of 9.2 billion. It currently occupies the third spot right after Bitcoin and Ethereum.

2. Bitcoin Cash (BCH)

Created in August 2017, Bitcoin Cash is one of the most recognizable altcoins. This is because it was born of a contentious hard fork of the Bitcoin blockchain. At that time, the Bitcoin community was split into two. One faction was against the idea of splitting the chain, while the other argued that for Bitcoin to reach its potential, it had to be able to process more transactions at each time.

Be that as it may, it’s one of the most successful forks of the dominant currency. The source of that success is probably the currency’s compelling offering of a much faster Bitcoin network. This it does by increasing the size of blocks, and as a result, a number of transactions each can hold. 

Satoshi Nakamoto intended Bitcoin to be a peer-to-peer electronic currency that could be used for day-to-day purchases. However, as the coin gained mainstream traction, so did transactions increase on the network, and the network slowed down due to the limited 1MB block size. The block limitation meant that one block could only handle a limited number of transactions, causing transactions to queue up and clog the network. 

Bitcoin Cash’s solution was to increase the block size to 8 MB, thus permitting more transactions to be held in one block. While one block on Bitcoin can hold between 1000 and 1500 transactions, one block on Bitcoin Cash can handle tens of thousands. As of July 2018, BCH’s price was $225.36. It occupied the 5th position in the market with a market cap of 4.2 billion.

3. Libra (LIBRA)

The decision to add Libra to this list can certainly raise eyebrows but bear with us. Important here can mean the scale and magnitude of a cryptocurrency’s potential disruption or simply the power of the outfit behind it. And going by those two yardsticks, Libra is, to put it mildly, important. 

The currency is set to be launched by Facebook. When Facebook broke out the news last year, it said the currency would launch in 2020, but at the time writing, we’re yet to see that happen. 

As would be expected, the news was met with mixed reactions. Some people were excited about the potential of a powerful entity such as Facebook, helping to push the concept of crypto into the mainstream. Others, especially regulators, met the news with indignation. The reason for this was twofold. 

One was Facebook’s unflattering history with how it has dealt with users’ data and privacy. Regulators submitted that Facebook would sell user data to advertisers, and then we’d have a repeat of the Cambridge Analytica debacle. The other reason was due to Facebook’s massive worldwide reach – we’re talking about billions of users – which regulators argued would undermine the global financial system. 

The reason for the cryptocurrency’s launch delay is probably its going back to the drawing board to create a cryptocurrency that can appease regulators. In July last year, David Marcus, the project’s head, in remarks prepared for US lawmakers said that Libra would be “the broadest, most expensive, and most careful pre-launch oversight by regulators and central banks in fintech’s history,” and that Facebook wouldn’t launch the crypto until it had “fully addressed regulatory concerns.” Upon launch, the project will be overseen by Switzerland-based Facebook’s subsidiary, Calibra.

4. Monero (XMR)

Monero is one of the cryptocurrencies that have been created to make up for Bitcoin’s less than satisfactory privacy approach. While the Bitcoin blockchain does not reveal a user’s identity, all its transaction history is out there for the whole world to see. With enough resources and dedication, an entity can trace down the real-life owner of a transaction. 

Created as a fork of Bytecoin in April of 2014, Monero is a privacy-oriented cryptocurrency whose development was completely donation-dependent and driven solely by the community. It utilizes “ring signatures” to anonymize transactions. A ring signature is a cryptographic signature in which several signatures are merged together, with all of them appearing valid, while in actuality, only one is. This makes it impossible to single out the real signature.

This level of privacy for Monero has caused it to become the go-to currency for clandestine dealings and criminal activities. No matter the reputation it has acquired, though, Monero has enormously contributed to the crypto space in its offerings. So, let’s see how Monero is doing in the market. At the time of writing, Monero has a per-token value of $68.63, with a market rank of #15 and a market cap of $2.1 billion.

5. Cardano (ADA)

Created by Charles Hoskinson and launched in September 2017, Cardano is a cryptocurrency platform on which people can send and receive value in a decentralized, peer-to-peer, and safe manner. Through this, Cardano wants to make the world “work better for all.” The cryptocurrency has been nicknamed the Ethereum killer, and given its rapid rise to the coveted top 10, it wouldn’t be a surprise if this prophecy came true in a few years.

Cardano has taken a unique and intriguing approach to its development process. Apart from being originally peer-reviewed by blockchain experts, academics, and researchers from various universities, protocol updates have to undergo the same round of evaluation by experts. Cardano’s rationale for this rigorous process is to ensure that the platform meets the highest standards for security, scalability, and efficiency, ultimately granting users a quality experience. 

Cardano is one among many third-generation cryptocurrencies, which is a term used to describe cryptocurrencies that seek to improve upon the deficiencies of the first generation (Bitcoin) and second-generation blockchains (Ethereum). As of July 19, 2020, Cardano has a per-token value of $.0123970 and is the sixth-largest cryptocurrency with a market cap of 3.2 billion.

6. EOS (EOS)

EOS is one interesting cryptocurrency in part because no one knows what ‘EOS’ stands for and because it rose to the high sanctums of cryptocurrency riding on a wildly successful ICO that raised $4 billion. The crypto was created by Dan Larimer, who is also the founder and co-founder of successful crypto projects BitShares and Steemit, respectively.

Just like Ethereum, EOS seeks to provide a platform for developers to create decentralized applications. Unlike Bitcoin and Ethereum that use the power-hungry proof-of-stake consensus mechanism, EOS uses a delegated proof-of-stake mechanism that is not only energy-efficient but also allows it to achieve an impressive TPS (transactions per second) capability of 1000+. As of July 19, 2019, EOS traded at $2.50 had a market cap of $2.3 billion that positioned it at #12 in the market. 

Categories
Crypto Market Analysis

Daily Crypto Review, August 5 – XRP Drops by 6% Despite Fundamentals Booming

The cryptocurrency market had a day without much movement. Bitcoin is currently trading for $11,166, which represents a decrease of 1.52% on the day. Meanwhile, Ethereum lost 2.66% on the day, while XRP lost 6%.

 Daily Crypto Sector Heat Map

When talking about top100 cryptocurrencies, Band Protocol gained 15.33% on the day, making it the most prominent daily gainer. The Midas Touch (13.97%) and Kava.io (12.79%) also did great. On the other hand, Quant has lost 15.75%, making it the most prominent daily loser. It is followed by Ampleforth’s loss of 14.84% and MCO’s loss of 11.32%.

Top 10 24-hour Performers (Click to enlarge)

Bottom 10 24-hour Performers (Click to enlarge)

Bitcoin’s dominance level has increased since we last reported, with its value currently at 61.17%. This value represents a 0.37% difference to the upside when compared to yesterday’s value.

Daily Crypto Market Cap Chart

The cryptocurrency market capitalization has decreased slightly since we last reported. Its current value is $341.39 billion, which represents a decrease of $6.78 billion when compared to the value it had yesterday.

_______________________________________________________________________

What happened in the past 24 hours?

_______________________________________________________________________

_______________________________________________________________________

Technical analysis

_______________________________________________________________________

Bitcoin

The largest cryptocurrency by market cap had a slow day, with its price being locked in a range bound by The $11,460 resistance and $11,090 support. Bitcoin continuously retested its immediate support, but the lack of volume and pressure towards the downside brought nothing to the BTC bears. Bitcoin’s downside is also guarded by the 50-period moving average, which is sitting right under $11,090.

BTC traders should look for an opportunity to make a trade when BTC breaks $11,460 or falls below $11,090.

BTC/USD 4-hour Chart

Technical factors:
  • Price is currently above its 50-period EMA, but below its 21-period EMA
  • Price is near its middle B.B (20-period SMA)
  • RSI is neutral (47.67)
  • Volume decreasing
Key levels to the upside          Key levels to the downside

1: $11,460                                 1: $11,090

2: $11,630                                 2: $10,855

 3: $12,000                                 3: $10,505

Ethereum

Ethereum has a slow day as well, with its volume normalizing and volatility fading. The second-largest cryptocurrency by market capitalization oscillated between $401 and $380 over the course of the day. The cryptocurrency seems like it will be trading within the range bound by $415 and $362 for some time now.

Traders should look for a trade opportunity within the range ETH is currently in.

ETH/USD 4-hour Chart

Technical Factors:
  • Price is above its 21-period EMA and its 50-period EMA
  • Price is currently at its middle B.B. (20-period SMA)
  • RSI is elevated (57.69)
  • Descending volume
Key levels to the upside          Key levels to the downside

1: $415                                     1: $362

2: $496                                     2: $340

                                                  3: $302

Ripple

XRP experience a day with a bit more volatility than Bitcoin and Ethereum, with its price dropping down to below $0.3 levels. While the move to the downside seems to be stopped by the 21-period moving average for now, XRP will certainly move somewhere (more likely to the downside. On top of that, XRP has formed a triangle formation, which gives us a possible time estimate of its next move.

Traders can look for an opportunity to trade when XRP breaks the triangle formation.

XRP/USD 4-hour Chart

Technical factors:
  • Price above 21-period and the 50-period EMA
  • Price is below the middle B.B. (20-period SMA)
  • RSI is neutral (54.18)
  • Average volume
Key levels to the upside          Key levels to the downside

1: $0.32                                    1: $0.285  

2: $0.3328                                2: $0.266

                                               3: $0.245


Categories
Crypto Videos

About Time! Binance Sending Out Its Debit Cards!


Binance Sending Out Its Debit Cards – Crypto Cards Taking Over


After months of planning and testing, the crypto giant Binance has begun delivering its crypto debit cards to customers.
Binance CEO Changpeng Zhao, better known as CZ, posted a tweet on July 25 as a response to a community member that has expressed interest in the product. CZ said that they started shipping debit cards in limited quantities.
As the previous reporting shows that the plan was to do an August launch for the card in the European region, it can be inferred that CZ meant that Binance started shipping to European customers at the time being.


Binance debit card timeline

One of the largest platforms in the crypto industry, Binance, unveiled its plans for a crypto debit card in April 2020, which would go by the name Binance Card. The company then proceeded to acquire crypto debit card company Swipe, using the acquisition to further its plans for the Binance Card project.


CZ and Binance tested out the payment option in July, which the CEO revealed in a July 10 Twitter post. This was done as a part of the product’s initial testing.
Four days later, Binance announced its plans for an August card launch in certain regions of Europe, guaranteeing cards’ compatibility with four digital assets. Bitcoin and Binance’s BNB cryptocurrency were among the four assets listed.

CZ’s recent tweet shows that the development for Binance’s card is going along quite well, as well as that the company is respecting the timeline that it has given. Binance itself has also posted a number of headlines in 2020 amid all the setbacks that happened due to the COVID-19 situation.

Categories
Cryptocurrencies

Cobo Vault Review: Is It The Safest Hardware Crypto Wallet Ever Designed?

Cobo Vault is arguably one of the most secure hardware wallets currently available. Created by blockchain expert Lixin Liu, Cobo Vault features a host of premium security features that give it an edge over the competition. These include open sourcing its software, disabling wireless connections to the wallet, and enclosing it in a military-grade casing that’s both water and shock-proof. According to Liu, the device that’s dedicated to the Western Markets was designed with the aim of providing the safest, yet easy to use, hardware wallet.

It is one of the most transparent hardware wallets ever introduced to the public. Virtually, all its aspects are open-sourced. In this guide, we explore this in detail. We’ll highlight its key features, explaining its security features, providing you with a step by step on how it works, and going over its pros and cons.

Cobo Vault Key Features:

i) 4-inch touchscreen with a fingerprint sensor: Cobo Vault hardware wallet is relatively bulky and features one of the widest screens ever fitted on a hardware wallet. The wallet’s interactive interface is a 4-inch touchscreen with a fingerprint sensor and capable of fitting a full keyboard. The Cobo vault wallet also features a button and a camera that facilitate the wallet’s communications.

ii) Water and shock resistant: Both the metallic and glass casings of the Cobo Vault hardware wallet are made of aerospace aluminum. The military-grade casing is waterproof, impact-resistant, and fulfills the MLD-STD-810G standards set by the US Military.

iii) Rechargeable and removable battery: Cobo Vault hardware wallet features a rechargeable and removable battery. Additionally, instead of relying on the more expensive Li-Ion batteries, the wallet uses the readily available and inexpensive AAA batteries. Most importantly, these batteries have to be detached and charged on a charging dock as a further safety guide.

iv) Multi-coin and tokens support: The Cobo Vault hardware wallet currently supports up to 10 cryptocurrencies and the ERC-20 tokens. Its providers have, nevertheless, hinted on the possibility of expanding this number of supported cryptos during the upcoming firmware updates.

Cobo Vault security features:

Multi-character password:

Like any other hardware or software wallet, Cobo vault has a password as its first protection measure. You get to set this password during wallet installation and activation. Unlike most other crypto wallets, however, Cobo Vault allows you to set up a 30-character long password. Plus, you also have the option of using a pattern password.

Communication via QR Codes:

Unlike most other hardware wallets that use both wired and wireless connections like Bluetooth or Wi-Fi to connect to their crypto apps, Cobo vault uses QR codes. It does not have a USB port, and neither does it support Bluetooth nor Wi-Fi connections. To send/receive cryptos in/out of the wallet, you have to use its camera on the wallet device to scan the receiver’s QR code.

Open-sourced software:

Like most other hardware and software crypto wallets, Cobo vault has outsourced the technology used in coming up with the wallet. This has exposed it to scrutiny and auditing by crypto and blockchain industry experts who affirm its security.

Cobo vault has gone ahead and open-sourced its wallets secure element – often considered the most opaque part of the hardware – making it the first hardware wallet to expose this sensitive aspect of its wallet’s operations.

Firmware Upgrade through SD Card:

In light of the fact that the Cobo vault hardware wallet doesn’t have a USB port and doesn’t support wireless connections, it can only be updated via an SD card.

12-24 word recovery seed:

When installing the Cobo vault hardware wallet, you will also be furnished with a 24-word recovery seed that you can use to recover your private keys if you ever forget your password or lose the device. The Cobo Vault package will also feature a Cobo tablet – a stainless metallic wallet that you will use to store this recovery seed.

Increasing lockout period:

Cobo Vault further protects your wallet against brute force attacks by incrementally pushing up the lockout time between two subsequent password input attempts.

Self-destruct security feature:

In addition to the increased lockout period for failed password input, the Cobo vault hardware wallet has a self destruct feature. The wallet will delete any form of data stored within the wallet’s secure element should anyone try to open the body of the device.

Hidden vaults:

You get to create a vault/ wallet address for every crypto stored in your Cobo vault. But you also have the option of creating multiple hidden wallet addresses with individual passcodes for these cryptocurrencies and tokens.

No physical attack points:

The Cobo Vault Hardware wallet is completely air-gapped with no physical points of attack, safe for the SD card used during the firmware update. By disabling Wi-Fi, USB cable, and Bluetooth connections, Cobo Vault effectively eliminates the possibility of a man-in-the-middle attack.

Encryption chip:

The device features an encrypted chip that integrates BIP32, 39, and 44 security protocols. The Chip is proprietary and bank-grade, and it works by auto-generating truly random numbers for your private keys.

Setting up Cobo Vault hardware wallet

Step 1: Power on your device

Press and hold the power button for 3 seconds to boot the Cobo Vault wallet and proceed to choose your desired language.

Step 2: Visit Cobo official website

Using your desktop, laptop, or mobile phone, open Cobo Vault’s official website and click on start to display the web authentication QR code. The size of this code can be adjusted inwards or outwards.

Step 3: Scan the QR code using your Cobo Vault device

Use the camera on your Cobo vault device to scan the QR code displayed on the Cobo vault.

Step 4: Input the 8-digit code shown on your device

For the Cobo vault device verification, scan the 8-digit code on the website. If it succeeds, the website will display the “Authenticated” message while the device displays a “Success” note. But if your hardware and the website don’t pair, and the authentication process fails, it is possible that the device might have been tampered with.

Step 5: Set a strong password

Proceed to set a strong, memorable, and highly unique password. An ideal password is ten characters long. But, the Cobo Vault wallet makes it possible for you to create a 30-character password with a mix of symbols, numbers, and letters. Plus, you have the option of choosing to set up a pattern as your password.

Step 6: Create your vault

Proceed to create a new vault for storing your digital assets. To get started, tap on the ‘Create vault’ icon, click ‘Next,’ and then “Understand” to complete the process.

Step 7: Back up or record the recovery phrase

After creating the first vault, the device will display a set of 24-words known as the seed that is used in recovering your private keys should you forget the password for the device. Record these on the indestructible metal tablet shipped alongside the device. The device will ask you to confirm that you correctly recorded the seed.

Step 8: Start loading cryptocurrencies and tokens

Your wallet is now active and ready for use. You can start moving your cryptocurrencies from exchanges and other wallets into the Cobo Vault Wallet.

Step 9: Synchronize with Cobo Vault Mobile App

Accessing your vault from your mobile phone is quite easy. All you are required to do is synchronize your Cobo vault mobile app with your device. Start by downloading the app from Google Play or iOS. Open the app and click on “Bind” from the “Add wallet” option. Agree to their terms and conditions and click “confirm” to begin scanning the QR code.

If the code doesn’t scan currently on the first trial, click on “difficulty scanning” and retry.

Supported Crypto Assets and countries

Unlike most other hardware crypto wallets that support hundreds – sometimes thousands – of cryptocurrencies and tokens, you can only store a maximum of 11 cryptocurrencies and ERC-20 tokens on the Cobo Vault hardware wallet. These include:

  • Ethereum (ETH)
  • Dash
  • Bitcoin (BTC)
  • BitcoinCash (BCH)
  • Ethereum Classic (ETC)
  • EOS
  • XRP
  • Litecoin (LTC)
  • Zcoin (XZC)
  • Tron (TRX)
  • Decred (DCR)
  • ERC- 20 tokens

The Cobo wallet developers argue that there is no limit to the number of cryptos you can store within your Cobo crypto wallet. They are also regularly releasing firmware updates for the wallet that involves increasing the number of supported cryptocurrencies.

Virtually any crypto trader/investor looking for a safe storage unit for their digital assets can purchase the Cobo Vault hardware wallet form their official website and have it shipped to any part of the world.

Cobo Vault hardware wallet ease of use:

The fact that the Cobo Vault wallet will only use the QR code scanner for communications with the company’s website and mobile apps complicate its use – especially the initial activation and verification process. The processes of sending and receiving coins into the wallet are, however, quite straightforward as the wallet eliminates the need to type in the lengthy wallet addresses. You only need to scan the other party’s QR code.

Thanks to its relatively large touch screen and fingerprint sensor, interacting with the wallet when checking crypto balances, creating additional vaults, or setting passwords for hidden vaults is relatively simple.

Cobo Vault hardware wallet customer support:

Cobo vault’s website is multilingual and available in both English and Mandarin. Its developers have also availed both written and video tutorials on their website aimed at helping address some of the most common challenges faced by Cobo Vault users.

You can also contact the Cobo Vault customer support team by raising a ticket on their website, via email, or reaching out through the official Cobo Vault social media pages (Facebook, Weibo, Twitter, or LinkedIn).

Cobo wallet fees and charges:

The unlimited number of premium security features integrated into the Cobo Vault hardware wallet explains the relatively high price of the different Cobo Vault wallet models. Ideally, there are three models of the Cobo Vault Wallet: Cobo Vault Essential costs $99, Cobo Vault Pro costs $149, while Cobo Vault Ultimate costs $479.

You, however, won’t be charged to download and install the Cobo Vault mobile app or for the continued use of the Cobo wallet. The blockchain network operators will nevertheless institute transaction fees that vary based on the amounts transferred and type of coin. These fees go to blockchain miners and not Cobo Vault.

Pros and Cons of Cobo Vault hardware wallet

Pros 

  • The contactless nature of the hardware wallet goes a long way in eliminating the man-in-the-middle hacks.
  • It’s the first truly open-sourced hardware wallet – given that this open-sourced nature extends to its secure element.
  • Its large display allows users to use a full keyboard and eases interactions with the wallet.
  • The increased lockout period and self-destruct features pay a critical role in preventing such physical intrusions as the brute force attack.
  • Cobo Vault wallet employs a combination of several security features, all aimed at keeping your private keys private.

Cons

  • One may consider the wallet too complicated and not user-friendly.
  • The different models of the Cobo Vault wallet are a bit expensive.
  • The wallet supports less than a dozen cryptocurrencies.

How Does Combo Vault wallet Compare to other Wallets in the Market? 

Cobo Vault differs significantly, with some of the most common hardware wallets available today. For instance, in addition to the common security features employed by such hardware wallets as Trezor and Ledger Nano, Cobo Vault introduces the self-destruct mode. It also limits the device’s wireless connectivity and embraces a military-grade casing. That is, fire, water, and impact-proof. The likes of Trezor and Ledger Nano may, however, be considered more user-friendly, support a wide range of crypto assets, and are also less costly.

Final Verdict: Is Cobo Vault the safest hardware wallet?

Thanks to its tamper-proof design, open-sourced secure element, self-destruct feature, and limited connectivity, Cobo Vault makes it on the list of the most secure hardware wallets available today. We consider it ideal for long-time crypto investors specializing in popular cryptos. Its security and cool design notwithstanding, we take offense with its steep cost $479 cost, especially considering that it only supports 11 cryptocoins.

Categories
Crypto Market Analysis

Daily Crypto Review, August 4 – BTC Establishes Itself Above $11,000; Altcoins Taking Over The Market

The cryptocurrency market ended up in the green today, with Bitcoin establishing its place above $11,000 and most altcoins gaining substantial value. Bitcoin is currently trading for $11,350, which represents an increase of 1.86% on the day. Meanwhile, Ethereum gained 4.8% on the day, while XRP gained 6.87%.

 Daily Crypto Sector Heat Map

When talking about top100 cryptocurrencies, MCO gained 41.91% on the day, making it the most prominent daily gainer. Ocean Protocol (28.92%) and Energy Web Token (22.88%) also did great. On the other hand, Ampleforth has lost 12.73%, making it the most prominent daily loser. It is followed by Aave’s loss of 6.32% and Celsius’ loss of 3.80%.

Top 10 24-hour Performers (Click to enlarge)

Bottom 10 24-hour Performers (Click to enlarge)

Bitcoin’s dominance level has decreased since we last reported, with its value currently at 60.80%. This value represents a 0.82% difference to the downside when compared to Friday’s value.

Daily Crypto Market Cap Chart

The cryptocurrency market capitalization has increased since we last reported. Its current value is $347.17 billion, which represents an increase of $9.74 billion when compared to the value it had yesterday.

_______________________________________________________________________

What happened in the past 24 hours?

_______________________________________________________________________

_______________________________________________________________________

Technical analysis

_______________________________________________________________________

Bitcoin

The largest cryptocurrency by market capitalization confirmed its position above $11,000 in the past 24 hours (at least in the short term) Its price kept slowly going up until it hit a (possibly) new resistance level of $11,460. The price then took a small dive but returned to sideways movements. Bitcoin is in a good spot to create a move that will lead it towards (or above) $12,000 in the near future.

BTC traders should look for an opportunity to make a trade when BTC breaks $11,460 or falls below $11,090.

BTC/USD 4-hour Chart

Technical factors:
  • Price is currently above its 50-period EMA, but below its 21-period EMA
  • Price is between its bottom B.B. and its middle B.B (20-period SMA)
  • RSI is neutral (51.35)
  • Volume increased
Key levels to the upside          Key levels to the downside

1: $11,630                                1: $11,090

2: $12,000                                2: $10,855

                                                 3: $10,505

Ethereum

Ethereum continued pushing towards the upside, pretty much unaffected by the “flash crash” that brought its price down from $415 to $320. The second-largest cryptocurrency by market capitalization is moving upwards and having the 21-period and 50-period moving averages as support. The price is currently just below $400.

Ethereum traders should look for an opportunity in a pullback, which will most likely happen after the current move towards the upside.

ETH/USD 4-hour Chart

Technical Factors:
  • Price is above its 21-period EMA and its 50-period EMA
  • Price is currently between its top B.B. and its middle B.B. (20-period SMA)
  • RSI is elevated (63.95)
  • Above-average volume
Key levels to the upside          Key levels to the downside

1: $340                                    1: $302

2: $362                                    2: $289

                                                 3: $278

Ripple

XRP was also one of the altcoins that made significant progress towards the upside in the past 24 hours. The third-largest cryptocurrency by market cap recovered from the “flash crash” quickly and hurled upwards, reaching past the $0.31 resistance level (now support) once again.

XRP traders can look for an opportunity in the range between $0.31 and $0.32.

XRP/USD 4-hour Chart

Technical factors:
  • Price above 21-period and the 50-period EMA
  • Price is between the top B.B. and the middle B.B. (20-period SMA)
  • RSI is elevated (66.85)
  • Elevated volume
Key levels to the upside          Key levels to the downside

1: $0.32                                    1: $0.285  

2: $0.3328                                2: $0.266

                                               3: $0.245


Categories
Crypto Market Analysis

Daily Crypto Review, August 3 – More than $1 Billion Positions Liquidated; Crypto Market Booming Despite the “Flash-Crash”

The cryptocurrency market had quite a weird weekend in terms of price performance. The market and most of its cryptocurrencies had a “flash crash,” but quickly recovered to a price slightly below the previous highs. Bitcoin is currently trading for $11,160, which represents a decrease of 6.59% on the day. Meanwhile, Ethereum lost 4.04% on the day, while XRP gained 1.03%.

 Daily Crypto Sector Heat Map

When talking about top100 cryptocurrencies, Loopring gained 17.24% on the day, making it the most prominent daily gainer. Terra (14.69%) and Synthetix Network (13.73%) also did great. On the other hand, Ampleforth has lost 20.21%, making it the most prominent daily loser. It is followed by The Midas Touch’s loss of 18.78% and Quant’s loss of 15.89%.

Top 10 24-hour Performers (Click to enlarge)

Bottom 10 24-hour Performers (Click to enlarge)

Bitcoin’s dominance level decreased since we last reported, with its value currently at 61.62%. This value represents a 1.29% difference to the downside when compared to Friday’s value.

Daily Crypto Market Cap Chart

The cryptocurrency market capitalization increased since we last reported. Its current value is $337.43 billion, which represents an increase of $9.65 billion when compared to the value it had on Friday.

_______________________________________________________________________

What happened in the past 24 hours?

_______________________________________________________________________

_______________________________________________________________________

Technical analysis

_______________________________________________________________________

Bitcoin

The largest cryptocurrency by market capitalization spent the weekend crashing down to $10,555 and then recovering from the drop. After the price going up all the way up to $12,000, Bitcoin suddenly dropped to $10,555, which liquidated $1 billion of positions. However, the price quickly recovered and went over $11,000. It is still unsure if the price will end up being above this support level, but it is more likely that BTC will remain above, rather than fall below it.

BTC traders should look for a trade opportunity when BTC bounces from $11,000 or falls below it.

BTC/USD 4-hour Chart

Technical factors:

  • Price is currently below its 50-period EMA and its 21-period EMA
  • Price is between its bottom B.B. and its middle B.B (20-period SMA)
  • RSI is neutral (47.02)
  • Volume increased (descending)

Key levels to the upside          Key levels to the downside

1: $11,630                                1: $11,090

2: $12,000                                2: $10,855

                                                 3: $10,505

Ethereum

Ethereum acted pretty much the same as Bitcoin over the weekend, with its price reaching a major high of $415, and then plummeting down to $320 before recovering to $380 levels. While the current price is considerably lower than the $415 high, but Ethereum made insane gains over the course of the week and month.

Ethereum traders should look for a trade opportunity after the cryptocurrency decides its price direction.

ETH/USD 4-hour Chart

Technical Factors:

  • Price is above the 50-period EMA and the 21-period EMA
  • Price is between its top B.B. and its middle B.B (20-period SMA)
  • RSI is elevated (61.44)
  • Above-average volume (descending)

Key levels to the upside          Key levels to the downside

1: $340                                    1: $302

2: $362                                    2: $289

                                                 3: $278

Ripple

XRP spent the weekend reaching the resistance level of $0.32, which it could not pass over, and then dropping towards the downside. The third-largest cryptocurrency reached a low of $0.241 before bouncing back to above $0.285 level, where it currently is consolidating (and rising slowly).

XRP traders can look for an opportunity in the range between $0.285 and $0.31.

XRP/USD 4-hour Chart

Technical factors:

  • Price above 21-period and the 50-period EMA
  • Price is between the top B.B. and the middle B.B. (20-period SMA)
  • RSI is elevated (63.79)
  • Elevated volume (descending)

Key levels to the upside          Key levels to the downside

1: $0.32                                    1: $0.285  

2: $0.3328                                2: $0.266

                                               3: $0.245


Categories
Cryptocurrencies

What’s EOS? A Beginner’s Guide

The first (Bitcoin) and second (Ethereum) generation blockchains each brought groundbreaking innovations in the blockchain space. Bitcoin pioneered the concept of blockchain and cryptocurrency – completely changing the face of finance. Ethereum took the idea of blockchain and expanded it to include smart contracts and decentralized applications. 

But even with those contributions, the two blockchains somehow couldn’t hack the test of scalability. Both Bitcoin and Ethereum’s transactions per second (at 7 and 15 respectively) pale in comparison with real-world systems that can handle millions of daily active users. 

EOS, a blockchain project by Chinese company Block.One wants to solve these problems. It aims at supporting thousands of transactions per second, as well as providing a free interactive environment for developers from all over the world to experiment with and create decentralized applications. Ambitious goals notwithstanding, EOS has not made it unscathed by a controversy or two.

Let’s dig into what EOS is all about.

Understanding EOS

EOS is a blockchain and cryptocurrency project that supports the creation of decentralized applications (DApps). The EOS team also wants to solve some of the problems burdening blockchains such as low transaction speeds and complexity of use that would lock out many developers. The EOS platform claims to support 1000+ transactions per second. For these reasons, it has been dubbed the ‘Ethereum Killer.’

EOS is the brainchild of Dan Larimer, a well-known figure in the crypto space and creator of successful blockchain platforms, Steemit and BitShares. EOS is known as just that: EOS. There doesn’t exist a full form of the name, and neither have the creators offered any. 

Block.one, the company behind EOS, raised a record-setting $4.1 billion in a year-long initial coin offering (ICO) that ran up until July 2017. This represents the biggest ICO to ever happen in the blockchain space to date. 

EOS’s Approach to Blockchain Applications

EOS believes in and seeks to achieve these requirements for blockchain: 

#1. Support Millions of Users 

If blockchain applications are to compete with businesses such as eBay, Amazon, Uber, and Facebook, blockchain tech would need to support tens of millions of users at any time. 

#2. Free Usage

If blockchain is to realize greater adoption, it needs to be free for users. Developers and businesses using the platform can then explore and implement other monetization strategies. 

#3. Flexibility and Bug Recovery

A blockchain platform should be flexible to allow businesses to upgrade their applications if and when needed. The platform should also be able to identify and root out bugs when they occur.

#4. Low Latency

Blockchain applications should relay high volumes of data with minimal delay (latency). Low latency would ideally be near real-time access to data. Anything less would frustrate users and render blockchain uncompetitive against legacy systems.

#5. Support Sequential Performance

Not all applications can be implemented with parallel algorithms. Applications like, let’s say, crypto exchanges require sufficient sequential performance to deal with high volumes. 

How Does EOS Work?

EOS’s product is essentially like that of Ethereum – offering a conducive environment for developers to create DApps. But EOS wants to focus on the most critical problems currently facing blockchain, such as high latency, scalability, flexibility, that have held back blockchain from achieving its full potential.

EOS endeavors to address these issues by supporting more scalability, flexibility, and ease of use. The developing team claims the network can support thousands of industrial-scale DApps without suffering performance bottlenecks by the use of sequential performance and “asynchronous communication” of data. 

Additionally, EOS achieves scalability by employing certain features. First, it’s ownership model promotes free usage for clients, and significantly reduces or eliminates transaction fees. Developers can also utilize various on-platform resources based on their stake in EOS. This means app developers are in a better position to predict their hosting costs, as well as design the best monetization strategies for their respective products. 

EOS: Delegated Proof of Stake (DPoS)

Dan Larimer conceptualized the delegated proof-of-stake of consensus mechanism. In DPoS, network delegates vote for a few representatives, who are then tasked with securing the network. These chosen delegates will also oversee the generation and verification of new blocks as well as their addiction to the blockchain.

In the context of EOS, 21 delegates (supernodes) are chosen from a pool of potential block producer candidates. Block producers are rewarded for their role in maintaining and securing the network. Rewards are granted on a per-block-basis and the block rewards system bankrolled by a 1% annual token inflation. 

Controversies Surrounding EOS

EOS has not been without a few controversies. It all started with the year-long ICO that raked in $4.1 billion. Some members of the community felt this was irresponsible, greedy, and shady. 

There have also been concerns that its delegated proof-of-stake consensus mechanism, in which there are only 21 producers, is too centralized. Blockchain testing company Whiteblock has also come out to say that the project is not genuinely censorship-resistant, saying “the foundation of the EOS system is built on a flawed model that is not truly decentralized.” 

The EOS network was also rigged with bug after bug, especially leading up to the main net release. This was very bewildering for many people who couldn’t fathom how this was possible with all that money collected. This led to the company establishing a bug bounty system that rewarded benevolent hackers who identified bugs in the system. Even after the project went live, bugs were still reported.

EOS.IO and EOS Tokens

The EOS network houses two tokens: EOS and EOS.IO. The role of EOS.IO is to manage functions in the ecosystem. It facilitates the vertical and horizontal scaling on the network. 

The EOS token allows developers to purchase a stake and obtain access to various natural processes to create and run DApps. Token holders who are not running DApps can rent their bandwidth to others who need it. And lastly, the EOS token can be used as a speculative investment and is available for purchase/trading on various exchanges. 

Economics of EOS

An inflation rate of 1% of EOS is used as block producer rewards. The inflation rate was adjusted from 5% in February 2020. As of Jul 25, 2020, EOS’s per-token value is $2.62, and it has a market cap of 2.4 billion, which makes it the 12th biggest cryptocurrency in the world. EOS’s 24-hour volume is $1, 294, 563, 760, its circulating supply is 934, 603, 711, and its total supply is 1, 021, 303, 722. EOS’s all-time high was $22.89 (Apr 29, 2018), while its all-time low was $. 0.480196 (Oct 23, 2017). 

Buying and Storing EOS

You can purchase EOS from a variety of exchanges, including Binance, OKEx, Huobi, HitBTC, DigiFinex, Bitrue, ConBene, Gate.io, Upbit, LATOKEN, and BitMex.

As for which wallets support EOS, you have several great options such as Ledger Nano, Guarda Wallet, Atomic Wallet, Trezor, Jaxx Liberty, and Infinito.

Final Thoughts

EOS proposes a brave new world of free blockchain transactions. If it can indeed support a TPS of 1000+, it will be a far cry from the single and double-digit TPS offered by Bitcoin and Ethereum, respectively. Could this combination of capabilities bury Ethereum? That remains to be seen.

Categories
Crypto Daily Topic

 Who is Vitalik Buterin?

The name Vitalik Buterin is perhaps the most recognized in the blockchain and cryptocurrency world, after Bitcoin’s pseudonymous Satoshi Nakamoto. Buterin, 26, is one of the people who has made groundbreaking contributions to this space. He pretty much changed the face of cryptocurrency and blockchain by introducing Ethereum – a tour de force that unleashed the true power of blockchain. 

Countless revolutionary projects now run on top of Ethereum, ranging from identity to entertainment to cryptocurrency wallets to crowdfunding. Vitalik first described Ethereum  in November 2013, calling it “a culmination of months of thought and often frustrating work into…” cryptocurrency 2.0″ – in short, using the Bitcoin blockchain for more than just money.” 

So, what’s the story of Buterin? Let’s explore his journey through childhood, through Ethereum’s creation, and now. 

A Background

Vitalik Buterin is known to the tech world as the crypto wunderkind who created the blockbuster blockchain and cryptocurrency project Ethereum at only 21 years old. A Russian-Canadian programmer, Vitalik has been active in the Bitcoin and crypto community since 2011. His involvement began as a writer for Bitcoin Magazine, which he co-founded. 

At the time of writing, Vitalik’s Ethereum is the world’s second most successful and recognized cryptocurrency after Bitcoin. It has a market cap of 35.6 billion – which makes up more than 90% of the altcoin market. 

Vitalik’s Early Life

Vitalik was born on Jan 31, 1994, in the small town of Kolomna, Russia. He lived in Russia until age 6 when his parents moved to Canada in search of better work opportunities. By the time he was in third grade, his teachers had noticed that he possessed some remarkable talents. He was then quickly moved to the program of gifted kids. 

Once in the program, Vitalik began to realize that his particular sets of talents made him a bit of an oddity among his peers. These talents included a natural predisposition for math and programming, an early interest in economics, and the uncanny ability to add three-digit numbers in his head twice as fast as the average person. 

As he told Wired, “I remember knowing, for a while, for a long time, that I was kind of abnormal in some sense,” adding “When I was in grade five or six, I just remember quite a lot of people were always talking about me like I was some kind of math genius. And there were just so many moments when I realized, like okay, why can’t I just be like some normal person and go have a 75% average like everyone else.” 

Cryptocurrency Beginnings

Vitalik’s involvement in cryptocurrency can be pointed to two events: his being introduced to Bitcoin by his father and his own realization that centralized systems were plain horrible. He was a longtime fan of Blizzard’s World of Warcraft, until, he says, the company “removed the damage component from my beloved warlock’s Siphon Life spell. I cried myself to sleep, and on that day, I realized what horrors centralized services can bring.” Even as a kid, Vitalik always had a ‘cartoon mentality’ of centralized institutions ‘just being plain evil.’ 

But Vitalik didn’t take up Bitcoin immediately. After hearing about it from his father, he first dismissed it was a fad with no intrinsic value. But he chanced upon it a second time, after which he began to develop more interest. After reading up about it, he wanted to grab some so that he could participate in this experimental currency. But he neither had the money to buy it nor the computing power to mine it himself. So he scoured online Bitcoin forums and found someone willing to pay him 5 Bitcoins for contributing to a blog. 

This work caught the attention of Romania-based Bitcoin enthusiast Mihai Alisie, whom he would later co-found Bitcoin Magazine with. Vitalik would soon be juggling the role of head writer at the magazine, his computer science lessons at Waterloo University, and as a research assistant for cryptographer Ian Goldberg.

As he continued researching Bitcoin, he decided to attend related real-world events. In May of 2013, Vitalik traveled to San Jose for a Bitcoin conference that completely changed his view on crypto. There were attendees from every corner of the globe, booths everywhere showcasing hardware wallets, payment gateways, Bitcoin ATMs, and so on. Being present in this living, breathing moment impressed on him that the Bitcoin and crypto movement, in general, was real after all. “That moment really crystallized it for me. it really convinced me that, hey, this thing’s real and it’s worth taking a risk and jumping into.” 

That very semester, he ended his classes at Waterloo. Instead, he hunkered down to look for a substantial way to contribute to this burgeoning, exciting movement. After further research, he realized that many people were going about “Cryptocurrency 2.0”, or the next stage for blockchain tech, the wrong way. All projects were trying to improve on Bitcoin by adding new layers of application. “I discovered that they were doing this sort of Swiss army knife approach of supporting 15 different features and doing it in a very limited way,” he told Wired. 

How Ethereum Came to Be

Vitalik soon discovered that the blockchain could be designed to support every kind of imaginable digital service. On the blockchain, these services would interact with each other frictionlessly. This is how the idea of Ethereum was born. As for why the name Ethereum, Vitalik explains, “I was browsing a list of elements from science fiction on Wikipedia when I came across the name. I immediately realized that I liked it better than all of the alternatives that I had seen; I suppose it was the fact that it sounded nice and it had the word “ether” referring to the hypothetical invisible medium that permeates the universe and allows light to travel.” 

Vitalik would go on to sketch his idea out into a whitepaper, which he then sent to several of his friends. Those friends then sent it to their friends, and soon, many people reached out to him with unexpectedly positive reviews of the idea. “When I came up with Ethereum, my first thought was, okay, this thing is too good to be true and I’m going to have five professional cryptographers raining down on me telling me how stupid I am for not seeing how stupid I am for not seeing a bunch of very obvious flaws,” he narrated. As it turned out, however, his idea was perfectly sound. 

Two months later, he attended another Bitcoin conference in Miami, where he met some of the people who really liked the idea. (Some of these were crypto enthusiast Stephan Tual, entrepreneur Anthony Di Iorio, Bitcoin investor Joseph Lubin, and programmers Gavin Wood and Charles Hoskinson). There, he described Ethereum to the conference, receiving a standing ovation and having a horde of investors lining up to talk to him after the speech. Around the same time, Vitalik received a Thiel Fellowship grant of $100,000. 

In the following months, Vitalik and his group of friends decided to raise money for the projects via a crowd sale of Ether, from which they managed to raise 31,000+ Bitcoins (worth around $18 million at the time). (However, the team made the mistake of storing the money in Bitcoin. Soon after, the price of Bitcoin tumbled, causing the team to lose a lot of money). Still, they had enough money to set up the Ethereum Foundation, which up to today oversees the development of Ethereum. 

Ethereum Comes to Being

The foundation then got busy working on Ethereum. Before the official launch of the network, the team test ran several prototypes of the network, the last of these being ‘Olympic.’ Multiple bug tests were also run to help identify any vulnerabilities in the system. In July of 2015, Ethereum went live. 

Vitalik’s Other Blockchain Ventures

Vitalik has also been involved in a few other crypto-related ventures such as pybitcointools, multisig.info, Dark Wallet and KryptoKit, and Egora. 

Awards and Recognition

Buterin is the recipient of several high-profile awards, including Forbes’ 2018 30 under 30, Fortune’s 40 under 40, World Technology Award in the IT Software Category, 2014. 

Quotes By Vitalik on Ethereum and Blockchain

“The concept of smart contracts is so complex, that understanding how to make them safer comes only with experience…We can only wait and allow people to do projects, some of which succeed. The same as cars and airplanes were becoming safer with time, through experience we will be also realizing how to make smart contracts with an acceptable level of risk.” Source

“The thing that I often ask startups on top of Ethereum is, ‘Can you please tell me why using the Ethereum blockchain is better than using Excel?’ And if they can come up with a good answer, that’s when you know you’ve got something really interesting.” Source

“The main advantage of blockchain technology is supposed to be that it’s more secure, but new technologies are generally hard for people to trust, and this paradox can’t really be avoided.” Source

“The idea that we can separate this economy where we micro-tokenize and let people have their own micro-ownership, I think that is definitely a very interesting and promising idea.” Source 

Categories
Cryptocurrencies

What’s Chainlink (LINK) All About? 

Today’s blockchains exist in isolation from each other and the outside world. This significantly limits their potential to achieve mainstream adoption. For blockchain to reach maximum potential, it needs to be able to interact with the outside world. 

Oracles, which are third-party services that provide smart contracts with real-world connectivity, have been proposed to stand in this gap. But therein lies the problem. These third-party services are centralized. That means they have a single point of failure, making them no safer than any legacy digital system. 

What if there could be a decentralized oracle system? Now that would be something. Chainlink is a project that provides a decentralized network of oracles to offer smart contracts with real-world data and info. The first and only one of its kind, the project has attained impressive success just three years into its launch. 

Breaking Down Chainlink

Launched in 2017, Chainlink is a blockchain effort to connect external data with smart contracts on the blockchain. The Chainlink consists of a network of nodes that facilitate the introduction of smart contracts with real-world happenings and info that’s outside the chain. With this, Chainlink supports a variety of applications, including supplying smart contracts with all kinds of information ranging from bank interest rates to weather forecasts, election results, and sports scores. 

On its website, the project describes itself as: “The Chainlink network provides reliable tamper-proof inputs and outputs for complex smart contracts on any blockchain.” 

How Does Chainlink Work? 

Chainlink’s main plan is to create a bridge between on-chain smart contracts and the off-chain. For this to happen, the network has an on-chain mechanism that interacts with an off-chain mechanism. 

On-chain Architecture

Chainlink’s on-chain architecture comprises smart contracts and oracles that transmit data from external sources to the chain. Oracles take user requests for outside data and submit it to the network via a requesting contract. 

The Chainlink protocol responds by creating a corresponding smart contract (Chainlink Service Level Agreement (SLA Contract) to acquire this off-chain data. The Chainlink SLA Contract then creates three sub-contracts: a reputation contract, an order-matching contract, and an aggregating contract. 

The reputation contract ensures that an oracle provider is authentic and reliable, getting rid of disreputable ones. An order-matching contract passes the requesting contract’s request to the appropriate Oracle according to the level and type of request. Finally, the aggregating contract takes all the data from the selected oracle and reconciles it for the best results and then delivers it to the requesting contract.

Off-chain Architecture

Off-chain, Chainlink comprises a network of oracle nodes that connect to the Ethereum network. Chainlink plans to add support for other smart contract platforms in the future. Let’s look at the off-chain architecture.

#1.Chainlink Core.

This is a software whose work is to interface with the blockchain. It schedules and distributes tasks across the various off-chain services. Work executed via Chainlink nodes is registered as assignments. Each assignment comprises ‘subtasks,’ that are processed as a pipeline. Each subtask has a particular activity it carries out before passing its results on to the next subtask, and on and on until the final result is reached.

#2. External Adapters

Apart from the built-in subtasks, Chainlink’s network also supports customs subtasks that can be created via ‘adapters.’ Adapters here mean external services with minimal representational state transfer API.

#3. Subtask Schemas

These are pieces of software that ensure compatibility between adapters since these adapters are of different types and created by different developers. 

Chainlink’s Reputation System

Chainlink utilizes a Reputation System that records the user ratings of oracle providers. Via the Reputation System, prospective users can evaluate the reliability and trustworthiness of an oracle provider beforehand. The Reputation System is based on the following metrics: 

  • The total number of assigned requests. This includes all the requests that an oracle has previously taken on, whether complete or incomplete
  • Completion rate. This is the total number of requests that an oracle has completed. Completion rate is calculated by averaging the number of requests assigned with those that have been completed
  • The total number of accepted requests. This is the number of requests that are seen as acceptable.
  • Average response time. This is calculated by measuring the timeliness of responses to past requests.

The Reputation System incentivizes oracle providers to act honestly since a bad rating would potentially ruin a brand’s value. The Chainlink team hopes the system will create a virtuous circle in which well-behaved oracles acquire a good reputation, and the good reputations will feed into the incentive for a continued collaborative and high-performance environment. 

The LINK Token

The LINK token is the native token of the Chainlink network. It’s an ERC20 compliant token, meaning it’s based on the Ethereum blockchain. The network uses the token to pay nodes who retrieve data from external sources and convert it to blockchain readable formats. Smart contracts on, let’s say, Ethereum, have to pay their chosen Chainlink node operator with LINK tokens. 

The Chainlink whitepaper describes LINK as an “ERC20 token, with the additional ERC223 “transfer and call” functionality of transfer (address,uint256, bytes), allowing tokens to be received and processed by contracts within a single transaction.”

LINK also derives value from increased use cases of the network. As the use of cases of the Chainlink platform increase, so does the value of the token. 

Economics of LINK 

As of July 25, 2020, Chainlink is trading at $7.70. has a market cap of 2.7 billion that places it at #11 in the market. LINK has a 24-hour volume of $563, 161, 674, a circulating supply of 350, 000, 000 and a total supply of 1 billion. LINK’s all-time high was $8.80 (Jul 16, 2020), while its all-time low was $0.126297 (Sep 23, 2017).

Buying and Storing LINK

You can find LINK at any of several exchanges, including Binance, Coinbase Pro, Kraken, BKEX, BitHumb, LATOKEN, Bitrue, DragonEX, and Gemini. 

Being an ERC20 token, LINK can be stored on any wallet that supports Ethereum. Options include Atomic Wallet, Guarda Wallet, MyEtherWallet, Trezor, and Ledger. 

Final Thoughts

Chainlink is a real solution to a real problem. By providing a decentralized oracle solution to blockchains, it gives them the chance to interact with the outside world safely and securely. The blockchain ecosystem stands to benefit massively from that and similar ideas. So far, Chainlink has done extremely well, and it will likely go nowhere but up. 

Categories
Crypto Daily Topic

How to Invest in Bitcoin

Everyone has heard of folks that became millionaires from Bitcoin trading. Of course, trading Bitcoin is no guarantee that you’re going to wake up super rich. It takes smart calculation and healthy doses of patience to realize a tangible ROI. 

Now, despite Bitcoin investing being a potentially lucrative venture, many people either still don’t have the faintest idea of what it is and how to go about it, or they think it’s something beyond their reach. 

We hope to change that in this article. You’ll realize that getting started in Bitcoin is easier than you think. 

So, we’ll break down the steps towards owning Bitcoin, right after we understand what Bitcoin is and some important caveats that you need to be aware of before hopping on the train. 

What’s Bitcoin? 

Bitcoin is the pioneer and the most successful of what’s known as cryptocurrencies. It has no physical presence – only digital, and it can be transferred electronically from one person to another, irrespective of their locations around the globe. 

One of the most defining factors of Bitcoin is decentralization, which means that it’s not controlled or run by any single individual or entity. Rather, it’s maintained and secured by thousands of computers (known as nodes) all over the world. These computers are run by regular people like you and me, just like anyone can contribute to Wikipedia. 

Bitcoin has a finite coin supply of 21 million, meaning once that supply is reached, normal coins will be released. The rate at which new coins are released is reduced by half at approximately every four years. The first halving was in 2012, the next in 2016, and the latest one happened in May 2020.

Despite having no physical proof of existence, Bitcoin has proven to be a very attractive financial instrument to investors. This is partly because unlike Fiat currency that is issued and controlled by governments, Bitcoin is self issuing, and its value as a currency is fully determined by people’s perception/acceptance. It’s the same thing when it comes to exchanging with other users. Users can transfer Bitcoin among themselves on a purely peer-to-peer (P2P) basis. 

When Bitcoin was only starting out, anyone with a regular computer could ‘mine‘ and own the currency. But after the currency gained traction, the mining difficulty increased, rendering regular computers ineffective and necessitating the invention of more powerful computers known as application-specific integrated circuits (ASICs).

The problem is, ASICs cost a neat penny. Not just that, Bitcoin mining is now mostly done by entire mining ‘farms’ who more or less control the whole Bitcoin mining endeavor. With these odds stacked against them, the average aspiring Bitcoin investor has no choice but to purchase the currency. 

What you Need to Know Before You Begin

Bitcoin is a purely internet-based currency. That, therefore, calls for entirely different approaches to security and storage. That means there are a few things that you need to know before you even dive into handling Bitcoin.

If you want to invest in Bitcoin, you’re going to need a crypto wallet, your ID credentials, a secure internet connection, and a method of payment. After assembling those things, you need to sign up at a cryptocurrency exchange of your choice. A method of payment can either be bank wire, debit card, or credit card. These are the requirements for purchasing Bitcoin from a cryptocurrency exchange, which is one of several ways of obtaining Bitcoin. Purchasing bitcoin from an exchange is one of the safest sources and because there’s virtually no chance of fraud. 

Something else you should look out for is privacy and security. Privacy here means that, let it be only you that knows how much Bitcoin you own. Bragging about the size of your holdings is a bad idea. That’s because when you let the world know that you own Bitcoin, you could very well be attacked – and that means both digitally and physically. 

How can you be attacked digitally? This could be a ransomware attack, a SIM swap attack, hacking, phishing attacks, and so on. As for physical attacks, there’s no shortage of stories of people that have been kidnapped and forced to give up their Bitcoin private key. A private key is like your bank account PIN. When you give up your private key, you’ve given up control and access to your funds. 

Your private key should be guarded at all costs. You need to know that anytime you make a transaction, the person at the other end can see your account balance because it’s publicly available in your public address. It’s not a good idea for someone to know your account balance. So, if possible, keep any large holdings in different public addresses from the ones that you use for regular transactions. 

And finally, be aware that all the history of transactions on the Bitcoin blockchain is transparent for everyone to see. What’s available, though, is public addresses. Your personal identifying information is not. Bitcoin transactions are private, but not anonymous. Indeed, Bitcoin transactions are best described as pseudonymous. Here’s the thing: anyone with enough resources and determination can, by using blockchain analysis, track down the real-life identity of the individual behind a transaction. 

To counter this, various technologies have been invented to achieve complete anonymity for Bitcoin transactions. These include Bitcoin mixers

Getting Started 

Now that you know what you need to know, let’s go through the steps of acquiring Bitcoin. 

#1. Get a Bitcoin Wallet

Unlike Fiat currency that’s stored in the bank, Bitcoin has to be stored in a cryptocurrency wallet. That will allow you to receive, send, and transfer Bitcoin. There are two main types of crypto wallets: software and hardware. Software wallets are based on the internet (including wallets provided by crypto exchanges), while hardware wallets are kept offline.

Software wallets are not ideal because they are subject to online vulnerabilities. Hardware wallets, which are devices typically resembling a flash drive, provide much more protection since they can’t be hacked. Some of the best hardware wallets in the market include Ledger Nano S, Ledger Nano X, Trezor Model One, Trezor Model T, and KeepKey. 

#2. Connect a Bank Account

The next thing you need to do is connect your wallet to a bank account, debit, or credit card. Be aware that each of these methods has its own fees. If you use a bank account, expect to wait for at least four to five days for transactions to go through. With a bank account, you can buy and sell Bitcoin and get money deposited directly into your account. A bank account is better, security-wise, if you’re dealing with huge sums of money. 

With credit and debit cards, you can buy Bitcoin almost instantly. However, most exchanges only allow you to buy crypto, and even then, there’s a limit to how much you can buy. You cannot sell Bitcoin or deposit money into your bank account if you’re using a debit or credit card. 

#3. Sign up on a Bitcoin Exchange

A Bitcoin exchange is an online-based marketplace where you can buy, sell, or exchange Bitcoin. Just like there are many online markets for regular products – Amazon, eBay, and Alibaba, you’ll also find a variety of Bitcoin exchanges. 

Different exchanges have different reputation, reliability, user experience, pay structure, exchange rates, and the available cryptocurrencies for trading. Before you stick with one, look around. Here are some of our recommendations. 

Coinbase: This is US-based crypto and one of the ‘mainstream’ exchanges. It supports Bitcoin, Ethereum, Litecoin, Tezos, Ripple, EOS, cryptocurrencies. 

Binance: At the time of writing, Binance is the world’s largest crypto exchange by volume. It also supports the majority of the major cryptocurrencies. Unlike many exchanges, Binance charges a 0.1% fee for all trades.

Square Cash: This is an app exchange by online payments company Square. The app is mighty convenient for users of the Square platform. The app aims to enable users to buy and sell Bitcoin as quickly and as frictionlessly as possible.

#4. Place an order

After signing up at your preferred exchange, you’re now set to purchase Bitcoin. Congratulations. Even if you can’t afford one Bitcoin, which goes for several thousand dollars, thou shalt not fret. You can still purchase Bitcoin in its small, infinitesimal divisions called Satoshis

Other ways to Acquire or Invest in Bitcoin

We’d be remiss if we didn’t mention the other ways apart from exchanges through which you can acquire Bitcoin. Some of these include: 

Bitcoin ATMs: These are kiosks that allow you to buy or sell Bitcoin. As of July 25, 2020, Coin ATM radar indicates that there are currently 8805 Bitcoin ATMs in 73 countries.

Peer-to-peer Bitcoin sites: These are platforms that allow you to purchase Bitcoin directly from other owners. Examples include Bisq, Remitano, and LocalBitcoins.com. Always exercise extra caution when purchasing Bitcoin directly from individuals. 

Bitcoin Futures: For the more experienced investors, Bitcoin futures are another way to get involved in Bitcoin. 

Mining: If you can afford ASICs, then you can absolutely join a mining pool and start earning Bitcoin. 

Final Thought

Now that you have a grasp of how to own Bitcoin, you’re better prepared to start investing. Remember to do thorough research on any crypto exchange before you sign on. Read reviews, look at the supported currencies, and so on. Also, remember Bitcoin’s price is uber unpredictable, so only invest money that you can afford to lose. 

Categories
Crypto Market Analysis

Daily Crypto Review, July 31 – Binance Debit Cards Now in Europe; XRP Whales Started Buying?

The cryptocurrency market mostly traded sideways as Bitcoin still continues its fight for $11,000. Bitcoin is currently trading for $11,065, which represents a decrease of 0.43% on the day. Meanwhile, Ethereum gained 4.76% on the day, while XRP gained 2.04%.

 Daily Crypto Sector Heat Map

When talking about top100 cryptocurrencies, Chilliz gained 29.75% on the day, making it the most prominent daily gainer. Bancor (14%) and VeChain (12.22%) also did great. On the other hand, Ampleforth has lost 45.57%, making it the most prominent daily loser. It is followed by Flexacoin’s loss of 8.58% and Quant’s loss of 8.06%.

Top 10 24-hour Performers (Click to enlarge)

Bottom 10 24-hour Performers (Click to enlarge)

Bitcoin’s dominance level decreased slightly since we last reported, with its value currently at 62.91%. This value represents a 0.75% difference to the downside when compared to yesterday’s value.

Daily Crypto Market Cap Chart

The cryptocurrency market capitalization increased slightly since we last reported. Its current value is $328.13 billion, which represents an increase of $3.04 billion when compared to the value it had yesterday.

_______________________________________________________________________

What happened in the past 24 hours?

_______________________________________________________________________

_______________________________________________________________________

Technical analysis

_______________________________________________________________________

Bitcoin

The largest cryptocurrency by market capitalization spent the day fighting for $11,000 yet again. The sideways movement ranged from the support of $10,855 to a little above $11,090 resistance level. While it is still unsure of whether Bitcoin will end up above or below $11,000, the rally from the $9,000 levels has been extremely successful. As for the short-term future of Bitcoin, it is still unsure, as some analysts call for an immediate correction while others predict a price increase to $11,500 levels.

BTC traders should look for a trade opportunity when BTC bounces off of $10,855 or falls below it.

BTC/USD 4-hour Chart

Technical factors:

  • Price is currently above its 50-period EMA and its 21-period EMA
  • Price is between its top B.B. and its middle B.B (20-period SMA)
  • RSI is elevated (60.82)
  • Volume increased (descending)

Key levels to the upside          Key levels to the downside

1: $11,090                                1: $10,855

2: $11,630                                2: $10,505

                                                 3: $10,015

Ethereum

Ethereum broke off from its period of stagnation and moved towards the upside. The second-largest cryptocurrency by market cap moved to $340 before being stopped. ETH is now consolidating just above the previous consolidation phase.

Ethereum traders should look for a trade opportunity after the cryptocurrency moves back below $324 or if it makes another move towards the upside.

ETH/USD 4-hour Chart

Technical Factors:

  • Price is above the 50-period EMA and the 21-period EMA
  • Price is at the top B.B.
  • RSI is elevated (66.5)
  • Above-average volume (descending)

Key levels to the upside          Key levels to the downside

1: $340                                    1: $302

2: $362                                    2: $289

                                                 3: $278

Ripple

XRP spent its day mostly trading sideways, but also gaining in value slightly. The third-largest cryptocurrency by market cap failed (so far) to break the $0.2454 level completely, but it has approached that event considerably. If, however, XRP doesn’t break the resistance level soon, it might fall back and retest the support level of $0.235.

XRP traders can look for an opportunity when the cryptocurrency breaks its ranging moves to either side.

XRP/USD 4-hour Chart

Technical factors:

  • XRP in a mid-term descending trend (though it broke the trend in the short-term)
  • Price above 21-period and the 50-period EMA
  • Price is between the top B.B. and the middle B.B. (20-period SMA)
  • RSI is elevated (61.84)
  • Elevated volume (descending)

Key levels to the upside          Key levels to the downside

1: $0.245                                  1: $0.235  

                                                2: $0.227

                                               3: $0.214


Categories
Cryptocurrencies

A Look at Bitcoin Derivatives – Futures, Perpetual Swaps and Options

The key to Bitcoin’s allure as an investment is its price fluctuations. The fluctuations give investors the choice to buy when the price is bearish and sell when the price is bullish. 

But after the 2017 incredible bull run, Bitcoin seems to have adopted a more predictable price action. While the coin experiences volatility, it’s not up to the level where many investors would consider “exciting.”  

For this reason, speculators looking for, well, more exciting trades are flocking to Bitcoin derivatives. Global trading of these products already even surpassed Bitcoin

So what are derivatives exactly? Read on. 

What are Derivatives? 

A derivative is a tradable security whose value is derived from or relies on an underlying asset. Derivatives are not a modern phenomenon. Indeed, they go as far back as medieval times when merchants all over Europe would use them to facilitate trades and take part in periodical fairs. 

Today, derivatives have become an integral part of everyday trading. Generally, they belong to the more sophisticated and high-risk realm of trading. Examples of derivatives include swaps, futures, options, swaps, and warrants. 

With that,

Let’s explore Bitcoin derivatives

#1. Bitcoin Futures

Bitcoin futures are an agreement or contract to sell or buy Bitcoin at a predetermined price at a predetermined date in the future. Bitcoin futures give investors the opportunity to participate in the Bitcoin market without having to purchase the underlying currency. 

By trading in Bitcoin futures, investors get certain benefits as opposed to if they were trading in Bitcoin directly. First, trades take place on an exchange regulated by the Commodities Futures Trading Commission, which would give investors who are risk-averse more confidence to participate. Second, futures are settled in Fiat, which means investors do not need to sign up for or invest in a Bitcoin wallet. 

Of all Bitcoin derivatives, futures were the first to really explode into the market, and they remain the most actively traded today. Before they caught on, BTC futures were trading in lesser-known platforms. It’s only in 2014 when increased demand prompted major exchanges such as CME Group Inc and Cboe Global Markets to start offering the service. Bitcoin futures today lead other Bitcoin derivatives in terms of adoption and market activity. 

#2. Bitcoin Perpetual Futures (Swaps)

The Bitcoin market also supports derivatives known as perpetual futures or swaps, which are a lot like the standard futures discussed above, except they do not have an expiry date, a predetermined date on which they are to be settled. 

Since the contract will never expire, both the parties can hold the position indefinitely, as long as their BTC count holds enough funds to cover them. 

Perpetual futures use a mechanism called funding rate, which is a small fee that keeps the price of a contract near the underlying spot price index to cushion against major deviations. Funding rates usually correlate with market sentiment. When the market is bullish, funding rates will be positive, and when the market is bearish, funding rates will tend to be negative. 

The funding rates are exchanged between the two participants in a contract (long and short parties) – it’s not a fee collected by the exchange. 

Note: Both perpetual features and the funding rate phenomenons were invented by crypto exchange Bitmex. 

#3. Bitcoin Options

Bitcoin options are derivatives that track the Bitcoin market over time. A trader invests in an option by buying the “option” or right (but not obligation) to sell or buy the asset at a set price (known as the strike price) in the future.

Options contracts can either be of two types: call and put. Call options give you the right to purchase underlying assets before or on a specific date. Put options give you the right to sell it. 

Options contracts can also be either European or American. An American option allows you to exercise options rights at any time during the life of a contract (before and on the date of expiration), while the European option can only be executed on the day of expiration.

Owning the rights to an option means that you reserve the right to buy or sell on the expiry date. If you don’t, the contract simply lapses. However, you lose the money you paid for the contract. 

Just like futures, options are settled in cash but bear very little risk compared to futures. With futures, both parties (buyer and seller) have unlimited risk and reward (since the price of Bitcoin can go any direction before the settlement). For options, however, only buyers have an unlimited reward for a limited risk, while sellers have unlimited risk and very limited reward.

Categories
Crypto Daily Topic

Top 5 Anonymous Cryptocurrency Wallets

Did you know that Bitcoin is not anonymous? Yes, your public address can be used to link your transactions with your real identity. This is obviously,  not ideal because if it happens, an attacker will stop at nothing to hack your account. And at this point, you already know that crypto is the target of all manner of scams, fraud, and theft attempts. What this means is you cannot leave any stone unturned when it comes to protecting your crypto funds. 

One of the best ways to do that is to use an anonymous wallet. Anonymous wallets keep your info away from your transactions. They also obscure the movement of your money, so snooping parties are thrown off. 

That said, which anonymous wallets are out there? We did a breakdown of five of the best, so you know which option is best for you. 

#1. Samourai Wallet (Mobile, Bitcoin-only)

Samourai is a wallet that keeps your transactions private, your identity under wraps, and your crypto secure. And if the statement on their website is anything to go by, the team behind the wallet is pretty serious about what they’re doing. The group introduces themselves as: “…privacy activists who have dedicated their lives to creating the software that Silicon Valley will never build, the regulators will never allow, and VC’s will never invest in. We build the software that Bitcoin deserves.” 

Samourai utilizes the following features to keep you off the trail:

Stonewall: A feature that thwarts address clustering efforts that would  deanonymize you

PayNym: Having your public address online makes you vulnerable to tracking attempts. PayNyms prevent this from ever happening by keeping the public address between just the two involved parties (sender and receiver)

Scrambled PIN: PIN access is randomized every time you’re accessing the wallet. Also, the PIN is never visually presented. This way, screen recording spyware, and similar attempts are effectively thwarted.

Stealth Mode: A cool feature that removes the Samourai Wallet from your phone’s launcher, home screen, and app list. Instead, to reveal the wallet, you need to dial a secret PIN code. 

#2. Wasabi Wallet (Desktop, Bitcoin-only)

Wasabi is a BTC wallet that is ‘unfairly private.’ The wallet implements CoinJoin and Tor to protect your privacy and anonymize your transactions.

Conjoin is an anonymization strategy that ‘mixes’ multiple users’ transactions so that it’s hard for third parties to identify which transaction belongs to which user. It’s impossible, even for the CoinJoin coordinator, to track each transaction.

All transactions go through Tor, providing an extra layer of privacy and anonymity. Currently, Wasabi is only available for desktop macOS, Windows, Ubuntu, and Linux systems. 

#3. Unstoppable (Android and iOS, Multiple currencies)

Unstoppable is a mobile wallet that enables you to interact with local currencies in a safe, independent, and private manner. You don’t need an account, email, phone number, KYC, or third-party service to start using Unstoppable. It also utilizes ‘input/output randomize’ so no one can track incoming and outgoing transactions. This throws off any third party monitoring your transactions either when you’re transacting or in the future. Unstoppable also employs ‘no address reuse’ so that there’s no single trail of your transaction history.

The wallet currently supports Bitcoin (BTC), Ethereum (ETH), all ERC20 tokens, Binance Chain (BNB), and BEP2 tokens, Dash (DASH), Litecoin (LTC) and Bitcoin Cash (BCH).

An Unstoppable wallet also educates users on crypto essentials so that users can get acquainted with the basics of the industry. On the app, users also get daily insights into what’s happening in the crypto market. You can also trade/exchange Ethereum and  ERC20 tokens right on the app.

Unstoppable also uses secure storage mechanisms provided by Android so that no one can access your funds should your phone get stolen or lost.

#4. Electrum on Tails OS

Electrum is one of the most trusted crypto wallets. Using Electrum integrated with the Tails operating system can guarantee users full anonymity. The Tails OS runs your activity through Tor, making it impossible for third parties to track your transactions. 

If you’re wondering what Tails is, it’s a software explicitly designed to anonymize user online presence. “Tails is a live system that aims to preserve your privacy and anonymity. It helps you to use the internet anonymously and circumvent censorship almost anywhere you go and on any computer but leaving no trace unless you ask it explicitly. It is a complete operating system designed to be used from a USB stick or a DVD independently of the computer’s original operating system. It is a free software and based on Debian GNU/Linux.” 

Like many other anonymity wallets, you don’t need to enter any personal information during setup. Electrum also supports a ‘no address reuse’ feature so that no one can track your transaction history by using just one address. The wallet also supports plugins for third-party wallets and multi-signature services. 

If you plan to or are using a hardware wallet, you can use it in conjunction with Electrum. The wallet supports third-party plugins for popular hardware wallets as well as multi-signature services. This wallet is best suited for the more tech-savvy users who have no difficulty using alternative operating systems. If I would rather stick to a wallet with everything in-house, then you might need to skip this option.

#5. BitLox (Hardware, Bitcoin Cash and Bitcoin Gold)

BitLox is a hardware wallet that, on top of anonymization, comes with a host of features that users will find highly desirable. The wallet supports hidden wallets – which is hidden wallet data that is indistinguishable from random bytes in such a way that only you know that data is there. 

Bitcoin comes in three sets: BitLox Advanced, BitLox Ultimate, and BitLox Extreme Privacy. BitLox Advanced, made from aerospace alloys, is the simplest of them all. But that doesn’t mean it’s simple when it comes to ensuring user funds’ security. The option comes with 100 different wallets, with each capable creating an infinite number of addresses. 

The  Ultimate option only differs from the Advanced option in the material that makes it: titanium. The Extreme Privacy option is fortified with military-grade USB fault and comes with the Tails OS so that your activity it’s completely anonymous. 

Other amazing features of BitLox include multi-language support, several layers of PIN protection when you’re logging in and for every single transaction, and the deletion of all user data in case the emergency PIN is required. This means even if your wallet lands in the wrong hands, they can’t use your PIN, mnemonic phrase, and so on to access your funds.

Categories
Crypto Market Analysis

Daily Crypto Review, July 30 – Bitcoin Confirmed as Better Hedge than Gold? BTC fighting for $11,000

The cryptocurrency market mostly traded sideways as Bitcoin was fighting to regain $11,000. Bitcoin is currently trading for $11,065, which represents an increase of 1.2% on the day. Meanwhile, Ethereum gained 0.33% on the day, while XRP gained 0.45%.

 Daily Crypto Sector Heat Map

When talking about top100 cryptocurrencies, Travala.com gained 21.78% on the day, making it the most prominent daily gainer. Digitex Futures (16.68%) and Aave (11.94%) also did great. On the other hand, Ampleforth has lost 35.64%, making it the most prominent daily loser. It is followed by Aurora’s loss of 10% and iExec RLC’s loss of 8.31%.

Top 10 24-hour Performers (Click to enlarge)

Bottom 10 24-hour Performers (Click to enlarge)

Bitcoin’s dominance level increased slightly since we last reported, with its value currently at 63.66%. This value represents a 0.35% difference to the upside when compared to yesterday’s value.

Daily Crypto Market Cap Chart

The cryptocurrency market capitalization increased since we last reported. Its current value is $325.17 billion, which represents an increase of $4.246 billion when compared to the value it had yesterday.

_______________________________________________________________________

What happened in the past 24 hours?

_______________________________________________________________________

_______________________________________________________________________

Technical analysis

_______________________________________________________________________

Bitcoin

The largest cryptocurrency by market capitalization had another slow day, where it tried to pass $11,000 and consolidate above it. However, while it has passed the threshold, BTC hasn’t confirmed its position above it, making the $11,000 mark uncertain. The $10,855 support level is, on the other hand, a strong support that has been confirmed.

BTC traders should look for a trade opportunity when BTC bounces off of $10,855 or falls below it.

BTC/USD 4-hour Chart

Technical factors:

  • Price is currently above its 50-period EMA and its 21-period EMA
  • Price is between its top B.B. and its middle B.B (20-period SMA)
  • RSI is elevated (62.24)
  • Volume increased (descending)

Key levels to the upside          Key levels to the downside

1: $10,855                               1: $10,505

2: $11,090                               2: $10,015

3: $11,630                                3: $9,870

Ethereum

Ethereum spent its day consolidating above the $315 level, finding support at the 21-period moving average. The second-largest cryptocurrency by market cap ensured its position above $302 (at least in the short-term). Its future movement will most likely be determined by Bitcoin’s next move.

Ethereum traders should look for a trade opportunity after the cryptocurrency breaks its consolidation phase.

ETH/USD 4-hour Chart

Technical Factors:

  • Price is above the 50-period EMA and the 21-period EMA
  • Price is under the middle B.B. (20-period SMA)
  • RSI has normalized (56.41)
  • Above-average volume (descending)

Key levels to the upside          Key levels to the downside

1: $340                                    1: $302

2: $362                                    2: $289

                                                 3: $278

Ripple

Unlike Bitcoin and Ethereum, the third-largest cryptocurrency by market cap maintained high volume and tried to make a move that would break its current ranging position. XRP first moved to the upside, trying to break $0.2454, but failed to do so, which triggered a reaction from XRP bears. The cryptocurrency then made an attempt to break $0.235 to the downside but failed in doing that as well, therefore “locking” XRP in a range between the two resistances.

XRP traders can look for an opportunity when the cryptocurrency breaks its ranging moves to either side.

XRP/USD 4-hour Chart

Technical factors:

  • XRP in a mid-term descending trend (though it broke the trend in the short-term)
  • Price above 21-period and the 50-period EMA
  • Price is between the top B.B. and the middle B.B. (20-period SMA)
  • RSI is elevated (65.63)
  • Elevated volume

Key levels to the upside          Key levels to the downside

1: $0.235                                  1: $0.227 

2: $0.245                                  2: $0.214

                                               3: $0.205


Categories
Crypto Market Analysis

Daily Crypto Review, July 29 – BTC consolidating under $11,000; XRP Skyrocketing

The cryptocurrency market mostly traded sideways after major breakthroughs in the past ten days. Bitcoin is currently trading for $10,880, which represents a decrease of 2.76% on the day. Meanwhile, Ethereum lost 3.38% on the day, while XRP gained 2.42%.

 Daily Crypto Sector Heat Map

When talking about top100 cryptocurrencies, Aave gained 20.59% on the day, making it the most prominent daily gainer. iExec RLC (20.52%) and THORChain (19.48%) also did great. On the other hand, Ampleforth has lost 16.44%, making it the most prominent daily loser. It is followed by Digitex Futures’ loss of 12.01% and HedgeTrade’s loss of 11.28%.

Top 10 24-hour Performers (Click to enlarge)

Bottom 10 24-hour Performers (Click to enlarge)

Bitcoin’s dominance level decreased since we last reported, with its value currently at 63.31%. This value represents a 1.02% difference to the downside when compared to yesterday’s value.

Daily Crypto Market Cap Chart

The cryptocurrency market capitalization skyrocketed and now confirmed its position above the $300 billion mark. Its current value is $320.93 billion, which represents a decrease of $0.06 billion when compared to the value it had yesterday.

_______________________________________________________________________

What happened in the past 24 hours?

_______________________________________________________________________

_______________________________________________________________________

Technical analysis

_______________________________________________________________________

Bitcoin

The largest cryptocurrency by market capitalization had a rather slow day, unlike the past days, which passed in BTC making significant gains. The volume is slowly fading away while the price is trying to find resistance. Bitcoin fell under $11,000 and is currently consolidating above the $10,855 support level. However, it is still unsure if Bitcoin will stay above it or fall under.

BTC traders should look for a trade opportunity when BTC breaks $10,855 to the downside or $11,090 to the upside.

BTC/USD 4-hour Chart

Technical factors:

  • Price is currently above its 50-period EMA and its 21-period EMA
  • Price is between its top B.B. and its middle B.B (20-period SMA)
  • RSI is elevated (69.73
  • Volume greatly increased (descending)

Key levels to the upside          Key levels to the downside

1: $10,855                               1: $10,505

2: $11,090                               2: $10,015

3: $11,630                                3: $9,870

Ethereum

Ethereum also had a slow day, while its price drop reflected Bitcoin’s drop (percentage-wise). The second-largest cryptocurrency by market capitalization is trying to consolidate around the $315 mark, while its volume is fading. Ethereum has strong support at $302, which might get challenged shortly.

Ethereum traders should look for a trade opportunity after the cryptocurrency is done with consolidating.

ETH/USD 4-hour Chart

Technical Factors:

  • Price is above the 50-period EMA and the 21-period EMA
  • Price is at the middle B.B. (20-period SMA)
  • RSI is elevated (58.66)
  • Extremely high volume (descending)

Key levels to the upside          Key levels to the downside

1: $340                                    1: $302

2: $362                                    2: $289

                                                 3: $278

Ripple

Unlike Bitcoin and Ethereum, the third-largest cryptocurrency by market cap had quite a good day, which brought its price above $0.227 and $0.235 resistance levels. XRP made a move, which was sparked by an influx of buyers. The move is still not over, and XRP is fighting to stay above $0.235, though that is unlikely unless the cryptocurrency pushes its price towards the $0.245 level.

XRP traders can look for an opportunity in pullbacks after the bullish move.

XRP/USD 4-hour Chart

Technical factors:

  • XRP in a mid-term descending trend (though it broke the trend in the short-term)
  • Price above 21-period and the 50-period EMA
  • Price is above the top B.B.
  • RSI is in the overbought territory (73.69)
  • Elevated volume

Key levels to the upside          Key levels to the downside

1: $0.235                                  1: $0.227 

2: $0.245                                  2: $0.214

                                               3: $0.205


Categories
Crypto Market Analysis

Daily Crypto Review, July 28 – Bitcoin Spikes to $11,000; Over $300 Million Liquidated

The cryptocurrency market spent made yet another boom as Bitcoin passed the $11,000 benchmark. Bitcoin is currently trading for $11,024, which represents an increase of 7.7% on the day. Meanwhile, Ethereum lost 1.04% on the day, while XRP gained 2.85%.

 Daily Crypto Sector Heat Map

When talking about top100 cryptocurrencies, Kava.io gained 14.29% on the day, making it the most prominent daily gainer. Divi (13.17%) and Band Protocol (12.84%) also did great. On the other hand, Ampleforth has lost 23.81%, making it the most prominent daily loser. It is followed by Flexacoin’s loss of 17.11% and Augur’s loss of 11.43%.

Top 10 24-hour Performers (Click to enlarge)

Bottom 10 24-hour Performers (Click to enlarge)

Bitcoin’s dominance level increased since we last reported, with its value currently at 64.33 %. This value represents a 2.78% difference to the upside when compared to yesterday’s value.

Daily Crypto Market Cap Chart

The cryptocurrency market capitalization skyrocketed and now confirmed its position above the $300 billion mark. Its current value is $320.99 billion, which represents an increase of $20.52 billion when compared to the value it had yesterday.

_______________________________________________________________________

What happened in the past 24 hours?

_______________________________________________________________________

_______________________________________________________________________

Technical analysis

_______________________________________________________________________

Bitcoin

It’s safe to say that the largest cryptocurrency by market capitalization had another amazing day as it broke a major benchmark of $11,000 and reaching a final price of $11,394 before cooling down. The moment Bitcoin broke $10,000, on-chain activity registered a great increase in exchange inflow, which ultimately led to this fast price increase. During the process, Bitcoin managed to liquidate over $300 million in sell orders.

BTC traders should look for a trade opportunity either with another move up (aggressive) or when the price cools down slightly and makes a top (safer).

BTC/USD 4-hour Chart

Technical factors:

  • Price is currently above its 50-period EMA and its 21-period EMA
  • Price is slightly below its top B.B.
  • RSI is in severely overbought territory (84.33)
  • Volume greatly increased

Key levels to the upside          Key levels to the downside

1: $10,855                               1: $10,505

2: $11,090                               2: $10,015

3: $11,630                                3: $9,870

Ethereum

Ethereum looks like it has found its top at $330 after rising in price for the past 6 days. The final move brought the second-largest cryptocurrency by market cap to the highs of $333 before cooling off a bit. Ethereum now seems like it will (if nothing major happens to Bitcoin) possibly head towards the nearest support level to test it.

Ethereum traders should look for a trade opportunity in Ethereum’s pullbacks and confirmations.

ETH/USD 4-hour Chart

Technical Factors:

  • Price is above the 50-period EMA and the 21-period EMA
  • Price is below the top B.B.
  • RSI elevated (64.32)
  • Extremely high volume

Key levels to the upside          Key levels to the downside

1: $340                                    1: $302

2: $362                                    2: $289

                                                 3: $278

Ripple

The third-largest cryptocurrency by market cap had quite a stable day as it confirmed its path above $0.214. XRP then bounced up and tried to make a break above the $0.227. However, the move was unsuccessful due to the wall of sellers present. XRP will most likely continue to trade within a range, bound by $0.214 to the downside and $0.227 to the upside.

XRP traders can look for an opportunity within the range XRP is currently trading in.

XRP/USD 4-hour Chart

Technical factors:

  • XRP in a mid-term descending trend (though it broke the trend in the short-term)
  • Price above 21-period and the 50-period EMA
  • Price is below the top B.B.
  • RSI is elevated (61.27)
  • Average/slightly higher than average volume

Key levels to the upside          Key levels to the downside

1: $0.227                                  1: $0.214

2: $0.235                                  2: $0.205

3: $0.245                                 3: $0.2


Categories
Crypto Market Analysis

Daily Crypto Review, July 24 – Bitcoin Above $10,000; Ethereum Passing $300

The cryptocurrency market spent had quite a bullish weekend. Out of the major cryptocurrencies, Ethereum and Bitcoin broke the strongest barriers. Bitcoin is currently trading for $10,050, which represents an increase of 3.95% on the day. Meanwhile, Ethereum gained 6.42% on the day, while XRP gained 1.04%.

 Daily Crypto Sector Heat Map

When talking about top100 cryptocurrencies, Elrond gained 22.75% on the day, making it the most prominent daily gainer. Status (10.69%) and Terra (9.44%) also did great. On the other hand, Synthetix Network has lost 10.39%, making it the most prominent daily loser. It is followed by Band Protocol’s loss of 6.95% and Aave’s loss of 6.76%.

Top 10 24-hour Performers (Click to enlarge)

Bottom 10 24-hour Performers (Click to enlarge)

Bitcoin’s dominance level decreased slightly since we last reported, with its value currently at 61.51%. This value represents a 0.78% difference to the downside when compared to Friday’s value.

Daily Crypto Market Cap Chart

The cryptocurrency market capitalization skyrocketed and broke the $300 billion mark. Its current value is $300.47 billion, which represents an increase of $13.24 billion when compared to the value it had on Friday.

_______________________________________________________________________

What happened in the past 24 hours?

_______________________________________________________________________

_______________________________________________________________________

Technical analysis

_______________________________________________________________________

Bitcoin

The largest cryptocurrency by market capitalization had an amazing weekend, which ended with it breaking the $10,000 mark. Bitcoin experienced a steady increase in price for six days now, slowly breaking each obstacle in its path. The final move, which broke $10,000, was a bit hectic as the wall of sellers kept the price down for quite a bit. Bitcoin is now held from going up by the ascending resistance level. However, the “battle” for $10,000 is not over yet, as Bitcoin did not make a strong confirmation move.

BTC traders should look for a trade opportunity after BTC decides whether it will move above or below $10,000.

BTC/USD 4-hour Chart

Technical factors:

  • Price is currently above its 50-period EMA and its 21-period EMA
  • Price is above its top B.B.
  • RSI is in the overbought territory (76.57)
  • Volume Increased

Key levels to the upside          Key levels to the downside

1: $10,015                               1: $9,870

2: $10,505                               2: $9,735

3: $10,855                                3: $9,580

Ethereum

Ethereum, just like Bitcoin, made some amazing gains as well as broke major resistance levels over the course of the weekend. The second-largest cryptocurrency by market cap spent the past five days rising sharply towards the upside due to its booming fundamentals. The weekend ended with Ethereum moving past $300 and pushing to $325, with the move still continuing. With the RSI being heavily overbought and volume slowly declining, traders can expect the move to end soon.

Ethereum traders should look for a trade opportunity in Ethereum’s pullbacks from the big move towards the upside.

ETH/USD 4-hour Chart

Technical Factors:

  • Price is above the 50-period EMA and the 21-period EMA
  • Price is above the top B.B.
  • RSI severely overbought (82.86)
  • Extremely high volume

Key levels to the upside          Key levels to the downside

1: $340                                    1: $302

2: $362                                    2: $289

                                                 3: $278

Ripple

The third-largest cryptocurrency by market cap had a good weekend, though not quite as good as Bitcoin and Ethereum. XRP established its position above $0.214, which is a great mid-term indicator. While the initial bullish move got stopped by the $0.227 and XRP started moving towards the downside, the current position XRP is in is quite good.

XRP traders can look for an opportunity within the range XRP is currently trading in.

XRP/USD 4-hour Chart

Technical factors:

  • XRP in a mid-term descending trend (though it broke the trend in the short-term)
  • Price above 21-period and the 50-period EMA
  • Price is below the top B.B.
  • RSI is elevated (64.47)
  • Average/slightly higher than average volume

Key levels to the upside          Key levels to the downside

1: $0.227                                  1: $0.214

2: $0.235                                  2: $0.205

3: $0.245                                 3: $0.2


Categories
Crypto Education

Forex to Crypto Trading: Making the Transition

Have you noticed how each and every post, podcast, and video out there focus only on one form of trading? If you happened to be wondering why someone who stresses on their success only highlights a single market’s potential, you are on the right track. Also, isn’t it interesting how many traders look up what’s new and they take on a new market, completely dropping what they did before as if their shiny new toy was going to render more success despite not having learned anything before? If you have already done some forex trading, and if you browsed through whatever available material there was, you then may have also wondered how understanding other markets could help you prosper. If that is the case, or if you are here for some fresh insight, in today’s discussion we are going to take on a road less traveled and provide you with the reasons why anyone should expand their range of trading experience from the forex to the crypto market.

The topic of expansion is often conditioned by various factors. You are allowed to expand, but when your projections and beliefs go against your primary community, you are either considered to be unrealistic or you may start questioning your judgment. What so many fail to see is that true knowledge comes not only from spreading out across one market’s ecosystem but from expanding across several markets as well. The truth is that no market should ever enjoy the exclusive privilege of being the one way to go about trading.

This topic of superiority has only limited traders from using real-life opportunities to learn how to make more money. What is more, those who recognized the importance of going wide also understand the changing nature of the markets we trade. We need to look for ways to always be a part of the game because we may wake up one day to find out that the currencies we know no longer have the same meaning and importance as they did before. Therefore, by making a conscious decision to learn about other forms of trading you protect your investment and your future as a trader.

Quite interestingly, although both the fiat and the crypto markets revolve around the topic of currency, any cryptocurrency trader who ever tried to boldly copy and paste strategies onto the forex market without attempting to learn before making any decisions probably failed initially. Unlike this situation, all forex traders who shifted to the crypto market faced considerably fewer challenges in comparison to the previous scenario. Although no market is exempt from failure, which can indeed be painful and quite costly too at times, we need to understand what it is that forex traders seem to know about trading that makes such a vast difference in overall trading experience and, naturally, the related financial reward. If you are interested in the topic of cryptocurrency and you strive to become a more affluent trader, then there should not be any reasons for you not to absorb whatever you may have learned about forex and extend this knowledge and previously acquired skills to another market.

The remaining questions, quite understandably, reveal the concern where to start looking. What are the steps that forex traders use to buffer some inevitable challenges looming in the cryptocurrency market? Which factors make it easier for the individuals engrossed in the fiat market to engage in trading cryptocurrencies rather than vice versa? Even though the questions are many, to be able to answer them, we may need to address the overall climate of the two markets first. The answers are often not quantitative, but qualitative, so to provide direct and useful advice that can be transferred to a certain degree from forex to crypto trading, we need to assess the entire setting surrounding both markets. In addition, we need to comprehensively assess how these environments and differences can allow the experience with one market to serve any future involvement with the other.

What each forex trader can testify is that most fiat-driven individuals are deeply immersed in the topic of trading and devoted to the exploration of new and useful information. The blogs and videos on this topic are growing in numbers on a daily basis and the search for the best indicators is as vigorous as it has always been. The same can be said about the world of cryptocurrency, yet there is one essential difference that directly and profoundly impacts a trader’s mindset. While we can see that the two communities experience an almost identical degree of devotion to the development and the desire to grow financially, it is the nature of the traders’ involvement in these communities that make a clear distinction between them.

Unlike the fiat realm, there is an air of neediness to communicate and share one’s expectations between crypto traders. An average crypto trader would commonly turn to the community, waiting for the announcements of upcoming events. Unfortunately, this exchange of information often projects an unrealistically optimistic perspective disguised as mutual support, and the charged-up atmosphere, aside from elevated emotions, often fails to produce any lucrative outcome. As contacts and groups, we engage with professionally help shape our careers, such specific collaboration typical of the crypto market produces a distinctive trader profile, which should be the focal point of research for any forex turn crypto trader.

To further describe why the overall trading climate is so relevant for the growth of every trader, we need to think about the topic of independence. As a forex trader, you may be on the lookout for some useful tips and success stories, but you will eventually need to test these out ether in the demo or in the real world, which needless to say does not apply to the crypto market. The crypto community still consists of individuals who seem to be lacking individuality in decision-making, always watching out for the approval or reassurance from their peers. These may seem to be insignificant differences on the surface yet, from the psychological point of view, such tendencies and practices are slowly but surely building insecure traders, dependent on external ideas before daring to take any deliberate action.

Naturally, this approach can hardly help develop any strategy or pave the way for drawing necessary conclusions. Therefore, short of deduction and planning, trading cryptocurrencies often prevent those involved from developing key analytical skills. Consequently, these traders’ constant reliance on outside support and input, accompanied by a severe lack of objectivity, makes generating revenue highly implausible. Since trading essentially revolves around profit, as a forex trader, it is your task to use your tested-out methods and plan how you can benefit from the pre-existing knowledge prior to new market penetration.

If you are still thinking whether you should embark on this journey, you should bear in mind that you have the necessary means to expand yet to another market and thus ensure an even greater source of income. Due to the fact that your trading experiences allowed you to grow an independent mindset, you can make use of the analytical and planning skills you took time to develop. With this advantage, you will not only progress faster, but you will be able to secure your financial stability should any unexpected events take place in either of the markets. Finally, to answer the question of why anyone should move from forex to crypto, consider how much better and profitable your trading career could be in the future with the ease of not having to put excessive amounts of effort as a pre-condition.

Categories
Crypto Videos

How To Launder 1.4 Billion Dollars!


Over $1.4 Billion of Laundered Money Came to Crypto Exchanges


Money laundering concept. Yellow clothes peg hold Bitcoin and one hundred dollar banknotes.

The latest report by Peckshield, a company specializing in blockchain security, shows that over $1.4 billion of laundered money found its path to crypto exchanges in 2020.
Peckshield has been collecting data from both online and offline sources for more than one year, and then, verified and analyzed it. In this process, they were able to identify more than 100 million transaction addresses.


The company found that around 147,000 Bitcoin, currently worth more than $1.4 billion, has moved onto top exchanges this year.
These assets were associated with hacks, the dark web economy, illegal gambling, etc.
“We ranked the exchanges by the amount of stolen money on them, and found that the top ten exchanges for illegal funds were: Huobi, Binance, Okex, then ZB Gate.io, Bitmex, Luno, HaoBTC, Bithum, and lastly Coinbase.” – Peckshield stated in its report.
The company also said that some of the monitored addresses moved their funds to crypto mixers, which made it difficult to continue tracing them.

“As of June 30, we have monitored the high-risk address, out of which $1.62 billion flowed into the blacklisted address, while $15.9 billion went into the mixed currency service provider. It should be emphasized that the majority of the funds that went through the mixed currency service have been successfully laundered, and were untraceable after that.”

Wallets associated with the PlusToken scam have been followed by suspected massive open-market sales on crypto exchanges. In turn, this created fake spikes in Bitcoin, Ethereum, and altcoin prices.

Categories
Crypto Videos

Is High Frequency Trading Stabilising 𝐁𝐢𝐭𝐜𝐨𝐢𝐧?


High-Frequency Trading Made Bitcoin Boring?


The Bitcoin market has been quite slow lately. Some would say a little too quiet. As of July 14, Bitcoin’s volatility levels dropped to levels unseen after 2017. In recent weeks, Bitcoin was left behind as investors piled into altcoins such as Chainlink and Cardano.

One possible explanation for why Bitcoin is consolidating for so long may be an increase in the presence of high-frequency trading (or HFT for short) firms in recent months. Paolo Ardoino, CTO of Bitfinex, believes that HFT is a major reason behind Bitcoin’s volatility.
“Crypto is back to the old days of HFT before everything became the zero-sum game that it became today. HFT crypto firms can make a lot of money by deploying relatively straightforward strategies, such as cross-exchange arbitrage or exploiting the spread between one exchange and another” – Ardoino said.

HFT and cryptocurrency

High-frequency trading is a trading method that uses trading algorithms to transact an enormous number of orders in fractions of a second. While it has existed in the crypto space for a long time, the scope of its existence was rather small. However, just as billionaire Paul Tudor Jones revealed his BTC holdings recently, other institutional investors are showing interest and joining the market. This may explain the greater influence of HFT on the market.
Bitfinex, which claims it is “huge for HFT in crypto,” just recently revealed that between 80% and 90% of its platforms’ volume was now generated by HFT companies. Bitfinex partnered with a company called Market Synergy and started offering “institutional standard crypto connectivity.”

This crypto exchange platform concludes the growing use of HFT represents an increase in “maturity in the crypto space.”
However, why would Bitcoin volatility go down instead of up, with the increased use of HFT? Ardoino explained that, while the volatility is reduced, the liquidity of the market has drastically increased, which is exactly how HFT operates.

“As Bitcoin becomes an established asset class, the high levels of volatility associated with crypto will recede,” he explained. “There is an inverse correlation between liquidity and volatility, especially when HFT is involved.”
Bitcoin is famous for moving aggressively to the upside and downside for a short period of time. If we take a look at the previous year, Tom Lee of Fundstrat reminded everyone that the majority of Bitcoin gains came in the ten best trading days of the year. However, the evergrowing presence of HFT may as well be changing the “rule of 10 best days” as well.

Categories
Crypto Market Analysis

Daily Crypto Review, July 24 – US Banks Can Provide Crypto Custody Services; Bitcoin Approaches $10,000

The cryptocurrency market spent yet another day shooting for the upside as Bitcoin tries to push itself closer towards $10,000. Bitcoin is currently trading for $9,358, which represents an increase of 0.42% on the day. Meanwhile, Ethereum gained 2.68% on the day, while XRP gained 1.2%.

 Daily Crypto Sector Heat Map

When talking about top100 cryptocurrencies, Flexacoin gained 36.8% on the day, making it the most prominent daily gainer. DigiByte (12.57%) and Maker (8.03%) also did great. On the other hand, Ampleforth has lost 11.12%, making it the most prominent daily loser. It is followed by Aave’s loss of 8.86% and Reserve Rights’ loss of 7.63%.

Top 10 24-hour Performers (Click to enlarge)

Bottom 10 24-hour Performers (Click to enlarge)

Bitcoin’s dominance level decreased slightly since we last reported, with its value currently at 62.29%. This value represents a 0.12% difference to the downside when compared to yesterday’s value.

Daily Crypto Market Cap Chart

The cryptocurrency market capitalization increased when compared to when we last reported, with the market’s current value being $287.23 billion. This value represents an increase of $3.17 billion when compared to the value it had yesterday.

_______________________________________________________________________

What happened in the past 24 hours?

_______________________________________________________________________

_______________________________________________________________________

Technical analysis

_______________________________________________________________________

Bitcoin

The largest cryptocurrency by market capitalization had another great day after the Office of the Comptroller of the Currency made an announcement stating that US banks can now provide crypto custody services. Bitcoin’s price instantly skyrocketed and reached a high of $9,690, therefore passing the $9,580 resistance level. However, the fight to stay above $9,580 is still in play, and it is uncertain where Bitcoin will end up.

BTC traders should look for a trade opportunity after bitcoin establishes itself above or below $9,580.

BTC/USD 4-hour Chart

Technical factors:

  • Price is currently above its 50-period EMA and its 21-period EMA
  • Price is right below its top B.B.
  • RSI is in the overbought territory (72.10)
  • Volume Increased

Key levels to the upside          Key levels to the downside

1: $9,580                                 1: $9,251

2: $9,735                                 2: $9,120

3: $9,870                                  3: $8,980

Ethereum

Ethereum made a move towards the upside as it followed the influx of crypto bulls entering the market. The second-largest cryptocurrency by market cap established its position above $260 and hurled towards $278. However, the bullish move could not quite reach above it, and Ethereum stayed below. However, there is a high possibility that Ethereum will make another move as the range between $278 and the ascending line is closing in.

Ethereum traders should look for a trade opportunity in searching for pullbacks or after range confirmations.

ETH/USD 4-hour Chart

Technical Factors:

  • Price is above the 50-period EMA and the 21-period EMA
  • Price is slightly below the top B.B.
  • RSI severely overbought (82.89)
  • Two-candle volume spike (the rest is average)

Key levels to the upside          Key levels to the downside

1: $278                                    1: $260

2: $289                                    2: $251.4

3: $302                                     3: $240

Ripple

The third-largest cryptocurrency by market cap went past the $0.205 resistance (now support) level as bulls managed to win the fight for the level. However, XRP did not make a great leap towards the next resistance level, as Bitcoin and Ethereum did. Due to a low bullish presence, XRP failed to go past $0.21 and started moving towards the downside.

XRP traders can look for an opportunity after XRP confirms its position above $0.205, or as it falls below $0.205.

XRP/USD 4-hour Chart

Technical factors:

  • XRP in a mid-term descending trend (though it broke the trend in the short-term)
  • XRP lacks strong support levels below $0.178
  • Price above 21-period and the 50-period EMA
  • Price above the top B.B.
  • RSI is elevated (64.43)
  • Average/slightly higher than average Volume

Key levels to the upside          Key levels to the downside

1: $0.214                                  1: $0.205

2: $0.227                                  2: $0.2

3: $0.19


Categories
Cryptocurrencies

Will Cryptocurrencies Be Able to Destabilize FIAT Money?

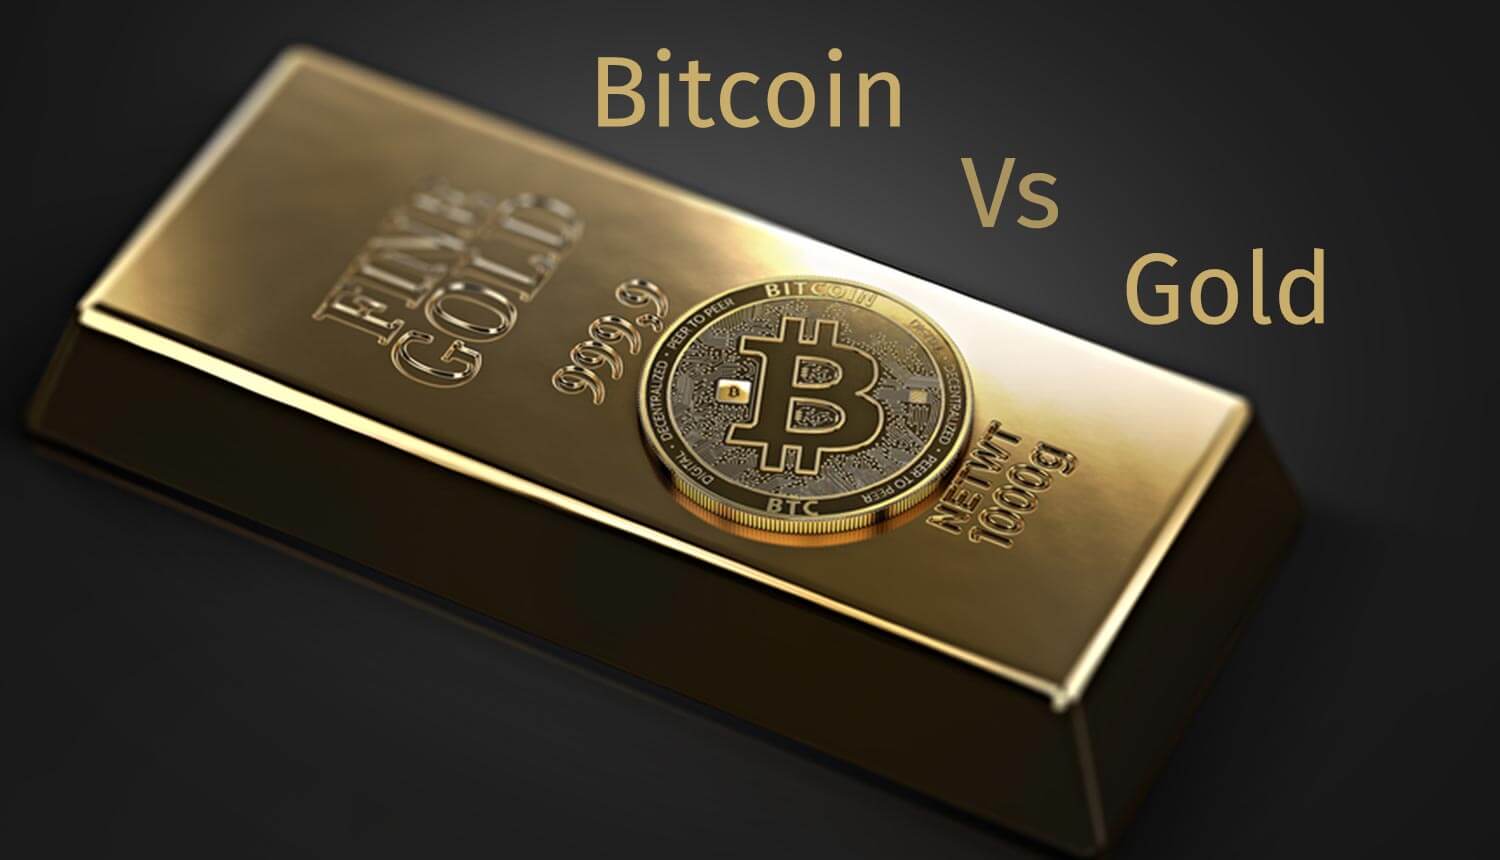
The assumption in some quarters is that cryptocurrencies will replace gold as money, or at least challenge it. This is a mistake that comes from a misunderstanding of exchange theory ( is a theory of how a free market fixes prices and trade in a spontaneous mechanism, which normally takes place without the need for common or planned objectives between economic operators). We must also know that in addition to a few European countries and North America, gold is money that is firmly in the minds of ordinary people.

Some economists have concluded that cryptocurrencies are probably the purest form of financial bubble in all the history of speculation, and will end up being of great theoretical interest to the next generations, as will the phenomenon of the tulip bubble.

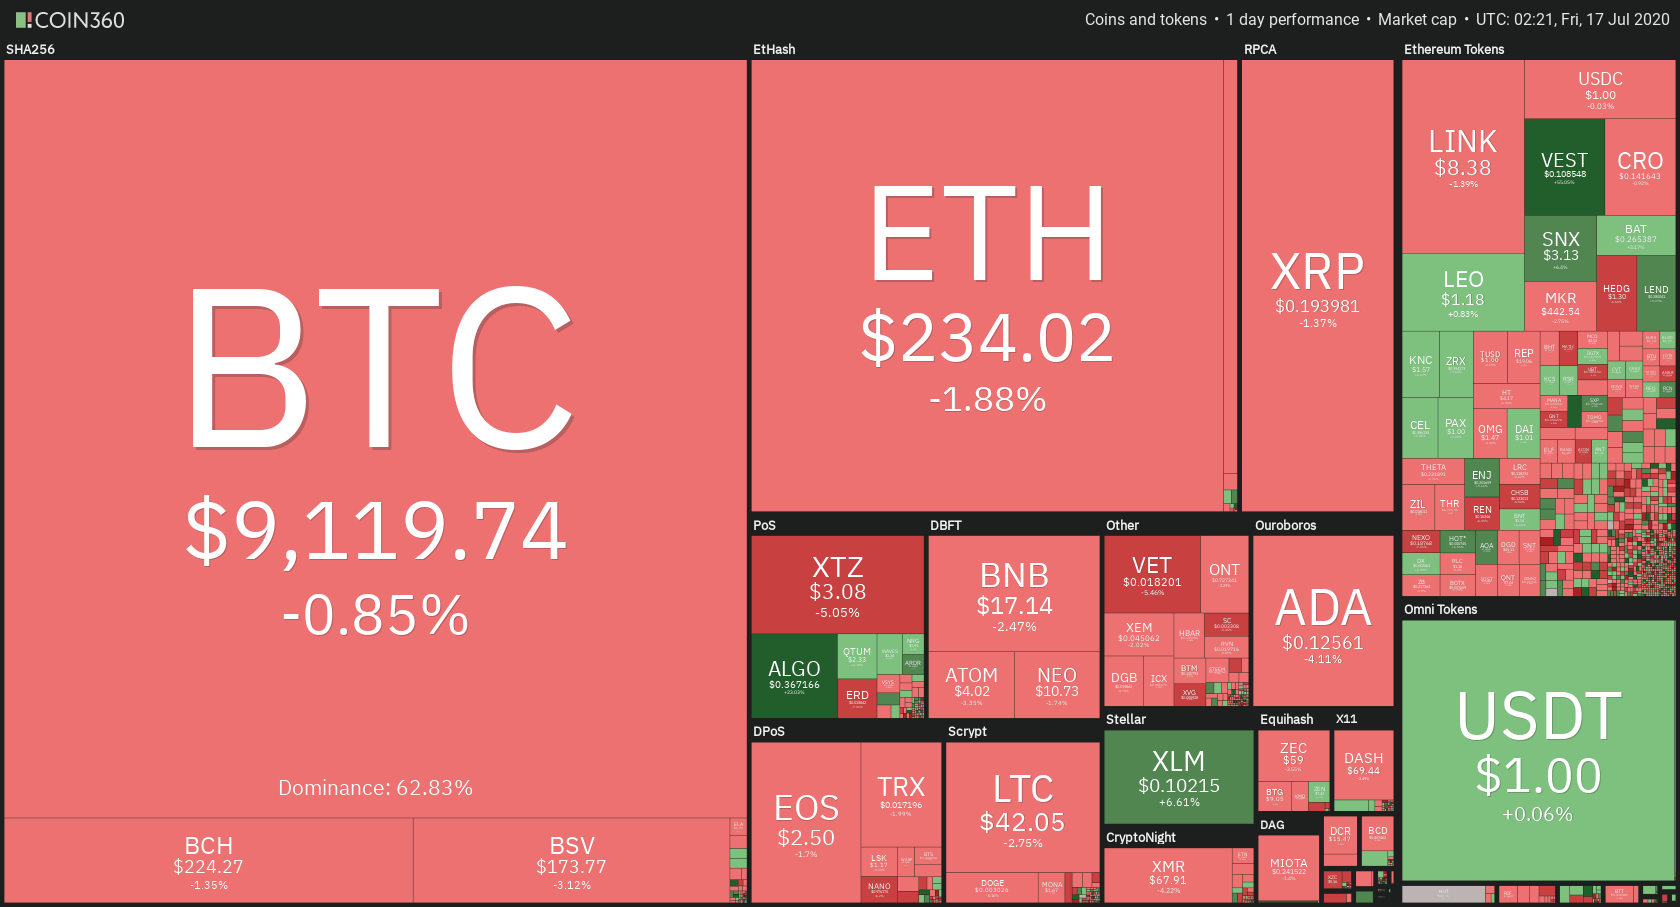
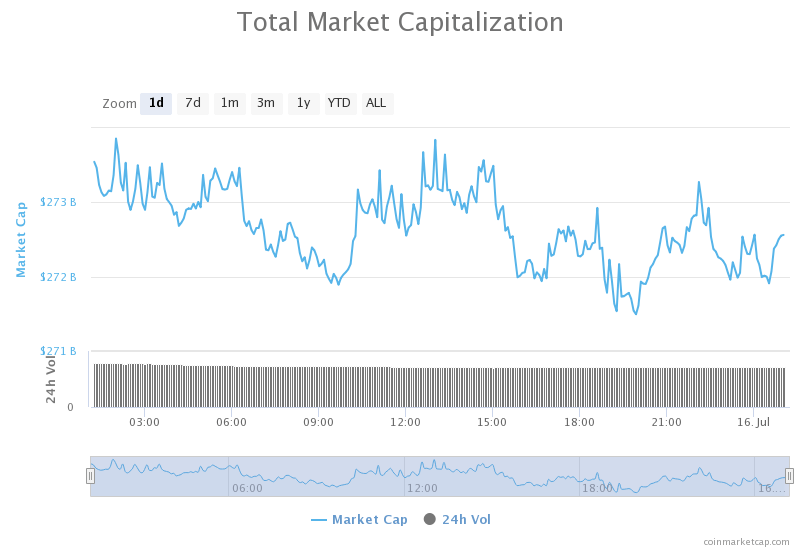
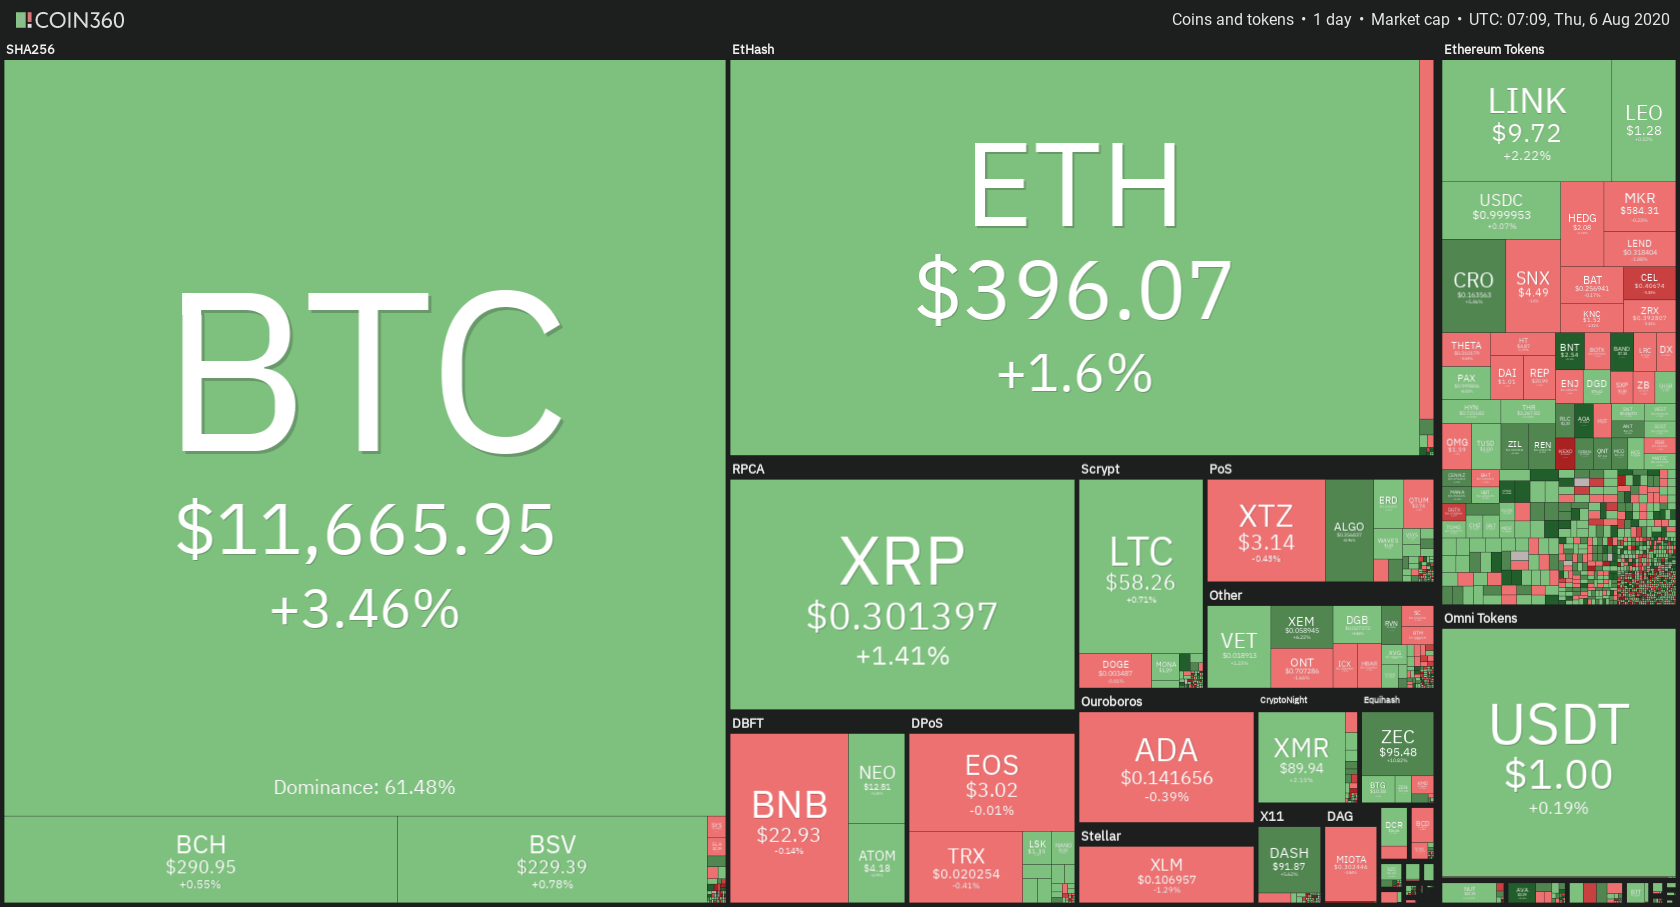
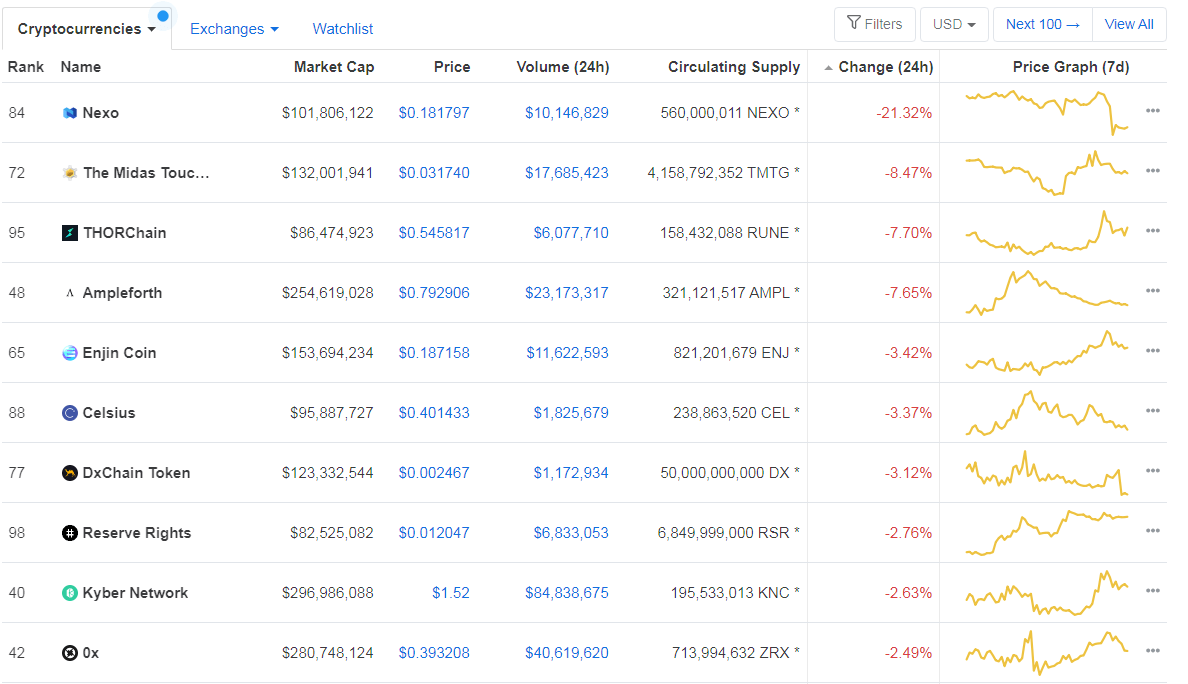
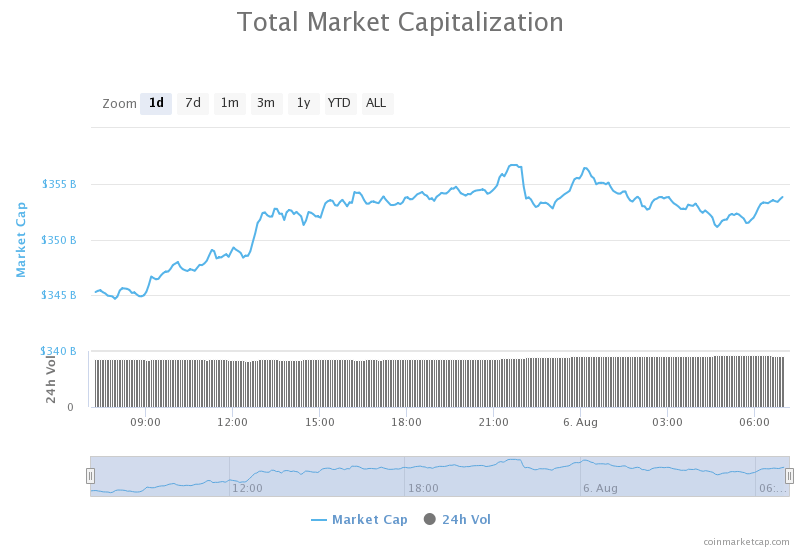
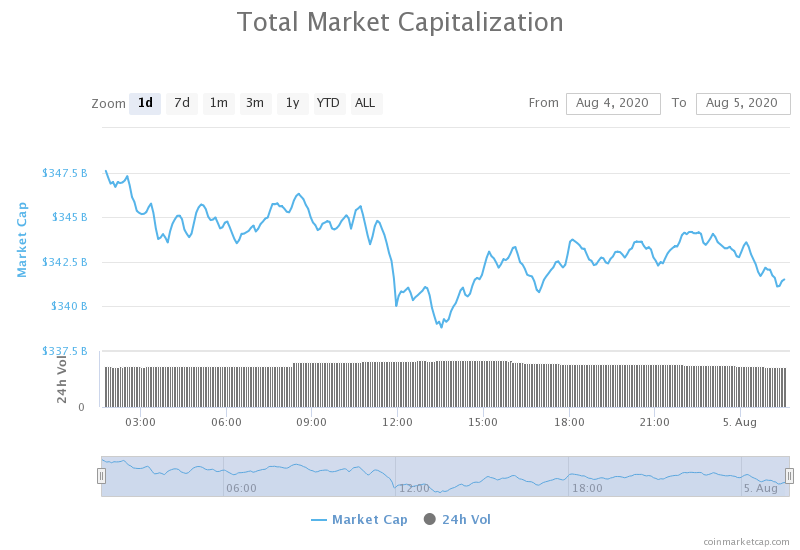
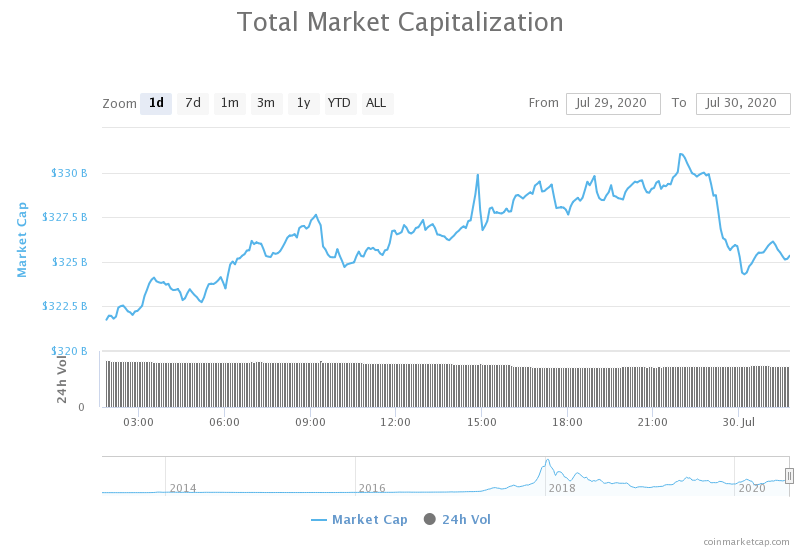
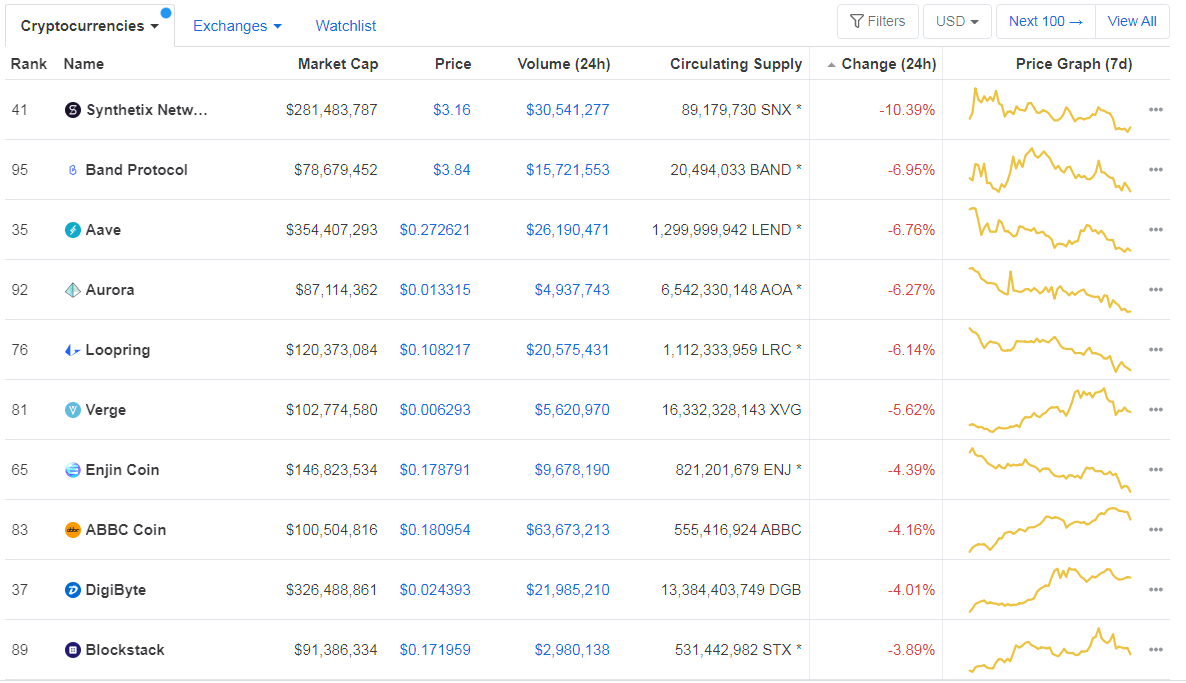
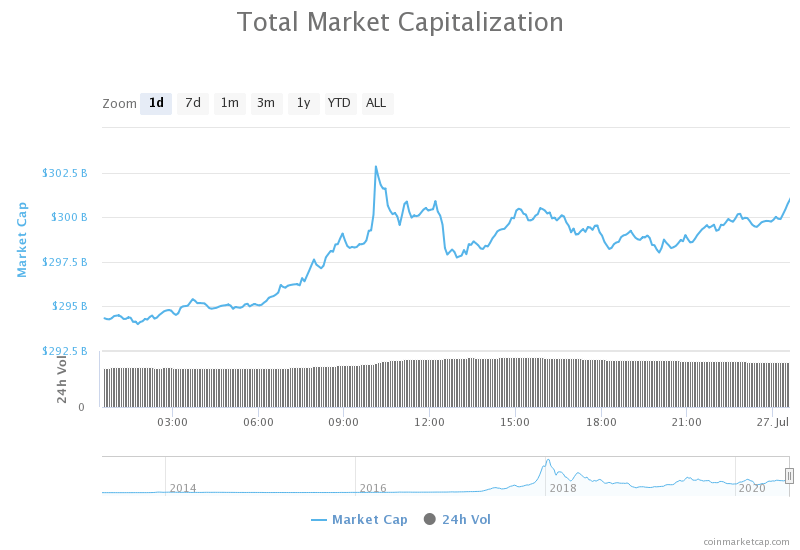
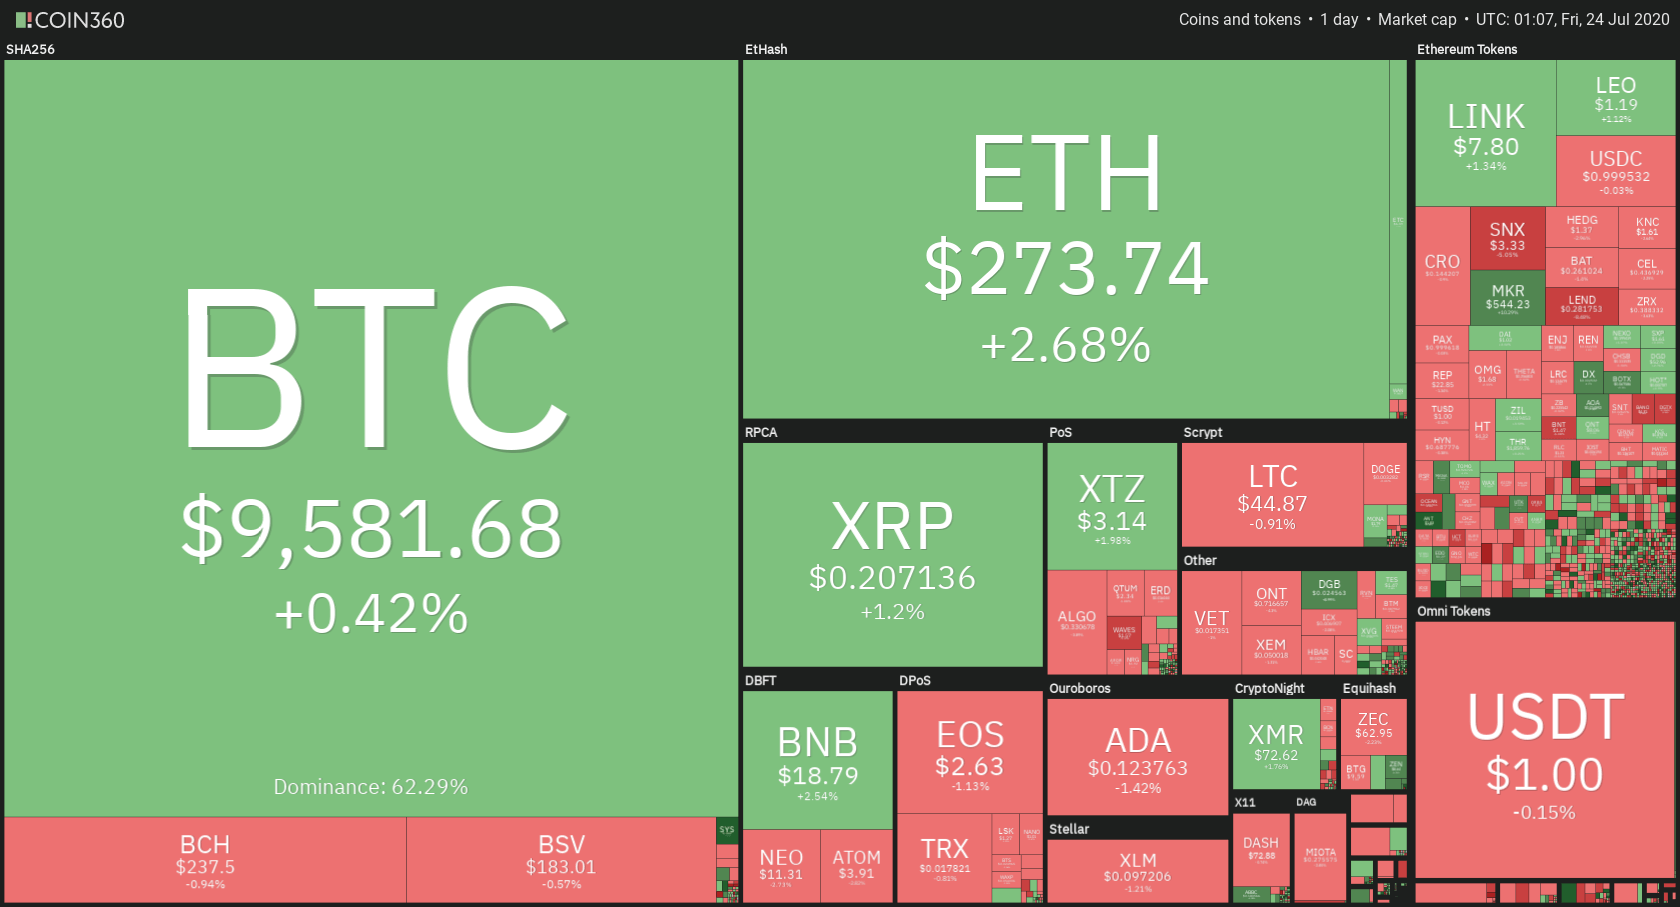
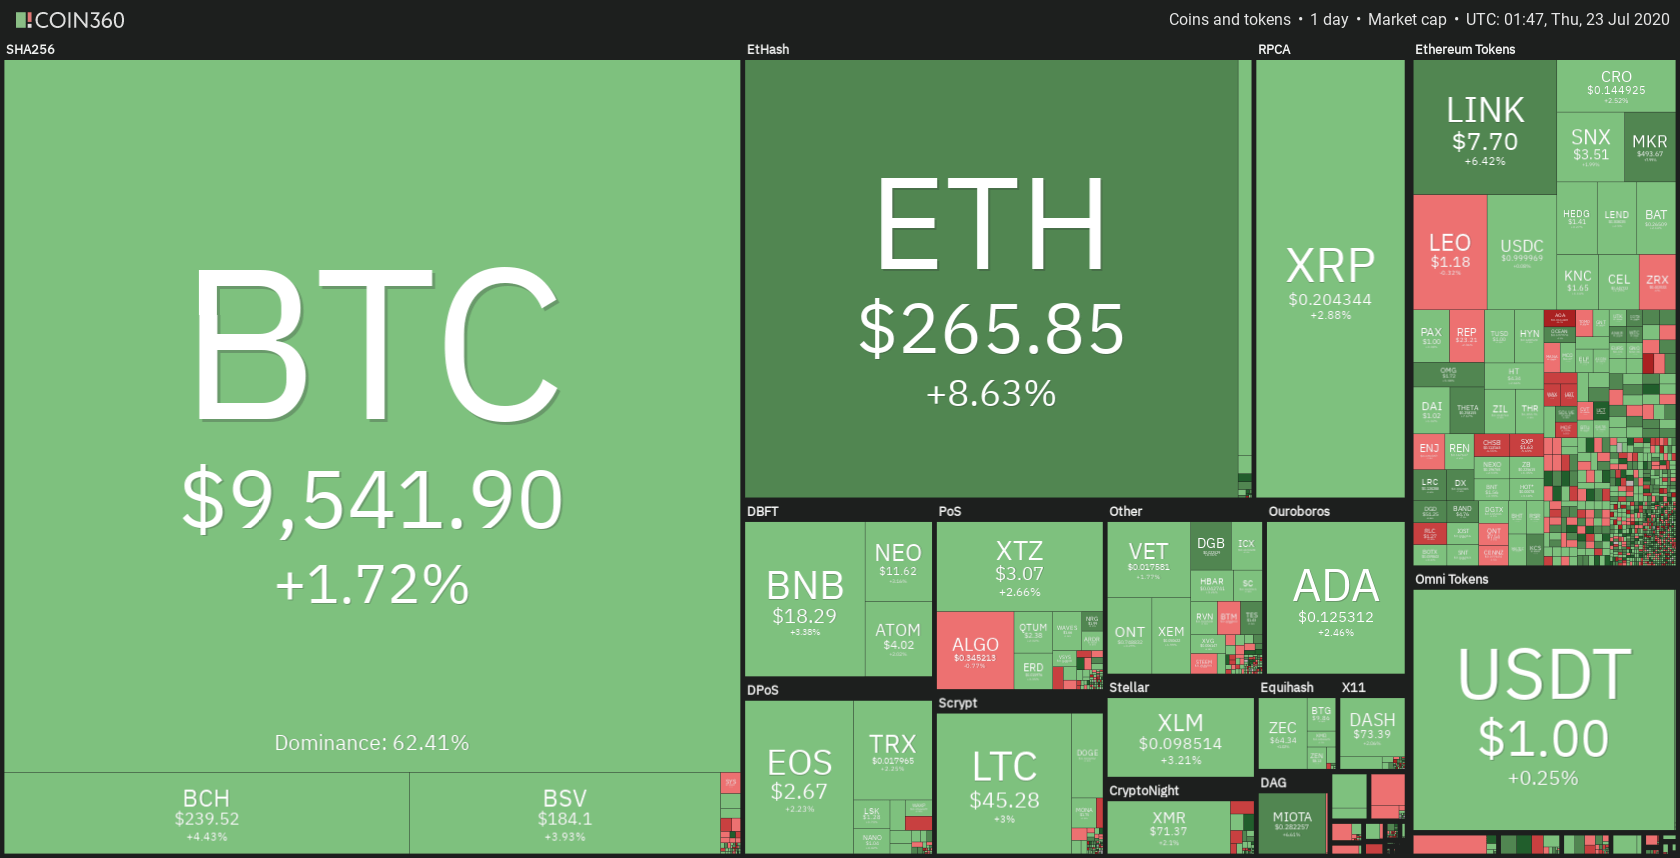
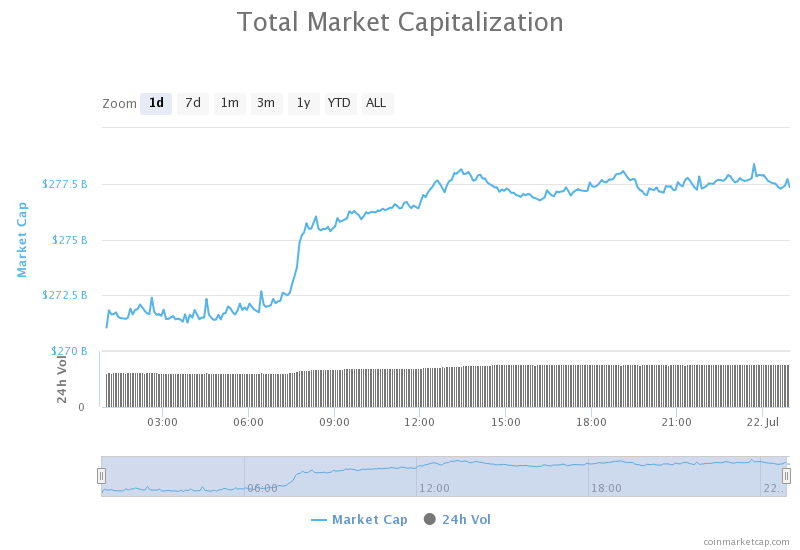
It is worth noting that all cryptocurrencies together are worth about $120 billion, with Bitcoin having a market capitalization that represents $55 billion of that total. Although this seems like a lot of money, it is only a very small fraction with respect to FIAT cash and deposits worldwide. Therefore, the point where new money is exhausted to feed the madness of cryptocurrencies does not seem to have been reached, and this market could have much more to go”.

That was in August 2017, when bitcoin cost $3,000 against the current price of more than quadruple. In the short term, all sorts of dubious promoters are sending out unsolicited invitations to buy, promising price gains of thousands percent. In many cases, these developers also own the cryptocurrencies themselves and are inflating the price in their own interest. If potential buyers do not bite the bait in sufficient quantities, then these markets may end up suffering a sharp correction.

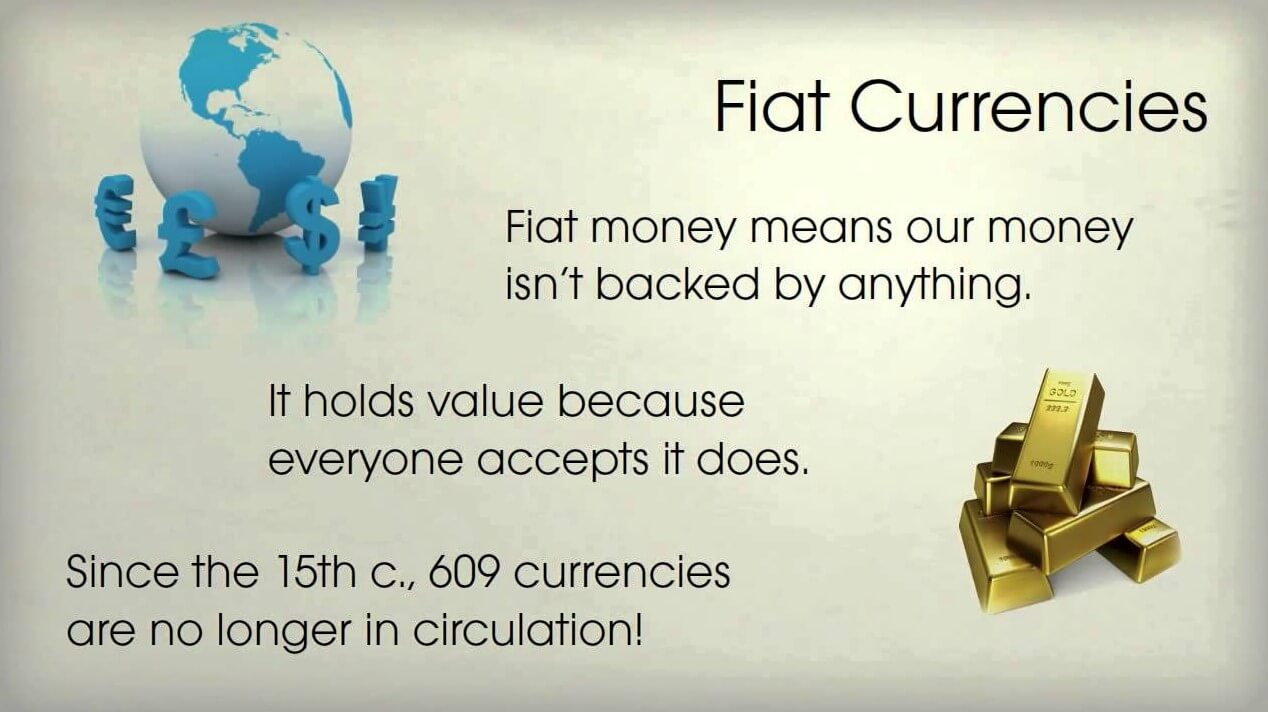
We must look beyond this. This article aims to learn more about the dynamics that drive the price of Bitcoin and other cryptocurrencies, and concludes that instead of destabilizing gold. If madness continues, it is much more likely to destabilize fiduciary currencies.

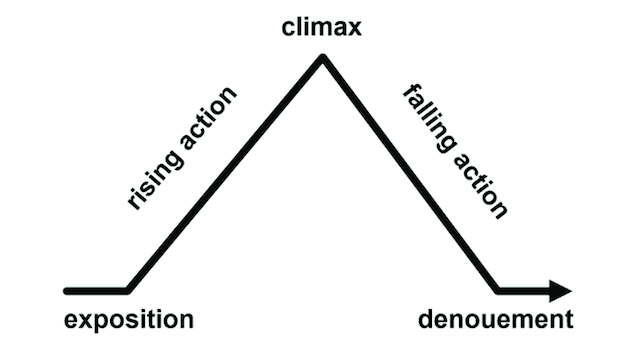
But first, we need to understand how bubbles form and progress. A warning: what follows is a theoretical description of how bubbles evolve and eventually implode, including points that may be relevant to cryptocurrencies. It is almost certain that other factors will affect how prices will move forward, in particular the dynamics behind the global credit cycle designed by the banking system. On its own, the impending credit crunch, regardless of the madness of cryptocurrencies, threatens to be the most damaging in our lives and could easily override the cycle of the cryptocurrency bubble. This article does not claim to examine all the risks of these new assets.

Dynamics of a Financial Bubble: The Start-Up Phase

Bubbles, like markets, tend to go through three distinct phases. The first is the initial movement, driven by participants with knowledge, or by those close to promoters who initiate a scheme or form of investment. Sensible and experienced investors realize from the start that the prices of a new company, a financial instrument is being inflated, irrationally in their opinion, so they do not participate. At this point, the general public is unaware of what is happening, and many of those who could have made an investment and entered early end up falling into heavy price corrections, counterpart failures, or outright fraud. As a result, prices are mostly driven by the initiates, the first to adopt, the creators of the new opportunity to make money.

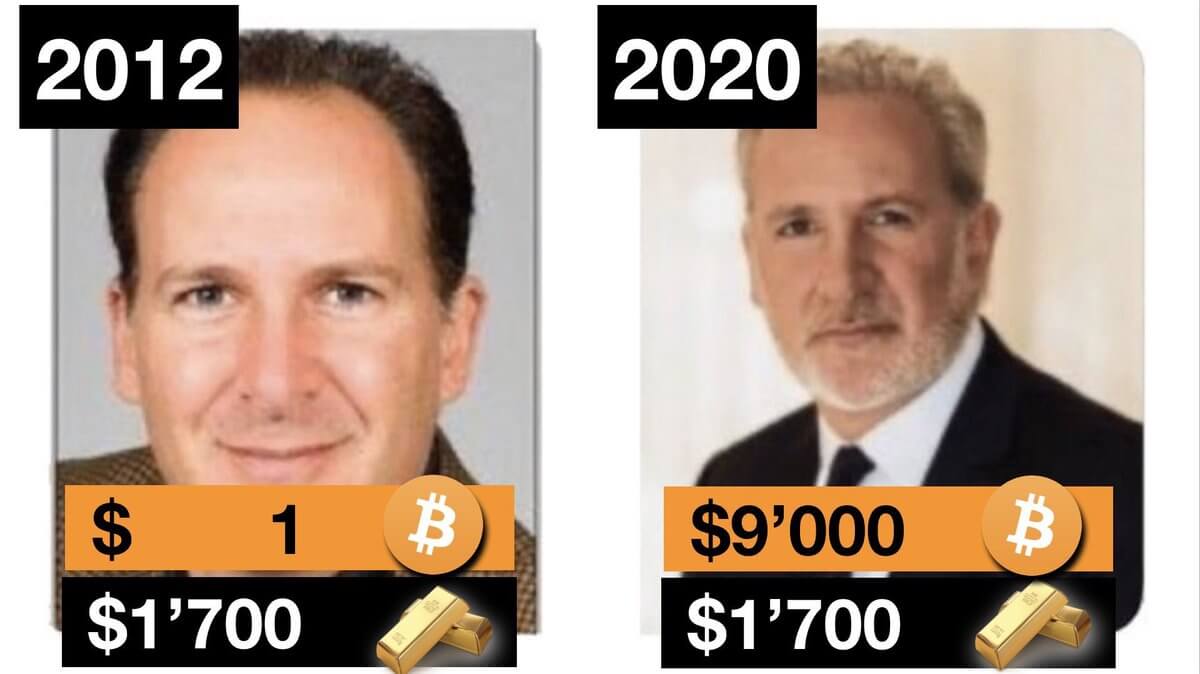
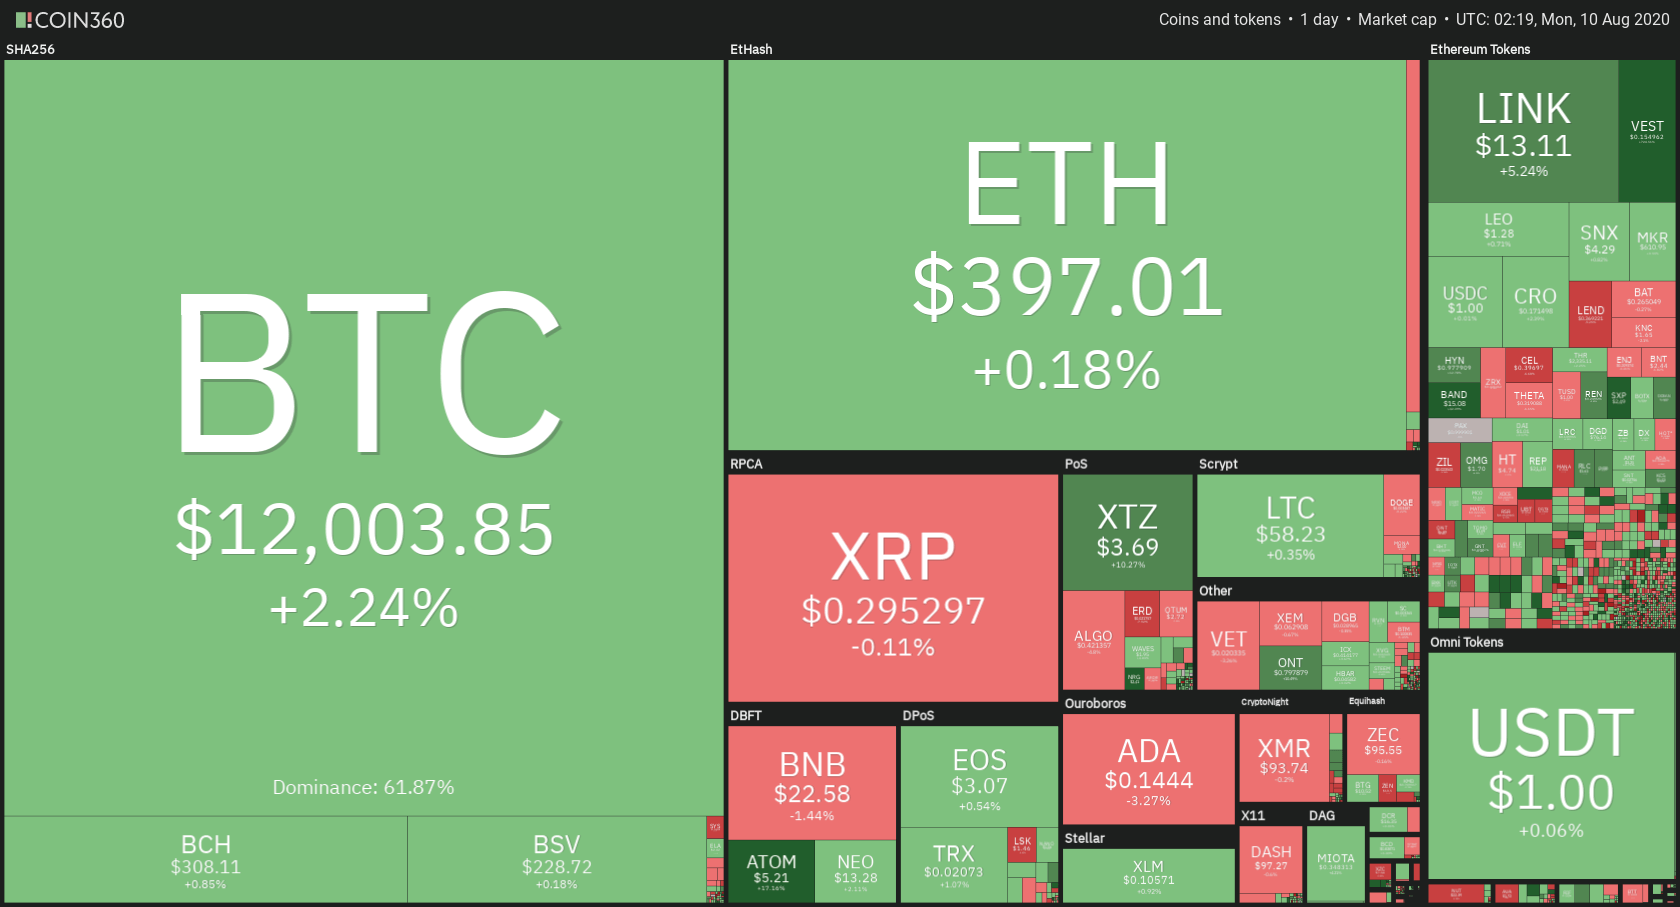
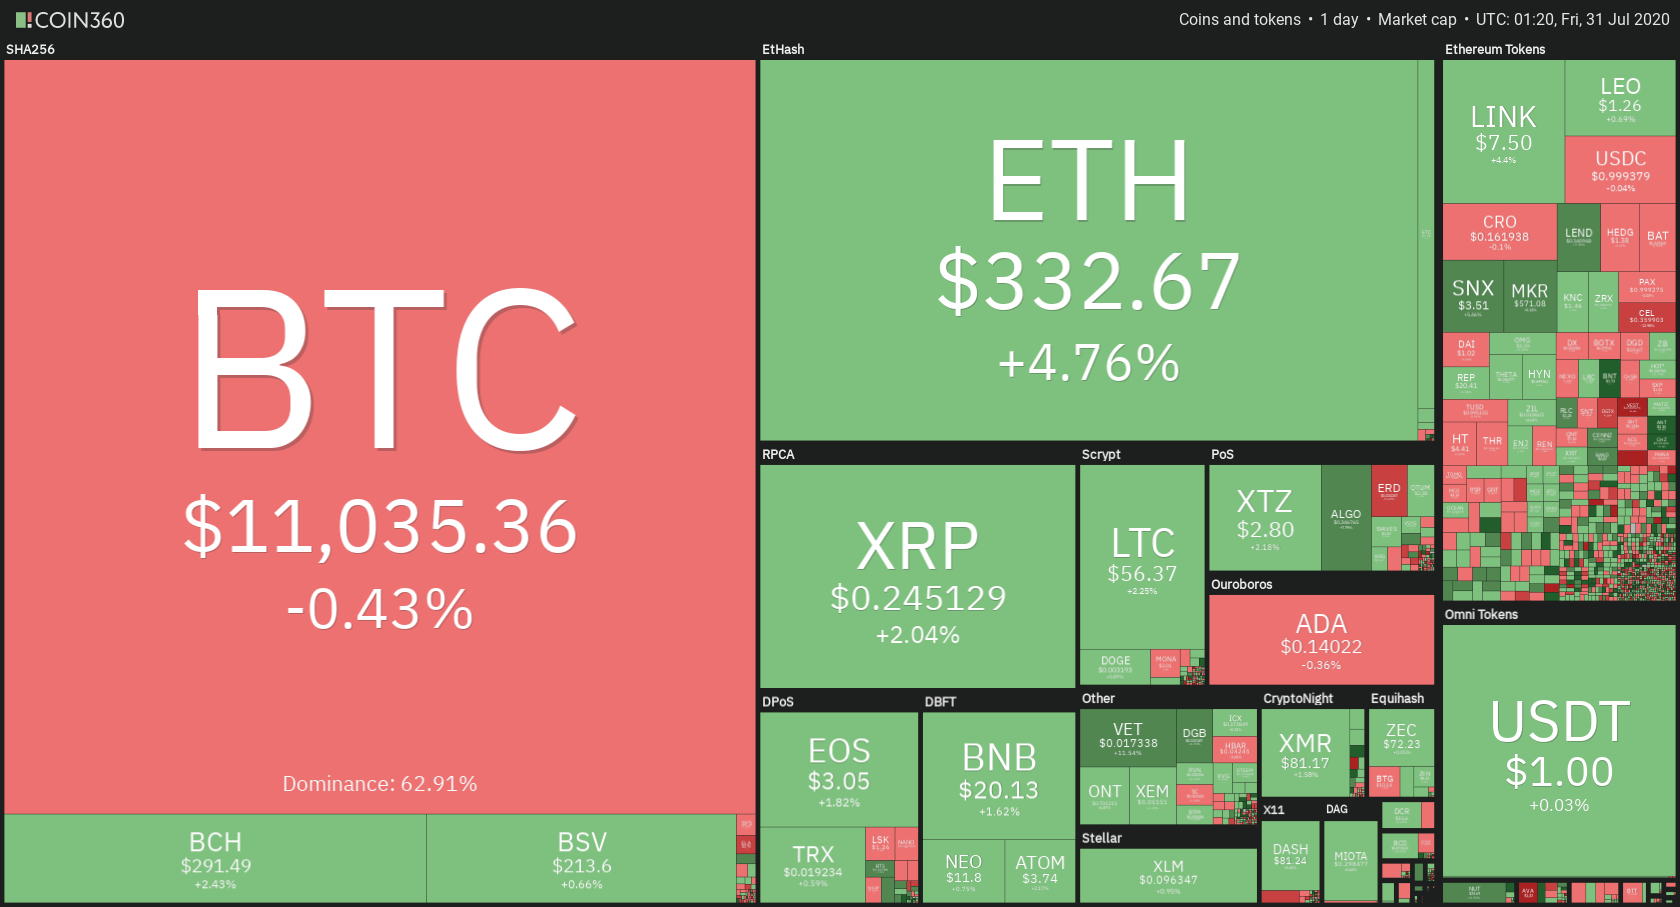
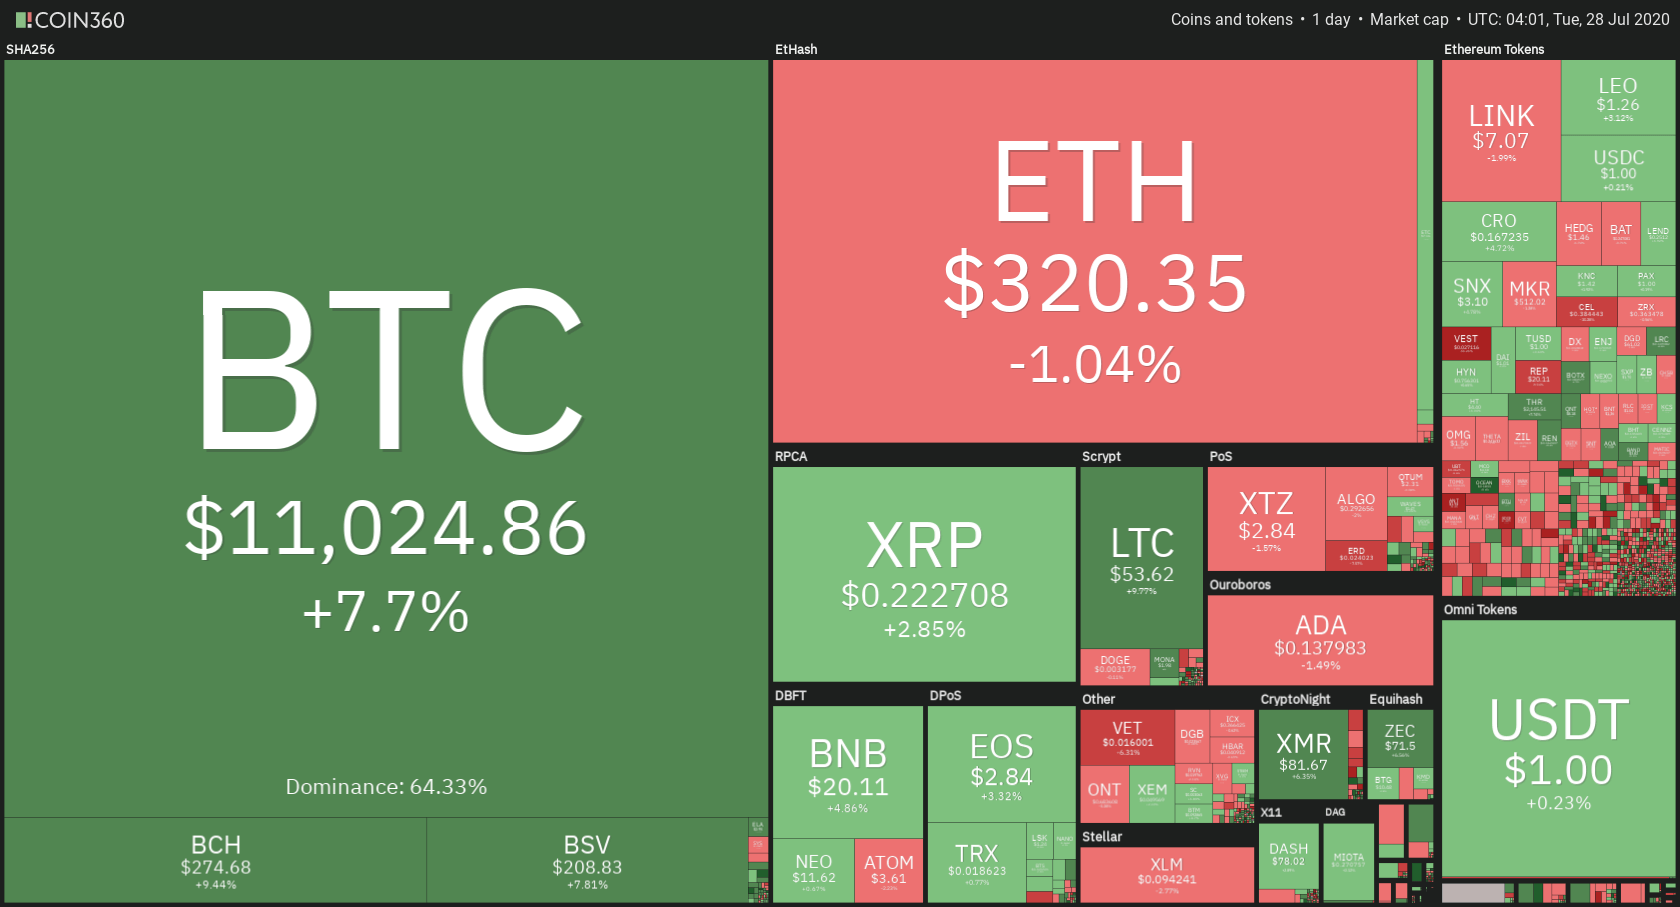
In the specific case of cryptocurrencies, these are the geeks and technology-savvy entrepreneurs who have a good understanding of the dynamics that drive the values of these assets. This has been the story of cryptocurrencies so far. Bitcoin, the leader of a package of around 1,000 different cryptocurrencies, has risen from nothing to more than $11,000 at the time of writing this article, in less than a decade.

Currently, this is already an almost record-high inflation bubble. Each bubble has its own personal characteristics, but this one is special. The invention of blockchain technology, Bitcoin’s central self-audit process, ensures that payments are confirmed and that property rights are undisputed. Blockchain itself could become one of the greatest financial and technological legacies of our time. The combination of financial and technological elements is the backdrop to cryptocurrencies, a powerful combination, compared to the one-dimensional bubbles of the past.

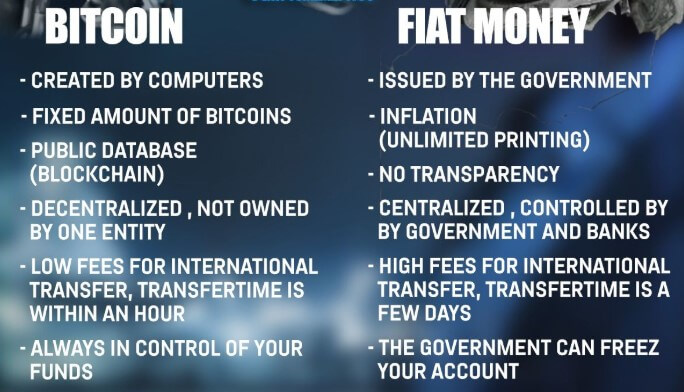
The limitation in the supply of new individual cryptocurrencies is designed to ensure that the growing popularity drives prices upwards. This contrasts with fiduciary currencies, which through the expansion of credit on an elastic base of base money, means that the increase of its supply is virtually unlimited. It is very likely that the difference between these two characteristics will in the future be more important for future cryptocurrency prices, measured in fiduciary currencies.

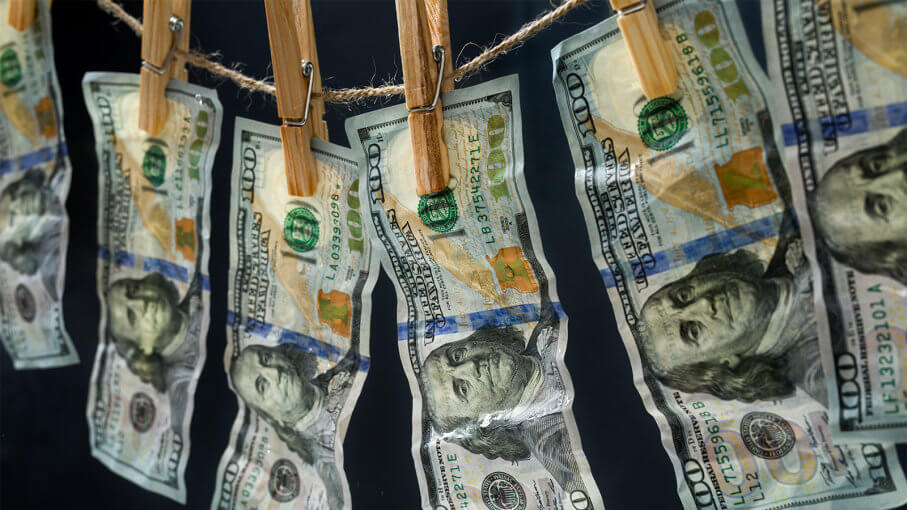
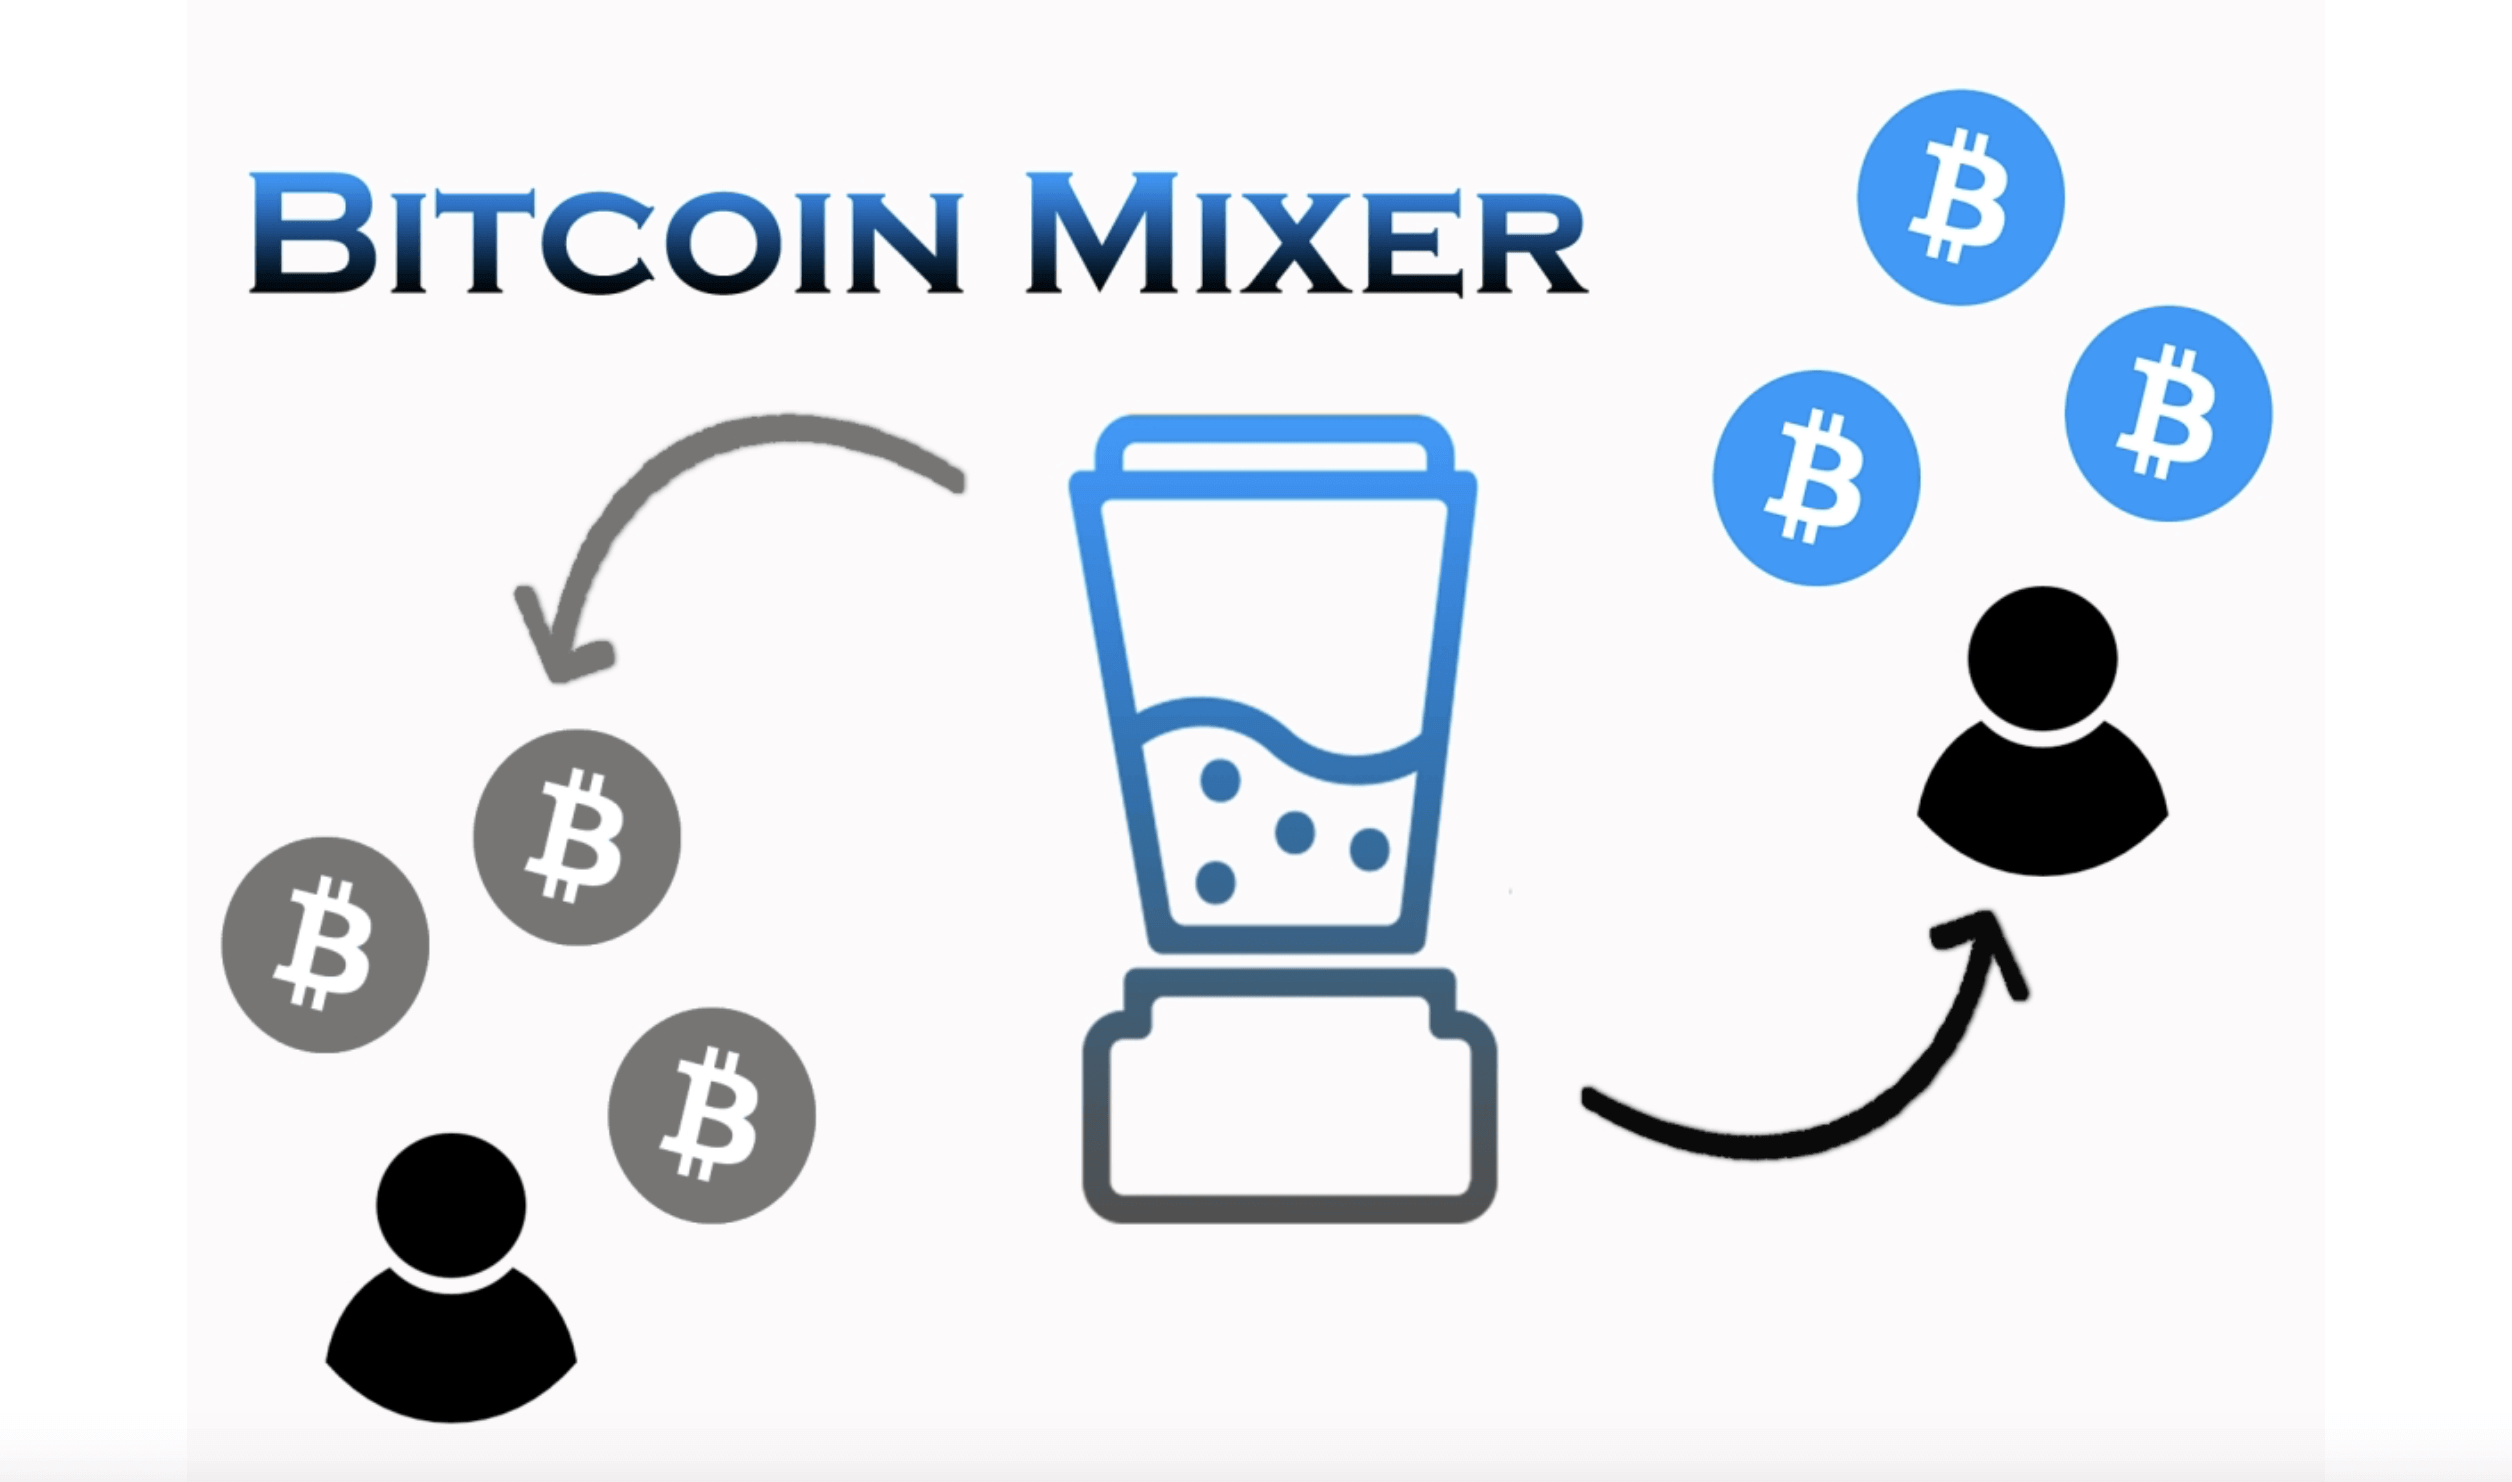
The limitation of new demand has been significant so far because it has had to overcome some disadvantages. In addition to the widespread rejection of the phenomenon by the general investor sector, the market has also not been regulated and has therefore been considered dangerous for investment. Governments have shut down Bitcoin exchanges on the pretext that cryptocurrencies are used to evade taxes and launder the proceeds of crime. While the technological side of the phenomenon has been advanced and generally competent, the financial aspects have been on a scale ranging from amateur to fraudulent. It has been a new version of the Wild West, driven by anti-government libertarianism.

Governments have not yet decided their response, but aside from expressing interest in blockchain technology, most have no idea and have been taken by surprise. Cryptocurrencies can undermine capital controls, important for China and many other countries that seek to protect their own fiduciary currency values and have caused discomfort to Governments as a result.

However, we are now going through the early stages of development, when cryptocurrencies were mainly the exclusive domain of technophiles and libertarians. The transition may not be clear. Almost all major market drivers and agitators have already made their investment in this market, so a significant drop could create problems for them. An unpleasant wake-up call of this nature, after such huge initial gains, should not be dismissed lightly.

With or without such price correction, cryptocurrency exchanges and other related service providers are beginning to realize that dealing with unknown clients on a completely question-free basis is impractical, especially when governments want to be able to control all transactions. Companies moving into Phase 2 will work to improve their reputation and are likely to adopt regulations. This brings us to Phase 2.

Phase 2: Acceptance in the Traditional Investment Sector

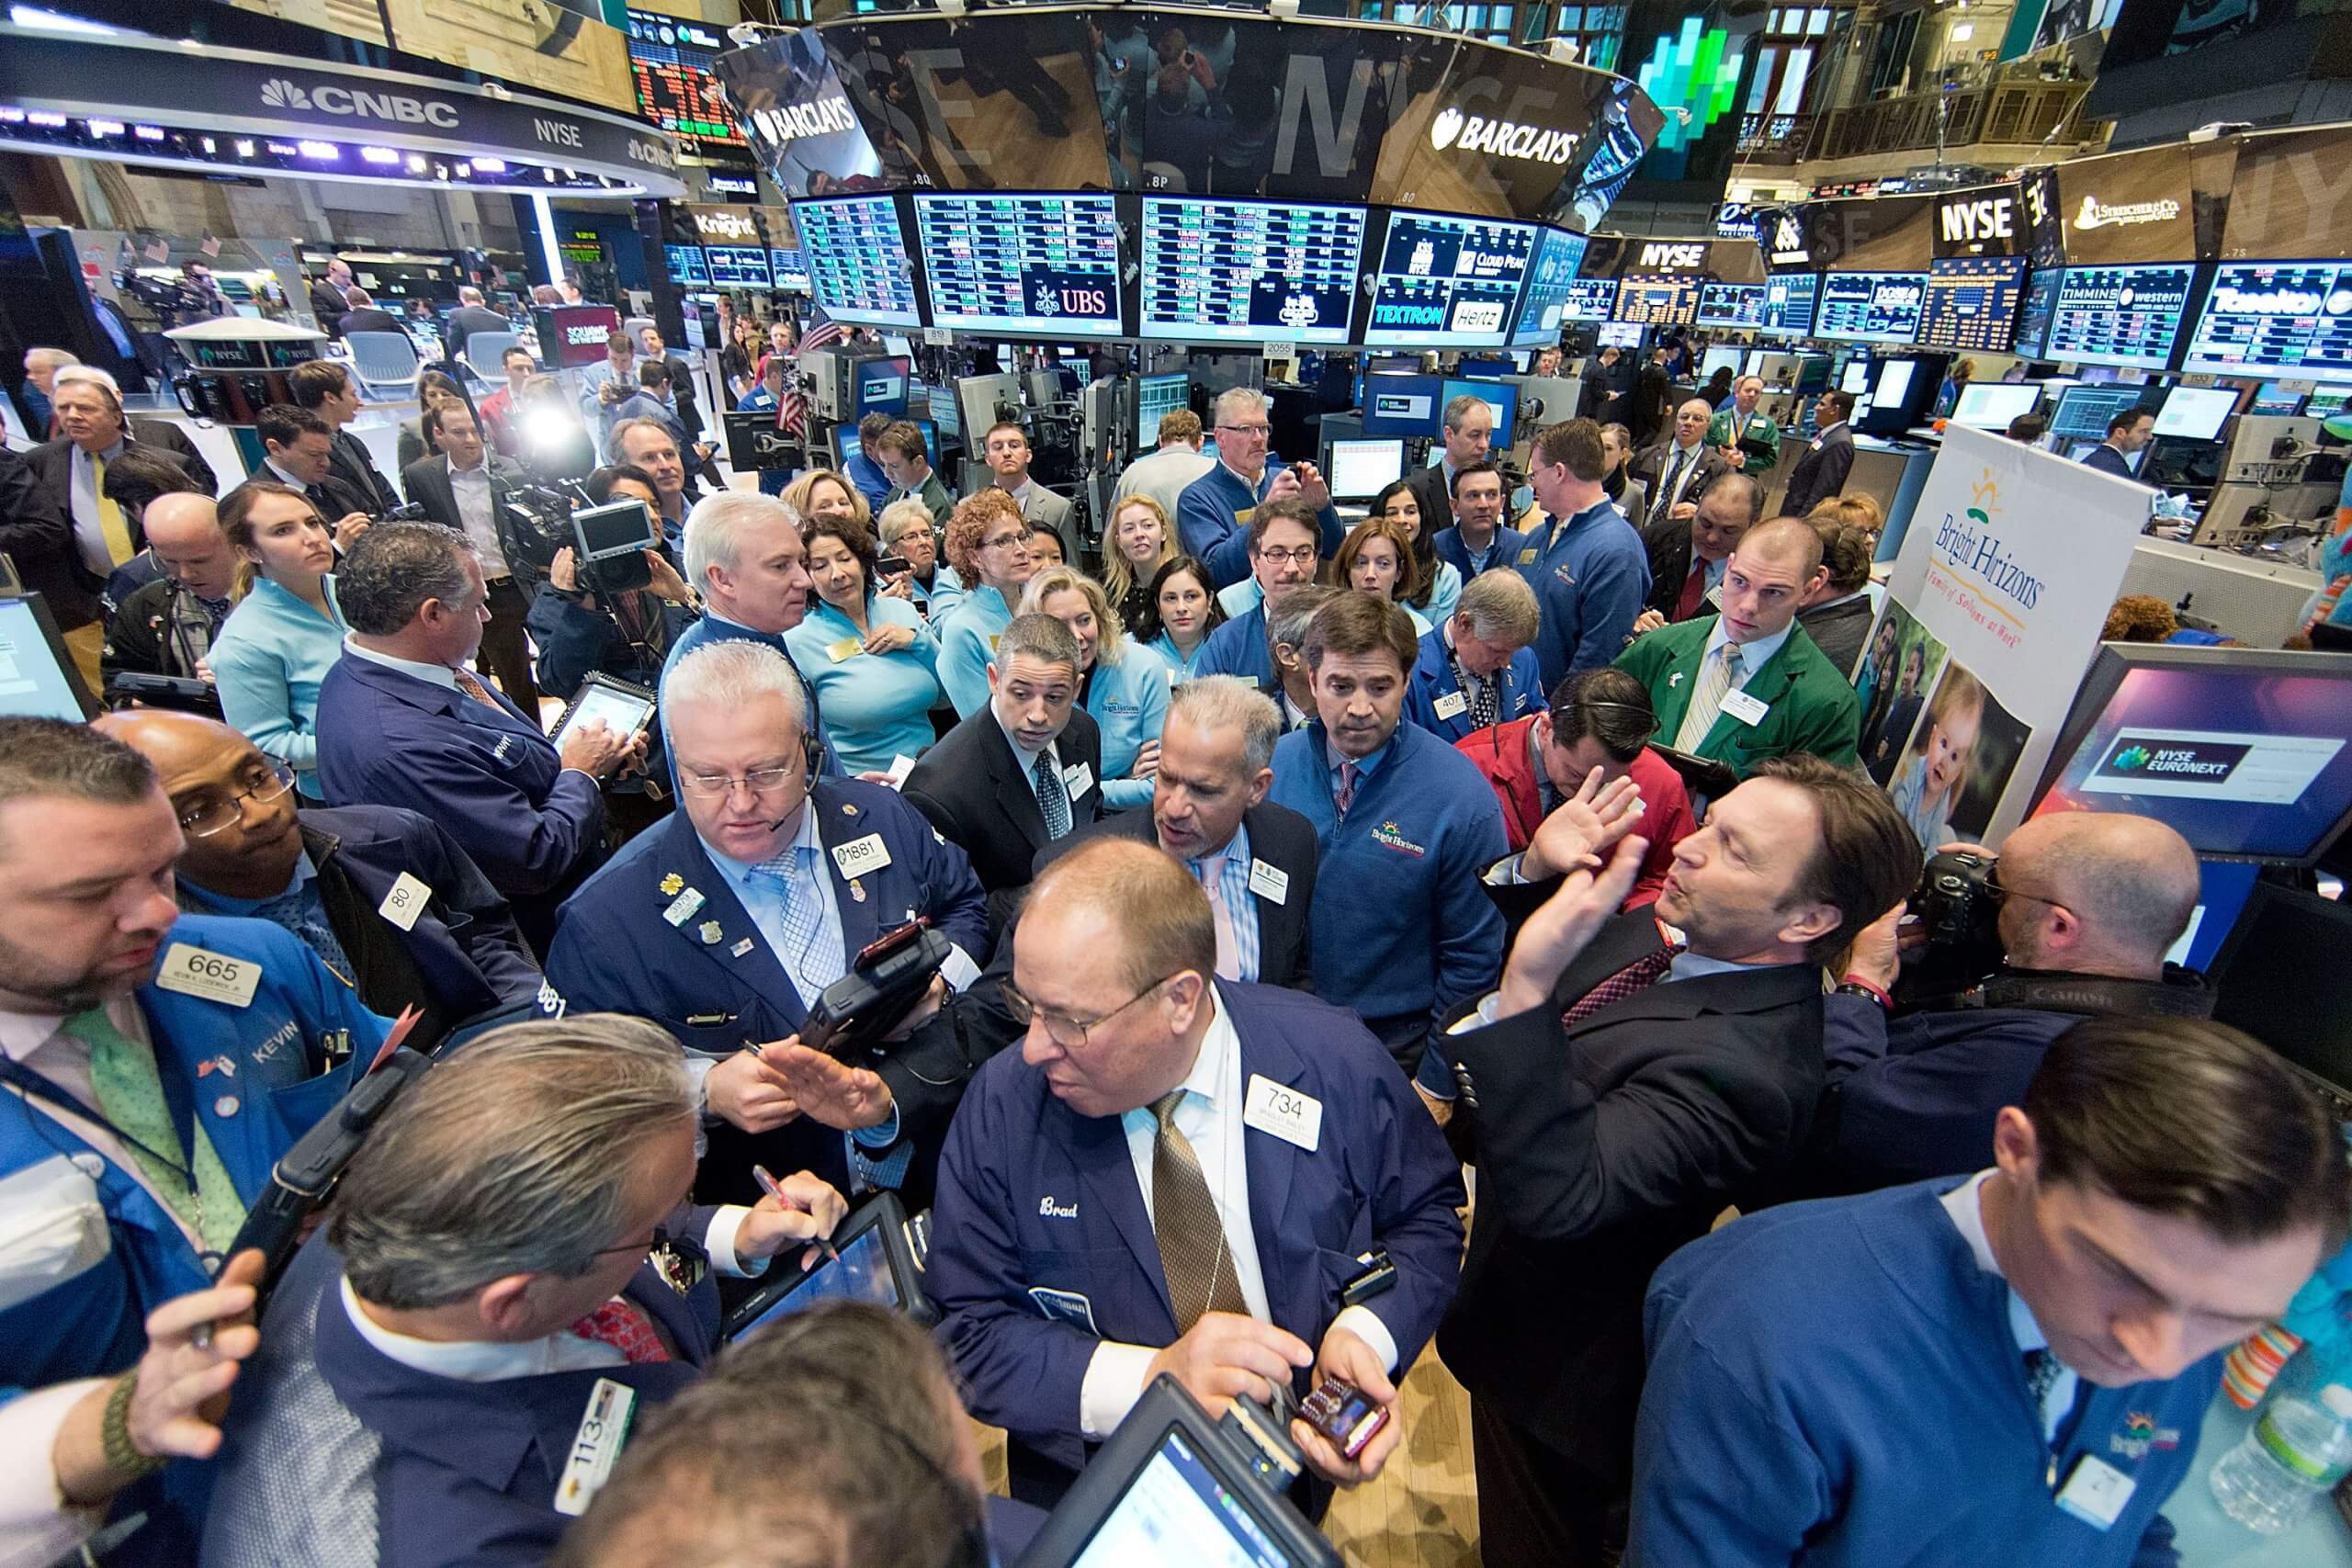
The interest generated by the first phase of the bubble has attracted a lot of attention from professional investors, particularly the bolder hedge funds and some other quasi-institutional actors. They point out that conventional investments appear to be fully valued, for this reason, the alternatives are being actively considered. Well, finally, if the rates of now on, bonds and therefore stocks are likely to fall in value. There are options, like playing the commodity cycle and maybe gold, for those who understand it. However, the vast majority of investments are made in regulated assets that are likely to have little or no upside benefits.

These professional speculators will closely follow government policy on cryptocurrencies. Cryptocurrencies are unregulated, and this is a serious impediment for investment institutions. Therefore, the recent announcement by the CME that they will introduce a Bitcoin futures contract by the last part of the year is a tremendous development for the digital currency sector that gives them greater credibility. Futures are regulated investments and will allow the money category managed at Comex to speculate on the price of Bitcoin. The proposed contract will be settled in cash, based on a Bitcoin reference rate, which means that delivery cannot be required. It seems ironic that the first Bitcoin-regulated investment medium uses the same mechanism that links betting to a horse race, but at least the futures contract is divorced from unregulated counterparts.

Assuming that the CME goes ahead with this contract, other regulated exchanges around the world are likely to do the same and demand will arise for futures that cover other credible cryptocurrencies, such as Ethereum, for example. In a short time, wealthy clients will ask their fund on its investment policy with respect to cryptocurrencies, and it will no longer be reasonable to dismiss them as irrelevant. That’s why the CME futures contract is such an important development. While it will divert part of the demand from the second phase of buying real bitcoins by creating a parallel market of speculation, it will legitimize investment in the underlying product, namely Bitcoin.

Governments and their central banks will then face a great challenge. This is a new phenomenon, and you know it’s not money, but you’re worried it’s going to turn into money. In reality, government economists do not have the theoretical knowledge necessary to control the issue in a convenient way. Some, like the Chinese, could continue to repress when they can the users and markets of Bitcoin, due to the threat to their capital controls. It is very likely that other governments will choose the opposite view, on the premise that if cryptocurrency service providers are regulated, or at least comply with financial regulation, then the huge profits that are made are an additional and welcome source of tax revenue.

The tax is the carrot and could become an important key to the future acceptance of cryptocurrencies. And if governments allow cryptocurrencies to become a form of investment and even money, only an overzealous fund manager will still refuse to get involved. We will see a momentum reversal against value, and a new paradigm, such as the technology bubble of the late 1990s.

It is highly unlikely that the division between the completion of Phase 2 and the start of Phase 3 is clear. When investment institutions get involved in a bubble, the public is obliged to start doing so as well. Our theoretical assessments are just that, but in reality, it is very likely that there is a division between the third and the second phase. The second phase, once it moves forward, you could see a huge amount of money looking to enter this type of market, and it is at this time when we start with the third phase, the real madness of the crowds.

Phase 3: A Market Driven by Public Greed

No one knows how high Bitcoin and the other cryptocurrencies will rise in Phase 2. One thing is certain, in the end, a person will have to be a true financial hermit not to know that the surest way to make money, More money than you can possibly earn by doing anything else is buying cryptocurrencies. Undoubtedly, by then Bitcoin will not have a price in tens, or hundreds of thousands of dollars, because they will be divided, thousand, or even ten thousand against one. All a greedy, profit-hungry audience will want to know is that the price is low, affordable, and can only go up.

It’s the same with every bubble in history, but this one is potentially much bigger. To enjoy the thrill of the Mississippi bubbles and the South Seas, one had to be at a communicable distance from Paris and London, respectively. If the person lived outside these capitals, he probably risked being the victim of bandits, took a stagecoach with his gold, and looked for accommodation to be close to intermediaries. The hysteria of these bubbles probably did not infect more than a few tens of thousands of people. These were the rich when there was hardly an independent so-called middle class.

When those bubbles are given, the money was mainly real cash. In other words, speculative purchases should be paid for with FIAT money and diverted from other uses. The result was price inflation in Paris and London, reflecting the amount of money that flowed to those centers. At the same time, prices in the nearby provinces would have been depressed due to the lack of circulating money. Those who accumulated profits were made with FIAT money, silver, and gold.

Richard Cantillon, who was John Law’s personal banker in France, lent real money (his own and the gold from his depositors) for the Parisian nobility to buy John Law’s paper scheme. He took Mississippi stock as collateral and secretly sold it for gold. Cantillon withdrew to Italy to await events, and the Mississippi bubble collapsed as expected.

Bubble deflation generally reflects an adjustment in values and expectations rather than a real sale. Enough money had been taken out of Paris, thanks mainly to some smart gamblers like Cantillon, to make sure the bubble imploded. Wealth disappeared, leaving everyone, including those who had not bought shares, impoverished.

It cannot be said that there was no credit behind the bubble, but before the days of fractional reserve banking, unsecured lending was too risky for a bank, being fraudulent. Today, cryptocurrencies are not so hampered. Your purchase is fully paid for by extended bank credit and unsupported trust money, both created from nothing. Modern banking practice could allow cryptocurrencies to be accepted as collateral, and bankers will only know that prices are rising and that it is a profitable lending business.

Not only is the trust money available, but it is no longer necessary to be a day’s drive away to make the investment. Any citizen with a bank account and a mobile phone can join; not just the aristocracy of Paris or London, but billions in the world. The offer, which was materialized in the form of new currencies and yet-to-be-invented means of investment, is unlikely to keep pace with rising public demand, at least for a time. Methods of channeling public money into cryptocurrencies will be appropriately regulated, granting them public respectability.

When people know only one thing, and that is that cryptocurrencies are a financial miracle and a sure way to make money, they will be ready to collapse, if the bubble story is a guide. The last question we must address is how this can happen.

The Denouement

The collapse of a bubble always occurs when the supply increase is adjusted to demand or, alternatively, demand cannot keep pace with supply. Long before fractionated reserve banking was sanctioned by the government, the demand limitation was the availability of money, which, as stated earlier, meant that money had to be diverted from other activities to feed the bubble. Today, the expansion of bank credit, at least in theory, allows bubbles to extend in terms of both duration and extent.

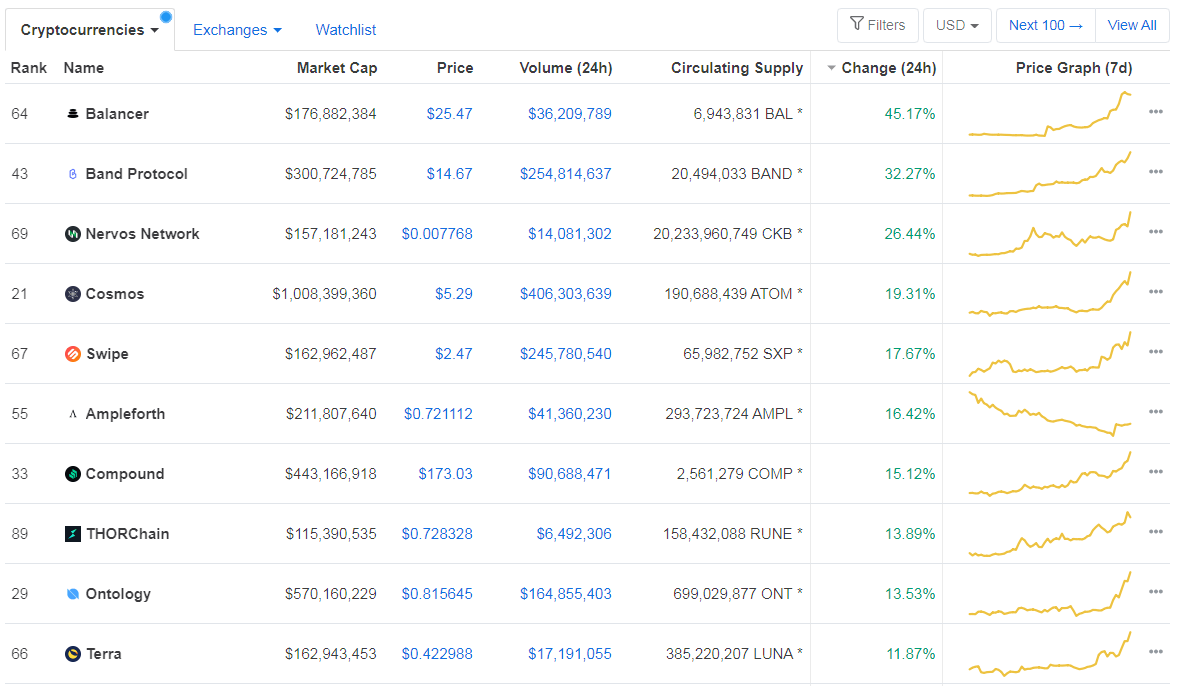
In practice, the supply in a bubble is always restricted, even for nothing else, to the desire of individual promoters to see the prices of their investment schemes rise. But the bubble of the South Seas showed that a successful promotion leads to a plethora of imitations, which is already being demonstrated with cryptocurrencies. Very few of these imitations have gained traction in the market so far, but future cryptocurrencies could be more credible, increasing the means available. Therefore, although bitcoins in this world individually have supply limitations, the market, in general, does not.

Derivatives and associated developments are likely to evolve outside the market, and will certainly be more sophisticated and acceptable. Funds that invest in public subscription and cryptocurrency futures could obtain official approval by regulating themselves through stock market listings. Their listing on stock exchanges will create additional demand, but it is inevitable that a point will come when that additional demand is completely absorbed. In theory, at least that time is a bit far.

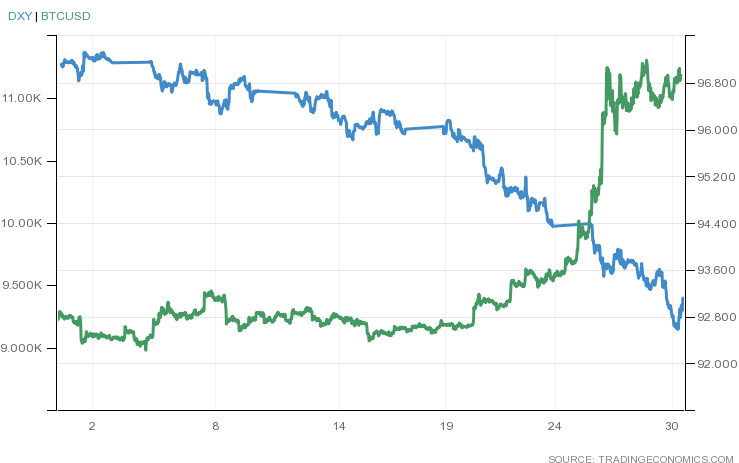
Given the ability of banks to create credit to inflate the bubble, it is difficult to visualize that there will be an end to madness just by analyzing cryptocurrencies for themselves. Therefore, we must consider the prospects of fiduciary currencies being sold to buy cryptocurrencies, and how the expansion of the cryptocurrency bubble may affect fiduciary currencies. Because it’s from that angle that the end is likely to happen.

Measured in terms of fiduciary currencies, any bubble is price inflation. The exclusion of relevant assets from government inflation statistics means that the effect on consumer prices will be a second-rate event.

For purposes of illustration and assuming that all other things are the same, suppose that at the height of the bubble, five percent of the world’s population is trading cryptocurrencies. This is possible given the ubiquity of mobile phones and other electronic devices. The paper wealth created by some 350 million people who enjoy the bubble, as well as a small part of the huge amount of money under professional management, will at that time be in the order of billions, possibly in the order of tens of billions. That wealth will extend to spending on services and goods, raising consumer prices in all areas. The effect is likely to be much more pronounced in advanced economies, where very few people lack banking services, and their successful speculation is more likely to translate more directly into spending.

It is at this time that it would seem that cryptocurrencies will replace government currencies, which could become a dangerous illusion. Central banks will soon realize that widespread public profits in cryptocurrencies are undermining the purchasing power of unsupported government currencies. At that time they will have no choice but to raise interest rates enough to stifle demand for these currencies. And when demand declines, it’s almost certain that there will be a rapid collapse.

In the absence of other factors, there is no doubt that this is how the bubble should develop. It has the characteristics of being the purest bubble in the history of money, following the three impulse movements traditionally associated with bullish markets. There is no definite difference between a bullish market and a bubble, except for the degree, just as there is no point where inflation becomes hyperinflation, and socialism becomes communism.

Underlying Credit Cycle and its Effects

It is very likely that the advance of this phenomenon is affected or reduced by other factors, especially the existing credit cycle. The industrial revolution across Asia, led by China and Russia, will almost certainly have a profound impact on world prices of goods and services over the next year or two. Not only are commodity prices expected to rise, but funds are expected to flow from conventional investments to capital projects, increasing demand for skilled workers, and increasing their wages.

Price increases and production shortages will force nominal interest rates to rise anyway, whether central banks want it or not. Any expansion of bank credit to support cryptocurrency speculation will add to these end-of-cycle factors. Therefore, it seems likely that interest rates will rise enough to trigger a credit crunch before the cryptocurrency bubble has the time to continue its theoretical course completely.

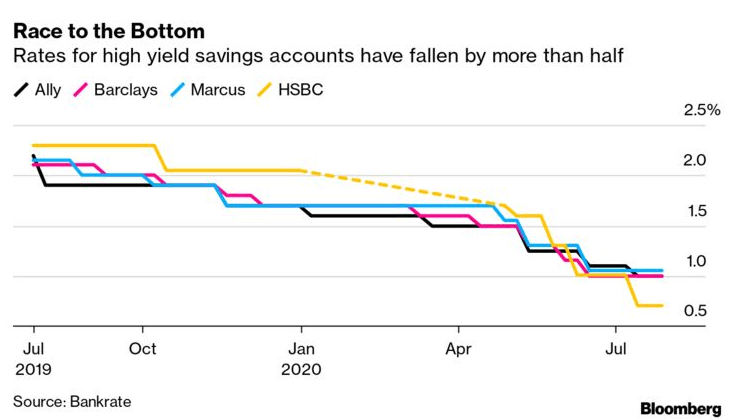
Assuming that commercial banks are rescued after the next credit crunch, it is possible that the disrupted cryptocurrency bubble will continue, probably after a strong negative swing. Bank deposits will remain intact, and depositors as a whole will have a much greater amount of fiduciary money than they need. It is almost entirely certain that central banks be forced to lower interest rates to zero, or to negative territory, making cryptocurrencies a more attractive alternative to bank deposits.

This should lead to a conclusion, which is that if it continues, the cryptocurrency bubble will play a major role in weakening the purchasing power of fiduciary currencies, potentially dramatically. If public participation in the final phase of the bubble occurs before the next credit crunch, it could advance and magnify the credit crunch itself. If it still runs its course after the credit crunch, it could undermine the buying power of fiduciary currencies in its wake, in a way we could never see after the Lehman crisis.

Will the price of gold be negatively affected? Surely, some members of the public, particularly in North America and Europe, will think so and will delay or sell gold purchases so they can invest in cryptocurrencies. But the truth is that gold is real money and has survived other episodes like this before. The eventual victim in this bubble will be money without state-issued backing. Gold will remain solid money long after the cryptocurrency bubble is recorded in the history books as the most convincing and pure evidence of the madness and delusions of the crowds.

Categories
Crypto Market Analysis

Daily Crypto Review, July 23 – Ethereum’s Price Skyrockets As Developers Announce Ethereum 2.0 Test Specifications

The cryptocurrency market spent yet another day shooting for the upside as Bitcoin tries to push itself closer towards $10,000. Bitcoin is currently trading for $9,358, which represents an increase of 1.72% on the day. Meanwhile, Ethereum gained a whopping 8.63% on the day, while XRP gained 2.88%.

 Daily Crypto Sector Heat Map

When talking about top100 cryptocurrencies, Terra gained 15.84% on the day, making it the most prominent daily gainer. DigiByte (8.29%) and Flexacoin (8.14%) also did great. On the other hand, Ampleforth has lost 30.52%, making it the most prominent daily loser. It is followed by iExec RLC’s loss of 12.26% and Velas’ loss of 7.15%.

Top 10 24-hour Performers (Click to enlarge)

Bottom 10 24-hour Performers (Click to enlarge)

Bitcoin’s dominance level decreased slightly since we last reported, with its value currently at 62.41%. This value represents a 0.38% difference to the downside when compared to Friday’s value.

Daily Crypto Market Cap Chart

The cryptocurrency market capitalization increased when compared to when we last reported, with the market’s current value being $284.16 billion. This value represents an increase of $6.63 billion when compared to the value it had on yesterday.

_______________________________________________________________________

What happened in the past 24 hours?

_______________________________________________________________________

_______________________________________________________________________

Technical analysis

_______________________________________________________________________

Bitcoin

The largest cryptocurrency by market capitalization had another green day where it continued strides towards $9,580, and ultimately $10,000. While the price did reach the $9,580 resistance level, it could not pass it for the time being. However, there is still a chance Bitcoin will pas (and confirm) the $9,580 level in this run, even though the overbought RSI says otherwise.

BTC traders should look for a trade opportunity after bitcoin loses bull presence or after it passes $9,580.

BTC/USD 4-hour Chart

Technical factors:

  • Price is above its 50-period EMA and its 21-period EMA
  • Price at its top B.B.
  • RSI is in the overbought territory (74.80)
  • Increased Volume

Key levels to the upside          Key levels to the downside

1: $9,580                                 1: $9,251

2: $9,735                                 2: $9,120

3: $9,870                                  3: $8,980

Ethereum

Ethereum skyrocketed today, gaining over 8% in the past 24 hours. The reason for the sudden increase in Volume (and price) is contributed to the growing DeFi field. This price is the highest Ethereum has been since February. Ethereum’s price rise got stopped by the ascending resistance level, but only for a short amount of time.

Ethereum traders should look for an opportunity in searching for pullbacks.

ETH/USD 4-hour Chart

Technical Factors:

  • Price is above the 50-period EMA and the 21-period EMA
  • Price above the top B.B.
  • RSI severely overbought (85.65)
  • One candle volume spike (rest is average)

Key levels to the upside          Key levels to the downside

1: $278                                    1: $260

2: $289                                    2: $251.4

3: $302                                     3: $240

Ripple

The third-largest cryptocurrency by market cap did well as well, with its price finally passing the $0.2 threshold after being stuck below it for almost a month. The move is currently stuck at the $0.205 resistance level, as XRP didn’t decide whether it will consolidate above or below it.

XRP traders can look for an opportunity to trade after XRP “decides” if it will end up above or below $0.205.

XRP/USD 4-hour Chart

Technical factors:

  • XRP in a mid-term descending trend (though it broke the trend in the short-term)
  • XRP lacks strong support levels below $0.178
  • Price above 21-period and the 50-period EMA
  • Price above the top B.B.
  • RSI is elevated (65.78)
  • Average/slightly higher than average Volume

Key levels to the upside          Key levels to the downside

1: $0.205                                  1: $0.2

2: $0.214                                  2: $0.19

3: $$0.227                               3: $0.178


Categories
Crypto Market Analysis

Daily Crypto Review, July 22 – Ethereum Passes Bitcoin and Becomes the Most Used Blockchain

The cryptocurrency market spent yet another day shooting for the upside as Bitcoin tries to push itself closer towards $10,000. Bitcoin is currently trading for $9,358, which represents an increase of 1.75% on the day. Meanwhile, Ethereum gained 3.06% on the day, while XRP gained 1.35%.

 Daily Crypto Sector Heat Map

When talking about top100 cryptocurrencies, Augur gained 22.19% on the day, making it the most prominent daily gainer. Elrond (20.66%) and Blockstack (16%) also did great. On the other hand, Synthetix Network has lost 10.2%, making it the most prominent daily loser. It is followed by Reserve Rights’ loss of 6.28% and Algorand’s loss of 4.53%.

Top 10 24-hour Performers (Click to enlarge)

Bottom 10 24-hour Performers (Click to enlarge)

Bitcoin’s dominance level stayed at the same level since we last reported, with its value currently at 62.79%. This value represents a 0.04% difference to the downside when compared to Friday’s value.

Daily Crypto Market Cap Chart

The cryptocurrency market capitalization increased slightly when compared to when we last reported, with the market’s current value being $277.53 billion. This value represents an increase of $1.98 billion when compared to the value it had on yesterday.

_______________________________________________________________________

What happened in the past 24 hours?

_______________________________________________________________________

_______________________________________________________________________

Technical analysis

_______________________________________________________________________

Bitcoin

The largest cryptocurrency by market capitalization spent the day furthering yesterday’s strides towards $9,580, and ultimately $10,000. However, with volume fading as well as RSI stepping into the overbought territory, it is unlikely that Bitcoin will pass $9,580 without consolidation.

BTC traders should look for a trade opportunity after bitcoin loses bull presence or after it passes $9,580.

BTC/USD 4-hour Chart

Technical factors:

  • Price is above its 50-period EMA and its 21-period EMA
  • Price at its top B.B.
  • RSI is overextended (69.87)
  • Increased volume (descending)

Key levels to the upside          Key levels to the downside

1: $9,580                                 1: $9,251

2: $9,735                                 2: $9,120

3: $9,870                                  3: $8,980

Ethereum

Ethereum continued on its path towards the upside in the past 24 hours. The second-largest cryptocurrency by market cap established its presence above $240 and pushed towards $251. However, the bullish presence is fading, and Ethereum is losing its momentum towards the upside.

Ethereum traders should look for an opportunity in searching for pullbacks.

ETH/USD 4-hour Chart

Technical Factors:

  • Price is above the 50-period EMA and the 21-period EMA
  • Price at the top B.B.
  • RSI elevated (68.02)
  • One candle volume spike (rest is average)

Key levels to the upside          Key levels to the downside

1: $251.4                                 1: $240

2: $260                                    2: $228

3: $278                                     3: $225.4

Ripple

The third-largest cryptocurrency by market cap spent another day trading in a sideways manner. Its moves are bound by the $0.19 support level and (more often) $0.2 resistance level. XRP’s next move will most likely be determined by Bitcoin’s move (in any direction).

XRP traders can look for an opportunity to trade when the currency breaks $0.2 with increased Volume, or falls down below $0.19 with increased volume.

XRP/USD 4-hour Chart

Technical factors:

  • XRP in a mid-term descending trend (though it broke the trend in the short-term)
  • XRP lacks strong support levels below $0.178
  • Price above 21-period and the 50-period EMA
  • Price slightly above middle B.B. (20-period SMA)
  • RSI is neutral (53.58)
  • Average/slightly low Volume

Key levels to the upside          Key levels to the downside

1: $0.2                                      1: $0.19

2: $0.205                                  2: $0.178

3: $0.214


Categories
Forex Basics

Comparing Popular Forex, Crypto and Penny Stocks Trading Methods

From podcasts to blog posts, we are constantly exposed to countless pieces of information. Everyone is nowadays sharing their opinions on the best investment strategies that should get you from zero to professional in no time. As we can at times rely a little too much on other people’s thoughts and ideas. You should know that there is a particular indicator which grants success regardless of what one decides to trade – profit. The final outcome and goal of every trade anyone ever does is one thing – money.

So, if you happened to be wondering if your investment strategy is the right one, just ask yourself the question of what is more important – being right or being profitable. While this is often easier said than done, we should first put effort into understanding which skills can help you begin or jump-start your career as a cryptocurrency trader. If you are a successful crypto trader or a forex trader attempting to trade cryptocurrencies, you will find that specific knowledge unique for the world of forex may be the one thing you have not given a try yet.

Firstly, we must acknowledge the fact that, to be able to understand how any form of trading functions, we really give ourselves the opportunity to compare and contrast as many different types of trading as possible. Not only will such an approach generate more knowledge, and therefore more insight, expansion across several markets will also lessen the chances to severely endanger your financial stability. While sources we turn to in order to learn more about trading often point to one of the popular markets, such as stocks, metal, etc., exploring the options to cover more than one market can give you an advantageous position as the truth is always somewhere in between.

By focusing on a single market and references which only praise that particular type of trade without acknowledging the power of a more comprehensive standpoint, you both deprive yourself of the opportunities to increase your profit and reduce your prospects of becoming a truly prosperous trader. Moreover, if you have already faced some challenges and experienced some losses trading in one or more markets, you are that much more apt to decide for yourself what your next step should be. Although they say we should learn from other people’s mistakes, even if you have made the mistakes we are going to discuss here, you probably know that almost every professional trader undergoes some level of disappointment in the process of gaining invaluable experience, which in itself is a reason strong enough for you to diversify your array of trading knowledge and skills.

Quite interestingly, the experiences of penny stock traders appear to be quite comparable to the ones of crypto traders. Both are often pushed to respond to quite pressing invitations to invest, further entailing an idea that one should not miss such rare opportunities to earn a profit. What is more, the common sites traders use to track trends and exchange ideas on lucrative investments are frequently the very places where the most enthusiastic supporters share inconsequential conclusions and thus mislead others into making unwise investment decisions. With such elevated emotions and stories which are blown out of proportions more often than not, penny stock traders become susceptible to hidden psychological manipulation. Because they are so closely involved with the group, these traders start trusting far-fetched ideas which their peers keep reinforcing one after the other.

As the underlying reasons for such miscalculations are mainly related to hope, shared by all participants jointly highlighting their wish to succeed, an individual can slowly start distrusting their own analytical skills. Placing one’s trust in the wrong hands can even lead to overlooking some real investment opportunities just because of the lack of hype surrounding these monumental events. In assessing various pieces of information traders come by, many times traders mistake interest for value, failing to recognize that some of the news receiving the least attention can actually indicate some very real lucrative investment opportunities. As a result of being so caught up believing whatever information available, these traders’ sense of what is right and wrong becomes heavily impaired. At this point, such traders are so oblivious to the accompanying risks that they in fact resemble poker players who invest $100 to earn 20 times more only to lose everything by the time the night ends.

This parallel between penny stock and cryptocurrency traders’ experiences should only serve as an example of how you can protect yourself from harming your financial stability and repetitively falling for the same trap. Therefore, to safeguard future investments, every trader should strive to implement some essential skills, which successful forex traders appear to display more prominently than those in other markets. With so many individuals having become deeply immersed in the cult-like crypto community, you may want to begin to assess how much your decision-making depends on groupthink.

While drawing constructive conclusions does entail a substantial degree of research, relying on a single-perspective source both deprives you of valuable insight and limits objectivity to a great extent. Moreover, although investing does imply a certain level of risk, deciding to go all-in actually goes against some basic trading principles. Besides, to be able to secure some stable, sustainable profit, you should start thinking about a strategy before you set out to reach your goals, as this will prevent some very probable misfortunes. As a crypto trader, you may have already missed some steps discussed here, but if you perceive your failures as invaluable lessons, you will help yourself to adopt a powerful mindset that allows the experience to transform into success.

You can always extend your cryptocurrency portfolio and turn to some other markets as well since you know now how experience in one market can affect your chances of amassing a fortune in some other ones. As we could see from the examples above, so many crypto and penny investors had to learn the hard way which key skills they require to avoid common trading mistakes. Nonetheless, due to the extensive array of experiences, lessons, and trading examples, you may now begin to grasp the importance of sensibly and logically analyzing one’s strategies, devising a strategic and well-thought-out plan, and intelligently growing an independent investor mindset, which are all considered essential forex trading skills.

Categories
Crypto Market Analysis

Daily Crypto Review, July 21 – Mastercard Bullish On Bitcoin; Paxos To Become Paypal’s Bitcoin Custodian

The cryptocurrency market spent the day trying to reach past its immediate resistance levels. Bitcoin is currently trading for $9,330, which represents an increase of 1.31% on the day. Meanwhile, Ethereum gained 1.26% on the day, while XRP gained 0.28%.

 Daily Crypto Sector Heat Map

When talking about top100 cryptocurrencies, Augur gained 11.37% on the day, making it the most prominent daily gainer. Waves (11.36%) and DxChain Token (6.32%) also did great. On the other hand, Band Protocol has lost 19.85%, making it the most prominent daily loser. It is followed by Kava’s loss of 17.94% and iExec RLC’s loss of 16.09%.

Top 10 24-hour Performers (Click to enlarge)

Bottom 10 24-hour Performers (Click to enlarge)

Bitcoin’s dominance level increased slightly since we last reported, with its value currently at 62.83%. This value represents a 0.33% difference to the upside when compared to Friday’s value.

Daily Crypto Market Cap Chart

The cryptocurrency market capitalization increased slightly when compared to when we last reported, with the market’s current value being $275.58 billion. This value represents an increase of $2.89 billion when compared to the value it had on yesterday.

_______________________________________________________________________

What happened in the past 24 hours?

_______________________________________________________________________

_______________________________________________________________________

Technical analysis

_______________________________________________________________________

Bitcoin

The largest cryptocurrency by market capitalization spent the day contesting and poking the $9,251 resistance level until a large spike caused by an increase in bear presence brought its price to $9,380. Bitcoin passed $9,251 instantly, but could not reach $9,580. It is currently trying to stabilize at around $9,330.

BTC traders should look for a trade opportunity after bitcoin establishes its position.

BTC/USD 4-hour Chart

Technical factors:

  • Price is above its 50-period EMA and its 21-period EMA
  • Price above the top B.B.
  • RSI is overextended (69.86)
  • Increased volume

Key levels to the upside          Key levels to the downside

1: $9,580                                 1: $9,251

2: $9,735                                 2: $9,120

3: $9,870                                  3: $8,980

Ethereum

Ethereum accompanied Bitcoin on its slow path towards the upside, but with its own little twist. While the upswings were much more explosive, the downswings were slower and less volatile. Ethereum reached past $240, which is where it is consolidating at the moment. The start of the explosive move got supported by the influx of buyers as well as the 21-period and 50-period moving averages, which were right at the bottom of the candle.

Ethereum traders should look for an opportunity when Ethereum confirms that it will stay above $240, or when it fails to do so.

ETH/USD 4-hour Chart

Technical Factors:

  • Price is above the 50-period EMA and the 21-period EMA
  • Price above the top B.B.
  • RSI elevated (67.20)
  • Slightly increased volume

Key levels to the upside          Key levels to the downside

1: $240                                    1: $228

2: $251.4                                 2: $225.4

3: $260                                     3: $218

Ripple

The third-largest cryptocurrency by market cap, unlike Bitcoin and Ethereum, had a pretty slow day. XRP hovered around the $0.2 resistance level, but could not break it. The inability to break this level might come from the steady low volume XRP has. For the time being, XRP will continue to trade stuck in a range, bound by support level of $0.19 and resistance level of $0.2.

XRP traders can look for an opportunity to trade when the currency breaks $0.2 with increased volume, or falls down towards $0.19 with increased volume.

XRP/USD 4-hour Chart

Technical factors:

  • XRP in a mid-term descending trend (though it broke the trend in the short-term)
  • XRP lacks strong support levels below $0.178
  • Price above 21-period and the 50-period EMA
  • Price between the middle B.B. (20-period SMA) and the top B.B.
  • RSI is neutral (56.72)
  • Volume average

Key levels to the upside          Key levels to the downside

1: $0.2                                      1: $0.19

2: $0.205                                  2: $0.178

3: $0.214


Categories
Crypto Videos

Grayscale Stopped Buying Bitcoin! What This Means For Bitcoins Future Price!

Grayscale Stopped Buying Bitcoin – What Happened?

For several months, Grayscale Investments was buying more Bitcoin than miners were able to produce. However, this trend came to a halt a few weeks ago.

Grayscale Bitcoin Trust Fund would file a Form 8-K with the SEC on a weekly basis, declaring its most recent Bitcoin acquisitions. However, the last report was filed on June 25, when the company disclosed that it purchased almost 20,000 BTC. The lack of reports after June 25 indicates that Grayscale completely stopped buying Bitcoin. According to its Q2 report, GBTC invested an average of $57.8 million per week.

A Grayscale spokesperson said that the halt in BTC purchases is only temporary, and is caused by a quiet administrative period.


Grayscale indicates institutional interest in Bitcoin

One thing to note is that GBTC is not a hedge fund, which means that it doesn’t buy assets and expects a return on them. Rather, the trust buys assets only when investors buy shares of the trust. As 84% of Grayscale’s investments came from institutional investors, mostly hedge funds, Grayscale buying Bitcoin is a great indication of institutional interest in crypto.


July tends to be a somewhat slow month for investment activity due to many asset managers taking vacations, which may have caused Grayscale to stop buying Bitcoin. Another reason might be that institutions lost some short-term interest due to Bitcoin not moving much recently. Bitcoin has been stuck price-wise ever since early May.

Categories
Crypto Videos

Crypto News! Twitter Promises Additional Security After Another Major Hack…

Twitter Promises Additional Security Measures After Major Hack

Twitter vows to add more security training as well as measures in order to protect its platform from breaches such as July 15 wide-scale hack.
Twitter made a statement saying that it is continuing its investigation into the hack while also looking to provide more security training against social engineering tactics. These measures will be in addition to cybersecurity coaching that they get during onboarding as well as ongoing phishing exercises.

Around 130 accounts were compromised on July 15 when hackers took over these prominent Twitter accounts in a Bitcoin giveaway hoax. Elon Musk, Bill Gates, Kanye West, current presidential candidate Joe Biden, as well as many crypto firms like Binance, Coinbase, Gemini, and BitFinex were among the hacked accounts.
“We’re aware of our responsibilities to the people who are using our service and to society more generally. We are embarrassed, we are disappointed, and more than anything, we are sorry,” Twitter said.

Twitter said that the hack did not only allow hackers to access the accounts, but also to view personal information such as email addresses and phone numbers.

How did this happen?

The attackers targeted employees, as Twitter said, using schemes that intentionally manipulated them to perform specific actions in a certain way, therefore revealing information. Hackers got their hands on and used Twitter employees’ credentials and accessed internal systems, which explains how accounts with two-factor authentication were compromised.
This large-scale hack has been deemed a wake-up call for all centralized platforms and possibly paved the way for decentralized platforms to emerge.

Categories
Crypto Daily Topic

Forex Vs. Crypto Trading: Which one is a Safer Investment Option? 

In the last few years, both forex and cryptocurrency markets have exploded in popularity as more people seek alternative ways of earning passive income. Forex currency exchange (forex), in particular, has been around for much longer but was initially accessible only to a wealthy class of investors. It was not until a few years ago that forex trading became accessible to all classes of investors, thanks to the proliferation of online brokers. 

Cryptocurrency trading, on the other hand, gained most of its audience after the phenomenal 2017 market rally. Even though cryptocurrencies are speculative investments that may result in huge losses, the violent price swings can also bring in significant profits. 

The two markets have their own unique aspects that make them attractive to different investors. At the same time, they share similar dynamics of supply and demand, which govern the prices of their respective assets. As such, it can be quite difficult, especially for new traders, to determine which market offers the best returns with minimal risks. A close examination of various market dynamics, however, can reveal which investment option aligns with your goals as an investor. 

Liquidity and Volatility 

Having been around for long, the forex market boasts the largest market liquidity with a daily trading volume of about $5.4 trillion. The crypto-market, on the other hand, had a cumulative market cap of $237 billion in 2019 alone. 

With respect to these figures, the forex market is less volatile– thus, the market prices remain fairly stable even after large trades, like the ones placed by institutional investors. Also, the low volatility and high liquidity mean that the forex market can absorb economic shocks better than the crypto market, which has high volatility and low liquidity. 

The forex market is, therefore, more appealing to risk-averse investors looking for more guaranteed returns. This is not to say that the crypto market is entirely unsafe for investment. For a trader, the high volatility of the market means that you can make significant profits, especially if you can correctly anticipate the market patterns using market analysis tools. The conservative traders also have an equal opportunity to thrive in the crypto market as the value of the underlying asset increases over time. 

Security 

There’s no doubt that the forex market is more secure than the crypto market. For starters, the underlying assets in foreign exchange are regulated by the governments through central banks. Moreover, all trading transactions are facilitated by a tight web of brokers who are required to comply with anti-money laundering (AML) and the Know Your Customer (KYC) policies to protect traders from fraud. On the downside, giving online brokers access to your personal data with respect to KYC regulations exposes you to identify theft. The brokers may even decide to monetize your data by selling it to advertisers without your consent. 

Cryptocurrencies, however, have little to no regulation. While they can be pegged to more stable assets, most of them aren’t and therefore derive their value from their own utility and speculation. What’s worse, there have been several cases of cryptocurrency scams where developers launch digital coins without any concrete use case nor utility value. 

Despite the ill reputation, the security of your investment in the digital asset market is only limited by the extent of your research in finding a reputable cryptocurrency and an exchange platform. The viability of a digital coin depends on its whitepaper and roadmap, as the two outline the intrinsic usefulness of the digital asset. Ideally, crypto worth investing in should have a real-world use case in a niche where there’s less competition. This way, the crypto will derive much of its value not from speculation but from its usability. 

Less competition ensures the asset maintains a high demand, which strengthens its overall value. Most importantly, the exchange on which a digital asset is listed should have a good history of securing investors’ funds. Exchanges with constant cases of being hacked may not be the right platform for trading cryptocurrencies. 

Exposure to risks

In the market trends context, both cryptocurrency and forex markets share the same level of risk in the sense that it is almost impossible to accurately predict the market movements. This is why both markets require a sound risk management plan, such as stop-loss orders, to maintain profitability when the market is in a bear run. 

To further limit losses and increase profits, you may consider leveraging the power of trading bots in both markets. These bots can be programmed to trade in line with your investment goals and execute orders autonomously. In the crypto market, they can be helpful since the market runs 24/7, unlike forex trading, which is limited to 5 days a week. 

Conclusion 

Essentially, choosing between forex or cryptocurrency trading boils down to what type of investor you are. If you are looking to make quick profits over a short period of time, then the crypto market is ideal, given its high volatility. At the same time, you should note that the volatility can easily work against you. To gain huge profits with minimal risk, invest in cryptocurrencies with a long-term goal. The market rewards patient investors generously, as evident from the historic increase in the value of most cryptocurrencies, which have turned out to be profitable to long-term investors. 

Forex trading has less potential for huge gains, whether long or short-term, as the value of the underlying asset is determined by monetary policies set by the central bank. But, there is a way to enjoy the best of the two worlds – trading forex using cryptocurrencies. In this case, you’ll have the high liquidity of the forex market to your advantage as well as the volatility of cryptocurrencies. This combination works even better if you can trade using well-established cryptos such as Ethereum or Bitcoin, whose demand is high, rendering them valuable. Besides increasing your chances of making profits, trading forex using cryptocurrencies secures your financial data since you don’t have to share your bank or credit card details to make cryptocurrency transactions. 

Categories
Crypto Market Analysis

Daily Crypto Review, July 20 – Twitter Hacker Possibly a BitMEX Trader; Hack Will End Up Being Good for Bitcoin?

The cryptocurrency market spent the weekend recovering from the descending trend that brought Bitcoin to $9,000. Bitcoin is currently trading for $9,200, which represents an increase of 0.15% on the day. Meanwhile, Ethereum gained 1.51% on the day, while XRP lost 0.49%.

 Daily Crypto Sector Heat Map

When talking about top100 cryptocurrencies, Band Protocol gained 39.23% on the day, making it by far the most prominent daily gainer. Terra (30.63%) and Swipe (28.00%) also did great. On the other hand, Flexacoin has lost 31.16%, making it the most prominent daily loser. It is followed by iExec RLC’s loss of 11.66% and Reserve Rights’ loss of 10.95%.

Top 10 24-hour Performers (Click to enlarge)

Bottom 10 24-hour Performers (Click to enlarge)

Bitcoin’s dominance level increased slightly since we last reported, with its value currently at 62.5%. This value represents a 0.33% difference to the downside when compared to Friday’s value.

Daily Crypto Market Cap Chart

The cryptocurrency market capitalization increased slightly when compared to when we last reported, with the market’s current value being $272.69 billion. This value represents an increase of $3 billion when compared to the value it had on Friday.

_______________________________________________________________________

What happened in the past 24 hours?

_______________________________________________________________________

_______________________________________________________________________

Technical analysis

_______________________________________________________________________

Bitcoin

The largest cryptocurrency by market capitalization spent the weekend slowly regaining its value after the drop to $9,000. The slow rise in price was stopped by an influx of buyers, which tried to bring the price above the $9,251 resistance level but failed to do so as the sheer volume was too low. Bitcoin is now consolidating at around the $9,200 level.

BTC traders should look for a trade opportunity in the range that is bound by the nearest support and resistance levels.

BTC/USD 4-hour Chart

Technical factors:

  • Price is above its 50-period EMA and its 21-period EMA
  • Price right below the top B.B.
  • RSI is neutral (53.87)
  • Lower than average volume

Key levels to the upside          Key levels to the downside

1: $9,251                                 1: $9,120

2: $9,580                                 2: $8,980

3: $9,735                                  3: $8,820

Ethereum

While Ethereum accompanied Bitcoin on its slow path towards the upside, it did so with much lower volume and volatility. The most recent hours brought a sharp increase in price, which attempted to bring the price above $240, but the push was unsuccessful. Ethereum is now consolidating right below the $240 level.

Ethereum traders should look for an opportunity when Ethereum starts moving down, or when it reacts to the next support/resistance level.

ETH/USD 4-hour Chart

Technical Factors:

  • Price is above the 50-period EMA and the 21-period EMA
  • Price above the top B.B.
  • RSI elevated (63.03)
  • Average/slightly increased volume

Key levels to the upside          Key levels to the downside

1: $240                                    1: $228

2: $251.4                                 2: $225.4

3: $260                                     3: $218

Ripple

The third-largest cryptocurrency by market cap moved along its range-bound upwards path towards $0.2. While the move got stopped at $0.2, XRP managed to gain some value over the course of the weekend. Volume remained stable throughout this slow increase, which is a great indicator.

XRP traders can look for an opportunity to trade when the currency breaks $0.2 with increased volume, or falls down towards $0.19 towards increased volume.

XRP/USD 4-hour Chart

Technical factors:

  • XRP in a mid-term descending trend (though it broke the trend in the short-term)
  • XRP lacks strong support levels below $0.178
  • Price above 21-period and the 50-period EMA
  • Price between the middle B.B. (20-period SMA) and the top B.B.
  • RSI is neutral (55.26)
  • Volume average

Key levels to the upside          Key levels to the downside

1: $0.2                                      1: $0.19

2: $0.205                                  2: $0.178

3: $0.214


Categories
Crypto Daily Topic

Algorithmic Trading Strategies Explained

Algorithmic trading is an advanced form of trading that uses a computer program to automate the process of buying and selling of either stocks, cryptocurrencies, FX currency pairs, options, or futures. Unlike trading assets directly through a broker, algorithm trading is more accurate and result-oriented as it is designed with a predefined set of instructions that guide it on how to execute trades.

The trades are executed at the exact price and trade volume. This helps eliminate the time lag between placing and execution of the order. Also, all trades are free from human emotions, which may otherwise make a trader give up on profitable trade due to fear or make losses in pursuit of profits. Although the trades are executed automatically, the algorithms used have to be generated by traders in line with their investment goals. The traders key in variables like price, volume, time, and other indicators, which trigger a buy or sell order when specific conditions are met. 

Common Algorithm Trading Strategies 

Here are some of the most used automated trading strategies that you can explore: 

#1 Momentum-based/ trend algo 

Momentum and trend is the simplest algorithm trading strategy that aims at capitalizing on a long-running market trend. The idea is that if the market has been moving in one specific direction, upwards or downward, it’ll continue to do so until it’s affected by opposing factors that change its trajectory. A simple momentum-based algorithm, for instance, will invest in the best performing indices based on their performance within a specific duration of time. A more complex strategy blends momentum over time, making use of both absolute and relative momentum indicators. For instance, when the 30-day moving average goes above the 80-day moving average, a buying order is executed; conversely, when the 30-day moving average goes below the 180-day moving average, then a selling order is executed. 

As such, momentum algo trading makes use of technical indicators such as the historical price data and trading volume to execute orders. Further, the strategy allows traders to rebalance the system on a weekly, monthly, quarterly, or even yearly basis. 

#2 Statistical Arbitrage trading 

Statistical arbitrage is an opportunistic trading algorithm strategy that capitalizes on the price differences of assets as listed on various exchanges or markets. For instance, say a security trades at $10 on exchange Y and goes for $9.86 per share on exchange Z. The algorithm will identify this price difference and take a long position of the security in exchange Z, then quickly takes a short position of the same amount of the security on exchange Y. 

To realize reasonable profits using this trading strategy, you need to execute high trade volumes frequently since the price differences are almost negligible. However, for the cryptocurrency market, the price differences can be significant due to the difference in demand for crypto within a specific geographical location. For instance, you can buy low-priced crypto from your local exchange and sell it in an overseas exchange where the demand is higher. 

#3 Mean reversion 

Mean reversion strategy can be used in conjunction with the momentum/trend algorithm to avert losses when the market trends change drastically. Here’s how – while momentum strategy assumes that an asset’s price will continue moving in the same trajectory as it’s currently trending, mean reversion, on the other hand, works under the principle that an asset will always return to its mean value at some point in time regardless of its current high or low trend. The idea here is that the price of an asset will always go back to its historical average price after extreme deviations. Often, these deviations are caused by overselling or overbuying of the subject asset, influencing its price movement.  

When using the mean reversion strategy, the algorithm seeks to identify the upper and lower price limits of an asset. When the price is below the lower limit, the algorithm takes a long position and sells when the price goes above the higher limit in anticipation of the price returning to its average value. 

#4 Weighted average price strategy 

In this strategy, large orders are executed based on either volume-weighted average price or time-weighted average price. The strategy can be executed manually, but the large orders have to be released in small parts, which cannot be humanly possible with as much efficiency and accuracy as that of an algorithm. Besides, to make above-average profits, the orders have to be executed as close as possible to the volume-weighted average price or time-weighted average price to reduce the impact on the market. 

#5 Sentiment analysis 

Sentiment algorithm trading is quite simple as it doesn’t rely on complex mathematical models to execute orders. It involves examining the general market movements based on the opinions of major stakeholders and traders’ behavior. As such, the algorithm analyzes all types of data from media reports, to social media, to earning reports – and uses this information to predict future price movements upon which orders will be executed. 

#6 Building a custom algorithm trading strategy 

There are various websites such as CryptoHopper and Bitsgap that offer a variety of trading algorithms which you can then connect to the exchange site of your choice. But, you still have an option to design a unique trading strategy, one that works with your understanding of the market and investment goals. To build an algorithm trading strategy, you need to have proficient programming skills in addition to a good understanding of the quantitative and fundamental analysis of the market. 

Once you have these skills, all you have to do is feed your code input variables such as price, trade volume, and other variances that will trigger the execution of orders. Note that, before using your strategy to trade on the real market, you need to run a backtesting program that involves testing the performance of the strategy using historical data. If the strategy brings good results, you can confidently use it to trade in the real market. 

Conclusion 

Algorithm trading strategies are ideal for both novice investors and traders who are yet to understand the factors influencing market movements. Even the experienced traders can also benefit from the accuracy and efficiency of algorithm trading strategies, which ensures that they don’t miss out on any trading opportunity. However, it is vital to understand that each strategy works differently, and therefore it’s advised to choose one that meets your investment goals. 

Categories
Crypto Videos

Dogecoin TikTok Pump Explained! Desperate Or Genius Pump & Dump?


Dogecoin TikTok Pump Explained

Dogecoin has been in the public eye as TikTok social media enthusiasts created a challenge that was trying to bring this popular cryptocurrency to $1. However, the hype around it, as well as the price has fallen notably in the past couple of days.

OKCoin CMO Haider Rafique said that “The Dogecoin TikTok effect is really down to the vitality of the TikTok platform, rather than the crypto industry because it thrives off of creating viral challenges. This is exactly the category in which this Dogecoin challenge fits”.
He added: “TikTok challenges come and go in very short cycles, and just by looking at the 20% drop in Dogecoin’s price in the last 24 hours, the trend has likely run its course already.”

TikTokers creating Dogecoin awareness

A viral movement on TikTok saw people buying Dogecoin, as well as urging their viewers to do the same. The ultimate goal of the effort was to send Dogecoin’s price to 1$. However, while the move did bring an increase to Dogecoin’s price, Doge’s price did not break above a penny during the challenge. During the TikTok movement, however, Dogecoin managed to double in price before going back down.

Dogecoin internet traction falls


Other than Dogecoin’s recent price plummet, other metrics are also hinting at Haider Rafique’s conclusion. Google Trends shows that searches for Dogecoin came back to a more normal level.
“We in the crypto market should be very careful of these viral moments as they detract from our long-term goal of creating a global and equitable financial system,” Rafique added.

Categories
Crypto Market Analysis

Daily Crypto Review, July 17 – People Call For a Bitcoin Ban After the Twitter Hack; What Will Actually Happen?

The cryptocurrency market spent most of its day recovering from the move that brought Bitcoin to $9,000. Bitcoin is currently trading for $9,119, which represents a decrease of 0.85% on the day. Meanwhile, Ethereum lost 1.88% on the day, while XRP lost 1.37%.

 Daily Crypto Sector Heat Map

When talking about top100 cryptocurrencies, Ampleforth gained 28.69% on the day, making it by far the most prominent daily gainer. Algorand (24.57%) and Aurora (16.45%) also did great. On the other hand, Divi has lost 8.28%, making it the most prominent daily loser. It is followed by Nexo’s loss of 7.12% and Elrond’s loss of 6.55%.


Top 10 24-hour Performers (Click to enlarge)

Bottom 10 24-hour Performers (Click to enlarge)

Bitcoin’s dominance level increased slightly since we last reported, with its value currently at 62.83%. This value represents a 0.11% difference to the upside when compared to yesterday’s value.

Daily Crypto Market Cap Chart

The cryptocurrency market capitalization decreased slightly when compared to when we last reported, with the market’s current value being $269.69 billion. This value represents a decrease of $2.84 billion when compared to the value it had yesterday.

_______________________________________________________________________

What happened in the past 24 hours?

_______________________________________________________________________

_______________________________________________________________________

Technical analysis

_______________________________________________________________________

Bitcoin

The largest cryptocurrency by market capitalization started the day quite rough, with its price dropping to $9,000 as bearish influence and volume increased. However, the price quickly retraced back above the $9,120 level, where it is currently consolidating. However, Bitcoin is approaching the descending trend line, which fell under during its drop to $9,000, which may cause the price to move once again.

BTC traders should look for a trade opportunity when Bitcoin reacts to the descending trend line.

BTC/USD 4-hour Chart

Technical factors:

  • Price is below its 50-period EMA and its 21-period EMA
  • Price right below the middle B.B. (20-period SMA)
  • RSI neutral/low (40.42)
  • Average volume (came back from increased)

Key levels to the upside          Key levels to the downside

1: $9,251                                 1: $9,120

2: $9,580                                 2: $8,980

3: $9,735                                  3: $8,820

Ethereum

Ethereum started the day by being rejected from the $240 level, therefore triggering a fall towards the $228 level. The second-largest cryptocurrency by market capitalization managed to stop its price drop at $229 and slowly start to recover and consolidate. While the price is on a slow path towards the upside, the ultimate short-term direction of Ethereum is unknown.

Ethereum traders should look for an opportunity when Ethereum approaches the $240 level.

ETH/USD 4-hour Chart

Technical Factors:

  • Price below the 50-period EMA and the 21-period EMA
  • Price below the middle B.B. (20-period SMA)
  • RSI neutral (40.36)
  • Average volume (back from greatly increased)

Key levels to the upside          Key levels to the downside

1: $240                                    1: $228

2: $251.4                                 2: $225.4

3: $260                                     3: $218

Ripple

The third-largest cryptocurrency by market cap was no exception to how the price action played out. The day started with a sharp price drop, which brought the price below $0.19. However, XRP quickly recovered and got on a slow upward trend, which may be stopped by the moving averages above it. If, however, XRP manages to pass them, the $0.2 resistance level will still pose a big problem.

XRP traders can look for an opportunity to trade when the volume increases, and the trend becomes clear enough, as the low volume and volatility are certainly not ideal for trading at the moment.

XRP/USD 4-hour Chart

Technical factors:

  • XRP in a mid-term descending trend (though it broke the trend in the short-term)
  • XRP lacks strong support levels below $0.178
  • Price below 21-period and the 50-period EMA
  • Price right under the middle B.B. (20-period SMA)
  • RSI is neutral (43.89)
  • Volume lower than average

Key levels to the upside          Key levels to the downside

1: $0.2                                      1: $0.19

2: $0.205                                  2: $0.178

3: $0.214


Categories
Cryptocurrencies

Dash Core Wallet Review

If you are reading this review, there are high chances you are familiar with Dash. To give you a quick overview of what it entails, Dash is a decentralized cryptocurrency, which is also an altcoin that has been forked from the Bitcoin blockchain. It was launched as “Xcoin” back in January 2014. Currently, it is ranked 12th in the cryptocurrency market. However, to use it, you need a Dash wallet.

While there is quite a good number of third-party wallets such as Jaxx, Dash Electrum, and Exodus, there is a Dash Core desktop wallet that you might want to consider for keeping your Dash coins safe. It is as its name suggests. The wallet is designed by Dash themselves, and, therefore, you can always rely on it for the latest updates and optimum performance. Read on as this review gets into a detailed insight into everything you need to know about the Dash Core Desktop wallet. 

Key Features

Masternode commands and voting: Dash Core wallet features special commands for controlling servers known as masternodes. They are used to enable services such as InstantSend, governance, and treasury system, as well as PrivateSend. 

ChainLocks: This feature is provided by the Dash Network that provides certainty when accepting any payment. It is used in parallel with InstantSend. Technically, it creates an environment where payments can be accepted instantly and with little or no risk from the “Blockchain Reorganization Events.”

PrivateSend: It is, as its name suggests. PrivateSend features provide users with true financial privacy by integrating an innovative process that mixes your inputs with at least two other people in one transaction. It also means that there will be no seed that leaves your wallet.

InstantSend: The technology integrated into this feature allows Dash currency to compete with instantaneous transaction systems without relying on a centralized authority. 

OS compatibility: Dash Core wallet is available for Linux, Windows, MacOS, and Raspberry Pi. 

Governance and treasury: It allows stakeholders to determine the direction that the project is heading to and devote 10% of the block reward to the ecosystem and the development of the project. 

Wallet encryption: This feature allows users to set a unique password or PIN that can be used to access the wallet. 

How to Download and Set Up the Dash Core Desktop Wallet

Step 1: Head to the official Dash website at https://www.dash.org/

Here, you will find two options. One is the “Get Dash,” and the other is for “12.1 Update”. Scroll down to the download wallet section. You will automatically be redirected to a different page where you can download your desired type. You’ll find options such as OSX, Windows (32 bit), Windows (64 bit), and Linux. Choose an option that suits your current operating system.

Step 2: Download Installer

After choosing your desired option, you will be prompted to save the software onto your device. Click on save and let the download complete. 

Step 3: Install the application

Once the download is complete, the next step would be to install the application. Click on the downloaded app and follow the installation prompts. You will be asked to either “run Dash Core” or “finish” once the setup is complete.

Step 4: Choose a custom data directory path

Another window will pop up to provide you with brief information on how much space your wallet will need, so you should ensure you choose your hard drive’s directory path carefully. Notably, you should consider that your Dash Core data will increase over time based on your usage. For this reason, you should ensure that you have enough storage on your existing drive. 

Click “OK” after you are done.

Step 5: Allow access to the firewall

If your firewall is active, you will be asked to grant the application access. Click on “Allow access” and wait for the application to synchronize with the Dash Blockchain. 

Step 6: Encrypt wallet

Once synchronization is complete, the first step would be to encrypt your wallet. Click on settings and choose “encrypt wallet.” Ensure you input a unique passphrase that is impossible to guess but easy to remember. The best way to set a strong password is to incorporate random characters, numbers, and lower and uppercase letters. Click “OK” once you are done.

Step 7: Read the risks involved when you lose your password

Another window will pop up with a warning of what might happen if you lose your passphrase. Click “yes” to start the encryption process. Give the process a few minutes. Another pop up will show up just before the encryption is complete informing you that the application will close to finish the wallet’s encryption process. Click “OK” to confirm and reopen the application. 

Step 8: Back up your wallet

Now that you have successfully installed and encrypted your wallet, the next step should be to create a backup. Click on “file” at the top of the application and click on “Backup Wallet.” Note that it is advisable to back up your wallet every time you add more coins. You can use storage mediums such as cloud or USB/hardware.

How to Send Dash

Sending Dash with your Dash Core desktop wallet is quite easy. All you need to do is click on “Send” and input the required details. Below is a detailed guide on how to go about it:

Pay To:  Enter the receiver’s address

Label: Enter a label for the address to add it to your address book and for easier access. It will help you sort out all the people you have ever sent to with ease. 

Amount: Add the number of coins you want to send.

Transaction fee: Click on “recommended” to expand the options.

Send: Ensure all the details are correct and click send.

Also, you might want to check on the transaction history. It will help you keep track of every transaction.

Receiving Dash

Receiving Dash on your application is also easy. All you are required to do is click on receive and fill in the required information. Here is a breakdown of how to go about it.

Label: It is helpful in organizing a list of addresses you use frequently.

Amount: Choose the amount of Dash you are requesting.

Message: You can add a message if you wish. 

Request payment: Click on request payment once you are done.

How Does Dash Core Compare to Other Wallets in the Market?

Dash Core vs. Atomic Wallet

Dash Core integrates quite a good number of powerful features such as InstaSend, PrivateSend, Masternode, Governance, and many other management functions. These features ensure that all transactions are safe and valid. The Atomic wallet supports neither PrivateSend nor InstaSend. However, it allows users to exchange cryptocurrencies peer-to-peer, which means that no third-parties are acting as intermediaries.

Dash Core vs. Exodus Wallet

Exodus is yet another well-known desktop Dash coin wallet in the market. It’s famous for its ability to integrate several cryptocurrency exchange programs such as ShapeShift. Users can trade a wide range of cryptos with little or no notable time constraints. However, this cannot be said of Dash Core. Another notable thing with Exodus is that it is offered in lite-node, which also means that you don’t have to download the entire blockchain on your PC. You will require more than 10 GB of free space on your computer to download and use Dash Core as it is offered in full-node. 

Pros and Cons of Dash Desktop and Mobile Wallet

Pros

  • Offers the highest security standard among free wallets
  • It is a multi-coin wallet and supports over 100 cryptocurrencies
  • Private keys are stored on the PC or Smartphone
  • You can access your DASH coins from anywhere across the globe
  • Downloads are free

Cons

  • Private keys can be stolen through phishing
  • Updates should be made regularly
  • The wallet is a full-node wallet and requires individuals to download the entire DASH blockchain that is well over 10GB

Final thoughts 

If you are looking for the best desktop DASH wallet, there is no better option than to try out the company’s DASH wallet itself. They have specially designed their crypto wallet to integrate top-notch security features. What’s more, you can always be sure to remain updated with their latest releases. Try it out, and there is no doubt you will enjoy their services. 

Categories
Crypto Market Analysis

Daily Crypto Review, July 16 – Bitcoin Giveaway Scam Hits Twitter: Jeff Bezos, Barack Obama, Kanye West And More Targeted

The cryptocurrency market had quite a slow day with sideways movements. Bitcoin is currently trading for $9,206, which represents a decrease of 0.59% on the day. Meanwhile, Ethereum lost 0.53% on the day, while XRP lost 0.95%.

 Daily Crypto Sector Heat Map

When talking about top100 cryptocurrencies, Elrond gained 14.90% on the day, making it by far the most prominent daily gainer. Syntherix Network (12.31%) and iExec RLC (11.07%) also did great. On the other hand, Bytom has lost 8.57%, making it the most prominent daily loser. It is followed by Nervos Network’s loss of 8.39% and Divi’ loss of 8.38%.

Top 10 24-hour Performers (Click to enlarge)

Bottom 10 24-hour Performers (Click to enlarge)

Bitcoin’s dominance level decreased slightly since we last reported, with its value currently at 62.72%. This value represents a 0.28% difference to the downside when compared to yesterday’s value.

Daily Crypto Market Cap Chart

The cryptocurrency market capitalization didn’t change in valuation when compared to when we last reported, with the market’s current value being $272.53 billion. This value represents a decrease of $0.13 billion when compared to the value it had yesterday.

_______________________________________________________________________

What happened in the past 24 hours?

_______________________________________________________________________

_______________________________________________________________________

Technical analysis

_______________________________________________________________________

Bitcoin

The largest cryptocurrency by market capitalization had quite a slow day. Its price followed the descending resistance line throughout most of the day until it jumped slightly above it. However, the current move has insufficient strength to pass the $9,251 resistance level. On top of that, the upside is guarded by the 21 as well as 50-period moving averages.

BTC traders should look for a trade opportunity after the largest cryptocurrency passes $9,251, or fails to break it.

BTC/USD 4-hour Chart

Technical factors:

  • Price is below its 50-period EMA and its 21-period EMA
  • Price right below the middle B.B. (20-period SMA)
  • RSI neutral (47.59)
  • Average volume

Key levels to the upside          Key levels to the downside

1: $9,251                                 1: $9,120

2: $9,580                                 2: $8,980

3: $9,735                                  3: $8,820

Ethereum

Ethereum also had a slow day, with its price dancing between $237.5 (where ETH seems to have found some form of support) and a $240 resistance level. The second-largest cryptocurrency by market capitalization might attempt to break $240 very soon, but such a move would need strong confirmation afterward to be completely valid.

Ethereum traders should look for an opportunity after the fight for $240 ends.

ETH/USD 4-hour Chart

Technical Factors:

  • Price below the 50-period EMA and the 21-period EMA
  • Price below the middle B.B. (20-period SMA)
  • RSI neutral (47.81)
  • Average volume

Key levels to the upside          Key levels to the downside

1: $240                                    1: $228

2: $251.4                                 2: $225.4

3: $260                                     3: $218

Ripple

The third-largest cryptocurrency by market cap was trading sideways throughout the day, with its price being slightly below $0.2. The resistance level held up quite nicely, which brought XRP’s price down by a bit. However, even though it performed the worst out of the top3 cryptocurrencies in the past 24 hours, XRP’s price moved less than 1% in total.

XRP traders can look for an opportunity to trade when the volume increases, and the trend becomes clear enough, as the low volume and volatility are certainly not ideal for trading at the moment.

XRP/USD 4-hour Chart

Technical factors:

  • XRP in a mid-term descending trend (though it broke the trend in the short-term)
  • XRP lacks strong support levels below $0.178
  • Price above 21-period and below the 50-period EMA
  • Price right under the middle B.B. (20-period SMA)
  • RSI is neutral (47.11)
  • Volume lower than average

Key levels to the upside          Key levels to the downside

1: $0.205                                  1: $0.2

2: $0.214                                  2: $0.19

3: $0.227                                 3:$0.178


Categories
Crypto Videos

Bitcoin Price Will Never Go to $0!

Bitcoin Price Will Never Go to $0!


It is now official: Bitcoin can face many price crashes, but not to the extent that it ends up costing $0. This is because one man decided he is going to buy all of it.
Entrepreneur and outspoken Bitcoin bull Alistair Milne posted a tweet on July 9, revealing that he had placed a buy order for 18.52 million BTC (currently worth $174 billion).

Milne uploaded a screenshot of his Bitfinex order book, proving that he did, in fact, place an 18.52 million BTC order, buying them all at 1 cent.
“I hereby confirm that Bitcoin will never go to zero,” he wrote.

“I’m buying them all at 1 cent.”
In order to complete this purchase, Milne will need a sum of $185,200 — currently equating to 19.7 BTC. He would, of course, also need Bitcoin to drop to a valuation of $0.01.
Bitcoin at $0 is a hard sell

Despite all the factors pointing to the overwhelming likelihood of Bitcoin never dropping to anywhere near zero in the future thanks to network incentives, the largest cryptocurrency by market capitalization is not without its vocal detractors.
Gold bug Peter Schiff remains among people who believe that Bitcoin is worthless and ultimately going down.
Other critics, however, may no longer be quite as sure as they once were. Ex-PayPal CEO Bill Harris claimed in 2018 that Bitcoin would go to $0, while just two years after that, rumors of PayPal integrating crypto payments began spreading.

Categories
Crypto Videos

Bitcoin vs. Gold and S&P 500: Correlation analysis


Bitcoin vs. Gold and S&P 500: Correlation analysis


While many want to believe that Bitcoin is a non-correlated asset, that doesn’t seem to be the truth. Though Bitcoin’s correlation with gold is diminishing, the asset’s correlation with the S&P 500 index is on the rise, as reported by the researchers at the crypto exchange Kraken.
Kraken Intelligence, which is a research part of major US cryptocurrency exchange, Kraken, has released a “Bitcoin Volatility Report” for the month of June 2020.


Bitcoin’s volatility 

The new report shows a 31% drop in Bitcoin trading, resulting in a 6-month low of Bitcoin’s annualized volatility.
The significant decline in volumes, as well as volatility, marked June as the least volatile month since February 2020.


Correlation with gold drops 

Bitcoin’s 30-day correlation with gold went down and passed its one-year average of 0.24 to the downside. This signified a four-month low correlation of -0.49, the researchers announced. The move towards the downside followed a modestly positive trend that started in the second half of May (and ended above a one-year average of 0.50).


Correlation with the S&P 500 on the rise

While Bitcoin is showing fewer signs of correlation with gold, the cryptocurrency’s correlation with the stock market indexes such as the S&P 500 seems to be growing. Kraken Intelligence reported that the trend reversal caused Bitcoin’s correlation with the S&P 500 to climb to the highs of up to 0.65.
Kraken’s data on Bitcoin and S&P 500 correlation is not a “lone wolf” since other exchanges’ research shows the same. OKCoin posted data earlier this week, saying that the exchange witnessed high levels of Bitcoin and S&P 500 1-month realized correlation. Daniel Koehler, liquidity manager at OKCoin, said that “The last time we saw SPX and BTC 1-month realized volatility spread being this low was prior to the March 12th BTC price crash”.

Categories
Crypto Market Analysis

Daily Crypto Review, July 15 – Fidelity Goes All-In On Bitcoin; BTC Difficulty At Historic Heights

The cryptocurrency market had quite a slow day and closed to no movement in the past 24 hours. Bitcoin is currently trading for $9,243, which represents an increase of 0.59% on the day. Meanwhile, Ethereum gained 0.56% on the day, while XRP gained 0.74%.

 Daily Crypto Sector Heat Map

When talking about top100 cryptocurrencies, Kava gained 20.77% on the day, making it by far the most prominent daily gainer. Syntherix Network (16.17%) and Waves (15.28%) also did great. On the other hand, Nexo has lost 12.73%, making it the most prominent daily loser. It is followed by Ravencoin’s loss of 8.11% and The Midas Touch’ loss of 6.75%.

Top 10 24-hour Performers (Click to enlarge)

Bottom 10 24-hour Performers (Click to enlarge)

Bitcoin’s dominance level decreased slightly since we last reported, with its value currently at 63%. This value represents a 0.27% difference to the downside when compared to yesterday’s value.

Daily Crypto Market Cap Chart

The cryptocurrency market capitalization increased slightly when compared to when we last reported, with the market’s current value being $272.66 billion. This value represents an increase of $1.79 billion when compared to the value it had yesterday.

_______________________________________________________________________

What happened in the past 24 hours?

_______________________________________________________________________

_______________________________________________________________________

Technical analysis

_______________________________________________________________________

Bitcoin

The largest cryptocurrency by market capitalization had quite a slow day. While its price went above the descending resistance line, the price itself did not move that much. On top of that, the move seemingly got stopped by the $9,251 resistance level (at least for now). The decreasing volume while being stopped by both moving averages and the resistance level suggests that the move reached exhaustion and that $9,251 will not be tackled (in the very near future).

BTC traders should look for a trade opportunity after the largest cryptocurrency passes $9,251.

BTC/USD 4-hour Chart

Technical factors:

  • Price is below its 50-period EMA and its 21-period EMA
  • Price right below the middle B.B. (20-period SMA)
  • RSI neutral (48.17)
  • Increased volume (Coming back to normal)

Key levels to the upside          Key levels to the downside

1: $9,251                                 1: $9,120

2: $9,580                                 2: $8,980

3: $9,735                                  3: $8,820

Ethereum

Ethereum was even less volatile than Bitcoin, with its price hardly even moving throughout the day. The second-largest cryptocurrency by market capitalization spent the day sitting on the $240 level while the bears and bulls were fighting on whether the price will consolidate below or above it. The volume dwindled as time passed, and ETH seems like it has more chance of remaining under $240. However, there is still a chance for bulls to win.

Ethereum traders should look for an opportunity after the fight for $240 ends.

ETH/USD 4-hour Chart

Technical Factors:

  • Price above the 50-period EMA and below the 21-period EMA
  • Price below the middle B.B. (20-period SMA)
  • RSI neutral (48.14)
  • Increased volume (Coming back to normal)

Key levels to the upside          Key levels to the downside

1: $240                                    1: $228

2: $251.4                                 2: $225.4

3: $260                                     3: $218

Ripple

The third-largest cryptocurrency by market cap hardly moved at all after the price drop of July 13, which brought the price below the $0.2 threshold yet again. XRP is hovering below the $0.2 level for two days now, without any possibility of breaking it yet.

XRP traders can look for an opportunity to trade when the volume increases, and the trend becomes clear enough, as the low volume and volatility are certainly not ideal for trading at the moment.

XRP/USD 4-hour Chart

Technical factors:

  • XRP in a mid-term descending trend (though it broke the trend in the short-term)
  • XRP lacks strong support levels below $0.178
  • Price above 21-period and below the 50-period EMA
  • Price right under the middle B.B. (20-period SMA)
  • RSI is neutral (46.8)
  • Volume lower than average

Key levels to the upside          Key levels to the downside

1: $0.205                                  1: $0.2

2: $0.214                                  2: $0.19

3: $0.227                                 3:$0.178


Categories
Crypto Market Analysis

Daily Crypto Review, July 14 – IRS Violated Taxpayers’ “Bill of Rights”; The UK Wants a Digital Currency

The cryptocurrency market shad a green day, mostly caused by Bitcoin dropping under its immediate support level. Bitcoin is currently trading for $9,199, which represents a decrease of 0.82% on the day. Meanwhile, Ethereum lost 1.6% on the day, while XRP lost 1.42%.

 Daily Crypto Sector Heat Map

When talking about top100 cryptocurrencies, Aurora gained 245.87% on the day, making it by far the most prominent daily gainer. Divi (24.12%) and Ravencoin (17.39%) also did great. On the other hand, Ampleforth has lost 36.61%, making it the most prominent daily loser. It is followed by Nexo’s loss of 13.30% and Quant’ loss of 11.55%.

Top 10 24-hour Performers (Click to enlarge)

Bottom 10 24-hour Performers (Click to enlarge)

Bitcoin’s dominance level increased slightly since we last reported, with its value currently at 63.27%. This value represents a 0.33% difference to the upside when compared to yesterday’s value.

Daily Crypto Market Cap Chart

The cryptocurrency market capitalization decreased slightly when compared to when we last reported, with the market’s current value being $270.87 billion. This value represents a decrease of $3 billion when compared to the value it had yesterday.

_______________________________________________________________________

What happened in the past 24 hours?

_______________________________________________________________________

_______________________________________________________________________

Technical analysis

_______________________________________________________________________

Bitcoin

The largest cryptocurrency by market capitalization had a red day as bears broke its immediate support level. BTC dropped below the descending trend line as well as the $9,251 level in a short bear run. The price went all the way down to the $9,120 support level, but stopped and reversed its path there.

Once again, BTC traders had a great opportunity to trade the pullback after the bearish move. Trading Bitcoin’s reversals and confirmations are the safest way to trade at the moment.

BTC/USD 4-hour Chart

Technical factors:

  • Price is below its 50-period EMA and its 21-period EMA
  • Price at the lower B.B.
  • RSI at below the middle point and heading down (42.17)
  • Increased volume

Key levels to the upside          Key levels to the downside

1: $9,251                                 1: $9,120

2: $9,580                                 2: $8,980

3: $9,735                                  3: $8,820

Ethereum

Ethereum had a slightly red day as well, but with a much tamer move towards the downside. While bears did manage to push Ethereum below the $240 level, they faced a good amount of resistance at the 4-hour 50-period moving average. However, the price went under it as well, but stopped near the $237 level, where some form of support is created.

Ethereum traders should look for an opportunity to trade the next bounce off of $240 or break to the downside from the $240.

ETH/USD 4-hour Chart

Technical Factors:

  • Price below the 50-period EMA and the 21-period EMA
  • Price at the lower B.B.
  • RSI near the middle (45.68)
  • Increased volume

Key levels to the upside          Key levels to the downside

1: $240                                    1: $228

2: $251.4                                 2: $225.4

3: $260                                     3: $218

Ripple

The third-largest cryptocurrency by market cap fell below the $0.2 support level after a failed attempt of breaking $0.205 to the upside. The price dropped all the way to $0.192 before bouncing back. XRP is now consolidating above the 4-hour 50-period moving average, which it uses as a temporary support. The “battle” for $0.2 is, however, not yet finished.

XRP traders can look for an opportunity to trade after XRP establishes whether it will end up above or below $0.2.

XRP/USD 4-hour Chart

Technical factors:

  • XRP in a mid-term descending trend (though it broke the trend in the short-term)
  • XRP lacks strong support levels below $0.178
  • Price below 21-period and the 50-period EMA
  • Price at the lower B.B.
  • RSI is neutral (45.92)
  • Average volume

Key levels to the upside          Key levels to the downside

1: $0.205                                  1: $0.2

2: $0.214                                  2: $0.19

3: $0.227                                 3:$0.178


Categories
Forex Videos

Retail Traders Expect a $15,000 Bitcoin Value By 2020 End!


Retail Traders Expect a $15,000 Bitcoin in 2020


A survey conducted by Bitcoin IRA, which is a major crypto custodian, shows that 42% of the platform’s customers think Bitcoin’s price will exceed $15,000 by the end of 2020. On top of that, a staggering 57% of the respondents said that they are buying and holding cryptocurrency as a long-term investment rather than a short-term money grab.

High hopes for Bitcoin

Mike Schrobo, Bitcoin IRA’s head of marketing, said that all respondents were retail investors. He also said that the company firmly believes in the long-term fundamental benefits as well as value propositions crypto provides to the financial system. He claimed that upward price pressures will likely continue as a result of Bitcoin’s adoption and scarcity. He also connected Bitcoin’s future price increase expectancy with money printing all around the world, which happened, and is happening, as a result of the COVID-19 pandemic.

Comprehensive survey

The survey also showed that 53% of respondents are extremely interested in earning some form of interest on their investments, either through lending or investing. Besides cryptocurrencies, the survey showed that these investors are also investing in precious metals, cannabis, and movie companies.

Categories
Crypto Market Analysis

Daily Crypto Review, July 13 – Coinbase Working With the US Secret Service; ETH 2.0 Facing Delays

The cryptocurrency market spent the weekend mostly rising in price after a semi-severe drop in price. Bitcoin is currently trading for $9,289, which represents an increase of 0.03% on the day. Meanwhile, Ethereum gained 0.59% on the day, while XRP lost 1.03%.

 Daily Crypto Sector Heat Map

When talking about top100 cryptocurrencies, iExec RLC gained 17.91% on the day, making it by far the most prominent daily gainer. Chainlink (17.25%) and Elrond (12.52%) also did great. On the other hand, Flexacoin has lost 21.07%, making it the most prominent daily loser. It is followed by UNUS SED LEO’s loss of 6.27% and Celsius’ loss of 6.03%.

Top 10 24-hour Performers (Click to enlarge)

Bottom 10 24-hour Performers (Click to enlarge)

Bitcoin’s dominance level decreased slightly since we last reported, with its value currently at 62.95%. This value represents a 0.34% difference to the downside when compared to Friday’s value.


Daily Crypto Market Cap Chart

The cryptocurrency market capitalization increased slightly when compared to when we last reported, with the market’s current value being $273.87 billion. This value represents an increase of $0.74 billion when compared to the value it had on Friday.

_______________________________________________________________________

What happened in the past 24 hours?

_______________________________________________________________________

_______________________________________________________________________

Technical analysis

_______________________________________________________________________

Bitcoin

The largest cryptocurrency by market capitalization had an average weekend in terms of volatility. Its price went down from $9,200 levels to $9,000 first, but bounced back quickly and started regaining its previous levels. BTC faced resistance in the form of the descending trend line for a short while but overcame it eventually. The price went up and then down to confirm the position above the level above which it is currently trading.

BTC trades should wait for the next increase in volume before trading BTC.

BTC/USD 4-hour Chart

Technical factors:

  • Price is above its 50-period EMA and its 21-period EMA
  • Price between the upper B.B. and the middle B.B (20-period SMA)
  • RSI at the mid-levels (52.35)
  • Decreased volume

Key levels to the upside          Key levels to the downside

1: $9,580                                 1: $9,251

2: $9,735                                 2: $9,120

3: $9,870                                  3: $8,980

Ethereum

Ethereum had had a slow weekend, with mostly sideways movement. However, the second-largest cryptocurrency by market cap managed to establish its position above the $240 during it. While the move to the upside seems to be done, Ethereum fulfilled its short-term goal and can trade, knowing it has strong support at $240.

Ethereum traders should look for an opportunity to trade the next bounce off of $240 or break to the downside from the $240.

ETH/USD 4-hour Chart

Technical Factors:

  • Price above the 50-period EMA and the 21-period EMA
  • Price slightly below the upper B.B.
  • RSI near the middle (55.41)
  • Decreased volume

Key levels to the upside          Key levels to the downside

1: $251.4                                 1: $240

2: $260                                    2: $228

3: $278.8                                  3: $225.4

Ripple

The third-largest cryptocurrency by market cap kept making higher lows and lower highs throughout the weekend. Ultimately, the price broke $0.2 to the downside and came back above it many times, with it currently being below $0.2. It is still uncertain where the price will end up.

XRP traders can look for an opportunity to trade after XRP establishes whether it will end up above or below $0.2.

XRP/USD 4-hour Chart

Technical factors:

  • XRP in a mid-term descending trend (though it broke the trend in the short-term)
  • XRP lacks strong support levels below $0.178
  • Price is at the 21 and above the 50-period EMA
  • Price slightly above the middle B.B. (20-period SMA)
  • RSI is neutral (52.65)
  • Average volume

Key levels to the upside          Key levels to the downside

1: $0.205                                  1: $0.2

2: $0.214                                  2: $0.19

3: $0.227                                 3:$0.178


Categories
Crypto Videos

IRS Intends to Track Privacy Coins! Is It Possible?


IRS Intends to Track Privacy Coins and Lightning Network Transactions

The U.S. Internal Revenue Service is seeking information as well as tools to help it trace transactions that are using privacy coins, side chains such as Plasma and OmiseGo, as well as layer two protocols such as the Lightning Network.

The U.S. Department Of The Treasury published an information request, revealing the IRS’ Criminal Investigation Division seeking submissions for “an interactive prototype” for analyzing distributed ledger-based transactions that are involving privacy coins as well as other privacy-enhancing blockchain technologies.

IRS and Privacy

The document is very specific in which cryptocurrencies the IRS wants to track. The list includes Monero, Zcash, Dash, Grin, Komodo, Verge, and Horizen, among the privacy coins that the IRS hopes to target. In addition to these, the IRS also wants to track layer two solutions such as Raiden Network, Celer Network, and Lightning network.

The IRS requests prototypes with which to declutter transactions and track a single user’s transaction regardless of the method used to obfuscate or hide the transaction location. The agency also requests the prototype to include a mechanism for importing and exporting the data gathered.

Hard to track privacy coins

Despite the bold ambitions the IRS has shown in trying to track cryptocurrencies, the agency acknowledges that tracking the movements and addresses of privacy coins is close to impossible at the moment.

They stated that currently, there are a few investigative resources for tracing transactions that are involving privacy cryptocurrency coins, side-chain ledger transactions, layer-two network protocol transactions, or transactions on distributed ledgers that are using signature algorithms that provide privacy.

Categories
Crypto Videos

A New Way To Trade Bitcoin – Is This The Key To Huge Gains?

New Way To Trade Bitcoin – Is This The Key To Profitability?

NEW YORK, NY – JANUARY 25: Chief Executive Officer David Lissy, joined by members of Bright Horizons’ leadership team, celebrate their IPO at the New York Stock Exchange on January 25, 2013, in New York City. (Photo by Ben Hider/NYSE Euronext)


According to the data currently circulating on social media, Bitcoin’s volatility is not spread out as well all may thing. In fact, the volume, as well as volatility of Bitcoin, seem to be highly correlated with the opening of the United States markets.


US stock markets vs. BTC

When compared to the London and Asia stock market opens, the US market open has a much greater of an impact on Bitcoin’s price volatility as well as volume. Further data from the on-chain analysis company Skew confirms the trend. Their data shows that Bitcoin trading is most intense around 4 pm UTC.


As an example, the past 30 days have shown Coinbase having an average of $6.5 million in volume between 3 pm and 4 pm UTC. We can clearly see the difference if we compare it to 9 am UTC, where Bitcoin saw just $2 million on average.


Bitcoin trading and regional changes

While this data doesn’t sound too important, it may indicate a trend of US institutions stepping into the crypto market. When compared with the 2017 to 2019 data, we can see that Asian traders have less of an impact now, while US traders have more of an impact.