Categories
Crypto Market Analysis

Daily Crypto Review, Sept 24 – Bitcoin Following Gold: $9,300 On The Horizon

The cryptocurrency sector has experienced a slight decrease in value as (as many traders speculate) Bitcoin mirrored Gold’s triangle pattern breakout and headed towards the downside. Bitcoin is currently trading for $10,261, representing a decrease of 1.72% on the day. Meanwhile, Ethereum lost 4.54% on the day, while XRP lost 3.79%.

 Daily Crypto Sector Heat Map

If we look at the top100 cryptocurrencies, Uniswap gained 13.73% on the day, making it the most prominent daily gainer. HedgeTrade (9.22%) and Hyperion (5.61%) also did great. On the other hand, DigiByte lost 17.91%, making it the most prominent daily loser. It is followed by Ren’s loss of 17.78% and Reserve Rights’ loss of 11.70%.

Top 10 24-hour Performers (Click to enlarge)

Bottom 10 24-hour Performers (Click to enlarge)

Bitcoin’s dominance level experienced a slight increase since our last report, with its value currently being at 61.45%. This value represents a 0.35% difference to the upside when compared to when we last reported.

Daily Crypto Market Cap Chart

The crypto sector capitalization has decreased in value over the past 24 hours. Its current value is $325.05 billion, which represents a decrease of $8.86 billion when compared to our previous report.

_______________________________________________________________________

What happened in the past 24 hours?

_______________________________________________________________________

_______________________________________________________________________

Technical analysis

_______________________________________________________________________

Bitcoin

Bitcoin has spent the day mirroring Gold’s movement from a day ago, where it broke the same triangle pattern to the downside. With the same happening to Bitcoin, we saw its price falling to sub-$10,300 levels. If we take into account the CME Futures, which will expire on Friday, deeming as much as 86% of $284 million worth of contracts worthless, we can guess with accuracy that the bears will continue to reign over the market for now. The suggested price of $9,300 to $9,500 is even more realistic now.

BTC/USD 1-day Chart

If we take a look at the 4-hour time frame, the largest cryptocurrency by market cap has dropped below the 23.6% Fib retracement as well as the triangle bottom line, suggesting strong bearish sentiment in the short-term. While the volume is descending and preparing for the next move, Bitcoin’s next one will most likely be to the downside.

BTC/USD 4-hour Chart

Bitcoin’s short-term technicals haven’t changed from yesterday, and are still very bearish. However, while the technicals are very bearish on the 4-hour chart, the daily and weekly technical overview is slightly less bearish, while the monthly overview is very bullish.

BTC/USD 4-hour Technicals

Technical factors (4-hour Chart):
  • Price is below both its 50-period EMA and 21-period EMA
  • Price slightly closer to the bottom Bollinger band
  • RSI is neutral (34.72)
  • Volume is slowly descending from a massive spike
Key levels to the upside          Key levels to the downside

1: $10,500                                 1: $10,015

2: $10,630                                 2: $9,880

3: $10,850                                  3: $9,740

Ethereum

The DeFi market has managed to recover from its plummet, with yearn.finance leading the move to the upside. While Ethereum has lost value due to its correlation with Bitcoin, its short-term overview is slightly more bullish.

However, if we take a look at Ethereum’s chart, we can see that the second-largest cryptocurrency by market cap managed to stabilize after hitting the bottom Bollinger band, which provided adequate support. While ETH did fall below $340 and broke a major support level, which calls for a push towards $300, the situation is slightly more bullish than the day before.

ETH/USD 4-hour Chart

Ethereum’s short-term technicals are extremely bearish, while the situation changes drastically in the weekly and monthly overview, where the overview is quite bullish.

ETH/USD 4-hour Technicals

Technical Factors (4-hour Chart):
  • The price is below both its 21-period and its 50-period EMA
  • The near its bottom Bollinger band
  • RSI is hovering around the oversold line (30.56)
  • Volume is average (except for the one-candle volume spike during the downturn)
Key levels to the upside          Key levels to the downside

1: $340                                     1: $300

2: $360                                     2: $289

3: $371                                      3: $278

Ripple

XRP has spent the day continuing its Elliot impulse wave 5th leg. While its price did go down, many traders have turned slightly bullish, calling out for the end of the 5th leg of the impulse wave at the spot where the price meets the ascending trend line from March (the red ascending line). This would put the price target for XRP at somewhere between $0.215 and $0.218 before pushing towards the upside.

XRP/USD 1-day Chart

While many traders have turned bullish, XRP’s technicals are still firm with their bearish sentiment. The bearish sentiment doesn’t end at the shorter time frames; it rather extends to the daily and weekly overview as well.

XRP/USD 4-hour Technicals

Technical factors (4-hour Chart):
  • The price is below both its 21-period EMA and its 50-period EMA
  • Price is very close to its bottom Bollinger band
  • RSI is in the oversold territory (27.28)
  • Volume is volatile, with occasional spikes
Key levels to the upside          Key levels to the downside

1: $0.227                                   1: $0.221 

2: $0.235                                   2: $0.214

3: $0.2454                                3: $0.2


Categories
Cryptocurrencies

03 Wallet Review: Is It The Safest Neo Blockchain Wallet Yet?

203 crypto wallet launched in 2015 as a mobile crypto app before its developers – 03 Labs – introduced the desktop version in 2018. It is built for the Ontology Network – a Neo Blockchain fork – that was previously grouped alongside NEP-5 crypto projects. It is specially designed to provide Neo platform users with a safe and easy to use platform where they can store, exchange, and monitor their crypto portfolio.

The 03 network website describes the 03 crypto wallet app as a “gateway to the smart economy” where you can “manage, exchange, stake, and buy” different cryptocurrencies. But how convenient is the 03 Wallet? How safe is the 03 mobile wallet app? This wallet review seeks to explore and detail all the 03 Wallet features to help determine the wallet’s safety and security level.

Key features:

Cross-platform wallet: 03 is a cross-platform wallet implying that it is available as both a mobile wallet for Android and iOS smartphones and a desktop app compatible with Windows, macOS, and Linux. You can download the updated versions of either on the 03 network website or GitHub.

Voting and staking: By maintaining a significant number of Gas and NEO coins in your 03 Wallet, you can vote for the network delegates. Similarly, you can stake your coins held in the 03 Wallet and get to earn interest in the form of GAS tokens.

Multiple payments methods: 03 Wallet is also one of the few NEO and ONT network-linked wallets that allow for crypto purchases using credit cards. It is also one of the few wallets that allow you to buy Neo-affiliated tokens using such other cryptocurrencies as Bitcoin, Ethereum, and Litecoin.

Integrates a crypto marketplace: Though 03 Wallet does not have an inbuilt exchange, it integrates the Switcheo marketplace that allows for the exchange of cryptocoins and tokens at reasonable fees. The marketplace is highly intuitive and easy to use but requires you to transfer funds between the exchange and your wallet.

NEO newsfeed: The crypto wallet also integrates an updated NEO-blockchain news site. Here, you get the latest news and developments taking place within the Neo blockchain and ONT networks.

Portfolio monitoring: 03 further lets you partition your wallet and create hot and cold storage. This, plus the fact that you are able to monitor both wallet performances, plays a key role in helping you make sound financial decisions. It is also a security measure ensuring that even if a hacker were to gain access to your device, they cant breach your cold storage.

Security features:

Uses device password: Like most other app-based crypto vaults, 03 Wallet is secured with a password. But, unlike most other wallets, you don’t have to create a separate password for the wallet as it uses your device’s password.

Open source: 03 Wallet is created using open-source technology, which gives anybody a chance to view and audit its code. You can download this code on either the 03 network website or GitHub.

Hierarchically deterministic: The 03 Wallet app is also hierarchically deterministic and will auto-generate a new wallet address for every new transaction. This goes a long way in masking your real public address and throwing off would-be third-party crypto trackers.

Non-custodial: The 03 crypto wallet doesn’t store your private keys in the ONT or Neo network servers. Rather, it saves them within your device.

Guaranteed user anonymity: 03 Wallet guarantees the anonymity of their wallet users in the sense that it doesn’t ask for any of your personal information when creating a user account and neither does it collect and store any information that’s personally identifiable to you. Your crypto transactions are, therefore, wholly anonymous.

Military-grade encryption: All the data collected by the wallet, including your wallet address, private keys, and passwords, is also subjected to military-grade encryption. So are all wallet communications with third party systems like payment processors and exchanges.

How to set and activate the 03 Wallet

Step 1: Search for 03 Wallet on Google play store of Apple app store and download

Step 2: Install the wallet and, once complete, launch the app and select “Create a New Wallet.”

Step 3: Create a password for your wallet. This not only helps secure your app vault but also plays a key role in randomizing your private key.

Step 4: Click on the settings tab and proceed to backup your crypto wallet.

Step 5: Your 03 Wallet is now active and ready for use.

How to add/receive crypto into your 03 Wallet

Step 1: Log in to your 03 crypto wallet, and on the user dashboard, click on the “Receive” tab.

Step 2: The wallet will display both the public address and the QR code that you can copy and send to the individual sending you coins.

Step 3: Alternatively, use the “Buy” option and buy crypto from the integrated exchanges.

Step 4: Wait for your crypto to reflect on your wallet.

How to send crypto from your 03 Wallet

Step 1: Log in to your 03 crypto wallet app and on the user dashboard, click “send.”

Step 2: If you have multiple crypto coins held in here in different wallets, select the crypto you want to send

Step 3: On the transfer window, key in the recipient’s wallet address and the number of coins you wish to send 

Step 4: Confirm the accuracy of these details and hit send

03 Wallet ease of use

03 Wallet is very user friendly and easily navigable with all the important tabs carefully placed on the user dashboard. The wallet is designed to appeal to novice and experienced traders alike. The onboarding process is quick and straightforward, and so are the processes of sending and receiving crypto. 03 is also a light wallet that doesn’t eat into your phone’s storage or battery power while guaranteeing the fastest transaction processing speeds.

03 Wallet supported currencies

03 is a multi-currency asset, implying that it supports a wide variety of cryptocurrencies. Supported cryptos include Neo, Neo Gas, ONT, all NEP-5 tokens, and all ONT-G tokens.

03 Wallet cost and fees

Installing the 03 Wallet and storing your cryptocurrencies therein is free. You will, however, be charged a network fee for outbound transactions by the NEO and ONT networks.

Other charges that you might incur when using 03 Wallet include the exchange fees accrued when you buy or sell crypto. This fee is fixed at 15% of the total value, but you enjoy a 50% discount if you use the exchange’s native token – SWTH.

What are the pros and cons of using the 03 Wallet

Pros:                                                                                                           

  • The wallet app is highly intuitive and beginner-friendly
  • 03 Wallet is quite versatile as its available on mobile and desktop
  • 03 integrates a crypto exchange and supports crypto purchases using a credit card
  • Wallet users also have access to a readily available customer support team via Telegram and twitter
  • The transaction processing fees are minimal and discounted – in the case of the Switcheo exchange

Cons:

  • When the wallet uses your device’s password, you risk losing private keys should you deactivate the password before backing up the vault
  • It is a hot wallet
  • It ignores key security features like the two-factor authentication

Comparing 03 Wallet with other Neo-blockchain crypto wallets

03 Wallet vs. Neo Web Wallet

03 Wallet and Neo web wallet are some of the most innovative and easy to use Neo-blockchain wallets. They are also Neo-specific, relatively safe, and promote anonymous crypto trading. They also encrypt your user data and store it in your device. However, while Neo is web-based, 03 Wallet is a desktop and mobile app.

While Neo Web wallet may be considered faster in transaction processing, 03 Wallet carries the day when it comes to the number of supported currencies, integration with crypto exchanges, and support of multiple payment processing service providers.

Verdict: Is 03 Wallet safe?

Well, the desktop and mobile wallet app has embraced key security and anonymity measures that guarantee the security and anonymity of your trades. It, for instance, is hierarchically deterministic in generating wallet addresses, it is open-sourced, and allows for anonymous trading. Moreover, it introduces the concept of partitioning your wallet to create hot and cold storage. However, we must mention that 03 is still a hot wallet and, therefore, exposed to the inherent threats dogging online wallets.

Categories
Crypto Market Analysis

Daily Crypto Review, Sept 23 – Gold Pushing BTC Towards $9,500; XRP Bears Taking Over

The cryptocurrency sector has mostly tried to consolidate after this weekend’s losses. Bitcoin is currently trading for $10,496, representing an increase of 0.68% on the day. Meanwhile, Ethereum gained 0.26% on the day, while XRP lost 1.28%.

 Daily Crypto Sector Heat Map

If we look at the top100 cryptocurrencies, OMG Network gained 21.05% on the day, making it the most prominent daily gainer. Synthetix Network (20.54%) and Hyperion (16.87%) also did great. On the other hand, Avalanche lost 54.43%, making it the most prominent daily loser. It is followed by Orchid’s loss of 13.56% and Celo’s loss of 10.10%.

Top 10 24-hour Performers (Click to enlarge)

Bottom 10 24-hour Performers (Click to enlarge)

Bitcoin’s dominance level experienced a slight decrease since our last report, with its value currently being at 61.10%. This value represents a 0.19% difference to the downside when compared to when we last reported.

Daily Crypto Market Cap Chart

The crypto sector capitalization has slightly increased in value over the past 24 hours. Its current value is $333.91 billion, which represents an increase of $3.7 billion when compared to our previous report.

_______________________________________________________________________

What happened in the past 24 hours?

_______________________________________________________________________

_______________________________________________________________________

Technical analysis

_______________________________________________________________________

Bitcoin

Bitcoin has spent the day trying to “end the battle” for the 23.6% Fib retracement level. With it ultimately ending up above it, Bitcoin has managed to stay out of the bearish cycle it was about to jump in. With that being said, the 1-day chart is still calling for a pullback towards the $9,300-$9,500. The large red triangle on our chart shows Bitcoin’s possible correlation with gold (as the gold chart looks exactly the same, with the exception that its triangle already popped to the downside), which may cause another push towards the downside.

BTC/USD 1-day Chart

If we take a look at the 4-hour time frame, the largest cryptocurrency by market cap managed to stay above the triangle bottom line and gain a foothold at the 23.6% Fib retracement line. However, Bitcoin’s sentiment is still slightly bearish in the short-term, which may ultimately result in another nosedive.

BTC/USD 4-hour Chart

Bitcoin’s short-term technicals are still very bearish. However, the more we look at longer time frames, the better the situation is. While the technicals are very bearish on the 4-hour chart, the daily and weekly overview are not so bad (though still tilted towards the downside), while the monthly overview is still very bullish.

BTC/USD 4-hour Technicals

Technical factors (4-hour Chart):
  • Price is slightly  below its 50-period EMA and its 21-period EMA
  • Price slightly below its middle Bollinger band
  • RSI is neutral and recovering from the downswing (39.62)
  • Volume is slowly descending from a massive spike
Key levels to the upside          Key levels to the downside

1: $10,630                                 1: $10,500

2: $10,850                                 2: $10,015

3: $11,000                                  3: $9,880

Ethereum

DeFi market is experiencing a bloodbath, with yearn.finance dropping 50% from its highs established in the past weeks and the rest of the market following. With that being said, many institutional investors have said they are macro-driven and not crypto-driven and that ETH’s fundamentals have never been better.

However, if we take a look at Ethereum’s chart, we can see that the situation is not exactly bullish. The second-largest cryptocurrency by market cap has barely established support at the $340 level. With the volume coming back to normal, it seems that ETH will stay at this level and try to consolidate in the short-term.

ETH/USD 4-hour Chart

Ethereum’s short-term technicals are extremely bearish, while its mid-term technicals are getting quite bullish. This confirms the story that the “smart money” is telling, which is that institutional money is coming into the market regardless of the short-term bearishness.

ETH/USD 4-hour Technicals

Technical Factors (4-hour Chart):
  • The price is below both its 21-period and its 50-period EMA
  • The between its middle and bottom Bollinger band
  • RSI is neutral but tilted towards the downside (34.67)
  • Volume has returned to average
Key levels to the upside          Key levels to the downside

1: $360                                     1: $340

2: $371                                     2: $300

3: $400                                      3: $289

Ripple

XRP has spent the day trying to consolidate after a push towards the downside. The fourth-largest cryptocurrency by market cap has (for now) stopped its squeeze down after hitting the bottom of the bottom Bollinger band, which stopped it from descending further. While the sentiment is still bearish, the move towards the downside that will finish the Elliot impulse wave’s fifth leg may be delayed slightly.

XRP/USD 1-day Chart

Taking a look at the technicals, XRP is showing extreme bearish sentiment on both short-term and long-term charts. Its 4-hour, daily, weekly and monthly indicators are heavily tilted towards the downside, which is certainly not a good sign for the XRP bulls.

XRP/USD 4-hour Technicals

Technical factors (4-hour Chart):
  • The price is below both its 21-period EMA and its 50-period EMA
  • Price is slightly above its bottom Bollinger band
  • RSI is neutral and flat (38.38)
  • Volume is coming back to average
Key levels to the upside          Key levels to the downside

1: $0.235                                   1: $0.227 

2: $0.2454                                 2: $0.221

3: $0.266                                  3: $0.214


Categories
Forex Videos

Buffett dumping Wells Fargo benefits Bitcoin


Warren Buffett and its company Berkshire Hathaway have substantially cut their position on Wells Fargo, selling a whopping number of 100 million shares. The, as they call him, Oracle of Omaha, is continuing to trim his position in bank stocks, which subsequently means that he is bumping up the bull case for gold and Bitcoin.
Berkshire Hathaway reportedly held $32 billion in Wells Fargo stocks at one point, while the investment conglomerate now owns only 3.3% in equity of the lender, coming up to just $3.36 billion.

Why Did Buffett Dump Wells Fargo


Throughout his career, Buffett always spoke about the importance of value investing and cash flow. He typically prefers businesses that have quite predictable and stable operations and results in consistent profitability.
In July, Wells Fargo posted a loss of $2.4 billion, recording its first loss since the 2008 financial crisis. Following the disappointing quarterly report, the bank said that its dividends would be cut to 10 cents per share.
This month, Moody’s financial analysis report showed its rating going down from stable to negative. The reason for this was mainly how slow the process to overhaul its governance was. Allen Tischler, a Moody’s analyst, said:
“Our change in outlook reflects Wells Fargo’s slower-than-anticipated pace when it comes to resolving its legacy governance, oversight, compliance, as well as operational risk management deficiencies. The aforementioned slow pace weighs on its expense base, further undermining the company’s earnings potential.”


The confluence of the quarterly loss, the dividends being cut, and the downgraded outlook presented by analysts likely led Buffett to trim his position in Wells Fargo.
Berkshire’s portfolio has had a reshuffle in recent months as its investments shifted more towards Barrick Gold. While decreasing its exposure to the US banking sector, Buffett invested in gold as well as in Japanese trading companies.
How Does This Benefit Bitcoin?
The decisions Buffett made recently show that he is seeking safety in terms of cash flow as well as a hedge against inflation. The large Barrick Gold investment fuels the bull case for Bitcoin simply because the perception of BTC as a store of value is greatly improving, especially given the tight correlation between gold and BTC since the March 2020 crash.

BTC would “cannibalize” gold in the future


While Buffet doesn’t want to get involved in cryptocurrencies, other notable investors, including the Winklevoss twins, have very strong beliefs that Bitcoin as “digital gold” could compete against gold over the long term. Of course, Bitcoin is also interesting to investors because of its immense upside potential. When comparing the size of the two markets, Bitcoin’s market capitalization is still only around 1.5% of gold.
Cameron Winkelvoss, the co-founder of Gemini, announced that Bitcoin already has significant advantages versus gold. He said:

“Bitcoin has made significant ground on gold —going from white paper to over $200 billion in market cap in under a decade. Bitcoin will continue to cannibalize gold dramatically over the next decade.”
Wall Street veteran and the host of the Keiser Report, Max Keiser, also believes that Buffett exiting the dollar is quite a bullish signal for the price of gold and Bitcoin.

Categories
Crypto Guides

Could Bitcoin Ever Beat Gold & Get The Safe-Haven Status?

Introduction

The traditional investors from the last few months are trying to understand the unprecedented financial system. The world is suffering from economic uncertainties, where 20% of the US workforce lost their jobs due to the COVID pandemic situation. At the same time, the precious metal “gold” hit an all-time high in this 2020 summer and stayed on a hike for a long time ever since.

The gold rush in the market might be due to various reasons – US dollar fall, US-China deteriorating relations, and general global economic crisis. Also, cryptocurrency investors advocated that Bitcoin perhaps can beat gold as the safe-haven, but researchers pointed out the fact that BTC is not so performing. As with the stock market fall, the market worth of Bitcoin was also down – which means that BTC can’t be classed as a safe-haven asset.

Bitcoin and Gold Market Risk

Bitcoin and gold have emerged as a leading investment unit to stabilize the economic downfall. In the finance industry, there is no guarantee for returns on investment, so there is always high risk. It’s not true that the value of gold will always rise because, in 2012-2015, it was dropped by $20,000 per ounce. Similarly, BTC value bounces up and down. Gold is not so volatile as Bitcoin currency. Gold is acting as a safe-haven from the last 100 years, and bitcoin is in the market from the last decade.

Can Bitcoin be called a Safe-Haven Asset?

Amid all economic crises, bitcoin price hardly reached $9,011, and that too, with a high risk. So, it can’t be considered as a safe-haven asset due to the following two reasons:

Reason 1

The Bitcoin volume in the market is so small to validate the concept of the safe-haven asset. A safe-haven in the traditional market is the asset whose price rises typically. When there is any risk, the investors simply shift their money from risky assets to a safe one to avoid the loss and to retain their investment value.

In the traditional market, Bitcoin’s share is less than $200 billion US dollar, which is not enough to perform as a safe-haven asset. It lacks federal regulations for transactions, and there is a high risk of scams in the Bitcoin cryptocurrency industry. That’s why the Securities and Exchange Commission also rejected the Bitcoin ETF proposal.

Reason 2

Bitcoin can’t be accessed or used in the environment, having no internet connection. In extreme places, you may be cut-off from the cryptocurrency exchange and Bitcoin traders due to limited internet connectivity. For example, due to any major strikes, most of the time, the government shut down the internet accessibility to slow down the protests and all.

In the meantime, due to no internet connection bitcoin wallet and exchange system get hampered instantly. Therefore, bitcoin can’t be used in the emergency situation, so it can’t be considered as an alternative currency or safe-haven asset.

Conclusion

Gold is a risky asset because of sharp falls, and bitcoin, too, has speculative risk factors. In the case of the safe-haven concept, gold is already declared as a safe-haven asset in the traditional market, while Bitcoin is battling for the title. A wide range of economic forces across the world doesn’t impact its value, as BTC trade executes independently. Despite the global recession and high unemployment, BTC is doing great in the market. But for now, we believe that this is not enough to qualify as a safe-haven asset.

Categories
Crypto Market Analysis

Daily Crypto Review, Sept 22 – Crypto Sector Plummets Alongside Stocks and Gold; Markets Preparing for the US Presidential Election

The cryptocurrency sector has dropped severely as the traditional markets tumbled and caused the crypto market to do the same. Bitcoin is currently trading for $10,458, representing a decrease of 4.38% on the day. Meanwhile, Ethereum lost 7.68% on the day, while XRP lost 5.87%.

 Daily Crypto Sector Heat Map

If we look at the top100 cryptocurrencies, only three have actually increased in value. Orchid gained 25.73% on the day, making it the most prominent daily gainer. Loopring (5.88%) and Hyperion (5.03%) also did great. On the other hand, Celo lost 19.17%, making it the most prominent daily loser. It is followed by Uniswap’s loss of 19.04% and Aave’s loss of 16.93%.

Top 10 24-hour Performers (Click to enlarge)

Bottom 10 24-hour Performers (Click to enlarge)

Bitcoin’s dominance level experienced an increase since our last report (as it always happens when the market drops), with its value currently being at 61.29%. This value represents a 0.67% difference to the upside when compared to when we last reported.

Daily Crypto Market Cap Chart

The crypto sector capitalization has lost value over the course of the past 24 hours. Its current value is $330.84 billion, which represents a decrease of $21.61 billion when compared to our previous report.

_______________________________________________________________________

What happened in the past 24 hours?

_______________________________________________________________________

_______________________________________________________________________

Technical analysis

_______________________________________________________________________

Bitcoin

Bitcoin has spent the day in a bearish pullback, which stopped at the 23.6% Fib retracement. However, its current position is just below that line, which makes it possible that it will continue its drop towards $9,300 to $9,500 levels. This push towards the downside was a bit premature, and most likely caused by the traditional market plummeting. Traditional markets have historically been slightly bearish before the presidential election, while they quickly recovered shortly after.

BTC/USD 4-hour Chart

If we take a look at the 4-hour time frame, the largest cryptocurrency by market cap has bounced off of the pink line after failing to break it, pushing further towards the downside, and ultimately breaking the 23.6% Fib retracement level. Bitcoin’s immediate position will be determined by whether it can break the 23.6% Fib retracement, but its overall short-term position is still bearish.

BTC/USD 4-hour Chart

Bitcoin’s short-term technicals have turned bearish as BTC dropped in price. However, its longer-term technicals are still bullish. With that being said, we can expect Bitcoin to drop a bit further before turning towards the upside.

BTC/USD 4-hour Technicals

Technical factors (4-hour Chart):
  • Price is far below its 50-period EMA and its 21-period EMA
  • Price slightly above its bottom Bollinger band
  • RSI is extremely close to being oversold (34.92)
  • Volume is slowly descending from a massive spike
Key levels to the upside          Key levels to the downside

1: $10,630                                 1: $10,500

2: $10,850                                 2: $10,015

3: $11,000                                  3: $9,880

Ethereum

While fundamental traders are calling for ETH’s price increase, most traders that take technical indicators into account are calling for a pullback towards $300. Etherum has lost over 7% of its value in the past 24 hours, with the move towards the downside ending at $340.

ETH/USD 4-hour Chart

Ethereum’s short-term technicals are still extremely bearish, while its mid-term technicals are tilted towards the bear side just a bit. With that being said, we can expect Ethereum to push towards the $300 level, unless Bitcoin pulls out of its bearish sentiment and pushes the market upwards.

ETH/USD 4-hour Technicals

Technical Factors (4-hour Chart):
  • The price is far below both its 21-period and its 50-period EMA
  • The slightly above its bottom Bollinger band
  • RSI is recovering from being oversold (32.42)
  • Volume is descending from its spike during the downswing
Key levels to the upside          Key levels to the downside

1: $360                                     1: $340

2: $371                                     2: $300

3: $400                                      3: $289

Ripple

XRP has spent the day (as almost every single cryptocurrency) pushing towards the downside. While the overall market move seemed premature and looked like it was pushed by the traditional markets, that may not be the case with XRP. If we take a look at the 4-hour chart, XRP’s 4th leg of the Elliot impulse wave has ended, which prompted the price to go towards the downside. Traders can most likely expect XRP’s price pushing towards $0.21.

XRP/USD 4-hour Chart

Taking a look at the technicals, XRP is showing bearish sentiment with both its short-term and long-term indicators. Its indicators change from just bearish to extremely bearish the longer we go in time, which implies an inherent bearishness when it comes to XRP.

XRP/USD 4-hour Technicals

Technical factors (4-hour Chart):
  • The price is well below both its 21-period EMA and its 50-period EMA
  • Price is slightly above its bottom Bollinger band
  • RSI is oversold but recovering (27.50)
  • Volume is coming back to normal after a huge spike (low)
Key levels to the upside          Key levels to the downside

1: $0.235                                   1: $0.227 

2: $0.2454                                 2: $0.221

3: $0.266                                  3: $0.214


Categories
Crypto Market Analysis

Daily Crypto Review, Sept 21 – Crypto Market is Preparing For a Bearish Move; UNI Token Booming

The cryptocurrency sector has mostly stayed at the same place over the weekend as Bitcoin was trying to break the psychological $11,000 resistance. Bitcoin is currently trading for $10,935, which represents an increase of 0.28% on the day. Meanwhile, Ethereum lost 1.58% on the day, while XRP lost 1.27%.

 Daily Crypto Sector Heat Map

If we look at the top100 cryptocurrencies, Celo gained an astonishing 45.37% on the day, making it the most prominent daily gainer. ZB Token (33.20%) and DigiByte (15.24%) also did great. On the other hand, HedgeTrade lost 13.52%, making it the most prominent daily loser. It is followed by Flexacoin’s loss of 12.67% and yearn.finance’s loss of 9.63%.

Top 10 24-hour Performers (Click to enlarge)

Bottom 10 24-hour Performers (Click to enlarge)

Bitcoin’s dominance level experienced a slight increase since our last report, with its value currently being at 60.62%. This value represents a 0.48% difference to the upside when compared to when we last reported.

Daily Crypto Market Cap Chart

The crypto sector capitalization stayed at virtually the same place over the weekend. Its current value is $351.13 billion, which represents a decrease of $3.37 billion when compared to our previous report.

_______________________________________________________________________

What happened in the past 24 hours?

_______________________________________________________________________

_______________________________________________________________________

Technical analysis

_______________________________________________________________________

Bitcoin

Bitcoin has spent the weekend trying to get past the psychological resistance of $11,000, but failed to do so. The daily chart shows a possible resistance level at the 61.8% Fib retracement from the Head and Shoulders pattern. If that happens, we may expect lows of $9,300 to $9,500.

BTC/USD 4-hour Chart

If we take a look at the 4-hour time frame, Bitcoin fell under the pink ascending line, which is now acting as resistance. However, this resistance is not as strong and may be surpassed with ease. Bitcoin is still struggling and trading within the range bound by $11,000 and $10,850 to the upside and downside, respectively.

BTC/USD 4-hour Chart

Bitcoin’s short-term technicals are showing bullish sentiment, while its mid-term technicals are slightly more bearish. While Bitcoin shows the most bullish sentiment out of the top three cryptocurrencies, we can expect a rebound from the current highs as BTC is unable to gain any meaningful bull push.

BTC/USD 4-hour Technicals

Technical factors (4-hour Chart):
  • Price is above its 50-period EMA and just slightly above its 21-period EMA
  • Price is at its middle Bollinger band
  • RSI is flat but overextended to the upside (53.96)
  • Volume is slowly descending
Key levels to the upside          Key levels to the downside

1: $11,000                                 1: $10,850

2: $11,090                                 2: $10,630

3: $11,460                                  3: $10,500

Ethereum

Ethereum’s price has been squeezed out of its current levels over the weekend, pushing it below the yellow bottom support (now resistance) line. However, the bears didn’t do much either, with ETH’s price descent ending after failing to break $371 to the downside. If this level breaks, we can expect a push towards the $360 support level.

ETH/USD 4-hour Chart

Ethereum’s technicals have turned towards the bear side as the price went down. While the DeFi surge should be taken into account, Ethereum looks like it will push towards the downside in the short-term.

ETH/USD 4-hour Technicals

Technical Factors (4-hour Chart):
  • The price is below both its 21-period and its 50-period EMA
  • The price below its middle Bollinger band
  • RSI neutral and stabilizing (45.44)
  • Volume is average (two-candle spike during the downswing)
Key levels to the upside          Key levels to the downside

1: $400                                     1: $371

2: $415                                     2: $360

3: $445                                      3: $340

Ripple

When taking a look at the 1-day chart, XRP has continued its Elliot Wave impulse pattern, nearly ending the fourth part of the wave. It is expected for XRP to push towards the downside (most likely towards $0.21) as a final leg of the impulse wave.

XRP/USD 1-day Chart

XRP spent its weekend in a slow push towards the upside as a continuation of its 4th leg of the impulse wave. With that being seemingly done, we can expect more bears to enter the market quite soon. This prediction is also confirmed by XRP finding much resistance at its 21-period and 50-period moving averages.

Taking a look at its technicals, XRP is (just as Ethereum) tilted towards the sell-side. Unlike Ethereum, however, XRP is showing even more bearish sentiment on longer time frames.

XRP/USD 4-hour Chart

XRP/USD 4-hour Technicals

Technical factors (4-hour Chart):
  • The price is below both its 21-period EMA and its 50-period EMA
  • Price is slightly below its middle Bollinger band
  • RSI is neutral and stabilizing (43.93)
  • Volume is average (low)
Key levels to the upside          Key levels to the downside

1: $0.266                                   1: $0.2454 

2: $0.285                                   2: $0.235

3: $0.31                                    3: $0.227


Categories
Crypto Videos

Is Bitcoin rising because the US Dollar is falling? #correlated

.

Is Bitcoin rising because the US Dollar is falling?


Thank you for joining this educational video by forex.academy. In this video, we will be looking at the rising bitcoin and the falling US dollar.


Let’s take a look at the US dollar currency index, also known as DXY, on this daily chart where we can see that at the beginning of March, there was a high of 103.00 when measured against other currencies which make up the major pairs, including the Euro, GB Pound, Swiss Franc, Japanese Yen, Australian dollar, and the New Zealand Dollar, and the Canadian Dollar, and where since then the DXY has fallen to its current level of around 93.00. this is entirely due to the American economy suffering at the hands of the covered virus.

And although the recent economic data from the United States, including upbeat retail sales and non-farm productivity for July, were better than expected, and where the initial jobless claims for August was also lower than expected, all depicting a slightly healthier economy then was forecast by market economists, the dollar remains very much on the back foot. This will likely continue until such time as the democrats and republicans agree to a relief stimulus package to aid those unemployed Americans and struggling companies.


Now let’s look at this bitcoin futures chart on the Chicago mercantile exchange, or CME, going back to June of this year and where we can see that prices failed to fall below the key 9,000 to the US Dollar support area and since the latter part of July, prices have increased almost exponentially up to its current level of 11,870.
And so we can clearly see that in this extra time of market turbulence and volatility, the dollar is clearly falling, and bitcoin futures are clearly rising. Historically the markets typically do not use a correlation mechanism – in this case, a negative correlation – in order to trade one against the other. However, is that about to change?

It is a widely held belief that the highest ever spike in bitcoin to around 20,000 was driven by the fear of missing out or the FOMO effect.
However, some institutions and market analysts are fearful that the biggest single currency in the world, the United States dollar, will continue to take a battering, and that holding just one currency at such times of market turbulence and uncertainty may have inflationary pressures within the United States, and therefore there is a trail of thought is that some long-term speculators are moving out of the US dollar, even in these risky times, preferring to diversify into bitcoin, where market upside potential is possible on the basis that bitcoin has seen a previous high of 20,000 and whereby a floor seems to be established of around 9,000. This will give investors some comfort in believing that the coins will not go down to a few dollars, for example, and this will likely fuel the FOMO effect and thus the continued trend for both assets.

Categories
Crypto Market Analysis

Daily Crypto Review, Sept 18 – Uniswap’s UNI Token Surges Over 100% After Launch; Bitcoin Continues Fighting For $11,000

The cryptocurrency sector has mostly stayed at the same place as Bitcoin was fighting for the psychological $11,000 resistance. Bitcoin is currently trading for $10,938, which represents an increase of 0.46% on the day. Meanwhile, Ethereum gained 1.8% on the day, while XRP gained 1.33%.

 Daily Crypto Sector Heat Map

If we look at the top100 cryptocurrencies, |Uniswap gained an astonishing 112.59 % on the day, making it the most prominent daily gainer. ABBC Coin (28.18%) and SushiSwap (21.75%) also did great. On the other hand, Hyperion lost 19.78%, making it the most prominent daily loser. It is followed by Flexacoin’s loss of 12.93% and Celo’s loss of 11.74%.

Top 10 24-hour Performers (Click to enlarge)

Bottom 10 24-hour Performers (Click to enlarge)

Bitcoin’s dominance level experienced a slight decrease since our last report, with its value currently being at 60.14%. This value represents a 0.16% difference to the downside when compared to when we last reported.

Daily Crypto Market Cap Chart

The crypto sector capitalization stayed at the same place in the past 24 hours. Its current value is $354.50 billion, which represents an increase of $0.59 billion when compared to our previous report.

_______________________________________________________________________

What happened in the past 24 hours?

_______________________________________________________________________

_______________________________________________________________________

Technical analysis

_______________________________________________________________________

Bitcoin

Bitcoin has spent the day trying to confirm its position above $11,000 or to push above it yet again after it dropped below the level. The largest cryptocurrency by market capitalization struggled to cross this psychological resistance but confirmed the $10,850 support, which puts it in a narrow range that traders can use to their advantage.

Bitcoin’s short-term indicators are a bit less bullish than a couple of days ago, as Bitcoin did not manage to break the $11,000 mark. However, its long-term technicals are still extremely tilted towards the upside.

BTC/USD 4-hour Chart

Technical factors:
  • Price is above both its 50-period EMA and 21-period EMA
  • Price is right between its middle and top Bollinger band
  • RSI is flat but overextended to the upside (64.35)
  • Volume is slowly descending
Key levels to the upside          Key levels to the downside

1: $11,000                                 1: $10,850

2: $11,090                                 2: $10,630

3: $11,460                                  3: $10,500

Ethereum

Ethereum has followed its tight movement towards the ascending trend line, which took its price a bit higher than yesterday. Technicals, as well as the influx of people using Ethereum due to UNI token launching, bumped its price up to around 2% towards the upside.

With this being said, Ethereum’s technicals have turned extremely bullish as many traders called for the double bottom that formed, propelling ETH’s price up towards $400.

ETH/USD 4-hour Chart

Technical Factors:
  • The price is above both its 21-period and its 50-period EMA
  • The price slightly closer to its top Bollinger band than the middle one
  • RSI slowly descending (60.41)
  • Volume is average
Key levels to the upside          Key levels to the downside

1: $371                                     1: $360

2: $400                                     2: $340

3: $415                                      3: $300

Ripple

XRP has continued its push towards the upside and has continued heading towards the $0.266 resistance level. The steady push has slowed down a bit due to a decrease in volume but has shown no signs of completely stopping. XRP is in quite a good spot now, as many traders are calling for long positions (mostly on the 1-day and 1-week charts).

XRP saw a change of its short-term technicals to extremely bullish, while its mid-term technicals (1-month) are still tilted towards the sell-side. With that being said, more and more traders are slightly less bearish on XRP in the mid-term.

XRP/USD 4-hour Chart

Technical factors:
  • The price is well above its 21-period EMA and its 50-period EMA
  • Price is very close to its top Bollinger band
  • RSI is pushing towards overbought (64.37)
  • Volume is descending
Key levels to the upside          Key levels to the downside

1: $0.266                                   1: $0.2454 

2: $0.285                                   2: $0.235

3: $0.31                                    3: $0.227


Categories
Crypto Market Analysis

Daily Crypto Review, Sept 17 – Bitcoin Above $11,000; XRP Skyrocketing

The cryptocurrency sector has shot up as Bitcoin pushed towards $11,000. Most cryptos ended up in the green, with some even outperforming Bitcoin. Bitcoin is currently trading for $11,019, which represents an increase of 2.72% on the day. Meanwhile, Ethereum gained 5.58% on the day, while XRP gained an astonishing 7.24%.

 Daily Crypto Sector Heat Map

If we look at the top100 cryptocurrencies, DigiByte gained 23.07% on the day, making it the most prominent daily gainer. Hyperion (19.61%) and Kusama (11.85%) also did great. On the other hand, SushiSwap lost 15.68%, making it the most prominent daily loser. It is followed by Flexacoin’s loss of 11.46% and UMA’s loss of 11.43%.

Top 10 24-hour Performers (Click to enlarge)

Bottom 10 24-hour Performers (Click to enlarge)

Bitcoin’s dominance level experienced a slight decrease since our last report, with its value currently being at 60.30%. This value represents a 0.21% difference to the downside when compared to when we last reported.

Daily Crypto Market Cap Chart

The crypto sector capitalization has gone up significantly in the past 24 hours. Its current value is $353.89 billion, which represents an increase of $10.48 billion when compared to our previous report.

_______________________________________________________________________

What happened in the past 24 hours?

_______________________________________________________________________

_______________________________________________________________________

Technical analysis

_______________________________________________________________________

Bitcoin

Bitcoin has, as we said in our previous article, pushed towards the upside, attempting an $11,000 break. While it has broken the $11,000 psychological resistance, it got stopped out at the $11,090 resistance level. Bitcoin will have to make a confirmation move in order to stay above $11,000, which may be hard since it will be in such a tight range ($11,000 to $11,090).

Bitcoin’s short-term indicators are extremely bullish, but its longer-term indicators are also tilted towards the bull side. Traders should look out for how Bitcoin handles the $11,000 level and trade off of it.

BTC/USD 4-hour Chart

Technical factors:
  • Price is above both its 50-period EMA and 21-period EMA
  • Price is near its top Bollinger band
  • RSI is overextended to the upside (71.42)
  • Volume is stable (with a couple of spikes)
Key levels to the upside          Key levels to the downside

1: $11,000                                 1: $10,850

2: $11,090                                 2: $10,630

3: $11,460                                  3: $10,500

Ethereum

As we said in our previous article, it would take a strong push towards the upside to pull Ethereum out of the 35% downside prognosis, which many trades called since the ETH/USD pair created a bear flag. However, Bitcoin’s push towards $11,000 prompted Ethereum to push towards the upside and get back into the range.

With this being said, Ethereum hasn’t confirmed its position above the bear flag lower line, which is because the $371 level it passed will remain in our “key level to the upside” section until ETH confirms otherwise. Still, its short-term indicators have changed to a bit more bullish scenario.

ETH/USD 4-hour Chart

Technical Factors:
  • The price is above both its 21-period and its 50-period EMA
  • The price is right at its top Bollinger band
  • RSI is neutral but pushing towards the upside (59.82)
  • Volume is low and stable
Key levels to the upside          Key levels to the downside

1: $371                                     1: $360

2: $400                                     2: $340

3: $415                                      3: $300

Ripple

XRP had an amazing day, with its price pushing over 7% on the day. The third-largest cryptocurrency by market cap has used this influx of bulls to its fullest, confirming its position above $0.2454 and even pushing towards $0.266.

XRP has joined Ethereum in terms of technicals, with the short-term overview changing to a short-term buy, while its long-term technicals are still showing slight bearishness. Traders can look for a pullback that XRP will inevitably make and trade off of it.

XRP/USD 4-hour Chart

Technical factors:
  • The price is above its 21-period EMA and its 50-period EMA
  • Price is above its top Bollinger band
  • RSI is skyrocketing and pushing towards overbought (67.99)
  • Volume is low (but slowly increasing)
Key levels to the upside          Key levels to the downside

1: $0.266                                   1: $0.2454 

2: $0.285                                   2: $0.235

3: $0.31                                    3: $0.227


Categories
Crypto Market Analysis

Daily Crypto Review, Sept 16 – Ethereum Facing a 35% Drop; Bitcoin Remains Bullish

The cryptocurrency sector has ended up with almost every single cryptocurrency in the top100 in the red. Bitcoin is currently trading for $10,707, which represents a decrease of 0.52% on the day. Meanwhile, Ethereum lost 5.13% on the day, while XRP lost 3.44%.

 Daily Crypto Sector Heat Map

If we look at the top100 cryptocurrencies, ABBC Coin gained 11.74% on the day, making it the most prominent daily gainer. Nervos Network (11.40%) and Hyperion (9.41%) also did great. On the other hand, the SushiSwap lost 34.73%, making it the most prominent daily loser. It is followed by NXM’s loss of 27.55% and Aragon’s loss of 24.48%.

Top 10 24-hour Performers (Click to enlarge)

Bottom 10 24-hour Performers (Click to enlarge)

Bitcoin’s dominance level experienced an increase since our last report, with its value currently being at 60.51%. This value represents a 1.04% difference to the upside when compared to when we last reported.

Daily Crypto Market Cap Chart

The crypto sector capitalization has gone down in the past 24 hours. Its current value is $343.41 billion, which represents a decrease of $6.08 billion when compared to our previous report.

_______________________________________________________________________

What happened in the past 24 hours?

_______________________________________________________________________

_______________________________________________________________________

Technical analysis

_______________________________________________________________________

Bitcoin

After a strong push towards the upside, Bitcoin has tried to consolidate just below the $10,850 mark. The largest cryptocurrency by market cap grazed the RSI overbought territory while failing to push its momentum past the $10,850 level, which held up quite nicely. Bitcoin is now stabilizing around the $10,700 level, where it will try to gather enough bull presence for another push towards $11,000.

Bitcoin’s short-term indicators are showing a bit less bull presence compared to yesterday, while its long-term indicators are still bullish.

BTC/USD 4-hour Chart

Technical factors:
  • Price is above both its 50-period EMA and 21-period EMA
  • Price is between the middle and top Bollinger band
  • RSI is overextended to the upside but descending (63.56)
  • Volume is stable
Key levels to the upside          Key levels to the downside

1: $10,850                                1: $10,630

2: $11,000                                2: $10,500

3: $11,090                                 3: $10,360

Ethereum

Ethereum has experienced quite a massive drop, considering it was not caused by a Bitcoin selloff. The second-largest cryptocurrency by market cap started its price descent and confirmed its bear flag formation. If the bear flag prediction comes true, we may experience a 35% move towards the downside from Ethereum. However, if the $360 level holds and pushes the price back up, the current move towards the downside may be called a fakeout.

With this being said, after the price has left the bear flag and confirmed it, the indicators have turned to “strong sell”. This is certainly a strong bearish indicator (or rather a set of indicators).

ETH/USD 4-hour Chart

Technical Factors:
  • The price is below both its 21-period and its 50-period EMA
  • The price is right below the middle Bollinger band
  • RSI is neutral and descending (41.22)
  • Volume is low and stable
Key levels to the upside          Key levels to the downside

1: $371                                     1: $360

2: $400                                     2: $340

3: $415                                      3: $300

Ripple

XRP had quite a wild day when looking at its price movement. The third-largest cryptocurrency by market cap fell below the $0.2454 level, which triggered a massive selloff that brought its price to the $0.235 level. However, XRP bulls quickly reacted and brought the price back up near the $0.24 level, which is where XRP is at.

XRP has joined Ethereum in terms of technicals, with the short-term overview showing a “strong sell” sign.

XRP/USD 4-hour Chart

Technical factors:
  • The price is below its 21-period EMA and its 50-period EMA
  • Price is below its middle Bollinger band
  • RSI is neutral and descending (40.77)
  • Volume is low (one-candle spike during the selloff)
Key levels to the upside          Key levels to the downside

1: $0.2454                                  1: $0.235 

2: $0.266                                    2: $0.227

3: $0.285                                   3: $0.221


Categories
Crypto Market Analysis

Daily Crypto Review, Sept 15 – BTC Heading Towards $11,000; ETH Facing a 35% Drop?

The cryptocurrency sector has mostly been in the green in the past 24 hours, with Bitcoin leading the way towards the upside. Meanwhile, most of the tokens that ended up in the red on the daily were Ethereum (mostly DeFi) tokens. Bitcoin is currently trading for $10,763, which represents an increase of 4.09% on the day. Meanwhile, Ethereum gained 3.41% on the day, while XRP gained 2.42%.

 Daily Crypto Sector Heat Map

If we take a look at the top100 cryptocurrencies, Hyperion gained 51.28% on the day, making it the most prominent daily gainer. NXM (40.86%) and Bytom (18.97%) also did great. On the other hand, the UNUS SED LEO lost 6.72%, making it the most prominent daily loser. It is followed by Waves’ loss of 6.35% and Band Protocol’s loss of 5.57%.

Top 10 24-hour Performers (Click to enlarge)

Bottom 10 24-hour Performers (Click to enlarge)

Bitcoin’s dominance level experienced a slight increase since our last report, with its value currently being at 59.47%. This value represents a 0.1% difference to the upside when compared to when we last reported.

Daily Crypto Market Cap Chart

The crypto sector capitalization has skyrocketed in the past 24 hours. Its current value is $351.49 billion, which represents an increase of $15.59 billion when compared to our previous report.

_______________________________________________________________________

What happened in the past 24 hours?

_______________________________________________________________________

_______________________________________________________________________

Technical analysis

_______________________________________________________________________

Bitcoin

Bitcoin has made a move towards the upside, passing through its $10,360 and $10,500 levels. As we mentioned in our previous articles, this is a huge bullish sign, and the overall indicators are showing that as well. If the bulls regain momentum, we can expect a push towards $11,000 once the consolidation continues.

With that being said, Bitcoin’s current price movement got stopped at the $10,850 level. While this does mean that Bitcoin bulls have encountered some resistance, it certainly does not mean that the overall trend is over. Bitcoin has shown great resistance at the $10,000 psychological level, which prompted this push towards the upside.

BTC/USD 4-hour Chart

Technical factors:
  • Price is above both its 50-period EMA and 21-period EMA
  • Price is right at the top Bollinger band
  • RSI is overextended to the upside, though with more room to go up (67.45)
  • Volume is stable
Key levels to the upside          Key levels to the downside

1: $10,850                                1: $10,630

2: $11,000                                2: $10,500

3: $11,090                                 3: $10,360

Ethereum

Ethereum was extremely volatile in the past 24 hours. Its price movements were quite hectic, with the price pushing past the $371 level and reaching the $385 mark before coming back down to restest the newly-conquered level, only to go up again and down again. Ethereum is currently supported by both the 50-period and 21-period moving averages, which are right below its price level. On top of that, the $371 level was turned to a support level after a clean confirmation move.

While its technicals show a short-term buy opportunity, the long-term technicals are still tilted towards the sell side. On top of that, Ethereum has created a nice bear flag formation, which (if it turns out to be correct) can prompt a 35% move towards the downside.

ETH/USD 4-hour Chart

Technical Factors:
  • The price is right above both its 21-period and its 50-period EMA
  • The price is right above the middle Bollinger band
  • RSI is neutral (53.36)
  • Volume is low and stable
Key levels to the upside          Key levels to the downside

1: $400                                     1: $371

2: $415                                     2: $360

3: $445                                      3: $340

Ripple

XRP has managed to push itself above the $0.2454 level once again, but still hasn’t confirmed its position above it. A confirmation above this level and a slight push towards the upside will be crucial for the future of XRP, as many traders are calling for bearish scenarios and drawing a bearish flag (though this flag is a lot less picture-perfect as the one on the ETH/USD chart).

XRP is showing signs of slight short-term bullishness, while its longer-term technicals are still pointing towards the downside.

XRP/USD 4-hour Chart

Technical factors:
  • The price is just above its 21-period EMA and its 50-period EMA
  • Price is right above its middle Bollinger band
  • RSI is neutral and pushing towards the upside(54.88)
  • Volume is extremely low, but stable
Key levels to the upside          Key levels to the downside

1: $0.2454                                  1: $0.235 

2: $0.266                                    2: $0.227

3: $0.285                                   3: $0.221


Categories
Crypto Market Analysis

Daily Crypto Review, Sept 14 – The EU Regulating Stablecoins; Crypto Market Preparing For a Move

The cryptocurrency market managed to stay relatively healthy over the weekend as most cryptos tried to consolidate rather than move. Bitcoin is currently trading for $10,343, which represents a decrease of 0.85% on the day. Meanwhile, Ethereum lost 5.22% on the day, while XRP lost 2.06%.

 Daily Crypto Sector Heat Map

If we take a look at the top100 cryptocurrencies, Flexacoin gained 13.18% on the day, making it the most prominent daily gainer. OKB (13.14%) and Waves (12.08%) also did great. On the other hand, the NXM lost 18.45%, making it the most prominent daily loser. It is followed by DFI. Money’s loss of 17.46% and yearn .finance’s loss of 16.42%.

Top 10 24-hour Performers (Click to enlarge)

Bottom 10 24-hour Performers (Click to enlarge)

Bitcoin’s dominance level experienced an increase since our last report, with its value currently being at 59.37%. This value represents a 4.93% difference to the upside when compared to when we last reported.

Daily Crypto Market Cap Chart

The crypto sector capitalization has gone slightly down in the past 24 hours. Its current value is $335.90 billion, which represents a decrease of $2.27 billion when compared to our previous report.

_______________________________________________________________________

What happened in the past 24 hours?

_______________________________________________________________________

_______________________________________________________________________

Technical analysis

_______________________________________________________________________

Bitcoin

Bitcoin has spent the weekend steadily and slowly increasing and trying to reach past $10,500. While it has gotten past the $10,360 level once, it fell under it once the move couldn’t carry enough momentum to pass $10,500 as well. Bitcoin is currently fighting for the $360 level, with its price being right below it.

Our prediction regarding the price movement stays the same as Bitcoin did not move much over the course of the weekend. If Bitcoin doesn’t pass the $10,360 line soon, we should look for support at $9,600, and ultimately at the 200-day SMA ($9,080).

It is also important to note that, as the price movement has been muted for such a long time, it is extremely likely that, once the price moves past $10,360 or below $10,000 (with confidence), we might see a massive surge in volume extending that move. This will be a great opportunity for traders to trade on the way down, as well as the pullbacks.

BTC/USD 4-hour Chart

Technical factors:
  • Price is below the 50-period EMA and right at the 21-period EMA
  • Price is right at middle Bollinger band
  • RSI is neutral (50.27)
  • Volume is stable (slightly below average)
Key levels to the upside          Key levels to the downside

1: $10,360                                1: $10,015

2: $10,500                                2: $9,870

3: $10,630                                 3: $9,600

Ethereum

Ethereum’s price movement in the past couple of days looks exactly like Bitcoins in direction, but with much higher volatility. The second-largest crypto by market cap took the weekend to push towards $400, which ended unsuccessfully. As the move could not carry the momentum forward, bears took over and brought the price to its current position, where it is bound in a narrow range by $360 to the downside and $371 to the upside.

Ethereum’s volatility certainly comes from people investing in DeFi as Ethereum was never as volatile as it is now. However, its moves are still following Bitcoin. This volatility might be a good opportunity for traders to push for some trades.

ETH/USD 4-hour Chart

Technical Factors:
  • The price is right above its 21-period and its 50-period EMA
  • The price is at its middle Bollinger band
  • RSI is neutral (49.14)
  • Volume is low and stable
Key levels to the upside          Key levels to the downside

1: $371                                     1: $360

2: $400                                     2: $340

3: $415                                      3: $300

Ripple

XRP has not been much different from the aforementioned two cryptocurrencies. The third-largest cryptocurrency by market cap is still trading within a range bound by $0.235 to the downside and (more importantly) $0.2454 to the upside. XRP did have one a short period where it spiked above the resistance level, but the price quickly dwindled back down to its original level.

XRP is now fighting for the $0.2454 level, trying to surpass it. However, the extremely low volume shows us that this is will most likely not happen. Traders might have the opportunity to trade the pullback.

XRP/USD 4-hour Chart

Technical factors:
  • The price is just above its 21-period EMA and just below its 50-period EMA
  • Price is right above its middle Bollinger band
  • RSI is neutral (51.35)
  • Volume is extremely low, but stable
Key levels to the upside          Key levels to the downside

1: $0.2454                                  1: $0.235 

2: $0.266                                    2: $0.227

3: $0.285                                   3: $0.221


Categories
Crypto Market Analysis

Daily Crypto Review, Sept 11 – DeFi Sector Experiences Volatility; The Rest Of The Market Stable

The cryptocurrency market has experienced large volatility in the DeFi sector, while the rest of the market was relatively stable. Bitcoin is currently trading for $10,301, which represents a decrease of 0.68% on the day. Meanwhile, Ethereum lost 0.11% on the day, while XRP lost 0.73%.

 Daily Crypto Sector Heat Map

If we take a look at the top100 cryptocurrencies, aelf gained 152.47% on the day, making it the most prominent daily gainer. Flexacoin (45.07%) and Ampleforth (35.77%) also did great. On the other hand, the SushiSwap lost 14.95%, making it the most prominent daily loser. It is followed by Elrond’s loss of 7.82% and Serum’s loss of 6.08%.

Top 10 24-hour Performers (Click to enlarge)

Bottom 10 24-hour Performers (Click to enlarge)

Bitcoin’s dominance level experienced a massive drop since our last report, with its value currently being at 54.44 9.29%. This value represents a 4.85% difference to the downside when compared to when we last reported.

Daily Crypto Market Cap Chart

The crypto sector capitalization has gone up in the past 24 hours. Its current value is $337.66 billion, which represents an increase of $5.84 billion when compared to our previous report.

_______________________________________________________________________

What happened in the past 24 hours?

_______________________________________________________________________

_______________________________________________________________________

Technical analysis

_______________________________________________________________________

Bitcoin

Bitcoin has spent another day trying to push past the $10,360 resistance. However, every attempt in the past few days ended up in BTC passing the level, but then coming back under it due to being unable to confirm its position above. While the resistance level weakens each time Bitcoin attempts to pass it, it brings more bears to the game as most people intuitively trade in the direction opposite to the most recent failed attempt.

If Bitcoin doesn’t pass $10,360 soon, we should look for support at $9,600, and ultimately at the 200-day SMA ($9,080).

BTC/USD 4-hour Chart

Technical factors:
  • Price is below the 50-period EMA and right above the 21-period EMA
  • Price is slightly closer to the middle than the top Bollinger band
  • RSI is neutral (49.57)
  • Volume is stable
Key levels to the upside          Key levels to the downside

1: $10,360                                1: $10,015

2: $10,500                                2: $9,870

3: $10,630                                 3: $9,600

Ethereum

Ethereum has, unlike Bitcoin, managed to gain some value as it reached past its $360 level. However, the move has ended and Ethereum is now stuck in a narrow range between $360 to the downside and $371 to the upside. The second-largest cryptocurrency by market cap has repeatedly tried to get past it, but with no success.

Ethereum’s break above $371 should establish a short-term bullishness, while a break below $360 is not as relevant, and we may look for $340 as the next support.

ETH/USD 4-hour Chart

Technical Factors:
  • The price is above its 21-period while it is currently crossing the 50-period EMA
  • The price is near its top Bollinger band
  • RSI is neutral (52.77)
  • Volume is low and stable
Key levels to the upside          Key levels to the downside

1: $371                                     1: $360

2: $400                                     2: $340

3: $415                                      3: $300

Ripple

XRP failed to break its immediate resistance of $0.2454, which triggered a small pullback. The third-largest cryptocurrency by market cap doesn’t seem like it will be able to break this level any time soon unless it gets a massive influx of bulls. Unlike the aforementioned two cryptocurrencies, XRP is a bit more stable, and failing to push above a resistance level doesn’t necessarily mean that it will attempt a move towards the downside.

XRP/USD 4-hour Chart

Technical factors:
  • The price is just below its 21-period EMA and well below its 50-period EMA
  • Price is sitting at the middle Bollinger band
  • RSI is neutral and descending (47.20)
  • Volume is low and stable
Key levels to the upside          Key levels to the downside

1: $0.2454                                  1: $0.235 

2: $0.266                                    2: $0.227

3: $0.285                                   3: $0.221


Categories
Crypto Market Analysis

Daily Crypto Review, Sept 10 – Ethereum Double-Digit Gains; Crypto – S&P500 Correlation nears All-Time-Highs

The cryptocurrency market recovered today as Bitcoin bulls pushed past $10,360. On top of that, Ethereum skyrocketed, netting double-digit gains on the day. Bitcoin is currently trading for $10,391, which represents an increase of 3.90% on the day. Meanwhile, Ethereum gained 11.36% on the day, while XRP gained 5.48%.

 Daily Crypto Sector Heat Map

If we take a look at the top100 cryptocurrencies, Solana gained 42.61% on the day, making it the most prominent daily gainer. Yearn.finance (24.55%) and Aave (24.03%) also did great. On the other hand, the Hyperion lost 24.27%, making it the most prominent daily loser. It is followed by Blockstack’s loss of 5.21% and Tron’s loss of 2.60%.

Top 10 24-hour Performers (Click to enlarge)

Bottom 10 24-hour Performers (Click to enlarge)

Bitcoin’s dominance level decreased slightly since our last report, with its value currently being at 59.29%. This value represents a 0.60% difference to the downside when compared to when we last reported.

Daily Crypto Market Cap Chart

The crypto sector capitalization has gone up slightly in the past 24 hours. Its current value is $331.80 billion, which represents an increase of $4.90 billion when compared to our previous report.

_______________________________________________________________________

What happened in the past 24 hours?

_______________________________________________________________________

_______________________________________________________________________

Technical analysis

_______________________________________________________________________

Bitcoin

Bitcoin has spent the past 24 hours trying to push past the $10,360 resistance level, which is key if the largest cryptocurrency by market cap wants to continue its bullish presence. Even though the level has fallen, BTC needs to reliably pass it and confirm its position above it in order to encourage more bulls to enter the market. If Bitcoin positions itself above $10,360 well, the influx of bullish pressure will most likely send its price further up towards $10,500 or even $10,630

If, however, Bitcoin manages to fall below $10,000 and confirms its position below it, we can expect to see a bear push towards $9,600 and ultimately to the 200-day SMA ($9,080).

BTC/USD 4-hour Chart

Technical factors:
  • Price is below 50-period EMA while being above its 21-period EMA
  • Price is hitting the top Bollinger band
  • RSI is neutral and pushing towards the upside (54.00)
  • Volume is stable
Key levels to the upside          Key levels to the downside

1: $10,360                                1: $10,015

2: $10,500                                2: $9,870

3: $10,630                                 3: $9,600

Ethereum

Ethereum skyrocketed in the past 24 hours, with its price reaching double-digit gains. The second-largest cryptocurrency by market cap overcame the initial rejection of the $360 level and ultimately pushed past it, reaching the $371 level and getting stopped out there. The next move Ethereum makes will be crucial and will determine its short-term future.

If Ethereum manages to pull off a confirmation move above $360, we can expect a push towards $371. However, if that does not happen, we can expect ETH to return to its previous levels.

ETH/USD 4-hour Chart

Technical Factors:
  • The price is well above its 21-period while being slightly above its 50-period EMA
  • The price is above its top Bollinger band
  • RSI is neutral and pushing towards the upside (57.49)
  • Volume is low and stable
Key levels to the upside          Key levels to the downside

1: $360                                     1: $340

2: $371                                     2: $300

3: $400                                      3: $289

Ripple

XRP made a move towards the upside like Ethereum and Bitcoin, but its move was more alike to Bitcoin’s than Ethereum’s. The third-largest cryptocurrency by market cap managed to gather some bullish pressure and push towards the $0.2454, which barely touched at the time of writing). However, just like with Bitcoin, XRP did not conquer this resistance level yet, and it will have to confirm its position above it in order to bring the attention of more bulls.

XRP might face another resistance level in the form of its 50-period moving average, which sits very close to its current price.

XRP/USD 4-hour Chart

Technical factors:
  • The price is just above its 21-period EMA and right above its 50-period EMA
  • Price is above its top Bollinger band
  • RSI is neutral and moving towards the upside (54.76)
  • Volume is low and stable
Key levels to the upside          Key levels to the downside

1: $0.2454                                  1: $0.235 

2: $0.266                                    2: $0.227

3: $0.285                                   3: $0.221


Categories
Crypto Market Analysis

Daily Crypto Review, Sept 9 – Will DeFi Bubble Burst, Send Ethereum to Freefall?

The cryptocurrency market had another pullback today, with Bitcoin coming dangerously close to $10,000. Bitcoin is currently trading for $10,087, which represents a decrease of 2.29% on the day. Meanwhile, Ethereum lost 3.26% on the day, while XRP lost 2.52%.

 Daily Crypto Sector Heat Map

If we take a look at the top100 cryptocurrencies, IOST gained 11.86% on the day, making it the most prominent daily gainer. TRON (11.78%) and Ontology (7.92%) also did great. On the other hand, the SushiSwap lost 15.01%, making it the most prominent daily loser. It is followed by Hyperion’s loss of 14.32% and Ocean Protocol’s loss of 11.46%.

Top 10 24-hour Performers (Click to enlarge)

Bottom 10 24-hour Performers (Click to enlarge)

Bitcoin’s dominance level stayed at the same spot since our last report, with its value is currently at 59.89%. This value represents a 0.05% difference to the upside when compared to when we last reported.

Daily Crypto Market Cap Chart

The crypto sector capitalization has gone down slightly in the past 24 hours. Its current value is $326.90 billion, which represents a decrease of $6.34 billion when compared to our previous report.

_______________________________________________________________________

What happened in the past 24 hours?

_______________________________________________________________________

_______________________________________________________________________

Technical analysis

_______________________________________________________________________

Bitcoin

Bitcoin has been clinging to the $10,000 psychological resistance for the past 24 hours as bears took over the market yet again. The largest cryptocurrency by market cap fell well below $10,000, but quickly recovered and stayed just a bit up for the duration of the day. The reason for the sudden drop is most likely the inability to break the $10,360 resistance level. Lower time-frames show that Bitcoin might have formed a triple bottom formation, which would indicate some form of bullishness.

When it comes to predictions, we are one step closer to the bearish scenario than yesterday. A drop sustained drop below $10,000 could lead us to $9,600 and ultimately to the 200-day SMA ($9,080). On the other hand, if BTC manages to bounce off the current levels and surpass $10,500, a move to $11,000 is likely.


BTC/USD 4-hour Chart

Technical factors:
  • Price is well below its 50-period, while it’s slightly below its 21-period EMA
  • Price is slightly below middle Bollinger band
  • RSI is neutral (43.31)
  • Volume is stable
Key levels to the upside          Key levels to the downside

1: $10,360                                1: $10,015

2: $10,500                                2: $9,870

3: $10,850                                 3: $9,600

Ethereum

Ethereum had quite a bad day, with its price falling below the $340 mark. The second-largest cryptocurrency by market cap is already down over 30% from the $490 peak, with many indicators showing bearish scenarios. If the DeFi bubble pops, we can see Ethereum in freefall, though that is unlikely simply due to high yields current investors are collecting from staking.

On the other hand, while some DeFi enthusiasts cashed out and left the market due to the volatility, Ethereum’s gas prices have normalized from its Sept 2nd highs, which may be just enough to push the price slightly up or at least keep it stable.

Traders should pay attention to how Ether handles the $340 level.


ETH/USD 4-hour Chart

Technical Factors:
  • The price is slightly below its 21-period and well below its 50-period EMA
  • The price is right below its middle Bollinger band
  • RSI is neutral (41.08)
  • Volume is descending (low)
Key levels to the upside          Key levels to the downside

1: $340                                     1: $300

2: $360                                     2: $289

3: $371                                     

Ripple

XRP has lost a couple of percent of its value, though nothing to be scared of. The third-largest cryptocurrency by market cap tested its support level of $0.235 for a couple of times in the past 24 hours, and all attempts towards the downside failed. Many analysts are calling for XRP’s future rise, but we need to see a drastic change in volume for that to happen.

XRP traders should watch out for volume spikes, as even sideways trading is hard now due to the extremely low volume.

XRP/USD 4-hour Chart

Technical factors:
  • The price is just under its 21-period, while it is well below its 50-period EMA
  • Price is at its middle Bollinger band
  • RSI is neutral (45.18)
  • Volume is low
Key levels to the upside          Key levels to the downside

1: $0.2454                                  1: $0.235 

2: $0.266                                    2: $0.227

3: $0.285                                   3: $0.221


Categories
Crypto Videos

China Dropping USD for Bitcoin!


China Dropping USD for Bitcoin – Iron Importers Favoring Crypto Over the US Dollar

The Chinese iron ore sector seems to be completely shifting towards blockchain-powered cross-border platforms when it comes to conducting trade deals in the national currency Yuan (RMB for short), rather than using the more usual USD transactions.
According to China Economic Net, many of the world’s biggest iron miners are on board for the adoption of blockchain platforms rather than using USD as they did before. The report suggests that importers also want to adopt the up-and-coming digital yuan as soon as it launches officially, all in order to make transactions less dependent on USD.

Powered by blockchain

Ansteel Group International Economic and Trade Co., Ltd., as well as Rio Tinto Group, completed a $14.44 million cross-border settlement transaction recently. This transaction was, unlike the previous ones, powered by blockchain.
During an interview with the International Finance News, a Rio Tinto Group representative commented on the transaction settled on the blockchain:

“As early as 2014, we started conducting RMB transactions with Baosteel. In 2019, we established a port business. Now, Chinese customers have the opportunity to buy our products in small quantities from Chinese ports and pay for them in RMB. As the main supplier of individual Chinese customers, we believe that these port sales can help us better serve our existing customer base.”
Xinhua News Agency reported that in the first half of the year, RMB cross-border transactions amounted to RMB 12.7 trillion (which equates to $1.83 billion), a year-on-year increase of 36.7%.
This proves a point of China trying to move away from the US dollar and into other alternatives, with the main one being blockchain.

Categories
Crypto Videos

Grayscale Extremely Bullish on Bitcoin! The Next Bull Run Is Now!

Grayscale Extremely Bullish on Bitcoin: Bitcoin Market ‘Looks Like 2016, Before Historic Bull Run’

A new report coming from crypto fund manager Grayscale Investments proposes an argument that Bitcoin’s market structure currently “parallels that of early 2016, right before Bitcoin began its historic bull run.”
Grayscale predicts that the demand for Bitcoin will grow significantly as inflation accelerates, therefore highlighting the need for a scarce monetary commodity.
The report identifies many on-chain indicators that show growing interest in cryptocurrencies, noting an increase in long-term holding rather than short-term speculation. Grayscale also notes that the number of daily active addresses is at the highest level since 2017’s all-time highs.


Grayscale notes that the increasing dependence of the US economy on quantitative easing to simply stay afloat and that history shows that this is a difficult addiction to quit.
Despite the US dollar remaining “structurally quite strong relative to other currencies,” the report also shows that investors are constantly searching for ways to protect against the, now than ever, ever-expanding money supply. Grayscale also notes that the investors found Bitcoin to be a good a store of value and a great protection against inflation, simply due to its deflationary nature.

Grayscale cites the scoring system that is used by hedge fund manager Paul Tudor Jones and which assesses Bitcoin’s attributes against other financial assets, such as cash, gold, and others.
Quoting Jones, the report noted:
“What was surprising to me was that Bitcoin scored as high as it did. BTC had an overall score of almost 60% of that of financial with a market cap that is 1/1200th of that. Bitcoin scored 66% of gold as a store of value with a market cap just 1/60th of gold’s total value.”
Paul Tudor Jones then added that “Something appears wrong here and my guess is it is the price of Bitcoin.”

Categories
Crypto Market Analysis

Daily Crypto Review, Sept 8 – Peter Schiff Buying More Bitcoin; Investors Keep Buying BTC Despite Downside Potential

The cryptocurrency market was quite slow today, with most cryptocurrencies establishing their positions rather than pushing towards upside or downside. Bitcoin is currently trading for $10,329, which represents an increase of 0.64% on the day. Meanwhile, Ethereum lost 2.23% on the day, while XRP lost 0.36%.

 Daily Crypto Sector Heat Map

If we take a look at the top100 cryptocurrencies, BitShares gained 9.64% on the day, making it the most prominent daily gainer. Dash (8.35%) and Zcash (5.51%) also did great. On the other hand, the Reserve Rights lost 12.27%, making it the most prominent daily loser. It is followed by Kusama’s loss of 9.38% and Arweave’s loss of 9.26%.

Top 10 24-hour Performers (Click to enlarge)

Bottom 10 24-hour Performers (Click to enlarge)

Bitcoin’s dominance level has gone up slightly, with its value is currently at 59.84%, which represents a 0.23% difference to the upside when compared to when we last reported.

Daily Crypto Market Cap Chart

The crypto sector capitalization has gone up slightly in the past 24 hours. Its current value is $333.24 billion, which represents an increase of $1.71 billion when compared to our previous report.

_______________________________________________________________________

What happened in the past 24 hours?

_______________________________________________________________________

_______________________________________________________________________

Technical analysis

_______________________________________________________________________

Bitcoin

Bitcoin’s price has been holding to the psychological $10,000 support all weekend, trying to stay above it. While the largest cryptocurrency by market cap managed to stay above it, this has been the second day that it couldn’t pass the $10,360 resistance. On top of that, the past 24 hours showed us a much greater spike in volume during a support retest than a resistance test. Lower time frames show that Bitcoin has possibly made a double bottom, which calls for a slightly more bullish scenario.

When it comes to predictions, nothing has changed from yesterday. If the bulls fail to break the $10,360 level soon (and sustain it), the bears will most likely make another attempt to bring the price down. A drop to the 200-day SMA ($9,080) is highly likely. On the other hand, if BTC manages to bounce off the current level and surpass the next one ($10,500), a move to $11,000 is likely. While traders should wait for a bigger move to happen before trading, small profits can be made on sideways-movement trades.

BTC/USD 4-hour Chart

Technical factors:
  • Price is well below its 50-period, while it is at its 21-period EMA
  • Price is slightly above middle Bollinger band
  • RSI has recovered and is neutral (46.38)
  • Volume is stable
Key levels to the upside          Key levels to the downside

1: $10,360                                1: $10,015

2: $10,500                                2: $9,870

3: $10,850                                 3: $9,600

Ethereum

Ethereum has broken free from its descending trend as well, with its price consolidating between the $340 and $360 levels. Ethereum tested the $340 level with a strong push towards the downside, but the level held up quite nicely. This may give Ethereum the opportunity to gather its strength and push past the $360 level.

Ethereum’s gas prices have dropped slightly from the highs it reached on Sept 2nd, which may be just enough to push the price slightly up.

Traders should pay attention to how Ether handles the $360 level.


ETH/USD 4-hour Chart

Technical Factors:
  • The price is slightly below its 21-period and well below its 50-period EMA
  • The price is right at its middle Bollinger band
  • RSI is neutral (42.37)
  • Volume is descending (low)
Key levels to the upside          Key levels to the downside

1: $360                                     1: $340

2: $371                                     2: $300

3: $400                                      3: $289

Ripple

XRP has also taken the day to consolidate and establish its presence at the levels it reached after its price plummeted. The third-largest cryptocurrency by market cap is currently trading within the range bound by the $0.235 and $0.2454. The most recent retest of the support level showed that $0.235 will be hard to get through for bears, while the $0.2454, as well as the 21-period moving average, will require a lot more bullish presence to get conquered as well.

XRP traders should either trade within the range or wait for a breakout.

XRP/USD 4-hour Chart

Technical factors:
  • The price is just under its 21-period, while it’s well below its 50-period EMA
  • Price is slightly above its middle Bollinger band
  • RSI is neutral (44.06)
  • Volume is average
Key levels to the upside          Key levels to the downside

1: $0.2454                                  1: $0.235 

2: $0.266                                    2: $0.227

3: $0.285                                   3: $0.221


Categories
Crypto Market Analysis

Daily Crypto Review, Sept 7 – Peter Schiff: “I Was Wrong About Bitcoin”; Bitcoin Facing $9,000 or Recovering?

The cryptocurrency market has been trying to establish its position after the pullback that happened on Wednesday and Thursday. Bitcoin is currently trading for $10,260, which represents a decrease of 1.34% on the day. Meanwhile, Ethereum recovered from its big drop and gained 7.3% on the day, while XRP gained 2.67%.

 Daily Crypto Sector Heat Map

When taking a look at the top100 cryptocurrencies, SushiSwap gained 79.68% on the day, making it the most prominent daily gainer. UMA (31.22%) and Flexacoin (26.59%) also did great. On the other hand, the HedgeTrade lost 20.50%, making it the most prominent daily loser. It is followed by Hyperion’s loss of 15.70%. The rest of the market was either in the green or lost sub-1% of its value.

Top 10 24-hour Performers (Click to enlarge)

Bottom 10 24-hour Performers (Click to enlarge)

Bitcoin’s dominance level has gone up slightly, with its value is currently at 59.61%, which represents a 0.32% difference to the upside when compared to when we last reported.

Daily Crypto Market Cap Chart

The crypto sector capitalization has gone down slightly in the past 24 hours. Its current value is $331.58 billion, which represents a decrease of $3.07 billion when compared to our previous report.

_______________________________________________________________________

What happened in the past 24 hours?

_______________________________________________________________________

_______________________________________________________________________

Technical analysis

_______________________________________________________________________

Bitcoin

After failing to break the $12,000 mark, BTC bears have taken over the market, causing the price to plummet, reaching as low as $10,000. The largest cryptocurrency by market cap took the weekend to consolidate and establish its presence above $10,000. However, the $10,360 resistance level proves its strength once again, making Bitcoin’s rebound towards the upside that much harder.

If the bulls fail to break the $10,360 level and sustain it, the bears will most likely make one more attempt to bring the price down. In this case, a drop to the 200-day SMA ($9,080) is likely. However, if BTC manages to bounce off the current level and rise above $10,500, a move to $11,000 is likely.

Traders should pay close attention to Bitcoin’s price movement around the $10,360 level, as the next move will determine its short-term future.

BTC/USD 4-hour Chart

Technical factors:
  • Price is well below its 50-period and 21-period EMA
  • Price is at its middle Bollinger band
  • RSI is recovering from being in the oversold territory (38.77)
  • Volume is descending (from extremely high)
Key levels to the upside          Key levels to the downside

1: $10,360                                1: $10,015

2: $10,500                                2: $9,870

3: $10,850                                 3: $9,600

Ethereum

Ethereum had a similar weekend as Bitcoin, as its price consolidated and tried to establish itself above the most recent low of $310. While its price did get stuck at the $360 resistance level, it increased in value much more than Bitcoin, most likely due to the growing popularity of DeFi.

With all being said, Ethereum’s short-term future will be decided by the popularity of DeFi and the problems it will encounter with extremely high Gas fees.

Traders should pay attention to how ETH handles the $360 level.


ETH/USD 4-hour Chart

Technical Factors:
  • The price is well below its 21-period and 50-period EMA
  • The price is near its middle Bollinger band
  • RSI is neutral and recovering from being oversold (40.82)
  • Volume is descending (from high)
Key levels to the upside          Key levels to the downside

1: $371                                     1: $360

2: $400                                     2: $340

3: $415                                      3: $300

Ripple

While XRP suffered the same fate as Bitcoin and Ethereum in terms of price movement, the third-largest cryptocurrency by market cap did have slight differences in the move towards the downside. XRP had several bull comebacks that tried to push the price back up, but failed due to the overall bearishness of the market.

XRP is now consolidating between the $0.235 and $0.2454, with low volume and no signs of future movement (unless the technicals change drastically).

XRP traders should watch out for any form of break of the immediate support/resistance levels.

XRP/USD 4-hour Chart

Technical factors:
  • The price is well below its 21-period and 50-period EMA
  • Price is near its middle Bollinger band
  • RSI is recovering from being oversold (40.84)
  • Volume is low (back from elevated)
Key levels to the upside          Key levels to the downside

1: $0.2454                                  1: $0.235 

2: $0.266                                    2: $0.227

3: $0.285                                   3: $0.221


Categories
Crypto Market Analysis

Daily Crypto Review, Sept 4 – Bitcoin at $10,000: What Happened? Detailed Price Level Analysis

The cryptocurrency market has been decimated after Bitcoin plummeted below $11,000. Bitcoin is currently trading for $10,260, which represents a decrease of 10.02% on the day. Meanwhile, Ethereum lost 12.07% on the day, while XRP lost 9.21%.

 Daily Crypto Sector Heat Map

When taking a look at the top100 cryptocurrencies, TRON gained 15.35% on the day, making it the most prominent daily gainer. Celo (13.98%) and ZB Token (8.75%) also did great. On the other hand, the Ampleforth lost 33.29%, making it the most prominent daily loser. It is followed by Sushi Swap’s loss of 32.41% and DFI. Money’s drop of 32.28%.

Top 10 24-hour Performers (Click to enlarge)

Bottom 10 24-hour Performers (Click to enlarge)

Bitcoin’s dominance level has gone up slightly, with its value is currently at 59.29%, represents a 0.67% difference to the upside when compared to when we last reported.

Daily Crypto Market Cap Chart

The crypto sector capitalization has plummeted in the past 24 hours. Its current value is $334.65 billion, which represents a decrease of $39.74 billion when compared to our previous report.

_______________________________________________________________________

What happened in the past 24 hours?

_______________________________________________________________________

_______________________________________________________________________

Technical analysis

_______________________________________________________________________

Bitcoin

After failing to break the $12,000 mark, Bitcoin bears have taken over the market and the price plummeted, reaching as low as $10,000. While it was true that many people were bullish and called for a bull market, Bitcoin’s continuous failed attempts to break $12,000 took its toll and started a short-term bear trend that could reach $9,600 at some point.

There are many reasons that caused Bitcoin (and the rest of the crypto market) to plummet, mainly the US traditional market, DeFi, miners as well as traders.

  1. The US S&P 500 index pulled back on Thursday after reaching record highs just earlier this week. This happened because of a US report showing jobless claims of over 881,000 in August. While this number was, in fact, better than expected, it is still much larger than the one that the US saw during the 2009 recession high-point (665,000). Bitcoin is not completely uncorrelated from the traditional markets and has most likely reacted slightly to this news.
  2. While the DeFi craze is continuing, many believe that the fact that people are locking billions of dollars worth of Bitcoin may cause any form of market manipulation or influx of buyers/sellers much more significant due to reduced supply in circulation. It is also not implausible that DeFi is in a bubble (even some DeFi project leaders/creators such as Yearn Finance’s Andre Cronje say it), and that this is a form of a bubble “pop”.
  3. Miners and traders gathered up to sell Bitcoin at the $12,000 mark, which triggered this crash. Miners tried to secure their profits and play it safe, and traders most likely did the same, as they saw strong resistance sitting at the $12,000 level. All of the big mining pools saw large BTC outflows from the wallets, incidacting a market play with the intention to take profits and secure gains.

Traders should pay attention to Bitcoin’s price movement around $10,090 and $10,400.

BTC/USD 4-hour Chart

Technical factors:
  • Price is well below its 50-period and 21-period EMA
  • Price is just above its lower band
  • RSI is deep in the oversold territory (21.56)
  • Volume is elevated
Key levels to the upside          Key levels to the downside

1: $10,360                                1: $10,015

2: $10,500                                2: $9,870

3: $10,850                                 3: $9,600

Ethereum

Ethereum had a similar day to Bitcoin, with its price plummeting and reaching as low as $371. The second-largest cryptocurrency by market cap tried to break the downward pressure after dropping below $445. It quickly bounced off of $415 and pushed towards the upside. However, the $445 level was now resistance, and after a failed attempt to break it, ETH moved further down.

Ethereum is now in its consolidation/recovery stage near $380.

Traders should pay attention to any influx in volume as well as how ETH handles $415.


ETH/USD 4-hour Chart

Technical Factors:
  • The price is well below its 21-period and 50-period EMA
  • The price is just above the lower band
  • RSI is in the oversold territory (28.35)
  • Volume is descending (from extremely high)
Key levels to the upside          Key levels to the downside

1: $400                                     1: $371

2: $415                                     2: $360

3: $445                                                 

Ripple

XRP was no exception when it comes to today’s price movement. The third-largest cryptocurrency by market cap plummeted and reached as low as $0.238 before starting to recover. The price is now recovering at the $0.2454 support level, which is (at the moment) contested. It is still unsure of whether XRP will end up above or below it, so traders should watch out to a breakout to any side.

XRP/USD 4-hour Chart

Technical factors:
  • The price is far below its 21-period and 50-period EMA
  • Price is at its lower band
  • RSI is in the oversold area (29.09)
  • Volume is above average
Key levels to the upside          Key levels to the downside

1: $0.266                                   1: $0.2454 

2: $0.285                                   2: $0.235

3: $0.31                                    3: $0.227


Categories
Crypto Market Analysis

Daily Crypto Review, Sept 3 – DeFi Flippening: Unifi’s Volume Topples Coinbase

The crypto sector had quite a bad day as almost every single cryptocurrency ended up in the red. Bitcoin is currently trading for $11,376, which represents a decrease of 4.26% on the day. Meanwhile, Ethereum lost 6.82% on the day, while XRP lost 9.33%.

 Daily Crypto Sector Heat Map

When taking a look at the top100 cryptocurrencies, Kusama gained 24.25% on the day, making it the most prominent daily gainer. UMA (13.51%) and JUST (9.08%) also did great. On the other hand, the Ampleforth lost 26.14%, making it the most prominent daily loser. It is followed by OMG Network’s loss of 15.44% and Aragon’s drop of 15.44%.

Top 10 24-hour Performers (Click to enlarge)

Bottom 10 24-hour Performers (Click to enlarge)

Bitcoin’s dominance level has gone up slightly, with its value is currently at 58.62%, represents a 0.48% difference to the upside when compared to when we last reported.

Daily Crypto Market Cap Chart

The crypto sector capitalization has decreased significantly over the course of the day. Its current value is $375.41 billion, which represents a decrease of $15.64 billion when compared to our previous report.

_______________________________________________________________________

What happened in the past 24 hours?

_______________________________________________________________________

_______________________________________________________________________

Technical analysis

_______________________________________________________________________

Bitcoin

Bitcoin’s push towards the upside yesterday culminated by the cryptocurrency price reaching the $12,000 mark before triggering a bear push. The largest crypto by market cap couldn’t keep its price above the level, which triggered massive bearish volume that brought the price down as low as $11,150. Bitcoin is currently consolidating right below $11,460, which it is testing and trying to get past. However, this level has proven to be a strong resistance point at the moment.

Traders should pay attention to Bitcoin’s price movement around $11,460.

BTC/USD 4-hour Chart

Technical factors:
  • Price is below its 50-period and 21-period EMA
  • Price is just above its lower band
  • RSI is stable (38.13)
  • Volume is coming back to normal after a massive spike
Key levels to the upside          Key levels to the downside

1: $11,630                                1: $11,460

2: $12,015                                2: $11,090

3: $12,330                                 3: $10,855

Ethereum

Ethereum had a similar day to Bitcoin, with its price plummeting and reaching as low as $418 after failing to break $496 to the upside. The second-largest crypto by market cap is currently near the $445 level, which is resisting any current pushes towards the upside that Ethereum makes at the moment.

With all this being said, Ethereum is still looking extremely bullish as DeFi’s volume and the number of users is reaching its all-time highs. Traders should look for a break from the $445 level.

ETH/USD 4-hour Chart

Technical Factors:
  • The price is at its 21-period and below 50-period EMA
  • The price is just below the middle band
  • RSI is neutral (52.47)
  • Volume is descending (from extremely high)
Key levels to the upside          Key levels to the downside

1: $445                                     1: $415

2: $496                                     2: $400

                                                  3: $360

Ripple

XRP was no exception when it comes to today’s price movement. The third-largest crypto by market cap crashed, at one point reaching sub-$0.266 levels. However, the price recovered, and XRP is currently consolidating at the $0.272 level. However, unlike Bitcoin and Ethereum, which seem ready to test its resistance levels, XRP’s low volume as well as price position signal that there is almost no chance it will move towards the upside on its own.

Traders should look at XRP’s next move, which will be triggered by a volume spike.

XRP/USD 4-hour Chart

Technical factors:
  • The price is below its 21-period and 50-period EMA
  • Price is just above its lower band
  • RSI is stable and leaning towards the oversold area (39.55)
  • Volume is slightly below average
Key levels to the upside          Key levels to the downside

1: $0.285                                   1: $0.266 

2: $0.31                                     2: $0.2454

3: $0.32


Categories
Cryptocurrencies

Six Cryptocurrency Myths All Traders Should Know About

Cryptocurrency has been rising in popularity lately, but it remains largely misunderstood by many traders to this day. You might have heard some rumors or others may have told you that investing in cryptocurrency isn’t a good idea. Or perhaps you’ve heard the opposite, that investing in cryptocurrency is guaranteed to make you a millionaire. Regardless of whether you’re pro-cryptocurrency or against it, we’re here to debunk 6 of the most common cryptocurrency myths. 

Myth #1: Cryptocurrency doesn’t have any real monetary value.

This is one of the most popular myths about cryptocurrency. People think that because it is virtual or invisible, it has no value in the real world. Donald Trump once said that it “based on thin air”. This isn’t true. If you check out the current cryptocurrency rates, you’ll see that the value of cryptocurrency continues to rise. Scarcity, supply & demand, and utility add to the value of cryptocurrency coins as well. Bitcoin, Litecoin, and other cryptocurrencies are even accepted by many brokerages and other institutions as a valid funding method. Even though we can’t physically see cryptocurrency, this doesn’t mean that the coins don’t hold value. Otherwise, they would never be recognized and accepted for payments. Keep in mind that all other exchangeable currencies were once based on nothing as well. 

Myth #2: Cryptocurrency isn’t safe.

Many investors worry that cryptocurrency is a big target for hackers and that it isn’t a safe place to store one’s money. With some cryptocurrencies, this may be true – there are scammers out there, but it is important to remember that each provider is different. Providers that use blockchain technology offer a much higher level of security. If one block is changed, it affects the surrounding blocks, which makes it much easier for the network to pick up fraudulent activity. Remember, even regular banks attract scammers. Cryptocurrency may even offer better security than a central bank, as fewer hackers understand how it works and that information isn’t used as often as one’s bank account number, for example. 

Myth #3: Investing in cryptocurrency is a guaranteed moneymaker.

Cryptocurrency is a volatile instrument. This can be good for traders because it offers more chances to enter and exit the market. However, the sharp rises and dips in price make investing riskier. Even if someone you know personally has made a large profit from investing in Bitcoin or another cryptocurrency, this doesn’t mean that you will have the same luck. Of course, this is true for any trading instrument, it’s just that cryptocurrency is more volatile than currency pairs. 

Myth #4: Transactions are anonymous.

Many traders believe that transactions made with cryptocurrency are anonymous, but this isn’t the case. Those transactions are kept on a public ledger and some government organizations have relationships with owners to keep track of it all. For example, it was recently discovered that several people using Bitcoin were using the currency to make illegal purchases. Your sending address can be tracked, although some providers are more laid back while others monitor this more carefully. 

Myth #5: Only tech-savvy people can use cryptocurrency.

Learning to use cryptocurrency may seem intimidating to those that are used to traditional banking methods. This doesn’t mean that you shouldn’t invest the time to learn how it works, however, and you’ll likely find that it isn’t as complicated as it seems on the surface. There’s a ton of online information that can help traders learn to use cryptocurrency and how to invest successfully. 

Myth #6: Blockchain will change the payment system forever.

Many people believe that the blockchain will replace traditional payment methods in the future. This is only half-true. The blockchain does offer security and it is efficient, so it is likely that it will become a more recognized and accepted payment method as time goes on. However, people will continue to use debit and credit cards alongside it. Bitcoin will not wipe out all of our current payment methods, it will only join them. 

Conclusion

Hopefully, we’ve helped our readers to understand cryptocurrency a little more. It is important to understand that myths and rumors can come from misunderstanding, as many traders haven’t put a lot of effort into learning about these futuristic payment methods. If you hear something about investing in or using cryptocurrency, always do your own research to find out if it is fact or fiction.

Categories
Crypto Market Analysis

Daily Crypto Review, Sept 2 – Ethereum Pushing Towards $500; Decentralized Exchanges Volume Surges

While the top cryptocurrencies had quite a slow day, the DeFi market kept going up. Bitcoin is currently trading for $11,890, which represents an increase of 2.37% on the day. Meanwhile, Ethereum gained 7.57% on the day, while XRP gained 6.91%.

 Daily Crypto Sector Heat Map

When taking a look at top100 cryptocurrencies, DFI.Money gained 111.02% on the day, making it the most prominent daily gainer. SushiSwap (35.54%) and Flexacoin (23.70%) also did great. On the other hand, the bZx Protocol lost 16.28%, making it the most prominent daily loser. It is followed by Aragon’s loss of 10.47% and Kusama’s drop of 9.44%.

Top 10 24-hour Performers (Click to enlarge)

Bottom 10 24-hour Performers (Click to enlarge)

Bitcoin’s dominance level has gone down slightly, with its value is currently at 58.14%, represents a 0.26% difference to the downside when compared to when we last reported.

Daily Crypto Market Cap Chart

The crypto sector capitalization has increased significantly over the course of the day. Its current value is $391.05 billion, which represents an increase of $14.67 billion when compared to our previous report.

_______________________________________________________________________

What happened in the past 24 hours?

_______________________________________________________________________

_______________________________________________________________________

Technical analysis

_______________________________________________________________________

Bitcoin

After managing to fend off the bears and establish its presence above $11,630 yesterday, Bitcoin started moving towards the upside. The largest cryptocurrency by market cap pushed towards the upside and quickly reached the $12,000 mark. However, the cryptocurrency did not stay above it for long and fell under it yet again. Bitcoin is now on a path towards the downside.

Traders should pay attention to how Bitcoin’s price reacts to its moving averages, as well as to $11,630.

BTC/USD 4-hour Chart

Technical factors:
  • Price is above its 50-period and 21-period EMA
  • Price is at its middle band
  • RSI is neutral (52.80)
  • Volume is slightly increased
Key levels to the upside          Key levels to the downside

1: $11,630                                1: $11,460

2: $12,015                                2: $11,090

3: $12,330                                 3: $10,855

Ethereum

Ethereum had another extremely bullish day, where its parabolic rise continued. The second-largest cryptocurrency by market cap surged towards the upside and passed $445 with ease, only to be stopped a little under $490. Ethereum is now consolidating slightly below this level.

Ethereum’s parabolic price rise is attributed to a surge of interest in DeFi projects, and all they have to offer.

Ethereum traders should pay attention to DeFi announcements, as well as to how ETH will consolidate.

ETH/USD 4-hour Chart

Technical Factors:
  • The price is above its 21-period and 50-period EMA
  • The price is just below the upper band
  • RSI is in the overbought territory (73.71)
  • Volume is descending (from extremely high)
Key levels to the upside          Key levels to the downside

1: $445                                     1: $415

2: $496                                     2: $400

                                                  3: $360

Ripple

XRP, boosted by the other cryptos increasing in price, pushed towards the upside itself. The third-largest cryptocurrency by market cap managed to get past the $0.285 resistance level, and then quickly (and successfully) retested it. The move towards the upside got stopped at $0.305, and XRP is now consolidating slightly under it.

While XRP’s move seems like it ran out of steam, its volume is still relatively high, which may indicate a possibility of further volatility.

Traders should look at XRP’s volume spikes and check for any signs of its next move’s direction.

XRP/USD 4-hour Chart

Technical factors:
  • The price is above its 21-period and 50-period EMA
  • Price is just under its upper band
  • RSI is stable and extremely close to being overbought (63.57)
  • Volume is slightly above average
Key levels to the upside          Key levels to the downside

1: $0.31                                     1: $0.285 

2: $0.32                                     2: $0.266

3: $0.3328                                3:$0.2454


Categories
Cryptocurrencies

Cryptocurrency Investment Guide: Ripple

Ripple (XRP) is one of the most recognizable cryptocurrencies out there, next to other big options like Bitcoin, Ethereum, Litecoin, and a few others. It was developed by Ripple Labs in 2012. In 2017, the digital currency was one of the best investments one could make, but traders should know that it isn’t possible to buy many of these options for less than $1. Ripple, on the other hand, is a good choice if you’re looking to buy stock in digital currency that can be purchased for less than one dollar. Another interesting fact is that Google was one of the first companies to back Ripple back in 2015. Some of the other names promoting XRP have also supported big names like BuzzFeed, Coinbase, Facebook, Snapchat, Twitter, and many others. These investors have a history of believing in real up and coming companies. 

Ripple uses a real-time payment system that allows money to be exchanged between individual people no matter where they are located or what bank they use. Just imagine the possibilities for people that need to send money overseas. Some people believe that Ripple could replace traditional banking systems in the future, thanks to its lightning-quick sending speeds and convenience. When you buy Ripple, you’re buying XRP, which is the currency that actually powers Ripple, although it isn’t necessary for the payment system to work. 

Of course, traditional banking systems aren’t going to disappear completely. Many people prefer traditional methods and don’t trust or understand that sending online currency is safe, especially older people that might not be used to working with technology. If Ripple does become a widely used payment system, it would fare better by aiming to work along with banks. Fortunately, many big banks do support Ripple and have decided to invest in it. Here are a few banks that have invested in this cryptocurrency:

  • BBVA
  • Yes Bank
  • MUFG
  • SEB
  • Akbank

Several others have joined those listed above who believe in Ripple’s potential, proving that banks and cryptocurrency could really work side-by-side in the future, rather than against each other. Even with the popularity of Bitcoin, Ripple is the first (and only) cryptocurrency that is being supported by financial institutions, giving it a leg up on the competition in this sector.

You might be wondering why banks would want to invest in cryptocurrency. Honestly, it’s true that this benefits their customers with faster speeds, but this isn’t the only reason. The truth is that using Ripple can save them $3.76 per payment, to a tune of $564,000+ a year in savings. More banks are expected to join those that support Ripple as it grows more popular, especially due to the money it can save them.

As we move towards the end of our article, we must point out some of Ripple’s flaws. The first is that the currency isn’t widely recognized and that some people may not even realize that some banks are working with it. This could be expected for older generations that want to stick with what they’re used to, but many young people also fail to understand cryptocurrency, which could halt the growth of XRP. Another downside is that Ripple’s low price might not allow much room for the currency to grow with a current market cap of $3. 

With that being said, there are still several reasons to invest in Ripple. The fact that this is the only cryptocurrency that banks are using says one thing, along with the fact that many other banks are likely to start using it because it can save them money. It might become a headache to convince people to learn how it works and why they should use it, but once they do, then it will become a preferred payment method for many. As we move towards the future, people are looking for more convenient ways to do things, and we believe that Ripple has provided a modern solution that fixes the drawn-out problem of waiting days or even weeks to send money through traditional banking systems. The bottom line is that if you’re going to invest in Ripple, you should do it now while the price is still under $1. 

Categories
Crypto Market Analysis

Daily Crypto Review, Sept 1 – Binance Crypto Card Expanding To The US; YFI Token Up 1,000,000% Since July

While the top cryptocurrencies had quite a slow day, the DeFi market kept going up. Bitcoin is currently trading for $11,630, which represents a decrease of 0.38% on the day. Meanwhile, Ethereum gained 2.99% on the day, while XRP lost 0.59%.

 Daily Crypto Sector Heat Map

When taking a look at top100 cryptocurrencies, Sushi gained 110.98% on the day, making it the most prominent daily gainer. BitShares (72.48%) and Kusama (35.57%) also did great. On the other hand, DFI.Money lost 18.67%, making it the most prominent daily loser. It is followed by bZx Protocol’s loss of 13.96% and NXM’s drop of 9.34%.

Top 10 24-hour Performers (Click to enlarge)

Bottom 10 24-hour Performers (Click to enlarge)

Bitcoin’s dominance level has gone down slightly, with its value is currently at 58.40%, represents a 0.84% difference to the downside when compared to our last report.

Daily Crypto Market Cap Chart

The crypto market cap has increased significantly over the course of the day. Its current value is $375.72 billion, which represents an increase of $3 billion when compared to our previous report.

_______________________________________________________________________

What happened in the past 24 hours?

_______________________________________________________________________

_______________________________________________________________________

Technical analysis

_______________________________________________________________________

Bitcoin

After a weekend of steady gains, Bitcoin spent the day trying to establish its presence above the newly-conquered $11,630 level. While the fight is still in progress, it seems that the largest cryptocurrency by market cap will stay above the level, thus turning it into support.

Traders should take a look at how Bitcoin handles its next resistance, which is at around $11,820.

BTC/USD 4-hour Chart

Technical factors:
  • Price is above its 50-period EMA and 21-period EMA
  • Price is above its middle band
  • RSI is neutral but leaning towards overbought (57.26)
  • Volume is low
Key levels to the upside          Key levels to the downside

1: $11,630                                1: $11,460

2: $12,015                                2: $11,090

3: $12,330                                 3: $10,855

Ethereum

Unlike Bitcoin, Ethereum has had a great day. The second-largest cryptocurrency by market cap continued its rush towards the upside, fueled by the expansion of DeFi. The move towards the upside rekindled after ETH confirming its position above $415 and stopped (for now) at its next resistance level, which is sitting at $445. While Ethereum has a chance of breaking this level as well, it is unlikely that it will stay above it as the volume seems to be fading, while its RSI is in the overbought territory.

Ethereum traders should look for ETH’s pullback after the bullish move ends.

ETH/USD 4-hour Chart

Technical Factors:
  • Price is currently above its 21-period and 50-period EMA
  • Price is just below the upper band
  • RSI is in the overbought territory (74.23)
  • Volume is descending
Key levels to the upside          Key levels to the downside

1: $445                                     1: $415

2: $496                                     2: $400

                                                 3: $360

Ripple

XRP’s move towards the upside ended abruptly as the third-largest cryptocurrency by market cap failed to break the $0.285 resistance level. While it is still very close to it, XRP shows no signs of breaking the resistance any time soon, unless it gets external help in the form of BTC pushing the price of the whole crypto market.

On the other hand, XRP doesn’t show any signs of going down anytime soon, so we can expect some range-bound trading in the near future.

Traders should look for an opportunity within the range XRP is currently in.

XRP/USD 4-hour Chart

Technical factors:
  • The price is above its 21-period and 50-period EMA
  • Price is slightly above its middle band
  • RSI is stable and neutral (58.98)
  • Volume is low and relatively stable
Key levels to the upside          Key levels to the downside

1: $0.285                                   1: $0.266 

2: $0.31                                     2: $0.2454

3: $0.32                                    3:$0.235


Categories
Crypto Market Analysis

Daily Crypto Review, August 31 – Cryptos Making Steady Gains Over the Weekend; ETC Hit By Third 51% Attack

The crypto market had a good weekend, with almost every single top cryptocurrency ending up in a net gain. Bitcoin is currently trading for $11,664, which represents an increase of 0.66% on the day. Meanwhile, Ethereum gained 4.42% on the day, while XRP gained 2.19%.

 Daily Crypto Sector Heat Map

When taking a look at top100 cryptocurrencies, UMA gained 48.99% on the day, making it the most prominent daily gainer. Flexacoin (27.54%) and bZx Protocol (26.08%) also did great. On the other hand, DFI.Money lost 17.06%, making it the most prominent daily loser. It is followed by Golem’s loss of 10.16% and NEM’s drop of 7.06%.

Top 10 24-hour Performers (Click to enlarge)

Bottom 10 24-hour Performers (Click to enlarge)

Bitcoin’s dominance level has gone down quite a bit over the weekend and dropped below the 60% mark. Its value is currently at 59.24%, represents a 1.82% difference to the downside when compared to our last report.

Daily Crypto Market Cap Chart

The crypto market cap has increased significantly over the course of the weekend. Its current value is $372.72 billion, which represents an increase of $19.24 billion when compared to our previous report.

_______________________________________________________________________

What happened in the past 24 hours?

_______________________________________________________________________

_______________________________________________________________________

Technical analysis

_______________________________________________________________________

Bitcoin

Bitcoin spent the weekend slowly rising in price on low volume. The largest cryptocurrency by market cap rose above $11,460 and $11,630 resistance levels, turning them into support. The $11,630 level is currently being retested, but it looks like Bitcoin will stay above it unless a large spike of sellers suddenly comes to the market.

Traders should take a look at Bitcoin’s confirmation of the $11,630 level. If BTC stays above it, traders can consider Bitcoin to be moving in within a range, bound by $11,630 and $12,000.

BTC/USD 4-hour Chart

Technical factors:
  • Price is above its 50-period EMA and 21-period EMA
  • Price is slightly above its middle band
  • RSI is neutral but leaning towards overbought (57.95)
  • Volume is low
Key levels to the upside          Key levels to the downside

1: $11,630                                1: $11,460

2: $12,015                                2: $11,090

3: $12,330                                 3: $10,855

Ethereum

After passing the descending trend and moving above it, Ethereum had a couple of days of steady gains. The second-largest cryptocurrency by market cap slowly gained ground and passed the $400 as well as $415 resistance levels along the way. The move stopped just above $430, before starting to retrace. There is a big possibility that the $415 level will be tested as a support level.

Ethereum traders should look for ETH’s reaction when the price reaches $415 again.

ETH/USD 4-hour Chart

Technical Factors:
  • Price is currently above its 21-period and 50-period EMA
  • Price is slightly below the upper band
  • RSI is severely overbought (67.64)
  • Volume is average
Key levels to the upside          Key levels to the downside

1: $415                                     1: $400

2: $445                                     2: $360

3: $496                                      3: $340

Ripple

XRP also had a great weekend, with its price consistently moving towards the upside after briefly breaking the $0.266 support level to the downside, which is where the bullish move on Aug 27 started. While it made some progress towards the upside, XRP did not reach past any significant resistance levels. In fact, it got stopped by the $0.285 level, which it most likely won’t pass.

Due to its RSI being close to overbought, low volume, and price rejection around the $0.285 level, XRP will most likely start a move towards the downside now.

XRP traders should trade it on its way down towards $0.266 or possibly look for a bounce off of the support XRP will find on its way down.

XRP/USD 4-hour Chart

Technical factors:
  • The price is above its 21-period and 50-period EMA
  • Price is slightly below its upper band
  • RSI is nearly overbought but is moving towards neutral (58.17)
  • Volume is low and relatively stable
Key levels to the upside          Key levels to the downside

1: $0.285                                   1: $0.266 

2: $0.31                                     2: $0.2454

3: $0.32                                    3:$0.235


Categories
Crypto Market Analysis

Daily Crypto Review, August 28 – Bitcoin Bearish as XRP Plummets

The crypto market was mostly bearish over the course of the day, with XRP losing the most out of the top cryptocurrencies. Bitcoin is currently trading for $11,341, which represents a decrease of 0.5% on the day. Meanwhile, Ethereum lost 0.44% on the day, while XRP lost 5%.

 Daily Crypto Sector Heat Map

When taking a look at top100 cryptocurrencies, Numeraire gained 29.44% on the day, making it the most prominent daily gainer. Serum (23.05%) and Uma (21.68%) also did great. On the other hand, Aragon lost 17.67%, making it the most prominent daily loser. It is followed by Kusama’s loss of 12.20% and Qtum’s drop of 11.12%.


Top 10 24-hour Performers (Click to enlarge)

Bottom 10 24-hour Performers (Click to enlarge)

Bitcoin’s dominance level has gone up quite a bit from when our previous report, with its value currently at 61.06%. This value represents a 0.71% difference to the upside when compared to our last report.

Daily Crypto Market Cap Chart

The cryptocurrency market cap has decreased slightly over the course of the day. Its current value is $353.48 billion, which represents a decrease of $6.8 billion when compared to our previous report.

_______________________________________________________________________

What happened in the past 24 hours?

_______________________________________________________________________

_______________________________________________________________________

Technical analysis

_______________________________________________________________________

Bitcoin

Bitcoin was extremely volatile in the past 24 hours, with its price ranging from $11,110 to $11,600. The largest cryptocurrency by market capitalization is still below the $11,460 resistance level and seems like its preparing a move (most likely to the downside).

The price of Bitcoin has declined by more than 6% in the last three days and that along with the fact that $700 million Bitcoin futures expiry is approaching, traders are nervous and have a bearish scenario in mind. Many technical analysts believe that Bitcoin has two paths ahead at the moment: $16,000 or $9,600.

Traders should take a look at Bitcoin’s movement around $11,460 before trading.

BTC/USD 4-hour Chart

Technical factors:
  • Price is below its 50-period EMA and 21-period EMA
  • Price is below its middle band
  • RSI is neutral but leaning towards oversold (41.82)
  • Volume is average (one-candle spike)
Key levels to the upside          Key levels to the downside

1: $11,460                                1: $11,090

2: $11,630                                2: $10,855

3: $12,015                                 3: $10,500

Ethereum

The second-largest cryptocurrency by market capitalization continued its path above the descending trend line. While being above this line is a positive thing, Ethereum is still losing value as it’s gripping the line and following it down. If ETH decides to test the upside, it will encounter some turbulence way before its major resistance at $415.

If, however, Ethereum pushes towards the downside, it will fall back into the trend and possibly rush towards the bottom trend line.

Ethereum traders should look for Ethereum’s volume spike and push towards the upside.

ETH/USD 4-hour Chart

Technical Factors:
  • Price is currently below its 21-period and 50-period EMA
  • Price is slightly below the middle band
  • RSI is neutral (45.39)
  • Volume is very low (With volume spike when the trend line was retested)
Key levels to the upside          Key levels to the downside

1: $415                                     1: $400

2: $445                                     2: $360

3: $496                                      3: $340

Ripple

XRP had an incredibly bad day, as bears took over the market and pushed its price down. The third-largest cryptocurrency by market cap dropped under the $0.266 support, and then immediately tried to head back up (without any success). While the price is still near the $0.266 level, it is unlikely that XRP will confidently move above it unless Bitcoin pulls the whole crypto market up by a sudden move to the upside.

XRP traders should look for how the cryptocurrency reacts to the $0.266 level and trade-off of that info.

XRP/USD 4-hour Chart

Technical factors:
  • The price is below its 21-period and 50-period EMA
  • Price is slightly above its lower band
  • RSI is at the oversold line (30.19)
  • Volume is unstable and cycling between average (low) and extremely high volume candles
Key levels to the upside          Key levels to the downside

1: $0.285                                   1: $0.266 

2: $0.31                                     2: $0.2454

3: $0.32                                    3:$0.235


Categories
Crypto Guides

What Should You Know About Bitcoin Options?

Introduction

Investing and trading cryptos is not just about buying and selling these currencies, there are other alternatives as well. Bitcoin options trading is a lucrative alternative for the same. It offers more flexibility and extensive strategies in comparison to trading on cryptocurrency exchanges. However, trading Bitcoin options is not as easy as buying Bitcoins on exchanges. In this article, let’s understand some of the basics of trading Bitcoin options. 

Bitcoin Options – An Overview 

Options are a form of derivative, which implies that they are centered on an underlying asset like cryptocurrencies, stocks, or commodities. Depending on the contract type, buyers will be provided with the opportunity to purchase or sell the asset at a particular value called the strike price within a particular time period. 

We will come across two forms of Bitcoin options, just like while trading the traditional options. And they are, Call & Put Options. Call Option holders get the chance to purchase assets at a fixed price within a specific window of time. Put Options offers the chance to sell at a particular price in a specific time frame. 

When purchasing Bitcoin options, traders have to pay a specific premium for the chance to sell or buy Bitcoin at a price set in the future. This provides a smart way to go short or long BTC, allowing investors to gain even when the market is declining, and multiply their profits.  

How Do Bitcoin Options Trading Work?

If the underlying investment is trading more than the strike price, it is considered to be in the money for a call. Investors have the right to buy Bitcoin at the lower strike price. They can later sell the same at a higher price and keep the difference. If there is a price that goes under the strike price beyond the expiration date, it will not be worth anything. But the loss investors incur is limited to the premium they have paid. 

In case of a put, the price must be under the strike price to be “in the money.” Traders have the right to sell the Bitcoin at a higher value than the strike price. To leverage it, investors need to purchase the asset at market price. In the future, they can sell them at a value higher than the strike price and keep the profit. 

Where Can Traders Bitcoin Options?

Bitcoin options are not available on the crypto exchanges. Presently, the three primary Bitcoin option trading platforms that include: 

Quedex in Gibraltar | LedgerX in New York | Deribit in Amsterdam

Why Trade with Bitcoin Options? 

The following are the reasons to trade with Bitcoin Options: 

  • They are better in comparison to futures as their loss is limited to the premium paid. 
  • Bitcoin options are extremely flexible as they can be leveraged to reflect the future pattern and use different types of strategies. 
  • You can harness volatility without bearing a directional position via delta hedging. 

It is important to understand that not all Bitcoin options work similarly. While traders can exercise the American Bitcoin option anytime they want, European options can only be exercised upon the expiry. When it comes to buying Bitcoin options, traders should select a credible platform with a proven track record.

Categories
Crypto Market Analysis

Daily Crypto Review, August 27 – $700 Million of Bitcoin Options Expiring on Friday: Prepare for Volatility

The crypto market was split between cryptos that ended up in the green and in the red, with a bit more cryptocurrencies ending up gaining in the past 24 hours. Bitcoin is currently trading for $11,374, which represents an increase of 0.14% on the day. Meanwhile, Ethereum gained 0.77% on the day, while XRP lost 0.36%.

 Daily Crypto Sector Heat Map

When taking a look at top100 cryptocurrencies, Celo gained 56.49% on the day, making it the most prominent daily gainer. Aragon (36.44%) and Siacoin (17.45%) also did great. On the other hand, The Midas Touch lost 20.75%, making it the most prominent daily loser. It is followed by Kusama’s loss of 8.81% and Reserve Rights’ drop of 8.72%.

Top 10 24-hour Performers (Click to enlarge)

Bottom 10 24-hour Performers (Click to enlarge)

Bitcoin’s dominance level has stayed at the same place as we reported yesterday, with its value currently at 60.35%. This value represents a 0.01% difference to the upside when compared to our last report.

Daily Crypto Market Cap Chart

The cryptocurrency market cap has increased significantly over the course of the day. Its current value is $360.28 billion, which represents an increase of $24.61 billion when compared to our previous report.

_______________________________________________________________________

What happened in the past 24 hours?

_______________________________________________________________________

_______________________________________________________________________

Technical analysis

_______________________________________________________________________

Bitcoin

Bitcoin has had somewhat a slow day after bottoming out near $11,090. The largest cryptocurrency by market cap tried to break the $11,460 resistance level at one point, but it ended up unsuccessfully. Bitcoin will need to gather quite a strong bullish presence if it wants to reach $12,000 anytime soon, as the upside is guarded by way too many smaller and bigger resistance levels.

With $700 million of Bitcoin options expiring on Friday, we may see a nice spike in volume and volatility. Various analysts predict that the price at its current position would be a good buying opportunity for futures traders, while a price near $12,000 would be a good sell opportunity.

Traders should take a look at Bitcoin’s movement around $11,460.

BTC/USD 4-hour Chart

Technical factors:
  • Price is below its 50-period EMA and 21-period EMA
  • Price is between its lower and middle band
  • RSI is neutral but leaning towards oversold (41.02)
  • Volume is average
Key levels to the upside          Key levels to the downside

1: $11,460                                1: $11,090

2: $11,630                                2: $10,855

3: $12,015                                 3: $10,500

Ethereum

While it did not do much better than Bitcoin in terms of daily gains, Ethereum had a decent day. The second-largest cryptocurrency by market cap gathered a small bullish force to push through the descending trend. Not only did Ethereum push past it, but it also confirmed its position above it. With that being said, Ethereum needs a significant volume spike if it wants to reach past $400, or go any higher than that.

However, with DeFi booming and gathering interest from traders (and even creating new ones), Ethereum might be on the right track to show its true bullish nature in the mid-term.

Ethereum traders should look for Ethereum’s volume spikes and trade-off of that.

ETH/USD 4-hour Chart

Technical Factors:
  • Price is currently below its 21-period and 50-period EMA
  • Price is between its lower and middle band
  • RSI is neutral (44.63)
  • Volume is very low
Key levels to the upside          Key levels to the downside

1: $415                                     1: $400

2: $445                                     2: $360

3: $496                                      3: $340

Ripple

XRP was the only cryptocurrency in the red in the past 24 hours out of the top3 cryptocurrencies by market cap. After bottoming out near $0.266 and recovering to around $0.28, XRP started dropping slightly again, reaching the current price of $0.275. The low volume and candles with small bodies and small wicks show almost no volatility in trading.

XRP traders should look for a volume spike before even considering a trade.

XRP/USD 4-hour Chart

Technical factors:
  • Price is below its 21-period and 50-period EMA
  • Price is between its lower and middle band
  • RSI stable and leaning towards the oversold area (38.69)
  • Volume is below average and stable
Key levels to the upside          Key levels to the downside

1: $0.285                                   1: $0.266 

2: $0.31                                     2: $0.2454

3: $0.32                                    3:$0.235


Categories
Crypto Market Analysis

Daily Crypto Review, August 26 – Bitcoin in a Downtrend; Altcoins Following Bitcoin

Almost every single cryptocurrency in the top100 ended up in the red today, as Bitcoin fell below $11,630. Bitcoin is currently trading for $11,334, which represents a decrease of 2.34% on the day. Meanwhile, Ethereum lost 3.84% on the day, while XRP lost 2.57%.

 Daily Crypto Sector Heat Map

When taking a look at top100 cryptocurrencies, Kusama gained 35.49% on the day, making it the most prominent daily gainer. Aragon (18.33%) and The Reserve Rights (14.61%) also did great. On the other hand, Flexacoin lost 12.17%, making it the most prominent daily loser. It is followed by Ocean Protocol’s loss of 10.15% and Verge’s drop of 9.60%.

Top 10 24-hour Performers (Click to enlarge)

Bottom 10 24-hour Performers (Click to enlarge)

Bitcoin’s dominance level has increased slightly, with its value currently at 60.34%. This value represents a 0.3% difference to the upside when compared to our last report.

Daily Crypto Market Cap Chart

The cryptocurrency market cap decreased significantly over the course of the day. Its current value is $335.82 billion, which represents a decrease of $33.15 billion when compared to our previous report.

_______________________________________________________________________

What happened in the past 24 hours?

_______________________________________________________________________

_______________________________________________________________________

Technical analysis

_______________________________________________________________________

Bitcoin

Bitcoin has experienced yet another price drop in the past 24 hours. As we mentioned in our previous article, the largest cryptocurrency by market cap was preparing a move to either side and that the direction of the move will decide BTC’s faith in the short-term. As we can see, Bitcoin decided to go towards the downside and quickly dropped below its $11,630 and $11,460 support levels. It got stopped, however, by both the $11,090 and the descending trend line, which Bitcoin created ten days ago.

Traders should take a look at how Bitcoin resolves its current position and trade after they get more info.

BTC/USD 4-hour Chart

Technical factors:
  • Price is below its 50-period EMA and its 21-period EMA
  • Price is at its lower band
  • RSI bounced off of the oversold line (32.84)
  • Volume has increased
Key levels to the upside          Key levels to the downside

1: $11,460                                1: $11,090

2: $11,630                                2: $10,855

3: $12,015                                 3: $10,505

Ethereum

Ethereum also had a bad day, with bears dominating its price movements. The second-largest cryptocurrency by market cap has, over the course of the day, dropped back into the descending trend it just briefly escaped the day before. Ethereum’s position within the descending trend was confirmed after a small price spike couldn’t get past the trend’s upper level.

Ethereum traders should look for how ETH handles being in the level, and how it exits it.

ETH/USD 4-hour Chart

Technical Factors:
  • Price is currently below its 21-period and its 50-period EMA
  • Price is at its lower band
  • RSI is leaning towards oversold (37.87)
  • Volume is normal (but the past 24h saw a surge in volume at one point)
Key levels to the upside          Key levels to the downside

1: $415                                     1: $400

2: $445                                     2: $361

3: $496                                      3: $340

Ripple

XRP suffered from the same fate as BTC and ETH, with bears taking over the market and its price dropping in the past 24 hours. The third-largest cryptocurrency by market cap fell below $0.285 after not being able to properly confirm its position above it, and almost reached the $0.266 support in the process. XRP is now stabilizing at around $0.275 with low volume and volatility.

XRP traders should look for how the cryptocurrency reacts when it reaches its immediate support/resistance levels.

XRP/USD 4-hour Chart

Technical factors:
  • Price is below its 21-period and its 50-period EMA
  • Price is slightly above its lower band
  • RSI stable, but leaning towards the oversold area (38.10)
  • Volume is below average and stable (except a two-candle spike during the price drop)
Key levels to the upside          Key levels to the downside

1: $0.285                                   1: $0.266 

2: $0.31                                     2: $0.2454

3: $0.32                                    3:$0.235


Categories
Crypto Market Analysis

Daily Crypto Review, August 25 – Bitcoin Whales List Reaches All-Time High; DeFi Projects Still Booming

Cryptocurrencies had a steady day, with most of them being in the slight green. Bitcoin is currently trading for $11,768, which represents an increase of 1.22% on the day. Meanwhile, Ethereum gained 4.32% on the day, while XRP gained 1.85%.

 Daily Crypto Sector Heat Map

When taking a look at top100 cryptocurrencies, Aave gained 33.55% on the day, making it the most prominent daily gainer. Kusama (26.13%) and The JUST (17.30%) also did great. On the other hand, Nervos Network lost 7.95%, making it the most prominent daily loser. It is followed by OMG Network’s loss of 7.59% and Siacoin’s drop of 7.53%.

Top 10 24-hour Performers (Click to enlarge)

Bottom 10 24-hour Performers (Click to enlarge)

Bitcoin’s dominance level has decreased slightly, with its value currently at 60.04%. This value represents a 0.16% difference to the downside when compared to our last report.

Daily Crypto Market Cap Chart

The cryptocurrency market cap increased in value over the course of the day. Its current value is $368.97 billion, which represents an increase of $6.26 billion when compared to our previous report.

_______________________________________________________________________

What happened in the past 24 hours?

_______________________________________________________________________

_______________________________________________________________________

Technical analysis

_______________________________________________________________________

Bitcoin

Bitcoin is at an important crossroad that will decide its short-term future. While it is currently stuck between $11,630 and $12,000, the largest cryptocurrency by market cap will soon have to decide on its direction. Even though a retest of the $11,630 support seems much more plausible, that does not mean that BTC will make a sharp move towards the downside. If the level holds, Bitcoin might have a good chance of bouncing towards $12,000 yet again.

The low volume also shows that a bigger move is on the horizon.

Traders should look for what BTC will do after it hits one of its support/resistance levels before making a trade.

BTC/USD 4-hour Chart

Technical factors:
  • Price is below its 50-period EMA and below its 21-period EMA
  • Price is slightly above its middle band
  • RSI is neutral (50.15)
  • Volume is below average and stagnant
Key levels to the upside          Key levels to the downside

1: $12,015                                1: $11,630

2: $12,300                                2: $11,460

3: $12,900                                 3: $11,090

Ethereum

Unlike Bitcoin that’s preparing for a move and trading with reduced volume and volatility, Ethereum had a great day and ended up making good gains. The second-largest cryptocurrency by market cap had a small volume spike, which was significant enough to push the price up and past the descending trend it was in for a couple of days.

Ethereum is now stabilizing at around $400, while its volume is decreasing.

Ethereum traders should look for Bitcoin’s next move, which ETH will most likely follow.

ETH/USD 4-hour Chart

Technical Factors:
  • Price is currently above its 21-period and its 50-period EMA
  • Price is at its upper band
  • RSI is neutral (52.30)
  • Volume is slightly increased from the previous days
Key levels to the upside          Key levels to the downside

1: $415                                     1: $400

2: $445                                     2: $361

3: $496                                      3: $340

Ripple

XRP spent the day consolidating above $0.285 level, which is regained the previous day. The third-largest cryptocurrency by market cap focused on stabilizing above $0.285, but without much success. While it is still technically above it, XRP would need a small move towards the upside (or some other sort of a decisive move) to confirm its position.

XRP traders should be careful around the $.285 level and pick their trade carefully based on where XRP will go.

XRP/USD 4-hour Chart

Technical factors:
  • Price is above its 21-period and below its 50-period EMA
  • Price is slightly above the middle band
  • RSI is neutral (48.63)
  • Volume is below average and stable
Key levels to the upside          Key levels to the downside

1: $0.31                                     1: $0.285 

2: $0.32                                     2: $0.266

3: $0.332                                  3:$0.2454


Categories
Crypto Market Analysis

Daily Crypto Review, August 24 – YFI The Youngest DeFi Billionaire; IOTA Going Bankrupt

Cryptocurrencies spent most of the weekend recovering from the bearish move, which occurred late Friday and early Saturday. Bitcoin is currently trading for $11,731, which represents an increase of 1.11% on the day. Meanwhile, Ethereum gained 0.8% on the day, while XRP gained 1.71%.

 Daily Crypto Sector Heat Map

When taking a look at top100 cryptocurrencies, Cosmos gained 29.48% on the day, making it the most prominent daily gainer. IRISnet (21.33%) and The Midas Touch (18.49%) also did great. On the other hand, yearn.finance lost 8.32%, making it the most prominent daily loser. It is followed by Ren’s loss of 7.36% and Komodo’s drop of 6.67%.

Top 10 24-hour Performers (Click to enlarge)

Bottom 10 24-hour Performers (Click to enlarge)

Bitcoin’s dominance level has increased slightly and passed the 60% mark to the upside, with its value currently at 60.20%. This value represents a 0.46% difference to the upside when compared to our last report.

Daily Crypto Market Cap Chart

The cryptocurrency market cap experienced a decrease in value over the course of the weekend. Its current value is $362.71 billion, which represents a decrease of $10.46 billion when compared to our previous report.

_______________________________________________________________________

What happened in the past 24 hours?

_______________________________________________________________________

_______________________________________________________________________

Technical analysis

_______________________________________________________________________

Bitcoin

After a failed breakout of the ascending triangle, Bitcoin’s price started moving down until it reached $11,460 on Saturday. After reaching that level and not being able to pass it to the downside, Bitcoin bounced and started moving up slowly. The whole weekend was rather slow in terms of volatility, but extremely important in terms of where Bitcoin will end up. The fight for $11,630 was successful, and BTC is now above it, with the potential of going further up. However, the move to the upside will not go far with this volume, as it is way too low for any significant movement.

BTC traders should look for a trade near the $11,900 level, which might act as resistance.

BTC/USD 4-hour Chart

Technical factors:
  • Price is above its 50-period EMA as well as its 21-period EMA
  • Price is slightly above its middle band
  • RSI is neutral (54.45)
  • Volume is below average
Key levels to the upside          Key levels to the downside

1: $12,015                                1: $11,630

2: $12,300                                2: $11,460

3: $12,900                                 3: $11,090

Ethereum

Ethereum’s weekend was also spent in recovering from the bearish moves that occurred in the previous week. The second-largest cryptocurrency by market cap managed to stabilize at below-$400 levels, which it is now trying to pass to the upside. However, the moves which occurred in the past week created a downward-facing trend, which is creating resistance towards the upside, which Ethereum is struggling to pass with low volume, which it now has.

Ethereum traders can look for a trade after Ethereum breaks the trend (to any side).

ETH/USD 4-hour Chart

Technical Factors:
  • Price is currently above its 21-period and below its 50-period EMA
  • Price is at its middle band
  • RSI is neutral (49.72)
  • Volume is below average
Key levels to the upside          Key levels to the downside

1: $415                                     1: $400

2: $445                                     2: $361

3: $496                                      3: $340

Ripple

XRP’s chart looks no different than Bitcoin’s and Ethereum’s chart. The third-largest cryptocurrency by market cap spent the weekend recovering from what was lost during the bearish moves that occurred throughout the week. XRP stabilized at $0.28 and then gathered the strength to push past it. While the price is currently above the $0.285 level, it is not certain that it will stay that way. XRP would need a confirmation move in order to turn $0.285 into true support.

XRP traders can look for after XRP confirms its position, or after it drops below $0.285.

XRP/USD 4-hour Chart

Technical factors:
  • Price is currently above the 21-period and below the 50-period EMA
  • Price is slightly above the middle band
  • RSI is neutral (51.50)
  • Volume is stable and below average
Key levels to the upside          Key levels to the downside

1: $0.31                                     1: $0.285 

2: $0.32                                     2: $0.266

3: $0.332                                  3:$0.2454


Categories
Crypto Videos

Pompliano on Goldman Sachs Interest In Blockchain


Pompliano on Goldman Sachs’ Interest In Blockchain

With Mathew McDermott assuming the role of global head of digital assets for Goldman Sachs, the market can expect this banking giant to be quite involved in cryptocurrencies very soon.
“In the next five to ten years, we could see a financial system where all assets and liabilities will be native to a blockchain, and all transactions natively happening on-chain,” McDermott in a CNBC article on Aug 6.
Tweeting out this quote on Aug 6, Anthony Pompliano, Morgan Creek Digital co-founder, responded:
“Wall Street companies are about to learn why technologists often say innovate or die.”

McDermott’s plans include expansion

Taking over for Justin Schmidt, which was Goldman’s previous head of digital assets, McDermott plans to hire new Asia-based as well as Europe-based team members, with the goal of ultimately growing his lineup by 100%.
Additionally, the new Goldman executive mentioned a potential future native asset that they might develop. “We are exploring the viability of creating Golman’s own fiat digital token,” said McDermott for CNBC.

The era of digital money

Among many advantages of a blockchain-based digital system, McDermott specifically mentioned efficiency, describing how the new ecosystem could essentially have the same activities, except they would all be digital instead of physical.
“That includes debt issuances, loan origination, securitization; essentially, you’ll have a digital market ecosystem, and the options are pretty vast,” he explained.

Oli Harris, former head of digital assets strategy for JPMorgan Chase, who assisted with the outline of the JPM Coin, also took a position at Goldman thanks to McDermott.
McDermott, in his interview, also noted increased institutional attention, which is something the crypto industry has been wishing for over the past several years. “We’ve definitely seen an increase in interest across some of our institutional clients as they are exploring how they can participate in the crypto space,” he explained.

Categories
Crypto Videos

ETC Price Stable After Two 51% Attacks – Why?

https://youtu.be/RHEy8317eTw


ETC Price Stable After Two 51% Attacks – Why?

After suffering two major 51% attacks over the past week, Ethereum Classic has seen its hash rate go down considerably – all due to people being scared of another such attack.
As a consequence of Ethereum Classic’s miner capitulation, the estimated cost of performing a 51% attack targeting Ethereum Classic using hash power simply rented from NiceHash went down from $12,000 per hour to less than $4,000 per hour.

Despite this, the market price has been unaffected by the fragility of the network, with ETC actually gaining more than 2% since news of the second 51% attack broke. ETC is currently trading for $6.95.

Exchange volume report 

With the 24-hour trade volume being up roughly 10% from the level posted a few days before the first 51% attack, orders are continuing to execute across most of the top exchanges, including Coinbase Pro, Binance, Bitfinex, as well as KuCoin.
The increase in trade activity is occurring despite the suspension of withdrawals, deposits, and margin funding services among a number of leading cryptocurrency exchanges.

ETC and its market signals

The strength of ETC’s markets is quite high despite exchange’s having disabled wallet activity. This raises a question regarding whether algorithmic bots may be driving the trading activity at the moment.
A 2019 report published by Blockchain Transparency Institute made an estimate that Ethereum Classic was one of the three assets traded the most by the bots, with more than 80% of the volume being flagged as suspicious.

Ethereum Classic miners capitulation

After hovering between five and six terahashes per second through July, ETC’s hash power dropped to somewhere around four terahashes per second over the past seven days.
The second attack saw hash power spike up to 9 terahashes per second, just before plummeting to less than 2.5 terahashes per second afterward.

Categories
Crypto Market Analysis

Daily Crypto Review, August 21 – OMG Network Token Up Over 100% Today; Tether Moving 1 Billion USDT From Tron to Ethereum Blockchain

While most of the top cryptocurrencies took the day to consolidate or advance slightly, Ethereum tokens were the most volatile and moved up or down with much more intensity. Bitcoin is currently trading for $11,835, which represents an increase of 0.56% on the day. Meanwhile, Ethereum gained 1.39% on the day, while XRP gained 1.01%.

 Daily Crypto Sector Heat Map

When taking a look at top100 cryptocurrencies, OMG Network gained 106.88% on the day, making it the most prominent daily gainer. 0x (48.58%) and Flexacoin (42.15%) also did great. On the other hand, Ren lost 14.05%, making it the most prominent daily loser. It is followed by Reserve Rights’ loss of 7.07% and Waves’ drop of 6.93%.

Top 10 24-hour Performers (Click to enlarge)

Bottom 10 24-hour Performers (Click to enlarge)

Bitcoin’s dominance level has decreased slightly and went under the 60% mark yet again, with its value currently at 59.74%. This value represents a 0.7% difference to the downside when compared to our last report.

Daily Crypto Market Cap Chart

The cryptocurrency market cap experienced a sharp increase in value over the course of the day. Its current value is $373.17 billion, which represents an increase of $9.41 billion when compared to our previous report.

_______________________________________________________________________

What happened in the past 24 hours?

_______________________________________________________________________

_______________________________________________________________________

Technical analysis

_______________________________________________________________________

Bitcoin

After a failed breakout of the ascending triangle, Bitcoin’s price started moving down sharply towards $11,630. The move, as we noted in our previous articles, stopped there. Bitcoin spent the past 24 hours mostly consolidating after a brief moment of bullish presence, which brought its price above $11,800 levels.

This move towards the upside, no matter how small it is, shows that Bitcoin is in a great spot at the moment, and it would take a lot to shake it out of this extremely bearish mid-term position.

BTC traders should be looking for a trade above $12,000, or after the push towards it fails.

BTC/USD 4-hour Chart

Technical factors:
  • Price is at its 50-period EMA and below its 21-period EMA
  • Price slightly below its middle band
  • RSI is neutral (48.45)
  • Volume is average (descending)
Key levels to the upside          Key levels to the downside

1: $12,015                                1: $11,630

2: $12,300                                2: $11,460

3: $12,900                                 3: $11,090

Ethereum

Ethereum spent the day struggling at the $415 level, as the fight for whether it will end up above or below the level is still continuing. The second-largest crypto by market cap recovered from its drop to $395 after hitting a semi-descending line, which acted as support/resistance since Aug 5.

This fight for $415 clearly shows the fight between two mindsets: bulls who are extremely bullish when it comes to DeFi and everything related, and bears which are scared of the skyrocketing ETH transaction fees as well as of the ICO scenario that happened around 2017.

Ethereum traders should wait for ETH to establish itself above or below $415 before trading.

ETH/USD 4-hour Chart

Technical Factors:
  • Price is currently at its 21-period and its 50-period EMA
  • Price is at its middle band
  • RSI is neutral (47.15)
  • Volume is slightly below average
Key levels to the upside          Key levels to the downside

1: $415                                     1: $400

2: $445                                     2: $361

3: $496                                      3: $340

Ripple

XRP’s chart looks a lot like BTC’s chart in the past couple of days. The third-largest cryptocurrency by market cap stopped moving towards the downside after hitting $0.285, which held up quite nicely. XRP then got a small boost towards the $0.29, where it is now consolidating.

With both 21-period and 50-period moving averages right above the price, XRP would require a strong bullish initiative in order to move towards $0.31, which (at the moment) seems unlikely.

Traders can look for an entry within the range between $0.285 and $0.31.

XRP/USD 4-hour Chart

Technical factors:
  • Price is currently below the 21-period and 50-period EMA
  • Price is slightly below the middle band
  • RSI is neutral (46.15)
  • Volume is descending (approaching average)
Key levels to the upside          Key levels to the downside

1: $0.31                                     1: $0.285 

2: $0.32                                     2: $0.266

3: $0.332                                  3:$0.2454


Categories
Crypto Market Analysis

Daily Crypto Review, August 20 – ETH Plummets Due To Skyrocketing Transaction Fees; $12,000 Level Too Strong For Bitcoin

While most of the top cryptos had a slightly red day, Ethereum tokens mostly did great. Bitcoin is currently trading for $11,732, which represents a decrease of 0.25% on the day. Meanwhile, Ethereum lost 1.26% on the day, while XRP lost 1.24%.

 Daily Crypto Sector Heat Map

When taking a look at top100 cryptocurrencies, OMG Network gained 26.67% on the day, making it the most prominent daily gainer. yearn.finance (20.13%) and Qtum (10.04%) also did great. On the other hand, Balancer lost 19.84%, making it the most prominent daily loser. It is followed by Compound’s loss of 9.50% and Waves’ drop of 8,97%.

Top 10 24-hour Performers (Click to enlarge)

Bottom 10 24-hour Performers (Click to enlarge)

Bitcoin’s dominance level has increased slightly and passed the 60% mark, with its value currently at 60.44%. This value represents a 0.77% difference to the upside when compared to our last report.

Daily Crypto Market Cap Chart

The cryptocurrency market cap experienced a slight increase in value over the course of the day. Its current value is $364.76 billion, which represents an increase of $0.56 billion when compared to our previous report.

_______________________________________________________________________

What happened in the past 24 hours?

_______________________________________________________________________

_______________________________________________________________________

Technical analysis

_______________________________________________________________________

Bitcoin

After a brief break of the $12,000 level, Bitcoin fell down and is controlled by BTC bears for the second day in a row. The largest cryptocurrency by market cap has moved towards the $11,630 support level (as we said in our previous article) and tried to test its strength. The level held up, and Bitcoin is now consolidating right above it.

This bear push was caused by several factors, but mostly because of the immense resistance at around $12,000 and the challenges Ethereum faces with its incredibly high transaction fees (Bitcoin acts as a “representative” to all the cryptos, so it affects others, but is also affected by others).

BTC traders should be looking for a trade when Bitcoin breaks $11,630 to the downside or pushes towards $12,000 again.

BTC/USD 4-hour Chart

Technical factors:
  • Price is below its 50-period EMA and its 21-period EMA
  • Price is between its lower and middle band
  • RSI is slightly tilted towards the oversold area (41.97)
  • Volume is average
Key levels to the upside          Key levels to the downside

1: $12,015                                1: $11,630

2: $12,300                                2: $11,460

3: $12,900                                 3: $11,090

Ethereum

Even though Ethereum’s social sentiment is still extremely high due to the craze over DeFi, it is a fact that ETH’s transaction fees have been skyrocketing as the demand for DeFi increased. This fact, along with Bitcoin not being able to break the $12,000 mark, caused the second-largest cryptocurrency by market cap to drop below its $415 support level (now resistance). The drop stopped around $400 and changed direction, trying to retake its previous highs. However, the $415 resistance level confirmed its strength, leaving ETH below it.

Ethereum traders should look for a trade when ETH breaks $415 to the upside.

ETH/USD 4-hour Chart

Technical Factors:
  • Price is currently below its 21-period and its 50-period EMA
  • Price is slightly above its lower band
  • RSI is descending (39.54) and approaching oversold levels
  • Volume is average
Key levels to the upside          Key levels to the downside

1: $415                                     1: $400

2: $445                                     2: $361

3: $496                                      3: $340

Ripple

XRP has had quite a bad day, as it essentially nullified any previous moves towards the upside. The third-largest cryptocurrency by market cap dropped to $0.285 levels (and even below it at one point). While the level held up and secured XRP’s position above it, for the time being, XRP does not look like it will make another move towards the upside soon.

Traders can look for a trade when XRP breaks $0.285 to the downside.

XRP/USD 4-hour Chart

Technical factors:
  • Price is currently below the 21-period and 50-period EMA
  • Price is slightly above the lower band
  • RSI is neutral (40.49)
  • Volume is descending (though it is slightly elevated)
Key levels to the upside          Key levels to the downside

1: $0.31                                     1: $0.285 

2: $0.32                                     2: $0.266

3: $0.332                                  3:$0.2454


Categories
Crypto Market Analysis

Daily Crypto Review, August 19 – Cryptos Heavily in the Red, YFI Token Breaks $11,000 and Approaches BTC’s Price Level

Almost every single cryptocurrency in the top100 was in the red today after Bitcoin broke $12,000 to the downside. Bitcoin is currently trading for $11,685, which represents a decrease of 4.7% on the day. Meanwhile, Ethereum lost 5.56% on the day, while XRP lost 9.4%.

 Daily Crypto Sector Heat Map

When talking about top100 cryptocurrencies, yearn.finance gained 19.51% on the day, making it the most prominent daily gainer. THETA (17.62%) and Swipe (17.28%) also did great. On the other hand, Numeraire lost 10.95%, making it the most prominent daily loser. It is followed by BitTorrent’s loss of 10.14% and Fetch.ai’s drop of 9.94%.

Top 10 24-hour Performers (Click to enlarge)

Bottom 10 24-hour Performers (Click to enlarge)

Bitcoin’s dominance level has increased slightly (even though it is still under the 60% mark), with its value currently at 59.77%. This value represents a 0.13% difference to the upside when compared to our last report.

Daily Crypto Market Cap Chart

The cryptocurrency market cap experienced a decrease in value over the course of the day. Its current value is $364.20 billion, which represents a decrease of $20 billion when compared to our previous report.

_______________________________________________________________________

What happened in the past 24 hours?

_______________________________________________________________________

_______________________________________________________________________

Technical analysis

_______________________________________________________________________

Bitcoin

After finally breaking $12,000 with confidence, Bitcoin is now falling hard below it (click on the arrow of the image). The largest cryptocurrency by market cap is dropping below $11,700 at the moment on bearish momentum. If the cryptocurrency manages to break below the 11,600 level, the next target will be 11,087. Right now, it is heavily oversold, so we can also expect a bounce back to near $12,000.

BTC traders should look for a trade after the cryptocurrency decides on whether it will end up above or below $11,600, as this is a strong support level.

BTC/USD 4-hour Chart

Technical factors:
  • Price is below its 50-period EMA and below its 21-period EMA
  • Price is below its lower band.
  • RSI is dropping (34) and approaching the oversold area
  • Volume is above average
Key levels to the upside          Key levels to the downside

1: $12,015                                1: $11,630

2: $12,300                                2: $11,460

3: $12,900                                 3: $11,090

Ethereum

Ethereum’s social sentiment is still on the rise with the increased interest in DeFi. Even though the second-largest cryptocurrency by market cap is losing heavily in the past 24 hours, the $400 support level should hold, and ETH is (for the time being) safe above it. The next move Ethereum makes will most likely be caused by Bitcoin’s move, as the largest cryptocurrency by market cap is preparing an explosive move towards (most likely) the upside. That, though, should wait a bit, since cryptos are still under selling pressure.

Traders should look for a trade when ETH regains a higher and steady volume.

ETH/USD 4-hour Chart

Technical Factors:
  • Price is currently below its 21-period and its 50-period EMA
  • Price is below its lower B.B.
  • RSI is descending (36) approaching oversold levels
  • Volume is average
Key levels to the upside          Key levels to the downside

1: $445                                      1: $415

2: $496                                     2: $400

                                                  3: $361

Ripple

XRP’s bold move towards the upside, which came after announcing that its company (Ripple) will focus its business model on the XRP token rather than using it as a side solution, got nullified. The third-largest cryptocurrency by market cap dropped below the $0.31 level and as low as $0.29 (which is where it is at now).

Traders can look for a trade after XRP moves above or below its immediate support/resistance levels, or within the current trading level.

XRP/USD 4-hour Chart

Technical factors:
  • Price is currently below the 21-period and 50-period EMA
  • Price is below the lower B.B.
  • RSI is dropping (38.6)
  • Volume increased in the last hours
Key levels to the upside          Key levels to the downside

1: $0.32                                     1: $0.31  

2: $0.332                                   2: $0.285

                                                3:$0.266


Categories
Crypto Videos

Bitcoin Is As Big As The Bank of America!


Bitcoin as Big as Bank of America

All the capital invested in Bitcoin at the moment totals to a few billion dollars less than Bank of America’s market valuation.
Bitcoin’s current market cap currently sits just over $217 billion, while Yahoo Finance’s data shows Bank of America’s market cap at just over $226 billion.

Bitcoin’s market cap is still climbing 

Although it has endured a lot of dramatic price fluctuations, Bitcoin’s price managed to grow substantially in 2020, rising past several wealth comparisons along the way.
The United States Central Bank injected $168 billion into the economy back in March, just before COVID-19 measures. At that point in time, Bitcoin’s market cap was nearing $145 billion.
If we take a look at April, Jeff Bezos’ net worth came out at approximately $140 billion, while Bitcoin’s market cap neared $130 billion.
Since then, Bezos’ net worth managed to reach a staggering $193 billion, while Bitcoin’s valuation went even higher, to the point it is at currently, at $217 billion.

Bitcoin could reach astronomical heights

Morgan Creek Digital co-founder Anthony Pompliano forecasted a future Bitcoin market cap of over $80 or $90 trillion at some point. This forecast happened during an Aug 4 crossover podcast episode featuring Peter McCormack.

Pompliano, however, expressed his uncertainty on whether Bitcoin would reach such a market cap within his lifetime.
As a long-time Bitcoin advocate, Pompliano has stated his position on Bitcoin as well as crypto, in general, many times.

Categories
Crypto Market Analysis

Daily Crypto Review, August 18 – Crypto Fundamentals Booming: Bitcoin Above $12,000; XRP Skyrocketing to $0.315

The cryptocurrency market made gains over the course of the day as Bitcoin broke the $12,000 mark. Bitcoin is currently trading for $12,247, which represents an increase of 3.61% on the day. Meanwhile, Ethereum gained 1.12% on the day, while XRP gained 5.14%.

 Daily Crypto Sector Heat Map

When talking about top100 cryptocurrencies, Flexacoin gained 27.98% on the day, making it the most prominent daily gainer. yearn.finance (26.80%) and Fetch.ai (25.97%) also did great. On the other hand, Algorand lost 14.78%, making it the most prominent daily loser. It is followed by Chainlink’s loss of 12.26% and THORChain’s drop of 10.18%.

Top 10 24-hour Performers (Click to enlarge)

Bottom 10 24-hour Performers (Click to enlarge)

Bitcoin’s dominance level has increased slightly (though it is still under the 60% mark), with its value currently at 59.64%. This value represents a 0.47% difference to the upside when compared to our last report.

Daily Crypto Market Cap Chart

The cryptocurrency market cap experienced a solid increase in value over the course of the day. Its current value is $384.43 billion, which represents an increase of $11.03 billion when compared to our previous report.

_______________________________________________________________________

What happened in the past 24 hours?

_______________________________________________________________________

_______________________________________________________________________

Technical analysis

_______________________________________________________________________

Bitcoin

Bitcoin finally broke $12,000 with confidence, after a couple of days slowly preparing for this move. The largest cryptocurrency by market cap broke out from a large ascending triangle formation and pushed up to $12,470 before falling back down slightly. However, for now, Bitcoin is safe above $12,000 even though it is moving towards the downside. It will most likely test the closest support level in the short term.

This (relatively) sudden break above $12,000 came as a result of many things, but mostly increased interest in DeFi which is making people enter the crypto space (which they do through Bitcoin) and because of institutional investors such as Pantera capital (which just recently announced raising $165 million)

BTC traders should look for a trade after Bitcoin retests its support level.

BTC/USD 4-hour Chart

Technical factors:
  • Price is above its 50-period EMA and its 21-period EMA
  • Price is slightly below its top B.B.
  • RSI is elevated (63.83)
  • Volume is decreasing (one-candle spike)
Key levels to the upside          Key levels to the downside

1: $12,000                                1: $11,630

2: $12,300                                2: $11,460

                                                 3: $11,090

Ethereum

Ethereum’s social sentiment was booming as more and more people started investing in DeFi tokens. As this happened, more and more institutional investors grabbed ETH. This made the second-largest cryptocurrency by market cap establish its place above $415 with no signs of going below it in the short future.

When talking about the past 24 hours, Ethereum made a push towards $450 (accompanied by skyrocketing volume), which it did not have the strength to complete. The move died down, and Ethereum is now consolidating at the $430 level.

Traders should look for a trade when ETH regains steady volume.

ETH/USD 4-hour Chart

Technical Factors:
  • Price is currently above its 21-period and its 50-period EMA
  • Price is at its middle B.B.
  • RSI is neutral (52.68)
  • Volume is average (one-candle spike)
Key levels to the upside          Key levels to the downside

1: $445                                      1: $415

2: $496                                     2: $400

                                                  3: $361

Ripple

XRP made a bold move towards the upside after announcing that its company (Ripple) will focus its business model on the XRP token. As more emphasis was put on developing XRP as the main solution rather than a side solution, more investors flocked and bought XRP.

The third-largest cryptocurrency by market cap pushed past $0.31 and even $0.32, ultimately reaching $0.3275 as the top of the move. As it could not sustain itself above the $0.32 level, XRP fell below it and started a consolidation/confirmation period right between $0.31 and $0.32.

Traders can look for a trade after XRP moves towards $0.32 to break it or towards $0.31 to test the support level.

XRP/USD 4-hour Chart

Technical factors:
  • Price is currently above the 21-period and 50-period EMA
  • Price is slightly below the top B.B.
  • RSI is elevated (63.26)
  • Average volume (two-candle spike)
Key levels to the upside          Key levels to the downside

1: $0.32                                     1: $0.31  

2: $0.332                                   2: $0.285

                                                3:$0.266


Categories
Crypto

Top Four Reasons to Trade Cryptocurrencies

Have you ever wondered if trading cryptocurrency is a good investment? Lately, this type of currency has been growing in popularity and more and more traders have found themselves adding it to their portfolio. There are several reasons why traders invest in cryptocurrency, from predictions about the future to privacy concerns. It is important for new investors, or even intermediate traders that have never invested in this type of asset to understand the reasons why investing is worthwhile.

Cryptocurrency is the Future

At least, many traders believe so. There are some obvious issues with the world’s financial system and many traders think that cryptocurrency can solve those problems by providing us with a more efficient solution. However, there are currently more than 2,000 different cryptocurrencies available. The common idea is that many of these providers will fade over time and we will be left with a few of the most popular options in the end. Bitcoin and Ethereum are worthy competitors that will likely stand the test of time. One should also consider that each provider isn’t working with the same goals in mind. This could help to keep some of those smaller providers afloat.

Privacy

Privacy is one of the main draws of using cryptocurrency. Where banks require personal information, cryptocurrency allows one to make transactions anonymously. Previously, it was discovered that Bitcoin was being used for illicit transactions, such as buying drugs or illegal online services. Although we wouldn’t recommend taking part is this type of activity, this follows the idea that people should be able to spend their money how they want to. Many people want privacy and don’t want banks to be able to track where or how they spend their money, regardless of how vanilla their practices might be.

Avoiding National Banks

Many Americans do not find central banks trustworthy, especially those that lived through the great depression. Banks can manipulate currency, charge insane overdraft fees, or various other fees and interest rates. Intermediary fees are often charged on transactions that need to be sent overseas as well, which cost many traders a lot of money in the long run.

The 2008 crash inspired Bitcoin as an alternative method for those that distrust the banking system. Of course, there are some that prefer to stick with the tried and true method of traditional banking because they know how it works. Many older people would rather not bother with learning how to use a whole new type of currency. However, as time moves forward, the older generation will be made up of those of us that understand the way this currency works, and it will likely grow in popularity.

Volatility

Cryptocurrency is more volatile than other markets, which provides traders with more opportunities to enter and exit the market. There’s money to be made thanks to the large rises in value, but one should remember that the value can also drop significantly as well. Some events will influence these prices, so investors need to stay on top of the news and keep anything that might affect any cryptocurrency’s value in mind.

The Bottom Line

Bitcoin very well might be the way of the future, as more traders move away from traditional banking methods in favor of a more efficient, private way to make transactions online. Volatility in this market can also provide traders with more chances to enter or exit trades, and there is a chance to make large gains thanks to cryptocurrency’s occasional high rises in value. Of course, nobody should feel pushed to embrace cryptocurrency. It isn’t an entirely perfect system and it can fall victim to scammers. Volatility can also cause losses rather than gains because trading this type of currency is risky. In the long-run, we do believe that cryptocurrency will continue to rise in popularity and value, so traders should seriously consider investing with good education and a wealth of trading knowledge behind them.

Categories
Crypto Market Analysis

Daily Crypto Review, August 17 – DeFi Craze Continues: More BTC Tokenized Than Mined

The cryptocurrency market spent most of its weekend consolidating, with only a couple of cryptocurrencies moving significantly. Bitcoin is currently trading for $11,817, which represents a decrease of 0.64% on the day. Meanwhile, Ethereum lost 1.27% on the day, while XRP lost 0.47%.

 Daily Crypto Sector Heat Map

When talking about top100 cryptocurrencies, OMG Network gained 50.69% on the day, making it the most prominent daily gainer. Waves (26.69%) and Ren (24.74%) also did great. On the other hand, Quant lost 6.55%, making it the most prominent daily loser. It is followed by Divi’s loss of 5.80% and Ampleforth’s drop of 5.08%.

Top 10 24-hour Performers (Click to enlarge)

Bottom 10 24-hour Performers (Click to enlarge)

Bitcoin’s dominance level has decreased slightly and dropped under the 60% mark, with its value currently at 59.17%. This value represents a 0.91% difference to the downside when compared to our last report.

Daily Crypto Market Cap Chart

The cryptocurrency market cap experienced a slight increase in value over the weekend. Its current value is $373.40 billion, which represents an increase of $5.33 billion when compared to our previous report.

_______________________________________________________________________

What happened in the past 24 hours?

_______________________________________________________________________

_______________________________________________________________________

Technical analysis

_______________________________________________________________________

Bitcoin

Bitcoin was on a slightly upward slope over the course of the weekend, trying to reach $12,000 before attempting a strong push. The largest cryptocurrency by market cap saw good support in the 21-period moving average, which kept it on its path. The descending RSI and incredibly low volume indicate that the cryptocurrency will move very soon. Meanwhile, Bitcoin’s hashrate reached its new all-time high of 129 EH/s.

BTC traders should look for a trade when a volume spike happens.

BTC/USD 4-hour Chart

Technical factors:
  • Price is above its 50-period EMA and its 21-period EMA
  • Price is at its middle B.B
  • RSI is neutral (52.88)
  • Volume is decreasing (Low)
Key levels to the upside          Key levels to the downside

1: $12,000                                1: $11,630

2: $12,300                                2: $11,460

                                                 3: $11,090

Ethereum

Unlike Bitcoin, Ethereum was not moving slow throughout the weekend. After breaking the $415 mark, Ethereum needed to consolidate above it and show strength, which it did. The second-largest cryptocurrency by market cap retested its support (successfully) and is now safely at the $425 mark.

Traders should look for a trade when ETH regains volume.

ETH/USD 4-hour Chart

Technical Factors:
  • Price is currently above its 21-period and its 50-period EMA
  • Price is above its top B.B.
  • RSI is neutral (52.85)
  • Volume is below average
Key levels to the upside          Key levels to the downside

1: $445                                      1: $415

2: $496                                     2: $400

                                                  3: $361

Ripple

XRP spent its weekend consolidating between the $0.285 and $0.31 support and resistance levels. Low volatility, as well as volume, made XRP virtually untradeable over the course of the weekend. However, as much as XRP doesn’t seem like it doesn’t have the strength to push through $0.31 by itself (without Bitcoin moving first), the state it is currently in is still more bullish than bearish.

Traders can look for a trade after XRP increases its volume and heads towards $0.31.

XRP/USD 4-hour Chart

Technical factors:
  • Price is currently above the 21-period and 50-period EMA
  • Price is between its middle and top B.B.
  • RSI is neutral (55.30)
  • Low volume
Key levels to the upside          Key levels to the downside

1: $0.31                                     1: $0.285  

2: $0.32                                     2: $0.266

3: $0.245


Categories
Crypto Market Analysis

Daily Crypto Review, August 14 – ETH Price Skyrocketing; BitMEX Implementing KYC Procedures

The cryptocurrency market had mad a slight rally in the past 24 hours, with Ethereum leading the way with a price gain of almost 8%. Bitcoin is currently trading for $11,723, which represents an increase of 1.33% on the day. Meanwhile, Ethereum gained 7.61% on the day, while XRP gained 4.96%.

 Daily Crypto Sector Heat Map

When talking about top100 cryptocurrencies, Waves gained 36.29% on the day, making it the most prominent daily gainer. Algorand (34.02%) and Reserve Rights (25.27%) also did great. On the other hand, Ampleforth lost 14.74%, making it the most prominent daily loser. It is followed by Aragon’s loss of 12.46% and yearn.finance’s drop of 11.04%.

Top 10 24-hour Performers (Click to enlarge)

Bottom 10 24-hour Performers (Click to enlarge)

Bitcoin’s dominance level has decreased slightly since we last reported, with its value currently at 60.08%. This value represents a 0.76% difference to the downside when compared to yesterday’s value.

Daily Crypto Market Cap Chart

The cryptocurrency market cap experienced an increase in value since we last reported. Its current value is $368.07 billion, which represents an increase of $9.15 billion when compared to yesterday’s value.

_______________________________________________________________________

What happened in the past 24 hours?

_______________________________________________________________________

_______________________________________________________________________

Technical analysis

_______________________________________________________________________

Bitcoin

Bitcoin spent the day trying to get back near $12,000 after a day of consolidation. Its price made a sharp move towards the upside and broke the $11,630 resistance level, but stopped at $11,850 and then started to retrace. This retracement is most likely a test of the newly-passed resistance (now support). If Bitcoin’s price holds up above it, there is a good chance that we can see another move towards the $12,000 mark in the near term.

BTC traders should look for an opportunity when BTC spikes after the confirmation of its position.

BTC/USD 4-hour Chart

Technical factors:
  • Price is currently above its 50-period EMA and its 21-period EMA
  • Price is above its middle B.B
  • RSI is neutral (54.81)
  • Volume is decreasing
Key levels to the upside          Key levels to the downside

1: $12,000                                1: $11,630

2: $12,300                                2: $11,460

                                                 3: $11,090

Ethereum

Ethereum is the star of the day, as its price has skyrocketed over the course of the last 24 hours. The second-largest cryptocurrency by market cap saw a massive increase in volume while its price went from below-$400 levels all the way up to $432. Ethereum is now consolidating at around $420 and trying to test the $415 support level.

Traders should look for a trade when Ethereum confirms its position above $415 (or fails to do so).

ETH/USD 4-hour Chart

Technical Factors:
  • Price is above its 21-period and its 50-period EMA
  • Price is above its top B.B.
  • RSI is overbought (71.94)
  • Volume is average (one-candle spike)
Key levels to the upside          Key levels to the downside

1: $415                                     1: $$400

2: $496                                     2: $361

                                                  3: $340

Ripple

XRP had a great day and outperformed Bitcoin as well. The third-largest cryptocurrency by market cap ended up gaining almost 5% on the day after breaking above the $0.285 resistance level. As we noted in our previous report, breaking this level is key to pushing further towards the upside, and XRP’s future moves towards $0.31 are a bit more realistic now. However, for the time being, the current progress got stopped by the top B.B. at $0.3, and XRP started consolidating and (possibly) testing $0.285 as support.

Traders can look for an opportunity right after XRP increases in volume and heads towards $0.31.

XRP/USD 4-hour Chart

Technical factors:
  • Price is above the 21-period and 50-period EMA
  • Price is between its middle and top B.B.
  • RSI is neutral (57.75)
  • Low volume
Key levels to the upside          Key levels to the downside

1: $0.31                                     1: $0.285  

2: $0.32                                     2: $0.266

3: $0.245


Categories
Crypto Guides

What Is Crypto Arbitrage Trading?

Introduction

Arbitrage is known as ARB, and this trading technique is used to facilitate the purchase and sale of similar assets simultaneously. This offers traders the opportunity to gain profits from different price levels. This form of trade acquires profit by leverage market inefficiencies. So if there is a price difference between identical securities in various markets, we get winning opportunities. This is a great method to gain risk-free profit from discrepancies in prices. While this method comes to determining the ideal arbitrage opportunities and implementing it efficiently is quite challenging.

There are two types of crypto arbitrage:

Regular Arbitrage

It refers to purchasing and buying the same digital assets on various exchanges with considerable price differences.

Triangular Arbitrage

It encompasses price differences between three currencies on the same exchange. Traders to leverage the price difference through various conversions.

Although both approaches can be highly profitable, there are more challenges to identify opportunities for triangular arbitrage. Moreover, a large volume of trading on a similar exchange may qualify the trader for competitive fees, resulting in a positive impact on the profits.

Arbitrage Trading in the Crypto Market

While the concept remains the same, it involves different assets. There are hundreds of exchanges operating across the globe that allow people to purchase cryptocurrencies. Cryptocurrency prices are constantly changing across different exchanges. There are many social, political, and economic reasons that contribute to these changes. Arbitrage trading in this landscape is quite straightforward and depends on determining profitable paths.

Identifying the Right Path in Arbitrage Trading Paths

Arbitrage trading is extremely sensitive to time. Variations in the prices are temporary in nature. Potential trading profits generally stand between 1% and 6% per transaction. Therefore, traders need to leverage the right arbitrage software and tools to scan and monitor the market in real-time.

The opportunity for the cryptocurrency is calculated by determining the overlap between the lowest ask prices and the highest bid prices. So when the price of the bid is higher in one exchange than the asking price on another crypto exchange, this is designed as an arbitrage opportunity. Similar to any other method of crypto trading, there are certain risks associated with it. But people have created different strategies to mitigate the risks as much as possible.

Advantages of Crypto Arbitrage Trading

💰 With the right profit, it is a credible way to boost the capital. Similarly, it is all about speed, and you will make money quicker with regular trades.

💰 Most exchanges do not share and operate on their own. Typically, cryptocurrencies experience many rapid rises and sudden falls, resulting in price disparities and profitable arbitrage potentials.

💰 There are over 200 exchanges where you can purchase and sell cryptocurrencies. This means there are tons of profitable arbitrage opportunities.

Contrary to the market speculations, crypto arbitrage has witnessed massive success. It has proven a way to make some extra money without putting much effort. Considering that digital money is not subjected to social influences, and no-one controls them, people are highly inclined towards their potentials to increase in value in the near future.

Categories
Crypto Market Analysis

Daily Crypto Review, August 13 – Crypto Loans Entering the Market; Bitcoin Temporarily Stuck at $11,600

The cryptocurrency market had a day where almost no cryptocurrencies ended up in the red. Even though the gains were mostly small, only five cryptocurrencies lost in the past 24 hours. Bitcoin is currently trading for $11,582, which represents an increase of 1.88% on the day. Meanwhile, Ethereum gained 4.37% on the day, while XRP gained 1.11%.

 Daily Crypto Sector Heat Map

When talking about top100 cryptocurrencies, Numeraire gained 161.01% on the day, making it the most prominent daily gainer. Aragon (90.43%) and BitShares (41.67%) also did great. On the other hand, Divi lost 4.38%, making it the most prominent daily loser. It is followed by Compound’s loss of 2.5% and Aave’s loss of 1.85%.

Top 10 24-hour Performers (Click to enlarge)

Bottom 10 24-hour Performers (Click to enlarge)

Bitcoin’s dominance level has decreased slightly since we last reported, with its value currently at 60.84%. This value represents a 0.53% difference to the downside when compared to yesterday’s value.

Daily Crypto Market Cap Chart

The cryptocurrency market cap experienced a major increase in value since we last reported. Its current value is $358.92 billion, which represents an increase of $13.32 billion when compared to yesterday’s value.

_______________________________________________________________________

What happened in the past 24 hours?

_______________________________________________________________________

_______________________________________________________________________

Technical analysis

_______________________________________________________________________

Bitcoin

After a day of sharp decline, Bitcoin spent the day trying to restore the lost value. However, while the largest cryptocurrency by market cap did gain a few percent and rose to $11,600 levels, the $11,630 resistance seems to be holding the price in place quite well. Bitcoin will need to pass this level confidently (and soon), or BTC bears will consider this the start of a bear move.

BTC traders should look for an opportunity when BTC crosses $11,630.

BTC/USD 4-hour Chart

Technical factors:
  • Price is currently below its 50-period EMA but above its 21-period EMA
  • Price is slightly above its middle B.B
  • RSI is neutral (48.49)
  • Volume is decreasing
Key levels to the upside          Key levels to the downside

1: $11,630                                 1: $11,460

2: $12,000                                 2: $11,090

3: $12,300                                  3: $10,850

Ethereum

Ethereum had a slightly better day than its rival Bitcoin in terms of gains, as it returned to the level it was on the night before the selloff. However, the $400 level seems like it has great resistance, and it is yet unknown whether ETH will be able to break it. The move that will break $400 needs to be extremely strong, and it will most likely be caused by BTC’s move to the upside.

Traders should look for an opportunity when Ethereum breaks $400 or collapses after failing to do so.

ETH/USD 4-hour Chart

Technical Factors:
  • Price is above its 21-period EMA and its 50-period EMA
  • Price is between its middle and top B.B.
  • RSI is elevated (58.91)
  • Volume is average
Key levels to the upside          Key levels to the downside

1: $400                                     1: $361

2: $415                                     2: $340

3: $496                                      3: $302

Ripple

Unlike Bitcoin and Ethereum, XRP did not have such a good day today. The third-largest cryptocurrency by market cap did end up in the green on the day, but it failed to break the $0.285 level. Breaking this level is key to pushing further towards the upside, but the 21-period and 50-period moving average are also above the price and very near $0.285, making it incredibly difficult for XRP to move towards the upside.

Traders can look for an opportunity right after XRP breaks $0.285.

XRP/USD 4-hour Chart

Technical factors:
  • Price is below its 21-period and 50-period EMA
  • Price is slightly below its B.B.
  • RSI is neutral (42.19)
  • Low volume
Key levels to the upside          Key levels to the downside

1: $0.285                                    1: $0.266  

2: $0.31                                     2: $0.245

3: $0.32                                    3: $0.235


Categories
Crypto Cryptocurrencies

Should You Be Trading Ripple?

Although Ripple often finds itself labeled as a cryptocurrency like Bitcoin or Ethereum, it is important for investors to understand that Ripple extends beyond that label. The payment method Ripple uses is called RippleNet and the currency is called RippleXRP. The payment system interconnects banks with other financial institutions and allows them to transfer money or assets through the network. There are several reasons why many new banks are considering Ripple for the future, but there are also some reasons why one might need to be cautious before investing. Read on to find out the pros and cons of investing in Ripple.

Reasons to Invest:

Ripple uses faster technology that can really speed along cross-border transactions, which would typically take a week or more to clear through traditional banking.

Ripple’s payment protocols make it a secure and traceable way to send funds.

Although Ripple hasn’t attracted many big users, several banks plan on testing it soon and it will likely grow in popularity.

Those that invest early will make a large profit as more banks invest and drive up the coin’s value.

The price of Ripple is lower than that of Bitcoin or Ethereum.

Ripple’s focus was to be used by banks and it was started as an organization. This helps it to avoid regulation checks imposed on many other cryptocurrencies.
All of Ripple’s tokens are already mined so there is no inflation.

Reasons Not to Invest:

Ripple’s tokens are already mined, so the developers can decide when and how much to release. Or they can choose not to release. This is somewhat like investing in a bank.

Another con to the pre-mined coins is that all of Ripple’s coins already exist. This means that the developers own about 61% of them.

Ripple uses an open-source code that might attract some hackers. It is considered secure, but top-notch hackers might try to manipulate that system.

Ripple is often criticized because many big banks don’t seem to be interested. Its biggest rival would be SWIFT, which is used by more than 11,000 banks worldwide.

Conclusion

Ripple’s value is expected to increase as time goes on and coins become scarcer, thanks to supply and demand. It doesn’t have many financial institutions behind it at this point, but many are considering testing or using Ripple in the future. This means that it is prime time for early birds to invest to make a good profit as the cryptocurrency gains more supporters. Ripple’s pre-mined coins stop inflation, although this has resulted in the developers owning more than half of the currency with the ability to choose how much to release. While SWIFT is a big rival to beat, Ripple’s super-fast transaction capabilities and secure payment protocols will help it become more recognized as we move towards a more efficient future.

Categories
Cryptocurrencies

Citowise Crypto Wallet Review: Features, Safety, Pros and Cons?

If you are looking for a free and secure cryptocurrency wallet/payment solution provider, consider Citowise. This multi-currency crypto wallet premiered as a free digital wallet software and supported various platforms that allow easy use of cryptocurrencies. Citowise is also regarded as very secure, providing a transparent payment method for e-commerce.

Citowise crypto wallet is designed to offer private and business customers an easy way to empower the mainstream adoption of cryptocurrency. It is beginner-friendly and requires no technical knowledge to operate. Simply download your wallet, set up your account, and begin using existing platforms to sell and purchase supported cryptocurrencies.

The wallet was launched back in 2016 with one mission in mind: to create a secure blockchain infrastructure and ensure ordinary users understand the technology. One of the founders fell victim to a crypto hack while the other wasn’t awarded deserved coins after participating in an ICO. The third founder encountered problems sending crypto to a relative—the three set their sight on creating a solution that covered these and more challenges crypto users face daily.

Key Features:

Multiplatform:

Citowise provides free crypto wallets for both Android and iOS platforms, which are the most popular phones in the market. It is also compatible with Linux and Mac platforms and provides full support for Ledger cold storages and TREZOR.

Export/backup:

You can export or backup your digital wallet, which is recommended for security purposes. To do this, open your Citowise wallet through your phone or PC and navigate to the Wallet screen. Click on the wallet and select Export from the menu that comes up. Follow the remaining prompts to finish exporting your wallet.

Import wallet:

You can import your wallet back to Citowise and continue from where you left. Go to your Citowise wallet and navigate to the Wallet screen. Click on the button with a + sign appearing on the bottom right corner and follow the remaining prompts to import your wallet.

Integrated exchange:

Citowise provides a user-friendly interface that allows you to convert one crypto to another within the wallet. You get to pick your preferred integrated exchange, and the platform supports quite a number. Citowise can also transfer all your ERC20 tokens out-of-the-box.

Buy Cryptocurrency:

Within the Citowise simple user interface, there’s a feature for purchasing cryptos at the lowest market prices, directly from the wallet. This complements the integrated exchanges you pick for your crypto transactions. You don’t need any technical knowledge about blockchain networks to buy cryptocurrencies.

ICO:

This section offers a unique experience for users that want to claim coins from ICO campaigns. It comes with its set of features and possibilities.

Security features:

i) Password: Citowise requires each wallet owner to use a strong password that is hard to guess. Without a strong password, people with access to your devices can export the wallet and access the funds using another device. You can use the recommended Citowise password or create one with a variety of characters.

ii) Encrypted channels: Data processed by Citowise use encrypted channels to prevent external breaches. This ensures transactions are secure and accurate. The platform uses the latest cryptography technologies and security algorithms to keep hackers at bay. No history of a breach has been reported since launch. SSL certificates and regular scans also add a layer of security.

iii) Ad-Hoc payments: Citowise dispenses payments on a discretionary basis, ensuring investor and trader confidence. Ad-Hoc payments also guarantee privacy. However, users must ensure safe practices to prevent others from accessing their details and passwords.

iv) Instant notifications: Users will get timely information for any changes that occur in the network, so you can react quickly in case of anything. You can also request a report on your statement for personal audits.

v) Encrypted hardware: The Citowise hardware wallet features the latest encryption technology to keep hackers at bay. All you need to do is set up a strong password for your account.

Citowise user-friendly interface:

Citowise employs advanced technologies to provide a sleek, user-friendly interface with all the features you need within a click’s reach. The simple design appeals to both new users and older folks with little to no background in crypto wallets. Wallet users have total monetary control and can enjoy fast transactions and customer service. The site also includes links to various resources with more insights regarding the wallet. The hardware wallet is also secured using advanced encryption and very easy to use.

Supported currencies and countries

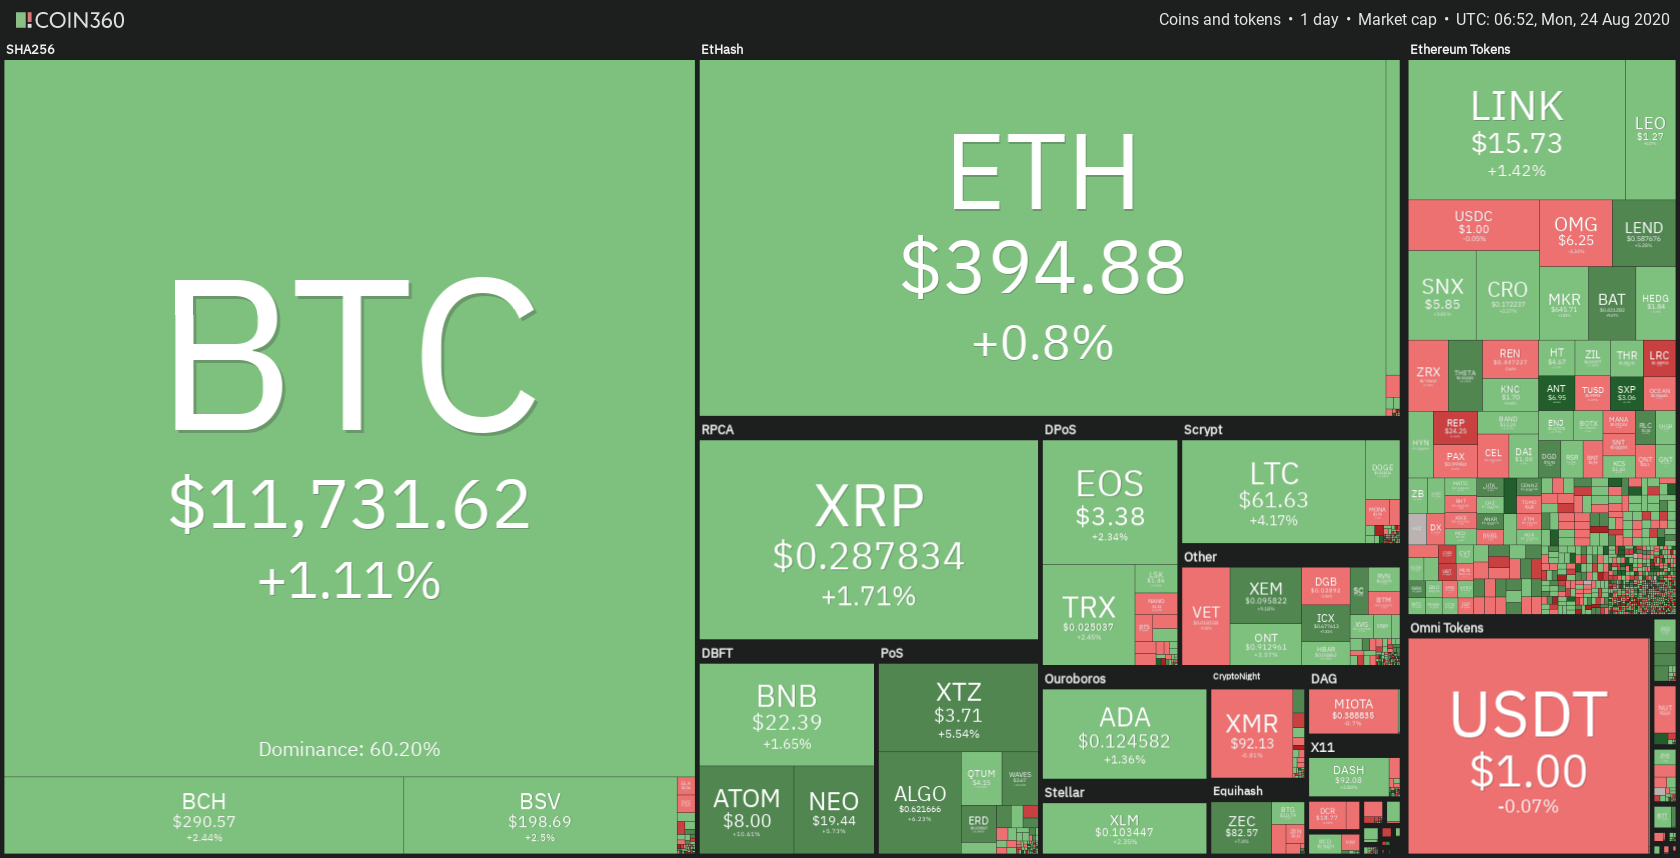
Citowise supports numerous cryptocurrencies and tokens than most crypto wallets. The platform accommodates all the 55,000+ tokens compatible with ERC20 standards. The most popular coins include BTC, ETH, LTC, BCH, VEN, EOS, TRX, and OMG.

Citowise also supports more than 1000 ETC coins and is available as a mobile app. The platform has offered financial solutions for 23 million+ companies in over 200 countries. All countries in the Eurozone are supported, and the number of currencies keeps growing, so it is advisable to check the information on the official site.

Citowise cost and fees

Setting up your Citowise wallet won’t cost a cent as the platform is free. No fee is charged for installing the wallet or using any integrated feature. Citowise is generally considered one of the budget-friendly digital wallets and charge the lowest fees in the market. The platform also scans all exchanges to minimize transaction costs.

While Citowise is free to use, network miners that verify and confirm transactions have their fees based on the network, transaction volume, speed of confirmation, and other factors. For instance, if you want speedy transactions from a system known to provide swift confirmations, you may pay a higher fee. The networks also have other restrictions, including limits on maximum and minimum transactions.

Customer support

Citowise offers various customer support channels to assist users in navigating all challenges they encounter using the wallet. A resourceful FAQ section provides insights concerning common questions, and the contact tab allows you to send an email describing your issue. Response time is fast compared to other wallets, and you can also reach the support team via social networks.

Setting up the Citowise crypto wallet

Step 1: Download and Install the Citowise app

To use Citowise, you need to download and install the wallet on your device. Citowise comes as a mobile app you can install on Android and iOS platforms. Head to the respective stores (Google Play and App Store) to download the wallet. They are also available on the homepage.

Step 2: Set up the wallet

Once you have the app installed on your device, launch it to set up your wallet. Like most crypto wallets, Citowise will require a unique wallet name and password. Enter and follow the prompts to create a wallet. You will be asked to back up the wallet, but this is optional, and you can do it later. However, it takes less than a minute to complete the backup.

Step 3: Enjoy Citowise

Once created, your Citowise wallet is ready for use. You can buy/sell cryptocurrencies, send and receive funds, and enjoy all the functionalities provided in the app. Citowise gives you total monetary control, so there’s a lot you can do with your account.

How to send currencies with Citowise

Step 1: Launch your Citowise app and log in. Click on balance on the bottom of the screen to see how much crypto you have.

Step 2: Click on the crypto balance you have and then Send Payments. Clicking on the Send icon that’s beside the Balance icon will also take you to the same page.

Step 3: Choose the recipient of the funds you are sending. You can do this by clicking on a contact list, using a QR code, or typing the wallet URL. Click Proceed.

Step 4: Enter the amount you wish to transfer in the To Pay section and click Proceed.

Step 5: Check if everything is okay and click the blue Send Payment button to send cryptocurrency. If you entered the wrong amount or address, click the back arrow to correct before submitting it.

How to receive currencies with Citowise

Step 1: Launch your Citowise mobile app and log in. Click on the Request icon on the bottom of the screen.

Step 2: In the request payment window, enter the amount you want to receive. You can change the cryptocurrency by clicking on the small arrow beside the current crypto. Converter and Setup Hint buttons also offer extra functionality on the window. Fill the description section for the request and input the wallet URL (the wallet you are requesting payments from). You can also request using QR code or sharing your URL.

Step 3: Check if all details are correct and click on Request Payment to ask for funds. Once the request is sent, the recipient will get a prompt notification on their app, and funds are added automatically when they pay.

Citowise supported currencies

Citowise supports various cryptocurrencies, but you will only have a few options to choose from during the account setup. The popular currencies supported include:

  • Bitcoin
  • Litecoin
  • Ethereum Classic
  • Ether
  • Bitcoin Cash
  • POA
  • Citowise Token

The wallet also supported various fiat currencies, including the Dollar (Canadian, Australian, and the US), Euro, British Pound, Swiss Franc, Chinese Yuan, Japanese Yen, Indian Rupee, Korean Won, and Russian Ruble.

Buying and selling crypto with Citowise

Citowise allows users to buy and sell cryptocurrencies, taking advantage of the best rates in the market. To buy and sell crypto, simply click on the three-row lines appearing on the top right corner and select Buy/Sell Crypto. This will open a service page where you can choose the preferred option. Some providers buy crypto while others sell, so choose accordingly. Specify the amount you want to buy or sell and trigger the request following the prompts given. Ensure you select the correct currency before buying or selling crypto.

How does Citowise compare with other wallets?

Citowise vs. eToro

Both Citowise and eToro are great crypto wallets you can use to accomplish various transactions. Citowise offers a simple interface and navigation. They also provide impressive ICO campaigns. Concerning features and functionality, Citowise and eToro don’t reflect much difference. However, eToro supports 120 different cryptos, which is way above the seven options available on Citowise. The wallets are both secure and relatively cheap, compared to other top-rated options.

Citowise vs CoolWallet S

CoolWallet S is a premium crypto wallet with advanced security features. Like Citowise, a hardware wallet is available for interested users. This obviously comes at a fee, but you get to enjoy top-notch security. CoolWallet S supports 22 cryptocurrencies, which is still above Citowise. However, this is nothing compared to wallets such as Ledger Nano S, which supports more than 1000 cryptos.

Pros and Cons of Citowise crypto wallet

Pros

  • Free secure crypto wallet available for mobile users
  • No transaction charges or subscriptions
  • Participate in ICO campaigns
  • Send, receive, buy or sell crypto easily
  • Choose from a wide variety of exchanges
  • Supports FIAT currency and in-app conversions
  • User-friendly interface appealing to both beginner and experienced crypto-traders

Cons

  • Supports fewer cryptocurrencies than most wallets
  • Very few service providers in the Buy/Sell Crypto section
  • Only available for mobile platforms

Final words

Citowise is an excellent mobile wallet you can use to facilitate various transactions. It allows you to exchange and convert cryptocurrencies and permits buying and selling of the same. You can also access popular FIAT currencies, pay for goods and services, or request invoice payments.

As a payment method, Citowise is safe and convenient to use, boasting a sleek interface with beginner-friendly navigation. Every important feature is within a click’s reach, and the mobile app is light on your device. If you are looking for a reliable, secure mobile crypto wallet, Citowise is worth a try. However, the platform could do better with support for more cryptocurrencies. Currently, users can only access a few popular options.

Categories
Forex Videos

Ethereum’s Adoption Rate Exceeding Bitcoin!

Ethereum’s Adoption Rate Exceeds Bitcoin’s Rate After 5 Years


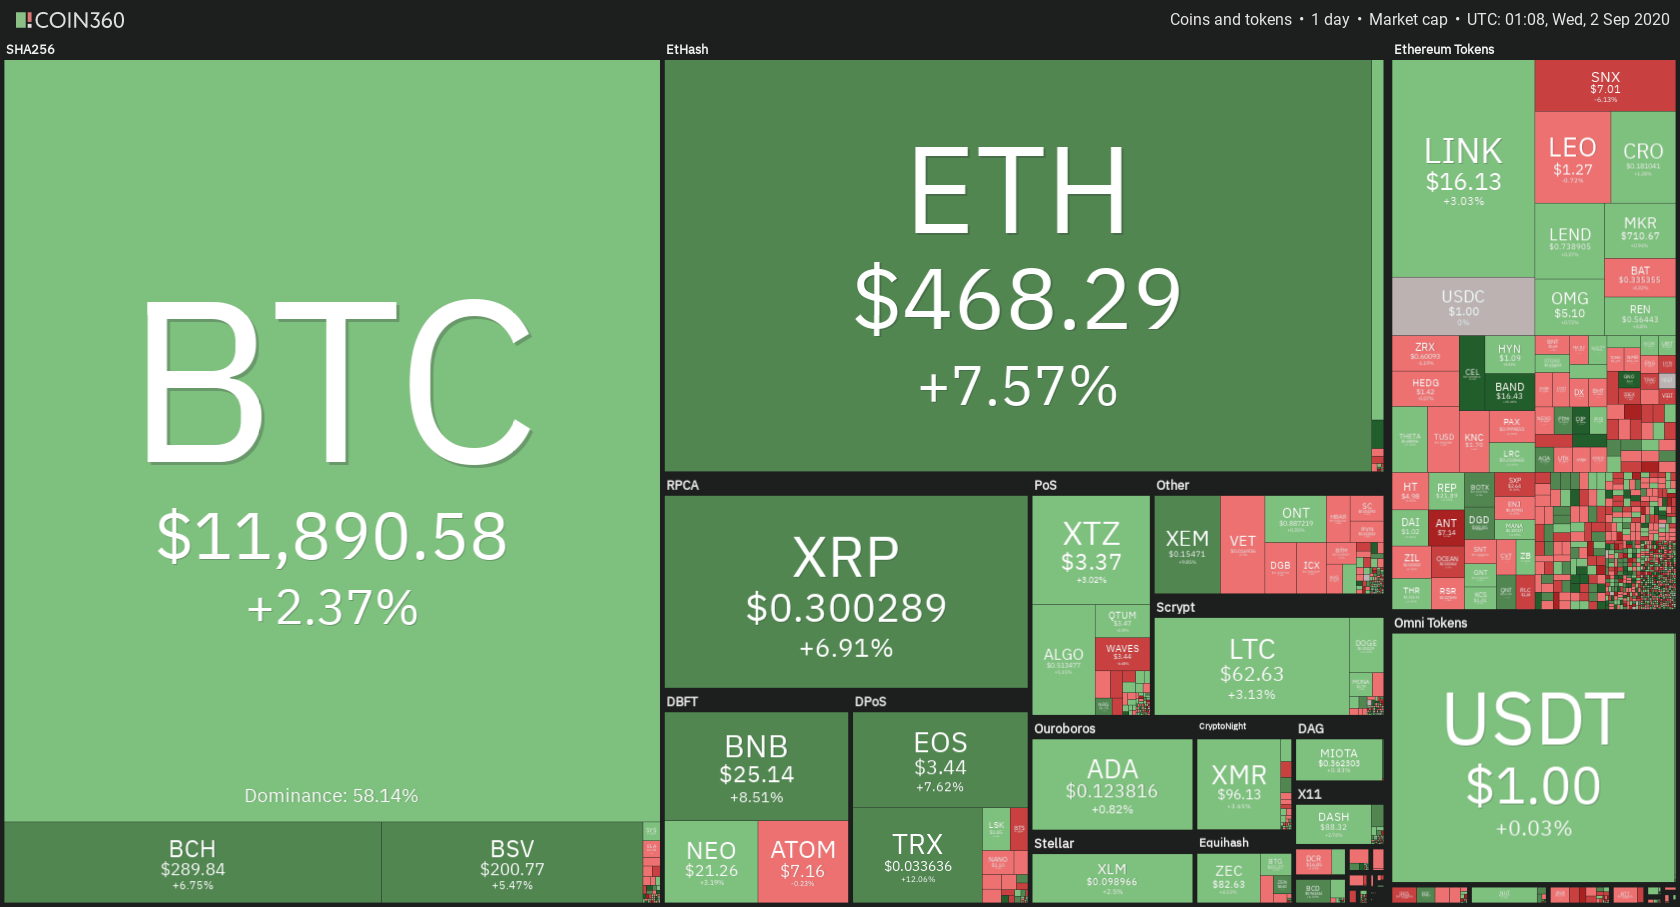
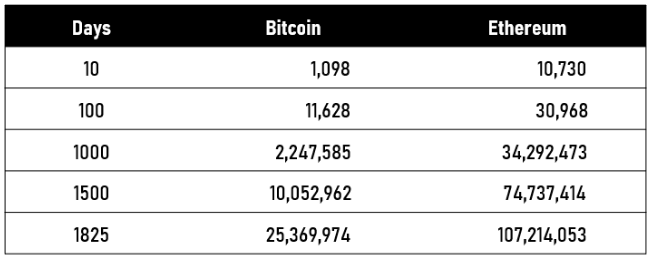
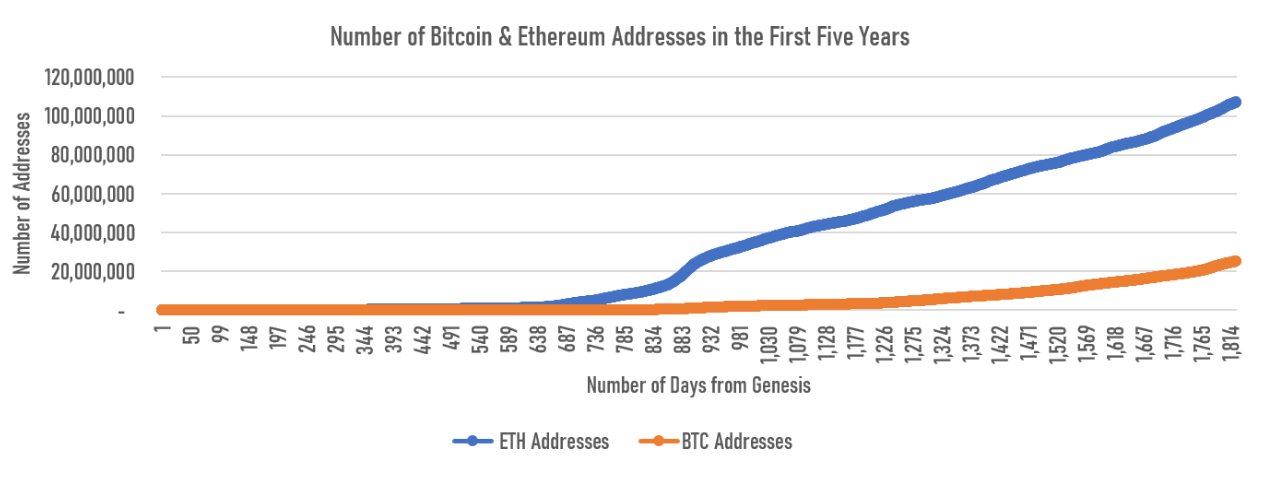
One key metric suggests that Ethereum has enjoyed a much faster adoption rate as well as the growth rate in the first five years of its existence than Bitcoin.
When comparing the total number of addresses created in the first five years on both Ethereum and Bitcoin, it’s easy to see that the second-largest cryptocurrency by market capitalization takes the win.

However, while the number of addresses could be considered a good gauge of the adoption rate, it may not be as perfect as it sounds. One reason for that is that the accounting systems are different.

Key differences


The growth rate for both BTC and ETH networks is quite similar in the first 600 days. However, by mid-2017, Ethereum’s curve became much steeper as a result of the ICO boom and the creation of thousands of ERC20 tokens on the Ethereum protocol.
Another advantage that Ethereum had over Bitcoin from the beginning is that, while Bitcoin was the tech that introduced crypto to the world, Ethereum walked an already walked path. Bitcoin’s adoption was rather slow and gradual at first as almost no one even know what crypto could bring. The slope of its curve never had an uplift similar to Ethereum’s curve during the ICO boom.

Categories
Crypto Market Analysis

Daily Crypto Review, August 12 – Crypto Selloff Brings Bitcoin to $11,000 Mark; What’s Next?

The cryptocurrency market was in the red in the past 24 hours, with most altcoins’ prices falling down over 5%. Bitcoin is currently trading for $11,375, which represents a decrease of 4.05% on the day. Meanwhile, Ethereum lost 4.84% on the day, while XRP lost 7.59%.

 Daily Crypto Sector Heat Map

When talking about top100 cryptocurrencies, Compound gained 31.08% on the day, making it the most prominent daily gainer. Swipe (16.13%) and Maker (12.37%) also did great. On the other hand, Band Protocol lost 16.42%, making it the most prominent daily loser. It is followed by yearn.finance’s loss of 14.86% and Nervos Network’s loss of 14.41%.

Top 10 24-hour Performers (Click to enlarge)

Bottom 10 24-hour Performers (Click to enlarge)

Bitcoin’s dominance level has increased slightly since we last reported, with its value currently at 61.39%. This value represents a 0.17% difference to the upside when compared to yesterday’s value.

Daily Crypto Market Cap Chart

The cryptocurrency market cap experienced a major decrease in value since we last reported. Its current value is $345.60 billion, which represents an increase of $7.98 billion when compared to yesterday’s value.

_______________________________________________________________________

What happened in the past 24 hours?

_______________________________________________________________________

_______________________________________________________________________

Technical analysis

_______________________________________________________________________

Bitcoin

Bitcoin experienced a large selloff as a result of bulls failing to successfully break the $12,000 mark. The largest cryptocurrency by market cap fell to $11,090 support level before rallying slightly to $11,400 levels. However, Bitcoin might have another bullish move as the RSI is dangerously close to the oversold territory while the volume is high, and since the $11,090 support level held up nicely, Bitcoin confirmed it almost certainly will not go below.

BTC traders should look for an opportunity when BTC makes another move towards the upside and breaks $11,460.

BTC/USD 4-hour Chart

Technical factors:
  • Price is currently below its 50-period EMA, as well as its 21-period EMA
  • Price is above its lower B.B
  • RSI is near the oversold territory (35.52)
  • Volume is decreasing from above-average levels
Key levels to the upside          Key levels to the downside

1: $11,460                                 1: $11,090

2: $11,630                                 2: $10,850

3: $12,000                                  3: $10,500

Ethereum

Ethereum also experienced a selloff, partly because of not being able to go past $400 and partly because of Bitcoin’s move towards the downside. The price broke the triangle formation to the downside (as we said in the previous article) as there was not enough pressure for it to get past the $415 mark. The second-largest cryptocurrency by market cap tested the $361 support, which held up nicely and did not let ETH fall below. Ethereum is now at the $375 mark and is showing no signs of dropping further below.

Traders should look for a trade opportunity when Ethereum makes a bounce towards the upside or falls below $361.

ETH/USD 4-hour Chart

Technical Factors:
  • Price is below its 21-period EMA and its 50-period EMA
  • Price is at its bottom B.B.
  • RSI is near the oversold territory (33.99)
  • Volume is average
Key levels to the upside          Key levels to the downside

1: $400                                     1: $361

2: $415                                     2: $340

3: $496                                      3: $302

Ripple

XRP was no different than Bitcoin and Ethereum in terms of the direction of its movement throughout the day, but it did differ in terms of intensity of the move. The third-largest cryptocurrency by market cap lost over 8% of its value at one point, as bears took over the market when XRP couldn’t break $0.31. The price fell to as low as $0.266 but quickly recovered to its current position ($0.278).

Traders can look for an opportunity to trade after XRP breaks $0.285.

XRP/USD 4-hour Chart

Technical factors:
  • Price is below its 21-period and 50-period EMA
  • Price is slightly above its bottom B.B.
  • RSI is near the oversold territory (35.64)
  • Low volume (slightly increased)
Key levels to the upside          Key levels to the downside

1: $0.285                                    1: $0.266  

2: $0.31                                     2: $0.245

3: $0.32                                    3: $0.235


Categories
Crypto Market Analysis

Daily Crypto Review, August 11 – yEarn Finance Token Explodes After Binance Listing; BTC Hashrate Unaffected by the Price Upswing

The cryptocurrency market tried to catch up to Bitcoin after it pushed up yesterday. Bitcoin is currently trading for $11,938, which represents an increase of 1.26% on the day. Meanwhile, Ethereum gained 1.27% on the day, while XRP lost 4.73%.

 Daily Crypto Sector Heat Map

When talking about top100 cryptocurrencies, yearn.finance gained 50.03% on the day, making it the most prominent daily gainer. JUST (39.71%) and Terra (28.27%) also did great. On the other hand, Balancer lost 13.90%, making it the most prominent daily loser. It is followed by Band Protocol’s loss of 9.52% and iExec RLC’s loss of 6.35%.

Top 10 24-hour Performers (Click to enlarge)

Bottom 10 24-hour Performers (Click to enlarge)

Bitcoin’s dominance level has decreased slightly since we last reported, with its value currently at 61.22%. This value represents a 0.56% difference to the downside when compared to yesterday’s value.

Daily Crypto Market Cap Chart

The cryptocurrency market cap has increased since we last reported. Its current value is $363.58 billion, which represents an increase of $0.89 billion when compared to yesterday’s value.

_______________________________________________________________________

What happened in the past 24 hours?

_______________________________________________________________________

_______________________________________________________________________

Technical analysis

_______________________________________________________________________

Bitcoin

Bitcoin has spent the day trying to regain what’s been lost after the failed attempt to break the $12,000 mark. However, the price doesn’t seem like it will be able to push past this level unless a surge in volume and bull pressure happens. Meanwhile, Bitcoin is locked between $11,630 and $12,000. When it comes to moves towards the downside, Bitcoin is well protected by the 21-period and 50-period moving averages.

BTC traders should look for an opportunity when BTC makes another push and breaks $12,000.

BTC/USD 4-hour Chart

Technical factors:
  • Price is currently above its 50-period EMA, as well as its 21-period EMA
  • Price between its middle B.B (20-period SMA) and its top B.B.
  • RSI is neutral (56.12)
  • Volume is decreasing
Key levels to the upside          Key levels to the downside

1: $12,000                                 1: $11,630

2: $12,330                                 2: $11,460

3: $13180                                   3: $11,090

Ethereum

Ethereum was quite stable in the past 24 hours, making small gains in an attempt to catch up to Bitcoin’s gains that happened yesterday. However, if we take a look at this month’s price movement, we can interpret the moves as a triangle formation, which will make a breakout very soon. It is more likely that the second-largest cryptocurrency by market cap will break the triangle formation towards the downside unless Bitcoin’s move pushes it up.

Traders should look for a trade opportunity when Ethereum breaks the formation.

ETH/USD 4-hour Chart

Technical Factors:
  • Price is above its 21-period EMA and its 50-period EMA
  • Price is slightly below its top B.B.
  • RSI is neutral (56.42)
  • Volume decreasing
Key levels to the upside          Key levels to the downside

1: $400                                     1: $361

2: $415                                     2: $340

3: $496                                      3: $302

Ripple

XRP is the cryptocurrency that gained the most in the past 24 hours (when compared to Bitcoin and Ethereum) as its price increased close to 5% on the day. The third-largest cryptocurrency by market cap made another push towards the $0.31 resistance level, but the move failed to even reach the level, let alone break it.

Traders can look for an opportunity to trade XRP within the range it is currently in.

XRP/USD 4-hour Chart

Technical factors:
  • Price is above its 21-period and 50-period EMA
  • Price is above its top B.B.
  • RSI is slightly elevated (58.52)
  • Low volume (slightly increased)
Key levels to the upside          Key levels to the downside

1: $0.31                                     1: $0.285  

2: $0.32                                     2: $0.266

3: $0.3328                                3: $0.245