Categories
Crypto

What The Experts Aren’t Saying About Forex Vs Crypto Trading

While brokers have always offered the ability to trade in most major and minor currency pairs, the cryptocurrency boom that occurred in 2010 caused many brokers to make the decision to add the most popular currency pairs like Bitcoin, Ethereum, Tether, and Ripple to their offerings. This opens up a world of opportunities to traders that want to invest in both while remaining convenient where you can open one trading account and access both options through most brokers. However, some traders may not completely understand the difference between currency pairs and the somewhat newly introduced cryptocurrency options. Online myths even suggest that cryptocurrency has no real value, which causes some traders to stay away. Regardless of what you’ve heard, you might be wondering which is better to invest in for the year 2021 – the timeless forex pairs, or the newer cryptocurrency options.

What is Forex?

The forex market is a global online foreign exchange market where the exchange rate of two different currencies is quoted and traded against each other. Major currencies include options like the US dollar, the Euro, the Japanese Yen, and the British Pound. When the US dollar is crossed with the Japanese Yen, it is written as USDJPY, while the US dollar crossed with the Euro is written as EURUSD, and so on. You can also trade minor currency pairs, which include any major pair that is not paired with the US dollar, along with exotic pairs from less established countries. Here are a few examples of exotic currencies:

  • The Norwegian Krone
  • The Hungarian Forint
  • The Russian Ruble
  • The South African Rand

When it comes to trading forex, there are pros and cons to think about. Forex involves fiat currencies that are managed by central banks, which typically aim to keep stable exchange rates for their currencies where possible. This makes the forex market less volatile, but traders also need to remember that prices are highly affected by global events. Elections, economic data releases, changes to central bank policy, and macroeconomic events can cause the market to become more volatile. While the forex market is more stable than the cryptocurrency market, it is still unpredictable at times.

Forex trading is also considered to be attractive because brokers are able to offer their services for a relatively low trading cost. Typically, brokers make their profits by charging spread and/or commission on a round trip trade. The average cost of trading the benchmark pair EURUSD is usually around 1 to 1.5 pips, making the cost to trade around 0.08% of the value of the asset being traded. This is significantly lower than the cost of trading cryptocurrency. 

The forex market is also widely available for trading, as market sessions generally go from Monday morning until Friday evening. This is divided into three major sessions: 

  • American
  • European
  • Asian

The wide market hours offer traders greater flexibility when it comes to trading opportunities, although it’s important to remember that the sessions dominated by New York, Tokyo, and London are considered to present the greatest opportunities to trade.

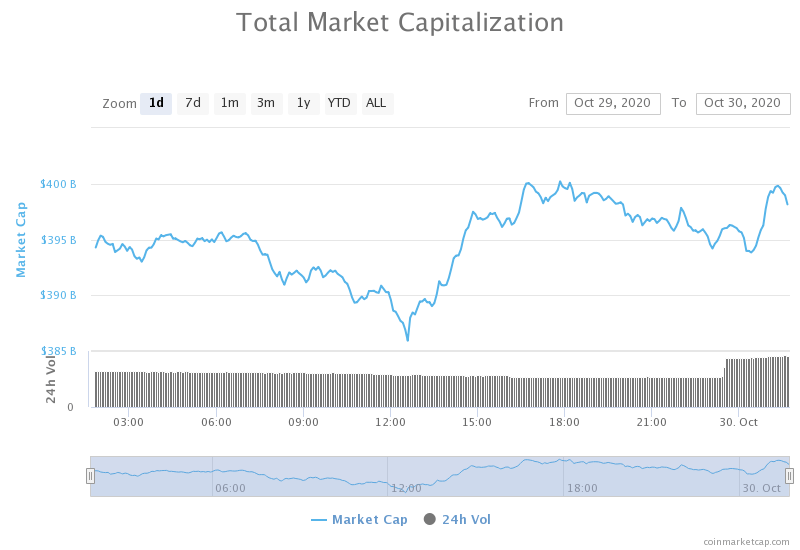
What is Cryptocurrency?

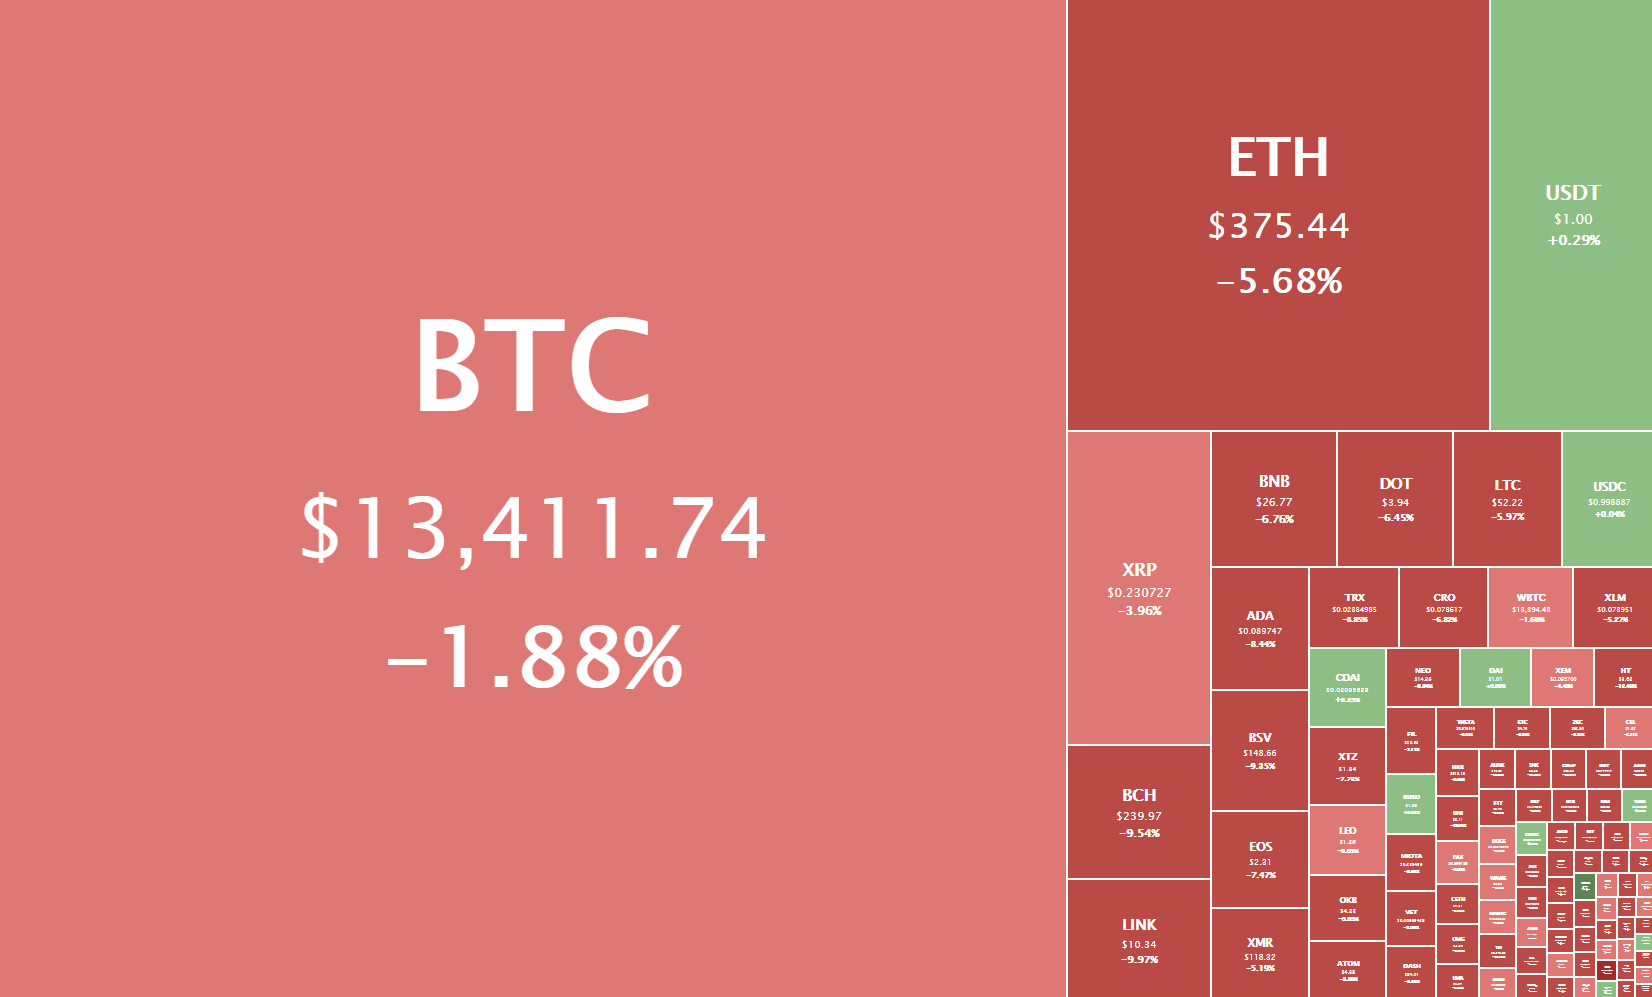
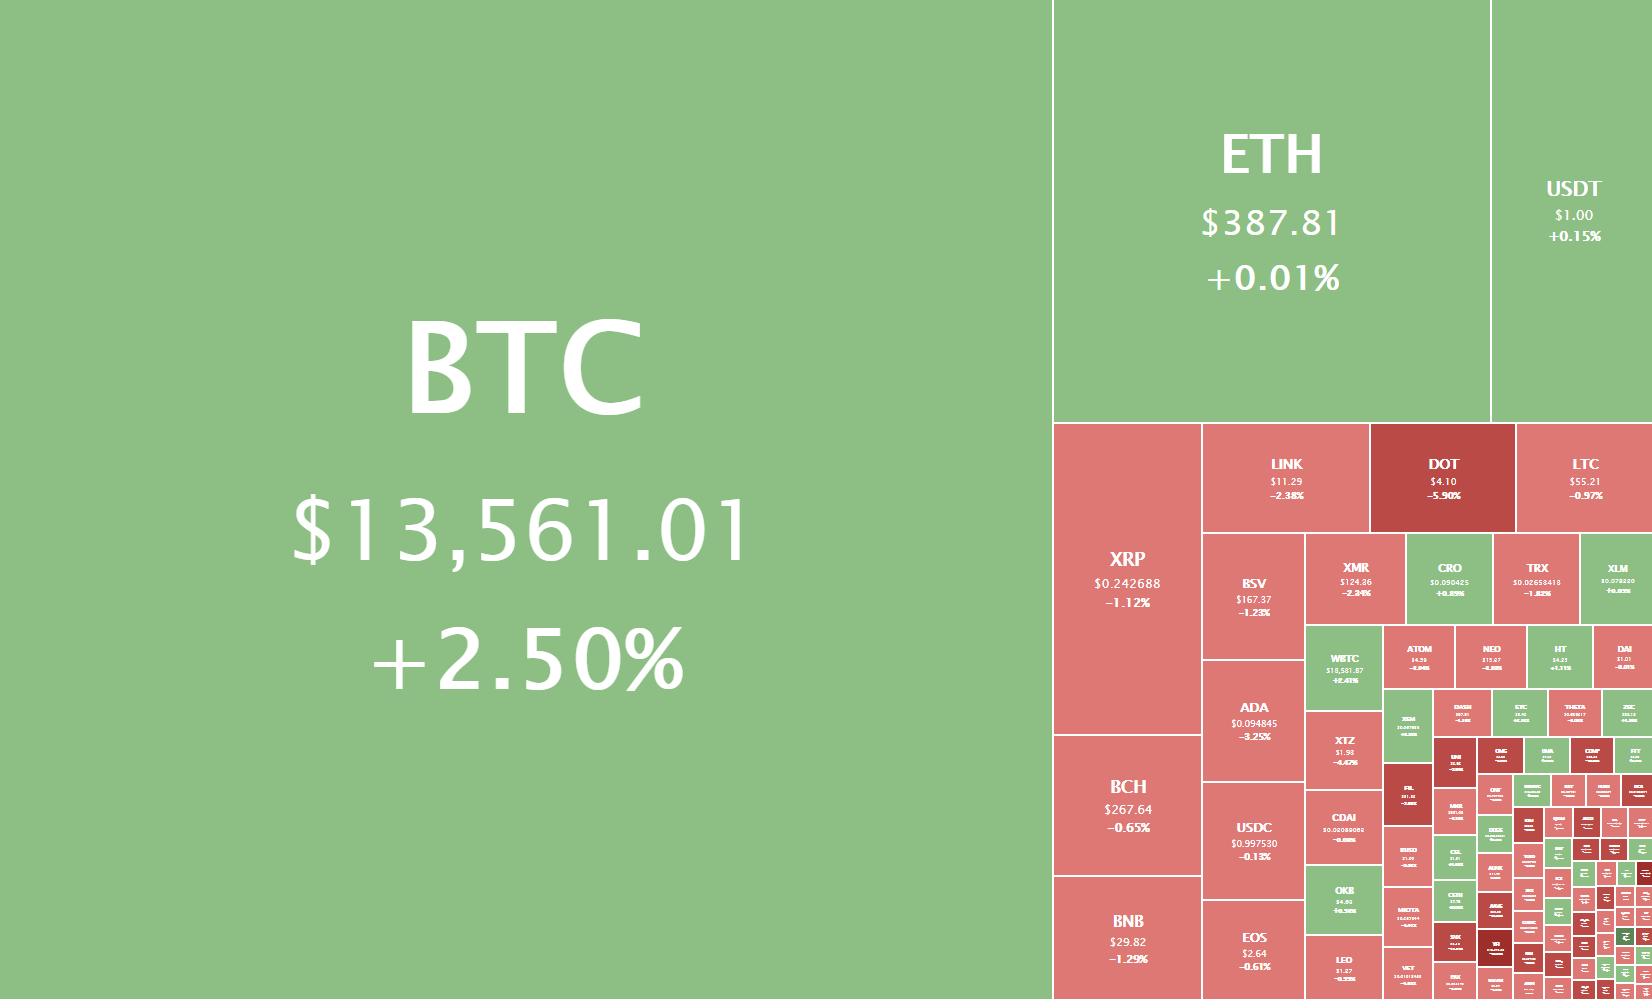
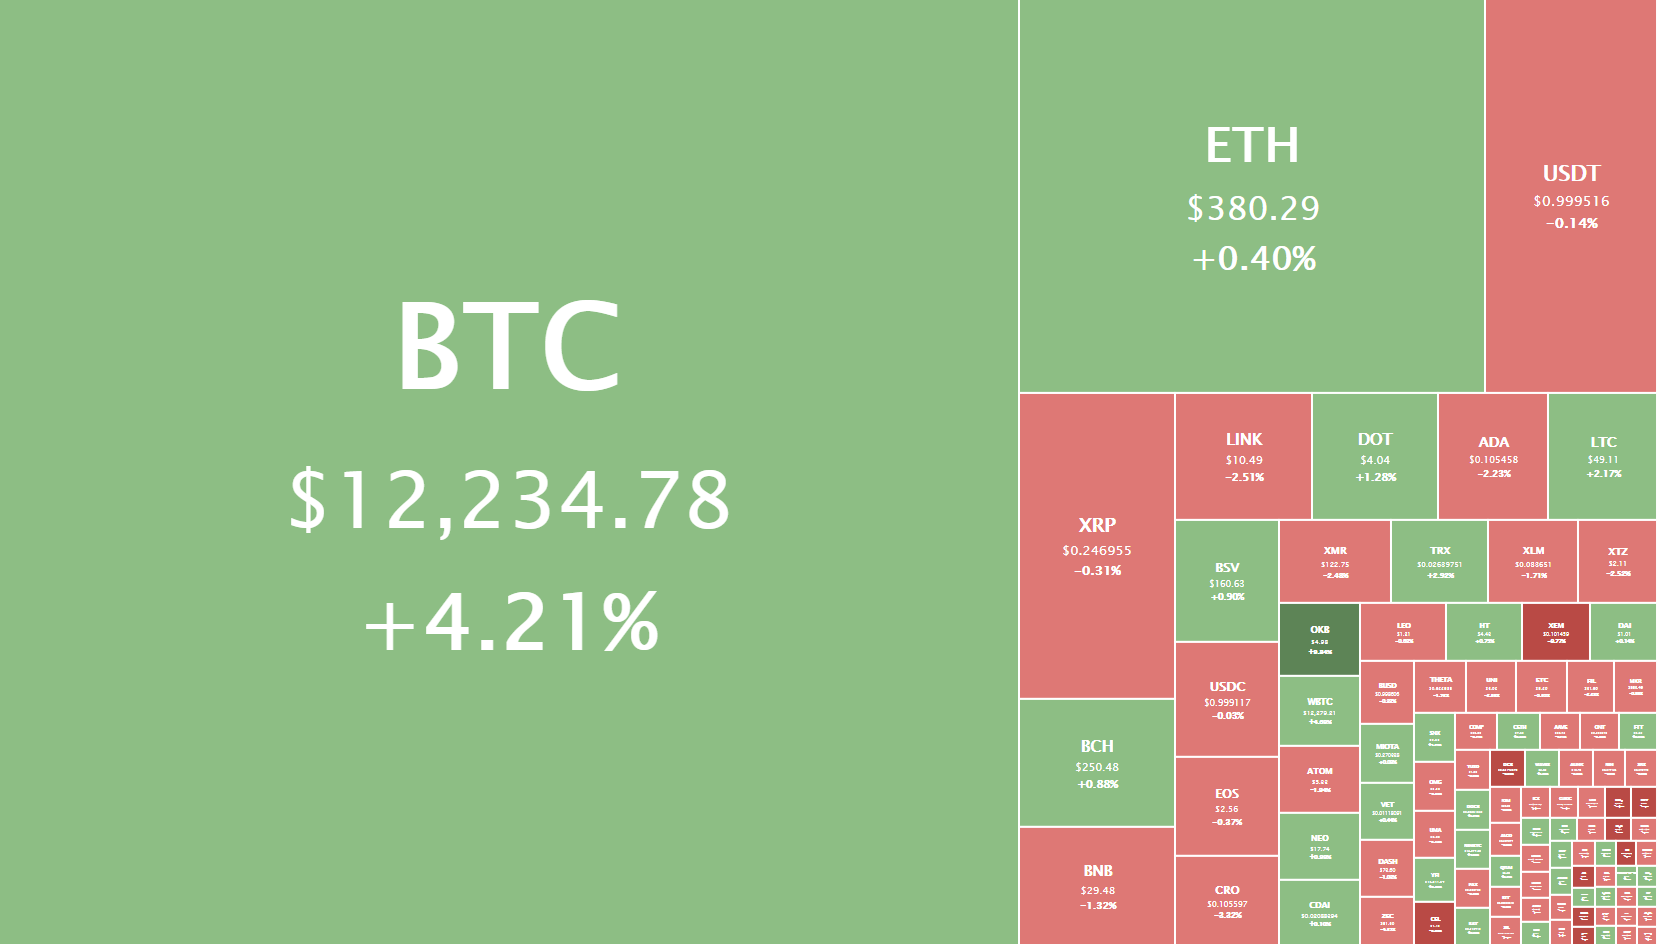
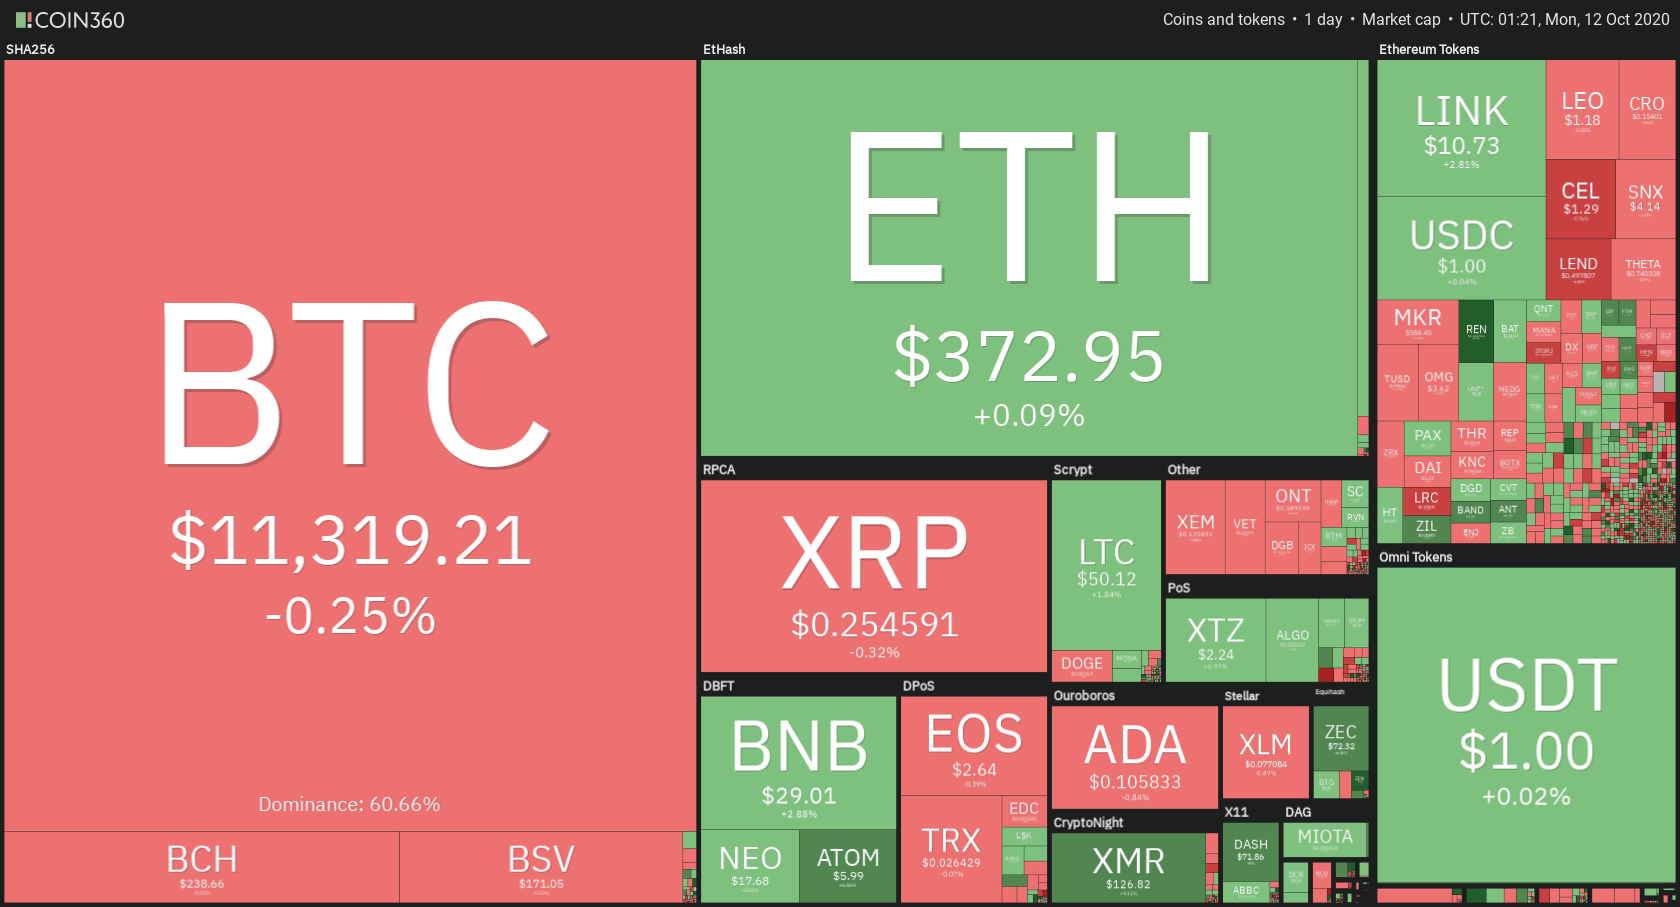
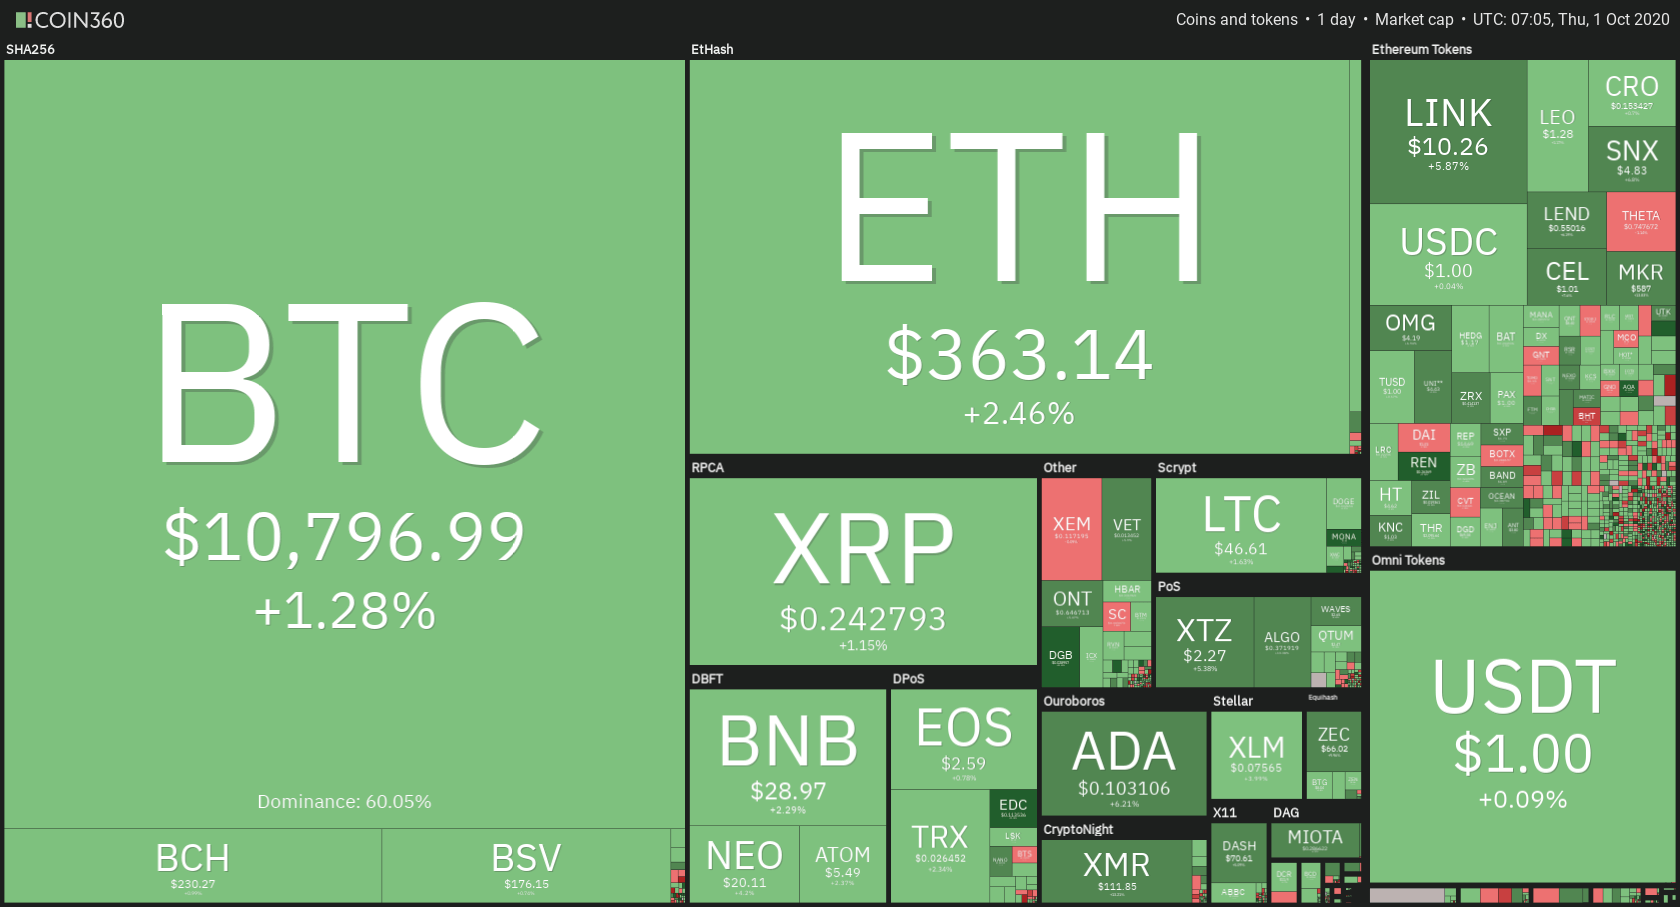
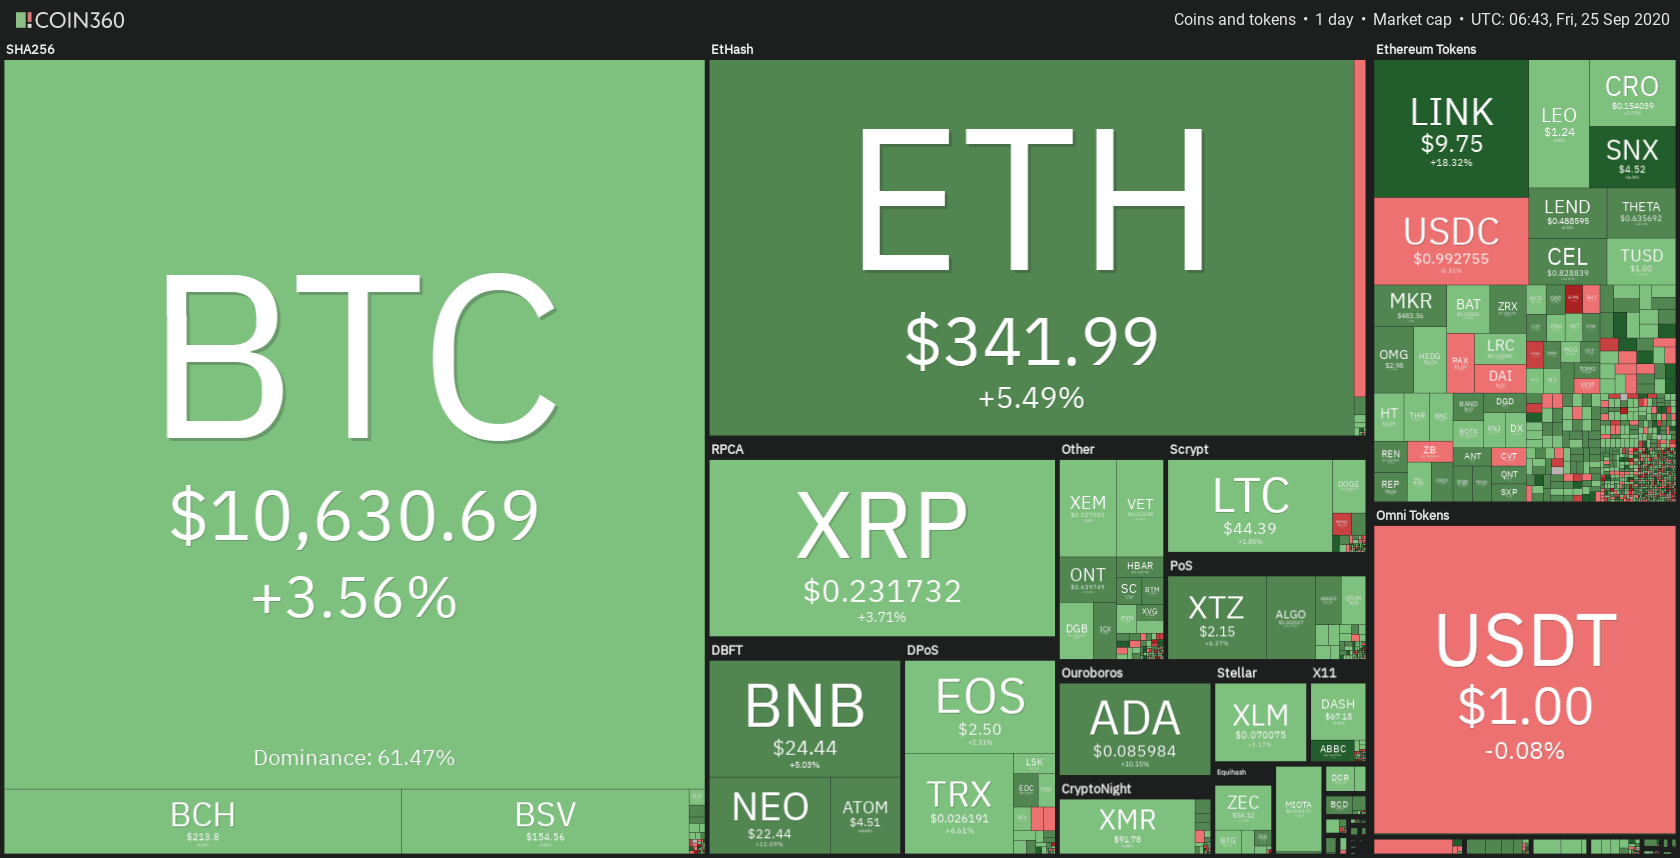
Cryptocurrency includes online digital currencies that work differently than real money does. While you can’t exchange cryptocurrency for goods or services the way that you can with cash, the digital currency holds value and can be exchanged for real money that can then be used to purchase those goods and services. Some examples of the most popular cryptocurrencies include Bitcoin, Ethereum, Tether, and Ripple. Some of these are created by private individuals, while we can thank banks and other companies for the creation of some cryptocurrency as well. Satoshi Nakamoto created the most well-known cryptocurrency Bitcoin in 2009 to provide a decentralized payment network that could offer peer to peer payments without relying on central banks. While there is still some speculation about whether cryptocurrency is a good investment, it’s important to know that the crypto market is approximately two-thirds the size of the forex market and growing. As we head towards the future, more individuals and banks will likely invest in it.

When it comes to investing in cryptocurrency, you have two options: you can use a major cryptocurrency exchange like Coinbase to buy a real cryptocurrency and hold onto it, or you can invest in cryptocurrency through most major brokers. If you purchase the cryptocurrency through an exchange, you’ll probably wind up paying commissions and fees, while you’ll have to worry about swap fees for holding crypto positions overnight if you choose to invest through your broker. If you want to make a long-term investment, it would be better to do so through an exchange.

Wondering if there are any major downsides to investing in cryptocurrency? Unfortunately, it does cost more to trade cryptocurrency as opposed to forex. Remember when we talked about the average price of trading the pair EURUSD? It costs about five times as much to trade the major cryptocurrency Bitcoin, which has an average exchange rate of 0.40% versus the 0.08% we mentioned earlier. 

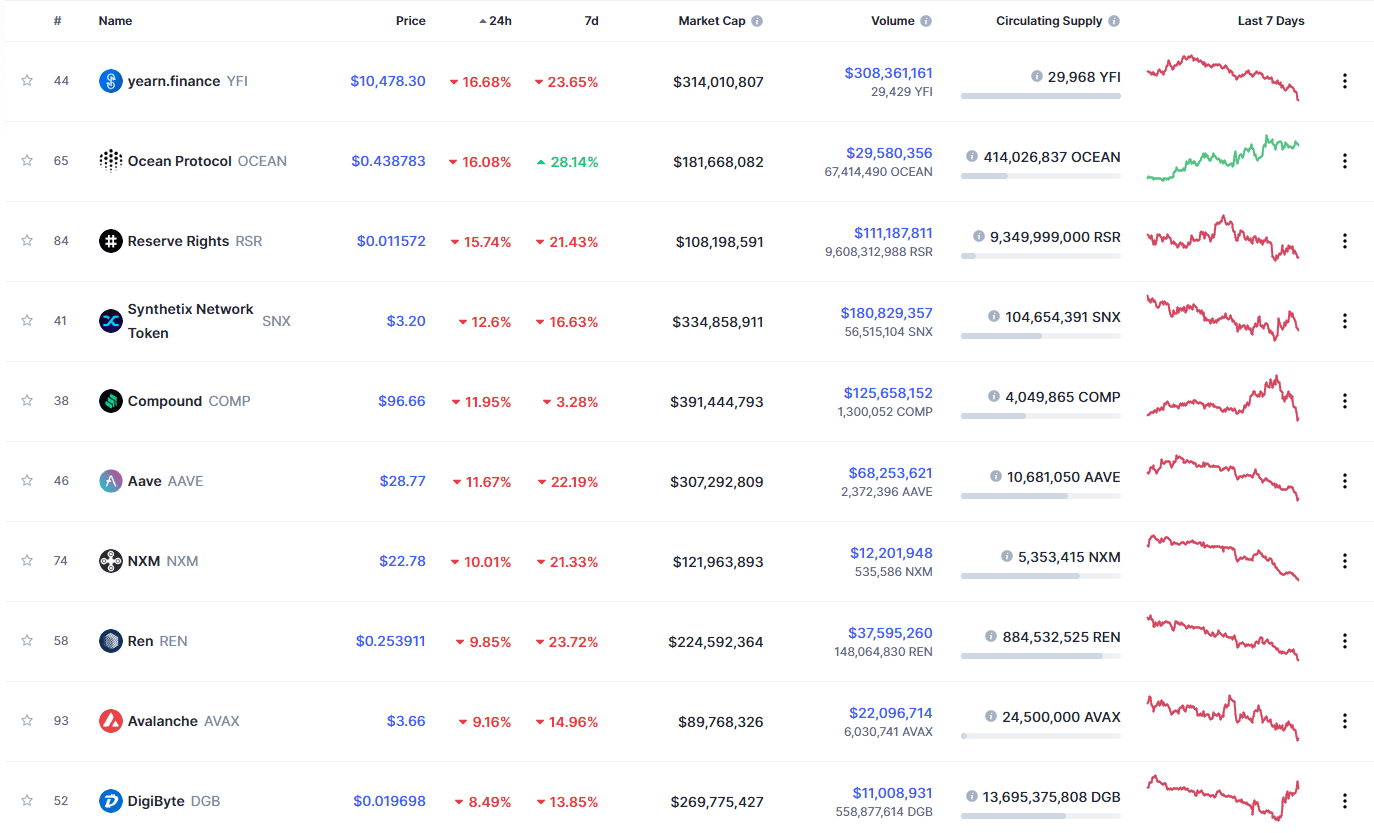
Cryptocurrency can also be more susceptible to volatility in the market. In addition to being affected by global events, they are also at high risk of volatility from events that occur in their own market. For example, the Bitcoin halving effect had a major impact on the market. These wide price fluctuations can work for you or against you – as they offer an opportunity to make a large profit, but the risk can be dangerous.  Many brokers limit the leverage that can be used when trading crypto pairs to 1:2 because of the high risk associated with trading them. Another plus to trading cryptocurrency comes in the form of more flexible market hours, with trading opportunities on the weekend as opposed to typical weekdays. 

The Bottom Line: Which is Better?

Above, we explained the most important points for forex and cryptocurrency. Below, we will break it all down into categories so that you can personally decide which is better to trade. 

  • When it comes to the cost of trading, forex wins by a landslide. While it costs about 0.08% of the value of EURUSD to trade, you’ll pay approximately 5 times as much to trade Bitcoin.
  • Bitcoin offers more flexible market hours, including weekdays and weekends, while forex traders can’t trade on the weekend. It’s also better to trade forex during certain market sessions.
  • Most brokers offer all major currency pairs, along with a good selection of minors and sometimes exotics. Lately, more brokers have added cryptocurrencies to their offers, but you may be limited to the most popular options. 
  • Both forex and crypto have prices that are driven by microeconomic factors, but crypto is far more volatile because it is also affected by issues within its own market.
  • Forex traders can access much higher leverage than crypto traders because brokers consider forex pairs to be much more stable. Some brokers offer leverage as high as 1:1000 or more, while crypto traders are often limited to a 1:2 leverage.
Categories
Crypto Daily Topic Cryptocurrencies

Is Bitcoin Cash a Good Investment?

Bitcoin Cash (BCH) is a cryptocurrency created in 2017 as a result of attempts to improve the performance of Bitcoin. BCH was spun off from Bitcoin (BTC) – the original cryptocurrency. 

The idea of forking one crypto from another is not strange. However, what makes the BCH spin-off noteworthy is that the fork involved an update to Bitcoin Core. Whereas some nodes accepted the update, others declined. Those that accepted the update formed the BCH network. The number of Bitcoins that each node had in their Bitcoin wallet at the time of the fork was duplicated on their BCH wallet.

The main motivation for starting the Bitcoin Cash project was to make Bitcoin more transactional-friendly. In other words, the pioneers of Bitcoin Cash were of the opinion that Bitcoin transactions took too long to settle; hence, it was better suited as an investment tool than a transactional currency. That was a good observation, but stakeholders widely disagreed on how to make these enhancements on the original Bitcoin, and that’s how Bitcoin Cash came to life.

This article explains what Bitcoin Cash is and evaluates whether it is worth investing in it.

How Is BCH Different from Bitcoin?

Considering that Bitcoin Cash is a fork of Bitcoin, one would expect striking similarity between the two. In fact, many crypto enthusiasts have described the former as nothing more than a newer version of the latter. So, are they one and the same thing? Well, not quite.

As earlier mentioned, the pioneers of Bitcoin Cash wanted Bitcoin transactions to be settled as fast as possible – just like traditional payment methods. The solution to this problem was to increase block sizes so that each block could accommodate more transactions. So, fundamentally, the difference is the block sizes. 

Nevertheless, the following are the notable differences between the two. Some came about as a result of increasing the block sizes and the sequence of events that were set in motion. 

  • Block size: This is the fundamental difference. The maximum block size of Bitcoin is 1 MB, while Bitcoin Cash blocks can grow up to 8 MB. Larger block sizes mean increased capacity to handle more transactions per second
  • Value: BCH has a lower dollar exchange rate than BTC. For comparison, at the time of writing, BCH was worth $269, while BTC was valued at $12,850.
  • Transaction processing time: Bitcoin transactions typically reflect after at least 10 minutes. For BCH, you can expect far shorter times.
  • Cheaper transaction fees: Crypto networks usually deduct a small percentage of the transaction value as network fees. While a network fee of $0.20 is common for BCH transactions, BTC transfers charge an average of $1.

BCH proponents believe that these differences give Bitcoin Cash an edge over Bitcoin.

Disadvantages of BCH

BCH seems to address most of Bitcoin’s challenges, making it seem more appealing. However, it is not without fault. The following are some of its notable disadvantages:

  • Less trading pairs – Since BCH is relatively new, you might find it a little cumbersome to get an exchange pair for your BCH. In comparison, you can exchange BTC or Ethereum with almost any other coin.
  • Less appeal among investor circles – BCH has not yet won investors’ confidence because it is relatively new in the market.
  • Lower mining profits – Mining BCH takes almost the same effort as mining BTC, but the network fees are much lower, thereby making the venture less profitable.

Investing in BCH

Bitcoin faces scalability challenges, and investors are increasingly showing optimism that BCH will save the day. But before investing in Bitcoin Cash, you need to find an exchange where you can buy and sell BCH and a secure wallet to keep your crypto. These two quick tips below will help you get started:

  • Finding an exchange: There are many crypto exchanges, but not all will work for you. You need to consider their exchange rates, supported payment methods, reputation, how fast they send the crypto to your wallet, and so on. Coinsutra has summarized the best exchanges for BCH here.
  • Getting a good wallet: Getting a secure and reliable wallet is a key pillar in your investment journey. You can find a comprehensive summary of the best BCH wallets on Wallets.com.

Now that you know where to buy your BCH and where to keep them safe, you can confidently join the club of BCH investors. 

Remember that BCH was created purposely as a transactional currency and not for long-term storage of value like stocks. This means that hoarding a large volume of BCH waiting for its value to grow might not be a wise thought. Nevertheless, you can still make some profit through buying and selling BCH. The idea is simple – you buy at a low price and sell when the price goes up. However, you will realize that this is a double-edged sword when you buy at a low price, and the price continues to drop even further. 

Coinbase is one of the best exchanges to buy and sell BCH since it offers a wide variety of exchange pairs. eToro is also worth considering as it facilitates social trading. Social trading allows you to learn trading from experts who are currently trading on the platform. So, you have a chance at trading profitably even if you have no experience. 

There is no magic formula for getting this right. However, you might want to play around with exchange pairs to find the best margins. For instance, if BCH/USD has low margins, you could try exchanging your BCH with BTC instead. 

Mining Bitcoin Cash

Mining cryptocurrencies is one of the ways one can generate revenue. It is, however, not for the faint-hearted. Just as is the case with Bitcoin, mining Bitcoin Cash requires mining rigs, which are special computers designed specifically for that purpose. You can get an Antminer R4, which is among the most powerful, at about $1,000. Antminer has a processing power of roughly 8.6TH/s (trillion calculations per second). You also need to prepare for huge power costs as this machine is rated at 845W. 

According to Bitinfocharts.com, mining Bitcoin Cash at 1TH/s earns an average of $1.35 per day. So, you’re looking at returns of $10.8 per day for the sort of investment above.

Overall, mining Bitcoin Cash is not the most lucrative of all alternatives, but at least you are guaranteed some returns. 

Final Remarks 

Bitcoin Cash is among the new cryptocurrencies. It is fast gaining popularity, making it worth considering for investment. It is cheaper than Bitcoin and allows faster transaction settlement. On the flip side, BCH is not yet widely accepted by investors. This makes it harder to find convenient trading pairs. 

Also, if you’re looking to invest in mining Bitcoin Cash, it isn’t as profitable as mining Bitcoin. If you’re considering investing in BCH for the long term, please understand that you will only make a profit if people want to buy BCH, more than they want to sell. So, if you are optimistic about this crypto’s steady growth, go forth in confidence and join the club of BCH investors.

Categories
Crypto Market Analysis

Daily Crypto Review, Nov 5 – Bitcoin Finally Above $14,000 as the Bull Run Continues; Ethereum 2.0 Contract Release Live

The cryptocurrency sector has explosively pushed towards the upside as Bitcoin broke the $14,316 and entered the territory explored only during the 2017/2018 bull run and last seen in July 2018. The largest cryptocurrency by market cap is currently trading for $14,316, representing an increase of 5.54% on the day. Meanwhile, Ethereum gained 4.78% on the day, while XRP gained 0.67%.

 Daily Crypto Sector Heat Map

HedgeTrade gained 38.24% in the past 24 hours, making it the most prominent daily gainer out of the top100 cryptos ranked by market capitalization. It is closely followed by Celsius’ gain of 9.37% and CyberVain’s 7.78% gain. On the other hand, Uniswap lost 16.95%, making it the most prominent daily loser. It is followed by yearn.finance’s loss of 16.73% and ABBC Coin’s loss of 9.35%.

Top 10 24-hour Performers (Click to enlarge)

Bottom 10 24-hour Performers (Click to enlarge)

Bitcoin’s market dominance level has increased slightly since we last reported, with its value is currently staying at 64.9%. This value represents a 0.6% difference to the upside when compared to the value it had yesterday.

Daily Crypto Market Cap Chart

The crypto sector capitalization has increased over the course of the day. Its current value is $412.17 billion, representing a $7.35 billion increase when compared to our previous report.

_______________________________________________________________________

What happened in the past 24 hours?

_______________________________________________________________________

_______________________________________________________________________

Technical analysis

_______________________________________________________________________

Bitcoin

The largest cryptocurrency by market capitalization had finally broken the $13,900 resistance with confidence and confirmed its position above it. Not only that, but it has entered the price level last seen in July 2018. This means that there will be a lot of uncertainty and unset support and resistance levels, and also a lot of random volatility due to various entities taking profit and new investors FOMOing in.

However, a couple of potential resistance levels have formed, one of them being at $14,640. Traders should pay close attention to this level as well as use Fib retracements to create possible targets when trading.

BTC/USD 1-hour Chart

Bitcoin’s technicals on showing a strong buy at all time-frames. No neutrality is being shown as Bitcoin is currently in an extremely favorable place price-wise.

BTC/USD 1-day Technicals

Technical factors (4-hour Chart):
  • Price is above both its 50-period EMA and its 21-period EMA
  • Price is slightly below its top Bollinger band
  • RSI is coming out of the overbought zone (69.10)
  • Volume is average
Key levels to the upside          Key levels to the downside

1: $14,640                                 1: $14,100

2: $16,665                                 2: $13,900

3: $17,260                                  3: $13,570

Ethereum

Bitcoin’s push towards the upside has fueled Ethereum, and the hype surrounding its version 2.0 launch, managed to surge above the ascending channel bottom line and re-enter the channel once again. The second-largest cryptocurrency by market cap reached as high as $409 before pulling back. It is now consolidating at slightly below $400.

If we don’t see any explosive moves from BTC and ETH in the short term, we can expect Ethereum to pull back slightly more and test the ascending channel’s bottom line as support. Traders can wait for the results of the “test” and trade off of that.

ETH/USD 4-hour Chart

Ethereum’s technicals on all time-frames are tilted towards the buy-side. However, its shorter time-frames (4-hour and daily) are showing hints of neutrality, while its longer time-frames are completely bullish.

ETH/USD 1-day Technicals

Technical Factors (4-hour Chart):
  • The price is above both its 50-period and its 21-period EMA
  • Price is between its middle and top Bollinger band
  • RSI is neutral (57.63)
  • Volume is average
Key levels to the upside          Key levels to the downside

1: $400                                     1: $378

2: $415                                     2: $371

3: $420                                      3: $361

Ripple

The fourth-largest cryptocurrency by market cap hardly even moved in the past 24 hours despite the rest of the crypto market booming. As we mentioned in our previous article, if Bitcoin’s next explosive move doesn’t fuel XRP, it will move within a range bound by $0.235 and $0.2454, exactly what happened.

XRP seems to be creating a triangle formation on its 4-hour chart. If that is the case, it is bound to move above or below it extremely soon. However, the move will most likely be stopped at its immediate support or resistance level.

XRP/USD 4-hour Chart

XRP’s technicals have improved slightly, as they were extremely bearish the last time we reported. While its daily overview is still heavily tilted towards the sell-side, its weekly and monthly overviews are almost neutral (though still slightly tilted towards the bear side), and its 4-hour time-frame is even showing some bullishness.

XRP/USD 1-day Technicals

Technical factors (4-hour Chart):
  • The price is below its 50-period EMA and at its 21-period EMA
  • Price at its middle Bollinger band
  • RSI is neutral (48.73)
  • Volume is average
Key levels to the upside          Key levels to the downside

1: $0.2454                                 1: $0.235

2: $0.26                                     2: $0.227

3: $0.266                                  3: $0.221


Categories
Crypto Market Analysis

Daily Crypto Review, Nov 4 – Bitcoin Contesting $14,000; Crypto Sector in the Green

The cryptocurrency sector has explosively pushed towards the upside as Bitcoin is contesting the $14,000 level yet again. The largest cryptocurrency by market cap is currently trading for $13,863, representing an increase of 3.81% on the day. Meanwhile, Ethereum gained 2.93% on the day, while XRP gained 3.67%.

 Daily Crypto Sector Heat Map

The Midas Touch Gold gained 13.90% in the past 24 hours, making it the most prominent daily gainer out of the top100 cryptos ranked by market capitalization. It is closely followed by ABBC Coin’s gain of 11.68% and Ampleforth’s 9.31% gain. On the other hand, CyberVain lost 9.64%, making it the most prominent daily loser. It is followed by NEAR Protocol’s loss of 9.57% and VeChain’s loss of 8.87%.

Top 10 24-hour Performers (Click to enlarge)

Bottom 10 24-hour Performers (Click to enlarge)

Bitcoin’s market dominance level has increased slightly since we last reported, with its value is currently staying at 64.3%. This value represents a 0.3% difference to the upside when compared to the value it had yesterday.

Daily Crypto Market Cap Chart

The crypto sector capitalization has increased over the course of the day. Its current value is $399.05 404.52 billion, representing a $10.79million increase when compared to our previous report.

_______________________________________________________________________

What happened in the past 24 hours?

_______________________________________________________________________

_______________________________________________________________________

Technical analysis

_______________________________________________________________________

Bitcoin

The largest cryptocurrency by market capitalization had a great day as its price moved above the $13,900 mark. While the move got stopped out near $14,000, its price is still above the level it just passed.

Due to no strong pullbacks happening at the moment and Bitcoin staying within a very narrow range ($13,000-$14,100), we can expect a strong move to either side very soon. Traders should pay attention to any attempt to break its support/resistance levels Bitcoin makes.

BTC/USD 4-hour Chart

Bitcoin’s technicals on all time-frames are bullish, with the weekly overview being the only one with a considerable amount of neutrality.

BTC/USD 1-day Technicals

Technical factors (4-hour Chart):
  • Price is above both its 50-period EMA and its 21-period EMA
  • Price above its middle Bollinger band
  • RSI is neutral (58.89)
  • Volume is average
Key levels to the upside          Key levels to the downside

1: $13,900                                 1: $13,570

2: $14,000                                 2: $13,180

3: $14,100                                  3: $13,000

Ethereum

Ethereum has bounced off of its $371 support level and started moving back towards its ascending channel. However, the channel bottom line was too strong to pass, and Ethereum ended up consolidating slightly below it. As time passes, the possibility of Ethereum breaking the level will be diminished due to the constant increase in the line’s price position.

Ethereum is now trading in a range between $378 and the ascending channel bottom line, which can be taken advantage of. However, Bitcoin is preparing a move, and Ethereum will most likely respond to it by following its direction and intensity, which can be used by the traders.

ETH/USD 4-hour Chart

Ethereum’s short-term technicals are unclear (4-hour overview being slightly bearish while daily overview is slightly bullish), while its longer-term technicals are heavily tilted towards the buy-side.

ETH/USD 1-day Technicals

Technical Factors (4-hour Chart):
  • The price is below its 50-period and at its 21-period EMA
  • Price is at its middle Bollinger band
  • RSI is neutral (49.02)
  • Volume is average
Key levels to the upside          Key levels to the downside

1: $400                                     1: $378

2: $415                                     2: $371

3: $420                                      3: $361

Ripple

The fourth-largest cryptocurrency by market cap took the day to push back above $0.235 and consolidate above it. This returned XRP back within a range bound by $0.235 to the downside and $0.2454 to the upside.

As we mentioned in our previous articles, if the next Bitcoin’s explosive move does not fuel XRP, traders can comfortably trade sideways action within this range. If, however, Bitcoin’s price moves to either side and XRP follows the direction, traders can use this event to trade alongside the direction XRP is moving in.

XRP/USD 4-hour Chart

XRP’s technicals on all time-frames are heavily tilted towards the sell-side. However, the longer the time-frame, the more neutral the technicals are, with the monthly indicator being very close to being completely neutral.

XRP/USD 1-day Technicals

Technical factors (4-hour Chart):
  • The price below its 50-period EMA and above its 21-period EMA
  • Price is slightly above its middle Bollinger band
  • RSI is close to the oversold territory (50.52)
  • Volume is slightly above average
Key levels to the upside          Key levels to the downside

1: $0.2454                                 1: $0.235

2: $0.26                                     2: $0.227

3: $0.266                                  3: $0.221


Categories
Crypto Market Analysis

Daily Crypto Review, Nov 3 – Crypto Sector in the Red; Altcoins Plummeting

The cryptocurrency sector experienced an overall price drop as Bitcoin pushed down towards sub-$13,500 levels. Most cryptocurrencies ended in the red as they lost quite a bit more than Bitcoin itself. The largest cryptocurrency by market cap is currently trading for $13,411, representing a decrease of 1.88% on the day. Meanwhile, Ethereum lost 5.68% on the day, while XRP lost 3.96%.

 Daily Crypto Sector Heat Map

The Midas Touch Gold gained 8.44% in the past 24 hours, making it the cryptocurrency to gain the most in a day (out of the top100 cryptos by market capitalization). The rest of the cryptocurrencies experienced close to no gains. On the other hand, Reserve Rights lost 17.14%, making it the most prominent daily loser. It is followed by SushiSwap’s loss of 14.07% and Compound’s loss of 12.86%.

Top 10 24-hour Performers (Click to enlarge)

Bottom 10 24-hour Performers (Click to enlarge)

Bitcoin’s market dominance level has increased since we last reported, with its value is currently staying at 64%. This value represents a 0.9% difference to the upside when compared to the value it had yesterday.

Daily Crypto Market Cap Chart

The crypto sector capitalization has decreased over the course of the day. Its current value is $388.84 404.52 billion, representing a $5.32 million decrease when compared to our previous report.

_______________________________________________________________________

What happened in the past 24 hours?

_______________________________________________________________________

_______________________________________________________________________

Technical analysis

_______________________________________________________________________

Bitcoin

The largest cryptocurrency by market cap has (as said in our previous article) moved away from the sideways trading as it could not stand trading in such a narrow range. Bitcoin pulled back below $13,570 and even went as low as ~13,200 before bouncing back to ~$13,400 (where it is currently consolidating).

The recent days have brought us a lot of support/resistance hopping, which is what we may expect in the near future as well. Traders should focus on capitalizing on these movements as they almost always overextend. The trades can be made both while Bitcoin is creating overextension (riskier but a bigger profit potential) or during the pullback (safer but less profit potential).

BTC/USD 4-hour Chart

Bitcoin’s 4-hour technicals are showing a bear tilt, while its longer time-frames are tilted towards the buy-side (longer time-frames have less neutrality and more of a buy-tilt than the shorter ones).

BTC/USD 1-day Technicals

Technical factors (4-hour Chart):
  • Price is far at its 50-period EMA and below its 21-period EMA
  • Price below its middle Bollinger band
  • RSI is neutral (43.90)
  • Volume is average
Key levels to the upside          Key levels to the downside

1: $13,570                                 1: $13,180

2: $13,900                                 2: $13,000

3: $14,000                                  3: $12,870

Ethereum

Ethereum has plummeted after failing to break the $400 mark, and losing all the most recent gains in the process. The second-largest cryptocurrency by market cap has left the ascending channel since the end of September. Its price drop was stopped at the $371 resistance level, which has held up quite well.

Ethereum is now trading in a narrow range bound by $371 to the downside and $378 to the upside. Traders should look for any breakouts to enter trades, while the ones that want to trade the sideways action should wait and see if Ethereum is likely to stay within this range.

ETH/USD 4-hour Chart

Ethereum’s 4-hour and daily technicals are tilted towards the sell-side, while its weekly and monthly overviews remain bullish.

ETH/USD 1-day Technicals

Technical Factors (4-hour Chart):
  • The price is far below both its 50-period and its 21-period EMA
  • Price is at its bottom Bollinger band
  • RSI is close to being overbought (35.83)
  • Volume is slightly above average
Key levels to the upside          Key levels to the downside

1: $378                                     1: $371

2: $400                                     2: $361

3: $415                                      3: $358

Ripple

The fourth-largest cryptocurrency by market cap has had a red day as well, with its price falling through major support levels. A failed attempt to break the $0.2454 level has triggered a pullback, which pushed XRP’s price below $0.235 and even attempted to break $0.227. However, this support level held up, and XRP is now trading slightly above it.

If not fueled by Bitcoin’s explosive move towards either side, XRP will most likely trade sideways between $0.227 and $0.235. While traders could trade the sideways action without much problem, the lack of intra-range volatility is low, which brings the profit potential way down.

XRP/USD 4-hour Chart

XRP’s daily, weekly, and monthly technicals are all showing a strong tilt towards the sell-side, while its 4-hour overview is slightly bullish with hints of neutrality.

XRP/USD 1-day Technicals

Technical factors (4-hour Chart):
  • The price far below both its 50-period EMA and its 21-period EMA
  • Price is at its bottom Bollinger band
  • RSI is close to the oversold territory (31.89)
  • Volume is slightly above average
Key levels to the upside          Key levels to the downside

1: $0.235                                   1: $0.227

2: $0.2454                                 2: $0.221

3: $0.26                                    3: $0.217


Categories
Crypto Market Analysis

Daily Crypto Review, Nov 2 – Ethereum’s Price Explodes; Bitcoin’s Whitepaper Celebrates its 12th Birthday

The cryptocurrency sector was full of volatility over the weekend as Bitcoin tried to break the $14,000 mark. Bitcoin is currently trading for $13,735, representing a decrease of 0.13% on the day. Meanwhile, Ethereum gained 3.12% on the day, while XRP gained 1.31%.

 Daily Crypto Sector Heat Map

Taking a look at the top 100 cryptocurrencies, Ocean Protocol gained 20.20% in the past 24 hours, making it the crypto to gain the most in a day. Aave (10.97%) and Ox (8.84%) also did great. On the other hand, ABBC Coin lost 10.72%, making it the most prominent daily loser. It is followed by CyberVain’s loss of 7.62% and Ren’s loss of 3.92%.

Top 10 24-hour Performers (Click to enlarge)

Bottom 10 24-hour Performers (Click to enlarge)

Bitcoin’s market dominance level had stayed at the same place since we last reported, with its value is currently 63.1%. This value represents a 0% difference when compared to the value it had on Friday.

Daily Crypto Market Cap Chart

The crypto sector capitalization has increased slightly over the weekend. Its current value is $404.52 billion, representing a $4.91 million increase compared to our previous report.

_______________________________________________________________________

What happened in the past 24 hours?

_______________________________________________________________________

_______________________________________________________________________

Technical analysis

_______________________________________________________________________

Bitcoin

The largest cryptocurrency by market cap had quite a volatile weekend, with its price breaking the $13,900 mark at one point and even reaching as high as $14,100. However, this price didn’t hold up, and Bitcoin fell back below $13,900, where it is consolidating at the moment. Bitcoin is now trading within a tight range, bound by $13,570 to the downside and $13,900 to the upside. History has shown us that BTC doesn’t stay range-bound for long; thus, we may expect a large move soon.

Traders should look for a trade when Bitcoin breaks one of its immediate resistances.

BTC/USD 4-hour Chart

Bitcoin’s overview on all time-frames is slightly bullish, with hints of neutrality. The neutrality is more present on the shorter time-frames as opposed to less neutrality on longer time-frames.

BTC/USD 1-day Technicals

Technical factors (4-hour Chart):
  • Price is far above its 50-period EMA and above its 21-period EMA
  • Price slightly above its middle Bollinger band
  • RSI is neutral (53.43)
  • Volume is slightly above average
Key levels to the upside          Key levels to the downside

1: $13,900                                 1: $13,570

2: $14,000                                 2: $13,180

3: $14,660                                  3: $12,870

Ethereum

Ethereum had spent the weekend slowly following the ascending channel bottom line until Sunday when its price bounced off and pushed past $400. The second-largest cryptocurrency by market cap managed to reach as high as $405 before pulling back and consolidating. The fight for $400 will continue, and it will decide if Ethereum will push towards $415 and $420 in the near future or not.

Traders should look for Ethereum’s break (or the failure to break) the $400 level and trade off of that.

ETH/USD 4-hour Chart

Ethereum’s 4-hour technicals have changed to a strong buy after Ether’s price spike, while its daily, weekly, and monthly time-frames are all slightly bullish with hints of neutrality.

ETH/USD 1-day Technicals

Technical Factors (4-hour Chart):
  • The price is far above both its 50-period and its 21-period EMA
  • Price is at its top Bollinger band
  • RSI is close to being overbought (64.51)
  • Volume is slightly above average
Key levels to the upside          Key levels to the downside

1: $400                                     1: $378

2: $415                                     2: $371

3: $420                                      3: $361

Ripple

The fourth-largest cryptocurrency by market cap spent the weekend consolidating below the $0.2454 level, which it has dropped below just before the weekend started. XRP tested both the $0.235 downside and $0.2454 upside, and both have proven to be strong support/resistance levels, which has left XRP range-bound.

XRP will take a lot of buying power to break above $0.2454 again, which means that the traders should consider trading sideways inside the range XRP is currently in.

XRP/USD 4-hour Chart

XRP’s daily, weekly, and monthly technicals are all showing a strong tilt towards the sell-side, while its 4-hour overview is slightly bullish with hints of neutrality.

XRP/USD 1-day Technicals

Technical factors (4-hour Chart):
  • The price below its 50-period EMA and above its 21-period EMA
  • Price is slightly above its middle Bollinger band
  • RSI is neutral (50.10)
  • Volume is average
Key levels to the upside          Key levels to the downside

1: $0.26                                     1: $0.2454

2: $0.266                                   2: $0.235

3: $0.27                                    3: $0.227


Categories
Crypto Market Analysis

BTC/USD Chart Overview + Possible Outcomes

In this weekly BTC /USD analysis, we will be looking at the most recent events, the current technical formations, as well as discussing possible outcomes.

Overview

Bitcoin has spent another week pushing towards the upside. This time, it has passed the resistance zone at ~13,200 and pushed further towards the 2019 yearly high of $13,900. Breaking this level signifies a crucial move towards reaching all-time highs as the zone between $13,900 and the $20,000 level has close to no volume, meaning that it is “air-filled.” The moves in this zone will include a lot of volatility due to people taking profits as well as FOMO-ing in.

Technical factors


Bitcoin has conquered the ~13,200 zone after a week of trading above it and a couple of retests. However, a new high is in sight, the 2019 yearly high of $13,900.

Bitcoin is booming with bullish indicators, with its downside being guarded by the 21-period moving average, as well as hash ribbons making a crossover into miner capitulation (a huge bullish signal).
Hash Ribbons are great for detecting market bottoms or preparations for another spike, and it is one of the indicators that has provided traders with the most stable and predictable returns (and with low drawdowns).

However, the technicals factors will have no effect on the strength of the move once it happens, and Bitcoin’s short-term direction will remain unclear until it confidently breaks or pulls back from the $13,900 level.

Likely Outcomes

Bitcoin has two main scenarios it can play out, which will depend on how the “fight” for $13,900 ends.
1: If it confirms its position above the level, we can expect the unexpected, as there is close to no sell pressure above. However, many will start taking profits so unexpected downswings might happen. With that being said, the most likely target after breaking $13,900 is $13,640, which is one of the small consolidation points which happened during the 2017/2018 spike.
2: The other scenario is just as likely, and involves Bitcoin rejecting $13,900, thus creating a double top and a short-term pullback. This pullback might end at the $13,200 zone, which historically has a lot of buy and sell pressure, or even further down towards $12,470.

We also have to note that, whichever of these scenarios play out, Bitcoin’s overall sentiment is extremely bullish and that investors that do not like trading should just stick with what they are comfortable with.

Categories
Crypto Guides

Secure Trades using Safex- A Decentralised, Open-Source Crypto Marketplace

Introduction

If you are frequently updated with the blockchain trend, then you must have come across Safex. Unlike most blockchain technologies used for security and transactional purposes, Safex is focused on e-commerce. Even since Bitcoin emerged as a P2P electronic cash system (peer-to-peer), the idea of a decentralized system on which people could easily trade with each other without requiring a centralized governing body has been at the forefront of every technological leap in the blockchain industry.

Living up to crypto enthusiasts and professionals’ expectations of wanting a truly borderless and open P2P trading system that helps both sellers and buyers. Safex is a community and a decentralized protocol built and designed on the original concepts of the individual rights to control, security, and privacy over transactions.

Let’s understand why Safex is the real attraction for crypto investors all across the globe.

What is Safex?

Safex is a privacy-based, decentralized, and open-source e-commerce marketplace designed to help both sellers and buyers and make transactions hassle-free. It allows you to create powerful web stores that are powered by blockchain. Safex has been using the heavily modified blockchain technology called cryptonote that leads to a world-class marketplace. What’s interesting about Safex is that the platform boasts a unique type of commerce-focused smart contract function.

Since data breach is the major vulnerability suffered by most centralized commerce platforms, Safex primarily focuses on privacy, addressing issues like opaque and unfair system for visibility of listings and trades, snooping on online behavior, unwarranted collection of personal data, and arbitrarily large and non-transparent commissions.

Industry experts claim that Safex has revolutionized the e-commerce sector by streamlining the processes and providing the e-commerce ecosystem with sheer privacy, which was previously not there.

More than 10,000 individuals have already invested in Safex Token and Cash after recognizing the project’s potential.

Why Safex?

Credit card fraud, privacy issues, and unfairness to small to medium-scale sellers are a few of the many problems affecting everyday users. With Safex, users get a solution in the form of secure online payment, an embedded privacy coin for free, and a marketplace on a blockchain. Safex combines Shopify, Upwork, and Amazon’s functionalities into a single platform, creating a new future for online shopping that eliminates the difficulties and challenges that users have to deal with every day.

Safex Features and Functionalities

With Safex, small sellers from across the world will have access to a global client base.

Engine for E-Commerce – Safex offers a decentralized database and an integrated global payment engine, which adds security and a privacy layer to online stores.

Safex Marketplace – Safex is a decentralized marketplace on a privacy blockchain, allowing sellers to gain exposure to the wide network of Safex users.

Privacy Blockchain -Safex uses functionalities like One-Time Address and Ring Signatures to maintain the senders’ anonymity and recipients of transactions.

Conclusion

Safex has already developed a strong community of users who believe in the project. Since blockchain is the future of online payment, Safex can prove to be a game-changer in how people carry out online transactions.

Categories
Crypto Market Analysis

Daily Crypto Review, Oct 30 – Bitcoin Bounces Back Above $13,500; XRP Breaks Crucial Support Level

The cryptocurrency sector was full of volatility today but ended the day with close to no gains. Bitcoin is currently trading for $13,561, representing an increase of 2.50% on the day. Meanwhile, Ethereum gained 0.01% on the day, while XRP lost 1.12%.

 Daily Crypto Sector Heat Map

None of the top100 cryptocurrencies gained much over the course of the day. NEM gained 3.57% in the past 24 hours, making it the crypto to gain the most in a day. Celsius (2.68%) and FTX Token (2.63%) also did great. On the other hand, yearn.finance lost 16.68%, making it the most prominent daily loser. It is followed by Ocean Protocol’s loss of 16.06% and Reserve Rights’ loss of 15.74%.

Top 10 24-hour Performers (Click to enlarge)

Bottom 10 24-hour Performers (Click to enlarge)

Bitcoin’s market dominance level had increased since we last reported, with its value is currently 63.1%. This value represents a 0.8% difference to the upside when compared to when we last reported.

Daily Crypto Market Cap Chart

The crypto sector capitalization has increased slightly in the past 24 hours. Its current value is $399.63 billion, representing a $6.58billion increase compared to our previous report.

_______________________________________________________________________

What happened in the past 24 hours?

_______________________________________________________________________

_______________________________________________________________________

Technical analysis

_______________________________________________________________________

Bitcoin

The largest cryptocurrency by market capitalization had quite a volatile day, with its price bouncing back from the $13,180 resistance and pushing up. While the price has reached ~$13,700 level, it has pulled back since, currently contesting the $13,570 resistance.

Traders should look at Bitcoin contesting the $13,570 level and trade in whichever direction the price confirms its move in.

BTC/USD 4-hour Chart

Bitcoin’s 4-hour and weekly overviews are neutral bullish, while its daily and monthly overviews are tilted towards the buy-side with close to no neutrality.

BTC/USD 1-day Technicals

Technical factors (4-hour Chart):
  • Price is far above its 50-period EMA and above its 21-period EMA
  • Price slightly above its middle Bollinger band
  • RSI is ascending towards overbought (59.94)
  • Volume is slightly above average
Key levels to the upside          Key levels to the downside

1: $13,570                                 1: $13,180

2: $13,900                                 2: $12,870

3: $14,000                                  3: $12,500

Ethereum

Ethereum had, just like Bitcoin, quite a volatile day today. Its price first bounced off of the ascending channel bottom line, which prompted a push towards $395 before falling yet again. As things stand now, the leg down is still not over yet, and Ethereum is yet to decide whether it will change its course towards the upside or break the channel down.

Traders should look for Ethereum’s response to the bottom channel line and trade in continuation to where it chooses to go.

ETH/USD 4-hour Chart

Ethereum’s technicals on all time-frames except for the 4-hour one are tilted towards the buy-side, with hints of neutrality. On the other hand, its 4-hour time-frame is tilted towards the sell-side with slight hints of neutrality.

ETH/USD 1-day Technicals

Technical Factors (4-hour Chart):
  • The price is below its 50-period and its 21-period EMA
  • Price is between its middle and bottom Bollinger band
  • RSI is neutral (40.64)
  • Volume is slightly above average
Key levels to the upside          Key levels to the downside

1: $400                                     1: $378

2: $415                                     2: $371

3: $420                                      3: $361

Ripple

The fourth-largest cryptocurrency by market cap had a bad day, as its price dropped below the crucial $0.2454 support level. XRP tried to recover and went above it at one point but failed to keep the price above the level, therefore triggering another push towards $0.24, where it is currently consolidating.

It is hard to say how traders should look at XRP, though the outlook is certainly bearish. Any push towards the upside will almost certainly result from Bitcoin making a large move towards the upside.

XRP/USD 4-hour Chart

XRP’s technicals are uniformed in its bearishness, with the 1-day and monthly overviews showing a bit more neutrality than the others.

XRP/USD 1-day Technicals

Technical factors (4-hour Chart):
  • The price well below both its 50-period EMA and its 21-period EMA
  • Price is slightly above its bottom Bollinger band
  • RSI is near oversold (35.97)
  • Volume is average
Key levels to the upside          Key levels to the downside

1: $0.2454                                 1: $0.235

2: $0.26                                     2: $0.227

3: $0.266                                  3: $0.221


Categories
Crypto Market Analysis

Daily Crypto Review, Oct 29 – Bitcoin Back At $13,000: What’s Next? Trading Ideas and Market Overview

The cryptocurrency sector quite a bad day, as Bitcoin led the rest of the sector down by dropping from $13,900 all the way to below $13,000. Bitcoin is currently trading for $13,240, representing a decrease of 3.70% on the day. Meanwhile, Ethereum lost 3.60% on the day, while XRP lost 2.93%.

 Daily Crypto Sector Heat Map

If we check out the top 100 cryptocurrencies, Ocean Protocol gained 11.69% in the past 24 hours, making it the crypto to gain the most in a day. Nexo (7.86%) and DigiByte (4.49%) also did great. On the other hand, ABBC Coin lost 12.3%, making it the most prominent daily loser. It is followed by Band Protocol’s loss of 11.46% and Quant’s loss of 11.36%.

Top 10 24-hour Performers (Click to enlarge)

Bottom 10 24-hour Performers (Click to enlarge)

Bitcoin’s market dominance level had decreased slightly since we last reported, with its value is currently 62.3%. This value represents a 0.1% difference to the downside when compared to when we last reported.

Daily Crypto Market Cap Chart

The crypto sector capitalization has decreased significantly in the past 24 hours. Its current value is $393.05 billion, representing a $15.07 billion decrease compared to our previous report.

_______________________________________________________________________

What happened in the past 24 hours?

_______________________________________________________________________

_______________________________________________________________________

Technical analysis

_______________________________________________________________________

Bitcoin

The largest cryptocurrency by market capitalization pulled back as its price couldn’t pass the crucial resistance of $13,900. The move was strong and lasted three candles (around 12 hours), over which Bitcoin fell as low as $12,895, where it bounced off of its 50-period moving average. Bitcoin is now consolidating above the $13,180 level.

Traders should look at how Bitcoin trades within the range bound by $13,180 and $13,570 and trade off of that.

BTC/USD 4-hour Chart

Bitcoin’s 4-hour, daily, and monthly technicals are looking almost identical, with all of them being tilted towards the buy-side, with a bit of neutrality sprinkled in. On the other hand, its weekly overview is a bit more bearish, with oscillators leaning towards the sell-side.

BTC/USD 1-day Technicals

Technical factors (4-hour Chart):
  • Price is above its 50-period EMA and at its 21-period EMA
  • Price is at its middle Bollinger band
  • RSI is neutral (52.27)
  • Volume is descending
Key levels to the upside          Key levels to the downside

1: $13,570                                 1: $13,180

2: $13,900                                 2: $12,870

3: $14,000                                  3: $12,500

Ethereum

Ethereum has followed Bitcoin to the downside, ultimately following its own predicted path within an ascending channel and reaching the bottom of $380 (as predicted in our previous articles) before bouncing back. It is currently trading slightly below $400, with a good chance of retesting this level once again.

Traders should watch for how Ethereum looks to retest the $400 resistance level and trade the pullback or the spike after that.

ETH/USD 4-hour Chart

Ethereum’s daily and monthly technicals are tilted towards the buy-side (with slight neutrality next to them). However, its shorter time-frame (the 4-hour overview) looks completely bearishness, while its weekly overview is completely neutral.

ETH/USD 1-day Technicals

Technical Factors (4-hour Chart):
  • The price is below its 50-period and its 21-period EMA
  • Price is slightly below its middle Bollinger band
  • RSI is neutral (42.03)
  • Volume is slightly above average
Key levels to the upside          Key levels to the downside

1: $400                                     1: $378

2: $415                                     2: $371

3: $420                                      3: $361

Ripple

The fourth-largest cryptocurrency by market cap managed to push above the ascending dotted yellow line (as predicted in our previous articles) but quickly failed as Bitcoin was dragging the market down. XRP followed and fell to its $0.2454 support level, which is holding for now. However, XRP is still quite close to the support level, which might break at any moment.

Traders should look for an entry if XRP breaks $0.2454 to the downside. When looking at trades to the upside, traders can look at Bitcoin’s upside pushes and trade off of that.

XRP/USD 4-hour Chart

XRP’s technicals are almost uniformed in how bearish they are, with its 4-hour, daily, and monthly overviews showing a slight tilt towards the sell-side. Its weekly overview, however, is completely neutral.

XRP/USD 1-day Technicals

Technical factors (4-hour Chart):
  • The price far below both its 50-period EMA and its 21-period EMA
  • Price is slightly above its bottom Bollinger band
  • RSI is neutral (38.72)
  • Volume is average
Key levels to the upside          Key levels to the downside

1: $0.26                                     1: $0.2454

2: $0.266                                   2: $0.235

3: $0.2855                                3: $0.227


Categories
Cryptocurrencies

The Top 5 Cryptocurrencies for Trading

Cryptocurrencies present limitless opportunities for Forex traders. However, the prospect of trading with these non-traditional currencies can seem daunting, especially now that there are so many available. Here, we’ve outlined the top five cryptos for trading with this year and into the foreseeable future.

Bitcoin

Bitcoin is still the most famous cryptocurrency, largest,  and most valuable. It was also the first to be launched by the still anonymous “Satoshi Nakamoto” in 2009. It is accepted at more points of sale than any other cryptocurrency. Bitcoin is the first choice for most investors, traders, and speculators, as it is the most liquid cryptocurrency and can be sold, bought, or traded on all platforms, more than any alternative. Bitcoins are created in mining, which used to be inside the capacity of laptops and desktops but is no longer so easy to do. At current mining rates, 18 Bitcoins are manufactured approximately every 15 minutes.

This rate of creation will be gradually reduced until the total number of bitcoins in existence reaches a maximum of 21 million, which at this rate will occur approximately in the year 2140. All transactions, including the manufacture, by mining, of new bitcoins, the price of bitcoin, and all sales and transfers with bitcoins, are recorded in a ledger.

Transactions have to be accepted by most nodes in Bitcoin’s blockchain technology and, since Bitcoin is relatively widely owned, transactions take less than 1 minute to be fully verified. The bitcoin miners act as nodes within the blockchain, effectively managing the system and processing all transactions. Once the 21 million bitcoins have been extracted, miners will have a greater need to collect transaction fees to maintain profitability. For this reason, traders are concerned that cryptocurrency may face a major problem in the future.

It is worth noting, however, that the purchase of assets or even a currency exchange a transaction fee also takes place, for this reason, Bitcoin is not necessarily at a disadvantage compared to other marketable assets. Miners can now charge transaction fees if they wish and choose which outstanding transactions to prioritize if they generate a commission. This means that, if you are in trouble, you can pay a little more for your transaction to be processed faster.

The transactions and ownership of Bitcoins are effectively private, since, although the block chain’s general ledger is publicly accessible and has a record of every transaction that has been made, owners are registered by digital credentials (“keys”) and not by their name or other tax identifiers. Holders can store and protect their keys using a variety of methods, all of which will be treated in more detail later.

In addition to being the greatest and famous cryptocurrency, Bitcoin has a pioneering and rebellious image, not being backed by large corporations, and is seen as a bold intrusion. In other words, Bitcoin can be the Wikileaks of cryptocurrencies!

Ethereum

Ethereum is second by size compared to Bitcoin. It was released in 2015 and was developed by a Bitcoin programmer who was disenchanted with the functionality of Bitcoin. Stock market capitalization is slightly less than half that of Bitcoin and there are approximately 750,000 individual Ether owners (as the currency is technically known). As a means of payment, it is accepted by very few points of sale or any commercial organization.

The characteristic of the Ether is that it is a blockchain technology designed to perform “intelligent contracts”, which are computer protocols designed to facilitate, verify, or enforce the negotiation or performance of a contract. The way of thinking about Ethereum is like a currency for commercial contracts over the Internet, unlike Bitcoin, which pretends to be more a reserve of value and means of generalized exchange. The surprising thing about “smart contracts” is that they control themselves: contracts are automatically canceled when a party fails to fulfill its obligation.

In other respects, Ethereum is actually very similar to Bitcoin. It is also extracted, but the characteristics that govern its extraction in the future are less clear than the Bitcoin rules. Ethereum has a more corporate identity and was launched into the market by a Swiss company. Ethereum has suffered from some negative publicity such as its general ledger has been successfully hacked and has suffered several hard forks (Hard Forks), being the first destined to recover the stolen assets after the attack of the hackers. However, some cryptocurrency analysts see in Ethereum the potential to surpass Bitcoin in market capitalization at some point in the future. Even so, in recent months the capitalization of Bitcoin has grown proportionately faster than that of Ethereum.

Bitcoin In Cash (Bitcoin Cash)

Bitcoin Cash or Bitcoin Cash is a branch of Bitcoin, created on August 1, 2017, following a hard fork in the Bitcoin blockchain. This hard bifurcation was the result of differences between those who prioritized Bitcoin as a value reserve (i.e., an investment) over a medium of exchange (i.e., cash to make transactions). Some Bitcoin miners wanted the boundaries to be removed, which would speed up transaction times. The result was that Bitcoin split up to form a new cryptocurrency with a faster transaction time, called Bitcoin Cash. It is extracted and operated in the same way as Bitcoin. Bitcoin Cash is generally more useful for people who need to derive their income streams from cryptocurrency or make many quick business transactions. It can be taken into account as an investment vehicle as it has a niche market and, since the fork, there is no doubt that its price has risen faster than that of Bitcoin.

Ripple

Ripple is the third-largest cryptocurrency in the world. It was created in 2012 but had been in development for approximately 8 years. Ripple is quite different from Bitcoin and Ethereum, as it has a more corporate image and backing, and is actually a decentralized, consensus-verified transaction network rather than a cryptocurrency. It was developed as a real-time gross settlement system, fast and inexpensive and can confirm transactions in a few seconds, faster than any other cryptocurrency. Already being used by several major banks for years, which consider it a safer system than Bitcoin and other cryptocurrencies.

Its native currency is Ripple, but it can support any unit of value, be it fiduciary currency like the US dollar or even flight miles and the like. This adaptability, as well as its use by banks, attracts some investors who are confident that Ripple’s technology will dominate the market and could eventually overtake Ethereum and Bitcoin in market capitalization. But it must be said that its value has increased more slowly in recent years than the value of other important cryptocurrencies.

Litecoin

Litecoin is the fifth-largest cryptocurrency. It was created in 2011 and was a Bitcoin fork, that is, a branch of Bitcoin. Its way of working is almost the same as Bitcoin in every way, except that has always proven to have a faster processing speed and is currently capable of processing transactions approximately four times faster than Bitcoin.

Overview of the 5 Main Cryptodivisas

From an investment or trading perspective, it is important to know the differences and similarities between each of the main cryptocurrencies as a starting point. This way, you can make sure you don’t buy too much of the same type of asset. So, let’s look at the characteristics of each of the cryptocurrency. The main elements that differentiate them and that are likely to influence their future perspectives are your market capitalization, functionality, popularity, image, security, and processing speed.

The notable atypical asset is Ripple: it is very corporate and a network rather than just a currency. In the future, it may become the matrix through which all, or almost all, crypto transactions are executed. In addition to Ripple, the main rivalry is between Bitcoin and Ethereum, and the latter hopes to soon overtake Bitcoin as a market capitalization leader. Bitcoin Cash and Litecoin can be grouped as currencies that are designed to be optimized for exchange rather than savings/investment.

For these fundamental reasons, it may make sense to divide the five crypts into 3 groups:

  • Ripple
  • Bitcoin and Ethereum
  • Bitcoin Cash and Litecoin

When we talk about technical analysis of market values, the story is more complicated. The price movements of the last 6 months seem to suggest that there is validity in our categorization by groups. Note also that cryptocurrencies with lower market capitalization appear to show stronger volatility, which is not surprising since illiquid assets are usually more volatile.

Cryptomonedas Menores

If you’re considering becoming a long-term cryptocurrency investor, it’s worth thinking about buying a number of lesser-known currencies that may become larger. By investing in very risky assets, the best returns are often made from spectacular gains on just one or two instruments. Therefore, a portfolio of small investments in smaller cryptocurrencies could have a high potential return.

If you decide to invest in lesser-known cryptocurrencies, it is very important that you do your own research. You can see a list of the top 100 cryptocurrencies by capitalization here. In the meantime, we’d like to list some of these smaller alternatives that we think might end up standing out in the crowd.

Golem, based on a network where anyone can earn money by renting their unused computing capacity in the cloud. It is now the twenty-seventh largest cryptocurrency by stock market capitalization.

Monero: announced as virtually nonpirateable and with an unprecedented level of security. It is now the fourteenth largest cryptocurrency by stock market capitalization.

Storj: the currency of a cloud storage system based on the blockchain system, where the currency is issued in exchange for a provision of storage space.

Categories
Crypto Guides

An Introductory Guide To ‘Yield Farming’ In The World of Cryptocurrencies

Introduction

Lately, the topic of Decentralized Finance or DeFi in the cryptocurrency space has been the most talked-about concept among crypto enthusiasts. While the general populous has been hunkering down on the economic uncertainty, people in the field of cryptocurrency have been excited about decentralized finance’s one of the latest, riskiest, and dynamic investment strategies – Yield Farming.

The concept is quite new, even for the crypto nerds. But it has the potential to change the dynamics of how people deal with cryptocurrencies. Some people may confuse it with liquidity farming, but Yield Farming is a different concept. Simply put, it is the process of finding the best returns (yields) that the cryptocurrency world has to offer.

One of the great things about Decentralised Finance is that they are permissionless. That is, anyone with an internet connection and a supported crypto wallet can interact with them, even a smart contract. This has given rise to Yield Farming. So, what is it? How does it work? Who can use it? We will answer all these questions and more in this post. Keep on reading.

What is Yield Farming?

Yield Farming is a process of generating rewards with crypto holdings using permissionless liquidity protocols. Simply put, Yield Farming means holding and locking cryptocurrencies and getting rewards. According to experts, Yield Farming bears a resemblance to staking. Nevertheless, it is a lot more sophisticated than you can think. In most cases, Yield Farming works with users known as liquidity providers (LP) who add capital to liquidity pools.

A liquidity pool is a smart contract containing funds; when liquidity providers provide liquidity to the pool, they get a reward. The reward received by the liquidity provider will be either generated from the fees of the underlying Decentralized Finance platform or some other sources. In some cases, liquidity pools use multiple tokens to pay their rewards. These tokens can be deposited to other liquidity pools to earn more rewards. This means that as a liquidity provider, you will contribute to the liquidity pools and earn rewards in return.

Yield Farming is done using Ethereum (ERC-20 tokens), and the reward generated is also some kind of ERC-20 token. Yield farmers move their funds quite often between different protocols, looking for higher yields. Experts believe that Decentralized Finance platforms may provide providers with other economic incentives to attract more capital.

How Does it Work?

Yield Farming is based on the Automated Marker Maker (AMM) principle that includes liquidity pools and liquidity providers. Suppose you are a liquidity provider. You deposit funds into a liquidity pool. This liquidity pool of yours is a whole marketplace where users can exchange, borrow, or lend tokens. As the user uses these tokens, they will have to pay a certain fee to the liquidity provider, that is, to you. This is how AMM works.

Conclusion

As simple as it sounds, Yield Farming is a complex phenomenon. The strategies involved are highly complex and are suitable for only advanced users. Also, experts suggest that it should be deployed by those who have a lot of capital.

Categories
Crypto Market Analysis

Daily Crypto Review, Oct 28 – Bitcoin Rushing Towards $14,000; Over 50% of US Investors Interested in Crypto

The cryptocurrency sector had a great day, with most cryptocurrencies ending up in the green due to Bitcoin pushing towards $13,900. Bitcoin is currently trading for $13.720, representing an increase of 4.81% on the day. Meanwhile, Ethereum gained 3.63% on the day, while XRP gained 1.61%.

 Daily Crypto Sector Heat Map

If we check out the top 100 cryptocurrencies, Flexacoin had another amazing day, gaining an astonishing 332.35% in the past 24 hours, making it the crypto to gain the most in a day. Nexo (13.94%) and Compound (13.71%) also did great. On the other hand, ABBC Coin lost 13.58%, making it the most prominent daily loser. It is followed by Reserve CyberVein’s loss of 10.32% and Quant’s loss of 7.90%.

Top 10 24-hour Performers (Click to enlarge)

Bottom 10 24-hour Performers (Click to enlarge)

Bitcoin’s market dominance level had increased quite a bit since we last reported, with its value is currently 62.4%. This value represents a 0.8% difference to the upside when compared to when we last reported.

Daily Crypto Market Cap Chart

The crypto sector capitalization has increased significantly since we last reported. Its current value is $408.12 billion, representing an increase of $13.35 billion compared to our previous report.

_______________________________________________________________________

What happened in the past 24 hours?

_______________________________________________________________________

_______________________________________________________________________

Technical analysis

_______________________________________________________________________

Bitcoin

The largest cryptocurrency by market capitalization surprised the market once again by pushing even further up. Our weekly chart overview has listed a push towards $13,900 as one of the likely scenarios for this week, which is exactly what happened. Bitcoin has pushed past the descending (yellow dotted) line and above the $13,180 resistance level, all the way to $13,800.

Traders should look at how Bitcoin behaves around $13,900 and follow the next push (either a pullback below $13,570 or a break past $13,900).

BTC/USD 4-hour Chart

Bitcoin’s technicals have changed to extremely bullish on all time frames since yesterday, with only the 4-hour chart oscillators showing some signs of a tilt towards the sell-side.

BTC/USD 1-day Technicals

Technical factors (4-hour Chart):
  • Price is far above both its 50-period EMA and its 21-period EMA
  • Price is at its top Bollinger band
  • RSI is overbought (74.76)
  • Volume is above average
Key levels to the upside          Key levels to the downside

1: $13,570                                 1: $13,200

2: $13,900                                 2: $12,870

3: $14,000                                  3: $12,500

Ethereum

Ethereum has spent the day bouncing off of the support level dating back from early September. While Ether had a slightly bigger chance of continuing its path down the projected path towards the bottom of the channel, Bitcoin’s rise sparked up Ether’s bounce. Its price is now hovering slightly above $400, with a solid chance of testing $415 again.

Traders should watch for how Ethereum plays out in the next few days to evaluate if it pushes towards $415-$420 or goes below $400.

ETH/USD 4-hour Chart

Ethereum’s technicals are tilted towards the buy-side on all time-frames, but only the daily time-frame is completely bullish. On the other hand, the 4-hour, weekly, and monthly overviews have signs of neutrality, mostly when it comes to oscillators.

ETH/USD 1-day Technicals

Technical Factors (4-hour Chart):
  • The price is above its 50-period and slightly above its 21-period EMA
  • Price is at its middle Bollinger band
  • RSI is neutral (55.78)
  • Volume is average
Key levels to the upside          Key levels to the downside

1: $415                                     1: $400

2: $420                                     2: $378

3: $435                                      3: $371

Ripple

The fourth-largest cryptocurrency by market cap has stayed at the same place over the course of the past 24 hours, possibly preparing itself for a move towards the yellow ascending line. Even if it keeps following it, XRP will gain a significant boost in price and an opportunity to test $0.26 once again.

Traders should look for a trade when XRP reaches $0.26, as they can enter a trade on either the pullback or the push above.

XRP/USD 4-hour Chart

XRP’s technicals are slightly tilted towards the buy-side, but the 1-day, as well as 4-hour and weekly technicals, show slight neutrality. On the other hand, its monthly overview is still bearish.

XRP/USD 1-day Technicals

Technical factors (4-hour Chart):
  • The price at both its 50-period EMA and its 21-period EMA
  • Price is at its middle Bollinger band
  • RSI is neutral (50.04)
  • Volume is average
Key levels to the upside          Key levels to the downside

1: $0.26                                     1: $0.2454

2: $0.266                                   2: $0.235

3: $0.2855                                3: $0.227


Categories
Crypto Market Analysis

Daily Crypto Review, Oct 27 – Bitcoin Preparing For a Retracement; XRP Tumbles on the Daily

The cryptocurrency sector spent the day with cryptocurrencies trying to find consolidation points as preparation for Bitcoin’s next move. Bitcoin is currently trading for $13.049, representing an increase of 0.61% on the day. Meanwhile, Ethereum lost 2.74% on the day, while XRP lost 1.73%.

 Daily Crypto Sector Heat Map

If we check out the top 100 cryptocurrencies, Flexacoin gained an astonishing 144.03% in the past 24 hours, making it the crypto to gain the most in a day. Kusama (28.07%) and Ocean Protocol (20.44%) also did great. On the other hand, Quant lost 13.61%, making it the most prominent daily loser. It is followed by Reserve Rights’ loss of 10.28% and Cybervein’s loss of 8.60%.

Top 10 24-hour Performers (Click to enlarge)

Bottom 10 24-hour Performers (Click to enlarge)

Bitcoin’s market dominance level had increased slightly since we last reported, with its value is currently 61.6%. This value represents a 0.5% difference to the upside when compared to when we last reported.

Daily Crypto Market Cap Chart

The crypto sector capitalization has stayed at the same place since we last reported. Its current value is $394.54 billion, representing an increase of $1.86 billion compared to our previous report.

_______________________________________________________________________

What happened in the past 24 hours?

_______________________________________________________________________

_______________________________________________________________________

Technical analysis

_______________________________________________________________________

Bitcoin


The largest cryptocurrency by market capitalization has spent the past 24 hours slowly gaining value and reaching the $13,180 mark. However, it managed to make (at the moment) the third lower high in a row, creating a short-term bearish indicator. The decaying volume, as well as an increase in sell pressure around the $13,200 level, supports the claim that Bitcoin is more likely to retrace first before moving up.

Traders should pay attention to how BTC approaches $13,180 and if it (more likely) enters a price correction phase, or if it rather (less likely) pushes past $13,180 and towards #13,900.

BTC/USD 4-hour Chart

Bitcoin’s technicals are a bit more bearish than the day before, despite its price being a bit higher. Its 4-hour, daily and weekly overviews all have sell-tilted oscillators and buy-tilted moving averages, while the overall summary is slightly bullish. The monthly overview is still fully bullish.

BTC/USD 1-day Technicals

Technical factors (4-hour Chart):
  • Price is above both its 50-period EMA and its 21-period EMA
  • Price is slightly above its middle Bollinger band
  • RSI is slightly below being overbought (61.54)
  • Volume is descending
Key levels to the upside          Key levels to the downside

1: $13,200                                 1: $12,870

2: $13,900                                 2: $12,500

3: $14,000                                  3: $12,300

Ethereum

Ethereum has spent the day following its ascended trading channel but to the downside. The second-largest cryptocurrency by market cap bounced off of the $420 highs as it couldn’t pass either of the $415 and $420 resistance levels and pushed towards the downside. The move will most likely end somewhere between $400 and $378. However, if Bitcoin pushes towards the upside, Ethereum will most likely abandon its current pattern and trade alongside it.

Traders should watch for how Ethereum retraces and what it does after, as many safe trading patterns may emerge from that.

ETH/USD 4-hour Chart

Ethereum’s technicals are quite confusing, as its 4-hour overview is completely bearish, while its daily overview is completely bullish. Its weekly and monthly overviews are tilted towards the buy-side, but the weekly one is slightly more neutral.

ETH/USD 1-day Technicals

Technical Factors (4-hour Chart):
  • The price is below both its 50-period and its 21-period EMA
  • Price is at its lower Bollinger band
  • RSI is nearly oversold (38.94)
  • Volume is average
Key levels to the upside          Key levels to the downside

1: $415                                     1: $400

2: $420                                     2: $378

3: $435                                      3: $371

Ripple

The fourth-largest cryptocurrency by market cap trying to decide its direction. Its price started to fall down after it failed to break $0.26, but it was expected for the ascending trend line (yellow dotted line) to hold at least for a bit more. However, XRP quickly broke that level to the downside, opening itself towards more possibility of moving down.

On the other hand, some people call the most recent moves a bull flag and are entering long positions. While this is unlikely, all traders must be aware of and respect this stance as well before entering their own trades.

XRP/USD 4-hour Chart

XRP’s technicals split into two sides, with the 4-hour and monthly overviews being tilted towards the sell-side and daily and weekly overviews being tilted towards the bull-side (with a bit of neutrality).

XRP/USD 1-day Technicals

Technical factors (4-hour Chart):
  • The price slightly below both its 50-period EMA and its 21-period EMA
  • Price is between its lower and middle Bollinger band
  • RSI is ascending (42.18)
  • Volume is average
Key levels to the upside          Key levels to the downside

1: $0.26                                     1: $0.2454

2: $0.266                                   2: $0.235

3: $0.2855                                3: $0.227


Categories
Crypto Market Analysis

Daily Crypto Review, Oct 26 – JP Morgan Calls Bitcoin “Currency With A Large Upside Potential”; Crypto Preparing For A Big Move

The cryptocurrency sector spent the weekend hovering around the same spot as Bitcoin was testing its ~$13,000 level. Bitcoin is currently trading for $13.049, representing a decrease of 0.80% on the day. Meanwhile, Ethereum lost 1.52% on the day, while XRP gained 0.18%.

 Daily Crypto Sector Heat Map

If we check out the top 100 cryptocurrencies, Flexacoin gained an astonishing 171.94% in the past 24 hours, making it the crypto to gain the most in a day. Filecoin (56.89%) and Reserve Rights (13.22%) also did great. On the other hand, Energy Web Token lost 7.94%, making it the most prominent daily loser. It is followed by Cosmos’ loss of 5.78% and ABBC Coin’s loss of 5.71%.

Top 10 24-hour Performers (Click to enlarge)

Bottom 10 24-hour Performers (Click to enlarge)

Bitcoin’s market dominance level had increased slightly since when we last reported, with its value is currently 61.1%. This value represents a 0.3% difference to the upside when compared to when we last reported.

Daily Crypto Market Cap Chart

The crypto sector capitalization has stayed at the same place since we last reported. Its current value is $396.38 billion, representing an increase of $1.83 billion compared to our previous report.

_______________________________________________________________________

What happened in the past 24 hours?

_______________________________________________________________________

_______________________________________________________________________

Technical analysis

_______________________________________________________________________

Bitcoin

The largest cryptocurrency by market capitalization has spent the weekend hovering around the $13,000 mark, and even attempted to break through the $13,200 resistance level (but failed to). With the volume is descending ever since Oct 21, most analysts are expecting a big move very soon. However, they are torn when it comes to the direction.

Traders should pay attention to how BTC handles its push towards the resistance level, as there might be good trading opportunities after (more likely) the level holds and a pullback occurs, or after BTC breaks the level and pushes higher (less likely).

BTC/USD 4-hour Chart

Bitcoin’s sentiment is highly bullish, with its shorter time-frames showing a bigger tilt towards neutrality, while its longer time-frames are more titled to the buy-side.

BTC/USD 1-day Technicals

Technical factors (4-hour Chart):
  • Price is far above its 50-period EMA and slightly above its 21-period EMA
  • Price is at its middle Bollinger band
  • RSI is slightly below being overbought (62.22)
  • Volume is descending
Key levels to the upside          Key levels to the downside

1: $12,870                                 1: $12,500

2: $13,200                                 2: $12,300

3: $14,000                                  3: $12,000

Ethereum

Ethereum has continued its descent from the highs it made on Oct 22, with its price moving slowly towards the downside. The smaller time-frame charts are showing that ETH kept creating new lower highs, with one (failed) attempt to break out of the trend. The next couple of hours will be crucial, as Ethereum is about to hit the trend line, break it or continue pushing down towards $400.

Traders should watch for how Ethereum reacts to the descending trend line and trade off of it.

ETH/USD 2-hour Chart

Ethereum’s technicals are tilted towards the buy-side on all time-frames, with its lower time frames being slightly more neutral.

ETH/USD 1-day Technicals

Technical Factors (4-hour Chart):
  • The price is above its 50-period and slightly above its 21-period EMA
  • Price is at its Bollinger band
  • RSI is overbought (52.24)
  • Volume is average
Key levels to the upside          Key levels to the downside

1: $415                                     1: $400

2: $420                                     2: $378

3: $435                                      3: $371

Ripple

The fourth-largest cryptocurrency by market cap spent the weekend testing its ascending support level (the dotted yellow line), which dates back from Oct 16. XRP has slowly descended from its most recent highs and reached the support line at the ~$0.252 level. The line provided good support, and XRP shot up as a result of it. However, it could not break the $0.26 resistance level, which may prove a problem in the long run.

XRP is unlikely to pass $0.26 unless it is fueled by Bitcoin’s push towards the upside. The more likely scenario would be that XRP hovers between the support line and the $0.26 level for some time.

XRP/USD 4-hour Chart

XRP’s technicals are bullish with hints of neutral sentiment on the 4-hour, 1-day, and 1-week time-frames, while its monthly time-frame shows strong bearish sentiment.

XRP/USD 1-day Technicals

Technical factors (4-hour Chart):
  • The price above both its 50-period EMA and its 21-period EMA
  • Price is near its top Bollinger band
  • RSI is ascending (58.25)
  • Volume is elevated
Key levels to the upside          Key levels to the downside

1: $0.26                                     1: $0.2454

2: $0.266                                   2: $0.235

3: $0.2855                                3: $0.227


Categories
Cryptocurrencies

What is Bella? Here’s All You Need to Know

It’s safe to say the future of finance is DeFi. DeFi, short for decentralized finance, is not only the idea of a democratized finance system but one with new and bold propositions for users. Blockchain-based finance will phase out intermediaries and inject transparency and fairness into the system. 

Bella is one of the projects in the middle of the DeFi action. It provides an array of DeFi products to benefit users and push DeFi into the mainstream. 

The Bella team believes “users deserve much better mobile products with elegant design and smooth user experience.” It aims to avail crypto to mobile – the gadgets we most interact with – like never before. 

Bella stands out as the first DeFi project hosted by Binance’s Launchpool platform – an initiative by the world’s largest crypto exchange to actualize the DeFi concept to Binance users. 

Breaking Down Bella

Bella Protocol is a suite of DeFi products such as yield farming, automated lending, one-click savings, a robot advisor, and more. The Bella team wants to make crypto investment more accessible for everyone with the aid of automated smart contracts and the security of the blockchain. 

The Bella team wants to correct the current situation in which users are barred from entering DeFi by high gas fees, slow speeds, and poor user experiences. On Bella, users can simply deposit crypto and gain back high returns. 

The Bella team comprises blockchain veterans with years of experience in finance, cryptography, and engineering. Bella has been imagined by the same team behind the ARPA project. 

Motivation Behind the Bella Protocol

The Bella team wants to address certain pain points that encumber the DeFi space right now. Thus, Bella protocol development is guided by the following: 

  • DeFi is a trillion-dollar market whose rise is much due to stablecoins
  • Despite all the hype and buzz, just 1% of crypto users are actively engaged in DeFi.
  • DeFi users still have to grapple with things like high gas fees, poor user experience, and the complexity of smart contracts. 
  • DeFi users are highly motivated by the promise of high yields through liquidity mining.
  • There’s a need for interoperability across various DeFi platforms for the best user experience.
  • The mobile phone will be the next big thing in both DeFi and CeFi (centralized finance)

Planned Products

#1. Liquidity mining: Users can stake in a variety of crypto tokens and gain BEL rewards. Currently, you can stake in Curve ARPA/USDC, BEL/USDC Liquidity Provider tokens.

#2. Flex savings: Bella supports optimized arbitrage yield farming strategies for both stablecoins and cryptocurrencies.

#3. One-Click Asset Deployment.

#4. Bella supports a smart portal for deploying popular DeFi products with minimal gas fees. 

#5. Lending: Bella supports flexible, secure, decentralized money markets where users can earn yields from staking, earn referral bonuses, and more.

#6. Robo-advisor 

This tool generates customized user risk profiles of indexes, stablecoins, and other crypto assets.

Main Features of Bella Protocol

#1. Automation

Bella plays heavily into automation. It enables a one-click investment process, where you can “sit back and watch your assets grow” while the code does all the work.

#2. Very Minimal to Zero Gas Fees

The Bella team believes everyone should have access to premium financial services. As such, you’ll encounter very minimal to zero gas fees while interacting with the platform.

#3. Best Yield 

Bella wants the particles to be a route for some of the best competitive returns in the market.

The BEL Token 

BEL is the native cryptocurrency of the Bella ecosystem, and it plays the following roles: 

  • Fee Collection: Part of transaction and service revenue from the ecosystem will be channeled towards BEL token stakers, referral channels, operations, and the risk reserve (an insurance resolve of salts to composite uses in the event of security breaches)
  • Discounts: BEL token holders get to enjoy discounts on services. For example, if you use the robo advisor and pay in BEL, you pay less.
  • Staking: Users will be able to earn staking rewards when they hold BEL tokens 
  • Voting and governance: Holding BEL tokens will entitle users to make their voice heard on major decisions such as product upgrades, new releases, partnering products, and so on 

Distribution of BEL

BEL tokens were distributed this way:

  • Binance launchpad tokens: : 5%
  • Private sale: 6%
  • Public auction tokens: 2%
  • Ecosystem tokens 18%
  • Project reserve tokens: 4%
  • User growth tokens: 40% 
  • Staking rewards tokens: 10%
  • Team tokens: 15%

Bella Community Growth Strategies 

The Bella team plans to implement several strategies in a bid to expand its community growth in the coming months and years. Current strategies include: 

  • Carrying out token auctions
  • Carrying out token airdrops to ARPA token holders
  • Actively engaging the community on social media platforms.
  • Launching the liquidity rewards program

Future strategies include the following: 

  • Partnering with other DeFi lending protocols to push BEL usage 
  • Partnering with decentralized exchanges (DEXes) so they can list BEL.
  • Collaborating with other DeFi platforms for BEL to be accepted as part of incentivized staking pools
  • Launching the Flex Savings and One-Click Portal to push the referral program
  • Enabling Fiat gateways to cater to a wider user base 

Tokenomics of BEL

As of October 8, 2020, BEL is trading at $1.08, with a market cap of $15,648,898, which places it at #381 in the crypto market. The token has a 24-hour volume of $3,960,114, a circulating supply of 14,500,500, and a total and maximum supply of 100 million. BEL’s all-time high was $10.03 (Sep 15, 2020), while its all-time low was $1.20 (Oct 03, 2020). 

Buying and Storing BEL

Currently, BEL is listed in Binance, Binance.KR, MXC, and Bilaxy, BKEX, HotBit, BitAsset, and Fatbtc. You’ll find the token paired against either USDC, BTC, BNB, BUSD, USDT, and more. 

You can store BEL tokens in either of several great wallets, including Ledger, Trezor, Atomic Wallet, Trust, and more. 

Closing Thoughts 

Bella is a DeFi lending protocol that seeks to differentiate itself by offering services for very little to no fees, a robo advisor to help users make the best out of their portfolio, and by targeting mobile users. And while other DeFi projects seek to avoid the CeFi space as much as possible, Bella works with it to provide a hybrid experience to users. Will these factors propel the protocol ahead or not? That remains to be seen. 

Categories
Crypto Market Analysis

BTC/USD Chart Overview + Possible Outcomes

In this weekly BTC /USD analysis, where we are looking at the most recent events, the current technical formations, as well as discussing possible outcomes.

Overview

Bitcoin has had another week of explosive gains, mostly due to its fundamentals. This week’s spike can’t go without mentioning PayPal’s announcement that it will enable its users to buy, sell and hold crypto, as well as that it will not be just a gimmick but rather a crucial factor in PayPal’s future business development (PayPal will offer crypto payments to its 26 million merchants, as well as enable the usage of crypto on its payment processing app Venmo). This news, alongside other news of large corporations investing tens of millions in Bitcoin and crypto, sparked the push past $12,000 and up to $13,235.

Technical factors


Bitcoin has abruptly left its triangle formation last week, pushing a little above $11,700 before consolidating and pulling back. After being pressed between $11,300 and $11,500 for some time, the PayPal news broke out, and Bitcoin surged, reaching as far as $13,235 before the move stopped.
Bitcoin is now in a consolidation phase, creating a triangle formation on the smaller time-frames. The formation is accompanied by descending volume, indicating that the move that will follow will be quite strong. Its RSI is overbought on all time-frames above 4 hours, while its moving averages are at play only at the 1-hour chart, where the current price is supported by the 21-period moving average.
Sentiment built around Bitcoin is certainly bullish at the moment, and any serious downturns are very unlikely. However, a slight pullback before the next push is likely.
Another thing to add is that Bitcoin is one step away from moving into the “fresh air” territory (after the 2019 high of $13,900) where there is no technical or historical volume ahead, meaning that this territory will be full of new people entering the market to chase profits as well as smart money taking profits.

Likely Outcomes

Bitcoin currently has two main scenarios it can play out. Both of these scenarios are bullish, where one breaks out above the current 1h time-frame triangle formation to the upside and past the $13,200 area, while the other one involves a pullback before the spike.
1: As shown in the chart, Bitcoin will most likely have to retrace slightly and reset its RSI level. While the bull sentiment is prevailing, the largest cryptocurrency by market cap should establish and confirm its support at the ~$12,500 level (which it breezed through) before going further up.
2: The other scenario is slightly less likely, and involves a simple breakout scenario of the current triangle formation to the upside and a push towards (ultimately) $13,900. This level will certainly be contested as it is the last frontier before the all-time high territory. On top of that, many investors will most likely take profit at this level.

The scenario in which Bitcoin suddenly down sharply and swiftly is incredibly unlikely. While a strong move in this direction is possible only if it’s backed by some bearish news/events, the bull phase Bitcoin is in at the moment is highly resistant to bad news.

Categories
Crypto Videos

Crypto Going Mainstream In 2021 As Paypal Adopts Bitcoin – Go Get Your Lambo!

Crypto Going Mainstream in 2021 – MAJOR Adoption by PayPal and Venmo


PayPal has officially confirmed on Wednesday, October 22, that it is entering the cryptocurrency market. The payments provider giant, with over 346 million active accounts all around the world, has pledged to make cryptocurrency not only an optional feature but rather “a funding source for purchases at its 26 million merchants worldwide.” PayPal also plans to expand this service to its peer-to-peer payment app Venmo in the first half of 2021.

The public already knew that PayPal was planning on moving into crypto in June, but the information came from anonymous sources, and nothing was certain. A month later, the Paxos exchange had been selected to act as support in PayPal’s crypto endeavors.
In a blog post that came out on Wednesday, PayPal said that the current pandemic had made it clear that people need digital payments of all sorts.
Starting in early 2021, PayPal’s customers will be able to instantly convert one of the supported cryptocurrencies to fiat currency, with no added incremental fees, PayPal said. Merchants will have no additional fees or integrations as all transactions will not be settled in crypto but rather in fiat currency at their current PayPal rates.

“Cryptocurrency simply becomes another funding source in the PayPal digital wallet, adding more utility to cryptocurrency holders, while addressing concerns surrounding volatility, cost as well as the speed of cryptocurrency-based transactions,” PayPal announced.
PayPal will initially have a $10,000 weekly buying cap as well as a $50,000 limit per 12-month period. All trades must be executed in US dollars, PayPal stated.

Everything sounds good… But!

As bullish the Bitcoin market has proven to be about this news at the moment, an initial review of the crypto services PayPal offers has a couple of cons. First off, the company will take a go-slow mindset, which is the complete opposite of how the markets reacted to the most recent adoption news. Critical caps limit who the buyers are, how much they can actually buy, and what they can do with their PayPal- sourced crypto. While this is not necessarily bad, crypto enthusiasts should take everything slow and with a grain of salt rather than instantly calling for the moon and ordering their Lambos.

However, there is completely bad news, rather than just a slight setback. PayPal is refusing to hand its customers’ crypto keys over, meaning that you own the cryptocurrency you buy on PayPal. Still, just like on centralized exchanges, you will not be provided with a private key,” PayPal casts this restriction as a loss-prevention tactic.
Another bad thing is that the users will not be allowed to send their crypto around or even withdraw it. PayPal stated that “you can only hold the crypto that you buy on PayPal in your account. The cryptocurrency in your account cannot be sent to other accounts on PayPal or off it.” This brought a lot of questions on whether PayPal’s crypto feature will have “paper Bitcoin” or if it will be covered by real cryptocurrency.


However, PayPal’s partnership with Paxos should be good enough proof that the crypto held on the payment provider will be the real deal. The New York State Department of Financial Services announced that it had granted the “conditional BitLicense” to PayPal, the first of its kind. The BitLicense was granted for a partnership with the Paxos Trust Company, enabling PayPal customers to buy and sell cryptocurrencies. Four DFS-approved digital assets that will be initially available are Bitcoin, Bitcoin Cash, Ether, as well as Litecoin, according to the DFS statement.
The service rollout also faces quite a few real-world restrictions. Out of the 50 US states, only 49 have coverage at launch, as Hawaii is excluded from the list.


Conclusion

Bitcoin and other cryptocurrencies rallied following this announcement, which is just one of several major recent mainstream corporate adoption signs in 2020. The PayPal event happened following Microstrategy’s $425 million Bitcoin investment, as well as a similar but more modest move by Square.

Categories
Crypto Market Analysis

Daily Crypto Review, Oct 23 – PayPal Enabling Crypto Not as Good as it Sounds; Ethereum Pushes Towards $420

The cryptocurrency sector was mostly consolidating after Bitcoin’s surge, with almost every single cryptocurrency in the top100 ending up in the green. Bitcoin is currently trading for $12,961, representing an increase of 1.21% on the day. Meanwhile, Ethereum gained 5.64% on the day, while XRP gained 2.34%.

 Daily Crypto Sector Heat Map

If we check out the top 100 cryptocurrencies, Ampleforth gained 19.04% in the past 24 hours, making it the crypto to gain the most in a day. Energy Web Token (17.44%) and Reserve Rights (12.20%) also did great. On the other hand, Filecoin lost 13.57%, making it the most prominent daily loser. It is followed by HedgeTrade’s loss of 8.57% and ABBC Coin’s loss of 8.49%.

Top 10 24-hour Performers (Click to enlarge)

Bottom 10 24-hour Performers (Click to enlarge)

Bitcoin’s market dominance level had decreased slightly since when we last reported, with its value is currently 60.8%. This value represents a 0.4% difference to the downside when compared to when we last reported.

Daily Crypto Market Cap Chart

The crypto sector capitalization has experienced an increase since we last reported. Its current value is $394.96 billion, representing an increase of $4.72 billion compared to our previous report.

_______________________________________________________________________

What happened in the past 24 hours?

_______________________________________________________________________

While most of the market rejoices Bitcoin’s surge, confirmation of a bull market, and PayPal enabling its users to buy, sell and hold crypto, not everyone is equally happy. Some analysts have pointed out that PayPal will almost certainly bring adoption, but perhaps at a steep price. If the payment processor giant doesn’t get involved in the community and refuses to give private keys to its users, the benefits may not outweigh the setbacks.

With that being said, additional adoption and introduction of Bitcoin to the wider masses is certainly a positive thing.

_______________________________________________________________________

Technical analysis

_______________________________________________________________________

Bitcoin

The largest cryptocurrency by market capitalization stayed strong after yesterday’s push and even gained some more value. The price pushed past $13,000 once again but couldn’t hold the level, which prompted a pullback towards the sub-$13,000 level. However, the $12,870 level has turned to a support level (though it still needs proper confirmation), which is certainly positive.

At the moment, traders should look Bitcoin’s pullback and trade-off of that. However, if Bitcoin manages to push past $13,000 with confidence, traders shouldn’t wait much but rather join in quickly.

BTC/USD 4-hour Chart

Bitcoin’s technical overview has a strong bullish sentiment on longer time-frames (weekly and monthly), while its short-term sentiment is slightly more neutral.

BTC/USD 1-day Technicals

Technical factors (4-hour Chart):
  • Price is far above its 50-period EMA and at its 21-period EMA
  • Price between its middle and top Bollinger band
  • RSI is overbought but descending(73.99)
  • Volume is extremely elevated
Key levels to the upside          Key levels to the downside

1: $12,870                                 1: $12,500

2: $13,200                                 2: $12,300

3: $14,000                                  3: $12,000

Ethereum

Ethereum’s push from yesterday was just a weaker iteration of Bitcoin’s push. However, the second-largest cryptocurrency by market cap has pushed further towards the upside on its own today, testing the $415 and $420 levels. While tests towards both levels failed, Ethereum is still very near $415 and may have the opportunity to strike again, or just consolidate near this level.

Traders should pay attention to Ethereum’s pullback towards $400 or push past $415 and trade off of that.

ETH/USD 4-hour Chart

Ethereum’s technicals are slightly confusing, as its 4-hour overview is completely bullish, while its daily overview is neutral-bullish. However, its long term technicals all tilt towards the buy-side.

ETH/USD 1-day Technicals

Technical Factors (4-hour Chart):
  • The price is far above its 50-period and its 21-period EMA
  • Price is near the top Bollinger band
  • RSI is overbought (75.95)
  • Volume is elevated
Key levels to the upside          Key levels to the downside

1: $415                                     1: $400

2: $420                                     2: $378

3: $435                                      3: $371

Ripple

The fourth-largest cryptocurrency by market cap had a day filled with volatility, ups, and downs. XRP started the day off strong with a push past $0.26 and towards $0.266. However, bulls have reached exhaustion quickly, and bears stepped in, pulling the price back down to $0.257, where XRP is now consolidating.

XRP has a high-resistance zone above $0.26, which we have seen today as well. For this reason, it is much more plausible that XRP will push towards the downside and retest the $0.25 or $0.2454 levels.

XRP/USD 4-hour Chart

XRP’s technicals are extremely bullish on the 4-hour and 1-day chart, while they are tilting towards the sell-side the longer time-frame we choose.

XRP/USD 1-day Technicals

Technical factors (4-hour Chart):
  • The price far above its 50-period EMA and above its 21-period EMA
  • Price is between its middle and top Bollinger band
  • RSI has left the overbought territory (61.12)
  • Volume is elevated
Key levels to the upside          Key levels to the downside

1: $0.26                                     1: $0.2454

2: $0.266                                   2: $0.235

3: $0.2855                                3: $0.227


Categories
Crypto Videos

Uniswap Monthly Volume Surpasses Coinbase!

Uniswap Monthly Volume Surpasses Coinbase; The DeFi Craze Continues


Data coming from Dune Analytics shows that Uniswap DEX has processed over $15.3 billion in volume in September only. In the same period, reports show that the centralized exchange giant Coinbase processed only $13.6 billion.

The significant spike in volume Uniswap had can be attributed to two major factors:
First, the explosive growth of the decentralized finance sector and yield farming of various governance tokens caused decentralized exchanges to thrive. Second, the launch of Uniswap’s own governance token has led to a frenzy on the platform.

The month of June marked the start of a DeFi governance token frenzy, with Compound’s COMP token being at the forefront of it. The process is relatively simple: DeFi users stake various cryptocurrencies and “farm” new governance tokens by doing that. The DeFi protocols that release the underlying governance tokens in a decentralized manner distribute them to the users who are staking funds. Once users successfully obtain the new tokens, they typically hold them until they are listed on a centralized exchange, where it could be easily sold.

Top cryptocurrency exchanges have to take various factors into consideration before listing tokens. The criteria for listing coins can include liquidity, developer activity, and track record. For new governance tokens and DeFi-related cryptocurrencies, it has proven to be a nearly impossible feat to meet those requirements.
Uniswap has, mostly for the aforementioned reasons, eventually evolved into the go-to platform when it comes to trading DeFi tokens, and the surge in total value locked in DeFi translated into intensified growth of Uniswap’s volume as well.

DEX Volume VS. Yield Farming

Uniswap’s volume has first surpassed Coinbase Pro in daily volume on August 30. Ever since then, it has continuously remained very competitive with the top US exchange. Uniswap creator Hayden Adams said in late August:
Wow, Uniswap’s daily trading volume is higher than Coinbase for the first time ever. Uniswap: $426M, Coinbase: $348M. It’s hard to express how crazy this is.” The consistently high performance coming from Uniswap occurred despite a very considerable slowdown in the yield farming craze. This suggests that, while the yield farming craze has been tamed, the uptrend of decentralized exchanges is sustainable over the long term.

The last couple of weeks brought a slight price drop of DeFi tokens, which also caused a drop in user activity in the yield farming space. The researchers at Dune Analytics are, however, not interpreting this as a bearish signal. Instead, they said:

“Despite the yield farming craze calming down, decentralized exchange volumes crushed old records in September, with $24 billion traded, up 100% from August. While the last few weeks were down when compared to the beginning of the month, all weeks in September were well-above the peak week from August.”

Ethereum analysts Anthony Sassano said that it also reflects the overwhelmingly positive sentiment that investors have for Ethereum. He said: “They told you that the decentralized exchanges on Ethereum were a fad – but they were so incredibly wrong. DEXs did $23.5 billion in volume in September alone! Betting against Ethereum has, is, and always will be a bad move.”

Categories
Cryptocurrencies

What’s PerlinX (PERL) All About?

Following Blockchain’s birth, the financial landscape is changing very fast. Now we’re talking of decentralized finance (DeFi), synthetic assets, liquidity pools, and other concepts that simply didn’t exist before. And all these are to the benefit of millions of people across the globe who were previously excluded from the financial system. 

PerlinX is a DeFi project that wants to “democratize the trading of real-world assets through decentralized liquidity pools and synthetic asset generation.” 

It’s among the many DeFi projects that are recently catching on and providing unparalleled value to users. In the traditional finance system, you can put up your money to generate yield. And sure, it will, but meager yields which take forever to add up to anything substantial. 

With PerlinX, you can earn nice rewards for simply staking in the PERL token. Let’s dive into the protocol and see how it works. We’ll also see the platform’s major driver – the PERL token, and how exactly it keeps the ecosystem moving. 

Understanding PerlinX 

Perlin is a DeFi platform where users can create and trade assets through a synthetic liquidity pool. Perlin will initially be focusing on synthetic assets. Platform users will be able to stake PERL tokens and earn rewards. Rewards will be in the form of PERL, UMA, and BAL tokens. PerlinX will also utilize the UMA protocol for the generation of synthetic assets. 

On the PerlinX platform, each asset will have its own real-time price feed, supported by the Data Verification Mechanism (DVM) supported by UMA. The DVM is designed to provide accurate and incorruptible price feeds. 

Synthetic assets on PerlinX will begin with the prefix ‘px’, as in pxGold, pxETH, pxCarbon, and so on. Also, for users to create synthetic assets on PerlinX, they must first deposit PerlinX as collateral. For now, the PerlinX protocol will support five assets, namely TUSD, BUSD, USDC, BAL, and ETH. 

What Can You Do on PerlinX? 

Below is how you can interact with the PerlinX platform: 

#1. Deposit crypto and earn rewards 

Platform users can stake in PERL and earn incentives as a result. Staking provides liquidity to the platform for borrowers who pay back with interest. 

#2. Create synthetic assets 

Users can utilize the PerlinX platform to create network assets of any type. To create a synthetic asset, a user must first deposit PERL as collateral. 

Roadmap for PerlinX 

After enabling users to earn incentives for staking in PERL, the team plans to embark on the following steps immediately: 

  • Start minting pxTokens.
  • Identify potential security loopholes on the platform and fix them immediately.
  • Improve user experience to facilitate staking and things like liquidation procedures and settling disputes.
  • Come up with a long-term incentivization mechanism for liquidity providers and synthetic asset creators.

Future Roadmap

  • Work to narrow the gap between the existing financial system and DeFi, and rally for more support for digital assets and more emerging complex assets like regulated securities
  • Work to improve the underlying Automatic Market Maker and synthetic assets mining process to realize better efficiency.

The PERL Token

PERL is the native utility token of the PerlinX platform. It will play a central role in the running of the ecosystem – and the two key roles will include the following: 

  • As a staking mechanism to earn incentives 
  • As collateral to be able to create synthetic pxTokens

How PERL Tokens Were Distributed

The PerlinX team distributed PERL in the following fashion: 

  • Seed sale tokens: 20%
  • Strategic sale tokens: 19.49%
  • Private sale tokens: 8.36%
  • Public sale tokens: 8.38%
  • Team tokens: 15%
  • Advisors: 9.65%
  • Treasury tokens: 19.12%

Key Metrics of PERL

As of September 29, 2020, the PERL token traded for $0.026798, with a market cap of $12,947,152, which placed it at #436. PERL had a circulating supply of 483,139,908 and a total supply of 1, 033,200,000. The token’s all-time high was $0.132243 (Aug 26, 2019) and an all-time low of $0.010643 (March 28, 2020), per Coinmarketcap. 

Buying and Storing

Today, you’ll find PERL listed as a market pair of BTC, USDT, BNB, WETH, BUSD, PERL, TUSD, BTC, and BAL in either of these exchanges: Binance, Bilaxy, CoinDXC, HotBit, TOKOK, Balancer and Uniswap (V2). 

You can store PERL tokens in Ledger, Trezor, Trust, Atomic, and MyEtherWallet wallets. 

Closing Thoughts

PerlinX is one of the bold projects that we’re seeing emerging in the DeFi space. The more these projects are, the more choices for DeFi users.

Categories
Cryptocurrencies

XZEN Hardware Wallet Review: Security, Fees, Ease of Use, Pros, And Cons

XZEN website describes its hardware wallet as a “Hybrid cybersecurity system” that “Combines hardware, software, and services” in guaranteeing maximum security, transparency, and the highest levels of user experience. It was designed and developed by an Estonian Virtual currency wallet and exchange services provider, XZEN EST Ltd, and launched in 2018. It is the native wallet for the XZEN exchange and features a mobile app companion that hosts such interactive services as the crypto exchange and payment service processor.

According to XZEN founder Dmitry Laptev, this highly innovative and versatile Crypto was born of the need to change the security architecture around hardware wallets. It is especially aimed at eliminating the chances of losing your digital assets because of a forgotten PIN or lost backup seed. It is also one of the few hardware wallets that support fiat currencies.

This review will be vetting the hardware wallet to determine if it is as secure and easy to use as advertised. We will outline its key operational and security features, provide you with a step-by-step guide on how to set up and use XZEN wallet, check the number of supported currencies, and compare it with other hardware wallets.

XZEN Wallet key features

On-device screen: XZEN hardware wallet features a 2.4-inch high-resolution LCD screen that is large enough to fit the entire wallet address.

Mobile compatibility: The hardware wallet has a mobile (Android/iOS) and desktop (Windows/macOS/Linux) app companions that host most of XZEN’s interactive features such as the crypto exchange and portfolio tracking tools.

Inbuilt exchange: XZEN hardware wallet users also interact with the XZEN decentralized exchange hosted on the mobile and desktop apps. The wallet is hybrid and supports both crypto-to-crypto as well as fiat-to-crypto exchanges. Also, it allows you to buy Crypto virtually via any credit/debit card.

Instant transfers: Cryptocurrency transfers on the XZEN platform are instantaneous. Moreover, transfers within the wallet’s ecosystem (from one XZEN wallet to another) do not attract additional charges or commissions.

Contactless payments: Embedded in the XZEN hardware wallet device is an NFC chip that powers contactless payments. It allows you to pay for goods and services in millions of stores worldwide without necessarily connecting your device to the store’s hardware. The chip is also attributed to one of the wallet’s coolest features – wireless charging.

Wireless connections: Just like you don’t need to physically connect an XZEN hardware device to a store’s systems to pay for goods, you also don’t need to connect it to your computer or mobile phone to transfer coins. It is fitted with the Bluetooth 4.2 technology used to communicate with its app companion via a highly secure and AES encrypted channel.

Steel case: The XZEN wallet components are protected by an airtight steel casing that is both dust and waterproof.

Security features

PIN Code + Touch ID: XZEN hardware wallet embraces a multilayered security feature that constitutes both a PIN Code and Touch ID.

Encrypted CPU: The hardware wallet will also feature a highly encrypted CPYU/secure element on which your private keys are stored.

Cold storage: XZEN hardware wallet maintains that the private keys for digital assets are always kept in a 100% offline device and never leave the wallet.

Two-factor authentication: All transfers out of your XZEN wallet must be subjected to two-factor authentication. While you can initiate the outbound transaction via the mobile or desktop app, it must be authorized by the hardware device.

Licensed: XZEN EST Limited is a licensed virtual currency wallet and exchange services provider, authorized and regulated by Estonia’s Financial Intelligence Unit (FIU).

How to set and activate the XZEN wallet

Step 1: Start by ordering the XZEN hardware device from the XZEN wallet’s official website.

Step 2: Open the XZEN wallet official website. Click on the “APP” page. Download the wallet app that is compatible with your phone or computer.

Step 3: Install and launch the app.

Step 4: Choose a username and create a unique multi-character password for the wallet app.

Step 5: Turn on the XZEN hardware wallet and pair it to the phone app via Bluetooth or the USB cable.

Step 6: Once paired, the hardware wallet will request you to create a PIN code and set up the fingerprint ID.

Step 7: It will then provide you with a 12-word recovery seed

Step 8: The wallet will now generate a wallet address that you can use to add/receive funds

How to add/receive Crypto into your XZEN wallet

Step 1: Log into your XZEN crypto wallet app and click on the “Receive” button.

Step 2: Copy the wallet address or QR code provided and send them to the individual sending you coins.

Step 3: Wait for the funds to reflect on your wallet.

How to send Crypto from your XZEN wallet

Step 1: Log in to your XZEN crypto wallet app and hit the “Send” icon.

Step 2: Select the cryptocurrency or token you wish to transfer, especially if you have multiple wallet addresses

Step 3: Enter the recipient address and amounts you want to send

Step 4: Turn on and login to XZEN hardware wallet.

Step 5: Connect the phone or computer to the hardware device via the cable or Bluetooth

Step 6: Confirm that the transaction details are correct and authorize the transaction.

XZEN wallet ease of use

XZEN has one of the most intuitive interfaces – for both the hardware device and the mobile/desktop apps. They are both clean and easy to navigate with little to no help. Several text and video guides throughout the XZEN wallet website can help you master your way around the device and apps. These come in handy in teaching you how to send or receive cryptos via XZEN and in figuring out your way around the crypto exchange.

These, plus the relatively easy and straightforward onboarding process, make XZEN wallet one of the most intuitive hardware wallets.

XZEN wallet supported currencies

XZEN is a multicurrency hardware wallet that is yet to embrace multiple cryptos and tokens. Currently, you can only host Bitcoins, Ethereum, and ERC-20 tokens on the wallet, but the XZEN website hints about an upcoming upgrade that incorporates more popular cryptos.

XZEN wallet cost and fees

XZEN hardware wallet costs $120.

Crypto exchanges within the decentralized exchange and crypto transfers to other XZEN wallets are free. Nevertheless, you will pay a variable network fee every time you send cryptos and tokens to external wallets and exchanges.

What are the pros and cons of using the XZEN Wallet?

Pros:

  • Crypto transfers from one XZEN wallet to another are free.
  • It integrates a hybrid exchange that allows you to pay for Crypto using a card.
  • Embraces a wide range of security and privacy features.
  • Supports anonymous user registration and trading.
  • Your private keys are held in offline cold storage and never leave the wallet.

Cons:

  • Supports a limited number of cryptocurrencies
  • Requires you to verify identity if you want to pay for Crypto via card

Comparing XZEN wallet with other hardware wallets

XZEN wallet vs. Ledger Nano S wallet

XZEN and Ledger Nano S are both multicurrency hardware wallets. Some of the key security measures they have both implemented include the generation of wallet addresses offline, cold storage for private keys, and two-factor authentication. They also have an on-device screen that one can use to check crypto balances while offline and verify transaction details for outbound transfers.

The two, however, have several operational differences. For instance, while XZEN will only support two major cryptocurrencies, Ledger Nano supports 1000+ cryptos and tokens. The on-device screen for the Ledger wallet is smaller than the large and high-resolution color screen on the XZEN hardware wallet. Moreover, XZEN can be more versatile as it is complemented by feature-rich mobile and desktop companion apps.

Verdict: Is XZEN wallet safe?

Yes. With fingerprint protection, offline cold storage, two-factor authentication, password-protected apps, and recovery seed in place, XZEN hardware wallet has put in place adequate security measures around your private keys. And in appreciation of XZEN wallet’s security-focused approach, storing and managing digital assets, the company was honored with the Excellence in Finance Award in 2019 during the global FiNext Conference in Singapore. Our only reservations with the hardware wallet are its relatively expensive price ($120) and its support for a limited number of coins.

Categories
Crypto Market Analysis

Daily Crypto Review, Oct 22 – PayPal to Enable its Users to Buy and Sell Crypto; Bitcoin Skyrockets to $13,000 as a Response

The cryptocurrency sector has rallied up and skyrocketed as PayPal announced that it will now support cryptocurrencies. Bitcoin has led the rally with an almost double-digit increase. It is currently trading for $12,886, representing an increase of 7.25% on the day. Meanwhile, Ethereum gained 6.69% on the day, while XRP gained 4.78%.

 Daily Crypto Sector Heat Map

If we check out the top 100 cryptocurrencies, we can see that Reserve Rights gained 45.36% in the past 24 hours, making it the top daily gainer. Litecoin (16.03%) and Ampleforth (14.02%) also did great. On the other hand, ABBC Coin lost 18.97%, making it the most prominent daily loser. It is followed by Filecoin’s loss of 14.56% and The Midas Touch Gold’s loss of 7.03%.

Top 10 24-hour Performers (Click to enlarge)

Bottom 10 24-hour Performers (Click to enlarge)

Bitcoin’s market dominance level had increased slightly since when we last reported, with its value is currently 61.2%. This value represents a 0.7% difference to the upside when compared to when we last reported.

Daily Crypto Market Cap Chart

The crypto sector capitalization has experienced a huge increase since we last reported. Its current value is $390.24 billion, representing an increase of $23.98 billion compared to our previous report.

_______________________________________________________________________

What happened in the past 24 hours?

_______________________________________________________________________

_______________________________________________________________________

Technical analysis

_______________________________________________________________________

Bitcoin

The largest cryptocurrency by market capitalization has had quite an amazing day filled with volatility and extremely high bull presence. Fueled by PayPal’s announcement that it will enable its users to buy,  sell and hold crypto,  Bitcoin skyrocketed and reached as high as $13,235 before pulling back. It’s currently trying to consolidate just under the $12,870 resistance level.

Any skepticism regarding whether the bull market has started has been shattered with Bitcoin’s most recent move. However, while this move was intense, Bitcoin will need a lot of great news, adoption, and ultimately time to reach its all-time highs.

At the moment, traders should look at how Bitcoin handles the pullback and trade-off of that.


BTC/USD 1-day Chart

Bitcoin’s technical overview is very strongly tilted towards the buy-side on longer time-frames (weekly and monthly), while its short-term overviews are slightly more neutral.

BTC/USD 1-day Technicals

Technical factors (4-hour Chart):
  • Price is far above its 50-period EMA and at its 21-period EMA
  • Price above its top Bollinger band
  • RSI is extremely overbought (81.74)
  • Volume is extremely elevated
Key levels to the upside          Key levels to the downside

1: $12,870                                 1: $12,500

2: $13,200                                 2: $12,300

3: $14,000                                  3: $12,000

Ethereum

Ethereum has followed Bitcoin’s lead and pushed towards the upside, though with much less strength. Its price ultimately reached the $400 resistance before pulling back slightly. It is currently trying to consolidate right under the $400 level, which is still a great increase in price since yesterday when Ether was fighting to stay above $378.

Ethereum traders should pay attention to how the second-largest cryptocurrency by market cap handles its immediate resistance level, as well as an eventual further pullback.

ETH/USD 4-hour Chart

Ethereum’s technicals on all time-frames show bullishness, with its 4-hour and long-term technicals being a bit more tilted towards the neutral position, while its 1-day overview is completely bullish.

ETH/USD 1-day Technicals

Technical Factors (4-hour Chart):
  • The price is far above its 50-period and its 21-period EMA
  • Price is at the top Bollinger band
  • RSI is close to overbought (66.91)
  • Volume is elevated
Key levels to the upside          Key levels to the downside

1: $400                                     1: $378

2: $415                                     2: $371

3: $420                                      3: $360

Ripple

The fourth-largest cryptocurrency by market cap has, like yesterday, used the momentum that Bitcoin has provided to push further up. Its price has established itself above the $0.2454 support level and pushed past $0.25. However, the $0.26 resistance level has not fallen, and XRP is now consolidating at the ~$0.255 level.

XRP’s upside is a zone of strong resistance, which this cryptocurrency will hardly surpass without Bitcoin’s push. XRP traders should pay attention to Bitcoin’s moves while focusing on XRP’s moves towards the downside.

XRP/USD 4-hour Chart

XRP’s technicals have changed quite a bit since our last report. Its 4-hour, 1-day, and weekly overviews are strongly tilted towards the buy-side, while its monthly overview is still bearish with a slight hint of neutrality.

XRP/USD 1-day Technicals

Technical factors (4-hour Chart):
  • The price far above its 50-period EMA and above its 21-period EMA
  • Price is at its top Bollinger band
  • RSI is close to overbought (65.61)
  • Volume is below average
Key levels to the upside          Key levels to the downside

1: $0.26                                     1: $0.2454

2: $0.266                                   2: $0.235

3: $0.2855                                3: $0.227


Categories
Crypto Market Analysis

Daily Crypto Review, Oct 21 – Bitcoin Above $12,000; Bull Market in Full Swing

The cryptocurrency sector was mostly in the red until Bitcoin took the day to push past $12,000, after which some cryptos started following it towards the upside. Bitcoin is currently trading for $12.234, representing an increase of 4.21% on the day. Meanwhile, Ethereum gained 0.40% on the day, while XRP lost 0.31%.

 Daily Crypto Sector Heat Map

If we look at the top 100 cryptocurrencies, we can see that Nano gained 6.94% in the past 24 hours, making it the top daily gainer. Aave (5.59%) and OKB (5.41%) also did great. On the other hand, NXM lost 13.92%, making it the most prominent daily loser. It is followed by Reserve Rights’ loss of 13.85% and Arweave’s loss of 12.59%.

Top 10 24-hour Performers (Click to enlarge)

Bottom 10 24-hour Performers (Click to enlarge)

Bitcoin’s market dominance level has increased slightly since when we last reported, with its value is currently 60.5%. This value represents a 1% difference to the upside when compared to when we last reported.

Daily Crypto Market Cap Chart

The crypto sector capitalization has stayed at the same spot since we last reported. Its current value is $366.26 billion, representing an increase of $0.79 billion compared to our previous report.

_______________________________________________________________________

What happened in the past 24 hours?

_______________________________________________________________________

_______________________________________________________________________

Technical analysis

_______________________________________________________________________

Bitcoin

The largest cryptocurrency by market capitalization is pushing past its psychological and actual major resistance of $12,000 right at this moment. The move started slow, with one candle testing the waters above $12,000 before backing out, before bulls went head-on and pushed the move quickly to far above this level. At the moment, Bitcoin has stopped its push at just above $12,250.

Traders should pay attention to hot Bitcoin finishes this move and trade either the pullback or the next wave up.

BTC/USD 1-day Chart

Bitcoin’s technical overview is strongly tilted towards the buy-side, with lower time-frames showing some signs of neutrality, while longer time-frames are completely bullish.

BTC/USD 1-day Technicals

Technical factors (4-hour Chart):
  • Price is far above its 50-period EMA and at its 21-period EMA
  • Price above its top Bollinger band
  • RSI is extremely overbought (80.30)
  • Volume is elevated
Key levels to the upside          Key levels to the downside

1: $12,330                                 1: $12,000

2: $12,500                                 2: $11,850

3: $12,870                                  3: $11,735

Ethereum

Ethereum’s price was pretty much stagnant until Bitcoin broke $12,000, which is when the second-largest cryptocurrency by market cap started pushing up as well. The price has slowly pushed past $371 and then explosively past $378, which is where it is at the moment.

Traders should pay attention to how ETH tries to establish itself above $378, and trade off of it.

ETH/USD 4-hour Chart

Ethereum’s 4-hour technicals are showing a tilt towards the sell-side, while its 1-day overview is still bullish. When taking a look at its longer time-frames, we can see heavy neutrality, but still overall bulishness.

ETH/USD 1-day Technicals

Technical Factors (4-hour Chart):
  • The price is above its 50-period and its 21-period EMA
  • Price is near the top Bollinger band
  • RSI is neutral (56.02)
  • Volume is elevated
Key levels to the upside          Key levels to the downside

1: $400                                     1: $378

2: $415                                     2: $371

3: $420                                      3: $360

Ripple

The fourth-largest cryptocurrency by market cap used the momentum Bitcoin’s move has created to push past its $0.2454 resistance once again after falling below it the day before. While this is a great thing, XRP couldn’t pass its previous resistance level of $0.25, which caused it to retest the support level. If it drops below $0.2454 again, bears may gather in a larger number and XRP might push down towards $0.235

XRP/USD 4-hour Chart

XRP’s technicals are quite mixed up, with its 4-hour and weekly overviews showing signs of bullish sentiment, while its daily and monthly overviews are tilted towards the sell-side.

XRP/USD 1-day Technicals

Technical factors (4-hour Chart):
  • The price is at its 50-period EMA and above its21-period EMA
  • Price is near its top Bollinger band
  • RSI is neutral (53.64)
  • Volume is below average
Key levels to the upside          Key levels to the downside

1: $0.26                                     1: $0.2454

2: $0.266                                   2: $0.235

3: $0.2855                                3: $0.227


Categories
Crypto Market Analysis

Daily Crypto Review, Oct 20 – Bitcoin Above $12,000 by the End of the Month? Bull Market has Already Started

The cryptocurrency sector has pushed towards the upside as Bitcoin reached $11,850. Bitcoin is currently trading for $11,741, representing an increase of 2.22% on the day. Meanwhile, Ethereum gained 0.50% on the day, while XRP gained 1.69%.

 Daily Crypto Sector Heat Map

If we look at the top 100 cryptocurrencies, we can see that Dash gained 11.62% in the past 24 hours, making it the top daily gainer. Stellar (7.37%) and Quant (6.5%) also did great. On the other hand, Aave lost 10.73%, making it the most prominent daily loser. It is followed by Crypto.com Coin’s loss of 10.06% and NEAR Protocol’s loss of 9.3%.

Top 10 24-hour Performers (Click to enlarge)

Bottom 10 24-hour Performers (Click to enlarge)

Bitcoin’s market dominance level has increased slightly since our last report, with its value is currently 59.5%. This value represents a 0.7% difference to the upside when compared to when we last reported.

Daily Crypto Market Cap Chart

The crypto sector capitalization has lost a bit of its value since Friday. Its current value is $365.47 billion, representing a decrease of $4.35 billion compared to our previous report.

_______________________________________________________________________

What happened in the past 24 hours?

_______________________________________________________________________

_______________________________________________________________________

Technical analysis

_______________________________________________________________________

Bitcoin

The largest cryptocurrency by market capitalization has pushed past its major resistance sitting at $11,500. The push was accompanied by a major volume increase, which brought Bitcoin’s price to as high as $11,850 before dropping back down to sub-$11,800.


This new spike has put Bitcoin at above 60% year-to-date gains. On top of that, Bitcoin is on track to challenge (and even pass) $12,000, which is a crucial resistance. With the price ignoring all indicators showing that it would bounce back down and pull away from its highs, it does quite the opposite. This inspired many analysts to call for Bitcoin at over $12,000 even by the end of the month.

BTC/USD 1-day Chart

Bitcoin’s technical overview is heavily tilted towards the buy-side, with every single time-frame showing almost no signs of neutrality.

BTC/USD 1-day Technicals

Technical factors (4-hour Chart):
  • Price is above its 50-period EMA and at its 21-period EMA
  • Price near its top Bollinger band
  • RSI is pushing towards the overbought area (63.99)
  • Volume is descending after a major spike
Key levels to the upside          Key levels to the downside

1: $11,735                                 1: $11,630

2: $11,850                                 2: $11,500

3: $12,000                                  3: $11,300

Ethereum

Ethereum’s price moved towards the downside throughout the past week, but then rebounded after hitting the $361 support level and began a slow push towards the upside. Ethereum bulls were patient and slowly took over first the $371 resistance level and now the $378 level, turning them both into support. In both cases, the push was just enough to bring the price above these levels, but the consolidation phase always ended with Ether’s price above its newly found support.

The fundamentals surrounding Ethereum are (at the moment) looking particularly strong as investors are expecting a successful launch of Ethereum 2.0.


ETH/USD 4-hour Chart

Ethereum’s technicals are showing a tilt towards the buy-side on all time-frames. However, while its lower time-frames are being more positive, its longer time-frames are being a bit more neutral (mostly oscillators).

ETH/USD 1-day Technicals

Technical Factors (4-hour Chart):
  • The price is above its 50-period and its 21-period EMA
  • The price between its middle and top Bollinger band
  • RSI is neutral (57.27)
  • Volume is descending from a spike
Key levels to the upside          Key levels to the downside

1: $400                                     1: $378

2: $415                                     2: $371

3: $420                                      3: $360

Ripple

The fourth-largest cryptocurrency by market cap has unexpectedly pushed towards the upside as XRP whales reemerged and went on a buying spree. The most recent upswing has put XRP above the $0.2454 level, which has proven itself both as strong support and resistance level. At the time of writing, XRP seems like it will stay above the level, even though most of its indicators are showing a strong possibility of price pulling back a bit more.

Traders should pay attention to how XRP handles the $0.2454 support level and trade it as XRP bounces up or breaks below it.


XRP/USD 4-hour Chart

XRP’s technicals are quite mixed up. While its 4-hour overview is neutral-bullish, its 1-day chart is completely bearish. On the other hand, its weekly overview is tilted towards the buy-side, while its monthly overview is quite neutral, but still leaning slightly towards the bear side.

XRP/USD 1-day Technicals

Technical factors (4-hour Chart):
  • The price is at its 50-period EMA and above its21-period EMA
  • Price is near its top Bollinger band
  • RSI is neutral (53.39)
  • Volume is below average
Key levels to the upside          Key levels to the downside

1: $0.26                                     1: $0.2454

2: $0.266                                   2: $0.235

3: $0.2855                                3: $0.227


Categories
Crypto Market Analysis

Daily Crypto Review, Oct 19 – Stablecoin Market Surpasses $20 Billion; Tether Dominating With Market Cap of Almost $16 Billion

The cryptocurrency sector has spent the weekend pushing towards higher highs but ultimately being stopped out at the most recent highs. Bitcoin is currently trading for $11,471, representing an increase of 0.71% on the day. Meanwhile, Ethereum gained 1.63% on the day, while XRP gained 0.35%.

 Daily Crypto Sector Heat Map

If we look at the top 100 cryptocurrencies, we can see that UMA gained 24.3% in the past 24 hours, making it the top daily gainer. Aave (19.42%) and Reserve Rights (14.8%) also did great. On the other hand, Filecoin lost 23.88%, making it the most prominent daily loser. It is followed by Crypto.com Coin’s loss of 8.92% and Waves’ loss of 4.28%.

Top 10 24-hour Performers (Click to enlarge)

Bottom 10 24-hour Performers (Click to enlarge)

Bitcoin’s market dominance level has increased slightly since our last report, with its value is currently 58.9%. This value represents a 0.2% difference to the upside when compared to when we last reported.

Daily Crypto Market Cap Chart

The crypto sector capitalization has lost a bit of its value since Friday. Its current value is $361.12 billion, representing a decrease of $1.44 billion compared to our previous report.

_______________________________________________________________________

What happened in the past 24 hours?

_______________________________________________________________________

_______________________________________________________________________

Technical analysis

_______________________________________________________________________

Bitcoin

The largest cryptocurrency by market capitalization has spent its weekend building up a bull presence and trying to push towards (and past) the $11,500 resistance level. However, the move failed, and Bitcoin is now trading just under the resistance line. With that being said, the volume that followed this move was incredibly low, which implies that a bigger move is ahead, and that traders should pay attention to what happens with the volume in the near future.

Bitcoin will most likely either go up or stay above $11,300, as many analysts say that Bitcoin is done with its sub-$11,000 area. However, we do have to pay attention to the Bitcoin CME Futures Gap.

BTC/USD 1-day Chart

Bitcoin’s technical overview is tilted towards the buy-side on every single time-frame. While its 4-hour and 1-day time-frames are showing neutral bullishness, its weekly and monthly sentiment is extremely positive.

BTC/USD 1-day Technicals

Technical factors (4-hour Chart):
  • Price is above its 50-period EMA and at its 21-period EMA
  • Price near its top Bollinger band
  • RSI is neutral (57.29)
  • Volume is below average and descending
Key levels to the upside          Key levels to the downside

1: $11,500                                 1: $11,300

2: $11,630                                 2: $11,180

3: $12,000                                  3: $11,000

Ethereum

Ethereum’s price movement throughout the weekend looked a lot like Bitcoin’s, but with a twist. The second-largest cryptocurrency by market cap moved towards the downside and (just like Bitcoin) created three lower highs on the way down. However, unlike Bitcoin, Ethereum has broken the downtrend and shot up in recent hours, though only to be stopped by the $378 resistance level. While there is still a chance for Ethereum to break this level, it will most likely be stuck below it (possibly within a range bound by $371 and $378) in the short-term.

ETH/USD 4-hour Chart

Ethereum’s technicals are showing a tilt towards the buy-side on all time-frames, with lower time-frames being more positive, while longer time-frames being more tilted towards the neutral stance (mostly oscillators).

ETH/USD 1-day Technicals

Technical Factors (4-hour Chart):
  • The price is above its 50-period and its 21-period EMA
  • The price at its middle Bollinger band
  • RSI is neutral (54.55)
  • Volume is descending
Key levels to the upside          Key levels to the downside

1: $378                                     1: $371

2: $400                                     2: $360

3: $415                                      3: $334

Ripple

XRP spent the weekend mostly trading sideways or rising a little after a whole week of price drops. The fourth-largest cryptocurrency by market capitalization fell under the $0.2454 and stayed below it over the weekend, and even though it is moving towards it, the current volume would not support a break of such a major resistance level.

Many analysts are calling for even more downward movement from XRP, justifying it by saying that this is a continuation of a trend dating back from 2018. The reduced volatility and range-bound trading seem to be confirming this thesis.

XRP/USD 4-hour Chart

XRP’s technicals are extremely bearish. Its 4-hour and daily sentiment being tilted towards the sell-side fully, while its weekly and monthly overviews are showing some signs of neutrality, though they are also heavily bearish.

XRP/USD 1-day Technicals

Technical factors (4-hour Chart):
  • The price is below both its 50-period EMA and its 21-period EMA
  • Price is at its middle Bollinger band
  • RSI is neutral (42.17)
  • Volume is below average
Key levels to the upside          Key levels to the downside

1: $0.2454                                 1: $0.235

2: $0.26                                     2: $0.227

3: $0.266                                  3: $0.221


Categories
Crypto Market Analysis

BTC/USD Chart Overview + Possible Outcomes

In this BTC /USD 1-day time-frame analysis, we will be looking at the most recent events, the current technical formations, as well as discussing possible outcomes.

Overview

Bitcoin has had a week of explosive gains, mostly due to its fundamentals. The US President Donald Trump announced another set of stimulus packages (while he was completely against it just before the announcement), as well as Jack Dorsey’s Square investing $50 million in Bitcoin sparked bulls’ interest and made the largest cryptocurrency by market cap push above $11,700. Bitcoin established support above its previous heavy resistance level, which is certainly another great sign for the bulls. However, one technical formation says that additional correction is ahead before the next push towards $12,000.

Technical factors

Bitcoin has left its triangle formation abruptly and to the upside, breaking not only the formation but also numerous resistances. The price started consolidating in a range bound by $11,300 to the downside and $11,500 to the upside, which was a great trading opportunity for traders that like sideways trading. Taking a look at smaller time-frames, Bitcoin has built a downwards-sloping channel that calls for a slight pullback (and a possible fill of the Bitcoin CME Futures gap) before pushing further up.

There are two most likely versions of this pullback, and both will be discussed above. However, an unexpected price spike or plummet is always a possibility, no matter how slim.

Likely Outcomes


Bitcoin currently has two main scenarios. It can play out, and both involve a pullback before a push towards $12,000.

  1. As shown on the chart, Bitcoin will most likely follow the channel until it finds strong support; it cannot go below, after which it will break the channel to the upside. After finding confirmation above it, it is free to push towards the upside ($11,730, $11,960, or even $12,000).
  2. The other scenario is a bit tricky, and therefore a bit less likely. The premise for this scenario is the head and shoulders chart pattern that started in late April of this year. The most recent high of this scenario is the top of the right shoulder, while the neckline is the black ascending line shown on the chart. In this scenario, the price would move alongside the dotted line until it hit the neckline, after which it would start to go up. In this case, the pullback and confirmation would most likely happen above $11,300, and only after consolidating above this level could Bitcoin push to the aforementioned targets.
  3. The scenario in which Bitcoin suddenly pushes up or down sharply and swiftly is incredibly unlikely and would have to be backed by some major news.
Categories
Crypto Market Analysis

Daily Crypto Review, Oct 16 – ICO That Raised $257 Million in 60 Minutes Finally Launched; Bitcoin Pushing Towards $11,500

The cryptocurrency sector has spent the day trying to push higher highs but failed as Bitcoin didn’t make it above $11,500. Bitcoin is currently trading for $11,486, representing an increase of 0.65% on the day. Meanwhile, Ethereum lost 0.64% on the day, while XRP lost 1.42%.

 Daily Crypto Sector Heat Map

If we look at the top 100 cryptocurrencies, we can see that Filecoin gained an astonishing 120.78% in the past 24 hours, making it the top daily gainer. ABBC Coin (39.25%) and Blockstack (9.35%) also did great. On the other hand, Aave lost 15.89%, making it the most prominent daily loser. It is followed by Arweave’s loss of 14.13% and Synthetix Network Token’s loss of 8.96%.

Top 10 24-hour Performers (Click to enlarge)

Bottom 10 24-hour Performers (Click to enlarge)

Bitcoin’s market dominance level has stayed at the same level since our last report, with its value currently being 58.7%. This value represents a 0% difference when compared to when we last reported.

Daily Crypto Market Cap Chart

The crypto sector capitalization has gained a bit of its value over the course of the past 24 hours. Its current value is $362.56 billion, representing an increase of $1.46 billion compared to our previous report.

_______________________________________________________________________

What happened in the past 24 hours?

_______________________________________________________________________

_______________________________________________________________________

Technical analysis

_______________________________________________________________________

Bitcoin

The oldest cryptocurrency spent the past 24 hours trying to push past the $11,500 resistance. While the fight for it still continues, there is a strong possibility that Bitcoin will actually stabilize its price above it. If that happens, bulls might come in even stronger and push the price towards $11,630, or even $11,730.

If, however, Bitcoin moves back below $11,500, the sentiment won’t change to a lot more bearish one, as Bitcoin is used to trading above $11,300 as of lately.

BTC/USD 1-day Chart

Bitcoin’s technical overview is extremely bullish on every single time-frame for almost a month now, with longer time-frames showing complete bullish sentiment, while the shorter ones are slightly less tilted towards the buy-side.

BTC/USD 1-day Technicals

Technical factors (4-hour Chart):
  • Price is above its 50-period EMA and at its 21-period EMA
  • Price near its top Bollinger band
  • RSI is neutral (60.70)
  • Volume is average
Key levels to the upside          Key levels to the downside

1: $11,500                                 1: $11,300

2: $11,630                                 2: $11,180

3: $12,000                                  3: $11,000

Ethereum

Unlike Bitcoin that tried to push towards its resistance level, Ethereum spent the day fighting to stay above the $378 level it recently fell under. The second-largest cryptocurrency by market cap tested the $371 support level, which held up quite nicely and attempted a push towards (now) resistance level of $378. While the fight for it still lasts, Ethereum will most likely end up above it if Bitcoin’s price doesn’t drop and pull ETH alongside.

ETH/USD 4-hour Chart

Ethereum’s technicals on all time-frames are a varying degree of bullish. While its 4-hour and monthly overviews are a bit more neutral, its daily and weekly overviews are strongly tilted towards the buy-side.

ETH/USD 1-day Technicals

Technical Factors (4-hour Chart):
  • The price is above its 50-period and right at its 21-period EMA
  • The price at its middle Bollinger band
  • RSI is neutral (54.03)
  • Volume is average
Key levels to the upside          Key levels to the downside

1: $378                                     1: $371

2: $400                                     2: $360

3: $415                                      3: $334

Ripple

XRP has spent the past 24 hours continuing its drop towards the $0.2454 support level. XRP is approaching a quarterly price drop of 20% if the price breaks to the downside. However, so far, the $0.2454 support level is holding up, and XRP bears are not able to break it. If the support level break, we can expect XRP to move towards $0.235.

Traders should either wait for a bounce towards the upside (less likely and riskier) or wait for a possible break below $0.2454 to trade alongside the strong move to the downside.


XRP/USD 4-hour Chart

XRP’s technicals have changed the sentiment to quite bearish in the past couple of days. While its monthly sentiment was bearish for a while, its 4-hour and 1-day overviews have turned completely towards the sell-side. On the other hand, XRP’s weekly overview is still slightly bullish.

XRP/USD 1-day Technicals

Technical factors (4-hour Chart):
  • The price is below both its 50-period EMA and its 21-period EMA
  • Price is slightly above its lower Bollinger band
  • RSI is neutral (40.83)
  • Volume is average (except for a couple of huge volume candle)
Key levels to the upside          Key levels to the downside

1: $0.266                                   1: $0.2454 

2: $0.27                                     2: $0.235

3: $0.273                                  3: $0.227


Categories
Crypto Market Analysis

Daily Crypto Review, Oct 15 – JP Morgan Says Bitcoin is Overvalued; XRP Crashes As it Breaks Major Support

The cryptocurrency sector has spent the day trying to find a point of consolidation. However, most cryptocurrencies did end up in the red. Bitcoin is currently trading for $11,412, representing a decrease of 0.38% on the day. Meanwhile, Ethereum lost 1.28% on the day, while XRP lost 3.36%.

 Daily Crypto Sector Heat Map

If we look at the top 100 cryptocurrencies, we can see that ABBC Coin gained 21.28% in the past 24 hours, making it the top daily gainer. Reserve Rights (19.41%) and Ren (13.61%) also did great. On the other hand, Storj lost 13.98%, making it the most prominent daily loser. It is followed by Uniswap’s loss of 12.63% and Energy Web Token’s loss of 9.94%.

Top 10 24-hour Performers (Click to enlarge)

Bottom 10 24-hour Performers (Click to enlarge)

Bitcoin’s market dominance level has decreased since our last report, with its value currently being 58.7%. This value represents a 2.54% difference to the downside when compared to when we last reported.

Daily Crypto Market Cap Chart

The crypto sector capitalization has lost a bit of its value over the course of the past 24 hours. Its current value is $360.10 billion, representing a decrease of $1.88 billion compared to our previous report.

_______________________________________________________________________

What happened in the past 24 hours?

_______________________________________________________________________

_______________________________________________________________________

Technical analysis

_______________________________________________________________________

Bitcoin

The largest cryptocurrency by market cap spent the past 24 hours stuck within a range bound by the $11,300 support level and $11,500 resistance level. The price entered a state of enormous volatility at one point, where Bitcoin tried to break both to the upside and downside. However, the move to the upside was quickly shut down, while the move towards the downside took a bit more time but failed as well. This left Bitcoin in a narrow range, which it will come out of as soon as the bulls and bears stabilize. Its decreasing RSI and volume are proof of future possible, sideways trading, as well as a big move up ahead.

BTC/USD 1-day Chart

Bitcoin’s technical overview is extremely bullish on every single time-frame, with longer time-frames showing full tilt towards the buy-side, while the shorter ones are slightly tilted towards the buy-side.

BTC/USD 1-day Technicals

Technical factors (4-hour Chart):
  • Price is above its 50-period EMA and at its 21-period EMA
  • Price is at the middle Bollinger band
  • RSI is neutral and descending (53.49)
  • Volume is average
Key levels to the upside          Key levels to the downside

1: $11,500                                 1: $11,300

2: $11,630                                 2: $11,180

3: $12,000                                  3: $11,000

Ethereum

Ethereum (just like Bitcoin) tried to find a consolidation price but failed to do so. The second-largest cryptocurrency by market cap faced an upward-facing trend line which it could not follow anymore that triggered a selloff and a drop below the line as well as the $378 support level. While Ethereum is still fighting for the support (now resistance) level, the price will most likely stay above this line.

ETH/USD 4-hour Chart

Ethereum’s technicals on all time-frames are bullish, with longer time-frames having a stronger bullish sentiment than the shorter ones. However, its monthly overview’s oscillators are showing indecisiveness, as they are neutral.

ETH/USD 1-day Technicals

Technical Factors (4-hour Chart):
  • The price is above its 50-period and at its 21-period EMA
  • The price at its middle Bollinger band
  • RSI is neutral (51.89)
  • Volume is average
Key levels to the upside          Key levels to the downside

1: $378                                     1: $371

2: $400                                     2: $360

3: $415                                      3: $334

Ripple

XRP had the worst day performance-wise out of the three cryptocurrencies we are covering. The third-largest cryptocurrency by market cap has dropped below its ascending support trend line, which extended the push towards the downside. The price reached as low as the $0.2454 support level, which is where the bulls picked up the pace and pushed the price up slightly.

Traders should pay attention to how XRP’s price moves around the ascending (yellow) resistance line, as well as the $0.2454 support level.

XRP/USD 4-hour Chart

XRP’s technicals are quite inconsistent, with its 4-hour and monthly technicals being tilted towards the sell-side. On the other hand, its weekly overview is bullish, while its daily overview is tilted more towards the bull side, with moving averages still having a hint of bearish sentiment.

XRP/USD 1-day Technicals

Technical factors (4-hour Chart):
  • The price is below both its 50-period EMA as well as its 21-period EMA
  • Price is at its lower Bollinger band
  • RSI is pushing towards the oversold area (38.64)
  • Volume is average (with the exception of one huge volume candle)
Key levels to the upside          Key levels to the downside

1: $0.266                                   1: $0.2454 

2: $0.27                                     2: $0.235

3: $0.273                                  3: $0.227


Categories
Crypto Market Analysis

Daily Crypto Review, Oct 14 – Analysts Calling for a Bull Market; Bitcoin Back Under $11,500

The cryptocurrency sector has experienced a pullback as Bitcoin went under its $11,500 support. Bitcoin is currently trading for $11,425, representing a decrease of 0.31% on the day. Meanwhile, Ethereum gained 0.09% on the day, while XRP lost 0.52%.

 Daily Crypto Sector Heat Map

If we look at the top 100 cryptocurrencies, we can see that PumaPay gained 13.55% in the past 24 hours, making it the top daily gainer. ABBC Coin (9.05%) and Uniswap (6.64%) also did great. On the other hand, Solana lost 7.81%, making it the most prominent daily loser. It is followed by Loopring’s loss of 6.9% and Kusama’s loss of 6.77%.

Top 10 24-hour Performers (Click to enlarge)

Bottom 10 24-hour Performers (Click to enlarge)

Bitcoin’s market dominance level has decreased slightly since our last report, with its value currently being 60.24%. This value represents a 0.16% difference to the downside when compared to when we last reported.

Daily Crypto Market Cap Chart

The crypto sector capitalization has lost a bit of its value over the course of the past 24 hours. Its current value is $361.98 billion, representing a decrease of $5.11 billion compared to our previous report.

_______________________________________________________________________

What happened in the past 24 hours?

_______________________________________________________________________

_______________________________________________________________________

Technical analysis

_______________________________________________________________________

Bitcoin

The largest cryptocurrency by market cap went into pullback mode as it couldn’t stay at its daily high of a little over $11,700. Bitcoin’s bull exhaustion triggered a pullback, which then broke the $11,500 support level to the downside, putting the cryptocurrency boxed in between $10,300 support and $10,500 resistance level. With the volume decreasing and RSI dropping down, we may expect sideways trading in the short-term before another attempt of (mostly likely) upwards motion.

Many analysts say that Bitcoin has almost no chance of going under $11,000 and that the most recent break above it has turned Bitcoin’s sentiment into a bullish one. However, if Bitcoin manages to go under $11,000, we may expect that the move will continue downwards quickly.

BTC/USD 4-hour Chart

Bitcoin’s technical overview is extremely bullish on all time-frames, with longer time-frames showing even stronger bull overview than the shorter ones.

BTC/USD 1-day Technicals

Technical factors (4-hour Chart):
  • Price is above both its 50-period EMA and 21-period EMA
  • Price is at the middle Bollinger band
  • RSI is descending (57.23)
  • Volume is above-average (descending
Key levels to the upside          Key levels to the downside

1: $11,500                                 1: $11,300

2: $11,630                                 2: $11,180

3: $12,000                                  3: $11,000

Ethereum

Ethereum also experienced a pullback from its highs as ETH bulls couldn’t go past $496. However, unlike Bitcoin, Ethereum didn’t break any support levels during the move towards the downside. As it bounced off of the $378 support level, it continued moving alongside a very steep upwards-trending line, which is a very bullish short-term sign.

While moving alongside this line is unsustainable in the long-term, Ethereum might experience some more stable gains in the next couple of days.

ETH/USD 4-hour Chart

Ethereum’s 1-day and weekly overviews extreme tilt towards the bull-side, while its 4-hour and monthly overviews show a bit of indecisiveness, though they are still bullish.

ETH/USD 1-day Technicals

Technical Factors (4-hour Chart):
  • The price is above both its 50-period and its 21-period EMA
  • The price slightly above its middle Bollinger band
  • RSI is neutral (60.70)
  • Volume is elevated (descending to average)
Key levels to the upside          Key levels to the downside

1: $378                                     1: $371

2: $400                                     2: $360

3: $415                                      3: $334

Ripple

XRP is known for being less correlated to Bitcoin’s movements than most other cryptocurrencies, which it has shown today as well. The third-largest cryptocurrency by market cap has traded sideways and hasn’t experienced any pullbacks. It has been trading alongside the upward-trending (yellow) line, which will force XRP to either go under it or face its resistance at the $0.26 level. In the meantime, however, we may expect low volatility.

XRP/USD 4-hour Chart

XRP’s technicals are quite inconsistent, as its daily and weekly overviews show quite a bullish tilt, while its monthly overview is almost completely bearish. Its 4-hour overview is leaning towards the buy-side but is quite neutral.

XRP/USD 1-day Technicals

Technical factors (4-hour Chart):
  • The price is above its 50-period EMA as well as its 21-period EMA
  • Price is at its middle Bollinger band
  • RSI is flat (52.19)
  • Volume is average but descending
Key levels to the upside          Key levels to the downside

1: $0.266                                   1: $0.2454 

2: $0.27                                     2: $0.235

3: $0.273                                  3: $0.227


Categories
Crypto Market Analysis

Daily Crypto Review, Oct 13 – G7 Will Continue to Oppose Libra; Bitcoin Consolidating After Another Bull Run

The cryptocurrency sector has experienced another surge as Bitcoin moved away from $11,300 and closer to $11,500. Bitcoin is currently trading for $11,434, representing an increase of 0.89% on the day. Meanwhile, Ethereum gained 3.35% on the day, while XRP gained 0.03%.

 Daily Crypto Sector Heat Map

Taking a look at the top 100 cryptocurrencies, we can see that Ocean Protocol gained 21.97% in the past 24 hours, making it the top daily gainer. CyberVein (14.58%) and Synthetix Network Token (11.83%) also did great. On the other hand, Ren lost 14.83%, making it the most prominent daily loser. It is followed by PumaPay’s loss of 8.33% and Uniswap’s loss of 3.33%.

Top 10 24-hour Performers (Click to enlarge)

Bottom 10 24-hour Performers (Click to enlarge)

Bitcoin’s market dominance level has decreased slightly since our last report, with its value currently being 60.40%. This value represents a 0.26% difference to the downside when compared to when we last reported.

Daily Crypto Market Cap Chart

The crypto sector capitalization has a bit more value over the course of the past 24 hours. Its current value is $366.13 billion, representing an increase of $7.71 billion compared to our previous report.

_______________________________________________________________________

What happened in the past 24 hours?

_______________________________________________________________________

_______________________________________________________________________

Technical analysis

_______________________________________________________________________

Bitcoin

The largest cryptocurrency by market cap has continued its push towards the upside, getting past $11,500 and even close to the $12,000 mark. The move died out when it approached $11,750. Bitcoin is now in the pullback phase, where its price has breached $11,500 to the downside and is testing how low it can go until the bulls step in again.

Traders should pay attention to how Bitcoin handles the $11,300-$11,500 level when looking for their next trade.


BTC/USD 4-hour Chart

Bitcoin’s technical overview on all time-frames is tilted towards the buy-side, with longer time-frames showing an extremely strong bull overview.

BTC/USD 1-day Technicals

Technical factors (4-hour Chart):
  • Price is above both its 50-period EMA and 21-period EMA
  • Price descending from the top Bollinger band
  • RSI is descending from almost-overbought levels (62.46)
  • Volume is above-average
Key levels to the upside          Key levels to the downside

1: $11,500                                 1: $11,300

2: $11,630                                 2: $11,180

3: $12,000                                  3: $11,000

Ethereum

Ethereum has had another bull-run in the past 24 hours, with its price reaching as high as $396. However, the second-largest cryptocurrency by market cap couldn’t reach past the $400 mark, triggering bull exhaustion, and ultimately a pullback. With volume and RSI dropping, we may expect Ethereum to look for a price to consolidate a bit lower than its current price, and possibly test the $371 support level.


ETH/USD 4-hour Chart

Ethereum’s 1-day and monthly overviews show some signs of doubt in the bullish sentiment, while its 4-hour and weekly overviews are completely bullish.

ETH/USD 1-day Technicals

Technical Factors (4-hour Chart):
  • The price is above both its 50-period and its 21-period EMA
  • The price at its top Bollinger band
  • RSI is flat and nearly overbought (66.74)
  • Volume is elevated
Key levels to the upside          Key levels to the downside

1: $378                                     1: $371

2: $400                                     2: $360

3: $415                                      3: $334

Ripple

Unlike Bitcoin and Ethereum, which both had a strong bull presence today, XRP has been trading sideways for most of the day. Its inability to reach past the $0.26 level has proven to be a problem, and we may expect XRP’s price to collide with the ascending trend line very soon. There is a small probability that XRP will reach past $0.26 and get close to $0.266, but it will most likely happen with Bitcoin’s help (though it is more likely that XRP will face the ascending line first).


XRP/USD 4-hour Chart

XRP’s 1-day technicals show a hint of doubt in its short-term bullish sentiment, while the 4-hour and weekly overviews are completely bullish. However, XRP’s monthly overview is still completely tilted towards the sell-side.

XRP/USD 1-day Technicals

Technical factors (4-hour Chart):
  • The price is above its 50-period EMA as well as its 21-period EMA
  • Price is at its middle Bollinger band
  • RSI is flat (55.33)
  • Volume is average but descending
Key levels to the upside          Key levels to the downside

1: $0.266                                   1: $0.2454 

2: $0.27                                     2: $0.235

3: $0.273                                  3: $0.227


Categories
Crypto Market Analysis

Daily Crypto Review, Oct 12 – Crypto Market Consolidating After a Surge: What’s Next?

The cryptocurrency sector has experienced a surge over the weekend as Bitcoin pushed above $11,000. Bitcoin is currently trading for $11,319, representing a decrease of 0.25% on the day. Meanwhile, Ethereum gained 0.09% on the day, while XRP gained 0.32%.

 Daily Crypto Sector Heat Map

Taking a look at the top 100 cryptocurrencies, we can see that Ren gained 27.02% in the past 24 hours, making it the top daily gainer. Monero (9.75%) and Cosmos (7.98%) also did great. On the other hand, Loopring lost 7.99%, making it the most prominent daily loser. It is followed by StorJ’s loss of 6.76% and PumaPay’s loss of 6.54%.

Top 10 24-hour Performers (Click to enlarge)

Bottom 10 24-hour Performers (Click to enlarge)

Bitcoin’s market dominance level has decreased slightly since our last report, with its value currently being 60.66%. This value represents a 0.67% difference to the downside when compared to when we last reported.

Daily Crypto Market Cap Chart

The crypto sector capitalization has gained quite a bit of value over the course of the weekend. Its current value is $358.48 billion, representing an increase of $14.33 billion compared to our previous report.

_______________________________________________________________________

What happened in the past 24 hours?

_______________________________________________________________________

_______________________________________________________________________

Technical analysis

_______________________________________________________________________

Bitcoin

The largest cryptocurrency by market cap has continued its push towards the upside on Friday/Saturday, reaching as high as $11,500. The move has died out since, and Bitcoin is now trading in a narrow range between the $10,300 support level and $10,500 resistance level (61.8% Fib retracement). The volume seems to be dying off, while the RSI is descending, which may indicate a short window where traders shouldn’t expect much volatility, but rather trade within this range. However, Bitcoin cannot stay locked up in such a narrow range for too long and will have to make another move in the short future.


BTC/USD 4-hour Chart

Bitcoin’s technical overview is tilted towards the buy-side overall, but its short-term (4-hour and 1-day) technicals are a bit mixed up, with oscillators questioning the bullishness. However, its long-term outlook is completely bullish

BTC/USD 1-day Technicals

Technical factors (4-hour Chart):
  • Price is above both its 50-period EMA and 21-period EMA
  • Price is near the middle Bollinger band
  • RSI is descending from almost-overbought levels (66.90)
  • Volume is descending
Key levels to the upside          Key levels to the downside

1: $11,500                                 1: $11,300

2: $11,630                                 2: $11,180

3: $12,000                                  3: $11,000

Ethereum

Ethereum’s movement over the weekend was similar to Bitcoin’s, with its price skyrocketing on Friday/Saturday, only to consolidate after the move ended. Ethereum bulls reached exhaustion after the price hit the 38.2% Fib retracement, and started consolidating right below it. Just as with Bitcoin, Ethereum is stuck within a range, bound by $371 to the downside and $378 to the upside.

Ethereum’s flat (and nearly overbought) RSI and descending volume indicate that Ethereum is preparing for a move.

ETH/USD 4-hour Chart

Ethereum’s short-term technicals are somewhat unclear, with its 4-hour overview turning to bullish and 1-day overview still being tilted towards the sell-side quite heavily. On the other hand, its long-term technicals are quite bullish.

ETH/USD 1-day Technicals

Technical Factors (4-hour Chart):
  • The price is above both its 50-period and 21-period EMA
  • The price is near its middle Bollinger band
  • RSI is flat and nearly overbought(66.85)
  • Volume is below average
Key levels to the upside          Key levels to the downside

1: $378                                     1: $371

2: $400                                     2: $360

3: $415                                      3: $334

Ripple

While XRP has also moved over the weekend, its move was not as significant as Bitcoin’s or Ethereum’s move. This is simply because it did not break any recent resistances, but rather got stuck at the same one it couldn’t get past on Oct 6. XRP is now consolidating at around $0.255, and we may possibly see a pullback to the orange ascending line as a retest of this upward-facing trend.

XRP has two possibilities now: it will either push towards $0.266 (less likely) or pull back towards the ascending line (more likely). Traders should keep in mind both of these scenarios when attempting to trade XRP.

XRP/USD 4-hour Chart

XRP’s 4-hour, 1-day, and weekly technicals are practically the same and are all tilted towards the buy-side (with oscillators being more or less neutral), while its monthly overview is heavily tilted towards the sell-side.

XRP/USD 1-day Technicals

Technical factors (4-hour Chart):
  • The price is above its 50-period EMA and at its 21-period EMA
  • Price is at its middle Bollinger band
  • RSI is descending (52.16)
  • Volume is average (descending)
Key levels to the upside          Key levels to the downside

1: $0.266                                   1: $0.2454 

2: $0.27                                     2: $0.235

3: $0.273                                  3: $0.227


Categories
Crypto Market Analysis

BTC/USD Weekly Overview + Possible Outcomes

This is the BTC/USD 1-day timeframe analysis, where we are looking at the most recent events, the current technical formations, as well as discussing possible outcomes.

Overview


Bitcoin has shown some volatility in recent days after bouncing off of the 100-period moving average (black line). The largest cryptocurrency by market cap bounce off of this line as well as the $10,500 level brought a lot of bulls back to the market, causing another price swing upwards. While it was more likely that Bitcoin would push down towards $10,360, the news surrounding it (many accredited and institutional investors putting their funds in the market at this particular moment) outweighed the bearishness caused by the macro events.

Technical factors

Bitcoin has been building a triangle formation for over a month now, and it was a consensus among analysts and traders that the triangle will most likely break towards the downside. However, the most recent push off of the 100-period MA (mostly due to fundamentals rather than technical factors) has proven traders wrong and decided Bitcoin’s short-term future.

The push towards the upside briefly stopped after breaking the uncertainty area, only to consolidate there and create enough pressure for the next move. After this happened, Bitcoin was free to move towards the $11,000 resistance level . At the moment, the pressure created by the bulls is fading, and we may expect a pullback.

Likely Outcomes


Bitcoin has encountered strong resistance at the $11,000 level, which will most likely cause it to back down towards $10,850. With (as we spoke in our numerous analyses) $10,850 level being the pivot pointBitcoin will choose to either back down towards $10,500 or $10,360 before (most likely) rising again, or to bounce from the $10,850 area and push towards $11,000-$11,300. At this moment, the most likely scenario is that Bitcoin will stay above $10,850 for the time being and that its next push will possibly move its price above $11,000, but almost certainly not above $11,300.

If we are talking about straightforwards pushes towards the upside or downside, it would take a great deal of pressure to either side to break its support or resistance levels, sitting at $10,850 and $11,300.

Categories
Crypto Market Analysis

Daily Crypto Review, Oct 9 – Bitcoin Close to $11,000: What’s Next?

The cryptocurrency sector as a whole has experienced a quick push to the upside. Bitcoin is currently trading for $10,839, representing an increase of 2.44% on the day. Meanwhile, Ethereum gained 2.91% on the day, while XRP gained 1.59%.

 Daily Crypto Sector Heat Map

If we look at the top 100 cryptocurrencies, we can see that UMA gained 31.88% in the past 24 hours, making it the most prominent daily gainer. The Midas Touch Gold (25.91%) and SushiSwap (18.59%) also did great. On the other hand, PumaPay lost 12.87%, making it the most prominent daily loser. It is followed by Zuba Token’s loss of 2.87% and Augur’s loss of 2.32%.

Top 10 24-hour Performers (Click to enlarge)

Bottom 10 24-hour Performers (Click to enlarge)

Bitcoin’s market dominance level has stayed at the same place since our last report, with its value currently being at 61.01%. This value represents a 0.05% difference to the upside when compared to when we last reported.

Daily Crypto Market Cap Chart

The crypto sector capitalization has gained quite a bit of value over the course of the past 24 hours. Its current value is $343.72 billion, representing an increase of $10.6 billion compared to our previous report.

_______________________________________________________________________

What happened in the past 24 hours?

_______________________________________________________________________

_______________________________________________________________________

Technical analysis

_______________________________________________________________________

Bitcoin

The largest cryptocurrency by market cap has broken its triangle formation towards the upside after a bounce from the $10,500 support level. The massive bull presence had brought the price just under $11,000 before BTC started to pull back and seek an appropriate level to consolidate at. At the time being, Bitcoin is fighting for $10,850, and staying above, it would be a major precursor to its future possible push towards $11,000-$11,300.

Traders should pay close attention to Bitcoin’s price movement around the $10,850 level, as well as the ascending line (pink), and trade based on how the price reacts to these levels.

BTC/USD 4-hour Chart

Bitcoin’s technical overview has turned bullish overall, with every single time-frame being bullish. While its weekly and monthly overviews were bullish for months now, its daily and 4-hour technicals have turned bullish only after the most recent spike.

BTC/USD 4-hour Technicals

Technical factors (4-hour Chart):
  • Price is above both its 50-period EMA and 21-period EMA
  • Price is near the top Bollinger band
  • RSI is descending from almost-overbought levels (61.39)
  • Volume is descending from above-average
Key levels to the upside          Key levels to the downside

1: $11,000                                 1: $10,850

2: $11,180                                 2: $10,630

3: $11,300                                  3: $10,500

Ethereum

Ethereum has moved towards the upside alongside Bitcoin, but its price movement didn’t do anything as impactful as Bitcoin’s price. While the bounce from the $344 level was significant, it could not reach, let alone pass, the $360 level. Ethereum’s short-term future is certainly within this range, which traders can make use of.

Once again, we will point out an extremely high chance of Ethereum staying between $334 and $360.

ETH/USD 4-hour Chart

Ethereum’s short-term technicals are somewhat unclear, with its 4-hour overview turning to bullish and 1-day overview still being tilted towards the sell-side quite heavily. On the other hand, its long-term technicals are quite bullish.

ETH/USD 4-hour Technicals

Technical Factors (4-hour Chart):
  • The price is above both its 50-period and 21-period EMA
  • The price is near its middle Bollinger band
  • RSI is neutral (54.08)
  • Volume is below average (one-candle spike)
Key levels to the upside          Key levels to the downside

1: $360                                     1: $334

2: $371                                     2: $300

3: $400                                      3: $289

Ripple

XRP has used Bitcoin’s move towards the upside to fuel its own move and established itself above the $0.2454 level. The third-largest cryptocurrency by market cap has bounced off the ascending line (and not the $0.2454 level this time) dating back from Sep 24 and pushed up, reaching as high as $0.253 before ending the move.

Traders should pay attention to any sharp increases in volume, as well as how XRP handles the immediate support and resistance levels. Most analysts are currently quite bullish on XRP, mostly when it comes to 1-hour and 4-hour charts.

XRP/USD 4-hour Chart

XRP 4-hour, daily, and weekly technicals are quite bullish, while its monthly overview is tilted towards the sell-side.

XRP/USD 4-hour Technicals

Technical factors (4-hour Chart):
  • The price is above its 50-period EMA and its 21-period EMA
  • Price is close to its middle Bollinger band
  • RSI is neutral (55.13)
  • Volume is above average
Key levels to the upside          Key levels to the downside

1: $0.266                                   1: $0.2454 

2: $0.27                                     2: $0.235

3: $0.273                                  3: $0.227


Categories
Crypto Guides

Is Tezos The Most Robust Cryptocurrency?

Introduction

Tezos is a decentralized, highly secure, transparent, and smart contract enabled blockchain governed by itself. It is a blockchain network associated with a digital token known as Tez or Tezzie (XTZ). Tezos doesn’t mine Tez. Instead, the token holder is rewarded under the consensus mechanism for participating in the proof-of-stake system.

A digital commonwealth group, sharing common interests and goals, is linked together to govern the Tezos platform. Tezos aims to become the most robust cryptocurrency blockchain by working together with its token holders to build more democratic protocol with the time. 

What is Tezos Attempting to Achieve? 

Tezos team wants to develop the most adaptable cryptocurrency project. It provides a token holder with equal governing power and is trying to avoid a hard fork situation. In which a community splits and starts competing with each other like in Bitcoin cash and Ethereum DAO. Tezos is implementing soft forks in which the community regularly updates the blockchain for constant growth. They are using (DAO) Decentralised Autonomous Organization system where every decision is taken after community discussion. This will make this more self amendable and upgradeable system.  

How Tezos Works? 

Tezos uses a proof of stake algorithm, and it can support 40 transactions/second on the network. It uses the Michelson coding language, which proceeds with formal verification to avoid any bugs in the network. To create error fee smart contracts, they use a mathematically provable code. In this network, the stakers are known as bakers.

To make delegate changes, you need to have 10,000 Tezos tokens and a bond. Most probably to make the system more democratic, Tezos has removed the miners to reduce their control power in the network. It is absorbing good elements from different blockchains to make it self-governing, self-evolving, and adaptable. If you notice anything appealing in any other blockchain, you can propose it to the community that approves the change for the Tezos network. 

Tezos Architecture

The protocol is divided into layers:

Network Protocol  – Here, the peer-to-peer communication is done to broadcast the decisions between the nodes.

Transaction Protocol – Here, the blockchain accounting model is implemented. 

Consensus Protocol – This consensus protocol verifies the agreement to confirm transactions. 

The Tezos Accounts

Implicit Account – It’s the most commonly used account. It has a public key and private key held by the account owner to secure the account balance. 

Originated Account – The formally verified smart contract account with the implicit account is known as an originated account.

Tezos Unique Capabilities

  • Self-amending and on-chain governance
  • Formal verification of smart contracts
  • Liquid proof of stake system 

Is Tezos a Good Investment?

Tezos is the youngest of all existing cryptocurrencies and focused upon the chain governance system. They claim to become a future-proof platform through on-chain governance that attracts a huge number of investors. Thus, Tezos seems to be a good investment. The good news is that most of the popular cryptocurrency investors are getting involved in Tezos. We should also consider that they don’t have a clear road map for the future, but the other dominating cryptocurrencies community is working in a specific direction. To conclude, despite Tezos being one of the most robust cryptos out there, its success or failure depends on active community decisions. 

Categories
Crypto Market Analysis

Daily Crypto Review, Oct 8 – DeFi Bubble Popped: Token Prices Shatter on Low Trading Volumes

The cryptocurrency sector as a whole has experienced a slight decrease as Bitcoin continued to path towards the downside. Bitcoin is currently trading for $10,525, representing a decrease of 0.47% on the day. Meanwhile, Ethereum lost 0.95% on the day, while XRP lost 1.09%.

 Daily Crypto Sector Heat Map

If we look at the top 100 cryptocurrencies, we can see that Ren gained 11.19% in the past 24 hours, making it the most prominent daily gainer. The Midas Touch Gold (9.72%) and PumaPay (7.65%) also did great. On the other hand, Hyperion lost 66.26%, making it the most prominent daily loser. It is followed by yearn.finance’s loss of 13.34% and Kusama’s loss of 11.08%.

Top 10 24-hour Performers (Click to enlarge)

Bottom 10 24-hour Performers (Click to enlarge)

Bitcoin’s market dominance level has stayed at the same place since our last report, with its value currently being at 60.96%. This value represents a 0.1% difference to the upside when compared to when we last reported.

Daily Crypto Market Cap Chart

The crypto sector capitalization has lost a bit of value over the course of the past 24 hours. Its current value is $333.12 billion, representing a decrease of $2.28billion compared to our previous report.

_______________________________________________________________________

What happened in the past 24 hours?

_______________________________________________________________________

While the top cryptocurrencies lost only a fraction of their respective market capitalization value, the DeFi market has deflated drastically. It is estimated that the daily DeFi token trade volumes have dropped by 30% combined, while recent market leaders Sushi, Uniswap, and yearn.finance are among the hardest hit with weekly losses of as much as 51%, 38%, and 31%, respectively. On top of that, the Binance DeFi composite index dropped over 20% yesterday, and 63% from its first trading day in August.

However, this is not the end of DeFi, but rather a small pop of the inflated price bubble. The DeFi market has seen various “whales” accumulating DeFi tokens and using its protocols, which is a great sign that this part of the crypto sector is here to stay.

_______________________________________________________________________

Technical analysis

_______________________________________________________________________

Bitcoin

The largest cryptocurrency by market cap has continued moving down and testing its support levels. This time, Bitcoin tested the $10,500 level, which held up nicely (for now). While the immediate sentiment is certainly bearish, there isn’t enough volume to test and break the  $10,360 level, which is crucial for the future price development of Bitcoin.

While short-term traders are mostly tilted towards the sell-side due to both macroeconomic events and technical analysis, investors are quite bullish on Bitcoin simply due to how the largest cryptocurrency develops in terms of usability, adoption, and other fundamental concepts.

BTC/USD 4-hour Chart

Bitcoin’s technical overview follows what we previously said, with short-term technicals being bearish, while the longer-term ones are bullish. Its 4-hour and 1-day overview tilting towards the downside, while its longer-term technicals have remained bullish.

BTC/USD 4-hour Technicals

Technical factors (4-hour Chart):
  • Price is below both its 50-period EMA and 21-period EMA
  • Price is near the bottom Bollinger band
  • RSI is neutral (42.08)
  • Volume is average
Key levels to the upside          Key levels to the downside

1: $10,630                                 1: $10,500

2: $10,850                                 2: $10,360

3: $11,000                                  3: $10,015

Ethereum

Ethereum was moving towards the downside throughout the day, testing its $334 support level once again. Trading volume faded as Ethereum couldn’t break this support, therefore staying above $334. On top of that, the near-oversold RSI oscillator shows that the move might be over for the time being.

As we mentioned many times now, traders should be careful and pay attention to any increase in volume, but should ultimately try to trade Ethereum’s movements between $334 and $360.

ETH/USD 4-hour Chart

Ethereum’s short-term and long-term technical overviews both look very similar to Bitcoin’s. While its short-term technicals (4-hour and 1-day) are heavily tilted towards the sell-side, its weekly and monthly outlooks are still quite bullish (though the bearish sentiment in short-term technicals is stronger than with Bitcoin, while the bullishness of its long-term overviews is weaker than with Bitcoin).

ETH/USD 4-hour Technicals

Technical Factors (4-hour Chart):
  • The price is below both its 50-period and 21-period EMA
  • The price is at its lower Bollinger band
  • RSI is neutral (37.59)
  • Volume is descending
Key levels to the upside          Key levels to the downside

1: $360                                     1: $334

2: $371                                     2: $300

3: $400                                      3: $289

Ripple

XRP did not differ much from the aforementioned two cryptocurrencies, and pushed towards the downside itself as well. The third-largest cryptocurrency by market cap has broken the $0.2454 level to the downside and entered the “safe zone” between $0.235 and $0.2454. However, the fight for $0.2454 is not over yet, and XRP still has a chance to regain this high, even though it is highly unlikely at this point.

XRP will most likely stay below $0.2454, and traders can use that to their advantage when trading as they could trade XRP’s sideways movements.

XRP/USD 4-hour Chart

XRP 4-hour overview is tilted towards the sell-side, while its daily and weekly overviews are completely bullish. However, its monthly overview is just as bearish as the 4-hour one, showing signs of pre-established bearish sentiment.

XRP/USD 4-hour Technicals

Technical factors (4-hour Chart):
  • The price is at its 50-period EMA and below its 21-period EMA
  • Price is close to its bottom Bollinger band
  • RSI is neutral (46.60)
  • Volume is average
Key levels to the upside          Key levels to the downside

1: $0.266                                   1: $0.2454 

2: $0.27                                     2: $0.235

3: $0.273                                  3: $0.227


Categories
Crypto Market Analysis

Daily Crypto Review, Oct 7 – Crypto Sector Falls As Trump Rejects Stimulus Proposal

The cryptocurrency sector has declined slightly as Bitcoin returned to the level it was on Monday. Bitcoin is currently trading for $10,591, representing a decrease of 0.88% on the day. Meanwhile, Ethereum lost 3.04% on the day, while XRP lost 3.26%.

 Daily Crypto Sector Heat Map

If we look at the top 100 cryptocurrencies, we can see that PumaPay gained 6.93% in the past 24 hours, making it the most prominent daily gainer. EOS (5.08%) and Ethereum Classic (2.6%) also did great. On the other hand, Elrond lost 17.09%, making it the most prominent daily loser. It is followed by Ocean Protocol’s loss of 15.55% and Aave’s loss of 15.24%.

Top 10 24-hour Performers (Click to enlarge)

Bottom 10 24-hour Performers (Click to enlarge)

Bitcoin’s market dominance level has increased slightly since our last report, with its value currently being at 60.95%. This value represents a 0.49% difference to the upside when compared to when we last reported.

Daily Crypto Market Cap Chart

The crypto sector capitalization has lost quite a bit of value over the course of the past 24 hours. Its current value is $335.30 billion, representing a decrease of $7.1 billion compared to our previous report.

_______________________________________________________________________

What happened in the past 24 hours?

_______________________________________________________________________

_______________________________________________________________________

Technical analysis

_______________________________________________________________________

Bitcoin

The largest cryptocurrency by market cap has spent a day declining in price slightly, with many analysts speculating that it was because of US President Donald Trump’s tweet on his rejection of the most recent stimulus proposal. Analysts that are less concerned about fundamentals saw a potential death cross as well as Bitcoin not being able to confidently pass the ascending trend (pink line), ultimately causing a small crash.

For the time being, Bitcoin will remain range-bound by the $10,360 level to the downside and $10,850 level to the upside as main support and resistance levels.

BTC/USD 4-hour Chart

Bitcoin’s short-term technicals have turned more bullish than yesterday, with both its 4-hour and 1-day overview tilting towards the downside. However, its longer-term technicals have remained bullish.

BTC/USD 4-hour Technicals

Technical factors (4-hour Chart):
  • Price is below both its 50-period EMA and 21-period EMA
  • Price is slightly below its middle Bollinger band
  • RSI is ascending (46.96)
  • Volume is average (after the one-candle spike)
Key levels to the upside          Key levels to the downside

1: $10,630                                 1: $10,500

2: $10,850                                 2: $10,360

3: $11,000                                  3: $10,015

Ethereum

Ethereum was trading on increased volume in the past 24 hours, with the volume starting to ramp up as the second-largest cryptocurrency by market cap was unable to break the top Bollinger Band line. This caused a slight crash, which pulled back Ether to its support level of $334, which held up quite nicely.

As we mentioned many times now, traders should pay attention to any increase in volume, but should ultimately trade Ethereum’s movements between $334 and $360.

ETH/USD 4-hour Chart

Ethereum’s short-term and long-term technical outlook looks very similar to Bitcoin’s. Its short term technicals (4-hour and 1-day) are heavily tilted towards the sell-side, while its weekly and monthly outlooks are still quite bullish.

ETH/USD 4-hour Technicals

Technical Factors (4-hour Chart):
  • The price is below both its 50-period and 21-period EMA
  • The price is at its lower Bollinger band
  • RSI is neutral (40.44)
  • Volume is above average
Key levels to the upside          Key levels to the downside

1: $360                                     1: $334

2: $371                                     2: $300

3: $400                                      3: $289

Ripple

XRP had a pullback day, where its price tried to find equilibrium after two days of pushing towards the upside. The third-largest cryptocurrency by market cap traded on increased volume, which indicated that the pullback would be more severe. The price has reached the $0.2454 support level and briefly fell under it as well. It is yet uncertain whether XRP has finished its pullback phase and remained above $0.2454, or if the fight for this level still continues.

XRP/USD 4-hour Chart

XRP 4-hour, daily, and weekly technicals are now tilted towards the buy-side, while its monthly outlook remains tilted towards the sell-side.

XRP/USD 4-hour Technicals

Technical factors (4-hour Chart):
  • The price is above its 50-period EMA and right at its 21-period EMA
  • Price is at its middle Bollinger band
  • RSI is neutral (51.12)
  • Volume is above average
Key levels to the upside          Key levels to the downside

1: $0.266                                   1: $0.2454 

2: $0.27                                     2: $0.235

3: $0.273                                  3: $0.227


Categories
Crypto Daily Topic

Serious Crypto Trading Mistakes and How You Can Avoid Them

The crypto market has made people millionaires overnight. It has also caused others to lose a large amount of their portfolio in the same time span. And it’s stories of the former that have newbie traders jumping on the ship every single day. However, the same reason some have gotten uber-lucky is the same one others have found themselves at the cleaners. 

What’s the reason? Well, the sheer unpredictability of the crypto market makes the markets subject to dramatic changes in the blink of an eye. This volatility means when dealing with the crypto market, lots of extra caution is needed. 

In this article, we’ll detail exactly how. It’s an examination of the most serious mistakes traders are not to make, and how you can avoid them to stand a better chance with your trades. 

#1. Relying on too Many Indicators

Trading indicators are one of the most obvious tricks to get ahead in any kind of trading – at least at first. Soon enough, though, you could easily find yourself lost in the myriad of available indicators available. From Bollinger Bands to MACD, to Stochastic, to EMAs, to RSI and plenty more, it’s so easy to get caught up without any tangible benefits. 

Most beginner traders and even experienced ones often make the mistake of thinking that they must understand all these indicators. Apart from indicators of having the ability to contradict each other, some overlap, meaning there’s no need to use so many. 

The reality is, many of the most successful traders get on while relying very little, if at all, on indicators. 

Instead, they observe things like volume and price action – which give them lots of clues on how to make the next move. 

#2. Trading as Much as You Can

In most crypto trading circles, the mantra is the more you trade, the better your chances. This couldn’t be further from the truth. Success in trading arises from strategy and well-executed trades. 

When you don’t overtrade, you can avoid losses caused by, let’s say, the market being down. Also, things like setting for yourself a fixed number of trades that you must meet daily are actually harmful because they force you to make decisions just to tick the list. In such a scenario, it’s very easy for you to take uncalculated risks that could lead to losses. 

What to do instead? Use your well-curated strategy to enter those particularly promising trades. Remember that your strategy need not be written in stone. What worked last week, last month, and so on might not necessarily work next time. So always change up your strategy in response to market realities. 

#3. Going Against the Trend

Trading against the trend is not a no-no. Many successful traders do that all the time. However, it’s harder for a beginner to pull this move successfully. For instance, it would be folly to buy when the market is bearish. While sometimes it can rebound, most times, profitable opportunities are highly uncertain. 

In most cases, when the market is on a downtrend, better to go short than long. When you become more acquainted with the intricacies of the market, you can make bolder moves. 

#4. Placing The Stop Loss Order Too Close

Stop losses are an indispensable tool of modern-day trading. They can help you limit losses in a security position. But in certain conditions, a stop-loss order can actually hold you back. An example is when you place the order too close to the buying price. 

In the highly-volatile cryptocurrency market, the price can go practically any direction in a very short time. As such, it’s very easy to trigger a stop-loss order before the price has stretched sufficiently. The scenario of the market taking a deep before climbing again is all too common. That’s why you need to give room for the price to test both support and resistance levels. 

#5. Acting on Hype

The cryptocurrency space is riddled with hype and “pump and dump” groups, caused by entities who pose as highly knowledgeable in crypto trends when in actuality, they are scam groups. Pump and dump is a crypto scam where a trader(s) hypes a coin as the next big thing, creating excitement about it in the market. 

The idea is to get unsuspecting traders to rush and purchase the coin. When this happens, the hype masters will offload the coin. Because it’s now flooding in the market, it loses value, and the unsuspecting traders are stuck with a valueless coin.

When you spot this kind of hype, take it with a generous pinch of salt. Do your own research before you invest in any coin. Reliable websites and reputable traders’ social media accounts are good places to start. 

#6. Diving Headfirst

You wouldn’t plunge into new waters without knowing the depth, so why would you do it with your money? One of the surefire ways to lose money in crypto trading is to blindly follow a strategy without knowing the mechanics of it. 

Instead, practice your strategy before applying it to real money. Most trading platforms will allow you to conduct demo trading, trading with virtual money instead of real cash. It’s highly recommended that you use these to rigorously experiment before trading in the real world. 

#7. Being Overconfident

The most successful traders will tell you confidence is part of their recipe. Confidence means carefully calculating a move and proceeding to execute it. And while confidence is great, overconfidence is not. 

Overconfidence can cause you to take unnecessary risks and lose money. It can make you enter trades at every turn while ignoring price direction. Fear is not the only emotion causing traders to lose money. Overconfidence is another. And both are detrimental to the process. 

So what should you do? Be confident, instead. One way to cultivate confidence is to study the markets regularly. The crypto market can change in an instant, and when you have beforehand knowledge of what to do in such a scenario, you can make a better-informed decision. 

One thing to know is that what might work when the markets are falling might not be applicable when they’re on an upturn. Another is that the overall market sentiment should outweigh yours at any point. If the market is falling, it makes no sense to go in and make a trade. Better wait for when the trend is more bullish. 

Another way to be confident? By staying on top of the news. The crypto market is highly sensitive to the news – and this means the news of many events – not just finance news. This could be the outcome of a major election, a natural disaster, and so on. And mind you –  this news never has to be true. Even a rumor could send the markets flying in the opposite direction. What does this mean? Sentiment analysis is key, too. If your sentiment analysis game is on top, then you’ll be more confident in your trades. 

#8. Having a Poor Risk-to-Reward Ratio

A risk-to-reward ratio could make the difference between miserable trades and profitable ones. Most beginner traders think scoring more profitable trades than losing ones is what makes a successful trader. In truth, you can lose more than you win and still come out on top. 

For instance, let’s say you have an 80% winning strategy. Even with such a strategy, a terrible risk-to-reward ratio, such as 1:1, will still lose you money. On the other hand, you can have a 40% winning strategy and with a healthy risk-to-reward ratio like 3:1, flip the tables in the best way. 

What does this mean? Better to have a superior risk-to-reward ratio with a lower winning strategy than a huge strategy with a poor risk-to-reward ratio. 

#9. Being Greedy

Humans are naturally predisposed to want it all – whenever possible. This, in its bare bones, is being greedy. And greed in trading is one of the surest ways to lose. 

Every trader will tell you of a time they entered a profitable position and held on for too long – waiting for it to double or triple. Then the markets changed at the flip of a coin, and they lost the position. What this means is sometimes it’s best to lock in a trade even when it’s rising, because a flash crash is an everyday occurrence in the world of crypto. And you simply never see it coming. 

So the key is to be realistic with your trades. Try to increase your portfolio methodically, rather than trying to make quick gains. 

#10. Entering More and More Losing Positions

This is when a trader insists on buying a  digital asset even though it’s clearly falling in value. In cryptoverse, it’s easy to get attached to a particular asset and continue to buy, even though the asset is taking a beating. While it’s good to trust your judgment, let your decision be based on evidence rather than personal bias. 

Go by this rule: if the market is in a general bearish mode, it’s a good idea to ‘buy the dip.’ But if the asset has been on a downtrend for months, even years, better hold out. Generally, buying into a position of strength works better than buying the dip because a currency is dear to your heart.

Categories
Crypto Market Analysis

Daily Crypto Review, Oct 6 – XRP Gains Over 10% As It Announces The Launch Of A New Crypto Exchange

The cryptocurrency sector has had a slow and steady day of mostly slight price increases. Bitcoin is currently trading for $10,707, representing an increase of 1.03% on the day. Meanwhile, Ethereum gained 0.7% on the day, while XRP gained 3.18%.

 Daily Crypto Sector Heat Map

If we look at the top 100 cryptocurrencies, we can see that the privacy coin sector did really well today. Zcash gained 6.86% on the day, making it the most prominent daily gainer. Monero (5.7%) and Quant (3.5%) also did great. On the other hand, PumaPay lost an astonishing 85.58%, making it the most prominent daily loser. It is followed by Uniswap’s loss of 14.37% and Synthetix Network Token’s loss of 11.59%.

Top 10 24-hour Performers (Click to enlarge)

Bottom 10 24-hour Performers (Click to enlarge)

Bitcoin’s level of market dominance has increased slightly since our last report, with its value currently being at 60.46%. This value represents a 0.16% difference to the upside when compared to when we last reported.

Daily Crypto Market Cap Chart

The crypto sector capitalization has gained value over the course of the past 24 hours. Its current value is $342.40 billion, which represents an increase of $1.16 billion when compared to our previous report.

_______________________________________________________________________

What happened in the past 24 hours?

_______________________________________________________________________

_______________________________________________________________________

Technical analysis

_______________________________________________________________________

Bitcoin

The largest cryptocurrency by market cap has spent another day by slowly gaining in value. The bulls were patient as Bitcoin approached the ascending trend line, ultimately passing it. Bitcoin’s short-term future will be decided by how he manages the $10,850 level. If the level gets tackled and Bitcoin stays above it confidently, we can expect a push towards $11,000-$11,300, or even higher. However, if that level doesn’t hold up, Bitcoin will return to the $10,360 level. Traders should pay attention to any spikes in volume.


BTC/USD 4-hour Chart

Bitcoin’s short-term technicals are a bit less bullish today, as the majority of the oscillators are neutral/bearish. However, its longer-term technicals have remained completely bullish.

BTC/USD 4-hour Technicals

Technical factors (4-hour Chart):
  • Price is above its 50-period EMA and its 21-period EMA
  • Price is slightly below its top Bollinger band
  • RSI is ascending (60.09)
  • Volume is below average
Key levels to the upside          Key levels to the downside

1: $10,630                                 1: $10,500

2: $10,850                                 2: $10,360

3: $11,000                                  3: $10,015

Ethereum

Ethereum’s price is slowly rising ever since the drop on Oct 2. However, the volume is slowly descending, turning Ethereum’s moves more and more dull. We may expect more slow and sideways movement until the volume picks up the pace.

Traders should pay attention to any increase in volume, as well as to Ethereum’s movement between $334 and $360.

ETH/USD 4-hour Chart

Ethereum’s 4-hour outlook has changed to full-out bullish, while its 1-day overview remains tilted towards the sell-side. On the other hand, its long-term overview seems extremely bullish, as its weekly or monthly technicals are both tilted towards the buy-side.

ETH/USD 4-hour Technicals

Technical Factors (4-hour Chart):
  • The price is above both its 50-period and 21-period EMA
  • The price is slightly above its middle Bollinger band
  • RSI is neutral (52.71)
  • Volume is below average
Key levels to the upside          Key levels to the downside

1: $360                                     1: $334

2: $371                                     2: $300

3: $400                                      3: $289

Ripple

XRP has had another amazing day, where its price moved further towards the upside and reached as high as $0.26. If the price manages to stay at this level, its next resistance will be found at the $0.266 level. However, a pullback is expected, where the area between $0.2454 and $0.251 has strong support.

It seems that the bulls have gathered around XRP on news of the company launching a cryptocurrency exchange on top of the XRP ledger, as well as because of the fact that XRP is very close to reaching a golden cross (50-period moving average crossing the 200-period moving average to the upside).

XRP/USD 4-hour Chart

XRP technicals are now tilted towards the buy-side, with the exception of its monthly outlook, which remains bearish.

XRP/USD 4-hour Technicals

Technical factors (4-hour Chart):
  • The price is well-above both its 50-period EMA and its 21-period EMA
  • Price is at its top Bollinger band
  • RSI is overbought (70.16)
  • Volume is above average
Key levels to the upside          Key levels to the downside

1: $0.266                                   1: $0.2454 

2: $0.27                                     2: $0.235

3: $0.273                                  3: $0.227


Categories
Crypto Market Analysis

Daily Crypto Review, Oct 5 – XRP Skyrockets and Gains Over 9%; Uniswap’s Volume Trumps Coinbase

The cryptocurrency sector is experiencing a slow but steady increase in price as Bitcoin is moving towards the upside after the $10,360 low it hit on Oct 2. Bitcoin is currently trading for $10,613, representing an increase of 0.53% on the day. Meanwhile, Ethereum gained 0.48% on the day, while XRP gained 5.79%.

 Daily Crypto Sector Heat Map

If we look at the top 100 cryptocurrencies as well as their gains and losses, Zilliqa gained 10.87% on the day, making it the most prominent daily gainer. Celsius (8.47%) and XRP (6.45%) also did great. On the other hand, SushiSwap Token lost 9.94%, making it the most prominent daily loser. It is followed by UMA’s loss of 8.93% and Bitcoin Gold’s loss of 8.64%.

Top 10 24-hour Performers (Click to enlarge)

Bottom 10 24-hour Performers (Click to enlarge)

Bitcoin’s level of market dominance stayed at the same spot since our last report, with its value currently being at 60.30%. This value represents a 0.07% difference to the downside when compared to when we last reported.

Daily Crypto Market Cap Chart

The crypto sector capitalization has gained value over the course of the weekend. Its current value is $341.26 billion, which represents an increase of $5.80 billion when compared to our previous report.

_______________________________________________________________________

What happened in the past 24 hours?

_______________________________________________________________________

_______________________________________________________________________

Technical analysis

_______________________________________________________________________

Bitcoin

The largest cryptocurrency by market cap has dropped in price due to the fundamentals, such as the US President Donald Trump being ill from COVID-19 as well as one of the largest trading platforms, BitMEX, being charged by the CFTC and the DOJ. However, the drop was only strong enough to push BTC to the $10,360 level, not below it. This is an extremely bullish sign as this support holding is key to the future development of Bitcoin.

Ever since then, Bitcoin has been slowly and steadily gaining in value but is being checked by the ascending trend line (pink). Traders should watch how BTC handles the trend line and if it surpasses it or keeps bouncing off of it.

BTC/USD 4-hour Chart

Bitcoin’s short-term technicals have changed to bullish over the weekend. Its longer-term technicals, however, have remained completely bullish, except for the daily outlook, which is just slightly more neutral.

BTC/USD 4-hour Technicals

Technical factors (4-hour Chart):
  • Price is above its 50-period EMA and its 21-period EMA
  • Price is at its top Bollinger band
  • RSI is ascending (56.69)
  • Volume is below average
Key levels to the upside          Key levels to the downside

1: $10,630                                 1: $10,500

2: $10,850                                 2: $10,360

3: $11,000                                  3: $10,015

Ethereum

Ethereum’s price has acted similar to Bitcoin’s movements, with Ether plummeting on Oct 2 and dropping to the $334 support level. However, bulls have taken over the market, and Ethereum has been slowly rising in the past couple of days. The prediction that options traders made regarding Ether trading below $360 and above $340 during October is still valid, and even more likely.

Traders should pay attention to any increase in volume, as that will spark the next move. The current volume is unable to bring any volatility to Ethereum.

ETH/USD 4-hour Chart

Ethereum’s 4-hour outlook has changed to slightly bullish, while its 1-day overview remains tilted towards the sell-side. However, its long-term overview seems extremely bullish, as its weekly or monthly technicals are both heavily tilted towards the buy-side.

ETH/USD 4-hour Technicals

Technical Factors (4-hour Chart):
  • The price is right below its 50-period and right above its 21-period EMA
  • The price is slightly above its middle Bollinger band
  • RSI is neutral (50.85)
  • Volume is below average
Key levels to the upside          Key levels to the downside

1: $360                                     1: $334

2: $371                                     2: $300

3: $400                                      3: $289

Ripple

XRP has had an amazing day and even managed to get in the top3 daily gainers section. The third-largest cryptocurrency by market capitalization started off the weekend with its price dropping and hitting $0.228. However, the price quickly recovered and hovered below the $0.235 level until it finally broke. The push towards the upside was strong and with high volume, which helped XRP reach as high as $0.254.

XRP is now trying to consolidate above the $0.2454 level, which traders should pay attention to. An additional spark of volatility might be good for trading, regardless of XRP’s direction.

XRP/USD 4-hour Chart

XRP technicals are now quite uniformed and bullish, with both short-term and long-term technicals being completely tilted towards the buy-side. However, its monthly outlook still remains bearish.

XRP/USD 4-hour Technicals

Technical factors (4-hour Chart):
  • The price is above both its 50-period EMA and its 21-period EMA
  • Price is at its top Bollinger band
  • RSI is heading towards the oversold territory (67.36)
  • Volume is above average
Key levels to the upside          Key levels to the downside

1: $0.2454                                 1: $0.235 

2: $0.266                                   2: $0.227

3: $0.27                                    3: $0.221


Categories
Crypto Videos

What Is DeFi Used For?


What is DeFi used for?

The Decentralised finance sector has been flourishing in the past few months, with more and more interest coming both from the side of retail and institutional investors. However, the current system isn’t exactly clear on what DeFi actually brings to the table. This video will hopefully bring a bit more clarity on how DeFi works.

DeFi in Lending

One of the sectors affected the most by the introduction of DeFi is certainly the lending sector. If you have ever applied for any type of loan, you surely know the process is both intense time-consuming. Worst of all, you are forced to use lending companies specifically designed to maximize their returns. On the other hand, the DeFi community produced some interesting ways to improve this sector.

Compound

A good example of a DeFi lending platform is Compound. The Compound platform showcases the true power of DeFi and its ability to transform how the world envisions the financial market in the future. Compound allows users to lend their cryptocurrencies out to other users. In exchange for providing the loan, these users receive interest in the form of cryptocurrency. The platform utilizes smart contracts that match lenders and borrowers. Additionally, these smart contracts make interest adjustments based on the market’s current state automatically.

Decentralized Exchanges

Many consider decentralized exchanges (DEX’s for short) as the logical next step in the evolution of the crypto exchange sector. DEX’s are peer-to-peer trading platforms that provide users with a more streamlined UX, tighter security, as well as more flexibility. Traditional exchanges operate via a centralized organization that monitors, facilitates, and approves all trades within the platform, which defeats the purpose of cryptocurrencies. On top of that, users of centralized exchanges are vulnerable to attacks and hacks, as history has shown us. There were numerous occurrences of exchange hacks in which the central organization, as well as its users, suffered huge losses.
DEX’s eliminate many of these concerns. The platform doesn’t include the assets directly, but rather via a smart contract. This way, there is no “weak spot” that a hacker could exploit.

Uniswap

We will use the Uniswap platform as our example of a decentralized exchange. It introduced an innovative mechanism now known as Automated Market Making. This new protocol enables near-instant settlement between different parties. The protocol will try to close trades as close as possible to the current market value.

DeFi Prediction Platforms

Another interesting development in the DeFi sector is the creation of prediction platforms. These platforms are used to analyze the current public opinion regarding a certain event.
Guesser
One good example of this type of decentralized application is Guesser, as it allows you to make various predictions and examine other people’s results in the pool. You even earn crypto for participation by being right with your prediction.

DeFi is Here to Stay

As the main systems of our society are currently undergoing a transformation towards decentralization, the demand for DeFi applications will rise. These new applications continue to disrupt the financial space in remarkable ways.
Decentralized applications are certainly something that is able to set the new standard for the worldwide economy moving forward.

Categories
Crypto Market Analysis

Daily Crypto Review, Oct 2 – Trump Tests Positive for COVID-19; Crypto and Stocks Negatively Affected

The cryptocurrency sector has failed to confidently push towards new highs, which triggered a pullback. On top of that, the current macroeconomic situation has pushed both cryptocurrencies and stocks towards the downside. Bitcoin is currently trading for $10,476, representing a decrease of 2.82% on the day. Meanwhile, Ethereum lost 5.09% on the day, while XRP lost 3.7%.

 Daily Crypto Sector Heat Map

If we look at the top100 cryptocurrencies as well as their gains and losses, Bitcoin Gold gained 4.88% on the day, making it the most prominent daily gainer. Balancer (3.92%) and Celsius (3.43%) also did great. On the other hand, Energy Web Token lost 16.88%, making it the most prominent daily loser. It is followed by Arweave’s loss of 16.61% and yearn. finance’s loss of 14.45%.

Top 10 24-hour Performers (Click to enlarge)

Bottom 10 24-hour Performers (Click to enlarge)

Bitcoin’s level of market dominance stayed at the same spot since our last report, with its value currently being at 60.37%. This value represents a 0.11% difference to the downside when compared to when we last reported.

Daily Crypto Market Cap Chart

The crypto sector capitalization has lost value over the course of the past 24 hours. Its current value is $336.45 billion, which represents a decrease of $7.99billion when compared to our previous report.

_______________________________________________________________________

What happened in the past 24 hours?

_______________________________________________________________________

_______________________________________________________________________

Technical analysis

_______________________________________________________________________

Bitcoin

The largest cryptocurrency by market cap failed to break the 38.2% Fib retracement level, causing a pullback, which (as we mentioned in our previous article) brought its price to the $10,360 range. The pullback happened over the course of a few hours, and first tested the ascending (pink) resistance level, which got confirmed, triggering another push towards the downside.

Even though Bitcoin’s price went down slightly, the good news is that the $10,360 range has not been breached. If Bitcoin, on the other hand, breaks this level to the downside, we may expect a strong push towards the downside.

BTC/USD 4-hour Chart

Bitcoin’s short-term technicals remained tilted towards the sell-side ever since Bitcoin confirmed its position below the 38.2% Fib retracement. Its daily overview has become a bit more bearish as well, while its weekly and monthly overviews are extremely bullish.

BTC/USD 4-hour Technicals

Technical factors (4-hour Chart):
  • Price is below its 50-period EMA and its 21-period EMA
  • Price is below its lower Bollinger band
  • RSI is pushing towards oversold(37.02)
  • Volume is average (with a couple of spike candles)
Key levels to the upside          Key levels to the downside

1: $10,630                                 1: $10,500

2: $10,850                                 2: $10,360

3: $11,000                                  3: $10,015

Ethereum

Ethereum’s price movement has lost its structure ever since it broke the higher high/higher low pattern it has created. The second-largest cryptocurrency by market cap pushed towards the $371 resistance level, but failed to break it, causing a strong pullback which first tested $360, and then went all the way down to $340 as $360 failed to hold.

ETH/USD 4-hour Chart

While Ethereum’s 4-hour and 1-day technicals are now tilted towards the sell-side, its long-term overview seems extremely bullish. Its weekly or monthly technicals are both heavily tilted towards the buy-side.

ETH/USD 4-hour Technicals

Technical Factors (4-hour Chart):
  • The price right below its 50-period and its 21-period EMA
  • The price is below its lower Bollinger band
  • RSI is heading towards the oversold territory (36.74)
  • Volume is average with a couple of spike candles
Key levels to the upside          Key levels to the downside

1: $360                                     1: $340

2: $371                                     2: $300

3: $400                                      3: $289

Ripple

XRP’s trading in the upper part of the range-bound by $0.235 and $0.2454 got interrupted by the market tumbling, pushing its price down towards $0.235 as well. While the $0.235 level was passed in the most recent push towards the downside, it is still unsure whether the price will stabilize above or below it. Traders should be very careful and should either try “riding the wave” if XRP starts to drop, or they should wait until the picture becomes a bit more clear.

XRP/USD 4-hour Chart

XRP technicals are now quite uniformed, with both short-term and long-term technicals being bearish. However, its weekly outlook shows a slight tint of bullishness.

XRP/USD 4-hour Technicals

Technical factors (4-hour Chart):
  • The price is below both its 50-period EMA and its 21-period EMA
  • Price is slightly below its lower Bollinger band
  • RSI is heading towards the oversold territory (37.47)
  • Volume is average (with a couple of spike candles)
Key levels to the upside          Key levels to the downside

1: $0.2454                                 1: $0.235 

2: $0.266                                   2: $0.227

3: $0.27                                    3: $0.221


Categories
Crypto Market Analysis

Daily Crypto Review, Oct 1 – Bitcoin Fighting for $10,850; Ethereum Bulls Rallying Against All Odds

The cryptocurrency sector ended up the day in the green, with most cryptocurrencies rallying towards the upside. Bitcoin is currently trading for $10,796, representing an increase of 1.28% on the day. Meanwhile, Ethereum gained 2.46% on the day, while XRP gained 1.15%.

 Daily Crypto Sector Heat Map

If we look at the top100 cryptocurrencies and their gains and losses, DigiByte gained 19.31% in the past 24 hours, making it the most prominent daily gainer. Ren (17.14%) and Maker (15.03%) also did great. On the other hand, The Midas Touch Gold lost 12.25%, making it the most prominent daily loser. It is followed by Energy Web Token’s loss of 7.37% and Hyperion’s loss of 5.71%.

Top 10 24-hour Performers (Click to enlarge)

Bottom 10 24-hour Performers (Click to enlarge)

Bitcoin’s level of market dominance decreased slightly since our last report, with its value currently being at 60.05%. This value represents a 0.43% difference to the downside when compared to when we last reported.

Daily Crypto Market Cap Chart

The crypto sector capitalization has gained in value over the course of the past 24 hours. Its current value is $349.36 billion, which represents an increase of $4.95 billion when compared to our previous report.

_______________________________________________________________________

What happened in the past 24 hours?

_______________________________________________________________________

_______________________________________________________________________

Technical analysis

_______________________________________________________________________

Bitcoin

Bitcoin’s 1-day chart shows that slight bullish sentiment took over after Bitcoin broke the triangle formation to the upside, pushing its price towards the 38.2% Fib retracement, which has proven as a resistance area. It is key for Bitcoin to confidently establish its price above this level if it wants to tackle $11,000 any time soon. However, if this does not happen, we may expect pullbacks to the $10,360 area.

BTC/USD 1-day Chart

If we zoom in to the 4-hour chart, we can see that the bulls are desperately trying to break the $10,850 level (38.2% Fib retracement), but to no avail. If the level does fall, however, we expect it to be on increased volume. Also, if that happens, the push will probably be extended, and traders can catch a lucrative trade on the way down while Bitcoin pulls back.

BTC/USD 4-hour Chart

Bitcoin’s technicals are showing strength all-around, with both shorter and longer time-frames showing bullish sentiment. This may be an indicator of Bitcoin’s current strength and a possible push past $10,850.

BTC/USD 4-hour Technicals

Technical factors (4-hour Chart):
  • Price is slightly above both its 50-period EMA and its 21-period EMA
  • Price is right above its middle Bollinger band
  • RSI is neutral (56.31)
  • Volume is average
Key levels to the upside          Key levels to the downside

1: $10,850                                 1: $10,630

2: $11,000                                 2: $10,500

3: $11,090                                  3: $10,015

Ethereum

Ethereum has shown some strength in the past 24 hours. Its price pattern of making higher highs and higher lows has been interrupted by a lower high and a lower low the past day. On the other hand, its current price movement seems to ignore this bearish sign and is pushing higher towards the $371 level. It seems that, however, $371 will not be reached as the volume is descending and showing a lack of interest in any volatility from both bulls and bears.

When it comes to any form of price direction prediction, traders are torn between putting Ethereum’s current movement in an ascending trend and calling for a rally towards the upside, or calling the most recent lower high/lower low combo a break of the ascending trend, and calling for a push towards the downside.

ETH/USD 4-hour Chart

Both Ethereum’s short-term and long-term technical overviews are tilted towards the buy-side. While its longer-term technicals were always bullish, its 4-hour and 1-day overviews changed from bearish to bullish since we last reported, indicating that the bullish traders might be in the right when it comes to Ethereum’s next move.

ETH/USD 4-hour Technicals

Technical Factors (4-hour Chart):
  • The price is above both its 50-period and its 21-period EMA
  • The price is above its middle Bollinger band
  • RSI is pushing towards the overbought area (59.99)
  • Volume is below average
Key levels to the upside          Key levels to the downside

1: $360                                     1: $340

2: $371                                     2: $300

3: $400                                      3: $289

Ripple

XRP has been trading sideways near its $0.2454 resistance level and tried to break it several times. However, each time failed, and the cryptocurrency had to pull back towards the middle of the range and prepare for its next move. XRP’s low volume and low volatility may be confirming that it is just preparing for the next big move, but the direction is currently unknown. If it rallies towards the upside, traders can either join the extended leg up or trade the pullback. If the price moves down, traders can either trade a bounce off of the $0.235 or wait for a possible break of this support level.

XRP/USD 4-hour Chart

XRP technicals are seemingly always the most interesting and confusing. When it comes to short time-frames, the 4-hour outlook is mixed (but tilted slightly towards the buy-side), while the daily outlook is slightly bearish. Its weekly outlook is back to bullish, while its monthly technicals show bearish sentiment.

XRP/USD 4-hour Technicals

Technical factors (4-hour Chart):
  • The price is slightly above both its 50-period EMA and its 21-period EMA
  • Price is at its middle Bollinger band
  • RSI is neutral (51.39)
  • Volume is stable, and average
Key levels to the upside          Key levels to the downside

1: $0.2454                                 1: $0.235 

2: $0.266                                   2: $0.227

3: $0.27                                    3: $0.221


Categories
Crypto Market Analysis

Daily Crypto Review, Sept 30 – Goldman Sachs Entering the Crypto Sector; Bitcoin Prepares for a Move

The cryptocurrency sector has stayed at virtually the same spot since our last report. Bitcoin is currently trading for $10,688, representing a decrease of 0.07% on the day. Meanwhile, Ethereum gained 0.18% on the day, while XRP lost 0.95%.

 Daily Crypto Sector Heat Map

If we look at the top100 cryptocurrencies and their gains and losses, The Midas Touch Gold gained 21.5% on the day, making it the most prominent daily gainer. Zilliqa (14.64%) and Energy Web Token (11.71%) also did great. On the other hand, DeFi projects took a hit as UMA lost 10.9%, making it the most prominent daily loser. It is followed by yearn.finance’s loss of 7.8% and OMG Network’s loss of 6.4%.

Top 10 24-hour Performers (Click to enlarge)

Bottom 10 24-hour Performers (Click to enlarge)

Bitcoin’s level of market dominance stayed at the same spot since our last report, with its value currently being at 60.48%. This value represents a 0.02% difference to the upside when compared to when we last reported.

Daily Crypto Market Cap Chart

The crypto sector capitalization has gained in value over the course of the past 24 hours. Its current value is $344.44 billion, which represents an increase of $0.55 billion when compared to our previous report.

_______________________________________________________________________

What happened in the past 24 hours?

_______________________________________________________________________

_______________________________________________________________________

Technical analysis

_______________________________________________________________________

Bitcoin

While it seems that Bitcoin is having quite a slow day, that is not exactly the case. Even though its price has not changed much since our last report, the largest cryptocurrency by market cap is fighting to stay above the triangle formation it has recently passed. If it manages to confirm its position above the triangle (and then 38.2% Fib retracement level), Bitcoin will set itself up to rush towards (and past) $11,000.

BTC/USD 1-day Chart

If we zoom in to the 4-hour chart, we can see that Bitcoin is right on the verge of going back under is level, but has held up nicely so far. Trading is quite simple at the moment, as Bitcoin is not making any sudden moves either towards the upside or downside.

BTC/USD 4-hour Chart

Bitcoin’s short-term technicals are tilted towards the sell-side and will be tilted in that direction until Bitcoin confirms its position above the 38.2% Fib retracement. However, its daily overview is slightly bullish, while its weekly and monthly overviews are extremely bullish.

BTC/USD 4-hour Technicals

Technical factors (4-hour Chart):
  • Price is slightly above its 50-period EMA and below its 21-period EMA
  • Price is right below its middle Bollinger band
  • RSI is neutral (48.90)
  • Volume is average
Key levels to the upside          Key levels to the downside

1: $10,850                                 1: $10,630

2: $11,000                                 2: $10,500

3: $11,090                                  3: $10,015

Ethereum

Ethereum has been pretty stable in the past 24 hours. Its price has been making higher highs and higher lows ever since Sept 24, until now. The trend has (seemingly) stopped, with Ethereum being stopped out by the $360 resistance level. While this makes Ethereum’s outlook slightly more bearish, in reality, this doesn’t change much as Ethereum Option traders have already made a prediction of ETH trading between $340 and $360 by the end of Oct.

ETH/USD 4-hour Chart

While Ethereum’s 4-hour and 1-day technicals are now tilted towards the sell-side, its longer-term overview is extremely bullish. If we take a look at its weekly or monthly technicals, the sentiment is heavily tilted towards the buy-side.

ETH/USD 4-hour Technicals

Technical Factors (4-hour Chart):
  • The price is at its 50-period and its 21-period EMA
  • The price is at its middle Bollinger band
  • RSI is neutral (50.89)
  • Volume is below average
Key levels to the upside          Key levels to the downside

1: $360                                     1: $340

2: $371                                     2: $300

3: $400                                      3: $289

Ripple

XRP has, after four days of trying, failed to break the $0.2454 resistance level. Its price has fallen off a bit since the last attempt, currently trading at around $0.24. We can also see that XRP has moved below its 50-period moving average, which may cause a further descent towards $0.235.

XRP/USD 4-hour Chart

XRP technicals are quite confusing. While its 4-hour outlook is mixed, its daily outlook is heavily tilted towards the sell-side. On the other hand, its weekly outlook is bullish, while its monthly outlook is, once again, bearish.

XRP/USD 4-hour Technicals

Technical factors (4-hour Chart):
  • The price is below both its 50-period EMA and its 21-period EMA
  • Price is slightly below its middle Bollinger band
  • RSI is neutral (48.16)
  • Volume is stable and average
Key levels to the upside          Key levels to the downside

1: $0.2454                                 1: $0.235 

2: $0.266                                   2: $0.227

3: $0.27                                    3: $0.221


Categories
Crypto Videos

Blockchain Can Shield Banks From Trade Scandals! The Banks Mass Adoption Of Blockchain Is Coming!


Blockchain Can Shield Banks From Trade Finance Scandals

Blockchain word as symbol cryptocurrency in chrome chain.

The pressure created by the ongoing economic crisis, mounting geopolitical tensions, and obsolete trade finance systems is pushing the trade finance industry all across the globe down a rabbit hole. To add fuel to the fire, recent trade finance scandals that involved major players such as Hin Leong, Agritrade, ZenRock, and Hontop Energy netted a combined loss of almost $6 billion. To limit exposure to such threats, major banks such as ABN Amro, Société Générale, and BNP Paribas have all withdrawn completely from the sector, while others stayed in the sector but raised the bar on their funding processes.

Samir Neji, founder, and CEO of Dltledgers, said: “For traders and other businesses that involve moving goods around the world, capital is now much harder to come by. This is bringing the sector that is already in difficulty further down.” By implementing blockchain, Neji pointed out. Traders can negate the paperwork, email exchanges, and phone calls that are now required to secure trade finance.
Distributed ledger technology (DLT for short) has the potential to bring transparency to the process of trade execution by sharing information in real-time, he added.

When all sides immutably record everything from trade participants, goods, documents, contracts, and payments on a single safe platform that provides tracking and authentication, the chances of a trade being fraudulent would plummet, or perhaps disappear altogether. Neji also said: “If banks see their trades carrying less risk, which they do when using DLT, the trader will be in a much better spot to get financing, and in many cases, will even end up paying lower rates.”
Apart from regaining the banks’ trust to fund global trade, blockchain would also allow traders to easily, smoothly, and safely execute their trades during the ongoing pandemic.

Conclusion

Regarding the adoption of blockchain technology by trade finance and supply chain players, Neji stressed that it was important to stop just talking about blockchain to customers and that they should just see the benefits the technology would offer themselves.
According to the exec, just as with using a smartphone, it is not important for people to know all the technicalities of the underlying technology if they want to actually benefit from it. He said that his company, as well as other companies in the sector, are working to incorporate blockchain in trade finance, but that they need to work together more so they could fight the common foes, such as paper documents, outdated processes, as well as fraud.

Categories
Crypto Videos

Binance Is Entering the DeFi Space!


Binance Entering the DeFi Space

Crypto exchange giant Binance has announced that it will be delving deeper into the world of DeFi products with its latest offering, which is an automated market maker named Binance Liquid Swap.

Aimed directly at its competitor Uniswap, as well as at its clones, Binance will launch an AMM liquidity pool that will allow its users to provide liquidity by depositing tokens. Just like Uniswap, which is the world’s most popular decentralized exchange, newly-created Binance Liquid Swap will also enable users to earn interest as well as a cut of the trading fees for the pool.

Binance’s product is the first AMM pool on a centralized exchange, and will, as such, be integrated into the Binance.com exchange. This will allow users of the Binance platform to pool tokens in their wallets to earn rewards.

The AMM pool will use a pricing module instead of an order book so they could provide more stable prices as well as lower transaction fees according to the announcement Binance made. The company is currently prioritizing liquidity for its own tokens, which means that the first pools offered on launch will be BUSD/DAI, USDT/BUSD, and USDT/DAI.

Earnings from the AMM pool will be accrued with a corresponding seven-day annual percentage yield (APY for short) with returns converted into the assets in their respective pools. Transaction fees, as well as prices, will be determined by the number of assets gathered in the liquidity pools.


Binance CEO stated that the new product is aimed to attract more volume and participants. He said:

“We hope we can further the growth of the DeFi space and empower our users with more earning power and easy liquidity through a centralized AMM pool. The pool’s main characteristics are credibility, safety, and security, which are all provided by Binance,”

Uniswap is, at the moment, the world’s most popular token swapping protocol as well as a decentralized exchange, with more than $1.8 billion in liquidity.

Binance Liquid Swap is actually the second venture into DeFi that the company has made within a week. On Sept 1, the crypto exchange took aim at Ethereum by launching ‘Binance Smart Chain,’ a new Ethereum smart contract that is compatible with the existing Binance Chain.

The company stated that the blockchain was optimized for DeFi, with the goal of low-cost transaction fees that can go as low as 1 cent.

Categories
Crypto Guides

Is EOS A Better Investment Than Ethereum Right Now?

Introduction

EOS and Ethereum both are popular blockchain smart contract platforms. To know whether EOS is a better investment or Ethereum, we will need to compare the two technologies by exploring basic concepts and comparing their mechanisms to draw out the necessary conclusions. After Ethereum was introduced in the crypto industry, two years later, EOS was launched and claimed to fix the flaws in Ethereum. EOS is a strong, scalable contender and might outperform Ethereum. The battle of EOS vs. Ethereum is the most interesting and happening space in the crypto industry. 

What is Ethereum?

Ethereum is a blockchain platform launched in 2015 by Vitalik Buterin. It allows users to send and receive funds independently without the assistance of any third party. It was the first blockchain project to install the smart technology contract. In this technology, some predefined conditions are applied, and users are needed to justify the conditions to proceed with transactions without the need for an intermediate body. This decentralized blockchain has its own cryptocurrency called Ether (ETH), which is tradable in most of the crypto exchanges. 

What is EOS?

EOS is a new blockchain platform that can also manage smart contracts. The Block.one company launched this project in 2017. It has created history by raising the highest Initial Coin Offering(ICO), worth more than $2.5 billion. It has its own EOS coin, which can be transferred from wallet to wallet. EOS aims to become the most scalable, cheapest, and fastest blockchain platform. 

Scalability

Presently Ethereum can support 15 transactions per second, whereas EOS can serve up to at least 10,000 transactions/second. EOS using IoT provides for inter-blockchain communication, which creates blockchains to allow more transactions. Ethereum is working on two protocols called “Plasma” and “Sharding” to increase transaction numbers per second. 

Transaction Cost

On Ethereum, users need to pay gas for each transaction, but EOS works completely in a different way. EOS blockchain users deposit their token to cover the bandwidth required for the transaction. 

Consensus Mechanism

Ethereum is based upon the proof-of-work model, and EOS follows the proof-of-stake model. The transactions are verified without the support of any intermediate system. Ethereum generates random puzzles at every node before confirming the transactions. These puzzles are so difficult to solve that you need to take the help of experts called “Miners.” While EOS offers to stake your coins to verify transactions, the stakers have a chance to earn the rewards. 

EOS Vs. Ethereum: Who holds the future?

Ethereum, just after Bitcoin, is the most popular cryptocurrency across the world. EOS, right from its initial days, is performing exceptionally well. EOS is yet to achieve growth that Ethereum has already achieved, but EOS is significantly better than Ethereum. EOS is a more user-friendly cryptocurrency than ETH. It’s still too early to think about how far EOS will go because the blockchain ecosystem is highly unpredictable. 

Conclusion 

EOS is younger than Ethereum and has improved scalability and transaction fees as compared to Ethereum, but still, it’s under so much controversy because of its more centralized layout. If Ethereum successfully implements the proof-of-stake mechanism, then EOS might not be able to outperform it. On the other hand, if Ethereum doesn’t reduce it’s transaction costs, then EOS will easily overtake Ethereum soon is what crypto experts believe. Cheers! 

Categories
Crypto Market Analysis

Daily Crypto Review, Sept 29 – Bitcoin’s Fail to Break $11,000 Causes a Red Day for Crypto: What’s Next?

The cryptocurrency sector has lost some value as Bitcoin failed to break $11,000. Bitcoin is currently trading for $10,660, representing a decrease of 1.68% on the day. Meanwhile, Ethereum lost 1% on the day, while XRP gained 0.76%.

 Daily Crypto Sector Heat Map

If we look at the top100 cryptocurrencies and their gains and losses, OMG Network gained 27% on the day, making it the most prominent daily gainer. ABBC Coin (18.7%) and Storj (16.95%) also did great. On the other hand, DeFi projects took a hit as Uniswap lost 16.2%, making it the most prominent daily loser. It is followed by DFI. Money’s loss of 13.47% and Ocean Protocol’s loss of 12.4%.

Top 10 24-hour Performers (Click to enlarge)

Bottom 10 24-hour Performers (Click to enlarge)

Bitcoin’s level of market dominance decreased slightly since our last report, with its value currently being at 60.46%. This value represents a 0.29% difference to the downside when compared to when we last reported.

Daily Crypto Market Cap Chart

The crypto sector capitalization has lost in value over the course of the past 24 hours. Its current value is $343.89 billion, which represents a decrease of $5.5billion when compared to our previous report.

_______________________________________________________________________

What happened in the past 24 hours?

_______________________________________________________________________

_______________________________________________________________________

Technical analysis

_______________________________________________________________________

Bitcoin

Bitcoin failed to end the day above the large triangle formation (and the 38.2 Fib retracement level), which caused its price to push back inside the body of the triangle. The move towards the upside exhausted the buyers as they couldn’t get past the 50-day moving average as well as the Fib retracement level.

BTC/USD 1-day Chart

If we zoom in to the 4-hour chart, we can clearly see that this was a fakeout that exhausted the buy-side even further. While it is unknown where Bitcoin’s next move will be, traders should look at the triangle and check for where BTC exits it.

BTC/USD 4-hour Chart

Bitcoin’s short-term technicals have changed its position from a “buy” to a “sell.” When comparing the technicals, we can see that the longer time frame we pick, the more bullish the Bitcoin overview is.

BTC/USD 4-hour Technicals

Technical factors (4-hour Chart):
  • Price is slightly below its 50-period EMA and below its 21-period EMA
  • Price is below its middle Bollinger band
  • RSI is neutral (47.23)
  • Volume is average
Key levels to the upside          Key levels to the downside

1: $10,850                                 1: $10,630

2: $11,000                                 2: $10,500

3: $11,090                                  3: $10,015

Ethereum

Ethereum has been in a state of constant price growth since Sept 24, with the price posting higher and highs as well as higher lows. This time, while the movement towards the downside was a bit sharper than usual, Ethereum has still posted a higher low, indicating it’s not as bullish as many people think. However, this move towards the downside stopped Ethereum from moving above the dreaded $360 resistance level, once again fulfilling the words of the majority of Options traders, which called for ETH trading between $340 and $360 until the end of October.

ETH/USD 4-hour Chart

While Ethereum’s 4-hour and 1-day technicals turned slightly more bearish and are tilted towards the sell-side, its longer-term overview is extremely bullish. When talking about weekly or monthly technicals, the sentiment is heavily tilted towards the buy-side.

ETH/USD 4-hour Technicals

Technical Factors (4-hour Chart):
  • The price is at its 50-period and its 21-period EMA
  • The price is at its middle Bollinger band
  • RSI is neutral (51.26)
  • Volume is average
Key levels to the upside          Key levels to the downside

1: $360                                     1: $340

2: $371                                     2: $300

3: $400                                      3: $289

Ripple

Not much has happened for XRP in the past 24 hours regarding price movement. The $0.2454 level stopped out any push from the bull-side, making XRP stagnant just below this resistance level. However, this made it almost clear that the 5th leg of the Elliot impulse wave did end with XRP’s move towards $0.219 (the circled candles). We can expect XRP to trader between the $0.235 support level and $0.2454 resistance level for some time.

XRP/USD 4-hour Chart

Ever since XRP left the Elliot wave pattern behind it, its short-term overview has turned bullish. However, its overview changes to bearish and then extremely bearish the longer we go in time (daily, weekly, monthly overview).

XRP/USD 4-hour Technicals

Technical factors (4-hour Chart):
  • The price is above both its 50-period EMA and its 21-period EMA
  • Price is slightly above its middle Bollinger band
  • RSI is neutral (55.23)
  • Volume is stable and average
Key levels to the upside          Key levels to the downside

1: $0.2454                                 1: $0.235 

2: $0.266                                   2: $0.227

3: $0.27                                    3: $0.221


Categories
Crypto Market Analysis

Daily Crypto Review, Sept 28 – XRP Exiting Bearish Structure and Aiming for $0.245; Bitcoin Eyeing $11,000

The cryptocurrency sector was mostly trading sideways over the weekend, with a sudden burst towards the upside in recent hours. Bitcoin is currently trading for $10,877, representing an increase of 1.14% on the day. Meanwhile, Ethereum lost 0.59% on the day, while XRP gained 0.18%.

 Daily Crypto Sector Heat Map

If we look at the top100 cryptocurrencies, Arweave gained 36.17% on the day, making it the most prominent daily gainer. Swipe (21.16%) and CyberVein (12.64%) also did great. On the other hand, ABBC Coin lost 18.37%, making it the most prominent daily loser. It is followed by DFI.Money’s loss of 10.91% and Reserve yearn.finance’s loss of 10.43%.

Top 10 24-hour Performers (Click to enlarge)

Bottom 10 24-hour Performers (Click to enlarge)

Bitcoin’s level of market dominance decreased slightly since our last report, with its value currently being at 60.75%. This value represents a 0.72% difference to the downside when compared to when we last reported.

Daily Crypto Market Cap Chart

The crypto sector capitalization has increased in value over the weekend. Its current value is $349.48 billion, which represents a decrease of $13.19 billion when compared to our previous report.

_______________________________________________________________________

What happened in the past 24 hours?

_______________________________________________________________________

_______________________________________________________________________

Technical analysis

_______________________________________________________________________

Bitcoin

Bitcoin has spent the weekend preparing for a move towards the upside, which happened in recent hours. While the move did break the large triangle to the upside, it stopped at the 38.2% level, which it is now fighting for. Only a daily close above this level would mean that the bulls have taken over the market, while anything else is far less bullish.

BTC/USD 1-day Chart

If we zoom in to the 4-hour chart, we can see that the largest cryptocurrency by market cap got stopped out (for now) at the 38.2% Fib retracement level. The next couple of hours will be crucial in determining Bitcoin’s short-term future and its sentiment.

BTC/USD 4-hour Chart

Bitcoin’s short-term technicals tilted even more towards the bull side over the weekend. On the other hand, its long-term technicals are still bullish on all time-frames.

BTC/USD 4-hour Technicals

Technical factors (4-hour Chart):
  • Price is above both its 50-period EMA and 21-period EMA
  • Price above its top Bollinger band
  • RSI is static but close to being overbought (62.31)
  • Volume is steady with a few spikes
Key levels to the upside          Key levels to the downside

1: $10,850                                 1: $10,630

2: $11,000                                 2: $10,500

3: $11,090                                  3: $10,015

Ethereum

Unlike Bitcoin, Ethereum didn’t have a strong move towards the upside, but rather kept its trading within a range, bound by $360 to the upside and $340 to the downside. As we said in our previous post, options traders bet on Ethereum having over 55% chance of staying below $360 and above $340 in the next month, with only around 20% of them betting on ETH breaking the $360 mark in October.

ETH/USD 4-hour Chart

While Ethereum’s 4-hour technicals are tilted towards the buy-side, its 1-day technicals are bearish. When talking about weekly or monthly technicals, the sentiment is tilted towards the buy-side heavily.

ETH/USD 4-hour Technicals

Technical Factors (4-hour Chart):
  • The price is above its 50-period and its 21-period EMA
  • The price ascension is stopped by its top Bollinger band
  • RSI is neutral (57.76)
  • Volume is below average
Key levels to the upside          Key levels to the downside

1: $360                                     1: $340

2: $371                                     2: $300

3: $400                                      3: $289

Ripple

XRP’s price movement has surprised traders as they expected it to push more towards the downside and continue its Elliot impulse wave 5th leg movement. However, it seems that XRP wanted to move towards the upside and pushed towards its $0.2454 resistance (unsuccessfully).

Traders are calling for two scenarios, with one being that XRP hasn’t finished its Elliot impulse wave pattern yet and that it will revisit the $0.21 lows before doing anything else. However, many traders are now saying that the impulse wave has ended with XRP reaching $0.219 instead of $0.21 and that it is now moving freely and trying to push above its resistance levels. While both sides have their reasoning, the large ascending support level (red line) is tipping the scales in favor of XRP, already ending its Elliot wave structure.

XRP/USD 1-day Chart

If we zoom in to the 4-hour chart, it’s even more apparent that the Elliot impulse wave has finished, and that XRP is now moving towards its support/resistance levels without such a strong pattern behind it.

XRP/USD 4-hour Chart

XRP’s 4-hour sentiment has turned bullish after (most likely) finishing its Elliot impulse wave pattern. Not only that, but its slightly longer time-frames are also tilted towards the buy-side, which is a healthy change when compared to last week. However, its monthly overview is still looking bearish (though not as much as before the weekend).

XRP/USD 4-hour Technicals

Technical factors (4-hour Chart):
  • The price is above both its 50-period EMA and its 21-period EMA
  • Price is slightly below its top Bollinger band
  • RSI is neutral (59.22)
  • Volume is stable and average
Key levels to the upside          Key levels to the downside

1: $0.235                                   1: $0.227 

2: $0.2454                                 2: $0.221

3: $0.266                                  3: $0.214


Categories
Crypto Market Analysis

Daily Crypto Review, Sept 25 – ETH Options Traders Like Trading Below $360; Crypto Market In the Green

The cryptocurrency sector has surprised the market and pushed towards the upside despite the short-term bearish sentiment surrounding it recently. Bitcoin is currently trading for $10,630, representing an increase of 3.56% on the day. Meanwhile, Ethereum gained 5.49% on the day, while XRP gained 3.71%.

 Daily Crypto Sector Heat Map

If we look at the top100 cryptocurrencies, Avalanche gained 24.96% on the day, making it the most prominent daily gainer. ABBC Coin (22.9%) and Arweave (18.7%) also did great. On the other hand, Hyperion lost 3.05%, making it the most prominent daily loser. It is followed by CyberVein’s loss of 2.76% and Reserve Paxos Standard’s loss of 0.4%.

Top 10 24-hour Performers (Click to enlarge)

Bottom 10 24-hour Performers (Click to enlarge)

Bitcoin’s level of market dominance stayed at the same spot since our last report, with its value currently being at 61.47%. This value represents a 0.02% difference to the upside when compared to when we last reported.

Daily Crypto Market Cap Chart

The crypto sector capitalization has increased in value over the past 24 hours. Its current value is $336.29 billion, which represents a decrease of $11.24 billion when compared to our previous report.

_______________________________________________________________________

What happened in the past 24 hours?

_______________________________________________________________________

_______________________________________________________________________

Technical analysis

_______________________________________________________________________

Bitcoin

Bitcoin has spent the past 24 hours pushing towards the upside, which resulted in a price increase of around 6% during its peak. The largest cryptocurrency by market cap has reached $10,800 before the bulls have exhausted their resources. This move towards the upside has put BTC within the large triangle, meaning that we can expect another strong move (to either side of the triangle) in the short future.

BTC/USD 1-day Chart

If we take a look at the 4-hour time-frame, the largest cryptocurrency by market cap has pushed past 23.6% Fib retracement and established itself well above it. Once the move ended, BTC found immediate support at the 50-period moving average.

BTC/USD 4-hour Chart

Bitcoin’s short-term technicals have changed its overview from very bearish to slightly bullish. On the other hand, its long-term technicals remained extremely bullish on all time-frames longer than 4-hours.

BTC/USD 4-hour Technicals

Technical factors (4-hour Chart):
  • Price is above both its 50-period EMA and 21-period EMA
  • Price near its top Bollinger band
  • RSI is neutral and tilted towards the upside (56.98)
  • Volume is volatile
Key levels to the upside          Key levels to the downside

1: $10,850                                 1: $10,630

2: $11,000                                 2: $10,500

3: $11,090                                  3: $10,015

Ethereum

Ethereum has pushed towards the upside, following Bitcoin’s move and gaining a bit less than 10% in the past 24 hours (during its peak). The second-largest cryptocurrency by market cap pushed past the $340 resistance line and established itself above it, therefore turning it into support. However, further moves towards and past $360 may be difficult at the moment, as we saw option traders for October expiration contracts “betting” that Ether is most likely going to trade between $340 and $360.

ETH/USD 4-hour Chart

Ethereum’s short-term technicals have not changed much since yesterday, tilting just slightly less to the sell-side than before. Its overview of longer time frames is extremely bullish, especially on the 1-day and 1-month technical overview.

ETH/USD 4-hour Technicals

Technical Factors (4-hour Chart):
  • The price is below its 50-period and right at its 21-period EMA
  • The price is between its top and middle Bollinger band
  • RSI is neutral (47.68)
  • Volume increased (but descending towards average)
Key levels to the upside          Key levels to the downside

1: $360                                     1: $340

2: $371                                     2: $300

3: $400                                      3: $289

Ripple

While XRP didn’t differ from the rest of the top cryptocurrencies and pushed towards the upside as well, the gains it made may not remain gains for long. XRP managed to gain around 5% in the past 24 hours (during its peak) but found great resistance at the 5th leg of the Elliot impulse wave. XRP quickly bounced off of it, indicating that we may see consolidation and a continuation towards the downside, where XRP will fulfill its move at the $0.219 target.

XRP/USD 4-hour Chart

XRP’s bearish sentiment extends across all time frames, with its 4-hour overview showing a bit lighter tilt towards the sell-side, and its longer time-frame overviews showing a strong tilt towards the sell-side.

XRP/USD 4-hour Technicals

Technical factors (4-hour Chart):
  • The price is below its 50-period EMA and just above its 21-period EMA
  • Price is slightly above its middle Bollinger band
  • RSI is natural (49.02)
  • Volume is slightly above average
Key levels to the upside          Key levels to the downside

1: $0.235                                   1: $0.227 

2: $0.2454                                 2: $0.221

3: $0.266                                  3: $0.214