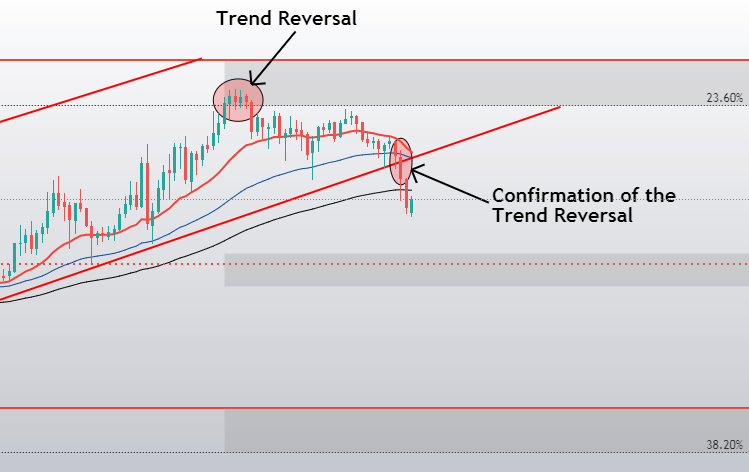
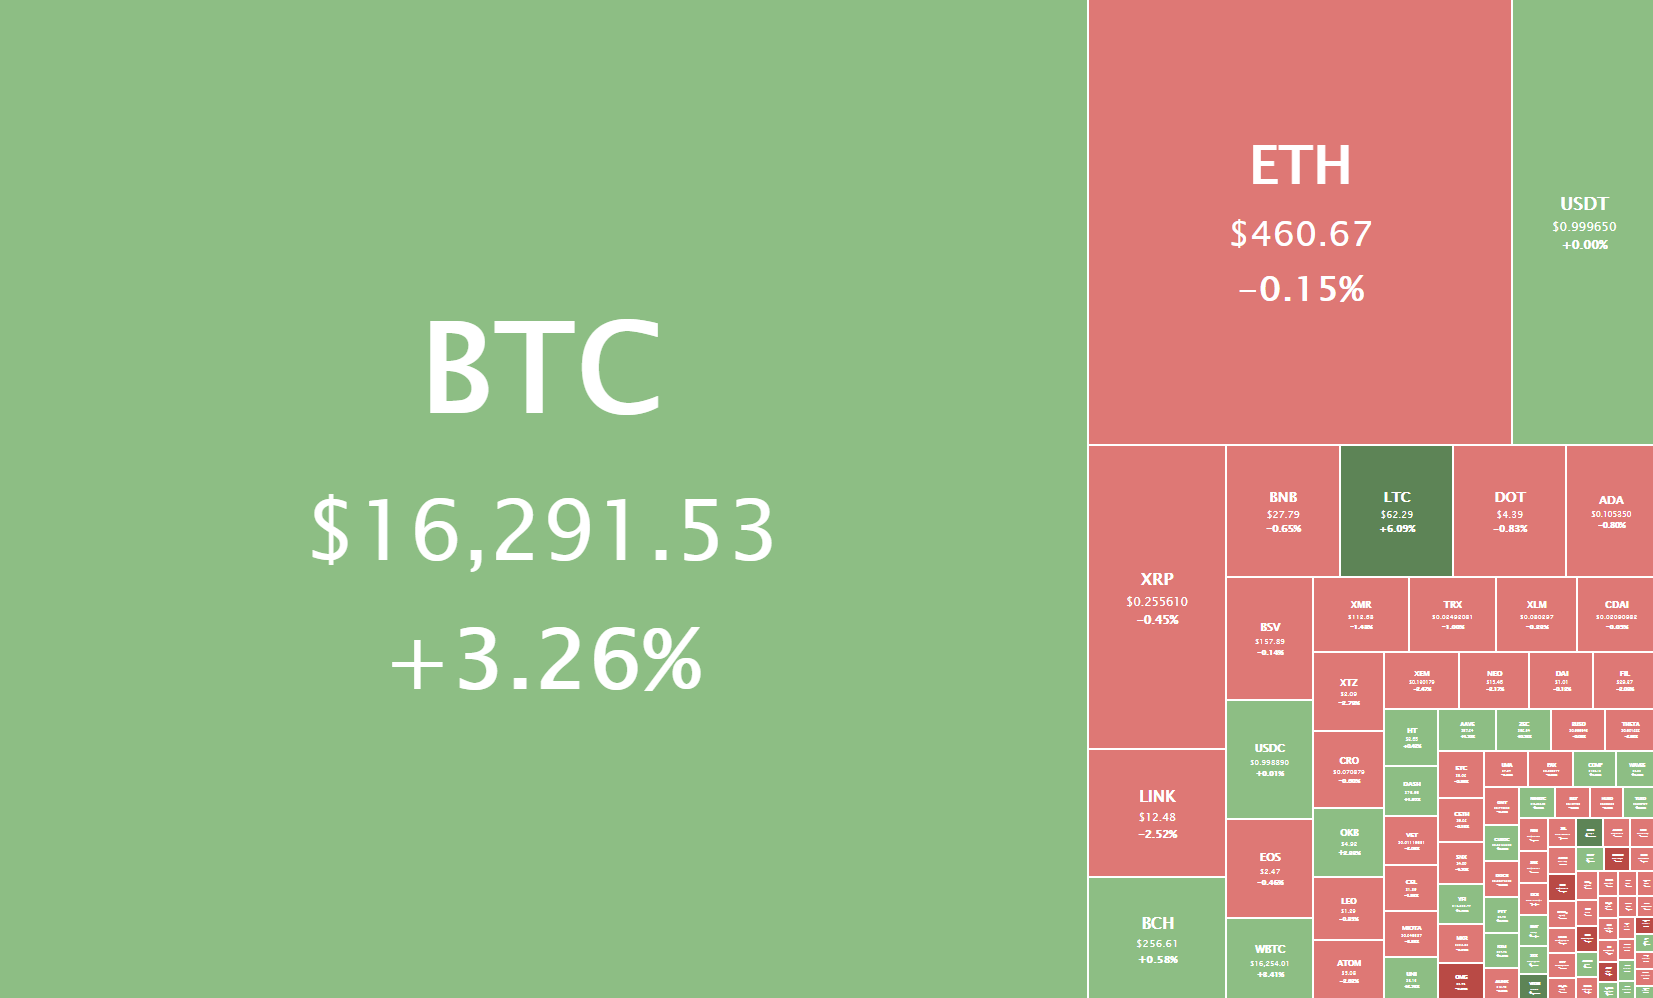
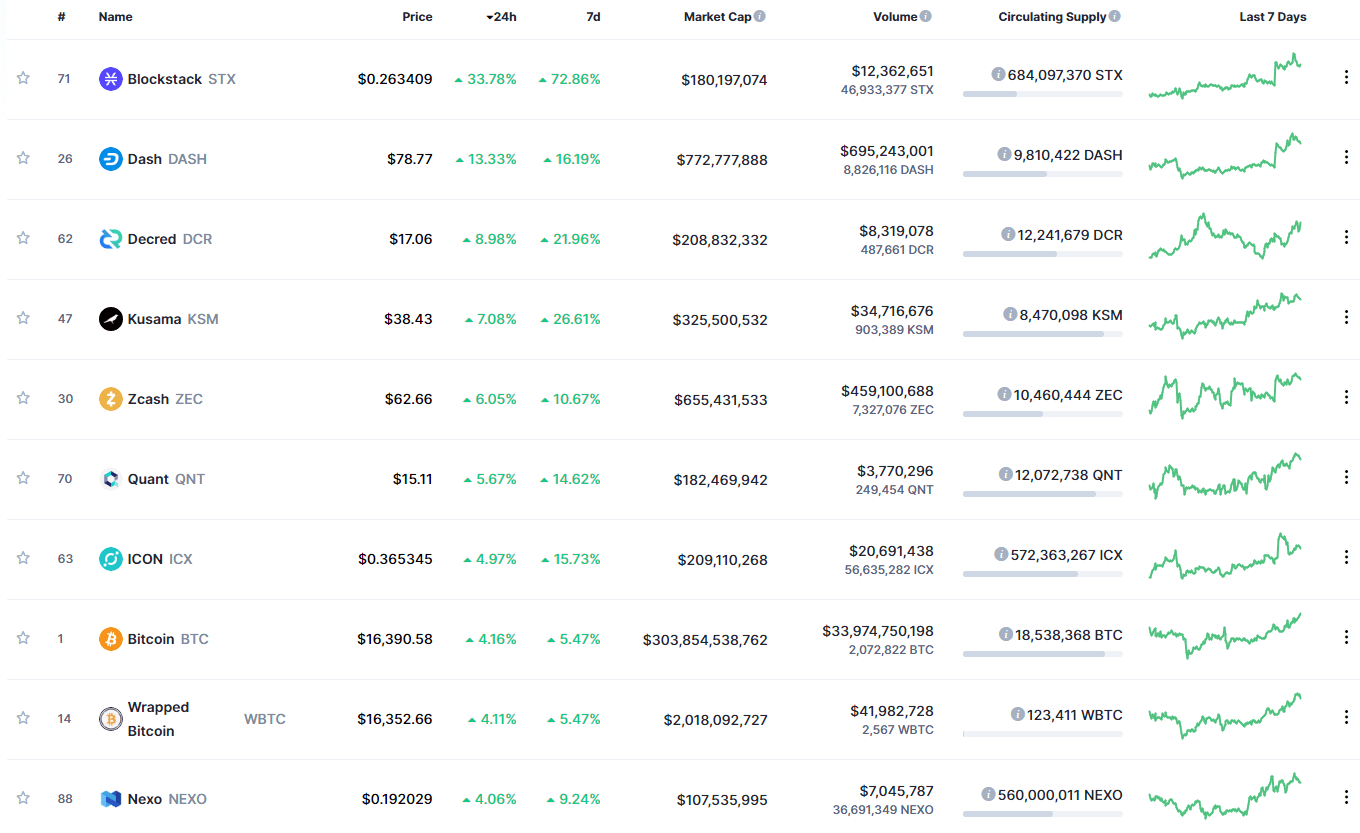
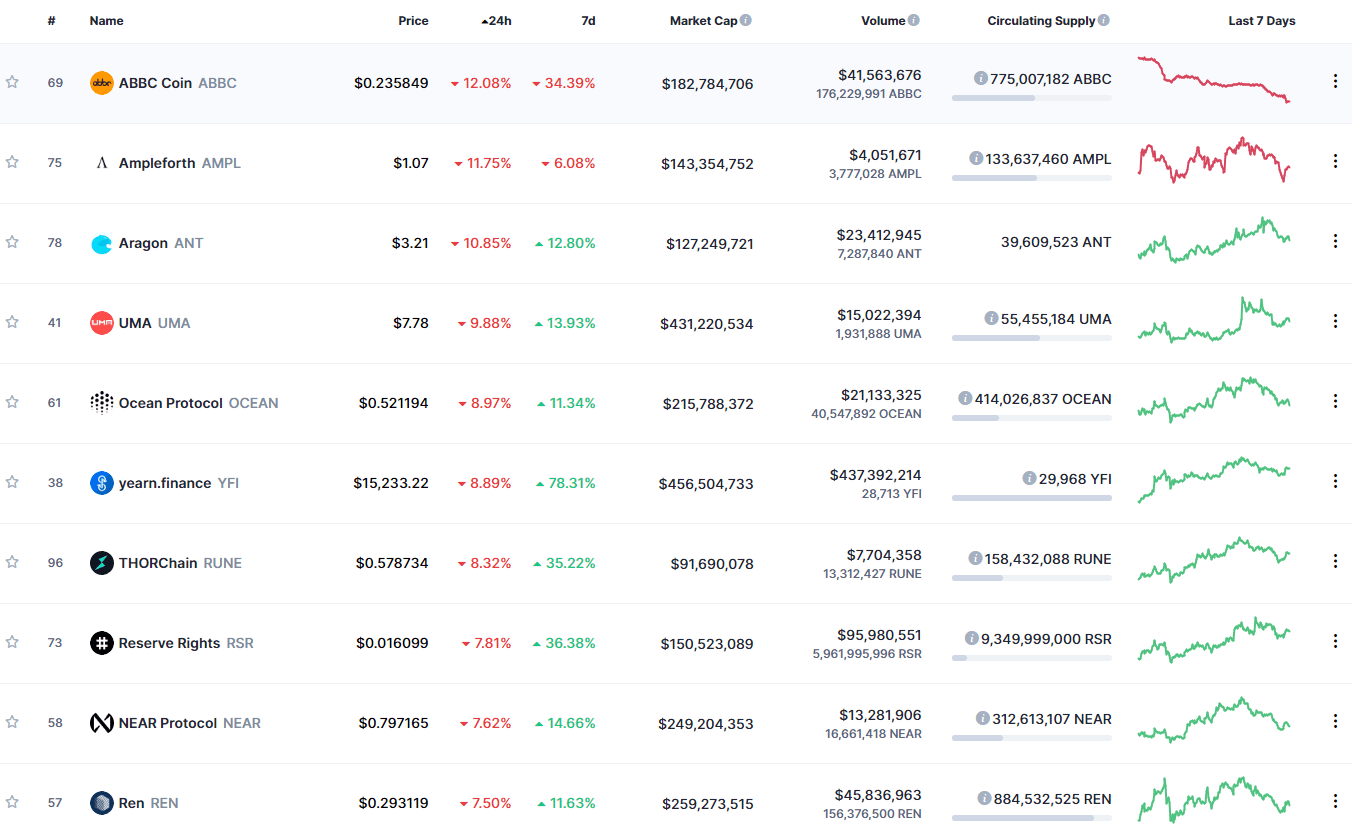
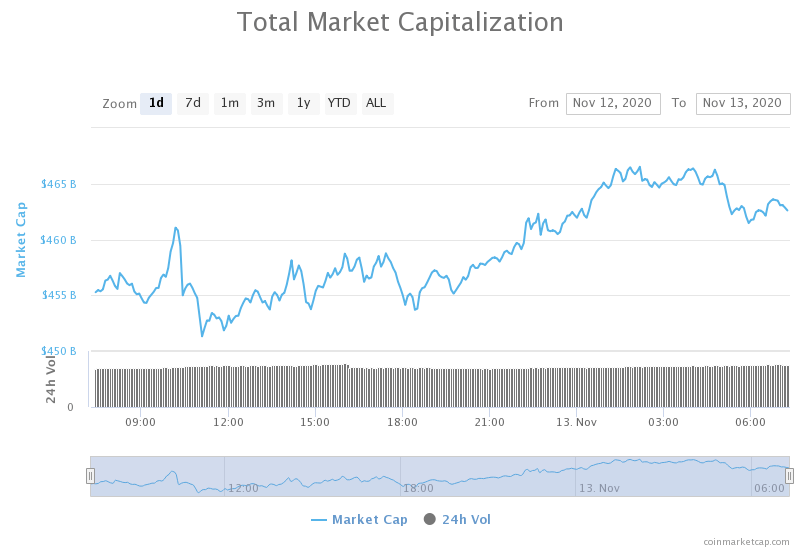
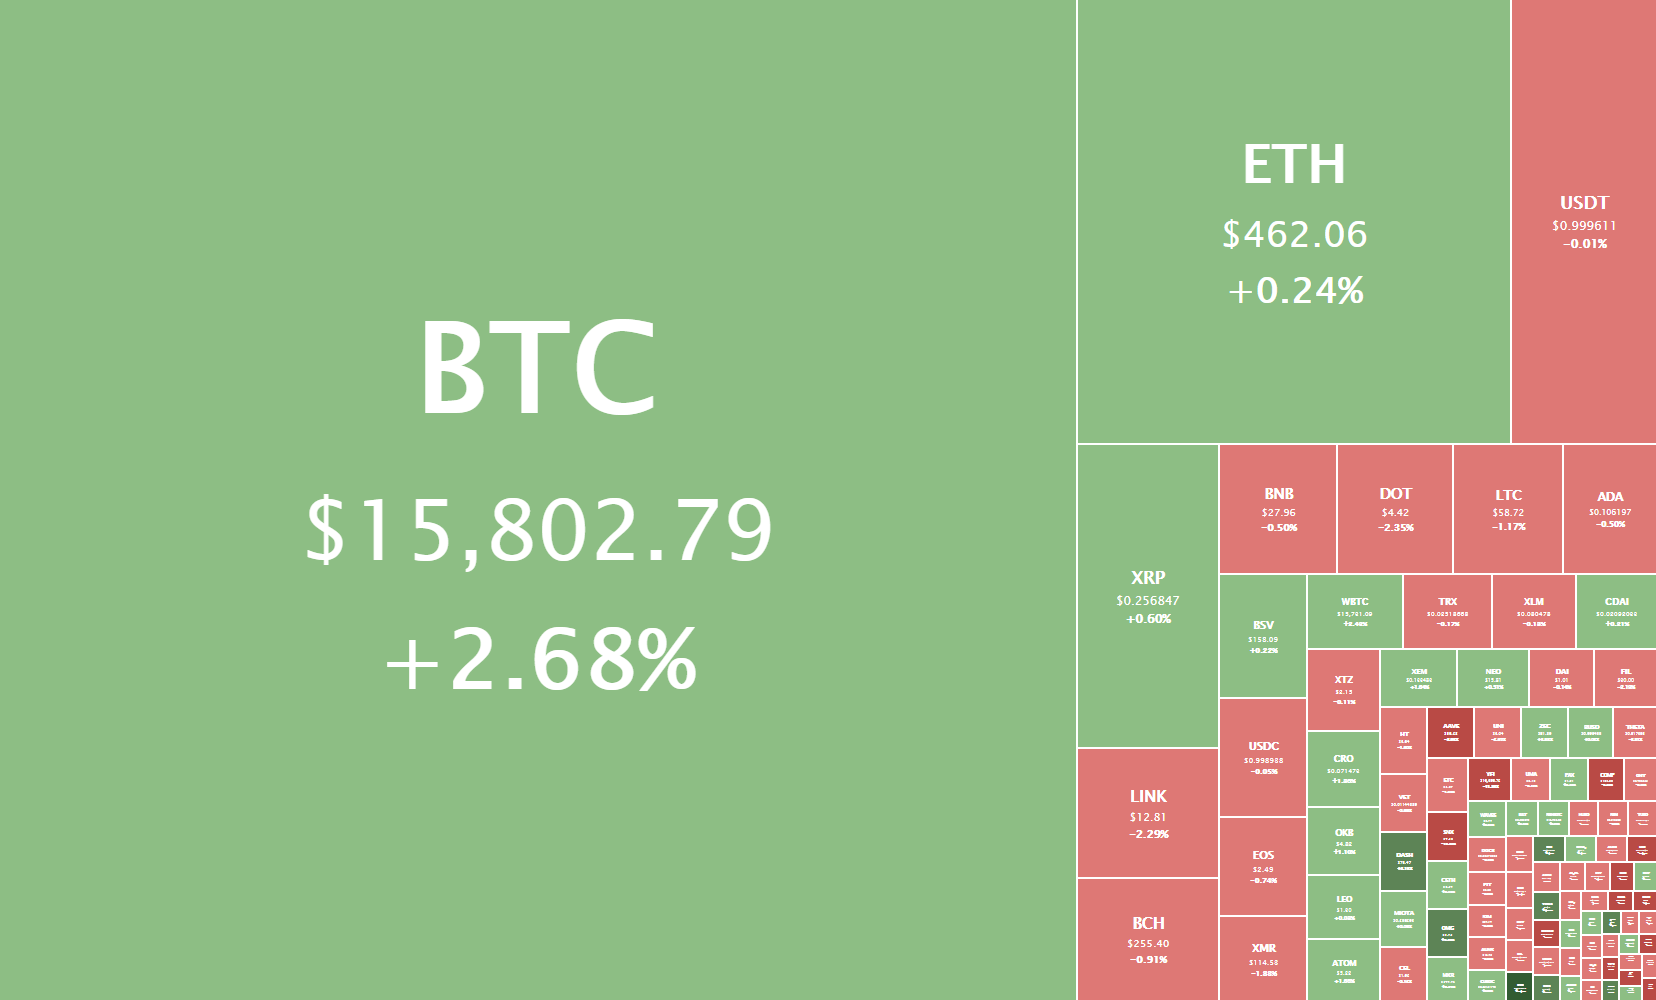
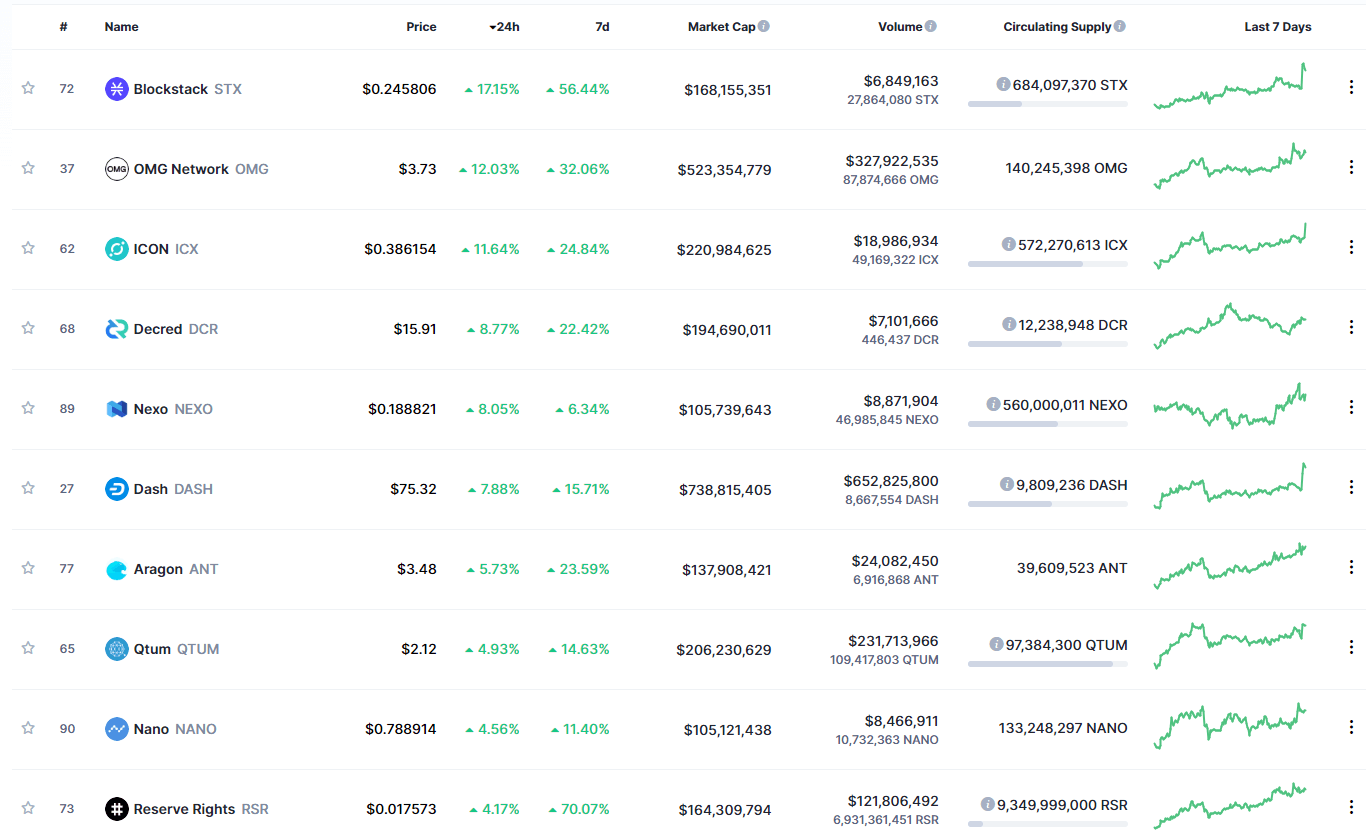
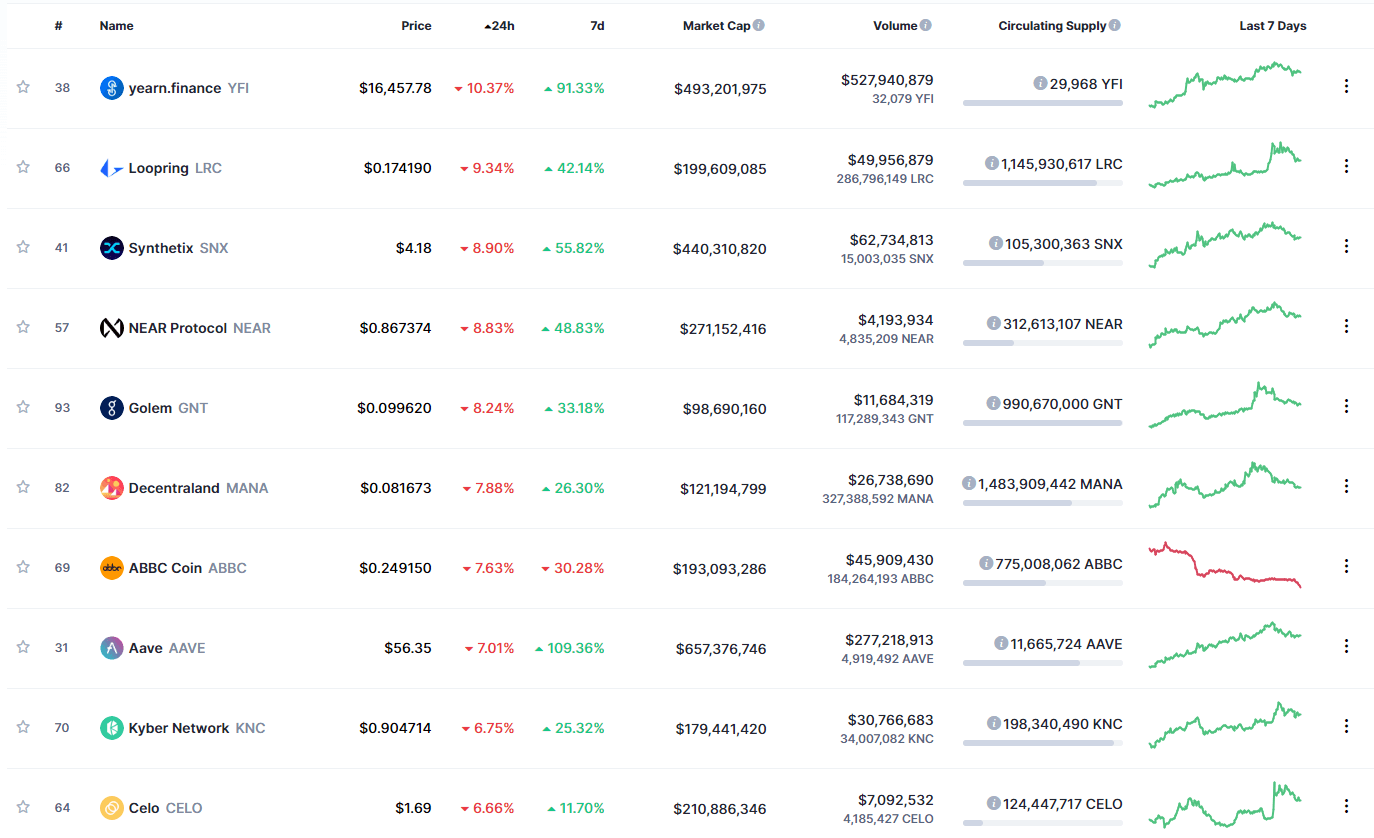
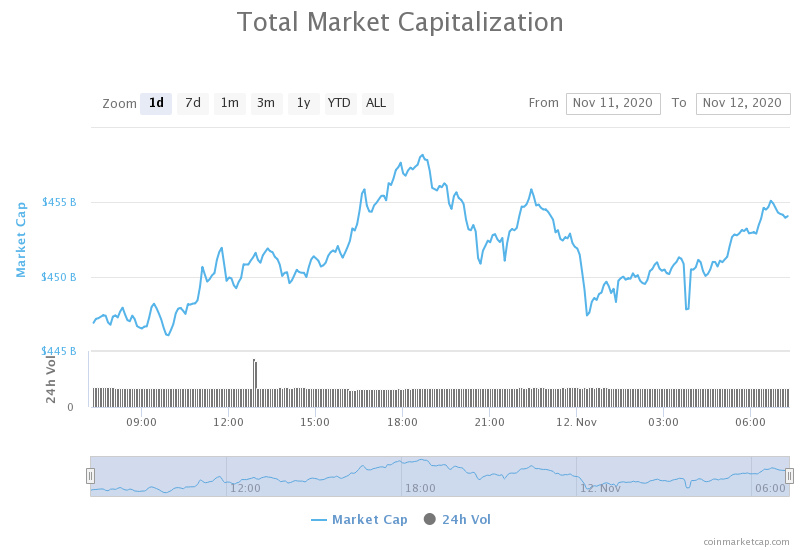
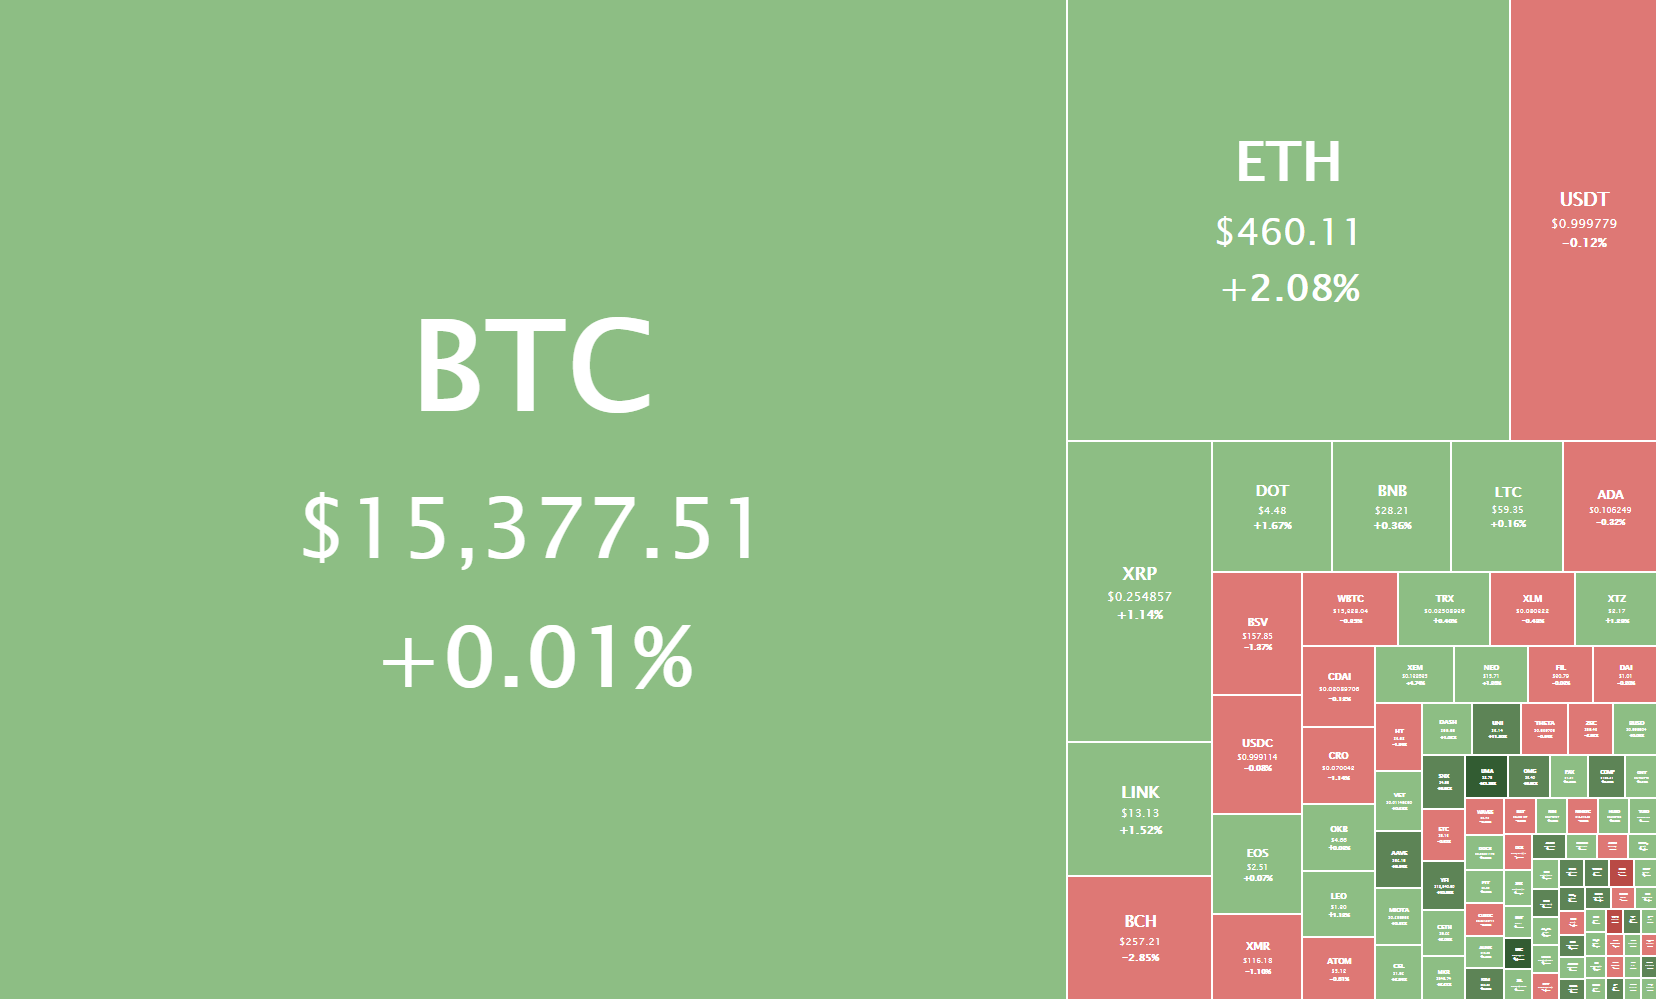
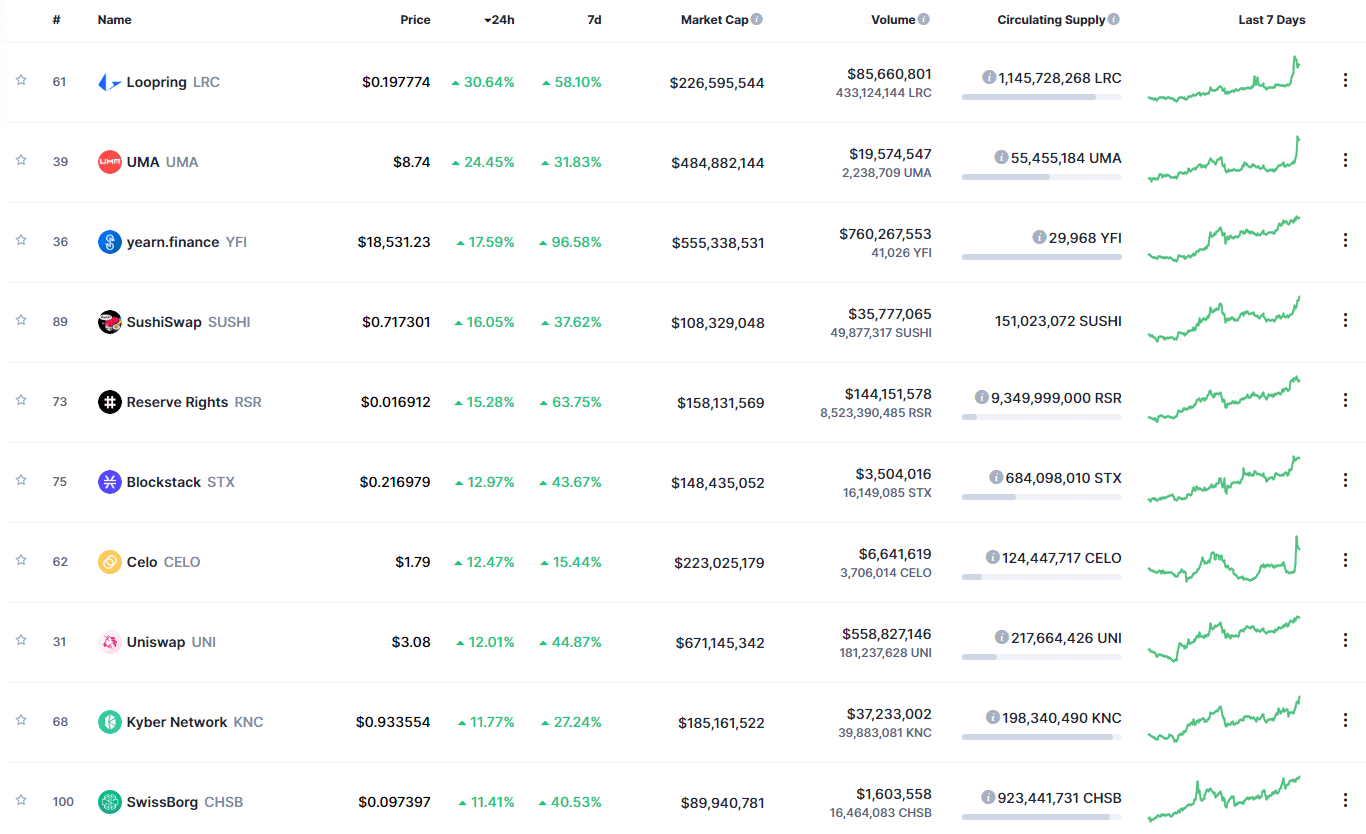
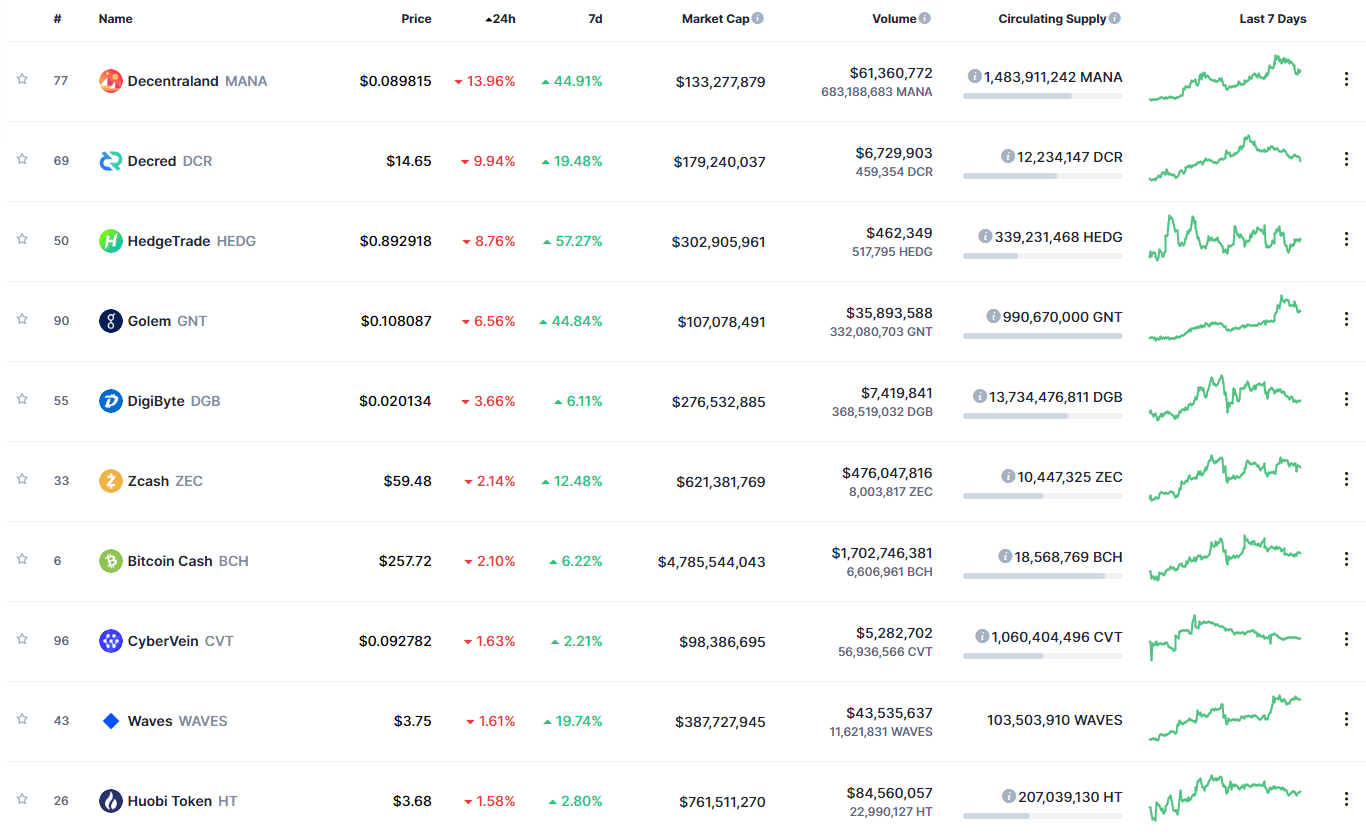
Categories
Crypto Videos

Ethereum 2.0 Launching Today – Upgrades Explained!


Ethereum 2.0 – Explained

Ever since Ethereum was released, the development of new technologies in the form of Decentralized apps on its blockchain, as well as other blockchains, has greatly expanded. Some of the biggest innovations in the Decentralized Finance sector has happened on top of Ethereum as its base.

Unfortunately, scalability issues started to emerge as Ethereum grew as a network. The number of transactions increased, but so did the cost of performing these transactions, which are paid in a currency called Gas.

If Ethereum is supposed to be the main platform to build the next generation of the Internet on top of it, the economics have to make sense, or the network becomes too impractical to use.

Ethereum 2.0 was announced as the solution to the scalability problem. These improvements will attempt to create a contrast to the existing version of Ethereum, and every part of the 2.0 version will be rolled out extremely carefully and slowly.

What Is Ethereum 2.0?

Ethereum 2.0, or “Serenity,” is the long-awaited and often discussed upgrade to the Ethereum network. This update’s main goal is to improve the network’s scalability. It will attempt to achieve various enhancements, where speed, efficiency, and scalability should all be improved without sacrificing any security and decentralization.

While this version of Ethereum was planned out a long time ago, it has taken some years to create and finally roll out. The primary reason for this is that any mistake could impact the network’s security, which would be a huge deal.

The biggest difference between the current Ethereum and Ethereum 2.0 is the consensus algorithm they use. While the current Ethereum uses the Proof of Work algorithm, the new and upgraded Ethereum will use the Proof of Stake consensus mechanism, alongside shard chains and the beacon chain. 

Proof of Stake


While Proof of Work has proven itself over the years as a stable and safe consensus mechanism, its main problem is scalability, since it demands an enormous amount of computing power as the blockchain grows.

As a solution to this problem, Proof of Stake replaces computing power with a different mechanism. In Ethereum’s case, as long as you have a minimum of 32 Ether, you can commit it, become a validator, and then get paid by confirming transactions.

Sharding and Beacon Chain

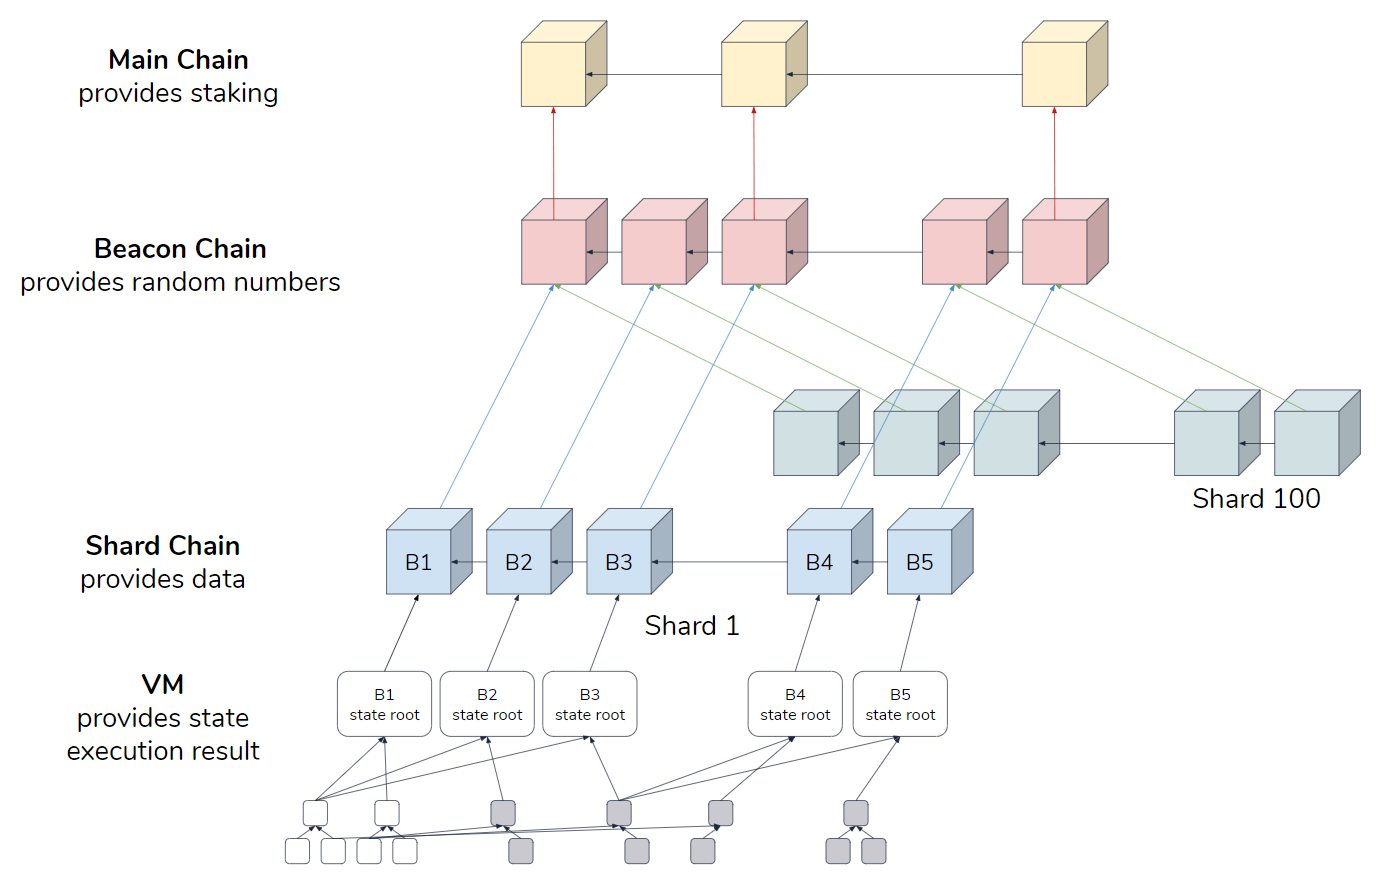
Anyone who wants access to the Ethereum network has to do so through a node. A node is a “client” that stores a copy of the entire network, meaning that the node has to download, compute, store, as well as process every single transaction in Ethereum’s existence. Since this can take up a lot of storage, Shard chains were introduced as a solution. They allow nodes to only contain specific parts, or shards, of one whole blockchain. 

While this does improve the scalability of the network, something has to keep everything stays in-sync. Beacon chains are providing information to shard chains and keep them working as intended.  

Ethereum 2.0 Phases

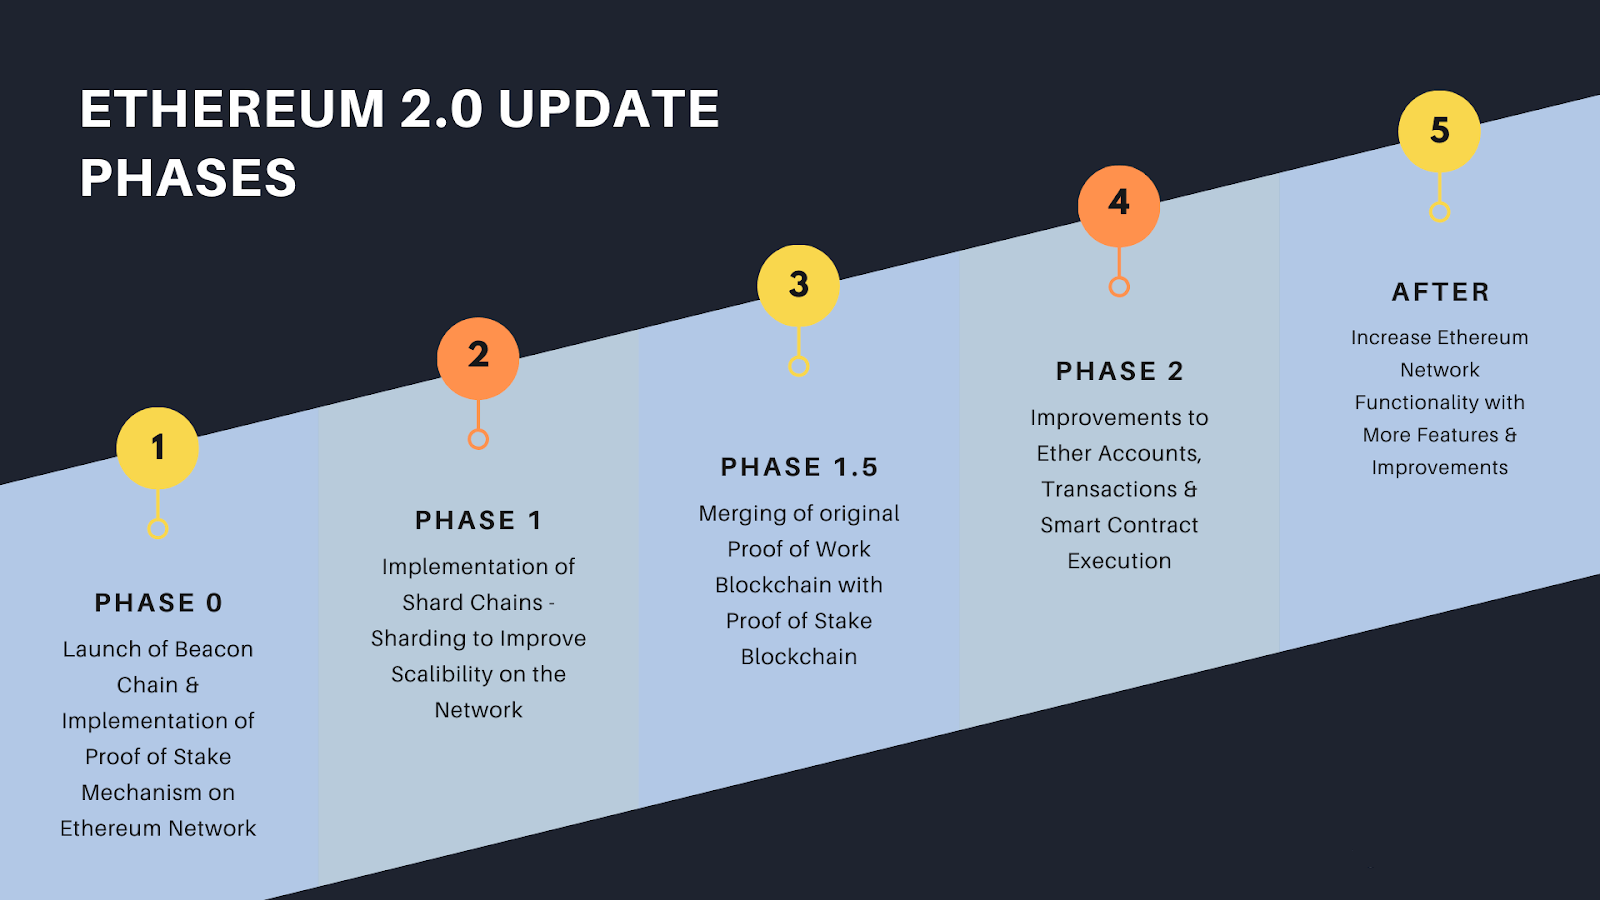
The roll-out of the Ethereum 2.0 update won’t come all at once. Instead, it will be released in three phases, with each phase bringing out a vital part of the update to the public network. 

Ethereum’s 2.0 update will be split into:

  • Phase 0
  • Phase 1 and 1.5
  • Phase 2

Phase 0

This phase will be dedicated to the release of the beacon chain as it’s central to shard chains’ functionality. However, this phase won’t have any shard chains. Instead, the beacon chain will begin accepting validators through a one-way deposit contract.

If you are thinking about staking Ethereum, it’s important to note that registered validators who stake their Ether won’t be able to “unstake” it until shard chains are fully implemented.

This Phase begins on Dec 1, 2020. 

Phase 1/1.5

The next phase is expected to be released somewhere during 2021 and will actually be a mix of two phases. Phase 1 will introduce shard chains, while Phase 1.5 is when Ethereum’s main net will officially begin transitioning away from Proof of Work and onto Proof of Stake.

Phase 2

The final phase of the 2.0 update will roll out in 2021 or later and will allow Ethereum to support fully formed shards. This is when Ethereum 2.0 will actually become the official Ethereum network. 

Final Word

Ethereum 2.0 is certainly an important upgrade to the Ethereum network and will hopefully bring much-needed scalability, among other things. Without the new features that this update brings, Ethereum could eventually become unsustainable, which would be detrimental to the innovation that its platform brings.


Categories
Crypto Daily Topic Cryptocurrencies

Top 5 Trends Driving the Crypto Market Right Now

2020 was an interesting year for crypto. From the market crash in March to Bitcoin rebounding past $15k for the first time in two years, to DeFi exploding than ever before, this was not your average year for the industry. But beneath these events were unseen undercurrents that were driving everything. 

As you already know, the crypto market moves to its own beat. It all comes down to supply and demand – the causes notwithstanding. This is starkly different from traditional currency, whose value is set and controlled by central banks. Other factors are artificial actions such as the stimulus protocols being conducted across the globe right now to ameliorate the economic shock of the Covid pandemic. 

What’s the point? That the crypto market is interesting, and the events driving it one side or another are worth a closer look. A lot is happening behind the scenes: from a change in attitudes to stablecoins to new and bold crypto products. 

This article looks at the trends that are currently driving the crypto market and how. 

#1. Stablecoins

Stablecoins are a special kind of cryptocurrencies pegged to real-life assets, so they’re not subject to the wild volatility experienced by ‘normal’ cryptocurrencies. Stablecoins can be pegged to fiat, other cryptocurrencies, or exchange-traded commodities like aluminum or gold. The fact that they are attached to a fixed unit doesn’t mean that their prices never vary. Their market prices tend to fluctuate around their underlying assets. 

Stablecoins have the ability to bridge the gap between fiat and digital currencies. They provide the stability of fiat while maintaining the security of crypto. This year, stablecoins kicked off exceptionally well, recording a $90 billion transactional volume in a single financial quarter. 

As an investor, you can make money off stablecoins.  For instance, you can acquire a stablecoin for $1 and sell it on the market at a higher value of, let’s say, $1.0003. The extra amount might seem meager, but the amount of profit accrued becomes very substantial when you multiply this figure by thousands or millions. 

#2.DeFi

DeFi (decentralized finance) is, without question, one of the megatrends pushing the crypto space right now. DeFi is the idea that people can have complete financial autonomy. You know, without an interfering government or controlling bank. It’s a revolutionary idea that’s not just timely but liberating. Countless projects are now rushing to introduce new and interesting DeFi products. Things like yield farming, the latest DeFi craze, entered the crypto lexicon less than two years ago. 

The vast majority of DeFi projects are based on Ethereum. Ethereum pioneered smart contracts and decentralized applications (DApps) – which explains everything. The network’s market cap increased by 60% in Q3 2020. This growth percentage was seen by increasing market value from $25 billion to $40.5 billion by the end of September. The top 10 DeFi coins’ market capitalization by total value experienced a greater increase within the quarter. This was seen through the 345% increase (rise from $1.2 billion to $5.3 billion). The market capitalization of DeFi now accounts for roughly 12% of the blockchain’s total market value. As of now, DeFi is the driving narrative for the Ethereum ecosystem.

DeFi protocols such as Compound, Balancer, Curve, and other varied platforms are introducing new and exciting DeFi products. From staking to yield farming to borrowing, investors are rushing to DeFi to carve out financial value. 

#3. The Possibility Of A Cashless Society

One of the biggest upheavals to the world’s normal order in recent times was the Covid pandemic. In the blink of an eye, the pandemic had interrupted everything we hold dear – social life, economies, and yes – deeply held attitudes. Naturally, people began to rethink a lot of things. 

What previously seemed odd was now the norm. Working remotely? Check. Crypto payments? Check. Now, being forced to do things differently can sometimes be a good thing, which is the case with these scenarios. And it seems like these practices will remain even after Covid is long gone. It wouldn’t be an exaggeration to say that a cashless society is a possibility in the future. 

Meanwhile, the blockchain space is expanding quickly, as applications for interacting with crypto also advance. These days, you can easily buy crypto with just a credit card. This is a huge leap from the early days when you had to meet with a stranger to purchase crypto (and we all know that’s a risky proposition). Also, it’s not just the young and savvy population that’s embracing crypto. It’s institutional investors too. 

#4. Derivatives

Derivatives are another trend driving the crypto market. Bitcoin derivatives dominate the market at the moment, but Ethereum is catching up. This is a strong showing of Ethereum, and it hints at a derivatives economy buoyed by Ether and possibly other crypto’s derivatives. It also means both individuals and institutional investors are beginning to see Ethereum as a worthwhile investment and trading asset. Another thing – it shows that the crypto market is maturing. When other cryptocurrencies join Bitcoin in the derivatives club, it will be a diverse and more resilient market. 

#5. Cryptocurrency is becoming big

Crypto is probably enjoying its highest review ratings in years. Bitcoin, the pioneer of them all and the most successful one, is not viewed as a bubble anymore. And its market cap has exploded to eclipse that of superstar companies such as Coca-Cola and Intel. Also, crypto’s underlying tech – blockchain, is now being embraced by a multitude of industries. Like we’d mentioned earlier, institutional companies are getting involved in crypto more than ever before. 

Closing Thoughts

When we study the undercurrents of the crypto market more closely, it’s easier to tell which direction it’s veering to. And the current trends indicate nothing but good things for the future of crypto. Stablecoins are roaring, as is DeFi, and indications point to Bitcoin sharing the derivatives spotlight with other cryptos in the near future. In short: these are the trends driving the crypto market right now. 

Categories
Crypto Daily Topic Cryptocurrencies

Learn How To Understand Crypto Market Data and Become a Pro

Newcomers in cryptoverse can be easily baffled by the myriad of things to learn and understand. ‘Ethereum has hit the highest 3-week close since the last bull run,’ and other such phrases are common in this industry. Then, there are charts that track the movement of different performance indicators in real-time. To add to the confusion, experts often differ on investment advice and the impact of various events in the industry. 

This article will help to simplify some of the common crypto market issues you will need to understand. It’s by no means a comprehensive guide for trading crypto, but it will give you that head-start you need to get going. 

Crypto Buzzwords

Buzzwords are a common feature of the crypto market and a common source of confusion at that. Normally, a well-written crypto article will not be without a dozen buzzwords. Some writers use crypto jargon purely for flair. But we will agree that these catchphrases have a way of hammering in opinions that would otherwise fly under the radar. 

To understand crypto market data, it is important to familiarize yourself with the industry glossary. There are a couple of basic phrases like bull and bear markets, trading sideways, support and resistance, candles, etc., that you may need to learn. You can always refer to your glossary when analyzing market data, but don’t you think the market data is already complex enough? You can make things easier by learning some market terminology beforehand on web resources such as Coinmarketcap‘s glossary page.

Market Indicators 

What is a crypto market without indicators? Due to the volume of activity on such markets, it’s impossible to track them on individual trades. Therefore, pros use indicators as quick reference guides for reading what the markets are trying to say. There could be a bunch of indicators used in crypto markets, but these are the most useful ones:

  • Price – It shows how much a crypto asset is trading against the dollar or another base currency. By itself, price doesn’t matter. What’s more important is price movement – that is, the change in price over a certain period (typically 24 hours). These changes are usually marked by opening and closing prices.
  • Market capitalization – It shows the total value of assets in a given market. Most investors believe a high market cap is a characteristic of a low-risk-low-return portfolio. 
  • Volume – It shows how active investors are buying and selling assets. High volumes are usually indicative of a ‘hot’ crypto.

Understanding Charts

Charts are an essential part of representing market data. Whether you’re looking at crypto or forex markets, these graphical data representation tools are inevitable. While newcomers may look at charts as beautiful pictures, market pros track these graphics continuously to know how different assets perform against certain indicators. 

Charts are pretty easy to understand. Basically, they show a certain aspect of a crypto is changing over time. There are several important charts that you need to be aware of:

  • Price charts – Price charts are the most common charts you will see when reviewing crypto market data. They provide you with real-time information regarding the price movement of a given crypto. Most price charts are simple X-Y graphs with day/month/year on one side and prices on the other. You can find easy-to-interpret price charts, among other sites, on Yahoo Finance or Tradingview. As a bonus, most charts are interactive – that is, they allow you to adjust the period for which you wish to view, zoom in to a specific day, and so on. It is highly unlikely that you will experience difficulty in interpreting price charts.
  • Fear and greed index – The fear and greed index seeks to represent the general level of fear or greed among investors. Investors like to give off the vibe that they’re purely analytical human beings, but the truth is they’re pretty emotional. And that’s why when fear spreads in the industry, investors pull out of the market. If we were to express fear and greed mathematically, these two emotions would be inversely proportional to each other – as fear rises, investor greed declines, and vice versa. You can find a good fear and greed index chart on CNN Money, where the index was invented. Well, this is the original index, which was customized for capital markets investors. If you want one specific to crypto markets, you could check out the chart on Btctools.com. 
  • Market cap charts – Market capitalization tells you how much worth is a given market, in total. Simply put, multiply the price of a unit of an asset by the total number of assets outstanding, and you get the market cap. You need to understand market cap charts because they give you an idea of how stable that market is. Generally, traders assume that markets with a high market cap (such as Bitcoin) are less conservative and thus less risky in the long run. 
  • Volume charts – A volume chart shows the level of trading activity in a given market. High volumes indicate positive investor sentiment. And just like economic inflation, rising market volumes suggest that things are looking up for that crypto. 
  • Combined charts – These charts put all the indicators (price, volume, market cap) on the same diagram. Each indicator is then marked by a differently-colored line and a key provided. 

Where to Get Reliable Market Data

Getting reliable market data is key to understanding crypto markets and making the right investment decisions. When looking for information, go for reputable sources such as Investopedia, Coinmarketcap, Coindesk, and others. Some data sources may be outdated or just plain incorrect. You know how non-factual data can be misleading. So, when analyzing crypto market data, choose reliable sources. 

Influencer Opinions

Listening to industry influencers is also a great way to understand crypto markets. The opinions of such people have the power of swaying investor sentiment. For instance, if Richard Branson says that he thinks Bitcoin is a ‘get-rich-quick scheme,’ some investors may back off a little. 

Now, you listen to influencers to get pointers on what to look out for. Most of the time, influencers tend to raise controversy, perhaps, just for the sake of it. So, don’t take their word for it – always research wider. 

Final Thoughts

Understanding crypto markets isn’t that hard after all. If you learn a few buzzwords, understand market indicators, know how to read different charts and where to get reliable market information, you could very well soon sound like a pro investor. This was just a basic guide to understanding crypto markets. Always read wide and keep informed. Good luck.

Categories
Crypto Market Analysis

Daily Crypto Review, Dec 1 – Bitcoin’s New Monthly All-Time High; Ethereum 2.0 Phase 0 Launches Today

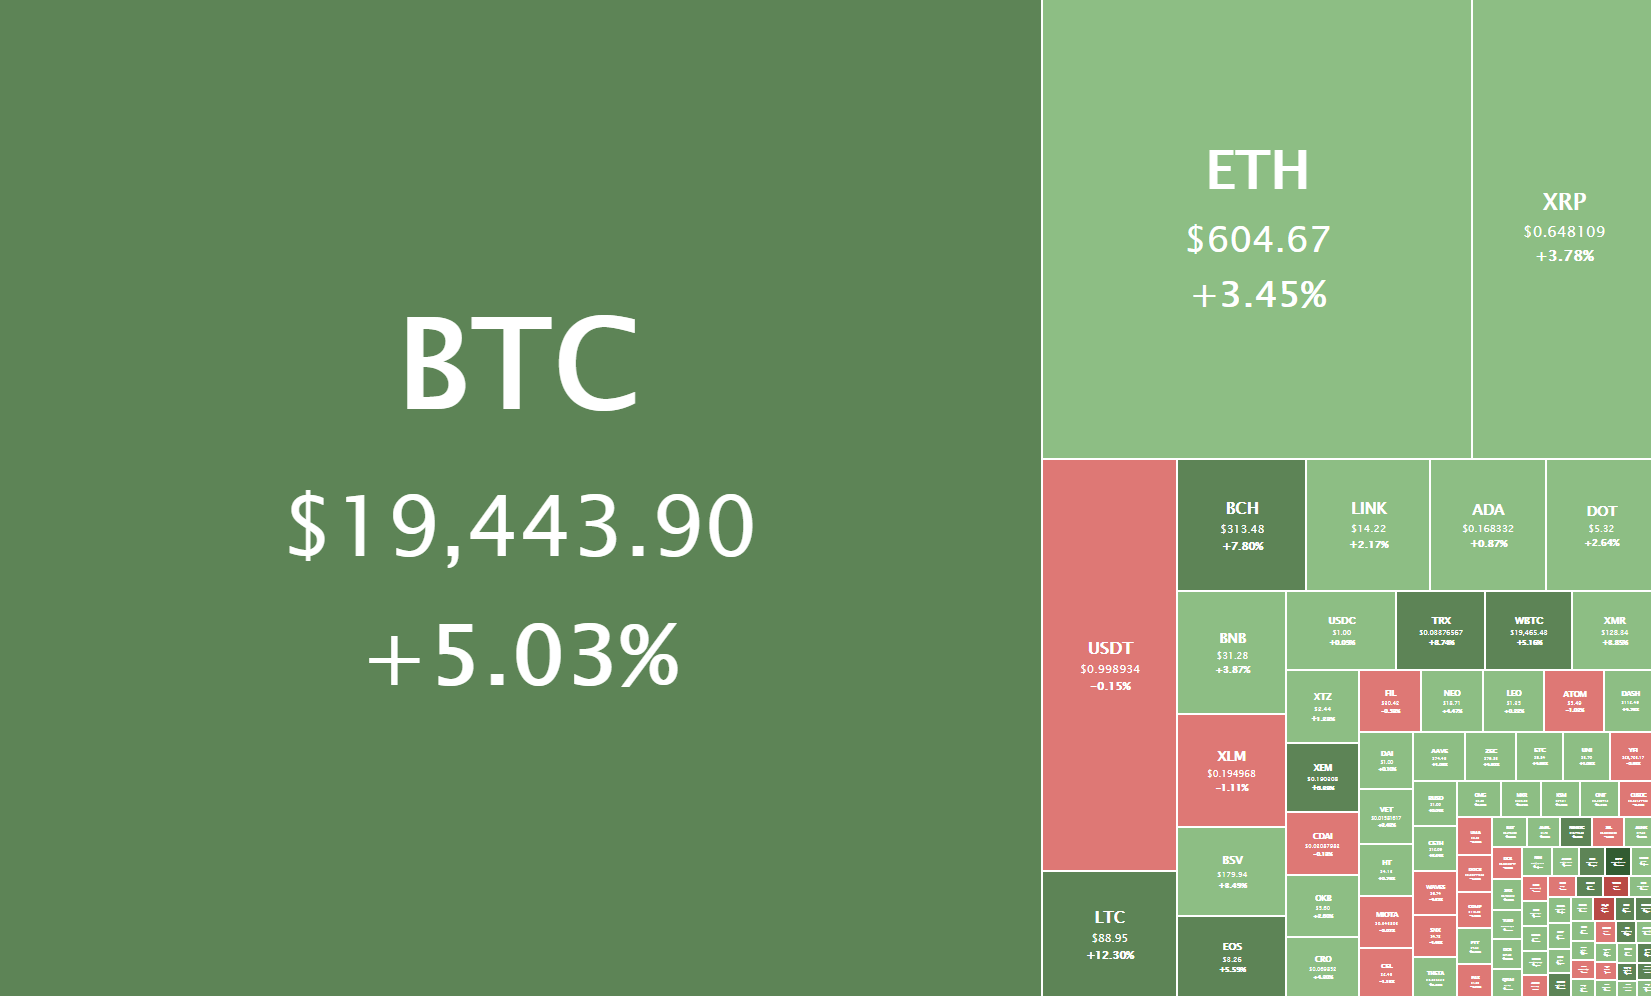
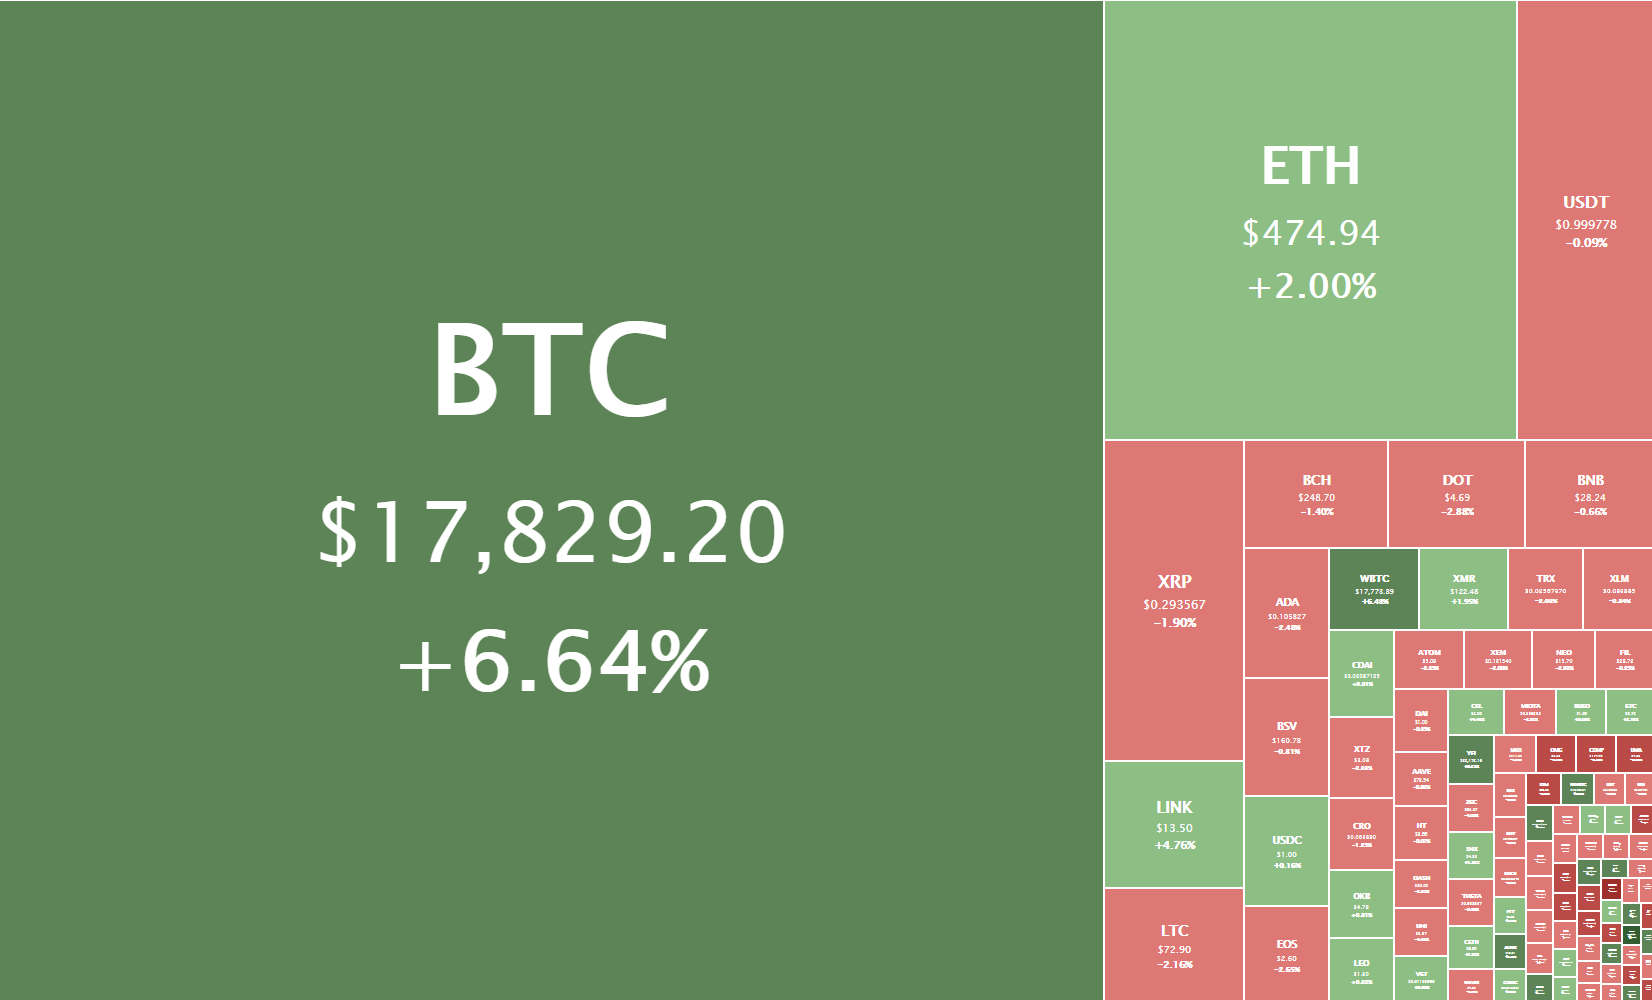
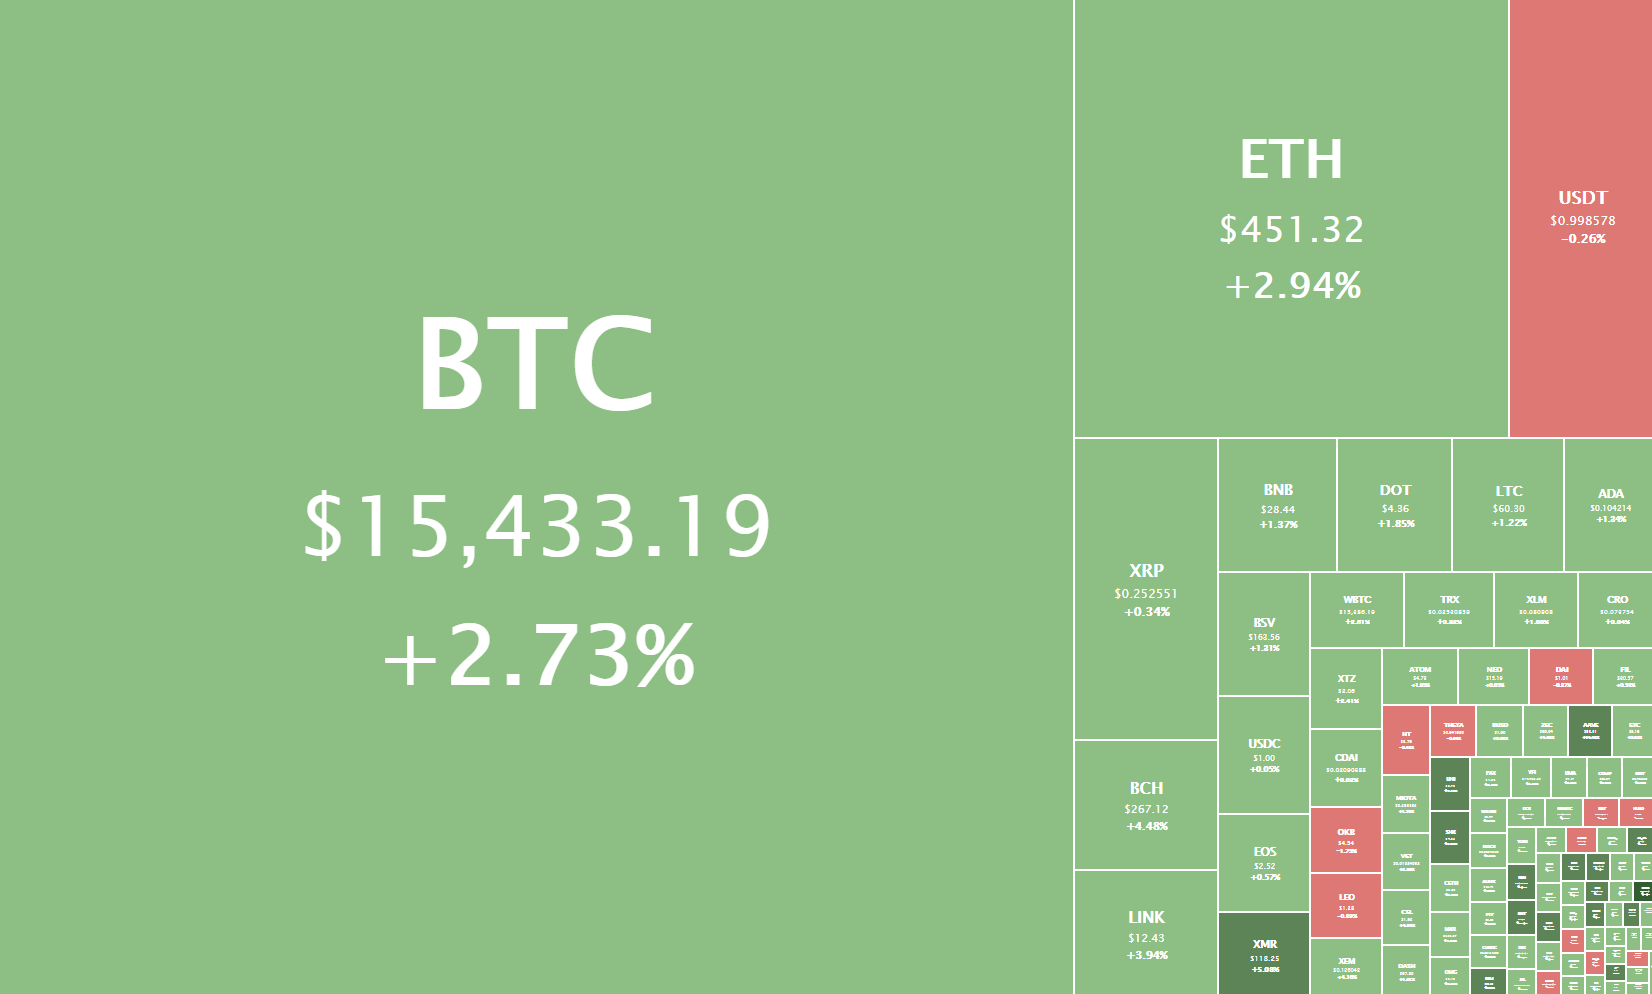
The cryptocurrency sector has pushed further up as Bitcoin made a new all-time high for a moment. The largest cryptocurrency by market cap is currently trading for $19,443, representing an increase of 5.03% on the day. Meanwhile, Ethereum gained 3.45% on the day, while XRP managed to gain 3.78%.

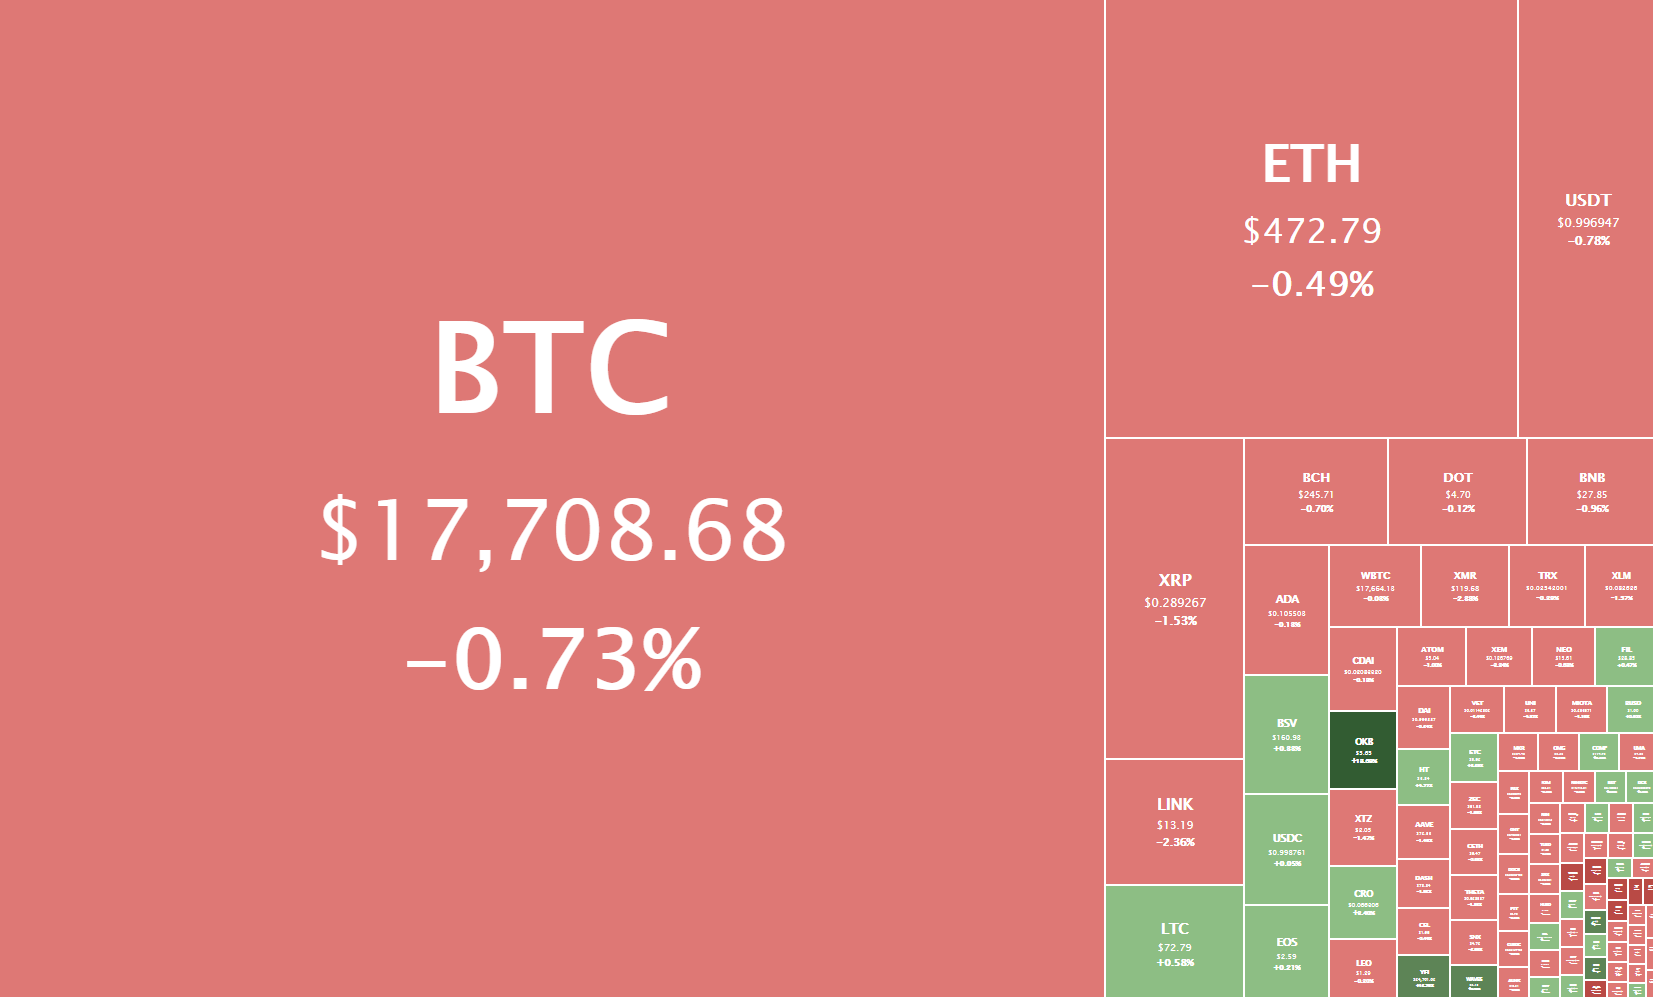
 Daily Crypto Sector Heat Map

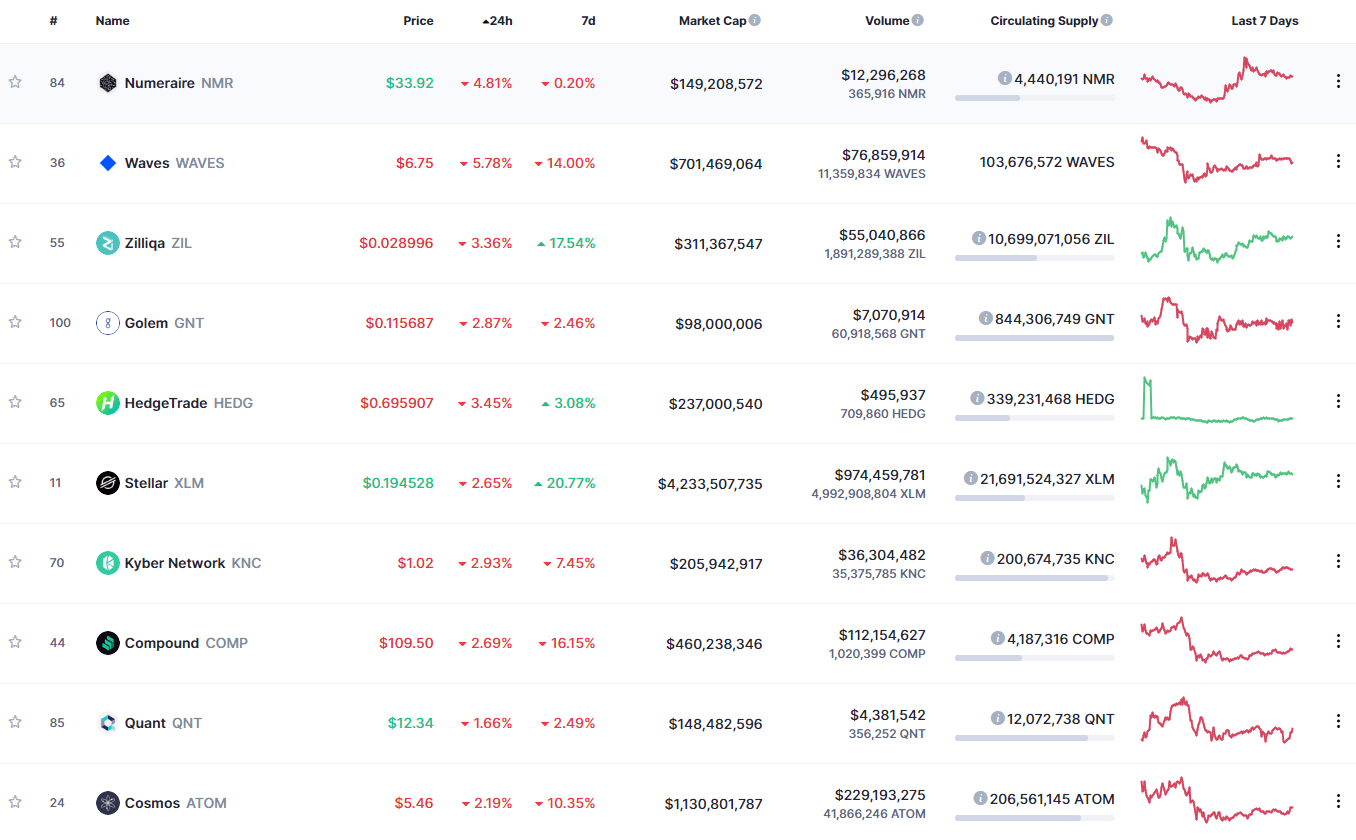
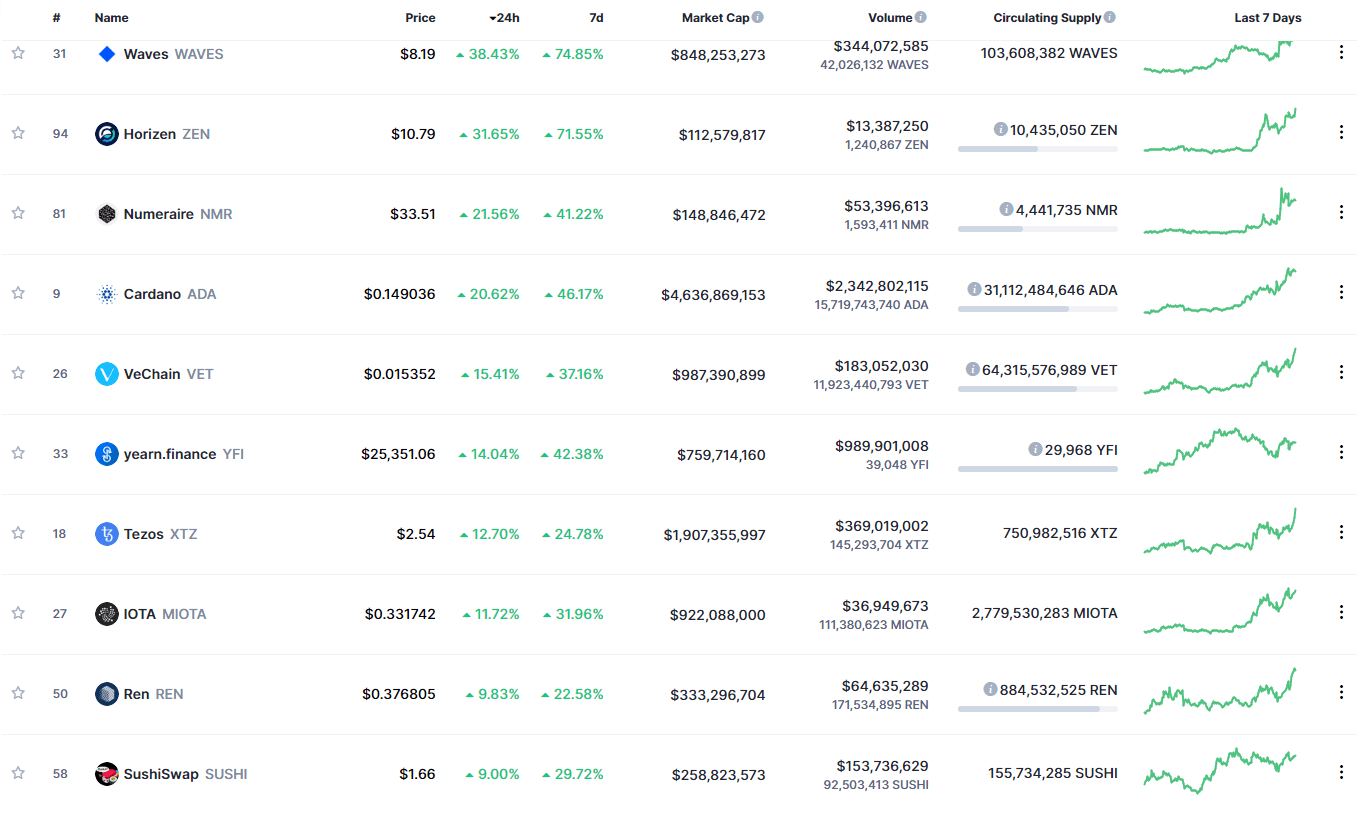
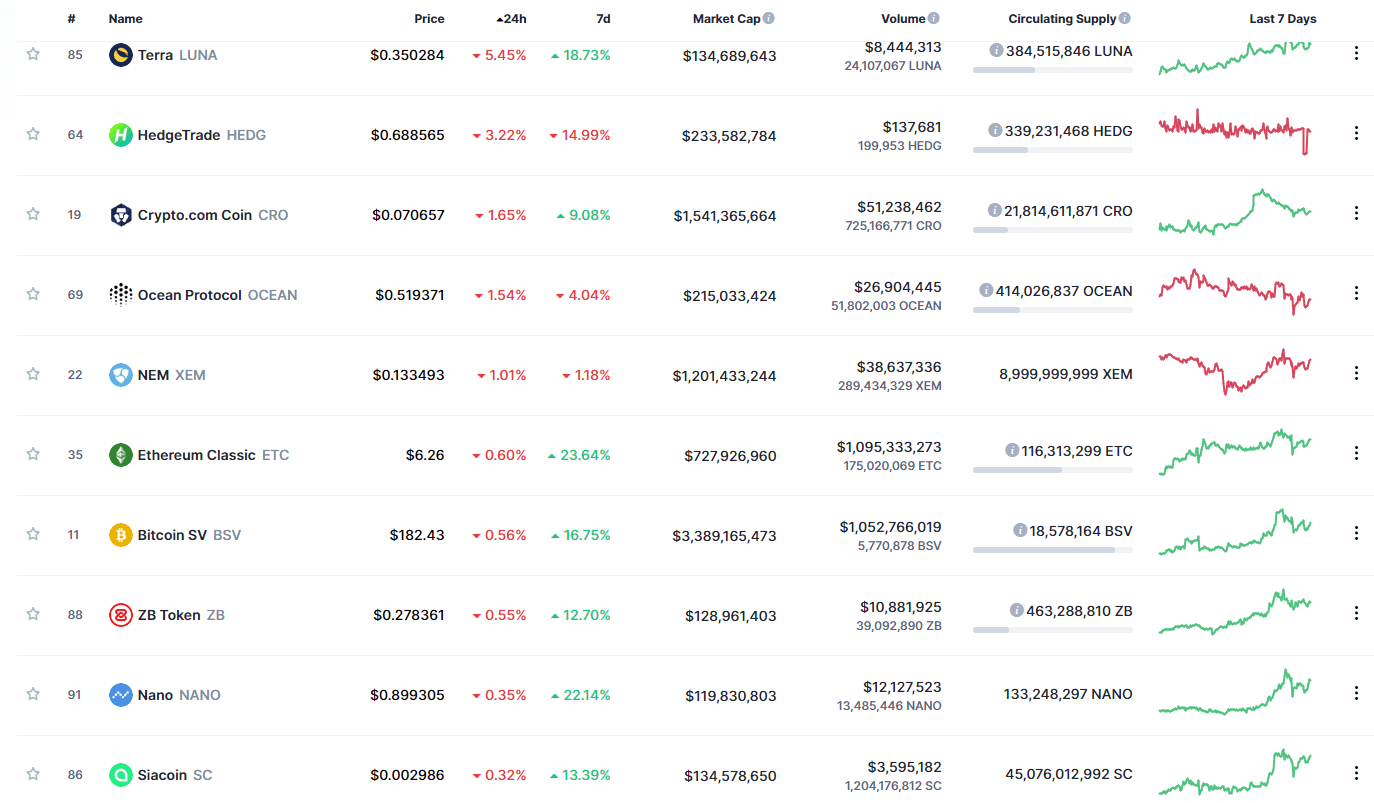
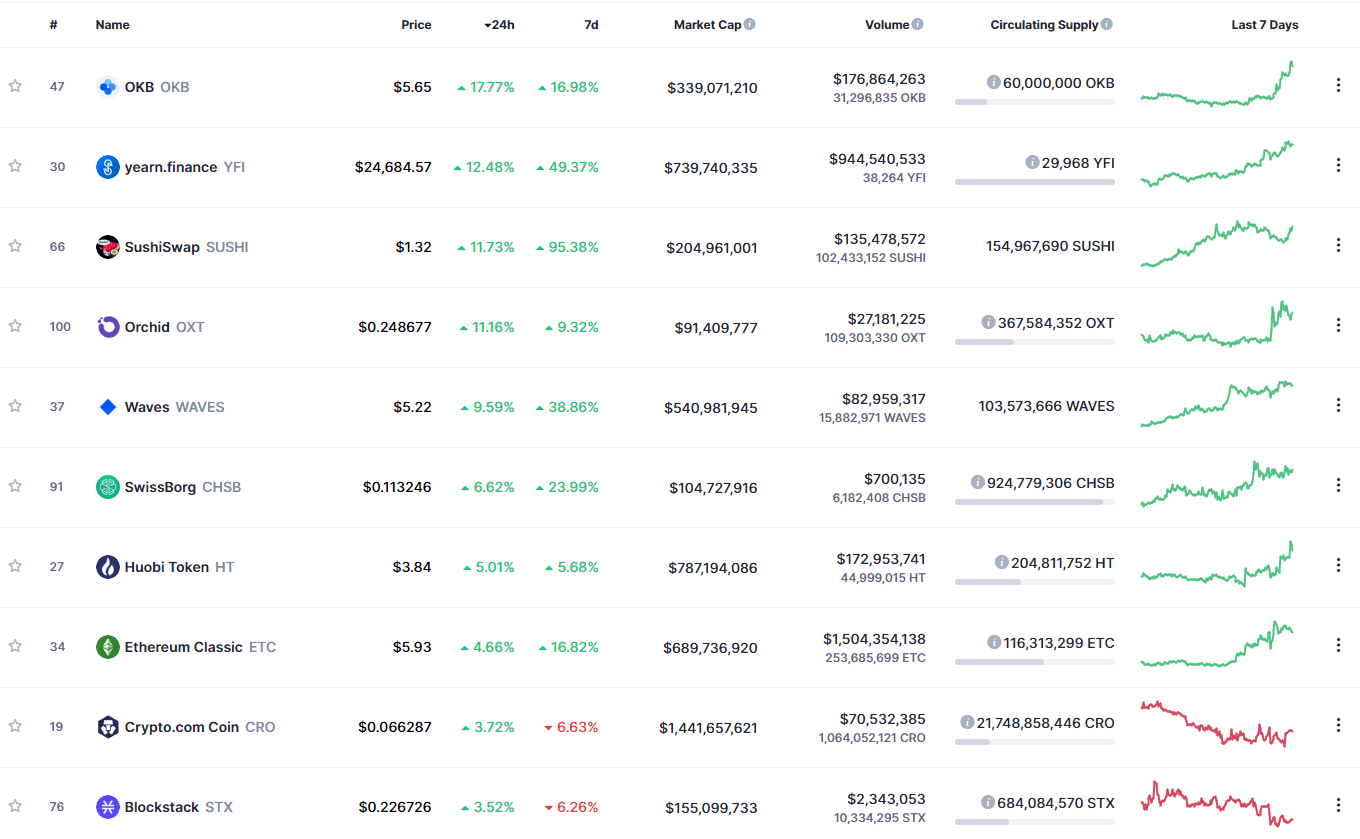
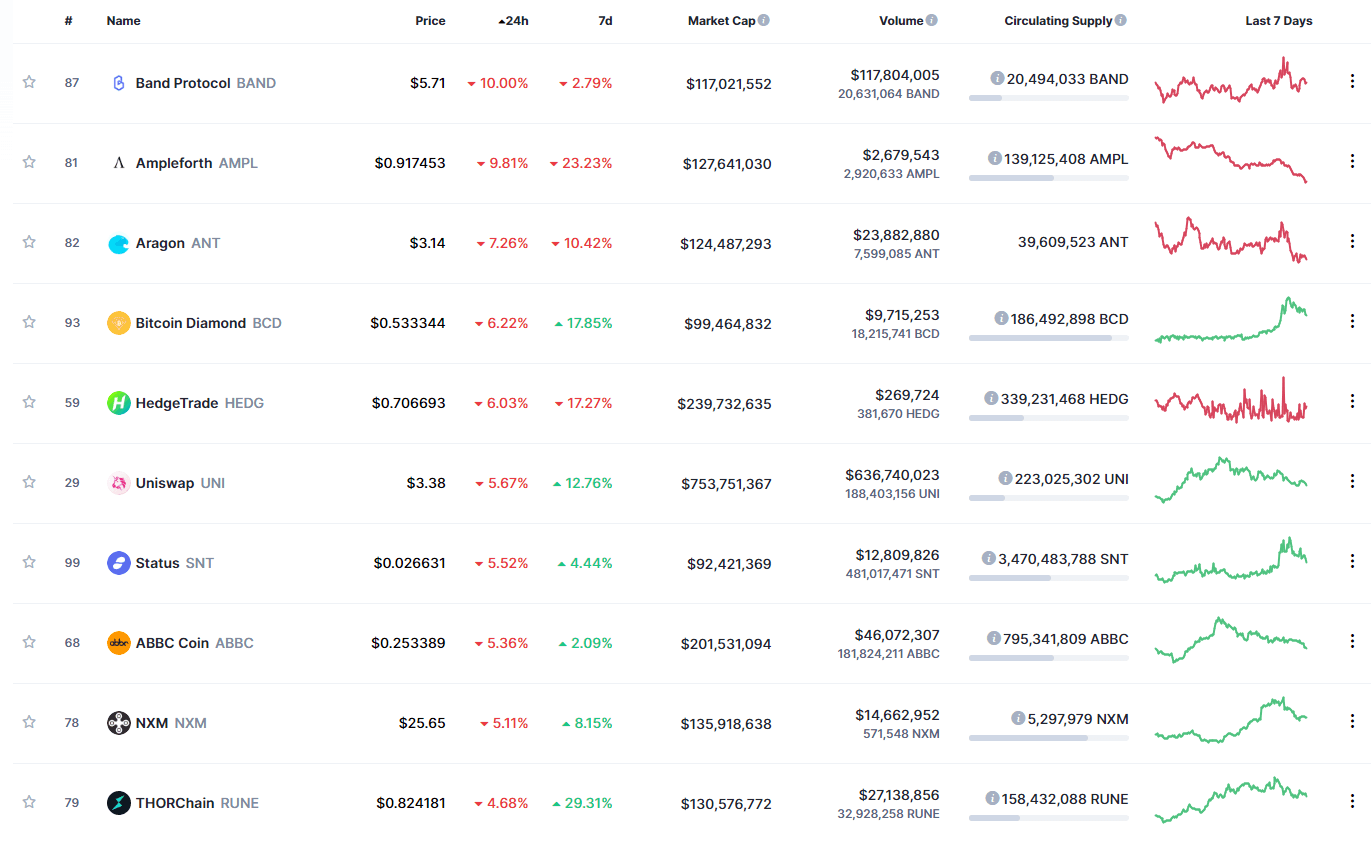
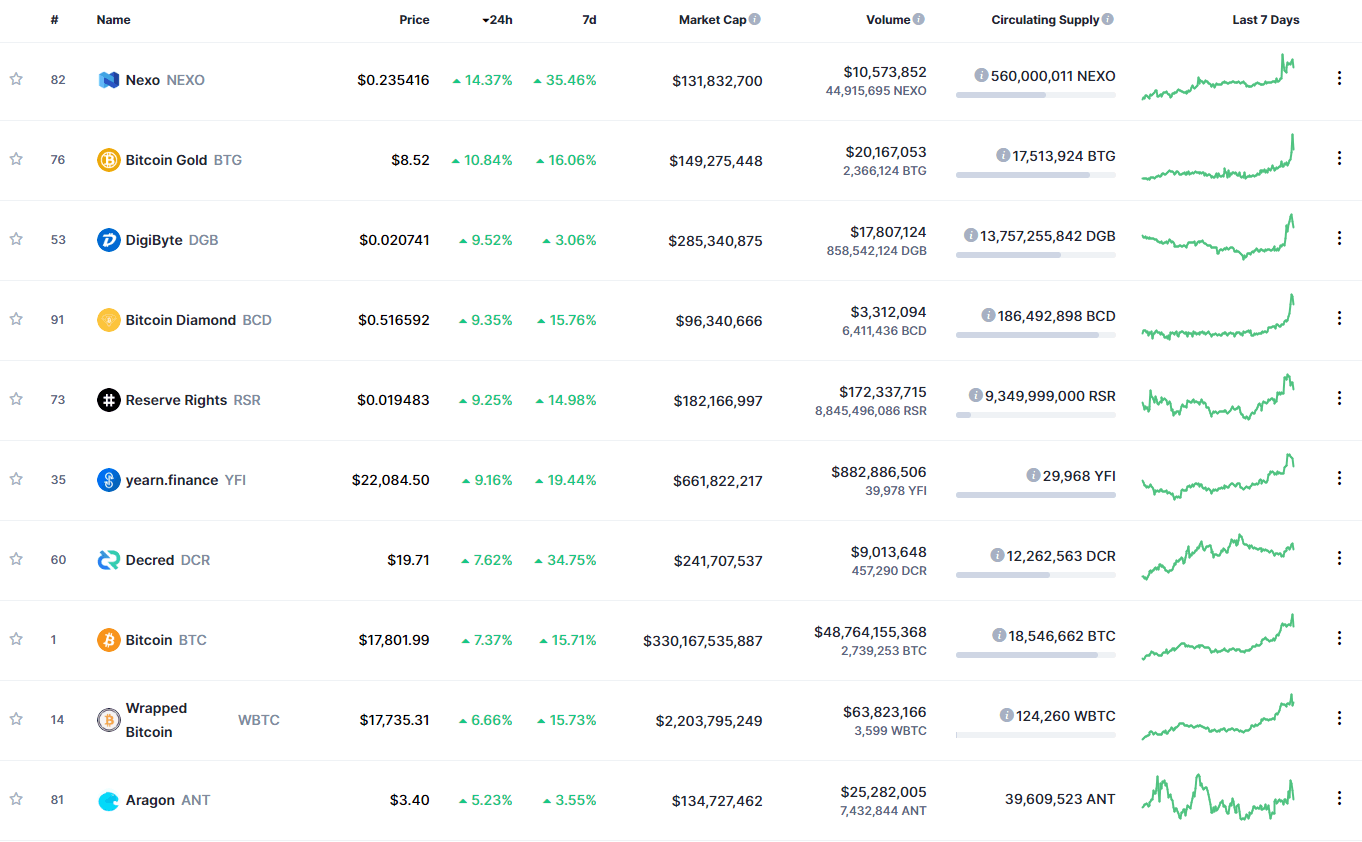
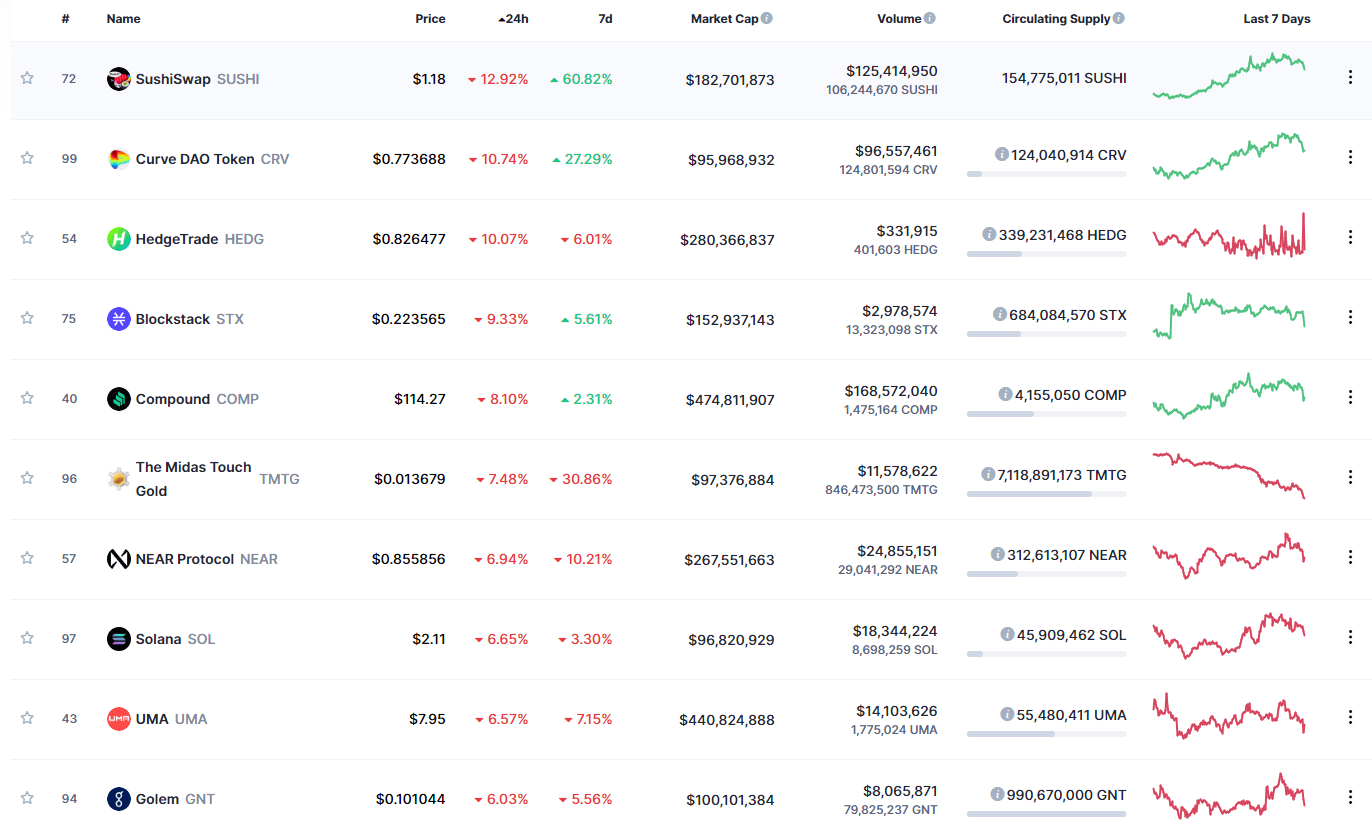
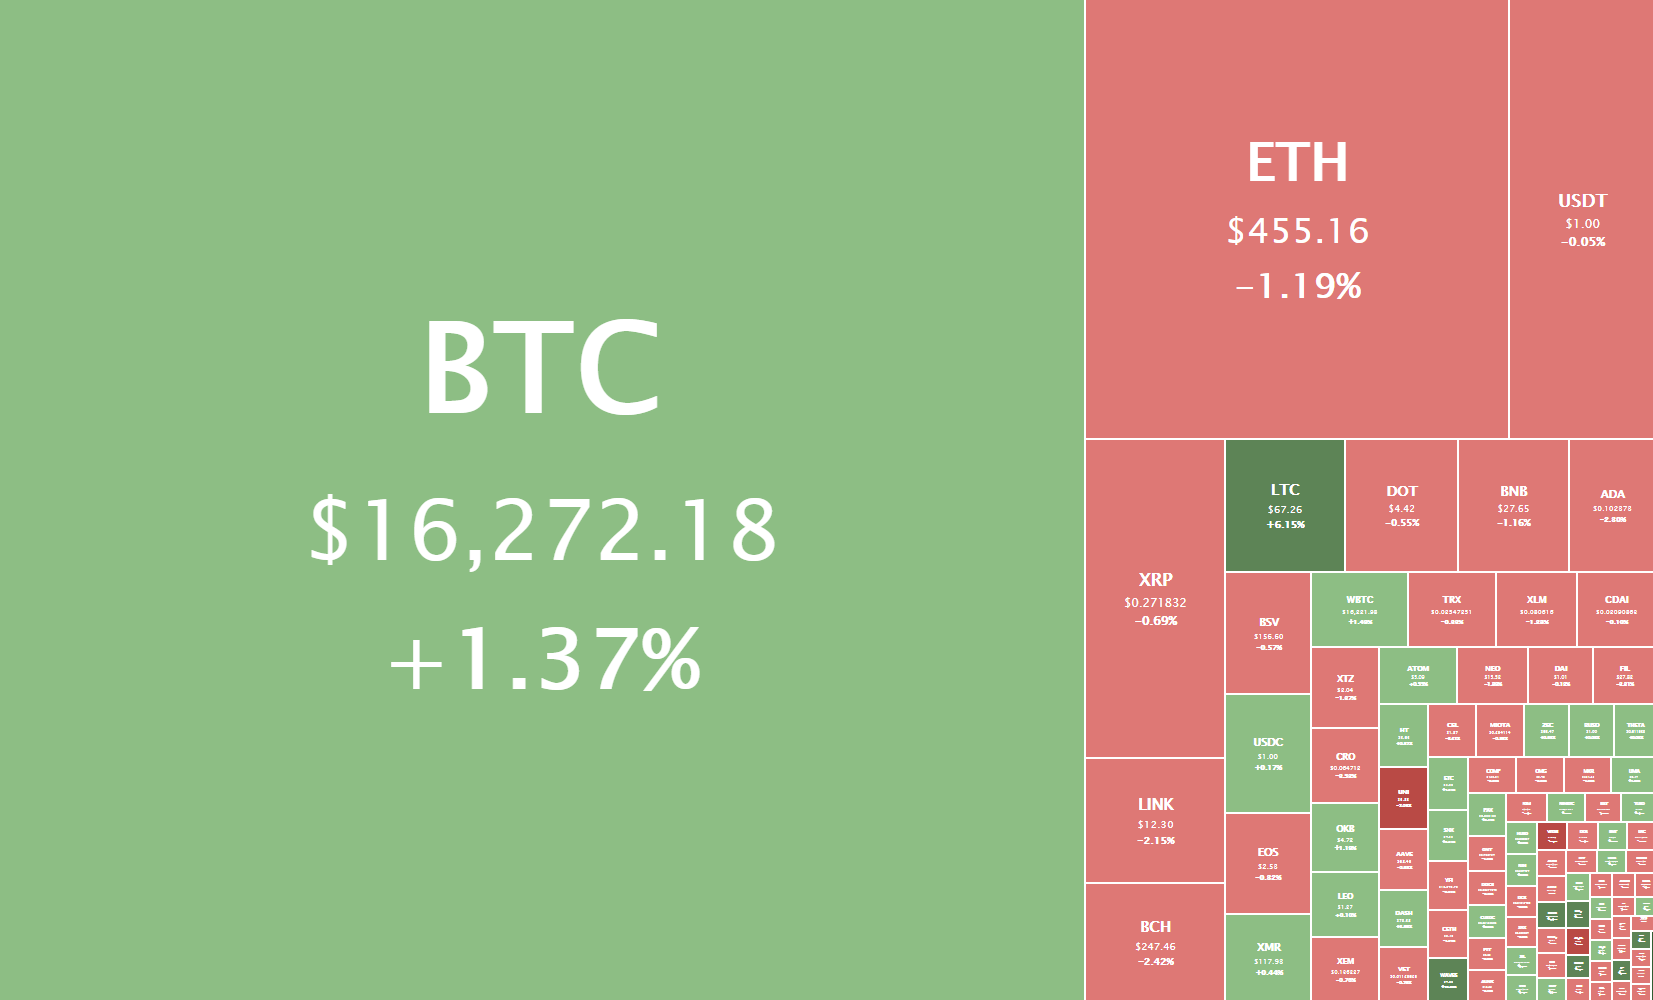
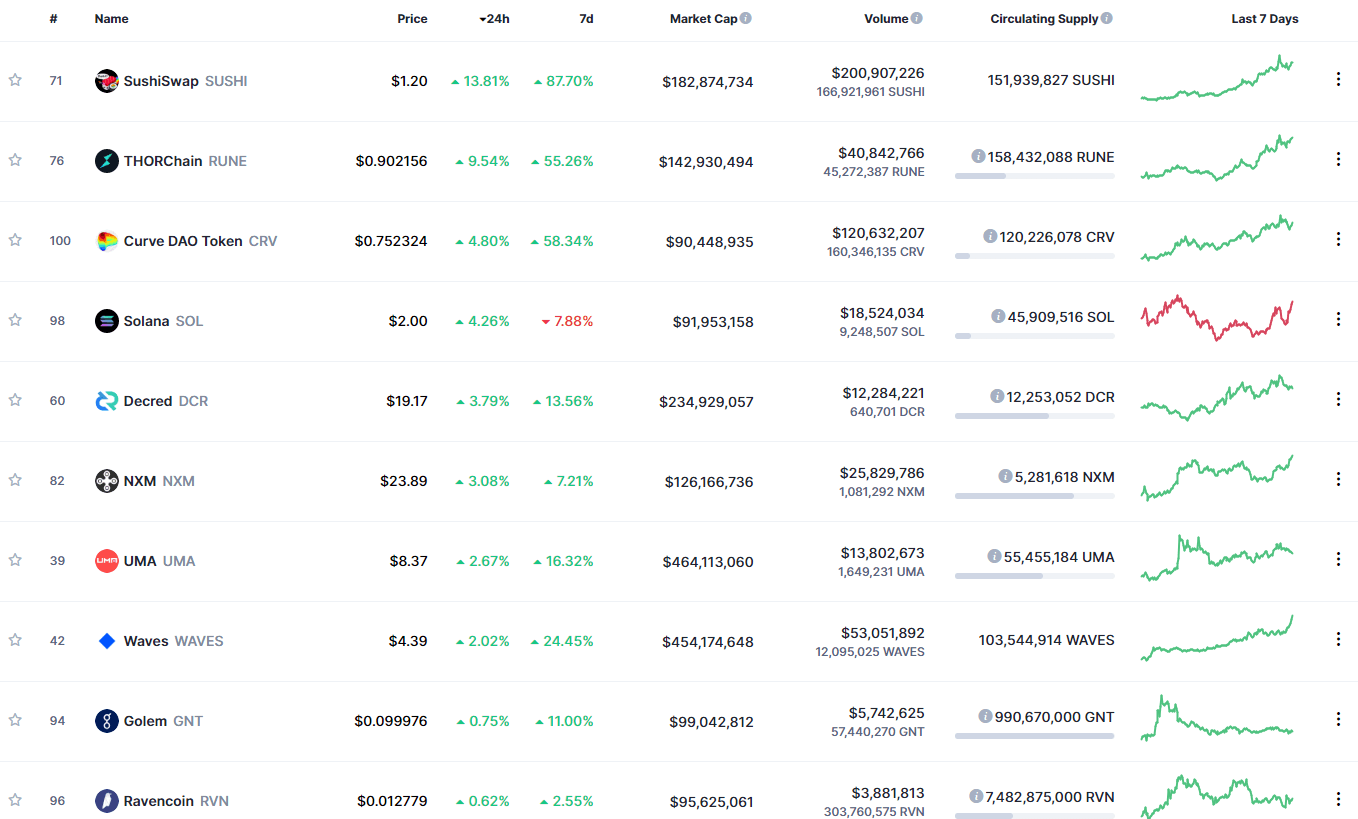
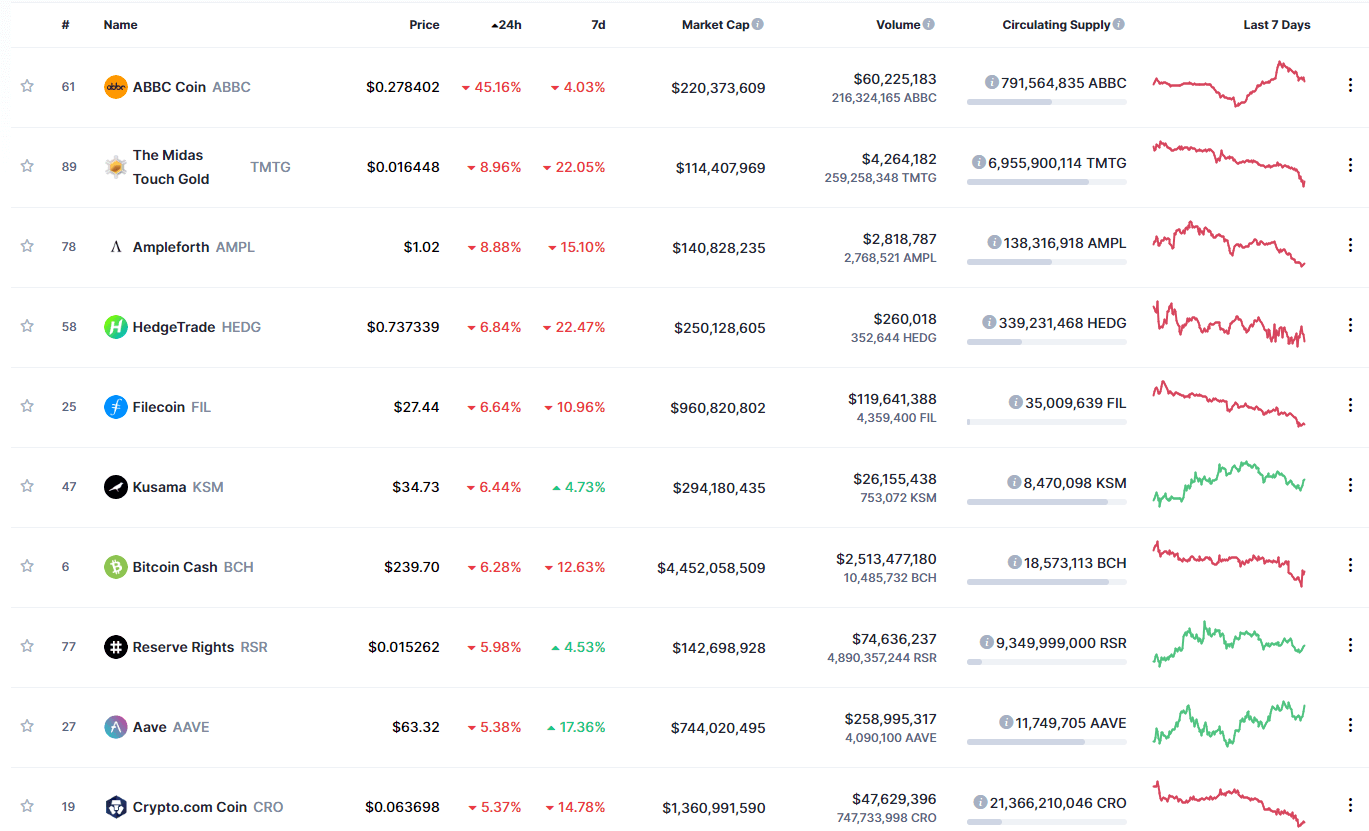
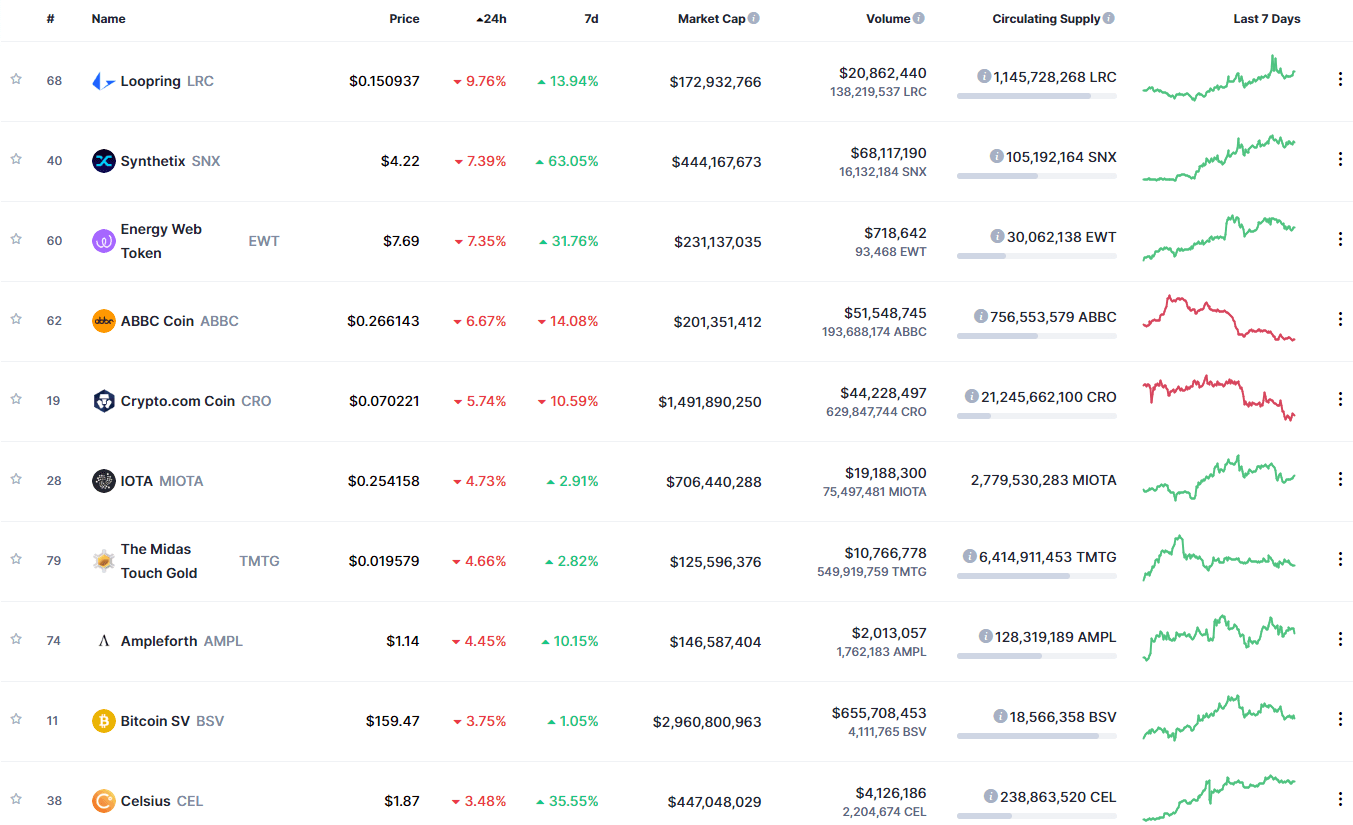
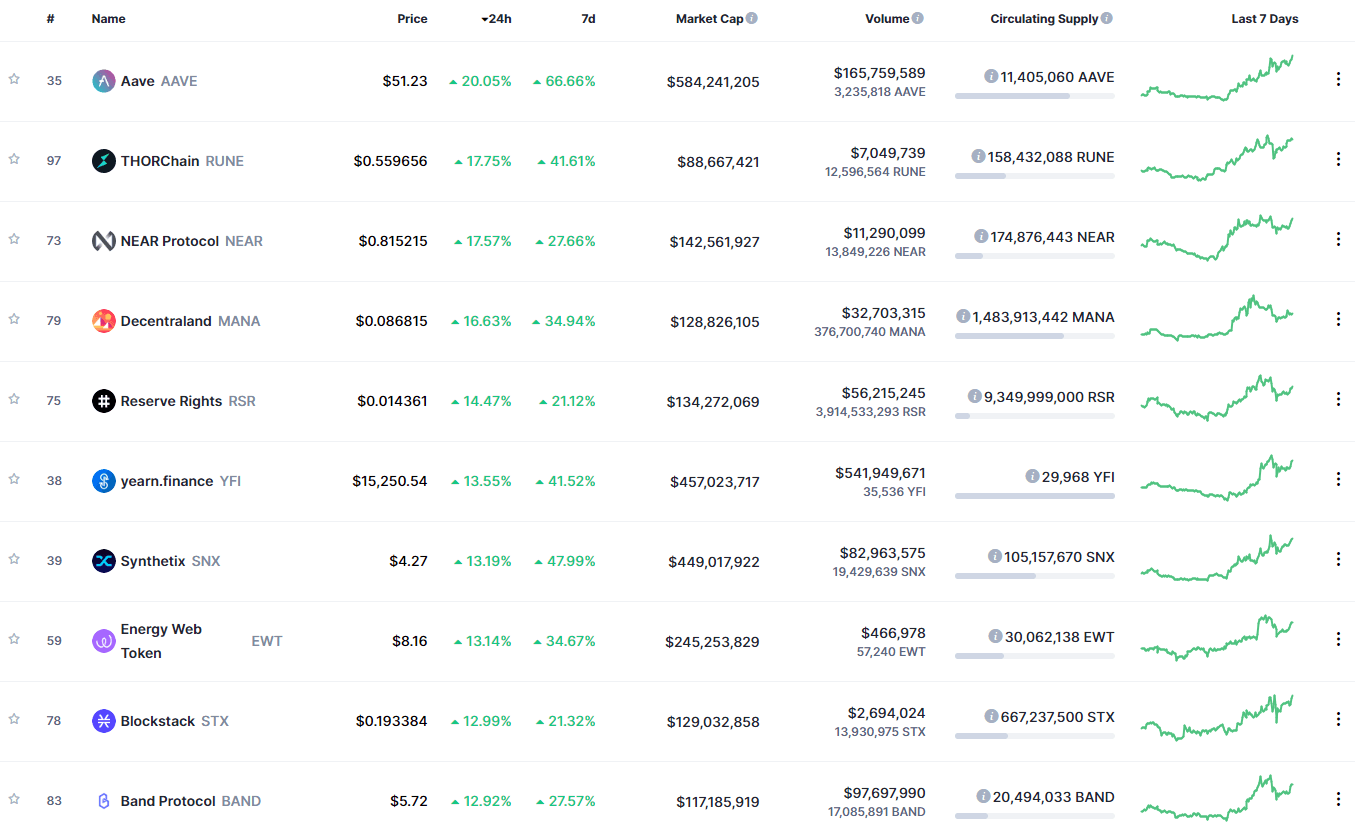
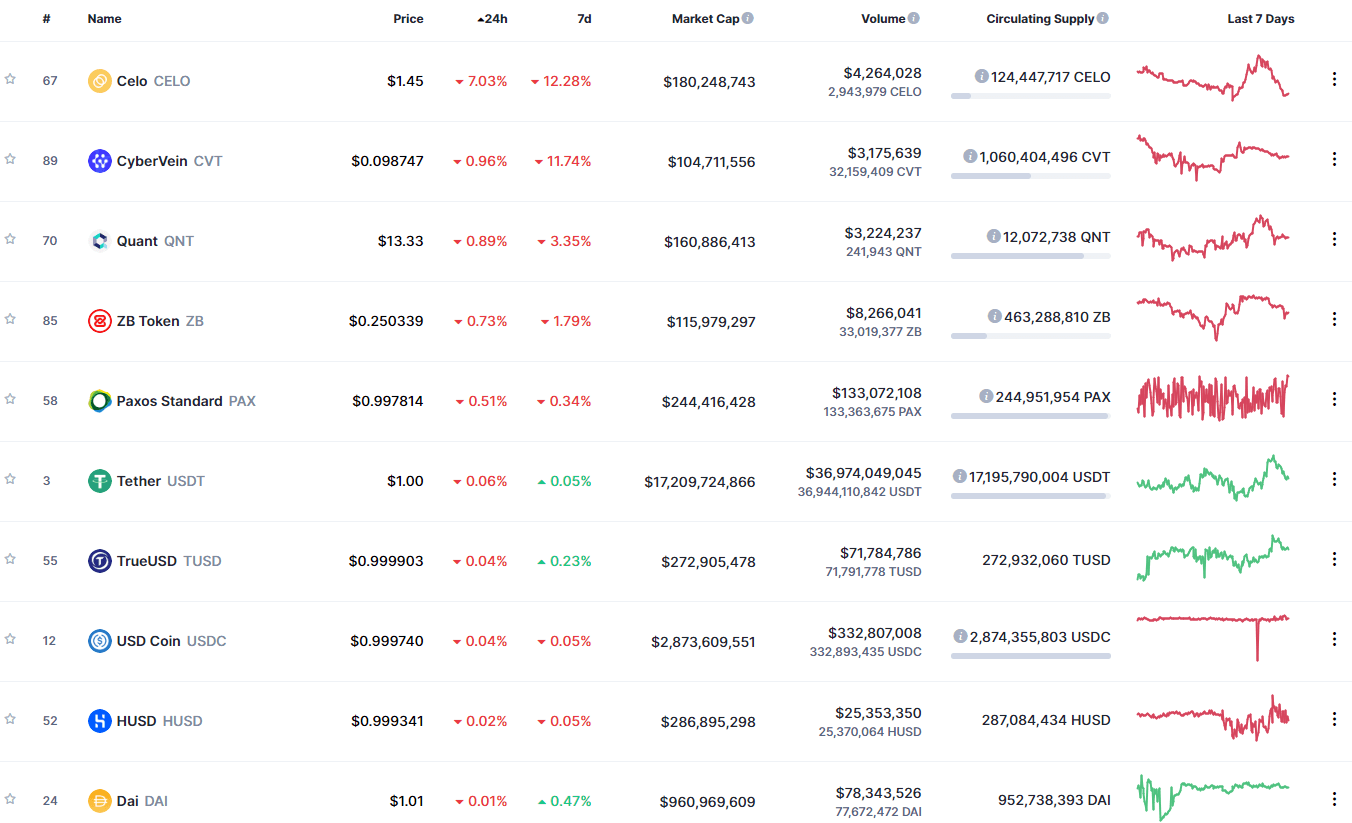
BitTorrent gained 18.25% in the past 24 hours, making it the most prominent daily gainer in the top100. It is closely followed by Litecoin’s gain of 11.22% and Decentraland’s 7.69% gain. On the other hand, Numeraire lost 4.81%, making it the most prominent daily loser. It is followed by Waves’ loss of 5.78 and Zilliqa’s loss of 3.36%.

Top 10 24-hour Performers (Click to enlarge)

Bottom 10 24-hour Performers (Click to enlarge)

Bitcoin’s market dominance has increased slightly since we last reported, with its value currently staying at 62.4%. This value represents a 0.7% difference to the upside compared to the value it had yesterday.

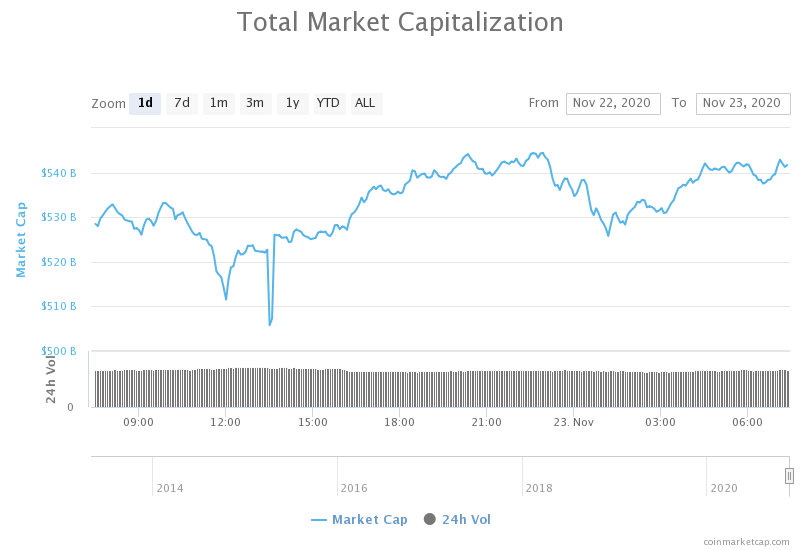
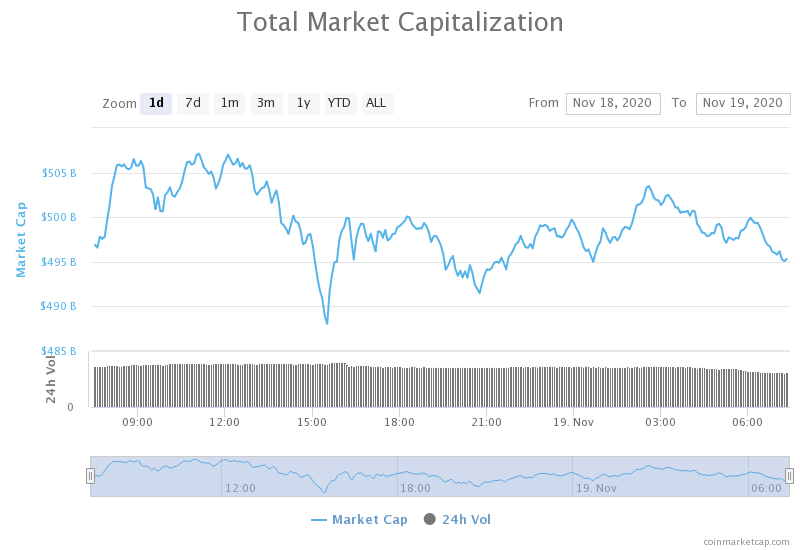
Daily Crypto Market Cap Chart

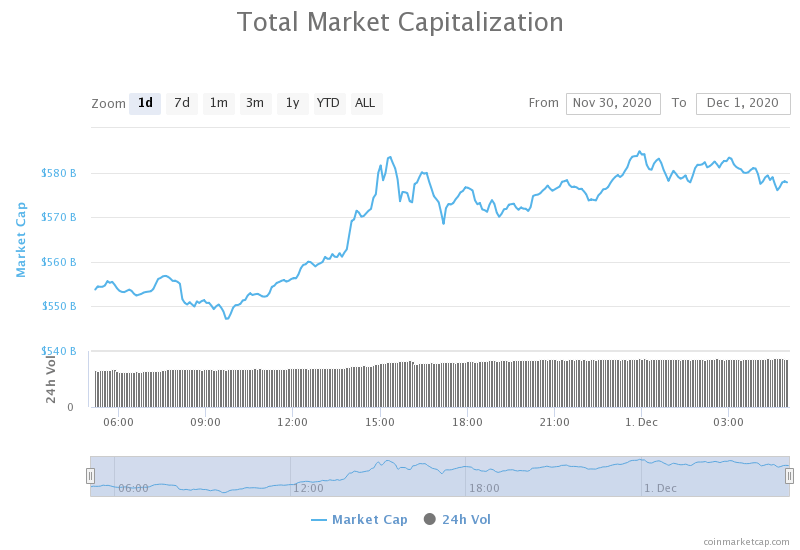
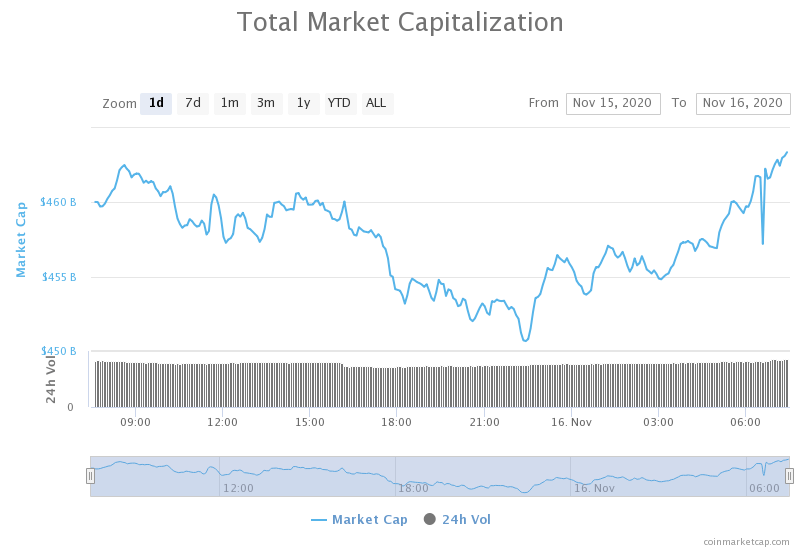
The crypto sector capitalization has increased significantly in the past 24 hours. Its current value is $577.86 billion, representing a $24.86billion increase compared to our previous report.

_______________________________________________________________________

What happened in the past 24 hours?

_______________________________________________________________________

_______________________________________________________________________

Technical analysis

_______________________________________________________________________

Bitcoin

Bitcoin has spent the day continuing its push towards the upside, even posting a new all-time high (on most exchanges) for a moment as it reached $19,864 on Bitstamp. However, the 20,000 mark and BitMEX’s $20,093 remain untouched. With the buys on exchanges and derivatives markets and institutional investments, a strong all-time high might be posted extremely soon.

Bitcoin trading is quite hard at the moment simply due to how the cryptocurrency moves. Still, traders can squeeze a profit if they trade along with the main trend and long Bitcoin when the volume increases.

BTC/USD 4-hour Chart

Bitcoin’s technicals on all time-frames are tilted towards the buy-side but show slight neutrality signs, or even slight signs of bearishness.

BTC/USD 1-day Technicals

Technical factors (4-hour Chart):
  • Price is far above both its 50-period EMA and its 21-period EMA
  • Price is near its top Bollinger band
  • RSI is near the overbought territory (69.43)
  • Volume is average
Key levels to the upside          Key levels to the downside

1: $19,500                                 1: $19,000

2: $19,666                                 2: $18,790

3: $20,000                                  3: $18,500

Ethereum

Ethereum has, just like Bitcoin, continued its climb up. However, the move has stopped slightly below its most recent highs, topping at $617.87. The second-largest cryptocurrency by market cap now has two scenarios to play out:

  1. It can create a double top and start moving back towards the supporting levels;
  2. It can continue moving up on fundamentals and break the recent high and the recent trading patterns it created.

Ethereum’s current fundamental outlook is extremely bullish due to its Phase 0 of Ethereum 2.0 launching. This, along with Bitcoin moving towards the upside, has made trading any potential pullbacks quite impossible due to the amount of potential risk such trade would carry.

ETH/USD 4-hour Chart

Ethereum’s 4-hour, daily, and monthly technicals are extremely bullish and show no signs of neutrality. On the other hand, its weekly time-frame’s sentiment is bullish but shows some neutrality.

ETH/USD 1-day Technicals

Technical Factors (4-hour Chart):
  • The price is far above both its 50-period and its 21-period EMA
  • Price is near its top Bollinger band
  • RSI is near being overbought (68.63)
  • Volume is average
Key levels to the upside          Key levels to the downside

1: $600                                     1: $510

2: $630                                     2: $500 

3: $735                                      3: $490

Ripple

The fourth-largest cryptocurrency by market cap has tried moving up, as well, but in a much tamer manner. XRP has established its presence above $0.625 and pushed towards $0.666, which stopped the move. XRP will most likely continue trading in a range-bound by $0.666 to the upside and either $0.625 or $0.596 to the downside

Trading XRP is quite difficult at the moment, and trading Bitcoin or Ethereum is potentially more profitable and slightly more straightforward.

XRP/USD 4-hour Chart

XRP’s technicals on the 4-hour and weekly time-frames are bullish but show some signs of neutrality. On the other hand, its daily and monthly overviews are completely bullish.

XRP/USD 1-day Technicals

Technical factors (4-hour Chart):
  • The price is above its 50-period EMA and slightly above its 21-period EMA
  • Price is between its middle and top Bollinger band
  • RSI is neutral (60.95)
  • Volume is average
Key levels to the upside          Key levels to the downside

1: $0.666                                   1: $0.625

2: $0.78                                     2: $0.596

3: $0.79                                   3: $0.535


Categories
Crypto Videos Forex Videos

What Caused The BTC/USD bull run collapse? How To Avoid Major Losses!


Bitcoin – USD bull run collapses, what happened?

Thank you for joining this forex academy educational video.

In this session, we will be looking at the end of the most recent bull run for the BITUSD pair.

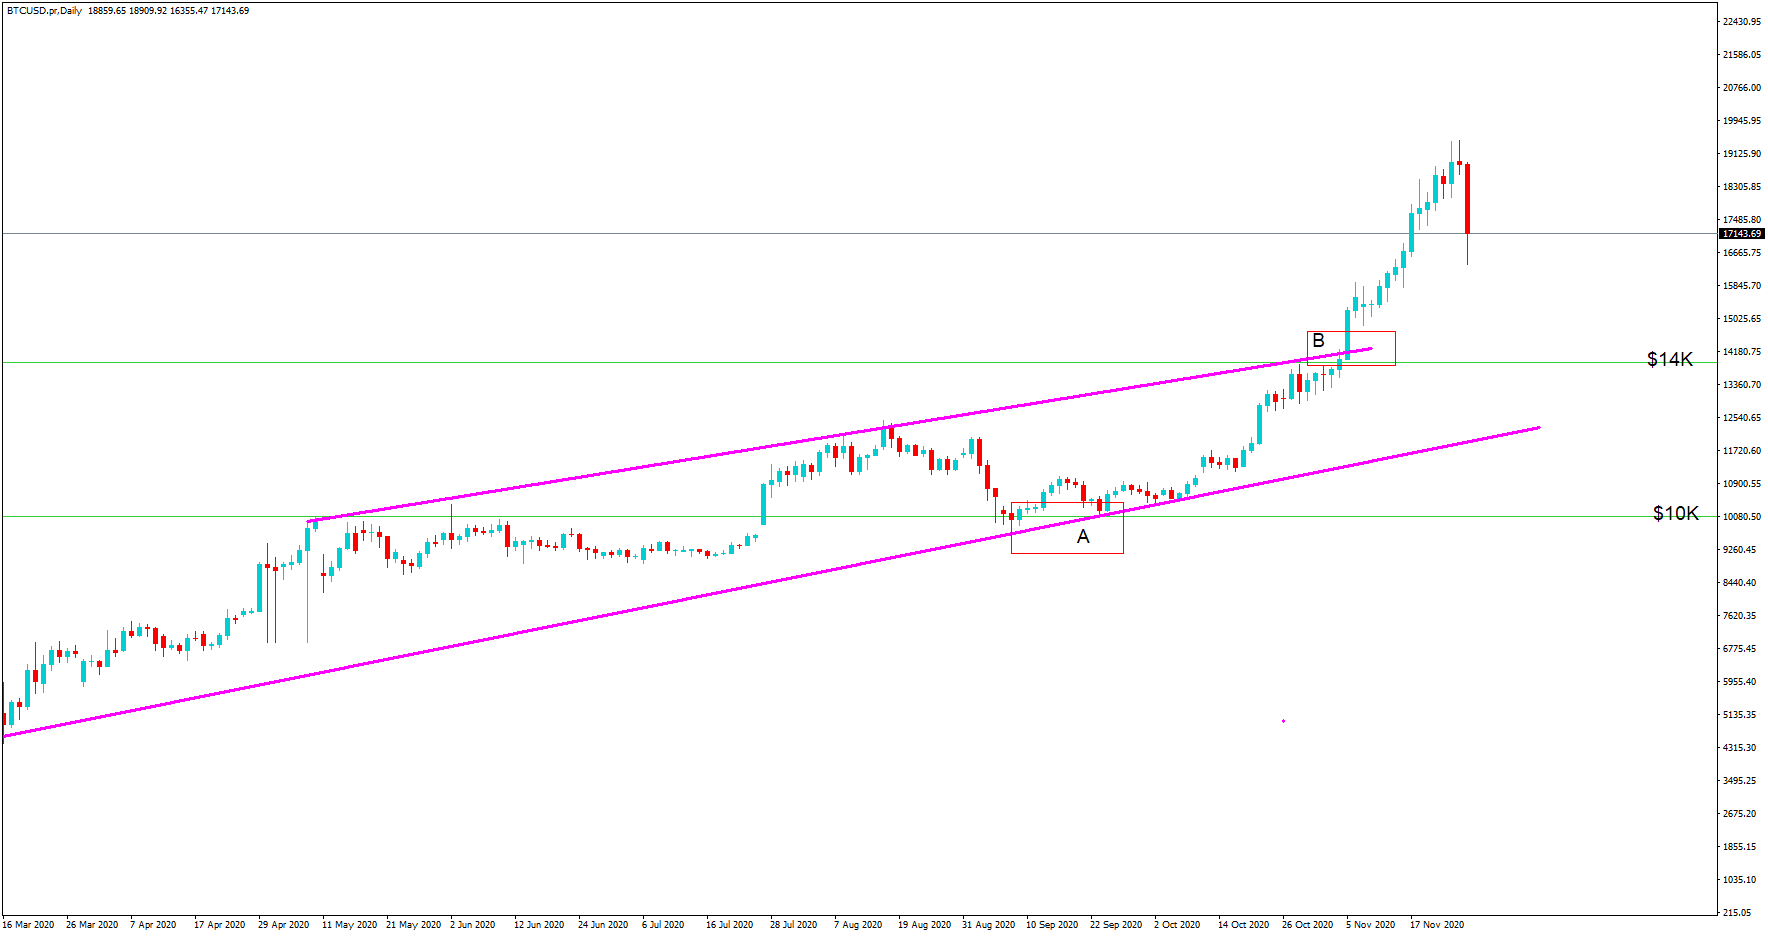
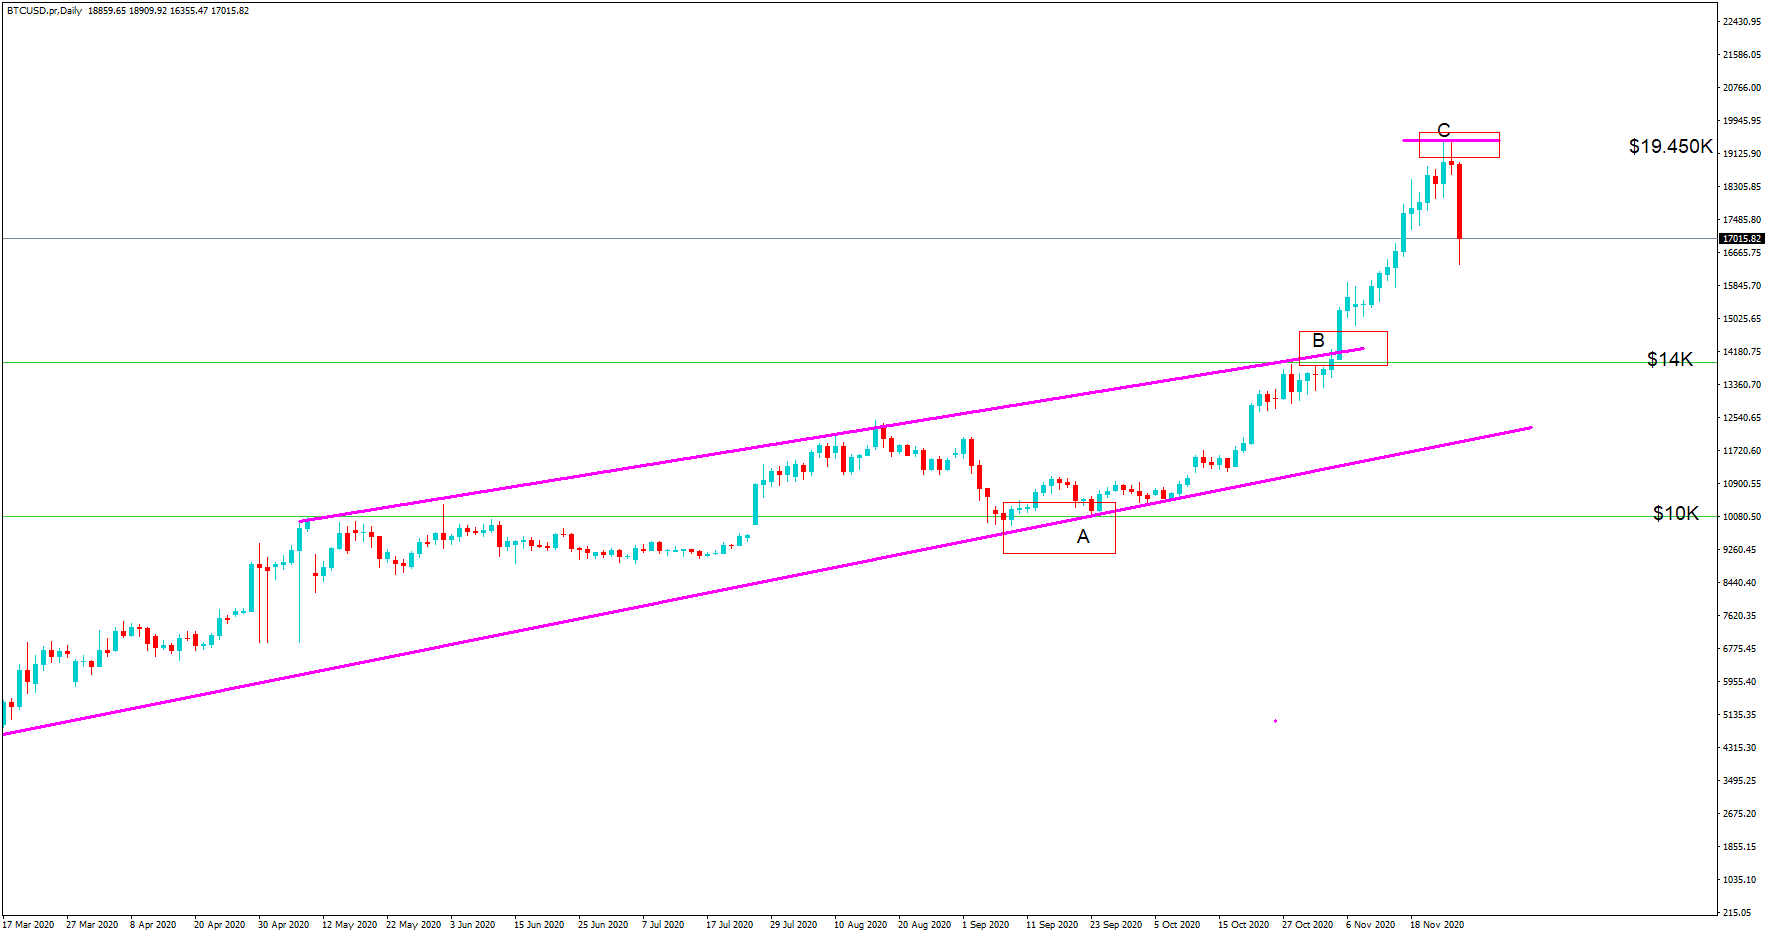
This is a daily chart for the pair.  As we see here, the pair has been on a bull run and has been conforming to this upward trend line since April 2020.  The price range found support at the all-important $10K level, which coincided with the support line at position A.  The pair found a bid tone up to position B,  where price action did not revert to the support line,  preferring to fade up to the line of resistance where we see a breach above the $14 k line which coincides with the area of resistance at position B giving the pair one of the largest single-day moves to the upside for several months.

We then see an extended rally up to position C see at $19.450k before a major pullback. So, what caused this?


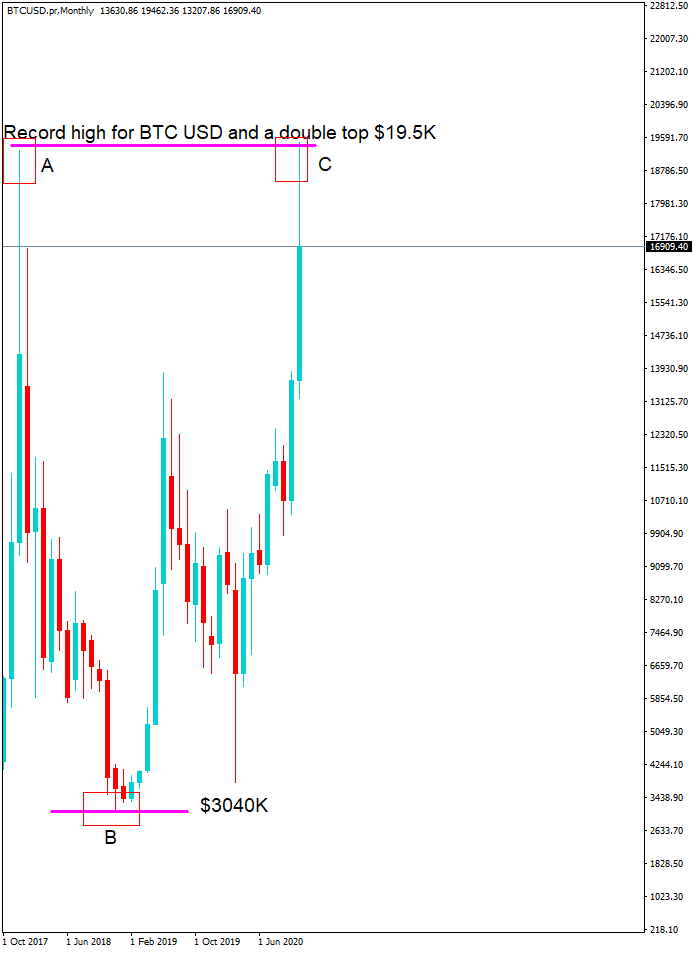
Firstly, we need to go back in time to 2017, shown here on the monthly chart, where bitcoin to the US dollar hit an all-time high hit around $19.5K, depending on the broker, shown here at position A, before crashing to $3K in the middle of 2018, at position B, and then taking 2 years to reach the $19.5K area as seen at position C.   This is a double top formation, where smart money investors, saw the potential of a reversal in price action, while many traders were hoping for a continuation to $20K and beyond.

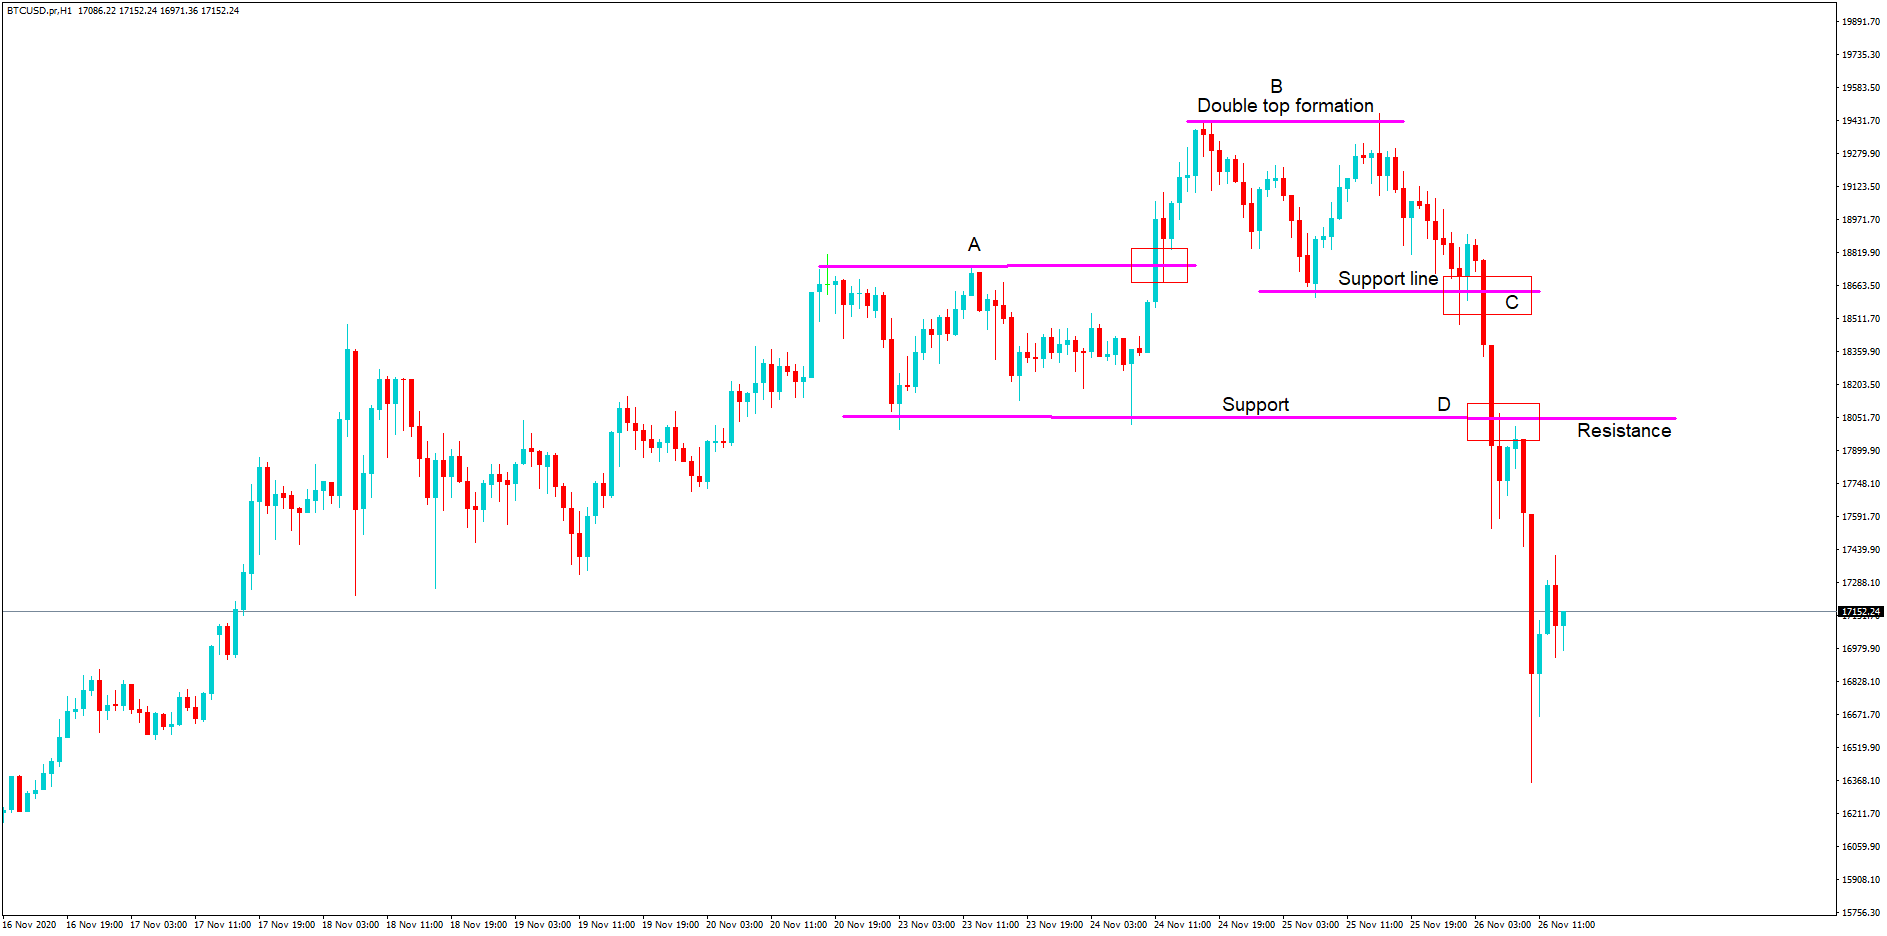
Now we need to drill down to the 1-hour chart.  We have a classic area of support and resistance at position A,  where the resistance line is breached to form a push up to $19.5K area,  before a pullback to the support line and a second attempt to move higher, which forms a double top,  and the price does not sustain the move higher and falls back to the support line at position C,  before crashing lower with large candles suggesting extreme volatility through eventually punching through the support line at position D, which becomes an area of resistance, before the pair crashes to a low of $16.3K. 

This move came about due to a series of important factors,  including historic highs,  followed by a crash,  followed by another bull run,  but where cautious traders would be reminded of the previous crash and were prepared to selling bitcoins and bitcoin futures,  as we see on our charts,  because of the nature of bitcoin which has no store value you other than the fact that it is of limited supply, and is predominantly a speculative instrument.

Thrown into the mix was the current bull run topping out just before the US Thanksgiving holiday, where traders will have decided to unwind their trades and take their profits.

Bitcoin proves again that it is a highly dangerous asset to trade. With one story of a $100 million loss in the press today, timing is critical. The main BTCUSD lost 11% in 24 hours and dragged other crypto assets lower in the panic. However, by using simple trend and support and resistance lines and dropping up and down in chart time frames, traders can gain a clear understanding of the risks and potential for turns in price action.


Categories
Crypto Daily Topic Cryptocurrencies

Read This Before Investing in a DeFi Project

Decentralized Finance (DeFi) is a system of financial applications that are powered by smart contracts. Defi has exploded in popularity because of its unprecedented features on cryptographic security, fraud-free transactions, and autonomy. Whether it’s investing, loans, insurance, banking, lending, and staking, pretty much every financial offering exists in DeFi. 

The space’s dramatic growth has led many investors rushing in to get a slice of the DeFi pie. But just like with crypto investing, you can gain some handsome profits, but you can also incur devastating losses, especially if you’re not careful. 

This article will guide you in what you need to do before dipping your feet in the DeFi investment waters. But before that, let’s look at what investing in DeFi entails. 

DeFi Investing: The Basics 

There isn’t much difference in the investment opportunities offered in the traditional financial setup and Defi. Decentralized lending, for instance, follows the same principle as lending in centralized finance systems, except this time, smart contracts are involved, and the returns are invariably better. Smart contracts are used to hold collateral from borrowers and also automatically deliver accrued interest to lenders. There’s also ‘staking.’ Staking in DeFi is when you lock up your crypto and get the right to participate in a network and, in some cases, earn rewards for depositing your crypto. 

We also have ‘yield farming’ in DeFi. Introduced by Synthetix and popularized by Compound, yield farming involves locking up your crypto assets in a project’s protocol and earning rewards. 

Defi investors use their insight to spot lucrative opportunities, just like traditional finance investors capitalize their knowledge on assets such as real estate.

With that, let’s get straight to:

What you need to do before investing in DeFi. 

#1. Carry out extensive research

Before you invest your hard-earned money in a Defi project, it helps to do your research. To verify whether a project is legit, head to Google, and type the project’s name followed by the word “scam.” If this project is a scam, someone else might have already flagged it.

You might have typed the name of the project alongside the term “scam,” and nothing has popped up. This does not mean that the project is completely legitimate. You can use Defi tokens and protocols, which anyone can view since the project is open-source. If you can, evaluate the project’s codes to see if the project is genuine. This method particularly helps if you have programming skills or know your way around smart contracts. 

#2 Observe the number of users and what they are saying

The more the users on a blockchain project, the more the value. With blockchain projects (mostly those on Ethereum where several Defi projects are built), there is real-time reporting. This can be done through Etherscan.io, which is for raw data, or Dune Analytics, which focuses on user-friendly reports. With these tools, you can look at the total users in a given Defi project coupled with the increasing number of users. The goal is to see real people using these protocols. Keep in mind that some of the data you see can also be corrupted as an elaborate ploy to lure in unsuspecting users. These accounts should belong to quality users, and their growth should be quadratic. If you observe such users utilizing the protocol, then it’s genuine.

Also, be keen on what trusted security professionals are saying and writing about these projects. Defi projects typically subject their smart contracts to manual security audits with an air-tight reputation. Some of them include Certik, Quantstamp, and OpenZeppelin.

You can also check what people on Twitter, Reddit, and DeFi-related sites and forums say about the project. You can also check whether the project is recognized by Defi Prime, Defi Pulse, and Defi Market Cap. 

#3. Verification by Etherscan

Once a project has verified their smart contracts on Etherscan, a unique code will be availed. When viewing the contract, the code you see is the same code you ought to get when using it. Of course, this does not mean that your project is invulnerable to hacks or it’s not a scam. Still, having a code that can be publicly assessed without the fear of the code being changed is vital.

ETHProtect is a service provided by Etherscan that enables people to report suspicious activities on the Ethereum blockchain. A “Red Shield,” issued by Etherscan’s security analysts and the Taint Inference Analysis Engine, is something to watch out for when looking at Defi projects. These usually mean that people have launched a complaint against a certain project. When you see a Red Shield attached to a project, know that it’s been identified as a scam. 

#4. Watch out for fake projects

Many fraudsters are ahead in the game – they create fake projects with legit-sounding names. But when you look more closely, you’ll find that the project’s links are either dead or lead to nowhere. Or it may have a website, but it looks all spammy, like requiring people to sign up for freebies – and other suspicious activities. 

You can also know if a project is legit by checking what exchanges its tokens are listed on. It’s almost impossible to find a scam project listed on reputable exchanges like Coinbase, Binance, Huobi, etc. Instead, fake projects are listed on decentralized exchanges or little-known centralized exchanges. 

Closing Thoughts 

Investing in DeFi can be lucrative, but watch out for the loopholes. The crypto space is full of scammers looking to make a quick buck at the expense of unsuspecting users. Luckily, there are ways to identify a fake DeFi project way before you can be duped to invest in one. Also, you can always analyze a project’s code for the tech-savvy investors and determine if it’s legit. Also, don’t forget the first rule of crypto investing: don’t put in more money than you can afford to lose!

Categories
Cryptocurrencies

Forex or Crypto, Which Way 2021?

It is not strange for beginner investors to conflate forex and crypto trading. Although they are similar in some ways, these two industries have significant differences. 

As the new year approaches, new and seasoned investors alike need information on how the different markets are likely to turn out as we expect each market to behave uniquely. Some cryptocurrencies tend to boom in the last quarter of the year, as we’re currently seeing with Bitcoin. On the other hand, currency exchange pairs tend to be more affected by geopolitical and economic happenings. 

While this article does not intend to claim that one is better than the other, we will highlight the key similarities, differences, benefits, and risks of both forex and crypto, with a focus on recent market trends. Hopefully, you will determine which investment will be suitable for you in the coming year.

What is the Forex Market?

The forex market is a decentralized market where foreign currencies are exchanged. Being decentralized means, there is no single global authority that controls the trade. However, the central banks in each country have a major influence on what prices their local currency fetches against foreign currency. This is how they balance imports and exports to keep their economies happy.

Anyone can participate in forex trade because it simply involves buying and selling currency, which most banks accept. Forex trading is usually done through FX brokers. Many online forex brokers such as IQ Broker offer convenient forex trading. With extensive research, some practice, a little courage, and luck, you can reap big trading forex

What about Crypto Trading?

Crypto trading involves buying and selling cryptocurrencies – much like with forex. This activity happens on crypto exchanges like Etoro, Coinbase, and Binance. Like forex trading, crypto trading is usually done through brokers or exchanges, giving it as much flexibility. Also, anyone can be part of over the $250 B that changes hands daily (as of November 2020) on different crypto exchanges. 

Forex and Crypto: Similarities

There’s so much similarity between forex and crypto trading that you’d be forgiven for conflating the two. Let’s look at some of the top similarities.

  • You need to be knowledgeable enough to engage in either. Otherwise, you’d be setting yourself up for losses.
  • Market forces, including investor sentiment and supply/demand, determine how both forex and crypto prices shift. 
  • One can close a trade in a relatively short time in either of the two.
  • Both involve buying and selling instruments, including currencies, crypto coins, tokens, futures, and other complex financial assets.
  • On the same note, both of these markets have different players. These include institutions and individual players, each looking to make some profits out of the market.

Technology, more so information technology, plays a crucial role in expanding these two markets. Although the forex market came in before the computers and the internet, forex is what it is today thanks to information technology. On the other hand, we could not be talking about Cryptocurrencies without the internet and computers.

Differences between Forex and Crypto Trading

Several differences distinguish forex markets from crypto markets. 

  • Forex markets usually operate during business days, typically Monday-Friday. On the other hand, the crypto market is on 24/7, 365 days a year. This gives crypto some edge when it comes to trading flexibility. 
  • Forex markets are inherently more stable, thanks to the involvement of central banks. Crypto markets, on the flip side, are notoriously volatile. Whether this is an advantage really depends on an investor’s point of view. 
  • Crypto markets tend to be riskier than forex markets, mainly due to their higher volatility. 
  • Forex trading is more regulated and protected, which means it can pose less trading risk. However, less risk means fewer returns.
  • With forex, you do not need a wallet or the technicalities that crypto trading comes with. All you need is an account to deposit funds and you are ready to go.

Which One Is Better?

Now, investors themself can best answer this question. Generally,  each market has unique characteristics that will appeal to some investors and not others. Still, the following factors can help you in determining which one would work better for you:

If you are more risk-averse, forex trading may be your go-to option. As we said earlier, crypto markets can be very turbulent. For instance, Bitcoin has been moving by even up to $2,000 USD a week, especially since October. No central bank would sit and watch such sudden price movements on their forex markets. So, if you thrill in dramatic movements in return for higher rewards, crypto sounds better.

The crypto market (led by Bitcoin) is currently on the bull run. The time is ripe for reaping huge from crypto. We’re not saying that crypto is now a get-rich-quick market. But all indications are that it is presently the most lucrative. On the flip side, many investors will lose big if the market goes on a free fall (an inevitability). Thus, short-term investors may find crypto more suitable in the coming months. 

If you’re looking to grow your investment over a long time, say beyond 2021, crypto trading may give you a better platform. While forex pairs usually oscillate between stiff margins, cryptocurrencies can rise exponentially over time. This growth depends on how well the crypto’s backing project is implemented. However, you can multiply your investment by investing in crypto with the potential to grow – something that’s not possible with forex.

Now that you have more clarity on the way ahead, what would be the next steps? If you prefer to venture into forex trading, you need to find the best brokers. Check out our reviews for some of the top brokers you can choose from. On the other hand, if you prefer the ‘wild west’ crypto market, you can choose to trade with brokers that support crypto or opt for crypto exchanges. 

Final Thoughts

Both forex and crypto trading offer investors opportunities for growing their investments. However, each market has its own characteristics. From a returns viewpoint, the main difference between the two is that forex offers moderate profits while crypto trading can have much higher returns. The bottom line is, forex trading favors investors who prefer less risk, while crypto is for more adventurous investors. Whichever investment you pick in 2021, ensure that the market’s risk and return profile are to your preference. 

Categories
Crypto Market Analysis

Daily Crypto Review, Nov 30 – Ethereum Soars on Great Fundamentals; Bitcoin Bulls Back in the Game

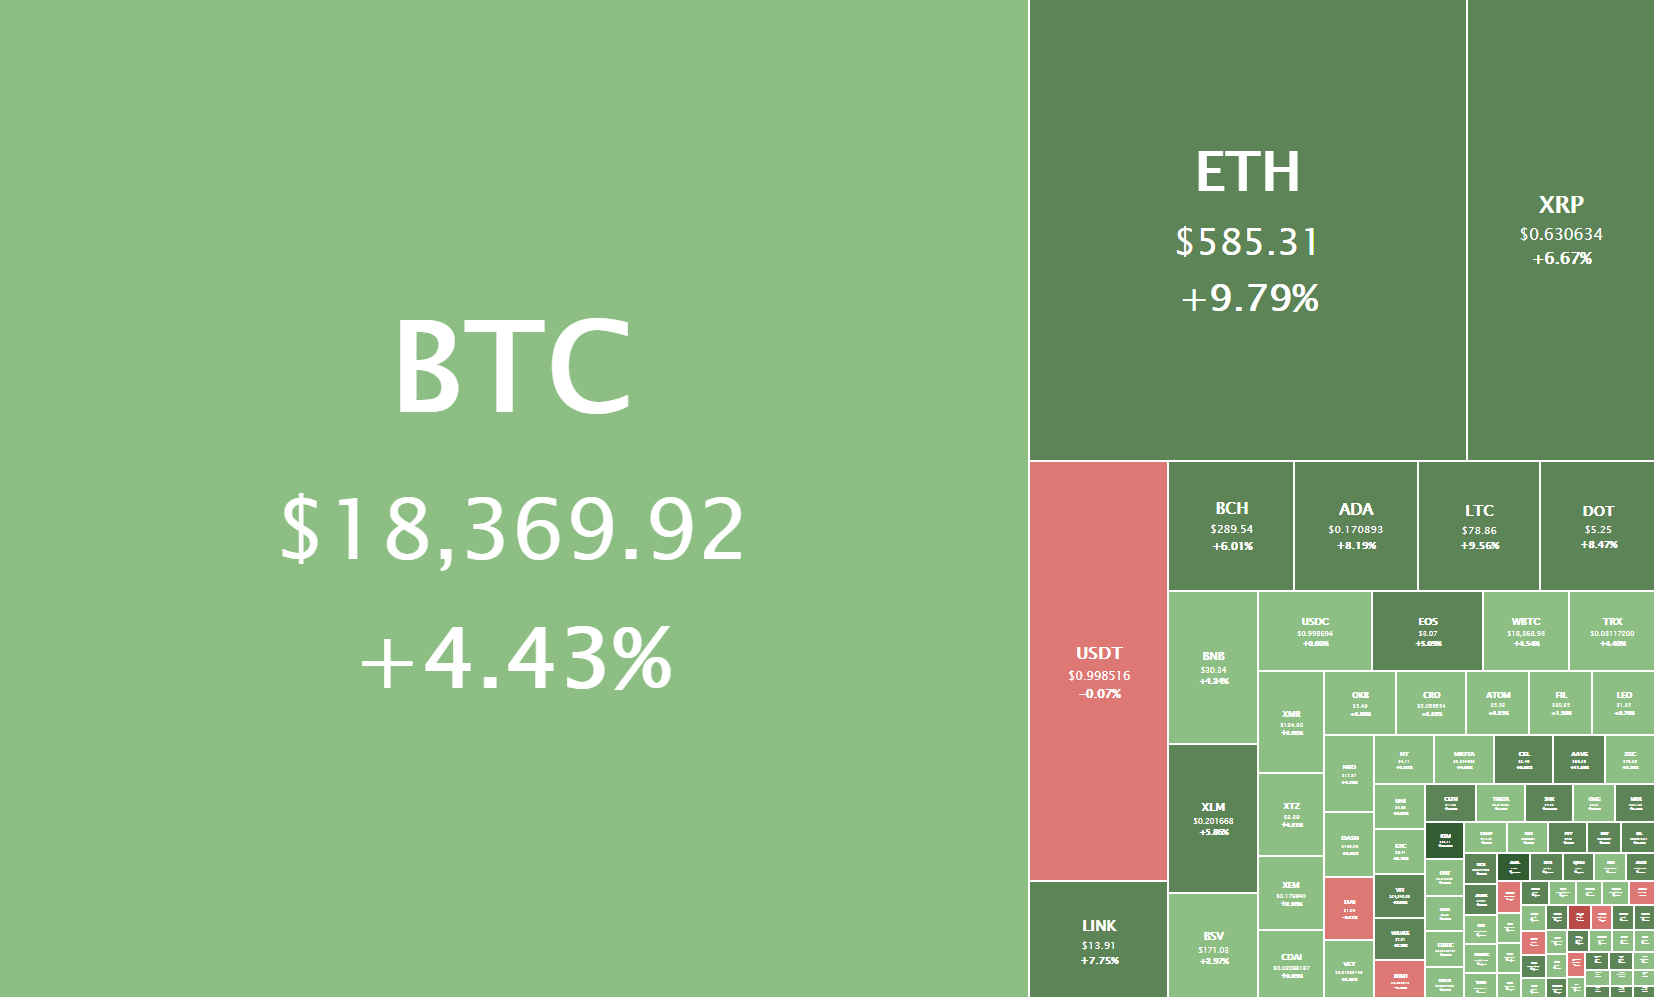
The cryptocurrency sector has spent the weekend regaining what was lost during the crash on Nov 25. Almost every single cryptocurrency in the top100 ended up being in the green. The largest cryptocurrency by market cap is currently trading for $18,369, representing an increase of 4.43% on the day. Meanwhile, Ethereum gained 9.79% on the day, while XRP managed to gain 6.67%.

 Daily Crypto Sector Heat Map

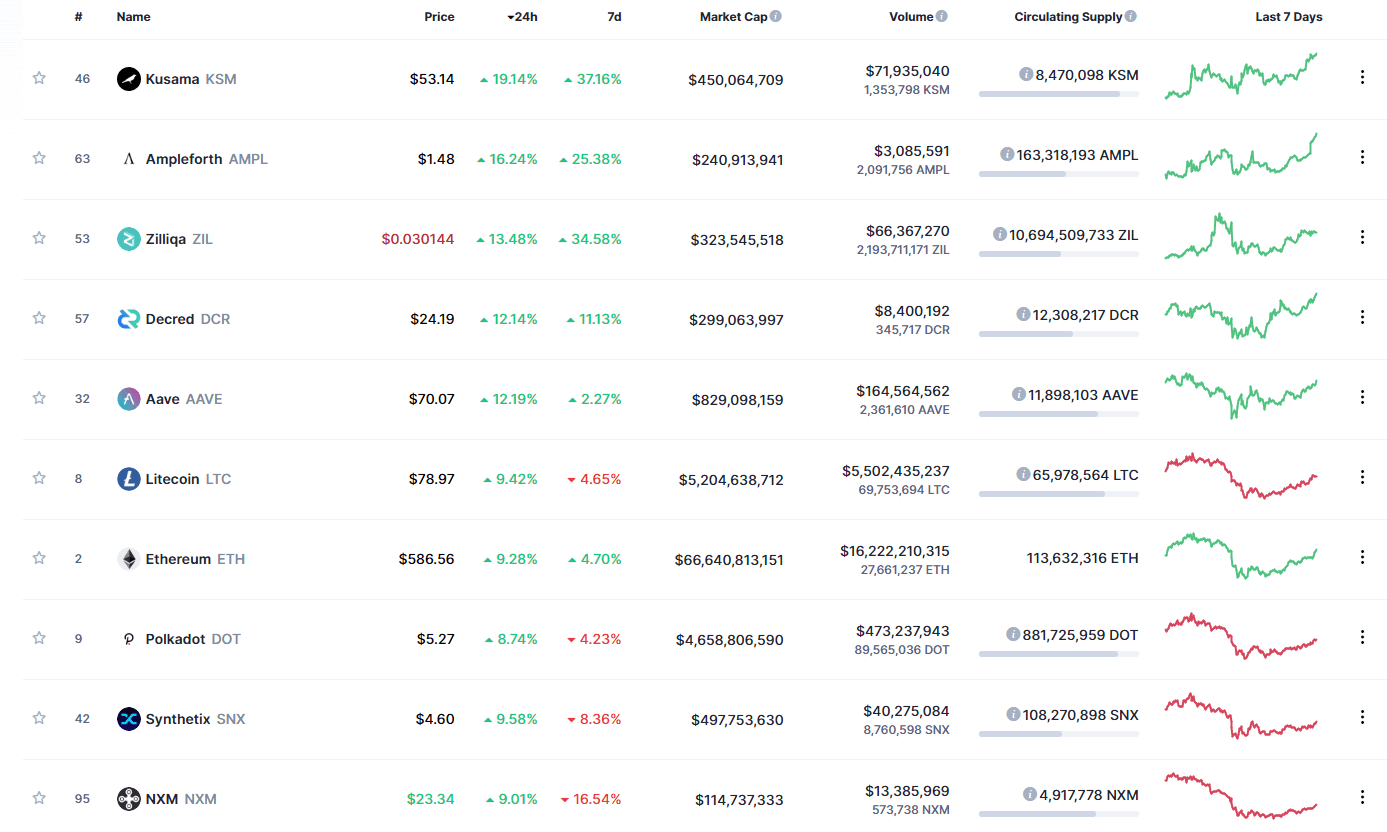
Kusama gained 19.14% in the past 24 hours, making it the most prominent daily gainer in the top100. It is closely followed by Ampleforth’s gain of 16.24% and Zilliqa’s 13.48% gain. On the other hand, Numeraire Coin lost 5.56%, making it the most prominent daily loser. There were no other cryptocurrencies in the top100 that lost over 1% of its value.

Top 10 24-hour Performers (Click to enlarge)

Bottom 10 24-hour Performers (Click to enlarge)

Bitcoin’s market dominance has decreased slightly since we last reported, with its value currently staying at 61.7%. This value represents a 0.5% difference to the downside compared to the value it had on Friday.

Daily Crypto Market Cap Chart

The crypto sector capitalization has increased significantly over the weekend. Its current value is $553.00 billion, representing a $38.14 billion increase compared to our previous report.

_______________________________________________________________________

What happened in the past 24 hours?

_______________________________________________________________________

_______________________________________________________________________

Technical analysis

_______________________________________________________________________

Bitcoin

Bitcoin has spent the weekend recovering from the Nov 25 crash. The price was slowly going up over the weekend, creeping up to and past $18,000 once again. The largest cryptocurrency by market cap is currently between its 61.8% and 78.6% Fib retracement levels, and a break to either side of this range may determine its short-term fate.

Bitcoin’s short-term future will greatly depend on if it breaks its immediate support or resistance level. In both cases, a strong rally towards that side may form, so traders should be prepared to “catch” the trade quickly.

BTC/USD 1-hour Chart

Bitcoin’s daily, weekly, and monthly technicals are tilted towards the buy-side but show slight neutrality signs. On the other hand, its 4-hour technicals are completely bullish.

BTC/USD 1-day Technicals

Technical factors (4-hour Chart):
  • Price is above both its 50-period EMA and its 21-period EMA
  • Price is near its top Bollinger band
  • RSI is neutral (62.26)
  • Volume is average
Key levels to the upside          Key levels to the downside

1: $18,500                                 1: $17,850

2: $18,790                                 2: $17,450

3: $19,000                                  3: $17,000

Ethereum

Ethereum has, just like Bitcoin, been climbing back and trying to reach its recent highs. The second-largest cryptocurrency by market cap is currently fighting to pass the 78.6% Fib retracement level, sitting at $592.5. If this level gets conquered with conviction, we may expect another run past $600.

Ethereum’s current fundamental outlook is very bullish due to its Phase 0 of Ethereum 2.0 launching. This, combined with Bitcoin moving towards the upside, has made trading any potential pullbacks impossible due to how risky it would be.

ETH/USD 4-hour Chart

Ethereum’s 4-hour, daily, and monthly technicals are completely bullish and show no signs of neutrality. On the other hand, its sentiment seen in the weekly time-frame’s is bullish but shows some neutrality.

ETH/USD 1-day Technicals

Technical Factors (4-hour Chart):
  • The price is far above both its 50-period and its 21-period EMA
  • Price is at its top Bollinger band
  • RSI is near being overbought(68.26)
  • Volume is average
Key levels to the upside          Key levels to the downside

1: $600                                     1: $510

2: $630                                     2: $500 

3: $735                                      3: $490

Ripple

The fourth-largest cryptocurrency by market cap has spent the weekend trying to maintain its level after a small rally that took its price from $0.55 to $0.65. XRP seems to be trading in a range, bound by the 38.2% Fib retracement ($0.582) and 61.8% Fib retracement ($0.657).

Trading XRP may not be optimal as trading Bitcoin, or Ethereum is potentially more profitable and slightly more straightforward.

XRP/USD 2-hour Chart

XRP’s technicals on shorter time-frames (4-hour and daily) are extremely bullish, while its weekly and monthly overviews show some signs of neutrality and bearishness (though they are still bullish).

XRP/USD 1-day Technicals

Technical factors (4-hour Chart):
  • The price is above its 50-period EMA and slightly above its 21-period EMA
  • Price is between its middle and top Bollinger band
  • RSI is neutral (58.86)
  • Volume is average
Key levels to the upside          Key levels to the downside

1: $0.657                                   1: $0.625

2: $0.711                                     2: $0.582

3: $0.79                                  3: $0.535


Categories
Crypto Daily Topic

Top Liquidity Pools for Earning on the Go 2020

Liquidity is a crucial aspect of any trade, much less the DeFi trade, which is notoriously volatile. Liquidity is how fast an asset can be converted into cash in the market. In DeFi, liquidity refers to the availability of liquid assets in the market.

DeFi is now booming more than ever before. New projects are being launched nearly every week – with each one bringing closer to the decentralized finance dream for millions across the world. Suffice to say, DeFi is inevitable. As such, it’s important to know the most important concepts of the idea, as well as projects that are helping advance those ideas.

This article talks about liquidity pools and some of the best of them in DeFi in 2020.

What are Liquidity Pools?

In DeFi, liquidity pools are tokens that are locked up in a smart contract. They facilitate efficient trade by providing liquidity and are exploited largely by decentralized exchanges (DEXes) to allow for seamless trade and prevent massive price swings.

Projects like Bancor were the first in the door but were quickly followed up by versions with trendier options such as Uniswap, Balancer, Curve, and so on. Balancer even showed the DeFi world that a liquidity pool could have more than just two assets in a single liquidity pool at any given time.

Liquidity pools eliminate the possibility of manipulation that can occur in centralized order books. They also lower gas fees, leveling the playing field for all participants. Also, liquidity pools allow liquidity providers to earn rewards. As such, liquidity pools are an excellent way to earn passive income.

With that, let’s get to:

Best liquidity pools in 2020

#1. Uniswap

Uniswap is one of the earliest liquidity pools and one of the best in terms of offerings. It’s an Ethereum-based token exchange platform that supports 50% Ethereum contracts and 50% ERC20 contracts. On Uniswap, exchange ETH for any ERC20 token in a peer-to-peer and decentralized fashion. The platform is open-sourced, meaning you can create an exchange pair in a pool of your choice for a token of your choice.

You can deposit crypto and receive a Uniswap token in return. For instance, when you deposit USDT, you’ll receive an equivalent amount in UNI (Uniswap’s native token). A liquidity pool on Uniswap could be yDAI+yUSDT+yTUSD+yGUSD, LGO-WETH, etc.

#2. Curve Finance

Curve finance is a decentralized liquidity pool running on top of Ethereum. Curve also supports stablecoin trading with low slippage. The platform started out without a native cryptocurrency but has just launched one – CRV.

Curve currently supports several pools, including yDAI, yUSDC, and yUSDT. It also supports stablecoin and asset swapping with Compound, PAX, etc.

#3. Balancer

Balancer is a price tracker, liquidity provider, crypto exchange, and decentralized asset manager based on Ethereum. It allows traders to exchange various currencies with minimal slippage. As well, anyone can add liquidity to a customizable pool and earn returns.

Balancer supports up to 8 crypto assets, including USDC, DAI, and ETH. In a Balancer liquidity pool, you can have up to 8 tokens at any time. For example, a pool can have several tokens with their respective percentages adding up to 100%.

#4. Bancor

Bancor is an Ethereum-powered protocol exchange that lets you trade between different cryptocurrencies. Bancor supports pooled liquidity, too, and utilizes an algorithmic market-making mechanism to ensure liquidity and keep an accurate report of crypto prices.

Bancor’s liquidity pool is known as the Bancor relay. The Bancor token is a stablecoin that helps mitigate liquidity volatility. Bancor supports liquidity pooling for the BNT token, ETH, ERC20 tokens, and its stablecoin USDB. Using the BNT token, users can swap tokens between other blockchains.

Currently, the Bancor network supports EOS and Ethereum blockchains but can theoretically be adopted by any open-source application that enables value exchange.

#5. Kyber Network

Kyber is another Ethereum-based liquidity and exchange protocol that allows decentralized applications to provide liquidity for users. The network features an ecosystem of vendors, wallets, and users who can just swipe and instantly send/receive tokens in a single transaction.

Kyber features a native utility token, KNC, which rewards liquidity providers and facilitates the network’s governance. As such, token holders can stake the token to take part in governance and earn crypto.

#6. Convexity Protocol

Convexity is a protocol built atop Ethereum’s blockchain that allows users to deposit liquidity and earn returns. It also provides users with an interactive interface to trade in fungible ERC20 tokenized options known as otokens. Users can create collateralized options contracts and sell them in the form of tokens, therefore earning a premium on their collateral.

#7. ICTE Protocol

ICTE protocol is a liquidity pool and a cross-blockchain inter-exchange protocol. ICTE connects both local and web-based exchanges, intending to solve scalability, security, and custodial issues while offering liquidity solutions to stockholders.

#8. KeeperDAO

KeeperDAO is a DeFi protocol based on Ethereum. It’s an on-chain DeFi underwriter that also acts as a proxy volatility fund. KeeperDAO also provides backstop liquidity to support on-chain lending and synthetic asset protocols. KeeperDAO interacts with other DeFi platforms such as Compound to ensure liquidity providers are rewarded with interest at all times.

Closing Thoughts

Liquidity pools provide much-needed movement in decentralized exchanges, aiding the seamless trading of currencies. They are also one of the many DeFi ways individuals can earn through DeFi. These liquidity pools, and others not on the list, are one step closer to financial autonomy for DeFi fans everywhere.

Categories
Cryptocurrencies

What’s Vite (VITE) All About?

Ethereum introduced smart contracts, and 5 years on, it’s still the premier destination for many developers. This is because the network still wields a lot of clout as the pioneer of the technology. However, the Ethereum network is far from perfect, and it faces some challenges like lack of scalability and higher fees that make things hard for developers. 

Countless crypto projects that aim to provide the same services as Ethereum have surfaced. Many, if not all, claim to fix Ethereum’s mistakes. One of the latest is called Vite, a project that utilizes a Directed Acyclic Graph (DAG) to confront the problems faced by traditional blockchains. 

This article will look at the Vite platform and what it’s really all about. We’ll also discuss where you can purchase the VITE token. 

Breaking Down Vite

Vite is a Directed Acyclic Graph smart contracts’ platform complete with a Snapshot Chain structure to facilitate free transactions and optimize speed, reliability, and security. The Snapchain uses a Delegated Proof of Stake (HDPoS) for network consensus, with supernodes getting rewarded with staking rewards but no transaction fees. 

Vite’s virtual machine is compatible with EVM and uses the Solidity ++ programming language. The network’s native token, VITE, facilitates simple token transactions and smart-contract executions. Instead of gas, users stake in the token to get ‘transaction quota,’ allowing them to carry out transactions. Stakers with unused quotas can lease it to decentralized apps and get tokens in return. The token is also used to vote for block producers. 

Products by Vite 

Vite has rolled out several products, with the most significant ones being a decentralized exchange (ViteX), a payments platform (VitePay), and a platform for blockchain applications (VitePlus). Let’s look at each more closely: 

ViteX: a decentralized exchange (DEX) with an on-chain order book and matching tool. ViteX currently supports over 20 crypto assets, including the most popular ones like Bitcoin and Ethereum.

VitePay: a fast and zero-fee payment solution. Users will pay for products and services via the Vite wallet, while merchants receive payment nearly instantly and with zero fees. VitePay is integrated with the e-commerce platform OpenCart, and you can use it at the official Vite store.

VitePlus: an enterprise blockchain solution for institutional entities. For instance, Vite has created an app known as SyraCoin that rewards city housing fund donors with blockchain-based coupons redeemable for various products/services.

Vite’s Decentralized Exchange (DEX) 

Vite’s decentralized exchange (Vite DEX) is a digital assets trading platform that features the following characteristics: 

#1. True decentralization and high security

Vite’s decentralized exchange realizes transaction matching through blockchain-based smart contracts. Users are in charge of their private keys and hence funds. 

#2. High performance, better trading experience

Vite powers an environment for high transaction throughput with near-instantaneous confirmations and zero transaction fees.

#3. Dividend earnings

ViteX provides many ways to acquire coins, including trading, staking, and listing.

#4. Transparency

Everything is done transparently, from the creation of a token gateway to order book info to token forging.

Community Strategies of Vite

The Vite team will implement several growth strategies, including the following: 

  • Adding more exchange operators to the platform who will autonomously list coins and contribute to the growth of the Vite community
  • Integrate more chains into the Vite wallet
  • Attract non-crypto users after deploying VitePlus
  • Maintain an active online and offline engagement with the community
  • Conduct monthly AMAs for both the technical and non-technical audience

Future strategies include: 

  • Get into commercial partnerships with more crypto-fiat payment processors
  • Deploy a one-step DEX technology that will allow people to create their own decentralized exchanges
  • Attracts more customers by launching more DeFi applications on Vite Wallet. This will provide users with more opportunities to borrow and lend crypto both within and outside the Vite network
  • Launch an Ecosystem Incentive Program that will support developer projects
  • Update the developer toolkit and host both physical and virtual developer conferences
  • Begin a blockchain debate podcast to spread the word on Vite and blockchain in general

Token Supply Distribution

The Vite token was distributed in the following manner: 

  • Private sale tokens: 40.43%
  • Marketing tokens: 10%
  • Ecosystem development tokens: 23.5 7%
  • Team tokens: 20%
  • Airdrop tokens: 5%
  • Advisor tokens: 1%

Vite Token Tokenomics

As of October 22, the VITE token traded at $0.018118, with a market cap of $8,554,358 that placed it at #567 in the market. Its 24-hour volume is $479,370, while its circulating and total supply is 472,148,102 and 1,004,719,212. VITE’s all-time high was $0.0114875 (July 18, 2018), while its all-time low is $0.005328 (March 13, 2020). 

Where to Buy and Store VITE

You can purchase VITE token from any of several reputable exchanges, including Binance, OKEx, HotBit, Bittrex, Bilaxy, and of course, ViteX. The token is listed as a market pair of USDT, BTC, ETH,

Vite provides their official wallet – a decentralized, multi-token wallet available for iOS, Android, Web, Mac, and Windows. 

Categories
Crypto Market Analysis

BTC/USD Weekly Chart Analysis + Possible Outcomes

In this weekly BTC/USD analysis, we will be taking a brief look at the most recent events, current chart technical formations, as well as the possible BTC short-term price outcomes.

Overview

Bitcoin has spent the past week experiencing a long-awaited pullback, after which it started consolidating. The largest cryptocurrency by market cap has dropped significantly and reached as low as $16,200 before bears reached exhaustion after failing to break its all-time high. While some analysts are calling for an end of the pullback, most of the data shows otherwise. First off, the current controversy around China seizing 1% of all Bitcoin is contributing towards the overall bearish sentiment. Second, a poll done on crypto investors says that the majority of investors believe that BTC will end up correcting as much as 40%. All this, plus the fact that Bitcoin couldn’t push past $17,260 for a couple of days now, is a testament to the short-term bearish sentiment.

On the other hand, people shouldn’t mistake this for a long-term bearish trend. In fact, Bitcoin has never been more bullish long-term.

Technical factors


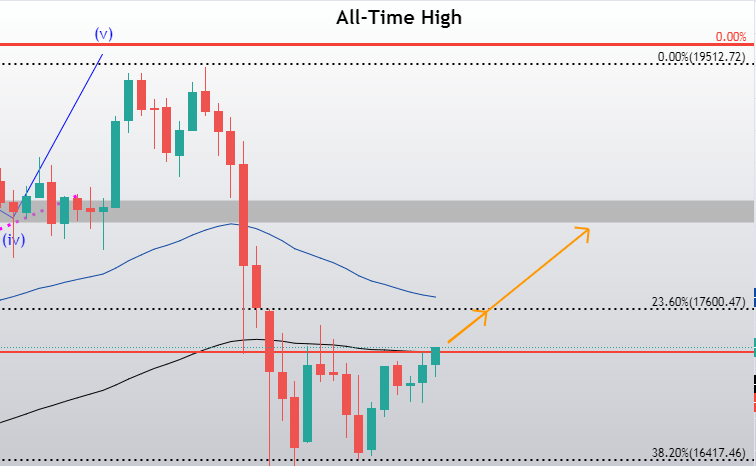
Bitcoin has continued moving up and performed exactly what we called last week (a push towards the all-time high). Once again, as expected, the push didn’t break the all-time high and has triggered a strong pullback. Bears have reached exhaustion at just over $16,000 and Bitcoin has started consolidating in a range, bound by $17,260 (both horizontal resistance and a 100-period moving average) to the upside and $16,420 to the downside.

The hash ribbons indicator still shows a buy/accumulate signal as it points out to miner capitulation.

Likely Outcomes

Bitcoin’s movement is a bit less obvious this week when compared to the past weeks. The cryptocurrency has a couple of scenarios it can play out as it leaves the current range-bound trading.

1: If Bitcoin breaks the range to the downside (slightly less likely), its most likely target will be $15,500. Due to the short-term bearish sentiment surrounding Bitcoin at the moment, a short trade doesn’t have to be considered as “trading against the large trend” and may actually be a good profit-making opportunity.

In this case, a clear stop-loss should be set a little above $16,420.

2: The second (just slightly more likely) scenario happens if Bitcoin manages to break the $17,260 mark. In this case, the cryptocurrency can reach many targets, but will most likely pass the $17,600 immediate resistance and push higher. The next zone of resistance after that is the $18,250-$18,450.

Trading Bitcoin’s sideways action in a current range is not advised as the price could break out of it at any time.

Categories
Crypto Videos

Where Did Bitcoin Go? Wrapped Bitcoin Assets are Encouraging the Supply Crisis!


Where Did Bitcoin Go? Wrapped Bitcoin Assets are Encouraging the Supply Crisis

In a blog post that came out on Nov 20, Binance reintroduced BTCB to the world. BTCB is a wrapped Bitcoin asset intended to bring liquidity from Bitcoin to Binance Smart Chain’s DeFi ecosystem.

However, hodlers may be cheering the reintroduction to BTCB for a completely different reason: each Bitcoin locked on Binance Smart Chain may contribute to an already very present Bitcoin supply crisis.

First announced in 2019, Binance initially saw wrapped Bitcoin only as a vehicle for traders to obtain the cross-chain asset exposure without leaving the Binance Smart Chain. However, since then, the utility of wrapped Bitcoin has expanded due to the maturation of the DeFi sector.

For instance, a wrapped Bitcoin token on Ethereum, or WBTC for short, has enjoyed massive success ever since its January 2019 launch: it’s currently ranked #14 when sorted by market capitalization on Coinmarketcap and has found significant adoption in various protocols such as Aave and Uniswap, whose contracts rank among the top-10 holders of WBTC.

In their blog, Binance noted that the pattern of adoption of WBTC might be seen with BTCB as well. The wrapped Bitcoin could be used for minting various stablecoins with BSC-native protocols such as QIAN and Venus. It could also be used as collateral for lending protocols such as CREAM, as well as in yield farming and liquidity mining protocols such as Bakery, Beefy, and Pancake.

According to what Binance “Proof of Assets” page, there is currently almost 10,000 Bitcoin on BSC — netting to over $181 million. However, the blog post specified that only 2,000 of them are in circulation.

Other smart contract-enabled chains are intending to compound the growing scarcity. If the success of wrapped and cross-chain Bitcoin-based assets continues to grow, institutions that are looking to hoover the Bitcoin supply may as well be faced with mounting scarcity.

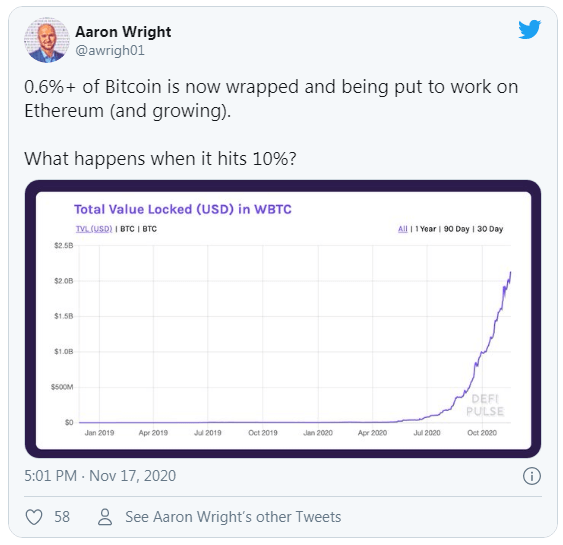
Co-founder of OpenLaw Aaron Wright pointed to such a possible future in his Twitter post, noting that only 0.6% of BTC is now wrapped and being put to Ethereum. 

Categories
Crypto Market Analysis

Daily Crypto Review, Nov 27 – Satoshi Nakamoto Emails Discovered; Crypto Market Consolidating

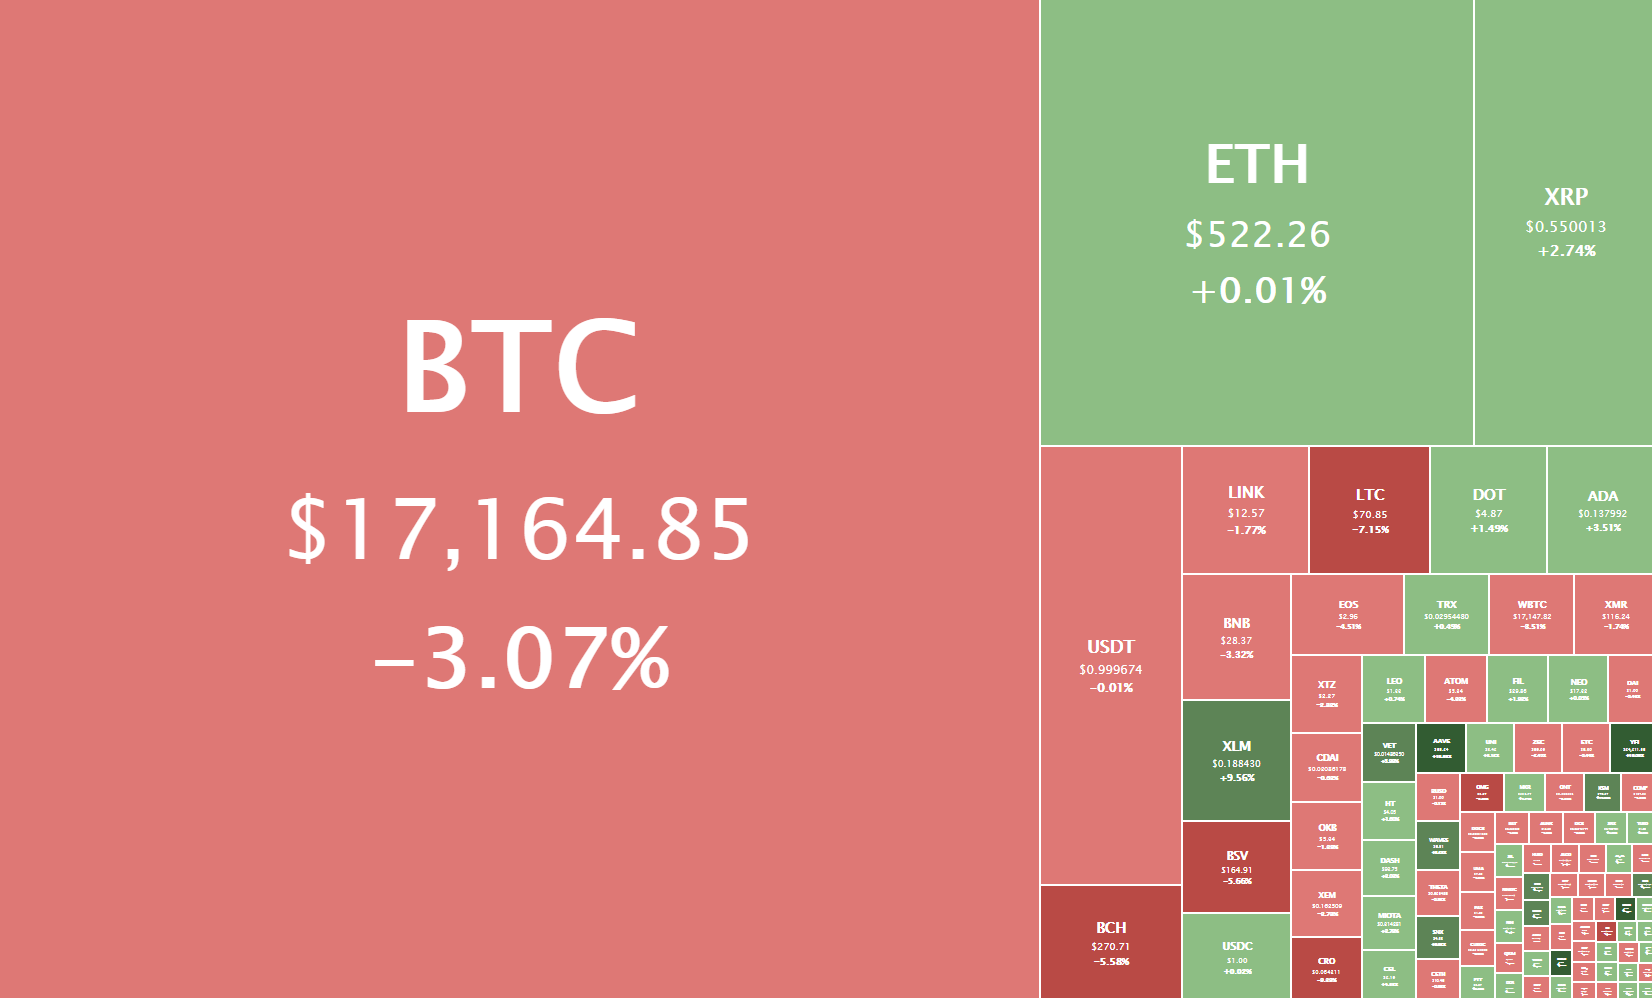
The cryptocurrency sector has started its consolidation period after a bloodbath it experienced yesterday. The largest cryptocurrency by market cap is currently trading for $17,164, representing a decrease of 3.07 % on the day. Meanwhile, Ethereum is gaining 0.01% on the day, while XRP managed to gain 2.47%.

 Daily Crypto Sector Heat Map

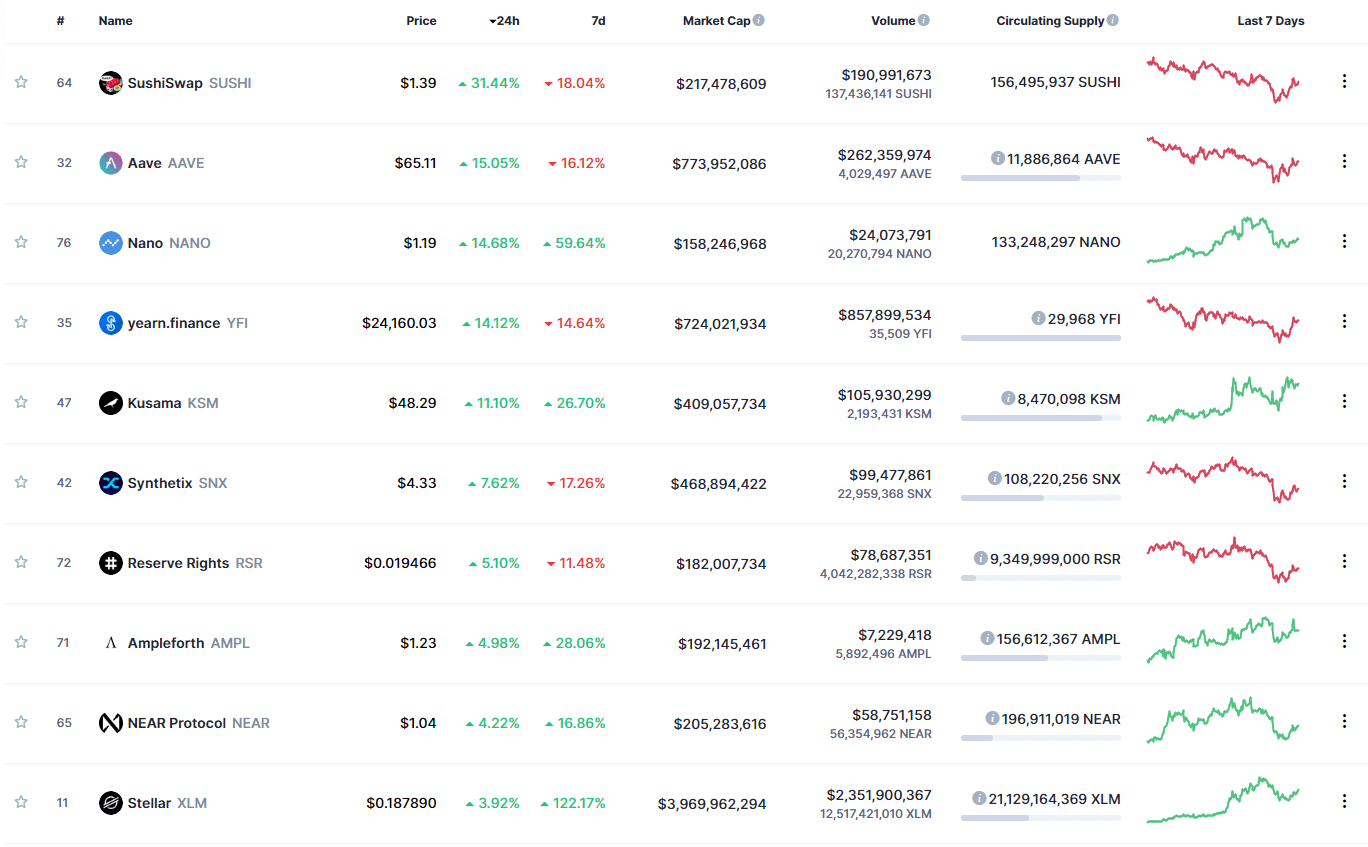
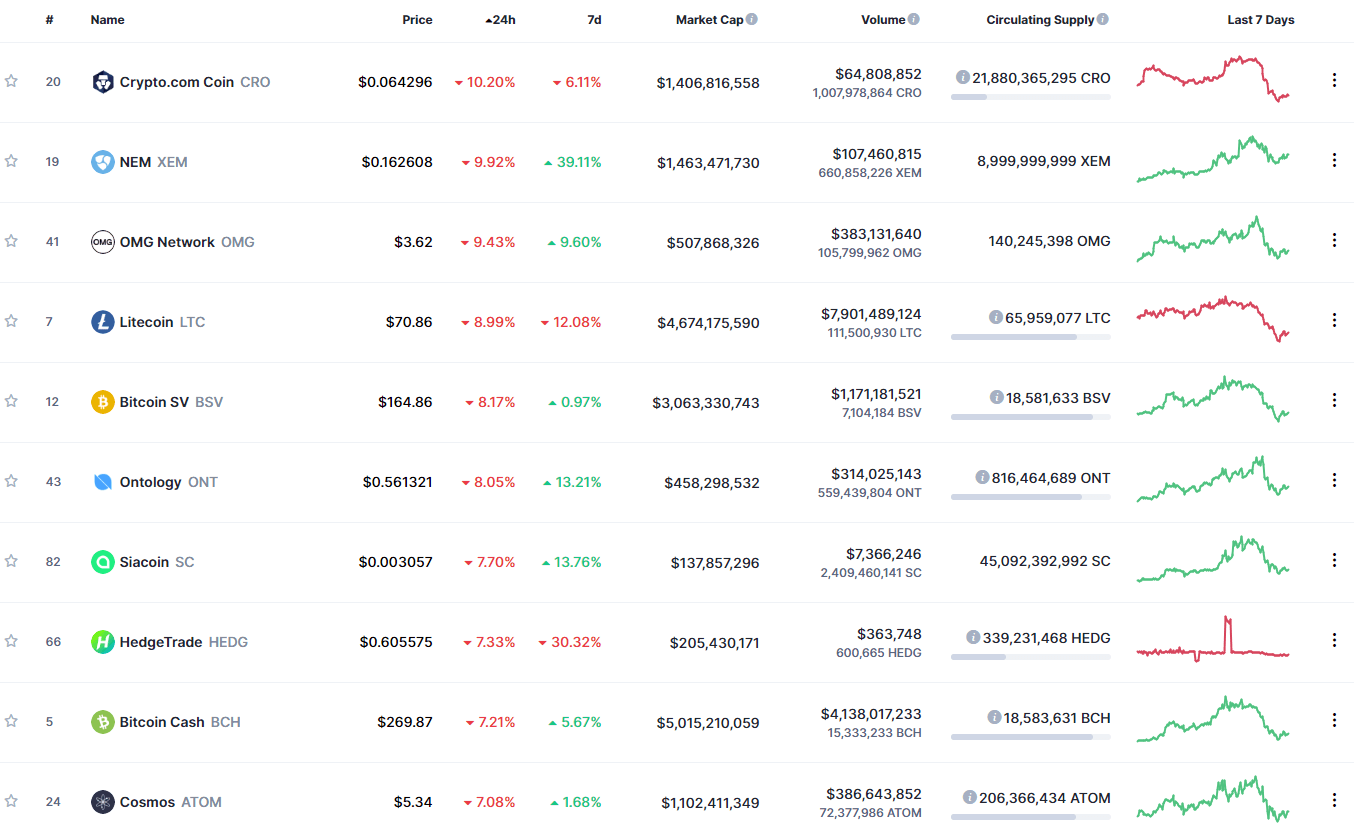
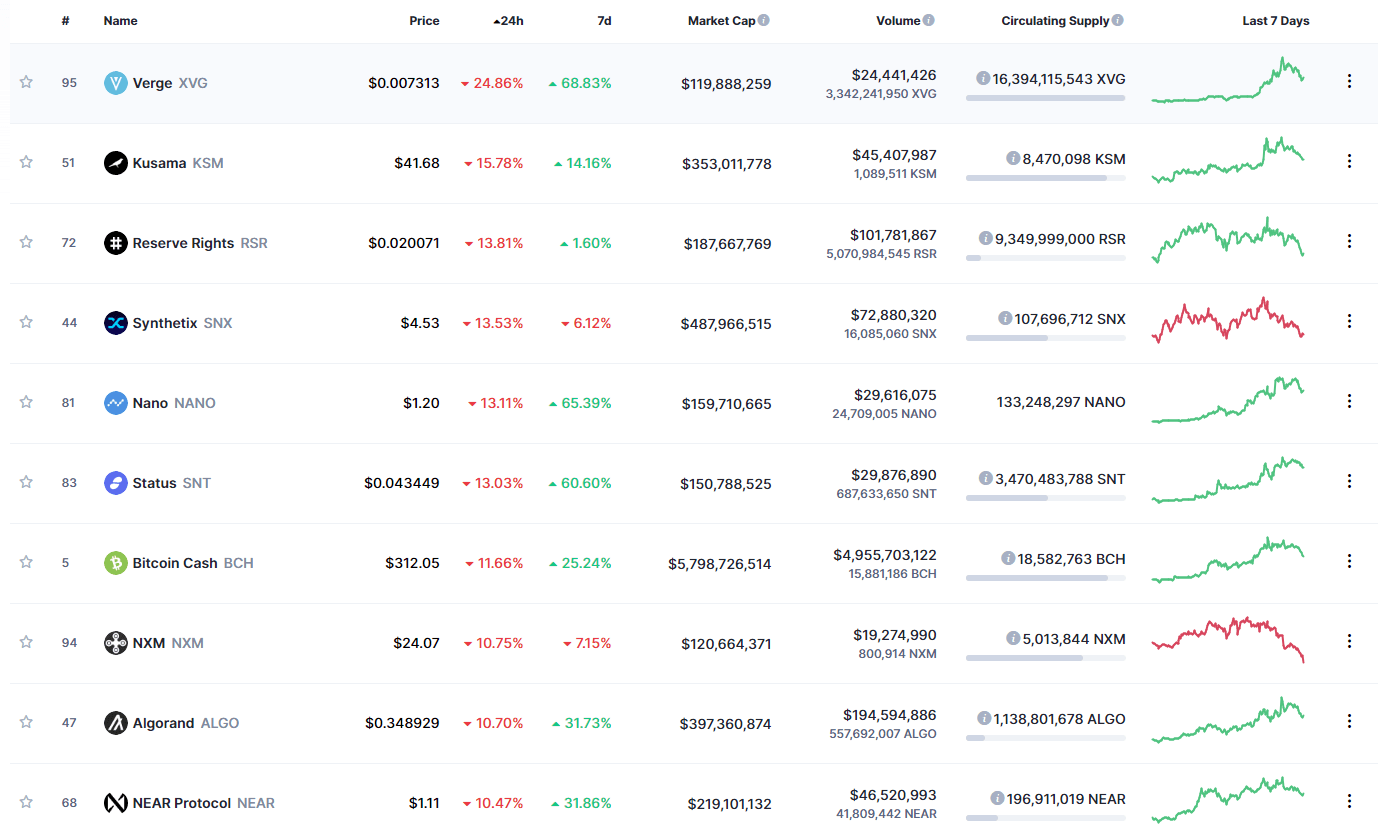
SushiSwap gained 31.44% in the past 24 hours, making it the most prominent daily gainer in the top100. It is closely followed by Aave’s gain of 15.05% and Nano’s 14.68% gain. On the other hand, Crypto.com Coin lost 10.20%, making it the most prominent daily loser. NEM lost 9.92% while OMG Network lost 9.43%, making them the 2nd and 3rd most prominent daily losers.

Top 10 24-hour Performers (Click to enlarge)

Bottom 10 24-hour Performers (Click to enlarge)

Bitcoin’s market dominance has stayed at the same place as yesterday, with its value currently staying at 62.2%. This value represents a 0% difference when compared to the value it had yesterday.

Daily Crypto Market Cap Chart

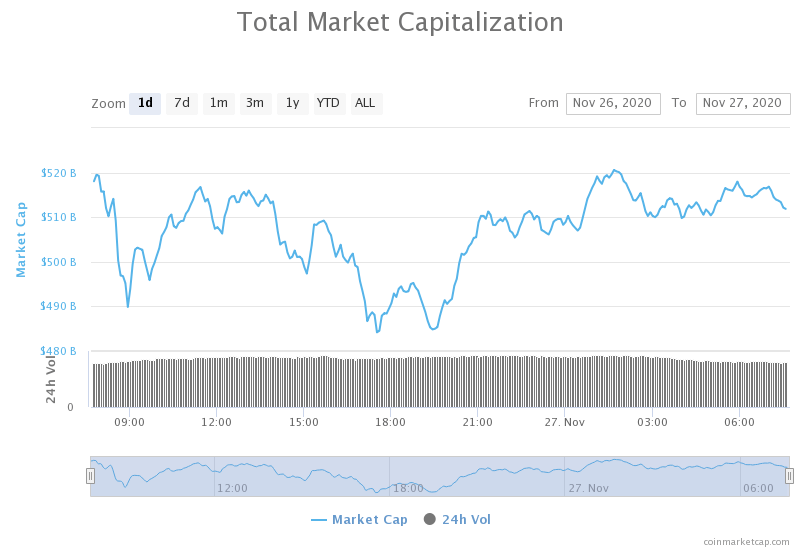
The crypto sector capitalization has decreased significantly over the course of the day. Its current value is $511.86 billion, representing a $48.67 billion decrease compared to our previous report.

_______________________________________________________________________

What happened in the past 24 hours?

_______________________________________________________________________

_______________________________________________________________________

Technical analysis

_______________________________________________________________________

Bitcoin

The largest cryptocurrency by market cap has triggered a rally towards the downside after creating a double top, which brought its price as low as $16,215. While some analysts say that the downturn is not over yet, Bitcoin has recovered slightly and is now consolidating just above the $17,000 mark.

While shorting Bitcoin could be a good profit-making opportunity if the downtrend continues, trading against the long-term trend is very risky. However, thinking about hedging against any downturns should be considered.

BTC/USD 1-hour Chart

Bitcoin’s daily and weekly technicals are tilted towards the buy-side and show no signs of neutrality. On the other hand, its monthly technicals show some signs of neutrality, while its 4-hour technicals are completely bearish.

BTC/USD 1-day Technicals

Technical factors (1-hour Chart):
  • Price is far below its 50-period EMA and at its 21-period EMA
  • Price is at its middle Bollinger band
  • RSI is neutral (44.33)
  • Volume is average
Key levels to the upside          Key levels to the downside

1: $17,450                                 1: $17,000

2: $17,850                                 2: $16,800

3: $18500                                   3: $16,350

Ethereum

Ethereum has experienced the same chain of events Bitcoin did in the past day or so. The downtrend ended up bringing Ethereum’s price back to as low as $480 before recovering. However, Ethereum’s ascending channel (yellow dotted) top line has stayed strong and triggered a mini-rally, which then brought the price above the red ascending line as well. Ethereum is now consolidating at around $515.

Ethereum’s current fundamental outlook is very bullish, but (as we said in our previous articles) any sharp move to the downside triggered by Bitcoin will affect Ethereum in a major way as well. This makes trading up hard, as one needs to constantly check Bitcoin’s price as well.

ETH/USD 1-hour Chart

Ethereum’s daily, weekly, and monthly technicals are completely bullish and show no or just slight neutrality signs. On the other hand, its sentiment seen in the 4-hour time-frame’s is completely bearish.

ETH/USD 1-day Technicals

Technical Factors (4-hour Chart):
  • The price is far below its 50-period and at its 21-period EMA
  • Price is at its middle Bollinger band
  • RSI is neutral (44.53)
  • Volume is average
Key levels to the upside          Key levels to the downside

1: $600                                     1: $510

2: $630                                     2: $500 

3: $735                                      3: $490

Ripple

The fourth-largest cryptocurrency by market cap has posted lower highs three times in a row, with its lows testing the $0.625 support level each time the price went down. However, the third time XRP went towards this level, Bitcoin’s push towards the downside triggered XRP bears, which took over the market. The downturn ended at the $0.475 level, which held up quite nicely. XRP is now trading in the middle of a range, bound by $0.475 to the downside and $0.625 to the upside.

Trading XRP may not be optimal at the moment as trading Bitcoin is both potentially more profitable and a bit more straightforward.

XRP/USD 1-hour Chart

XRP’s technicals on all time-frames are bullish, with its daily time-frame being the only one not showing any signs of neutrality. The other time-frames show either slight neutrality or even slight bearishness.

XRP/USD 1-day Technicals

Technical factors (4-hour Chart):
  • The price is slightly below its 50-period EMA and at its 21-period EMA
  • Price is slightly above its middle Bollinger band
  • RSI is neutral (48.78)
  • Volume is slightly above average
Key levels to the upside          Key levels to the downside

1: $0.625                                   1: $0.475

2: $0.79                                     2: $0.443

3: $0.963                                  3: $0.4


Categories
Crypto Videos

PayPal is the Reason for the Bitcoin shortage!


PayPal is the Reason for the Bitcoin shortage

PayPal’s entry into the cryptocurrency sector could be having a dramatic impact on Bitcoin’s price. In a newly published report posted by crypto investment firm Pantera Capital, the company says that a Bitcoin shortage is the main reason for the current price surge, and that the majority of the newly minted Bitcoin is being scooped up by PayPal. PayPal’s newly announced crypto service is, as Pantera states, “already having a huge impact,” adding that the payment merchant is buying up roughly 70% of all the newly mined Bitcoin.

Citing itBit’s data, Pantera claims that “When PayPal went live, Bitcoin’s volume started exploding. The increase in volume on itBit implies that within just four weeks of going live, PayPal is already buying up almost 70% of the new supply of Bitcoin.” According to Pantera, the data they analyzed suggest that PayPal and Cash App combined are buying up almost all of the newly-issued Bitcoin.


Bitcoin’s monetary policy is programmed in such a way that it is deflationary over time. With the recent widescale adoption, that would lead to higher purchasing power as well as supply scarcity. Pantera claims that it is exactly the supply scarcity that is contributing to Bitcoin’s parabolic surge.


PayPal has launched its crypto trading services in the US earlier this month, allowing its customers to trade up to $20,000 per week. The platform will expand its services out globally in early 2021. The online payment merchant currently has 300 million active users, which makes it dipping its toes into the crypto sector is a major stepping stone for adoption.

Pantera added that it’s a lot easier to purchase Bitcoin now than during the previous bull market in 2017. In addition to PayPal, the retail sector can now step into Bitcoin and other cryptocurrencies by using Cash App and Robinhood.


Wider adoption certainly means that the father of digital currencies is more likely to see higher price levels. Although Bitcoin remains extremely volatile, it showed the market that it could endure an unusually long period of stability by consolidating for over two months before breaking the sideways trading period and pushing towards the upside.


Categories
Crypto Videos

Retire by Holding Bitcoin – Crypto Retirement Plans Now Available in the US! 401k


Retire by Holding Bitcoin – Crypto Retirement Plans Now Available in the US

A US-based asset manager called Digital Asset Investment Management has launched the country’s first-ever employer-sponsored 401K retirement plans that support Bitcoin. According to a November 19 announcement, DAiM will now serve as the advisor and fiduciary in helping companies “create their employees’ 401K plan that offers several recommended model portfolios that vary in risk to traditional assets as well as the allocation of up to 10% to Bitcoin.”
The Bitcoin will be held in cold storage by Gemini Trust, which will allow DAiM to transfer Bitcoin to former employees that have left participating companies and are not under DAiM’s jurisdiction anymore. DAiM’s crypto-friendly plans are fully compliant with the Employee Retirement Income Security Act of 1974, and will start being offered by employers starting 2021.

While US citizens have been able to include cryptocurrencies in their individual retirement accounts, called 401K rollovers, and brokerage accounts since the IRS began taxing Bitcoin in 2018, DAiM COO Adam Pokornicky stated that “It’s been impossible to offer Bitcoin inside actual company-based plans up until now.”

“The difference is, while you could take an old 401K plan and convert it to an IRA after leaving a job or employer to invest in Bitcoin, it’s actually never been possible to invest in Bitcoin while still working at a company without taking any sort of penalty or quitting your job.”


Pokornicky stated that the traditional wealth management industries have been “slow to adapt and warm up to Bitcoin,” noting that there are “barely any investment advisors that offer licensed and regulated access to Bitcoin directly in retirement and brokerage accounts.” He attributes the sector’s refraining from having a “serious regulatory red tape” surrounding crypto compliance, stressing that it took “close to a full year of building” before DAiM was approved to offer the aforementioned employer-sponsored services:

“As an advisor, you can’t just go and start managing and advising for Bitcoin and crypto because you want to. There’s an enormous amount of both work and compliance that needs to be done prior to doing that, and in order to develop operational frameworks, strategic partnerships and infrastructure that need to be put together to be compliant in every state you operate.”

Pokornicky also noted the “booming” demand for retirement investments in Bitcoin, stating that he’s seen most demand from individuals aging between 28–45.


Categories
Crypto Daily Topic

Best DeFi Podcasts for 2020

Podcasts have exploded in recent years. As a medium, they provide a platform to discuss ideas in a relaxed and open setting. And frankly, most people would rather listen or watch interesting audio or video than read a lengthy 10k word article. Another emerging topic of interest is DeFi, short for decentralized finance. Podcasting and DeFi meet at an interesting intersection in modern times, and that’s why DeFi experts are using them to connect with a curious base. 

This article brings you the best DeFi podcasts for 2020, so you can never miss what’s trending. Whether you want bite-sized chunks to introduce you to the world of DeFi or the technical stuff, this article highlights the top podcasts for just that. 

#1. Into the Ether 

This is an official podcast of ETHHub, and it focuses on the Ethereum ecosystem with the show run by Gnosis Product Manager Eric Conner and Set Protocol Product Marketer Anthony Sassano. 

The podcast is produced weekly, alongside a newsletter and a repository of documentation to increase awareness on Ethereum and Ethereum protocols.

So far, the podcast has compiled more than 100 episodes on all matters Ethereum, including Ethereum-based applications, protocol upgrades, news, and current issues affecting the Ethereum community. 

#2. Unchained and Unconfirmed

Unchained and Unconfirmed is a DeFi podcast hosted by crypto and blockchain journalist and former Forbes editor Laura Shin. Podcast offers weekly insights into current trends in crypto and DeFi as well as personalities in the space that are making headlines. 

Shin has hosted Unchained since 2016. The show features hour-long interviews with prominent personalities in blockchain and DeFi. Unconfirmed constitutes 20 minutes conversations with industry experts on newsworthy events and begun in 2018. 

#3. The Global Crypto Podcast

This podcast is hosted by James Preston, Marc Forrest, and Shaun Ritson. The team aims to be the leading source of credible DeFi news and information in South Africa, and they hope to do so with a “South African” flavor. 

The show features conversations and interviews with notable figures in the industry with the goal of informing people of the power and potential of decentralized finance and technology. New episodes are released weekly on Mondays, 6 pm (UTC).

#4. The Ethereal Podcast

The Ethereal podcast is part of the Ethereal Summit, an initiative by several DeFi technologists, entrepreneurs, and investors engaging with Ethereum and its latest developments. The Ethereal team wants to inspire a “decentralized future.” 

Hosted by @DeFi_Dad, the Ethereal podcast features interviews with various DeFi builders, as well as leaders of DeFi outfits such as MakerDAO, Nexus Mutual, SKALE, and so on. The goal is to get these figures to give first-hand insights into the challenges involved in building DeFi solutions and decentralized techs. 

#5. Abel’s Abstracts 

Hosted by ETHGlobal organizer Abel Tedros, Abel’s Abstracts focuses on conversations with various builders of Web 3.0 and DeFi solutions and updates on DeFi-specific issues and global topics like covid-19 and how they are affecting financial markets.

#6. Chain Reaction

This is a podcast by Delphi Digital co-founders Tom Shaughnessy and Kevin Kelly. Chain Reaction aims to focus on research on economic, legal, and technical issues affecting the evolvement of decentralized finance and distributed ledger technologies. 

Delphi Digital independent research and consultancy on the crypto market, and this expertise shines through on the podcast as the team explores the work of various players in the DeFi space, such as founders, investors, etc. 

#7. Zero-Knowledge

The Zero Knowledge podcast is run by Videopath and zkSummit co-founder Anna Rose and Fredrik Harryson of Parity Core. The podcast focuses on interviews with zero knowledge experts and its relation to the decentralized web and DeFi.

Research on zero-knowledge proofs is key to cryptography, enabling individuals to transact on blockchain networks privately and securely. The podcast has so far had more than 130 episodes, including interviews with tens of DeFi builders.

#8. Blockcrunch

Launched in February 2018, this is a weekly podcast featuring Spartan Capital Head Of Research Jason Choi, with a focus on providing investors in blockchain and DeFi with relevant information. 

Choi explores a rich variety of topics, including investment research, DeFi startups, exchanges, hedge funds, and generally the crypto market landscape. 

#9. Epicenter

Epicenter is one of the earliest DeFi podcasts – having come into the space in 2013. Indeed, the podcast helped popularize the term “DeFi.” 

Epicenter hosts include Adam B. Levine of Let’s Talk Bitcoin Podcast, Sebastian Couture, Brian Fabian Crain, Chorus One co-founder Meher Roy, Cosmos Research founder Sunny Aggarwal, and Gnosis COO Friederike Ernst. 

So far, the podcast has 350 plus episodes in its catalog, which includes interviews with developers and builders across the DeFi spectrum.

Final Remarks

The DeFi space is relatively new and can be baffling, especially to newcomers. Whether you’re a beginner or a longtimer in the DeFi space, you’ll find that these podcasts are definitely worth checking out. 

Categories
Crypto Market Analysis

Daily Crypto Review, Nov 26 – Bitcoin’s “Flash Crash” Pulls Price Below $18,000; Blood on the Crypto Streets

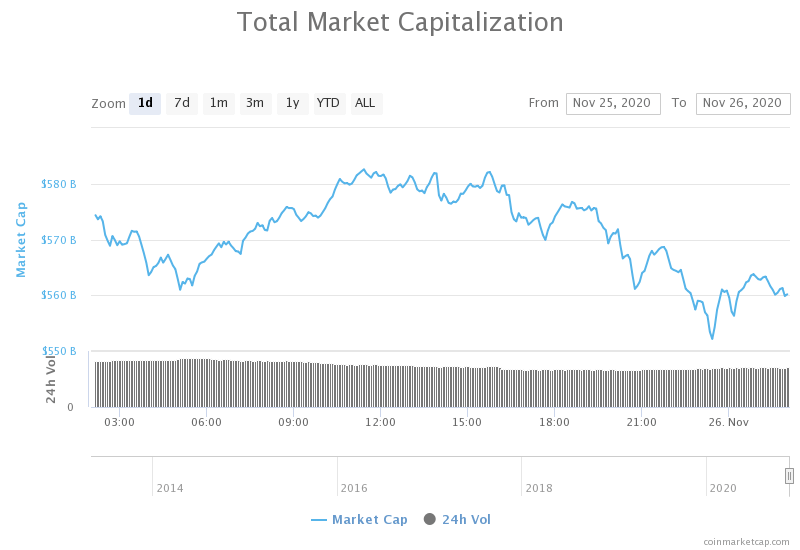
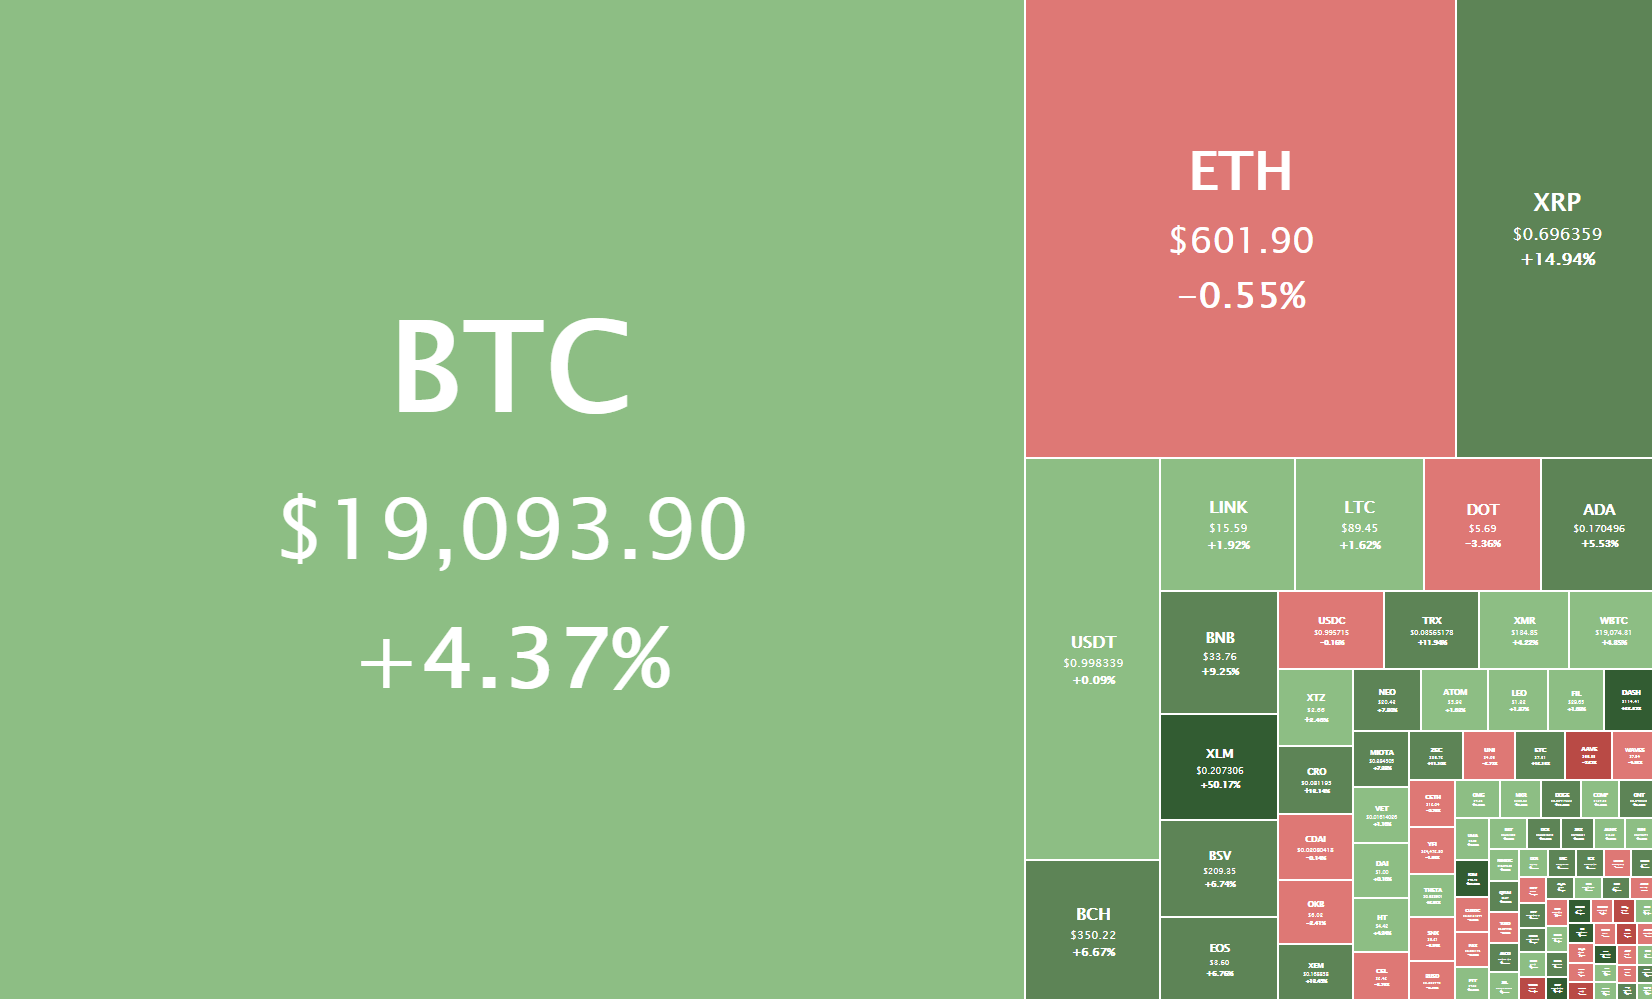
The cryptocurrency sector has ended the day in the red as Bitcoin failed to stay above $19,000 and even falling below $18,000 as bears took control of the market. The largest cryptocurrency by market cap is currently trading for $17,000, representing a decrease of 10.67%% on the day. Meanwhile, Ethereum is losing 15.34% on the day, while XRP lost 16.88%.

 Daily Crypto Sector Heat Map

Zilliqa 23.75% in the past 24 hours, making it the most prominent daily gainer in the top100. It is closely followed by Horizen’s gain of 18.71% and Elrond’s 11.54% gain. On the other hand, Verge lost 24.86%, making it the most prominent daily loser. Kusama lost 15.78% while Reserve Rights lost 13.81%, making them the 2nd and 3rd most prominent daily losers.


Top 10 24-hour Performers (Click to enlarge)

Bottom 10 24-hour Performers (Click to enlarge)

Bitcoin’s market dominance has increased over the day, with its value currently staying at 62.2%. This value represents a 0.6% difference to the upside compared to the value it had yesterday.

Daily Crypto Market Cap Chart

The crypto sector capitalization has decreased over the course of the day. Its current value is $560.17 billion, representing an $11.36 billion decrease compared to our previous report.

_______________________________________________________________________

What happened in the past 24 hours?

_______________________________________________________________________

_______________________________________________________________________

Technical analysis

_______________________________________________________________________

Bitcoin

The largest cryptocurrency by market cap has created a double top, which triggered a pullback from the recent highs. Not only has the price retraced to the sub-$19,000 level, but it has also broken the $18,500 support level. The price will most likely end up below the $17,850 level, as the market is calling for a pullback for quite some time. However, if the market recovers, we can expect the price to end up between $17,850 and $18,500.

While shorting Bitcoin might be a good profit-making opportunity at the moment, trading against the long-term trend is extremely risky. However, thinking about hedging versus any downturns might be a good option at the moment.

BTC/USD 1-hour Chart

Bitcoin’s 4-hour, daily, and weekly technicals are heavily tilted towards the buy-side and show no signs of neutrality or bearishness. On the other hand, its monthly technicals are showing some signs of neutrality.

BTC/USD 1-day Technicals

Technical factors (1-hour Chart):
  • Price is far below its 50-period EMA and its 21-period EMA
  • Price slightly below its lower Bollinger band
  • RSI is extremely oversold (23.98)
  • Volume is average (one candle spike)
Key levels to the upside          Key levels to the downside

1: $18500                                  1: $17,850

2: $19000                                  2: $17,450

3: $19500                                   3: $17,000

Ethereum

While Ethereum did follow Bitcoin to the downside, both in price direction and severity of the move, the situation doesn’t look that bad. The second-largest cryptocurrency by market cap has started its pullback after failing to stay above $600, culminating in a full-blown dump from $570 to $505. However, the ascending (red) line held up, and ETH reclaimed previous levels and is currently consolidating around $530.

Ethereum’s current outlook is very bullish, but any sharp move to the downside coming from Bitcoin will affect it in a major way. Traders should pay close attention to Bitcoin’s moves if they want to trade Ether.

ETH/USD 1-hour Chart

Ethereum’s technicals are a bit confusing, as its daily and monthly overviews are completely bullish, while its weekly overview shows slight signs of neutrality. Its 4-hour technicals, however, are pointing towards the sell-side.

ETH/USD 1-day Technicals

Technical Factors (4-hour Chart):
  • The price is below both its 50-period and its 21-period EMA
  • Price is below its bottom Bollinger band
  • RSI is extremely oversold (19.47)
  • Volume is above average
Key levels to the upside          Key levels to the downside

1: $600                                     1: $510

2: $630                                     2: $500 

3: $735                                      3: $490

Ripple

The fourth-largest cryptocurrency by market cap has performed similarly to the aforementioned two cryptocurrencies. XRP has posted lower highs three times in a row while testing the $0.625 support level each time. However, the last time XRP went towards this level, bears took over and pushed the price further down. XRP bears have seemingly reached exhaustion, and the cryptocurrency is now consolidating around the $0.575 level.

Trading XRP is not advised as trading Bitcoin is (at the moment) both potentially more profitable and more straightforward.

XRP/USD 1-hour Chart

XRP’s technicals on all time-frames are tilted towards the buy-side, with its daily overview being the most bullish time-frame. Its other time-frames show signs of neutrality or even slight bearishness.

XRP/USD 1-day Technicals

Technical factors (4-hour Chart):
  • The price is far below both its 50-period EMA and its 21-period EMA
  • Price is slightly below its bottom Bollinger band
  • RSI is close to being oversold (31.85)
  • Volume is above average
Key levels to the upside          Key levels to the downside

1: $0.625                                   1: $0.475

2: $0.79                                     2: $0.443

3: $0.963                                  3: $0.4


Categories
Crypto Daily Topic Cryptocurrencies

Should You Buy Bitcoin If The Fed Releases Stimulus?

The covid-19 pandemic has put a lot of pressure on economies. Nearly every region has recorded an economic slowdown since authorities began restricting the movement of people. Some governments have tried to rescue their economies from drowning, while others have done nothing. But the US government has been contemplating a stimulus package after it became clear that the central bank is running out of options.

The release of a stimulus package will invariably affect the economy. By extension, activity in the crypto space will be shaken. Washington has delayed the release of stimulus, but this fiscal intervention seems inevitable in the long run. When that happens, will it be our cue to buy crypto? Well, read on to find out.

How Stimulus Works

During an economic slowdown, such as the one being experienced due to the current pandemic, one of the biggest challenges the economy faces is a restricted cash flow. As people are cash-constrained, the volume of money exchanging hands declines. Since the beginning of the pandemic, there has been a coin shortage in the US. 

A fiscal stimulus can be achieved by having the government cut taxes or increase its spending. When taxes are reduced, people will have more disposable income, and this will encourage spending. In the latter case, an increase in government spending will inject more money into the economy, thereby bringing down the unemployment rate. In either case, the idea is to increase the motivation for spending and reduce the motivation for saving. 

When people are motivated to spend, currency deflation may result because people have money but do not produce more goods and services. The proposed $6 trillion stimulus is over 40 times Bitcoin’s market capitalization. One can only imagine how disruptive releasing this money can be. As we shall see later, the package will impact bitcoin and other cryptos in different ways.

The Case for/against Stimulus

The Fed has so far tried a range of options for keeping the economy afloat, including intervening in the stock markets and dishing out stipends to low income-earning Americans. Economists usually differ on the idea of meddling with the economy. One side of the table argues for a free-market approach, while others argue that government intervention at the right time is usually the best way out.

The problem with the stimulus is that it increases the country’s debt-to-GDP ratio. As will be explained later, people are getting money for work they have not done. This is essentially like borrowing money from the future. Technicalities aside, the issuance of stimulus introduces people’s risk of not using the money for the intended purpose. Beneficiaries can hoard the money in fear of economic uncertainty. This will keep the economy under strain, making crypto appear as the more attractive alternative. 

The other possibility is binge spending – yes, people tend to spend recklessly in times of inflation. This phenomenon typically results in even more inflation. The outcome? More people flock to crypto, which at such times seems immune to currency deflation.  

Impact on Bitcoin/ Cryptocurrencies

#1: Increased Spending on Bitcoin

There is a possibility that when the Fed releases the $1,200 checks, many will spend the money on buying Bitcoin. When the government started rolling out the coronavirus stimulus checks, it was reported that people were putting the money into waggish uses, including the purchase of tigers, guns, and Bitcoin. Judging from sentiments expressed on Twitter shortly after the announcement, Americans were eager to spend the money on non-essentials. 

One Twitter poll sought to know how many would spend their checks specifically on Bitcoin, and a whole 52% of those who qualified for the package said they were going to spend all of it on Bitcoin. The bottom line is that people spent their checks on Bitcoin, and they will do it again. If this happens, Bitcoin trading volume will increase, which will likely trigger a jump in the already-increasing BTC prices. Think about it.

#2: Devaluation of the USD

Stimulating the economy by giving people money will likely cause the USD to lose value and start fetching less on the forex market. This is because you are basically giving people money for work they have not done. Then, there is a (controversial) perception that Bitcoin and crypto, in general, is a haven for assets in times of economic crises. When these two theories are brought together, an influx in Bitcoin investment is very much conceivable. 

You see, investors holding their savings in dollars fear that a devaluation of the currency (in this case, as a result of releasing stimulus) might cause them to lose a significant portion of their savings. On the other hand, Bitcoin is flourishing in the bull market. So, it is only natural for investors to turn to Bitcoin if this money is released to Americans. A likely outcome in such a case is growth in Bitcoin’s demand, which means increasing prices.

Bitcoin’s Advantages (Amid this Crisis)

#1: It’s Not Even the Value, It’s Decentralization 

Bitcoin has a huge advantage over the USD in this crisis, and that’s the fact that it is decentralized. Unlike the dollar, they can’t just print more Bitcoin. This feature guarantees its investors that the risk of artificial deflation is minimized. Of course, there can be no guarantee that crypto will not see the bear run as long as the Fed keeps pumping dollars into the economy, but what are the chances?

#2: As We Speak, Bitcoin is on the Bull Run

Decentralization is great, but we can’t ignore the fact that Bitcoin is currently recording unusually impressive performance. As an investor looking for alternatives to the dollar, which is at risk of deflation, Bitcoin must not be far from mind. The way out can only be crypto since the stocks are not an option. Although share prices may see a decline if inflation indeed kicks in, it’s not a good idea to invest during the bear run. So, it looks like Bitcoin carries the day.

Final Thoughts

The coronavirus pandemic has brought with it an economic meltdown. The Fed has instituted several measures to counter the strain the economy has endured. Plans to release stimulus are before decision-makers now. This move may help relieve economic strain temporarily. However, it is likely to result in inflation. In such a case, investors might flock to Bitcoin to avoid losing their assets. If this happens, Bitcoin might become stronger, and investors’ margins will rise. In short, if the Fed releases stimulus, we could consider it our cue for buying Bitcoin. 

Categories
Crypto Market Analysis

Daily Crypto Review, Nov 25 – Bitcoin Above $19,000: What’s Next?

The cryptocurrency sector has spent the day pushing towards the upside as Bitcoin rallied and reached past $19,000. The largest cryptocurrency by market cap is currently trading for $19,093, representing an increase of 4.37% on the day. Meanwhile, Ethereum lost 0.55% on the day, while XRP gained 14.94%.

 Daily Crypto Sector Heat Map

Verge 63.06% in the past 24 hours, making it the most prominent daily gainer in the top100. It is closely followed by Stellar’s gain of 59.30% and Status’s 31.14% gain. On the other hand, Bitcoin Gold lost 16.21%, making it the most prominent daily loser. SushiSwap lost 12.05% while Balancer lost 7.89%, making them the 2nd and 3rd most prominent daily losers.

Top 10 24-hour Performers (Click to enlarge)

Bottom 10 24-hour Performers (Click to enlarge)

Bitcoin’s market dominance has increased over the course of the day, with its value is currently staying at 61.06%. This value represents a 1% difference to the upside compared to the value it had yesterday.

Daily Crypto Market Cap Chart

The crypto sector capitalization has increased slightly over the course of the day. Its current value is $571.53 billion, representing an $8.86 billion increase compared to our previous report.

_______________________________________________________________________

What happened in the past 24 hours?

_______________________________________________________________________

_______________________________________________________________________

Technical analysis

_______________________________________________________________________

Bitcoin

The largest cryptocurrency by market cap has had an exciting day as its price reached past the $18,500 mark and pushed towards its all-time highs. Bitcoin managed to get to $19,450 before the momentum started dying off. It is currently consolidating just at the $19,000 mark, fighting to stay above it. This move was enabled by a booming altcoin situation, which led to a money pour-over into Bitcoin.

Any trading to the downside is completely irresponsible now due to how Bitcoin is moving. On the other hand, its movement towards the upside is very hectic, and traders should pay attention to when they enter and exit trades. If Bitcoin establishes its presence above the $19,000 mark with confidence, another push that might break the $20,000 all-time high level is entirely possible.

BTC/USD 2-hour Chart

Bitcoin’s technicals are tilted to the bull-side slightly, with only the weekly time-frame being completely bullish. In contrast, its other time-frames contain a hint of neutrality or even bearishness.

BTC/USD 1-day Technicals

Technical factors (4-hour Chart):
  • Price is above its 50-period EMA and at its 21-period EMA
  • Price slightly above its middle Bollinger band
  • RSI is neutral (55.57)
  • Volume is average
Key levels to the upside          Key levels to the downside

1: $19000                                  1: $18500

2: $19500                                  2: $17,850

3: $19,666                                  3: $17,450

Ethereum

Ethereum’s parabolic move, which brought its price from $480 to $625, has seemingly ended, and Ethereum has entered a consolidation/retracement phase. While it was uncertain whether the second-largest cryptocurrency by market cap will stay above $600, the fight for the level has ended, and ETH moved back below it.

Ethereum has a very strong zone of resistance above $600 and all the way up to $632. On the other hand, it has a decently strong support zone at $575-$580. We can expect Ethereum to move in that range in the short-term unless a new breakout occurs.


ETH/USD 2-hour Chart

Ethereum’s technicals are tilted to the bull-side slightly, with only the monthly time-frame being completely bullish. In contrast, its other time-frames contain slight neutrality or even bearishness.

ETH/USD 1-day Technicals

Technical Factors (4-hour Chart):
  • The price is above its 50-period and slightly below its 21-period EMA
  • Price is near its bottom Bollinger band
  • RSI is neutral (50.82)
  • Volume is above average
Key levels to the upside          Key levels to the downside

1: $600                                     1: $510

2: $630                                     2: $500 

3: $735                                      3: $490

Ripple

The fourth-largest cryptocurrency by market cap’s controversial parabolic rise has died down and actually kept most of its gains. XRP has moved back from its recent highs of $0.78 (and even $0.9 on some exchanges) to a steadier $0.68, which is its current price. We can also see that XRP made a double top at the $0.735 mark, as well as a double bottom at the $0.625 support level.

Trading XRP is more manageable now as the volatility has died down, and the zones of support/resistance have been established. However, trading crypto overall is extremely risky at the moment, and only moves to the upside (and possibly sideways movement) should be traded.

XRP/USD 2-hour Chart

XRP’s 4-hour and daily overviews are completely bullish and show no signs of neutrality whatsoever, while its weekly and monthly overviews show slight neutrality or even a hint of bearishness.

XRP/USD 1-day Technicals

Technical factors (4-hour Chart):
  • The price is far above its 50-period EMA and slightly above its 21-period EMA
  • Price is slightly above its middle Bollinger band
  • RSI is neutral (59.98)
  • Volume is above average
Key levels to the upside          Key levels to the downside

1: $0.79                                     1: $0.625 

2: $0.963                                   2: $0.475

3: $1.01                                    3: $0.443


Categories
Crypto Daily Topic Cryptocurrencies

Can WazirX (WRX) be the Queen of Exchanges?

While it may appear as though crypto has received a lot of support and adoption, the reality is that penetration is yet to even go beyond 1%. The reasons for this are the massive obstacles standing between Fiat and crypto, such as high fees, complex procedures, regulatory hurdles, etc. Also, existing on-ramp solutions grapple with high deposit and withdrawal fees, delays, and users not truly owning their own money. 

WazirX is a decentralized crypto exchange that wants to solve these and more problems to provide users with the means to adopt cryptocurrency. Based in India and acquired by Binance, the platform’s name, Wazir, is another name for the “queen” in chess. The queen piece can not only play any move; it’s also the strongest. WazirX wants to live up to these characteristics. 

What’s WazirX? 

Launched in 2018, WazirX is a crypto exchange with advanced buy, sell, and trade functionalities. It features a live and open order book on which users can trade over 80 crypto assets, including Bitcoin, Litecoin, BNB, Dash, and more. 

On WazirX, you can also deposit or withdraw crypto and cash in or cash out stablecoins such as USDT in a fast, secure, and peer-to-peer manner. WazirX’s goal is to bridge the chasm between Fiat and crypto. 

WRX’s native token is the backbone of the ecosystem and has several use cases, including trading fee discounts, participation rewards, payment for margin fees, and more. WazirX supports five platforms at the time of writing: Web, Android, iOS, Windows, and Mac.

History of WazirX

The WazirX team launched the platform to respond to the Indian government’s banning of crypto businesses, exchanges, and shops. Banks had also been banned from engaging in any crypto-related activities. 

Today, the platform is, first and foremost, the go-to platform for Indian users to trade in crypto – in an uncensorable manner. But that’s not where the team is stopping. They intend to take the WazirX proposition to more developing and underdeveloped countries for Fiat on-ramp solutions. 

Binance acquired WazirX in November 2019. However, it continues to operate independently with a focus on peer-to-peer crypto trading. The WazirX team shares a vision with Binance, and that’s to increase the freedom of money around the world and improve people’s lives. 

How Does WazirX Realize Security? 

The WazirX team ensures security for the network through the following actions: 

  • Majority of funds kept in cold storage
  • A muti-sig wallet system
  • Two-factor authentication system for transactions
  • Strong KYC/AML procedures
  • Regular security audits

WRX Value 

WRX token holders will receive perks, including but not limited to discounts in payment of fees. The discount structure is as follows: 

  • 1st year: 50% trading fee discount
  • 2nd year: 25% trading fee discount
  • 3rd year: 12.5% trading fee discount
  • 4th year: 6.25% trading fee discount

Users will also earn participation rewards for performing P2P trades. Also, token holders will have voting power to determine issues such as future listings, update releases, etc. 

WazirX will burn 10% off WRX tokens every quarter based on the trading volume. In the end, about 100 million tokens will be burned – in a bid to prevent the token from overflooding the market. 

Who’s on the WazirX Team?

WazirX is the brainchild of a core team of members. We have founder and CEO Nischal Shetty, who is also the founder of Crowdfire and is an awardee of Forbes 30 under 30. 

Co-founder and CTO is also a co-founder of Crowdfire Sameer Mhatre is a full-stack developer and designer. He describes himself as “a huge Java and JS fan.” 

Co-founder and COO Siddharth Menon also co-founded Crowdfire. He’s also the founder of 3Crumbs, one of the early mobile startups in India. 

Community Growth Strategies of WazirX 

The WazirX team intends to implement several community growth strategies in a bid to expand the growth of the network. Current strategies include: 

  • Innovative participation reward programs, e.g., the WRX Trade Mining program
  • Publish media content including guest posts and features
  • Conduct AMAs and both virtual and physical conferences
  • Conduct interviews with influencers
  • Release progress updates every month
  • Headline events and partner with industry influencers

Future strategies include: 

  • Create dedicated Telegram channels for various countries
  • Headline and participate in more events such as meetups and conferences to grow further its offline presence
  • Continue to innovate with rewards programs
  • Collaborate with various wallets and decentralized finance apps to explore Fiat gateway solutions

WRX: Token Supply Distribution 

The ERX token was distributed in the following manner: 

  • Launchpad sale tokens: 10%
  • Private sale tokens: 5%
  • Foundation tokens: 30%
  • Product and marketing tokens: 20%
  • Partnership and ecosystem tokens: 20%
  • WRX Airdrop tokens: 11.10 percent
  • WRX trade mining tokens: 3.90%

How’s the WazirX Token Doing in the Market? 

As of October 31, 2020, WRX traded at $0.088615 with a market cap of $20,718,698 that placed it at #323 in the market. The token had a 24-hour volume of $8,866,743 and a circulating and total supply of 233,817,289 and 995,833,334. WRX has an all-time high of $0.229263 (Mar 07, 2020) and an all-time low of $0.055241 (Mar 13, 2020). 

Where to Buy WRX

You’ll find WRX listed as a market pair of USDT, BTC, BUSD, BNB, TRX, and more in several exchanges. They include but are not limited to WazirX, Binance, BinanceDEX, Bilaxy, Sistemkoin, BiKi, Poloniex, FTX, and Bitsonic. 

Final Thoughts

WazirX is relatively young, but it has done well. With its plan to spread its wings to more countries, the project is poised for more success and could very well compete with more established exchanges like Huobi, Coinbase, etc. Here’s to hoping it succeeds in both expanding and democratizing money for populations. 

Categories
Crypto Daily Topic

Top DeFi Tokens of 2020: Check Out Number 5

Which are the best DeFi tokens of 2020? DeFi tokens have had a great year. It’s not an exaggeration to say they could very well eclipse ‘normal’ cryptocurrencies in the future. As DeFi continues to explode and the year nears a close, it helps look at the tokens that have defined 2020 and will probably continue to do so in the coming year.

This list doesn’t just follow the tokens that are the highest in market cap. It also looks at the most promising and exciting tokens. 

#1. Chainlink 

Chainlink is a decentralized oracle for connecting blockchains to external data and information. The Chainlink protocol, which includes the LINK token, allows smart contracts to operate without relying on permissioned or centralized information. For instance, a developer can run a sports betting contract that relies on an external oracle for sports scores. Chainlink has proved especially popular, with countless DeFi protocols including Aave, Ampleforth, Celcius, Arbol, yearn.finance, Nexus Mutual, and Synthetix all utilizing its smart oracles function. This popularity has catapulted it to the top ten in market cap, sitting at #5 at the time of writing. The LINK token, which began the year going for $2, already hit $12. 

#2. Maker (MKR)

Maker is one of the earliest stablecoins in the DeFi space and one of the most resilient. Despite (and probably because) of its low total supply of slightly more than a million, the token is a huge hit in  DeFi, judging by its current per-token value of $513. And this is a climbdown from the highs of $1,700 in 2018 before the token plummeted during the 2018/2019 crypto winter. In 2020, it got a reprieve after reaching $600 this year. With its MKR token, the protocol makes up what is probably the best example of a stablecoin system: a collateralized debt position powered by its  stablecoin – DAI, which maintains stability for the protocol by using various economic incentives. MKR will be one of the tokens driving the DeFi space in the near future and beyond. 

 #3. Aave (LEND)

Aave is an open-source, decentralized protocol that allows users to create money markets, earn interest on their deposits, and borrow funds through the LEND token. With a market cap of $859 million, Aave is currently the 4th biggest DeFi token. Aave has had an incredible year. It started off at a mere $0.009 in  January but has now clocked $73 per token, which is remarkable even in crypto. 

#4. Synthetix Network Token (SNX)

Synthetix is a blockchain protocol that lets anyone gain exposure to a wide array of assets. The platform is credited for introducing yield farming in DeFi, though it’s now been overrun by platforms like Compound and Aave. Still, the token continues to ‘hold the line,’ as manifested by its current position of #9 among  DeFi tokens and #40 among all cryptocurrencies. With a market cap of nearly $500 million, SNX demonstrates its resiliency. Synthetix supports a smart contract infrastructure and incentivization system that will continue to propel it upwards. 

 #5. Dai (DAI)

Part of the Maker ecosystem, DAI isn’t a token that you buy to HODL. Still, it’s an excellent idea to buy the token and hedge your portfolio against volatility. Dai is probably the most elegantly designed stablecoin in the world today, with an ingenious incentivization and collateralization system that securely puts its value at a 1:1 ratio against the US dollar. While other stablecoins achieve stability by using clumsy ways like holding US dollars in the bank, Dai uses a more accurate and flexible tech-based system. Anyone can also create their own Dai if they put up collateral. 

#6 Compound (COMP)

Compound is a DeFi protocol that allows anyone to lend, borrow, and provide liquidity and earn returns. Comp exploded after it started distributing its native token, COMP, in June this year. It’s definitely one of the hottest tokens in DeFi right now, featuring a market cap of $526 million and a per-token value of $124 at the time of writing. COMP is an Ethereum-based mechanism used as a governance mechanism of the Compound ecosystem. As the Compound platform continues to expand, we’re sure to see the value of COMP following the lead. 

#7. 0x (ZRX)

0x is a decentralized exchange protocol that allows developers to create their own exchanges. The project’s founder calls it the “Craigslist for cryptocurrencies” in that anyone can build an exchange and post it online. Despite its promising value proposition, the 0x token, ZRX, has had the slowest growth this year. In January, you could buy the token for around $0.20, and it’s now sitting at $0.36 at the time of writing, with a market cap of $273,926,375. But the dismal growth of the token does not discount its potential to break through in the future. The 0x token is one to keep sights on. 

#8. Ampleforth (AMPL)

Ampleforth kicked off the year trading at around $1, went to rise to $4 in July, before sharply clamping down to around $1 again. Ampleforth calls itself a cryptocurrency “like Bitcoin,” but with a daily change in supply, insuring against market shocks.  Ampleforth wishes to solve what it calls the “dangerously correlated” crypto market by adding diversity to the ecosystem. While most cryptocurrencies follow the Bitcoin price pattern, the AMPL token matches to its own beat. This could prove an excellent hedge for your crypto portfolio. 

#9. Augur (REP)

Augur started the year sitting at around $9, and if now trades at $14 in November, a dip from around $20 in August. Based on Ethereum, Augur, via its native token – REP, aims to power a prediction market where users can earn money if they predict winning outcomes. Augur also acts as a decentralized oracle for verifying real-world events. These events could be anything – from natural events to election results to football matches’ outcomes. At the time of writing, Augur is at position #75 in the market and continues to be one of the DeFi’s best.

#10. Terra (LUNA)

Terra is a DeFi protocol that wants to expand everyone’s financial  inclusivity through its native token, LUNA. The Tetra team wants to “set money free” by building an open, global financial infrastructure. This infrastructure constitutes a family of stablecoins that allow users to earn mining rewards, giving people an incentive to participate in the network. Terra launched its mainnet in April 2019. It currently offers stablecoins pegged to the US dollar, South Korean Won, the Mongolian tugrik, and the IMF’s Special Drawing Rights basket of currencies. Users can trade LUNA as well as stake it and earn interest. LUNA token holders can also participate in the platform’s governance. After kicking off the year at $0.24, LUNA’s price nearly doubled around July before cooling down to around $0.33 in November. With its value proposition, Terra is set to be one of the most important DeFi presences in the future. 

Closing Thoughts

Ten years ago, the crypto space was talking about Bitcoin and decentralized currencies. Now, we’re talking of decentralizing the entire finance space. The above tokens represent some of the most exciting decentralized finance projects and their tokens in 2020. With a rapidly evolving DeFi space, you can expect anything in the coming year, but for now, these are among its biggest stars. 

Categories
Crypto Market Analysis

Daily Crypto Review, Nov 24 – XRP’s Push to $0.9 Manipulated? Ether Breaks $600 on Amazing News

The cryptocurrency sector has spent been in the green overall, with Bitcoin consolidating and altcoins booming. The largest cryptocurrency by market cap is currently trading for $18,364, representing a decrease of 0.36% on the day. Meanwhile, Ethereum gained 4.23% on the day, while XRP gained a whopping 54.14%.

 Daily Crypto Sector Heat Map

Stellar 61.98% in the past 24 hours, making it the most prominent daily gainer in the top100. It is closely followed by XRP’s gain of 52.19% and Verge’s 37.77% gain. On the other hand, SushiSwap lost 11.14%, making it the most prominent daily loser. Quant lost 9.44% while Nexo lost 8.27%, making them the 2nd and 3rd most prominent daily losers.

Top 10 24-hour Performers (Click to enlarge)

Bottom 10 24-hour Performers (Click to enlarge)

Bitcoin’s market dominance has reduced drastically over the course of the day, with its value is currently staying at 60.06%. This value represents a 2.6% difference to the downside compared to the value it had yesterday.

Daily Crypto Market Cap Chart

The crypto sector capitalization has increased significantly over the course of the day. Its current value is $562.75 billion, representing a $21.04billion increase compared to our previous report.

_______________________________________________________________________

What happened in the past 24 hours?

_______________________________________________________________________

_______________________________________________________________________

Technical analysis

_______________________________________________________________________

Bitcoin

The largest cryptocurrency by market cap has stayed pretty stable today as it couldn’t break the $18,500 mark. The price has been hovering right under the level for the whole day, and even made a couple of attempts to break it but to no avail. On the other hand, this small zone of resistance and support wasn’t broken to the downside either, as a break below $18,270 could spell a retracement.

This is a prime example of uncertainty due to Bitcoin’s current level (some are taking profits while some are investing). However, trading pullbacks in a bull trend is extremely risky and should be avoided.

BTC/USD 4-hour Chart

Bitcoin’s technicals are divided, with its daily and monthly overviews showing a slight hint of bearishness alongside the bullishness that overwhelms it. In contrast, the 4-hour and weekly overviews are completely bullish.

BTC/USD 1-day Technicals

Technical factors (4-hour Chart):
  • Price is above its 50-period EMA and at its 21-period EMA
  • Price is at its middle Bollinger band
  • RSI is neutral (53.88)
  • Volume is average
Key levels to the upside          Key levels to the downside

1: $18500                                  1: $17,850

2: $19000                                  2: $17,450

3: $19500                                   3: $17,130

Ethereum

With Ethereum’s 2.0 version 0 launch approaching, Ethereum has continued to increase in price. Today’s move was a continuation of the uptrend that started on Nov 0, additionally fueled by the announcement that the deposits required for Ethereum’s 2.0 version 0 to launch have passed the threshold. This news is a big sigh of relief for the ETH devs, as they were wondering if the protocol will reach its goal on time for the Dec 1 launch. This extremely bullish news has pushed Ethereum past $600, which it is now testing.

If Ethereum manages to successfully stay above $600, it will have very little resistance to the upside and basically trade only versus profit-taking sellers.

ETH/USD 1-hour Chart

Ethereum’s 4-hour and monthly time-frames are completely bullish, while its daily and weekly time-frames are slightly more tilted towards the neutral position.

ETH/USD 1-day Technicals

Technical Factors (4-hour Chart):
  • The price is far above its 50-period and slightly above its 21-period EMA
  • Price is between its middle and top Bollinger band
  • RSI is coming out of the overbought territory (59.88)
  • Volume is above average
Key levels to the upside          Key levels to the downside

1: $600                                     1: $510

2: $630                                     2: $500 

3: $735                                      3: $490

Ripple

The fourth-largest cryptocurrency by market cap has exploded to the upside and reached over $0.90 on the US cryptocurrency exchange Coinbase only to crash back down by roughly 30% in mere seconds. This was its highest price since May 2018. The rally was apparently driven by the Coinbase users as XRP did not see the same heights on any other exchange. Bitstamp and Binance saw a high of only $0.79.

Analysts believe that this rally is a culmination of an uptrend triggered in late Oct when an anonymous whale sent an astonishing $50 million worth of XRP at the time to Bitstamp. Ever since then, XRP/USD has been seeing a strong uptrend, up by 128.63% in the past week.

Trading XRP is simply impossible at the moment due to the amount of risk associated with this type of volatility.

XRP/USD 1-hour Chart

XRP’s 4-hour and weekly overviews are completely bullish and show no signs of neutrality, while its daily and monthly overviews show slight neutrality or even slight bearishness.

XRP/USD 1-day Technicals

Technical factors (4-hour Chart):
  • The price is above its 50-period EMA and at its 21-period EMA
  • Price is slightly above its middle Bollinger band
  • RSI is neutral (53.65)
  • Volume is above average
Key levels to the upside          Key levels to the downside

1: $0.79                                     1: $0.625 

2: $0.963                                   2: $0.475

3: $1.01                                    3: $0.443


Categories
Crypto Videos

Millionaires are Rushing to Buy Crypto According To This Survey! Do You Hold Any Bitcoin?


Millionaires are Rushing to Buy Crypto! Do YOU Hold Any Bitcoin?


A survey of over 700 high net-worth individuals has found that almost three-quarters of respondents that are worth more than $1 million either already own or are looking to put a part of their wealth in cryptocurrencies before the end of 2022.
The survey was conducted by financial advisory organization DeVere Group and revealed that 73% of respondents are currently bullish toward cryptocurrencies, which is an increase from 68% back in 2019.

Participants were individuals whose net worth equated to more than 1 million British pounds, equating to approximately $1.32 million. The participants were selected from a wide variety of regions that include the United States, the United Kingdom, Africa, Asia, the Middle East, Australia, as well as Latin America.

deVere Group CEO and founder Nigel Green stated in the survey that Bitcoin had once again shown its worth by being one of the best-performing assets in 2020, with a year-to-date increase of 125%. He then added:

“As the survey shows us, this impressive performance is drawing the attention of high net-worth investors who increasingly understand that cryptocurrencies are the future of money, and they don’t want to be left behind.”

Green noted that the respondents eyeing Bitcoin included some of the biggest Wall Street companies and attributed their warming sentiment to crypto adoption by large firms such as PayPal and Square:

“There is no doubt that many high net-worth individuals who were polled have seen that a major price surge driver is the growing interest being shown by institutional investors who are capitalizing on the extremely high returns that the crypto asset class is currently offering.”

Even former Bitcoin skeptics coming from Wall Street are now warming up to digital currencies. During a recent New York Times conference, Chairman and CEO of JPMorgan and Chase Jamie Dimon said he’s a “believer” in blockchain technology, as well as in “properly backed, properly regulated” cryptocurrencies.


Taking a look back, Dimon made headlines in 2017 when he referred to Bitcoin and other cryptocurrencies as a fraud, although JPMorgan has since embraced cryptocurrencies.


Billionaire hedge fund manager and Bitcoin bear Ray Dalio still has plenty of doubts about Bitcoin. Still, he has recently questioned his own skepticism, tweeting that he might be missing something about Bitcoin and that he’d love to be corrected.

Dalio had suggested that Bitcoin will fall down as a store of value and that governments may just “outlaw it and make it too dangerous to use.” He also stated that he couldn’t imagine central banks, big institutional investors, and multinational companies using it.

The millionaires’ survey was revealed to the public the same day that Bitcoin’s total market capitalization hit a new all-time high of an astonishing $336 billion, and its price rallied to above $18,000 and just shy of the $19,763 high that it reached in December 2017.

Categories
Crypto Videos

Pantera Capital Are Raising $134,000,000 – why?


Crypto Hedge Fund Pantera Capital Raising $134 Million


In a filing with the SEC on Nov 21, Bitcoin hedge fund giant Pantera Capital has announced an equity offering of up to a whopping $134 million, one of the largest capital fundraising campaigns in the seven-year history of the firm.

Founded in 2013 as the first-ever Bitcoin fund in the US, Pantera Capital initially raised $13 million, which is less than 10% of the current offering. It raised another $25 million later on, according to the firm’s public records.

However, in 2018, the fund redirected its efforts towards a larger raise that ultimately resulted in the formation of a third investment fund, now called Venture Fund III. This new fund raised $164 million from 2018-2020, with the majority of the capital inflows bookending crypto’s dreadful 2019 year.

Nowadays, as crypto seems like it has entered yet another raging bull market, the SEC filing tells us that Pantera has big plans ahead. 

Pantera didn’t state the reason for this new raise, and if the raise will result in a new fund or if it will simply be used to expand the scope of Venture Fund III. However, the company’s latest investments and executive comments actually might offer hints at its strategy for the future.


Pantera CEO Dan Morehead said that he believes the growth of decentralized finance, or DeFi for short, has the potential to outpace Bitcoin’s rise, and that the firm is focusing its new bets on the emerging financial vertical. In addition to this, Pantera seems to have its eye on the quickly expanding crypto derivatives market, as shown by its recent investment in Globe, a well-known derivatives trading platform.

Bitcoin bulls shouldn’t be negatively affected by the interest in DeFi and derivatives, however. In fact, Morehead has also previously made a moonshot target for the largest cryptocurrency, as he called for a Bitcoin price of $350,000.


Categories
Crypto Market Analysis

Daily Crypto Review, Nov 23 – Ethereum Exploding as its 2.0 Update Launch Approaches; Crypto Market in the Green

The cryptocurrency sector has spent the weekend being quite volatile as Bitcoin had a flash crash, which brought its price below $18,000, followed by a rally that brought it back above it. The largest cryptocurrency by market cap is currently trading for $18,461, representing an increase of 0.61% on the day. Meanwhile, Ethereum skyrocketed by gaining 8.13% on the day, while XRP gained 0.09%.

 Daily Crypto Sector Heat Map

Waves 38.43% in the past 24 hours, making it the most prominent daily gainer in the top100. It is closely followed by Horizen’s gain of 31.65% and Numeraire’s 21.56% gain. On the other hand, Terra lost 5.45%, making it the most prominent daily loser. HedgeTrade lost 3.22% while Crypto.com Coin lost 1.65%, making them the 2nd and 3rd most prominent daily losers.

Top 10 24-hour Performers (Click to enlarge)

Bottom 10 24-hour Performers (Click to enlarge)

Bitcoin’s market dominance has reduced drastically over the course of the weekend, with its value is currently staying at 63.2%. This value represents a 2.9% difference to the downside compared to the value it had on Friday.

Daily Crypto Market Cap Chart

The crypto sector capitalization has increased significantly over the course of the weekend. Its current value is $541.71 billion, representing a $34.48 billion increase compared to our previous report.

_______________________________________________________________________

What happened in the past 24 hours?

_______________________________________________________________________

_______________________________________________________________________

Technical analysis

_______________________________________________________________________

Bitcoin

The largest cryptocurrency by market cap has spent the weekend with decently high volatility as its price managed to go from above $18,500 to $17,600 and then back above $18,500 in just one day. While this “flash crash” is behind Bitcoin, the bulls seem to be more and more wary of the new highs, and a retracement before another push towards the upside is quite possible.

Due to many people taking profits and shorting Bitcoin to hedge their portfolios, the largest currency has a hard time going up. However, trading pullbacks in a bull trend is equally as risky. Bitcoin traders would have the most chance of succeeding if they traded only long positions.

BTC/USD 2-hour Chart

Bitcoin’s technicals are semi-divided, with its daily and monthly overviews showing a slight bullish tilt with signs of bears still present. In contrast, the 4-hour and weekly overviews show no signs of bearish presence and are completely bullish.

BTC/USD 1-day Technicals

Technical factors (4-hour Chart):
  • Price is above its 50-period EMA and at its 21-period EMA
  • Price is at its middle Bollinger band
  • RSI is neutral (51.42)
  • Volume is average
Key levels to the upside          Key levels to the downside

1: $18500                                  1: $17,850

2: $19000                                  2: $17,450

3: $19500                                   3: $17,130

Ethereum

Ethereum’s 2.0 version 0 launch is approaching, and Ethereum bulls seem to be back in the game. The second-largest cryptocurrency by market cap broke out of the ascending (red) line and pushed towards the upside, eyeing the $600 resistance level. While the rally was strong, Ethereum bulls started showing exhaustion at $580. With that being said, the move is still not considered over, and there is more opportunity to the upside.

We mentioned on Friday that Ethereum’s downside is quite defined, but that its upside isn’t. With ETH entering territory that was explored only a couple of times, the opportunity for volatility (but also slippage) is increasing.

ETH/USD 4-hour Chart

Ethereum’s 4-hour and daily time-frames are completely bullish, while its longer time-frames (weekly and monthly) are slightly more tilted towards the neutral position.

ETH/USD 1-day Technicals

Technical Factors (4-hour Chart):
  • The price is far above both its 50-period and its 21-period EMA
  • Price is at its top Bollinger band
  • RSI is extremely overbought (72.01)
  • Volume is above average
Key levels to the upside          Key levels to the downside

1: $600                                     1: $510

2: $630                                     2: $500 

3: $735                                      3: $490

Ripple

The fourth-largest cryptocurrency by market cap has, just like Ethereum, had quite an amazing weekend. XRP continued its rally to the upside that began on Nov 20 and reached as high as $0.49 before starting to consolidate. While consolidating, it has seemingly created a triangle formation that should keep its price at bay before ~80% of the formation is done.

While it is quite unknown how XRP will act right now, all chances are that it will stay within the triangle formation’s bounds for some time, at least.

XRP/USD 1-hour Chart

XRP’s daily and weekly overviews are completely bullish and show no signs of neutrality, while its 4-hour and monthly overviews show slight neutrality.

XRP/USD 1-day Technicals

Technical factors (4-hour Chart):
  • The price is above its 50-period EMA and at its 21-period EMA
  • Price is slightly above its middle Bollinger band
  • RSI is neutral (53.65)
  • Volume is above average
Key levels to the upside          Key levels to the downside

1: $0.476                                   1: $0.3328 

2: $0.509                                   2: $0.3244

3: $0.792                                  3: $0.31


Categories
Crypto Videos

Galaxy Digital Earnings Skyrocketing!


Galaxy Digital’s Q3 Earnings Skyrocketing

Galaxy Digital, a financial firm specializing in digital assets and blockchain technology, has reported that its over-the-counter trading desk reached record volumes in the third quarter. As they stated, this new report signaling that institutional uptake of cryptocurrencies is on the rise. 

The company’s Q3 earnings report showed an astonishing 75% year-over-year increase in trading volumes, as it reached approximately $1.4 billion. The increase was mostly attributed to an expanding counterparty base, the rollout of Galaxy Digital’s electronic trading platform as well as the continued growth of the company’s crypto derivatives business.

Assets under Galaxy Digital’s management totaled $407.4 million at the end of the third quarter, and the assets included $82.4 million in passive Bitcoin and index funds, as well as $325 million in the Galaxy EOS (read it as one word, eos, rather than spelling it) VC Fund. The latter represents a partnership with Block.one, a blockchain merchant bank and EOS founder.

Galaxy’s Bitcoin funds under management increased by 17.3% in the third quarter. While its large-cap Crypto Index Fund made a 32.3% return, the company still wasn’t able to turn a profit. Its Q3 net loss amounted to $44.6 million for the quarter ending Sept 30.

Galaxy Digital was founded in 2018 by a well-known billionaire and crypto evangelist Mike Novogratz. The company was founded in an effort to bring more institutional investors to cryptocurrencies. Novogratz said in an official press release that Galaxy Digital is in the process of preparing itself for the “incoming wave of institutional adoption ahead of digital assets as well as blockchain solutions by investors, corporates, and governments.”

When comparing the 2017 bull market to the current one, we can clearly see that the earlier bull run was largely driven by retail fear of missing out, while the euphoria surrounding Bitcoin in 2020 is quite different, as it is largely tied to institutional uptake.

All the evidence shows that institutional investors are flocking to Bitcoin in far greater numbers in the fourth quarter. Grayscale’s Bitcoin Trust experienced record inflows at the start of Nov, putting it on track to reach an astonishing 500,000 BTC by the end of 2020. That number would amount to roughly 2.7% of Bitcoin’s current circulating supply.


On top of that, institutional investors such as Paul Tudor Jones and Stanley Druckenmiller also not only own Bitcoin but openly talk about its potential benefits. They have both touted the cryptocurrency’s growth potential in the current environment.

Bitcoin’s price peaked at $16,500 in the past week, while it is currently fighting for $16,000, according to TradingView data. Whether the fight for this psychological level is won or lost, Bitcoin’s long-term potential is extremely bullish.


Categories
Crypto Market Analysis

BTC/USD Weekly Chart Analysis + Possible Outcomes

In this weekly BTC/USD analysis, we will be taking a brief look at the most recent events, current chart technical formations, as well as the possible BTC short-term price outcomes.

Overview

Bitcoin has spent the week constantly pushing towards the upside, with its price moving from around $16,500 on Monday all the way up to $19,000 at one point on Saturday. This left Bitcoin holders in a dilemma: should they hold or hedge their investments. Most holders are already satisfied with the BTC movement and don’t want to invest at such a high price, while some are hedging or even selling their funds to take a profit. On the other hand, such a large rally has “invited” the retail market to join in, and they are the majority of the buy force, alongside institutional investors that do not care about the current price and just want to invest every time they have funds available.

While many analysts called for a stronger pullback long before the most recent push, all significant bear-related signals were false.

Technical factors


Bitcoin has continued moving up, supported by the 50-period MA, which has proven as great support, as well as by the ascending (pink dotted) line. On top of that, the largest cryptocurrency by market cap has done a great job pushing through its previous highs and making higher highs/higher lows. If we consider the year-to-date Bitcoin balance on exchanges dropping 18% and institutions being more and more involved, we can almost certainly expect a long-term price increase.

The hash ribbons indicator is showing miner capitulation (ever since Oct 29), sending out a major buy/accumulation signal.

Likely Outcomes

Bitcoin has one main scenario, as well as one supporting scenario that is likely to play out.

1: If Bitcoin manages to hold the so-called pivot zone (18,250-$18,450), it is almost certain to bounce and reach the all-time high level, and possibly even pass it. In that case, longing Bitcoin after it confirms its position above the pivot zone is a great trade, as it has defined targets (target 1 = Bitcoin’s ATH; target 2 = ride the bull wave and continuously take profit until volume dies out) as well as a defined stop-loss target (right below the pivot zone).

If the first scenario plays out, it will most likely play out on the Nov 23rd, as this is when the pivot zone is meeting the ascending support line and (most likely) the 50-period moving average.

2: The second (and a bit less likely) scenario happens when Bitcoin fails to hold the pivot zone, in which case we can expect a price drop to $17,260.

A move that will end up below $17,260 is highly unlikely, simply due to the overall sentiment currently surrounding Bitcoin.

Categories
Crypto Daily Topic Cryptocurrencies

What’s Injective Protocol All About? 

In this age of DeFi, project after project is competing to provide users all over the world with the most innovative products. Injective Protocol, a layer 2 decentralized exchange, is one of them. Injective wants to unleash the potential of crypto derivatives and borderless decentralized finance. 

The protocol supports cross-chain derivatives trading for multiple crypto products such as perpetual swaps, futures, CDFs, and more. In 2018, the protocol made it to the winner’s list of projects selected for incubation by Binance Labs. Injective wants to solve high latency, inefficiencies, and poor liquidity encountered by most exchanges today. 

Understanding the Injective Protocol

Launched in 2018, the Injective Protocol is a DeFi project that wants to enable decentralized and cross-chain spot trading and derivative trading of financial products, from perpetual swaps to CDFs, to futures and more. The platform utilizes ‘peg zones’ to realize a cross-chain trading infrastructure. This environment is also trustless, censorship-resistant, transparent, and with low fees. 

Highlights of the Injective Protocol

The Injective Protocol features the following highlights: 

#1 Layer 2 decentralized derivatives trading: Injective can support fast, autonomous and transparent trading 

#2. Trading opportunities: On Injective, anyone can create and trade on a derivative market of their choice by utilizing only a price feed. This increases opportunities for trading that are not found on other exchanges.

#3. Cross-chain trading: Injective supports a wide range of trading and yield generation activities across a variety of networks

#4. Community governance: The Injective Protocol will be governed by the community – in a true decentralization fashion. Any changes or updates to the protocol will be determined through a vote based on a decentralized autonomous organization (DAO) structure.

#5. Liquidity mining incentives: Injective users will have the ability to earn value through a variety of liquidity mining pools

Injective: Products and Technical Infrastructure

The Injective protocol is made of four key components: 

  • Injective Chain
  • Smart Contracts on Ethereum
  • API nodes
  • Front-end interface

Let’s take a close look at each: 

#1. Injective Chain

This is a decentralized sidechain solution that powers derivatives trading and supports a Trade Execution Coordinator (TEC) and a decentralized order book. The Injective Chain utilizes a Tendermint consensus mechanism to confirm and validate transactions. 

On the Chain, users can build derivatives through two ways: the Injective Futures Protocol and smart contracts. The Injective Futures Protocol allows traders to create, enter into, and execute decentralized perpetual swaps and CFDs. 

#2. Smart Contracts on Ethereum

As a token-based protocol, Injective is intricately linked with INJ, its native token. For that reason, major protocol interactions and token economics are implemented through various smart contracts, which are as follows: 

  • Injective Coordinator Contract: Implements orders and Injective’s derivative transactions both on Ethereum and the Injective Chain
  • Staking Contract: Manages core functions like token rewards, choosing delegates, and governance
  • Injective Futures Contracts: Smart contracts that allow traders to create and trade perpetual swap contracts on the market
  • Injective Bridge Contracts: A suite of smart contracts that manage the flow of info between the Injective Chain and the Ethereum network
  • Injective Token Contract: An ERC-20 contract for INJ token

#3. Injective API Nodes

Injective’s API nodes are responsible for two things: supporting transaction relay services and being the data layer of the protocol. 

  • Transaction Relay Service – This is a tool that formulates transactions and relays them to the Injective Chain. It also simplifies functionalities such as staking, voting, and governance.
  • Data layer – The API nodes also act as a data layer through which external clients can interact with the protocol. 

#4. Front-end interface

The Injective protocol is fully decentralized, meaning individuals and companies can use it in a permissionless manner. Injective has enabled a friendly front-end interface through which they can do so. 

The INJ Token

INJ is the native token for the Injective network. It plays several roles, which include the following: 

  • Protocol governance: The INJ token will be used as a governance mechanism. Token holders will be able to vote on the future of the project, network parameters, and protocol upgrades through a DAO structure.
  • Deflationary mechanism: The INJ token will be periodically bought back and burned so that it doesn’t flood the market – as a deflationary measure
  • Collateral backing: INJ can be used as an alternative to stablecoins in the protocol’s derivatives trading, as well as a collateral backing when users lock up tokens so as to earn interest
  • Incentive mechanism: The INJ token is used to reward participants for taking part in the network’s consensus
  • Proof of Security (PoS): When nodes stake in INJ and get the right to take part in the network consensus, which secures the network, they will be rewarded with block rewards

INJ Token Distribution

The INJ token was distributed in the following fashion: 

  • Binance launchpad sale tokens: 9%
  • Seed sale tokens: 6%
  • Private sale tokens: 16.67%
  • Team tokens: 20%
  • Advisors’ tokens: 2%
  • Ecosystem development tokens: 36.33%
  • Community growth tokens: 10%

INJ: Tokenomics

As of Oct 31st, 2020, the INJ token traded at $0.776922, with a market cap of $10,456,039, which places it at #470 per Coinmarketcap. The token’s 24-hour volume is $2,431,311, with a circulating and total supply of 13,458,281 and 100 million, respectively. INJ’s all-time high was $1.22 (Oct 23, 2020), while its all-time low is $0.662174 (Oct 29, 2020). 

Buy and Storing INJ

You can find the INJ token listed on several exchanges, including but not limited to Binance, HotBit, Poloniex, DCoin, Uniswap (V2), VCC Exchange, and Pancake Swap. The token is listed as a market pair with USDT, BTC, BNB, BUSD, and WBNB. 

Categories
Crypto Market Analysis

Daily Crypto Review, Nov 20 – Bitcoin Conquering $18,000: What’s Next in Store?

The cryptocurrency sector has ended up with the majority of cryptos in the green as Bitcoin continued its rally past $18,000. The largest cryptocurrency by market cap is currently trading for $18,095, representing an increase of 1.31% on the day. Meanwhile, Ethereum gained 1.59% on the day, while XRP gained 2.42%.

 Daily Crypto Sector Heat Map

SushiSwap 31.66% in the past 24 hours, making it the most prominent daily gainer out of the top100 cryptos ranked by market capitalization yet again today. It is closely followed by Waves’ gain of 21.42% and CyberVein’s 17.06% gain. On the other hand, Blockstack lost 8.00%, making it the most prominent daily loser. NEM lost 7.73% while ABBC Coin lost 6.77%, making them the 2nd and 3rd most prominent daily losers.

Top 10 24-hour Performers (Click to enlarge)

Bottom 10 24-hour Performers (Click to enlarge)

Bitcoin’s market dominance has reduced slightly over the course of the day, with its value is currently staying at 66.1%. This value represents a 0.2% difference to the downside when compared to the value it had yesterday.

Daily Crypto Market Cap Chart

The crypto sector capitalization has increased over the course of the day. Its current value is $507.23 billion, representing a $12.16 billion increase compared to our previous report.

_______________________________________________________________________

What happened in the past 24 hours?

_______________________________________________________________________

_______________________________________________________________________

Technical analysis

_______________________________________________________________________

Bitcoin

The largest cryptocurrency by market cap has spent the past 24 hours pushing towards and past the $18,000 level after it has won the fight for $17,850. While the move was quite sudden at one point, it was actually not accompanied by a great increase in volume. This has ultimately caused BTC to end its move slightly above $18,200 and start its consolidation phase.

Due to many people taking profits and shorting to hedge their portfolios, Bitcoin has a hard time going up. However, trading pullbacks is equally as risky. Bitcoin traders would have the most chance of success if they traded only pushes to the upside, accompanied by a decent volume increase.

BTC/USD 1-hour Chart

Bitcoin’s technicals on the 4-hour, daily, and monthly time-frame are all bullish but show some signs of neutral presence. On the other hand, its weekly overview is tilted towards the buy-side and doesn’t show any bearishness.

BTC/USD 1-day Technicals

Technical factors (4-hour Chart):
  • Price is above both its 50-period EMA and its 21-period EMA
  • Price is near its top Bollinger band
  • RSI is neutral (57)
  • Volume is slightly below average
Key levels to the upside          Key levels to the downside

1: $18500                                  1: $17,850

2: $19000                                  2: $17,450

3: $19500                                   3: $17,130

Ethereum

Our yesterday’s call for Ethereum traders was that they should wait for the cryptocurrency to confirm its support level or fall under it, and then trade “with the wave.” Ethereum confirmed its position above the yellow dotted line (top line of the ascending channel) and pushed up instantly. The move brought Ether from $470 all the way to $488 before slowing down and starting to consolidate.

While Ethereum’s downside is quite defined, its upside isn’t. Traders should be wary of Ether’s future pushes to the upside, while they should trade any pullback from the retest of the yellow line.

ETH/USD 1-hour Chart

Ethereum’s 4-hour, daily and monthly time-frames are extremely bullish and show no signs of neutrality or bearishness. On the other hand, its weekly overview is still titled to the bull side but does show significant neutrality.

ETH/USD 1-day Technicals

Technical Factors (4-hour Chart):
  • The price is above both its 50-period and its 21-period EMA
  • Price is near its top Bollinger band
  • RSI is neutral after bouncing from almost being overbought(59.32)
  • Volume is average
Key levels to the upside          Key levels to the downside

1: $490                                     1: $470

2: $500                                     2: $451 

3: $510                                      3: $445

Ripple

The fourth-largest cryptocurrency by market cap has spent the day breaking out of its slow price descent and pushing towards the upside. XRP first changed its price direction at $0.284 and quickly pushed towards the upside, reaching as high as $0.306. However, that price did not hold up, and XRP started trading sideways around the $0.3 mark.

XRP traders should still be safe to trade within the range bound by $0.2855 and $0.31. However, since the range is quite large, traders would be even better if they could spot additional small buy/sell walls in the order books before blindly trading.

XRP/USD 1-hour Chart

XRP’s daily and weekly overviews are completely bullish and show no signs of neutrality, while its 4-hour and monthly overviews show slight neutrality.

XRP/USD 1-day Technicals

Technical factors (4-hour Chart):
  • The price is above its 50-period EMA and at its 21-period EMA
  • Price is near its middle Bollinger band
  • RSI is neutral (53.74)
  • Volume is average
Key levels to the upside          Key levels to the downside

1: $0.31                                     1: $0.28 

2: $0.3244                                 2: $0.27

3: $0.3328                                3: $0.266


Categories
Crypto Market Analysis

Daily Crypto Review, Nov 19 – Ethereum 2.0 Most Likely Not Launching on Time; Crypto Sector Consolidating

The cryptocurrency sector has spent the day trying to consolidate after Bitcoin finished its rally. However, while most cryptocurrencies moved less than 1%, almost every one of them ended up in the red. The largest cryptocurrency by market cap is currently trading for $17,708, representing a decrease of 0.73% on the day. Meanwhile, Ethereum lost 0.49% on the day, while XRP lost 1.53%.

 Daily Crypto Sector Heat Map

OKB gained 17.77% in the past 24 hours, making it the most prominent daily gainer out of the top100 cryptos ranked by market capitalization yet again today. It is closely followed by yearn.finance’s gain of 12.48% and SushiSwap’s 11.73% gain. On the other hand, Band Protocol lost 10.00%, making it the most prominent daily loser. Ampleforth lost 9.81% while Aragon lost 7.26%, making them the 2nd and 3rd most prominent daily losers.

Top 10 24-hour Performers (Click to enlarge)

Bottom 10 24-hour Performers (Click to enlarge)

Bitcoin’s market dominance has stayed at exactly the same place over the course of the day, with its value is currently staying at 66.3%. This value represents no difference when compared to the value it had yesterday.

Daily Crypto Market Cap Chart

The crypto sector capitalization has stayed at the same place over the course of the day. Its current value is $495.07 billion, representing a $3.01 billion decrease compared to our previous report.

_______________________________________________________________________

What happened in the past 24 hours?

_______________________________________________________________________

_______________________________________________________________________

Technical analysis

_______________________________________________________________________

Bitcoin

While it may seem that Bitcoin has had a pretty slow and uneventful day, that is certainly not the case. The largest cryptocurrency by market cap has spent the past 24 hours fighting for the $17,850 level and constantly going over and under it. However, the battle is finished, and BTC remains below $17,850 for the time being.

Many traders and analysts are warning BTC traders of a potential triangle formation forming. They also advise traders to refrain from trading until BTC chooses a clear direction.

BTC/USD 1-hour Chart

Bitcoin’s technicals on the daily, weekly, and monthly time-frame are all bullish but show signs of neutral presence. On the other hand, its 4-hour overview is tilted towards the buy-side and doesn’t show any bearishness.

BTC/USD 1-day Technicals

Technical factors (4-hour Chart):
  • Price is slightly above its 50-period EMA and below its 21-period EMA
  • Price is slightly below its middle Bollinger band
  • RSI is neutral (44.71)
  • Volume is slightly below average
Key levels to the upside          Key levels to the downside

1: $18500                                  1: $17,850

2: $19000                                  2: $17,450

3: $19500                                   3: $17,130

Ethereum

Ethereum has established itself above the top line of the ascending channel (yellow dotted line) and is now trading within a new range, bound by the yellow line as support and a new ascending trend line as resistance. Ethereum’s price seems to be in a correction phase at the moment, so we can expect a retest of the yellow line as well as a possible sharp move afterward.

Ethereum traders should wait for the cryptocurrency to confirm its support level or fall under it, and then trade “with the wave.”

ETH/USD 1-hour Chart

Ethereum’s time-frames are slightly tilted towards the buy-side, with its daily overview showing slight bear presence, while its 4-hour and weekly overviews are showing slight neutrality. On the other hand, its monthly overview is completely bullish.

ETH/USD 1-day Technicals

Technical Factors (4-hour Chart):
  • The price is below both its 50-period and its 21-period EMA
  • Price is between its middle and bottom Bollinger band
  • RSI is neutral (41.77)
  • Volume is slightly below average
Key levels to the upside          Key levels to the downside

1: $490                                     1: $470

2: $500                                     2: $451 

3: $510                                      3: $445

Ripple

The fourth-largest cryptocurrency by market cap had another day of slowly marching towards the downside. However, the extremely low volume may be suggesting that the current price movement is a “calm before the storm,” and that a new big move is coming. Analysts are calling for another push towards the upside. Still, a move down is just as likely with the current state of the sector (the crypto sector is currently in a consolidation/correction phase).

XRP/USD 1-hour Chart

XRP’s daily and weekly overviews are completely bullish and show no signs of neutrality or bearishness. On the other hand, its 4-hour and monthly overviews show slight neutrality.

XRP/USD 1-day Technicals

Technical factors (4-hour Chart):
  • The price is below both its 50-period EMA and its 21-period EMA
  • Price is slightly below its middle Bollinger band
  • RSI is pushing towards being oversold (39.45)
  • Volume is below average
Key levels to the upside          Key levels to the downside

1: $0.31                                     1: $0.28 

2: $0.3244                                 2: $0.27

3: $0.3328                                3: $0.266


Categories
Crypto Videos

A Bitcoin Whale Shorted $100M BTC – Bitcoin Still Climbing!

A Bitcoin Whale Shorted $100M BTC: Why are Whales Selling at $16,000?

According to the pseudonyms trader CL, a Bitcoin whale has placed a short position worth $100 million on the Bybit exchange. This information came after various on-chain data pointed toward a whale-driven sell-off that occurred throughout the past week.
Even though the overall sentiment around Bitcoin remains strongly bullish, many reasons make $16,000 a very attractive area for sellers.

The $16,000 level provides significant liquidity, primarily due to it being a heavy resistance level. The level has seen quite a high buyer demand, as stablecoin inflows show. However, buyer demand is significantly lower at higher levels at the moment. Due to the clash of buyers and sellers at this level, this area of high liquidity makes it even more compelling for sellers.

Whales are taking profits

An unknown seller aggressively sold Bitcoin on Bybit on Nov 15. Order flows show that they sold approximately $100 million worth of Bitcoin in $3.5 million increments. These increments showed up in the order books on average consecutively over a couple of hours.

Based on the abrupt, though seemingly incremental, large-scale sell order, CL suggested that this could result in two possible scenarios.
The seller could get engulfed, thus causing a squeeze, which might cause the Bitcoin price to increase. The sell orders could continue to apply selling pressure on BTC even after the seller finishes selling his portion of Bitcoin.
“Someone aggressive sold almost $100 million on Bybit, a 3rd of the sell positions are open; personally, I’m pretty curious to see what happens if the seller does get engulfed, or if he will be let free,” – said CL.
Meanwhile, other major exchanges have spotted several large deposits during the time of the short-selling. United States-based crypto exchange Gemini saw a 9,000 Bitcoin deposit, according to the data coming from CryptoQuant.


Whales typically choose exchanges with strict compliance and strong regulatory measures, such as Coinbase and Gemini. Considering the large Bitcoin deposit to Gemini, which is worth around $143 million, a pseudonymous researcher better-known as “Blackbeard” said this is the time to be cautious.

Perhaps… Just Weekend Volatility?

As CL stated, Bitcoin’s current market structure is quite different from the previous cycle. As an example, when Bitcoin was at $16,000 in 2017, the market was more than just a bit overheated and experienced extreme volatility.

He said: “Back in 2017, when Bitcoin pumped from 10k, 15, into 20k, we had OKEx’s weekly futures trade in 1000$ contangos. Now we’re here with quarterly futures trading only 100$ above.”
This time around, the rally seems to be more sustainable and gradual. Bitcoin has continued to see, with a few minor setbacks, a staircase-like rally over the past six months. This kind of rally has allowed it to evolve into a prolonged uptrend. On top of that, rather than sudden spikes and no consolidation, Bitcoin has seen upside followed by consolidation, which is a much healthier way of gaining ground.

One thing to note is that, while it is true that institutions are getting into crypto at the moment, data such as Google Trends show that there is still little interest from retail investors, a complete opposite from late 2017.
There is a very strong argument to be made that the ongoing rally is fundamentally different from the one in 2017 despite the current market sentiment, which is reaching “extreme greed.” The available supply has decreased due to the 2020 halving, and the reserves on exchanges over the past year have reduced drastically.


The Bitcoin futures funding rates are also neutral, coming at around 0.01%, meaning that the market is not as overheated or overcrowded as it was in 2017. This trend could make the downside potential limited, especially in the medium term. Market maturity is certainly one thing that has changed since 2017, and whether Bitcoin goes up or down in the short-term, its upside potential, in the long run, is tremendous and very likely.

Categories
Crypto Videos

JP Morgan – Institutions Ditching Gold ETFs For Bitcoin!

Institutions Ditching Gold ETFs For Bitcoin – JP Morgan Opens Up

The demand for Grayscale’s Bitcoin Trust has increased so much lately that it has surpassed all gold ETFs combined, according to JPMorgan Chase, the largest bank in the US.
JPMorgan noted that Bitcoin is eating away at gold ETFs demand very quickly. The news came out in a report shared by Michael Sonnenshein, who is currently the managing director of Grayscale Investments.

More and more institutional investors, such as family offices, are now viewing the world’s largest cryptocurrency as an alternative to the yellow metal used to be a hedge and the go-to safe-haven.
The Grayscale’s Bitcoin Trust flow trajectory in October became significantly steeper, while all gold ETFs remained basically flat. “The contrast between gold ETFs and Grayscale Bitcoin Trust lends support to the idea that investors that invested in gold ETFs previously, such as family offices, maybe looking into Bitcoin and seeing it as an alternative to gold.”


Bloomberg’s report dating from September showed Grayscale’s Bitcoin Trust is outperforming 97% of all US ETFs. The bullish report regarding Bitcoin’s adoption caps off an amazing week for the crypto asset management firm. Sonnenshein stated that his company had recorded the largest raise across its suite of products, totaling $237 million.
While GBTC remains the most popular investment vehicle for Grayscale, the Ethereum Trust is also gaining a lot more traction lately, with a record-shattering $58 million.

Last month, Grayscale’s Ethereum Trust became an SEC-reporting company, which means that it now has to file quarterly as well as annual disclosures with the US securities regulator. The company had over $1 billion worth of inflows in its third quarter of 2020. Its inflows in 2020 are now nearing a whopping $3 billion. Overall, Grayscale has over $9.1 billion worth of assets under management.

All in all, the trend of crypto surpassing traditional asset classes in terms of performance is becoming a trend, which is certainly bringing more and more investments to the sector. With so many institutions joining the movement lately, cryptocurrency is poised to receive the attention of the broader masses in the short future.

Categories
Crypto Market Analysis

Daily Crypto Review, Nov 18 – Bitcoin Encounters Heavy Resistance at $18,500: What Happens Next?

The cryptocurrency sector has spent the day mostly stable and looking at Bitcoin as it kept pushing towards highs unseen after the bull run of late 2017. The largest cryptocurrency by market cap is currently trading for $17.829, representing an increase of 6.64% on the day. Meanwhile, Ethereum gained 2.00% on the day, while XRP lost 1.90%.

 Daily Crypto Sector Heat Map

Nexo gained 14.37% in the past 24 hours, making it the most prominent daily gainer out of the top100 cryptos ranked by market capitalization yet again today. It is closely followed by Bitcoin Gold’s gain of 10.84% and DigiByte’s 9.52% gain. On the other hand, SushiSwap lost 12.92%, making it the most prominent daily loser. Curve DAO Token lost 10.74% while HedgeTrade lost 10.07%, making them the 2nd and 3rd most prominent daily losers.

Top 10 24-hour Performers (Click to enlarge)

Bottom 10 24-hour Performers (Click to enlarge)

Bitcoin’s market dominance has skyrocketed over the course of the day, with its value is currently staying at 66.3%. This value represents a 1.4% difference to the upside compared to the value it had yesterday.

Daily Crypto Market Cap Chart

The crypto sector capitalization has gone up quite a bit over the course of the day. Its current value is $498.06 billion, representing a $20.84 billion increase compared to our previous report.

_______________________________________________________________________

What happened in the past 24 hours?

_______________________________________________________________________

_______________________________________________________________________

Technical analysis

_______________________________________________________________________

Bitcoin

Bitcoin has had a parabolic run to the upside, reaching as high as $18,500 before dropping down. While the price gain was gradual at first, Bitcoin’s final push from $17,600 to $18,500 and then back to nearly $17,000 happened in just a couple of hours. This volatility came to be because BTC encountered heavy resistance at the now-confirmed $18,500 resistance level. Many traders call this move just a temporary pullback before a new high, while a minority is calling a short-term top.

Trading Bitcoin on a bull trend such as this one should only happen in one direction, and that is WITH the trend. Shorting Bitcoin and attempting to catch pullbacks will be far less lucrative due to the size of the move, as well as much riskier.

BTC/USD 1-hour Chart

Bitcoin’s technicals on the 4-hour, daily, and weekly time-frame are all completely bullish and show no signs of bear or neutral presence. On the other hand, its monthly overview is tilted towards the buy-side just slightly and does show some bearishness.

BTC/USD 1-day Technicals

Technical factors (4-hour Chart):
  • Price is far above its 50-period EMA and above its 21-period EMA
  • Price is between its middle and top Bollinger band
  • RSI is stabilizing after leaving the overbought territory (61.38)
  • Volume is descending
Key levels to the upside          Key levels to the downside

1: $18500                                  1: $17,850

2: $19000                                  2: $17,450

3: $19500                                   3: $17,130

Ethereum

Ethereum had had a turbulent 24 hour period, as its price went from fighting for and hovering over the top line of the ascending channel all the way to $495 and then back to $455 before it stabilized at around $475. This move has clearly shown the market another ascending line (red) formed on the ETH/USD chart, which has been tested a couple of times already. This line is Ethereum’s final resistance towards $500.

Ethereum should, as most cryptos at the moment, be traded only to the upside, as trading its pullbacks during a bull market is simply not worth it.

ETH/USD 2-hour Chart

Ethereum’s weekly time-frame shows some neutrality alongside its overall bullish stance, while the other time-frames show complete bullishness.

ETH/USD 1-day Technicals

Technical Factors (4-hour Chart):
  • The price is above both its 50-period and its 21-period EMA
  • Price is slightly above its middle Bollinger band
  • RSI is neutral (55.77)
  • Volume is above average
Key levels to the upside          Key levels to the downside

1: $490                                     1: $470

2: $500                                     2: $451 

3: $510                                      3: $445

Ripple

The fourth-largest cryptocurrency by market cap started off the day by pushing towards the upside and almost reaching its $0.31 resistance level. However, the bears have stepped in and brought XRP’s price down to $0.28 before consolidating in the middle of the range between the two aforementioned levels.

If Bitcoin doesn’t make another sharp move in the short-term, XRP is (yet again) sideways-action crypto. However, if BTC moves, it’s safest to watch Bitcoin and trade along with the bullish moves while discarding the bearish entries.

XRP/USD 4-hour Chart

XRP’s 4-hour, daily, and weekly technicals are tilted towards the buy-side, and while they aren’t showing signs of neutrality, the bullish sentiment isn’t as strong either. The monthly overview does, on the other hand, show clear signs of neutrality.

XRP/USD 1-day Technicals

Technical factors (4-hour Chart):
  • The price is above its 50-period EMA and at its 21-period EMA
  • Price is at its middle Bollinger band
  • RSI is neutral (54.33)
  • Volume is above average
Key levels to the upside          Key levels to the downside

1: $0.31                                     1: $0.28 

2: $0.3244                                 2: $0.27

3: $0.3328                                3: $0.266


Categories
Crypto Market Analysis

Daily Crypto Review, Nov 17 – Bitcoin Crushes $16,500; XRP Explodes to the Upside

The cryptocurrency sector has spent the day trying to reach past its recent highs as Bitcoin pushed past $16,500. The largest cryptocurrency by market cap is currently trading for $16,718, representing an increase of 2.97% on the day. Meanwhile, Ethereum gained 2.34% on the day, while XRP gained an astonishing 10.46%.

 Daily Crypto Sector Heat Map

Curve DAO Token gained 14.27% in the past 24 hours, making it the most prominent daily gainer out of the top100 cryptos ranked by market capitalization yet again today. It is closely followed by yearn.finance’s gain of 12.92% and Litecoin’s 10.99% gain. On the other hand, THORChain lost 7.28%, making it the most prominent daily loser. The Midas Touch Gold lost 6.16% while Uniswap lost 4.22%, making them the 2nd and 3rd most prominent daily losers.

Top 10 24-hour Performers (Click to enlarge)

Bottom 10 24-hour Performers (Click to enlarge)

Bitcoin’s market dominance has decreased slightly over the course of the day, with its value is currently staying at 64.9%. This value represents a 0.1% difference to the downside compared to the value it had yesterday.

Daily Crypto Market Cap Chart

The crypto sector capitalization has gone up very slightly over the course of the day. Its current value is $477.28 billion, representing a $13.89 billion increase compared to our previous report.

_______________________________________________________________________

What happened in the past 24 hours?

_______________________________________________________________________

_______________________________________________________________________

Technical analysis

_______________________________________________________________________

Bitcoin

After confirming its stance above $16,000 after fighting for it over the weekend, the largest cryptocurrency by market capitalization pushed towards $16,500 and attempted to reach new highs. The push was strong as there was no real sell pressure, so Bitcoin reached past $16,500 (and eventually past $16,700) without any real increase in volume. While the $16,500 position has been successfully tested once, the $16,700 level is still not completely won.

Trading Bitcoin on a bull trend such as this one should only happen in one direction: WITH the trend. Shorting Bitcoin and trying to catch pullbacks will be less lucrative due to the size of the move, as well as riskier due to the market sentiment.

BTC/USD 4-hour Chart

Bitcoin’s technicals are tilted towards the buy-side on all four time-frames (4-hour, daily, weekly, and monthly). However, all of them have some form of neutrality, implying that the bullish sentiment is not absolute.

BTC/USD 1-day Technicals

Technical factors (4-hour Chart):
  • Price is far above its 50-period EMA and its 21-period EMA
  • Price is near its top Bollinger band
  • RSI is approaching the overbought territory (65.02)
  • Volume is average
Key levels to the upside          Key levels to the downside

1: $17,000                                 1: $16,700

2: $18000                                  2: $16,500

3: $18500                                   3: $16,000

Ethereum

Ethereum has spent the past two days slowly moving towards the top line of the ascending channel after pulling back to $440. The move was gradual but saw some resistance when it reached the top line. However, Ethereum bulls endured and ultimately broke the level but got instantly stuck at the $470 resistance, which is another wall they have to jump over to remain above this channel.

If Ethereum’s struggles to break the $470 level continue, we may expect a pullback of some sort. With that being said, due to the overall sentiment towards Ethereum (and its 2.0 implementation) as well as the state of the crypto sector, shorting Ethereum should not be a proper trading strategy, even if ETH does pull back.

ETH/USD 4-hour Chart

Ethereum’s 1-day technicals are slightly bullish but are showing signs of neutrality. On the other hand, its 4-hour, weekly, and monthly overviews are completely tilted towards the buy-side.

ETH/USD 1-day Technicals

Technical Factors (4-hour Chart):
  • The price is above both its 50-period and its 21-period EMA
  • Price is slightly above its middle Bollinger band
  • RSI is neutral (57.54)
  • Volume is average
Key levels to the upside          Key levels to the downside

1: $470                                     1: $451

2: $490                                     2: $445 

3: $500                                      3: $420

Ripple

The fourth-largest cryptocurrency by market cap had yet another incredible day, with its price pushing past the $0.27 and even $0.2855 resistance levels. An incredible bull wave brought XRP’s price to $0.3 before it started to pull back slightly. This move has pushed XRP further up towards being the best-performing asset over a 1-week period compared to BTC and ETH, with gains of 18% this week, compared to BTC’s gains of 2.95 and ETH’s gains of 0.76.

Traders can finally look at XRP as a cryptocurrency that isn’t just used for sideways trading, and look for opportunities near new highs.

XRP/USD 4-hour Chart

XRP’s 4-hour, daily, and monthly technicals are slightly tilted towards the buy-side, and all of them are showing more or less signs of neutrality. The weekly overview is, on the other hand, completely bullish.

XRP/USD 1-day Technicals

Technical factors (4-hour Chart):
  • The price is above its 50-period EMA and its 21-period EMA
  • Price is at its top Bollinger band
  • RSI is heavily overbought (76.99)
  • Volume is above average
Key levels to the upside          Key levels to the downside

1: $0.31                                     1: $0.2855 

2: $0.3244                                 2: $0.27

3: $0.3328                                3: $0.266


Categories
Crypto Market Analysis

Daily Crypto Review, Nov 16 – Bitcoin to be Censored? Blockseer Mining Pool Enters the Game

The cryptocurrency sector has spent the weekend pretty flat as Bitcoin was experiencing a period of low volatility. The largest cryptocurrency by market cap is currently trading for $16,272, representing an increase of 1.37% on the day. Meanwhile, Ethereum lost 1.19% on the day, while XRP lost 0.69%.

 Daily Crypto Sector Heat Map

SushiSwap gained 13.81% in the past 24 hours, making it the most prominent daily gainer out of the top100 cryptos ranked by market capitalization yet again today. It is closely followed by THORChain’s gain of 9.54% and Curve DAO Token’s 4.80% gain. On the other hand, ABBC Coin lost 45.16%, making it the most prominent daily loser. The Midas Touch Gold lost 8.96% while Ampleforth lost 8.88%, making them the 2nd and 3rd most prominent daily losers.

Top 10 24-hour Performers (Click to enlarge)

Bottom 10 24-hour Performers (Click to enlarge)

Bitcoin’s market dominance has decreased slightly over the weekend, with its value is currently staying at 65%. This value represents a 0.3% difference to the downside compared to the value it had on Friday.

Daily Crypto Market Cap Chart

The crypto sector capitalization has gone up very slightly over the course of the weekend. Its current value is $463.37 billion, representing an $0.51 billion increase compared to our previous report.

_______________________________________________________________________

What happened in the past 24 hours?

_______________________________________________________________________

Blockseer, a US-based DMG Blockchain Solutions’ subsidiary, has recently announced a private beta version of a brand new Bitcoin mining pool. This particular mining pool is, however, quite unique and different. The Blockseer Mining Pool will, unlike any other mining pool, censor transactions from wallets that are blacklisted. They also plan on mandating the miners to undergo KYC procedure, according to marketing materials.

Any new blocks generated by the Blockseer pool will include only filtered transactions, and the filters will be based on the Walletscore’s data.

While some agree that this way of transacting might be the future, the vast majority of public figures say that this is pure censorship and that it goes against the basic principles of Bitcoin as a free cryptocurrency, where a transaction is a transaction, no matter where it comes from.

_______________________________________________________________________

Technical analysis

_______________________________________________________________________

Bitcoin

The largest cryptocurrency by market capitalization has spent the weekend experiencing very low volatility while fighting an incredibly important battle. Bitcoin was fighting to stay above the $16,000 mark after the move to the upside has died down at $16,500 on Nov 13, thus triggering a pullback.

An interesting outlook on Bitcoin is that the now won fight for $16,000 has created a higher low, and Bitcoin might push even higher in the following days. Traders should pay attention to volume increases around the $16,400-$16,500 mark.

BTC/USD 4-hour Chart

Bitcoin’s technicals are tilted slightly to the buy-side on the 4-hour, daily and weekly time-frames. However, all of these time-frames show signs of neutrality. On the other hand, its monthly overview is completely bullish.

BTC/USD 1-day Technicals

Technical factors (4-hour Chart):
  • Price is above its 50-period EMA and at its 21-period EMA
  • Price is near its middle Bollinger band
  • RSI is neutral (58.99)
  • Volume is slightly above average
Key levels to the upside          Key levels to the downside

1: $16,500                                 1: $16,000

2: $16,700                                 2: $15,480

3: $17,000                                  3: $14,640

Ethereum

Ethereum has, just like Bitcoin, spent the weekend fighting to stay above its support level. The second-largest cryptocurrency by market cap, however, did not manage to win its fight. Ether has triggered a pullback after bouncing from the $478 level, which caused its price to first hover around the yellow top ascending channel line until it finally broke it to the downside. The move was stopped at $440, and Ethereum has since recovered and is currently trading just below the yellow line.

Our call on Friday for Ethereum dropping below the line was correct, as ETH did exactly as expected. However, the combination of factors at the moment make Ethereum a not-so-good trade, and traders should perhaps look at other options before choosing to trade it.

ETH/USD 4-hour Chart

Ethereum’s technicals are extremely bullish on its weekly and monthly time-frames and very bullish (but not as much as the aforementioned time-frames) on its daily overview. Its 4-hour overview, however, is tilted heavily towards the sell-side.

ETH/USD 1-day Technicals

Technical Factors (4-hour Chart):
  • The price is slightly above its 50-period and slightly below its 21-period EMA
  • Price is slightly below its middle Bollinger band
  • RSI is neutral (47.32)
  • Volume is average
Key levels to the upside          Key levels to the downside

1: $470                                     1: $451

2: $490                                     2: $445 

3: $500                                      3: $420

Ripple

The fourth-largest cryptocurrency by market cap had an incredible day on Friday, as its price pushed above 2 of its major resistance levels. XRP has managed to, in a span of around 12 hours, push past the $0.26 and $0.266 levels and took the weekend to consolidate above them and create a strong foundation. The $0.266 level was tested as support twice already, successfully both times.

Traders can finally look at XRP as a crypto that moves somewhere else than sideways, and look for opportunities in places other than the range between $0.2454 and $0.26.

XRP/USD 4-hour Chart

XRP’s technicals are slightly tilted towards the buy-side on all time-frames, with more or less neutrality signs. The important change from the last report (and many reports before) is XRP’s monthly overview, which has finally turned bullish.

XRP/USD 1-day Technicals

Technical factors (4-hour Chart):
  • The price is above its 50-period EMA and slightly above at its 21-period EMA
  • Price is between its middle and top Bollinger band
  • RSI is neutral (59.63)
  • Volume is average
Key levels to the upside          Key levels to the downside

1: $0.27                                     1: $0.266

2: $0.2855                                 2: $0.26

3: $0.31                                    3: $0.2454


Categories
Crypto Guides

What Should You Know About Bitcoin Miner Capitulation?

Introduction

If you have dealt with cryptocurrencies like Bitcoin, you must know how uncertain they can be. While they can make you a millionaire within a day, they can also snatch away all your money in a short period. People who mine their money in Bitcoin have to keep a close eye on these fluctuations and ensure they take themselves out while there is still time. The same may be happening with Bitcoin.

You may have heard the experts talk about Bitcoin Miner Capitulation. Some of those also try to explain the concept in their own words. However, there is still a major confusion around the term “Miner Capitulation.” If you also want to learn more about the concept, you have come to the right place. We have collected all the crucial information on the topic to understand what exactly is happening with Bitcoin. So let’s begin.

What Is Bitcoin Miner Capitulation?

Bitcoin mining refers to the completion of verified transactions’ blocks that get appended to the blockchain. For these transactions, miners earn a reward in the form of cryptocurrency. If the miner isn’t able to manage to make out their operational costs from the Bitcoin mining process, they sell a significant amount of their mined Bitcoins. This leads to Bitcoin Miner Capitulation.

On the other hand, Miner Capitulation can also result from sudden drops in the Bitcoin market as this makes miners sell their coins. Hence, we can say that Bitcoin Miner Capitulation is when small miners can’t profit from their mining, and they back out. It creates selling stress in the market, leading to further drops in the price and a lack of buyers.

Is This First Bitcoin Miner Capitulation?

Many people dealing with Bitcoin assume this is the first time Bitcoin is experiencing a Miner Capitulation. But the facts state something different. Miner Capitulation has been seen twice in the history of Bitcoin:

  • 2016: When Bitcoin Halving took place this year, it was seen that miners began selling a significant amount of their Bitcoins.
  • 2018: Bitcoin again crashed by 50%, getting a value of $3,000 from $6,000. This led to low profits for small miners, and they again sold their Bitcoins in massive amounts.

Apart from these, the 2013 effect on Bitcoin’s price also brought in some Miner Capitulation. Therefore, this isn’t the first time Bitcoin is experiencing one such situation. It has happened whenever Bitcoin Halving takes place or the price drops down.

Is Bitcoin Miner Capitulation Something To Worry About?

It is usual for a big market like Bitcoin to host thousands or millions of transactions every day. So when some of the miners sell their coins, how does that make any difference? The answer to this question is simple, i.e., the tension of sale in the market.

With these small miners selling their coins, many other people also begin considering selling their coins. This stress rises with more sales. Moreover, it causes a lack of buyers in the market, and Bitcoin’s price falls further.

People are relating Bitcoin Miner Capitulation to more significant problems that may be seen in the upcoming times. That is why you must learn more about the current situation and take action while there is still time to save yourself from any bigger trouble.

Categories
Crypto Market Analysis

BTC/USD Weekly Chart Overview + Possible Outcomes

In this weekly BTC/USD analysis, we will be taking a brief look at the most recent events, the current chart technical formations, as well as the possible BTC price outcomes.

Overview

Bitcoin has spent the week building an ascending channel that took its price from the $14,640 level all the way to $16,500. However, the new levels are mostly unexplored (apart from the late 2017 mini-bubble), and people that already invested in Bitcoin are either holding or taking profits, while new investors are wary of entering due to the price reaching this high. This left Bitcoin with a lot of people holding, a minority taking profit, and even a smaller minority wanting to buy it at $16,500 at the moment, which triggered a pullback. This doesn’t mean that $16,500 is an overestimate of Bitcoin’s worth, but rather that the economic uncertainty around the new US presidency, an unstable stock market as well as regulatory bodies honing in on crypto are all factors in the current minor pullback.

Our previous weekly analysis has predicted the price increase to $16,500 as well as the pullback. This doesn’t mean that the bull season has ended or that bears have taken over for good, but rather that BTC entered a healthy correction phase before establishing a new price target.

Technical factors


Bitcoin has continued moving along the ascending channel started on Nov 7 and gaining in value up until the $16,500 resistance level that we called out. This level has triggered a pullback as BTC could not pass the zone of resistance. While the pullback was mostly sideways and slow, a confirmation of a real pullback happening occurred on Nov 14, when Bitcoin dropped out of the ascending channel as well as below the $16,000 psychological level.

While Bitcoin’s sentiment is extremely bullish overall, its short-term overview points to a pullback that will most likely end at the zone of support near the $15,480 level.

The hash ribbons indicator is still showing miner capitulation (ever since Oct 29), sending out a major buy signal.

Likely Outcomes

Bitcoin has one main scenario that is most likely to play out, which is its price continuing down towards the $15,480 area where it will encounter strong support, which will most likely stop it from going further down. If this happens and Bitcoin does bounce off of the $15,480 area, we may expect another push towards the recently-made highs. In this case, traders should have a clear path towards $16,500 again, and they should pay attention to BTC, possibly making a double top at its most recent high rather than surpassing the level.

A move that will end up below $15,480 is highly unlikely, simply due to the overall sentiment currently surrounding Bitcoin. However, as unlikely as it is, anything is possible, and Bitcoin might fall below the support level. In that case, traders can expect a sharp price decrease and a possible push towards the $14,640.

Categories
Cryptocurrencies

This Will Completely Change The Way You Approach Ripple

Ripple is primarily a payment network, RippleNet. Ripple is not a cryptocurrency in itself nor is it based on Blockchain technology in the same sense that Bitcoin does. RippleNet is a “decentralized” payment platform based on a distributed ledger (“interledger protocol” or “distributed ledger”) and free software that is focused on the development of international payments.

The Ripple network is decentralized but not in the same sense that the Bitcoin network is. The Ripple network operates through a list of single nodes authorised by the central authority of the network (unique node list), in this sense it is decentralised because the validation does not require intermediaries, but on the other hand, the protocol is imposed by a central entity and, nodes, in addition to being elected by this central authority, cannot “give an opinion”.

In this way, the main objective of Ripple is not the democratization of the financial system, as it could be in Bitcoin, but the dynamization of international transfers. In this sense Ripple does not present the “trade-off” between scalability and decentralization, so Ripple is perfectly scalable, currently supporting the same transactions per second as VISA. In fact, Ripple maintains that the complete decentralization of the “general ledger” is unnecessary for your purposes and for obvious safety reasons prefers that the nodes be limited and trustworthy.

“It’s only a matter of time before central banks adopt blockchain to settle high-value, inter-bank fund transfers” – CEO of Ripple in 2017

History of Ripple

Ripple’s story begins in 2004, with an idea of a Ryan Fugger, in 2005 the first version is created. In 2011 Jed McCaleb began developing XRP, a cryptocurrency that based its value on “consensus” rather than PoW (proof of work). In 2013 Ripple released its iPhone app and by 2014 Ripple has become the second-largest cryptocurrency, the German bank Fidor accepts the Ripple protocol, and its price increases by 200%. By 2015 several banks such as Santander, UniCredit, UBS, Royal Bank of Canada, and others already accepted the Ripple protocol. In 2016 Ripple licensed to operate in New York and for the following year the capitalization of the XRP reaches 10,000 million.

Between 2017 and 2018 XRP revalorized by up to 36,000%.

What does Ripple Bring?

When a national interbank transfer is made, two things can happen, or that the banks have an established relationship to carry out these or that they do not have established one and an intermediary, usually the central bank, must intervene. In the international case, the matter is complicated. For an international transfer, the main system is SWIFT (Society for Worldwide Interbank Financial Telecommunication ) in which an agency acts as an intermediary and manages the exchange of currency and the transfer, this takes time and costs money. There are also other systems such as SEPA for the euro area, where the ECB is the intermediary. The most important thing we have to bear in mind here is that there is an intermediary in transfers and this means slowness and fees.

Ripple or the RippleNet emerges as an alternative to this by proposing a relationship between banks at a global level. Ripple’s network currently has more than 100 banks (SWIFT has 11,000). However, Ripple allows you to perform instant transactions, with virtually no commissions securely. Against popular belief, RippleNet does not need a cryptocurrency to function, being able to operate directly with fiat money (fiduciary money).

For this reason, XRP, the Ripple cryptocurrency, is not essential for the use of the RippleNet. However, if it may be necessary in any case, as we shall see. It should be noted that the currency is not mineable, the company “created” 100 billion tokens and saved 20 billion of these (XRP). Not working with Pow (Proof of Work), as Bitcoin lacks intrinsic value, and with this not being mineable and subordinate to a central authority, XRP approaches the land of fiat money.

How Does Ripple Work?

RippleNet has two operating forms FIAT-FIAT and FIAT-XPR-FIAT called xCurrent and xRapid respectively. It also has a programmable access interface to facilitate the use of these two protocols called xVia.

xCurrent

This solution provides secure encrypted transactions in a decentralized manner, without any intermediary bank. The xCurrent protocol does not require XRP, it uses the “interledger protocol” (IPL), the “decentralized ledger” so that each participant has access to it. However, in the case of multi-currency transfers, it requires liquidity in the foreign exchange market to function properly.

xRapid

This protocol does use the XRP to provide liquidity. Moving funds into XRP by leveraging its liquidity to make the currency exchange, of course, the main barrier to xRapid’s growth is, of course, the liquidity of the XRP.

Price Evolution

Currently, XRP is one of the currencies with the highest capitalization after Bitcoin and Ethereum and its price reached almost 4$, now it is worth 0.23$. Their brutal price increase was possibly due to the fact that the new investors, who came in when the Bitcoin was in highs, went to other currencies thinking that the price of the Bitcoin was too high to be able to buy it or some similar issue, with total ignorance of what Ripple was. But, it is very important to consider what the cryptocurrency is conceived for if you want to bet on it.

The view that the Ripple network needed the XRP to work is popular, which encouraged many to buy. However, as we have seen, XRP is not essential for the operation of the network. It should also be borne in mind that it is the company that controls the issuance of tokens, as it says it will not issue more and there are 100,000 million but who knows..?

On the other hand, XRP does not have commissions, so a hypothetical return to the bullish market is a plus point that can take advantage of other less scalable currencies like Bitcoin. We can take advantage of the evolution of its price through CFD’s over XRP, which gives us the possibility to maintain short positions and leverage.

First of all the details presented, I wonder… Is it possible to adopt the XRP as a reserve currency in the distant future, given the progress this technology represents compared to traditional transfers? Will the price soar if this model of the movement of money is imposed internationally?

Categories
Crypto Market Analysis

Daily Crypto Review, Nov 13 – Bitcoin Above $16,000: What’s Next?

The cryptocurrency sector has spent the day equally divided between cryptos that ended up in the red and the green. The largest cryptocurrency by market cap pushed past its $16,000 mark and is currently trading for $16,291, representing an increase of 3.26% on the day. Meanwhile, Ethereum lost 0.15% on the day, while XRP gained 0.45%.

 Daily Crypto Sector Heat Map

Blockstack gained 33.78% in the past 24 hours, making it the most prominent daily gainer out of the top100 cryptos ranked by market capitalization yet again today. It is closely followed by Dash’s gain of 13.33% and Decred’s 8.98% gain. On the other hand, ABBC Coin lost 12.08%, making it the most prominent daily loser. Ampleforth lost 11.75% while Aragon lost 10.85%, making them the 2nd and 3rd most prominent daily losers.

Top 10 24-hour Performers (Click to enlarge)

Bottom 10 24-hour Performers (Click to enlarge)

Bitcoin’s market dominance has increased since we last reported, with its value is currently staying at 65.3%. This value represents a 0.8% difference to the upside compared to the value it had yesterday.

Daily Crypto Market Cap Chart

The crypto sector capitalization has gone up over the course of the day. Its current value is $462.86 billion, representing an $8.70 billion increase compared to our previous report.

_______________________________________________________________________

What happened in the past 24 hours?

_______________________________________________________________________

_______________________________________________________________________

Technical analysis

_______________________________________________________________________

Bitcoin

The largest cryptocurrency by market capitalization has tested the $16,000 mark for a long time, failing a couple of times as profit-taking chipped away too much bull power. However, BTC has officially broken the $16,000 resistance today, turning it into support. The move that pushed it past this mark has ended right at the $16,500 resistance, which held up quite well. Many say the reason for the move past $16,000 is that banks and firms are moving their funds into BTC due to uncertainties in the traditional markets (major indexes traded slightly in the red yesterday). An engulfing candle that followed the last green candle of the move, as well as RSI bouncing off of the overbought area, show that a correction is the most likely option at the moment.

Slow and steady increases in volume accompanied each of Bitcoin’s moves. Traders can use this info to enter and exit trades safely.

BTC/USD 4-hour Chart

Bitcoin’s technicals are bullish overall but are split between the 4-hour and weekly time-frames, which are more tilted towards the neutral position, and daily and monthly time-frames, which are completely bullish.

BTC/USD 1-day Technicals

Technical factors (4-hour Chart):
  • Price is well above its 50-period EMA and its 21-period EMA
  • Price is near its top Bollinger band
  • RSI is near the overbought territory (64.03)
  • Volume is slightly above average
Key levels to the upside          Key levels to the downside

1: $16,500                                 1: $16,000

2: $16,700                                 2: $15,480

3: $17,000                                  3: $14,640

Ethereum

Ethereum has continued its upward path, supported by its ascending channel top line. The second-largest cryptocurrency by market cap managed to hold itself above this level, effectively slowly increasing in price due to the slope of the support line. However, it is yet to be seen if ETH can stay above this level for long, and a potential drop below the line is quite possible.

Ethereum traders should look for ETH dropping below the top line of the ascending channel and trade off of that.

ETH/USD 4-hour Chart

Ethereum’s technicals are bullish on all time-frames, with its 4-hour time-frame being more tilted towards the neutral position and longer time-frames being completely bullish.

ETH/USD 1-day Technicals

Technical Factors (4-hour Chart):
  • The price is above its 50-period and slightly above its 21-period EMA
  • Price is slightly above its middle Bollinger band
  • RSI is neutral (53.64)
  • Volume is average
Key levels to the upside          Key levels to the downside

1: $470                                     1: $451

2: $490                                     2: $445 

3: $500                                      3: $420

Ripple

The fourth-largest cryptocurrency by market cap has had a slow day of sideways action within the range it is in for almost a week. XRP has moved slightly towards the middle of the range after it failed to break the $0.26 resistance level, entering a period of low volatility.

Traders shouldn’t really be interested in XRP at the moment due to its low volatility. However, those that want to trade XRP can enter trades with targets and stop-losses that correspond to the current support/resistance levels.

XRP/USD 4-hour Chart

XRP’s technicals on the 4-hour and daily time-frame have changed its stance from bullish/neutral to straight bullish, while its weekly time-frame is still almost completely neutral. Its monthly overview shows strong bearish sentiment.

XRP/USD 1-day Technicals

Technical factors (4-hour Chart):
  • The price is above its 50-period EMA and at its 21-period EMA
  • Price is at its middle Bollinger band
  • RSI is neutral (50.34)
  • Volume is slightly below average
Key levels to the upside          Key levels to the downside

1: $0.26                                     1: $0.2454

2: $0.266                                   2: $0.235

3: $0.27                                    3: $0.227


Categories
Cryptocurrencies

Up In Arms About Bitcoin? You’ll Want to Read This…

For the first time in history, there is the possibility of creating a new decentralized monetary system where all of us would benefit greatly. Throughout this article, it will be shown how money is being created from nothing and how Bitcoin solves the problems of the current system.

Jamie Dimon, CEO of JPMorgan, the world’s largest bank, commented that bitcoin was a bubble. In my opinion, this man being one of the only billionaire bankers earning almost 30 million a year, thanks to the current financial and banking system, it is normal that he opposes what competition does to him and can take him out of business, that is, bitcoin. The funny thing is that while Jamie Dimon was making these statements against cryptocurrency, his own bank was buying a lot of bitcoins.

Something similar happens with China, while its Central Bank wants to outlaw investments in ICOs, claiming that this new type of investment is seriously disrupting the financial and economic order, what it is doing is creating its own cryptocurrency. In fact, it is most likely the first country to create its own blockchain, since they have been experimenting for three years and have already commissioned several experts to help them carry it out.

So when this kind of negative news comes out, prices drop sharply. What happened in early September 2017 reminded me a lot of what happened last February 9 of the same year, when bitcoin plummeted by more than 10% when it became known that the Chinese Central Bank forced exchange houses to ban bitcoin withdrawals from their platforms for a month, and warned them that it would shut them down if they violated regulations.

The fact that central banks like China were so nervous about bitcoin, gave me more confidence to invest in this cryptocurrency, as the situation indicated that bitcoin should be much more powerful than most people imagined, to the extent that it could bypass the central banks, which currently have the greatest control over the economies.

A funny investment strategy would be to invest in what China prohibits, since in the past this country has banned Google, Facebook, Twitter, cloud services, Instagram, Snapchat, Pinterest, etc. So wanting to ban bitcoin, Makes me want to buy even more.

I want to point out that it is impossible to ban bitcoin or any other cryptocurrency. What governments can prohibit, is the activities of the exchange houses, that is, that these companies cannot open accounts to the citizens of the country, but they can never have any power over cryptocurrencies. In the event that a country bans these activities, its citizens could continue to have bitcoins, and from their wallets, they could continue to receive and send them. The only thing they couldn’t do is set up an account at the exchange houses.

In this way, I continue to think that prohibitions or negative comments from institutions or important people who are doing business in the traditional sector, do nothing but validate the great value of the cryptocurrency and ICOs market. So even if in the shortest term prices fall when news of this type is published, these facts will have to raise prices in the medium and long term, since this acceptance of value is what matters in the long run.

The Central Banks of other countries also start using blockchain. In the case of Russia, its central bank is also investigating and developing a blockchain. Vladimir Putin met with Vitalik Buterin, one of the founders of Ethereum, as he believes that the digital economy is essential for creating new business models, and sees Ethereum as a great tool to help Russia grow without so much dependence on oil and gas.

In this way, the Central Banks will no longer depend on monthly business surveys or the collection of data from the statistical centres, but in real-time, all the data will be available in a transparent and truthful manner, able to adapt monetary policies to an unprecedented level of precision.

But while I love to see the blockchain increasingly applied, I don’t like the central banks, banks, or governments to do it because they want to have even more control of the economy and that the current closed and centralized system will have even greater power.

How Money is Created

Governments spend more than they earn by creating deficits, and by financing it, they issue bonds, thus increasing the national debt, which we citizens pay through taxes. Banks buy these bonds and sell them to the Central Bank, with profits. To pay for this, the Central Bank, what it does, it creates money. That’s it, out of nowhere! And the banks with the money they get buy more bonds. The curious thing is that the Central Banks are private, that is, they have owners. In the case of the Fed (Banco Central Americano), its owners are also those of the big banks and oil companies. In other words, they themselves “play” with this process.

What is impressive is that more than 90% of the money is created not by the Central Banks, but by the banking system. Let’s take an example: With the money that the government obtains, it pays the salary to a soldier (most countries spend inordinately in wars), this soldier deposits 100€ to the bank. The bank keeps 10€ and 90€ it lends to Antonio. (In this case, the reserve ratio, which is the portion of deposits of a bank that must be kept in liquid reserves, is 10%). Well, from 100€ there are now 190€. Let’s continue: Antonio buys a t-shirt with his 90€, and David, who is the seller, deposits this money to the bank. Automatically, the bank again lends 90%, or 81€, so now there are 271€.

This is repeated, making an initial deposit of €100 can be converted to €1,000. And the truth is that the reserve ratio has typically been around 3% or 4%, causing even more money to be created than described in this example.

All this leads to inflation, because the more money there is in circulation, the higher the prices. In fact, the real definition of inflation should be the increase in circulating money, with rising prices simply being the symptom. So as you can see, people work in exchange for this money, which is printed or simply created by typing into a computer. Truly, each one’s wealth is his time.

To finish the process of creating money that we have just seen, what happens is that a large part of the money that is received goes into taxes. The collection of this money goes to the government to be able to pay the principal and interest of the bonds that they issue, that they possess the Central Bank, that as I have explained, they have bought previously creating the money.

During the process, interest is paid on government bonds issued and also on loans given by banks. This means that there is an intrinsic interest in every euro that exists, being a debt-based system.

To make it clear, let’s look at this example: suppose there is only one euro on the planet, and they lend it to you in exchange for interest (you have to return this euro + another euro of interest), where do you get this other euro to pay the interest? The answer is that you have to borrow this other euro, which obviously will also leave you with interest (owing this to other euro + one euro interest). So now there are 2 euros, but you owe 4.

In other words, there is never enough money to pay off the debt having there is always much more debt in the system than the money there is to pay it. The point is that with the current monetary system, debt cannot be stopped, because otherwise new money would not be created that is needed to pay off debts. In short, the inflation that results from this system is like a hidden tax that we all pay.

Currencies vs Money. Why Bitcoin

So, in view of the above, for me, the euro or any other conventional currency is not money, since one of the properties that I believe should have money is the preservation of value over time because there is a limited amount without it being possible to create new monetary units.

In this way, for me, the euro (and all other conventional currencies) is a currency in which it is better not to have our assets. I want to point out that throughout history and in any region, there have been more than 5,000 FIAT coins (which are not backed by gold or anything). The statistics are overwhelming: 100% of them have ended up worth 0. Yes, all of them!

What I do consider money is gold as it meets all the requirements to be considered money. I had always considered this metal as the best form of existing money until recently bitcoin was born. I consider bitcoin to be like digital gold, because looking at it well, I realize that it works even better than gold as money. Let us see according to the characteristics that the money must have:

Generally accepted: In this case, the bitcoin at the moment has nothing to do against gold, but therein lies the great opportunity to invest in bitcoins today, that if it becomes generally accepted by society, its price will have risen dramatically from current levels.

Portability (easily transported): With Bitcoins, I could carry billions of dollars on my mobile, pen, or app.

Indestructibility/durability: Bitcoin has no limitations or physical deterioration, within a million years every bitcoin will be exactly the same.

Homogeneity (All coins of the same quality, same weight, or same value): Undoubtedly, each bitcoin is exactly the same as another.

Divisibility: Bitcoin is divided up to 8 decimal places, with each bitcoin having 100 million units that are exactly the same.

Limited amount: There will never be more than 21 million bitcoins.

Difficult to fake or copy: It is impossible to create fake bitcoins, it is impossible for the blockchain system to accept them.

Given this, it stands to reason that bitcoin can become the money of reference. The problem that has existed recently with gold is that it is heavily manipulated by banks and central banks because it is not in their interest for them to revalue themselves and for the population to prefer to use this type of money instead of the currencies like the euro that they can print unlimited. So, without a doubt, another advantage of bitcoin over gold, is that it cannot be manipulated or controlled by anyone.

Throughout history, all empires have followed the same pattern:

-You start using good money (gold, silver, or gold-backed coins).

-Taxes are imposed and public works are created.

-As the economy grows, politics is increasingly influential, and spending on armies is rising sharply.

-Normally there are wars and expenses are enormous.

To finance the war, they “steal” the wealth of citizens by degrading the value of coins with conventional metals (in our case, today, the euros are made of nickel, steel, copper, aluminum, zinc, and tin. If we melted a 2 euro coin, the value of the material would barely exceed 2 cents). In this way, in every empire, there always comes a time when money can be created unlimitedly. It is usually followed by an economic crisis.

The loss of purchasing power is perceived by the population as prices rise, and confidence in the currency is lost. (We are currently at this point. It is not uncommon to hear on the street “politicians are thieves”, “banks are scammers”… In addition, today, with the internet, I think it will take less time to move to the next phase.)

There is a large movement of money from currencies to precious metals or other tangible assets. The currency falls into nothing, and assets like gold and silver go up a lot in price by hoarding the value that was in the currency. This great transfer of wealth benefits those who have real money, such as gold or bitcoins. And this is the interesting point: whoever owns bitcoins can rest assured that he will maintain his purchasing power and if the day of the great transfer of value comes, then he will benefit greatly.

Changes in the Monetary System – What’s Next?

Let’s see what changes have taken place in the global monetary system in the last century and a half:

  • Gold-Standard (1879-1914): each dollar is backed by the equivalent value in gold (100%)
  • Gold Exchange Standard (1914-1944): the dollar is partially backed by gold. (40%)
  • Bretton Woods System (1944-1971): Virtually every currency in the world is backed by the dollar, with a fixed exchange rate. The dollar also continues to be partially backed by gold.
  • Dollar-pattern (1971-present): the dollar completely abandons the backing of gold (0%). This means that all other currencies, too.

Seeing that the previous monetary systems lasted 35, 30, and 27 years respectively and that now we have already 46 years with the Pattern-Dollar, it is not uncommon to think that it is time for the current system to change and that possibly in the future we will find the point “5)” starting in this decade, to be called something like “Pattern-Decentralized”, representing the new model with bitcoin and other cryptocurrencies.

As for the acceptance of Bitcoin, today there are already many large companies that accept it, such as Microsoft, Tesla, Dell, Paypal, Subway, WordPress, Expedia, Bloomberg, Virgin, Zynga, Lionsgate, Rakuten, Victoria’s Secret, etc.. in fact there are thousands and it grows exponentially. Right here in Spain, the Red Lyra consortium was formed a few months ago, where companies such as Santander, BBVA, B.Sabadell, Bankia, Iberdrola or Endesa are entering this sector. The same applies to other consortia, with companies such as IBM, Samsung, Intel, Cisco, JPMorgan, Accenture, Deloitte, SAP, Airbus, and hundreds more.

How can we take advantage of all this? Very simple, investing in Bitcoins. The most sensible thing would be to have much of the personal wealth in assets such as real estate or precious metals such as gold. Now, I think a part should be kept in Bitcoins and by the way, some other cryptocurrencies in particular. The cryptocurrency market is full of opportunities.
Categories
Crypto Market Analysis

Daily Crypto Review, Nov 12 – Bitcoin Formed a Triple Top? Ethereum Accidentally Hard Forks

The cryptocurrency sector has spent the day mostly consolidating, with roughly the same amount of cryptocurrencies ending the day in the green and the red. The largest cryptocurrency by market cap is currently trading for $15,802, representing an increase of 2.68% on the day. Meanwhile, Ethereum gained 0.24% on the day, while XRP gained 0.60%.

 Daily Crypto Sector Heat Map

Blockstack gained 17.15% in the past 24 hours, making it the most prominent daily gainer out of the top100 cryptos ranked by market capitalization. It is closely followed by OMG Network’s gain of 12.03% and ICON’s 11.46% gain. On the other hand, yearn.finance lost 10.37%, making it the most prominent daily loser. Loopring lost 9.34% while Synthetix lost 8.90%, making them the 2nd and 3rd most prominent daily losers.

Top 10 24-hour Performers (Click to enlarge)

Bottom 10 24-hour Performers (Click to enlarge)

Bitcoin’s market dominance has increased slightly since we last reported, with its value is currently staying at 64.5%. This value represents a 0.6% difference to the upside compared to the value it had yesterday.

Daily Crypto Market Cap Chart

The crypto sector capitalization has gone up over the course of the day. Its current value is $454.16 billion, representing an $8.04 billion increase compared to our previous report.

_______________________________________________________________________

What happened in the past 24 hours?

_______________________________________________________________________

Ethereum had quite a bad day, as its consensus reached an unexpected hard fork. This issue is considered the one holding the most weight ever since the DAO debacle from 4 years ago. The developers are still looking into the issue, and things will be fully understood at a later date.

Ethereum essentially hard forked right when its developers introduced a new update to the chain, and those who haven’t upgraded yet (including Blockchair, Infura, and other miners) got stuck in a minority chain for around 30 blocks (2 hours).

_______________________________________________________________________

Technical analysis

_______________________________________________________________________

Bitcoin

The largest cryptocurrency by market capitalization has pushed towards the upside, reaching as far as $15,990 but not being able to break the $16,000 mark. This failure to break its immediate resistance level has caused another (third) top to form, marking a possible short-term trend reversal as a possibility if Bitcoin doesn’t move up quickly.

Traders should trade carefully around this level and be prepared to trade the pullback or the spike. While these “, ride the trend” trades are hard to predict in terms of when they start, they are easy to trade once the entry happens.

BTC/USD 4-hour Chart

Bitcoin’s technicals are bullish on all time-frames. However, its 4-hour and monthly time-frames are completely bullish, while its daily and weekly overviews are showing signs of neutrality or even slight bear presence.

BTC/USD 1-day Technicals

Technical factors (4-hour Chart):
  • Price is above its 50-period EMA and slightly above its 21-period EMA
  • Price is slightly above its middle Bollinger band
  • RSI is near the overbought territory (64.15)
  • Volume is slightly above average
Key levels to the upside          Key levels to the downside

1: $16,000                                 1: $15,480

2: $16,400                                 2: $14,640

3: $16,700                                  3: $14,100

Ethereum

Ethereum has stayed above the top line of its ascending channel but could not break the resistance zone above $470. However, its price didn’t react negatively to the news of the algorithm failure and an unplanned mini hard fork, which is quite a bullish outcome of events.

Ethereum traders should watch out for how the second-largest cryptocurrency by market cap navigates the range between the top line of the ascending channel and its $470 resistance level.

ETH/USD 4-hour Chart

Ethereum’s technicals are bullish on all time-frames, with its 4-hour and monthly time-frames being completely bullish and its daily and weekly overviews showing signs of neutrality or even slight bear presence.

ETH/USD 1-day Technicals

Technical Factors (4-hour Chart):
  • The price is above its 50-period and slightly above its 21-period EMA
  • Price is above its middle Bollinger band
  • RSI is neutral (60.34)
  • Volume is average
Key levels to the upside          Key levels to the downside

1: $470                                     1: $451

2: $490                                     2: $445 

3: $500                                      3: $420

Ripple

The fourth-largest cryptocurrency by market cap has suffered a minor pullback after failing to break its immediate resistance level ($0.26). XRP is still trading within a range bound by $0.2454 to the downside and $0.26 to the upside, while its range is even more narrow lately, as its price is hovering only the top portion of the range.

Traders still have the opportunity to trade XRP’s sideways action without much risk. On the other hand, if the volume does increase drastically, a move towards the upside is much more likely, unless Bitcoin’s potential move down brings every other crypto down with it.

XRP/USD 4-hour Chart

XRP’s technicals on the 4-hour, daily, and weekly time-frame are bullish with slight hints of neutrality. On the other hand, its monthly overview is heavily tilted towards the sell-side.

XRP/USD 1-day Technicals

Technical factors (4-hour Chart):
  • The price above its 50-period EMA and slightly above its 21-period EMA
  • Price is slightly above its middle Bollinger band
  • RSI is neutral (55.12)
  • Volume is average
Key levels to the upside          Key levels to the downside

1: $0.26                                     1: $0.2454

2: $0.266                                   2: $0.235

3: $0.27                                    3: $0.227


Categories
Crypto Market Analysis

Daily Crypto Review, Nov 11 – Mempool Cleared! Bitcoin Fees Plummet

The cryptocurrency sector has spent the day consolidating and preparing for the next move and setting up valid technical formations. The largest cryptocurrency by market cap is currently trading for $15,377, representing an increase of 0.01% on the day. Meanwhile, Ethereum gained 2.08% on the day, while XRP gained 1.14%.

 Daily Crypto Sector Heat Map

Loopring gained 30.64% in the past 24 hours, making it the most prominent daily gainer out of the top100 cryptos ranked by market capitalization. It is closely followed by UMA’s gain of 24.45% and yearn.finance’s 17.59% gain. On the other hand, Decentraland lost 13.96%, making it the most prominent daily loser. Decred lost 9.94% while HedgeTrade lost 8.76%, making them the 2nd and 3rd most prominent daily losers.

Top 10 24-hour Performers (Click to enlarge)

Bottom 10 24-hour Performers (Click to enlarge)

Bitcoin’s market dominance has decreased slightly since we last reported, with its value is currently staying at 63.9%. This value represents a 0.3% difference to the downside compared to the value it had yesterday.

Daily Crypto Market Cap Chart

The crypto sector capitalization has gone up slightly over the course of the day. Its current value is $446.12 billion, representing a $4.38 billion increase compared to our previous report.

_______________________________________________________________________

What happened in the past 24 hours?

_______________________________________________________________________

Bitcoin’s transaction fees have plummeted as its mempool got cleared, reaching its smallest size since the middle of Oct. This means that hundreds, if not thousands of unconfirmed transactions, got included in the recent blocks, leaving the blockchain clear and unclogged. The mempool clearing has been attributed to a 42% increase in hash rate, which happened just a couple of days ago as Chinese miners completed their migration from the Sechuan region.

At the moment, the median transaction fee is 3 sat/byte, or roughly $0.11.

_______________________________________________________________________

Technical analysis

_______________________________________________________________________

Bitcoin

The largest cryptocurrency by market capitalization has spent the day trading in a narrow range between $15,100 and $15,500, trying to pass the $15,480 level with confidence. However, as this did not happen, we are seeing a possible lower high forming. The flat RSI and volume dropping signal a “calm before the storm,” which means that traders should prepare for a sharp move soon.

Traders should wait for Bitcoin to choose its short-term direction and trade only if Bitcoin confidently goes above $15,480 or below $15,420 with significant volume.

BTC/USD 4-hour Chart

Bitcoin’s technicals are bullish on all time-frames. However, its shorter time-frames are showing signs of neutrality, or even slight bearish presence, while its monthly overview is completely bullish.

BTC/USD 1-day Technicals

Technical factors (4-hour Chart):
  • Price is above its 50-period EMA and right at its 21-period EMA
  • Price is at its middle Bollinger band
  • RSI is neutral (54.44)
  • Volume is average
Key levels to the upside          Key levels to the downside

1: $15,480                                 1: $15,420

2: $16,400                                 2: $14,640

3: $16,700                                  3: $14,100

Ethereum

Ethereum has, unlike Bitcoin, had a great day as its price propelled past the top line of the ascended channel. The price increase is mainly attributed to great news regarding its 2.0 update adoption, as its deposit contracts top 22.5 million only one week after launch.

However, while the price increase is certainly a great thing, Ethereum is currently entering a strong resistance zone (above $460), which may cause problems for the ETH bulls.

Traders should pay close attention to how (and if) Ethereum pulls back or continues upwards. If Bitcoin doesn’t make any moves, it’s safe to assume that Ethereum will pullback in the short future.

ETH/USD 4-hour Chart

Ethereum’s technicals show “extreme buy” daily, weekly, and monthly time-frames, while its 4-hour overview is slightly more neutral.

ETH/USD 1-day Technicals

Technical Factors (4-hour Chart):
  • The price is above both its 50-period and its 21-period EMA
  • Price is at its top Bollinger band
  • RSI is neutral (60.73)
  • Volume is average
Key levels to the upside          Key levels to the downside

1: $470                                     1: $451

2: $490                                     2: $445 

3: $500                                      3: $420

Ripple

The fourth-largest cryptocurrency by market cap has continued trading within a range, bound by $0.2454 to the downside and $0.26 to the upside. XRP has spent the day slowly increasing its price, but the one attempt it had of pushing past $0.26 got shut down quickly.

Traders are safe to assume that XRP will trade within the same range and that they can trade the sideways action. On the other hand, if the volume increases drastically, a move towards the upside is much more likely than one towards the downside (unless fueled by Bitcoin’s move).

XRP/USD 4-hour Chart

XRP’s technicals on the 4-hour and weekly time-frame are slightly bullish with slight hints of neutrality, while its daily overview is bullish. On the other hand, its monthly overview is tilted towards the sell-side.

XRP/USD 1-day Technicals

Technical factors (4-hour Chart):
  • The price above its 50-period EMA and slightly above its 21-period EMA
  • Price is slightly above its middle Bollinger band
  • RSI is neutral (52.36)
  • Volume is average
Key levels to the upside          Key levels to the downside

1: $0.26                                     1: $0.2454

2: $0.266                                   2: $0.235

3: $0.27                                    3: $0.227


Categories
Crypto Daily Topic Cryptocurrencies

What’s Troy Trade (TROY) All About?

With decentralized finance edging closer to the mainstream every day, all manner of DeFi products have been launched to cater to a fast-growing user base. You can now carry out your usual trades and a raft of other activities in a decentralized, secure, and borderless environment powered by the blockchain. 

Troy, launched in 2018, is one such platform. Troy claims to “redefine trading beyond exchange,” signaling to the many possibilities it avails to users. Troy incorporates modern technology like artificial intelligence to achieve safe and frictionless interactions with its products. The Troy platform currently runs on Ethereum but plans to switch to its mainnet in December 2020. 

This article is a deeper dive into the Troy ecosystem. 

Breaking Down Troy 

Troy is a full-stack, blockchain-powered environment for financial and brokerage services. Both individual and institutional traders can access a raft of services such as spot and margin trading, derivatives, lending, borrowing, and staking. Troy wants to achieve this main objective: provide users with decentralized, diversified, and affordable brokerage services for people of all regulatory backgrounds and financial habits.

Some of the project’s highlights include: 

  • Aggregated trading: Troy offers users direct access to the aggregated liquidity of multiple exchanges. Some of the functions on offer include dark pools, assignment services, and smart order routing. 
  • Data analytics: Troy helps customers make informed trading decisions by providing them with blockchain, trading, market, and media data. This data is optimized by artificial intelligence and quantitative models. 
  • Diversified brokerage services: Users can access a range of brokerage services from real-time fund transfer to settlement to OTC trading
  • Broad range asset management solutions: Troy users have access to a full-stack solution complete with straight-through processing, historical data, and a strategy assessment tool

Troy: Architecture

The Troy network is divided into smaller core subsystems, with each running independently of the other but all interoperable. Some of the core subsystems include, but are not limited to: user subsystem, market subsystem, trade subsystem, management subsystem, and gateway subsystem.

The trade subsystem is the most important of the subsystems, hosting the order transaction module,  scheduled scheduling module, etc. Users can create new trading accounts on the platform and immediately get to depositing, withdrawing, and sending and receiving crypto assets. They can also link existing trading accounts on various crypto exchanges to the Troy protocol through the use of application programming interfaces (APIs). 

You can also authorize other users to trade using your account and generally manage your account using the risk management module. Troy’s trading interface also allows you to move seamlessly between accounts and carry out cross-exchange trades. 

The platform’s data monitoring interface allows you to keep tabs with real-time market movements and utilize the mainstream trading execution algorithm to make better trades. And lastly, the data analysis module allows you to access real-time data from the most popular exchanges, as well as spot and margin trading data. 

Community Growth Strategies of Troy

The Troy team will deploy several strategies to expand the project’s growth and recruit more members into its fold. The Troy community is made of these participants:

  • Crypto investors, which are the main user base of Troy
  • Stakers and relayers: Network participants who update and record orders on the blockchain
  • Exchanges: These are liquidity and custodial service providers
  • Ecological partners: These are projects both in the blockchain and traditional finance space which contribute to the Troy ecosystem one way  or another

Troy will engage with these community groups in the following ways: 

  • Partner with programs such as the Global Financial Partnership Program to help expand global reach
  • Expand user base through programs like the Troy Token Challenge and the Troy Hercules Ambassador Program
  • Offer users incentives like mining rewards, staking rewards, etc. to attract more users

Future strategies include the following: 

  • Partner with product-oriented platforms such as quantity providers, wallets, and exchanges 
  • Open access for more Fiat channels such as JPY, EUR, USD, etc

The Troy Token

The native token of the Troy network is stylized as TROY. The token has these use cases: 

  • As a means of access to various Troy services 
  • As a deflationary mechanism: the Troy token will be occasionally burnt to rebalance supply and demand
  • As gas fees for interacting with the protocol
  • As fees for various functions, like trading and settlement
  • As an incentive mechanism for brokers for their contribution in maintaining the platform
  • As an incentive mechanism for relayer nodes to update, broadcast and  synchronize orders in a timely and accurate manner
  • As a staking mechanism for brokers to maintain global networks

Token Distribution

The Troy token was distributed in this fashion: 

  • Private sale tokens: 12%
  • Binance launchpad sale tokens: 8%
  • Team and advisors’ tokens: 10%
  • Ecosystem tokens: 10%
  • Mining rewards tokens: 60%

As of 27th October 2020, the TROY token traded at $0.002708, with a market cap of $24,854,424 that placed it at #293. The token had a 24-hour volume of $828,108, with a circulating and total supply of $9, 176,552, and 10 billion, respectively. TROY’s highest-ever price was $0.010834 (Dec 06, 2019), while its lowest-ever was $0.001330 (Mar 16, 2020). 

Where to Buy and Store TROY

TROY token is listed as a market pair of BNB, USDT, BNB, and KRW on exchanges such as Bilaxy, Binance, Binance DEX, XTheta Global, Bitribe, and HBTC. 

Troy is an ERC-20 token, meaning you can store it in any Ethereum-compatible wallet. Great choices include MyEtherWallet, MetaMask,  Ledger, Parity, Guarda, Atomic Wallet, Coinomi, and Trust Wallet.

Categories
Cryptocurrencies

Omni Wallet review 2020: How Safe is Omni Wallet?

On the web wallet website, this crypto storage vault is described as a web wallet dedicated to bridging the gap between “security, usability, and multi-currency support.” It is an open-source web wallet developed by OmniLayer Technology Company in 2013.  Originally referred to as Mastercoin, the Bitcoin-based protocol rebranded to Omni in 2016. Since then, Omniwallet’s development team has committed to the continued improvement of this multi-currency wallet’s features and functionalities that the team considers a work in progress.

On the Omniwallet website, this crypto vault is described as a protocol layer that is built on the Bitcoin blockchain. It is a custodial wallet that stores digital assets in highly secure company servers but also allows you to create personalized servers to host your private keys.

In this Omniwallet review, we want to determine if the wallet lives up to its security and usability promise. And to achieve this, we will detail its key features, the safety measures it has put in place, provide you with a step by step guide on how to use Omninwallet, and tell you everything you need to know about this hot wallet.

Omni Wallet key features:

Multicurrency support: Though it is built on the Bitcoin blockchain, Omniwallet is considered a multicurrency wallet that supports both Bitcoin and Omnilayer native tokens.

Built-in exchange: OmniLayer runs a decentralized crypto exchange that it has integrated on the Omniwlalet. It is fast in processing crypto transactions, maintains competitive transaction fees, and introduces wallet users to a wide range of cryptocurrencies, tokens, and stable coins.

Web-based: Omniwallet is purely web-based and compatible with virtually all popular browsers. Therefore, you don’t have to download or install crypto apps to access the wallet or interact with its services.

Own hosting: Omniwallet stores all the data, especially the private keys, in the highly secure OmniLayer servers. You nevertheless are free to create personalized servers like Amazon AWS that you can then use to host your private keys.

Omni Wallet security features:

Password: Like virtually all other cryptocurrency vaults, Omniwallet is secured with a wallet that you set when creating a user account. You will need it, alongside the wallet ID, to access the Omnilayer servers and interact with your private keys.

Open-sourced: According to Omniwlalet, everything about their wallet “is open source from the ground up.” Anyone can, therefore, view and critique their source code that is currently accessible on both the company website and GitHub repository.

Multifactor authentication: You can add a second and even a third layer of protection around your wallet using compatible platforms like Google Authenticator or email address to receive special codes that you can use to log in to the wallet.

Integrates Bitcoin armory: Bitcoin Armory is a specialized online Bitcoin wallet that stores your private keys in offline cold storage. Bitcoin armory also allows you to transact offline and only come online to broadcast the transaction.

Client-side encryption: The fact that Omniwlalet stores private keys on your behalf implies a lot of communication between the wallet and company servers. Client-side encryption here implies that communications between your Omni wallet and Omnilayer servers, as well as third-party systems, are encrypted before they leave your browser.

Hierarchically deterministic: By ensuring that the process of generating new wallet addresses is hierarchically deterministic, Omniwallet helps you mask your online crypto transactions by hiding your real wallet address, effectively throwing off crypto trackers.

Watch-only mode: When logging into your Omniwallet from an unsecured browser or compromised internet connections, you can opt to log in to its watch-only mode. This allows you to view crypto balances and crypto history but makes it impossible to view the private keys, alter the wallet settings, or transfer cryptos out.

How to activate/ setup the Omni Wallet

Step 1: Open the Omniwlalet.org website and click on the “Create Wallet” tab

Step 2: Create a unique password for the wallet and enter a valid email address

Step 3: You will receive your unique wallet ID in your email. You will need it together with the password to log in to your user account.

Step 4: Log in to the Omniwallet. Click on the three bars on the top left corner of the user dashboard, and under wallet options, select Backup to generate the backup for your wallet.

Step 5: You will be prompted to enter the wallet password for verification, after which you can download the wallet backup. Copy it to a USB stick or PC and store it safely offline.

Step 6: Your Omniwallet is now active and ready for use

How to add/ receive Crypto into Omni Wallet:

Step 1: Log in to your Omniwallet and click on the My Wallet tab.

Step 2: Use the My Address tab to see all the wallets hosted on the wallet.

Step 3:  Select the coin you want to receive to reveal the wallet address and QR code

Step 4: Copy either and forward them to the individuals sending you cryptocurrencies.

How to send crypto from Omni Wallet:

Step 1: Log in to your Omniwallet and click on the My Wallet tab.

Step 2: Use the My Address tab to see all the cryptocurrencies hosted on the wallet

Step 3: Click on the “Send” button at the far right of the user dashboard.

Step 4: On the “Send from” section, select the wallet address from whence to send the cryptos, then enter the recipient’s wallet address and the amount to send

Step 5: Confirm that the transaction details are correct and hit send.

Omni Wallet ease of use:

The process of creating a user account on Omniwallet is easy and straightforward. The wallet also maintains one of the cleanest, intuitive, and beginner-friendly user interfaces. The fact that it is a web wallet also means that it is easily accessible from virtually any browser and on the move.

The process of sending and receiving cryptocurrencies in and out of the wallet or backing up its contents is also easy and straightforward.

Omni Wallet supported currencies:

Omniwlalet will only support three cryptocurrencies: Bitcoin, Omni token, and Test Omni Token.

Omni Wallet cost and fees:

Omniwallet is free. However, you will be required to pay a small and highly variable transaction fee every time you send cryptos out to another wallet or exchange.

Omni Wallet customer support:

On the Omniwallet website is the FAQ section that hosts how-to guides for the wallet. It also highlights some of the common challenges faced by Omniwallet users and how to overcome them.

You will also find the ‘Contact Us’ page that provides users with the support email and hosts the wallet’s knowledge base. For technical queries, consider direct messaging Omniwallet’s customer support team on Facebook or Twitter.

What are the pros and cons of using the Omni Wallet?

Pros:

  • It is ultralight and doesn’t require you to download a node or app.
  • It is highly transparent as it embraces an open-sourced design.
  • It embraces such advanced crypto security features as client-side encryption and Bitcoin Armory.

Cons:

  • It stores private keys on your behalf.
  • It will only support a limited number of crypto.

Comparing Omni Wallet with other Custodial crypto wallets

Omni Wallet vs. eToro wallet

Omni and EeToro are similar because they both are custodial wallets, storing private keys and other sensitive data on your behalf. They have also integrated similar functional and security features, such as a decentralized exchange. They are also free and maintain very competitive transaction fees.
However, while Omniwallet is a Bitcoin-only crypto storage vault, eToro is more versatile and supports 100+ cryptos and tokens. Similarly, Omniwlallet’s customer support team may be considered a little lackluster and sluggish than the highly responsive team maintained by eToro.

Verdict: Is Omni Wallet safe?

The most significant blow to Omniwlalet’s claim of maintaining one of the most secure crypto wallets is that it is a web-wallet exposed to the inherent threats facing hot wallets. It has tried to address this challenge by introducing client-side encryption, self-hosted servers, and even the ultra-secure Bitcoin Armory.

Categories
Crypto Market Analysis

Daily Crypto Review, Nov 10 – Bitcoin Miners Migrated: BTC Hash Rate Up 42%

The cryptocurrency sector has spent the day mostly consolidating and preparing for the next move and setting up technical formations. The largest cryptocurrency by market cap is currently trading for $15,288, representing a decrease of 1.14% on the day. Meanwhile, Ethereum lost 1.70% on the day, while XRP lost 0.8%.

 Daily Crypto Sector Heat Map

Civic gained an astonishing 101.35% in the past 24 hours, making it the most prominent daily gainer out of the top100 cryptos ranked by market capitalization. It is closely followed by Golem’s gain of 29.25% and Decentraland’s 22.26% gain. On the other hand, Loopring lost 9.76%, making it the most prominent daily loser. Synthetix lost 7.39% while Energy Web Token lost 7.35%, making them the 2nd and 3rd most prominent daily losers.

Top 10 24-hour Performers (Click to enlarge)

Bottom 10 24-hour Performers (Click to enlarge)

Bitcoin’s market dominance has decreased slightly since we last reported, with its value is currently staying at 64.2%. This value represents a 0.1% difference to the downside compared to the value it had yesterday.

Daily Crypto Market Cap Chart

The crypto sector capitalization has gone down slightly over the course of the day. Its current value is $441.50 billion, representing a $4.29 billion decrease compared to our previous report.

_______________________________________________________________________

What happened in the past 24 hours?

_______________________________________________________________________

The past 24 hours were characterized by a slow price movement of the crypto sector. However, a lot of important news reached the public’s eye. Bitcoin Miners finished up on Sichuan’s migration, triggering a hash rate spike of 42% in the past 2 days. Ethereum has been performing great, and news of its 2.0 version is all over the place, with the most recent one being that the number of addresses surpassing 32 ETH (the amount required to be a validator) is at an all-time high. On the other hand, Bitcoin SV brought bad news to the sector, as its multi-sig feature got compromised, causing enormous losses for its users.

_______________________________________________________________________

Technical analysis

_______________________________________________________________________

Bitcoin

The largest cryptocurrency by market capitalization is trading in a very uncertain zone at the moment. Its price has most likely created a double top formation, indicating a possible pullback in the short-term. This prediction is even more convincing as we can see that Bitcoin can’t get past the $15,480 resistance after trying for over 12 hours. However, the overall sentiment around the cryptocurrency is extremely bullish, and its downside is protected by the ascending (yellow) line.

With that being said, traders should wait for Bitcoin to choose its direction and trade only if Bitcoin spikes above $15,480 or below $15,420 with significant volume.

BTC/USD 4-hour Chart

Bitcoin’s technicals are bullish on all time-frames. The only difference compared to yesterday was that every single time-frame is completely bullish and with almost no neutrality present (as opposed to yesterday, when neutral sentiment could be seen on some overviews).

BTC/USD 1-day Technicals

Technical factors (4-hour Chart):
  • Price is above its 50-period EMA and right at its 21-period EMA
  • Price is at its middle Bollinger band
  • RSI is neutral (53.60)
  • Volume is average
Key levels to the upside          Key levels to the downside

1: $16,400                                 1: $15,480

2: $16,665                                 2: $14,640

3: $17,260                                  3: $14,100

Ethereum

Ethereum has been playing around the upper line of the ascending channel (yellow dotted line) and constantly going above and under it. At the moment, its price is under the line, and any attempts of getting past it have been extinguished quickly. This most likely means that Ethereum failed to establish itself above the $451 level, which could trigger a correction towards the 50-period moving average, and ultimately the bottom channel line.

Traders should pay close attention to volume, as they will not have a lot of time to join in on the trade towards the downside. Placing a stop-loss right above the ascending channel top line should be a “safe bet.”

ETH/USD 4-hour Chart

Ethereum’s technicals are tilted heavily towards the buy-side on its 4-hour and monthly overview, while the neutral sentiment is heavily present on its daily and weekly charts.

ETH/USD 1-day Technicals

Technical Factors (4-hour Chart):
  • The price is above its 50-period and slightly above its 21-period EMA
  • Price is at its middle Bollinger band
  • RSI is neutral (55.58)
  • Volume is slightly elevated
Key levels to the upside          Key levels to the downside

1: $451                                     1: $445

2: $470                                     2: $420 

3: $490                                      3: $415

Ripple

The fourth-largest cryptocurrency by market cap continued its consolidation phase right above the $0.2454 level, which is considered a major pivot point in XRP’s trading in the recent past. XRP created a double bottom at this level, possibly indicating a push towards the $0.26 in the short term.

Traders should still be safe to assume that XRP will trade within the range and that they can trade the sideways action. However, if the volume increases drastically, a move towards the upside is much more likely (if not fueled by Bitcoin’s move).

XRP/USD 4-hour Chart

XRP’s technicals on the 4-hour, daily, and weekly time-frame are all tilted towards the buy-side. However, neutral sentiment can be seen in all of them. On the other hand, its monthly overview also has the same neutrality amount but is tilted towards the sell-side.

XRP/USD 1-day Technicals

Technical factors (4-hour Chart):
  • The price slightly above its 50-period EMA and at its 21-period EMA
  • Price is slightly below its middle Bollinger band
  • RSI is neutral (49.69)
  • Volume is average
Key levels to the upside          Key levels to the downside

1: $0.26                                     1: $0.2454

2: $0.266                                   2: $0.235

3: $0.27                                    3: $0.227


Categories
Crypto Videos

Microstrategy Will Hold $250 Million Worth Of Bitcoin For 100 Years!


This company will hold $250 million worth of Bitcoin for 100 years!

Microstrategy has announced that it has purchased a whopping 21,454 Bitcoin (worth $250 million) on Aug 11. The company’s CEO, Michael Saylor, announced publically that he will hold his company’s Bitcoin for 100 years, and that he has no intention of selling it.
This investment is now worth more than $290 million, representing a 16% increase in just over two months. On top of that, Microstrategy has purchased even more Bitcoin since.
In an interview with Real Vision CEO Raoul Pal, Saylor stated that the investment was not speculation, nor a hedge, but rather a deliberate corporate strategy with the goal of adopting the Bitcoin standard. The decision to invest over $250 million was discussed between its board of directors and the firm’s investors, as well as auditors.

Microstrategy decided to restructure its investment strategy in response to recent global economic uncertainty. The company is looking to explore assets better-suited to providing a long-term store of value, and they stated that Bitcoin is one of them.
After considering a variety of options and looking at it from a 100-year investment perspective, Saylor decided that Bitcoin was the only option. Taxes and fees kill almost all other assets, he concluded, and those that remain are instead severely crippled because they are controlled by either a CEO, government, or country.

Bitcoin, however, is evolving and gets harder, stronger, and faster over time, Saylor concluded. He described Bitcoin as a “hive of cybernetic hornets that are protected by a wall of encrypted energy.”
When asked about Ethereum as an alternative to Bitcoin, Saylor told Pal that it didn’t compare, as Ethereum is “still chasing after functionality.” He added that “it still has to be proven, as there are centralized competitors to it.”
Saylor’s bullishness on Bitcoin is clear, especially when he said that the fact that Bitcoin is so big when compared to all other cryptocurrencies, literally, “the market is screaming to you that this is a winner and that it’s eating the world.”

Saylor asserted that Bitcoin is the world’s best collateral and that it doesn’t even compare to gold or any other commodities in the long run. He said that if you hold $100 million in fiat currency for 100 years, you will lose 99% of it. If you held gold, you would still lose 85% at best.
Saylor described Bitcoin as an asset that is performing similar monetary utilities as gold, except better and without the fear of dilution.
Among many things he likes about Bitcoin, Saylor said that he thinks it’s important that anybody can inspect the fact that he owns the Bitcoin in one second and that it can be sent anywhere in the world for not even $5. He added that he could if he wanted, liquidate $100 million Bitcoin on “a Saturday afternoon.”

His thoughts about the crypto community were that many people believe he has weak hands, as they were saying that he will dump it very soon. However, Saylor added that the people calling him out don’t understand the mindset of long.
Saylor finished the two-hour-long interview by stating that his executives are paying close attention to developers in the crypto space and that any further opportunities will be exploited by him and his team.

Categories
Crypto Videos

The UK Bans Retail Investors From Using Crypto Derivatives!

The UK Bans Retail Investors From Using Crypto Derivatives Starting January 2021

The UK’s Financial Conduct Authority has banned the sale of cryptocurrency derivative products to retail investors. This move was followed by the statement that the ban will save its targeted customers £53 million (or $68.9 million) of losses each year. The ban will be in effect starting Jan 6, 2021.
In a statement that came out on October 6, the FCA declared that the sale, marketing, as well as distribution of any derivatives by any local or foreign company operating in the UK is banned. This includes contracts for difference, futures, options, and exchange-traded notes.
The Authority said that derivatives based on digital assets such as Bitcoin or Ethereum are “ill-suited for retail consumers due to the risk they pose.” The FCA outlined numerous risks that it considers are originating from trading such products, including a lack of “reliable basis for valuation,” possible market manipulation, as well as “extreme” price volatility.

It stated that retail clients generally lacked a “legitimate investment need to invest in these products,” as well as that the average retail investor did not fully understand derivatives trading. The ban was first proposed in July 2019, and it doesn’t affect the trading of cryptocurrencies such as Bitcoin, which are not FCA regulated, but only the derivatives of such assets.
Retail investors currently holding crypto derivatives will be allowed to keep them for as long as they want. Sheldon Mills, FCA’s interim executive director of strategy and competition, said that the significant price volatility, combined with the difficulties of valuing crypto assets reliably place retail consumers at a high risk of suffering major losses from trading crypto derivatives.

Shares of companies that offer the banned derivatives plummeted in London trading on Tuesday, Oct 20. CMC Markets dropped 2.8%, Plus500 fell 2.1%, while IG Group Holdings slid as much as 3.3%. An executive at Coinshares, a UK-based exchange that offers a variety of crypto derivatives, criticized the FCA’s decision. They also stated that the ban “will not result in more savings and benefits, but it will rather simply drive UK retail investors to unregulated crypto exchanges.”

The FCA ban can be seen as further evidence of the UK turning its back on innovation and on regulatory coordination with other jurisdictions,” said the aforementioned executive.

Categories
Crypto Market Analysis

Daily Crypto Review, Nov 9 – Bitcoin at $15,500; What Will Biden’s Win Bring to the Crypto Sector?

The cryptocurrency sector has spent the weekend trying to recover and regain previous highs after most cryptocurrencies briefly dropped in price due to the election uncertainty. The most recent spike was triggered by the end of the US presidential elections, which caused mass uncertainty in the markets, as well as by now-President Biden hiring pro-crypto Gary Gensler as a member of his team. The largest cryptocurrency by market cap is currently trading for $15,433, representing an increase of 2.73% on the day. Meanwhile, Ethereum gained 2.94% on the day, while XRP gained 0.34%.

 Daily Crypto Sector Heat Map

Aave gained 20.05% in the past 24 hours, making it the most prominent daily gainer out of the top100 cryptos ranked by market capitalization. It is closely followed by THORChain’s gain of 17.75% and NEAR Protocol’s 17.57% gain. On the other hand, Celo lost 7.03%, making it the most prominent daily loser. The rest of the cryptocurrencies barely suffered any losses in the past 24 hours.

Top 10 24-hour Performers (Click to enlarge)

Bottom 10 24-hour Performers (Click to enlarge)

Bitcoin’s market dominance has decreased slightly since we last reported, with its value is currently staying at 64.3%. This value represents a 1% difference to the downside compared to the value it had on Friday.

Daily Crypto Market Cap Chart

The crypto sector capitalization has gone up slightly over the weekend. Its current value is $446.21 billion, representing a $4.85 billion increase compared to our previous report.

_______________________________________________________________________

What happened in the past 24 hours?

_______________________________________________________________________

_______________________________________________________________________

Technical analysis

_______________________________________________________________________

Bitcoin

The largest cryptocurrency by market capitalization has entered a state of uncertainty due to how close the US presidential election process was, and even had a brief drop due to less crypto-friendly Joe Biden winning. However, a new announcement regarding Biden hiring crypto-friendly advisors, as well as general stabilization of the political sphere, has triggered a spike in both stocks and Bitcoin.

Bitcoin has, after a brief drop below the yellow ascending line, come back above it, but only slightly as the move to the upside was stopped by the $15,420-$15,480 level.

Traders should wait for Bitcoin to “decide” whether it will go above $15,480 or below $15,420 and trade off of that.

BTC/USD 4-hour Chart

Bitcoin’s technicals are bullish on all time-frames, with smaller time-frames showing a bit of neutrality and longer time-frames being completely bullish.

BTC/USD 1-day Technicals

Technical factors (4-hour Chart):
  • Price is above both its 50-period EMA and its 21-period EMA
  • Price is at its middle Bollinger band
  • RSI is neutral (60.66)
  • Volume is slightly elevated
Key levels to the upside          Key levels to the downside

1: $15,480                                 1: $14,640

2: $16,665                                 2: $14,100

3: $17,260                                  3: $13,900

Ethereum

Ethereum has had an amazing weekend, with its price skyrocketing past the top line of the ascending channel. While most analysts thought that the second-largest cryptocurrency by market cap couldn’t get back above this line after the Nov 7 drop, Ethereum has proven them wrong and went above $450.

However, the immediate area above $450 is a zone of strong resistance, and Ethereum traders have to watch out how they enter trades here. The safest pick when it comes to trading Ethereum right now would be “riding the wave” towards the upside when ETH decides to spike.


ETH/USD 4-hour Chart

Ethereum’s technicals are almost completely neutral on the 4-hour and daily time-frames, while its longer time-frames are heavily tilted towards the buy-side.

ETH/USD 1-day Technicals

Technical Factors (4-hour Chart):
  • The price is above both its 50-period and its 21-period EMA
  • Price slightly above its middle Bollinger band
  • RSI is neutral (62.07)
  • Volume is elevated
Key levels to the upside          Key levels to the downside

1: $451                                     1: $445

2: $470                                     2: $420 

3: $490                                      3: $415

Ripple

The fourth-largest cryptocurrency by market cap had ended its ascension on Nov 7, when most cryptocurrencies dropped heavily in price. However, while most cryptos managed to get back near its previous highs, XRP failed to do so. It is currently trading in a wide range between $0.2454 and $0.26, after stopping its upward move at the ~$0.256 level.

Traders can consider trading XRP’s sideways movement as the volume is now reduced, and the possibility of a strong move is low. However, if such a move does happen, it could be easily predicted due to XRP’s current position.

XRP/USD 4-hour Chart

XRP’s technicals on the 4-hour, daily, and weekly slightly bullish, with some hints of neutrality. Its monthly overview, however, is still tilted towards the sell-side.

XRP/USD 1-day Technicals

Technical factors (4-hour Chart):
  • The price slightly above its 50-period EMA and at its 21-period EMA
  • Price is slightly below its middle Bollinger band
  • RSI is neutral (53.59)
  • Volume is average
Key levels to the upside          Key levels to the downside

1: $0.26                                     1: $0.2454

2: $0.266                                   2: $0.235

3: $0.27                                    3: $0.227


Categories
Crypto Market Analysis

BTC/USD Chart Overview + Possible Outcomes

In this weekly BTC /USD analysis, we will be taking a look at the most recent events, the current technical formations, as well as discussing possible outcomes.

Overview

Bitcoin has spent the week vigorously pushing towards the upside. The move went parabolic as soon as BTC crossed the $13,900 mark and entered the $14,000 zone. While the surge got stopped just before it hit $16,000, there is a lot of potential upside as there is practically no resistance holding Bitcoin from reaching its all-time high. However, many traders are taking profits and playing it safe out of fear of ending up the same way they did in 2017/2018. This has caused BTC to lose momentum and, most likely, look for a pullback soon.

Technical factors


Bitcoin has conquered the ~15,000 level after a week of constant pressure to the upside. The largest cryptocurrency by market cap is currently consolidating right above the $15,480 support level, which will act as a pivot point and a trading direction decider. The next day or two will be crucial for Bitcoin’s price movement in the short future.

While Bitcoin’s sentiment is extremely bullish at the moment, there is no denying that a pullback is quite possible (and maybe even optimal). As there are no set resistance levels to the upside (because Bitcoin only visited these price levels during the bull run of 2017), we are using Fib retracements as well as small consolidation points from that time to determine possible consolidation/direction change spots.

Another thing to note is that, as of Oct 29, the hash ribbons indicator is showing miner capitulation, sending out a major buy signal.

Likely Outcomes

Bitcoin has two main scenarios it can play out, and both end up with the price pulling back to stabilize and consolidate a bit. The possibility of these plays happening is slightly in favor of the second scenario, but it mainly depends only on where Bitcoin ends up (above or below its pivot point).

  1. If Bitcoin remains above $15,480, we may expect further attempts of conquering the upside. The next target to the upside are the $16,000 psychological resistance, 23.6% Fib retracement level (sitting at $16,570) and $16,665. If Bitcoin pushes towards the upside, we are almost certainly expecting strong resistance at these levels and an almost certain pullback in the short-term.
  2. The other scenario may be slightly more likely, and involves Bitcoin rejecting the current level and falling below its pivot point. In this case, the largest cryptocurrency by market cap will look for a support level, and will most likely find it at the $14,640 level or the 38.2% Fib retracement level (sitting at $14,380).

While moves which include Bitcoin moving straight up or down and ignoring these support/resistance levels are possible, they are far less likely and would have to be caused by some fundamental even rather than just price action and technicals.

Categories
Crypto Market Analysis

Daily Crypto Review, Nov 6 – Bitcoin Zooming Past $15,000: How Far Can it Go Before Pulling Back?

The cryptocurrency sector has exploded to the upside as Bitcoin keeps paving the path towards highs only seen during the bull run of 2017/2018. The largest cryptocurrency by market cap is currently trading for $15.632, representing an increase of 10.1% on the day. Meanwhile, Ethereum gained 7.74% on the day, while XRP gained 4.5%.

 Daily Crypto Sector Heat Map

Uniswap gained 28.39% in the past 24 hours, making it the most prominent daily gainer out of the top100 cryptos ranked by market capitalization. It is closely followed by Aave’s gain of 25.21% and NEAR Protocol’s 23.87% gain. On the other hand, The Midas Touch Gold lost 6.16%, making it the most prominent daily loser. It is followed by Numeraire’s loss of 5.03% and Celo’s loss of 3.94%.

Top 10 24-hour Performers (Click to enlarge)

Bottom 10 24-hour Performers (Click to enlarge)

Bitcoin’s market dominance level has increased slightly since we last reported, with its value is currently staying at 65.3%. This value represents a 0.4% difference to the upside when compared to the value it had yesterday.

Daily Crypto Market Cap Chart

The crypto sector capitalization has skyrocketed in the past 24 hours. Its current value is $440.94 billion, representing a $28.77 billion increase compared to our previous report.

_______________________________________________________________________

What happened in the past 24 hours?

_______________________________________________________________________

_______________________________________________________________________

Technical analysis

_______________________________________________________________________

Bitcoin

The largest cryptocurrency by market capitalization has surged past the $15,000 psychological resistance and entered the zone last seen in Jan 2018, right before the BTC crash. Bitcoin scored double-digit gains on the day and destroyed the $14,640 resistance on the way, turning it into support. While it is currently slowing down as it is approaching $16,000, many analysts call for $17,000 before a pullback.

Traders should wait for Bitcoin to start pulling back if they want a safer trade, or they can ride the wave whenever Bitcoin’s price spikes if they are quick on their feet to enter and leave the trade.

BTC/USD 4-hour Chart

Bitcoin’s technicals are extremely bullish on all time-frames, and no time-frame is showing any signs of bearishness or neutrality.

BTC/USD 1-day Technicals

Technical factors (4-hour Chart):
  • Price is well above both its 50-period EMA and its 21-period EMA
  • Price is at its top Bollinger band
  • RSI is heavily in the overbought zone (79.75)
  • Volume is elevated
Key levels to the upside          Key levels to the downside

1: $15,420                                 1: $14,640

2: $16,665                                 2: $14,100

3: $17,260                                  3: $13,900

Ethereum

Ethereum has, due to Bitcoin pulling it up as well as due to the hype created around its 2.0 version coming out, surged and almost scored a double-digit gain on the day. The second-largest cryptocurrency by market cap has established itself back in the ascending channel after briefly dropping out of it. However, that wasn’t enough for the Ethereum bulls as they tried to push its price above the channel completely.

As the upper channel line held amazingly and stopped Ethereum’s rise, we can conclude that (unless Bitcoin doesn’t have any extreme surges), Ethereum traders can safely trade within a range bound by the ascending channel.


ETH/USD 4-hour Chart

Ethereum’s technicals are somewhat neutral on the 4-hour and daily time-frames, while its longer time-frames show a heavy tilt towards the buy-side.

ETH/USD 1-day Technicals

Technical Factors (4-hour Chart):
  • The price is well above both its 50-period and its 21-period EMA
  • Price is at its top Bollinger band
  • RSI is extremely overbought (78.03)
  • Volume is elevated
Key levels to the upside          Key levels to the downside

1: $445                                     1: $420

2: $451                                     2: $415 

3: $490                                      3: $400

Ripple

As we predicted in our previous article, the fourth-largest cryptocurrency by market cap has broken the triangle formation that was forming from Nov 3. The price has sparked up by Bitcoin’s push towards the upside, moved to the upside as well, reaching past the $0.2454 resistance level and up towards $0.25.

One thing to note is that, while XRP has managed to break $0.2454, it needs to confirm its position above it in order to be safe in the short-term.

XRP/USD 4-hour Chart

XRP’s technicals on the 4-hour, daily, and weekly chart are slightly tilted towards the buy-side but are not completely bullish. Its monthly overview, however, is tilted towards the sell-side.

XRP/USD 1-day Technicals

Technical factors (4-hour Chart):
  • The price is well above its 50-period EMA and its 21-period EMA
  • Price at its top Bollinger band
  • RSI is on the verge of being overbought (68.49)
  • Volume is elevated
Key levels to the upside          Key levels to the downside

1: $0.26                                 1: $0.2454

2: $0.266                                     2: $0.235

3: $0.27                                  3: $0.227