
The cryptocurrency market has had a slow day, with most cryptos seeking consolidation after a turbulent weekend. Bitcoin is currently trading for $9,161, which represents an increase of 0.66% on the day. Meanwhile, Ethereum gained 1.02% on the day, while XRP gained 0.12%.

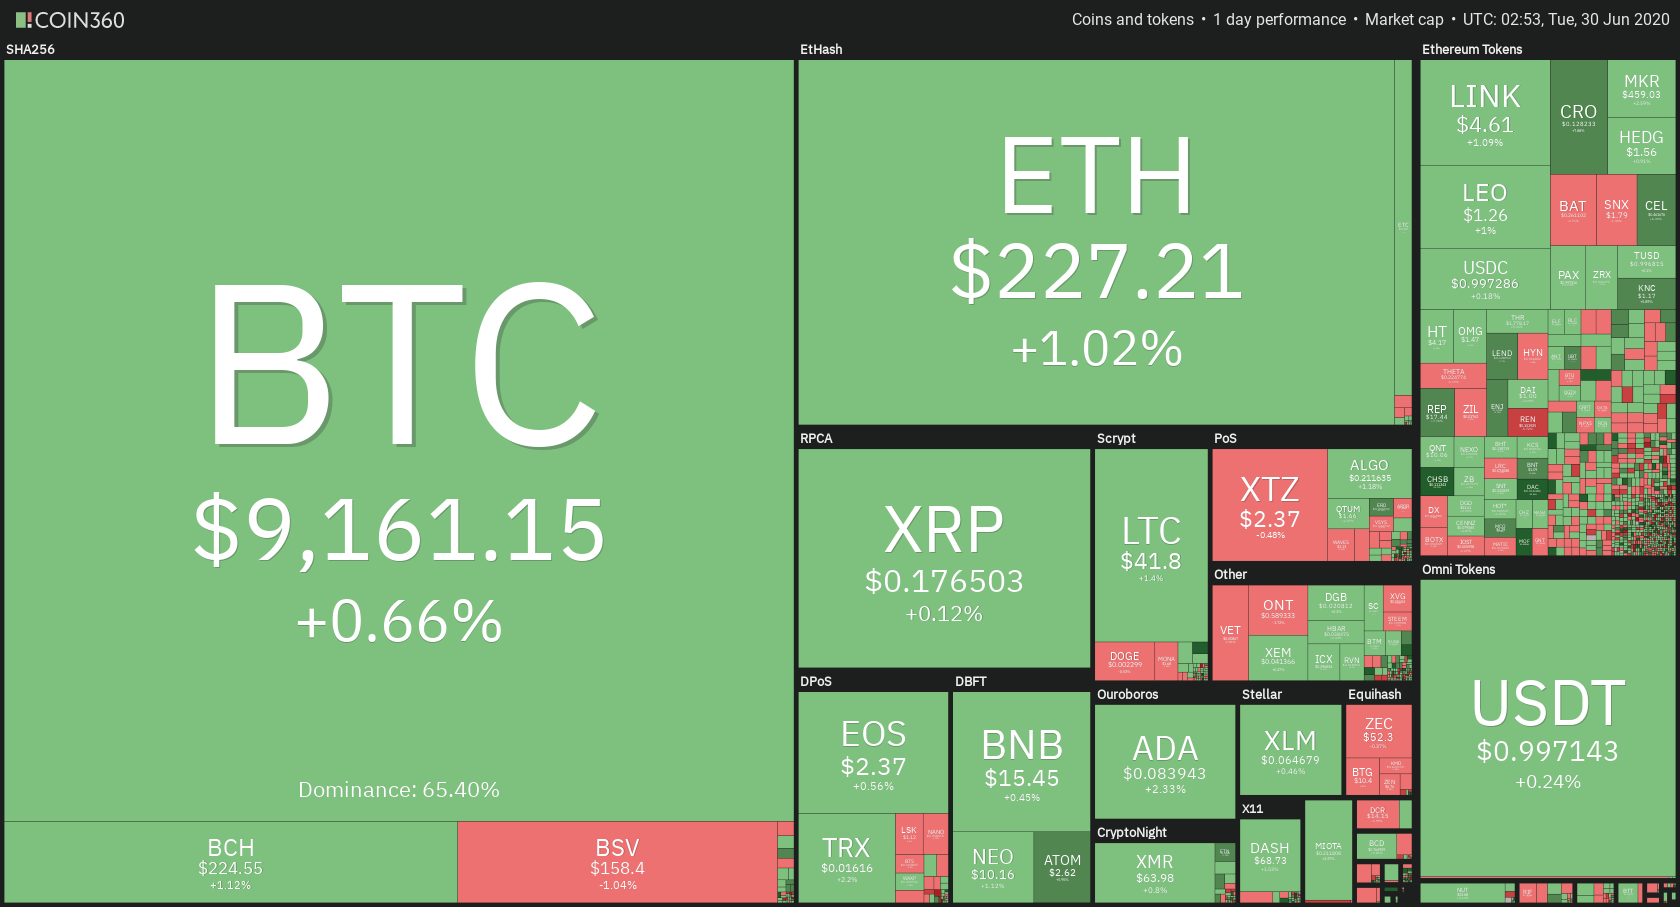
Daily Crypto Sector Heat Map
When talking about top100 cryptocurrencies, SwissBorg gained 18.17% on the day, making it by far the most prominent daily gainer. Elrond (12.74%) and Flexacoin (10.34%) also did great. On the other hand, The Midas Touch has lost 6.55%, making it the most prominent daily loser. It is followed by Ren’s loss of 5.09% and Bitcoin Gold’s loss of 4.36%.
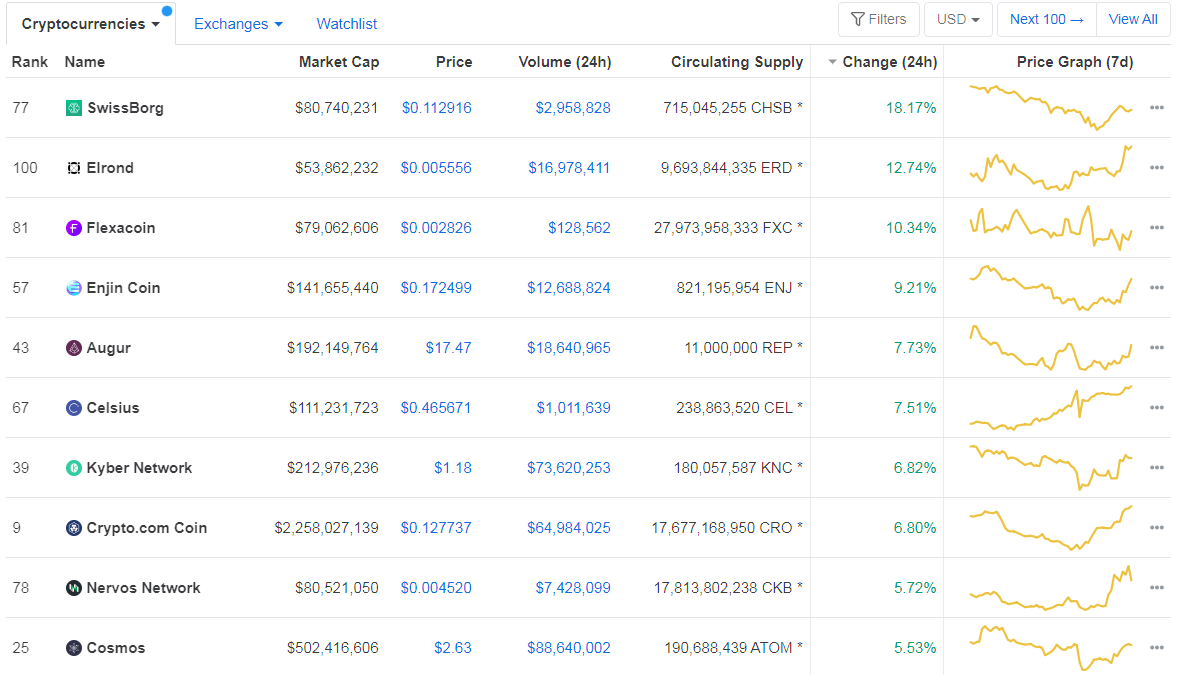
Top 10 24-hour Performers (Click to enlarge)
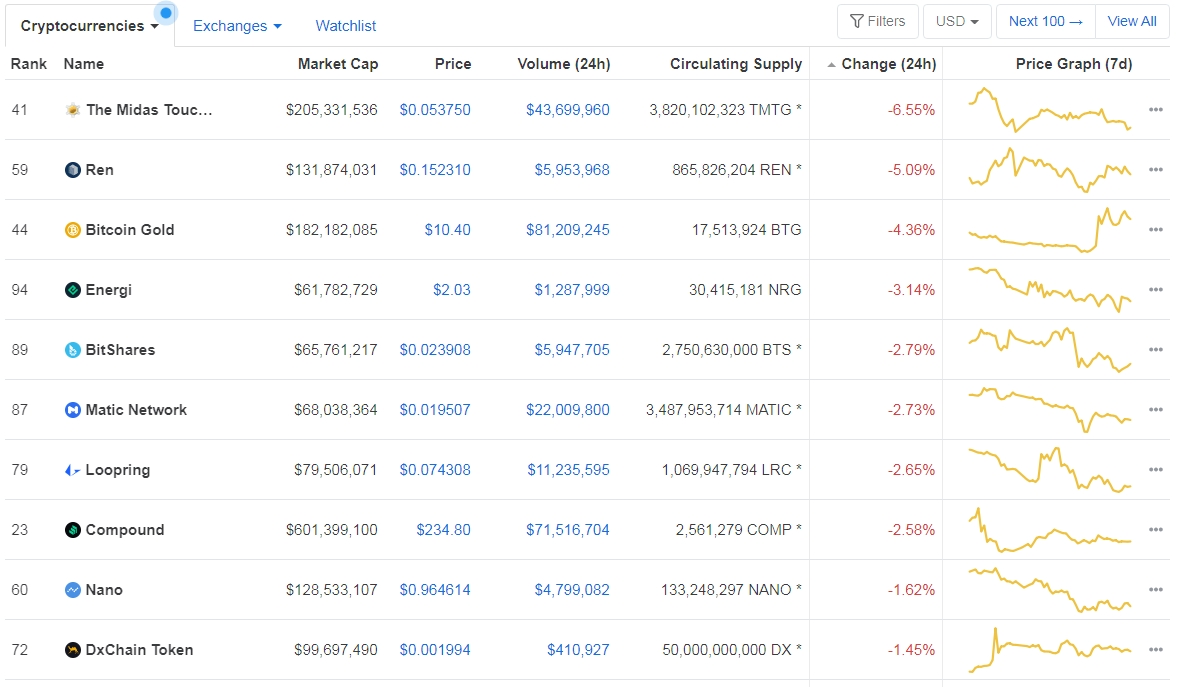
Bottom 10 24-hour Performers (Click to enlarge)
Bitcoin’s dominance level increased slightly since we last reported, with its value currently at 65.4%. This value represents a 0.15% difference to the upside when compared to yesterday’s value.
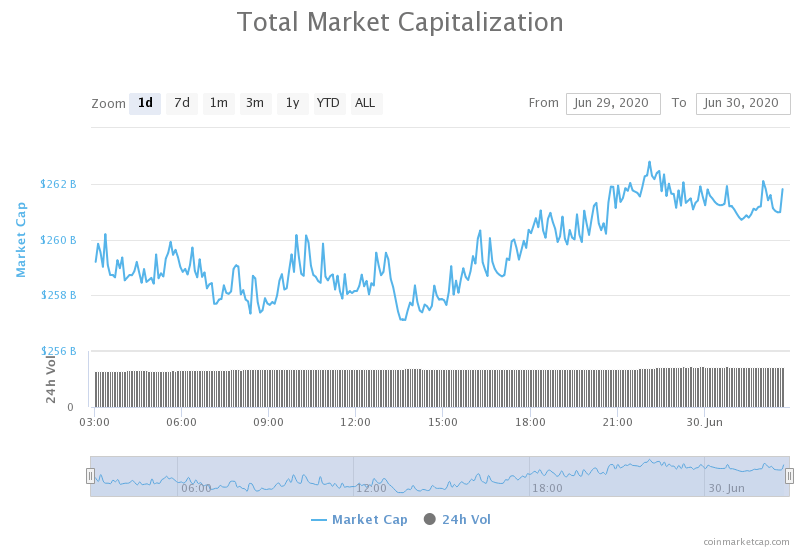
Daily Crypto Market Cap Chart
The cryptocurrency market capitalization stayed at exactly the same place when compared to yesterday, with the market’s current value being $261.24 billion. This value represents an increase of $1.82 billion when compared to the value it had yesterday.
_______________________________________________________________________
What happened in the past 24 hours?
_______________________________________________________________________
- The state of crypto debit cards after the Wirecard collapse (The Block)
- Bank of Canada researchers say zero-knowledge proofs are still too immature for CBDC use (The Block)
- Bitcoin Cash (BCH) Hits New All-Time Lows, But Everything’s Not Lost (Cryptobriefing)
- If any of these 3 crypto firms collapse, a “tsunami” will ensue: analyst (Cryptoslate)
- There’s $100 million of BTC on the Ethereum network—and that’s “bearish” for Bitcoin (Cryptoslate)
- Digital Currency Guru of $568M Cyber Fraud Forum Pleads Guilty (Coindesk)
- Researchers Say New Lightning Network Attack Could Create ‘Chaos’ (Cointelegraph)
- Class Action Alleges Visa-Acquired Co Was’ Data Plumbing’ Venmo, Cash App & More (Cointelegraph)
- Switzerland Won’t Amend Tax Law in Regard to Blockchain in Near Future (Cointelegraph)
- Uber Angel Investor: ’99 % of Crypto Projects Are Garbage’ (Cointelegraph)
_______________________________________________________________________
Technical analysis
_______________________________________________________________________
Bitcoin
The largest cryptocurrency by market capitalization took the time to recover after a pretty volatile weekend. The price surpassed yesterday’s price, but not by much. Even so, the 21-period moving average is tackled, and Bitcoin is now using it as a support rather than a resistance level. However, its moves to the upside were stopped by the 50-period moving average as well as the $9,251 resistance level.
Traders should closely pay attention to how well Bitcoin reacts to immediate support and resistance levels, as well as to the 21-period and 50-period moving averages.
BTC/USD 4-hour Chart
Technical factors:
- Price is below its 50-period EMA and above its 21-period EMA
- Price above the Middle B.B. (20period SMA)
- RSI near the middle point (52)
- Slightly above-average Volume
Key levels to the upside Key levels to the downside
1: $9,251 1: $9,120
2: $9,580 2: $8,980
3: $9,735 3: $8,820
Ethereum
Ethereum had an interesting day, as its price was not so stagnant. The second-largest cryptocurrency by market cap made a move to the upside in order to confirm breaking of $225.4 to the upside. After this was done successfully, the move got stopped in between the 21-period moving average to the downside and the 20-period SMA to the upside.
Ethereum traders should pay attention to support and resistance levels more than the moving averages, as it seems that Ethereum respects clear horizontal levels a bit more.
ETH/USD 4-hour Chart
Technical Factors:
- Price below the 50-period EMA and above the 21-period EMA
- Price right below Middle B.B. (20-period SMA)
- RSI near the middle point (51)
- Average (low) Volume
Key levels to the upside Key levels to the downside
1: $228 1: $225.4
2: $240 2: $217.7
3: $251.4 3: $198
Ripple
The third-largest cryptocurrency by market cap had a slow day, even with slightly elevated volume. XRP tried to break the $0.178 resistance level over the course of the day but failed to do so many times. As both 21period EMA and 20-period SMA are currently at the $0.178 level, XRP’s price might slowly go down as these moving average lines lower.
There aren’t many XRP trading opportunities at the moment, but most of them are completely straightforward, as they are always happening with sharp increases in volume. If XRP goes down, It is heavily guarded by the descending line which can be traded off of.
XRP/USD 4-hour Chart
Technical factors:
- XRP in a mid-term descending trend
- XRP lacks strong support levels below $0.178
- The upside is guarded by the 21 and 50-period EMA
- Price slightly below the Middle B.B. (20 SMA)
- RSI is below the middle point (44)
- Average Volume
Key levels to the upside Key levels to the downside
1: $0.178 1: $0.147
2: $0.19
3: $0.2
Related posts
 Daily Crypto Review, Oct 13 – G7 Will Continue to Oppose Libra; Bitcoin Consolidating After Another Bull Run
 Daily Crypto Review, Oct 15 – JP Morgan Says Bitcoin is Overvalued; XRP Crashes As it Breaks Major Support
 Daily Crypto Review, Oct 16 – ICO That Raised $257 Million in 60 Minutes Finally Launched; Bitcoin Pushing Towards $11,500
 Daily Crypto Review, Oct 19 – Stablecoin Market Surpasses $20 Billion; Tether Dominating With Market Cap of Almost $16 Billion