
The cryptocurrency market has spent the past 24 hours, either establishing its current levels or gaining a bit of value. Bitcoin is currently trading for $9,090, which represents a decrease of 5.76% on the day. Meanwhile, Ethereum lost 7.04% on the day, while XRP lost 4.98%.
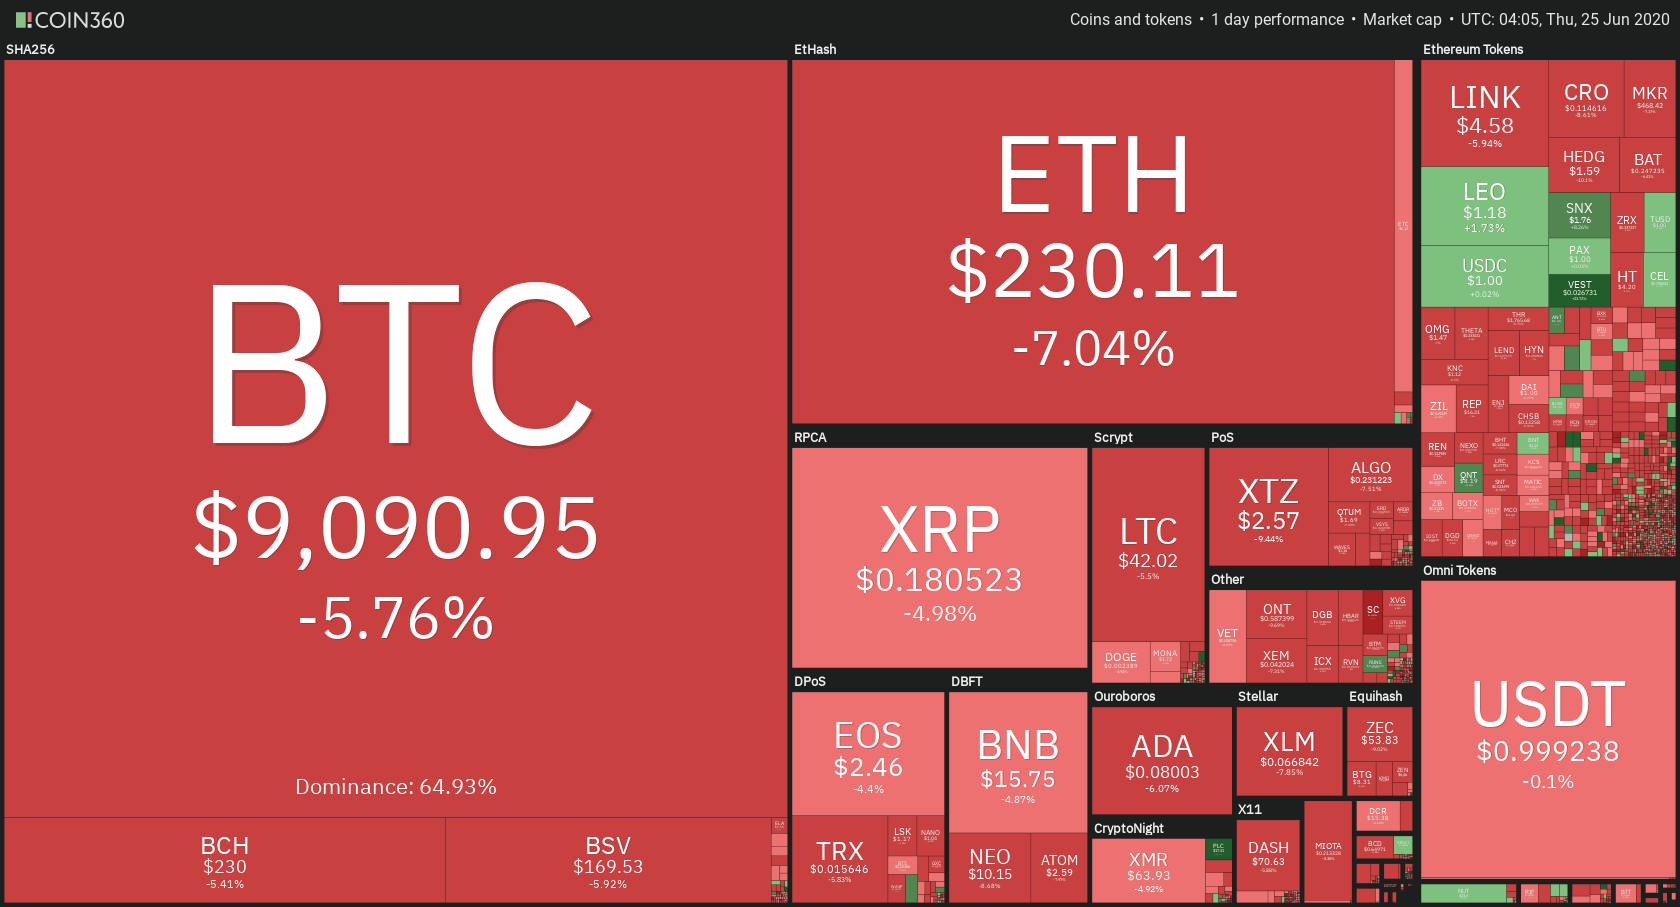
Daily Crypto Sector Heat Map
Cryptocurrencies below the top50 did the best in the past 24 hours, with Quant gaining 19.69%, Flexacoin 19.53%, and Synthetix Network 13.15%. Seele-N was by far the worst daily performer, with a loss of 22.69%, followed by Compound’s loss of 12.70% and Siacoin’s loss of 10.27%.
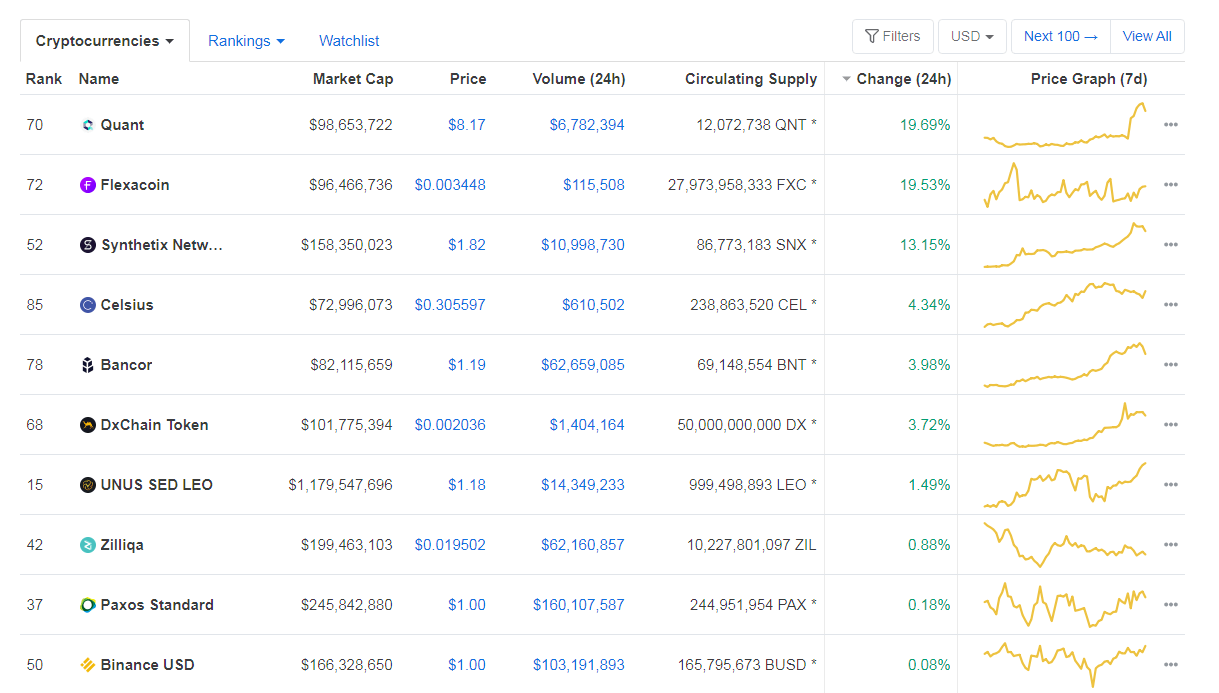 Top 10 24-hour Performers (Click to enlarge)
 Bottom 10 24-hour Performers (Click to enlarge)
Bitcoin’s dominance level decreased slightly since we last reported, with its value currently at 64.93%. This value represents a 0.18% difference to the downside when compared to yesterday’s value.
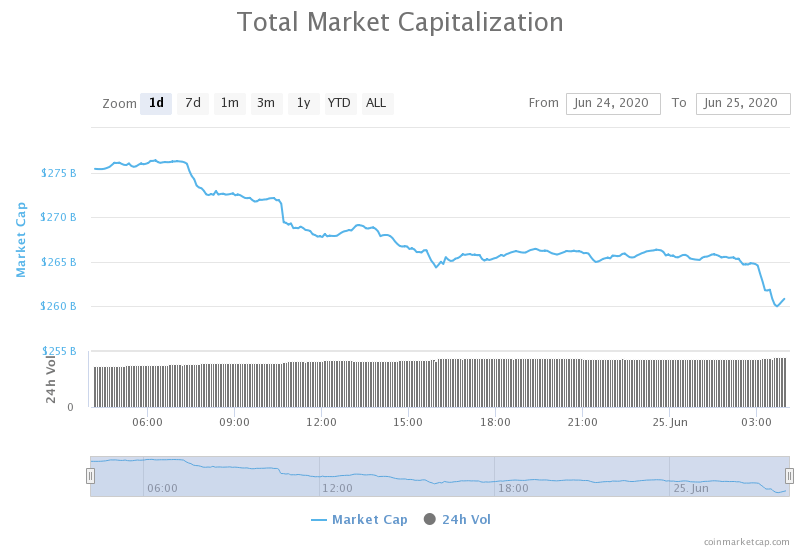 Daily Crypto Market Cap Chart
The cryptocurrency market capitalization decreased greatly when compared to yesterday, with the market’s current value being $261.39 billion. This value represents a decrease of $14.46 billion when compared to the value it had yesterday.
_______________________________________________________________________
What happened in the past 24 hours?
_______________________________________________________________________
- Australians Can Now Pay for Bitcoin at the Post Office (Cointelegraph)
- Compound (COMP) sees massive surge in on-chain activity despite 23% price slide (Cryptoslate)
- Judge Accepts Craig Wright’s Autism Defense, Says No to Sanctions (Cointelegraph)
- Grayscale Ethereum Trust plunges 50% as institutional investors dump shares (Cryptoslate)
- DEX Volume Breaks All-Time High Amid “Yield Farming” Craze (Cryptobriefing)
- $188 million in ETH tied to PlusToken Ponzi moves for first time since December (The Block)
- Libra-like stablecoins could improve consumer welfare in certain cases, Fed researchers find (The Block)
- Bithumb, one of Korea’s biggest crypto exchanges is appointing Samsung to underwrite its IPO (Cryptoslate)
- Sweden’s Central Bank Releases 98-Page’ Economic Review’ Devoted to CBDC (Cointelegraph)
- New Bill to Outlaw Encryption Without Gov’t Backdoor in US Senate (Cointelegraph)
_______________________________________________________________________
Technical analysis
_______________________________________________________________________
Bitcoin
The largest cryptocurrency by market capitalization spent the past 24 hours falling sharply after not being able to pass the $9,735 level. Bears came into play after bears exhausted themselves on trying to push beyond the immediate resistance of $9,735, which made it easy for them to drastically bring Bitcoin’s price down. The most recent price drop brought it to the $8,980 support level, but Bitcoin quickly recovered to above-$9,000 levels. Bitcoin is trading on increased volume, while its RSI grazed the oversold territory without entering it.
The short-term future of Bitcoin will be decided on how it tackles the $9,120 level (if it ends up above or below it).
BTC/USD 4-hour Chart
Technical factors:
- Triangle Formation broken to the downside
- Price is below its 21 and 50-period EMA
- Price is on top of the Lower BB
- RSI near the oversold territory
- Elevated Volume
Key levels to the upside Key levels to the downside
1: $9,251 1: $9,120
2: $9,580 2: $8,980
3: $9,735 3: $8,820
Ethereum
Ethereum lost quite a bit of its value as well (in fact, even more than Bitcoin). The second-largest cryptocurrency by market cap dropped from the high of $250 all the way down to $227. It is currently trying to find a spot to consolidate at (the most probable consolidation price would be around $230). Ethereum is currently trading on elevated volume, with its RSI dropping to below-40 levels.
ETH/USD 4-hour Chart
Technical Factors:
- Price below 21 and 50-period EMA
- Price just above the Lower BB
- RSI under the value of 40
- Elevated Volume
Key levels to the upside Key levels to the downside
1: $240 1: $228
2: $251.4 2: $225.4
3: $260 3: $217.7
Ripple
Just taking a look at the XRP/USD chart, we can see that the third-largest cryptocurrency by market cap has an extremely bearish outlook. XRP followed the overall crypto market trend and dropped in price in the past 24 hours, therefore losing the opportunity to contest (and possibly pass) the $0.19 resistance level. However, XRP did not fall under its $0.178 resistance, as the buying pressure was strong enough to hold the bears. XRP is currently recuperating from the drop at the $0.18 level.
XRP/USD 4-hour Chart
Technical factors:
- XRP in a mid-term descending trend
- XRP lacks strong support levels below $0.178
- Price is below its 21 and 50-period EMA
- Price is on top of the Lower BB
- RSI in the oversold territory
- Elevated Volume
Key levels to the upside Key levels to the downside
1: $0.19 1: $0.178
2: $0.2 2: $0.147
3: $0.205
Related posts
 Daily Crypto Review, May 26 – Tether (USDT) now Third-Largest Cryptocurrency by Market Cap; XRP Down to Fourth
 Daily Crypto Review, May 27 – BTC Transaction Fees Down More Than 50%
 Daily Crypto Review, Jun 05 – Hackers Target US Universities After “Kidnapping” a Whole Town; BTC Used as Ransom
 Daily Crypto Review, Dec 4 – Bitcoin Above $19,000; Ether Fighting for $600