On Friday, the fundamental side-eyes will remain on the German Ifo Business Climate figures, which are expected to drop from 90.7 to 90.2 along with the current account data, which is likely to drop from 25.2 B to 22.6B. Both of these figures extend bearish pressure on the Euro. Later, the Canadian retail sales will be in focus as it may drive some price action in the Canadian pairs.
Economic Events to Watch Today
EUR/USD – Daily Analysis
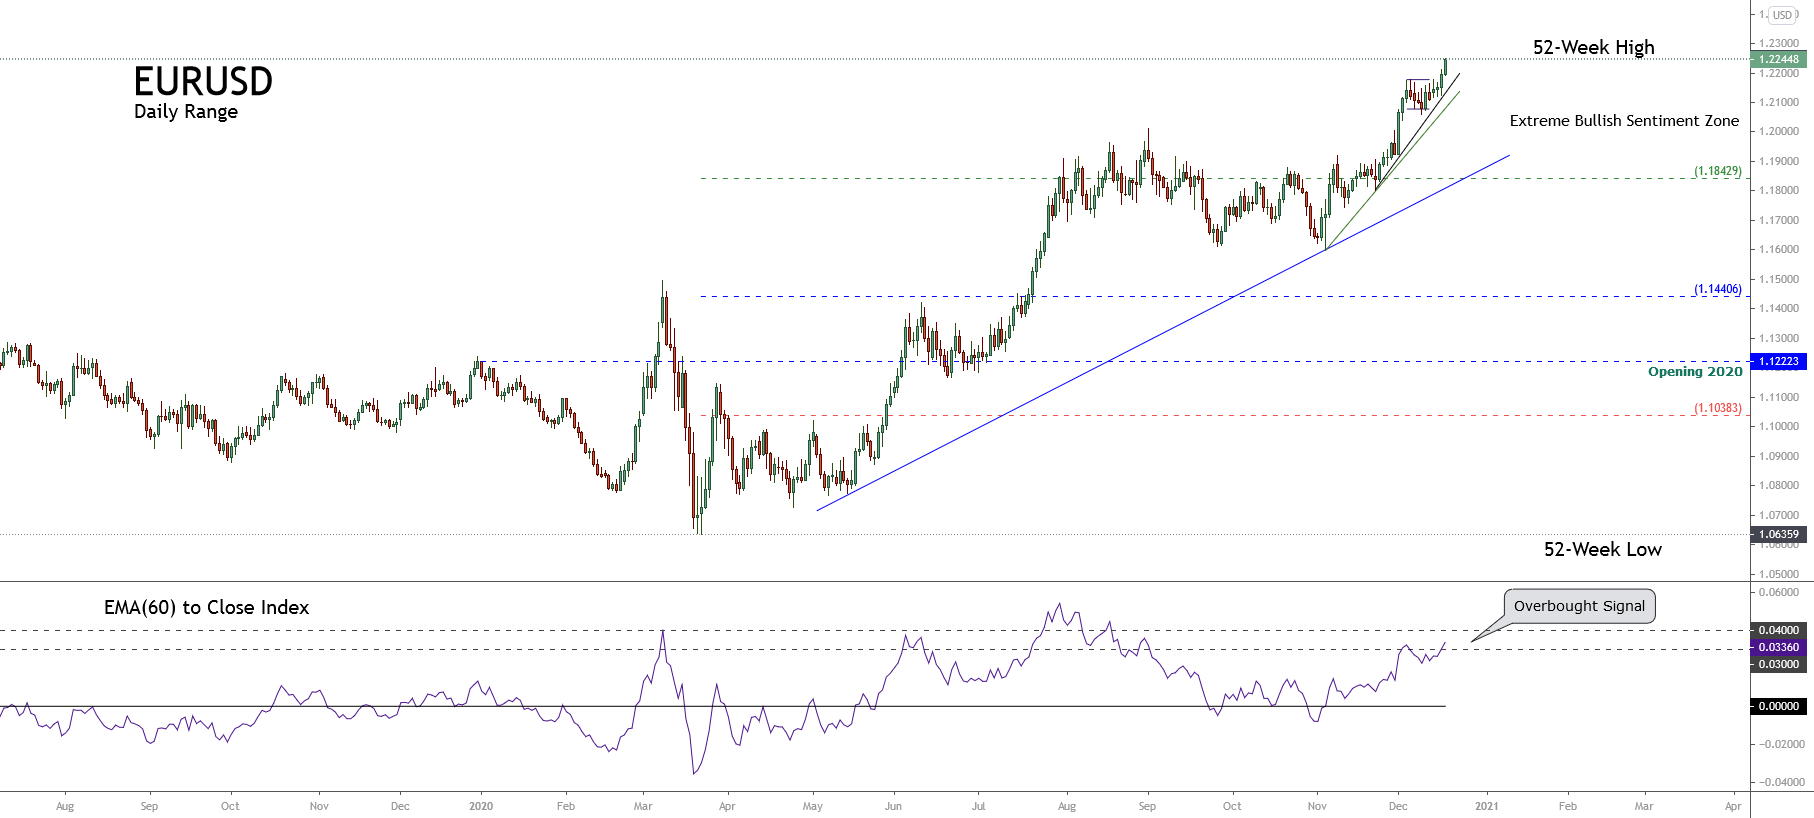
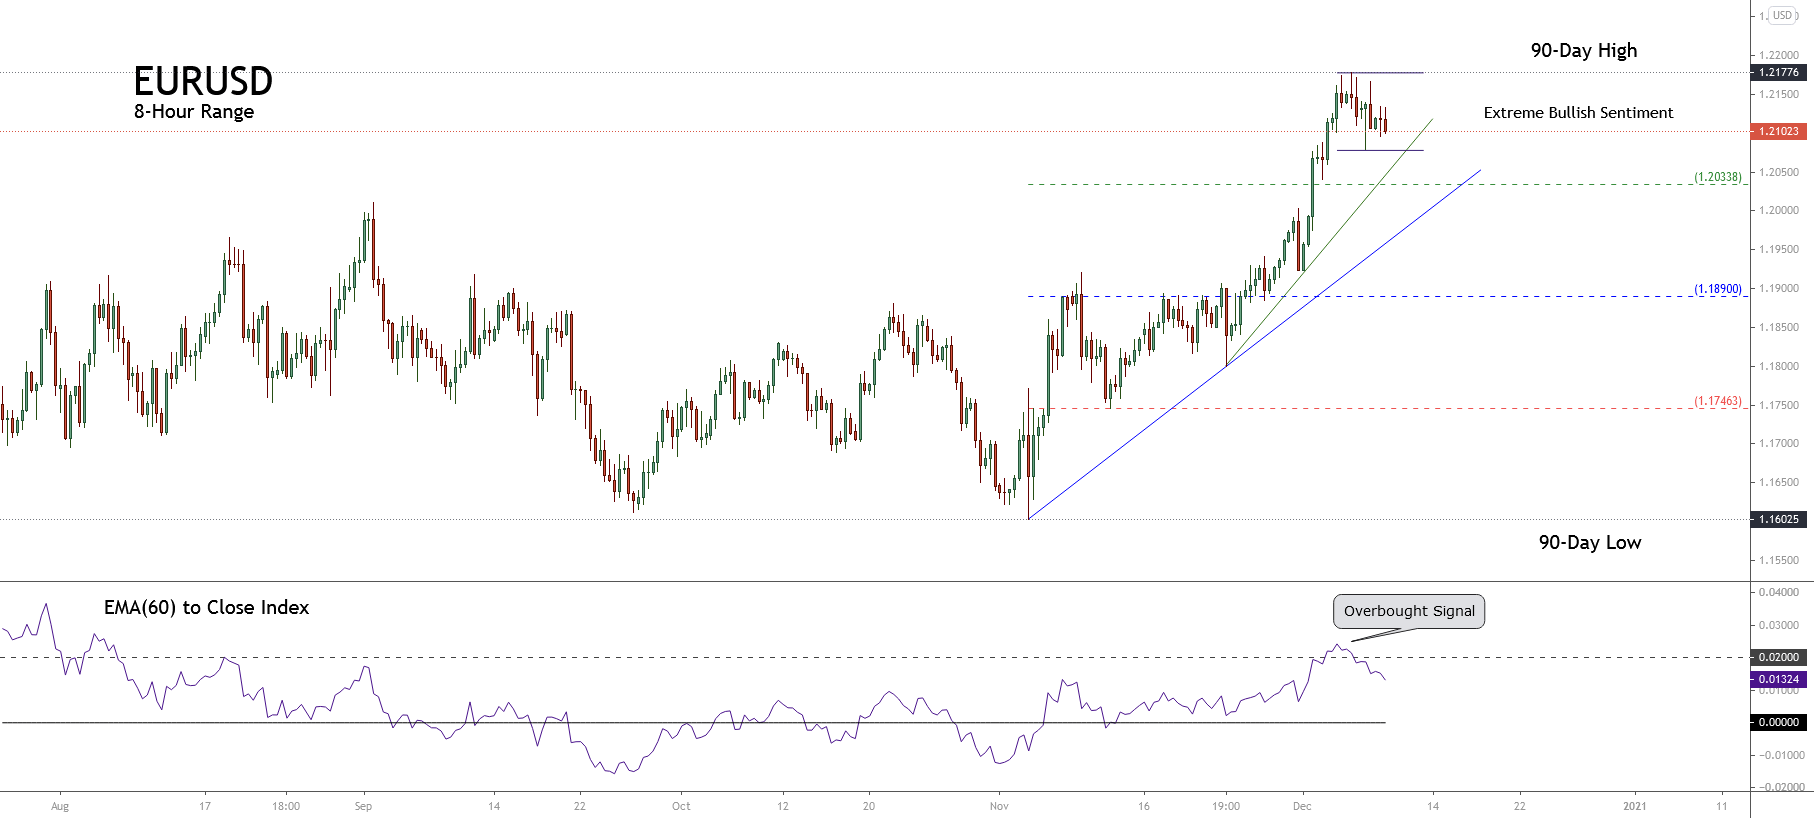
The EUR/USD pair was closed at 1.22679 after placing a high of 1.22725 and a low of 1.21897. EUR/USD pair extended its gains on Thursday and peaked in April 2018, amid the broad-based U.S. dollar weakness and the rebound of the Eurozone economy. The U.S. dollar weakness was derived from various factors, including rising hopes that the coronavirus relief bill will release soon, the dovish comments from Powell post-meeting, and the soft U.S. labor market data on Thursday.
The Democrats and Republicans were close to reaching a deal over a new $900 billion proposal, including $600-$700 in paychecks and unemployment benefits. The U.S. House Speaker Nancy Pelosi has even said that it might be possible that U.S. lawmakers will have the agreement in writing by the end of Thursday. These rising hopes for the U.S. stimulus bill added pressure on the U.S. dollar that ultimately supported the EUR/USD pair’s upward movement.
Powell emphasized that the Fed was following outcomes-based policies, which means if progress slows toward achieving those outcomes, then-Fed could step up its asset purchases. Powell’s dovish comments weighed on the U.S. dollar and supported rising EUR/USD prices on Thursday. Furthermore, on Thursday, the soft labor market data weighed on the U.S. dollar as the Unemployment Claims from last week surged to 885K. The weak U.S. dollar because of rising unemployment claims also supported the upward momentum in EUR/USD pair on Thursday.
On the data front, at 15:00 GMT, the Final CPI for the year in November remained flat at -0.3%. The Final Core CPI from Eurozone in November also remained as expected at 0.2%. From the U.S. side, at 18:29 GMT, the Philly Fed Manufacturing Index in December declined to 11.1 against the projected 20.1 and weighed on the U.S. dollar and supported EUR/USD prices. At 18:30 GMT, the Unemployment Claims from last week surged to 885K against the projected 817K and weighed on the U.S. dollar. For November, the Building Permits surged to 1.64M against the projected 1.55M and supported the U.S. dollar. The Housing Starts in November remained flat as projected 1.55M.
The Eurozone economy was rebounded as suggested by the December Eurozone’s Composite PMI that rose above 49 levels compared to expected 45.3 and supported the single currency. However, the Eurozone market confidence was tempered by the news that Germany, the largest Eurozone economy, would re-enter lockdown in January to curb coronavirus spread.
Meanwhile, the global economic outlook continued to improve following the news that Europe will be rolling out coronavirus vaccines. The E.U. Commission chief Ursula von der Leyen said that the coronavirus vaccination would start from December 27 in Austria, Germany, and Italy. The Health Minister Jens Spahn said that if the approval comes as planned, Germany will start vaccination on December 27. The potential vaccine rollout in Europe raised the Eurozone economy’s outlook and supported the single currency Euro and added the EUR/USD pair’s gains.
Daily Technical Levels
Support Resistance
1.2143 1.2231
1.2090 1.2266
1.2055 1.2320
Pivot point: 1.2178
EUR/USD– Trading Tip
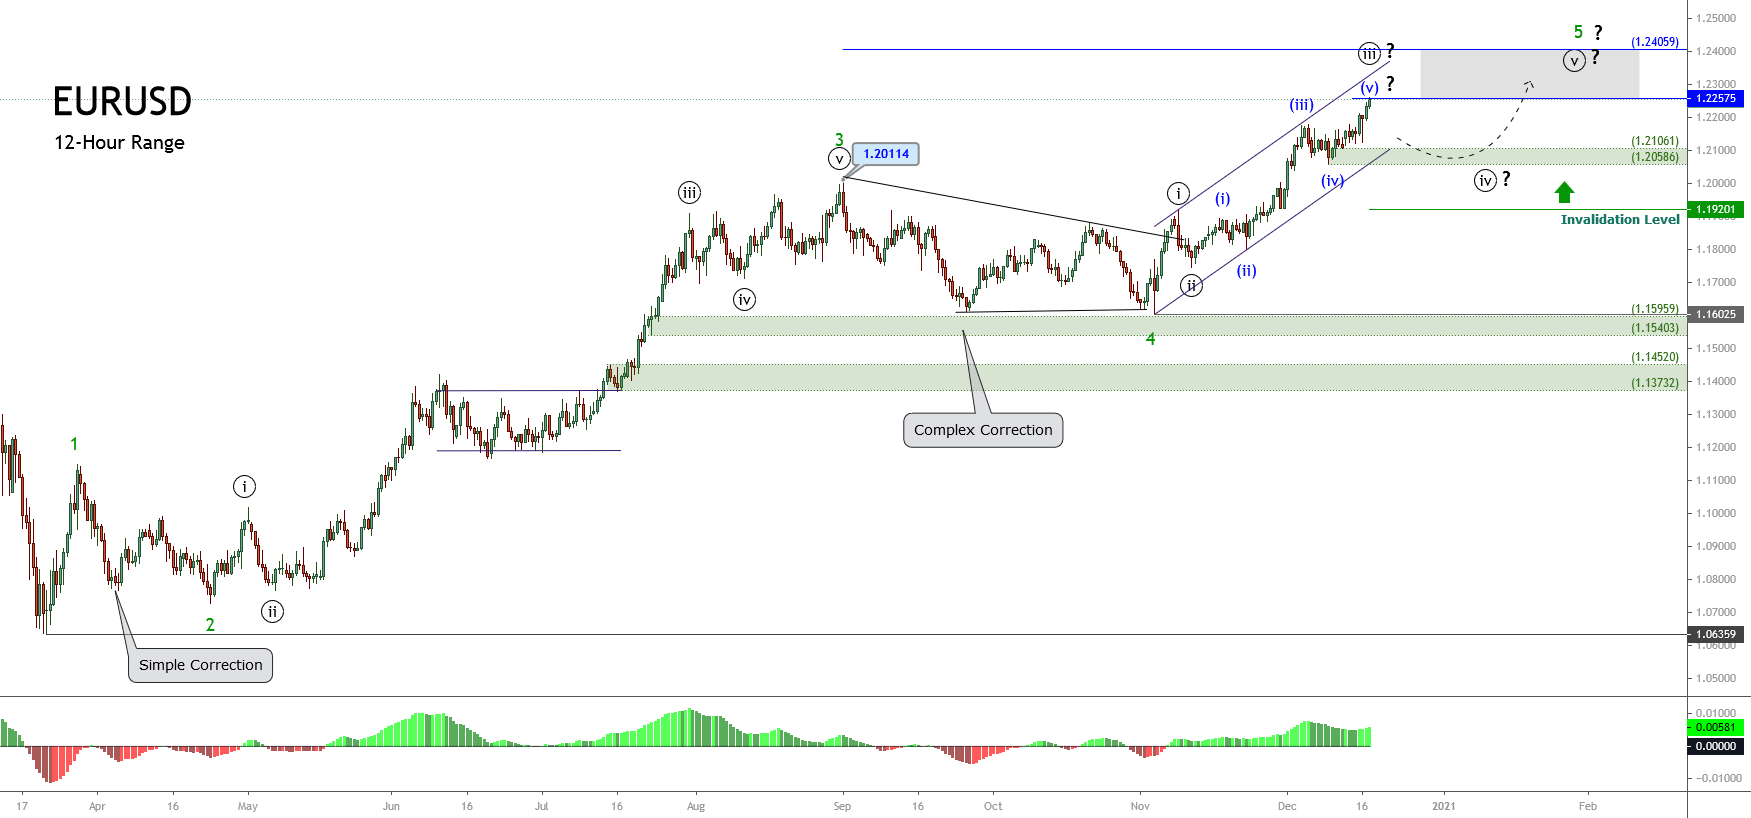
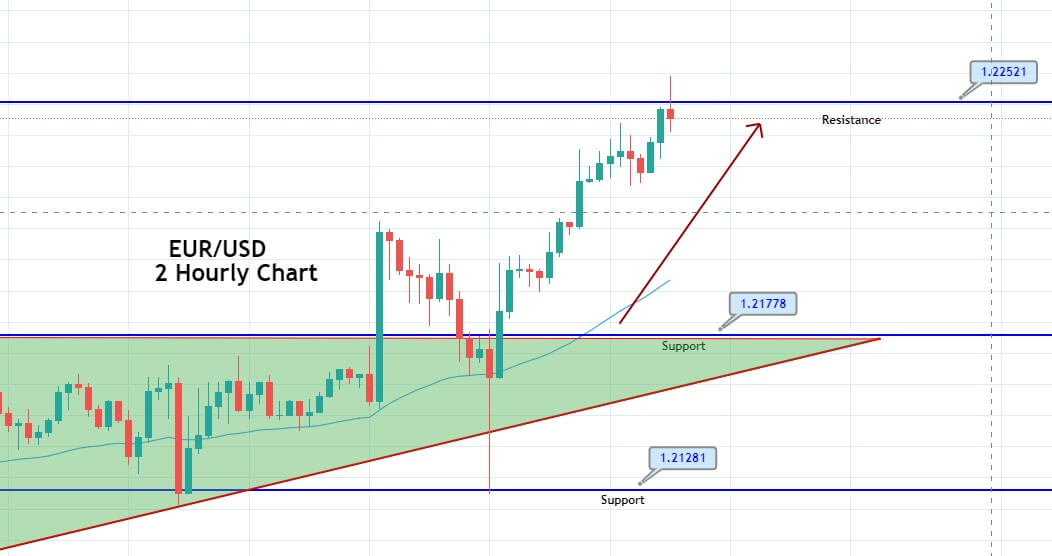
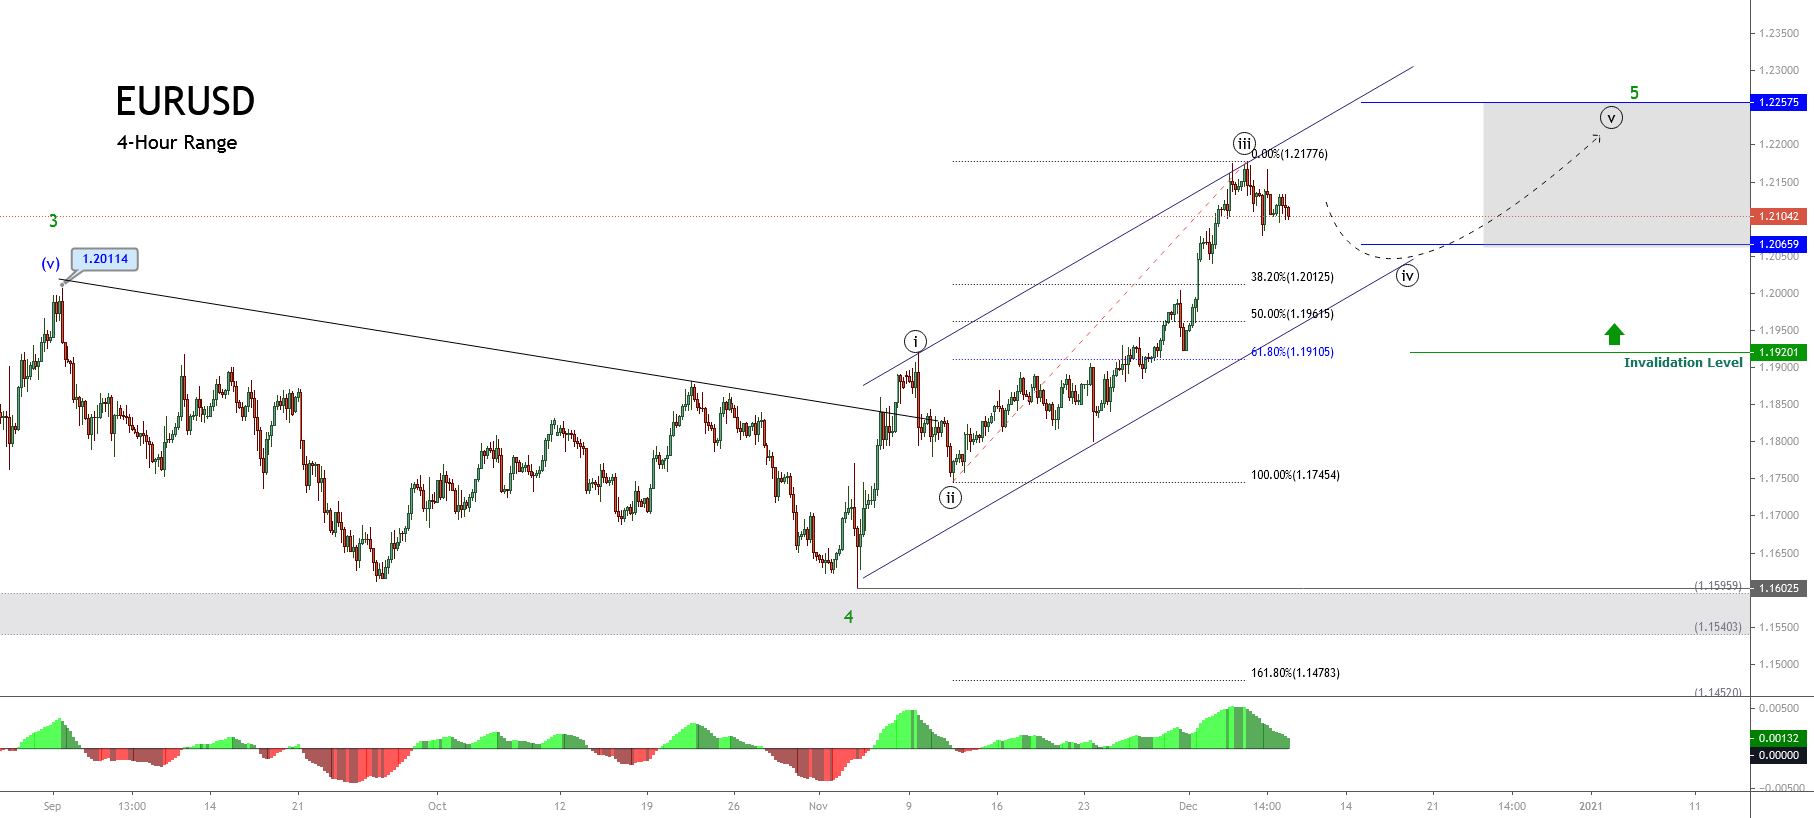
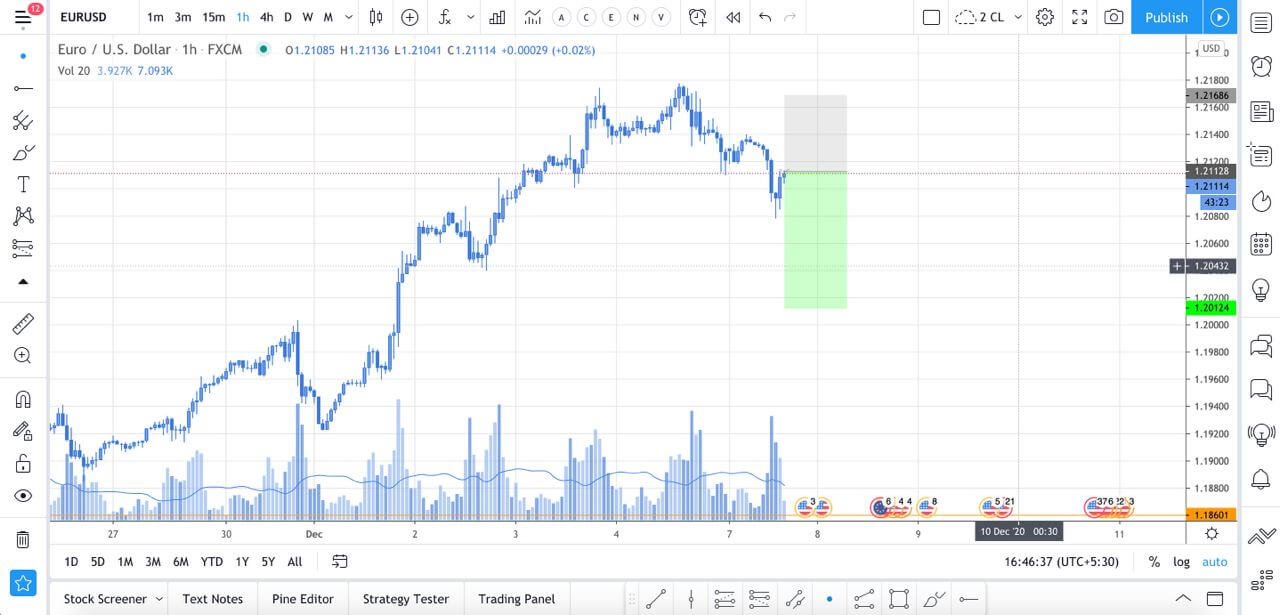
The EUR/USD bullish bias continues to drive an upward movement at 1.2245, and continuing an upward trend is likely to be continued. On the 4 hour timeframe, the EURUSD has entered the overbought zone, and it has completed 23.6% Fibonacci retracement at the 1.2240 level. A bearish breakout of 1.2240 can send the EUR/USD pair towards a 38.2% Fibo level of 1.2214. The odds of buying seems strong over the 1.2214 level today.
GBP/USD – Daily Analysis
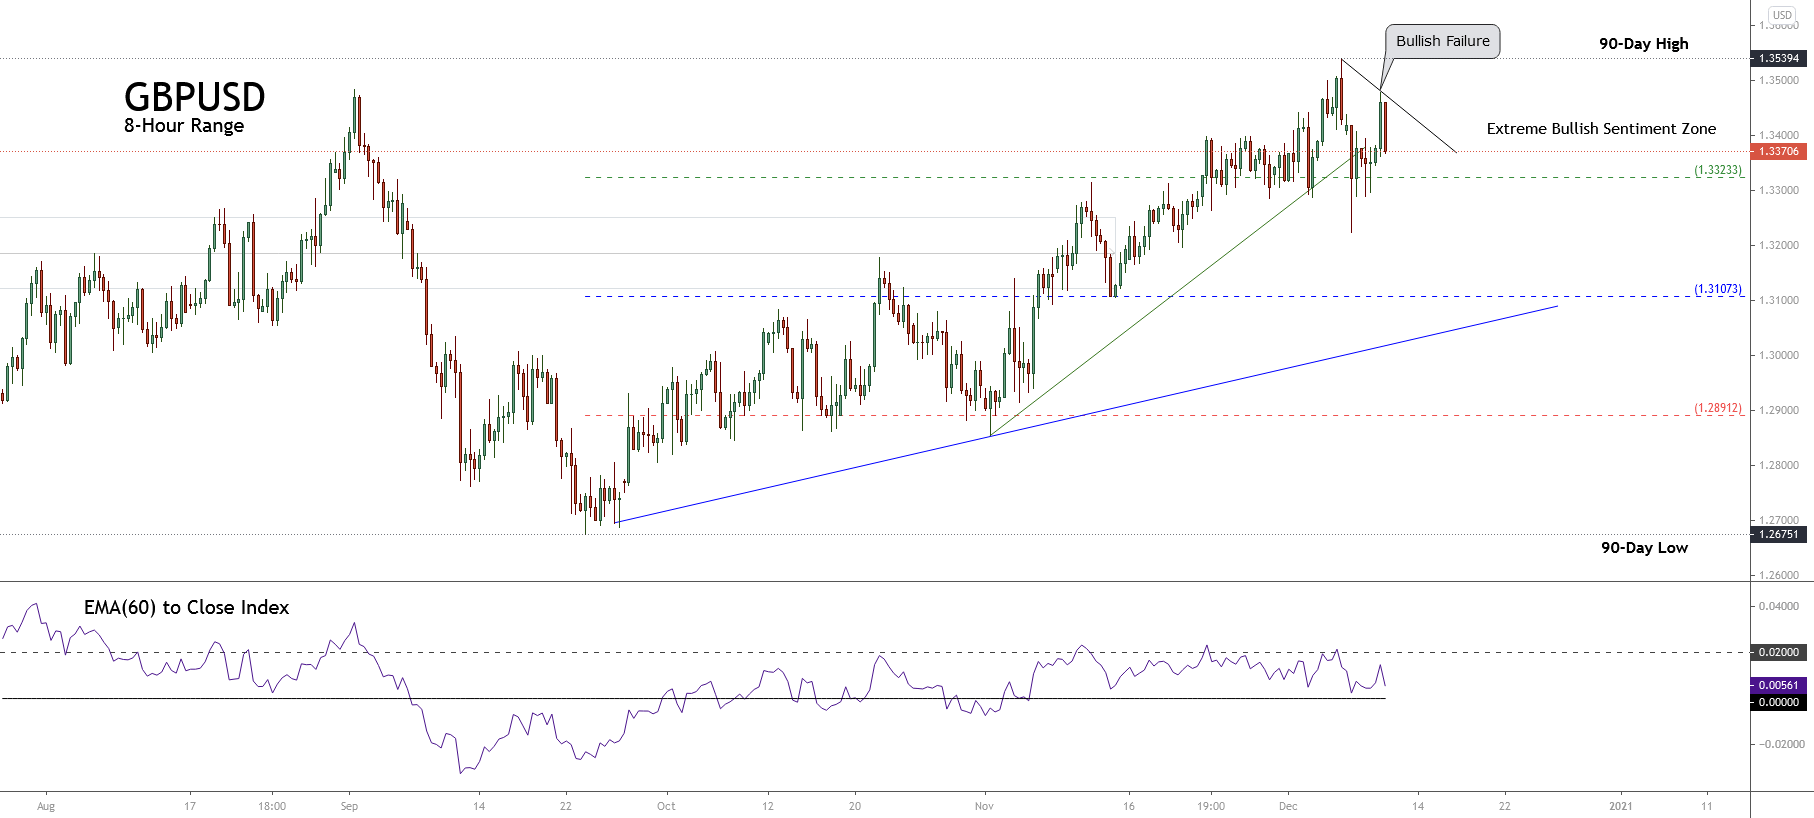
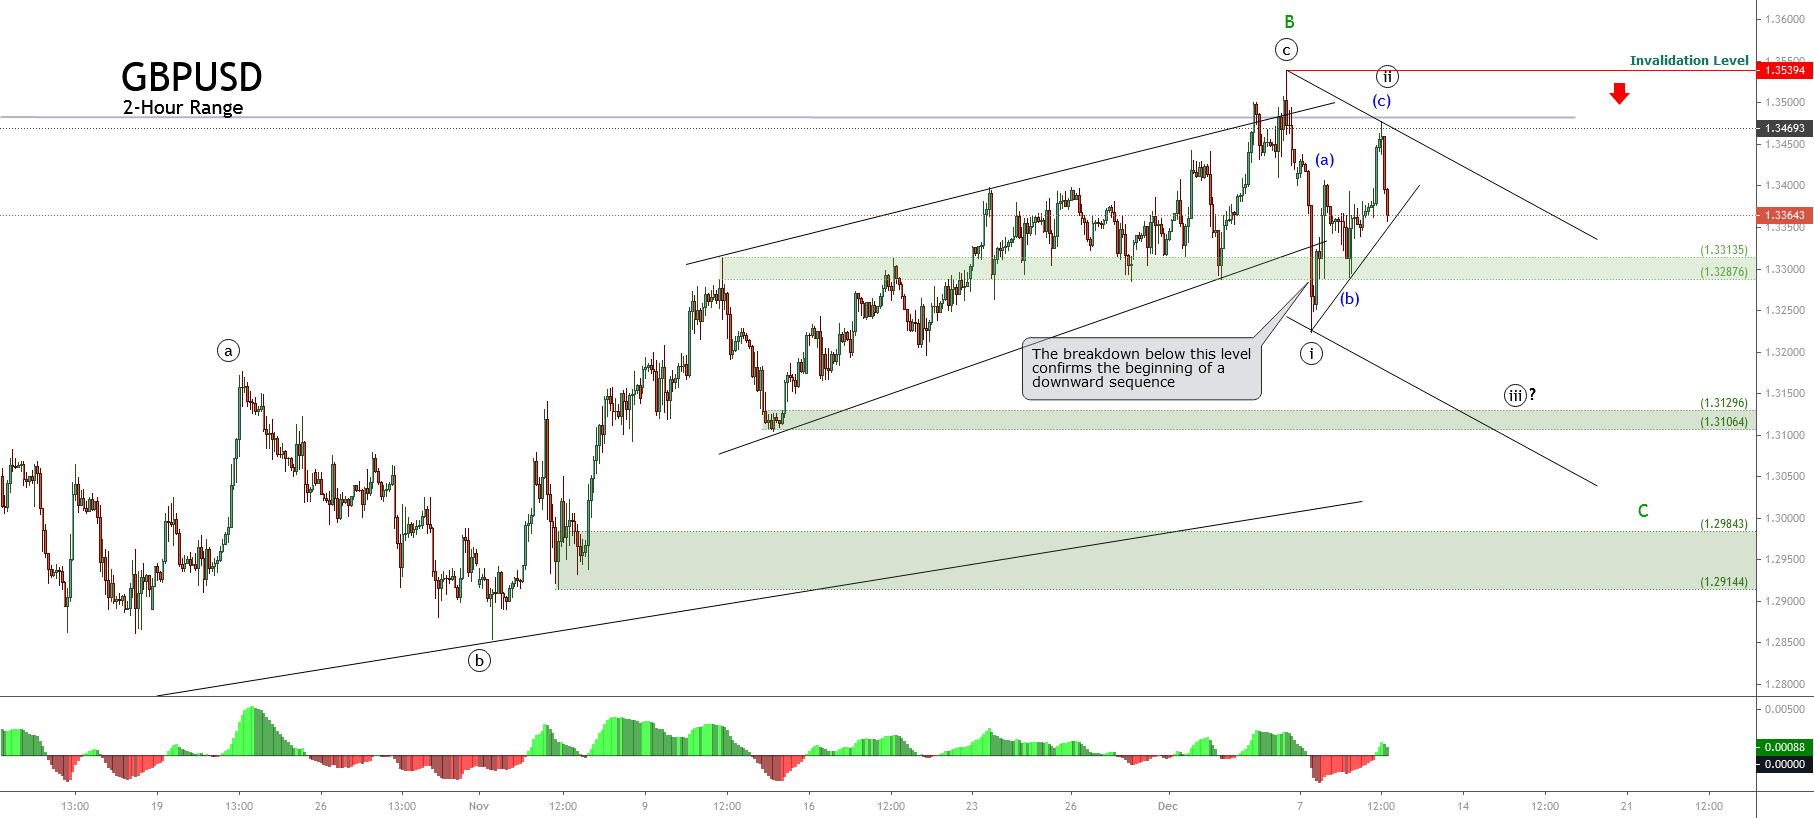
The GBP/USD pair was closed at 1.35833 after placing a high of 1.36244 and a low of 1.34950. GBP/USD pair extended its gains for the third consecutive day on Thursday and peaked since May 2018 due to broad-based U.S. dollar weakness. The British Pound pared some gains on Thursday after the U.K. Prime Minister Boris Johnson said that it was likely that a deal would not be reached until the European Union eased its stance over key sticking issues, including fishing rights.
Johnson poured cold water on the deal’s hopes, saying that it looked very likely that the agreement will not be finalized until the European Union shifts its position substantially. This update came in the right after the positive comments from European Commission President Ursula von der Leyen, who said that the progress in trade negotiations was seen.
Despite the hints of possible progress on a post-Brexit trade deal, PM Johnson has not shied away from his views that the possible outcome for the U.K. to leave the E.U. was without a deal. In this scenario, the U.K. and E.U. will follow the terms and conditions under the World Trade Organization that would not be good for both nations. The European Parliament has given Brexit negotiators until December 20 to strike a deal to allow enough time to ratify a potential agreement before the end of the U.K.’s transition period to leave the E.U.
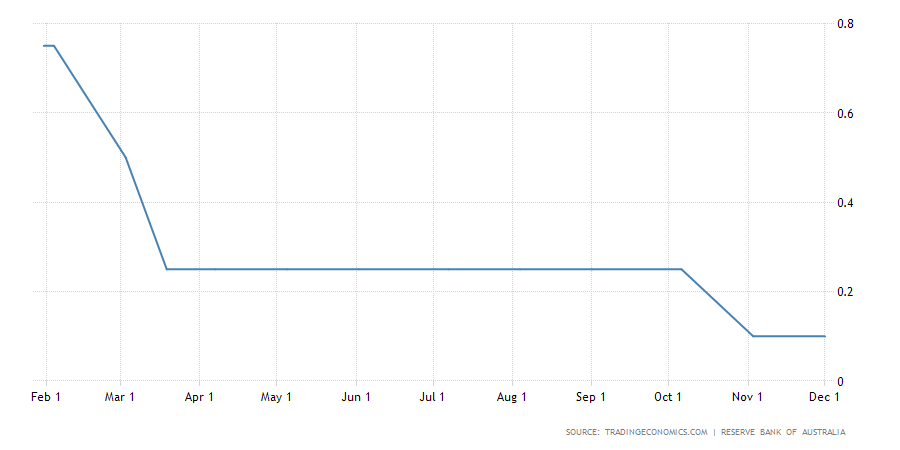
Furthermore, on Thursday, the Bank of England kept interest rates at the lowest level on record after warning that rapid growth in coronavirus infections will deliver a bigger hit to the U.K. economy than expected in the final months of 2020. The official interest rate was kept unchanged at 0.1% by BoE, while the bank also left the Q.E. bond-buying program unchanged at 895 billion pounds after pumping an additional 150 billion pounds into the economy last month.
The bank acknowledged that against a backdrop of soaring coronavirus infections amid the second wave of the pandemic has forced the government to launch tier-3 restrictions in England and tighter control over Scotland, Wales, and Northern Ireland that has put the economy under pressure. The bank projected that the GDP of the U.K. in the final three months of 2020 would contract by a little over 1%, which means that national output for 2020 will be 11% below 2019, and it will be the biggest recession in 300 years. These dovish comments from the Bank of England removed some of the GBP/USD pair’s daily gain on Thursday.
On the data front, at 17:00 GMT, the Asset Purchase Facility from Great Britain in December remained flat at 895B.
From the U.S. side, at 18:29 GMT, the Philly Fed Manufacturing Index in December fell to 11.1 against the anticipated 20.1 and weighed on the U.S. dollar and supported the GBP/USD pair. At 18:30 GMT, the Unemployment Claims from last week rose to 885K against the anticipated 817K and weighed on the U.S. dollar, and added further gains in GBP/USD pair. For November, the Building Permits rose to 1.64M against the anticipated 1.55M and supported the U.S. dollar. The Housing Starts in November remained flat as anticipated 1.55M. The U.S. dollar was weak across the board as the hopes for the second round of stimulus bills raised as the Democrats and Republicans were coming closer to reach a $900 billion proposal that would include $600 to $700 paychecks and unemployment benefits. The rising hopes that U.S. stimulus will reach an agreement soon weighed on the U.S. dollar and added in the gains of GBP/USD.
The U.S. dollar was also weak because of the rising number of coronavirus cases in the U.S. despite the vaccine rollout. According to Johns Hopkins University, the U.S. confirmed 247,403 new coronavirus cases on Wednesday, and the number of Americans’ deaths was recorded as 3656 in a single day. Meanwhile, the risk perceived the latest improvement in risk sentiment also supported British Pound after the hopes of another vaccine approval rose. A vaccine by Moderna that will offer about 94% protection against the coronavirus was set to get emergency authorization as early as this week by US FDA. On Thursday, a panel of 22 members of experts met to discuss the efficacy and potential side effects of Moderna’s vaccine. However, the American public will start receiving vaccine shots possibly after months, and in the meantime, the hospitals across the country will be caring for the coronavirus patients. These rising optimism raised the hopes that global economic recovery will reach soon and supported the risk sentiment that added strength in Sterling and helped GBP/USD pair to continue its upward movement.
Daily Technical Levels
Support Resistance
1.3442 1.3562
1.3378 1.3618
1.3322 1.3683
Pivot point: 1.3498
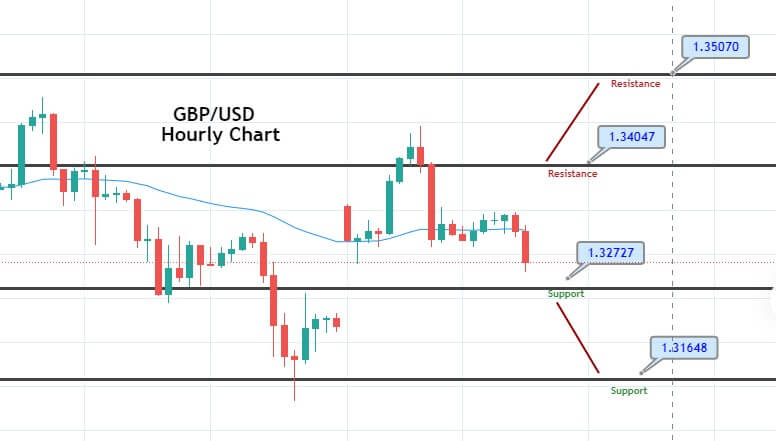
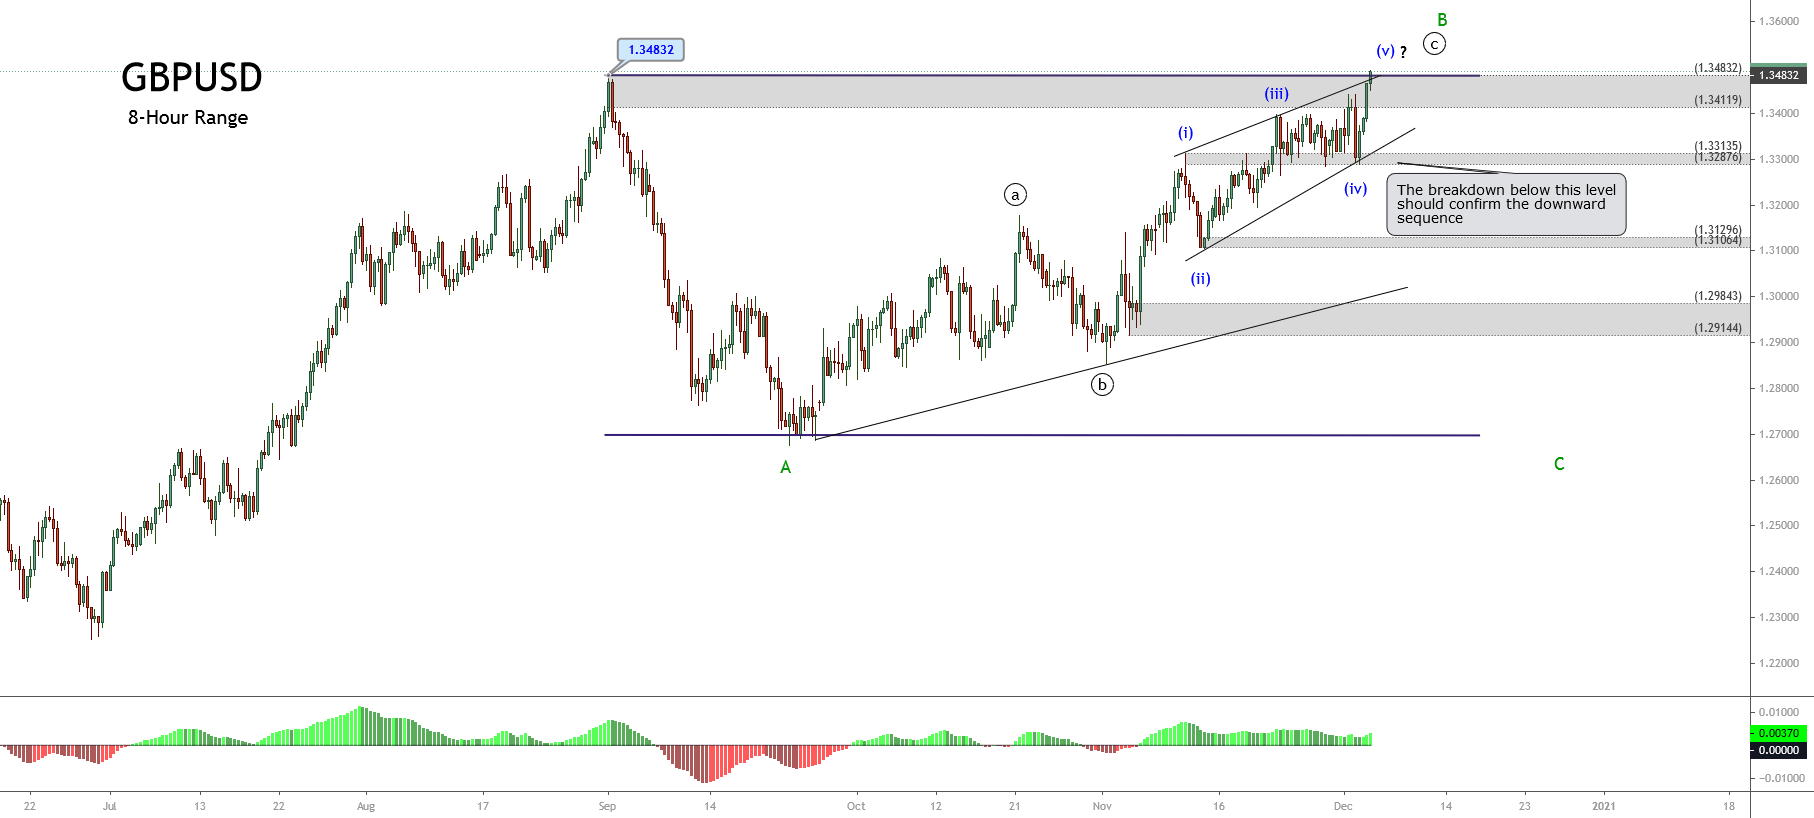
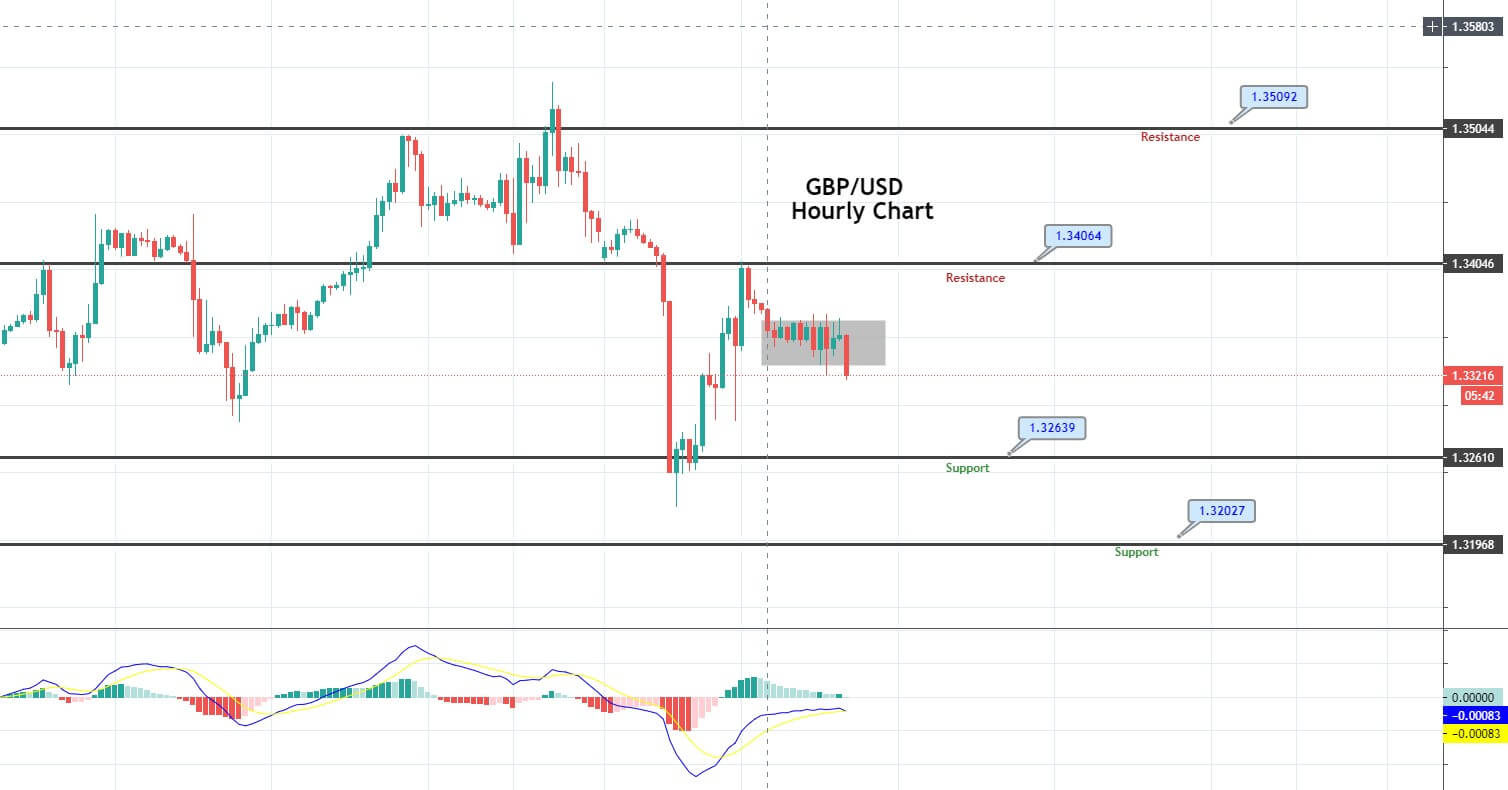
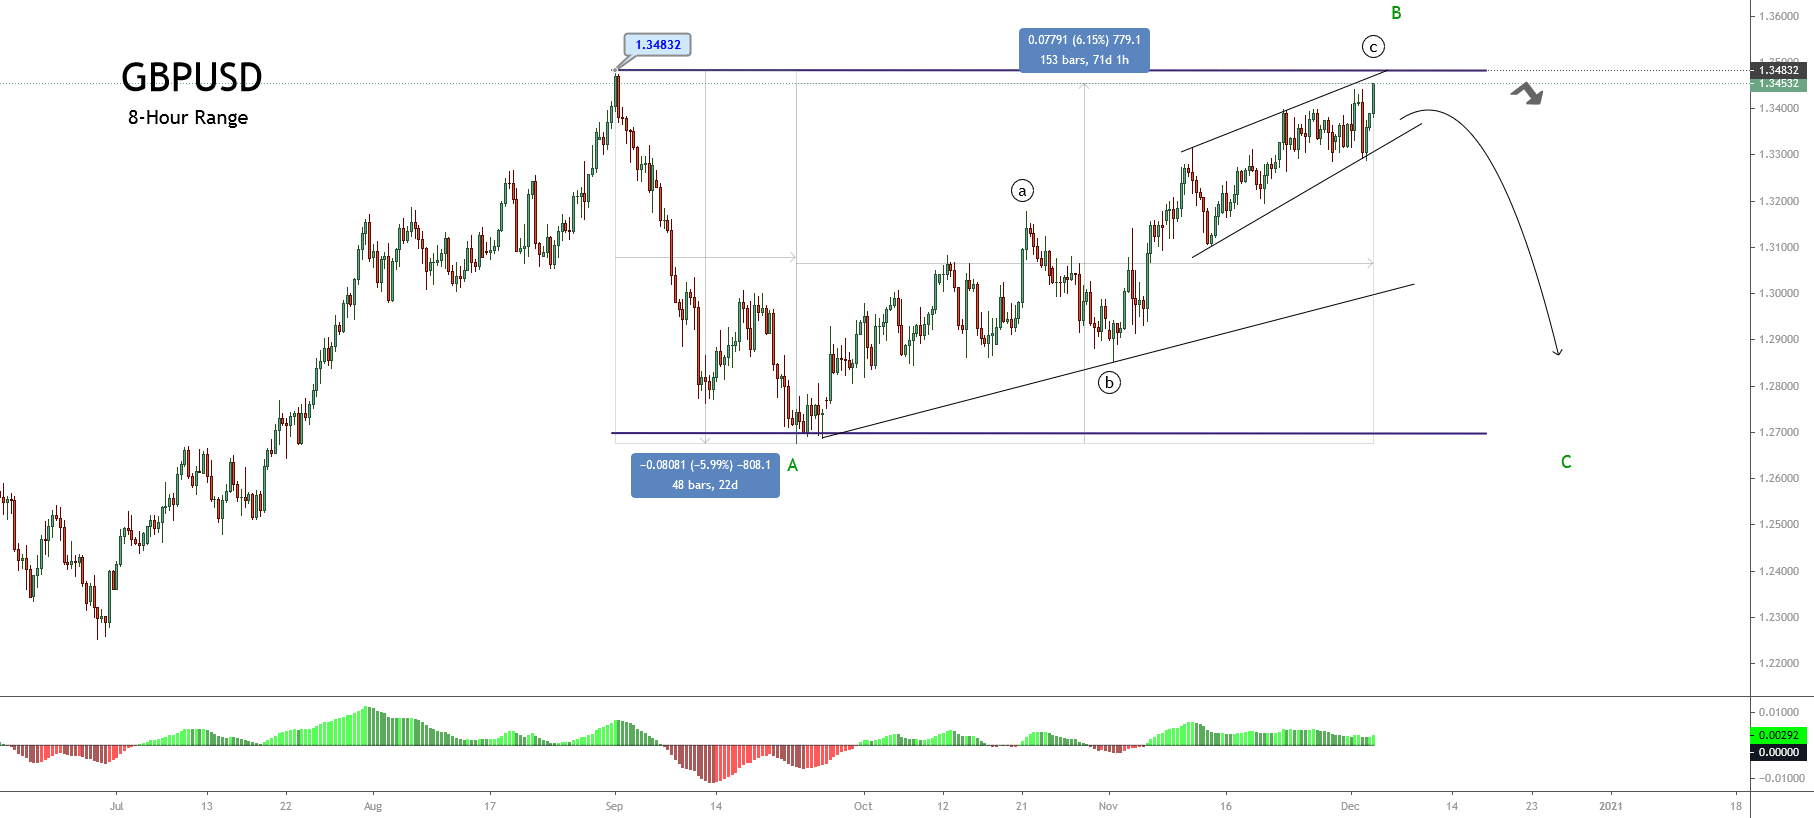
GBP/USD– Trading Tip
The GBP/USD is trading at 1.3550 level, facing an immediate support level of 1.3518 level. This support level is extended by an upward trendline, which can be seen in the 4-hour timeframe. On the higher side, the pair can extend the buying trend until the 1.3588 level, and the continuation of the buying trend can also lead Sterling towards the 1.3625 level. Support holds around the 1.3518 level, and a breakout can lead the pair towards the 1.3495 area. Bullish bias dominates today.
USD/JPY – Daily Analysis
The USD/JPY pair was closed at 103.074 after placing a high of 103.560 and a low of 102.872. The currency pair USD/JPY fell for the third consecutive day on Thursday amid the U.S. dollar’s broad-based weakness. The U.S. dollar fell significantly against the Japanese Yen, and the USD/JPY pair reached 102 level on Thursday as the U.S. dollar index fell below 90 levels for the first time since April 2018. The U.S. Dollar Index that measures the value of the U.S. dollar against the basket of six currencies fell to 89.7 level on Thursday and dragged the USD/JPY pair further on the downside towards its lowest since March.
On Thursday, the Wall Street main indexes rose modestly, with Dow Jones up by 0.39% and the NASDAQ by 0.42%. Meanwhile, the Japanese Yen performed well against its rivals across the board despite the risk appetite and kept the USD/JPY pair under pressure. The hopes for the second round of U.S. stimulus bill from Congress rose and weighed on the U.S. dollar as the Democrats and Republicans reached a consensus over the proposal of $900 billion stimulus aid that will include $600-$700 in the paychecks and unemployment benefits. Furthermore, the rising number of coronavirus cases in the U.S. were also weighing on the local currency as the cases in total reached about 17M in the U.S. Despite the vaccine rollout in the U.S., the rising number of coronavirus causes added pressure on the U.S. dollar and added further downside on the USD/JPY pair.
The USD/JPY pair’s downward momentum was the disappointing U.S. jobless claims on Thursday. On the data front, at 18:29 GMT, the Philly Fed Manufacturing Index in December decreased to 11.1 against the estimated 20.1 and weighed on the U.S. dollar that added pressure over the USD/JPY pair. At 18:30 GMT, the Unemployment Claims from last week increased to 885K against the estimated 817K and weighed on the U.S. dollar and dragged the pair USD/JPY further on the downside. Building Permits for November increased to 1.64M against the estimated 1.55M and supported the U.S. dollar. The Housing Starts in November remained flat as estimated at 1.55M.
Since September, the rising number of unemployment claims to the highest level suggested the effect of increasingly restrictive measures in many states due to increased coronavirus cases and people’s loss of confidence. Meanwhile, in Japan, the main upcoming event was the central bank meeting on Friday. The most likely scenario was a no change in the monetary policy setting and keeping the rates at -10bps and the 10-year JGB yield target at 0.00%. The emergency lending facilities are expected to extend beyond the current run-off date of March 31, 2021. There were no macroeconomic figures to be released from Japan on Thursday, so the pair USD/JPY kept following the U.S. dollar movements that were weak across the board on the day.
Daily Technical Levels
Support Resistance
103.47 104.02
103.25 104.37
102.91 104.58
Pivot point: 103.81
USD/JPY – Trading Tips
The USD/JPY has reversed the selling bias to trade at the 103.550 level. The safe-haven currency pair is trading beneath an immediate support mark of 103.750, and the formation of candles beneath this level will reinforce the bearish breakout. If this happens, we may have an opportunity to short the USD/JPY pair today. Bearish bias looks firm as the MACD is creating histograms underneath 0, and the 50 periods EMA is operating around 103.800 level, suggesting strong probabilities of selling. On the lower side, the USD/JPY pair may find subsequent support at the 102.900 level. It can be a good idea to take a selling position below 103.750 today. Good luck!