Categories
Forex Videos

Forex Fundamental Analysis For Novices – Factory Orders!

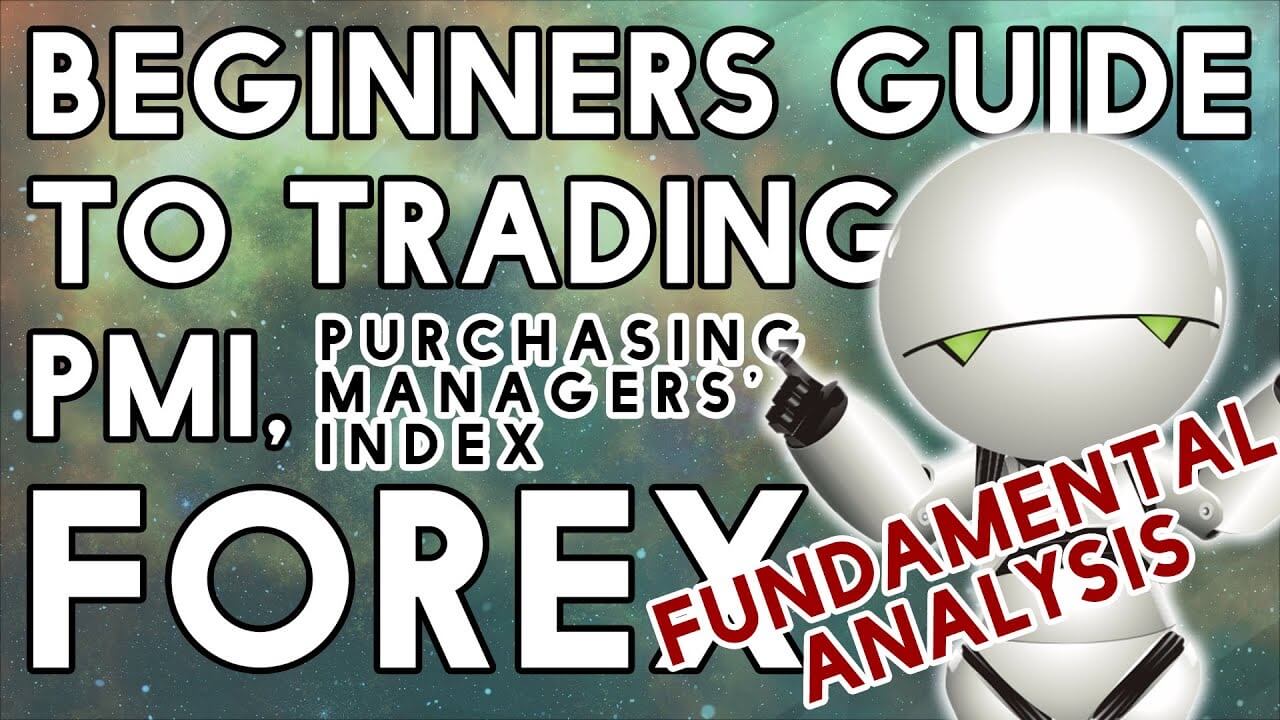
Fundamental Analysis For Novices Factory Orders

Welcome to the educational video Fundamental Analysis For Novices regarding factory orders
What are factory orders, and what do they tell you as an economic indicator?


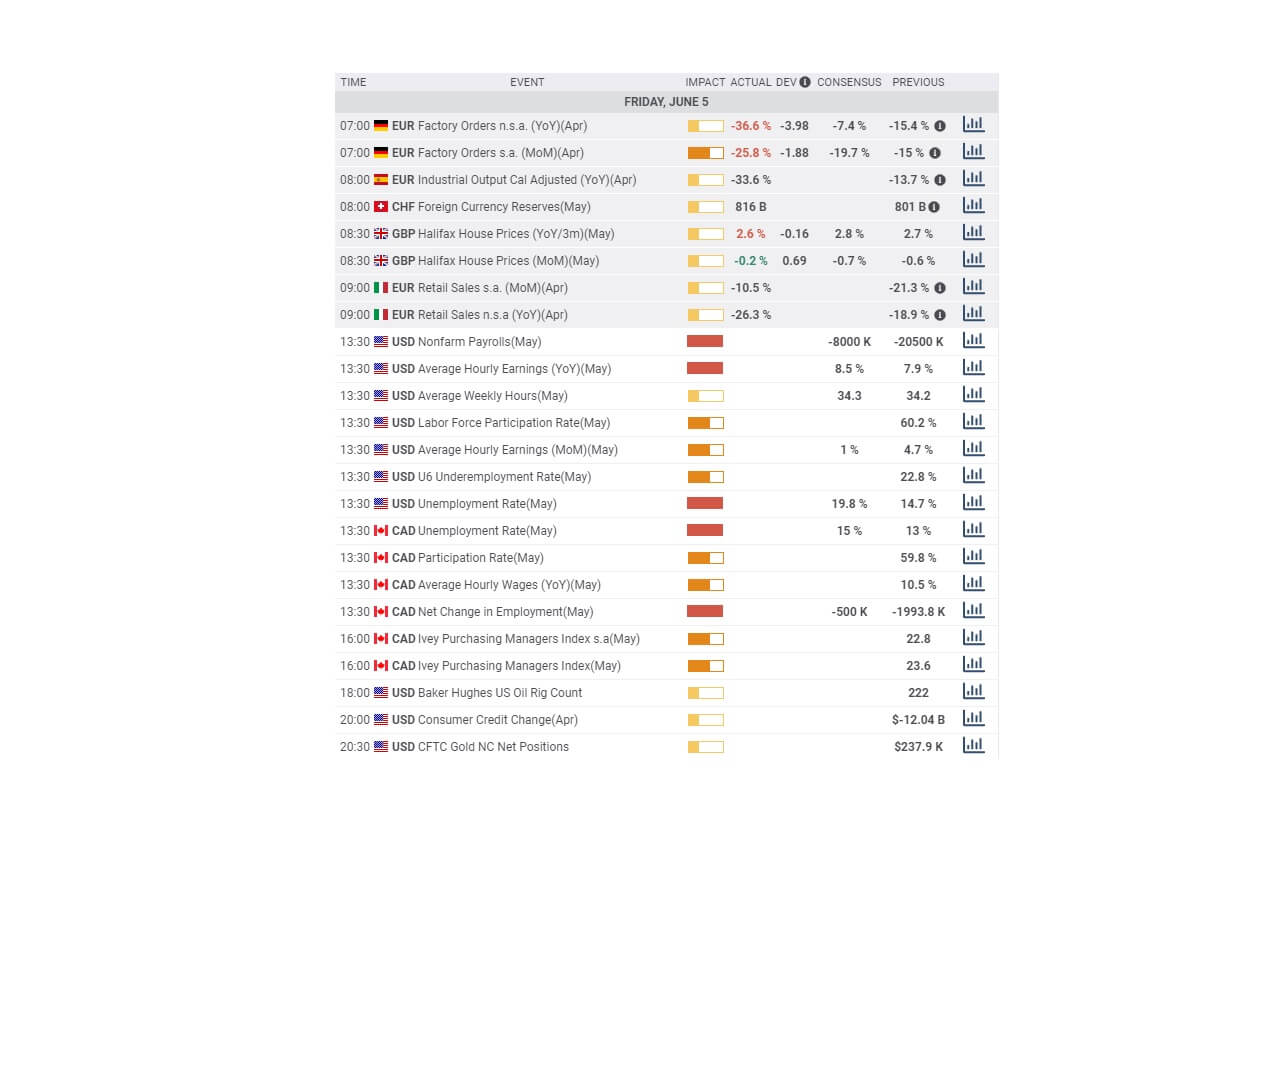
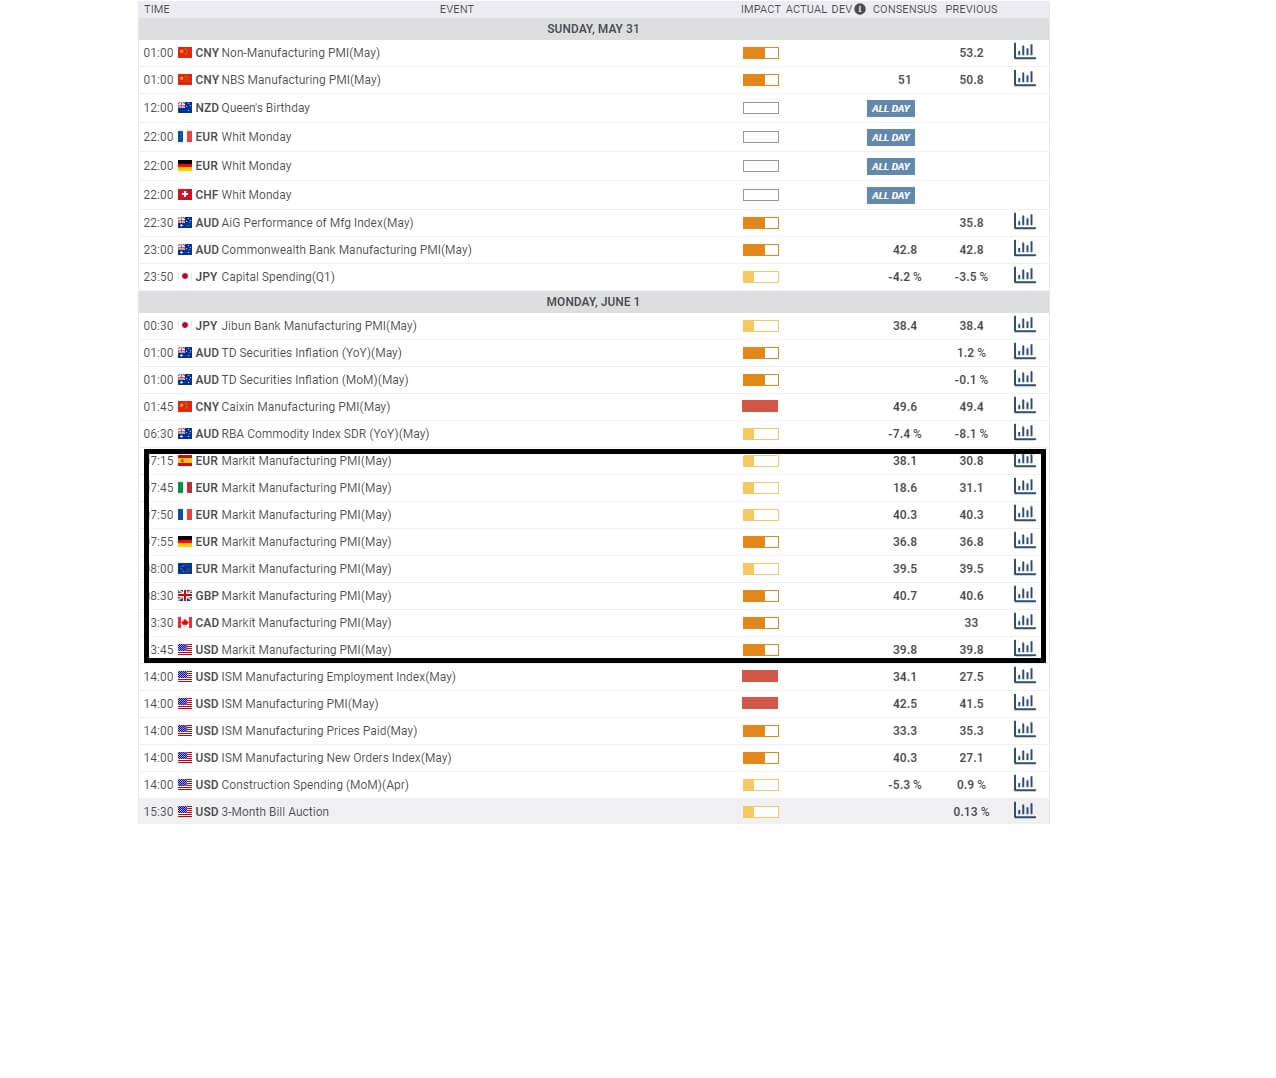
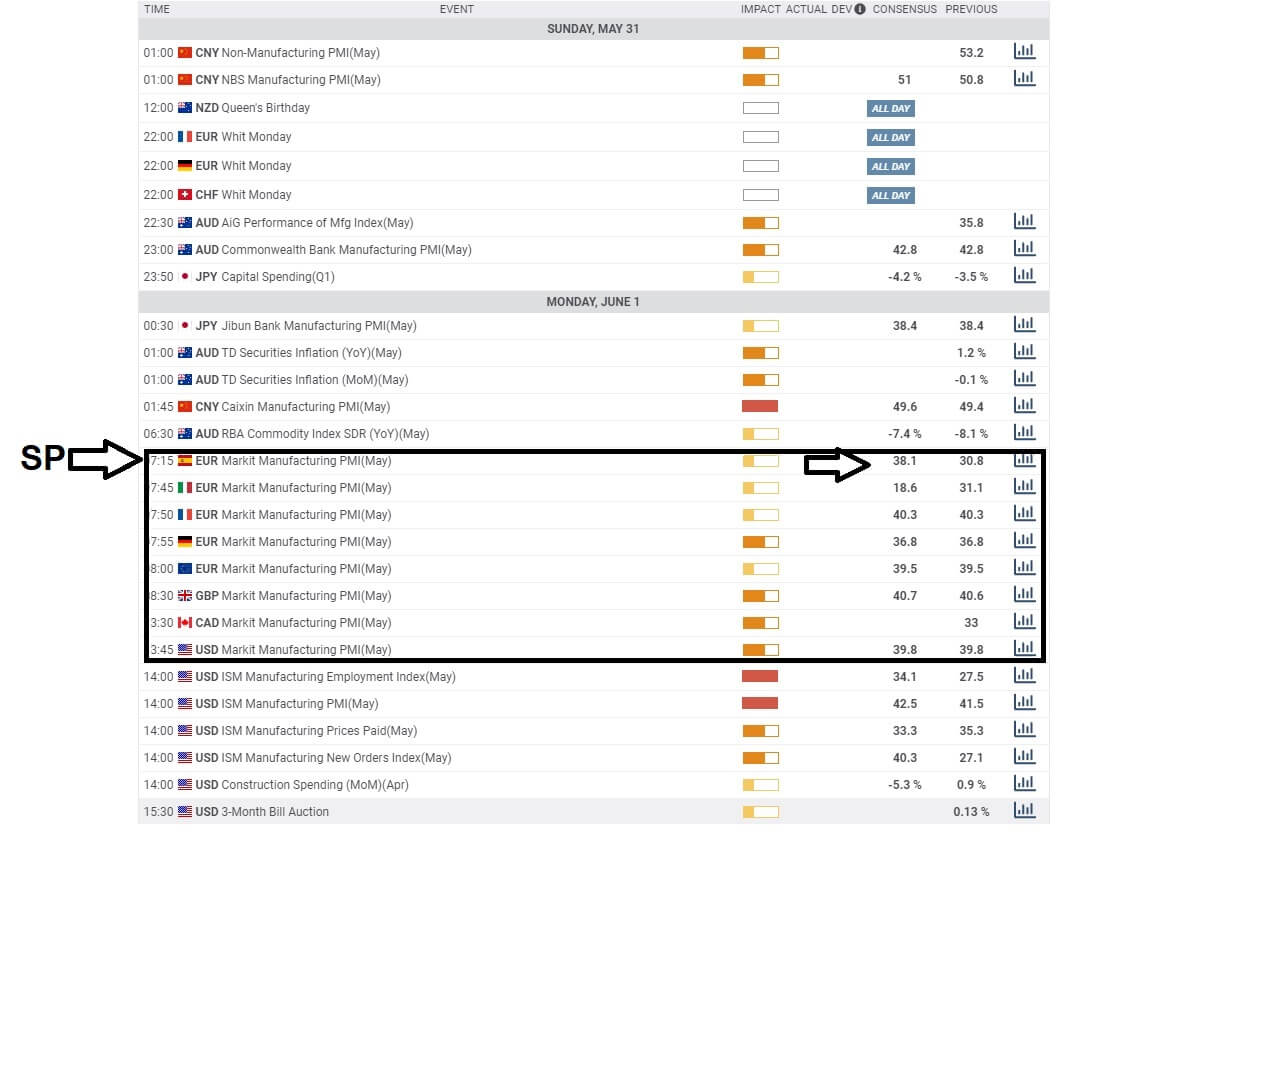
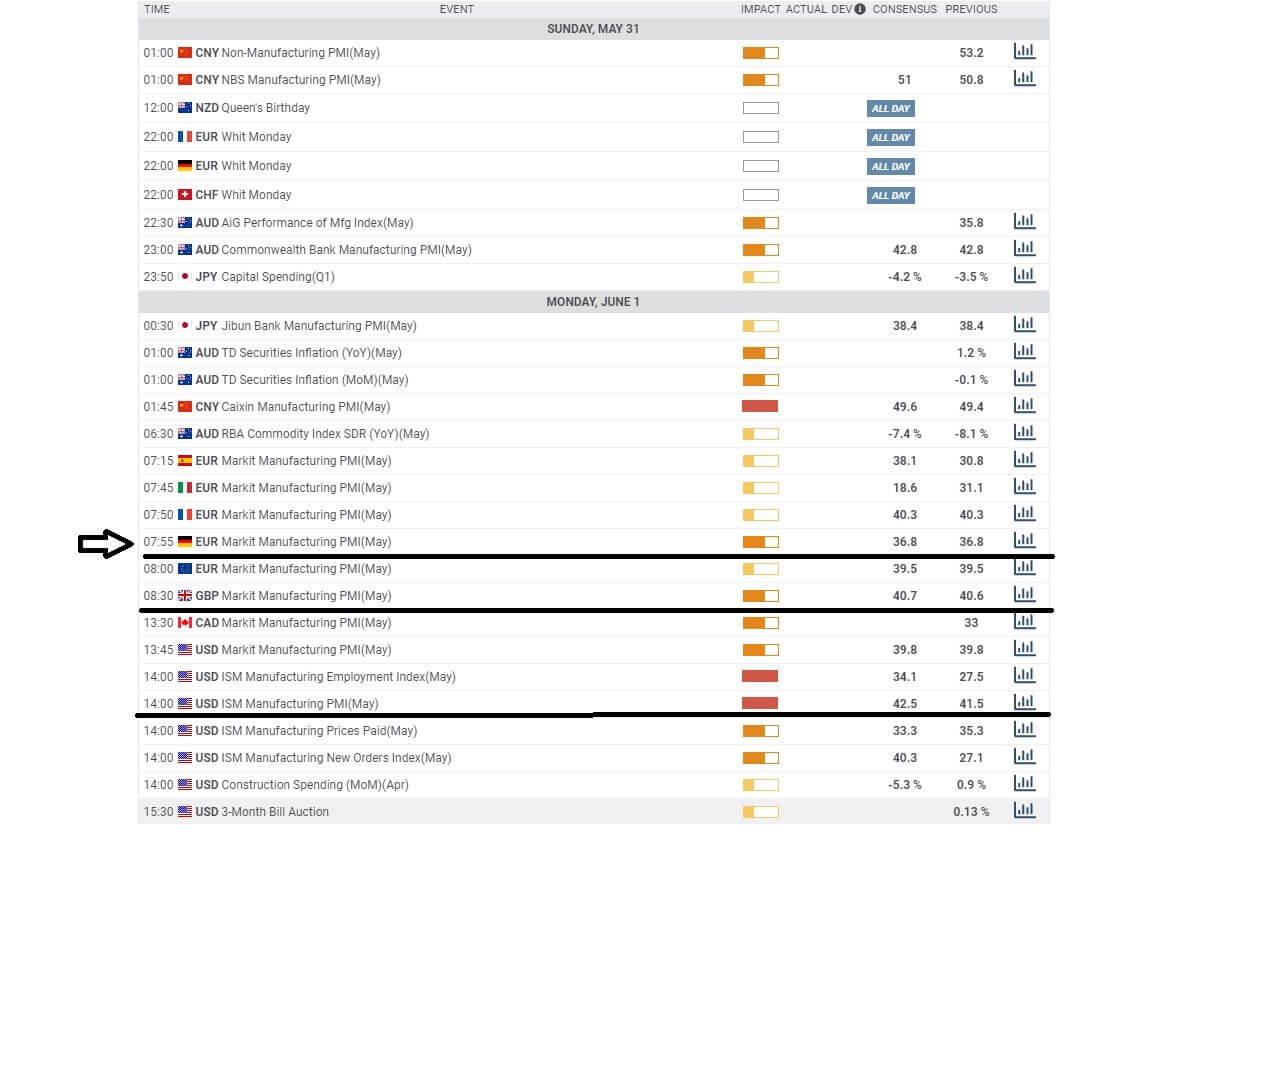
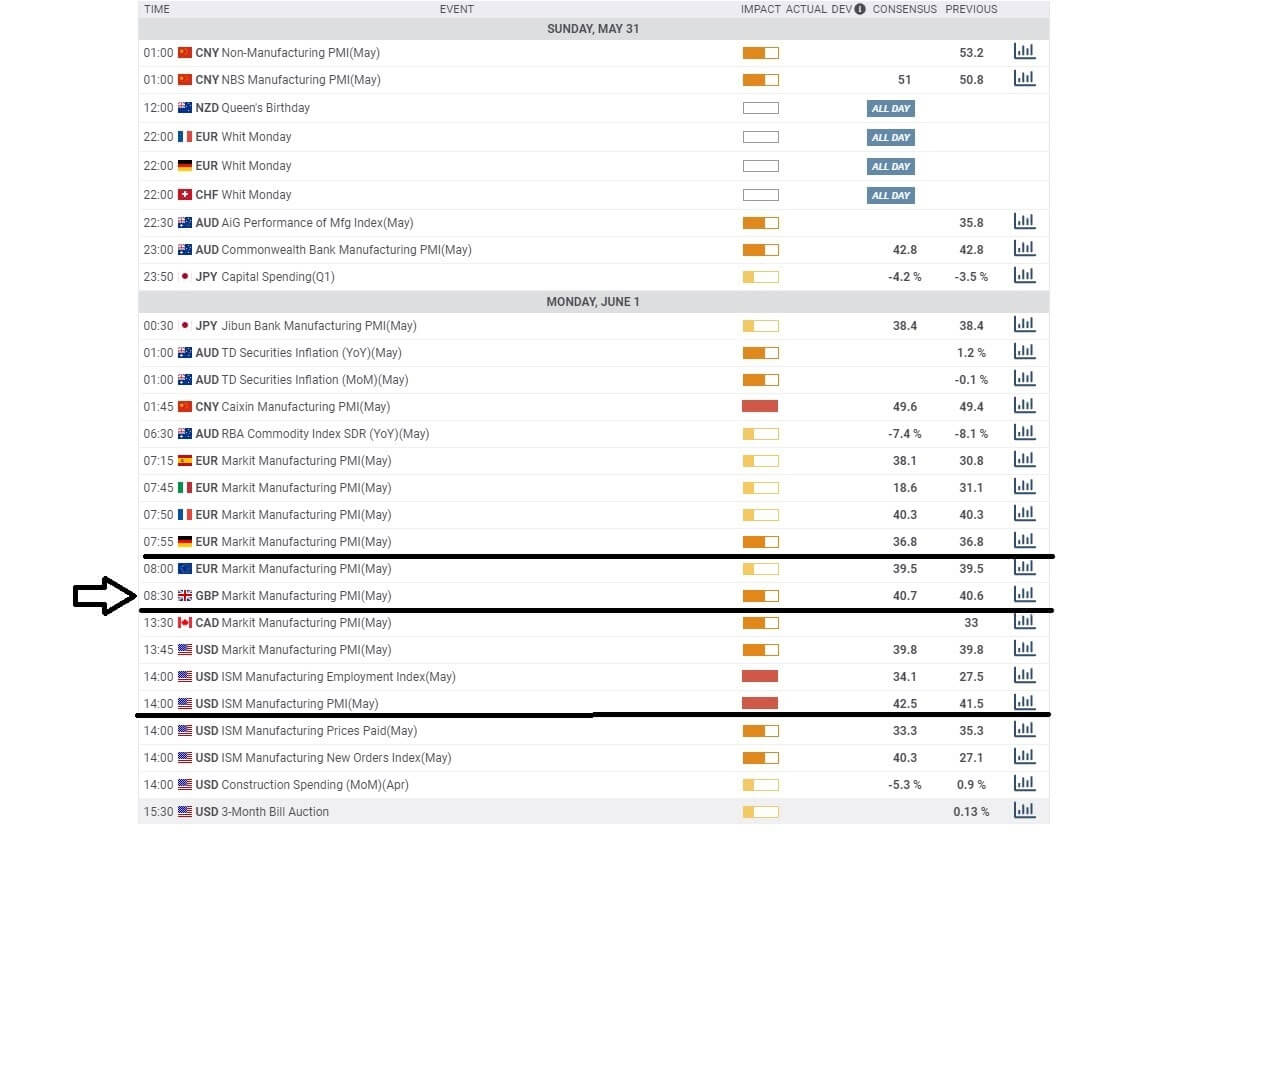
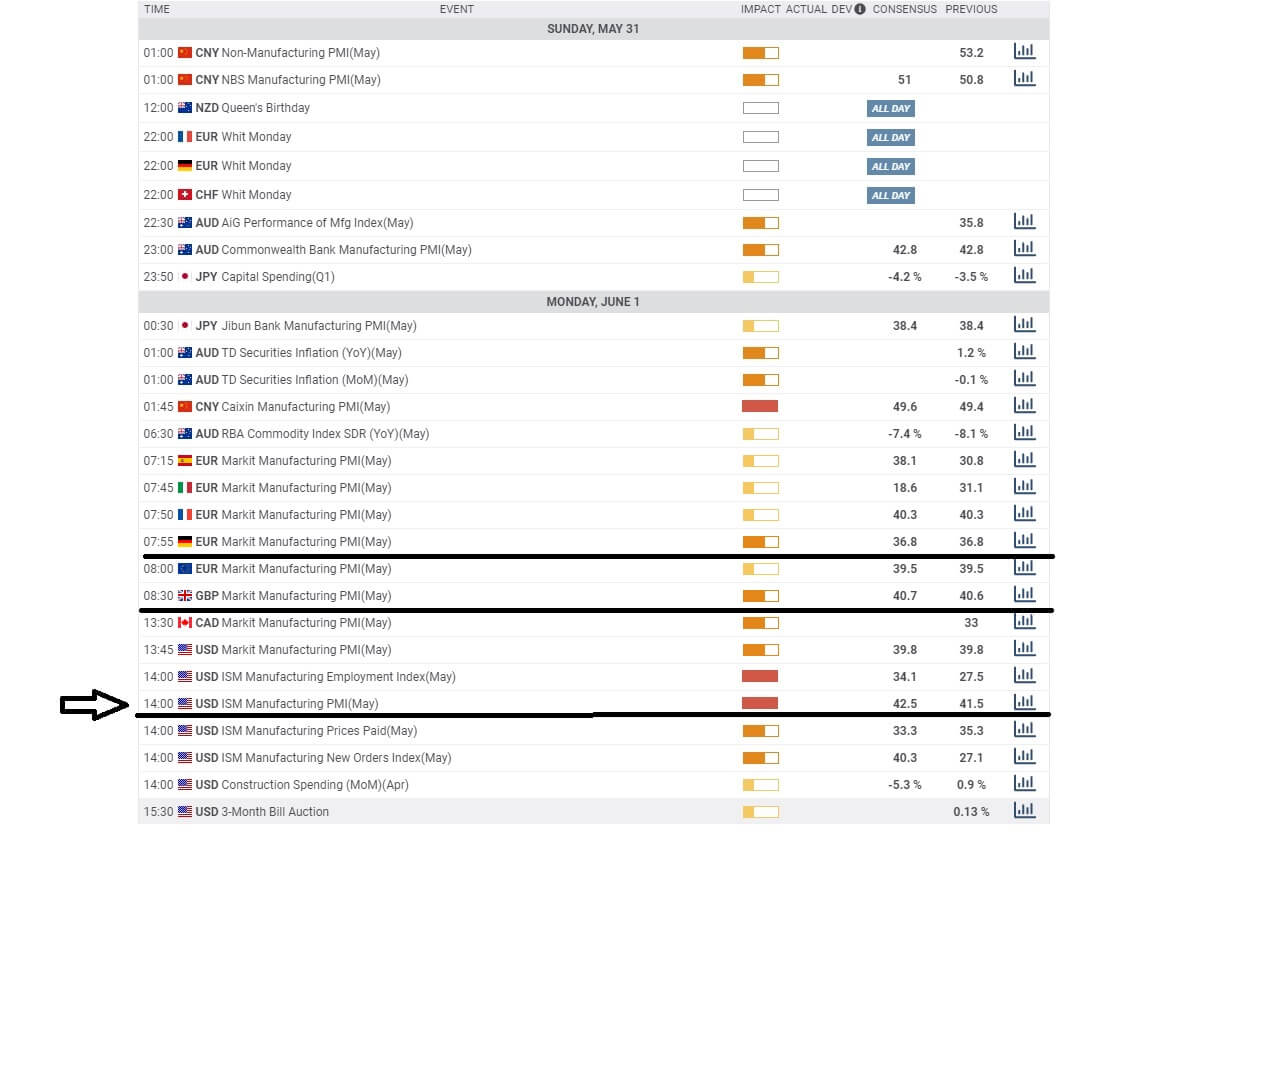
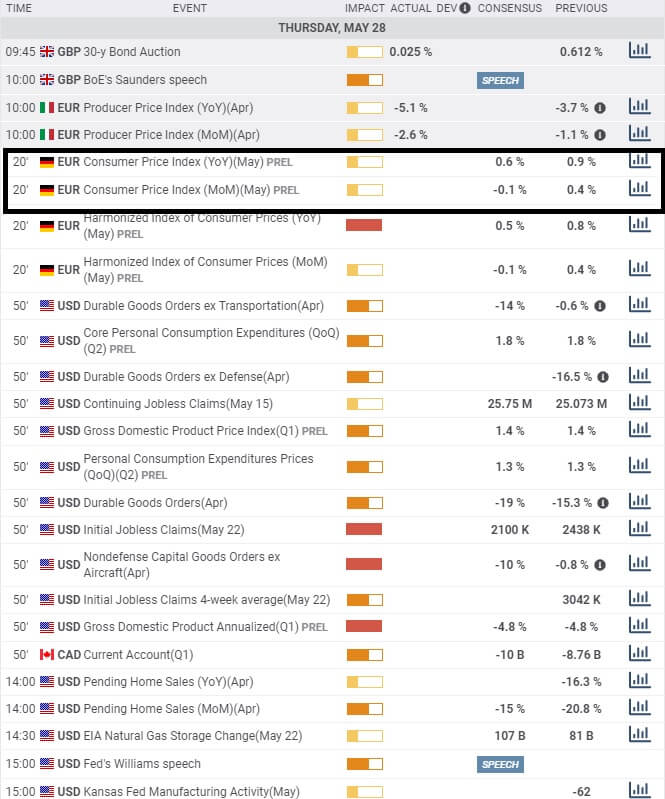
Each day when you look at your Economic Calendar, you will see different types of economic events due for release on particular days.
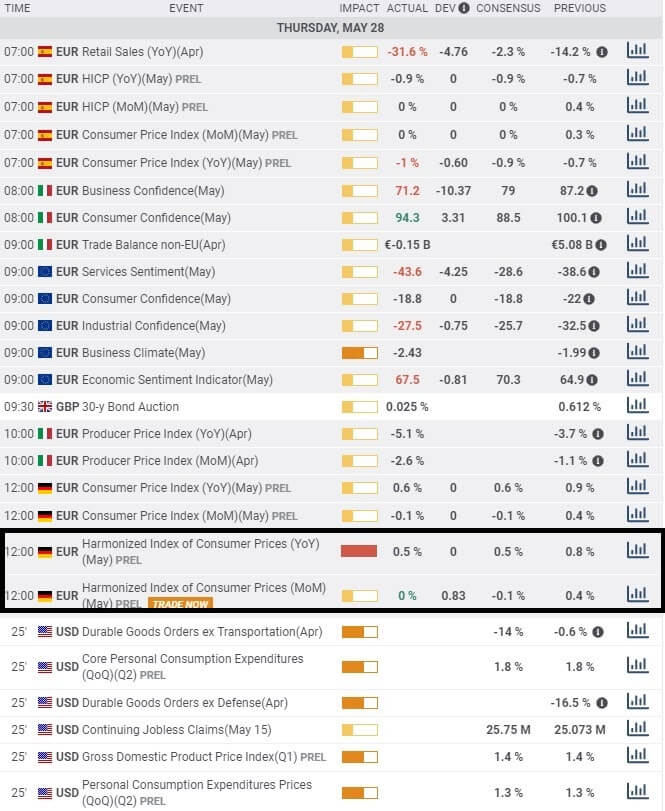
At the top of the economic calendar for Friday the 5th of June, we can see factory orders highlighted for Germany for both year on year and month on month.

Factory orders provide a picture of the financial health of countries that produce durable and non- durable goods. Durable goods are things such as sports equipment, machinery, household appliances, and generally things that are not consumed. Typically they will have a lifespan of a minimum of 3 years. Non-durable goods are produced by consumers and typically have a short shelf life of fewer than three years, Such as toothpaste, laundry detergent, soaps, deodorants, light bulbs, paper plates, and clothing.
Factory orders comprise four sections, new orders, unfulfilled orders, shipments, and Inventories. This data will show whether there is a backlog in production and trends in current sales. All of these taken together will show the strength of the current and future production for an economy.
In America, factory orders are so huge they are reported in the billions of dollars and are released by the Census Bureau of the United States Department of Commerce. All countries report their data as a plus or minus a percentage of previous reports.


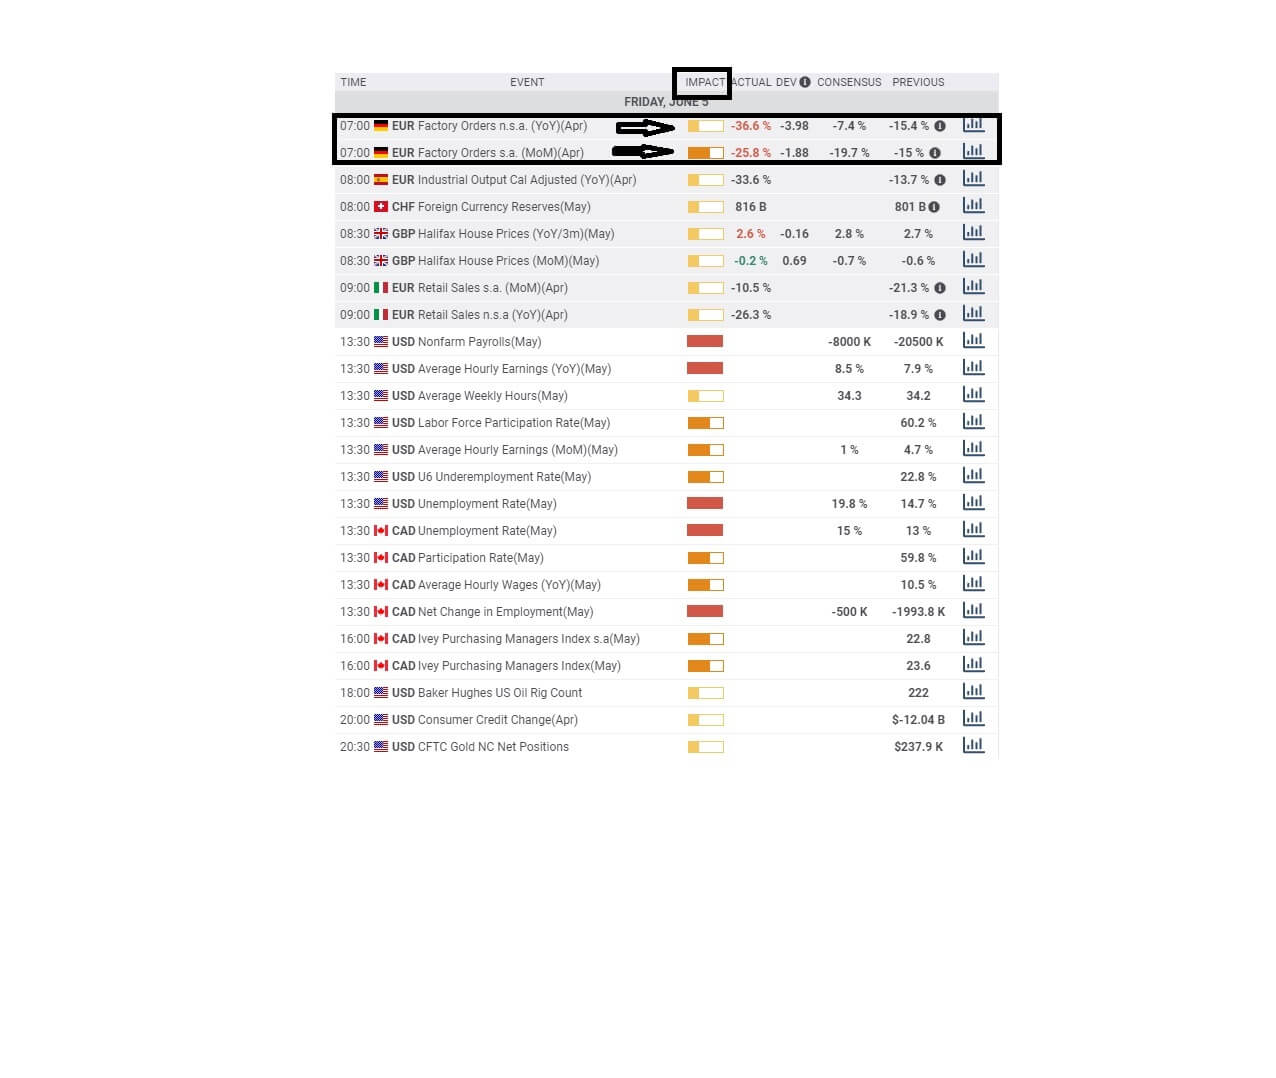
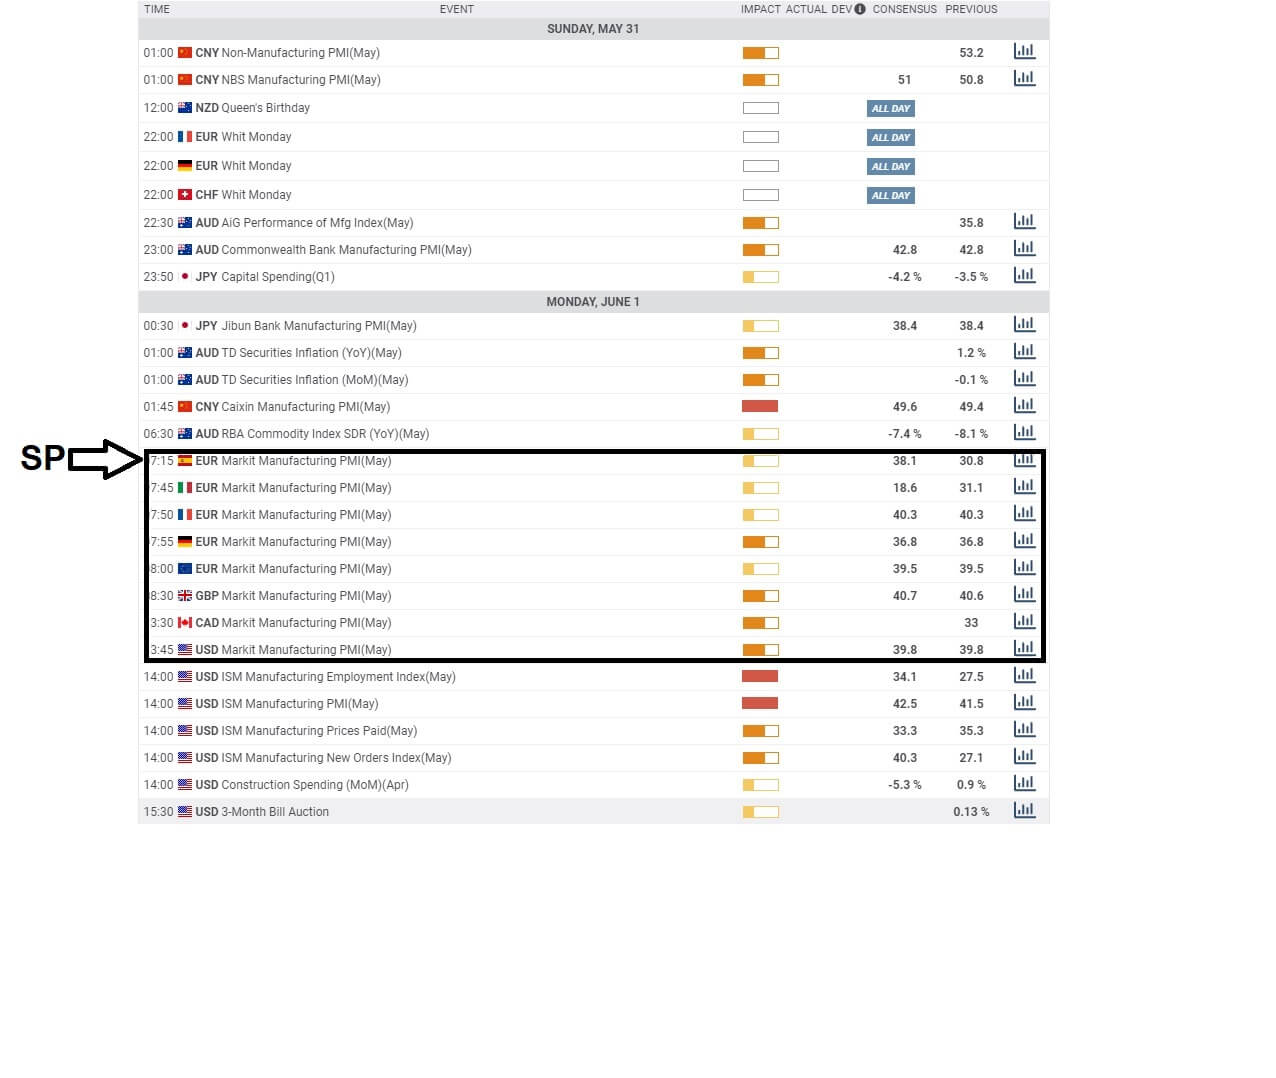
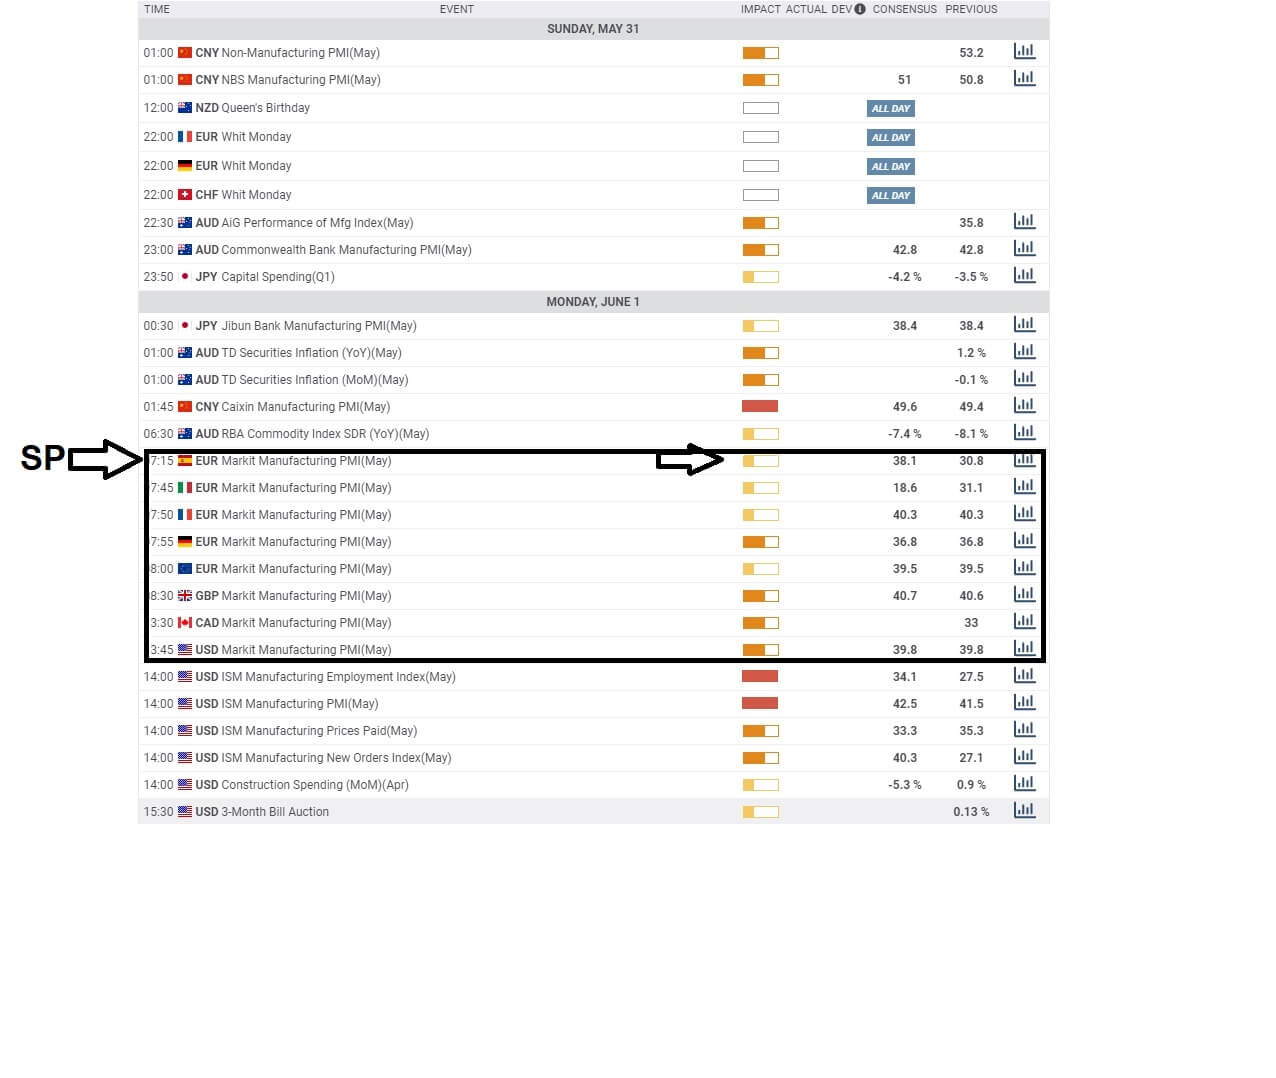
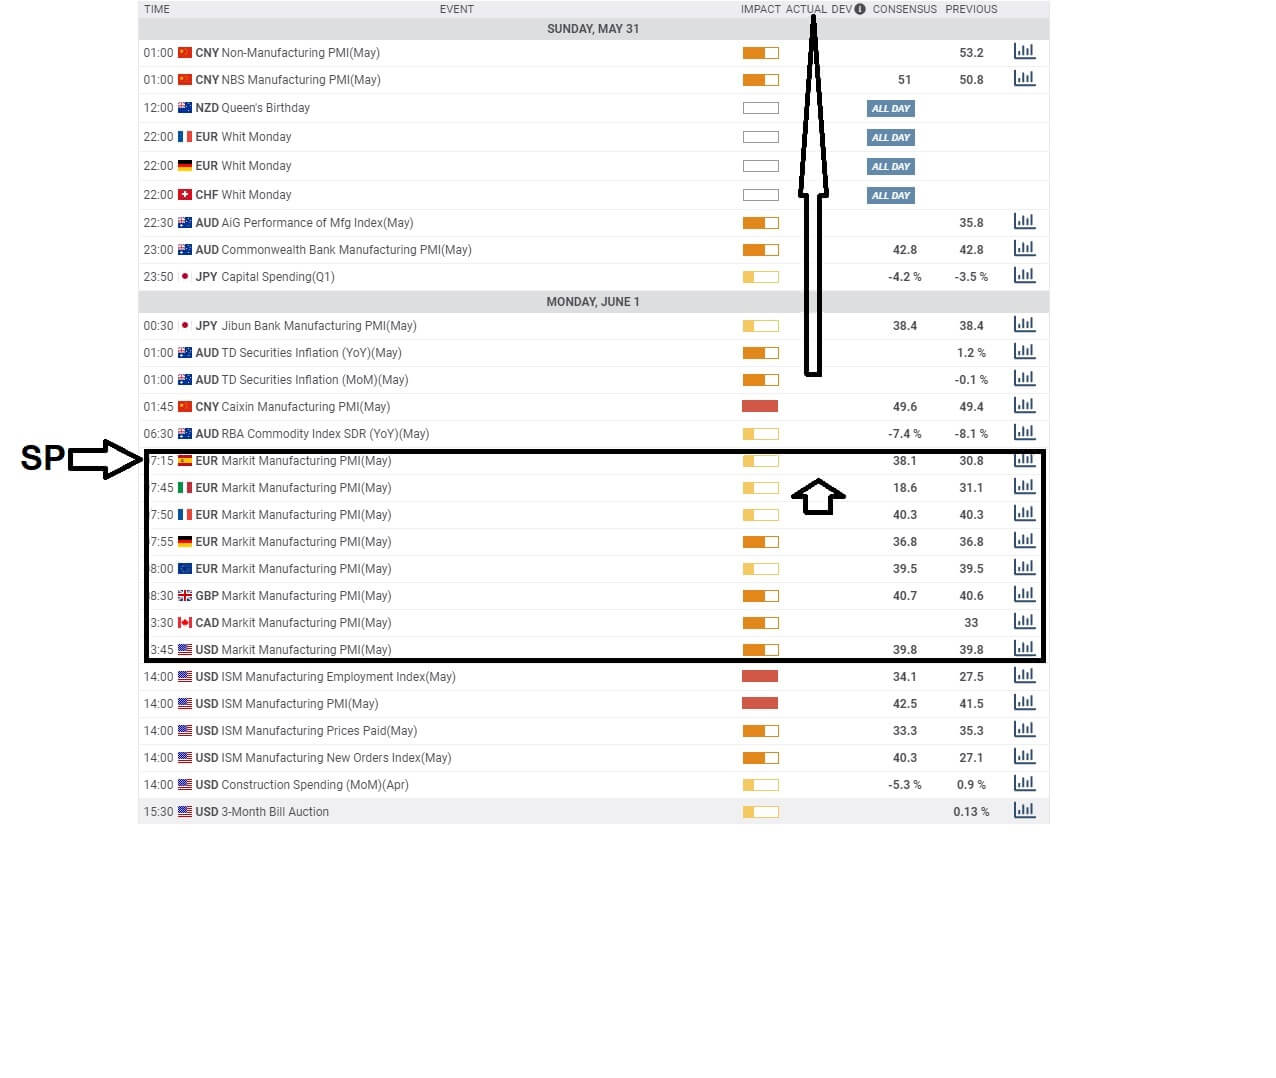
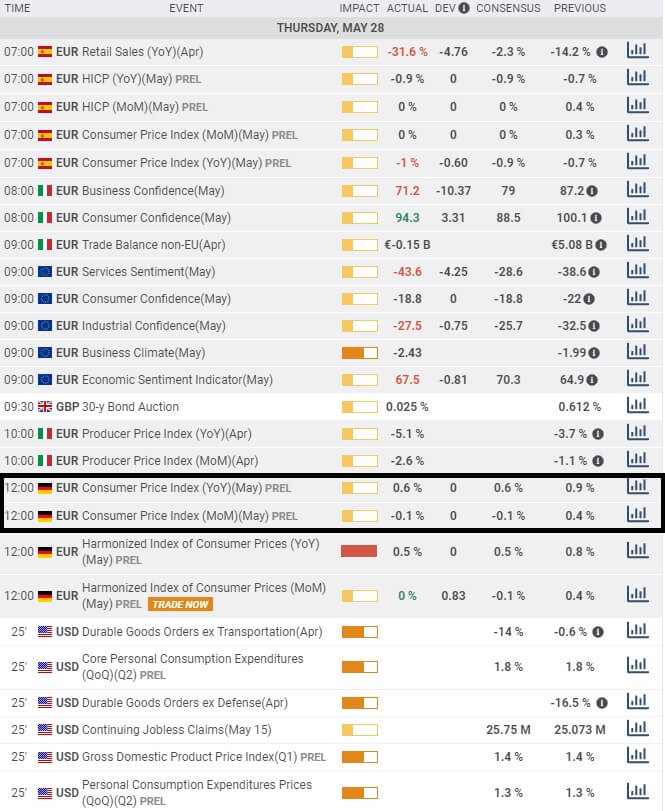
The market attaches a certain amount of importance to all economic data releases, and here we can see color bars that depict the impact that the release of this information will have. We can see that the month on month has a higher impact status than the year on year figure.


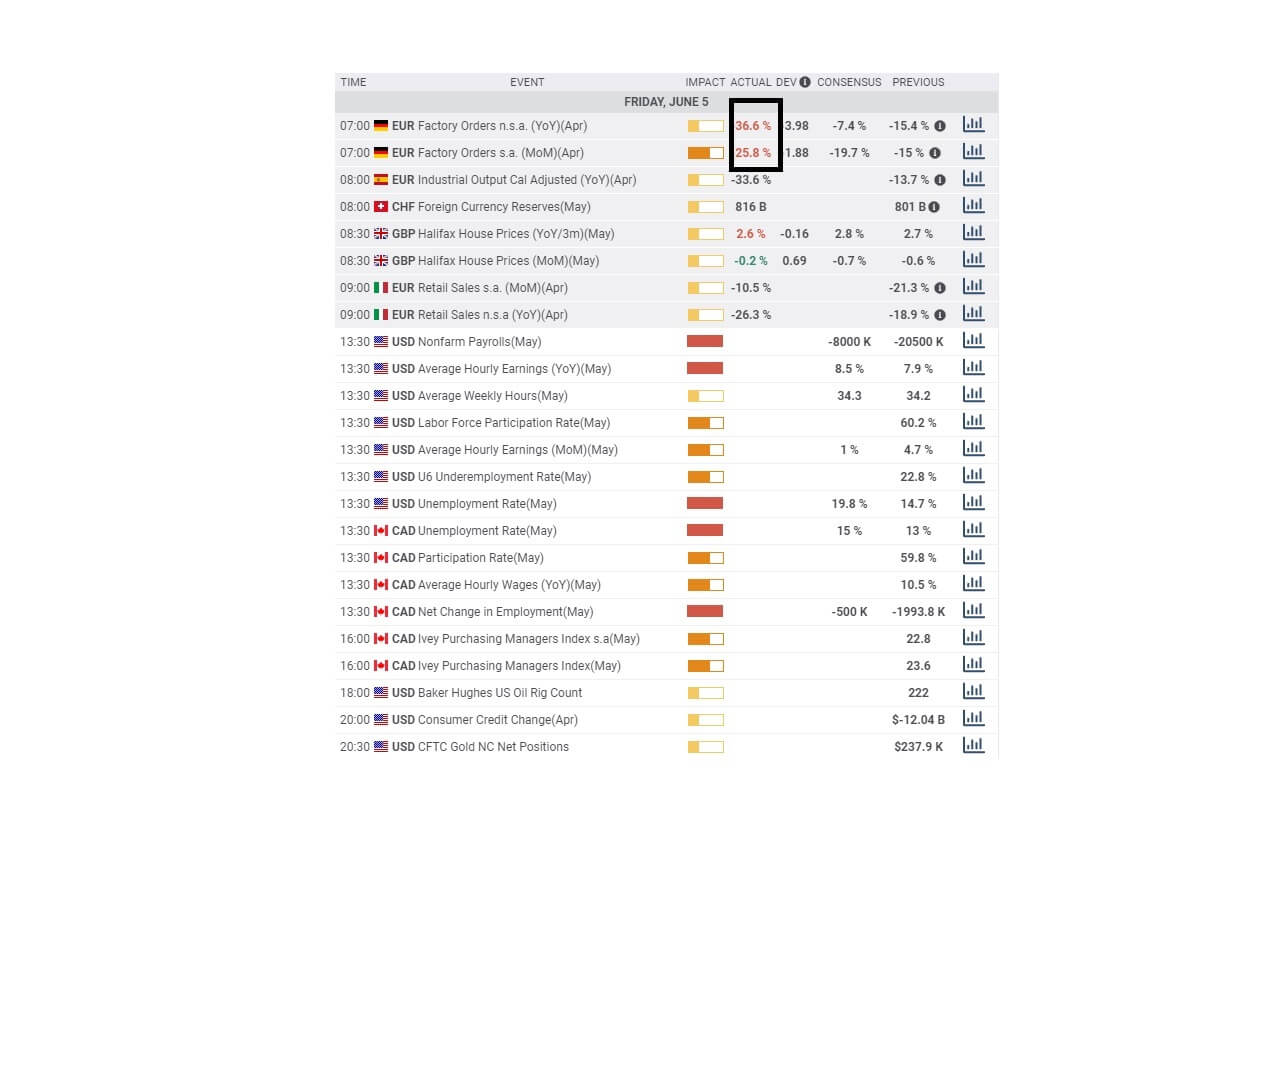
Hey, we can see that the actual data has been released at 7 AM CET and which was subject to an embargo. And when compared to the consensus, which is what the market was expecting and also the previous release from the month of March, the numbers are badly down at – 36.6 % year on year and -25.8% month on month for April.
These are bad numbers and can be put down to the fall out from the coronavirus pandemic, which has severely affected economic activity around the world.

Germany is the strongest economy in the Eurozone, and analysts and economists, as well as financial traders, keep a particular eye open for this type of underperformance.
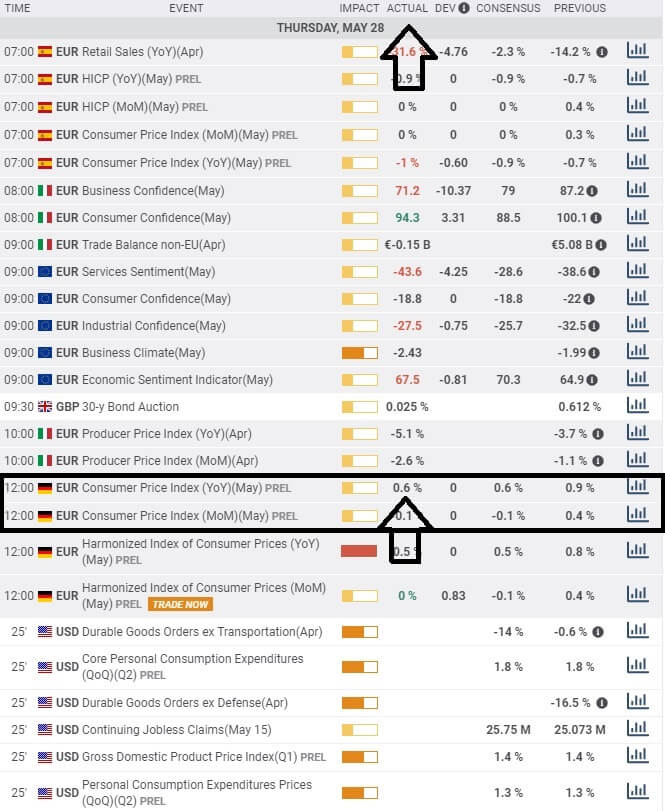
Factory orders show an overall direction of an economy. When factory orders increase, it means the economy is expanding, and consumer demand is high for goods. If a country is contracting, it will show up as bad economic data, such as we have just seen for Germany.
INSERT G: How to trade factory orders data release

Look out for the previous factory orders number and compare it to the previous release and, more importantly, the consensus which will have been formulated by economists and analysts. Big differences between the consensus and the actual number can cause market shocks or volatility. Remember, a higher percentage than the previous month and increase year on year indicate that the economy of a country is likely to be improving. This will reflect in higher consumer demand and is good for the exchange rate of a particular currency, which may move higher against its counterparts.
Conversely, if the data release is lower than the previous month and shows a decline this is a sign that the economy of a particular country is stagnating or contracting and therefore there is less consumer demand, and this could have the opposite effect of an exchange rate moving it potentially lower against its counterparts.

Categories
Forex Videos

Fundamental Analysis For Novices Markit Manufacturing PMI!


Fundamental Analysis For Novices Markit Manufacturing PMI

Welcome to the educational video on fundamental analysis, and this one is about, Markit manufacturing PMI.
The PMI element is the Purchasing Managers’ Index and is compiled by IHS Markit for over 40 major economies throughout the world. The information is updated month on month and released subject to an embargo at certain times, depending on the country.


And so if you are keeping an eye on your economic calendar, you would expect to see something like this for Markit Manufacturing PMI’s.


So the first one due on Monday, June 1st, is Spain.

The bar on this type of calendar shows the impact the news release will have in the financial markets, pertaining to the economic conditions of the country and as a part of the Eurozone, where Spain shares the common currency.


And then we have the previous month’s release, which was 30.8, the consensus by market analysts for this month’s figure, which is 38.1.


And when the figure is released at 7:15 a.m in Europe, the actual number will appear here.
The PMI, which stands for the purchasing managers index, is a snapshot of business conditions in the manufacturing sector for each country. Manufacturing is a huge component of a country’s gross domestic product, and therefore provides a picture of the overall economic conditions and financial health of a nation, in this case, Spain.

Generally speaking, a result above 50 signals bullish sentiment for the Euro, whereas a result below 50 is seen as bearish. Obviously, Spain is only one of 19 countries that use the Euro and one of 27 Eurozone member states, and because its economy is small in relation to some of the other country’s it has a lower impact.


Here we can see that the impact bar is higher for Germany because it has a larger economy than Spain, and therefore its relevance is greater because Germany contributes more to the Eurozone coffers.


Similarly, the impact for Great Britain is of high importance.


And when it comes to the United States, the PMI is very widely anticipated because it has a huge impact on the American economy and also because the US Dollar is the dominant currency in the world.
In the United States, this data is collated by a company called the Institute for Supply Management, or ISM and where they measure the manufacturing activity of more than 300 manufacturing firms across the USA, and where the monthly report, which is also referred to as the ISM Manufacturing Index, is announced on the first business day of each month, in line with most other countries, and where a reading below 50 suggests a contraction in manufacturing and where a number above 50 suggests expansion and where a reading of 50 means no change.

So how to trade the market manufacturing PMI and the ISM manufacturing index. Remember, we are looking for numbers above or below 50 and where above 50 is bullish and good for an economy, in which case you might expect to see a country’s currency exchange rate getting stronger. Conversely, numbers below 50 indicate a contraction in manufacturing for that country, and therefore this is a bearish number, and you might expect to see that country’s currency exchange rate move lower.

You will very likely find extreme volatility when the PMI numbers are released and are completely out of line with the market consensus. Markets do not like shocks, and when they occur, it creates market volatility.

Categories
Crypto Videos

Bitcoin vs Fiat currencies – Battle Of The Titans!


Bitcoin vs. Fiat currencies – The best investment in the past 1200 years!

Although it was not designed as an investment vehicle, Bitcoin’s value increase has made it the best currency investment in the last 1,200 years.
Its value appreciation over the past 11 years truly sets it apart from all of the world’s fiat currencies.
The first widely accepted Bitcoin commercial transaction happened on May 22, 2010, when Laszlo Hanyecz bought two pizzas for exactly 10,000 BTC. With the pizzas being worth around $30, this puts the transaction value to around $0.003 per BTC at this point.
If we take the price of $0.003 per Bitcoin as a reference point, Bitcoin’s price has appreciated over 320 million percent over the past ten years. Now let’s compare that with other currencies.

The US Dollar

The US dollar has been the only and official currency of the United States ever since the Coinage Act of 1792. In those 228 years, the US dollar managed to devalue quite a bit due to inflation.
According to consumer price index data, we know that $1 in 1792 bought the equivalent of today’s $26.71. In other words, the US dollar has lost over 96% of its value in these 228 years. The vast majority of the value dollar managed to lose actually happened since its decoupling from the gold standard, which happened in 1971.

The Euro

The Euro became an official currency on January 1, 1999, making it just ten years younger than Bitcoin. Therefore, we cannot say that currencies performed worse just because they are significantly older.
The Euro suffers from basically the same design issues as the dollar, the main one being inflation. One Euro today is worth the equivalent of just 0.70 euro in 1999, meaning that this currency has lost thirty percent of its value in only 21 years.

The British Pound

The British Pound is the oldest world currency still in use. It is actually over 1,200 years old. The decimalized pound sterling of today isn’t exactly what the original Pound was, which makes the comparison a bit inaccurate.
The original “pound” from the 8th Century was composed of 240 silver pennies. One Pound was equivalent to 350g, which is worth £156.45 ($200) at the current silver price. If we consider the original silver value rather than the spending power of the currency itself, in 1,200 years, the Pound has arguably appreciated by 15,545%.
Even if we do choose this optimistic way of measuring as our benchmark, the results still can’t even hold a candle to Bitcoin’s performance over the past ten years.

Categories
Crypto Videos

How To Get Money Back on Your Nike purchases! Just Do It!

How To Get Money Back on Your Nike Purchases – Crypto Edition


US footwear giant Nike has recently entered a new affiliate partnership that allows its customers to earn up to 3% from their online purchases with crypto.

The partnership with the London-based financial technology firm Plutus​ is now offering rewards through its debit card when its users shop Nike’s online store. When using this card, you can get 3% back in crypto and 9% cash reward from those purchases.

Who can use this card

In order to receive these rewards, customers must be using the Plutus Visa Card while doing their online shopping. As Plutus currently operates only within the United Kingdom and the European Economic Area, only people from these regions would be able to get the card.
The rewards on your purchases are generated in Plutus’s native token called Pluton. At the moment, this token is trading at $1.75, with a current market capitalization of around $1.5 million.

The future

By connecting with Nike to provide crypto rewards, Plutus is making yet another step towards bringing cryptocurrencies into everyday life. The team-up with Nike came months after Plutus introduced a similar feature for the major travel websites – Airbnb and Skyscanner. Unfortunately, the development had to be paused as the coronavirus spread intensified.
As time passes, more companies such as this one will bring crypto into everyday lives of people, making it more accessible and easy to use.

Categories
Crypto Videos

Multi Sig Wallets Now Securing Over 6M In Bitcoin!

Multi-Sig Wallets Now Securing Over 6M Bitcoin


Almost one-third of the total Bitcoin supply is now secured with multi-signature wallets.

Multi-sig Wallets

Bitcoin is secured with a combination of a public and a private key. In order to transact by using the Bitcoin network, a user needs to sign each transaction with the aforementioned private key. While this works fine in most cases, there are situations where this arrangement is not ideal.
As an example, if a cryptocurrency exchange founder secures all of the firm’s assets with a private key, only they know, it might not be optimal. If it happens that the founder suddenly dies, gets hacked, or even decides to engage in an ‘exit scam’?

If any of these things were to happen, all the funds would have been lost forever.
In order to alleviate these issues, a Bitcoin soft fork was introduced in 2012. This form enabled the use of multi-signature wallets, which, as the name suggested, allowed Bitcoin to be secured with multiple signatures. In order to use the wallet, a transaction would need to be signed with each of the private keys provided.
To continue our example, the same exchange founder could secure all the firm’s assets with five signatures while requiring at least three signatures for a transaction. The signatures could belong to the company executives, or even trusted third parties.

Adoption

While multi-sig wallets existed since 2012, the feature didn’t get widely adopted since 2015. The reason for that is that most people and companies did not really care about it until Mt. Gox (read as mount gox) got hacked. After this hack, the community recognized the flaws of the decentralized one signature wallet system.

Categories
Crypto Videos

Regulators vs Bitcoin! The Only Thing Standing In Bitcoin’s Way


Regulators vs. Bitcoin (double standard?)

Bitcoin exchange-traded funds have faced unfair pushback from US regulators, said director and digital asset specialist of VanEck, Gabor Gurbacs.
He claims that there’s a constant double standard against Bitcoin and other digital assets.

SEC Bitcoin ETF denials 

Law or auction gavel and bitcoins on a wooden desk, dark background

A Bitcoin ETF is a financial product that is officially traded on mainstream stock markets. The ETF shares are representing exposure to Bitcoin’s price, and they can be cash-backed or BTC-backed. Trading via ETFs basically allows for Bitcoin exposure through traditional market methods and brokers.
The US Securities and Exchange Commission has denied a massive number of Bitcoin ETFs over the past couple of years. VanEck submitted one of the most notable Bitcoin ETF proposals that ultimately got denied by the SEC after facing many delays.
For the Bitcoin ETF to be approved, regulators say that they need proof that Bitcoin has true price action and not action through market manipulation. However, when comparing Bitcoin’s situation to another available traditional market ETFs, the argument about true price action just doesn’t hold water.

Gurbacs defends Bitcoin price action

Bitcoin holds relatively efficient price discovery, which is even better than certain commodities already on the market, said Gurbacs. He also noted that he revealed proof of such data to the regulators. VanEck, together with its daughter company called MV Index Solutions, developed regulated indices in hopes of appealing to regulators.
Gurbacs added that, while he sees improvement in understanding this technology from the regulators, they have not come around yet. We have seen Wilshire Phoenix facing one of the most recent Bitcoin ETF denials from the regulators in February 2020.

Categories
Crypto Videos

China Embracing Blockchain & New Technology!

China Embracing Blockchain – A City Launching Blockchain-Powered Notary Program

The city of Suzhou wants to implement a program that would use real-time notarial tracing functions, and that would be powered by blockchain. This pilot program would, as reported in the local news, provide a wide range of notary services in the city of Suzhou, China.
The authorities of Suzhou announced that this program will hopefully help millions of citizens with accessing legal and government offices via the internet. The announcement was made on June 5.
The pilot platform will cover personal freedom, health, life, property rights, and more.

All of the materials will be uploaded and available through the cloud. Both audio and video records will be distributed and shared among notaries involved for legal purposes, therefore facilitating the use of real-time tracing functions.
This network will be called “Suzhou Notary Chain,” and it will allow the administrative law enforcement unit to use this system for online notarization as well as for carrying out the entire process through shared files stationed on the cloud platform.
Unlike the highly-conventional method of storing audio and video files only within a law enforcement database, this blockchain-based notary services platform will be used to process everything from recording to distribution. in theory. This should guarantee “easy data storage, non-tampering, high security, as well as traceability.”

China’s blockchain adoption

China continues to take bold steps towards blockchain technology adoption. It is slowly starting to implement related systems within different sectors of the economy, making it one of the leading countries in the sector. However, China’s stance on cryptocurrency is still not as open as people would like.

Categories
Crypto Videos

Swiss Regulators Now Allow Crypto Transactions! Another Big Step Forward!

Swiss Regulators Allow Crypto Transactions to a Local Bank – Major News

InCore bank became the first Swiss b2b bank that was approved by the financial regulators to operate with cryptocurrencies.
The Swiss Financial Market Supervisory Authority has authorized InCore bank to transact digital assets, therefore allowing customers worldwide to access as well as transact within the bank. The firm now has the ability to allow institutional clients to trade, transfer, and hold digital assets. Regulators have also allowed the bank to develop its own tokenization capabilities.

InCore announces partnership with IT crypto-asset consulting firm

Mark Dambacher, the CEO of InCore Bank, praised the decision that the regulators have made and commented:
“Our customers benefit greatly from the expansion to the new asset class without ever having to invest in infrastructure or new processes themselves. And all this while maintaining the usual security standards.”
The bank has already partnered up with Inacta AG, an independent Swiss-based consulting firm, in order to provide more information as well as crypto-asset management to its customers.

Boosting blockchain adoption within the banking sector

InCore company executives said that the bank plans to expand its strategy regarding blockchain in the coming months. They also have plans to include brokerage, custody, as well as transfer services to security tokens.
This can be a great start to Switzerland’s further adoption of blockchain technology and cryptocurrencies.

Categories
Forex Videos

Forex Fundamentals! How Unemployment Rate Affects The Market!

How Unemployment Rate Affects the FOREX Market


Though many have heard of the unemployment rate, only a few actually know how it all works and why it’s important for forex and currency traders to know all about it. The unemployment rate is incredibly important, as it reveals the current state of a nation’s economy.

What Is the Unemployment Rate?

The unemployment rate represents the percentage of people without a job in a given country’s workforce. The people accounted for here are still willing as well as able to work at a job, even though they are unable to find employment.
The unemployment rate a lagging indicator when it comes to the economy, meaning that it changes after the economic state of a given country has already changed. However, the unemployment rate doesn’t have to be a lagging indicator when translated to the FOREX markets. News and reports of a change in the unemployment rate could cause market volatility as it indicates the state of the economy.

Unemployment Rates and the Forex Market

The unemployment rate of a country shouldn’t be ignored by the traders. There are two common examples of how the unemployment rate can be looked at and what it means for the currency prices.

Rate is higher than predicted

If the unemployment rate comes out to be higher than the predictions, the government will have to stimulate the depressed economy by creating new jobs. Let’s use the US as an example. In this case, the Federal Reserve will have to lower the federal funds rate. If this fails in stimulating the economy, then the Federal Government will have to employ fiscal policy measures, such as hiring people for public works projects or stimulating demand with unemployment benefits.
When the unemployment rate rises, it negatively impacts the USD, most likely triggering a bearish turn.

Rate is lower than predicted

When the unemployment rate is lower than expected, the economy will encounter more workers that earn income as well as more consumption expenditure. This could lead to inflation, causing interest rates to rise. A drop in the unemployment rate is a positive occurrence for both the economy and the FOREX market, as the currency will most likely increase in value.

Categories
Forex Videos

Forex – Predicting Interest Rate Changes For Maximising Profit!

Predicting Interest Rate Changes to Improve FOREX Profits

One of the biggest factors influencing the foreign exchange market is interest rate changes that are made by some of the eight global central banks.
These changes are acting as indirect responses to other economic indicators, and they can potentially move the market sharply and immediately. As surprise rate changes almost always have a great impact on traders, understanding how to react to or even predict these volatile moves can lead to higher profits.

How Rates Are Calculated

Each central bank’s board of directors has control over the monetary policy of its country. This includes control over the short-term interest rate at which banks borrow from one another. Central banks often hike rates in order to curb their inflation, while they cut rates to encourage lending as well as to inject money into the economy.

Typically, the Central bank will decide what to do by examining the most relevant economic indicators; such as:

The Consumer Price Index
Consumer spending
Employment levels
Housing market
Subprime market

Predicting Central Bank interest Rates

A trader can estimate the rate change range by examining these indicators themselves. Typically, as the aforementioned indicators improve, the rates will need to be raised or (if the change is small) to stay at the same level. On the other hand, any significant drops in these indicators should be a sign of a possible rate cut to encourage borrowing.

Major announcements are another way central bank leaders can let people know how the rates will change. Whenever a board of directors from any central bank is scheduled to talk publicly, the news on how the particular Central bank views the current economic position will be revealed.

Traders can also estimate rates by averaging forecasts made by financial institutions, though this estimate would be second-hand and, therefore, less reliable.

Surprise Rate Changes

No matter how calculated a trader is, Central banks can, without any prior notice, deliver a surprise rate change. However, this may not be such a bad thing as the effect on the market is sharp, immediate, and most notably:

PREDICTABLE.
If there is a rate hike, the currency will almost always appreciate. Traders should act quickly and buy the currency as soon as possible. On the other hand, interest rate cuts indicate a currency going down in price, and traders should sell or short. Trading trend reversals is also a viable strategy, as the market will most likely overextend while performing a sudden and intense move.

Categories
Forex Videos

Gold VS Fiat currencies – What You Should Be Doing!


Gold vs. Fiat currencies – What to do?

Gold markets have rallied quite a bit during the trading session on Friday. The rally was most likely caused by people that want to preserve their holdings since they find the situation around the world concerning. On top of that, central banks are running their printing presses at full tilt, bringing even more uncertainty to the market. Ultimately, everything suggests that we should see fiat currencies slowly get devalued.
The gold market, on the other hand, is the natural place to go looking to protect your holdings from value drops.

Looking at the chart, even though gold looks quite bullish, the resistance between the $1740 level and the $1760 level might pose a problem. If gold can break above this area, then the market is most likely going towards the $1800 level without many stops. Ultimately, the $1800 level itself is significant resistance, so breaking above it and establishing support would mean much for the future of gold. With all of the various concerns all around the world when it comes to global trade, the pandemic as well as constant fiat printing, it is hard to imagine a scenario where gold doesn’t rise over the long term against the US dollar.

The fiat currency market will have to seek equilibrium and find what the right price is for all the pairs as countries dealt with the global problems differently. This, in turn, affected their economies and currencies differently. Fundamental analysis should be at the forefront of FOREX analysis at the moment.

Categories
Crypto Videos

Ransomware Attack Kidnaps a City in Austria – Shady Business?


Ransomware Attack Kidnaps a City in Austria

A Malware team called NetWalker has launched a ransomware attack against Weiz, a village in Austria. The attack managed to affect the public service system and leak a part of the stolen data from Weiz’s building applications as well as inspections.
The hackers managed to penetrate into the village’s public network by using phishing emails related to the COVID-19 crisis.

COVID-19 used as bait to deploy the ransomware

The way that the NetWalker group was able to infect the servers was by sending emails with fake information about the coronavirus, which Weiz employees clicked and therefore triggered the ransomware.
Panda Security, a company dealing with this case, claims that the ransomware used in this attack is one of the newer versions of ransomware which spreads using VBScripts. If the infection succeeds, it spreads throughout the entire network to which the infected machine is connected.

Weiz isn’t just a random village


While Weiz is a small village, it is considered the economic center of the region. It is the place where several big companies, such as the automaker Magna, as well as construction companies Strobl Construction and Lieb-Bau-Weiz, are established. This may indicate that the attack wasn’t completely random but instead directed towards this village in order to complete a specific objective.

Categories
Crypto Videos

Tether Talks About Printing USDT – What Does This Mean?

Tether Talks About “Printing” USDT

The CTO of Tether spoke about the popularity of its Ethereum-based asset and claimed that it was the reason why the company never burned a single USDT token.
The recent report that came from Flipside Crypto concluded that Tether never even tried to practice burning its tokens, additionally saying:
“We can also see that tokens never go to the “burn” category, which means that no USDT supply was destroyed throughout the course of April. Looking at the full USDT history on Ethereum, we found that tokens have never been burned.”

USDT’s side of the story

Paolo Ardoino, the CTO of both Tether and Bitfinex, explained that the company is mindful of how it works, and it does practice burning its tokens, but that it has so far done it only on the Omni and Tron networks. When it comes to the Ethereum network, Ardoino said that the company holds authorized but unissued and unbacked ERC20 tokens in their inventory.
He also stated that Ethereum had been the most popular blockchain in recent months, which caused the demand for ERC20-based USDT to rise exponentially.

Conclusion

While many condone this type of behavior and encourage burning and then reissuing new tokens, Ardoino said that the outcome is the same. However, many people who touched upon this topic believe that burning and reissuing USDT tokens could only help improve transparency and reduce skepticism, even if the outcome is the same in the end.

Categories
Forex Options

Expiry Options Weekly Review! How Forex Academy Is Helping Traders Profit!

FX Options Market Combined Volume Expiries. A weekly retrospective review

Hello everybody and thank you for joining us for the daily FX Options Market Combined
Volume Expiries review for the trading week ending on Friday 29th May 2020. Each week we will bring you a video taking a look back at the previous week’s FX option expiries and how they may have attributed to price action leading up to the maturities which happen at 10 a.m. Eastern Time, USA.

If it is your first time with us, the FX currency options market runs in tandem with the spot FX market, but where traders typically place Call and Put trades on the future value of a currency exchange rate and these futures contracts typically run from 1 day to weeks, or even months.


Each morning, from the FA website, our analyst, Kevin O’Sullivan, will bring you details of the notable FX Options Market Combined Volume Expiries, where they have an accumulative value of a minimum of $100M + and where quite often these institutional size expiries can act as a magnet for price action in the Spot FX arena leading up to the New York 10 a.m. cut, as the big institutional players hedge their positions accordingly.

Kevin also plots the expiration levels on to the relevant charts at the various expiry exchange rates and colour codes them in red, which would have a high degree of being reached, or orange which is still possible and where these are said to be in-play. He also labels other maturities in blue and where he deems it unlikely price action will be reached by 10 a.m. New York, and thus they should be considered ‘out of play.’ Kevin also adds some technical analysis to try and establish the likelihood of the option maturities being reached that day. These are known as strikes.
Please bear in mind that Kevin will not have factored in upcoming economic data releases, or policymaker speeches and that technical analysis may change in the hours leading up to the cut.
So let’s look at a few of last week’s option maturities to see if they affected price action.


So on Monday 25th, there were two maturities for the EURUSD pair with a red one at 1.0895 for €559M. And we can see that the technical analysis as provided by Kevin was, and I quote what he put on the website at around 8 a.m.: The EURUSD pair is in a bear channel but is oversold on our one hour chart. We should expect subdued price action due to a lack of market data out today and the fact that it is a public holiday in the UK and the USA. The option maturity at 1.0895 is currently in close proximity to the exchange rate, and we may see a pull-back to the level later in the session. However, at the moment, the bears are in control.


Now let’s turn to the one hour chart at 10 a.m. New York time. The pair was an official

Strike at 1.0895.
The second maturity was labelled in blue and was considered to be out of play.


On Tuesday 26th May, we brought you a couple of options expiries for EURUSD at 1.0900 and 1.0945, and this is the original price action and technical analysis chart where the pair had been trading at 1.0915 at the time Kevin wrote the analysis.


Now let’s take a look at the price action at the time of the New York cut. Price action continued as per the technical analysis throughout the European trading session and ended up at 1.0979, which was just 33 pips above the maturity of 1.0945. Options traders who bought a premium Put option for this expiry level would have been in the money.
Retail forex traders who had bought the pair during the European sessions based on Kevin’s analysis would have been in profit by over 63 pips.


On Wednesday 27th, there were two option maturities for the EURUSD pair. At the time of the cut, the FX exchange rate was 1.0986. This was just four pips away from the huge €1 B option at 1.0990


And here is the original analysis from Kevin at just after 8 a.m. BST. Pretty much spot on to what happened at the time of the cut.


There were three option expiries for USDJPY on Wednesday, and price action at around 8 a.m. suggested consolidation with a continuation to the downside. However, the 107.86 maturity was too much of a pull. The FX pair was at 107.83 at 10 a.m. New York time. That was just a few pips either way for the two maturities Kevin marked in orange.


We have a similar story with the AUDUSD pair on Wednesday, which had a large maturity at 0.6600 and where the FX exchange rate hit 0.652, which was just 17 pips shy of the maturity.


Of the notable option expiries for Thursday 28, we brought you one for USDJPY, where there was an expiry at 107.75, which was just one pip away from the exchange rate at the cut or 107.74. Remember, other brokers may be a pip out either side, in case this was as good as a strike.
We also had an expiry for the EURUSD pair at 1.0990 and 1.1020, and where the exchange rate at the cut was 1.1031. just 11 pips away from the latter.


On Friday 29th, we had an option at 107.50 for the USDJPY pair, which Kevin labeled in red, the maturity was just a couple of pips higher at the cut.


Several option expiries for the GBPUSD pair, but only one labeled in red at 1.2355 again, at the cut the exchange rate was just five pips short.

And the AUDUSD pair had a red maturity at 0.6650, and at the new york cut, the price was just 15 pips short.

Please remember, Kevin’s technical analysis is based on exchange rates, which may be several hours earlier in the day and may not reflect price action at the time of the maturities.
We suggest you get into the habit of visiting the FA website each morning just after 8 a.m. BST and take the levels and plot them onto your own trading charts and incorporate the information into your own trading methodology in order to use the information to your advantage.
Remember, the higher the amount, the larger the gravitational pull towards the exchange rate maturity at 10:00 a.m. Eastern time.
For a detailed explanation of FX options and how they affect price action in the spot forex market, please follow the link to our educational video.

Categories
Crypto Videos

Greyscale Are Buying All The 𝐁𝐢𝐭𝐜𝐨𝐢𝐧 Supply up!

Grayscale Stocking up on Bitcoin Like Never Before

Independent researcher Kevin Rooke made an estimate that Grayscale Investments ramped up its Bitcoin accumulation to an immense rate. The Cryptocurrency fund manager seems to be accumulating Bitcoin at a rate equivalent to 150% of the newly-mined BTC since the halving.
Rooke’s research shows that Grayscale has added 18,910 Bitcoin to its Investment Trust since the halving. To compare, only 12,337 Bitcoins have been mined since the halving on May 11.
Binance CEO Changpeng Zhao reposted this info chart, saying that there isn’t enough new Bitcoin supply to go around, even just for one guy.

Grayscale is rapidly absorbing Bitcoin supply

Rooke’s research estimates that Grayscale bought Bitcoin at a rate equal to one-third of the new supply during Q1 of 2020, therefore accumulating 60,762 BTC over 100 days. As a result, Grayscale’s Q1 average weekly investment into its trust increased 800% year-over-year and reached $29.9 million.
After Grayscale founder Barry Silbert said, “just wait until you see Q2,” the investment fund is now purchasing nearly double the coins per day, while the supply got reduced by half. This brings Grayscale’s daily average to 1,112.35 Bitcoin per day, which represents almost 150% of the daily mined coins.

Grayscale vs. CBDC’s

A recent report published by Grayscale show’s company’s distaste for people comparing Bitcoin to central bank-issued digital currencies.
The report clearly stated that CBDC’s are not something that can be viewed as a replacement to cryptocurrencies such as Bitcoin, but rather as a representation of departure from the true intent of cryptocurrencies, which is decentralized protocols. While CBDC’s can upgrade the payment infrastructure, Bitcoin is trying to upgrade money itself.

Categories
Forex Videos

Using CPI Data To Increase Your Win Ratio In Forex

Fundamental Analysis For Novices Consumer Price Index (CPI)

Consumer Price Index (CPI) measures the changes in the price of goods and services
purchased by consumers.
Each month the data is released into the financial market by the various economic and not for profit organizations. In Germany, for example, the information is provided by the Federal Statistical Office, Germany.
So what is the Consumer Price Index, which is also referred to as CPI?


This is what you would expect to see on your calendar. The section highlighted is for the Germany CPI figure. The data is the average price measurement change for all goods and services which were bought by households in any given country, in this case, Germany, for consumption purposes.
CPI is considered to be very important because it is the main indicator to measure inflation and fluctuations in buying trends. The higher the unit measurement reading, the more it is considered positive (or Bullish) for the Euro, and if the unit measurement is a low reading, it is considered negative (or bearish).


Here we can see that the data has been added after the embargo release.


We simply follow the corresponding data to the event log at the top of the page, and we can see the actual released number, in this case, 0.6%, and do the same across the data field to see what the previous release was and also what the market expected. When the released data falls out of line with market expectations, you might find extra volatility kicking in to the Euro currency as traders adjust their trading books accordingly.


In the case of the Eurozone of which Germany is a member state, the information is also added to the Eurozone CPI in which is called the Harmonized Index for Consumer Price Index, or HICP.

This information is collated by the Statistics Office of the European Union and is released at the same time as one of the member states’ data but after all member states have reported.
The cumulative effect or the HIPC is then used by the governing council of the Eurozone area to define and assess overall price stability as a whole. When trading this data, look for inconsistencies in the consensus and the actual figure. An unexpected lower number would be seen as bad for the Euro while the opposite applies for a higher than expected number.

Categories
Crypto Videos

Chinese Citizens Are Now Able To Inherit Crypto!

Citizens of China Now Able to Inherit Cryptocurrency

The Thirteenth National People’s Congress and Chinese People’s Political Consultative Conference has ended on May 28, bringing cryptocurrency holders an interesting feature. On that day, the parliament passed a new civil code, which brings China a legislation package that includes protecting civil rights such as inheritance, property, marriage, personality, contract, and infringement. What’s important to crypto users and holders is how the code was worded and what was implemented into it.

The new code states that when a natural person dies, their legacy is the personal legal property left by them. A Renmin University professor, Lixin Yang, said that this could be translated into the words: “internet property and virtual currency will be inherited.”
Dovey Wan, Primitive Ventures founding partner, has recently made a tweet stating that Bitcoin users should pay more attention to their Bitcoin private keys, regardless of what the new law says.

The new inheritance law that allows citizens of China to pass on their cryptocurrency, as well as other virtual assets, to their heirs will become active on January 1, 2021. This is seemingly just the start of China’s efforts to regulate Bitcoin, as they clearly stated that cryptocurrencies should be something guided by the law.

Categories
Forex Videos

Forex & Gross Domestic Product – How To Trade Fundamentals!

Fundamental Analysis For Novices Gross Domestic Product

Gross Domestic Product, which is commonly referred to as GDP, is one of the most important features of fundamental analysis.
New traders often skip fundamental analysis, preferring to learn a few technical analysis setups and hoping they will be able to ‘wing it’ and make money that way.

However, fundamental analysis is just as important, if not more so, than being able to learn to trade simply by looking at setups on a chart. At the very least, the two go hand in hand, and it is thoroughly recommended that new traders learn both sides to trading.

So what is Gross Domestic Product or GDP, and how should it be applied to trading currency pairs within the forex arena?
Quite simply, GDP is a measurement of a country’s financial health. It usually fluctuates from month to month and is updated by way of released economic data each month for market analysts and traders to view and where the results will likely affect how its currency exchange rate moves up and down against other currencies in the Forex market. This will, therefore, potentially impact on your trades, with regard to opened trades or those in the process of being opened. And so it is imperative that you learn about the GDP for both currencies – remember they are always traded in pairs – that you are trading, or thinking of trading. This also means that you must be aware of when these monthly data releases are happening.

What aspects make up GDP?


You will find GDP release information on your economic calendar, and it will provide you with the anticipated levels of GDP and show you the importance. So here we can see that German GDP YOY – or year on year came in at – 1.9% and had a market level of importance at medium but where the quarter on quarter figure came in at -2.2% and was considered as very important as it shows how Germany is coping during the pandemic.

GDP is updated then compared month by month, then quarterly and annually. It is based on the monetary value of goods which are produced and sold and services which are provided. Some of these goods and services will be sold within the country, and some will be exported.
But the consumption of these is referred to as consumer spending. GDP also takes into account investment into the country and government spending. It then takes the total value of all exports and deducts imports, and what is left is known as real GDP. This figure can then be further divided on a per capita basis or per individual, and all of this gives an overall picture of the financial health of a nation.

How to trade with GDP data

Essentially, if a country’s monthly GDP data is released as per market expectations, the fundamentals

should already be in the price action. That is to say, there should not be any shock factor, and price action movement should, theoretically, continue with technical analysis.
If the GDP comes in weaker than expected, it would be bad for an economy, and therefore, the price action of that country’s currency should weaken against any counter currency being traded.

If the GDP is better than the market forecast, the country’s currency should strengthen.
Ironically, we are in the most difficult of times currently, with a lot of countries’ GDP being decimated by the Coronavirus. So how does this impact on a country’s currency? At the moment, investors are trying to find ways of looking at how governments are handling the crisis and what level of money they are leveling at their country’s to prop them up and help individuals and companies to stave off bankruptcy. And therefore, this form of fundamental analysis has never been so fraught with danger in regard to using it to trade currencies. It is probably better to stay on the sidelines during these types of news releases until such time as some normality has returned to the world. But, GDP – especially if it comes in at an unexpected level – will always be a market mover, so be warned.

Categories
Forex Videos

The Forex BCI Indicator! Step Up Your Trade Game!

Fundamental Analysis For Novices Business Climate Indicator

Welcome to the educational video where in this session, we will be looking at Fundamental Analysis For Novices!


The Business Climate Indicator or BCI

So what is it, and how does it affect currency trading? Trading is a multifaceted and multi-layered business machine. Now just because the majority of new forex traders hardly ever bother with fundamental analysis, which, incidentally, is why over 70% fail, in institutional trading, traders will look closely at all fundamental indicators, of which the BCI is an important one. These institutions also have professional economists and analysts looking at this kind of data and relaying their findings to the trading desk, who will act on the views of the analysts. In essence, you are up against these teams when you trade, so it is better to be knowledgeable on such subjects in order to more fully understand price action.

Manufacturing is the process of taking raw materials, substances, and components and turning these into finished products that can be sold in the marketplace, both at home and abroad. There are many ways that analysts look at the health of a nation, but the BCI is a key barometer. It looks at the development conditions of the manufacturing sector.
In the Euro area, a sample of 23 thousand companies representing all sectors within manufacturing, including automotive vehicles and parts, planes, trains, transportation equipment, machinery, electrical sector, chemicals. Energy, construction, food industry, textiles, and consumer goods. Millions of people are employed in this sector.
Each month respondents are asked, during a brief prearranged phone call, five key questions: the number of new orders, for domestic and export consumption, production volumes, their inventories for the last three months, and their outlook for production volumes. The respondents are also asked if the situation has improved, deteriorated, or remained the same.
The results are converted into a unit measurement and released to the market at set times, subject to an embargo.


In the combined Eurozone BCI, numbers above 0 suggest increased confidence in near future business performance, and numbers below 0 indicate pessimism towards future performance. The minus numbers in this chart reflect the devastating effect that the coronavirus pandemic has had on manufacturing recently.
So, how to use this information when trading currencies. Quite simply, the worse the number, the worse the economic outlook for a country. However, keep an eye out for the release of this information in your economic calendar. And note, that the eurozone comprises 27 countries all releasing their individual BCI each month, and where 19 countries are using the Euro as their currency. Therefore, If you see sharp, unexpected moves in the BCI release, wait for the big guns to set trend direction and then jump on it according to your own trading methodology.

Categories
Forex Videos

Forex! Maximise Profits With The Correct Pairs!

Reducing risks by choosing the right pair to trade


If you could walk into a casino and you knew for a fact that the next spin of the roulette wheel would throw up a black, you’d bet your house on it. Obviously, that knowledge isn’t possible, and so, as traders, we do the next best thing. We use our knowledge and skills to set tip the odds in our favor while trading currencies.
One of the biggest problems here is that, depending on the time frame, you prefer to trade with, knowing exactly where exchange rate price action is going to turn in your favor can be difficult and somewhat challenging, especially when you factor in news events and also unexpected market turbulence caused by rumors and unexpected announcements by policymakers. All very inconvenient if any such event should turn your trade against you.

You only have to take a look at this daily chart of the GBPUSD pair to realize that within a daily short space of time, the exchange rate has been up to a high of 1.35100 in January 2020 to a low of 1.1400 in March 2020. Without tight stop losses in place, these types of swings, assuming you were the wrong way around and bought the pair at 1.35 and did not incorporate a tight stop loss can be account killers for many retail traders. And the hope of seeing a return to those levels could be a very long way away for the rest especially as the Pound is susceptible to trade talks with the European Union and where the negotiations are up against a tight timeline and need to be concluded by the end of this year.


Let’s turn our attention to the NZDAUD pair. If you think about it, the two countries are in close proximity, and they are very similar in that they are heavily reliant on exporting their goods and services, mostly commodities and with large trade deals with China. And so their economies are similar.

This means that to a large extent, their currencies remain in fairly tight ranges, although all currency pairs are prone to turbulence from time to time, especially when it comes to setting interest rates. But if we look a little closer at this 4-hour chart, the pair has been trading in a narrow range of not more than 250 ips since the beginning of April. This allows a little more flexibility with stop losses and also, for traders in Europe, or the USA, there are less likely to be any shocks with regard to economic data releases, or unexpected policymaker decisions because most of this will have come out during the Asian session when these countries are in full flow during their business hours.

So, bear this in mind. It is great to be on the right side of a 500 pip move, but it can be a whole lot stressful just bagging a few pips here and there in a pair that is trading within a narrow range and should not, in theory, break out unexpectedly during different time zones of their own.

Categories
Crypto Videos

The Satoshi Nakamoto Controversy! Has He Been Discovered?

The Satoshi Nakamoto Controversy: What Happened to his Crypto?

The past month has been very interesting in terms of Satoshi Nakamoto-related news, and it all started with someone mysteriously moving $1.6 million in Bitcoin from the address that could be one of Satoshi Nakamoto’s.
While most experts believe that the cryptocurrency transfer was done by one of the first-month Bitcoin miners rather than Satoshi themselves, others believe that there might be something else in play. However, this is not the complete story, as often-called Faketoshi Craig Wright came into the limelight and stirred up more uncertainty.

Wright vs. Kleiman

The case between Craig Wright and Ira Kleiman has been lasting for quite some time, with its final jury trial set for July 6. Craig Wright has announced that he is the real Satoshi Nakamoto, and claims that he has the private keys to the Bitcoin addresses that Satoshi should have access to. However, Kleiman’s side does not believe he is the real Satoshi Nakamoto, claiming that Wright might have access to these addresses, but that he cannot show the court that he has the access, as the addresses contain a proof of partnership between him and late Dave Kleiman.

The Encrypted File

Kleiman’s legal team said that Wright’s refusal to open the encrypted file suggests he knows that its contents will certainly include partnership records between Wright and Kleiman. The contents of the file will, as they said, show that 820,200 Bitcoins belong to the partnership rather than just to Craig Wright.
While this case unfolds, the public is waiting to see how everything resolves as they are looking for any clues on who Satoshi Nakamoto might be.

Categories
Crypto Videos

Reddit’s Co Founder Says We Are In Crypto Spring! #Buy

Reddit’s Co-Founder Says We Are In ‘Crypto Spring’

Alexis Ohanian, Reddit co-founder, has described the cryptocurrency ecosystem as a sector currently in the “crypto spring,” emphasizing the application of the technology as well as the talent working on it.

His interview with Yahoo Finance revealed his positive outlook on the cryptocurrency industry, especially in terms of top-tier engineers, designers, product developers, etc. that are building real solutions on top of this technology.
“We’re seeing top-tier talent building on this infrastructure, and that to me is the most interesting part,” he said.

Crypto won’t go away

Ohanian also stated that he had held a portion of his wealth in cryptocurrencies for quite some time now. When asked about the most recent price development, he said that he still feels pretty good about his holdings and that he doesn’t want to change much of it. He also described cryptocurrencies as a “prudent hedge.”


Reddit and Cryptocurrencies

Reddit has launched its cryptocurrency-based Community Points reward system on the Ethereum testnet called Rinkeby, with the intention to move to the mainnet by the end of 2020. Reddit is yet another company that is slowly but surely accepting cryptocurrencies as a concept rather than shying away from it due to the regulatory uncertainty.

Categories
Crypto Videos

Russia Is Outlawing Crypto! Dasvidaniya!

Russia Making Crypto Illegal?


Russian lawmakers have recently suggested punishments of up to 2 million rubles (around $27,800) as well as seven years in prison for illegal crypto or digital asset turnover. The law is not set in motion yet, but the government is considering it.

How bad are the fines?

The punishments suggested in the bill are on a sliding scale that starts from around $300 for using digital or cryptocurrencies for transacting goods and services, all the way up to 2 million rubles and seven years in prison for organizing illegal digital or cryptocurrency turnover.
They also proposed a penalty for buying digital assets for cash on Russian soil, as well as for transferring funds from cryptocurrency to any Russian bank accounts.

What will crypto companies do?

Yuri Pripachkin, president of the Russian Association of Crypto-economics and Blockchain, said that the new package of laws would act as a complete ban on cryptocurrency. By doing that, Russia will stop benefiting from this technology anymore. He believes that if the new rules were to be put in motion, many companies would simply move out of Russia and relocate to neighboring countries with a better approach towards cryptocurrencies.

While the companies have the opportunity to move from Russia to other countries that are more crypto-friendly, the Russian population that uses cryptocurrency will be cut off from the cryptocurrency world.

Categories
Crypto Videos

The BTC Halving Has Cost Us! But For How Long?

Bitcoin Halving Aftermath – What Comes Next?

The 2020 Bitcoin Halving that happened in May did not go quite as well as some people expected. While most crypto enthusiasts were very optimistic about the aftermath of the halving event, things turned out to be far from good. A substantial number of miners stopped mining on their equipment as the halved reward made them unprofitable. As a consequence of fewer miners working, transaction fees became considerably higher, the hash rate managed to decrease by up to 40%, while the new blocks are generated at unimaginably low speed.

Hash rate

One of the most significant post-halving trends is the decreased hash rate, The mining profitability of the older generation mining units has dropped substantially (or even turned into negative) as the block rewards got halved. At the moment of writing, an Antminer S9, which is a previous generation mining unit, is estimated to generate a negative $2 per day.

Block time

With a third of the miners turning off their mining units, it was only to be expected that the block generation speed would drop. The Bitcoin daily block generation metric fluctuated between 100 and 120 blocks per day before dropping to only 95 blocks on May 17. This amount of blocks generated per day was last seen during the 2017 Bitcoin-lows.

Fees

While the hash rate and block generation time are very significant, the most significant metric out of these are the Bitcoin transaction fees, as they affect not only the BTC infrastructure but the consumers as well. While people who transact in Bitcoin won’t mind a bit slower transactions, they will most likely be frustrated by the increase in transaction fees.
Transaction fees went up by more than one-third just three days after the halving, resulting in an 800% monthly transaction fee increase.
How long will this last?

Everyone is asking if this change of circumstances will affect Bitcoin negatively in the long run. However, experts believe that the latest adjustments, though negative, were not big enough to make a long-term negative impact. Most of them believe that it might take three to four difficulty corrections before miners could return to their “business as usual.”
The situation seems to be coming back to normal as all the parameters are returning to their previous levels.

Categories
Crypto Videos

China Gets Wrecked! Who Will Take The Bitcoin Mining Throne?

China Destroys 10% of the Global Bitcoin Mining Hashrate

epa06062677 (06/26) Tibetan Bitcoin mine manager Kun walks in between aisles of mining machines in a Bitcoin mine in Sichuan Province, China, 26 September 2016. Kun is the mine’s manager as well as one of its investors. He learned about Bitcoin through a friend and started investing in 2015. China, the world’s leader in Bitcoin mining, is dominating both the currency’s generation and the global trade in the currency. Sichuan has become known as ‘the capital of bitcoin mining’ as entrepreneurial Chinese set up ‘mines’ there due to its abundance of hydropower, perfect for the high electricity needs of the large number of computers required for Bitcoin mining. Bitcoin mines are buildings with warehouse-like structures equipped with massive numbers of microprocessors with which ‘miners’ solve complex math problems and are rewarded in the digital currency. The industry exists in a legal gray zone in China, and the miners in this story, concerned about attention from the government, asked not to have their full names or the names of the villages where their mines are located mentioned in this story. EPA/LIU XINGZHE/CHINAFILE ATTENTION: For the full PHOTO ESSAY text, please see Advisory Notice epa06062671

The Chinese provincial government of Sichuan has stamped out 10% of the global Bitcoin hashrate due to, as they announced, illicit cryptocurrency-related activities.
According to Cambridge University estimates, the province of Sichuan is responsible for almost 10% of the global Bitcoin hashrate. As a comparison, this single Chinese province has more mining power than then the entire United States or Russia. However, it is unsure what will now happen to the miners in this province.

What can we expect?

It’s not clear whether the recent issues will effectively destroy mining in Sichuan, as China’s crypto community was always strong, even despite governmental constraints. With that being said, many believe that, even though Chinese miners were never felt “comfortable” and “safe” when mining, this event has made the situation the worst it has been.

The question we have to ask is: Who will mine if the Chinese government shuts down Sechuan miners?

Philip Salter, Genesis Mining head of operations, said that the main advantage of mining in China is cheap production costs, but that it doesn’t come without disadvantages. The main disadvantage of mining in China would be that they use coal to create energy, which makes operating costs not so good.

People started speculating on who will pick up the slack: The big Sechuan miners by moving to other provinces or some other mining power that will come from the western part of the world. We have seen mining giants such as Bitmain creating facilities in western countries, so it might not be too far-fetched to believe that the era of China-dominated mining market might come to an end.

Categories
Forex Videos

Types For Noobs! How To Apply Our Free Signals & Make Money For Free


How to apply Forex Academy trade signals to your own trading account?

Ok, you have seen the Forex Academy signals table and the incredible success our professional Traders are enjoying, and you want to start copying some of the trades onto your own account, but you are a novice trader and a little bit unsure what to do next.

This presentation is designed to assist you with such tasks. Let’s take a look at a couple of examples of how you can go about applying the trades from the signals table on to your own trading account.


Let’s drill down into this pending order for the US dollar CAD trade at the top of the table.

We can presume that you have clicked onto the Method tab to have a look at the traders’ technical analysis and overview; you agreed with the sentiments and decide that you want to take this trade on by applying the price entry, take profit, and stop-loss on to your own trading platform.


The most common trading platform which is offered by the majority of brokers is the Metatrader mt4 platform, and so we assume that you are using this platform, in which case you should open it up and select the US dollar CAD chart. You don’t have to add technical analysis.


Click on the New Order tab, and an order box will pop up onto your screen.


Click onto the symbol drawdown panel to select the US dollar CAD asset.


The price will then change to the current exchange rate for this pair.
If this was an instant execution, you would simply sell-by market or buy the market by clicking on the relevant price paddles, which are colored red and blue.


However, this is a pending order which we need to select from the type of trade drop-down menu.

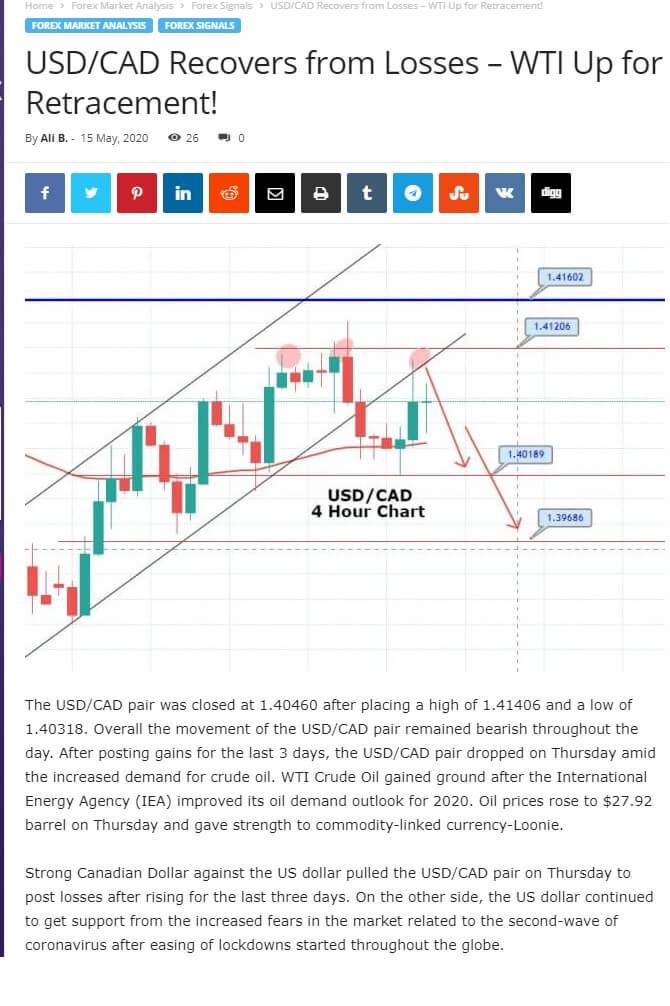
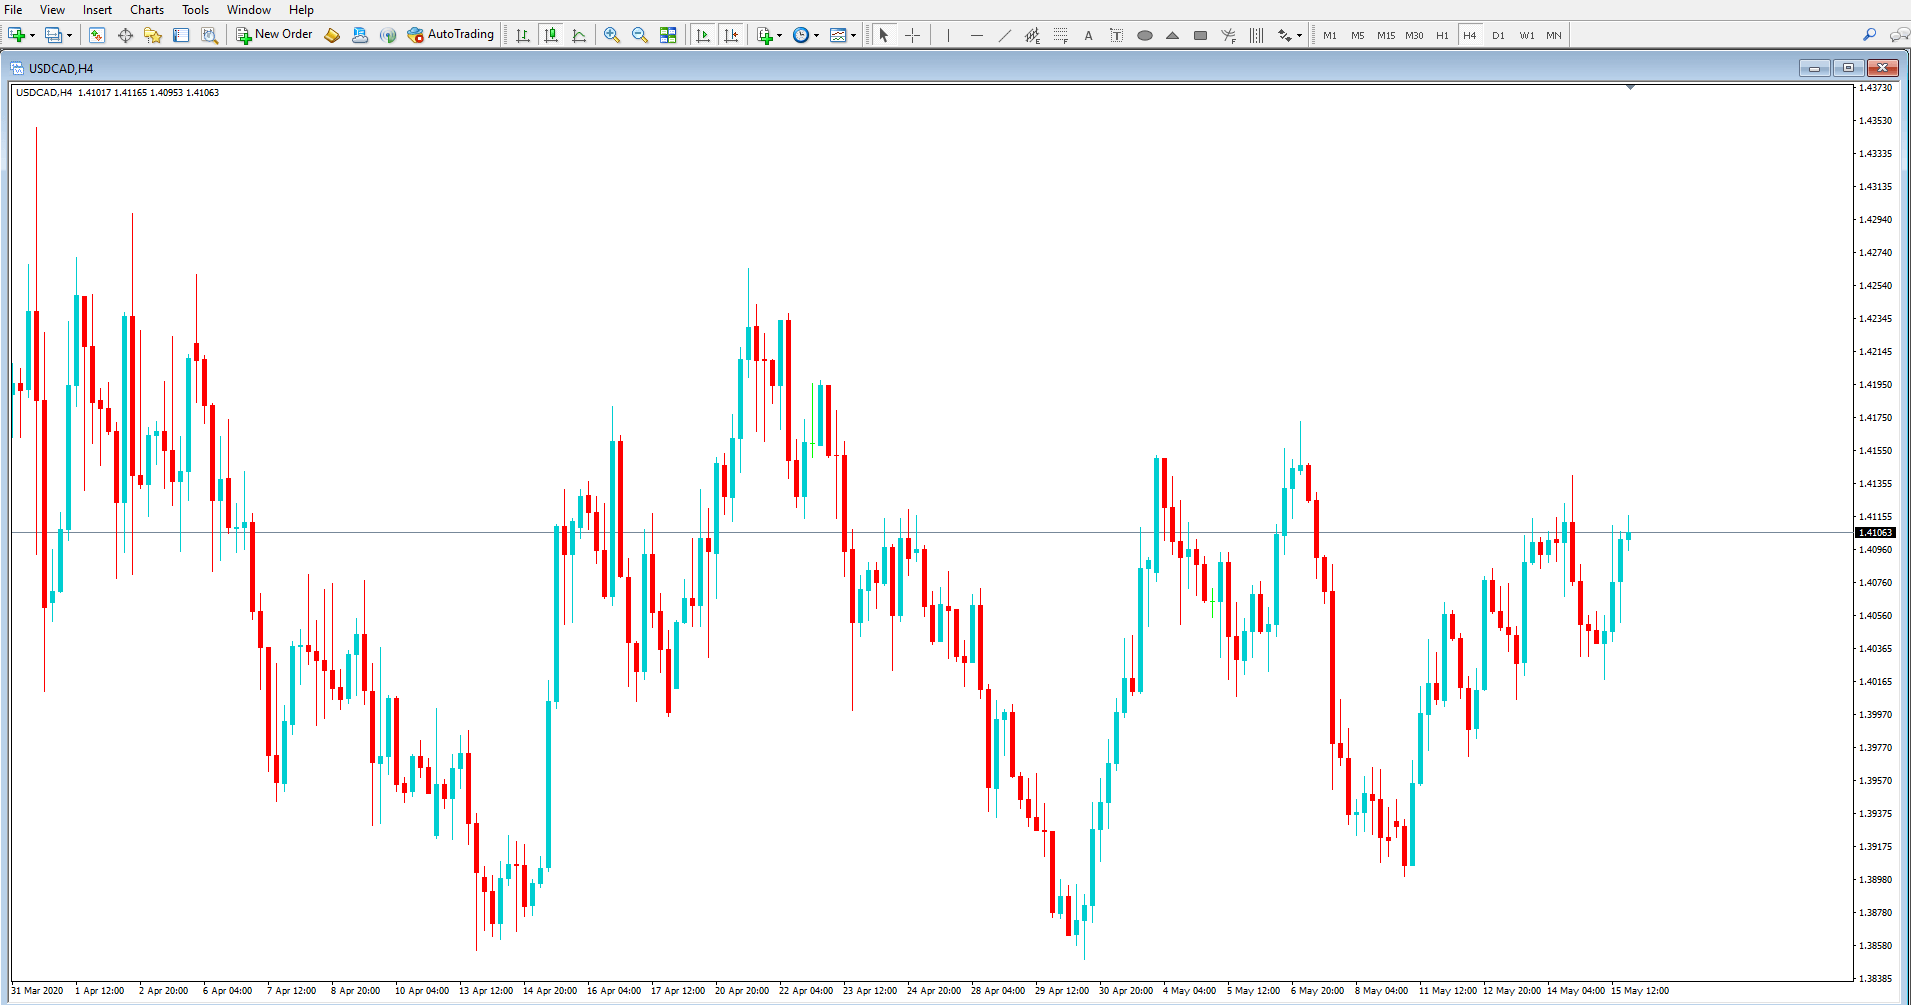
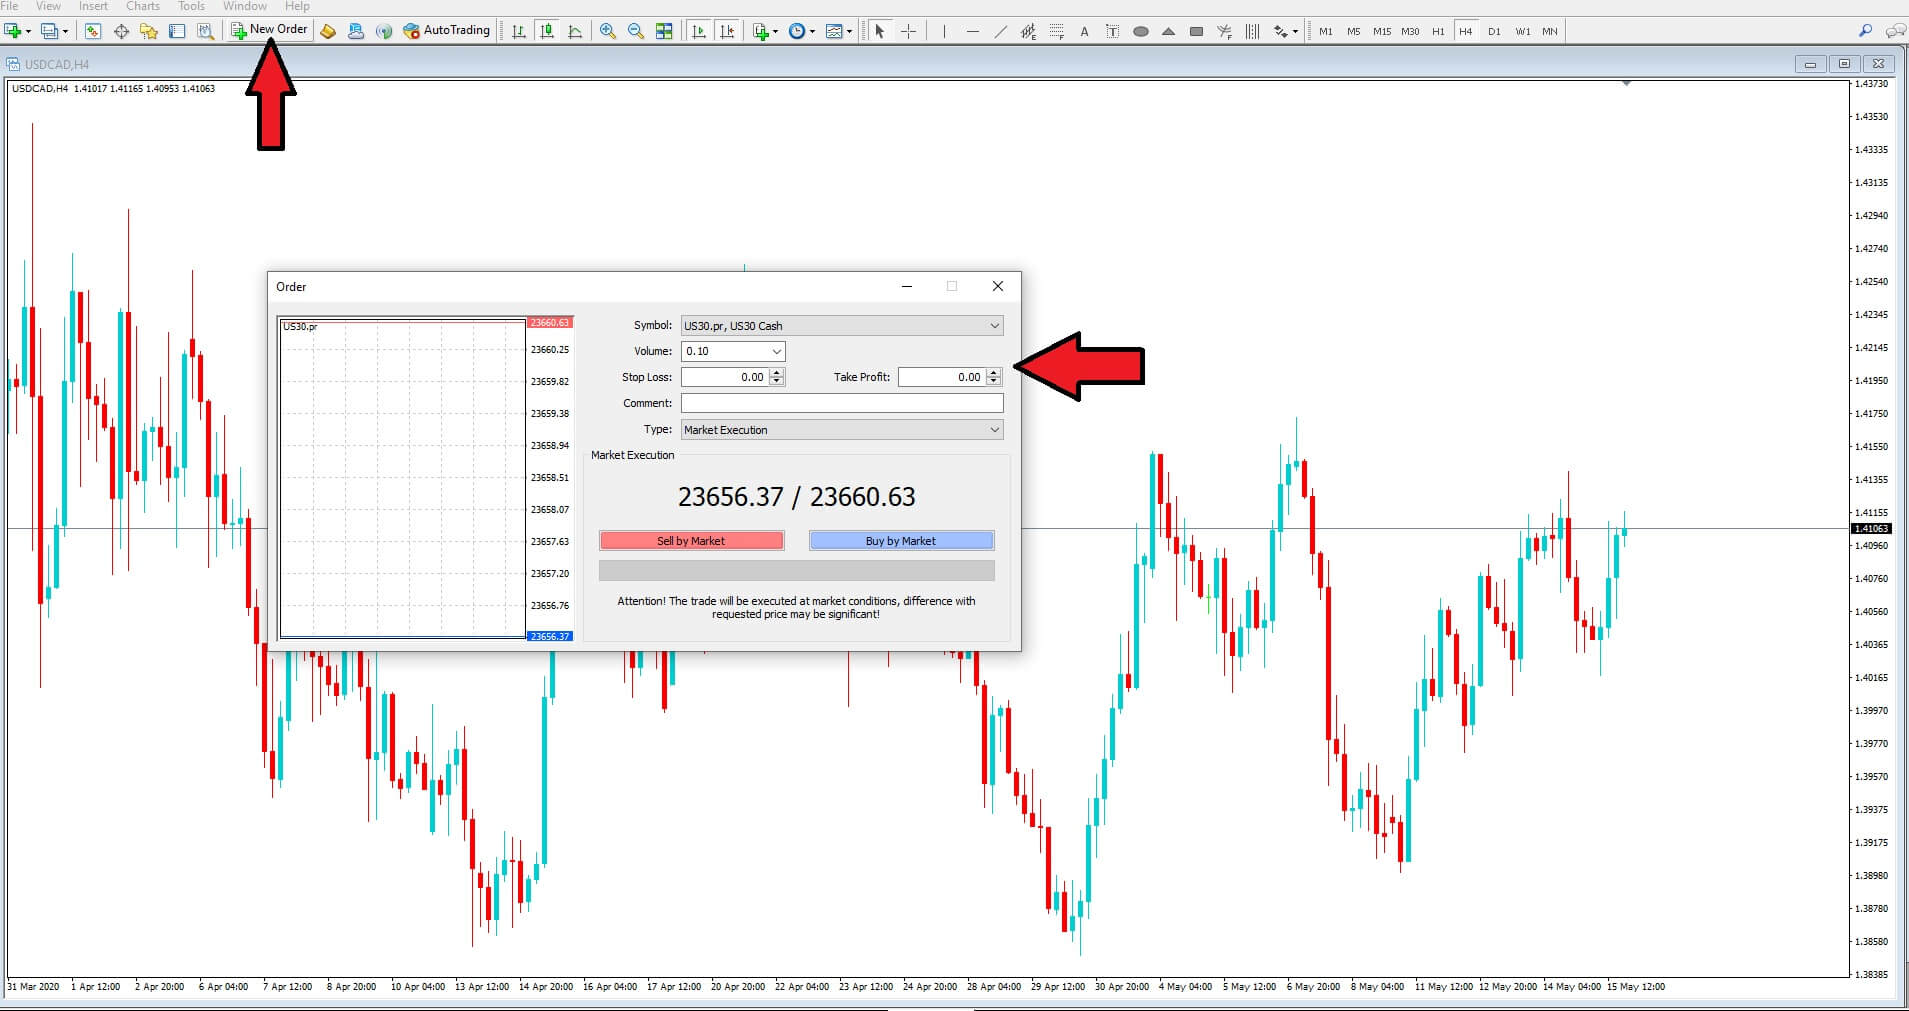
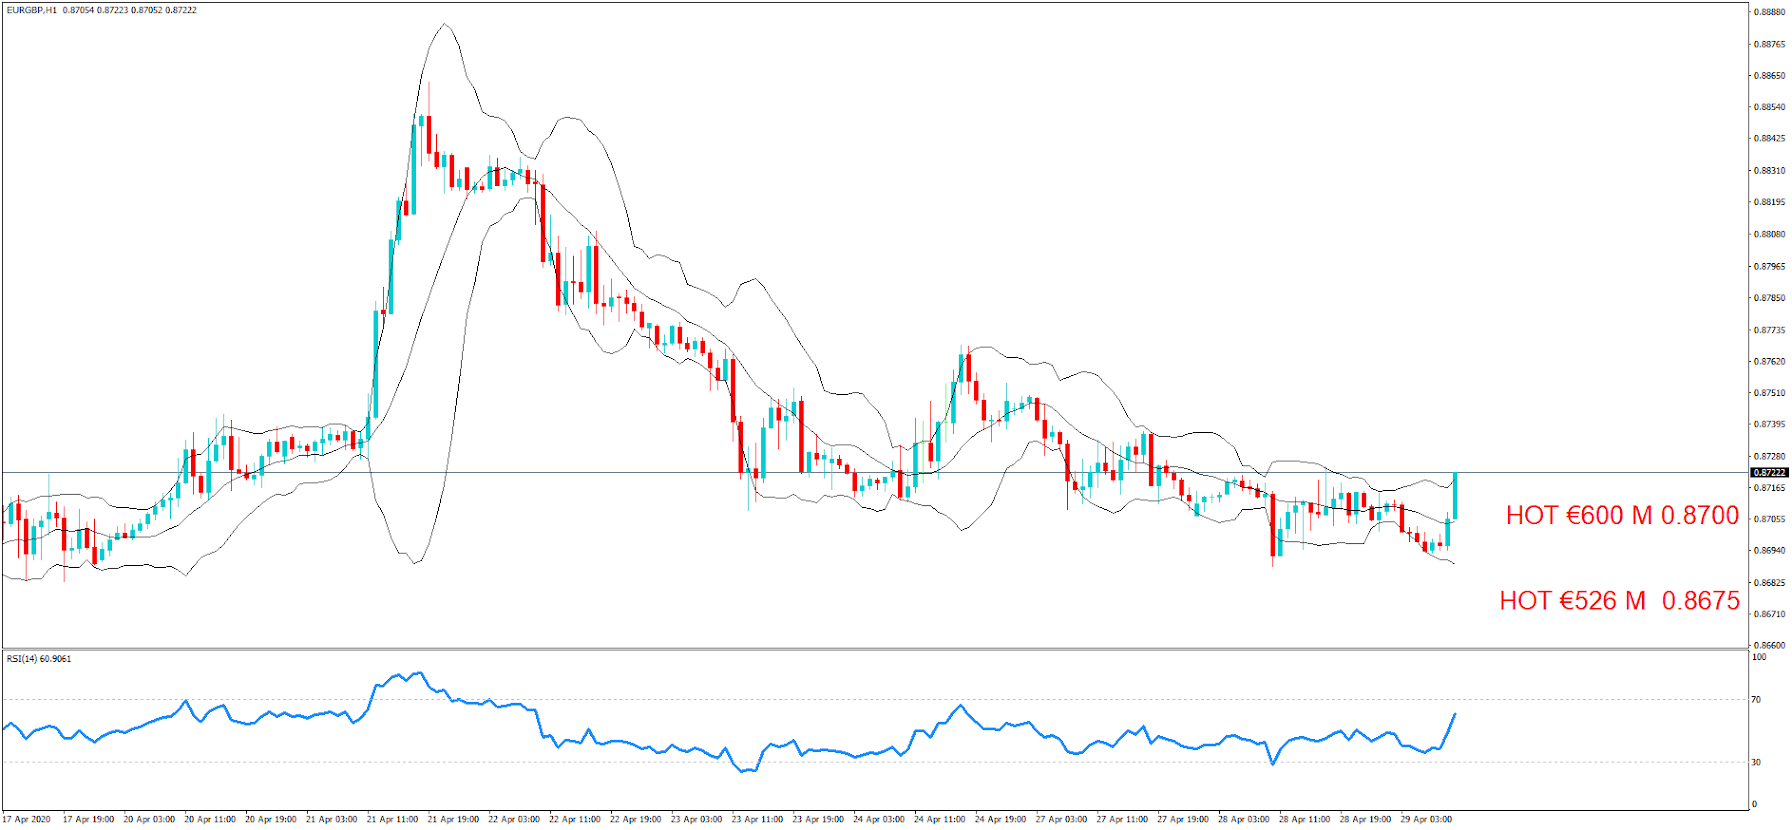
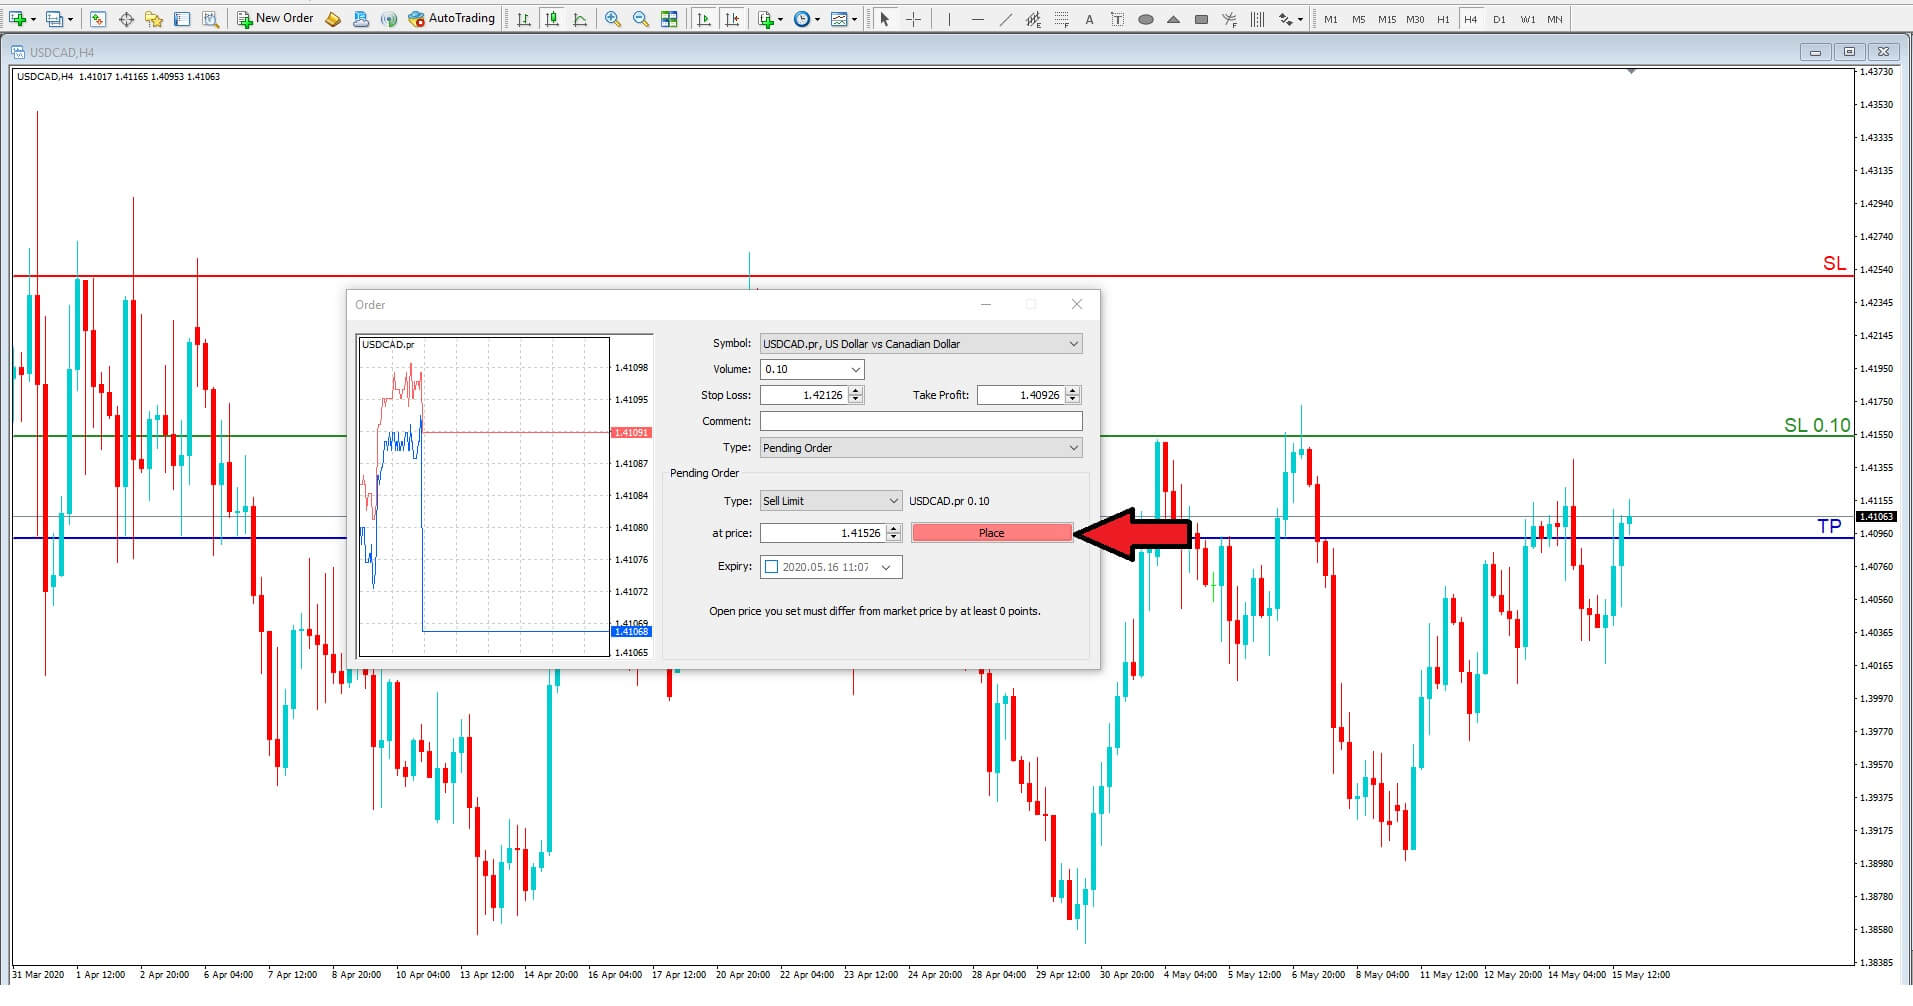
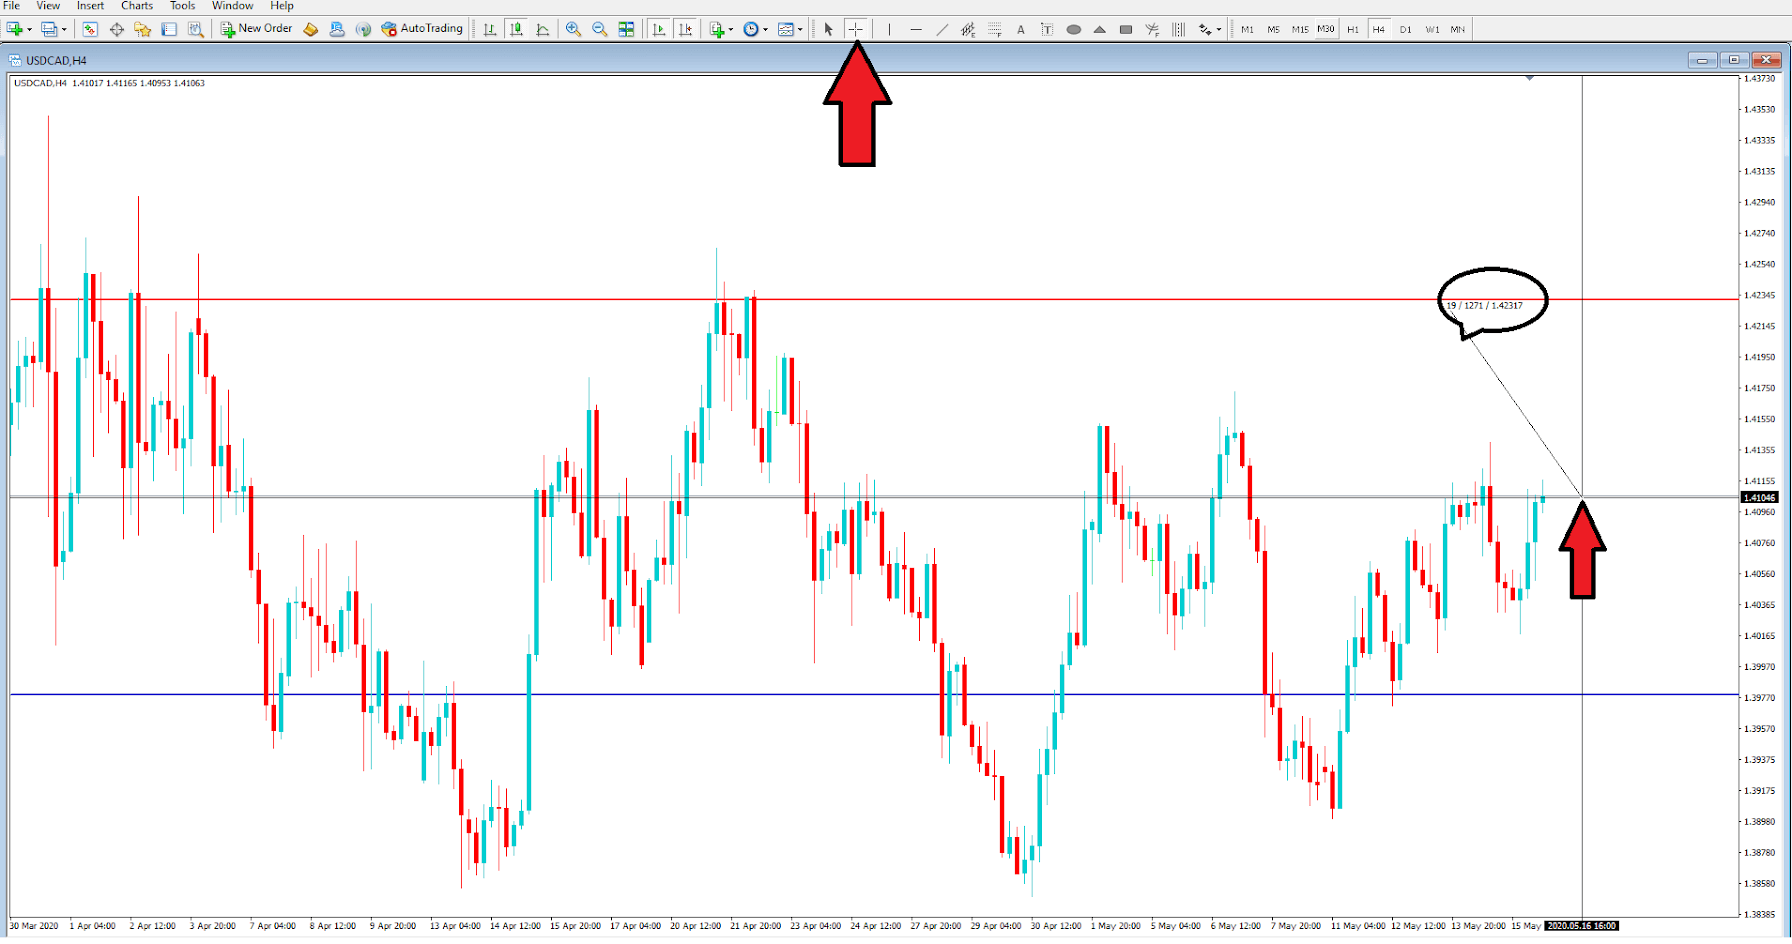
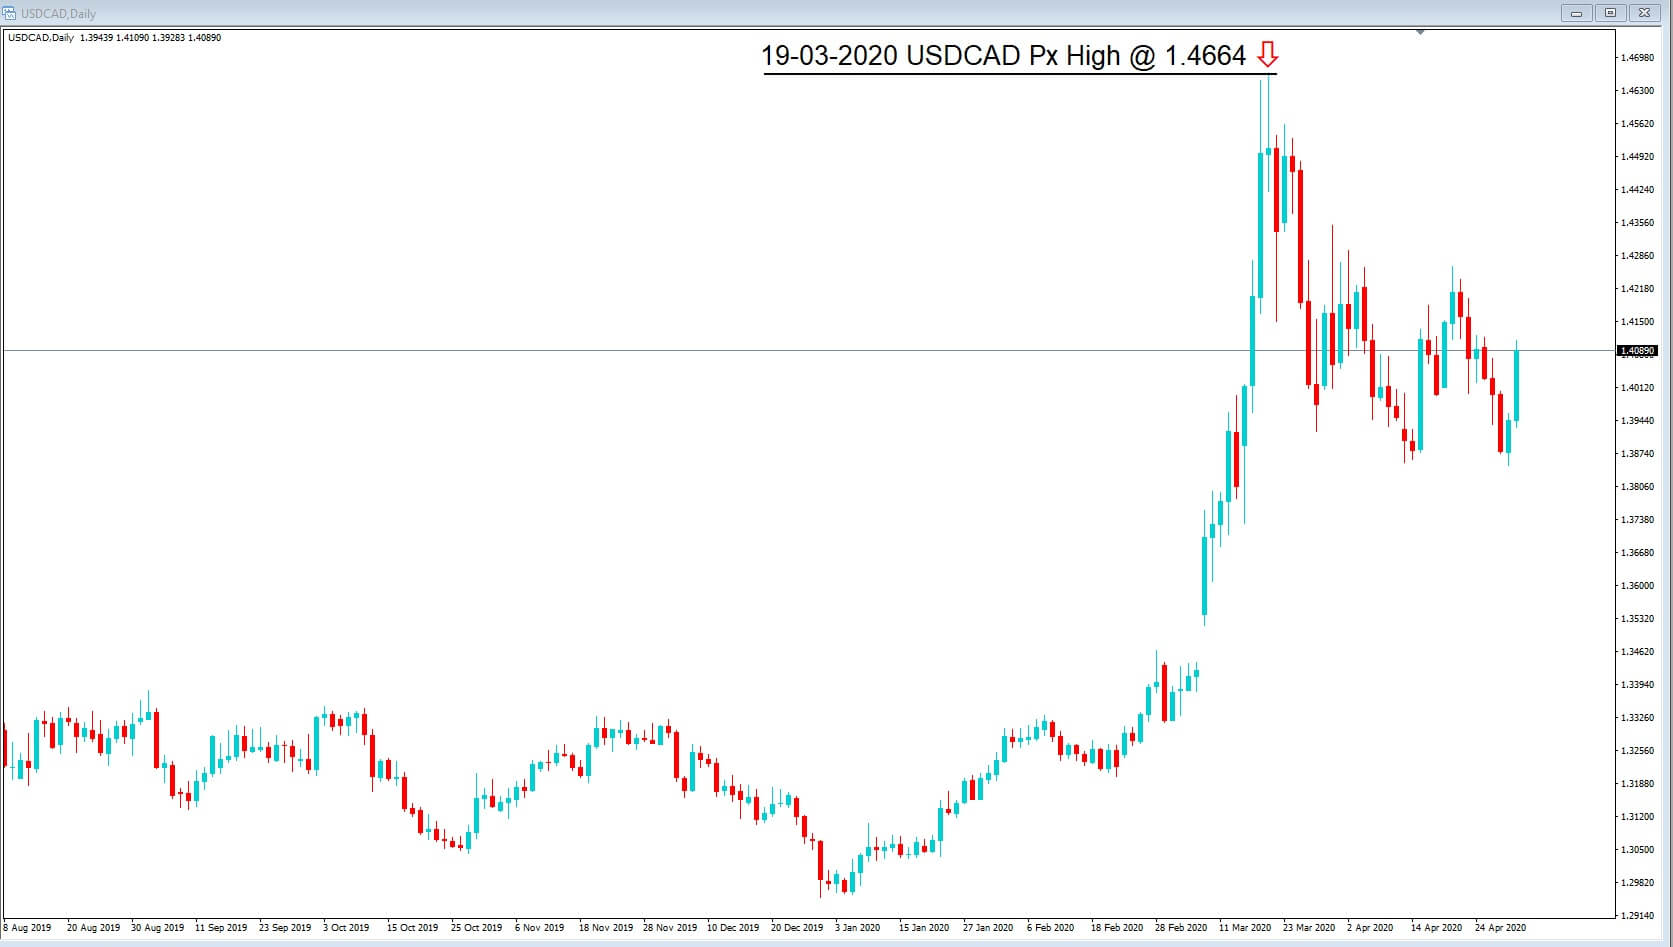
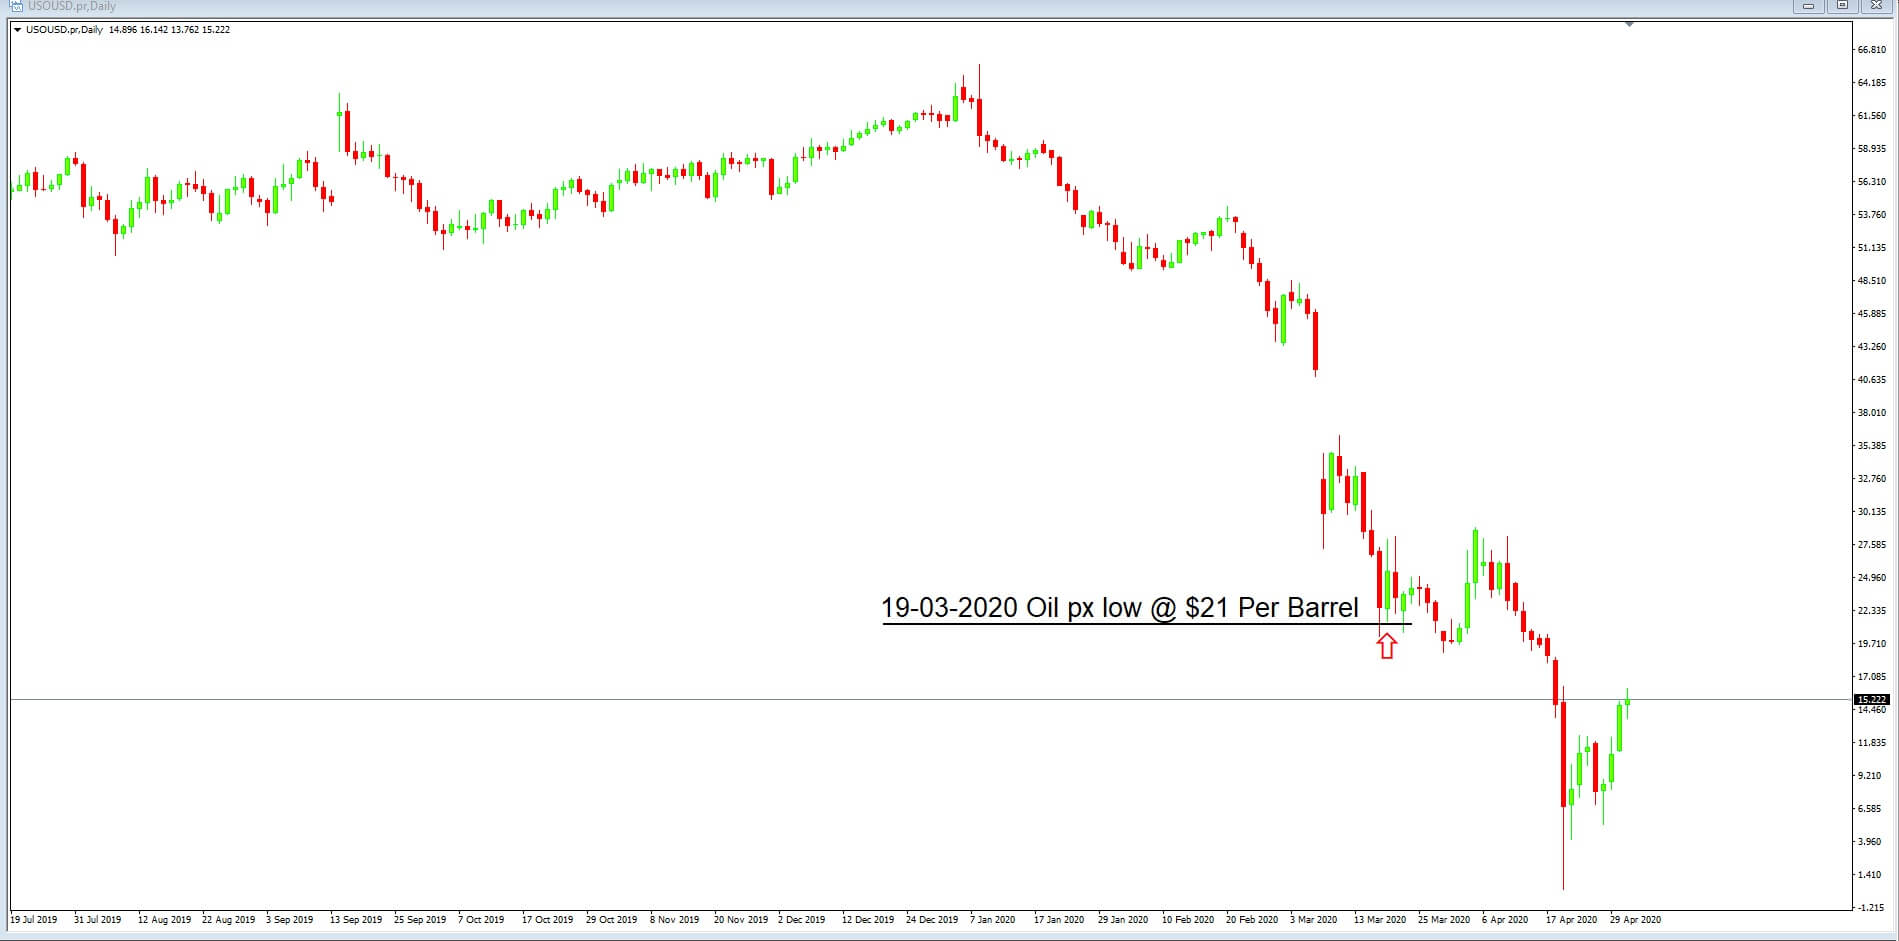
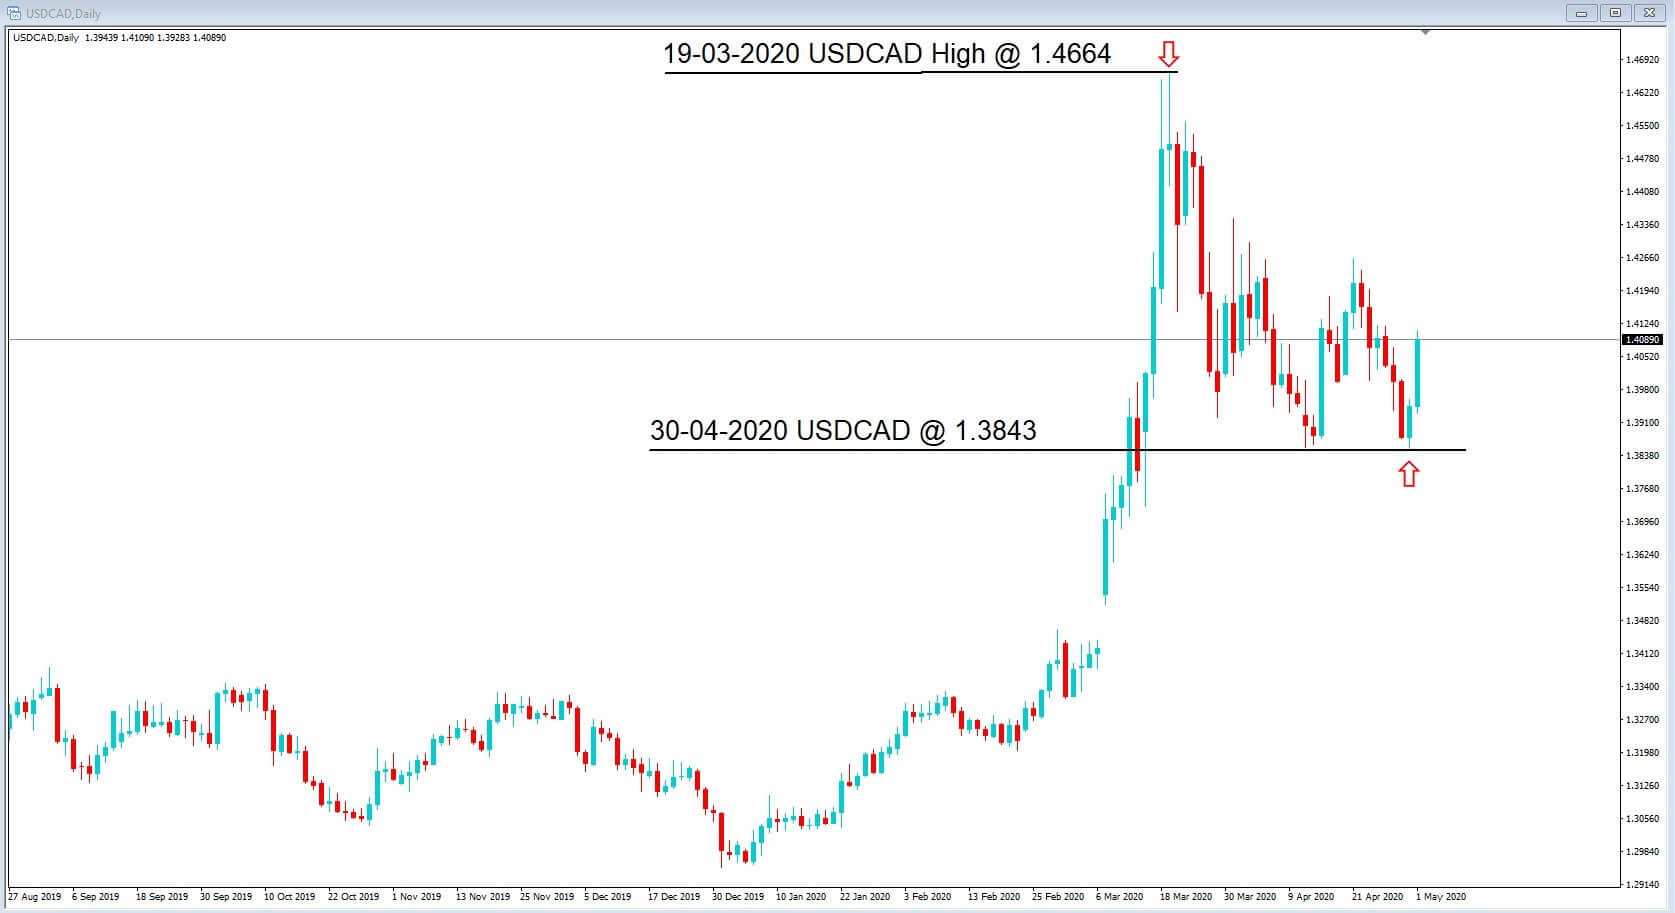
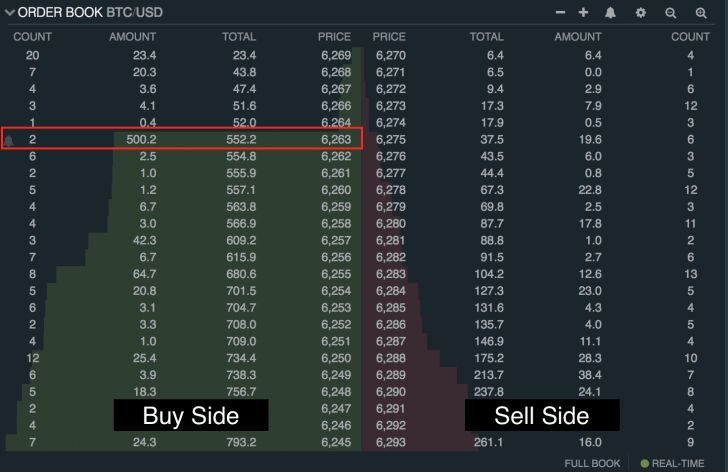
Let’s quickly remind ourselves of the trade we are copying. this is a Sell-limit pending order of the US dollar Cad pair, with an order to sell the pair at some point in the future with no specified cancellation date at an exchange rate of 1.41526 with a stop loss of 1.42126 and a take profit of
1.40926. This represents Minus 60 pips or plus 60 pips, where the risk to reward has a ratio of 1:1. So for every unit traded in a standard lot of 1.0, which equals 10 units of the base currency traded, you would win or lose $600. Or if traded with a mini lot equal to 0.1 unit of volume you would win or lose $60 and if you were trading in micro-lots of 0.01 units of volume you would win or lose $6


We now take this information and add it to our order box. Firstly you will need to put in the volume of currency you want to trade. Here we have added a volume of 0.10 units, which equates to around about $1 for every pip in movement.
We then complete the stop loss box by entering in the exchange rate 1.42126, the take profit at

1.40926, and then in the pending order section itself, click on the sell limit for the type of pending order. Enter an exchange rate of 1.41526.


Then simply click on the place tab, and if the server accepts your trade, it will be confirmed by three lines popping up on to your chart. One is the sell limit order with the volume you have chosen at the exchange rate at which the trade will be executed if the price reaches it at some certain point. The second will be the level at which the trade will be stopped out should it move against you, and the setup fail. And the third line is the take profit where the trade will close out if price action moves to this exchange rate level should the trade have been opened having gone to plan.


Should the trade you are looking at copying require a different type of pending order this can be found in the order type drop-down box and will include buy limit, sell limit, buy stop and sell stop orders.


Different types of pending orders are buy-limit, where a trader expects that the current exchange rate will fall lower before continuing in an upward trend, In which case he would use a buy limit order to enter a trade at a lower point than the current exchange rate.
Or the trader would use a buy stop order to enter a trade which is above the current exchange rate, and where he or she might use such an order anticipating that an upward trend would continue.


Conversely, a trader would use a sell limit pending order if they thought that the exchange rate was going to move slightly higher before reversing into a downward trend. This provides them with the possibility of gaining some extra pips. Or they use a sell stop order where they presume the exchange rate will move lower than where it is currently.
Other trading platforms have similar trade order systems, and so if you are not using the MT4, you will just need to research a little to find the trade execution setups.


To calculate your risk, most platforms, including the MT4 offer a cross-hair feature which you can drag onto your chart and by clicking on the current price exchange rate, or anywhere else, you can drag the cross-hair to any level on your chart, and it will show you the number of pips that you might lose or gain. In this example we can see that should a trade be executed at the current exchange rate the level to the stop loss we have chosen by the introduction of the red line is 127 pips away, and where one pip typically will equate to one US dollar with a volume of 0.10 units traded.

On that basis, if we were to go short on this pair at the current exchange rate with the current stop loss in place, we would have lost $127 should the pair have moved up to our stop loss. We can also simply drag the cross-hair lower to calculate possible winnings in pip amount values too.

Categories
Forex Videos

Elliot Wave Education In Forex – Trading With Confidence!

Elliot Wave Theory


This video is an example of a wave counting case when the movement starts from a different level to the lowest point of the movement recorded in the price chart.

The following chart corresponds to the cross Euro Pound in its hourly timeframe.

Different techniques of technical analysis teach that the price should be analyzed from the lowest point to the highest level, or vice versa. However, in Elliott’s wave theory, an impulsive, or corrective movement, does not always start or end at the lowest level shown on the price chart.

In this example, we see that the price comes from a bearish movement, which ends with an aggressive fall. However, this did not end at level 0.82758, but ended at level 0.82767, from where we observed that the euro pound cross initiated an impulsive sequence in five waves, which developed an extended third wave, also shows the advance on a fourth wave which is longer in time than the second wave and this impulsive sequence ended on January 14, 2020.

Now we will see the internal structure of the extended third wave. Here we see the first wave, the second, third, fourth, fifth. The degree of the sequence would correspond to Subminuette in green.

Remember that both colors and grades are used for convenience for analysis purposes. Elliott, when he developed his wave theory, he never pointed out an obligation of a time range with a specific degree. The important thing in wave counting is the existing order in the analysis process.

We have already seen the third extended wave, now we see the principle of alternation between the corrective waves, from the graph we see that wave 2 is a simple correction and the fourth is a complex correction.

In the fourth wave, we see that its structure corresponds to a triangular formation, and we see its internal segments a, b, c, d, and e, and here we can observe the initiation of impulsive movement in 5 waves belonging to the fifth wave.

The start of the fifth wave is validated once the price breaks the b-d triangle guideline. Likewise, the upward movement of the fifth wave is considered finished after the low rupture of the upward guideline that joins waves 2 and 4.

This corrective sequence should correspond to a corrective process of a similar degree to this training that began on December 13, 2019. However, for the purposes of this analysis, we will only analyze the impulsive structure. 

Another detail that we must take into account in the impulsive structure is related to the extended third wave, which has a particularity that we can observe in this case. When the share price goes back beyond 38.2% of Fibonacci, the price warns us that the momentum bullish is running out, and it is very likely that the price will not exceed the previous maximum. In this case, we see that the price exceeded the maximum of wave 3 for only 4 pips reaching the level 0.85959.


Categories
Crypto Videos

Making Bank With Hashrate Bitcoin Futures!


Hashrate Bitcoin Futures Introduced – Another Profit-Making Opportunity?

People interested in cryptocurrency and Bitcoin trading now have a brand new tool they can use to generate profit. FTX, a derivatives trading platform, announced the launch of a futures product that tracks not Bitcoin’s price, but rather Bitcoin’s hash rate.

What are Hashrate Futures?

Hashrate futures are contracts that track Bitcoin’s average mining difficulty each day from the start to the end of each quarter.
As measuring hash rate is virtually impossible, the tracking parameter used here is the mining difficulty. However, as difficulty adjustments attempt to maintain 10-minute block times, the average hash rate will be proportional to the average difficulty in the long run.
Hash rate is the computing power dedicated to the Bitcoin network. The more hash rate Bitcoin has, the more secure the network is. The mining difficulty, on the other hand, is the complexity of the equations which validate Bitcoin transactions.
Both the hash rate and the mining difficulty were hovering near the all-time highs, but the hash rate slowly tailed off after the halving.

How does this affect the market?

The introduction of a new crypto-related financial product is almost always a good thing, mostly because it attracts more investment. On top of that, crypto enthusiasts can use their knowledge to leverage one more thing and create a profit-making opportunity for themselves. However, whether this financial product will be net-positive, net-negative, or neutral for the crypto community, only time will tell.

Categories
Crypto Videos

Bitcoin CME Options Interest is Skyrocketing!

Bitcoin CME Options Interest Skyrocketing Post Halving

Chicago Mercantile Exchange Bitcoin options increased in popularity by a great deal over the past few days. The interest grew so much that the volume managed to hit $142 million as of May 15. This number doesn’t mean anything until compared to the previous volume this market had, so let’s compare the current volume with the past month’s volume. Data published by Skew shows a gain of over 1000% at the end of April when the market’s open interest reached just $12 million.

The reasoning behind the increase in interest

CME recorded an initial spike in options volume before Bitcoin halving, around May 5 and May 6. Both these days were close to $10 million by themselves. As we approached the halving, the volume died down as people didn’t know what to expect.

However, ever since the halving occurred, the volume skyrocketed, with days after the halving reaching $30 million and $40 million.

Institutional investor interest on the rise

Institutional investment in Bitcoin has continued to rise as we approached the halving, as well as after it. Companies such as Grayscale and Fidelity Digital both reported increased interest, while hedge fund manager Paul Tudor Jones claimed that almost 2% of his total equity is held in Bitcoin.

The bottom line

It looks like the Bitcoin halving is slowly starting to get attention from both institutions and retail investors. With the reduction of supply of Bitcoin as well as an increase in demand, we may look at Bitcoin’s price as possibly undervalued at the moment.

Categories
Forex Videos

The Dow Jones Bull Trap! Don’t Get Caught Buyers!

Dow Jones Index – Bull Trap

A bull trap is a misleading signal which tells financial traders that an asset, which has recently fallen, has reversed and is currently heading upwards, when in fact, the asset will continue to decline. Thus trapping buyers who went long, often at the top of the rebound, only to go on to suffer losses when the asset crashes.
We may well find ourselves in such a situation with the Dow Jones Index currently.


This is a daily chart of the Dow Jones index, and we can see that after a record-breaking run during February 2020, when the American economy was flying high, it crashed to a low of 18.200 just a few weeks later after the outbreak of Covid-19 as the US shut down its economy to protect citizens. This is the first time their economy has been closed down by Government consent.

The Federal Reserve threw money at the economy in the form of reducing interest rates and massive rounds of financial relief packages worth over $3 trillion, so far, and yet still with the majority of the economy flatlining, the Dow Jones Index rallied to a recent high of 24.900. This was effectively a massive bull run during a slump. It caught a lot of investors off guard, many who were selling stocks and shares seem to have sold out too soon during the first crash down to 18.200. But will those investors who started buying again after that low now suffer as the index falls lower, or will we continue to see momentum to the upside?

The issue for investors, as the Dow sits at 23.650 level, is that Banks are not paying dividends to investors this year as they try to shore up losses caused by the pandemic. This makes bank stock highly unattractive to traditional investors who would previously buy such stocks while accepting the risk of a potential fall in stock value while receiving dividend payments. They were happy to ride out any financial storms while waiting for better times ahead after the economy recovers and thus a return in the share price.
However, this crisis is not the same as the financial crisis in 2008, where investors such as Warren Buffet piled in through his investment vehicle, Berkshire Hathaway, to pick the stock up cheaply looking for long term growth. Boy, did he do well when the economy went on to surge higher?

However, Berkshire Hathaway has suffered heavy losses in this current crash, having lost an estimated $50 billion, and Mr. Buffet claims to have made a mistake in buying airline stocks and has just sold 84% of his stake in Goldman Sachs, the darling of the Wall Street investment banks. Could the writing be on the wall for US stocks now? He said that while the trains had come off the tracks in 2008, they are currently in the sidings in this event.

So, with over 20 million currently unemployed, GDP at -4.8% for March, manufacturing down, Government debt growing, and with 1.5 million cases of Covid-19 and almost 90 thousand poor souls having lost their lives, what on earth seems so attractive about buying US stocks right now?
The simple truth is that there are more buyers than sellers right now, many investors believing that the economy will bounce back quickly after similar health crises, such as Ebola, Sars Bird Flu, and Zika, where there were crashes in stocks but where they quickly recovered. And also where firms and

executives of those firms have bought their own stock on the dip lower. Some economists believe there will be a V-shaped recovery: a quick fall and a quick recovery. This sort of talk causes F.O.M.O or fear of missing out, a very big reason why we see such rallies, as they pile in buying up stock believing that the worst is over.


This is the number one reason that stocks are getting bought while the news is getting worse. But the elephant in the room is Covid-19 is still an unknown disease and the moment markets hear of second waves they will drop stocks like hot potatoes. There will highly come a time, very shortly, which will be the straw that broke the camel’s back, bringing the current bull run to a crashing end. And that will confirm what we see as a bull trap.

Categories
Crypto Videos

The US is Printing Trillions of Dollars! How Will That Effect Bitcoin!

The U.S. is Printing Trillions of Dollars – Is Bitcoin the Key?


The United States Senate recently approved a $2 trillion stimulus package in late March as a response to the COVID-19 pandemic and rising unemployment. On top of that, the House of Representatives has accepted a House Democrats’ proposal for another $3 trillion. The Federal Reserve had to evaluate the steps it will take and start a wave of quantitative easing unparalleled in size so far in history.
The Fed’s use of quantitative easing is meant to bring liquidity back to the market by printing more money and injecting it into the financial system.

Comparison

NEW YORK – SEPTEMBER 16: Traders work on the floor of the New York Stock Exchange (NYSE) on September 16, 2008, in New York City. The Federal Open Market Committee (FOMC) met today and announced they will hold the federal funds rate at 2.0 percent, despite the recent turmoil among investment banks on Wall Street. U.S. stocks were mixed following yesterday’s Dow Jones Industrial Average plunge of 4.4% or 504 points, being the worst single-day loss since the terrorist attacks of September 2001. (Photo by Spencer Platt/Getty Images)

Source: The tokenist.io

To understand the scale of this endeavor, we need to know a bit about the previous economic meltdown. The Recession of 2008 started when the Fed brought up more than $1.2 trillion worth of assets just so it would pump capital into the market. When compared to what it plans right now, the $1.2 trillion number sounds small and almost insignificant.
Over the past three months, the Fed purchased around $2.8 trillion worth of assets. However, unlike in 2008, it decided to buy riskier assets such as municipal and corporate bonds as well.

Where do Cryptocurrencies fit in?

The U.S. expects this bailout money to be spent on recovering the economy by preserving the financial health of public companies and not to be saved up, as the soon-to-be negative interest rates, as well as inflation, will eat it up in the long run. Since most Americans don’t own assets, the only actual result of the money “injection” will be a very short-term increase in purchasing power, followed by a long-term weakening of purchasing power.

Many analysts believe that this is a great opportunity for Bitcoin to establish itself as a store of value. Bitcoin, as well as the rest of the cryptocurrency market, could prove to be the key to people preserving their holdings amid the incoming inflation.

Categories
Crypto Videos

Negative Interest Rates & Bitcoin! Place Your Bets!

Negative Interest Rates and Bitcoin

With US President Donald Trump announcing that he wants to implement negative interest rates, people are starting to think of how that will affect the economy.
A report published by Stack Funds shows that negative interest rates in the US will force market participants to seek alternatives to traditional assets they were investing in before. This could be a great opportunity for both Bitcoin and the cryptocurrency market, as institutions, as well as the retail sector, would have to turn to something more lucrative.

Negative interest rates
It is important to note that there is no single interest rate that is adjusted, but rather many interest rates. The interest rate Stack Funds is talking about is the Federal Funds Rate, an overnight rate at which depository institutions lend their funds to each other in the US.

A negative interest rate is used when a central bank has to boost a weakening economy. When the economy is weak, people (as well as businesses) keep their cash and save up instead of spending it. A negative interest rate is used to encourage spending money, as keeping it in the bank will make you lose it anyways.

Alternatives

When low or negative interest rates are introduced to the economy, it makes investing quite difficult as the yield on every single traditional asset will be drastically lower than before. For that reason, investment managers have to look for alternative investments in order to seek acceptable returns. Bitcoin is surely one of the assets that will pop into the mind of investment managers first.
Even now, the institutional interest in Bitcoin was rising, with many notable people in finance joining the crypto bandwagon.

Categories
Crypto Videos

CRYPTOKITTIES Breaking The Internet & The Winklevoss Twins Part In It?


CryptoKitties breaking the internet again

Two years ago, CryptoKitties broke Ethereum by so many people playing this collection game. Two years later, the launch of a new CryptoKitties’ “Catterina” token has, once again, caused havoc. The net token launch overwhelmed the Winklevoss-backed NFT exchange Nifty.

The surprise CryptoKitties drop sold out in mere minutes

Nifty experienced service disruptions in the countdown to the tokens’ launch. The platform has posted that a massive number of users have joined their platform, which resulted in it being significantly slower. One Hundred “Catterina” tokens sold out just 3 minutes after launching.

Nifty couldn’t handle the traffic

Nifty’s service issues persisted, which was confirmed in their post: “Our systems have experienced unanticipated volume during this surprise drop, and some payment issues happened. Anyone who had their card charged but did not receive a kitty will be refunded automatically. Anyone who tried to pay with Ethereum but didn’t succeed will be refunded as well.”

Even Tyler Winklevoss tweeted about the CryptoKitties boom, saying: “Wowzers. That drop was intense.”

Right after the sale has ended, Nifty posted that one of the ‘Catterina’ NFTs managed to sell for $450 on a secondary market.

Why is this news important?

This news can be considered important because it implicates a couple of things. First off, it signifies how NFTs can revolutionize gaming through tokenizing items and allowing them to be privately owned and traded. There are several games that are embedding NFTs into their gaming experience already in development, which shows great promise towards progress in this direction.

The other important segment of this news is the conclusion retail investors can draw from this. As we mentioned in our previous videos, there are certain people that make a good amount of profit by just playing this game. Even while doing something people wouldn’t consider lucrative, they manage to earn a profit. This is just another indicator of the crypto sector growing and becoming a place where people can seek fun as well as profit.

Categories
Crypto Videos

Crypto Trading For Beginners!

The Easiest Profitable Bitcoin Strategy

So many traders struggle with making a profit in the volatile crypto market. They test several indicators by themselves or maybe even in a couple of indicators together, but with no success. Even if they found success during a bull market phase, they started losing money once the market changed directions.

Backtesting

Harry Nicholls backtested various crypto trading indicators in order to find the one that works best. He tested RSI, Stochastic, Bollinger Bands, MACD, Parabolic SAR, and Ichimoku Cloud.

All of the strategy parameters were kept to default. What he found out is that, at the time of the experiment, some indicators performed better than the other. While some netted over 20% gains overall, some lost over 15%.

If we take his research up to here, we can clearly see that the MACD is the clear winner among the indicators tested. However, is it? While the MACD was profitable and netted 22.51% after over three years of trading, the market itself went from $300 to, at one point, $19,900, which is far more than 22.51%.

The Buy and Hold method

After seeing that, he implemented the Buy and Hold method, which simply bought in the first time the indicator notified that it is a good time to buy, and held until the present. As the picture shows, the gains are immeasurable compared to the previous ones. The worst-performing indicator was Parabolic SAR, with the gains of 2,125.07%, just under 100 times the gains of MACD trading.

It is clear that the Buy and Hold method works so much better than trading based on one indicator, which is the whole point Nicholls was trying to make. Relying on just one trading indicator or tool is simply far too unpredictable for constant trading. Inexperienced traders do not have to dive into trading head-first and lose a lot of money in order to learn how to profitably trade. They can rather learn on the go while investing safely, as Bitcoin and the rest of the crypto market are already making amazing gains by themselves.

Categories
Crypto Videos

Crypto! The Most Important Altcoin Trading Rule!


The Most Important Altcoin Trading Rule

While most people are introduced to cryptocurrencies through Bitcoin investing and trading, the cryptocurrency market is much more than just Bitcoin. There are countless altcoins out there that compete with Bitcoin or try to solve some other problems existing in the world.
Whether traders support certain altcoins or not, the fact is that altcoins trading can be extremely profitable. However, not many people know how to properly trade altcoins as the profit has to be tracked both against the fiat currencies and against Bitcoin.

Altcoin Trading

Altcoin trading is not much different from Bitcoin trading in terms of indicators and tools traders use to trade it. It is just as volatile and just as predictable (or rather unpredictable) as Bitcoin is. However, one main difference is that it is highly correlated to Bitcoin and that altcoins traders need to take Bitcoin’s price movement into consideration when trading altcoins.
When Bitcoin moves in the same directions altcoins are moving, traders need to think of whether their money will grow more while sitting in Bitcoin or altcoins. When Bitcoin is about to move in the opposite direction to altcoins, traders have to think about whether altcoins will be “pulled” in Bitcoin’s direction, and how much. In a market where Bitcoin’s price is stable, altcoins trading certainly becomes superior to just holding Bitcoin as traders can make greater profits off of altcoins price fluctuations.
Altcoin traders need to watch the general trend of the specific altcoins as well as Bitcoin’s trend prior to engaging in trades.

Conclusion

This guide should be considered advice to all traders willing to go into altcoins trading. As with everything, with more risk comes more opportunity, and altcoins trading is no different. If you learn to incorporate and merge Bitcoin analysis with altcoins analysis, your altcoins trading will be far more profitable.

Categories
Crypto Videos

Applying The Stock To Flow Model To The Bitcoin Halving


Stock to Flow model and Bitcoin Halving

What is the Stock to Flow model?

The Stock to Flow model is a way to measure the abundance of a certain resource. The Stock to Flow ratio would then be the amount of a resource that is held in reserves divided by the amount of the resource produced annually.
While the Stock to Flow model is generally applied to natural resources, it has seen some use when predicting the cryptocurrency prices as of lately.

What does Stock to Flow show?

The S2F essentially shows a product’s supply increase each year for a given resource relative to its total supply. The higher the Stock to Flow ratio is, the less new supply enters the resource market relative to the total supply. Assets with a higher Stock to Flow ratio should, theoretically, retain its value over the long-term better than those with a lower Stock to Flow ratio.

Stock to Flow and Bitcoin

When Bitcoin’s mining and production is taken into account, it’s not difficult to see why Stock to Flow ratio would be used on calculating and predicting Bitcoin’s price. The model treats Bitcoin comparably to commodities such as gold or silver. In theory, such commodities should retain their value much better than other assets over the long term due to their low flow and relative scarcity.

As of recently, Bitcoin is considered a very similar resource, as it is scarce, costly to produce and has a maximum supply. On top of that, its issuance is defined which makes the flow almost completely predictable, which can be extremely useful when calculating long-term price movements.

According to the “followers” of this model, the properties that Bitcoin has create a scarce resource that is expected to retain and increase its value in the long-term. The chart shows that the Stock to Flow ratio has been extremely accurate in the long-term as the price acted almost the same way after every Bitcoin halving (which reduced its daily supply by half).

Conclusion

The Stock to Flow model is a visual representation of the relationship between the available Bitcoin and its production rate. While it has so far been successful in predicting Bitcoin’s price movements, it may not be able to take into account all aspects of the Bitcoin valuation. Even so, Bitcoin’s Stock to Flow ratio is something that should be tracked and taken into account when looking for long-term trends and how Bitcoin might act in the future.

Categories
Crypto Videos

The Crypt Rainbow Chart! Making Magical Gains!


Bitcoin Rainbow Chart Signaling to Buy

Traders all around the world are getting into cryptocurrency trading because of the volatility and profit potential it brings. However, the aforementioned volatility can also be the doom to traders if not taken seriously. Due to the high-risk nature of cryptocurrency trading, some traders are opting for longer-term trading.

Bitcoin Rainbow Chart

Bitcoin Rainbow Chart is a logarithmic chart that shows the evolution of the bitcoin (BTC) price, and was created so people can have a certain level of price expectation based on this model. It was created by Über Holger, the CEO of Holger.
This chart allows traders to observe price movements over the longer term while ignoring the disturbances generated by daily volatility. The rainbow chart divides the Bitcoin price into eight colored bands, namely: bubble zone, sell zone, FOMO, bubble formation zone, HODL zone, still cheap zone, accumulation zone, as well as buy and discounts zones.
The names of these bands, as well as the chart as a whole, are humorous and wasn’t created with the intention of providing real insight in future price movement. However, this graph has been quite successful in doing what it was not created for, which is prediction.
The curve of the eight bands was often described as “too perfect not to make sense”. All of the post-halving bubbles ended in the “bubble” zone, or even beyond it, while the three pre-halving low price levels have always been placed in the “discounts” zone. However, the have been some doubts as the chart failed to give accurate info in a few instances.

What does the Rainbow Chart say now?

An interesting thing about this chart is that the Bitcoin rainbow chart is now showing that Bitcoin’s price is in the buy zone. Along with the Bitcoin’s halving event, the price might actually see a price increase that this chart expects.

Categories
Crypto Videos Forex Options

Forex Expiries For The 30th Of April

FX option expiries for Apr 30 NY cut

FX option expiries for Apr 30 NY cut at 10:00 Eastern Time, via DTCC, can be found below. – EUR/USD: EUR amounts
• 1.0730 513m
• 1.0750 712m
• 1.0800 2.1bn
• 1.0947 1.1bn
– USD/JPY: USD amounts
• 105.50 645m
• 106.00 569m
• 106.60 640m
• 106.65 521m
• 107.00 645m
• 107.10 413m
• 107.15 573m
• 107.35 1.4bn
• 107.50 2.2bn
• 107.60 640m
– GBP/USD: GBP amounts
• 1.2320 209m
• 1.2375 209m
• 1.2395 269m
• 1.2400 220m
• 1.2430 241m
– AUD/USD: AUD amounts
• 0.6570 2.7bn

INTRO + Hello everybody, and thank you for joining us for the daily FX expiries briefing video for the 10 am New York cut today.
If it is your first time with us, the FX currency options market runs in tandem with the spot FX market, but where traders typically place Call and Put trades on the future value of a currency exchange rate and these futures contracts typically run from 1 day to weeks, or months.
Each day we bring you details of the notable FX option expiries where they have an accumulative value of a minimum of $100M + and where quite often these institutional size expiries can act as a magnet for price action in the Spot FX arena leading up to the 10 am cut.
We will also plot the levels on to the relevant charts at the various exchange rates where there are due to expire, and also identify the levels which are in play, and where we believe there is a greater chance of the expiry maturing based on technical analysis at the time of writing, we will label them as hot, warm or cold.


So today we have four Option Expires for the EUR/USD pair today ………………

Also, there are also 10 Options expiring for the USD/JPY pair…………………….

Also, there are also 5 Options expiring for GBPUSD…………………….

Also, there is also one Option expiring for AUDUSD…………………….

Of the notable option expiries which we brought you yesterday: price action hit the 108.65 level for EURUSD pair, which was an official strike at the 10 am cut. We listed this as Hot.
ERUGBP hit 0.8730 at the cut, which was only 30 pips from the 0.8700 option expiry. We listed this as Hot too.

GBPUSD had an expiry at 1.2425, and where we saw price action hit 124.47 at the cut, just 22 pips from the option expiry. We also listed this as Hot.

We suggest you take the levels and plot them onto your own trading charts and incorporate the information into your own trading methodology in order to use the information to your advantage.

Remember, the higher the amount, the larger the gravitational pull towards the exchange rate maturity at 10:00 am Eastern time.
For a detailed explanation of FX options and how they affect price action in the spot forex market, please follow the link to our educational video.

Categories
Forex Videos

Everything You Need To Know About The Forex Market Right Now!

When the fundamentals lag behind the technicals

In recent weeks you will have noticed that the financial markets are in complete turmoil, with extreme volatility in all sectors, but especially in the oil markets more recently, and where stock markets seem to be propped up by hope more than fundamentals; after all, many indices have been rallying while the world economies have ground to a halt. And where volatility has also spilled over into the currency market.

At the end of March 2020, we saw huge moves in currency pairs including a spike in cable, which only a few short weeks ago was trading at 1:14 and yet has recently spiked up to 1.2640, and where fundamentals for the British economy do not support this huge increase in the value of the pound.

So what is going on? Well, one thing is for sure, British economic data releases are not really showing the true extent of the fallout of the Covid-19 pandemic yet. And so, the fundamentals are lagging the technicals. In other words, the markets are being driven by technical analysis rather than fundamental analysis, in some circumstances.
Something that has stuck out like a sore thumb with regard to fundamentals lagging technicals is the USDCAD pair’s recent choppy price action. Let’s drill down in a little more detail to try and establish what is going on.


Before we do that, let’s take a look at the West Texas Intermediate or WTI, price action chart of the last 12-months. WTI is the benchmark for crude oil, and from 2019 to 2020, the price of a barrel of crude oil ranged between $50 to $66. West Texas Intermediate is a specific grade of crude that is used around the world and is seen as a benchmark in pricing oil.


In this chart, we can see that in the same 12-period, USDCAD ranged between 1.2966 to 1.3575. Obviously, this was just before the virus pandemic. But in case you didn’t know, Canada is the fourth-largest producer and fourth-largest exporter of oil in the world, with 96% of Canada’s oil exports going to the United States.
Production and exportation of all products, including gas and electricity in Canada, contributed to around 170 billion in Canadian Dollars to it’s 1.8 trillion dollars of gross domestic product, which equates to around about 10% of GDP. And so oil is big business in Canada. And anything that upsets the production and exportation of oil will have a dramatic effect on Canada’s gross domestic product, and a spillover will, of course, be the value of the Canadian dollar, where we would expect price action volatility.
In fact, Canada has huge reserves of crude oil in Alberta’s Oil Sands and large deposits off the coast of Atlantic Canada. Oil is such a big business here, including exploration, drilling, production, field processing, as well as storing and the transportation of oil.

The Canadian dollar is sometimes referred to as the Loonie because of the loon bird, as depicted on the Canadian $1 coin. The Canadian dollar is one of the major currency pairs. It is widely traded in the financial markets and has been subject to extreme volatility during the current crisis.
However, we have also noticed that the USDCAD price action has become out of kilter recently, and this can be attributed to price action falling out of line with fundamental analysis and where traders have been preferring to trade on the basis of technical analysis. But be warned, fundamental reasons will catch up eventually and make the relevant corrections.
let’s set out our reasoning behind this theory:


In this daily chart of the USDCAD, pair we can see that the price action, which had previously been contained within the 1.2966 to 1.3575 area, has spiked higher to reach a multi-year high at 1.4664 on the 19th March 2020. There are several reasons for this, including the perceived Covid-19 related hit to the Canadian economy, which affected and devalued the Canadian dollar.


But if we take a look at this chart of WTI, we can also see that the 2019 to 2020 price of a barrel of crude oil range of $50 to $66 has spiked lower to $21 per barrel and therefore this would have been the main contributor for the Canadian dollar spiking higher because traders envisaged that the low price of oil, which is attributed to a global slowdown and a lack of demand, would devalue the Canadian dollar and that is exactly what happened; Oil price lower, Canadian Dollar value lower.


Let’s move forward to 30th April where the price of oil has continued to collapse, at one point going into negative territory to – $40 a barrel for WTI for May’s futures contract, which is the first time in history that this has ever happened. But at this point, we can see that price has somewhat recovered to $11 dollars per barrel. And we might, therefore, expect that the Canadian dollar has also weakened.


However, on the same day of the oil low, 30th April, the Canadian dollar has rallied higher in value, with the USDCAD showing a low of 1.3843, its highest level in six weeks. Before moving higher again to 1.4100 where it currently sits.
While some of the increase in the value could have been attributed to the oil price coming off of its low, especially the minus figures, on hopes of a fuel demand recovery, the prospects of further economic stimulus by the Canadian government, and the gradual reopening of western economies, we can be in no doubt that there has been a lag in fundamental analysis, and where traders have preferred to move with technical analysis, during the period of 19th March to 30th April.
However even if things began to get back to normal, this is going to be an extremely long process, and yet many oil-producing countries such as Saudi Arabia and Russia keep pumping out oil in a high volume regardless of the slowdown in global economic growth and where the

surplus of oil in storage all around the world is not likely to be consumed until 2022, according to some analysts.
Therefore no matter what type of recovery we see, and it won’t be rapid until there is a cure for Covid-19, on the basis of supply and demand, we will see low oil prices for a long time to come. Therefore we should expect the US dollar CAD to continue to rise, perhaps to previous highs of $1.46, as the fundamentals catch up with the technicals.

Categories
Crypto Videos

The Facts Of Trading Crypto To Make Solid Returns!


Cryptocurrency Trading Essentials – Know What to Look For


Some cryptocurrency enthusiasts are just not interested in buying and holding their cryptocurrencies. They would rather use some of that investment money a bit more active and start trading. However, the majority of the traders lose money as they get tangled in the complex indicators and strategies while forgetting the basics.
This guild will try to point out one of the most important things when it comes to maintaining profitability and being consistent – Recognising Market Trends.

Trading in different market conditions

While it is important to know how to utilize the intricate indicators, oscillators, and other tools in order to trade crypto well, something as basic and as simple as recognizing a major trend direction will certainly go a long way. It is a rule that traders should only trade WITH the trend, but traders rarely look at bigger time frames in order to recheck the trend direction. As an example, the same candlestick formation might be a good signal in a bull market, but wouldn’t count as a signal in a bear market.
All three market directions (bullish, bearish, and ranging) work differently, and different strategies work in different market conditions. It is advisable that traders create strategies for each market direction rather than to try to make a revolutionary strategy that always works. It is generally true that almost every strategy will work in a bull market to some extent, while only a few strategies will effectively work in a bear market. Ranging markets are easy to trade as they are bound by support and resistance levels, but are hard to recognize before it’s too late.

An important thing to note is also that each of the strategies created should be tested on the market as a whole as well as on separate time spans in which there was only one trend direction. That way, we can estimate how the strategy works both on the market as a whole and on each of the separate trends.

Categories
Crypto Videos

Fractals In Crypto Trading – Add This Tool To Make Solid Gains!

Cryptocurrency Fractal Trading Guide

Bullish and Bearish Fractals

A fractal is a recurring pattern that occurs in larger price moves in technical analysis. In this case, it is a five candle trend reversal pattern, and there are bullish and bearish fractal versions. A bullish fractal reversal pattern has:

The third candle in a five-candle series has the lowest low
The first two candles have higher lows than the middle candle
The last two candles have higher lows than the middle candle

A bullish fractal reversal pattern signifies the end of a downtrend and the beginning of a new uptrend. Traders can use this pattern in two ways:
as a long entry signal or
as a signal to exit an existing short position

Many traders will use fractal signals alongside oscillators such as the stochastic or RSI for a confirmation of a bullish signal.
On the other hand, a bearish fractal reversal pattern has:

The third candle in a five-candle series has the highest high
The first two candles have lower highs than the middle candle
The last two candles have lower highs than the middle candle

A bearish fractal reversal pattern signifies the end of an uptrend and the beginning of a new downtrend. Traders use this pattern in two ways:
as a short entry signal or
as a signal to exit any existing long position
Fractals – multiple time frame analysis
Fractals are also very useful when it comes to multiple time frame analysis. Traders may use fractionalized times frames to create trading ideas.
As an example, a trader may use a daily or weekly time frame to get a better view of the overall market stance. However, they should decide their entry and exit points by looking at smaller time frames such as 1-hour or 15-minute charts.
A simple fractal trading strategy may look like this:
A trader identifies a major trend direction on a daily chart
They then use a 1-hour chart to identify their entry and exit points
Entry signals on the smaller time frame are considered only if they align with, the larger time frame trend
Signals against the larger trend are not considered trading signals but rather a suggestion to exit current positions
Conclusion
Using fractals as a trading tool can be beneficial in terms of analyzing daily randomness. Fractals can be used in many ways, so each trader needs to find the variation that suits them. While some traders may like using fractals, others may not. That being said, fractals are certainly a useful addition to any traders’ toolkit.

Categories
Crypto Videos

Crypto Pivot Points! Master The Market!

Cryptocurrency trading – Pivot Point guide


What are pivot points?
Pivot points are a pattern repetition indicator that is used to predict support and resistance levels. They can also help determine the overall market trends.
The most common way to use and calculate a pivot point is the so-called “five-point system.” This system comprises of an average of the numerical high, low as well as close of the previous trading period. These numbers are used to plot a course for five levels: two sets of resistance levels, two sets of supports, and a “pivot point.”

Calculating pivot points
The five-point system is one of the ways of calculating and identifying support and resistance levels. It is also one of the simplest, and is calculated like this:
Pivot Point (P) = (Previous Low + Previous High + Previous Close)/3
Resistance level 1 (R1) = (Pivot Point x 2) – Previous Low
Resistance level 2 (R2) = Pivot Point + (Previous High – Previous Low)
Support level 1 (S1) = (Pivot Point x 2) – Previous High
Support level 2 (S2) = Pivot Point – (Previous High – Previous Low)
The pivot point from our example is derived from the previous high, low, and close divided by 3. This allows traders to define an area where the price action seems most sensitive and likely to shift in sentiment.

Pivot point strategy – time frames

While it is possible to utilize pivot points on longer time frames, common practice looks at the smaller time frames such as 4-hour, 1-hour, 30, and 15-minute charts.
When used alongside other indicators such as the MACD and the RSI, traders can ensure the legitimacy and significance of their predictions.

Pivot point – example

An example shows the Bitcoin chart above with resistance levels marked as “R1” and “R2,” and support levels marked as “S1” and “S2.” The pivot point is marked as “P.”
Some traders end up using up to four resistance and support levels.
The first example shows that the pivot point acted as a threshold for prices to go bullish for continuation, therefore confirming the legitimacy of the move $6,285.
The RSI showed oversold conditions just before the breakout, and the MACD printed a bull cross, which added an additional layer of confirmation to this bullish move.
After a few unsuccessful attempts to surpass the R1 resistance level, Bitcoin plummeted on Sept. 14.
Finally, Bitcoin’s price went under the pivot, as well as both supports on Sept. 17.
Each of these moves had multiple indicators that confirmed the market sentiment moves as either a support and resistance test or a legit rally or breakdown.

Conclusion

Pivot points are certainly a useful addition to a trader’s technical toolbox that allows them to confirm the support and resistance levels, as well as to judge the strength of big price moves.

Categories
Crypto Videos

Crypto Scalping! Making Gains Under Pressure!

Scalping in Cryptocurrencies – Become a Trader


Scalping in Traditional Trading


Scalping is a way of trading most often used by Forex traders. It involves seemingly low-risk profiles but requires a lot of discipline as well as intensive and quick trade processing.
Scalping is trading without holding positions overnight, but rather trading on extremely short time frames to utilize short-term emotion-drive price movements.
Two common approaches to scalping are arbitrage and spread scalping. While arbitrage finds a discrepancy between the bid and ask prices between two brokers and buys from one to sell to the other, spread scalping involves the price differences with the same broker.

Scalping in Crypto Trading

A scalper in the crypto market has to take advantage of small price discrepancies between exchanges or small price fluctuations on a single exchange to lock in small gains multiple times.
Big bull run fills the crypto market with optimism, and investing often turns to altcoins, which lead to choppy markets that can be utilized. While an investor might spot the upward trend in a given alt to make a profit, a scalper would have to spot the upward trend, long the Altcoin and short BTC to create a hedge, as well as to have an exit strategy of going back to Bitcoin as soon as the trade is made.
Scalp traders need to be quick on their feet and enter as well as close their positions in a timely manner. Discipline is key when performing these actions.

Is Scalping for You?

Even when run correctly, scalping is a strategy that is more time-consuming and much more intensive than other strategies. You will need to monitor the prices of many crypto assets if you want to use the strategy fully. On top of that, you need to execute trades quickly and to manage your bankroll well. As this requires much technical knowledge and a lot of multitasking, many scalp traders try to trade only one or a couple of pairs and look for their breakouts or retracements in order to make a profit.
While this strategy seems the most appealing, it is not for everyone. Only traders with high enough risk tolerance can utilize this strategy without it impacting them mentally.
If you, however, do decide to use this trading method, backtest your trading strategies, use keybinds to quickly enter and exit positions and calculate your trading fees beforehand to avoid any unnecessary losses.

Categories
Forex Videos

The Free Forex Academy Signal Service! Over £18,000 made already! Part Two!

How You Can Make Money Using Forex.Academy’s Free Trading Signals Service – PART 2

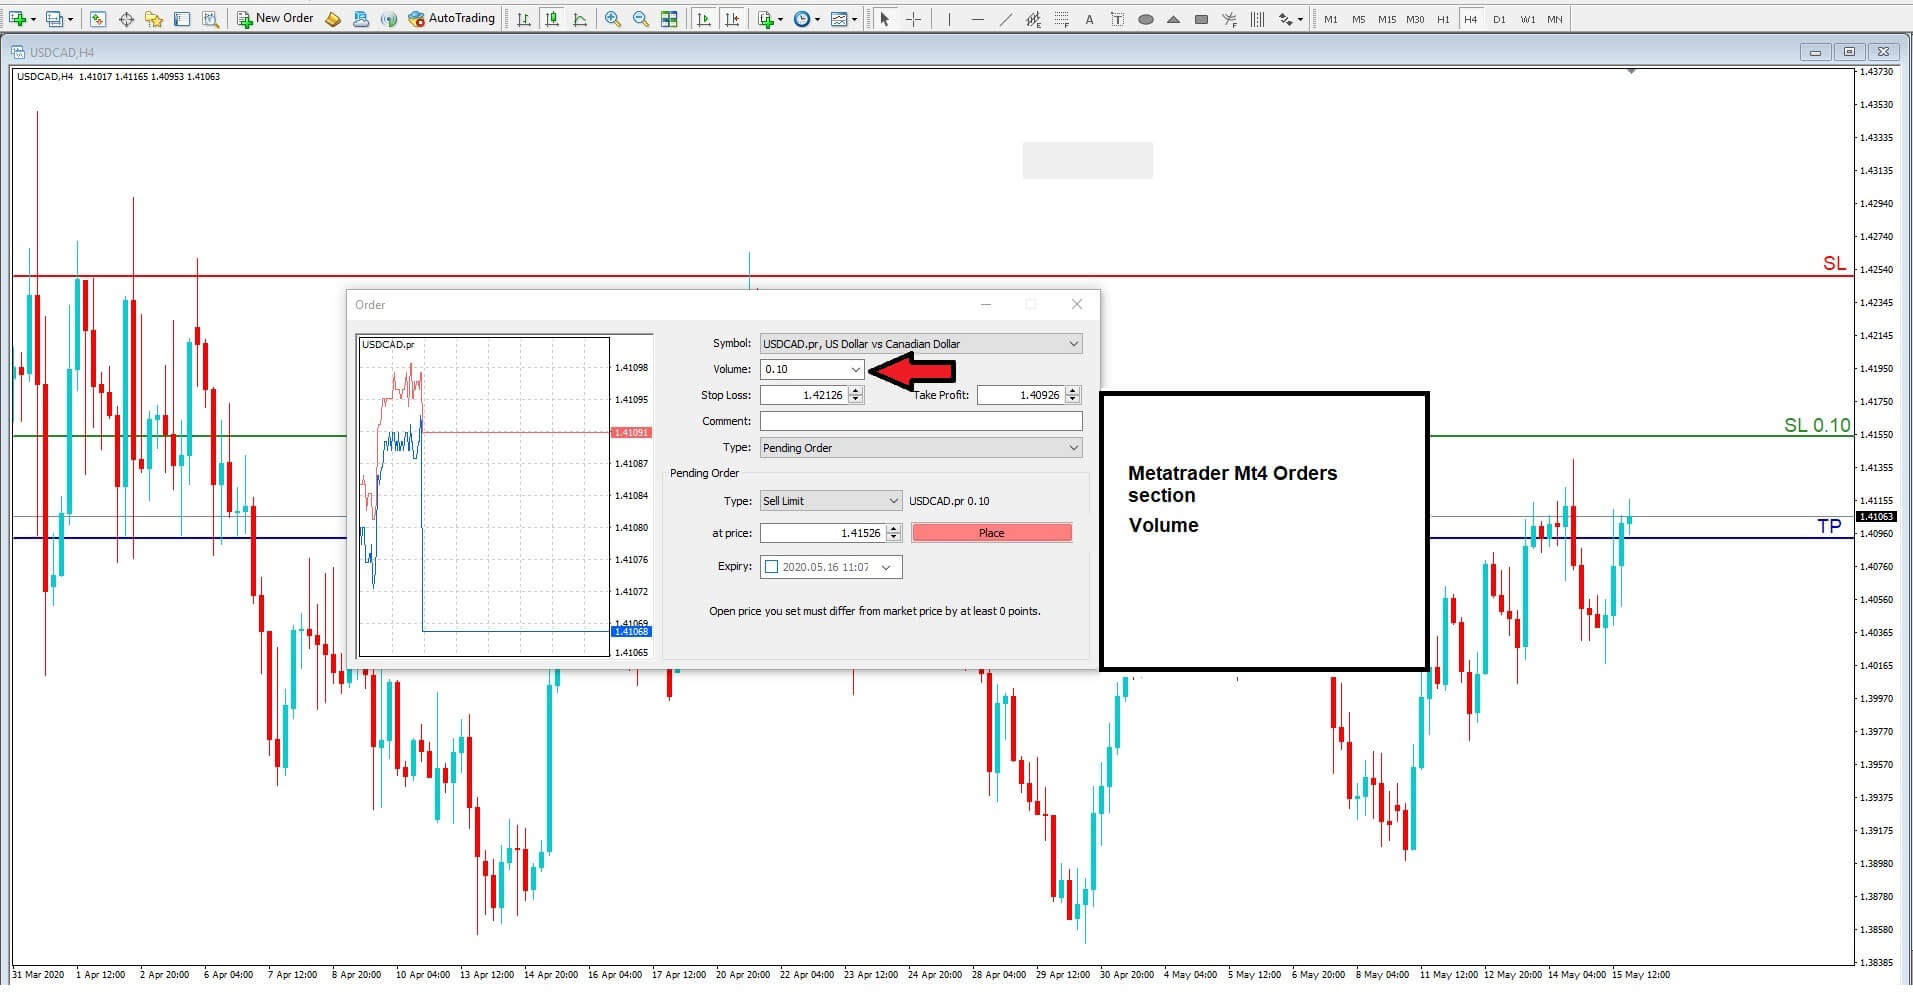
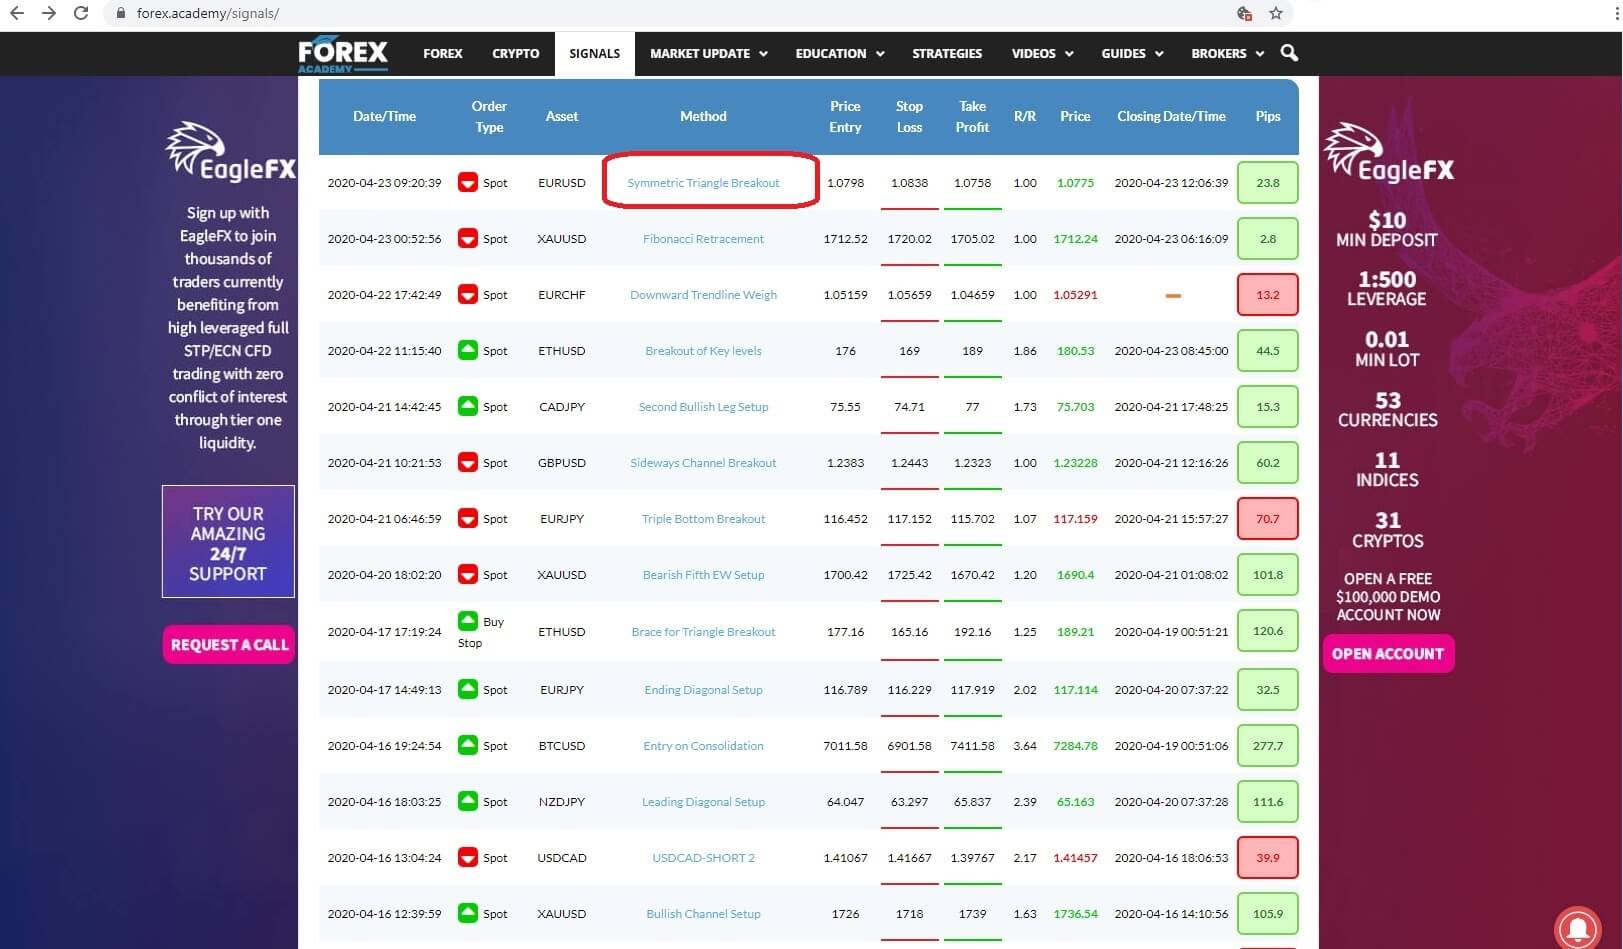
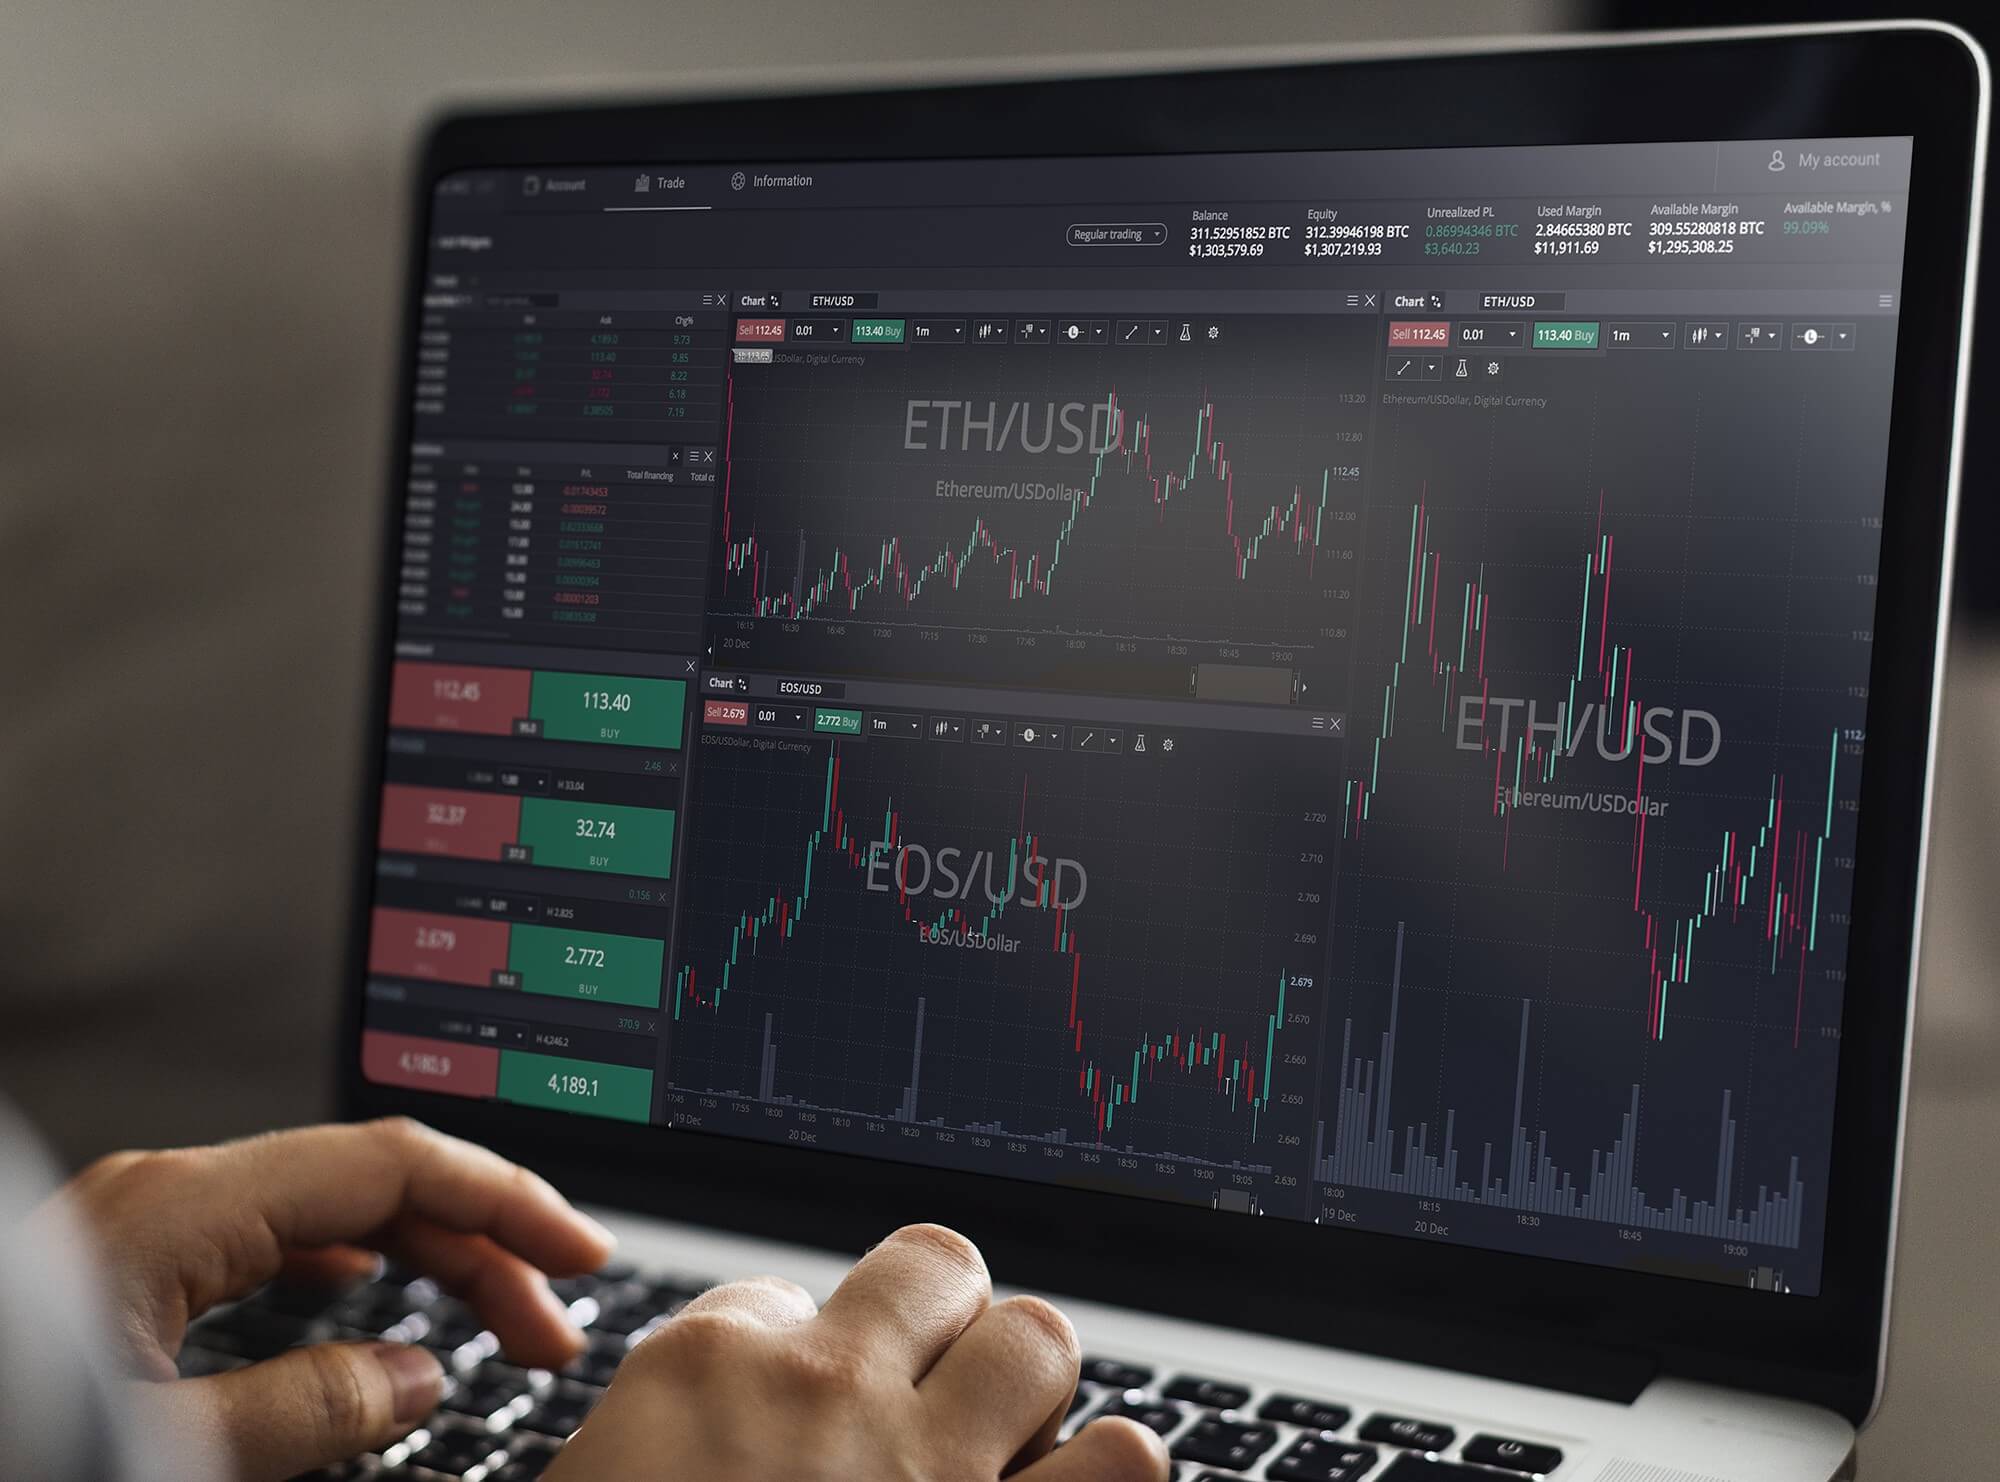
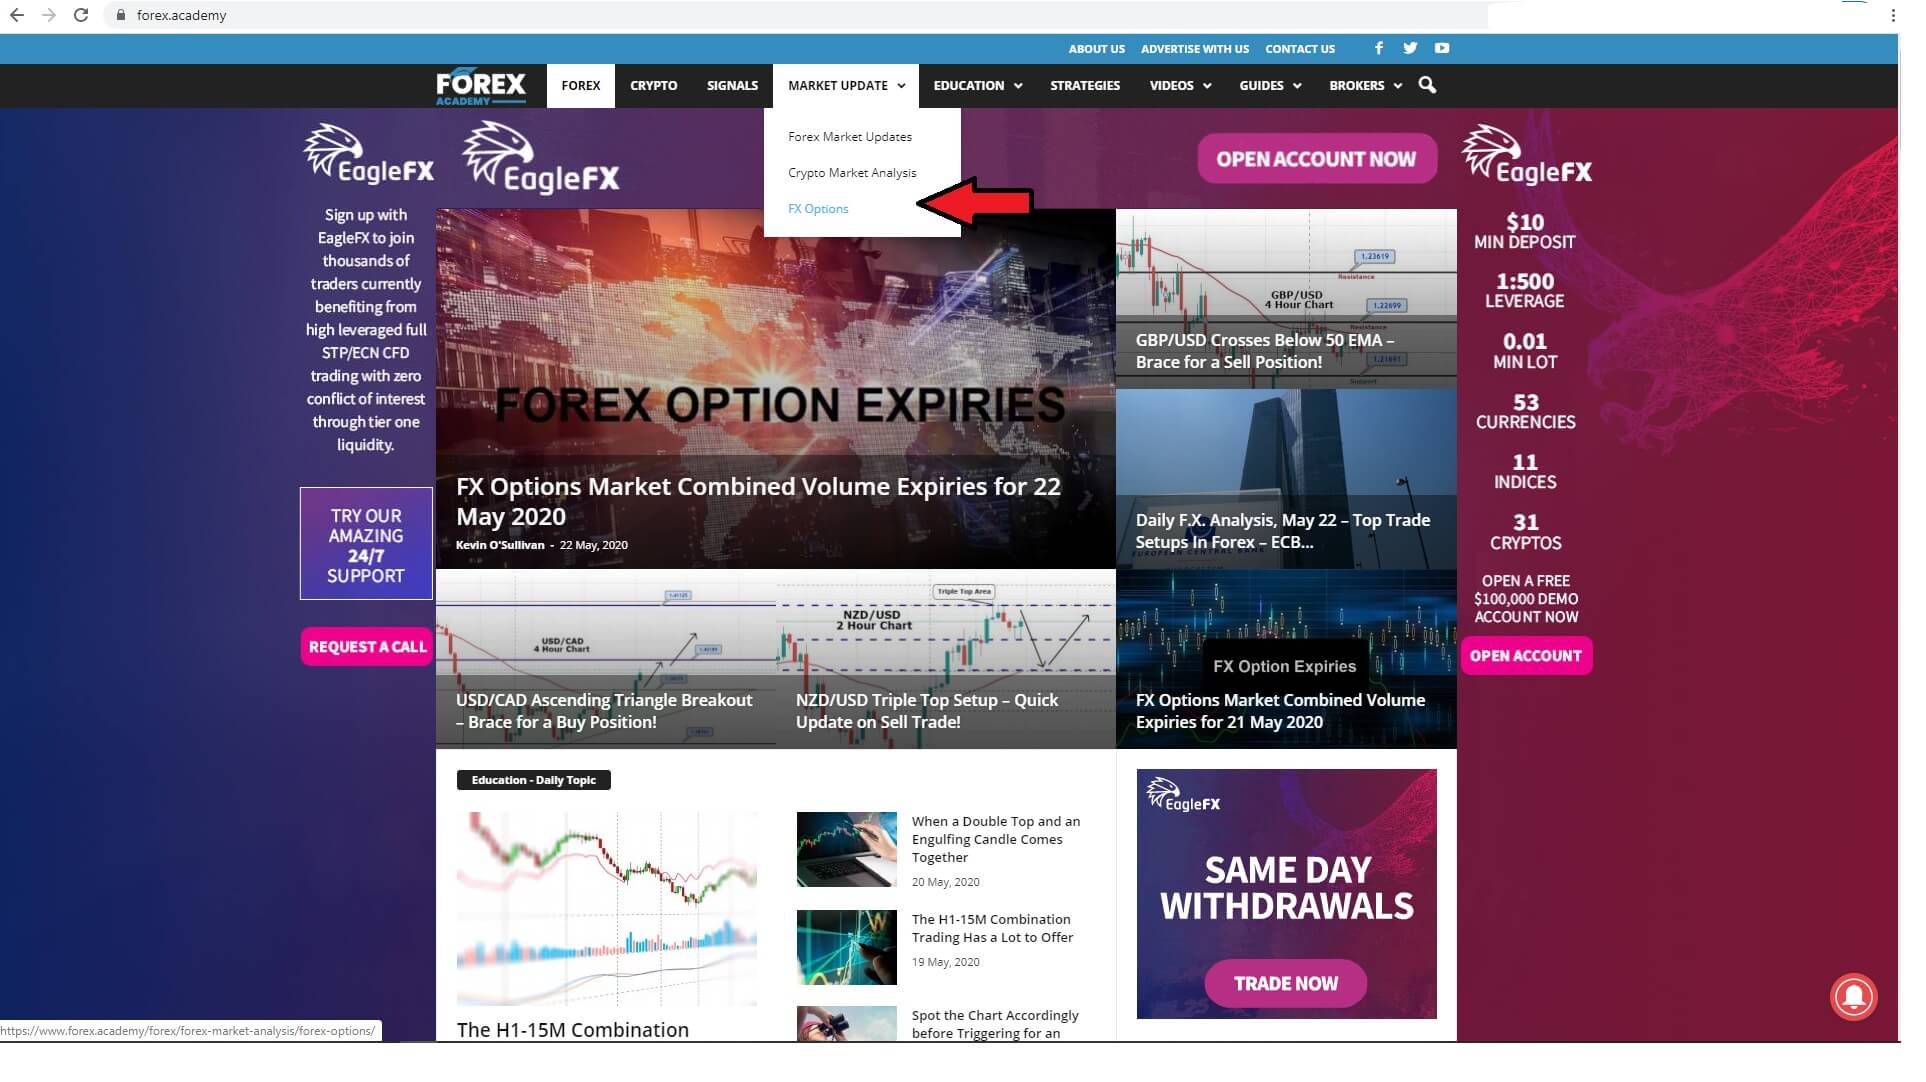
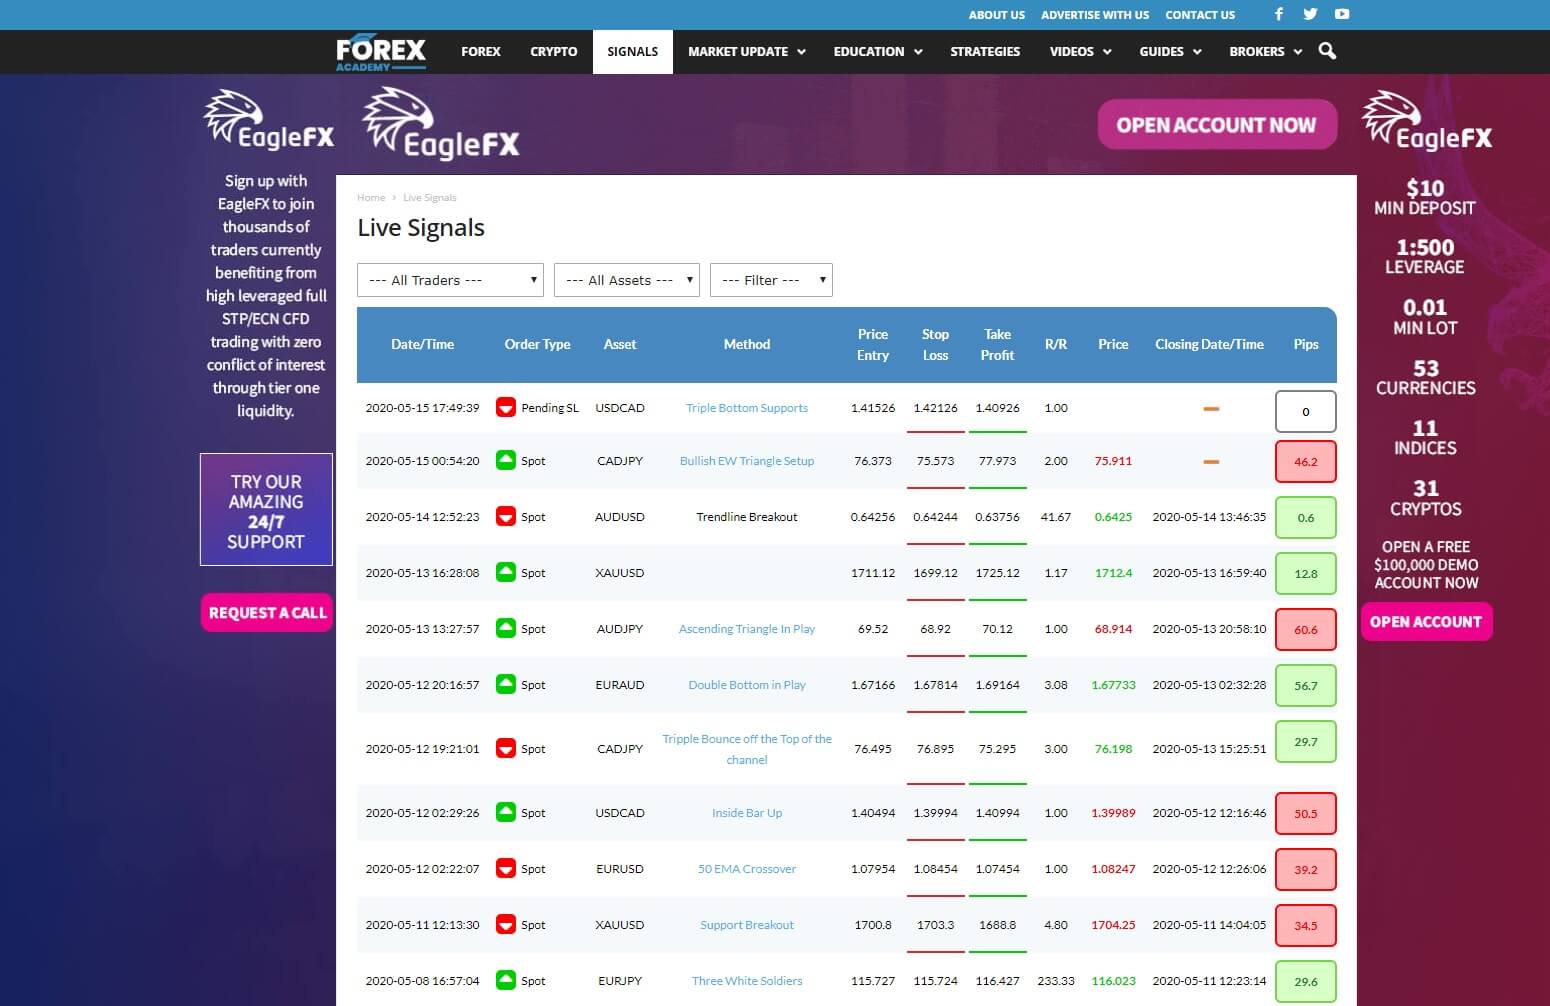
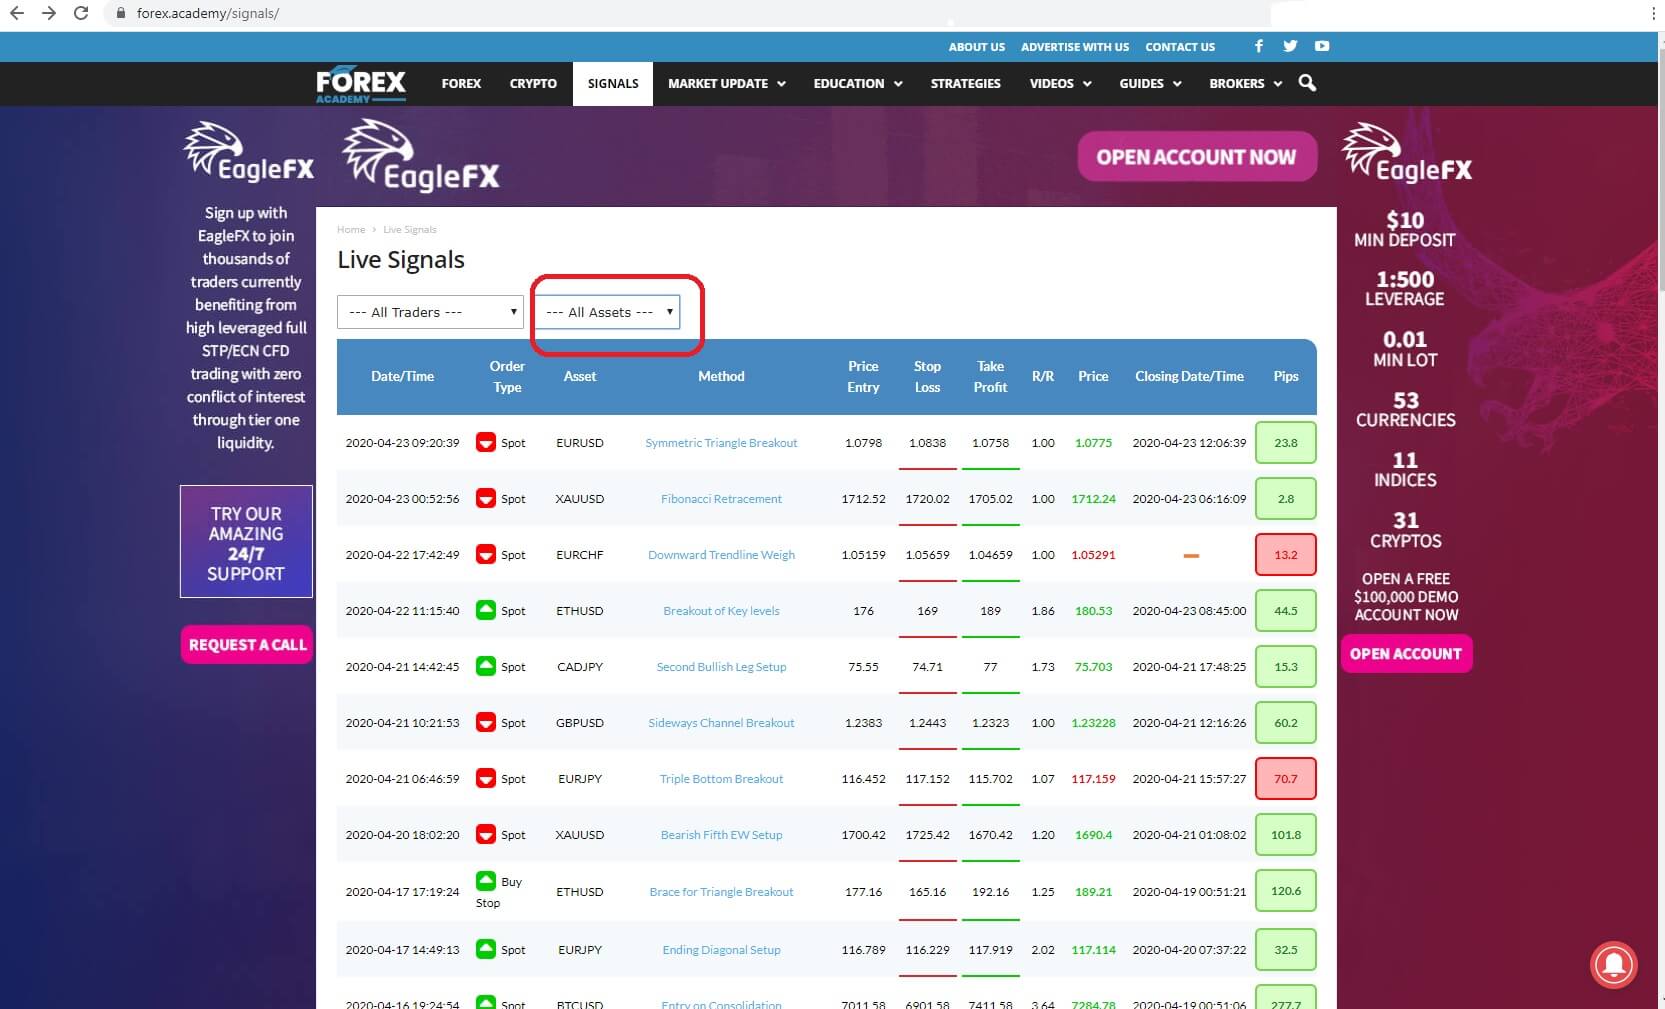
Welcome to how can you make money using forex academies free trading signals service part 2. By connecting to the Forex.Academy website and clicking the tab for our Free Trading Signals Service, you will find this page.
If you haven’t seen part one, please do so because we go into great detail about the usability of the trading signals page, including the various types of the assets being traded, the types of trade setups, and details of the professional traders involved in the signals.
In this presentation we will be looking at how the signals service can help you, the trader, whether you are a novice trader or a seasoned professional, there is something here for you in this superb free signal service.

So for argument’s sake, let’s say you are a complete novice forex trader, and you have looked at the forex space and decided that you would like to take advantage of this 5 trillion dollars per day turnover business machine, which is totally recession-proof. You have a couple of options, one you can go to the trouble of learning every aspect of the forex market, including everything that you will need to know about fundamental and technical analysis, which is no mean feat because there is just so much to learn in order to become a proficient and profitable currency trader. That said, all the educational tools that you will need can be found absolutely free of charge on the Forex Academy website.

You also have the option of using a copy or mirror trading platform, where you link your forex account to a trader based on the scrutiny you have done regarding his/her track record. However, most traders will not give you a biography, and hardly any of them will speak to you directly regarding their trading approach and methodology. Also, there will be a monthly subscription cost to the mirror platform, and also a separate fee-based subscription to the trader. While you may be able to see his/her performance track record, you will not be able to analyze their trade setups, because he or she will very likely not provide that information to you. In effect, you are blindly trusting them to make you money.

Alternatively, you can use the forex Academy trading signals service, which is totally free, 
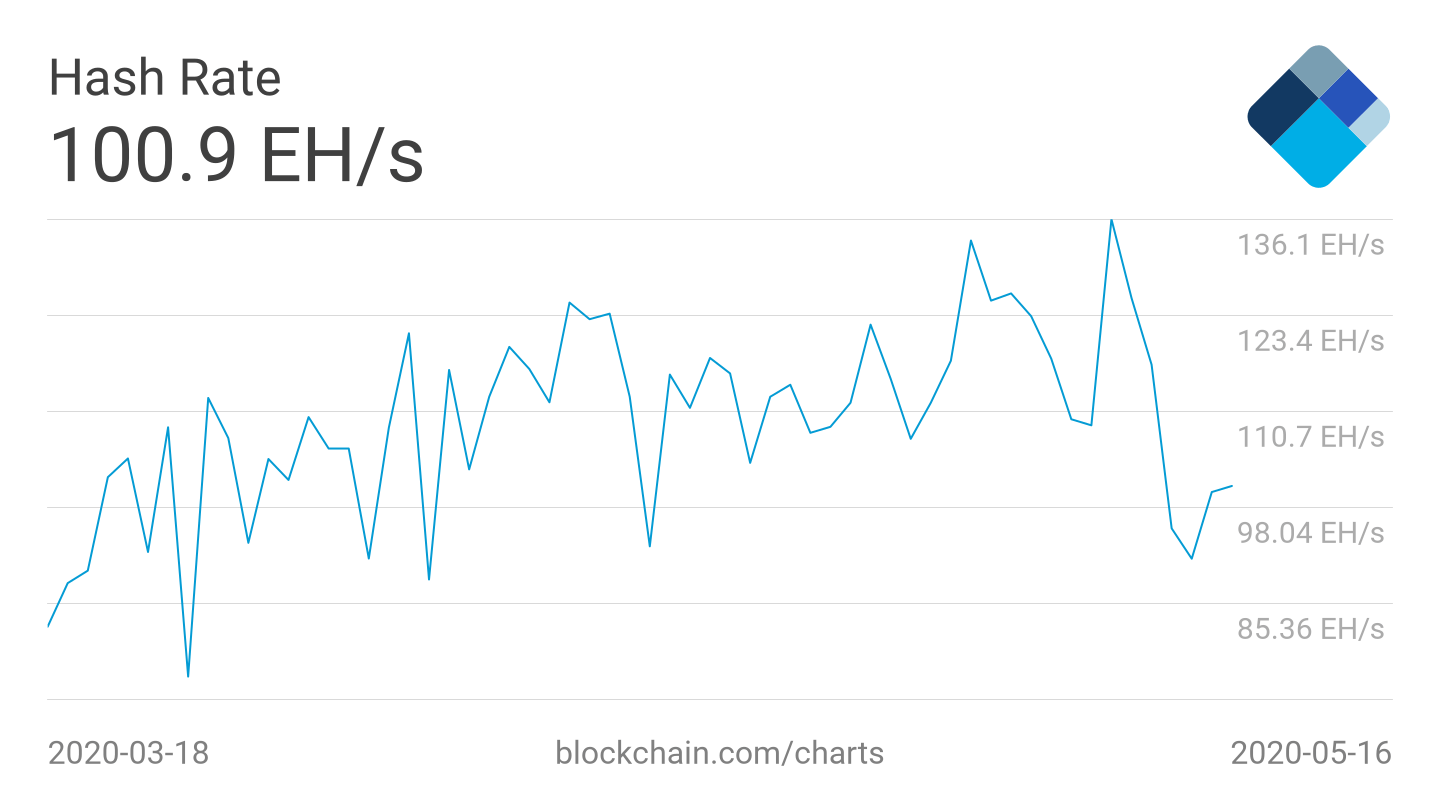
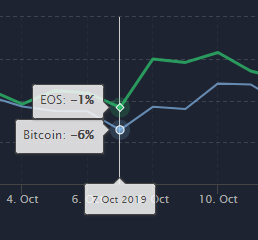
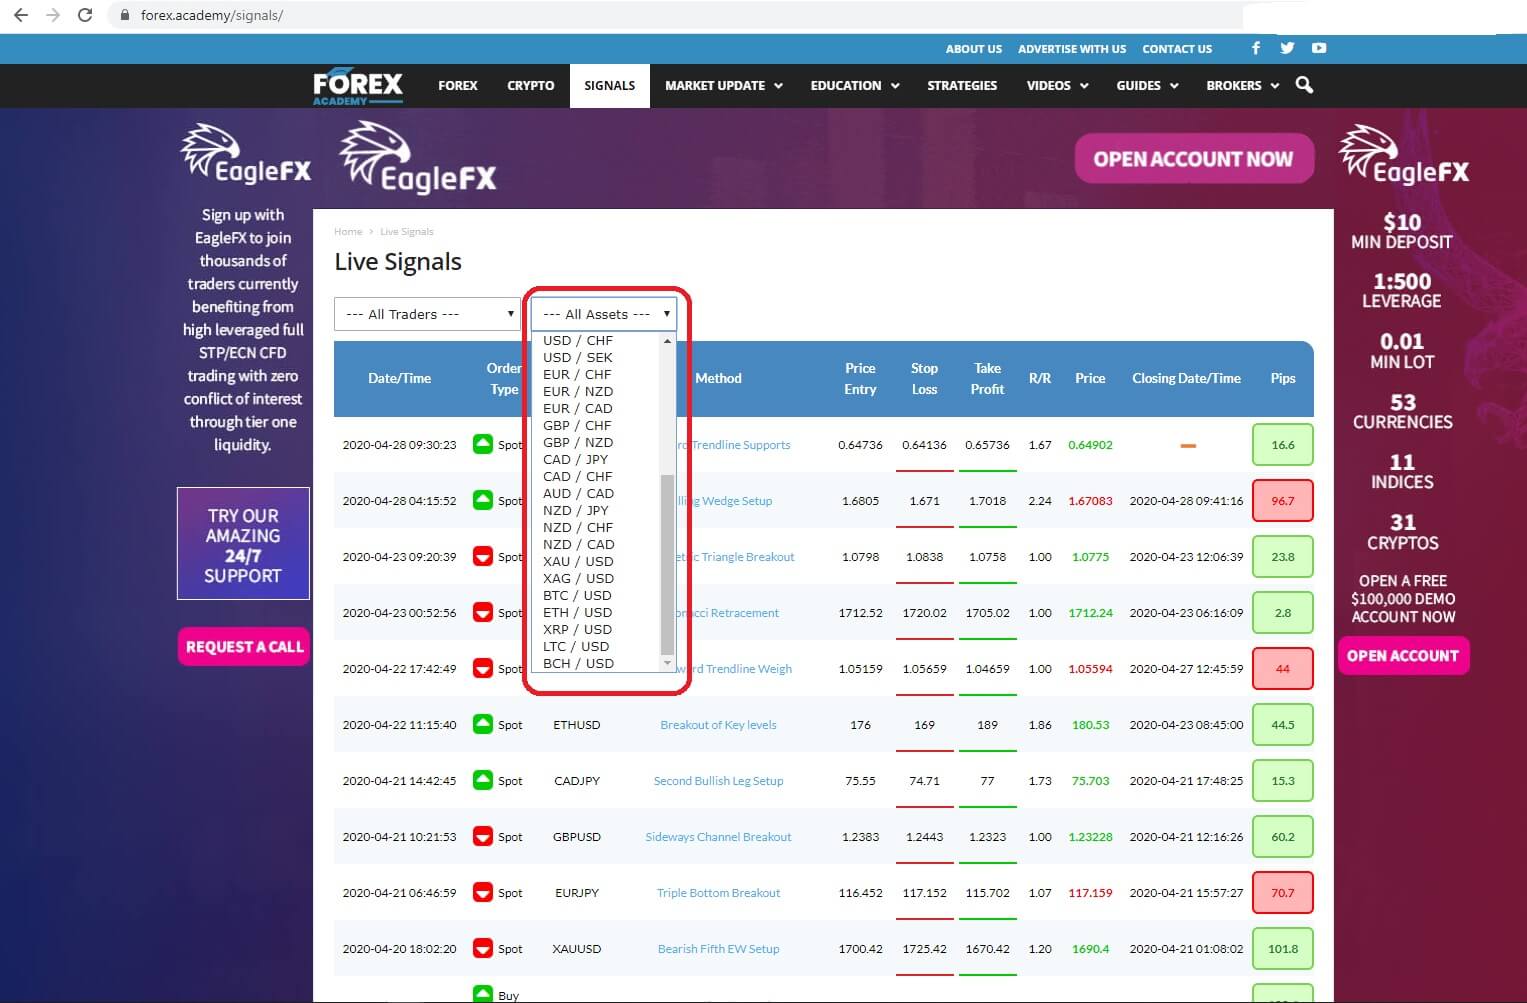
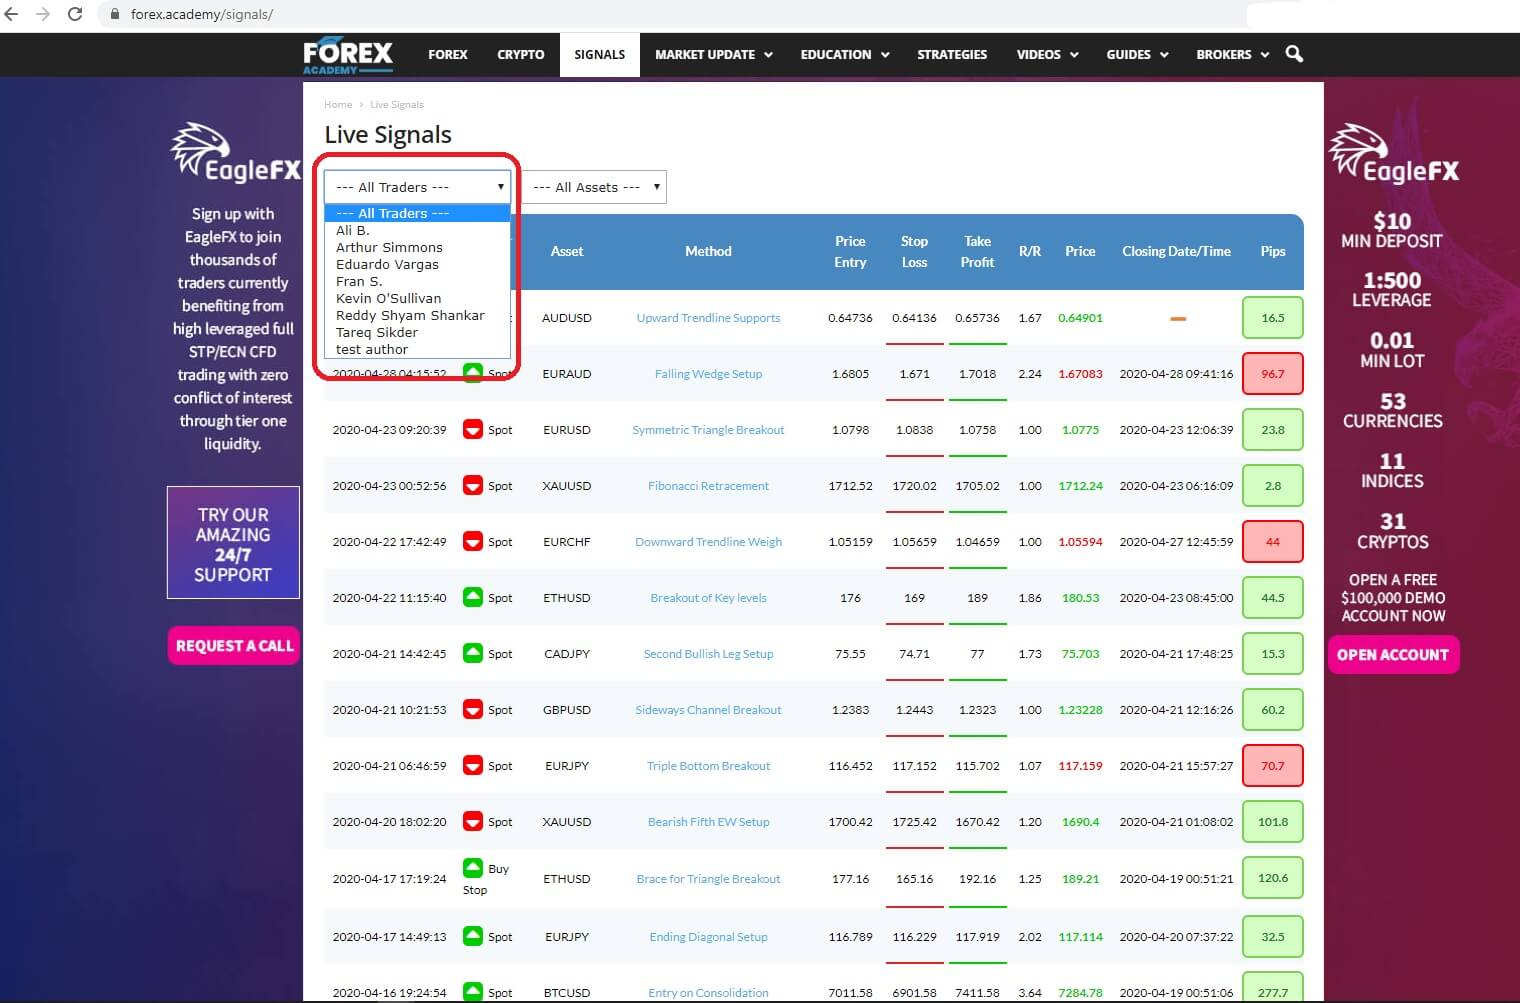
And where you get to choose the type of asset which is traded, from a basket of currencies and bitcoins.

And where you are provided with a biography of each trader, including their professional status within the forex market, both past, and present. 
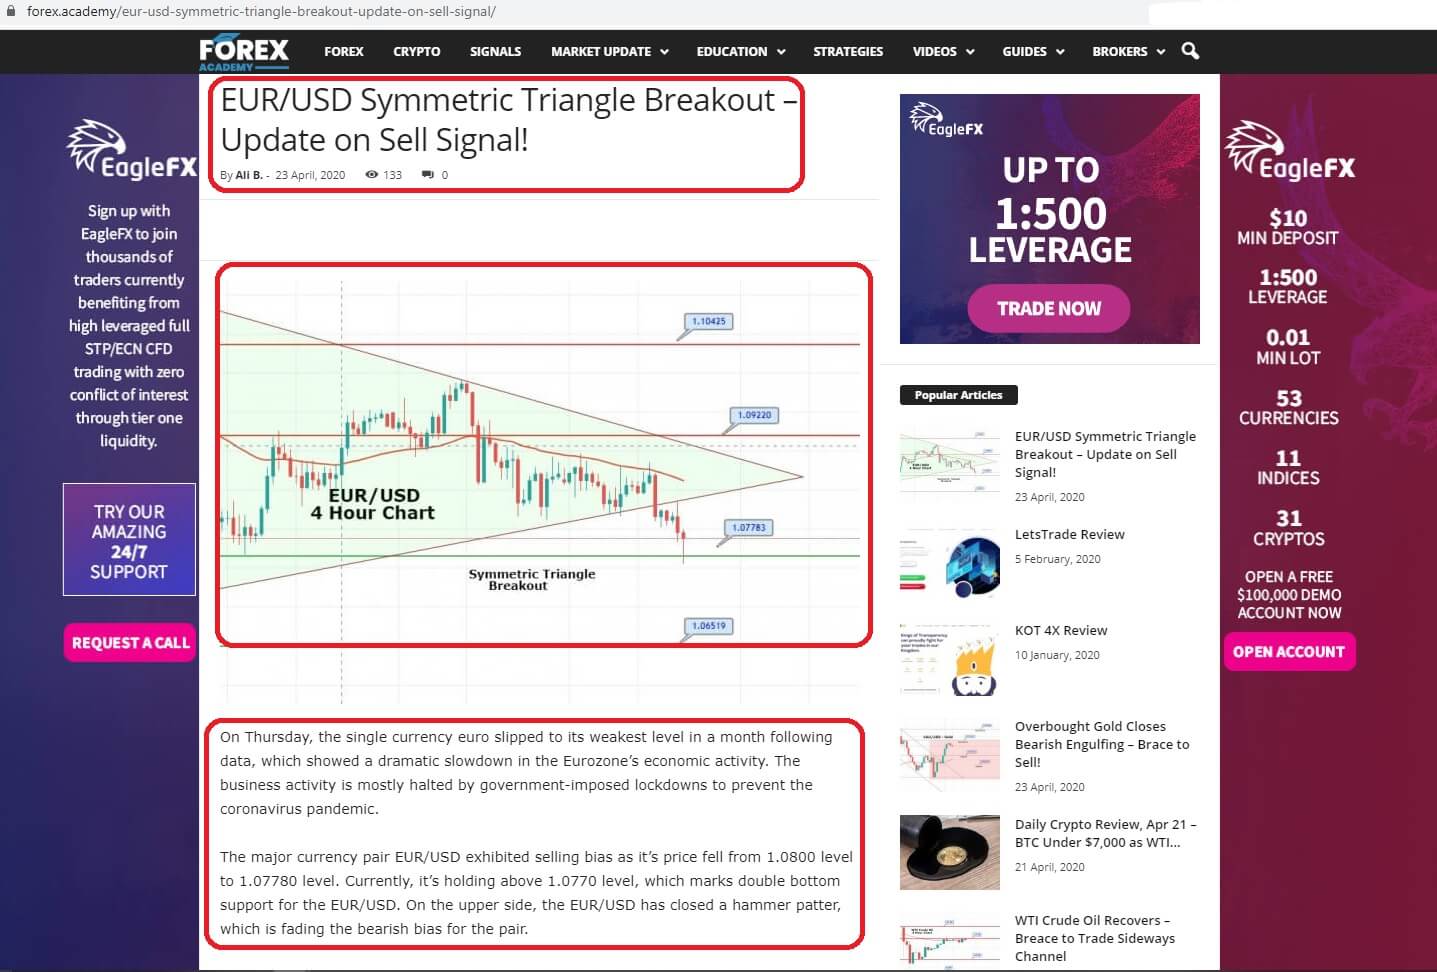
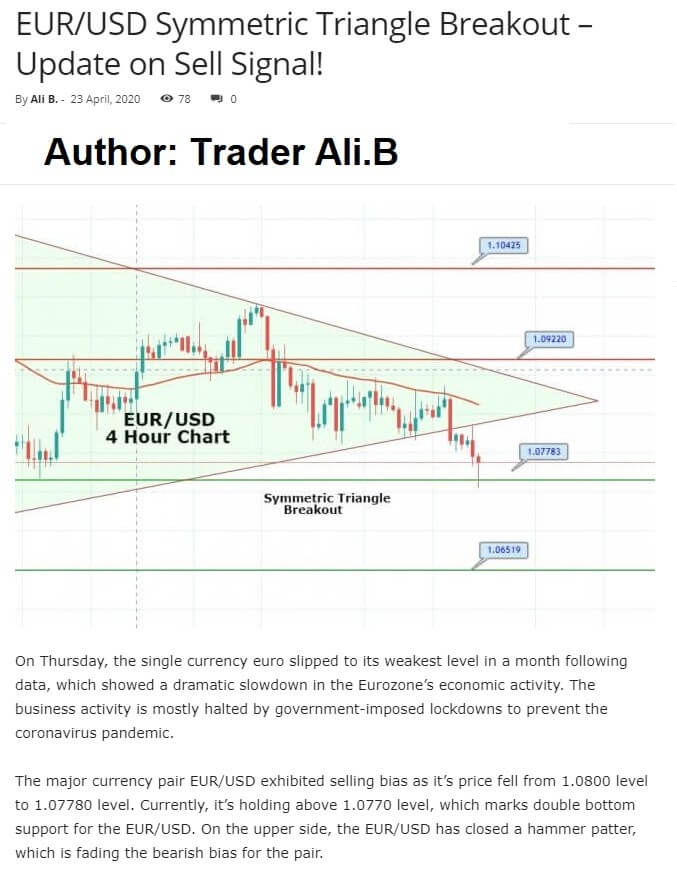
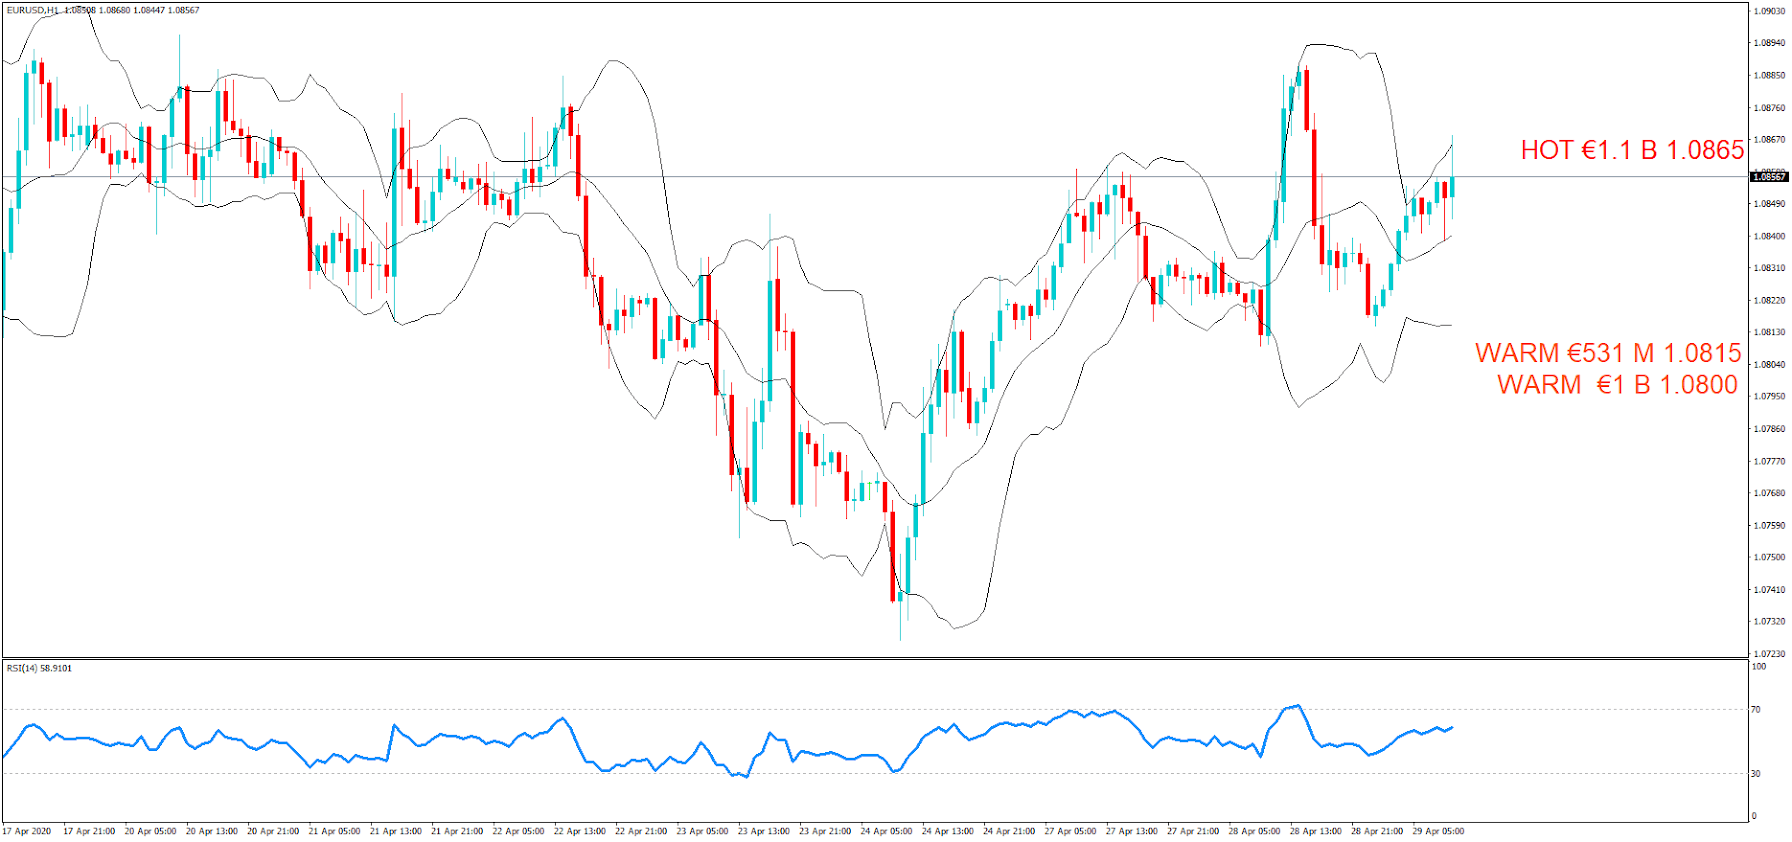
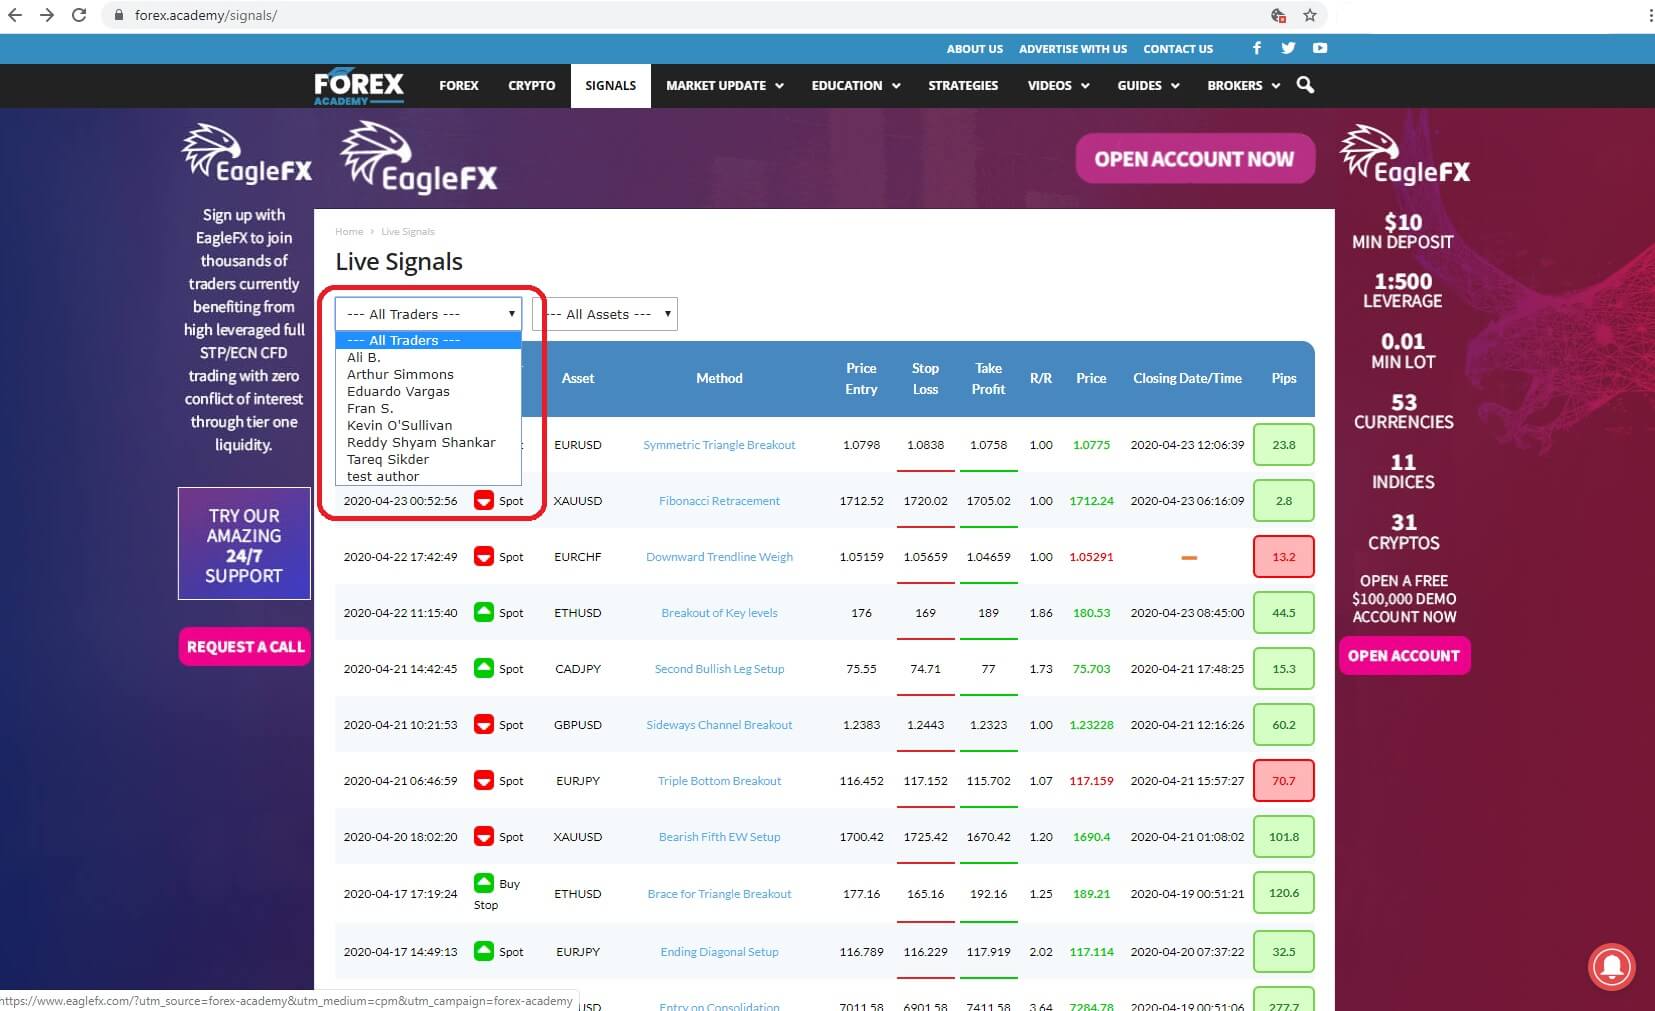
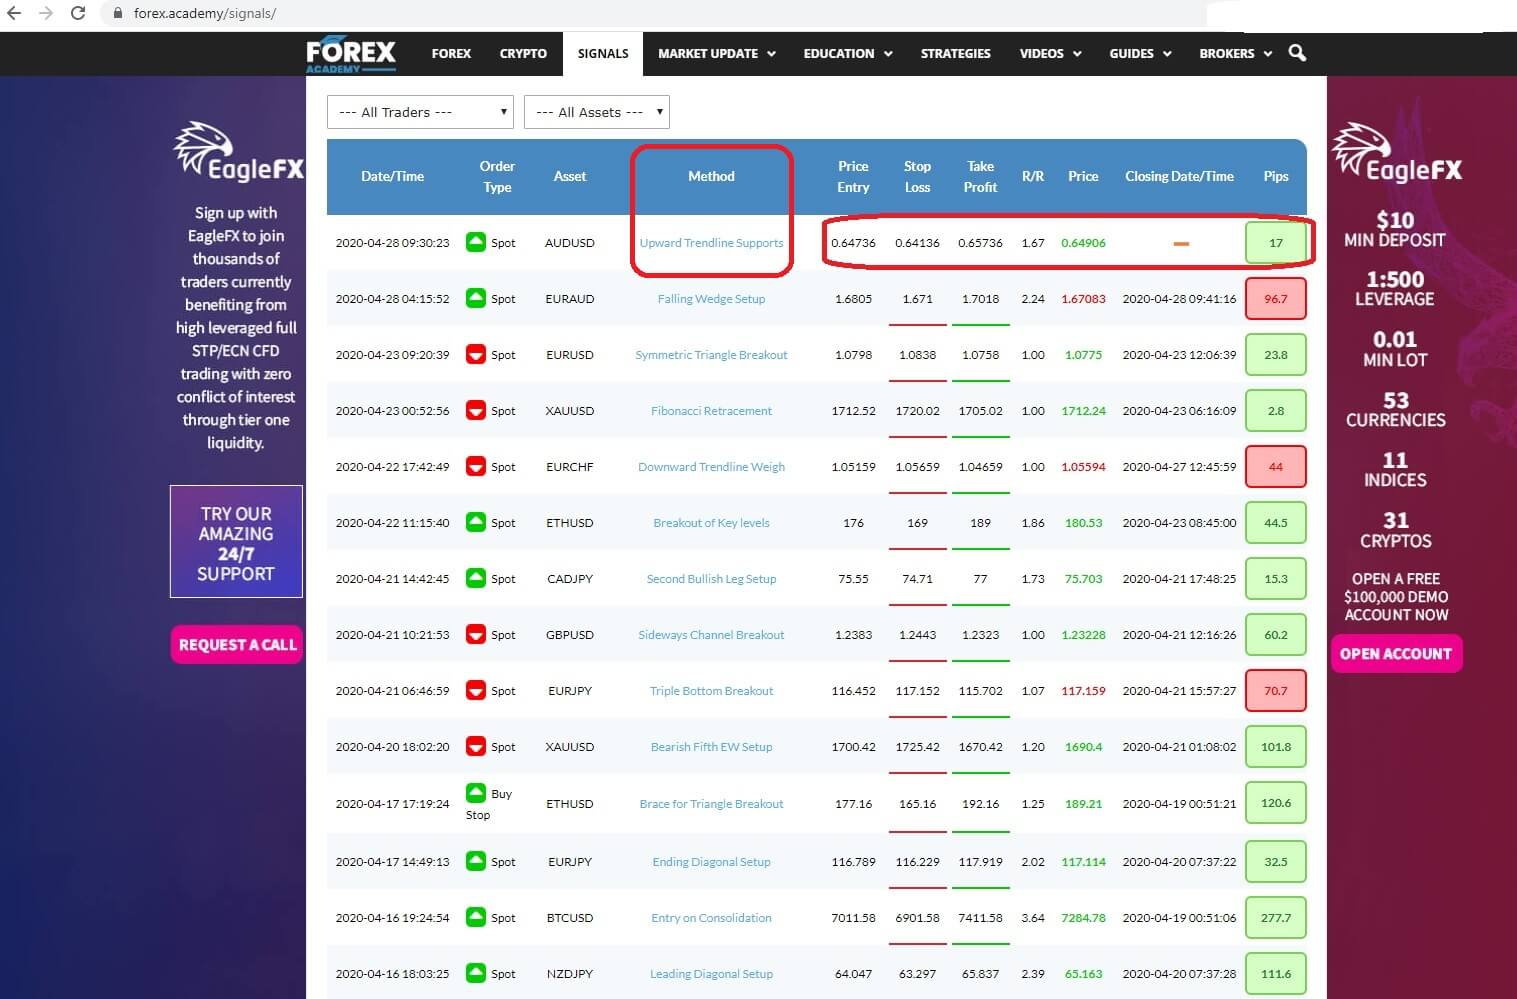
And where you can find details of the trade, including the name of the asset being traded, the technical analysis name for the trade setup, up-to-date visual technical analysis charts of the setups, and a written description of the fundamental and technical analysis behind each and every trade. Our professional traders only use technical and fundamental analysis setups that are widely used in the forex trading community in order to offer you reliable trading signals.

Trades will either be instant execution or pending orders and where you will be able to keep an eye on the trade table as and when these opportunities are presented, in which case you can pick and choose which trade to copy on your own trading platform. Having looked at the technical set up that the trader has uploaded in the method section, you then simply add stop loss and take profit

levels, or make adjustments to them based on your own risk preferences, and you then copy the entry price 
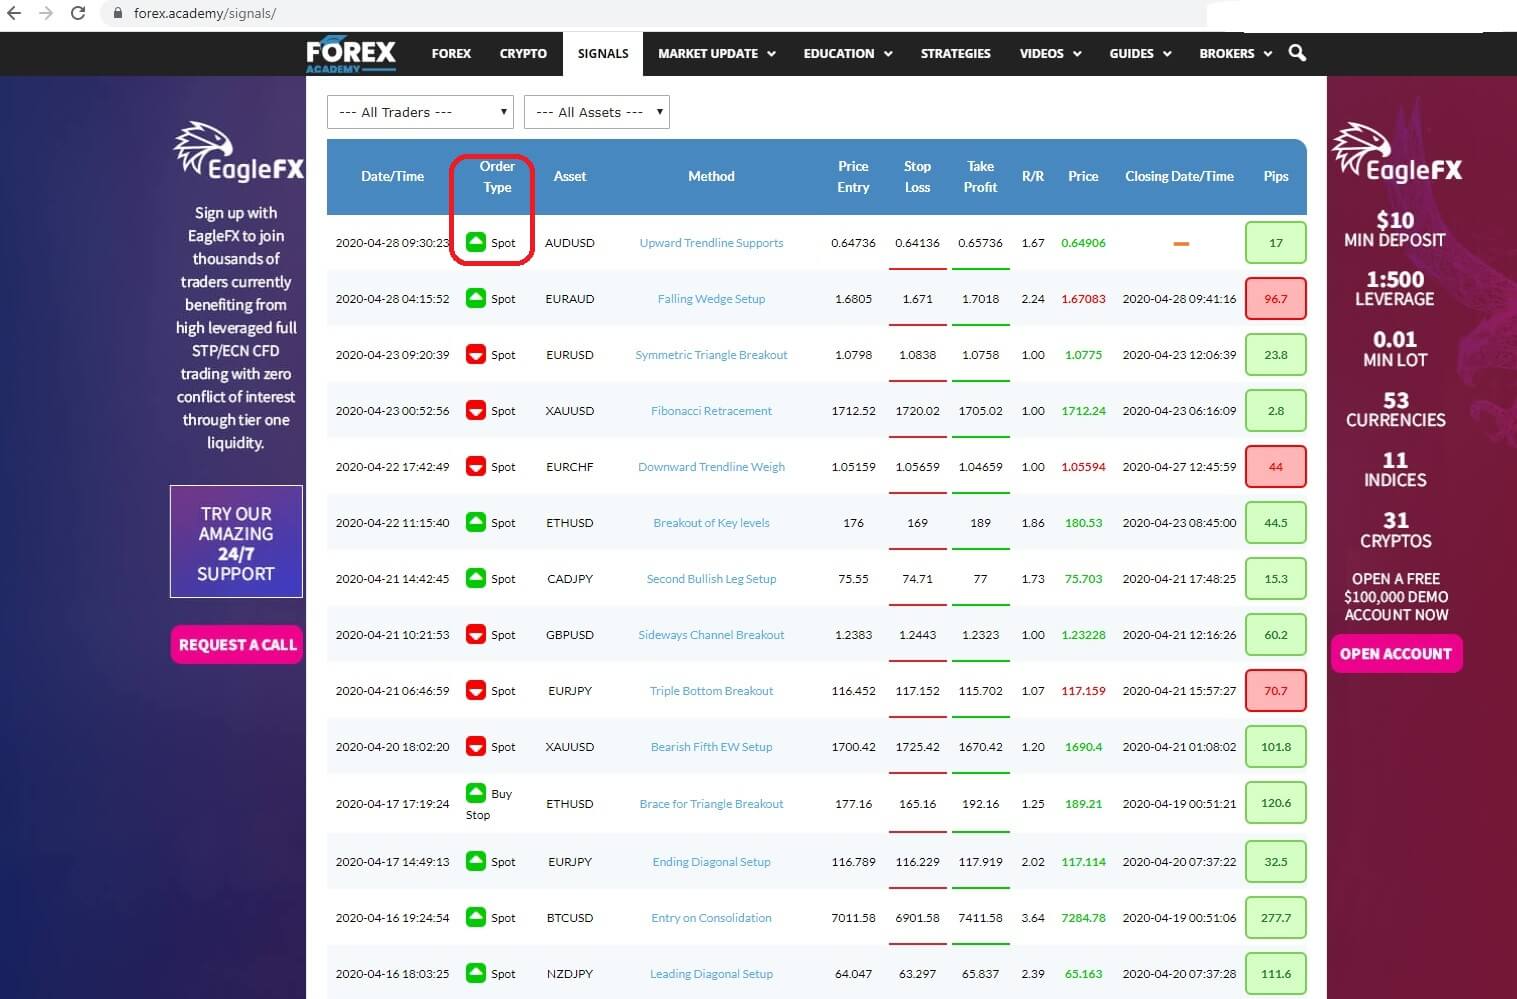
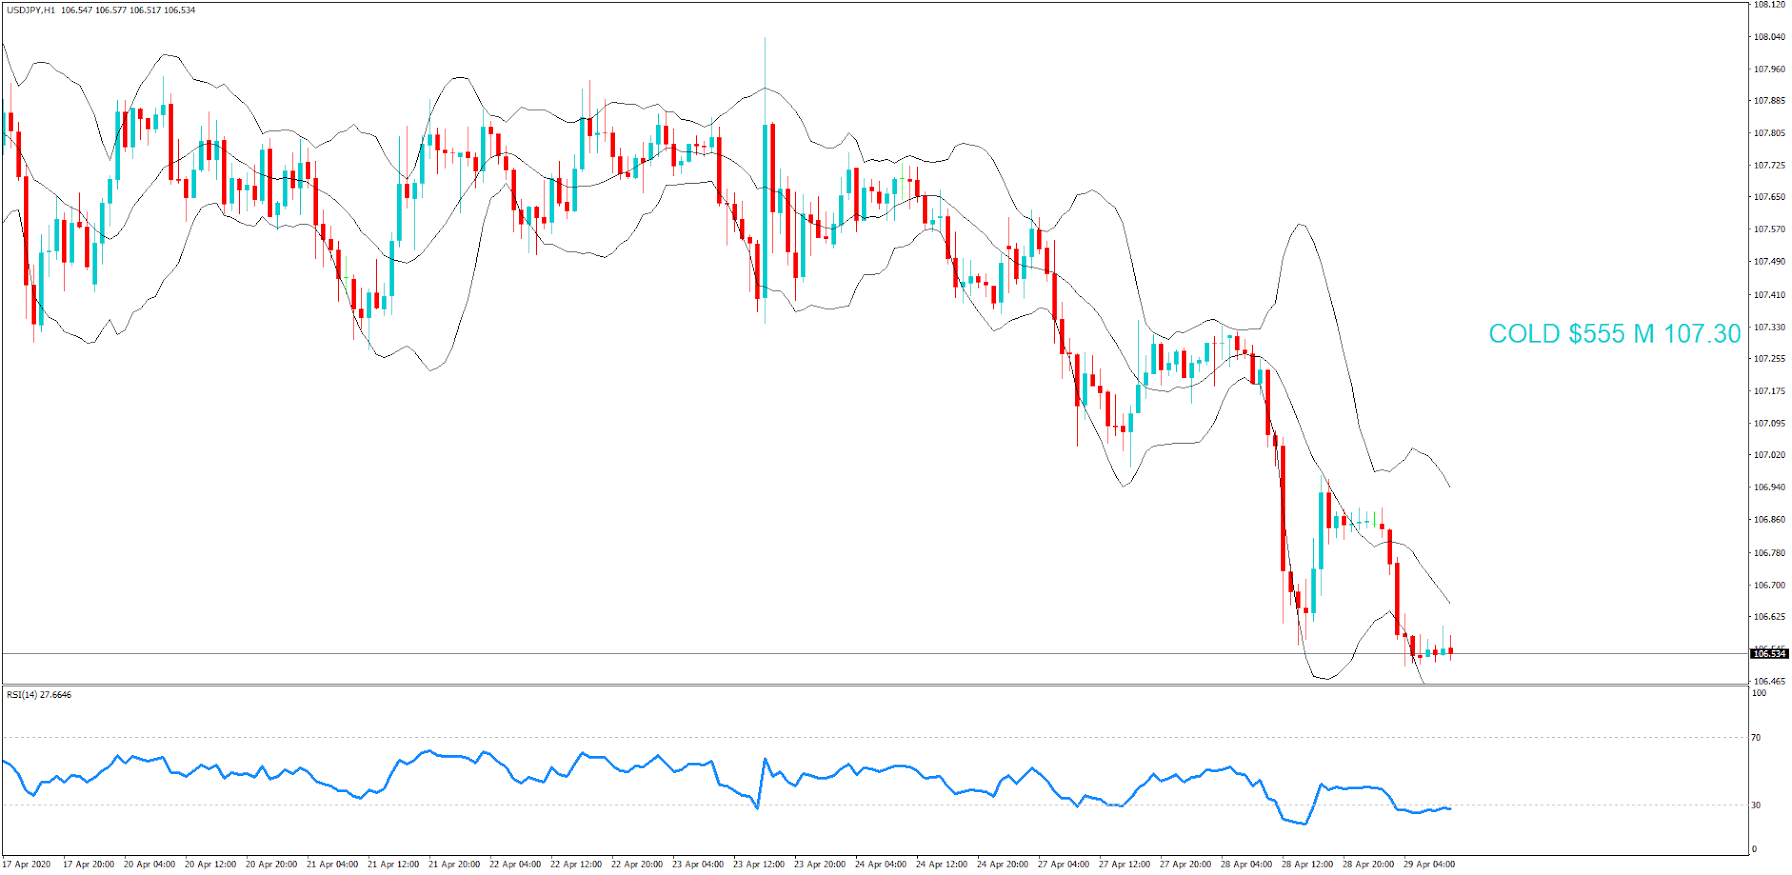
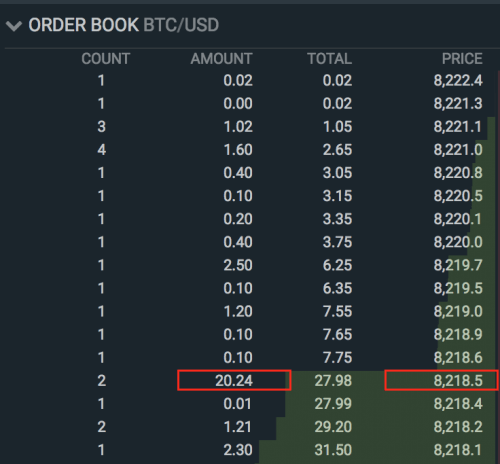
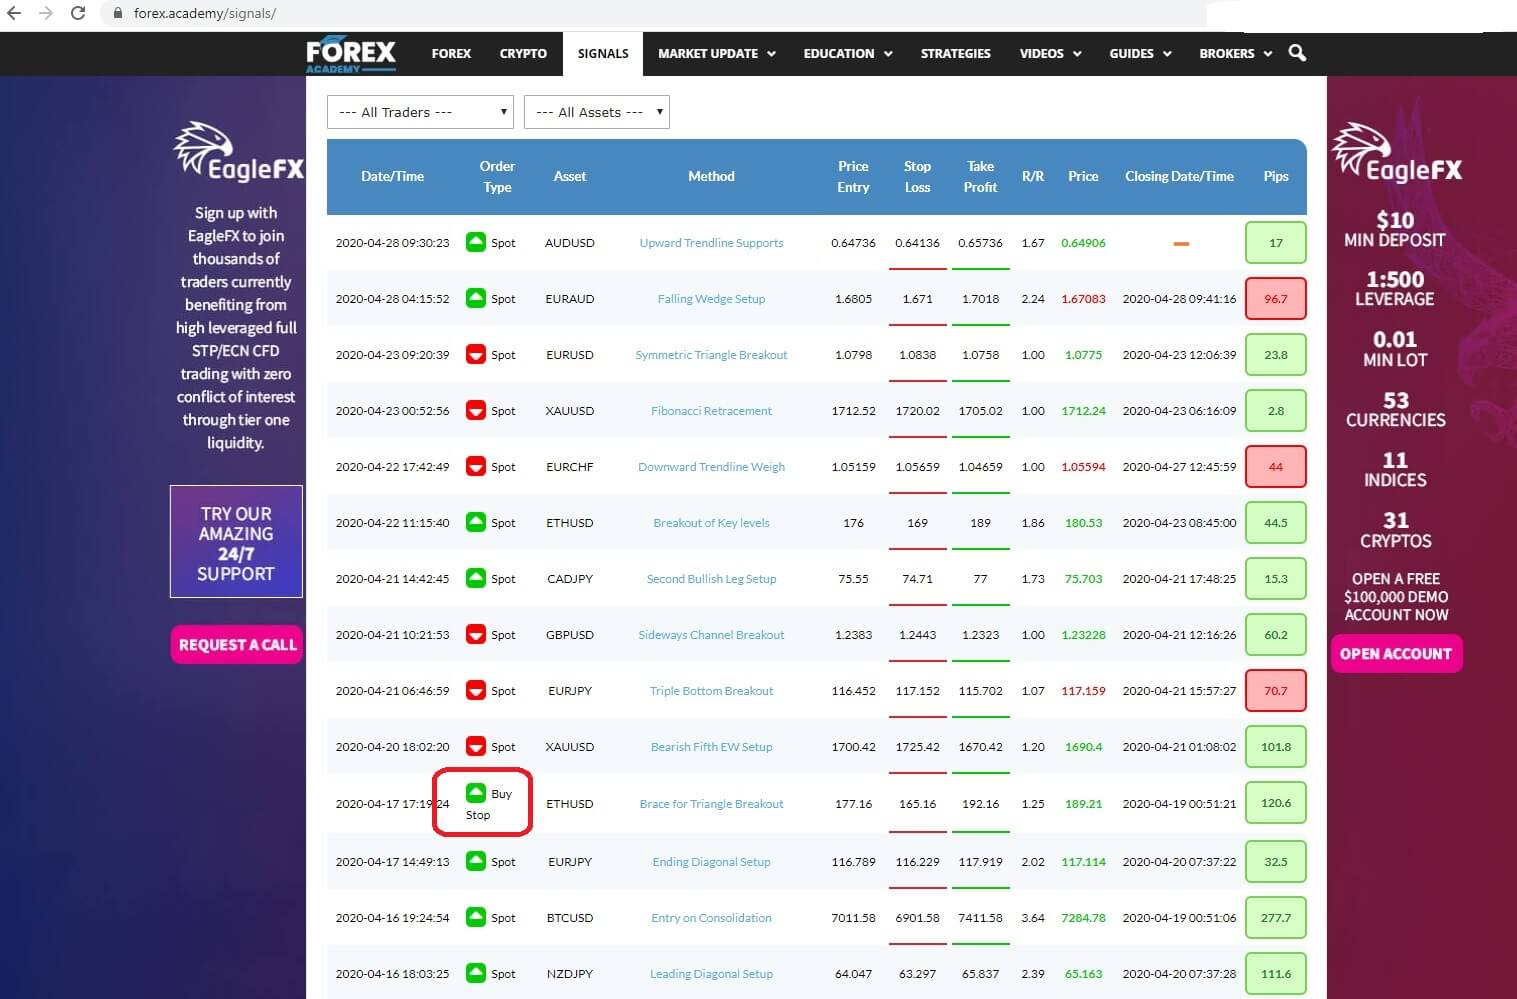
bearing in mind that if it is an instant execution you might miss a few pips unless you are monitoring the table continually. However, you would be more likely to get in at the beginning of the trade by copying pending orders such as this buy stop order.
If you would like to be notified by a free subscription service of every single trade set up, you can open up an account with eagle FX, by visiting their website www.eaglefx.com, who are our partners in this venture, and where you will benefit from high leverage and full, STP/ECN, processing which means you will have zero trading conflict with this reliable and respected broker.

Another benefit of having an account with the EagleFX is that you will also be notified automatically of key FX levels, which act as magnets for price action in the spot forex market. You can also find details of these on the forex academy website by clicking on the market update tab and scrolling down to FX options.
So, as you can see, if you are a novice trader, you have the ability to research the trade, and if you like it, you can copy them onto your own platform having confidence in the expertise of the professional trader who set the trade signal up in the first place. This will help you to grow as a trader, as you steadily learn more about trading via this unique option.
Of course, it might be that you are a seasoned trader and hence you are still happy with the methods that you find on our trade table, and perhaps you want to spend a little less time looking at setups yourself, in which case you can copy our free signals in order for you to enjoy that lifestyle choice.

Please also keep an eye out for the relevant marketplace for ‘Signal Academy’ Android and IOS trading signals apps, which we are developing and which will be available to download soon.

Categories
Crypto Videos

CRYPTO! How To Read An Order book!

How to read an Order Book – Cryptocurrency edition

An order book is a tool that visualizes the real-time list of orders for a particular asset, including buyers and sellers. By properly reading an order book, one has the option to assess the supply and demand.
While all order books have the same purpose, they can vary in appearance slightly from exchange to exchange. However, they all have the same features and functions.

Order Book – essentials

Every trader that strives to be profitable has to become comfortable with reading order books. In order to do that, they have to understand the concepts of bid, ask, price, and amount. This information is displayed for both the buy-side and the sell-side.

Price and Amount

Although the buy and sell sides display opposing information, the sheer concept of amount and price are relevant to both sides. The amount and price per order are displaying total units of a cryptocurrency at certain prices.
The example below shows an open buy order at the amount of 20.24 and a price of $8218.50.
Looking at the cumulative orders can improve trading, as you can see the total amount of cryptocurrency orders, as well as their prices.

The Buy-Side

The buy-side represents all open buy orders that are listed below the last traded price. The last traded price is also known as the “bid.” It shows the trader’s interest in a certain amount of cryptocurrency at a certain price.
Once the bid matches with an appropriate sell order, the trade happens.
When a high concentration of buy orders form at a specific price level, traders recognize it as the buy wall.

Buy walls affect the price of a cryptocurrency because the price cannot go lower due to the high demand at a higher price. Buy walls act as short-term support levels.

The Sell-Side
On the other side, we have the sell-side that contains all open sell orders that are above the last traded price. This price is also known as the “ask.” The sell wall is formed when there is a concentration of sell orders at a specific price level. The sell wall acts as a short-term resistance level.

Conclusion
The order book gives a trader a great opportunity of making more informed decisions that are based on the buy and sell interest for a particular cryptocurrency.
It provides a deep outlook into the live-action supply and demand, therefore revealing order imbalances, market manipulation as well as support/resistance zones.

Categories
Forex Signals Forex Videos

The Free Forex Academy Signal Service! Over £18,000 made already!

How You Can Make Money Using Forex.Academy’s Free Trading Signals Service – PART 1

The Forex.Academy’s Free Trading Signals Service. What is it and how can it help you?

Forex.Academy has recently launched its free trading signals service which can be found under
the Signals tab on the Forex.academy website.


The webpage lists many open and pending orders relating to trades in several assets, from currency pairs, gold, and bitcoin.


And the trades are managed by professional traders, some who have come from an institutional background, having trading with institutional size deal tickets running into $ billions. Biographies of each trader will be added to the technical analysis for every trade and you will be able to access this information to help you decide which trades to copy. You wont be disappointed. These guys really know their stuff.


Each individual trade is listed on the table, and comprises of several components parts, including: Insert 1: 
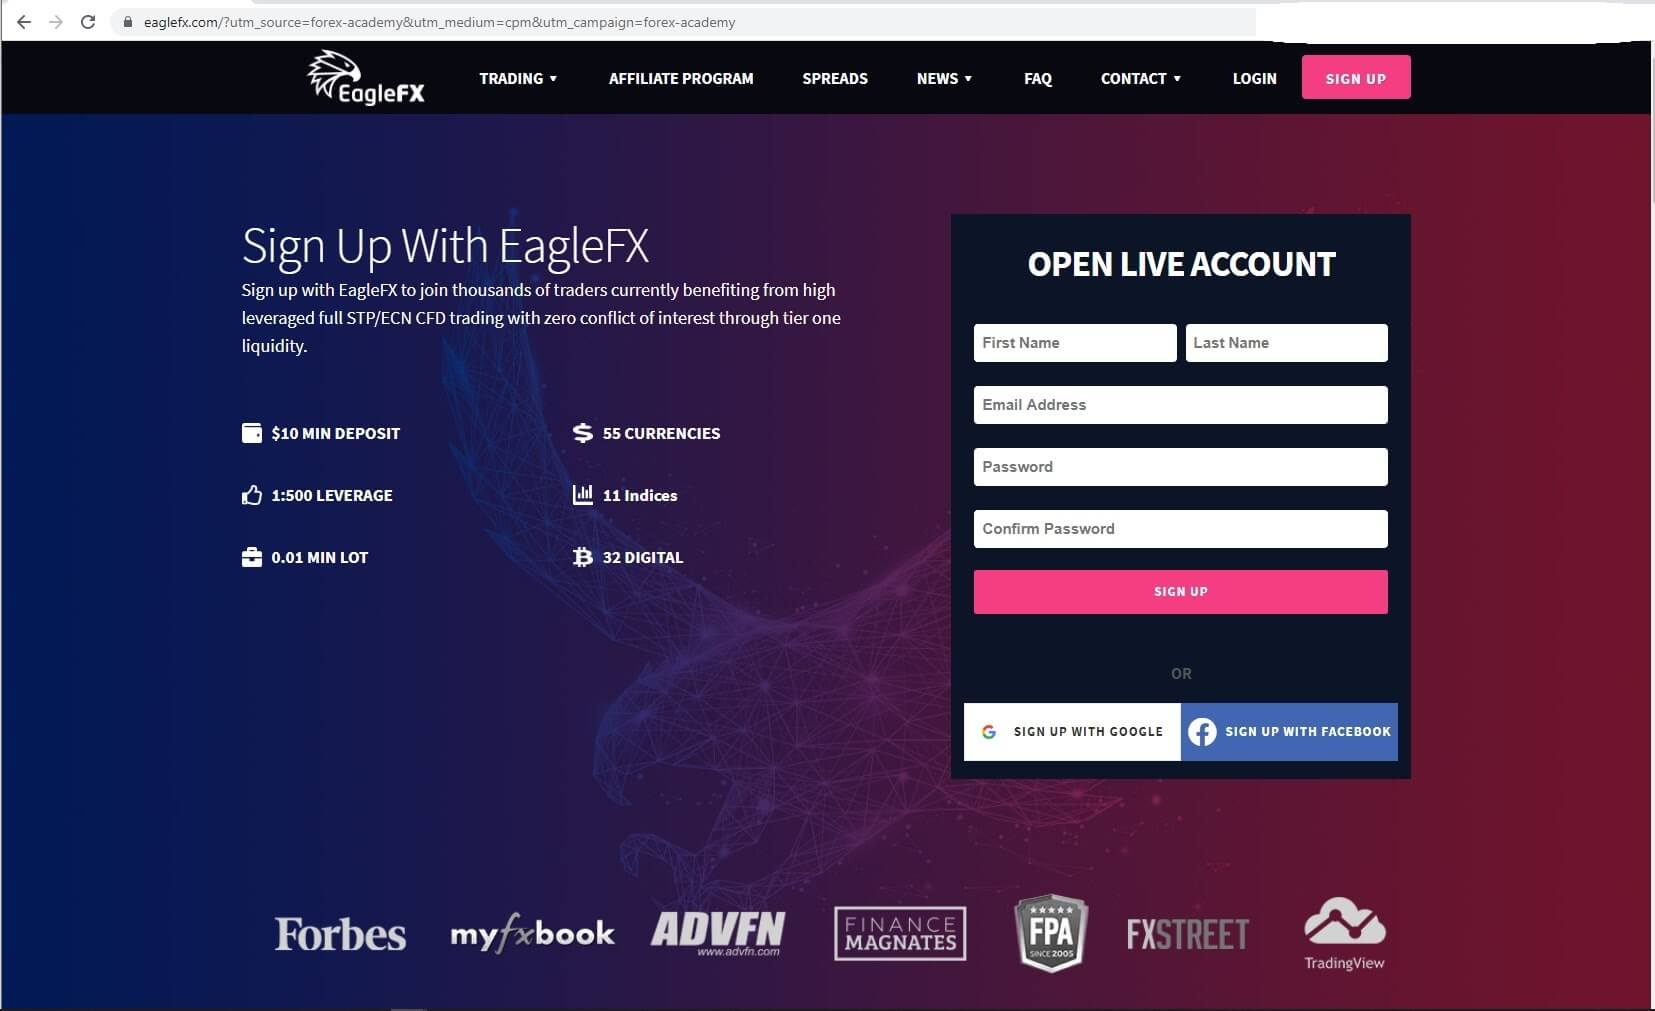
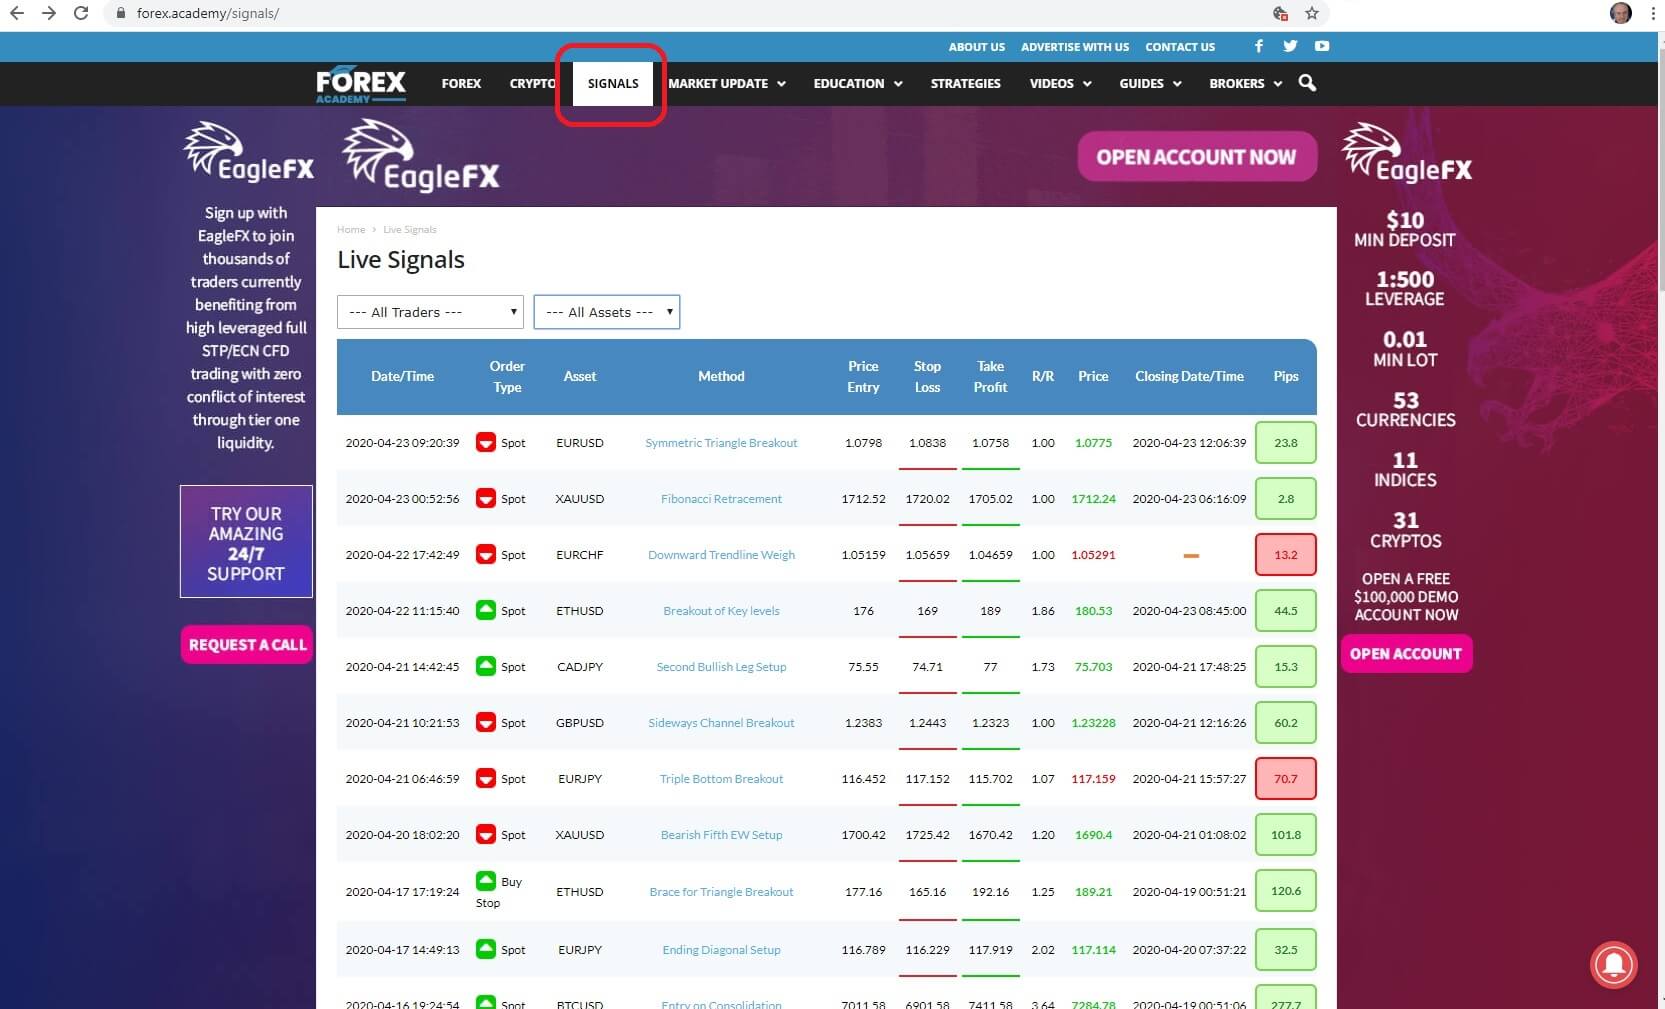
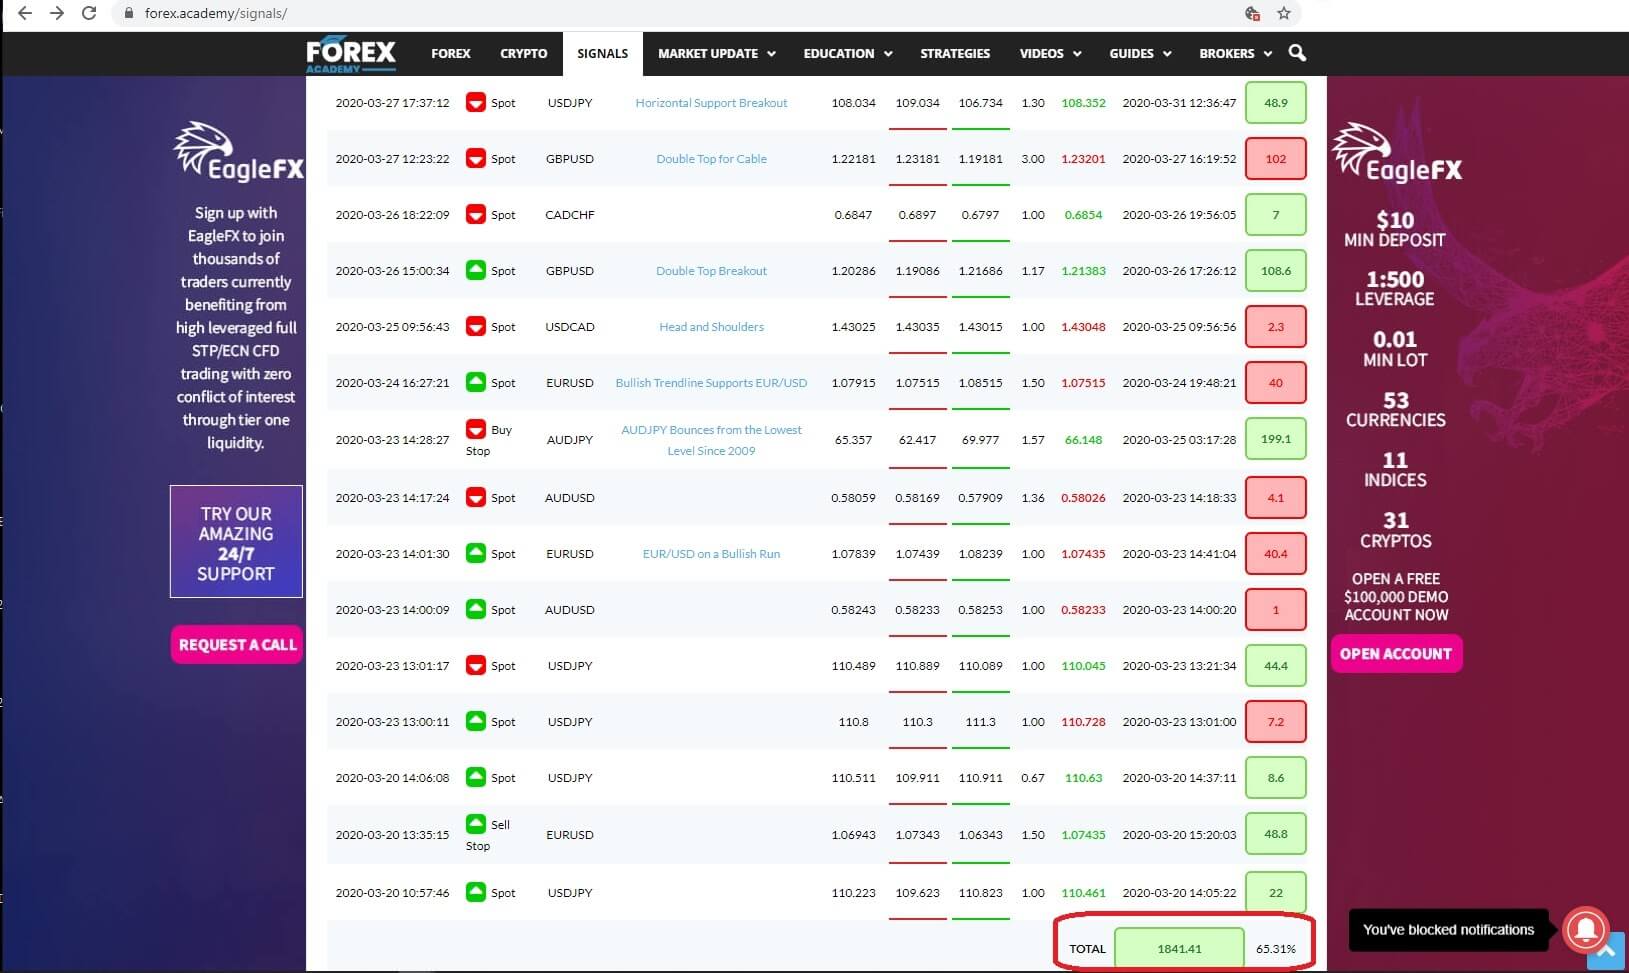
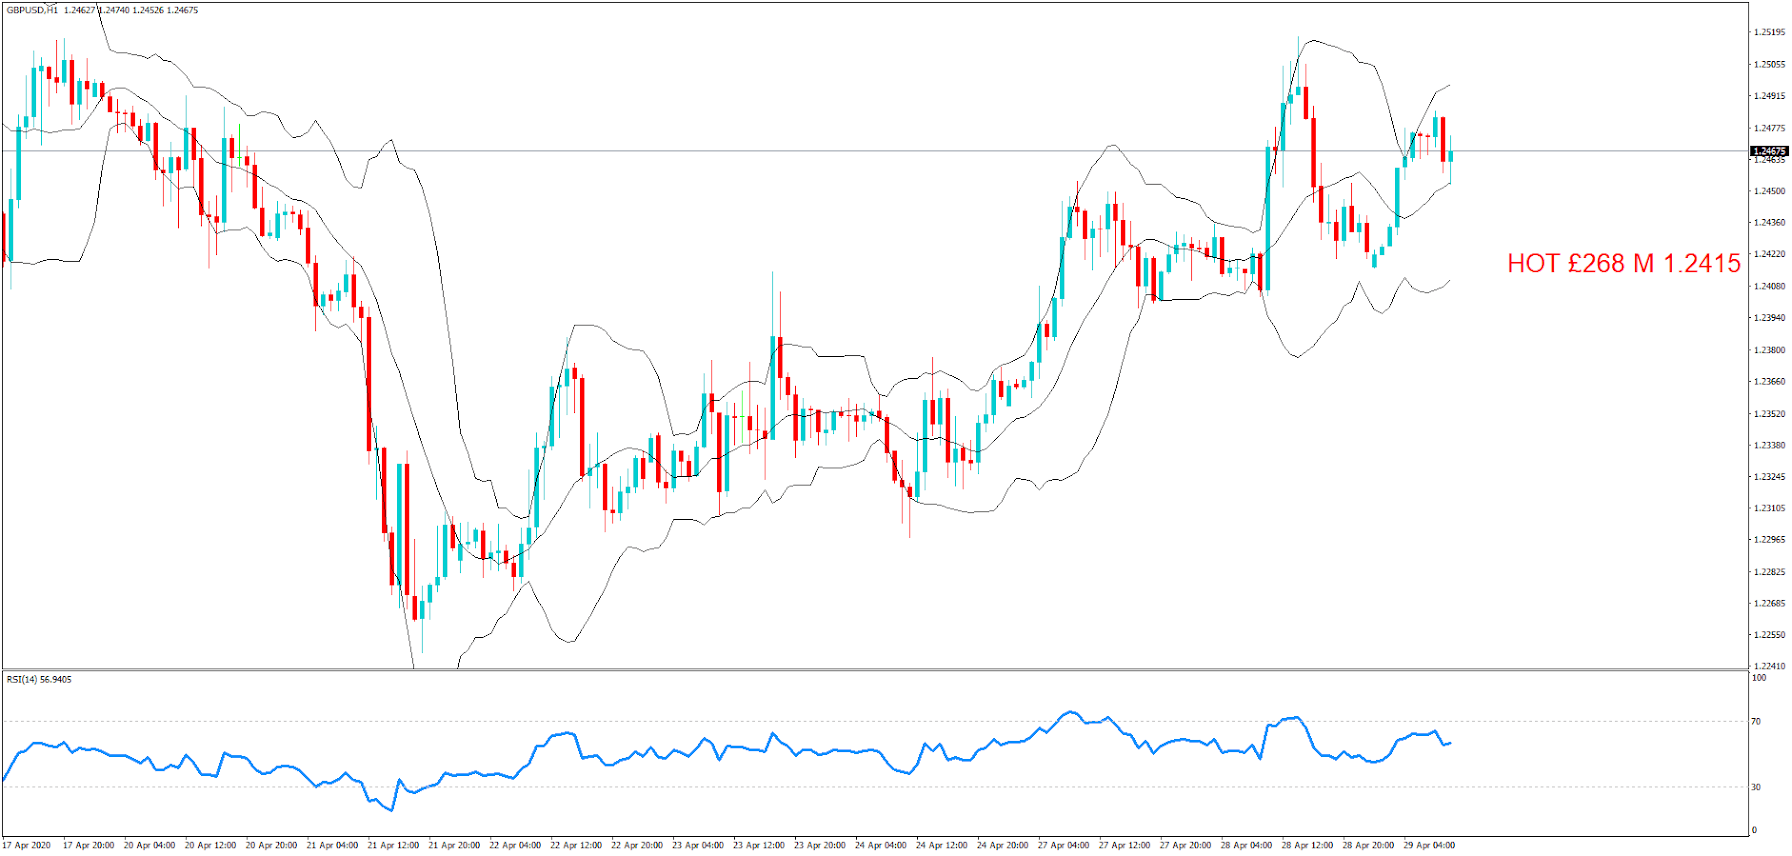
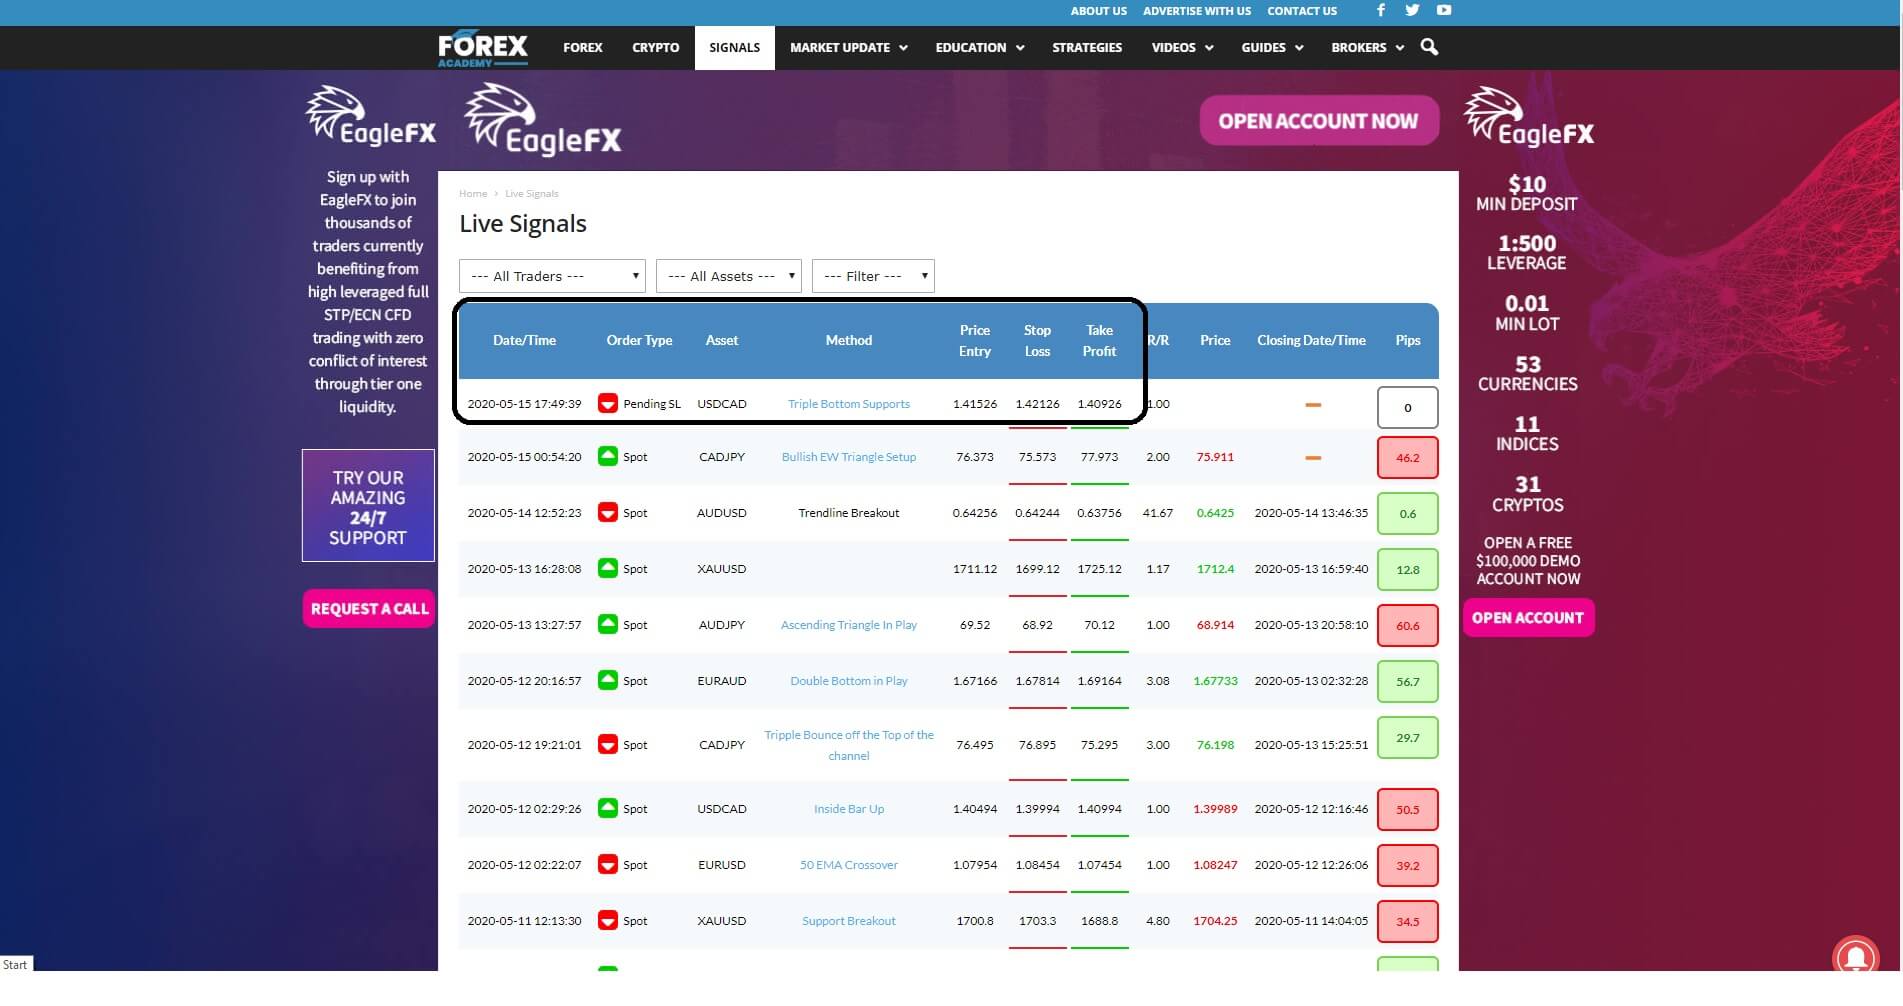
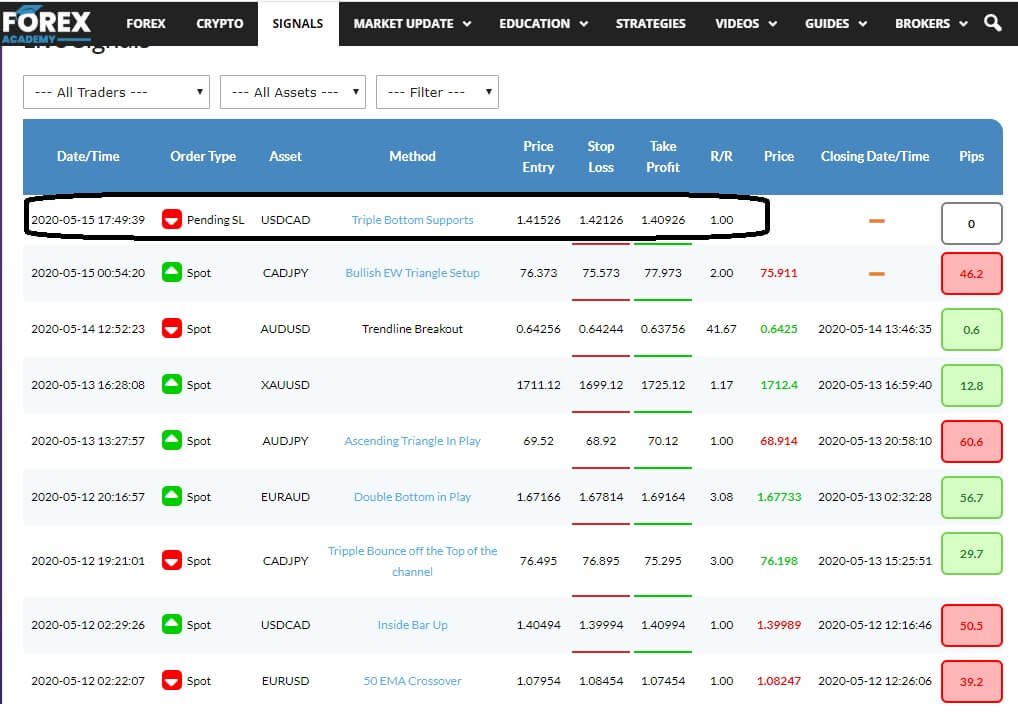
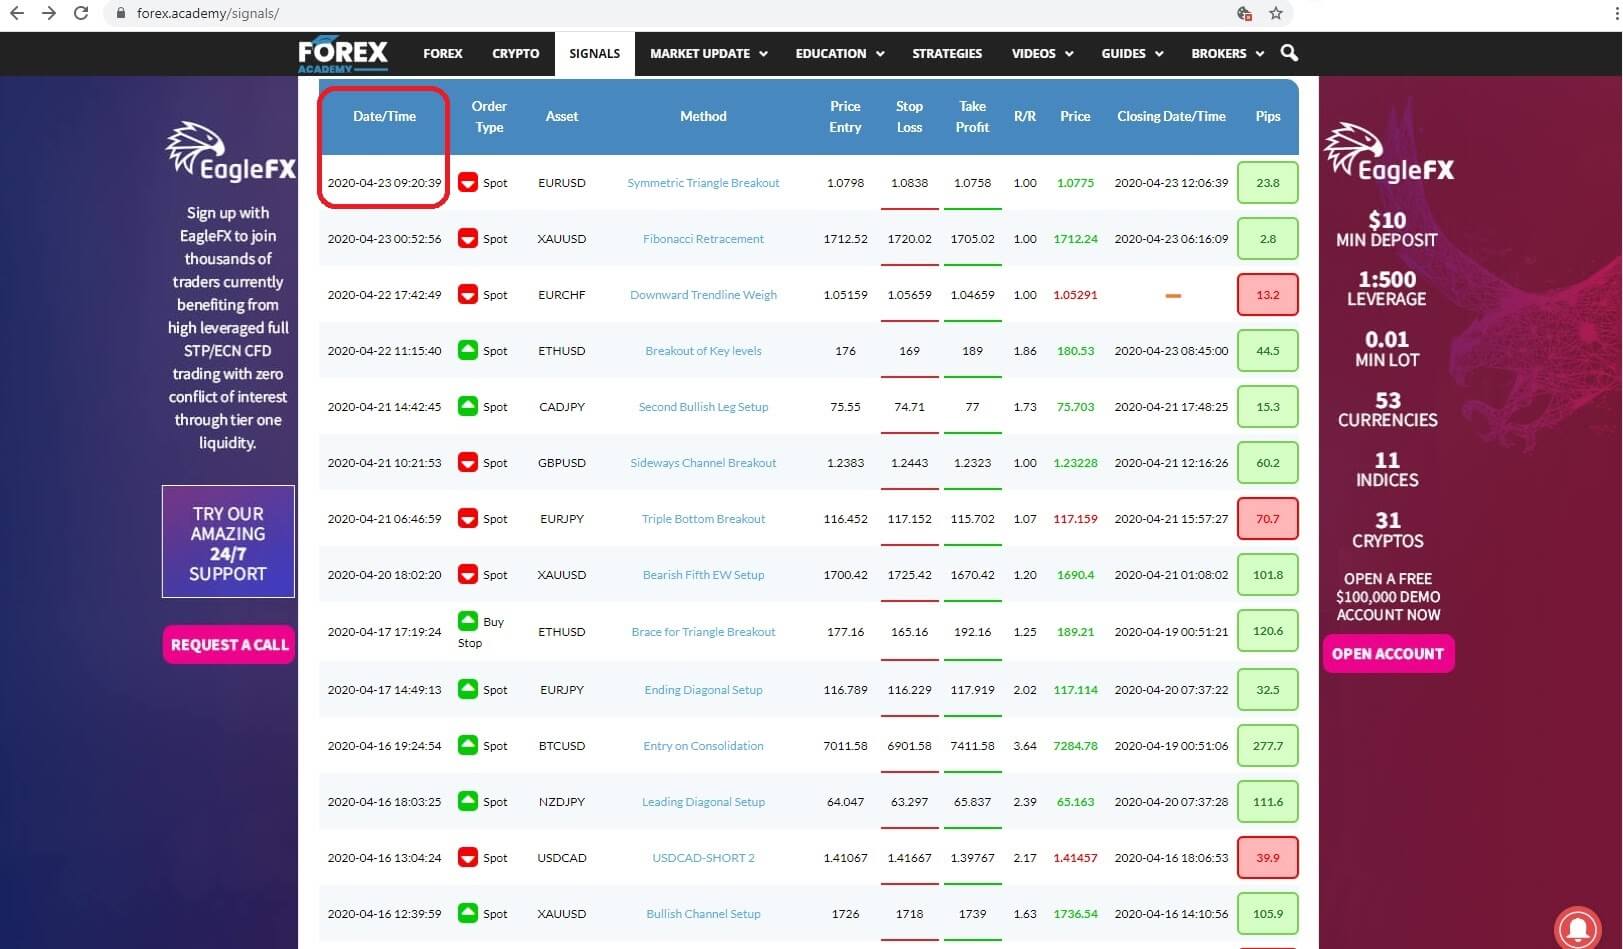
The date the trade was listed: Insert 2: 
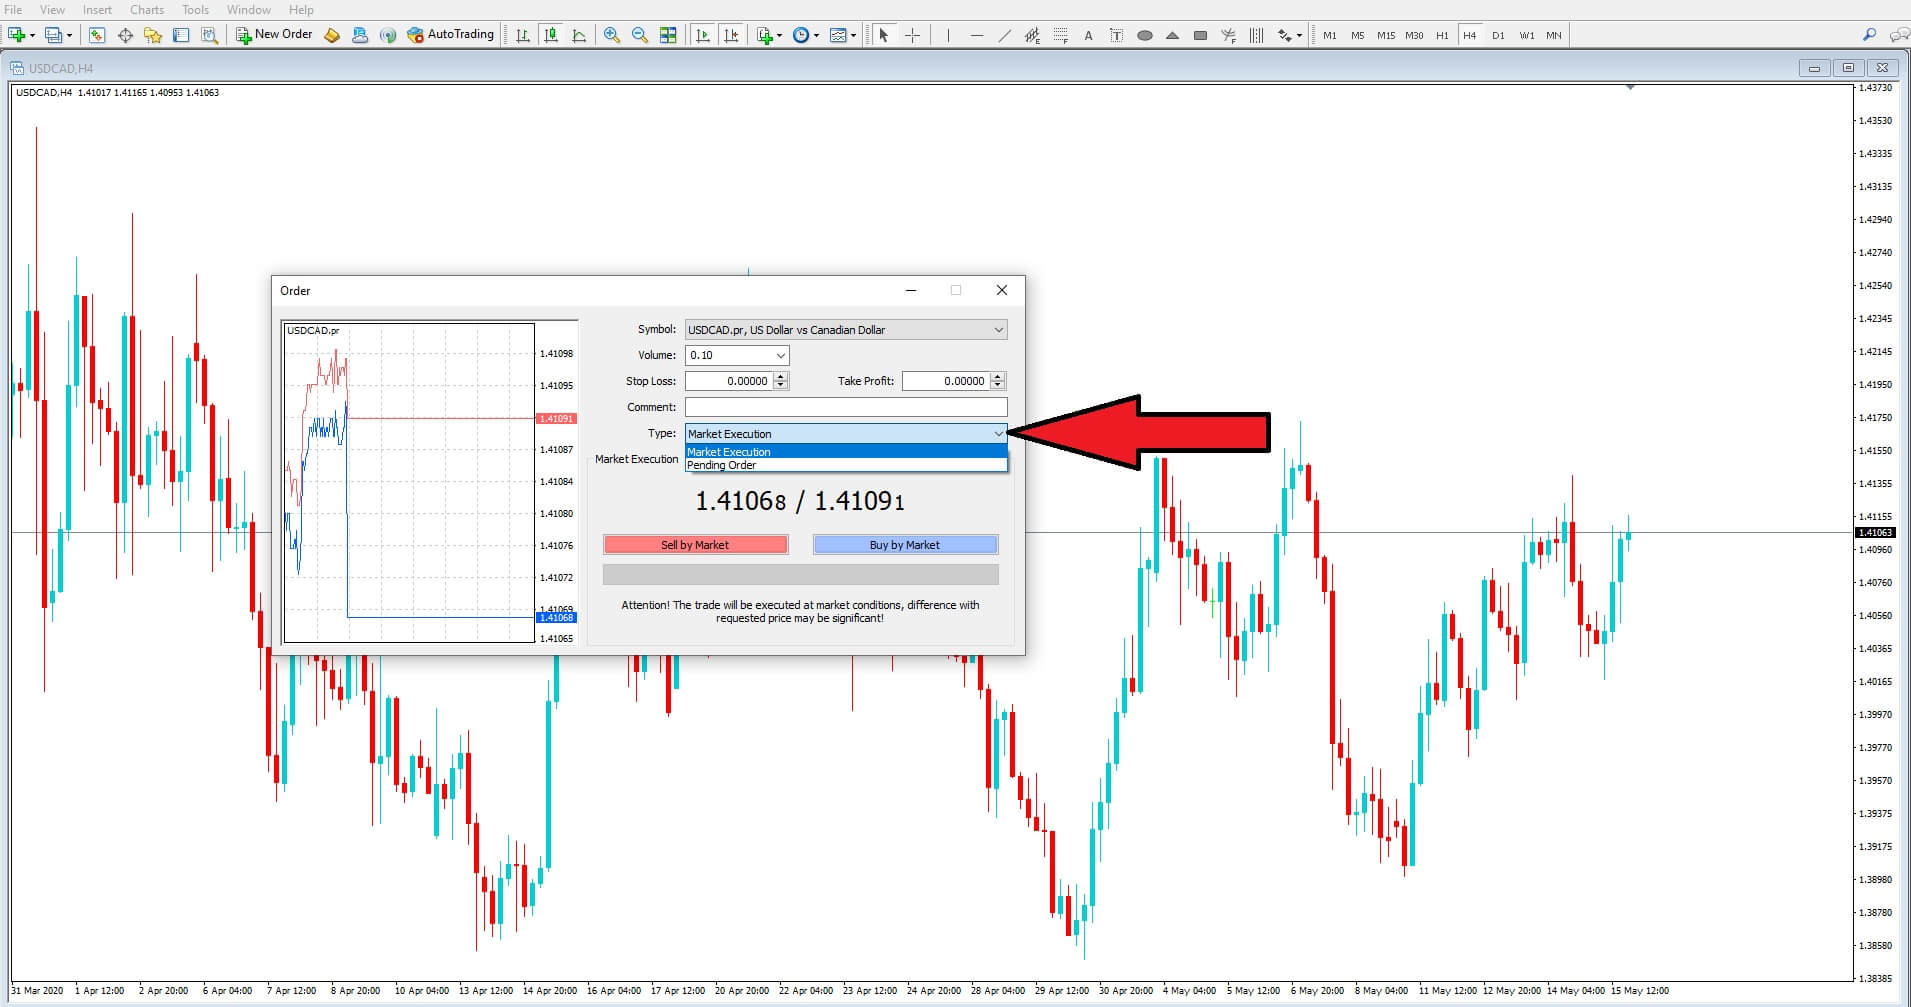
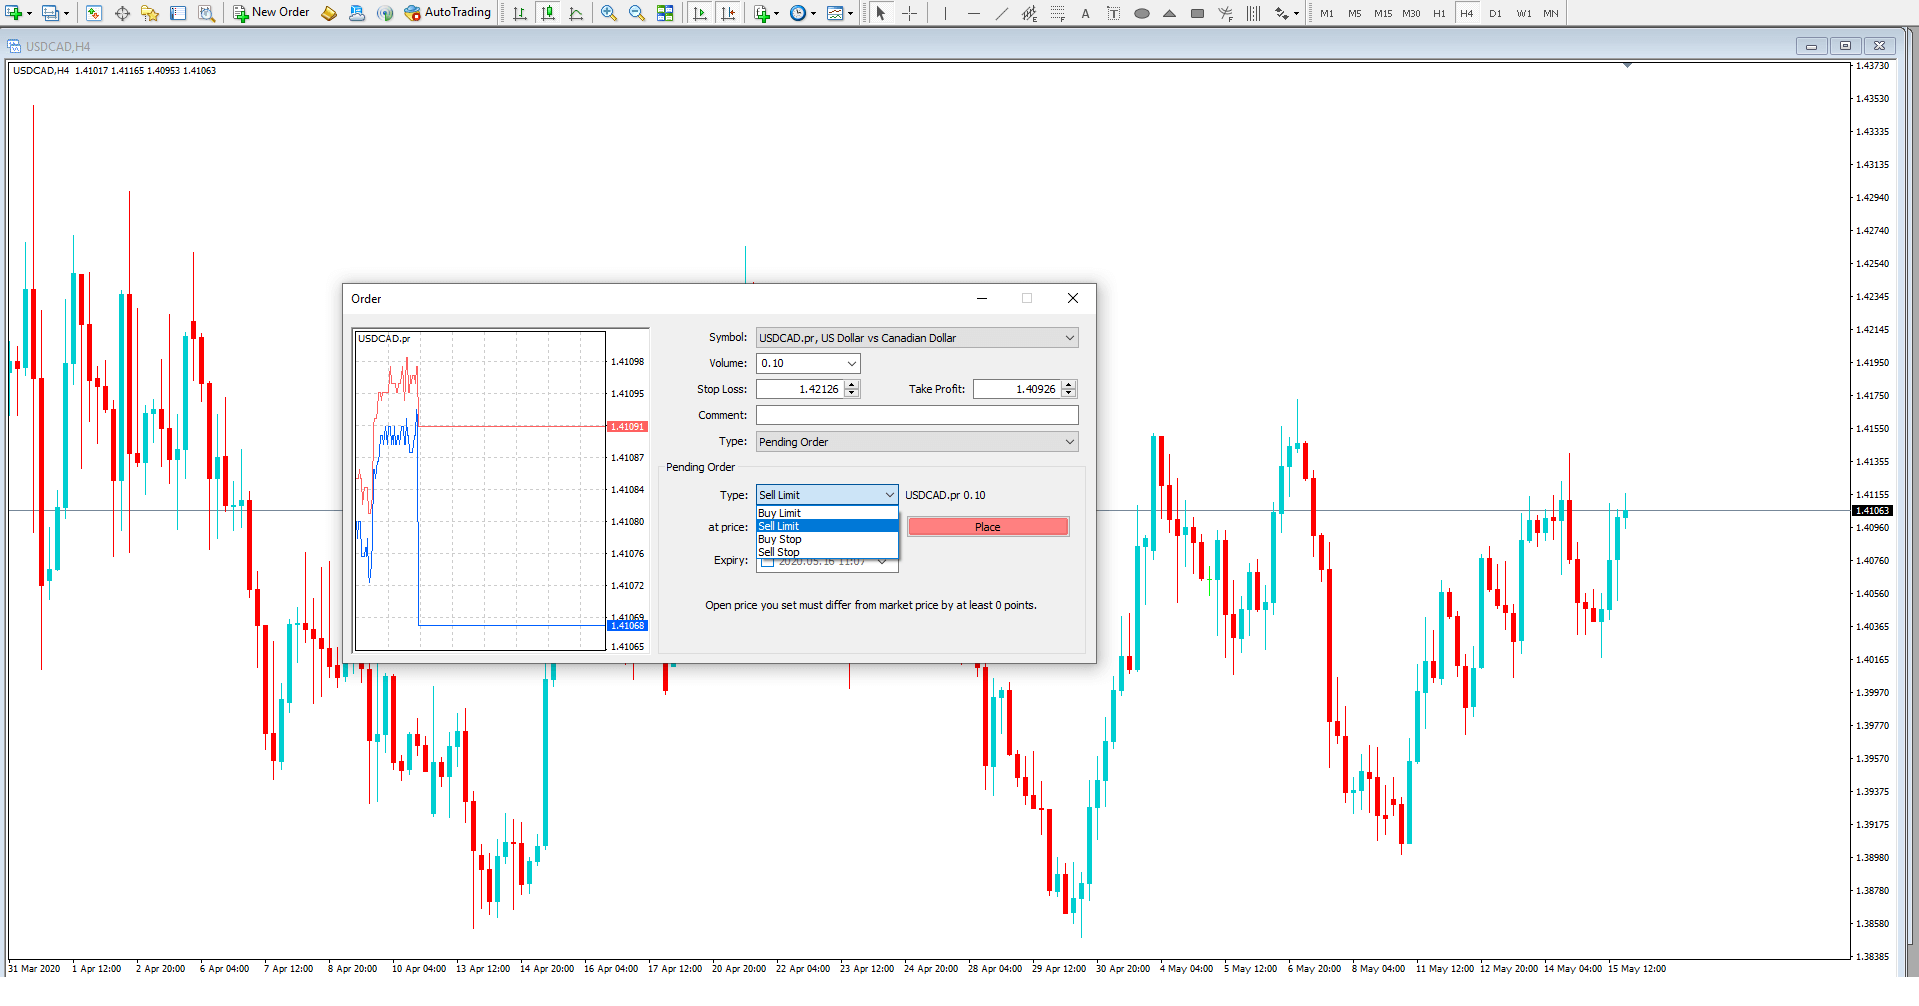
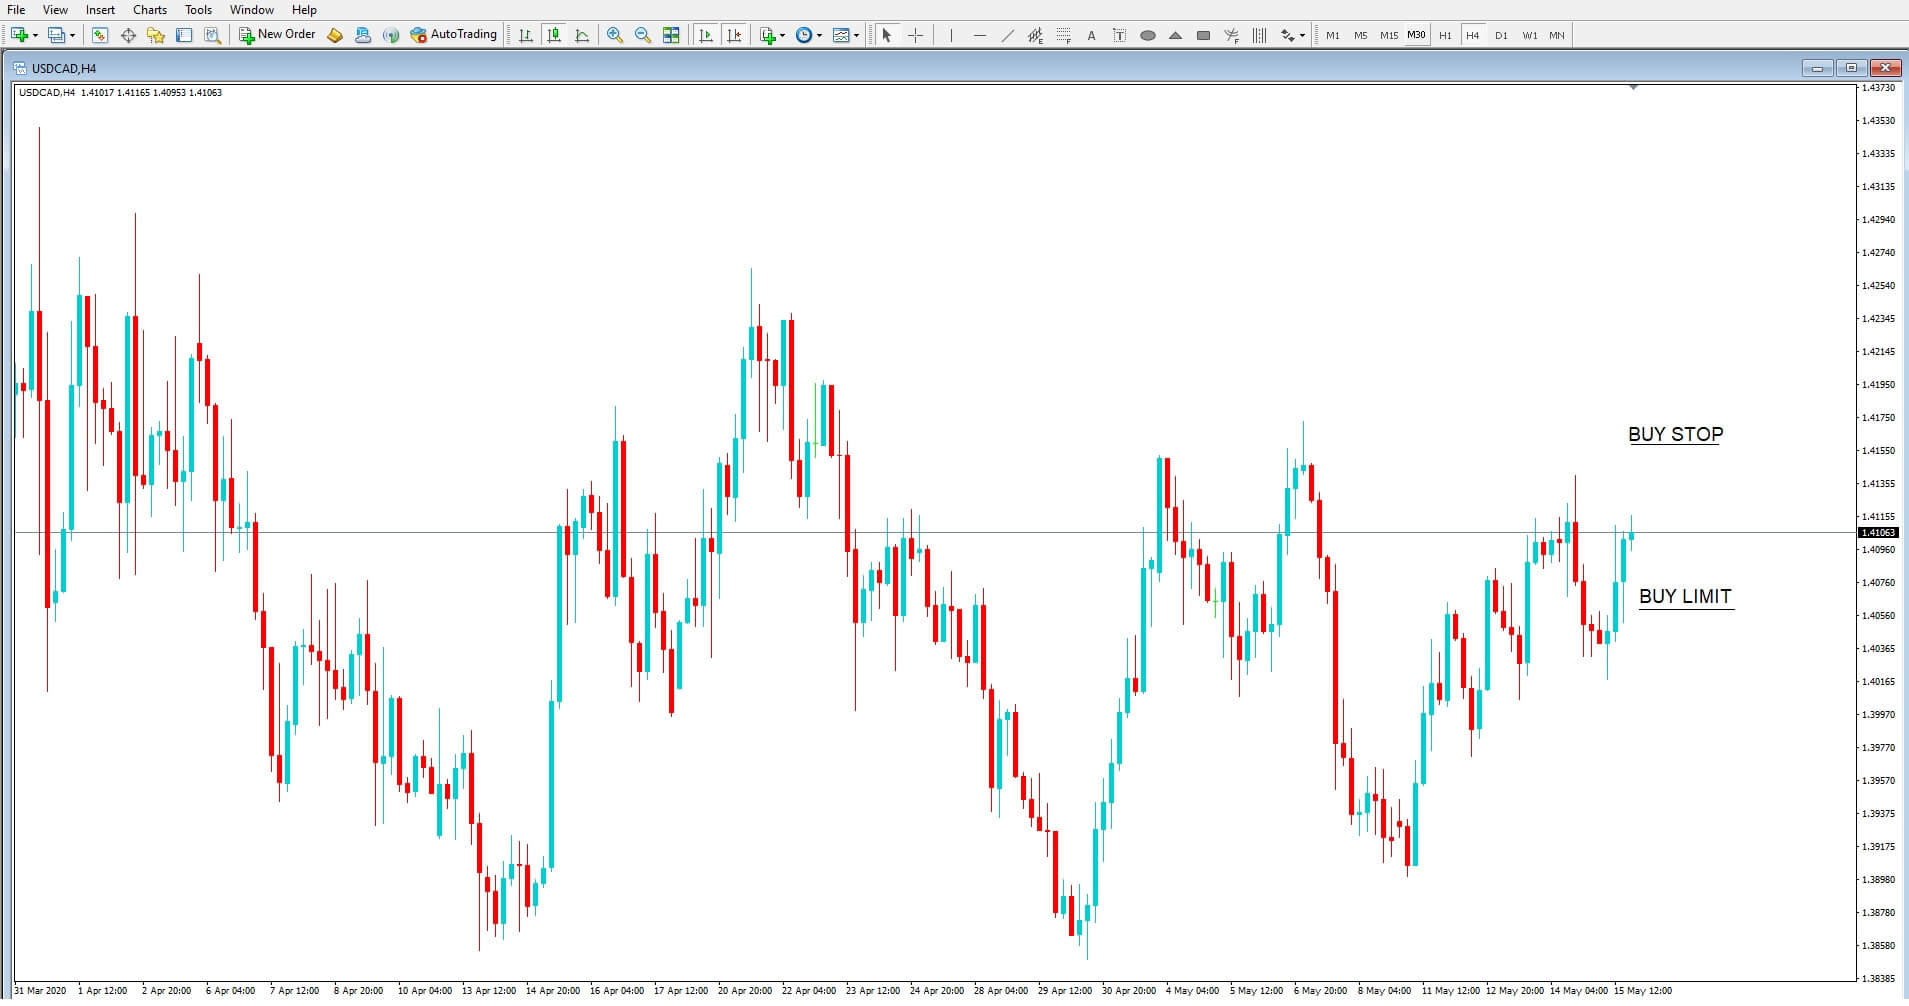
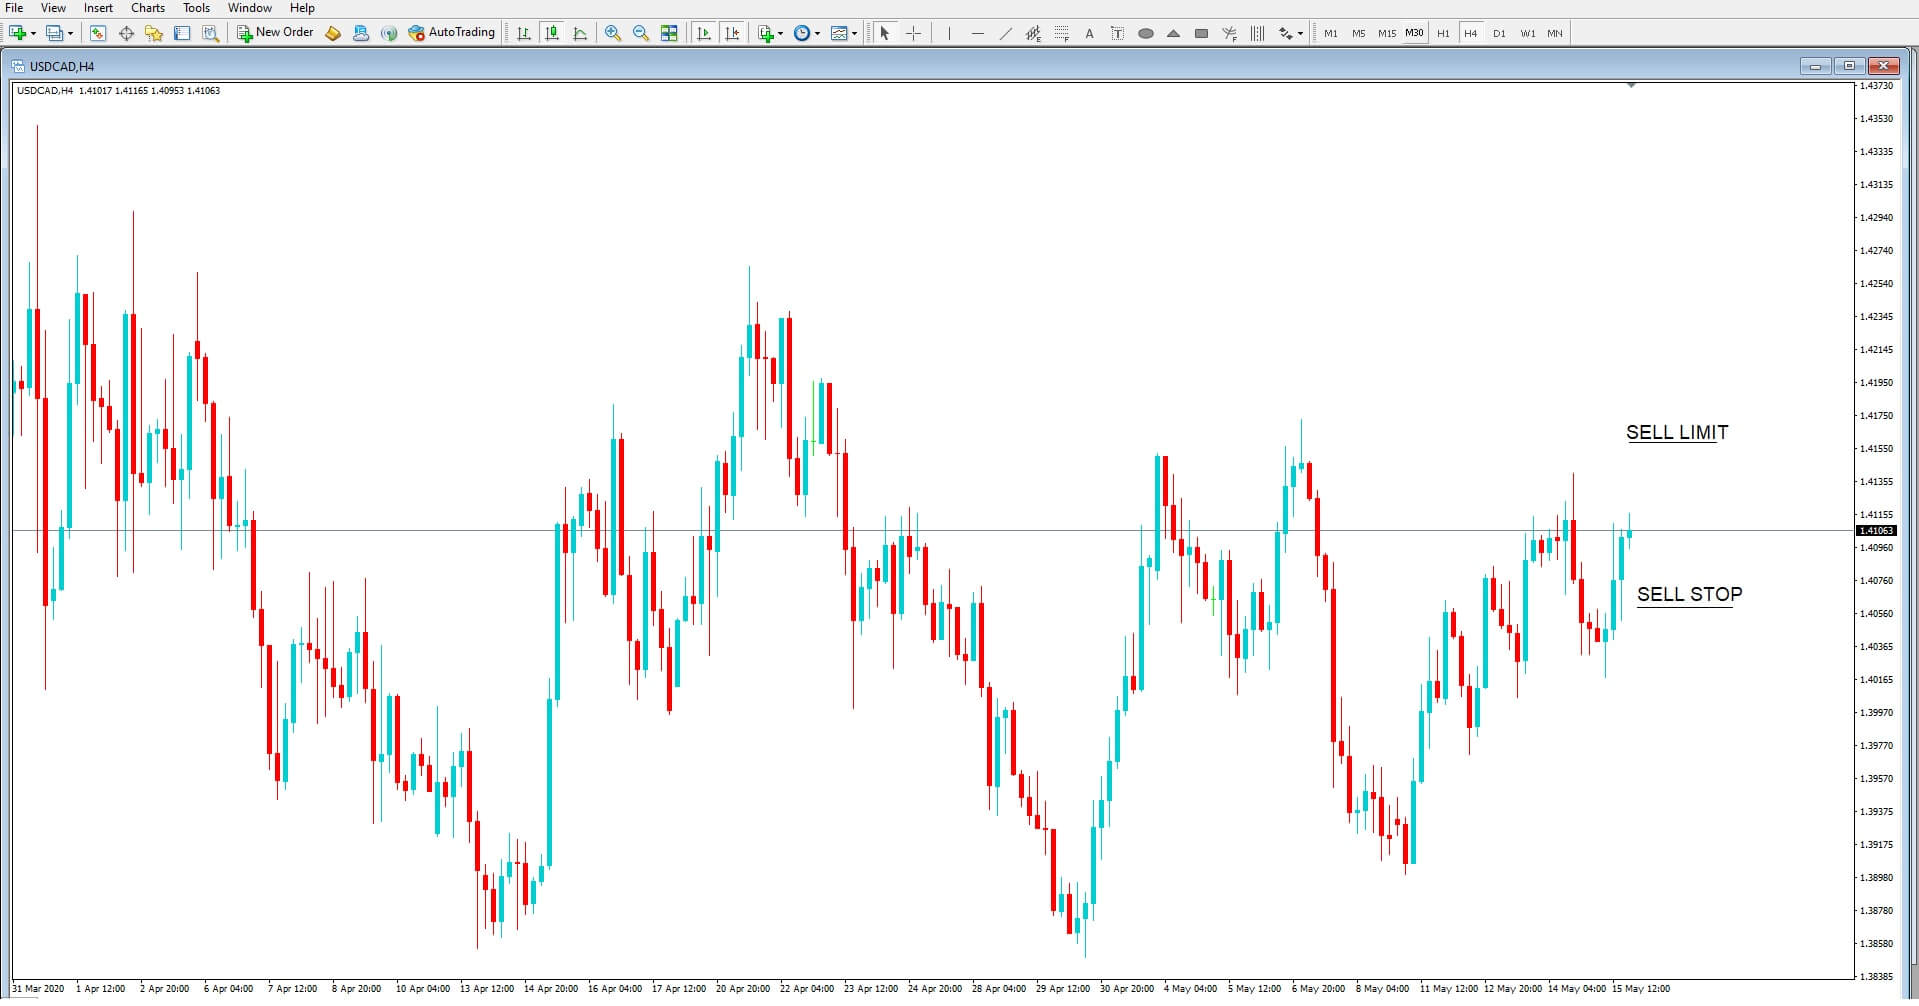
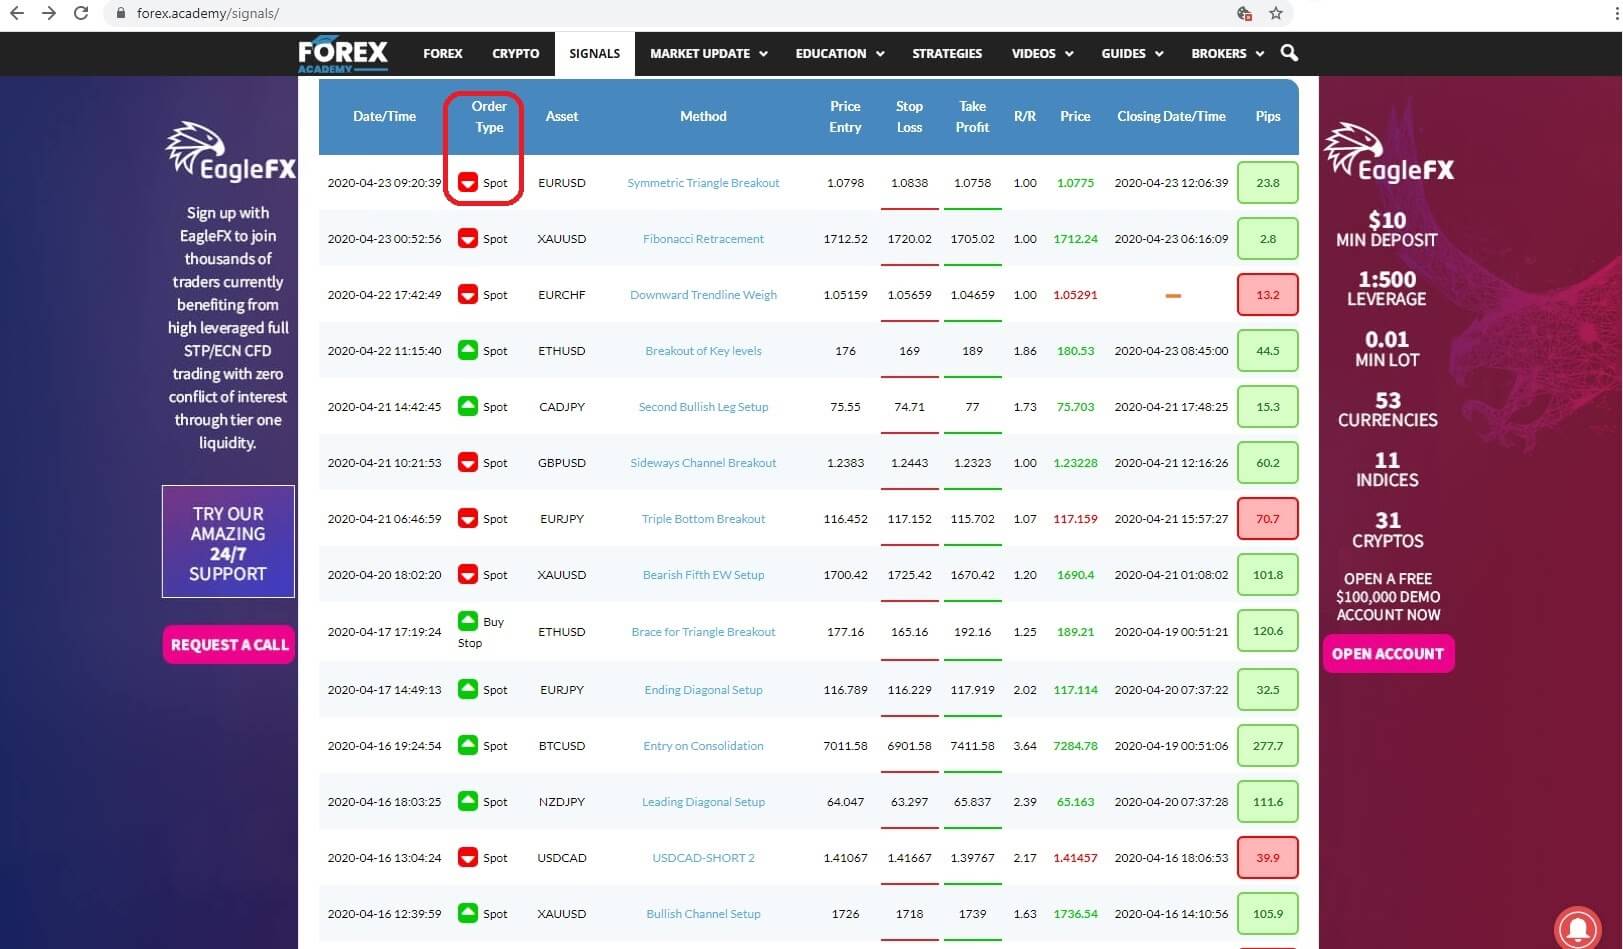
The type of order, which could be an instant execution, or spot trade, or a limit order including a buy limit or stop buy order or a sell limit or stop sell order, Insert 3: 
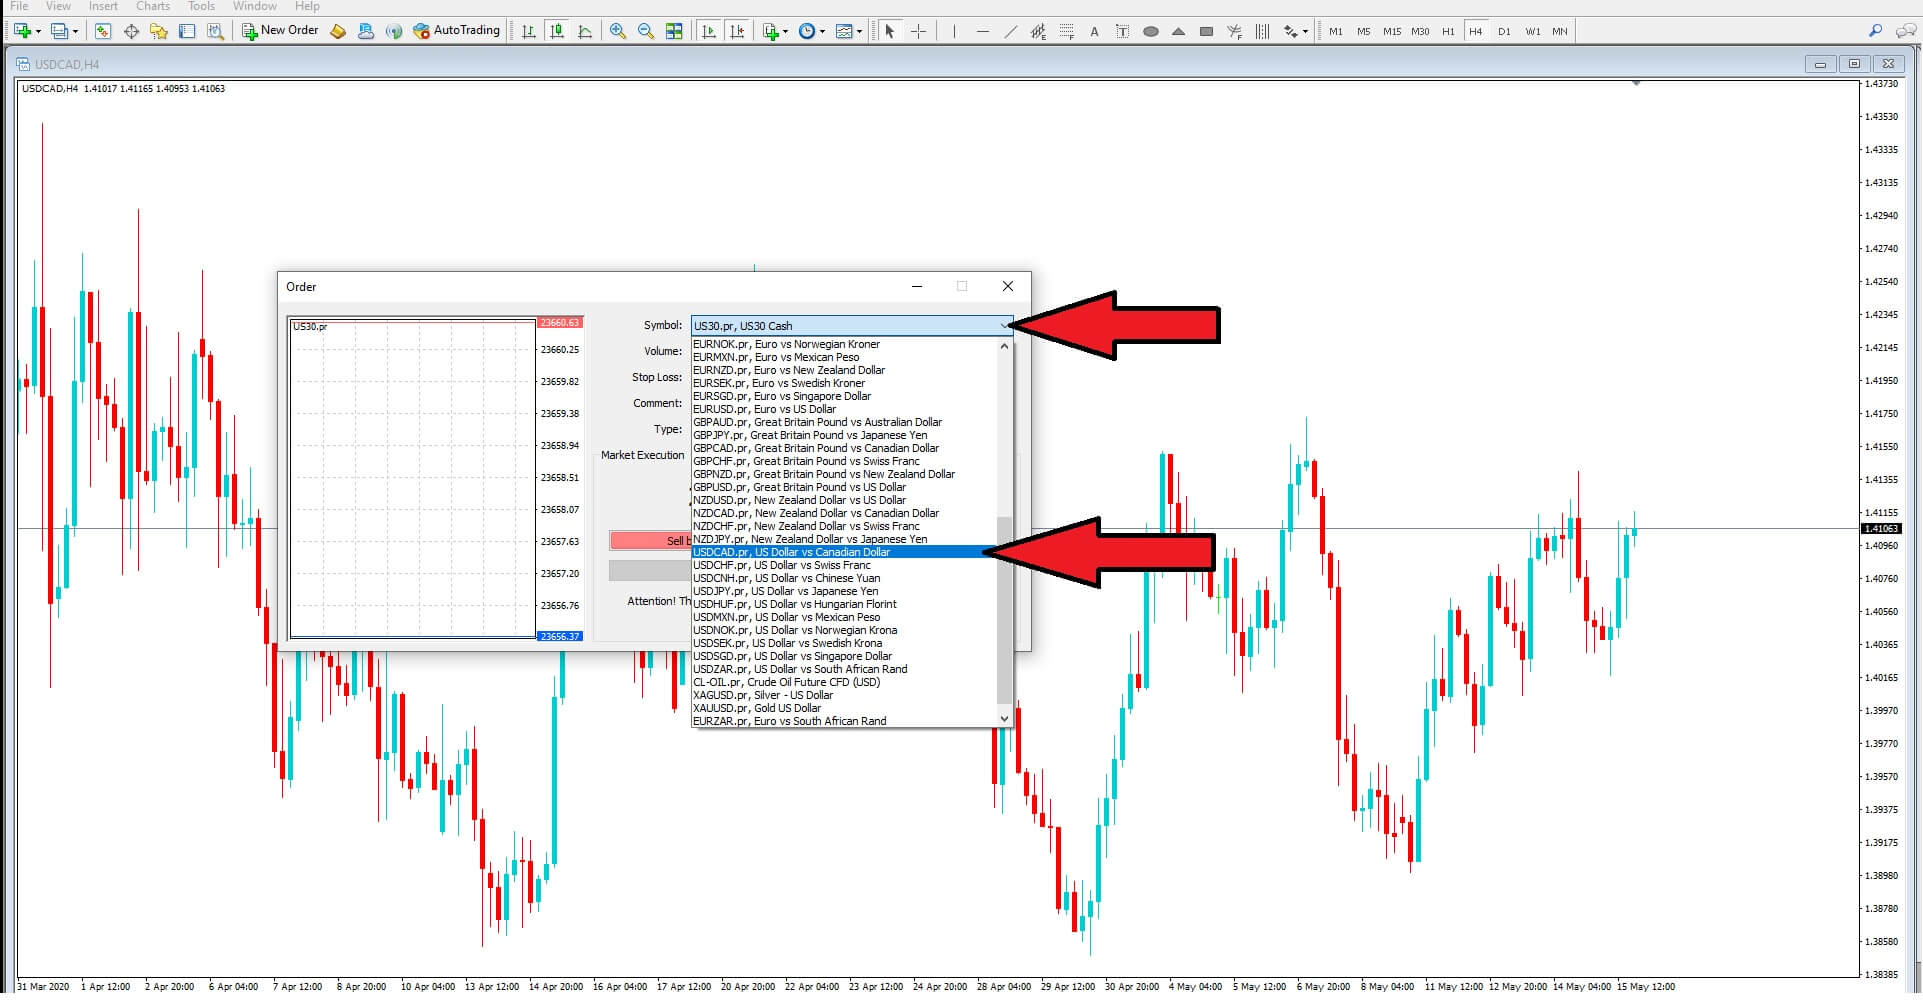
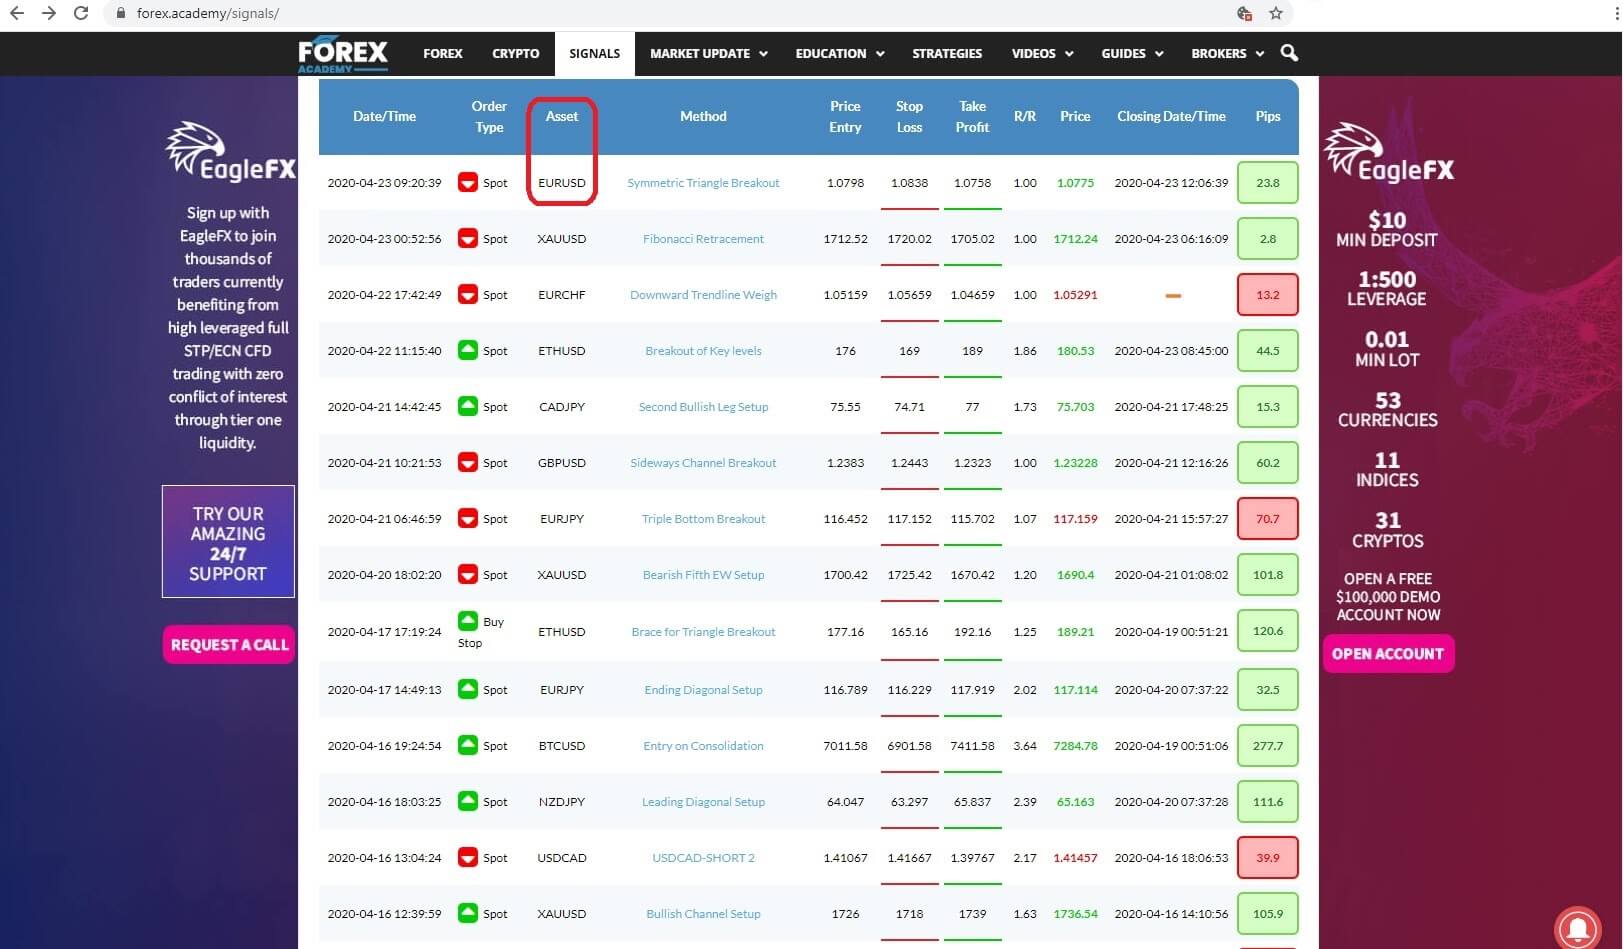
the type of asset, which could be a number of major or cross FX pairs and gold and bitcoin. Insert 4: 
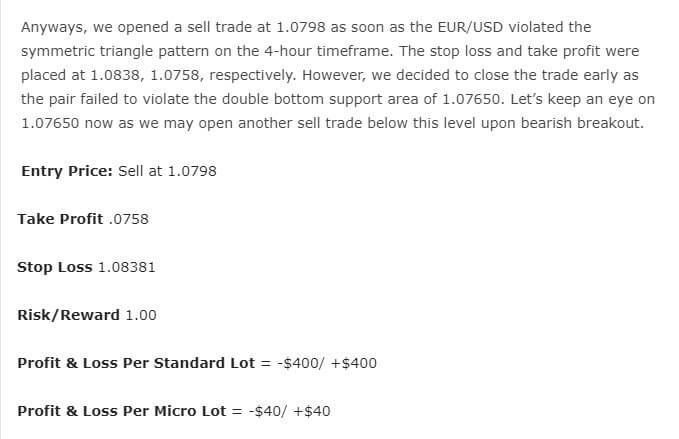
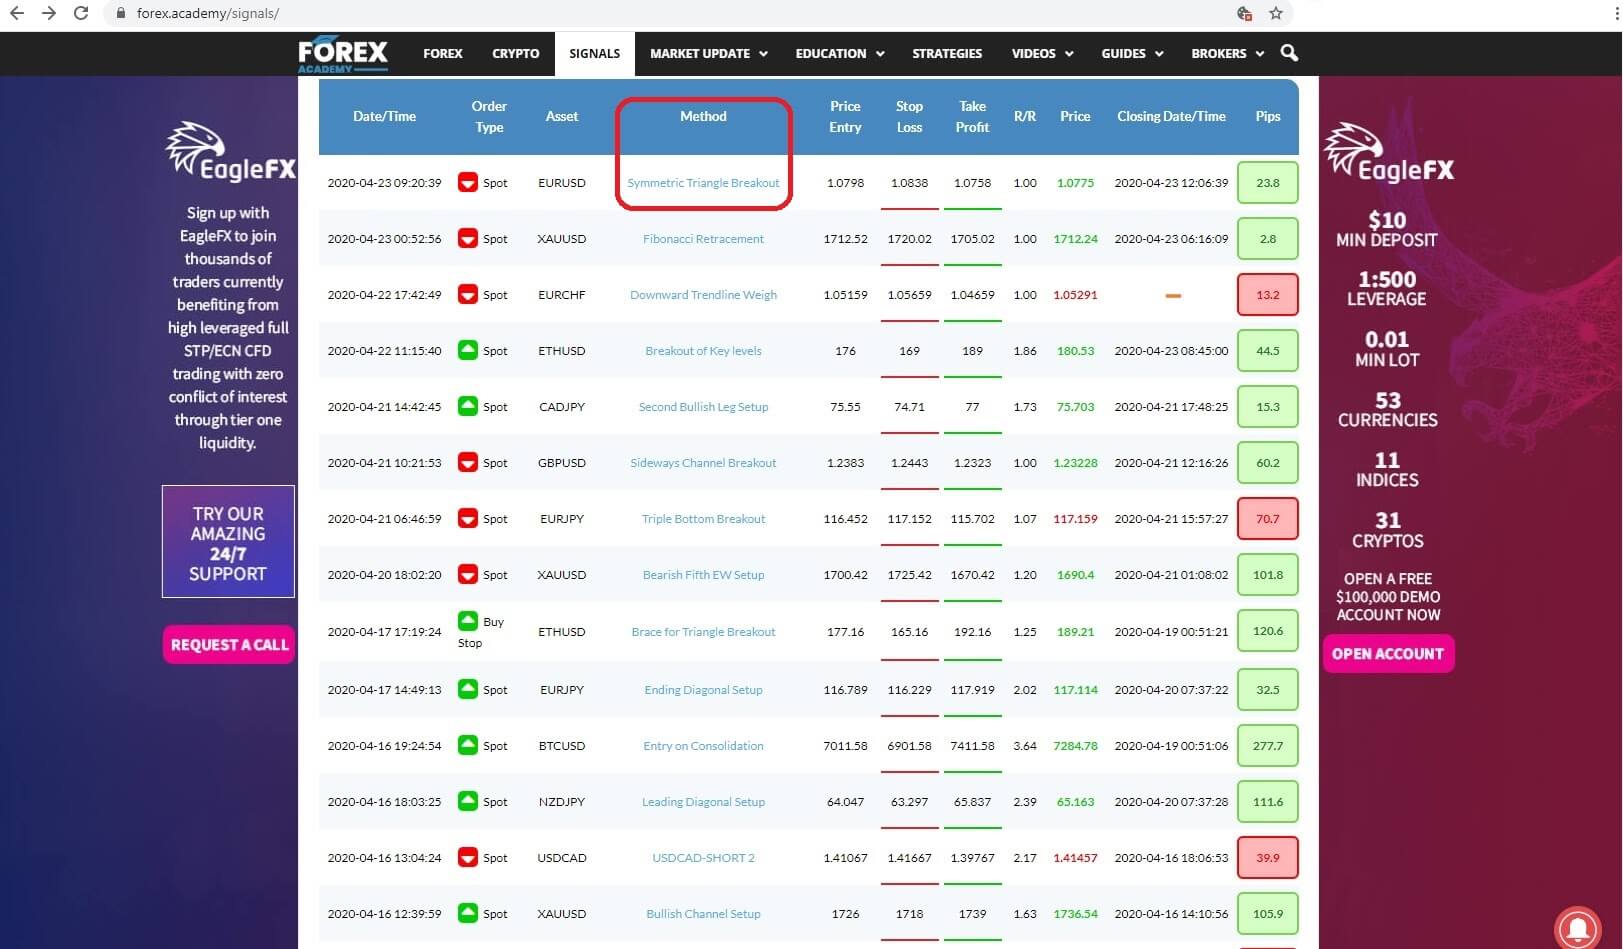
the method where the each trader gives a detailed analysis of the thinking behind each trade, which, incidentally, most other signal providers do not offer, and where we will come back later in this video to take a more detailed look, Insert 5: 
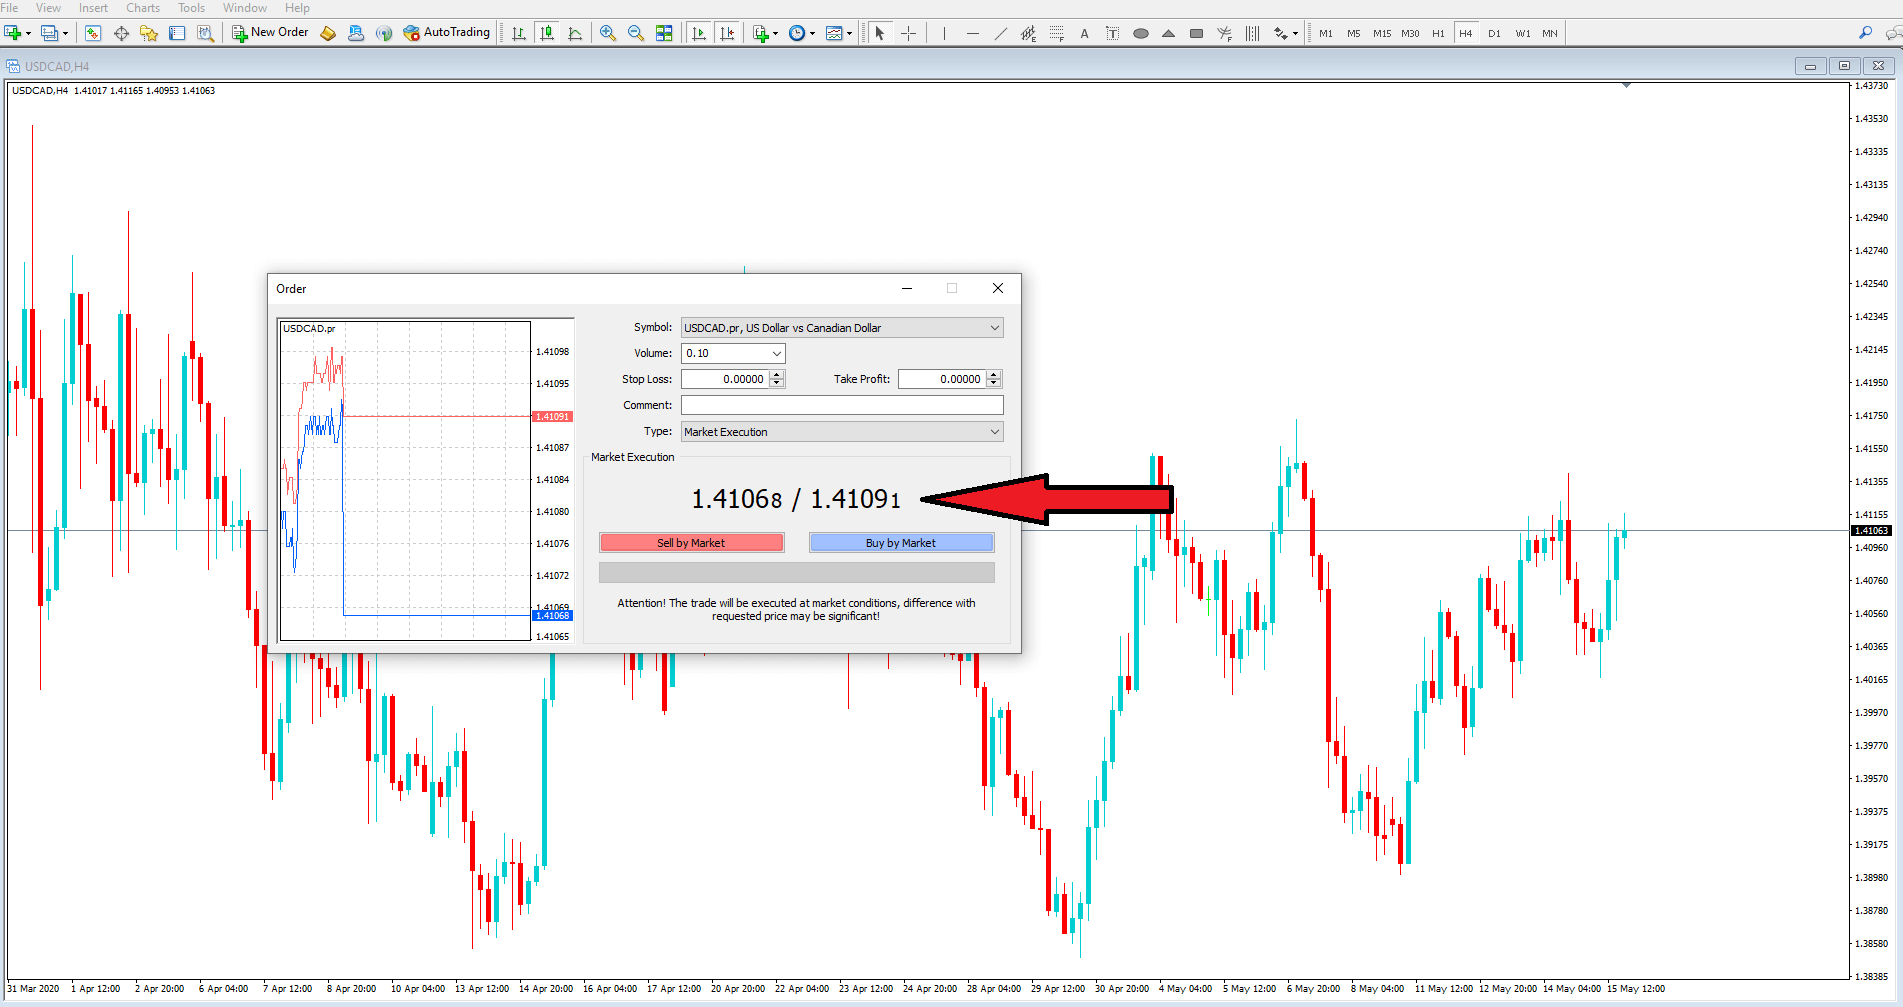
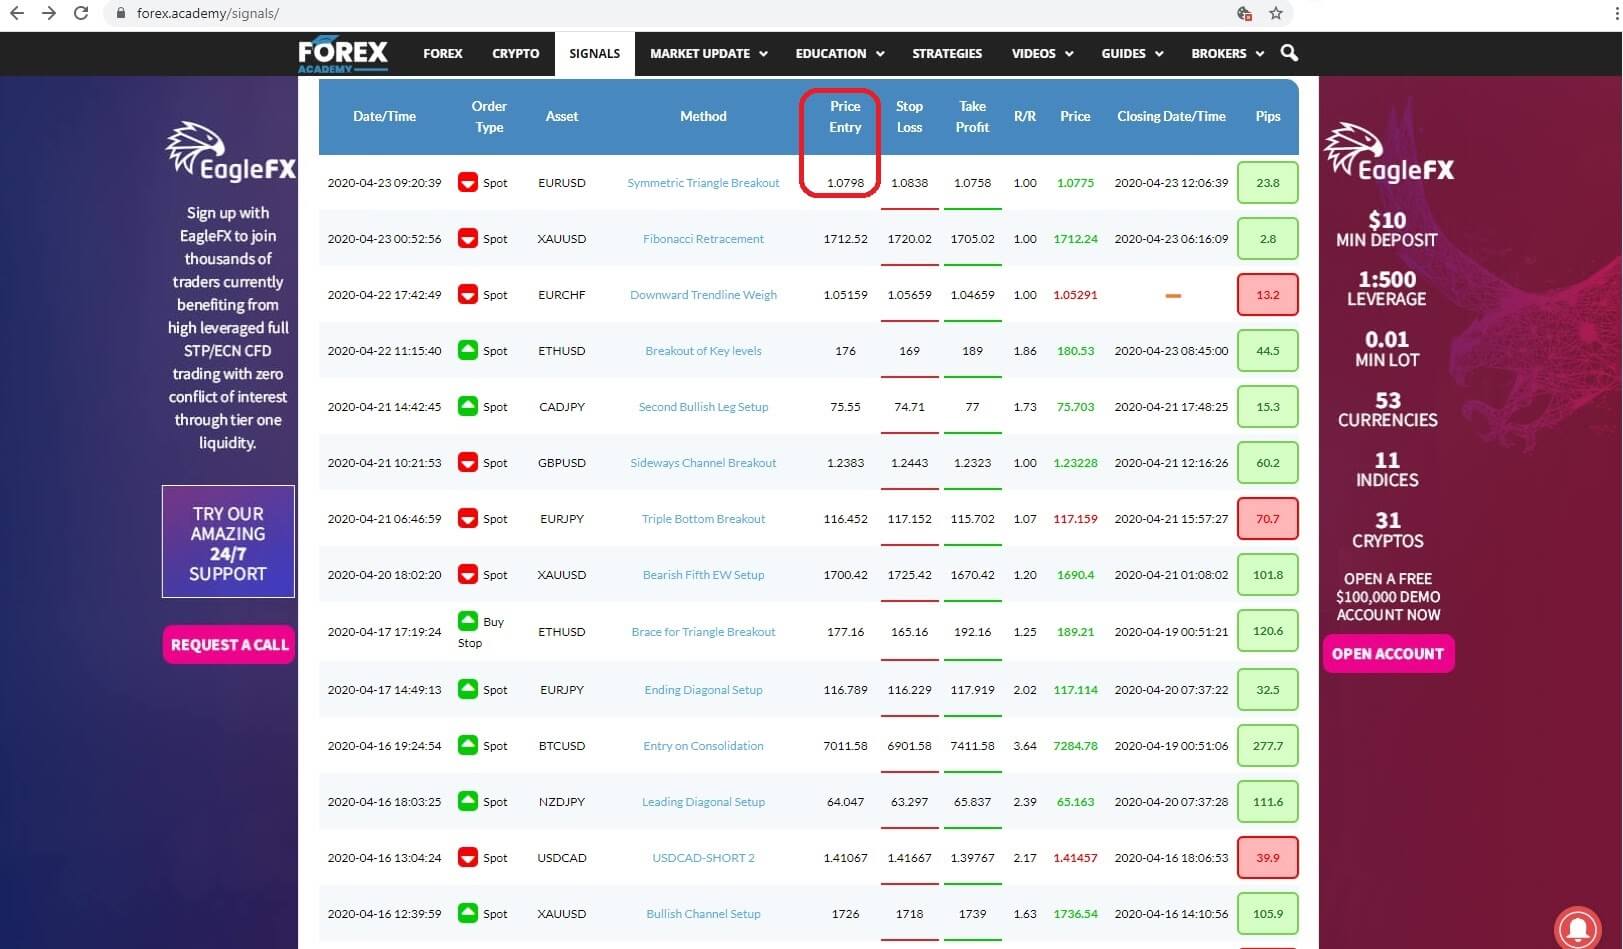
the entry price for the trade, Insert 6: 
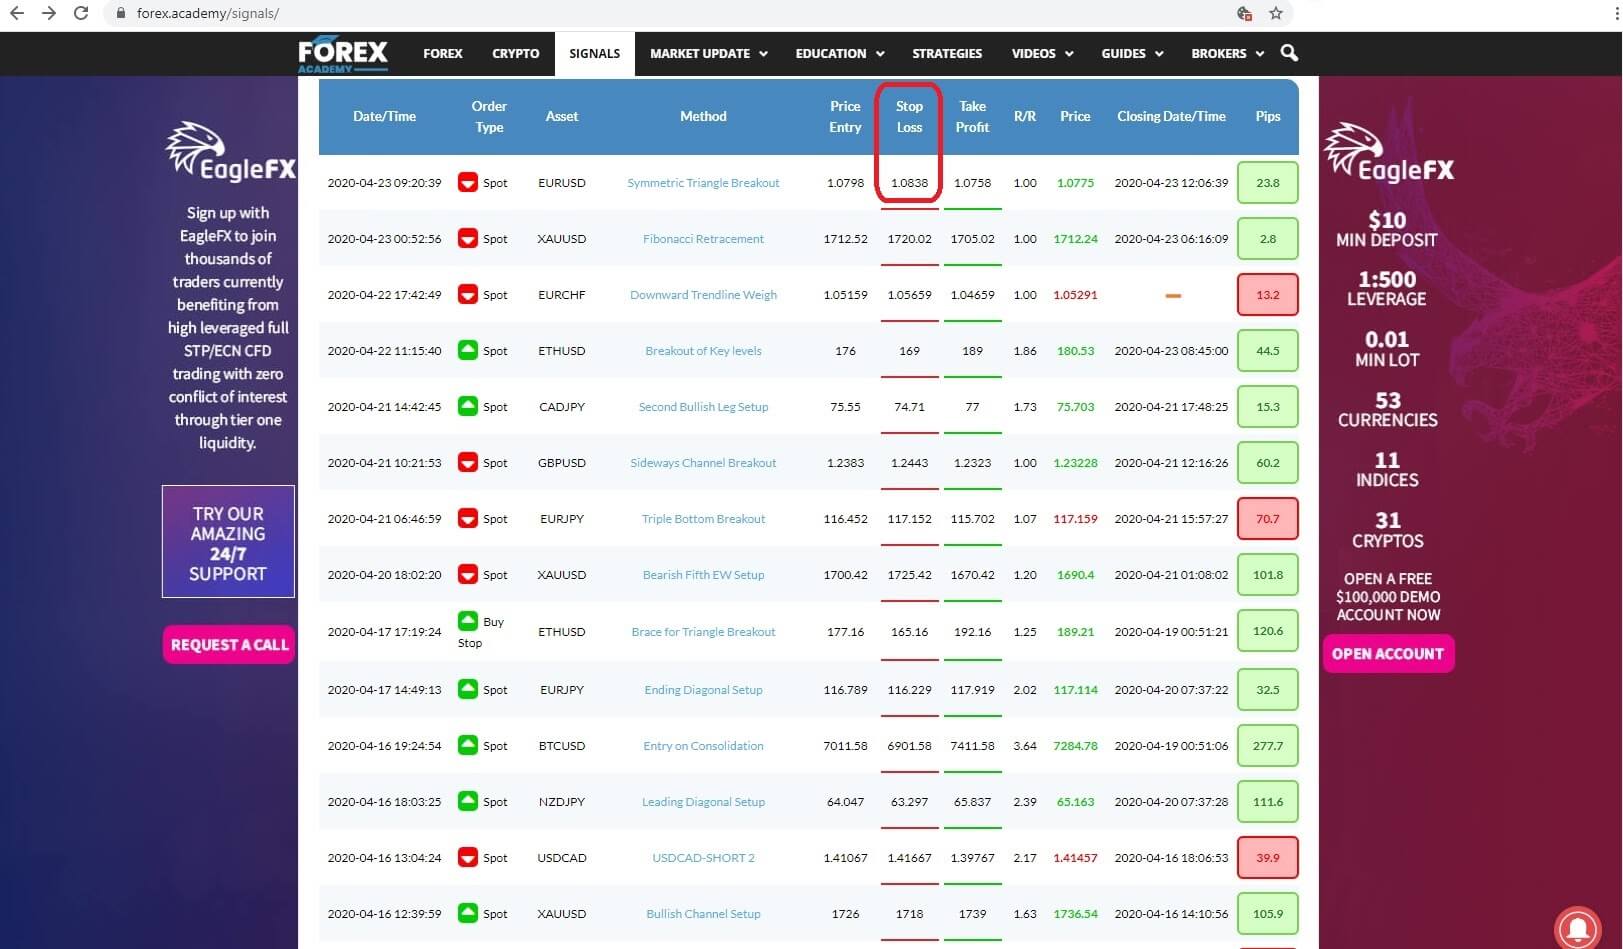
the stop loss for the trade, Insert 7 : 
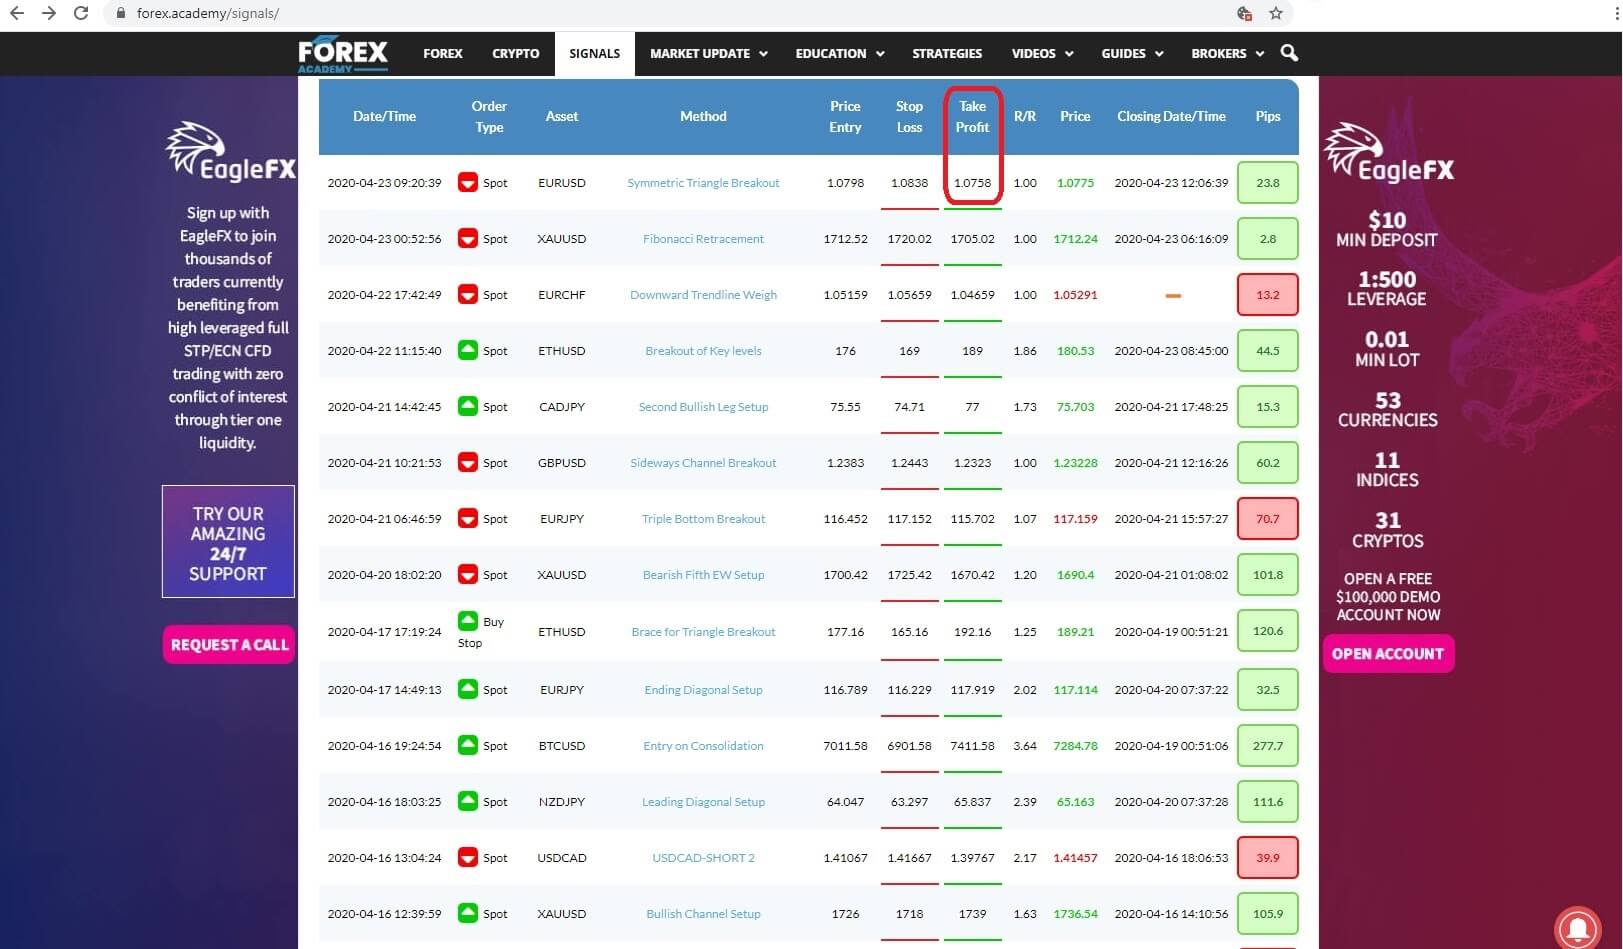
the take profit level, Insert 8, 
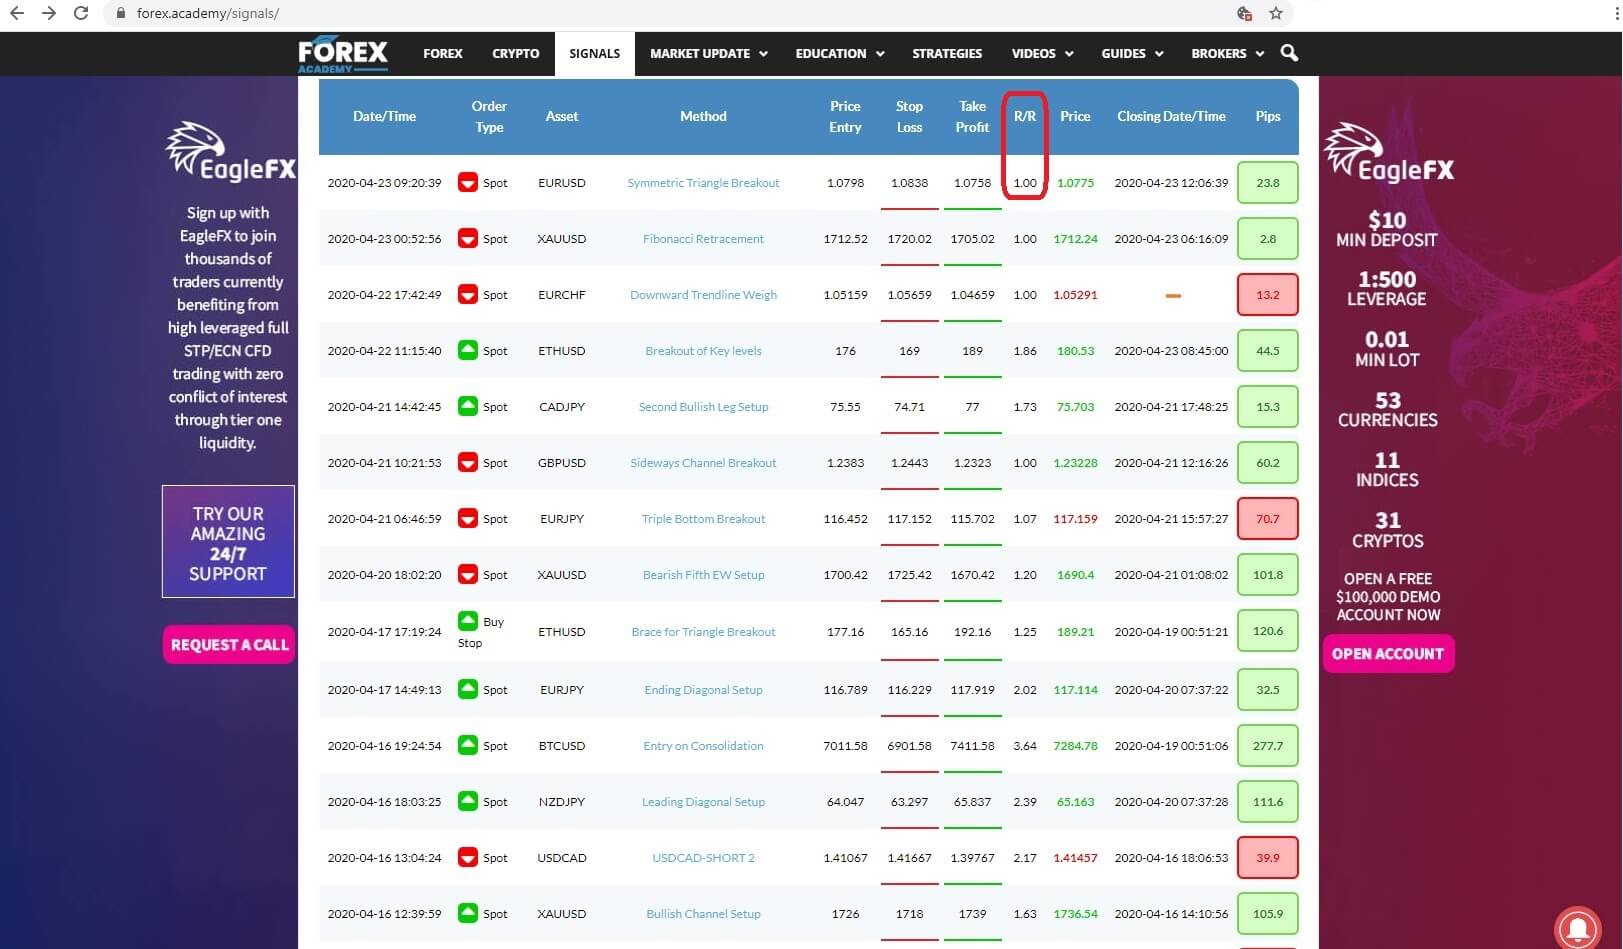
The risk to reward level, Insert 9: the price level at close; Insert 10:
The closing date and time, if applicable and insert 11: 
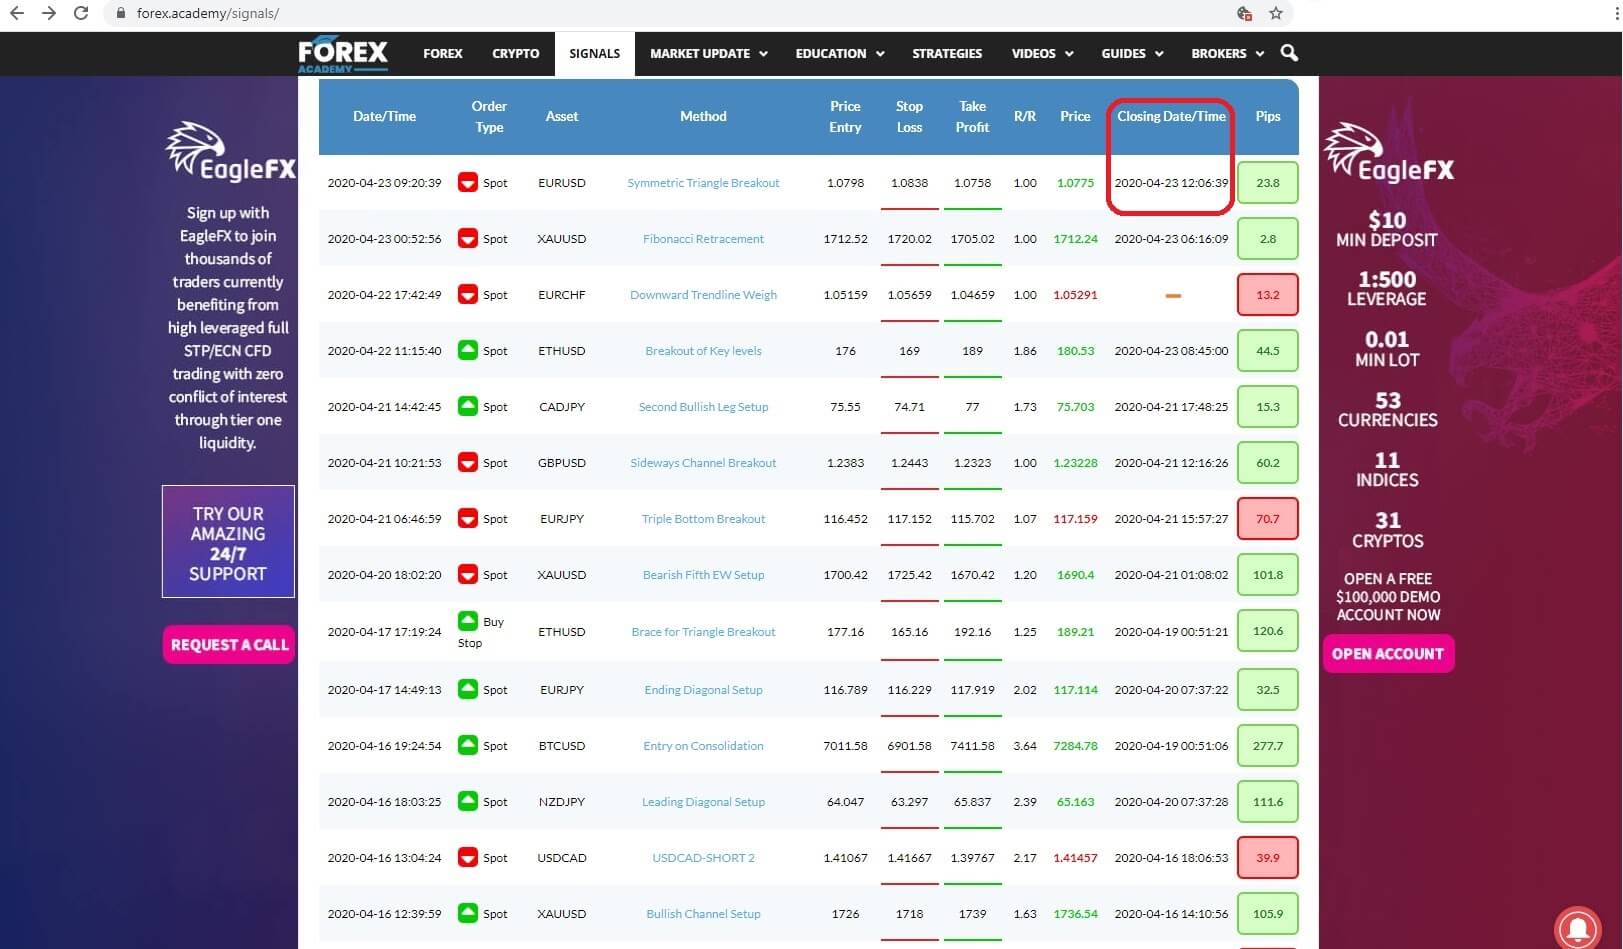
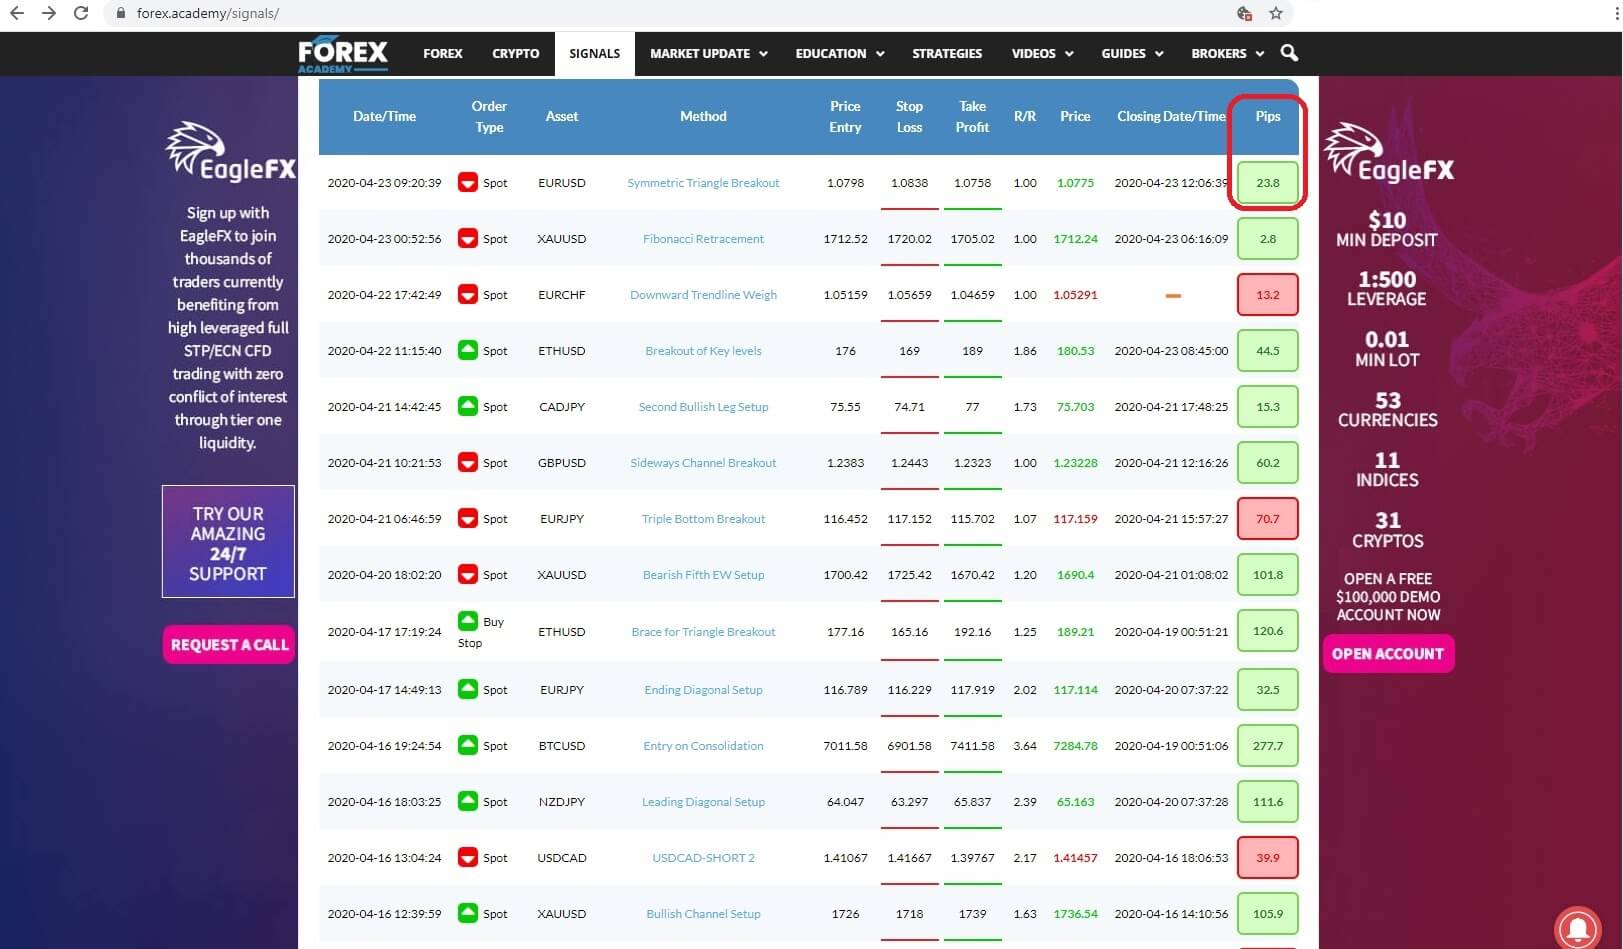
the amount of pips won or lost or in the event of an open trade the fluctuating level of pips in play.
Now lets drill down a little further into the trade methodology as promised earlier.


The platform has a cool feature called the method, it allows total scrutiny of all trades by third parties, such as yourself, who want to know about the thinking and methodology behind the set-up of each trade. This is not about tossing a coin and hoping for the best, it’s about incorporating all the methods and techniques which are employed and incorporated by professional traders and institutions which have a high for this type of technical and fundamental analysis, which tend to offer a high success rate.

And so in this spot EURUSD trade, the trader had based his assumption that the pair should move lower and entered a short position as an instant execution trade at the exchange rate of 1.0798 with a stop loss of 1.0838 and a take profit target level of 1.0758 with a risk to reward ratio of 1.00 and where the trade was manually closed out on the 23rd 04 2020 at 12:06 PM with a profit of 23.8 pips. This tells us that the price action was reversing and unlikely to achieve its target exchange rate at 1.0758 and therefore the trader decided to close out. Followers would have the same option, and remember, this is about making money, and that markets can change direction and things can therefore change.


So let’s now click on the Method tab, and drill down further into the trading methodology behind this trade. Now you will be presented with a detailed analysis of this train set up. In this instance, the trader is Ali.B, who has elected to use a technical and fundamental analysis approach, based on a symmetrical

triangle breakout and while preferring the 4-hour time frame. Ali has incorporated several support and resistance levels, and has keenly observed that price action was forming a squeeze, and that a symmetrical triangle breakout had occurred and this was the set-up that he had incorporated as the backbone of this trade.
Ali provides detailed clarification from a fundamental basis, which is backed up by cool headed technical analysis.


By scrolling down we can see that more detailed information has been provided and where copy traders can also calculate what their profit and loss would likely be in the trade was allowed to go all the way to the targets and stop levels, based on the incorporation of using a standard or micro lots for those who decide to copy the signals.

This is the trading signals service table in a nutshell, it’s completely transparent, fully detailed, easy to follow with trades that can be copied by others, including new traders, or even experienced ones with a limited amount of time to set up their own trades, or those who wish to supplement their trading portfolios.
So what is the catch I hear you say? Other signal providers want to charge me a monthly subscription fee, often quite expensive, so there must be a catch or there must be something wrong with this service. Well just because it’s free, it doesn’t devalue the product and Insert J
just look at the success story so far, in just a few weeks our team of professional traders, many who will be trading these setups themselves, with their own funds, has bagged a very impressive amount of pips won of 1841.41, and that equates to $18,410 less fees and spreads for traders who copied all these signals with risking one standard lot size, and even a still impressive $1,841 less fees and spreads while risking a mini lot. All with a win to lose ratio currently running at over 65%.
As for the trading signals service being free; well it is all a part of the commitment by the owners and team here at Forex.Academy to offer free professional, comprehensive educational and related services within the world of financial trading.

Join us for part 2 to find out how this brand new free service can help you.

Categories
Crypto Videos

Develop A Proper Actionable Crypto Trading Strategy & Conquer The Markets


Developing a profitable cryptocurrency trading strategy – guide

Trading and investing in cryptocurrencies are a bit different from investing in other classes of assets. Crypto trading extremely risky due to its high volatility, price fluctuations, and limited regulations surrounding it. However, trading cryptocurrencies can be extremely lucrative if a proper trading strategy is utilized. This guide will explain how to create a profitable cryptocurrency trading strategy.

Select a reliable exchange and a cryptocurrency
A cryptocurrency exchange is a platform where you can trade your cryptocurrencies, and choosing a reliable platform increases your profit potential. Choose a platform based on volume, trading fees, the safety of the platform, as well as its supported coins.

Do proper research

Doing proper research on the cryptocurrencies that you are thinking of trading is a no-brainer. You should trade cryptocurrencies that you believe in, but also those where you can get a quick profit by riding the hype train. The cryptocurrency market is different from other markets in the fact that its average investor is much more susceptible to the hype as well as fear, uncertainty, and doubt.
On top of that, doing proper research also translates to after you create the strategy you want to use. Each and every strategy needs to be backtested to see if it does well in bear, bull, or ranging markets. A strategy doesn’t have to be one-size-fits-all; you can rather have a separate strategy for different market movements.

Invest money that you can afford to lose

Crypto trading and gambling have a subtle similarity – they both warn the players about the limit that goes beyond the risk. In both cases, players (which are in this case traders) should only play up to the bankroll limit they are fine with losing.

Expect returns at regular intervals

It is common that the market sometimes doesn’t go your way, or that it goes better than expected. Traders should not be emotional when it comes to either gains or losses, but they should rather track their returns on a long-term basis in order to avoid the spread.
Only in the case that a strategy is unprofitable for a longer period should the trader reconsider changing it. Losses will always be a part of a trader’s life, even with the best strategy.

Utilize both fundamental and technical analysis

Traders should utilize every tool at their disposal in order to increase their profitability. Fundamental and technical analysis are two sides of the same coin, and they should both be taken extremely seriously.
While technical analysis may come as second nature to some traders, fundamental analysis of cryptocurrencies is usually not as easy. Since there are no clear ways of performing fundamental analysis with cryptocurrencies, one has to rely on knowing the coins they are trading inside-and-out from a tech standpoint, as well as to constantly track the investor sentiment in order to become a truly profitable trader.

Categories
Crypto Videos

Forex Option Expiries Over $100,000,000 – The 10AM New York Cut part 3


FX option expiries for Apr 29, NY cut at 10:00 Eastern Time, via DTCC, can be found below.


– EUR/USD: EUR amounts
• 1.0800 1.0bn
• 1.0815 531m
• 1.0865 1.1bn
– USD/JPY: USD amounts
• 107.30 555m
– GBP/USD: GBP amounts • 1.2415 268m
– EUR/GBP: EUR amounts
• 0.8675 526m
• 0.8700 600m

Hello everybody and thank you for joining us for the daily FX expiries briefing video for the 10 am New York cut today. If it is your first time with us, the FX currency options market runs in tandem with the spot FX market, but where traders typically place Call and Put trades on the future value of a currency exchange rate and these futures contracts typically run from 1 day to weeks, or months.

Each day we bring you details of the notable FX option expiries where they have an accumulative value of a minimum of $100M + and where quite often these institutional size expiries can act as a magnet for price action in the Spot FX arena leading up to the 10 a.m. cut.
We will also plot the levels on to the relevant charts at the various exchange rates where there are due to expire, and also identify the levels which are in play, and where we believe there is a greater chance of the expiry maturing based on technical analysis at the time of writing, we will label them as hot, warm or cold.

So today, we have Option Expires for the EURUSD, one of which is considered Hot at 1.0865 in the amount of €1.1bn. This is very much in the money with price action currently very close to the strike rate.

We also have Warm strikes at 1.0815 for €531m and 1.0865 for €1.1bn


Also, there is also an Option expiring for the USDJPY pair at 107.30 for $555M, however, although this is currently cold, as price action on our one hour chart is gravitating to the downside currently.


Moving on to the GBPUSD, we have one notable strike, which is in the money and labeled Hot on our 1-hour chart at 1.2415 for £268M. Price has been very volatile for the pair but looks to be running out of steam to the upside at the time of writing.


Finally, we have two hot ones for you in EURGBP at 0.8675 for €526 M and 0.8700 in €600M. Price action is in a downward channel on our one hour chart.
We suggest you take the levels and plot them onto your own trading charts and incorporate the information into your own trading methodology in order to use the information to your advantage.
Remember, the higher the amount, the larger the gravitational pull towards the exchange rate maturity at 10:00 AM Eastern time.
For a detailed explanation of FX options and how they affect price action in the spot forex market, please follow the link to our educational video.

Categories
Crypto Videos

Buying Bitcoin With Giftcards? Some People Are Making A Killing!

Buying Bitcoin with Gift Cards

The era of the internet and the constant growth of consumerism made gift cards an extremely popular payment method. You can buy a gift card at almost any store and then trade it for Bitcoin at your desired exchange. Platforms such as Paxful and Localbitcoins offer to exchange ANY gift card for Bitcoin.

Choosing A P2P Platform

The first step to exchanging gift cards for Bitcoin is choosing the right platform for you. As we mentioned before, this guide will cover Paxful and Localbitcoins.

Paxful


Paxful is the most well-known gift card-to-Bitcoin trading platform. This company offers over 300 payment methods, with gift cards being their primary trading methods. Besides their great customer service with 24/7 availability, they also post in-depth tutorials on how the platform works and how to make your trades as smooth as possible.

The main advantage of this platform, besides the array of gift cards you can choose from, is that the gift card-to-Bitcoin is their main method of transacting. This means that you will have no trouble with exchanging your gift cards due to the lack of buyers.

Localbitcoins

Localbitcoins is one of the older and more reputable peer-to-peer platforms. The company established itself by providing almost every payment method people would ever want to use. Localbitcoins is quite a fast and intuitive platform.

One downside to this platform is that Localbitcoins is a bit slow to react when something bad happens. The advantage of Localbitcoins is their availability, as they are working in every single country in the world. However, this platform is not a good place to trade lesser-known gift cards, as they have less demand and may have a lot worse exchange rates.

Conclusion

While both Paxful and Localbitcoin are quite reputable and well-known peer-to-peer platforms, Paxful has a slight edge as it specializes in gift card trading, while Localbitcoins only has gift-card trading as one part of the platform.

No matter which platform you choose, it can be highly profitable if you have the proper knowledge. Some people have even turned selling and buying Bitcoin for gift cards into a business due to the rate difference. However, be mindful of scammers and low-rating users, as these platforms have no real way to stop people from abusing the system.

Categories
Crypto Videos

Legitimate Passive Income Streams In Crypto – The Pitfalls & Successes Part 9

Earn Passive Income in Cryptocurrency – part 9

This part of the cryptocurrency passive income guide will talk about earning passive income by using security tokens.

Security Tokens

Security tokens, as a concept of yield-generating crypto-assets, is the closest thing we have in the cryptocurrency industry to the off-chain traditional markets. A security token represents an asset or a claim for profit. This type of tokens pays out dividends, which are, just like with traditional markets, returns on this asset or profits generated by it. The payouts are, again, just like with the traditional assets, paid according to a certain time schedule. Security tokens are highly regulated and typically issued via an STO (short for Security Token Offering). The core infrastructure, as well as regulations to acquire and trade security tokens, are still in development. However, them being “unfinished” as a concept should not be a discouraging thing, as the world is moving in the direction of making Security tokens a reality.

Security Tokens and Passive Income

When it comes to earning passive income by utilizing security tokens, there are not many options at the moment. However, the situation is changing every single day, and the day that security tokens become a viable passive income stream is rapidly getting closer. We are covering the topic of security tokens right now, so you would be prepared to take action when the time is right.

Depending on the underlying asset as well as its performance, the passive income of security tokens can vary greatly. The current lack of infrastructure makes it quite hard to estimate the market volume of security tokens. However, when the regulations on these assets become clear, the potential market size of the tokenizing assets can far exceed our expectations and even reach trillions. This is because, potentially, assets such as stocks, derivatives, bonds, and real estate can all be tokenised.

The current examples of dividend-yielding security tokens are Kucoin Shares, tZero, Neufund, and Nexo.