
Cryptocurrency trading – Pivot Point guide
What are pivot points?
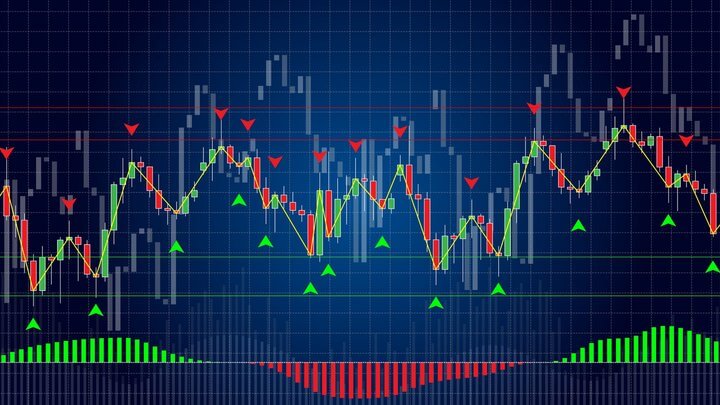
Pivot points are a pattern repetition indicator that is used to predict support and resistance levels. They can also help determine the overall market trends.
The most common way to use and calculate a pivot point is the so-called “five-point system.” This system comprises of an average of the numerical high, low as well as close of the previous trading period. These numbers are used to plot a course for five levels: two sets of resistance levels, two sets of supports, and a “pivot point.”
Calculating pivot points
The five-point system is one of the ways of calculating and identifying support and resistance levels. It is also one of the simplest, and is calculated like this:
Pivot Point (P) = (Previous Low + Previous High + Previous Close)/3
Resistance level 1 (R1) = (Pivot Point x 2) – Previous Low
Resistance level 2 (R2) = Pivot Point + (Previous High – Previous Low)
Support level 1 (S1) = (Pivot Point x 2) – Previous High
Support level 2 (S2) = Pivot Point – (Previous High – Previous Low)
The pivot point from our example is derived from the previous high, low, and close divided by 3. This allows traders to define an area where the price action seems most sensitive and likely to shift in sentiment.
Pivot point strategy – time frames
While it is possible to utilize pivot points on longer time frames, common practice looks at the smaller time frames such as 4-hour, 1-hour, 30, and 15-minute charts.
When used alongside other indicators such as the MACD and the RSI, traders can ensure the legitimacy and significance of their predictions.
Pivot point – example
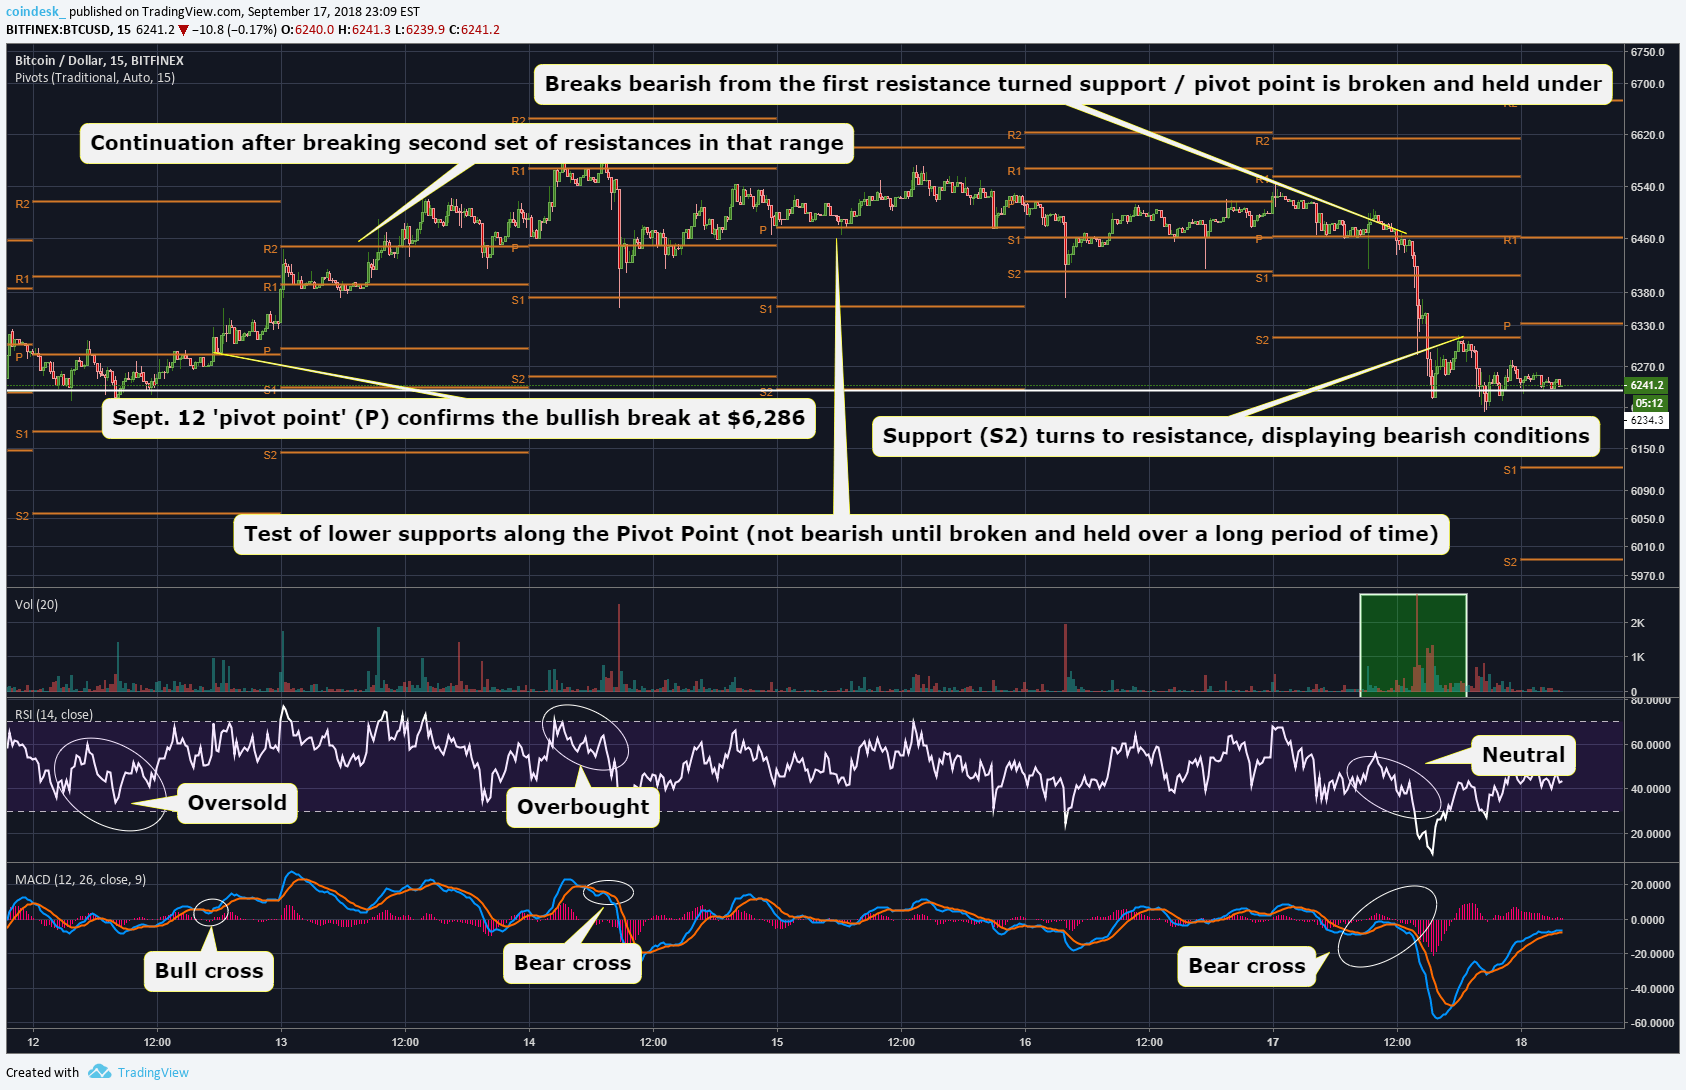
An example shows the Bitcoin chart above with resistance levels marked as “R1” and “R2,” and support levels marked as “S1” and “S2.” The pivot point is marked as “P.”
Some traders end up using up to four resistance and support levels.
The first example shows that the pivot point acted as a threshold for prices to go bullish for continuation, therefore confirming the legitimacy of the move $6,285.
The RSI showed oversold conditions just before the breakout, and the MACD printed a bull cross, which added an additional layer of confirmation to this bullish move.
After a few unsuccessful attempts to surpass the R1 resistance level, Bitcoin plummeted on Sept. 14.
Finally, Bitcoin’s price went under the pivot, as well as both supports on Sept. 17.
Each of these moves had multiple indicators that confirmed the market sentiment moves as either a support and resistance test or a legit rally or breakdown.
Conclusion
Pivot points are certainly a useful addition to a trader’s technical toolbox that allows them to confirm the support and resistance levels, as well as to judge the strength of big price moves.


One reply on “Crypto Pivot Points! Master The Market!”
Please how accurate are pivot points on Bitcoin and other top cryptos?