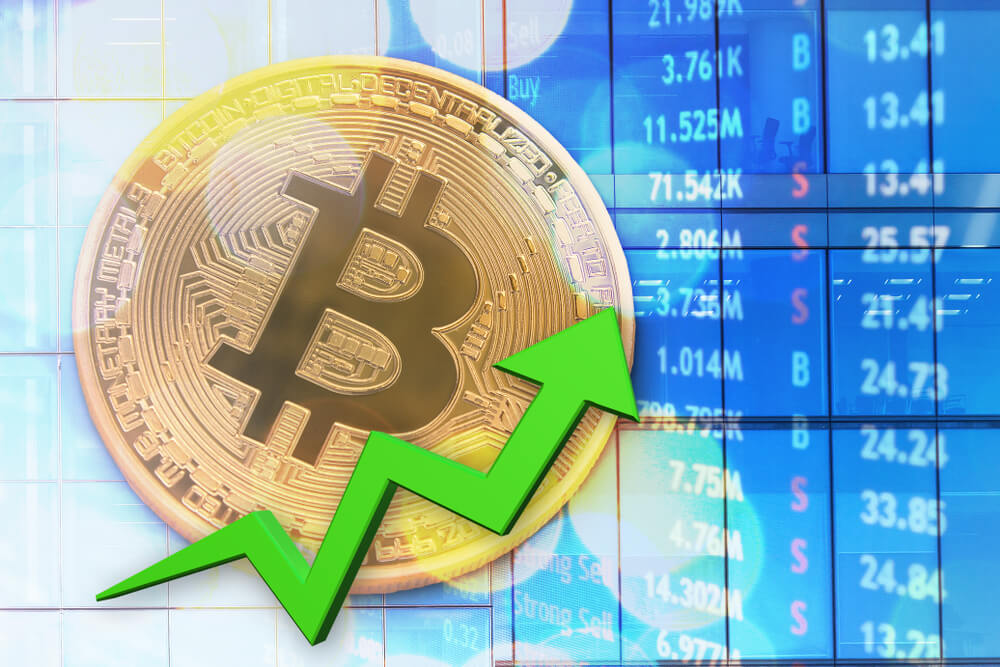
The cryptocurrency market spent made yet another boom as Bitcoin passed the $11,000 benchmark. Bitcoin is currently trading for $11,024, which represents an increase of 7.7% on the day. Meanwhile, Ethereum lost 1.04% on the day, while XRP gained 2.85%.
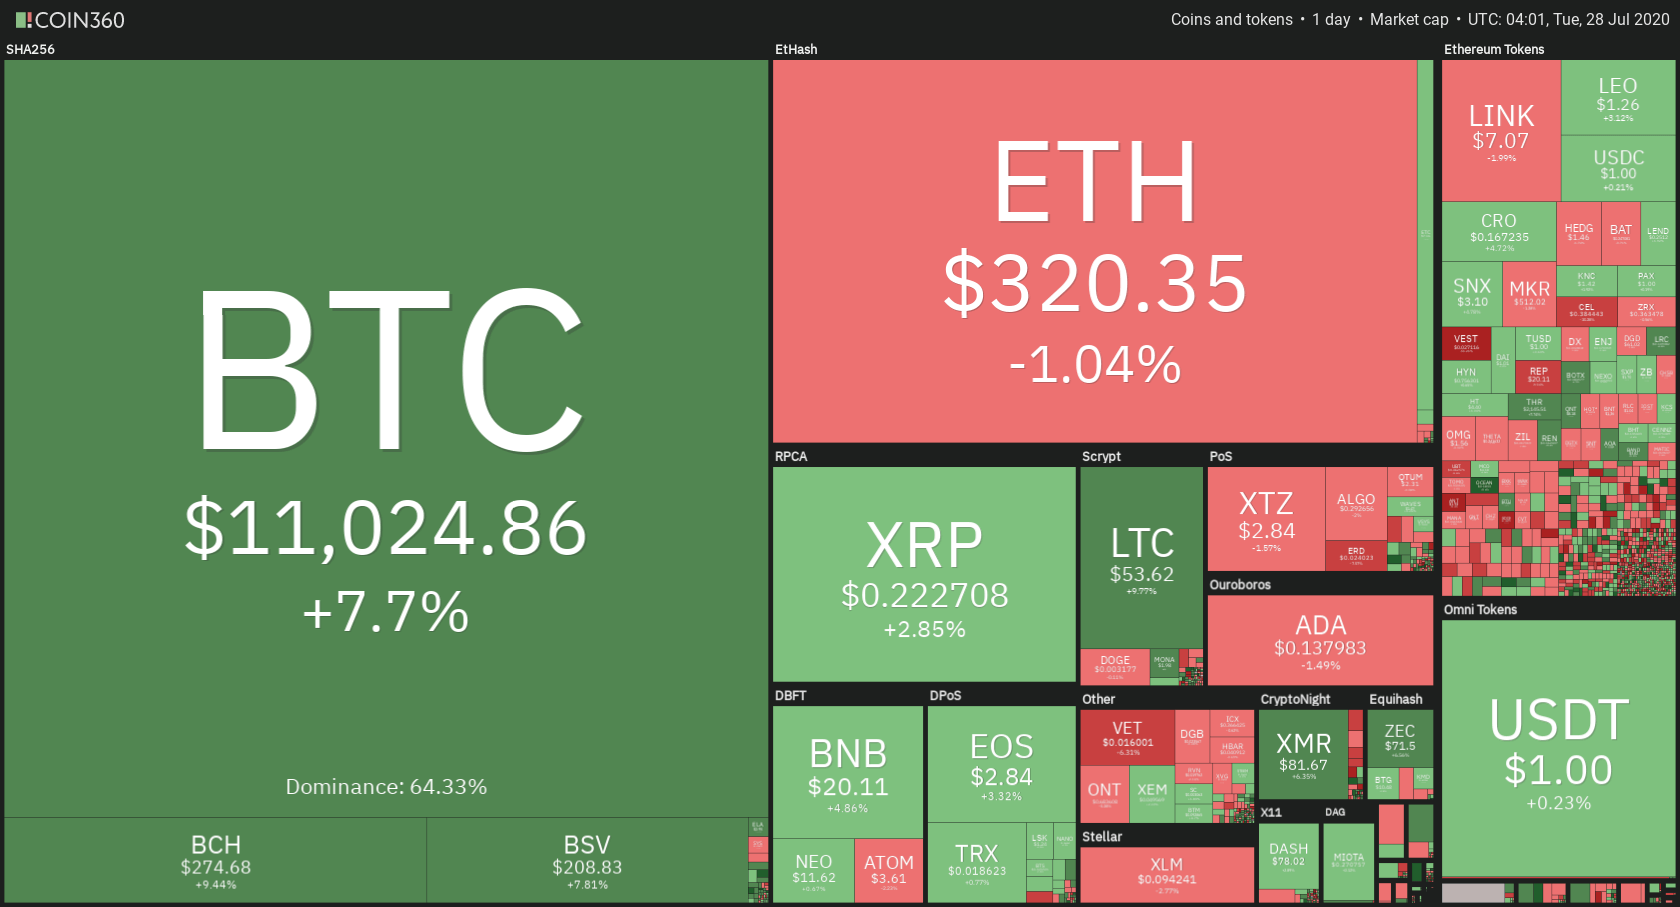
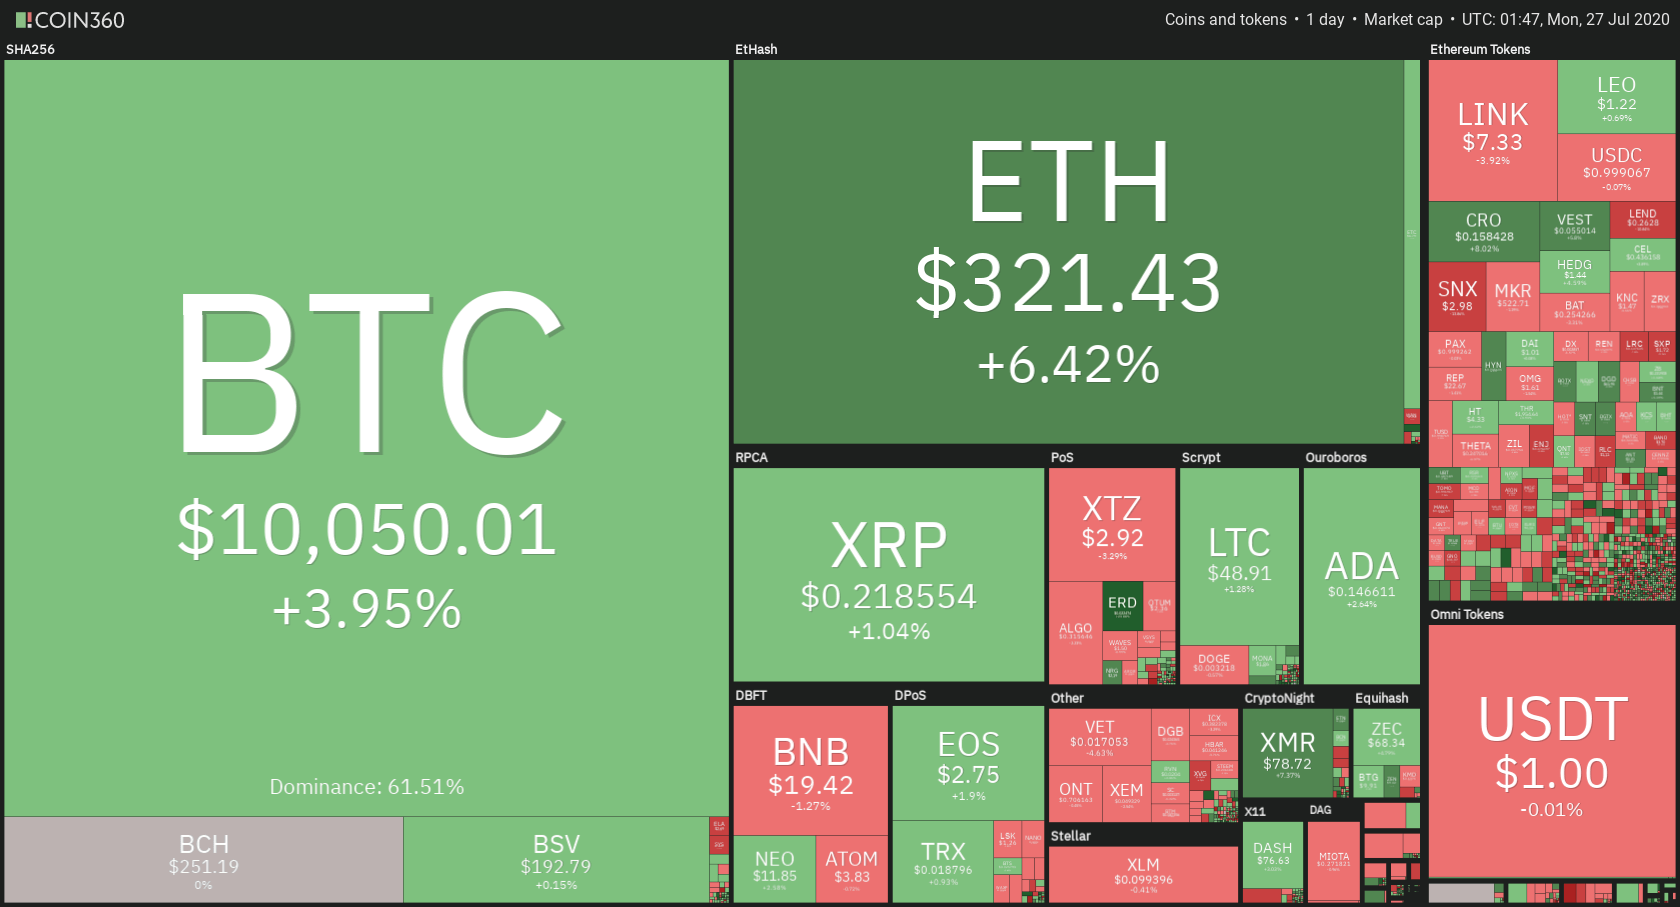
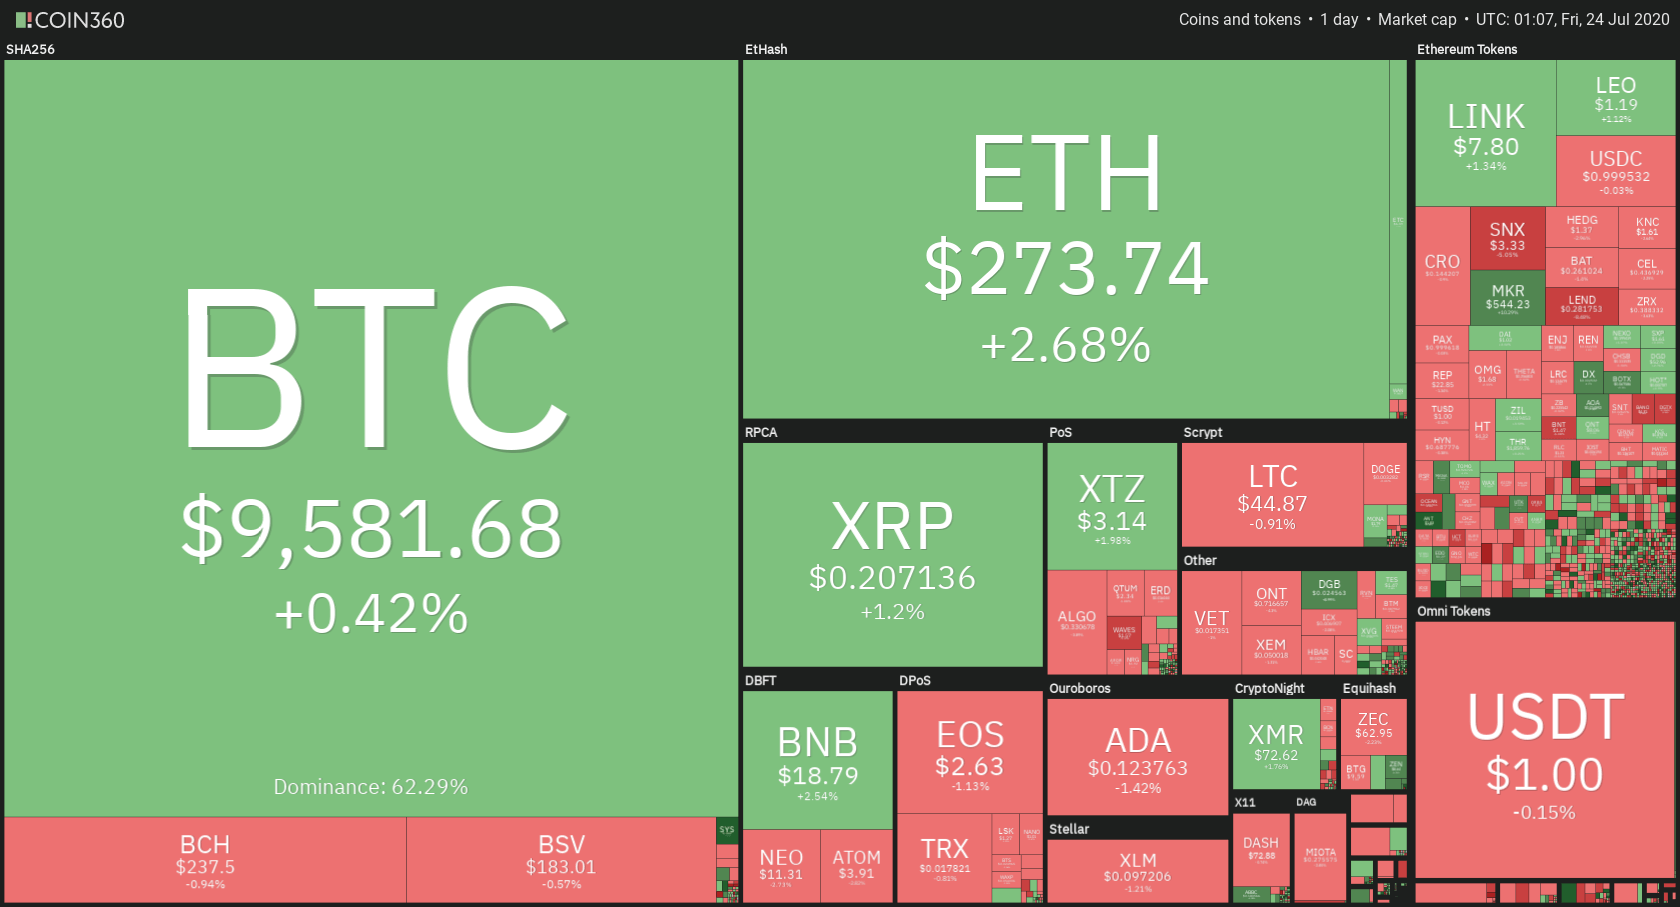
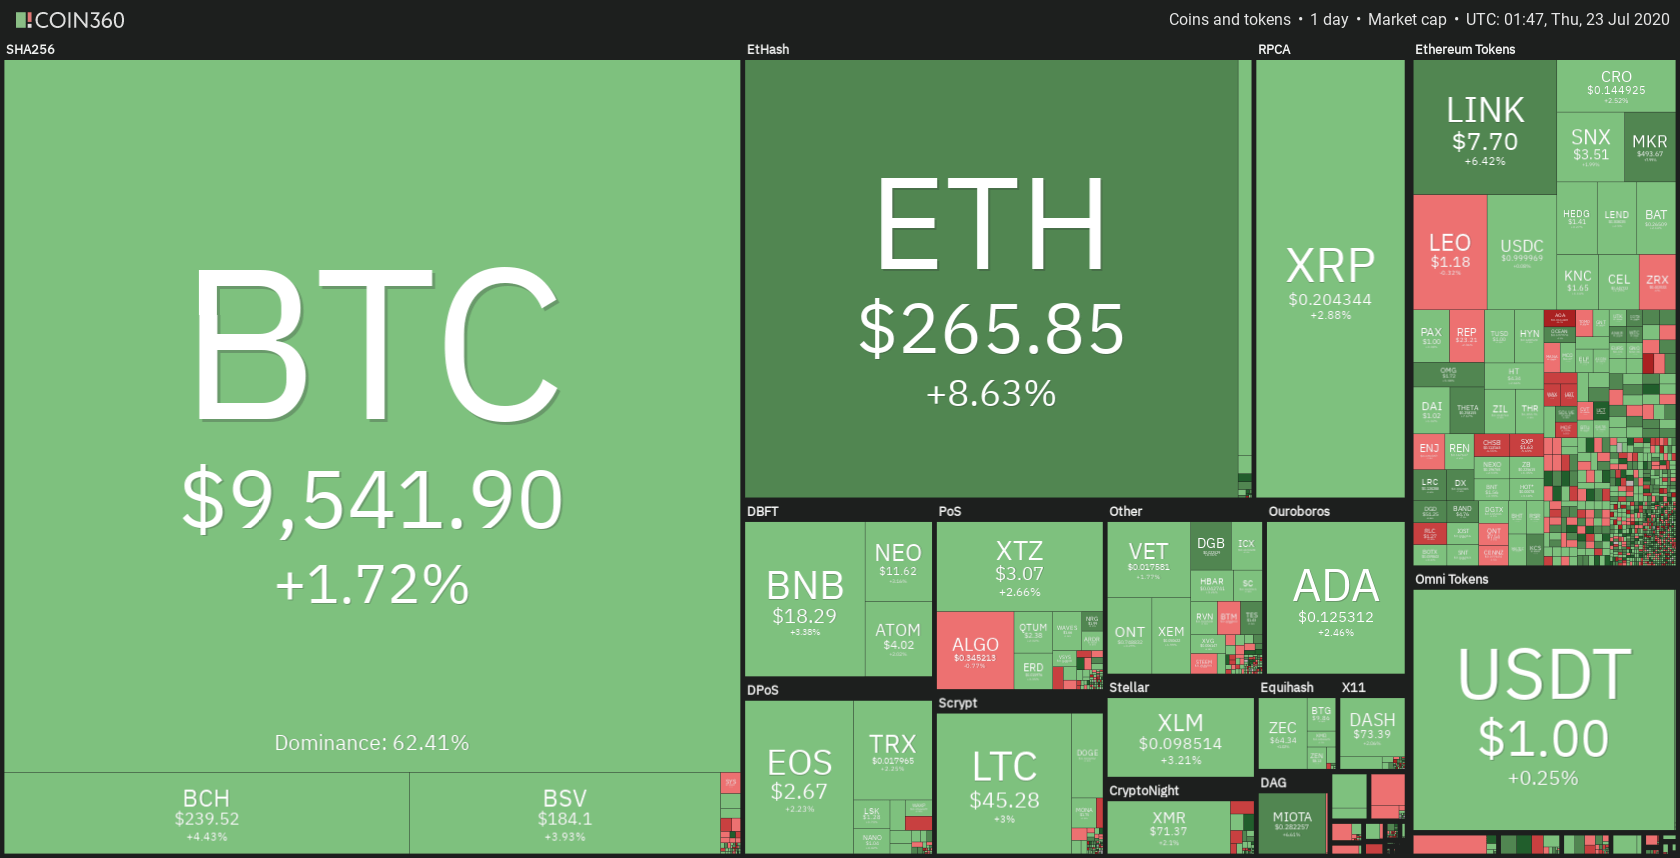
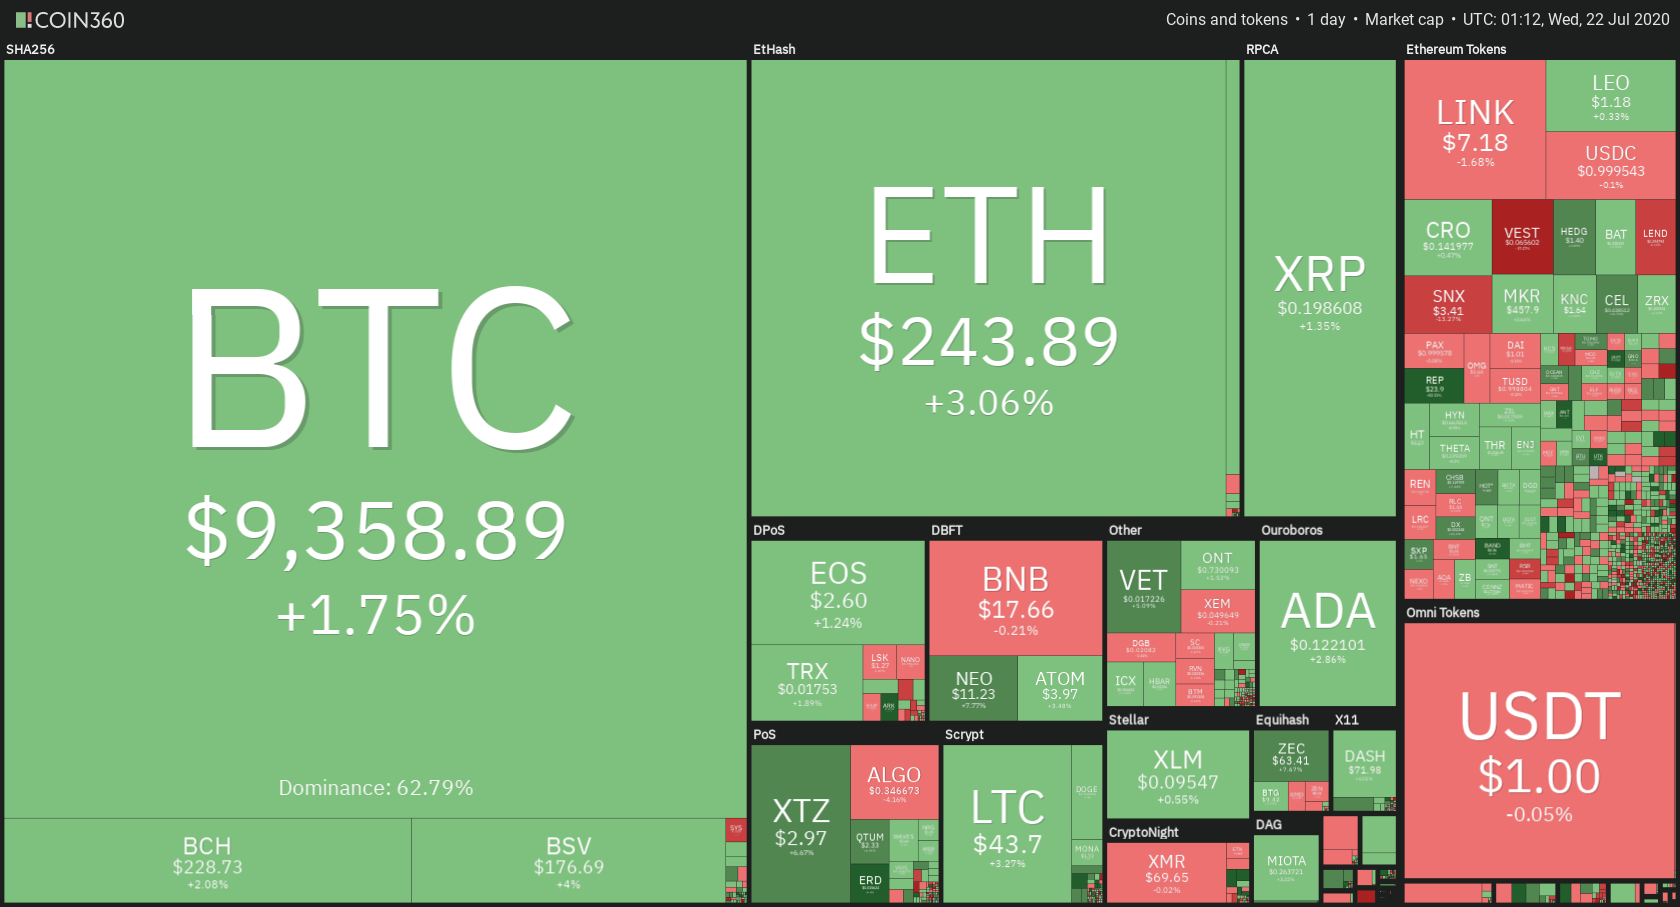
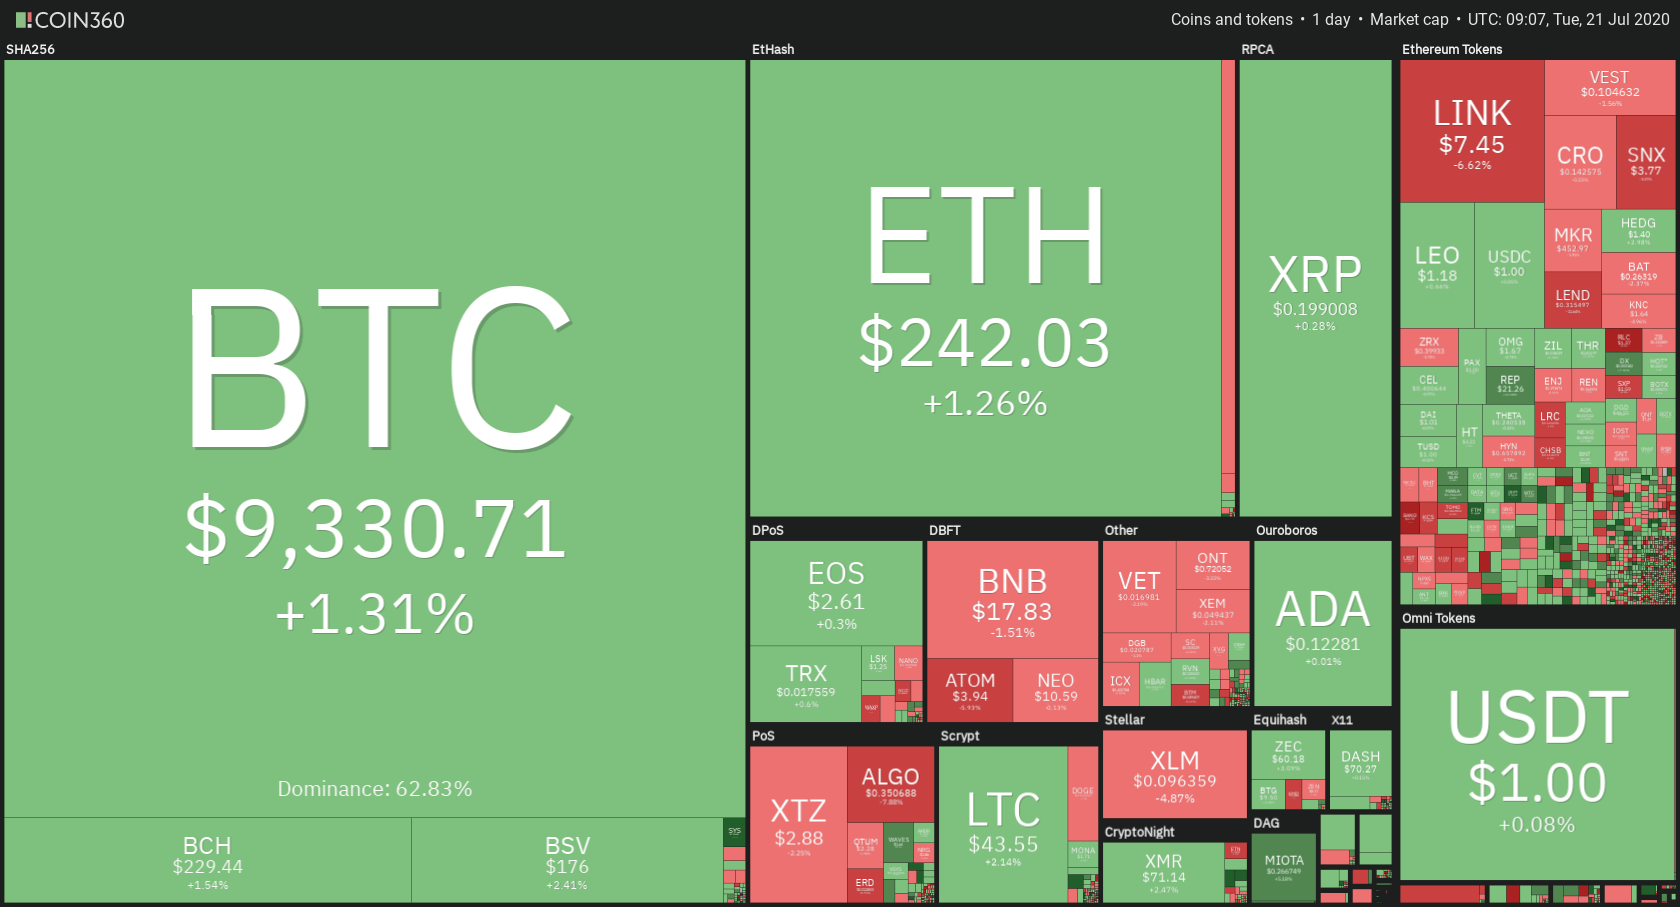
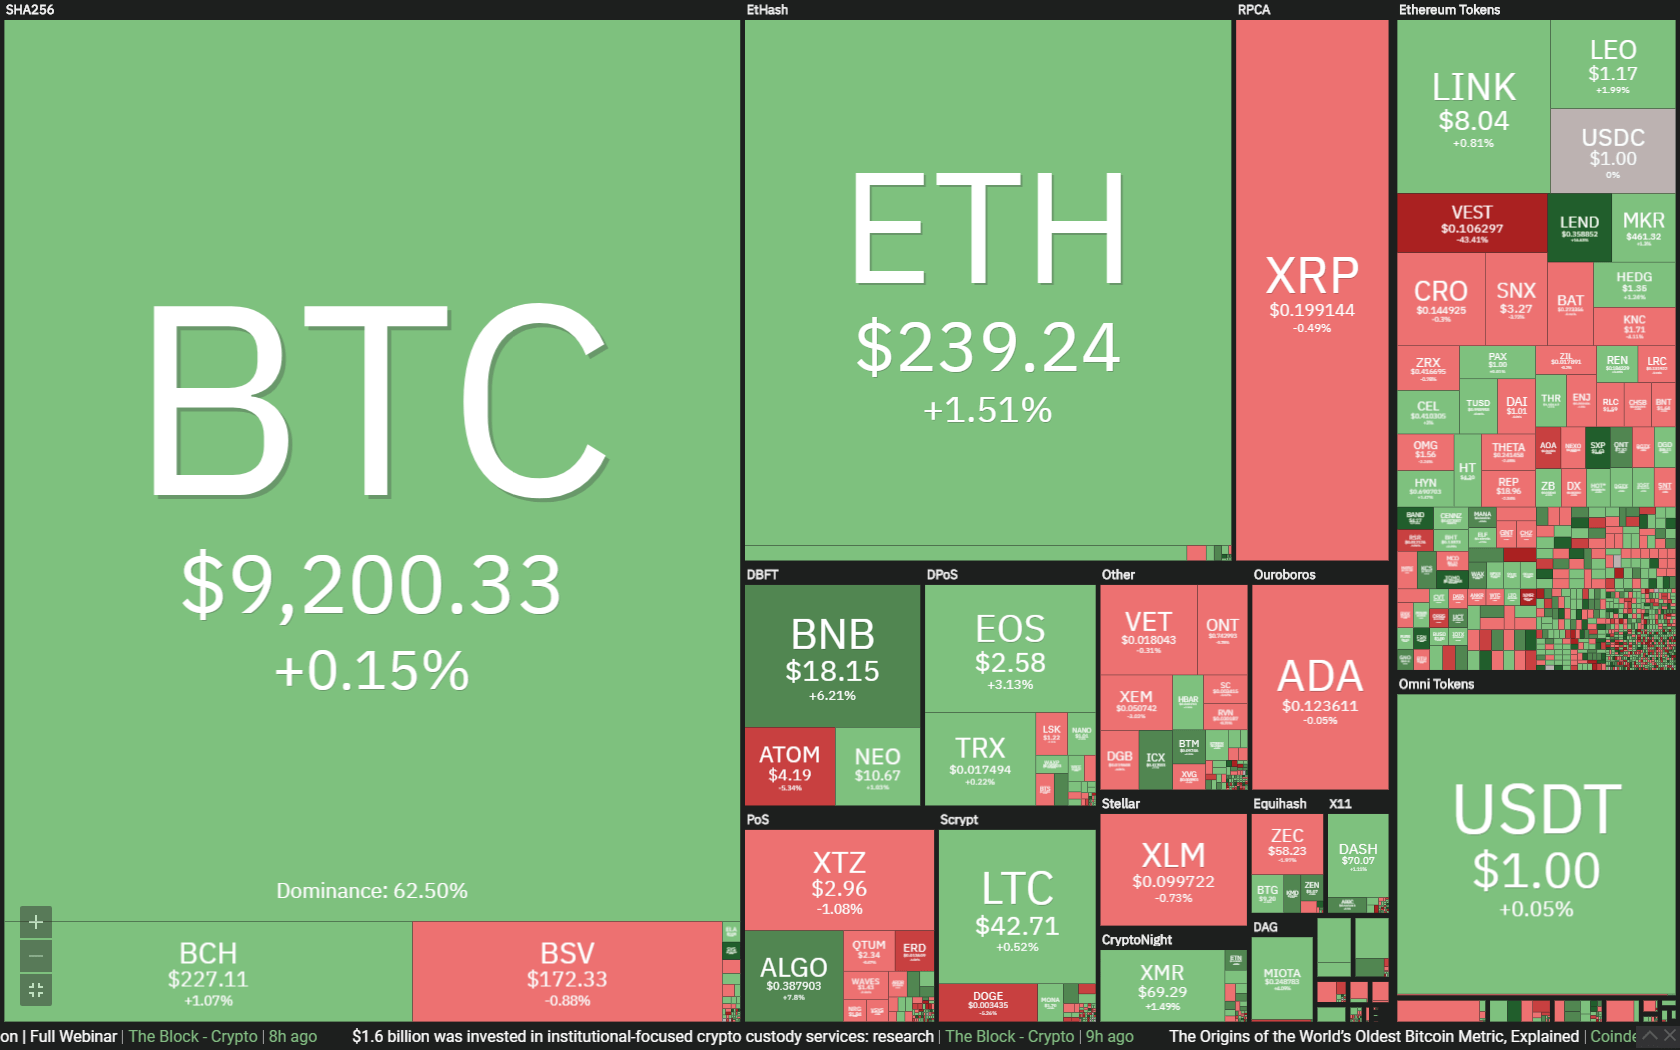
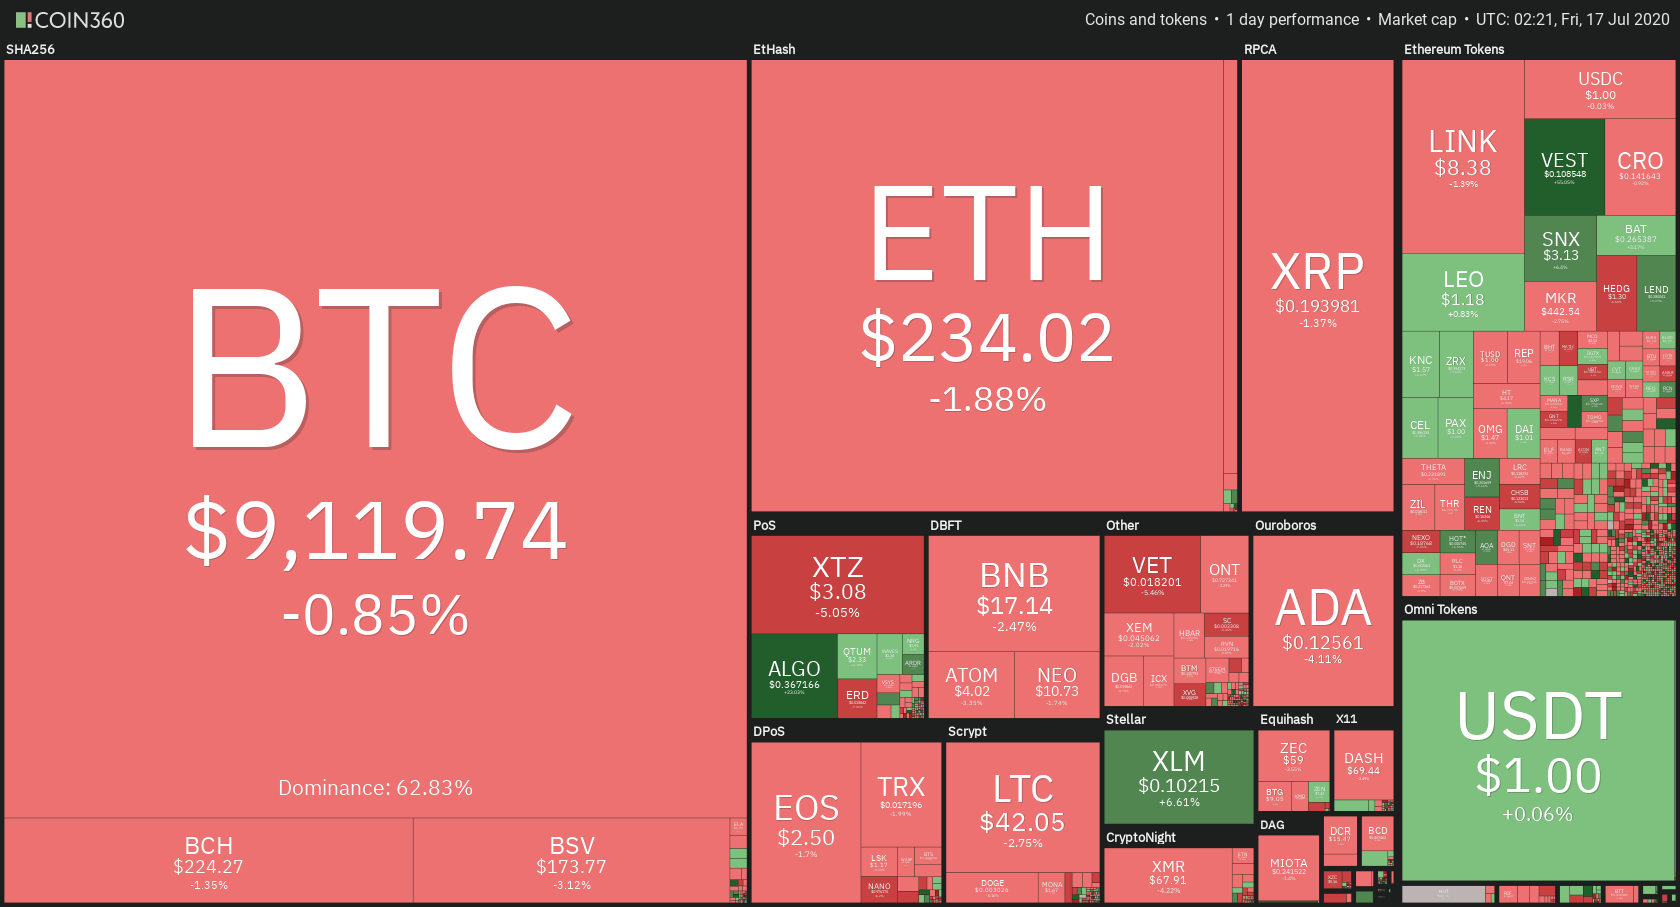
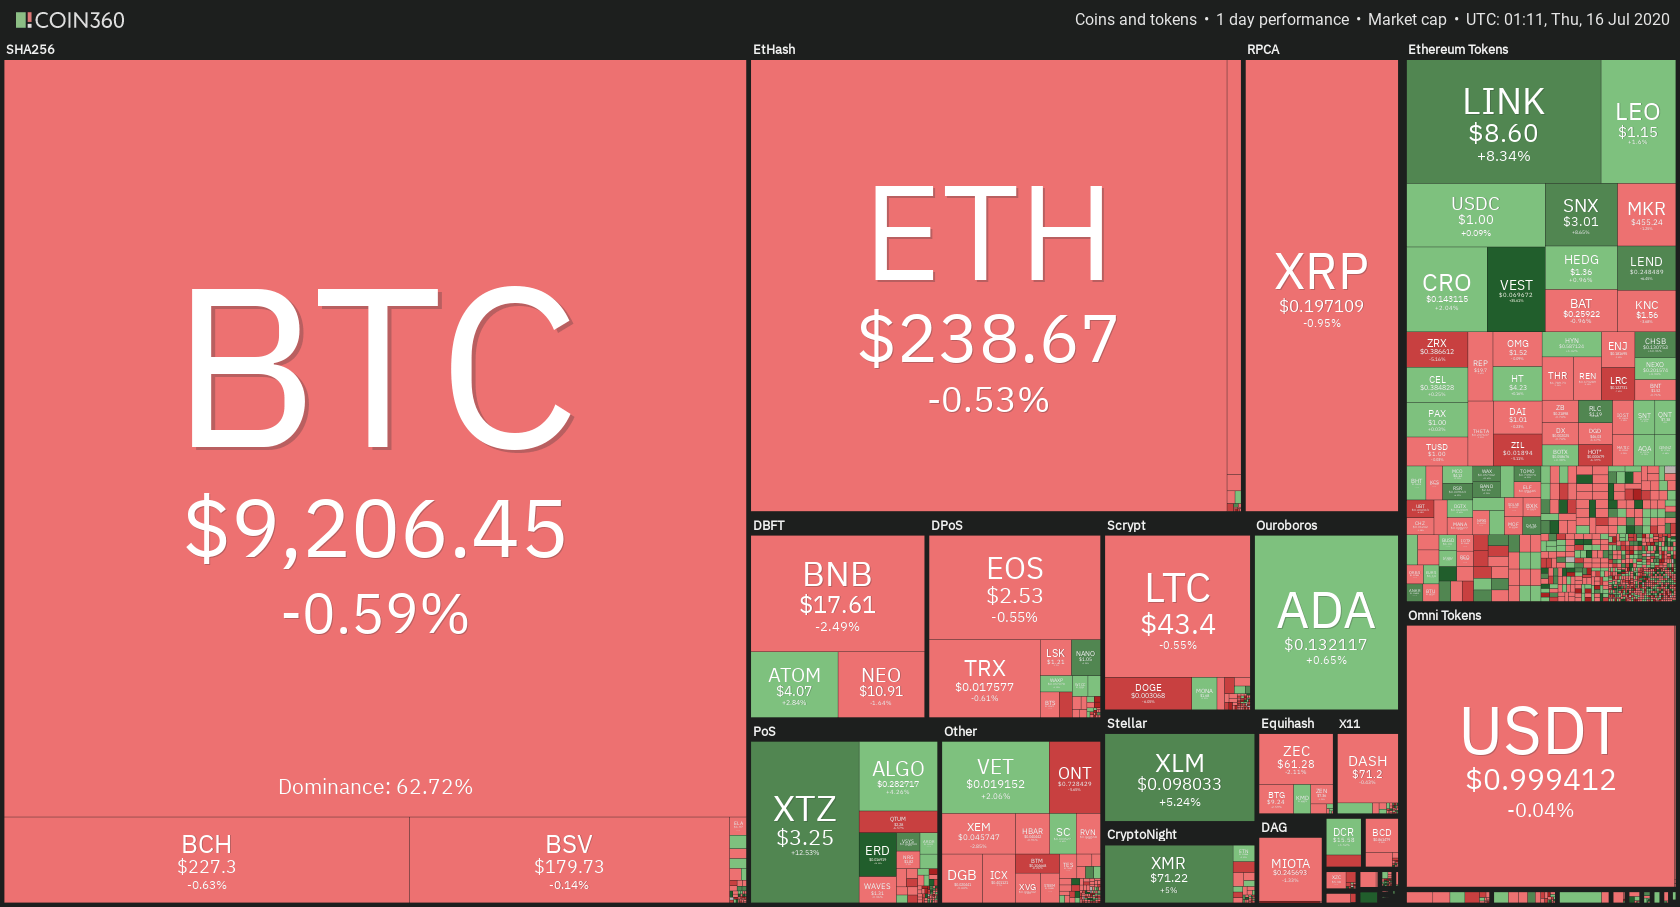
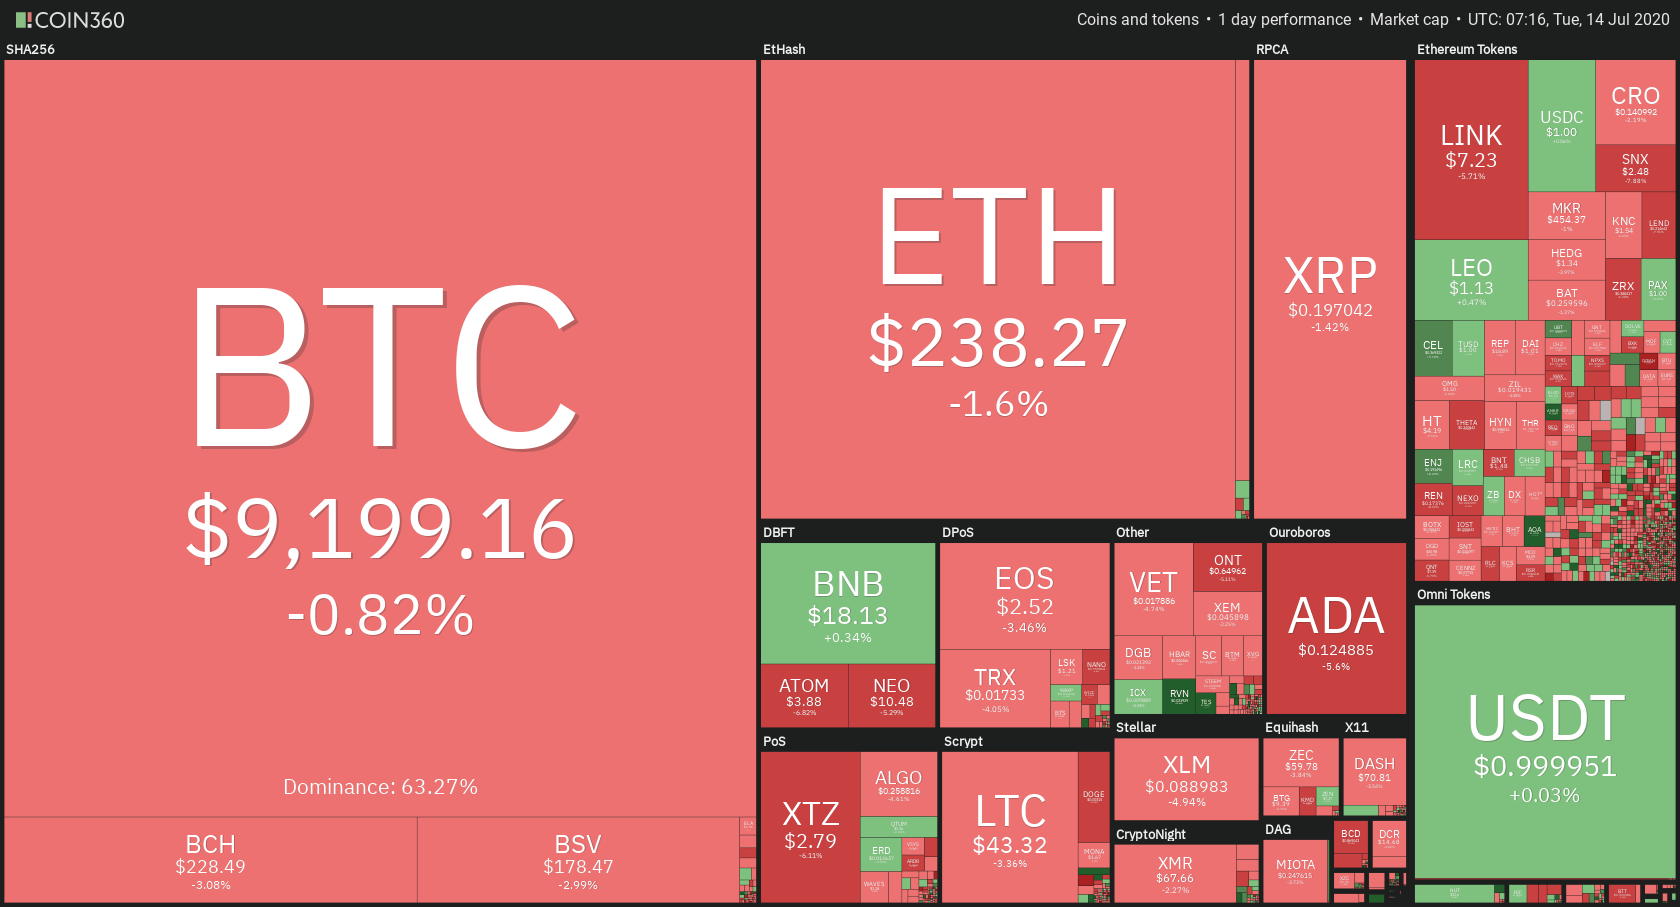
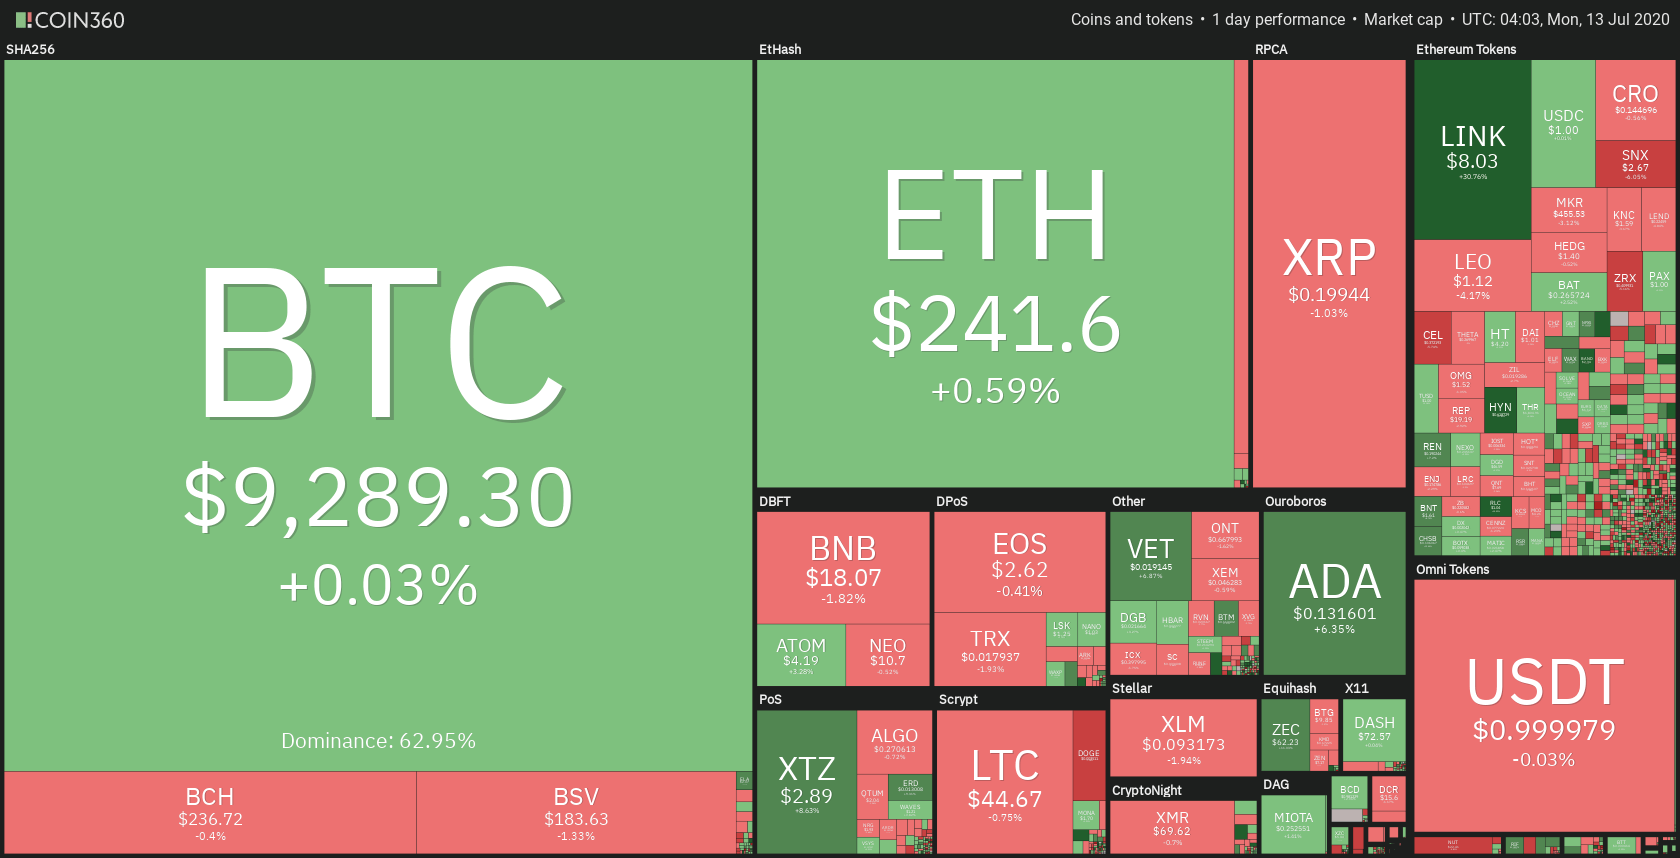
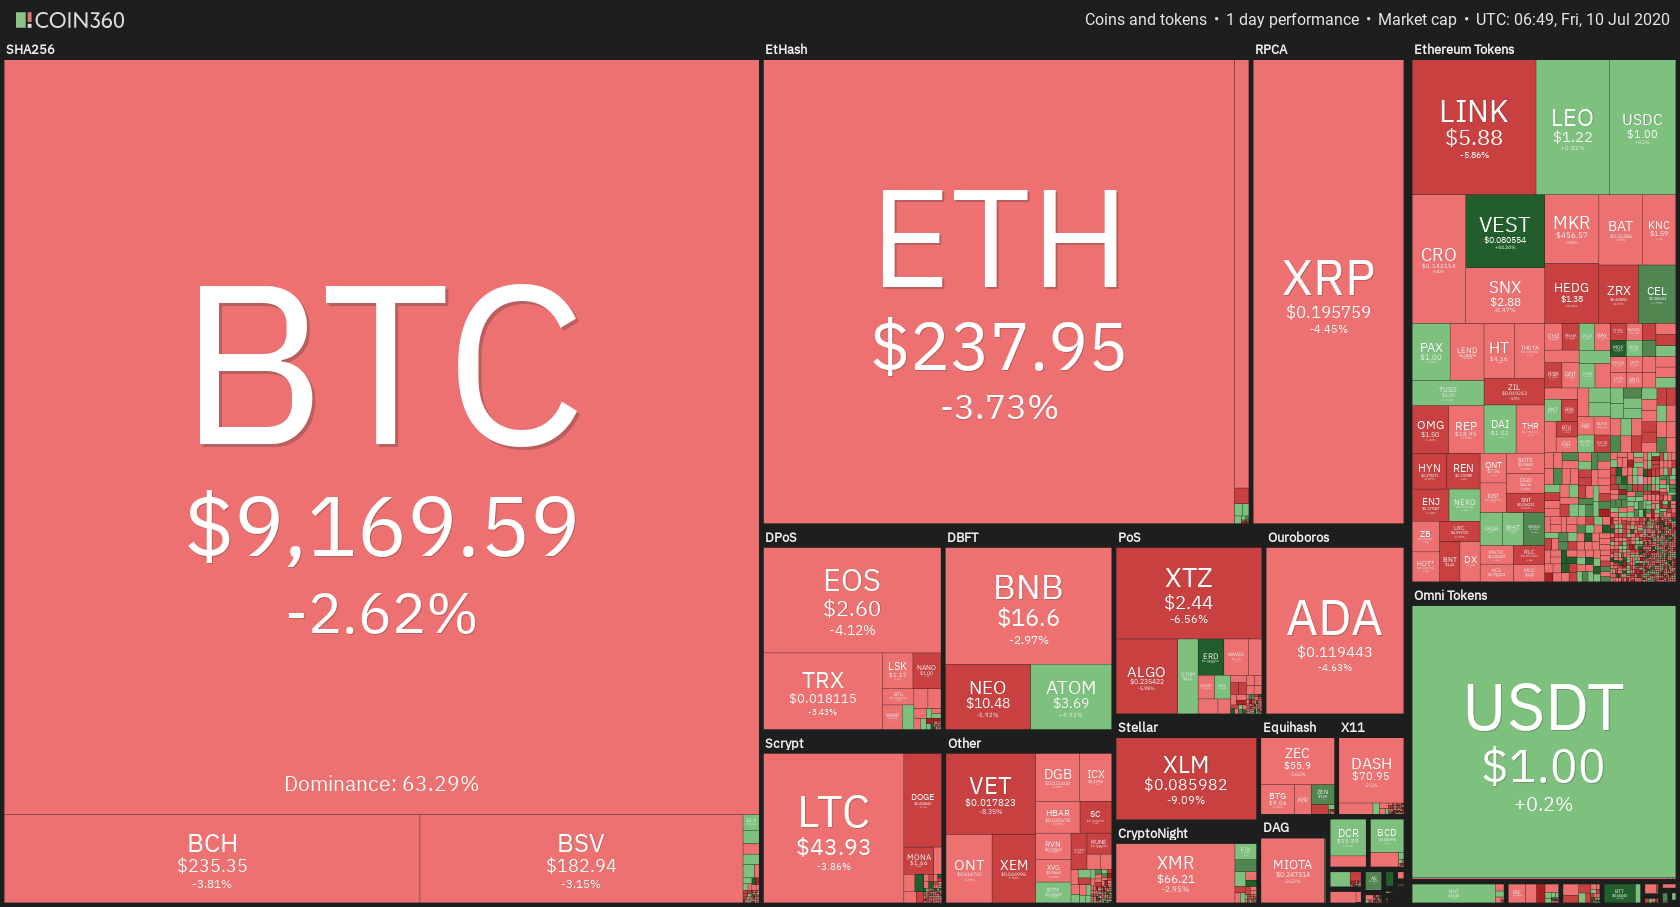
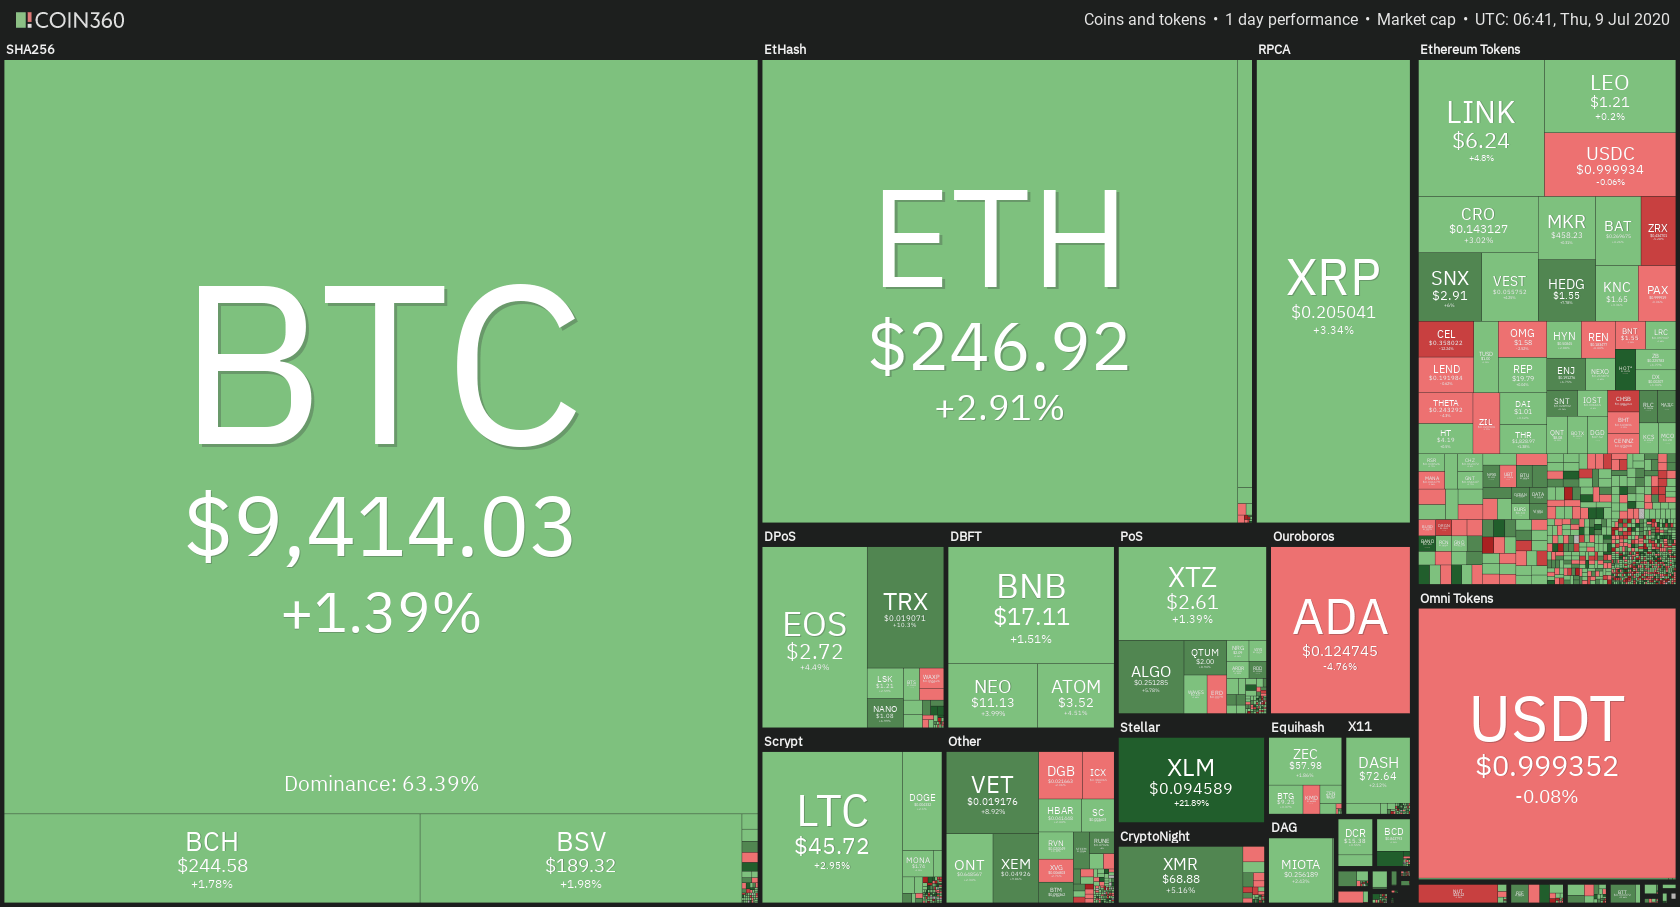
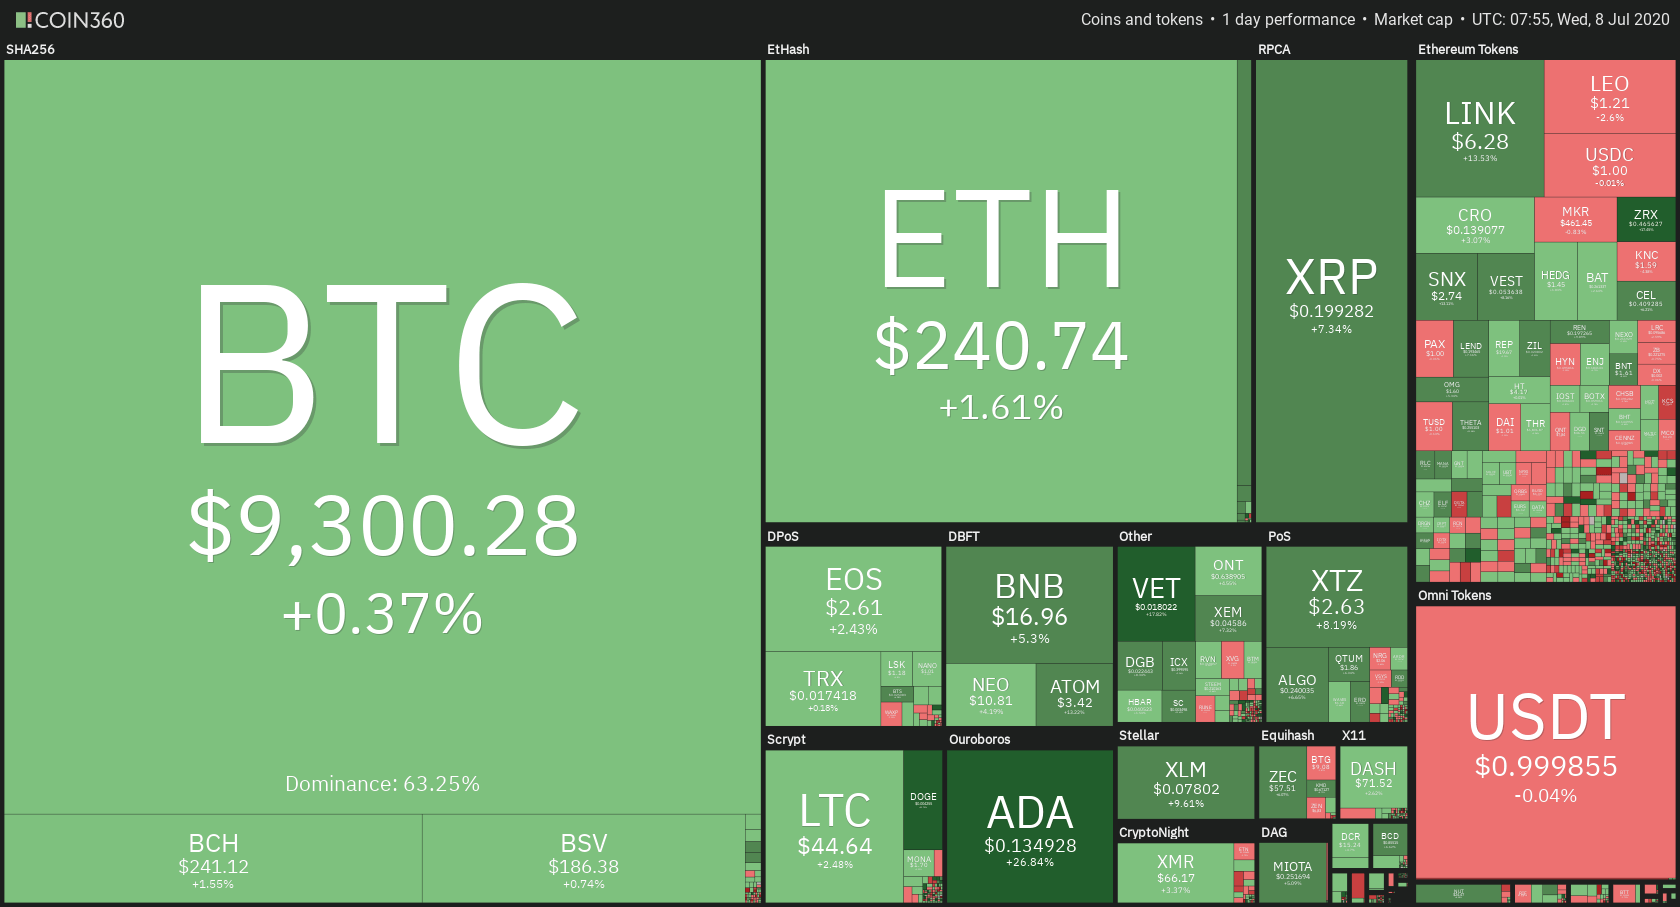
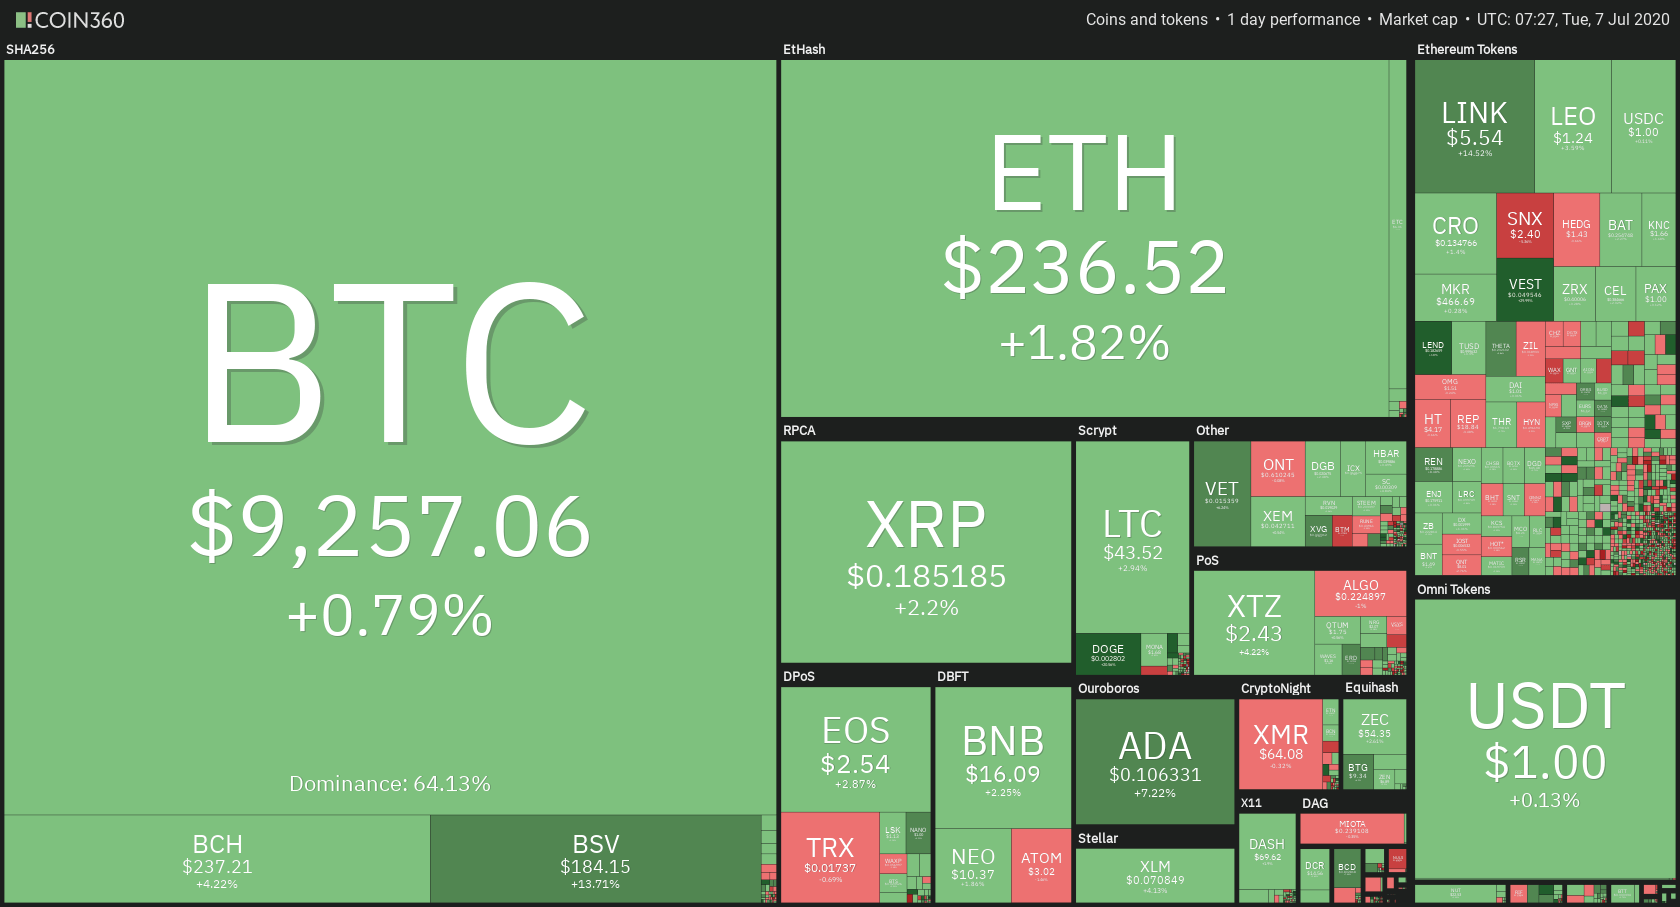
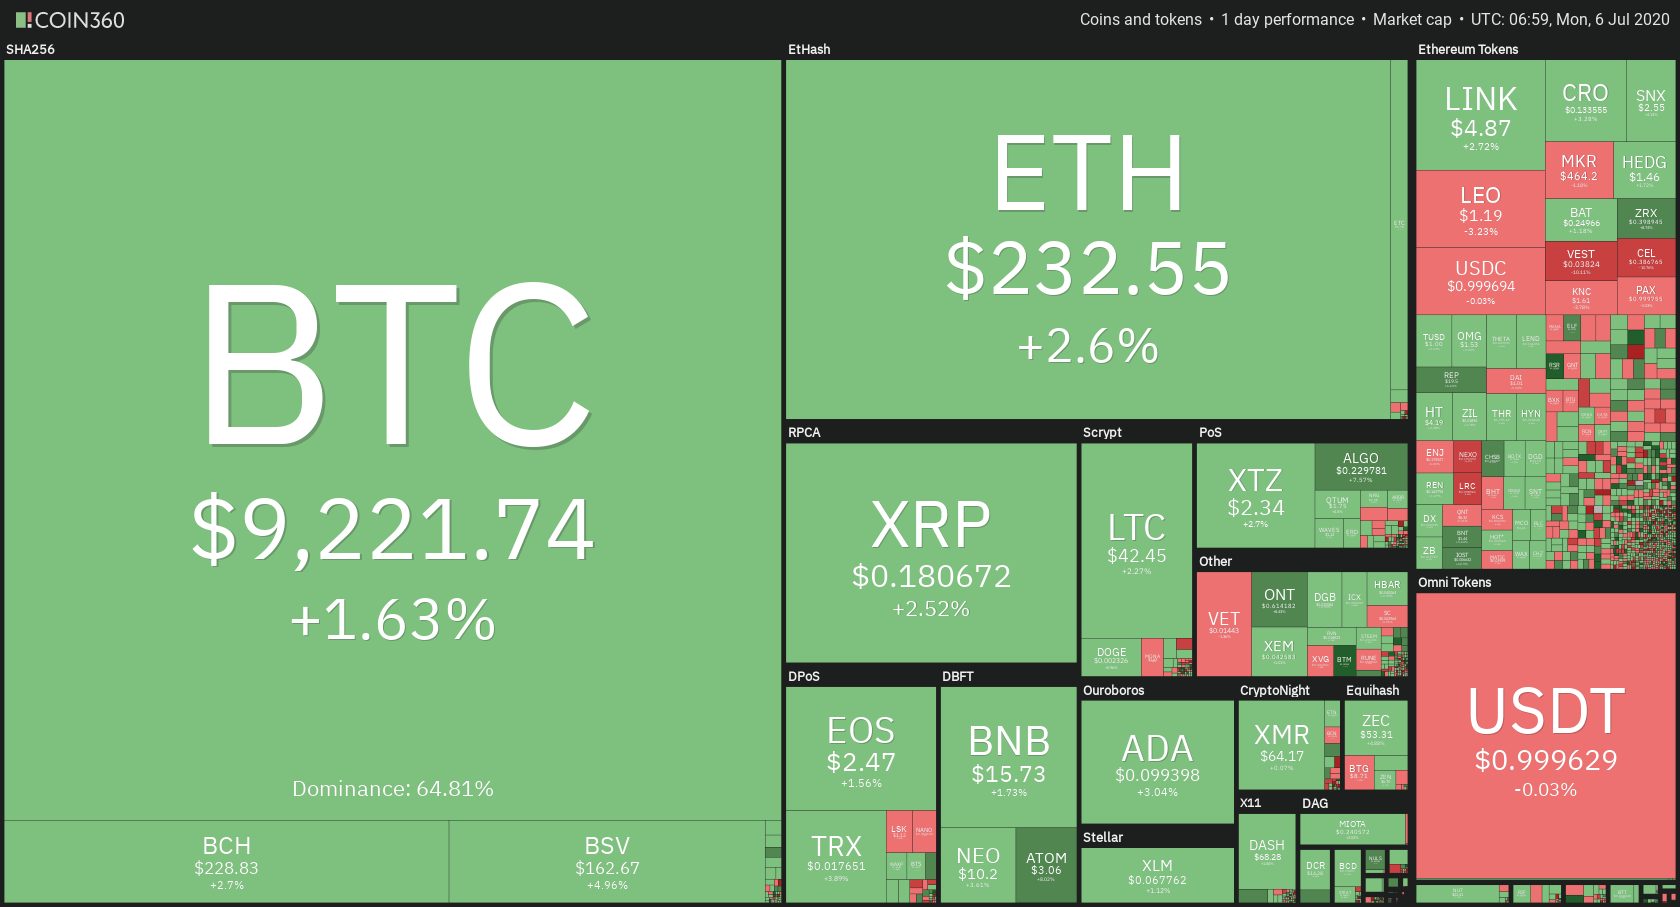
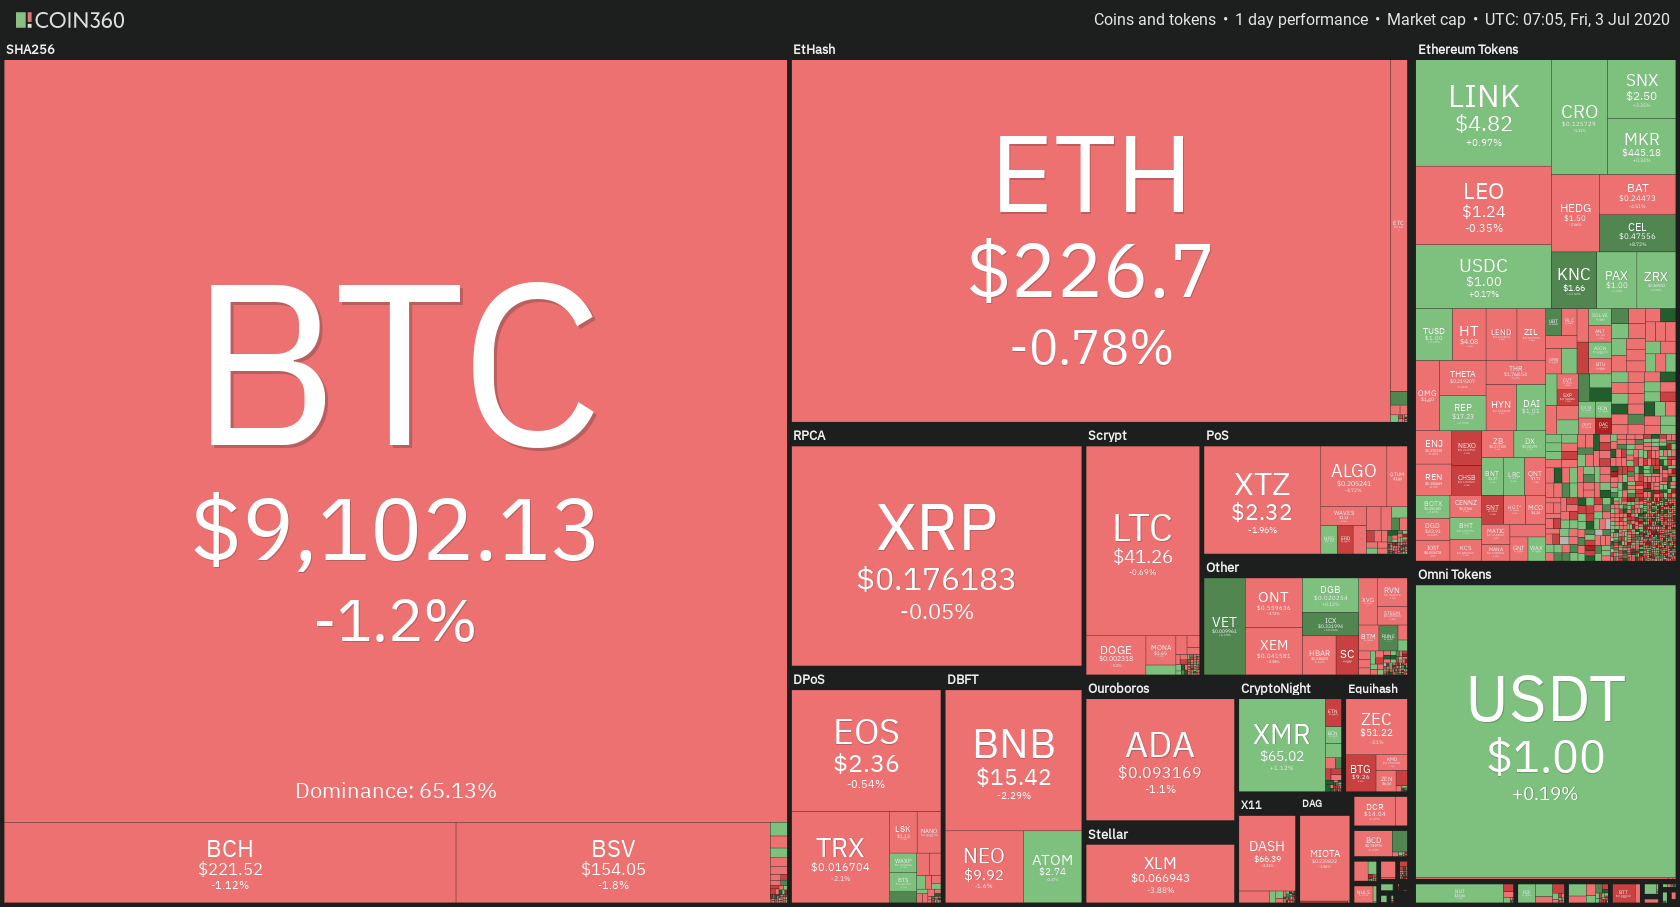
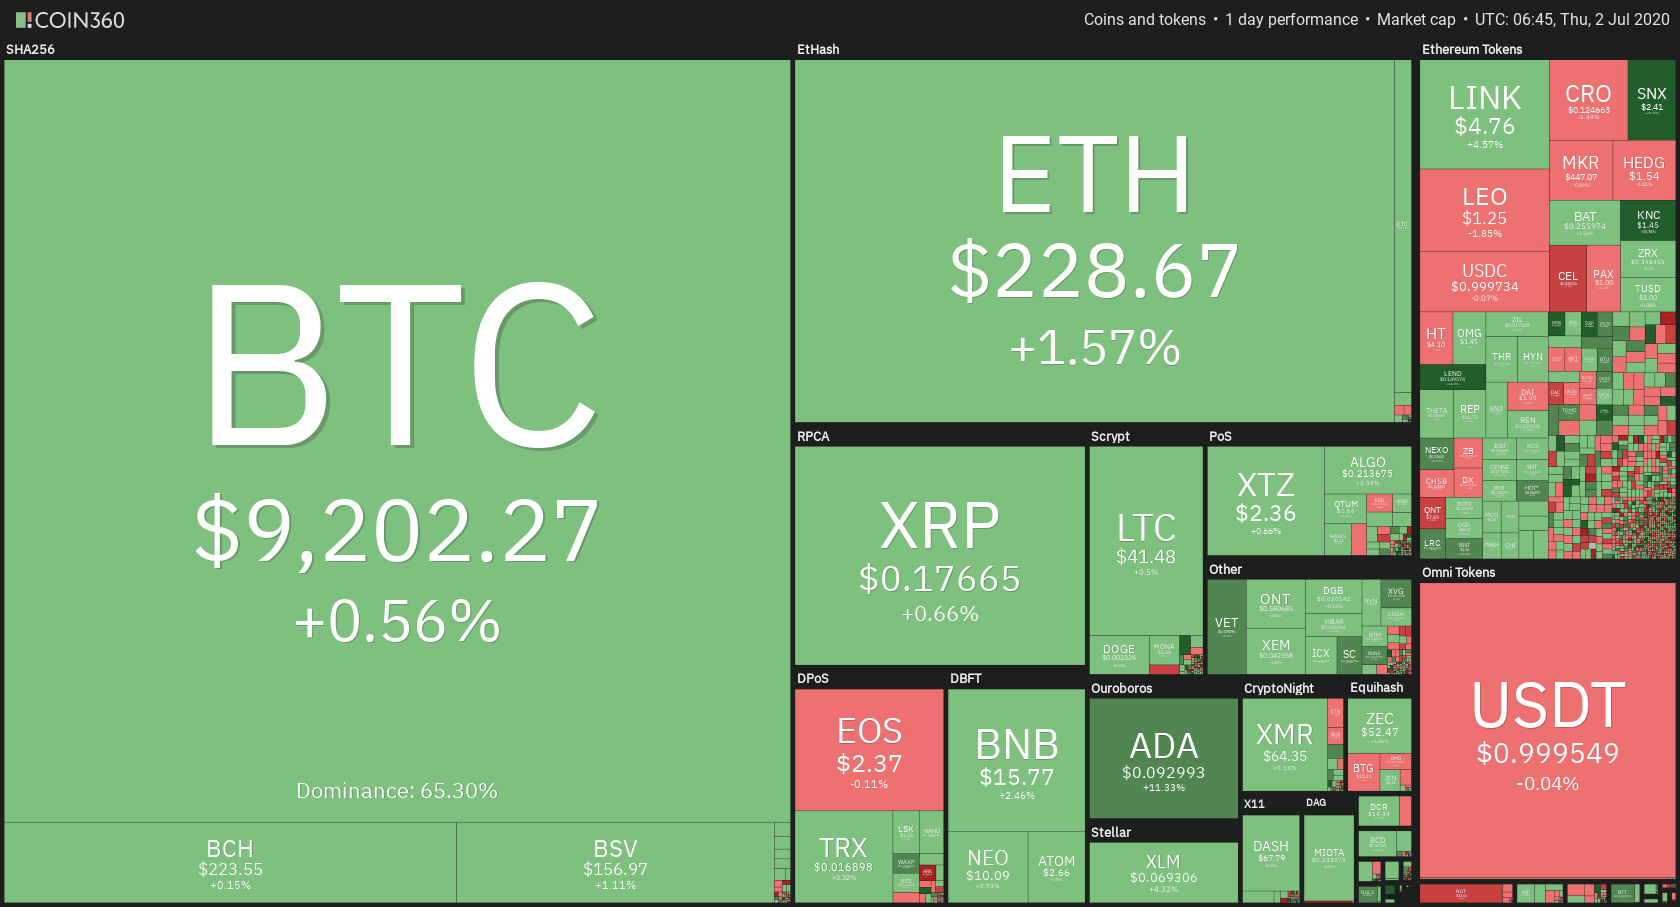
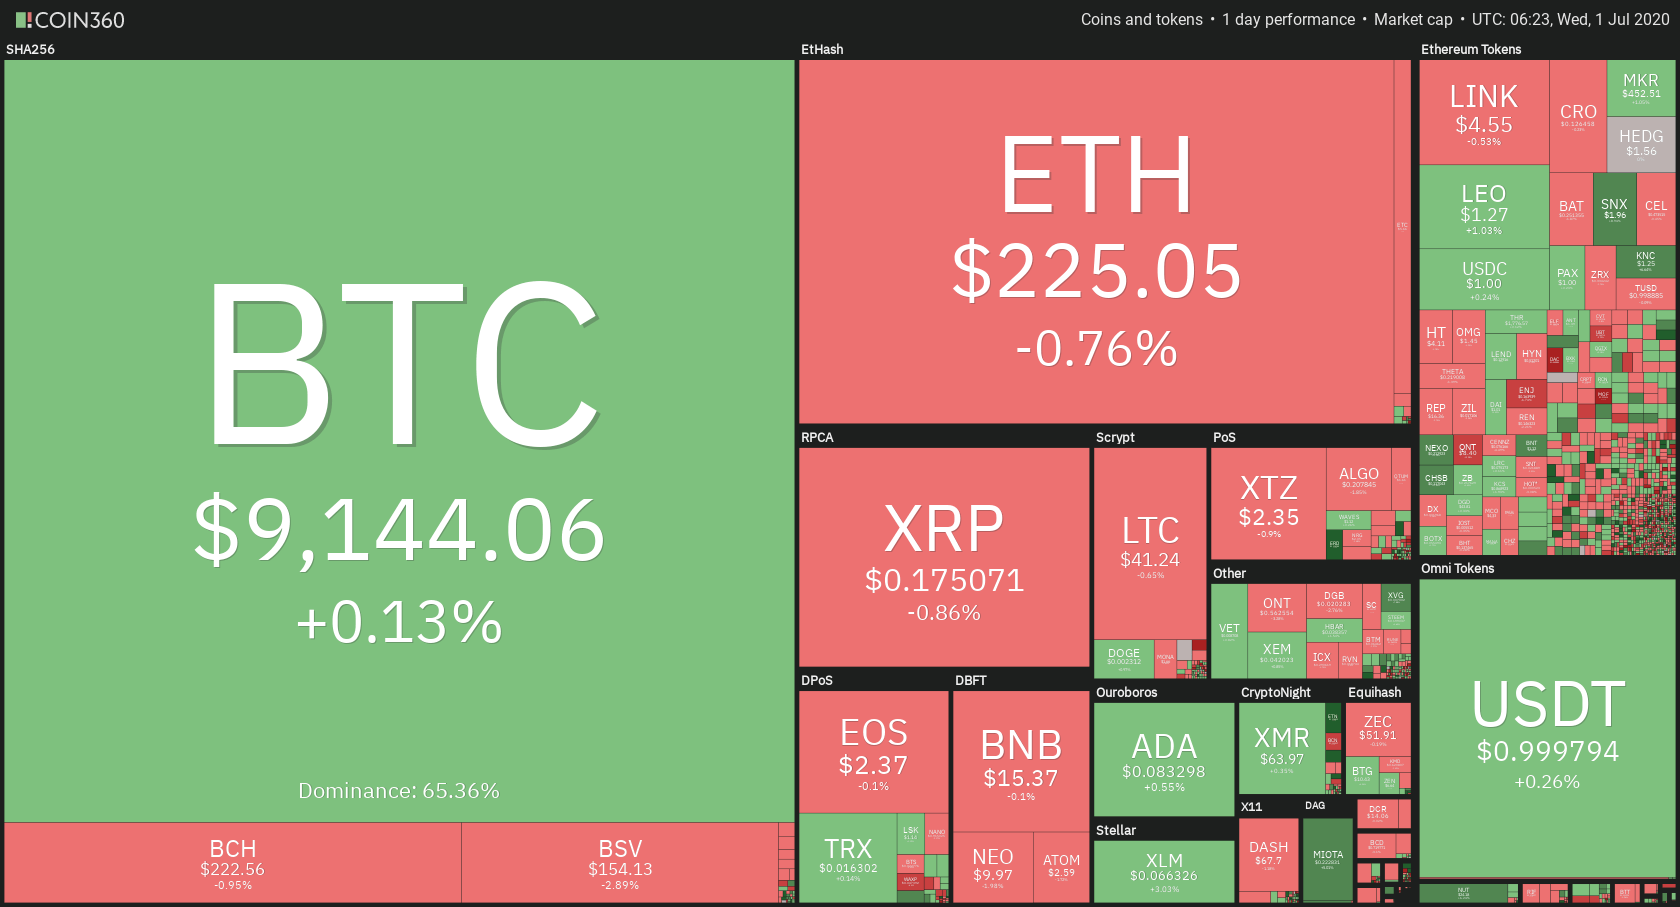
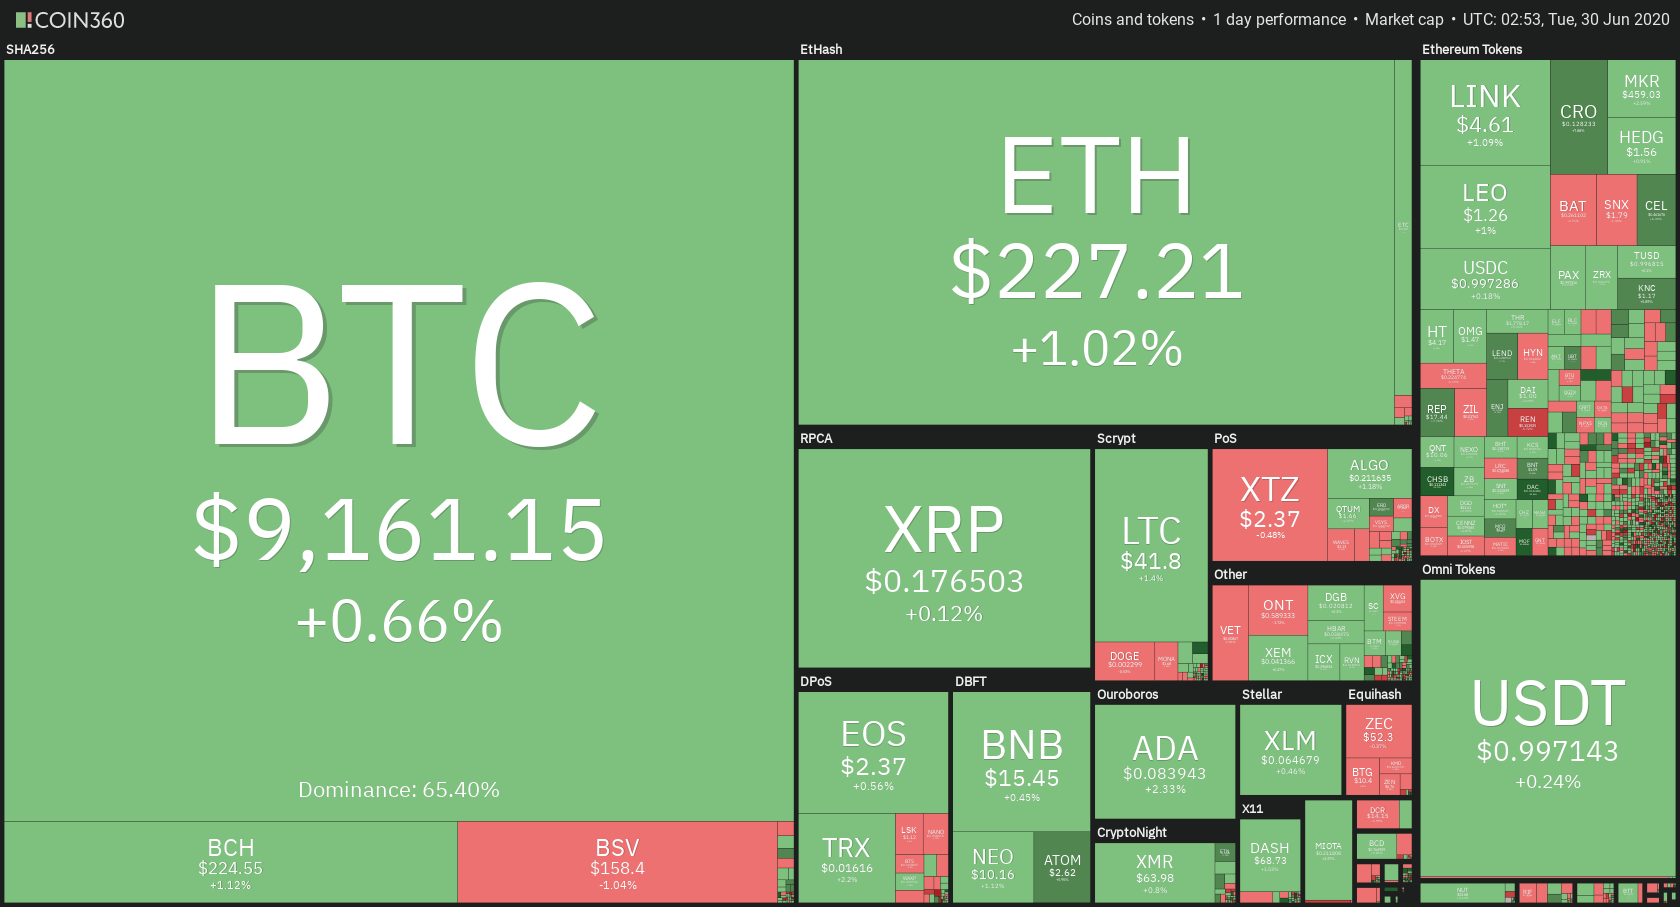
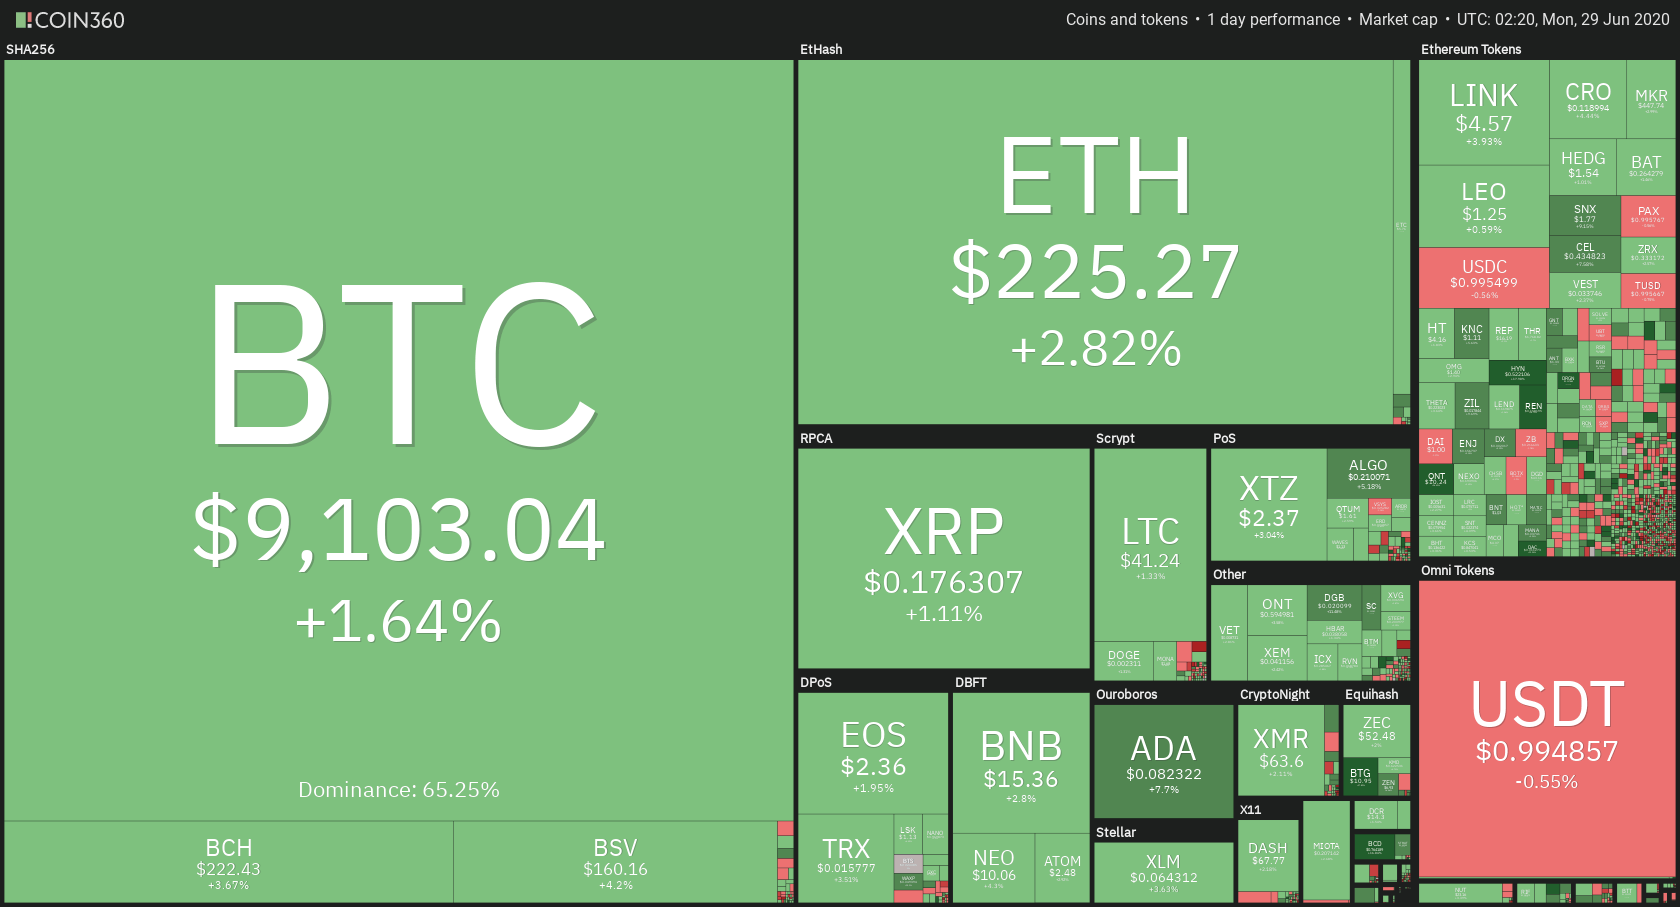
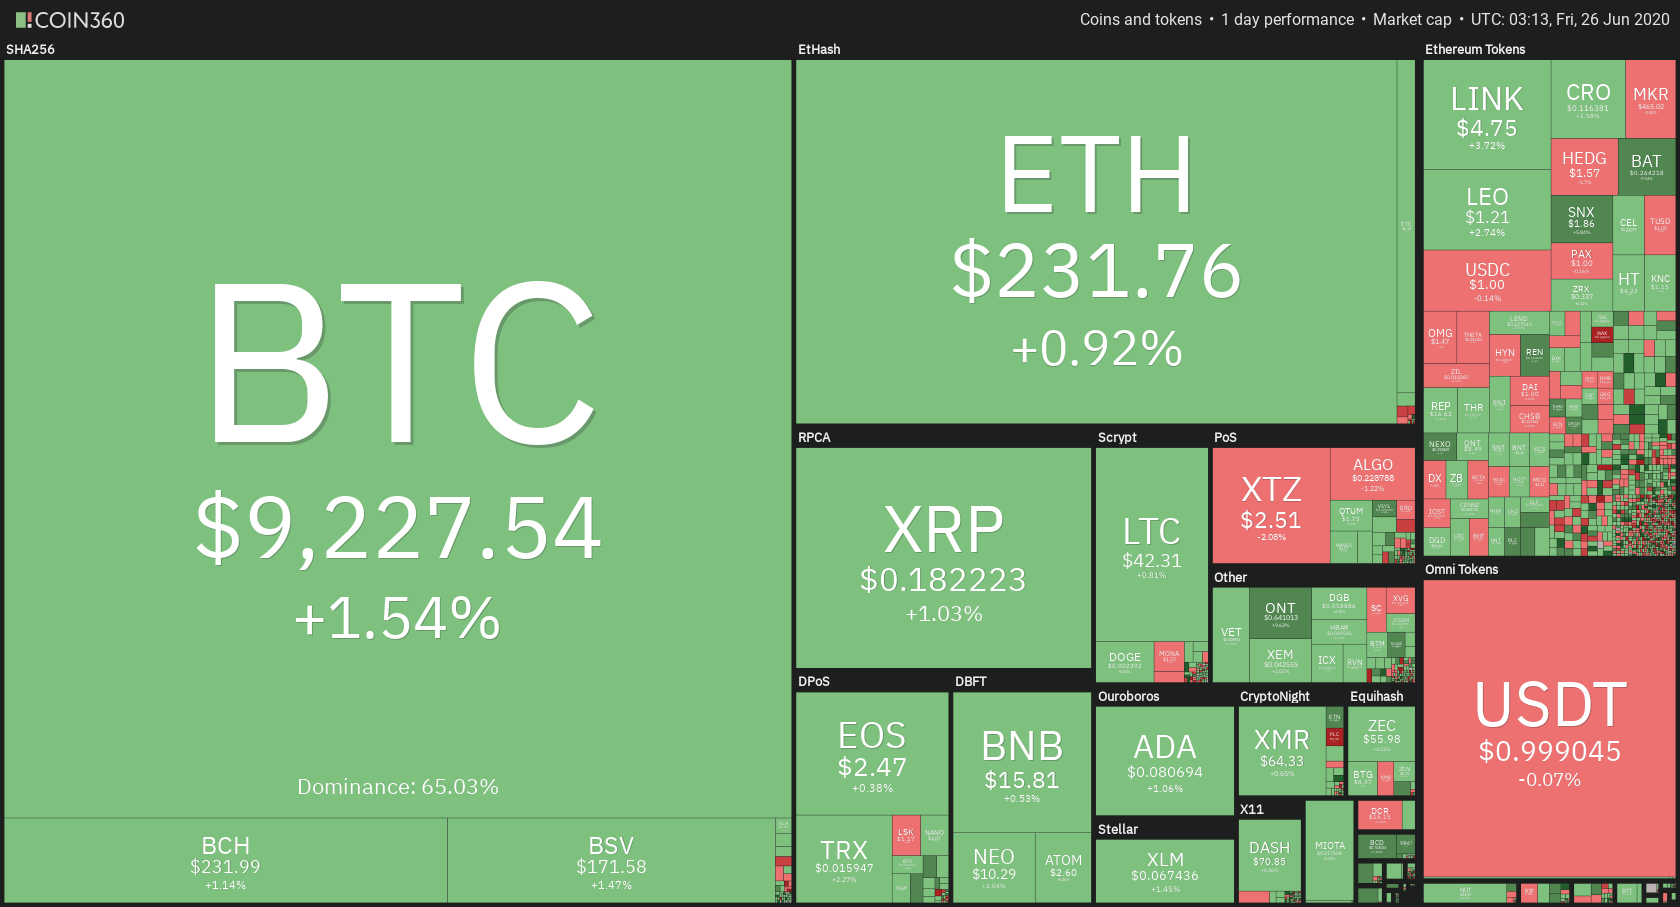
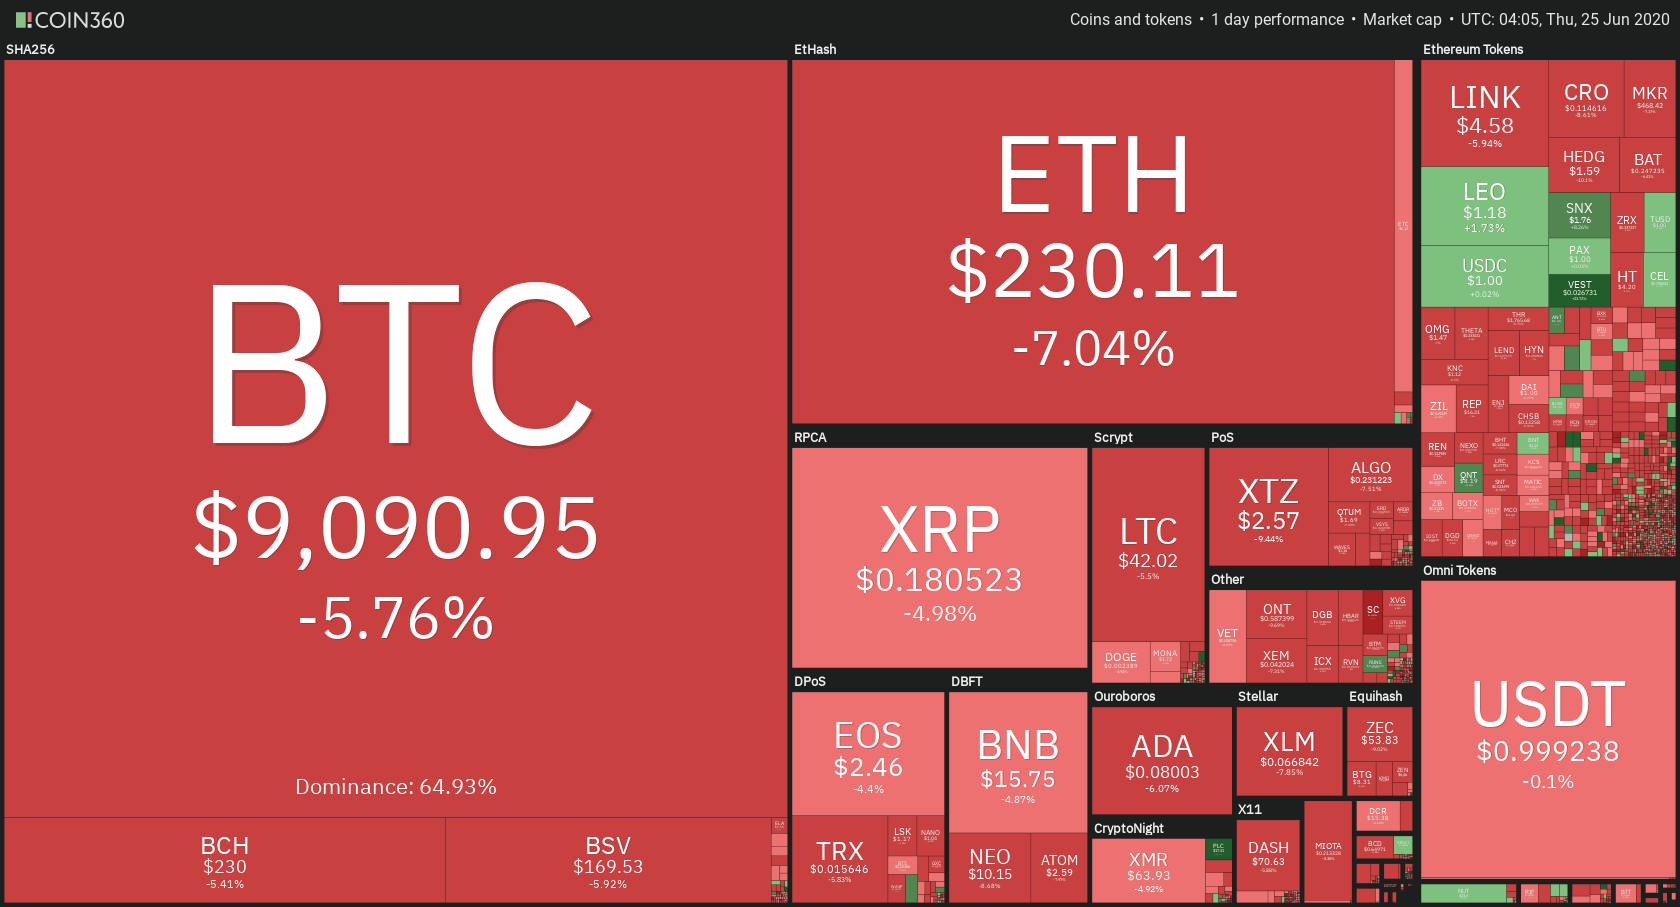
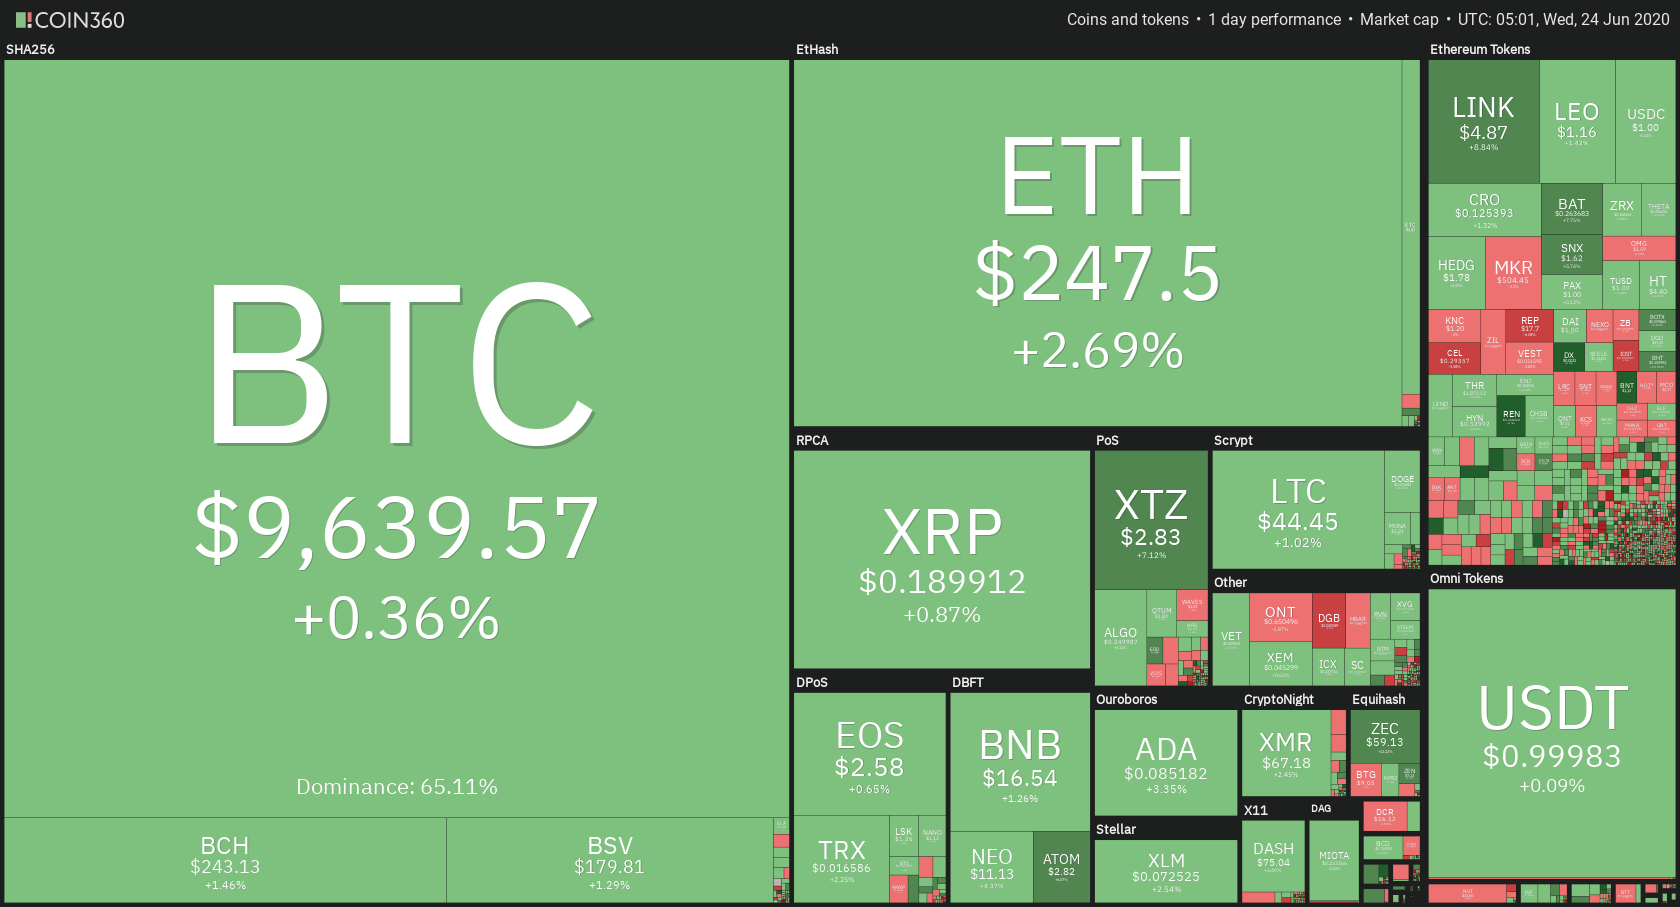
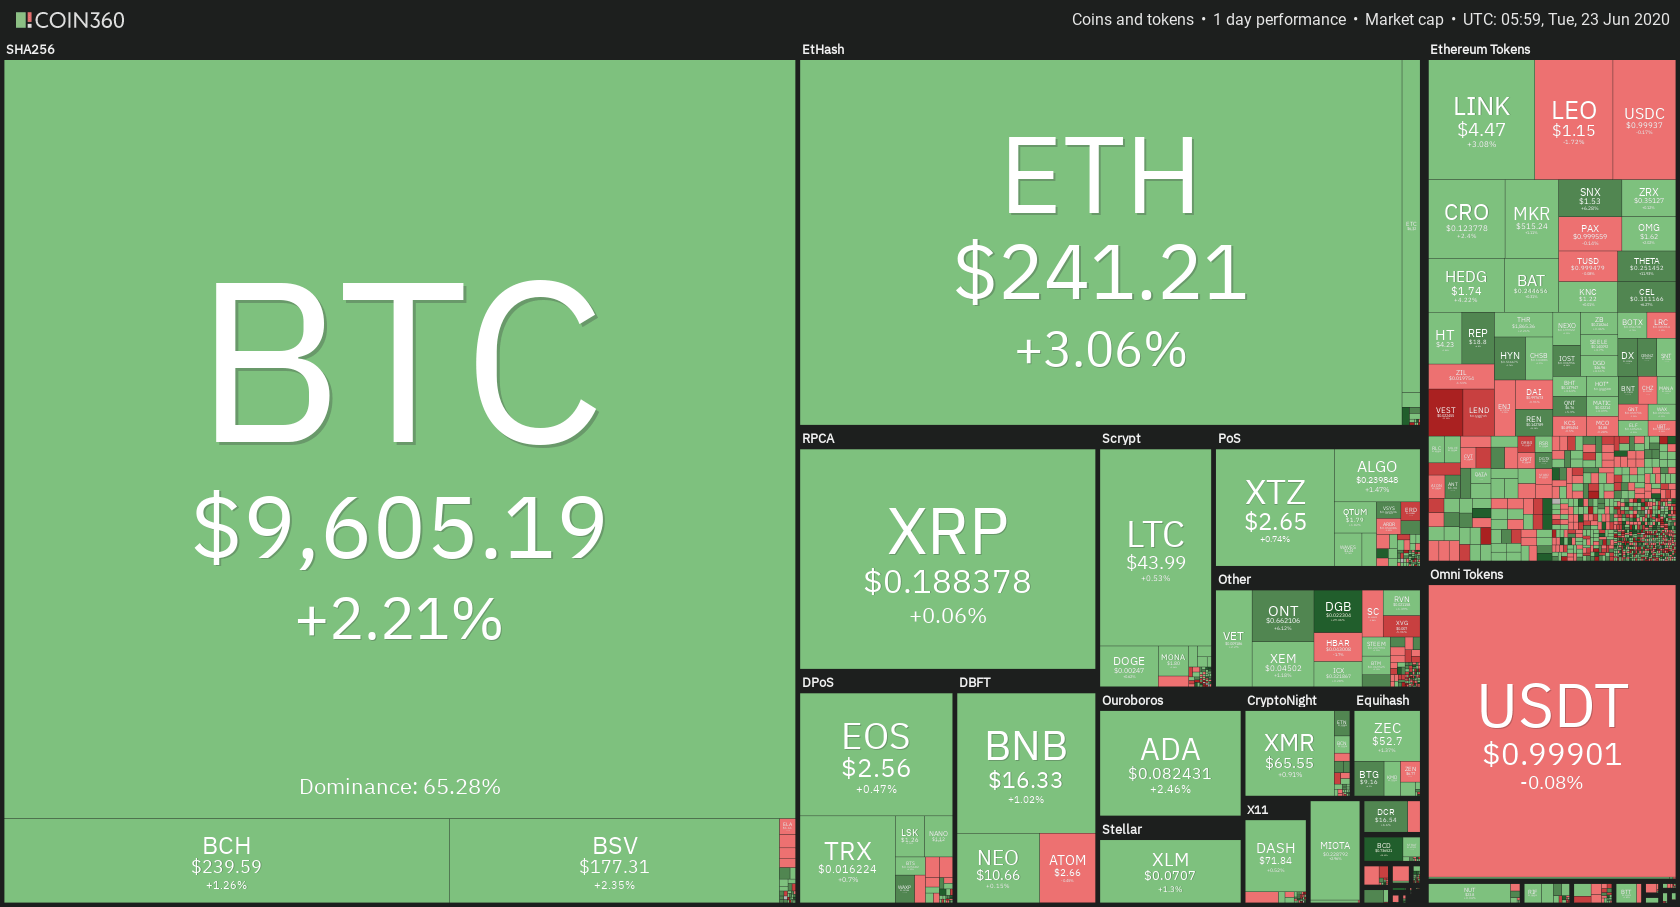
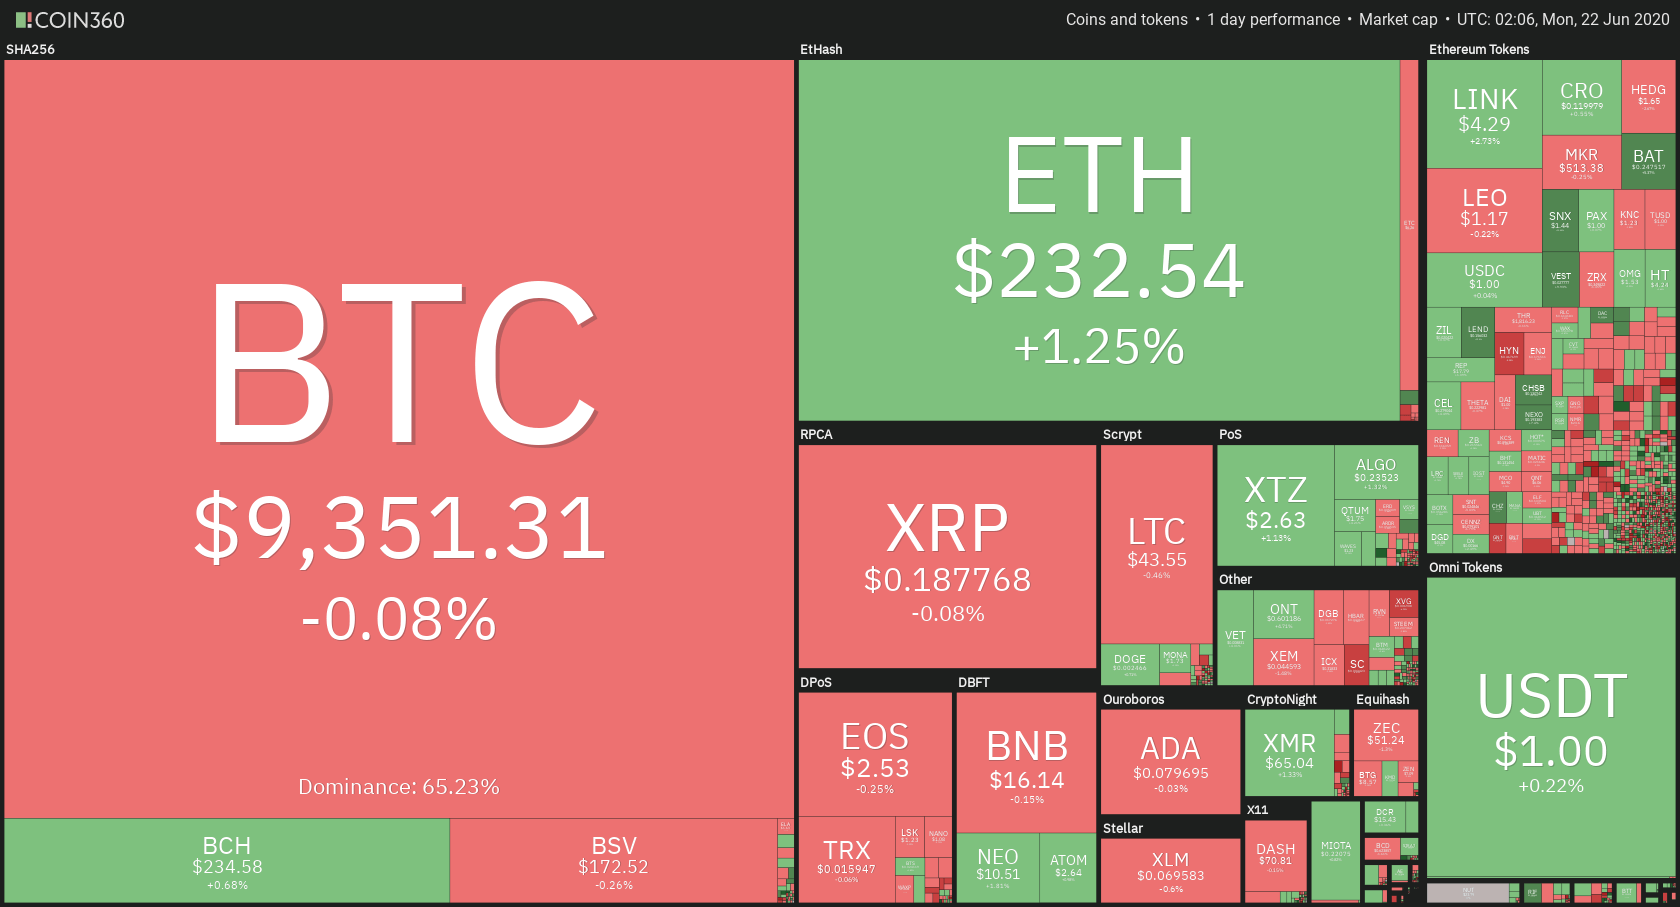
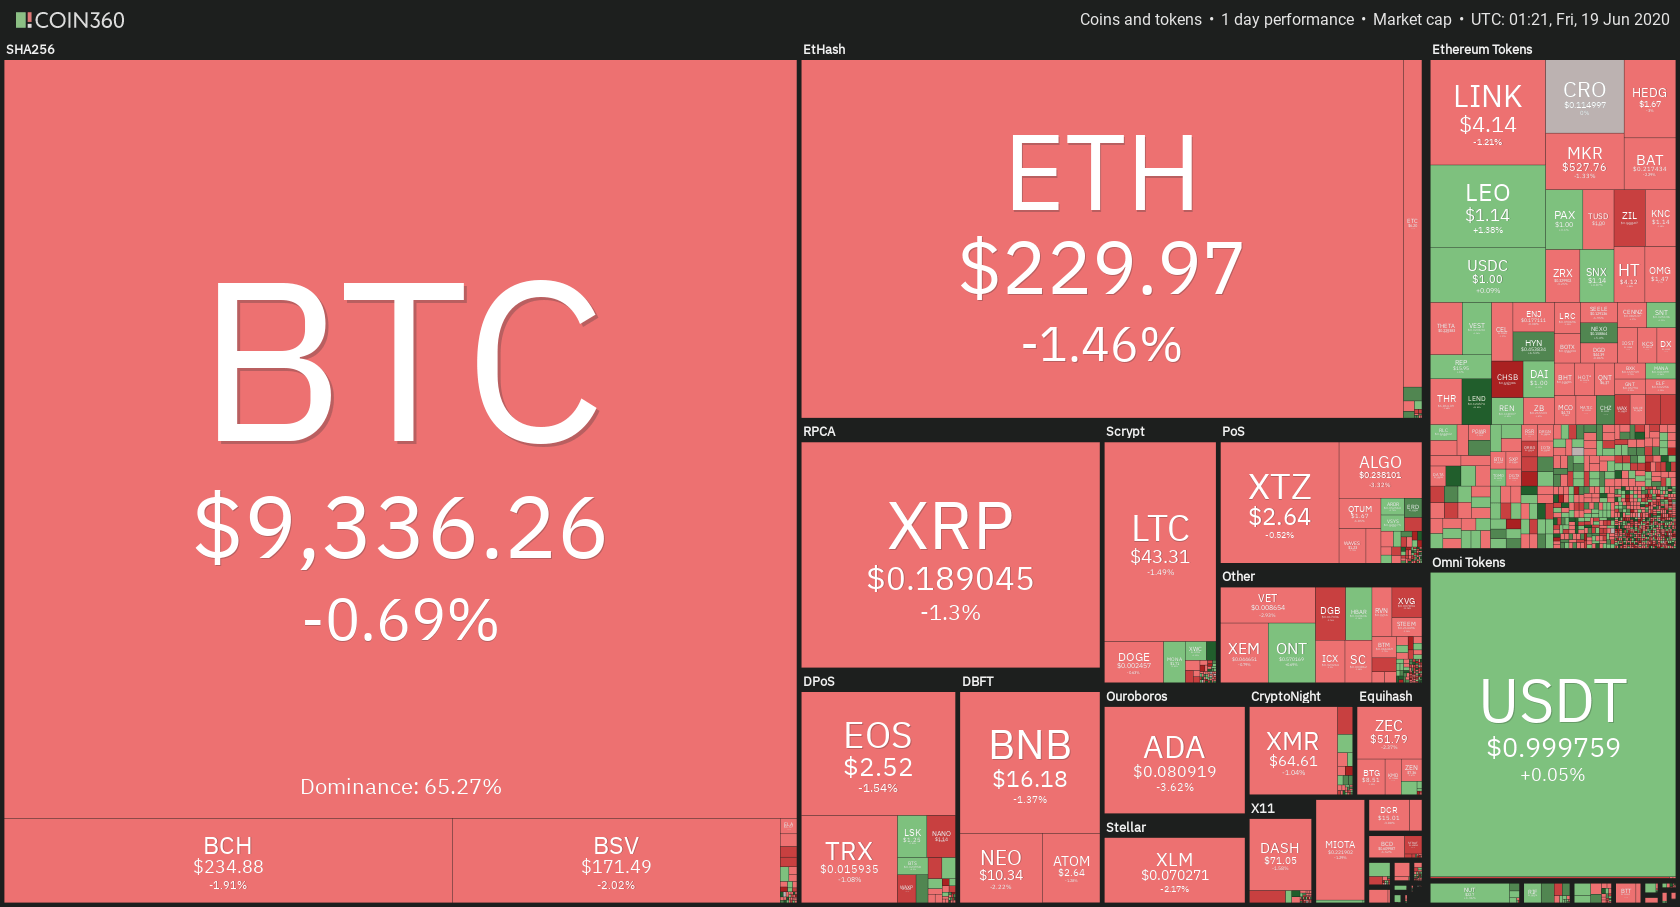
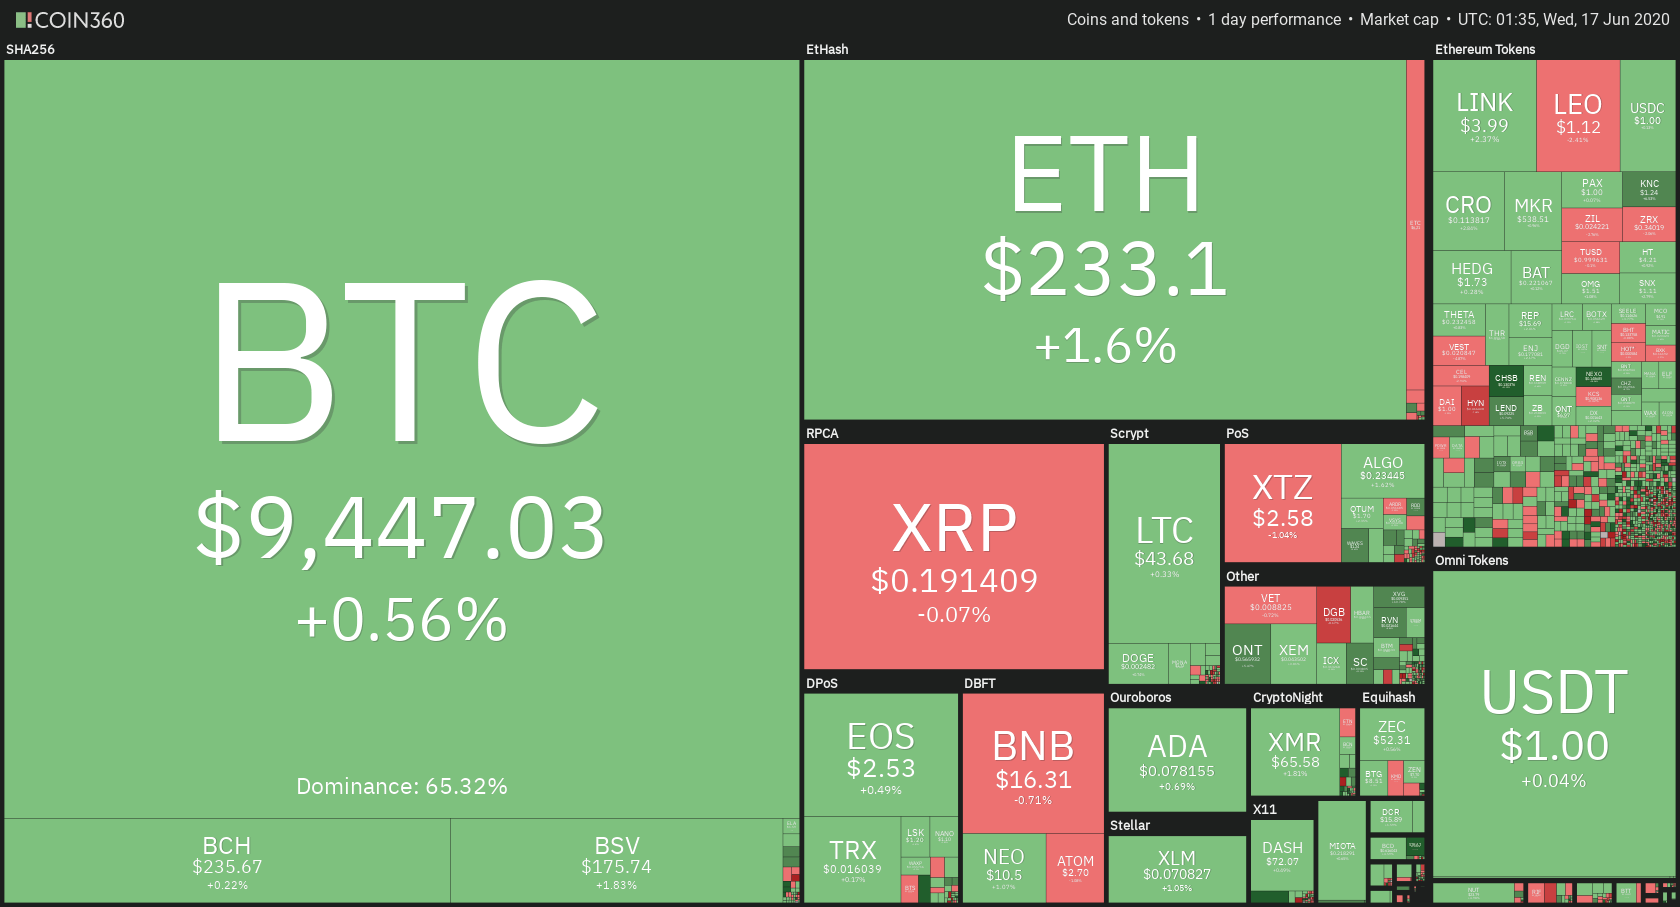
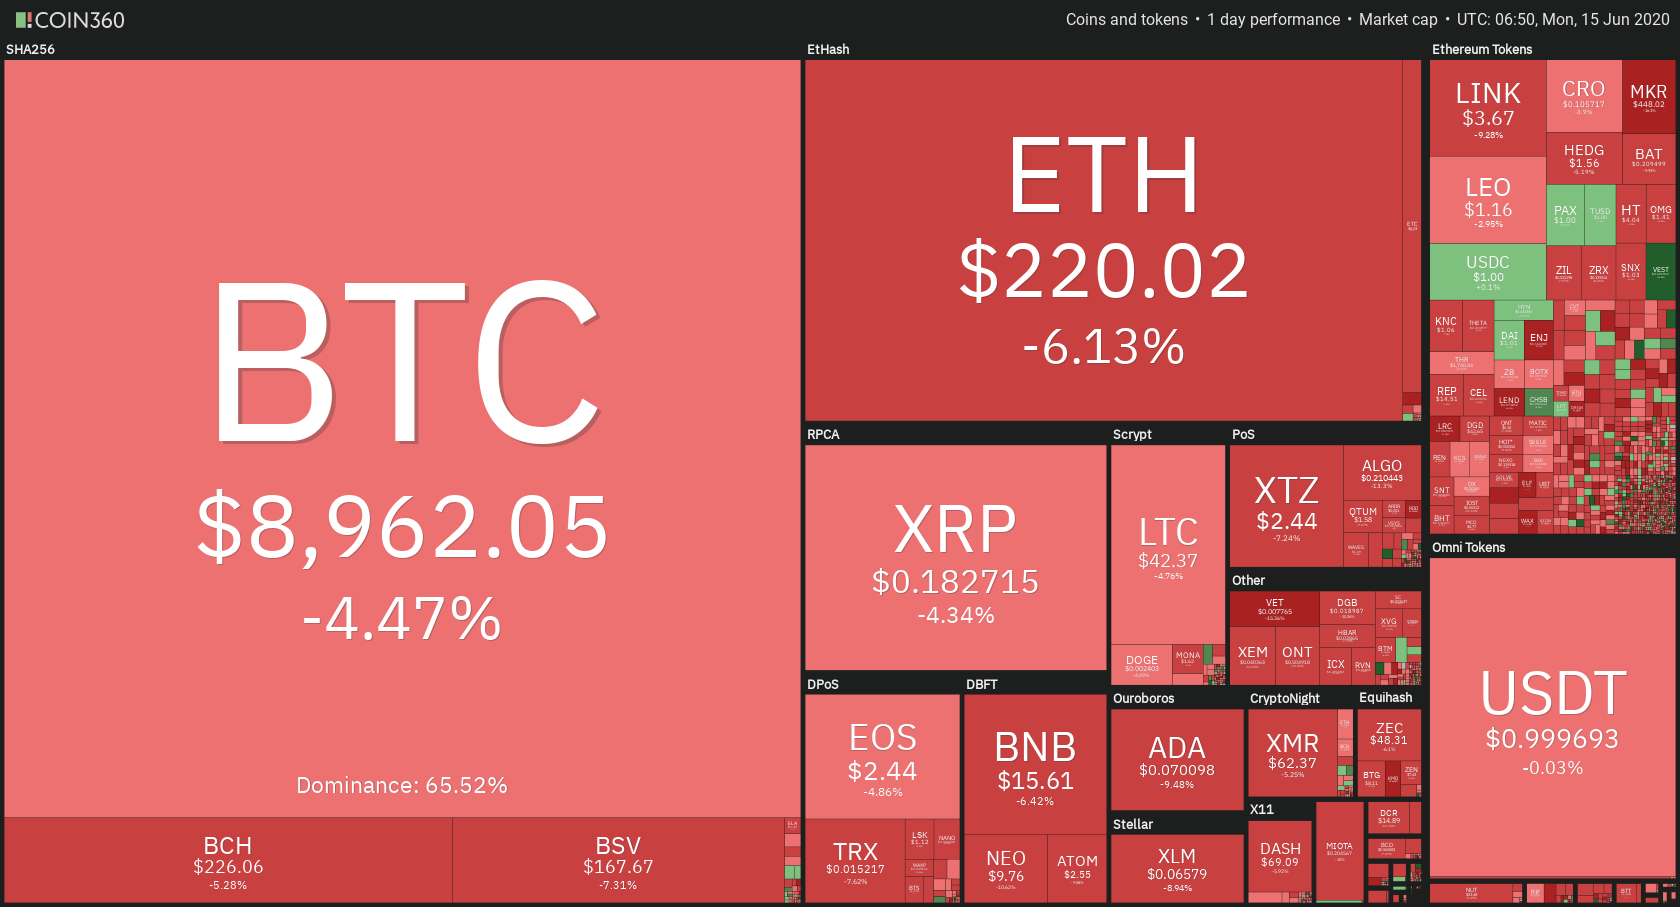
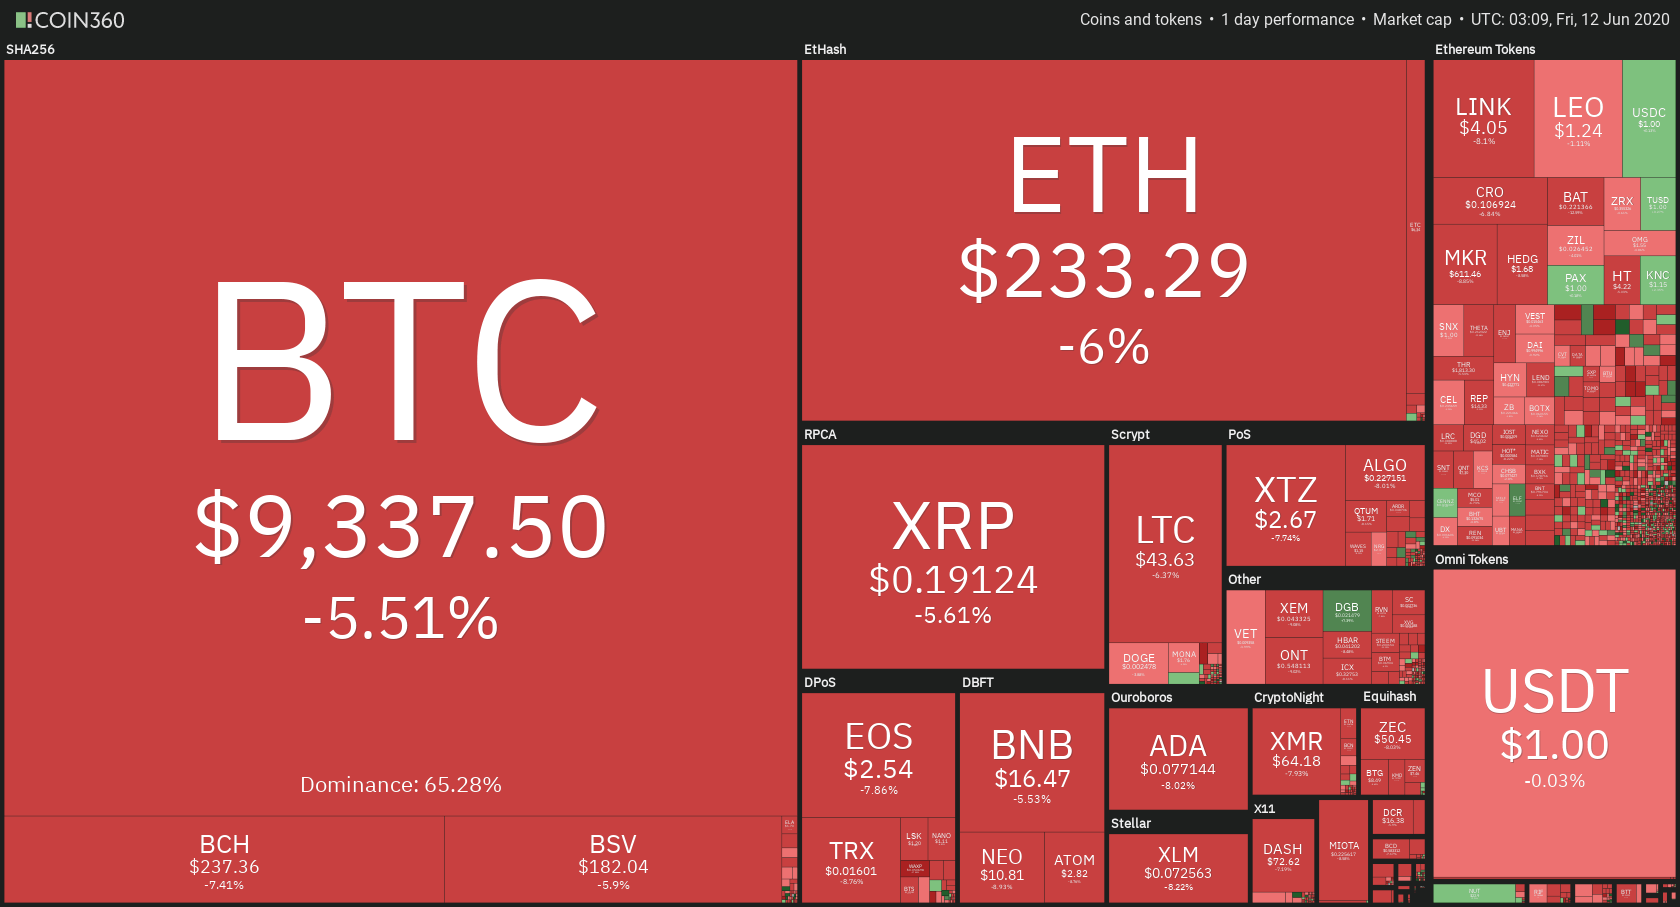
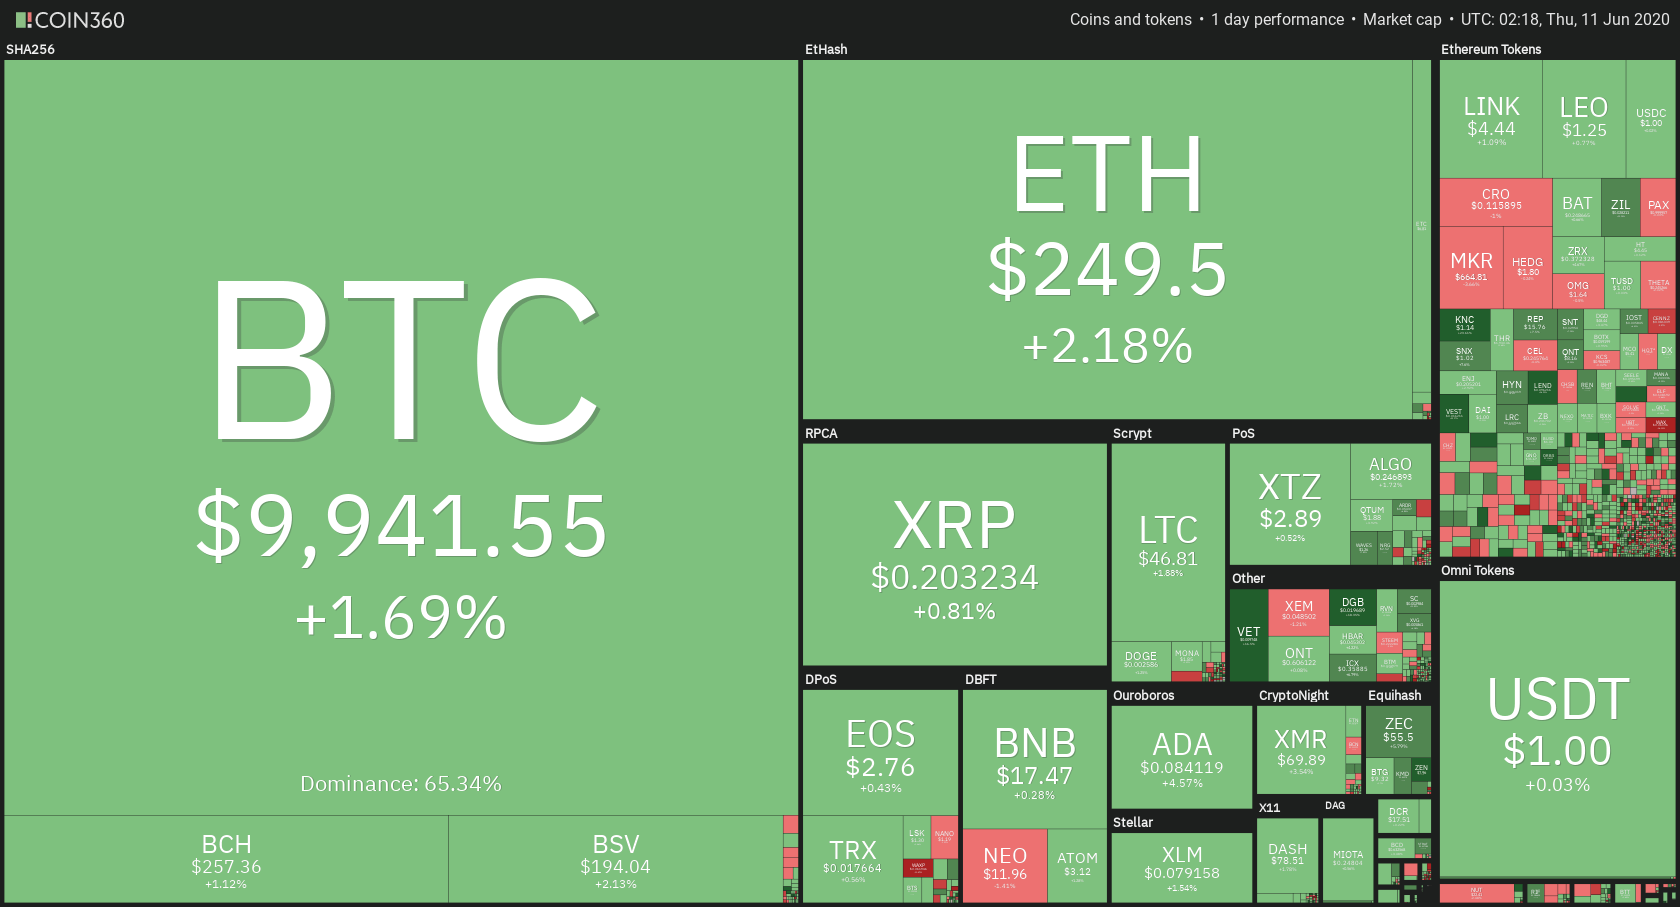
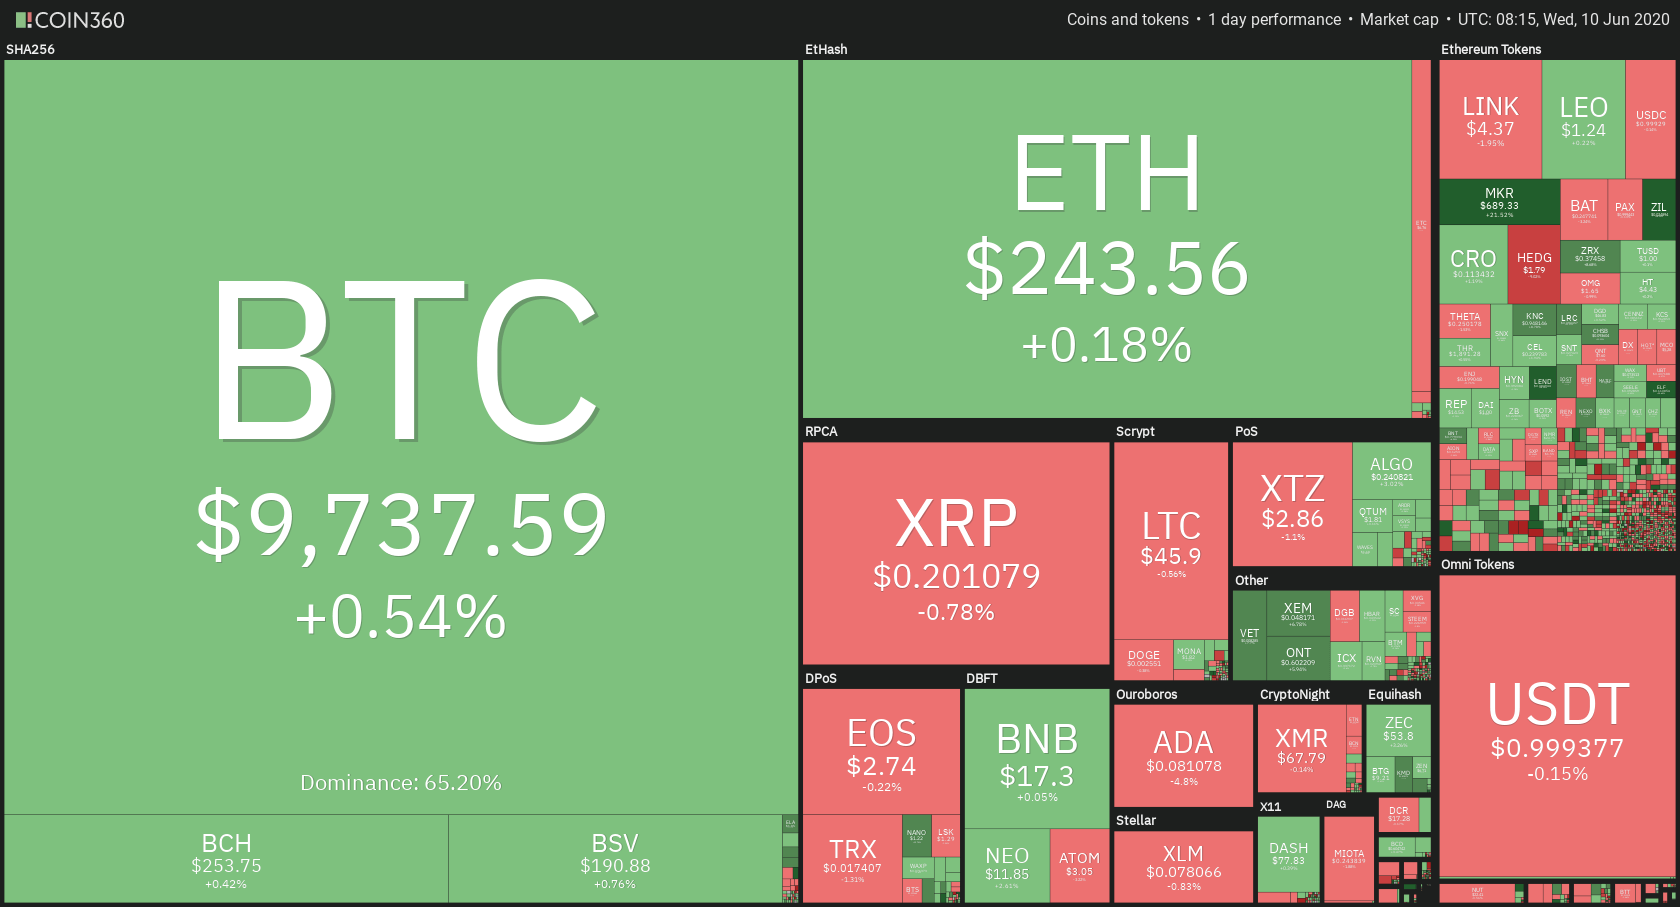
Daily Crypto Sector Heat Map
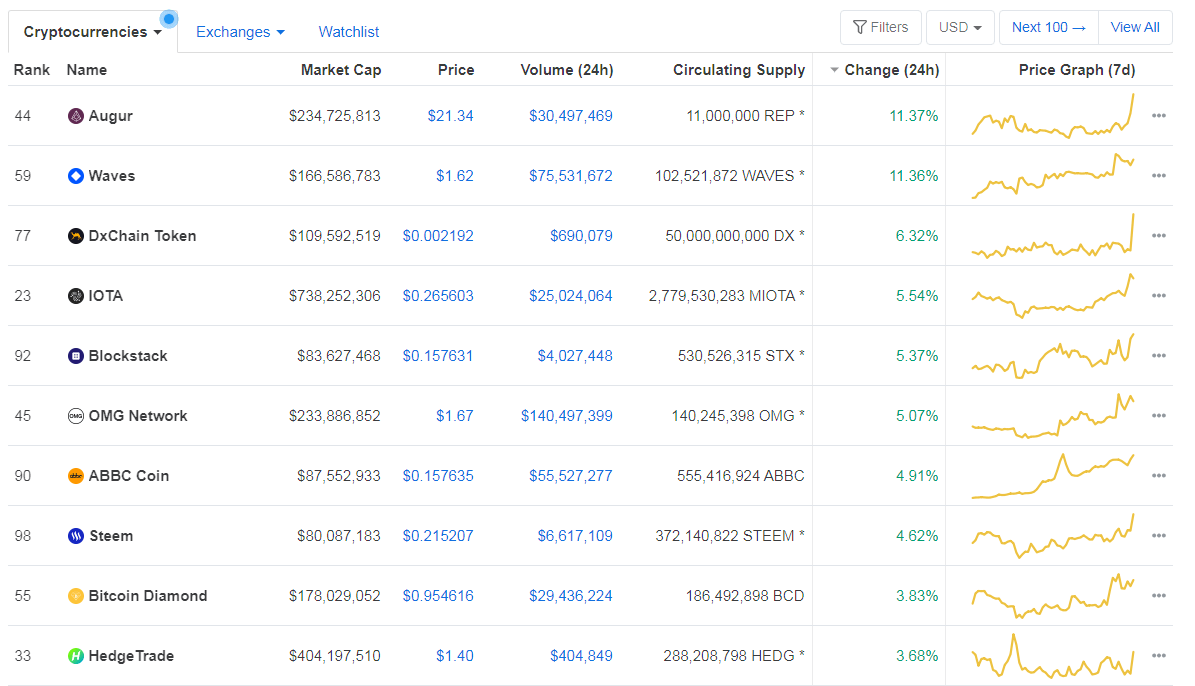
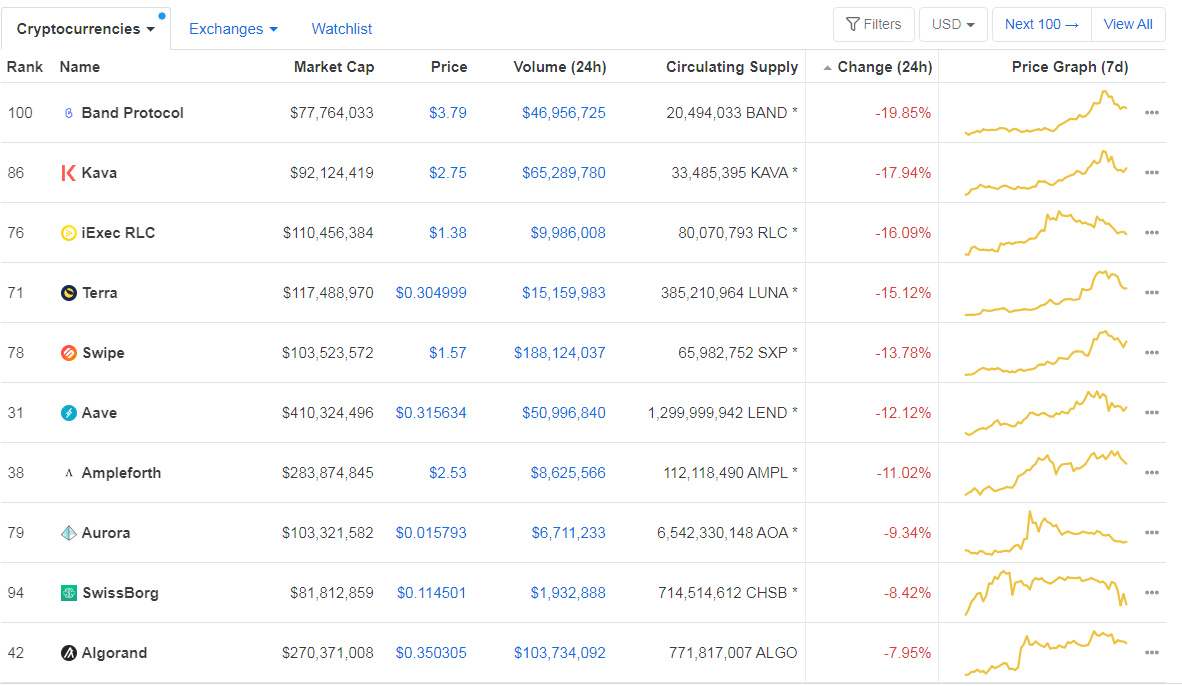
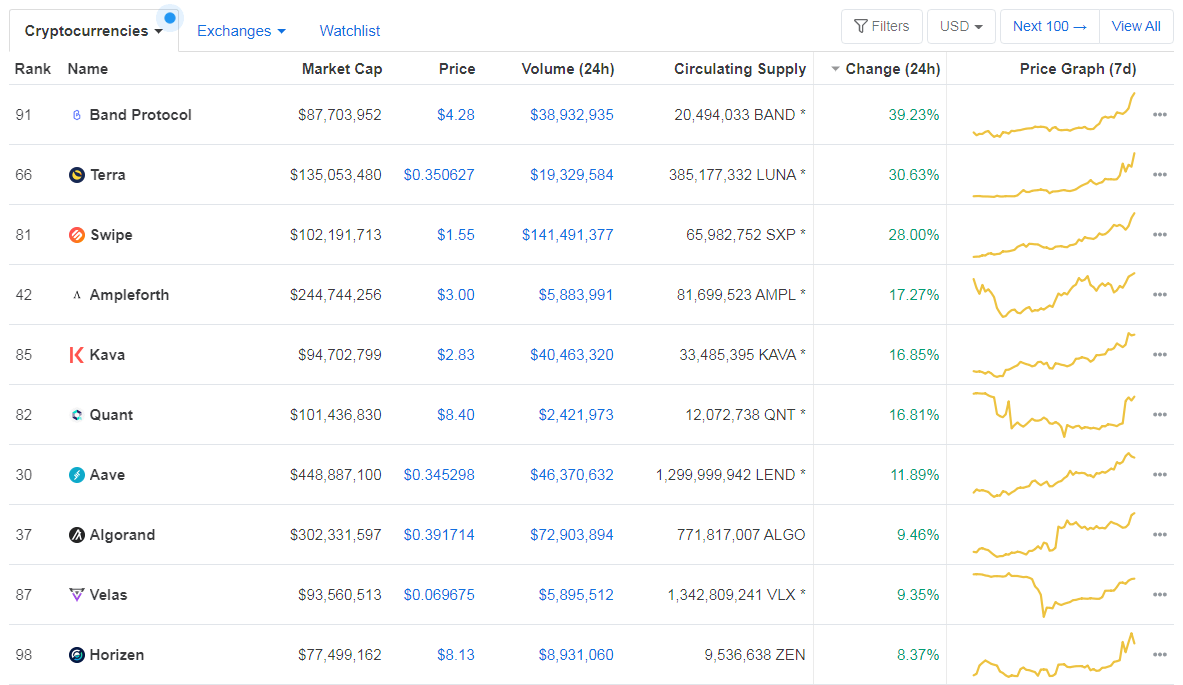
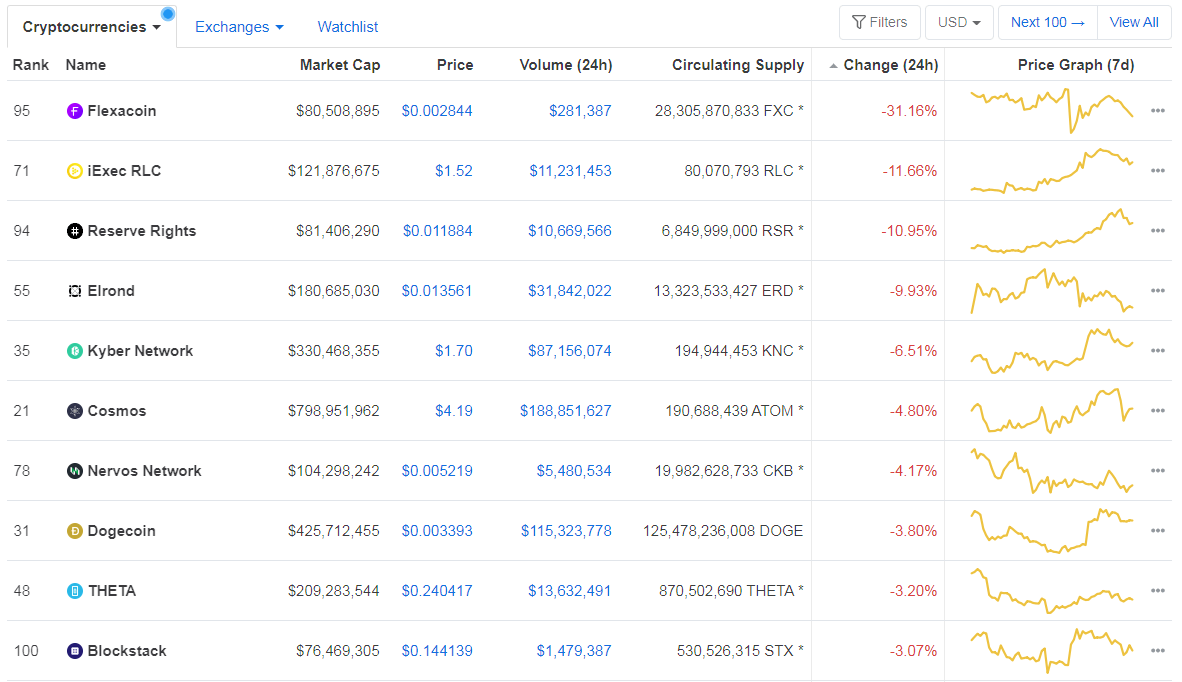
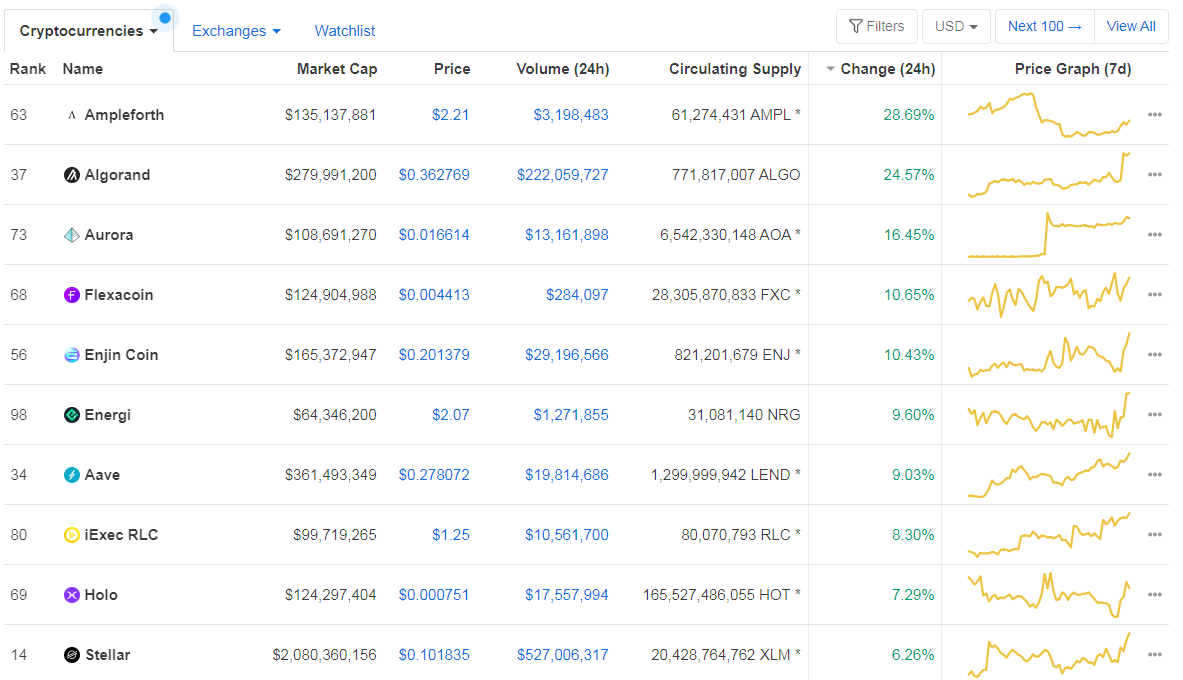
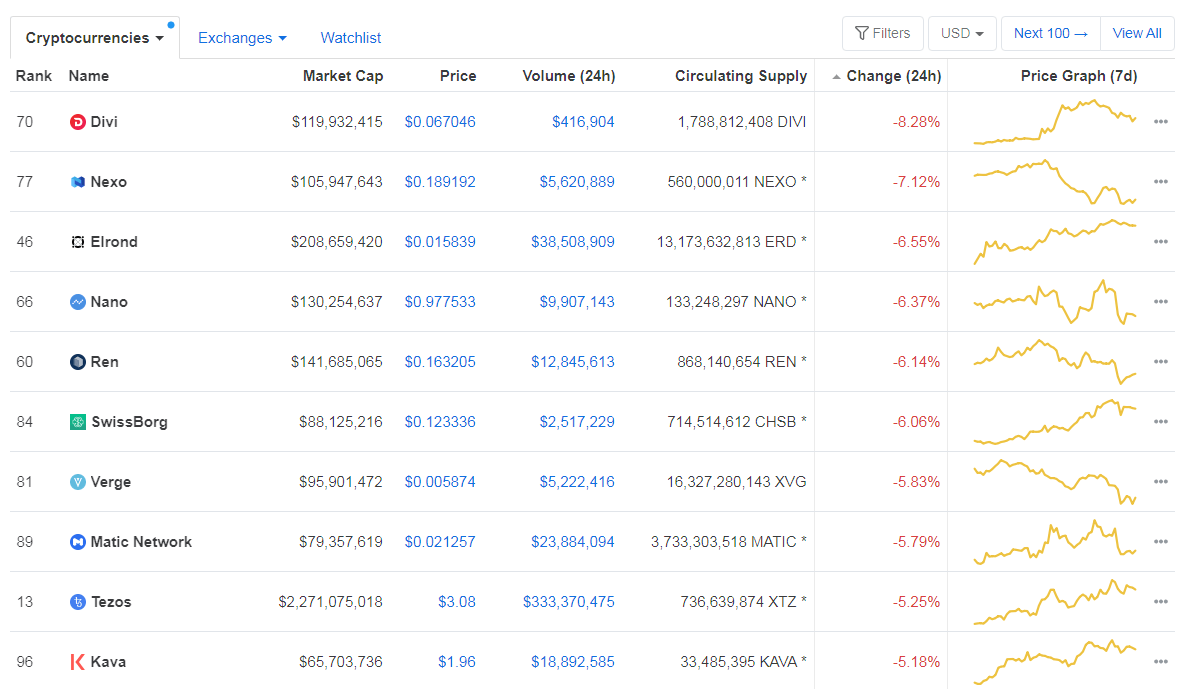
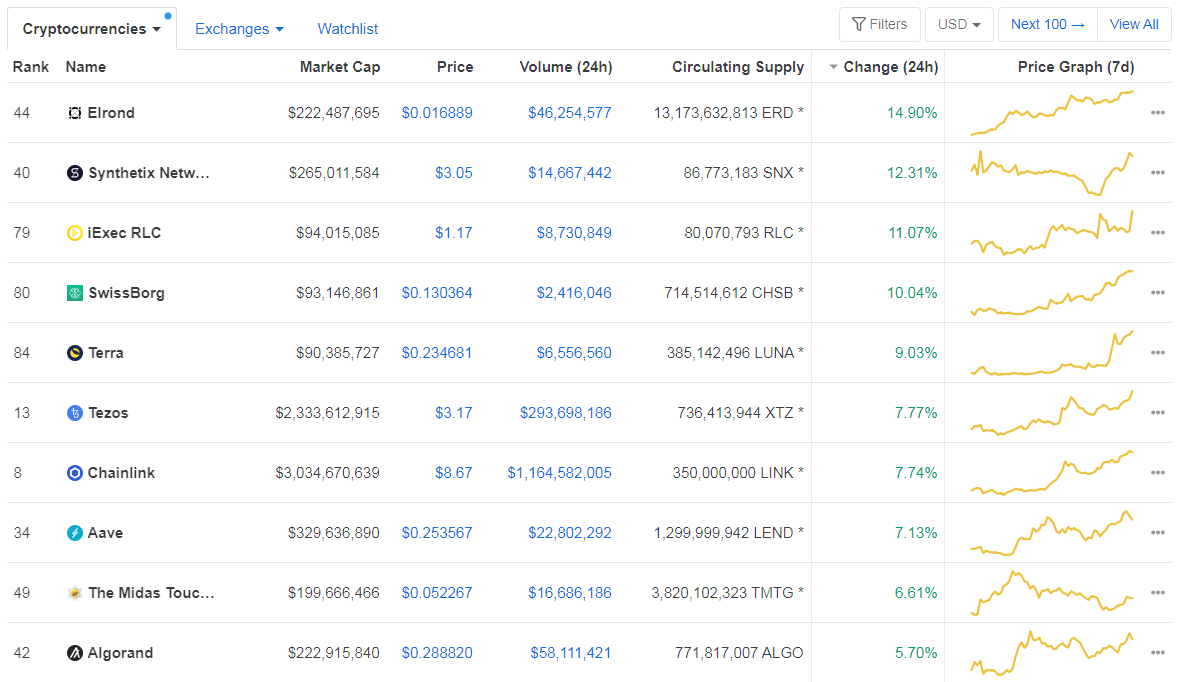
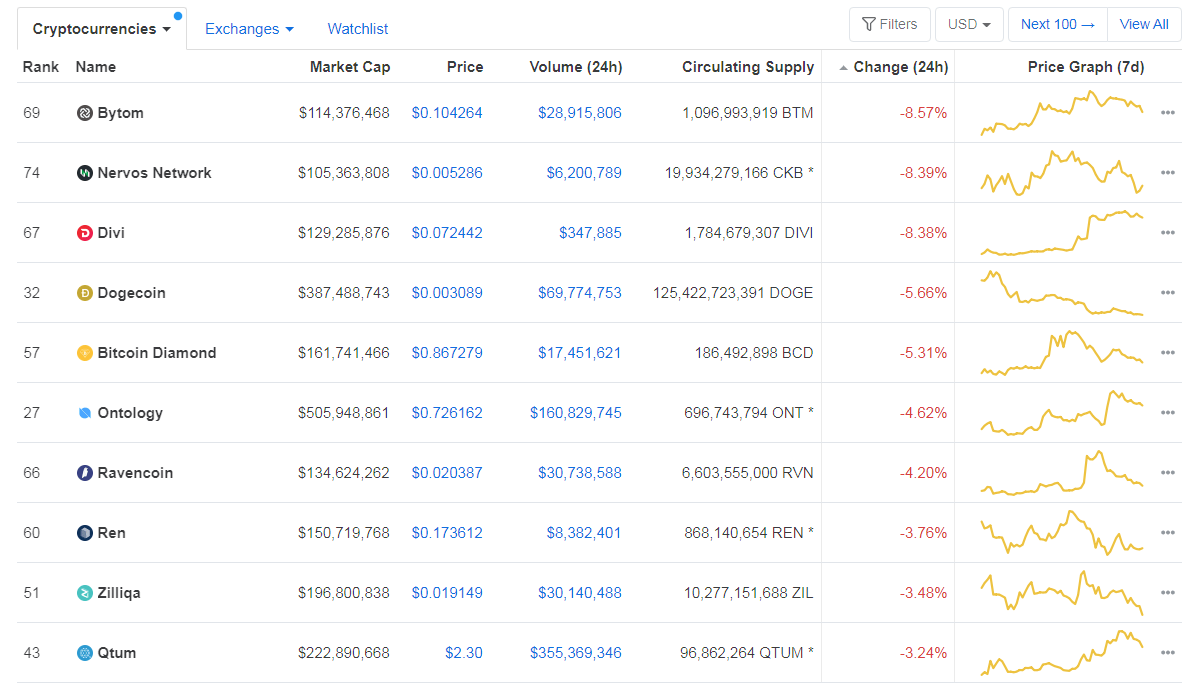
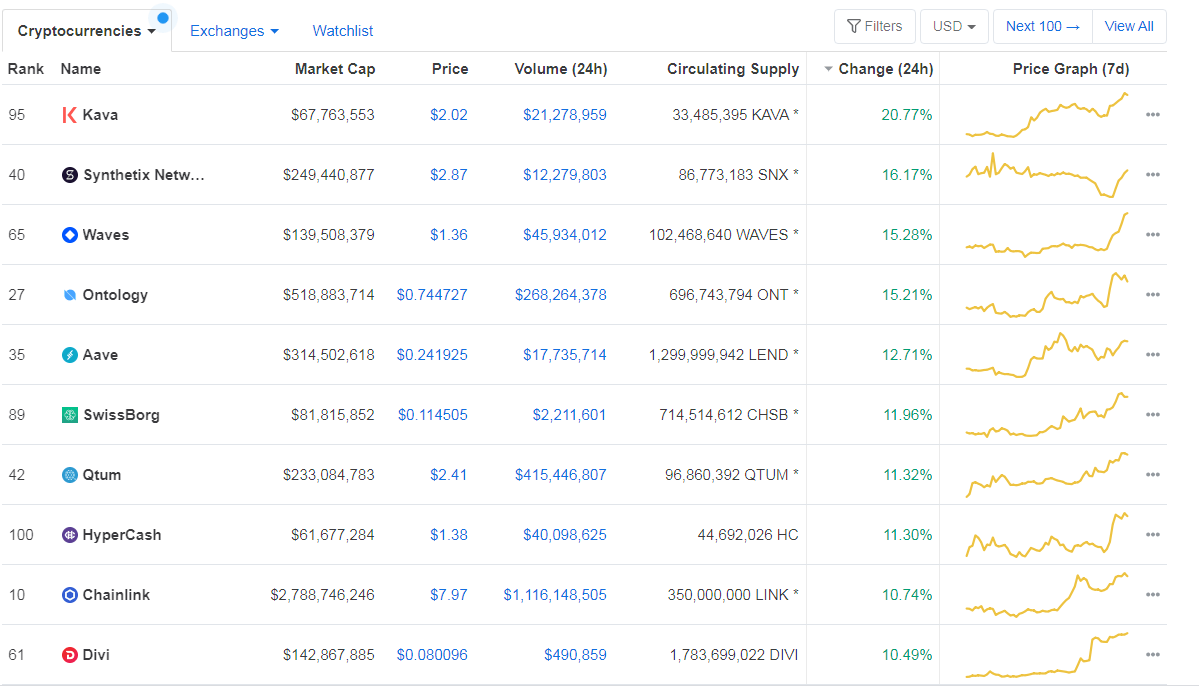
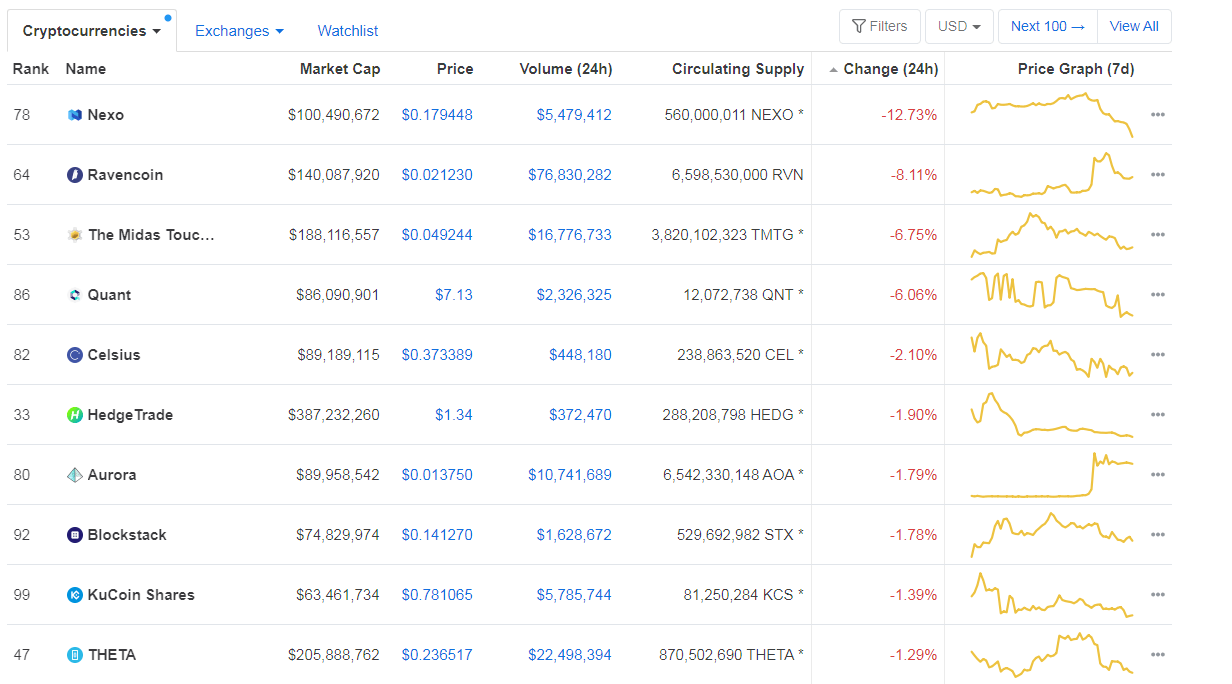
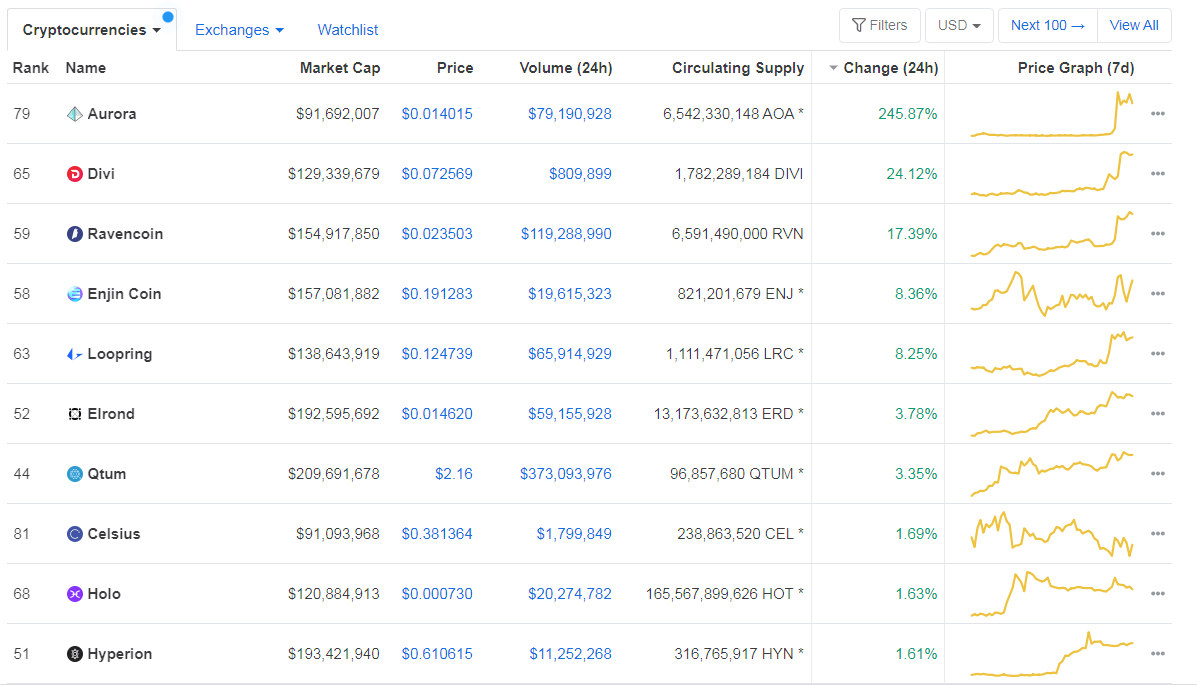
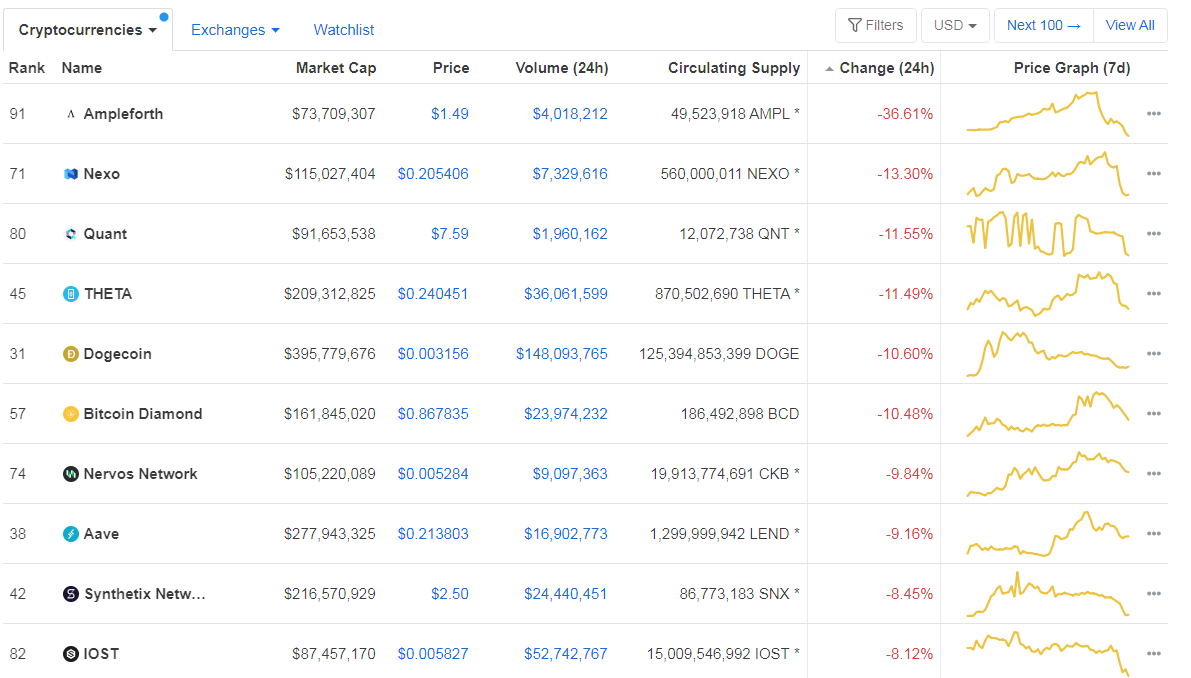
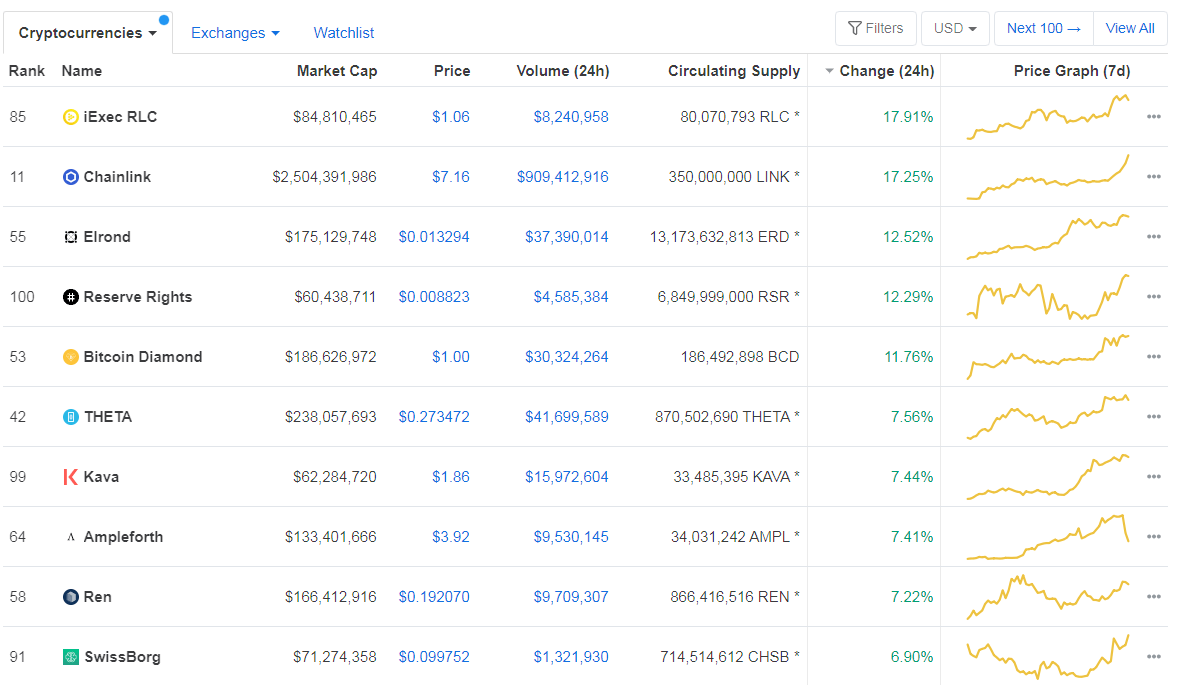
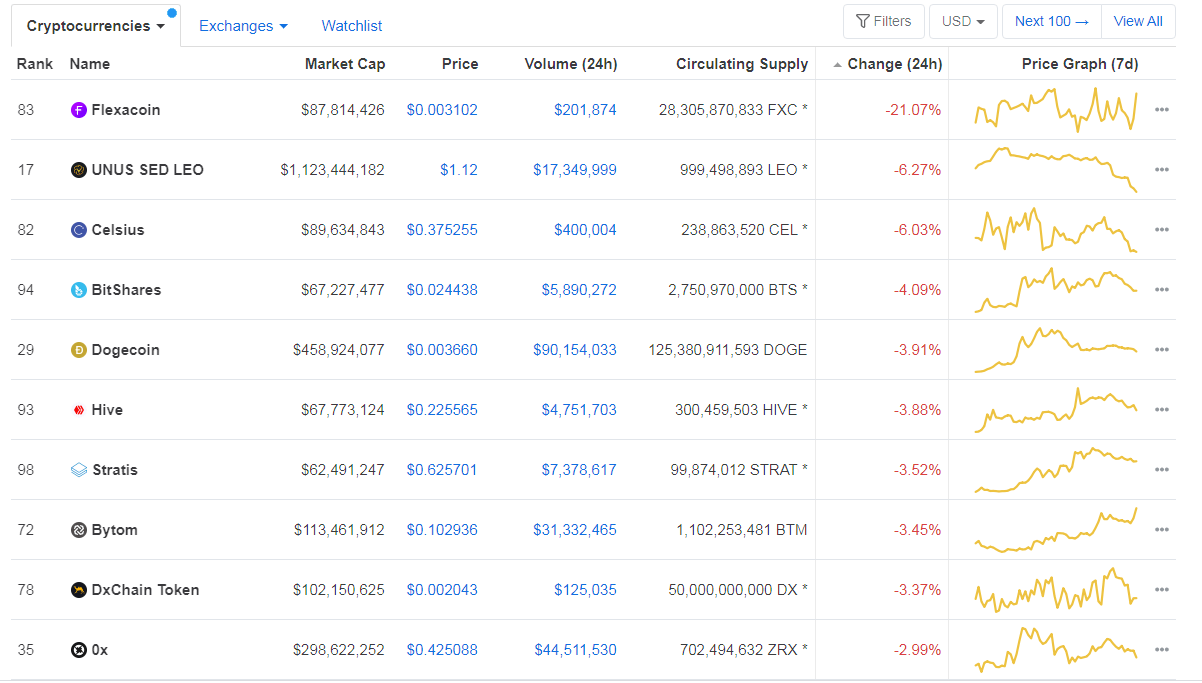
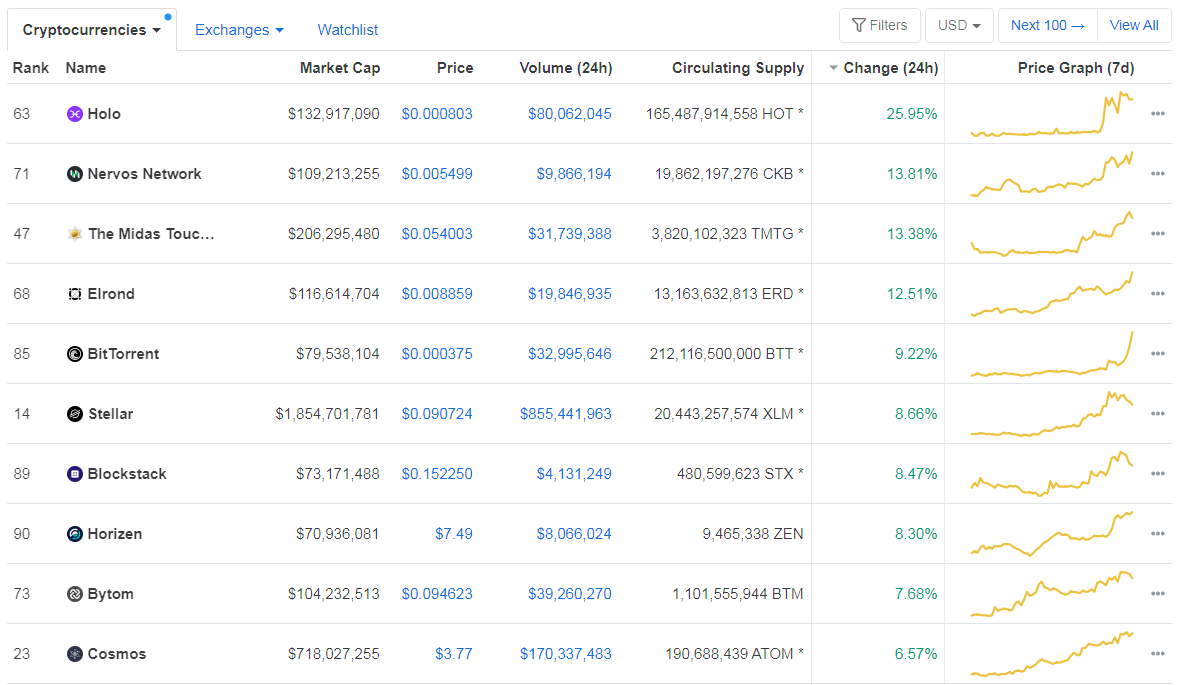
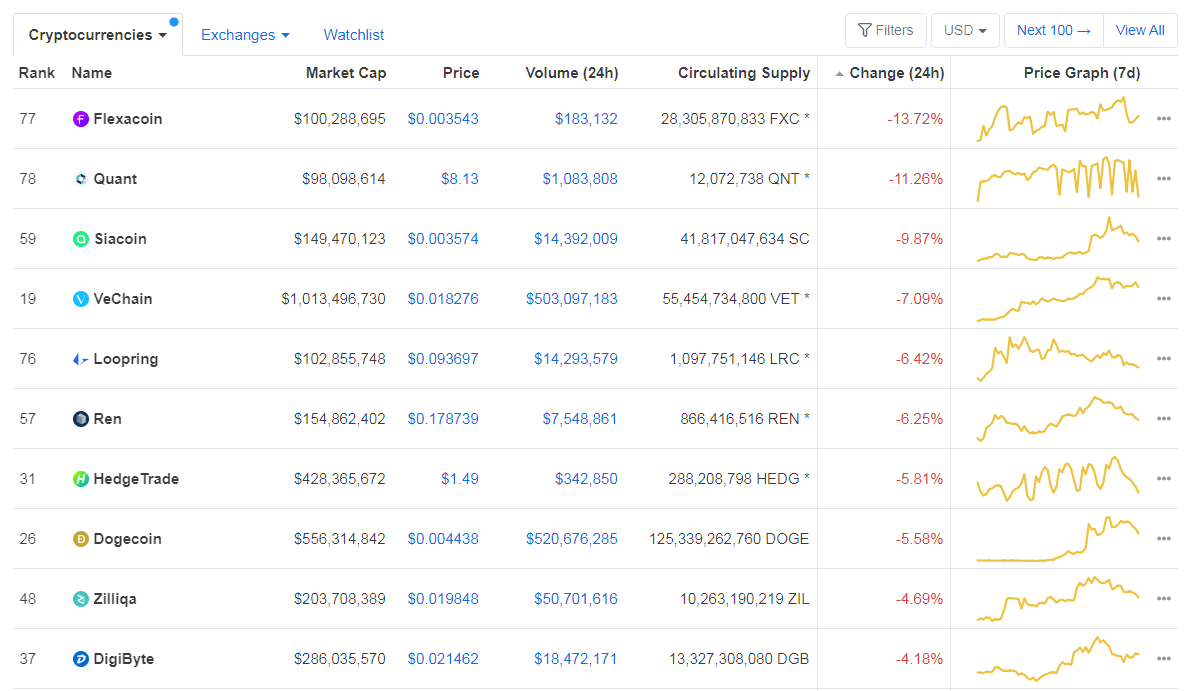
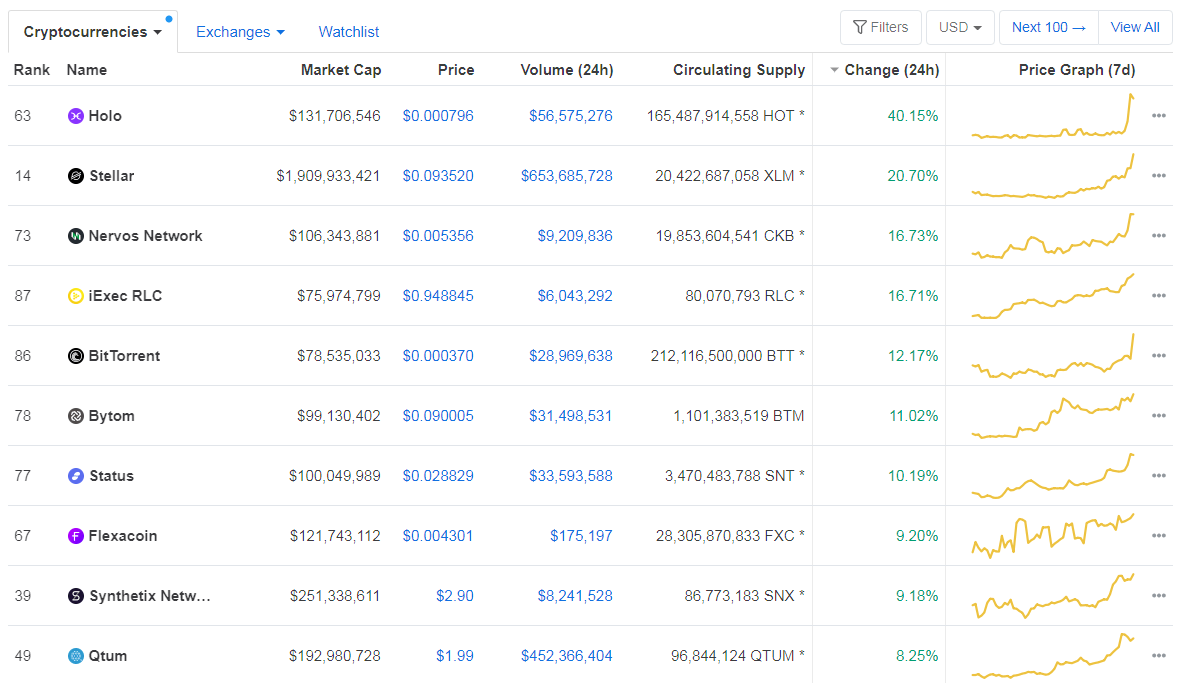
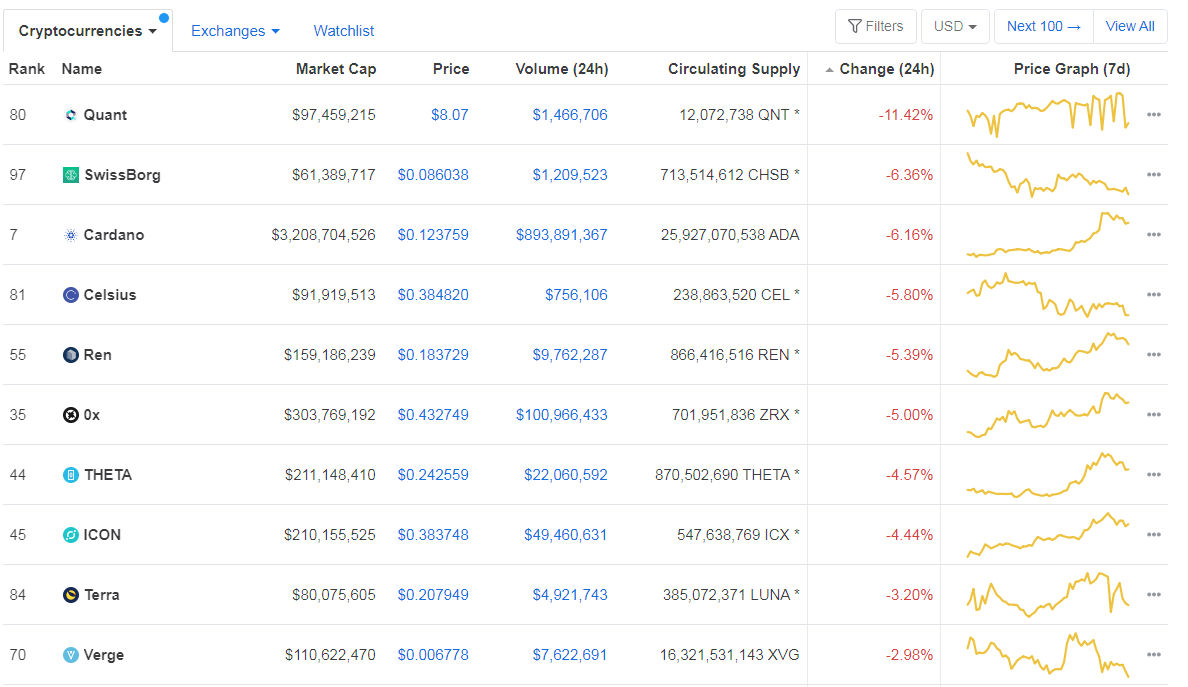
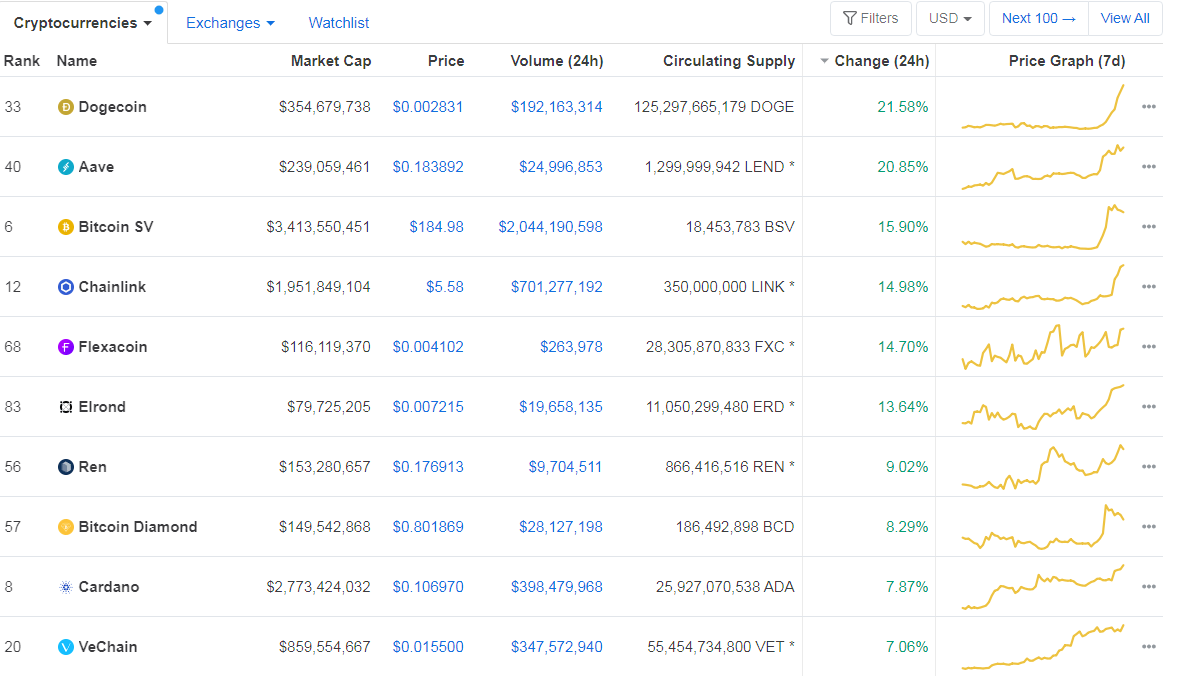
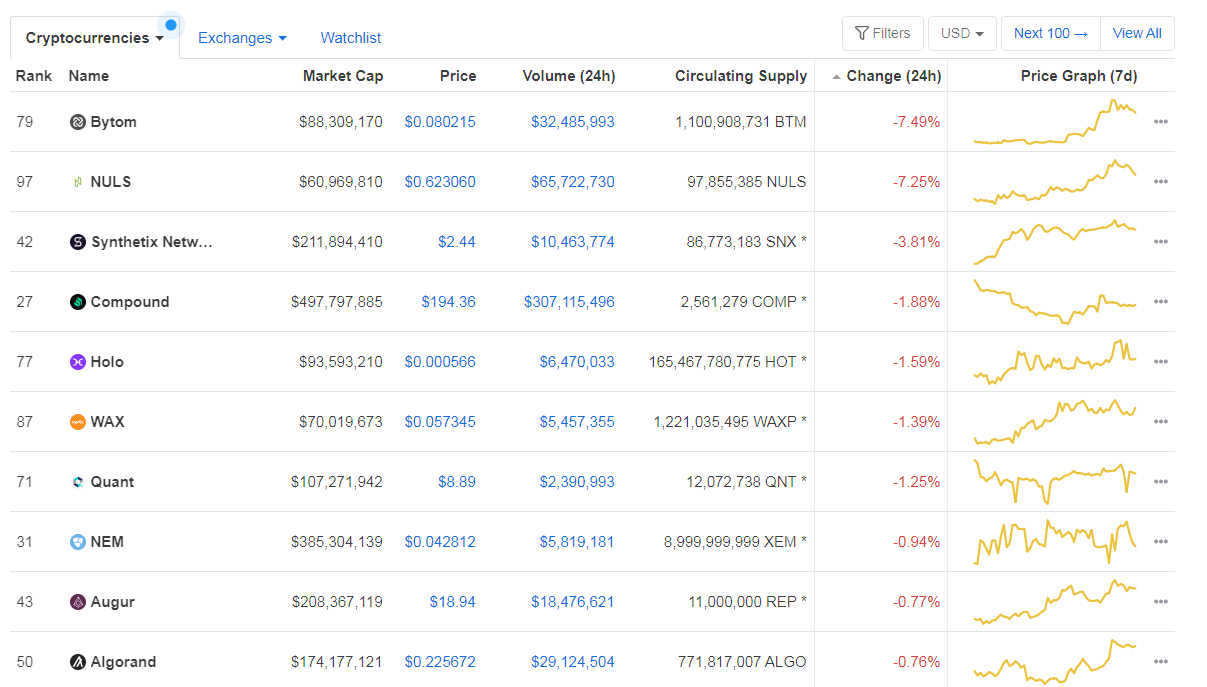
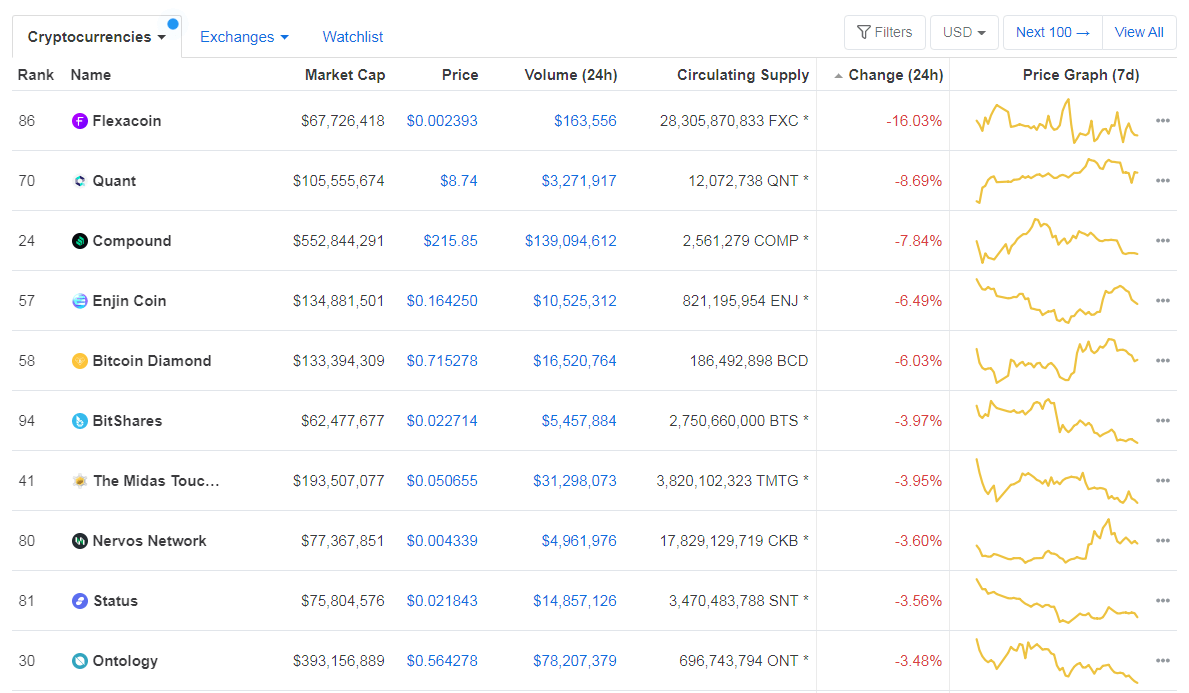
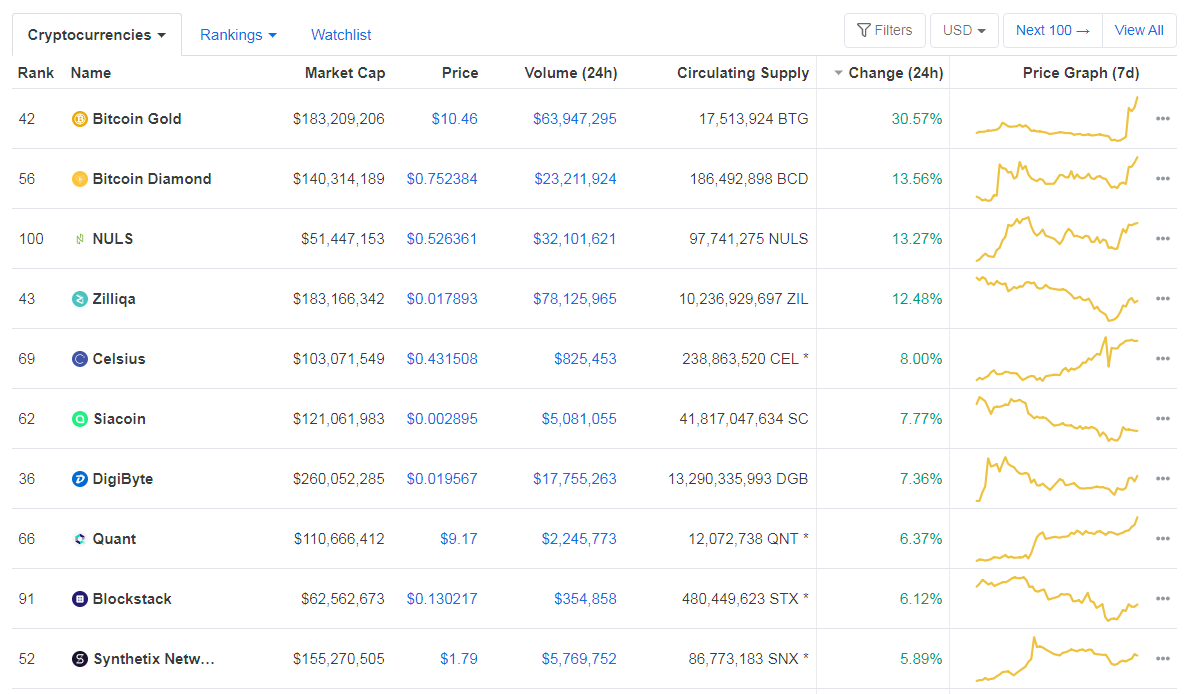
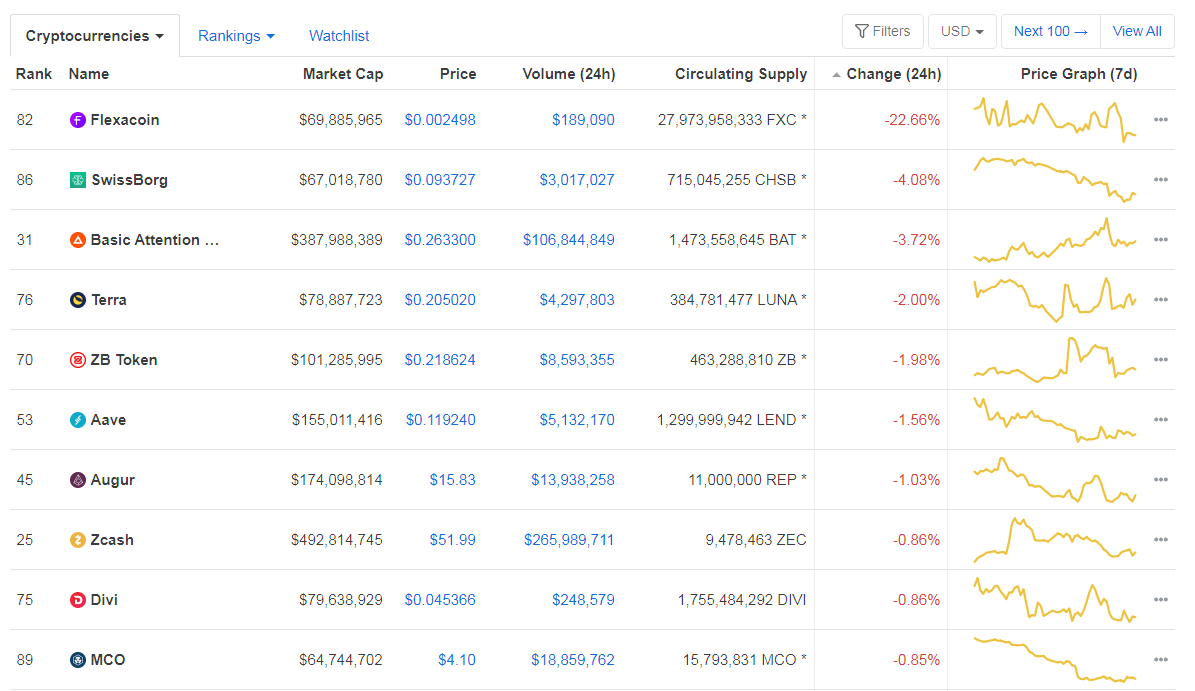
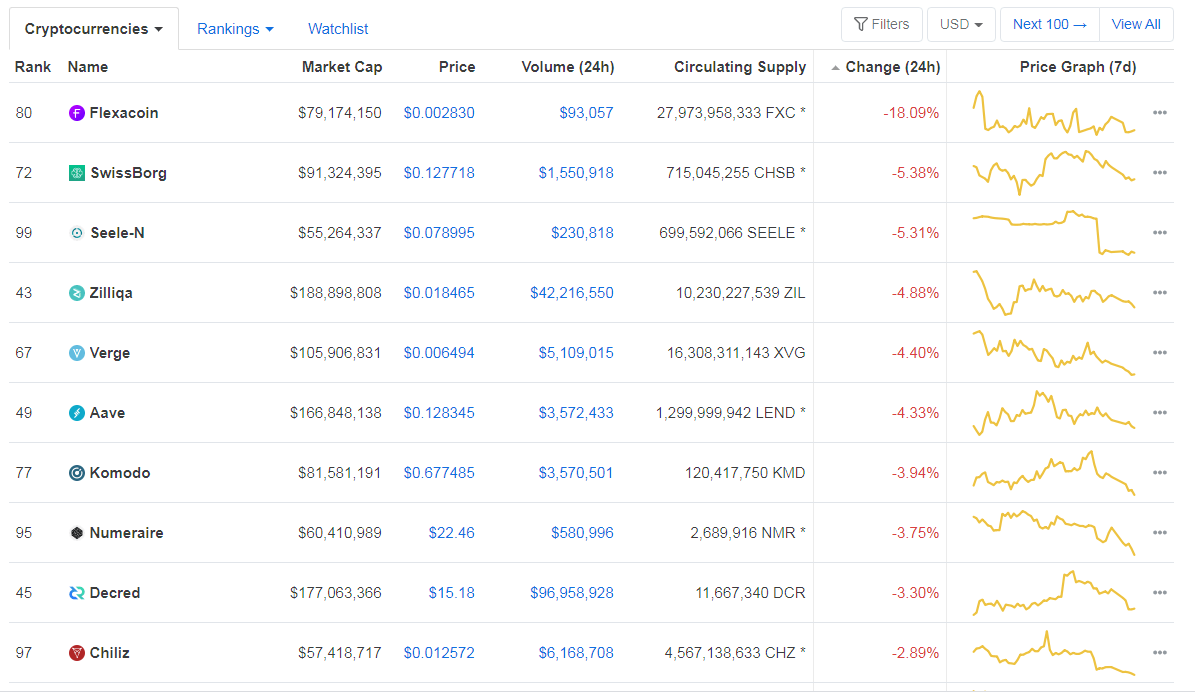
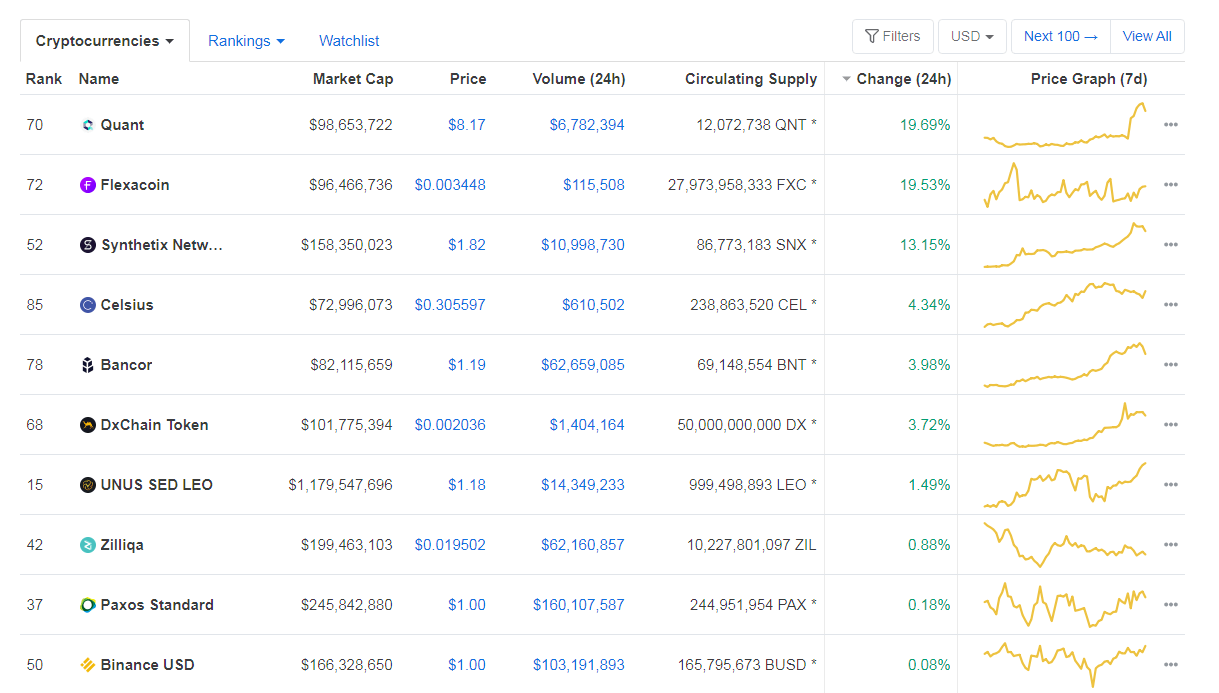
When talking about top100 cryptocurrencies, Kava.io gained 14.29% on the day, making it the most prominent daily gainer. Divi (13.17%) and Band Protocol (12.84%) also did great. On the other hand, Ampleforth has lost 23.81%, making it the most prominent daily loser. It is followed by Flexacoin’s loss of 17.11% and Augur’s loss of 11.43%.
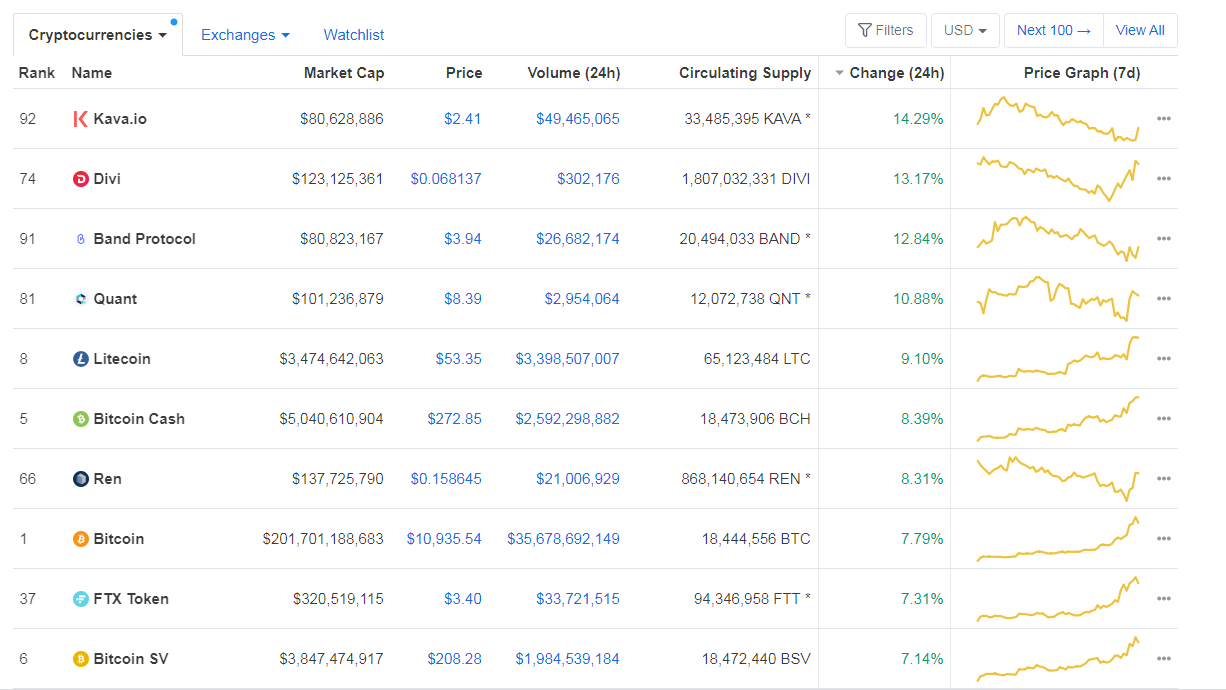
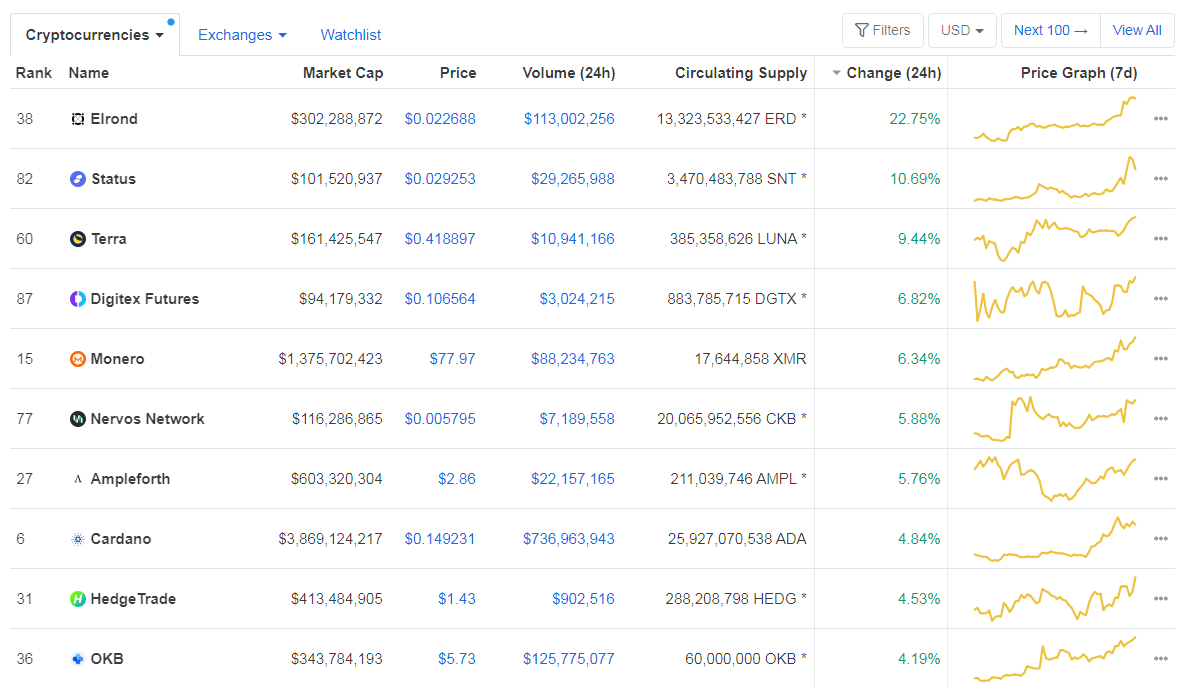
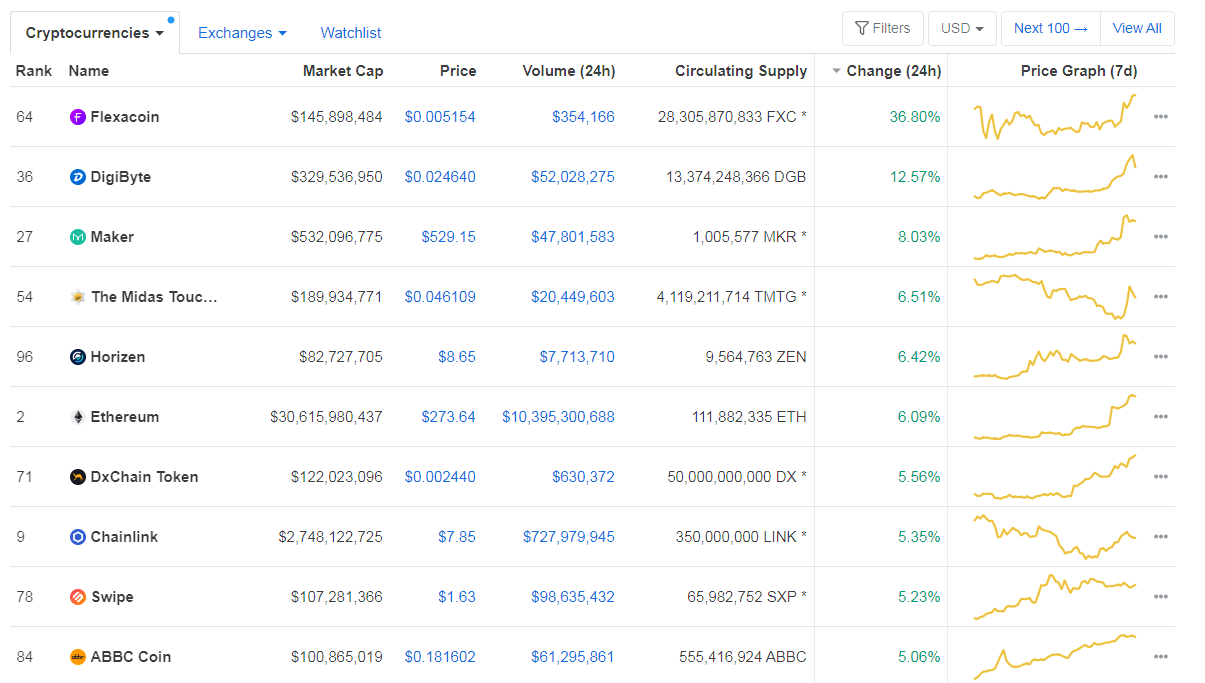
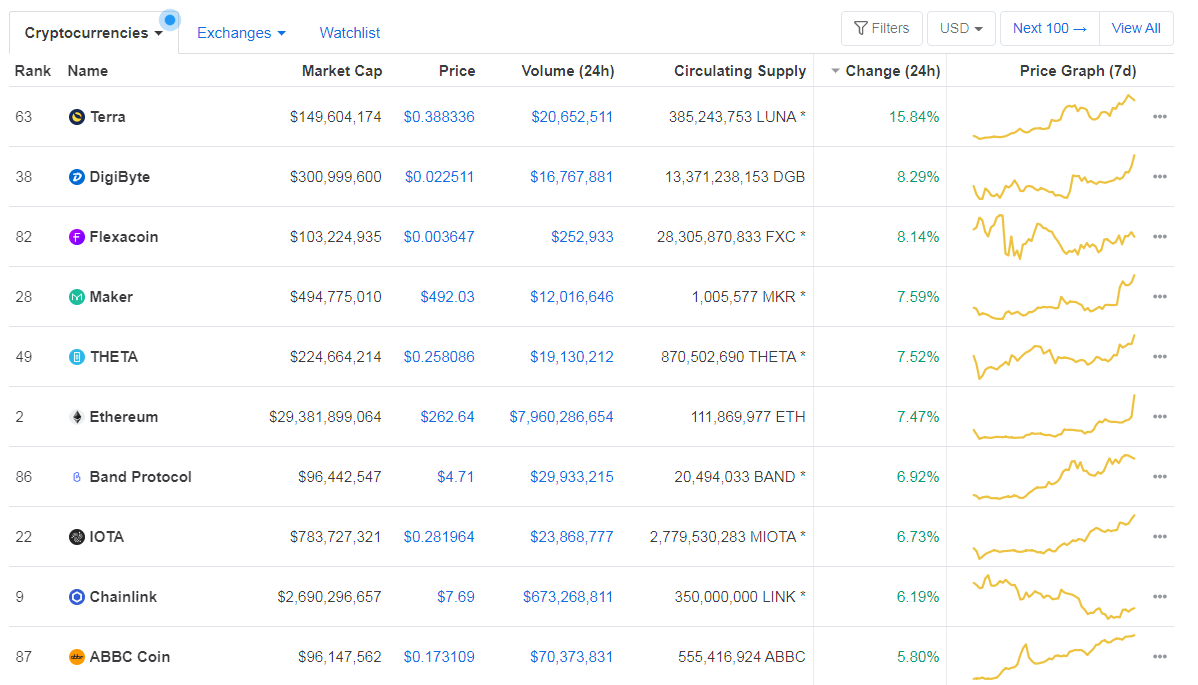
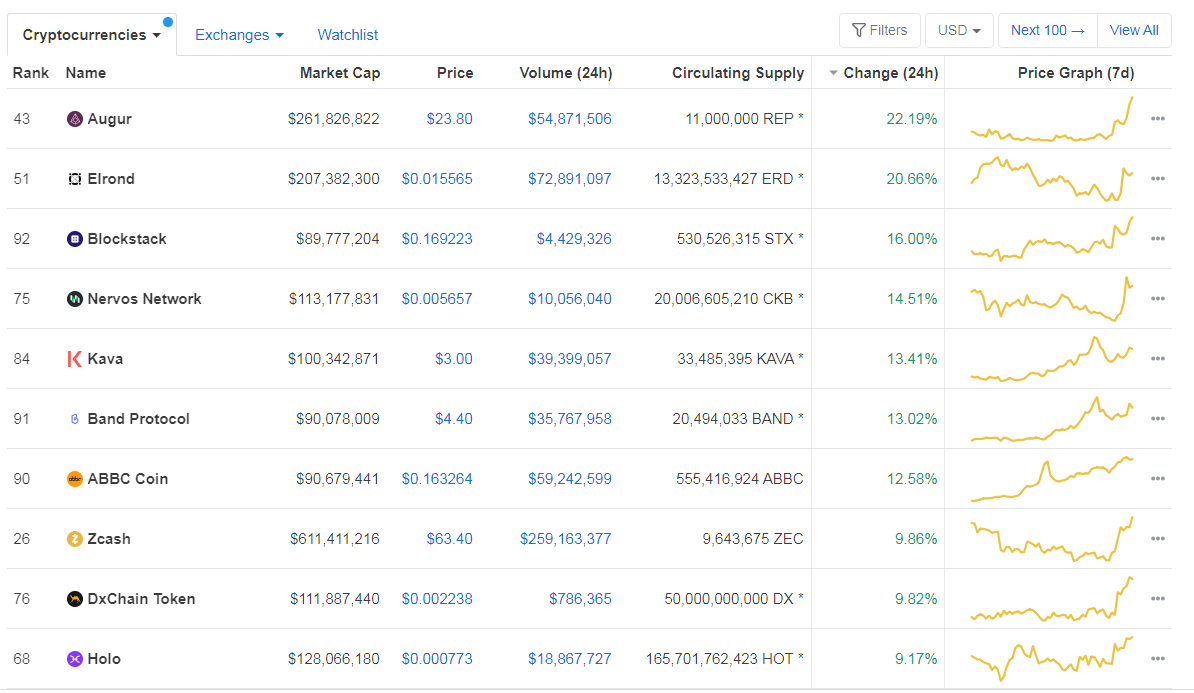
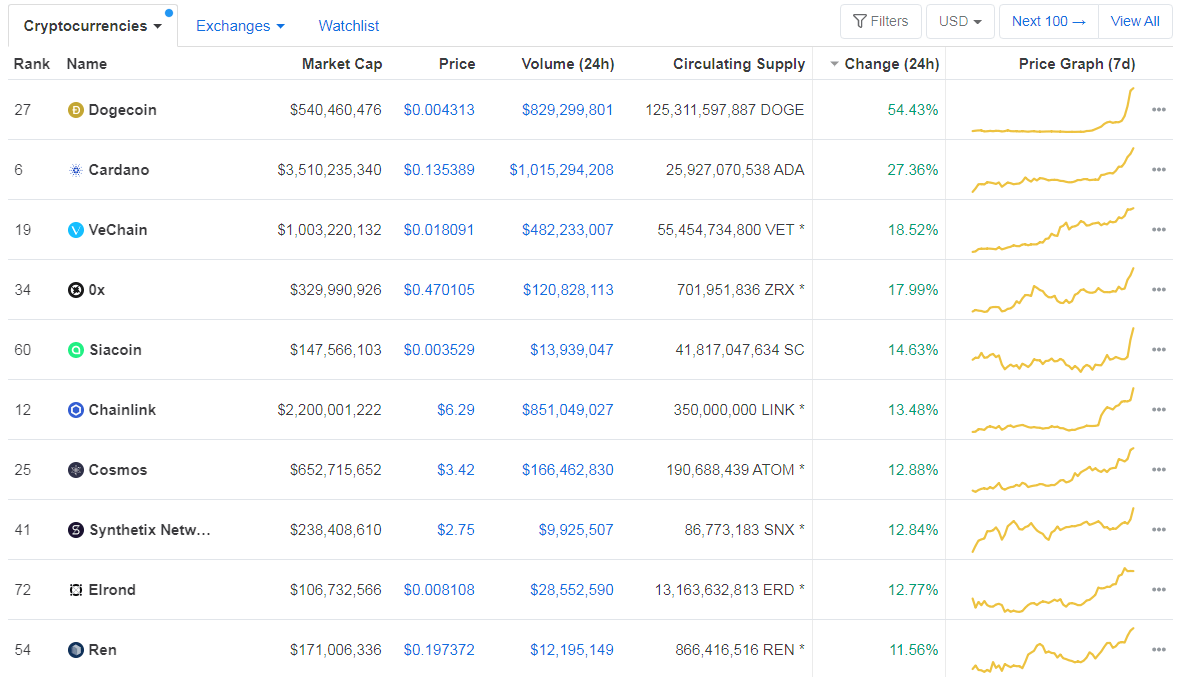
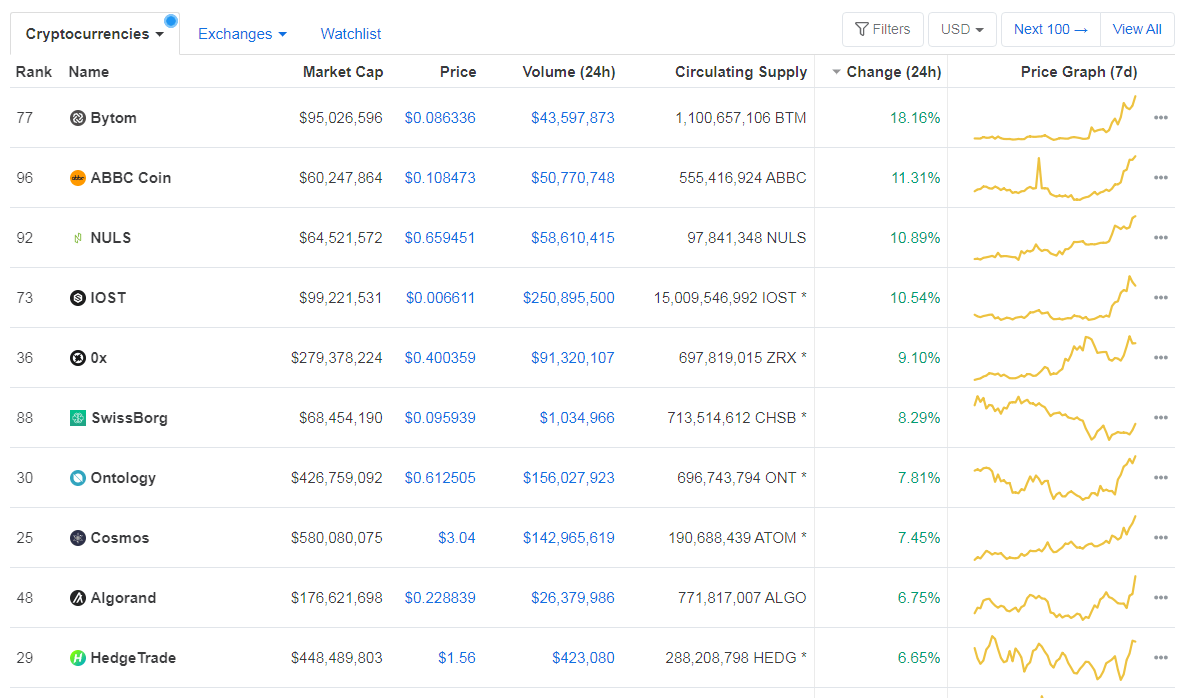
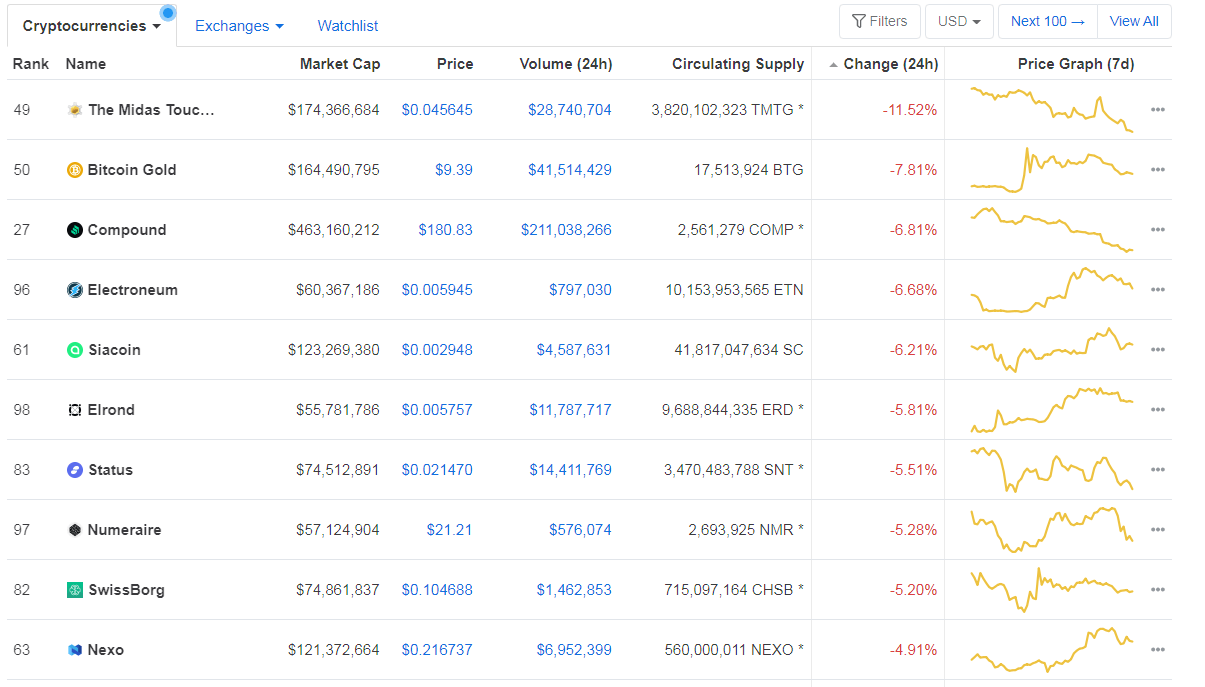
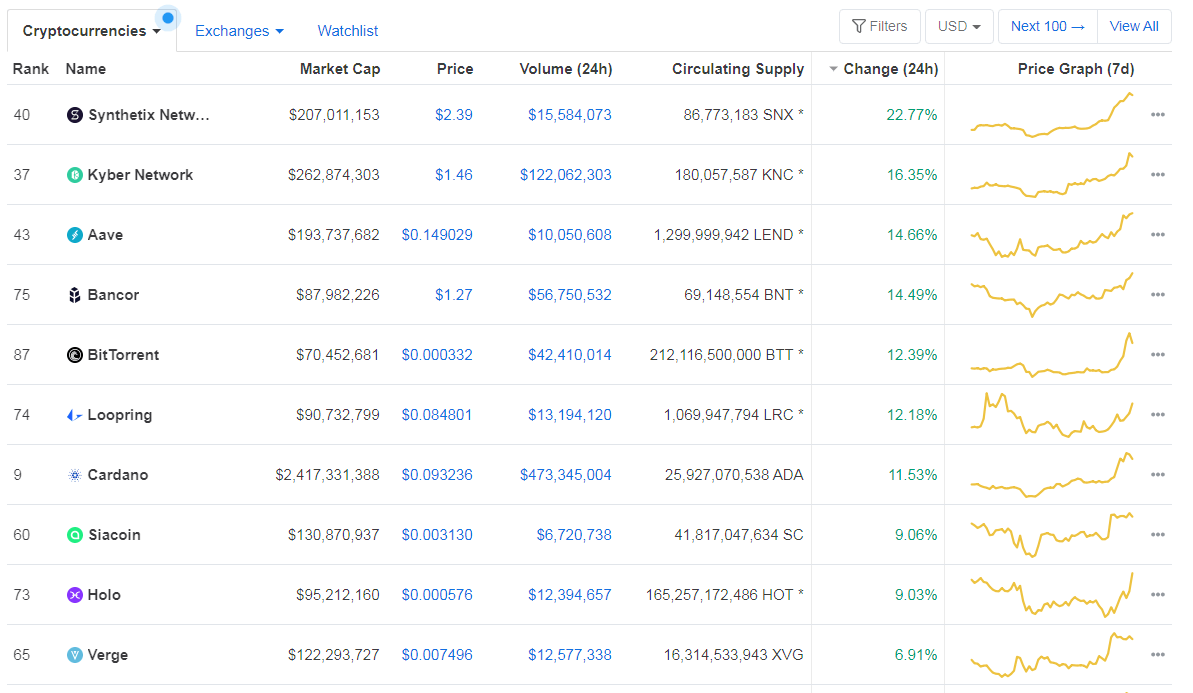
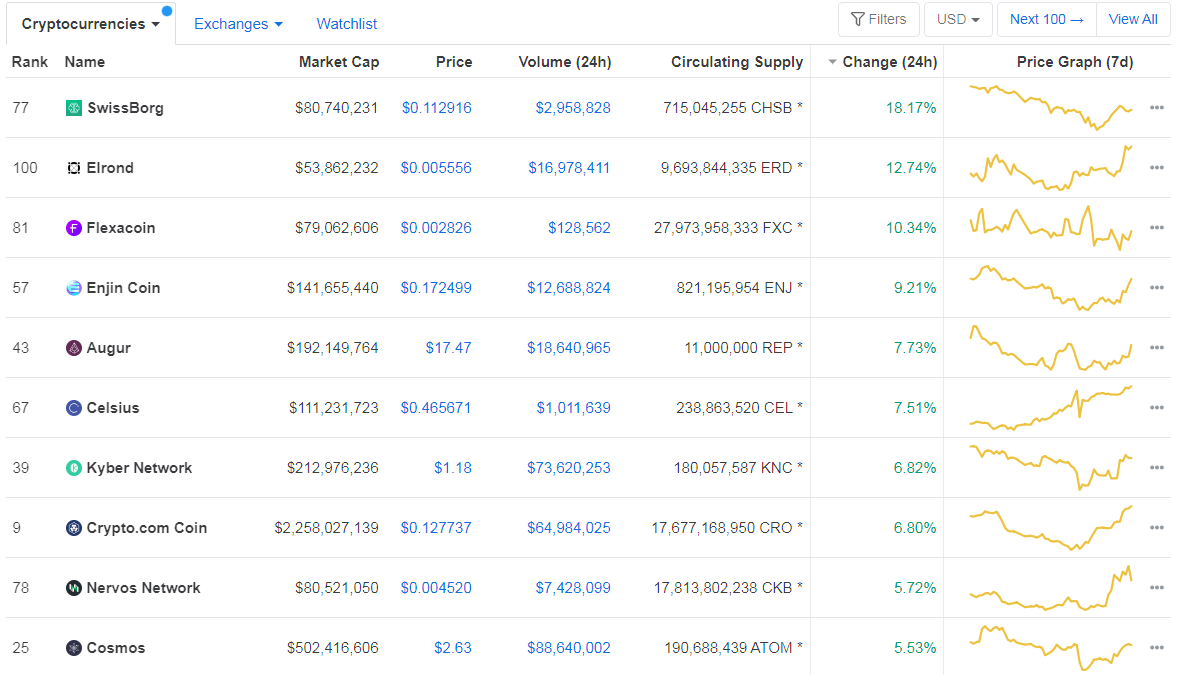
Top 10 24-hour Performers (Click to enlarge)
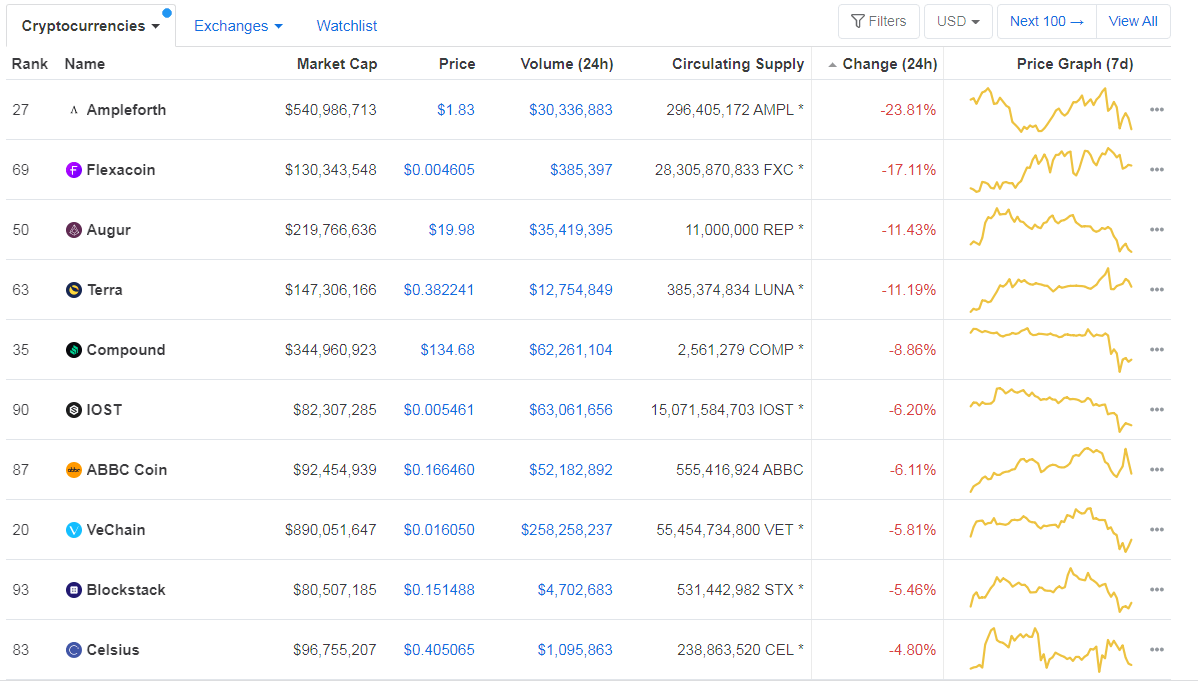
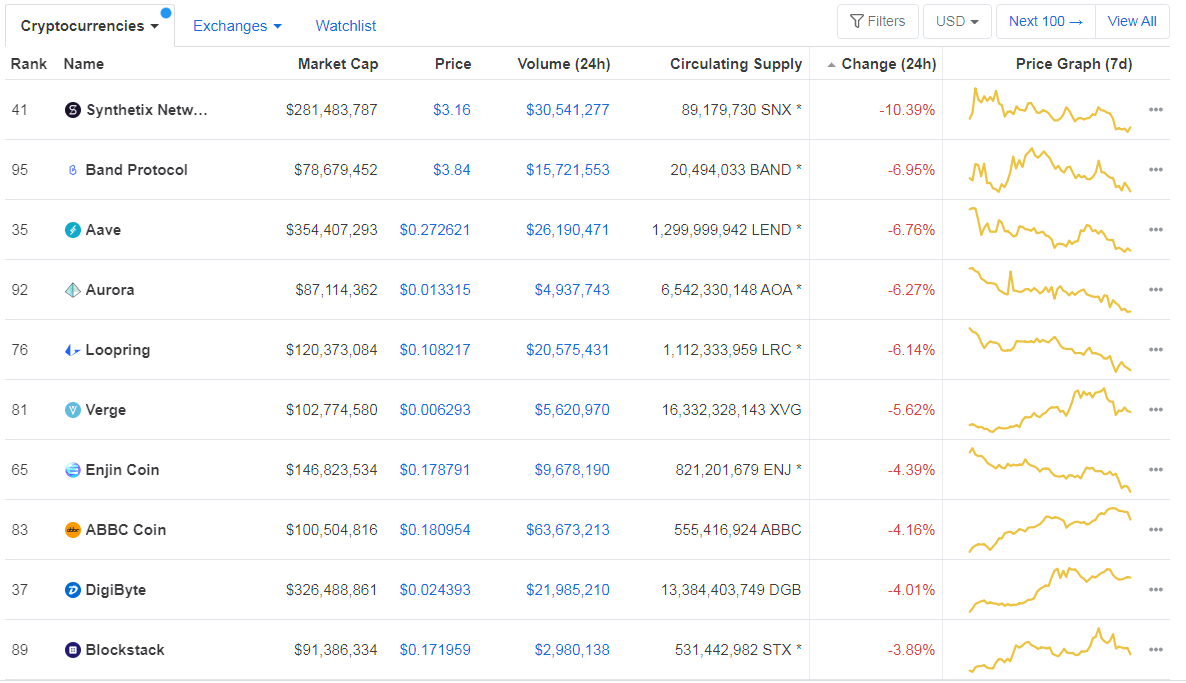
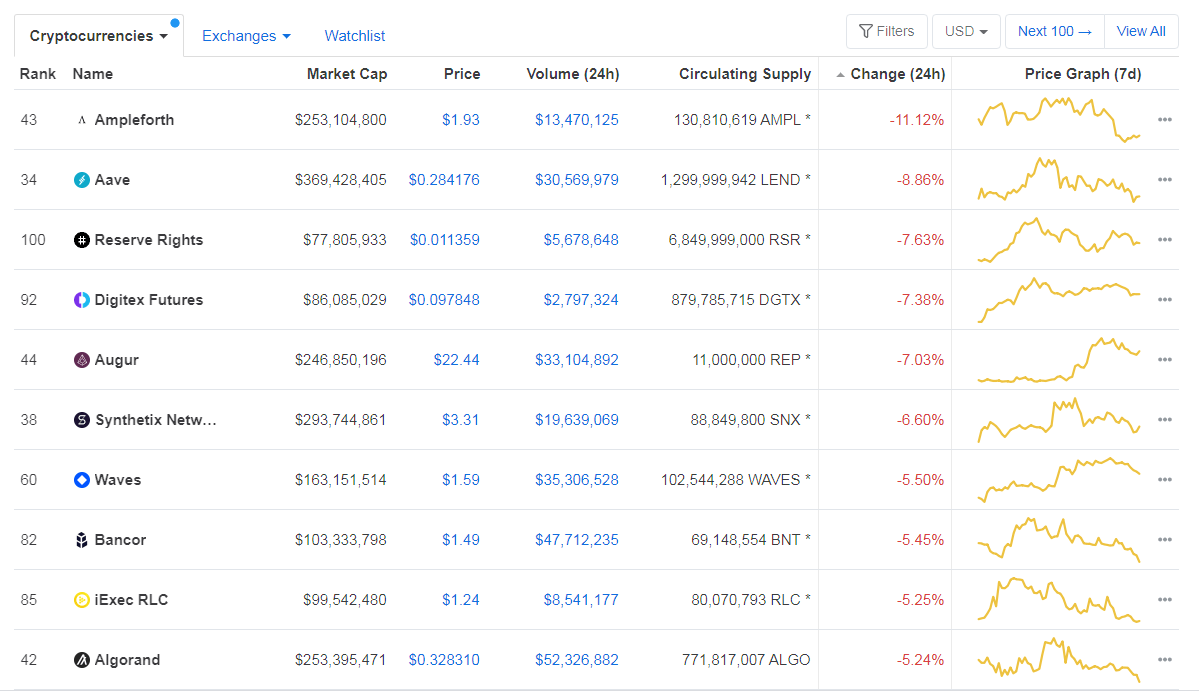
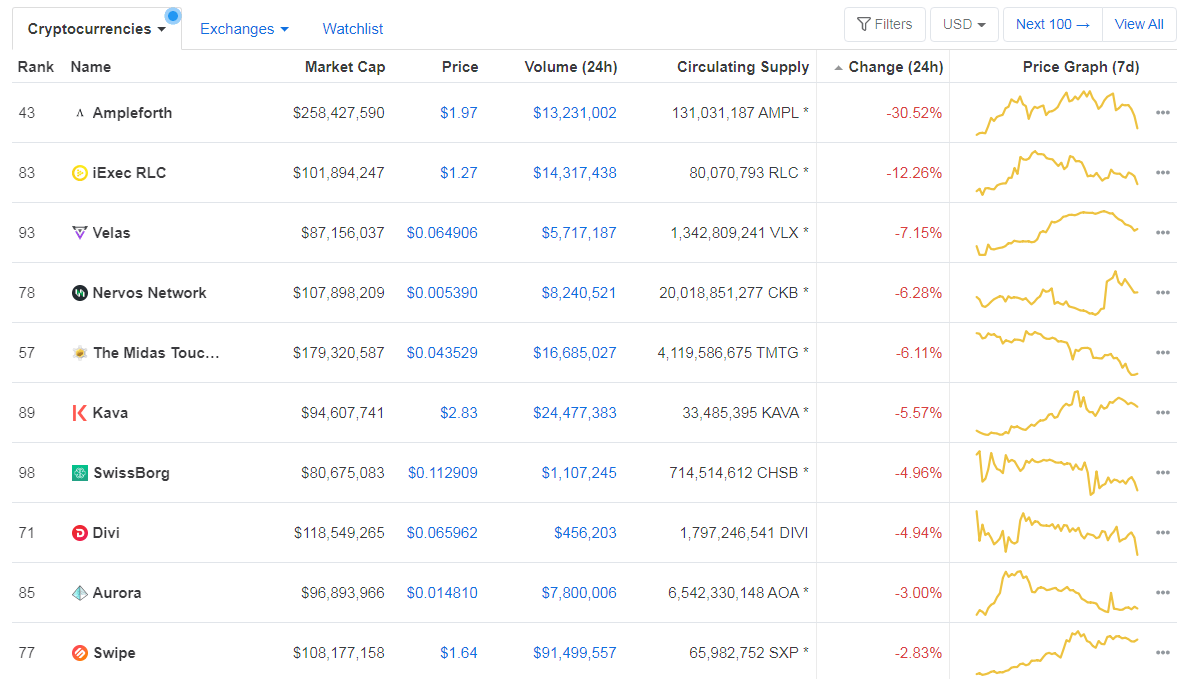
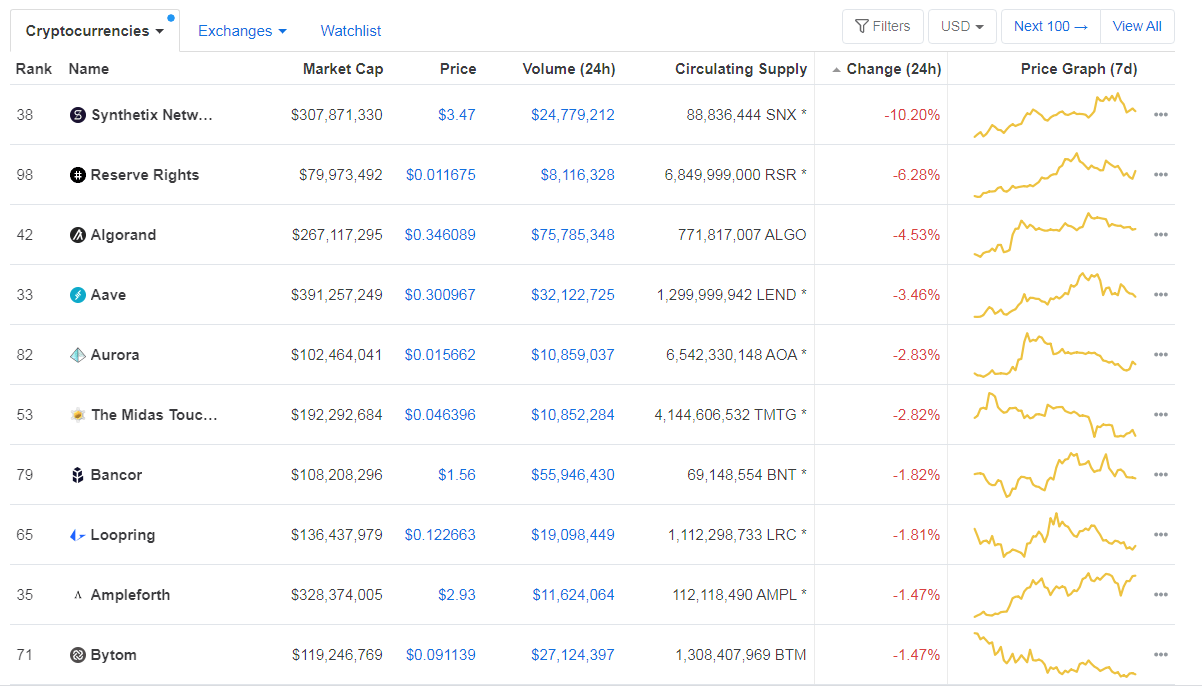
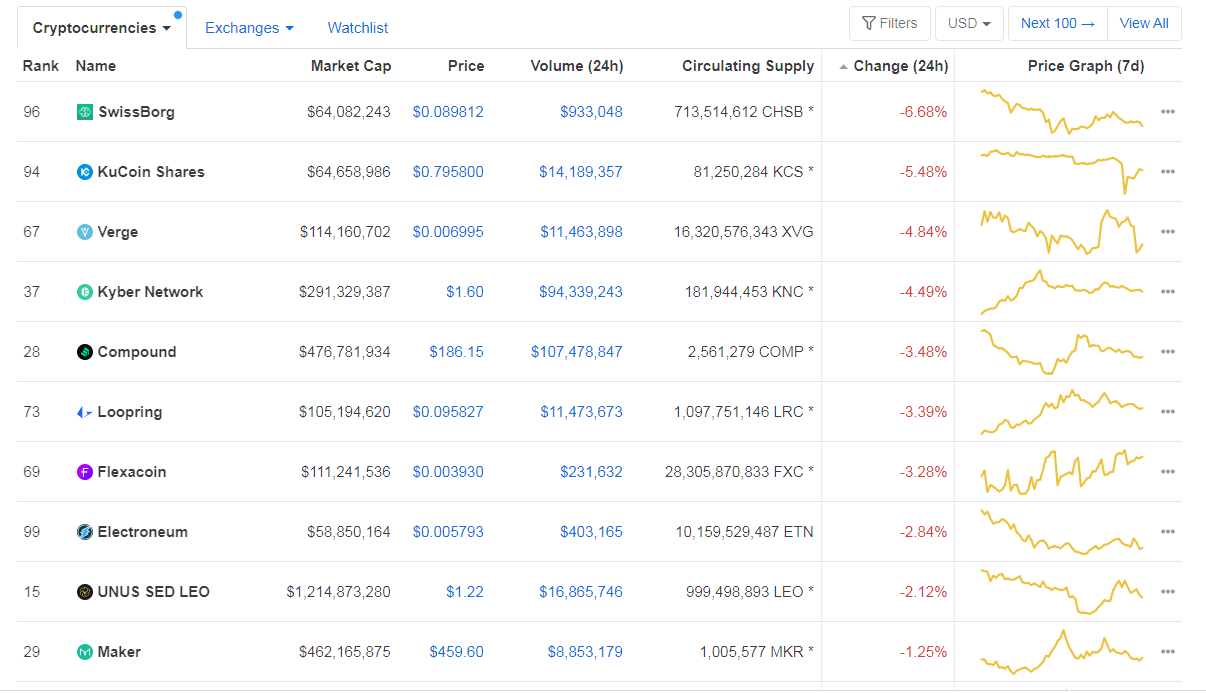
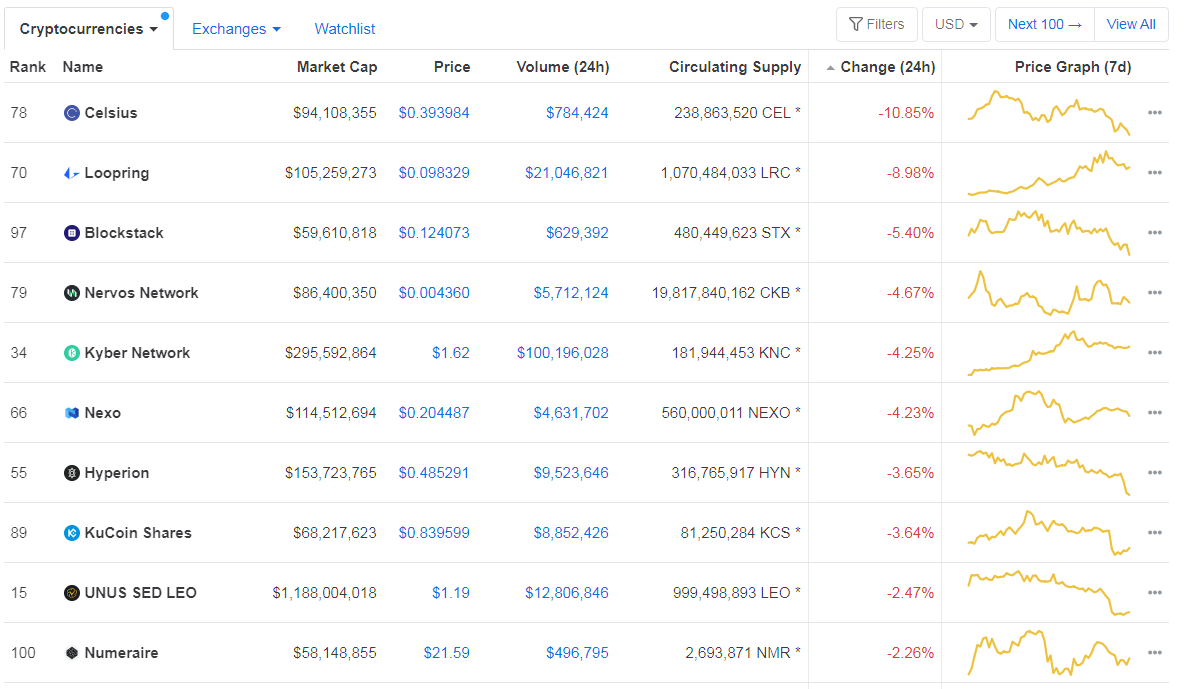
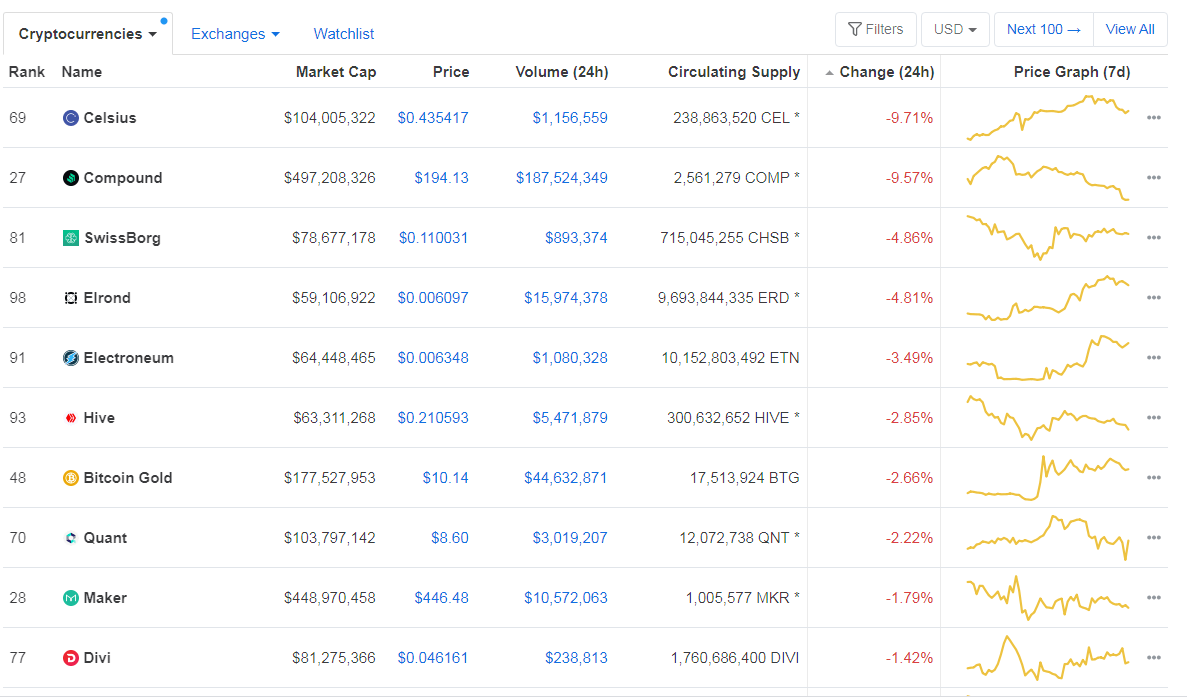
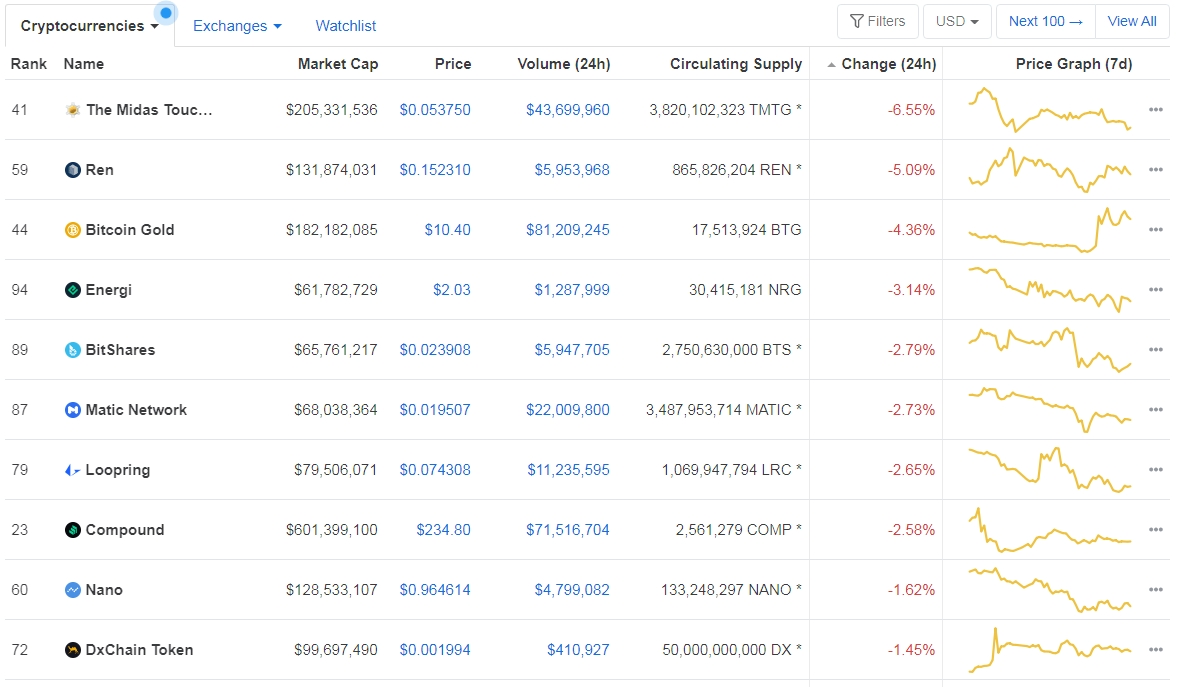
Bottom 10 24-hour Performers (Click to enlarge)
Bitcoin’s dominance level increased since we last reported, with its value currently at 64.33 %. This value represents a 2.78% difference to the upside when compared to yesterday’s value.
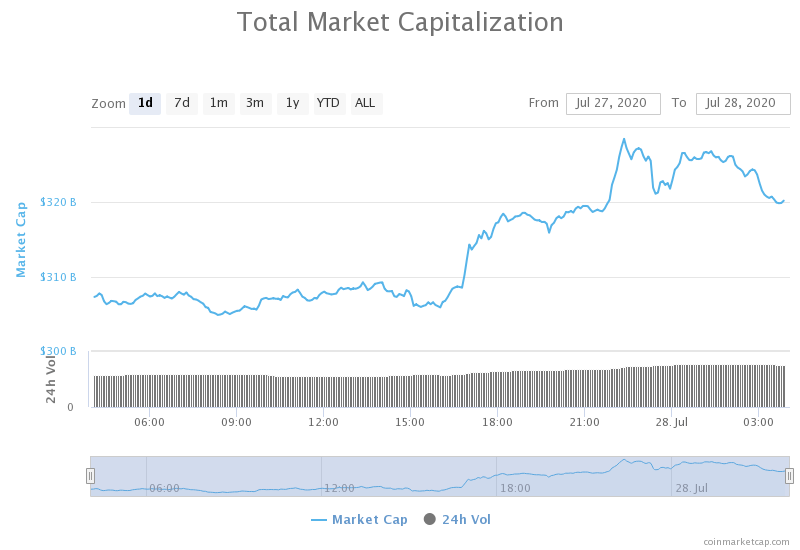
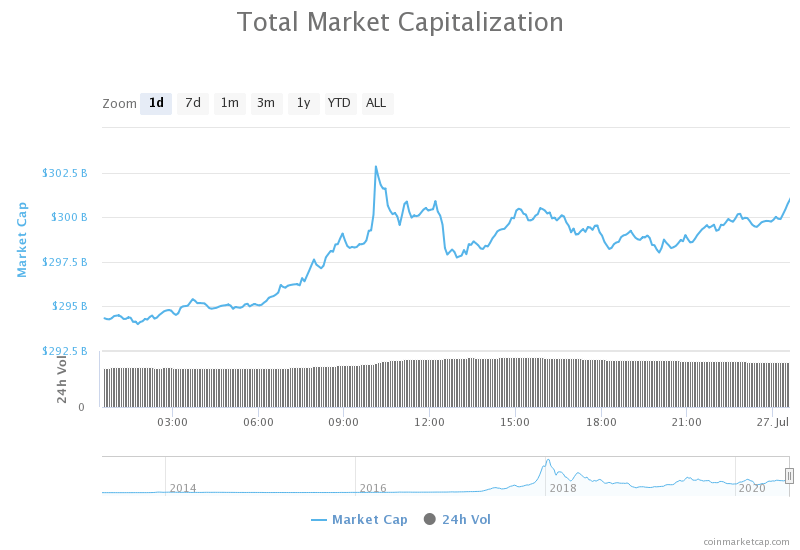
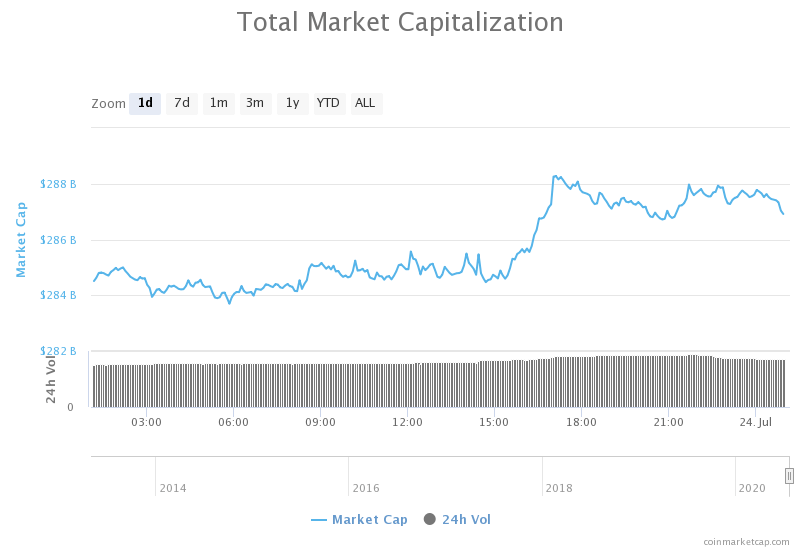
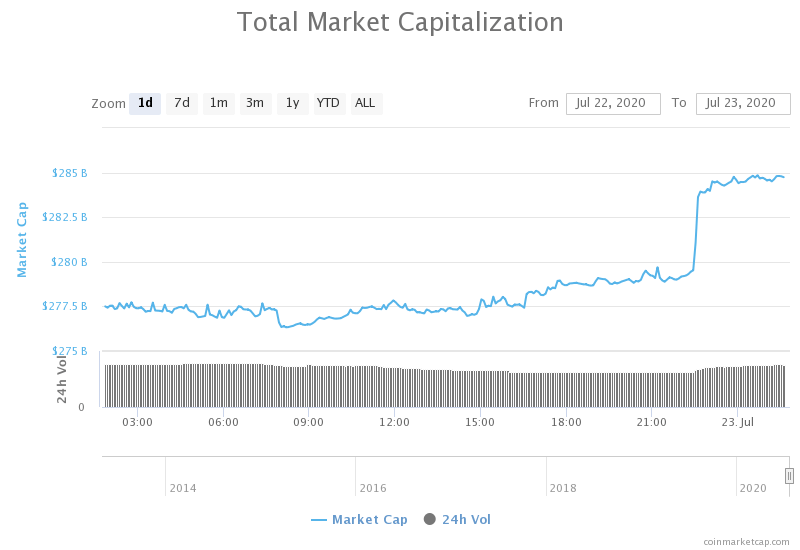
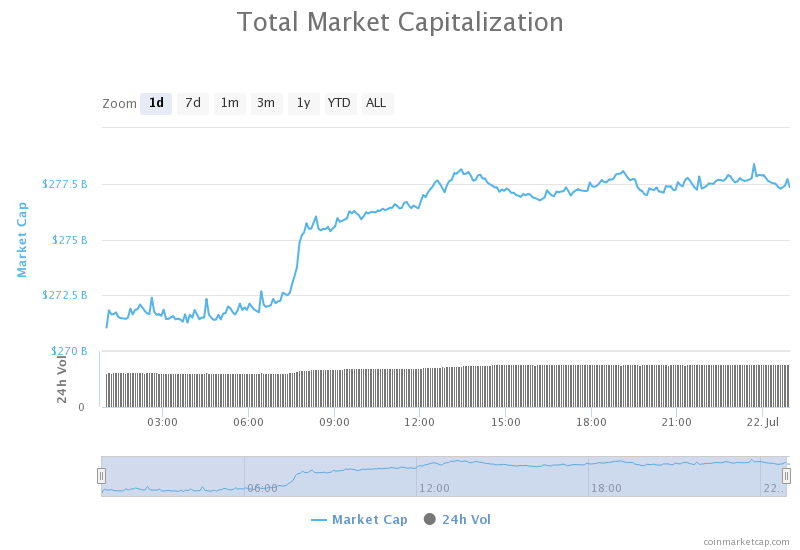
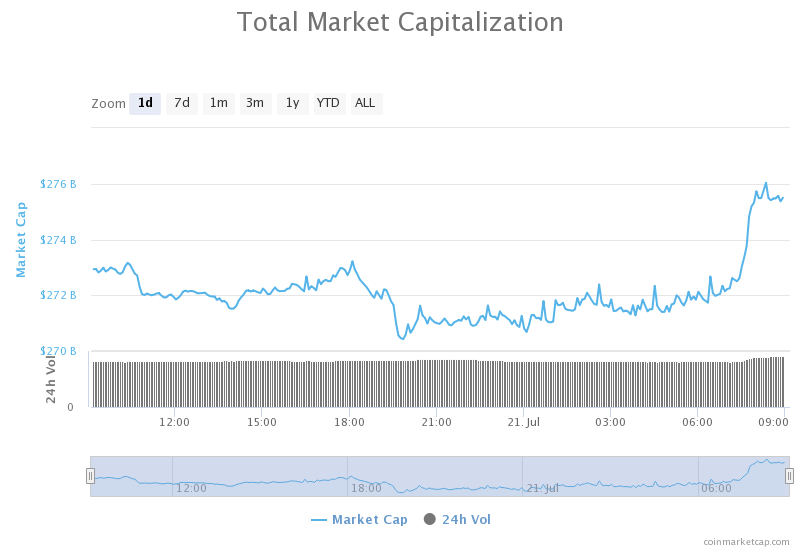
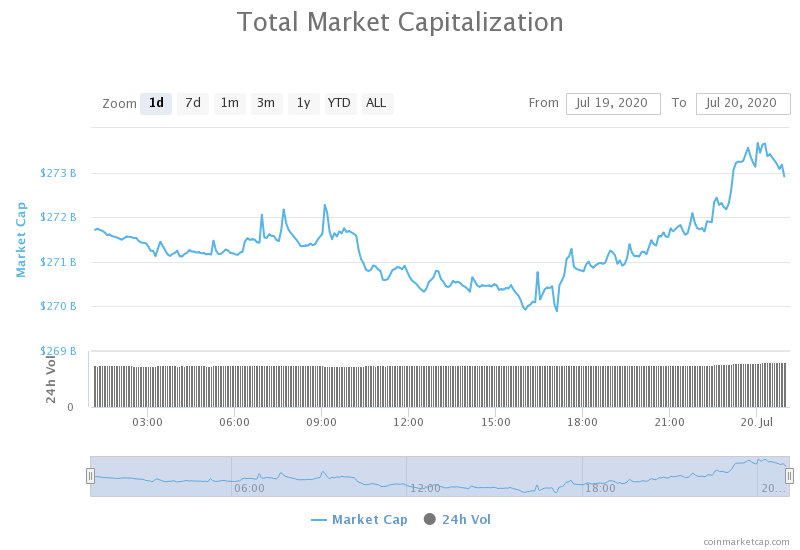
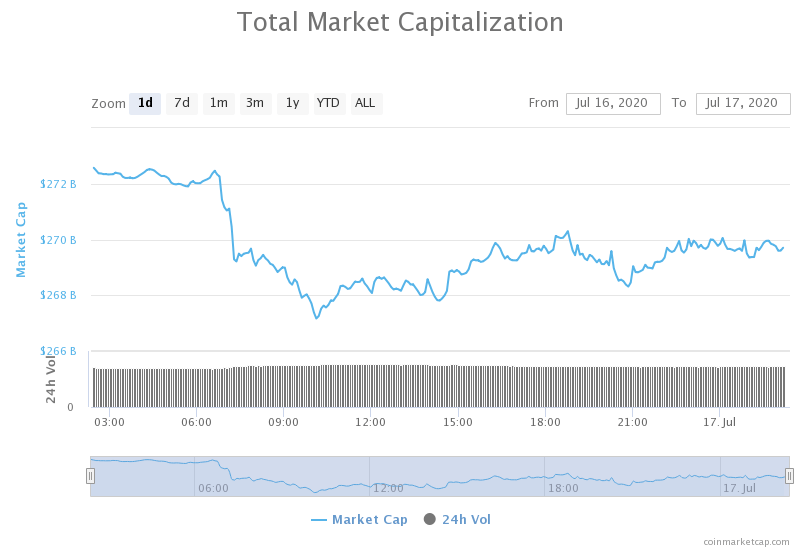
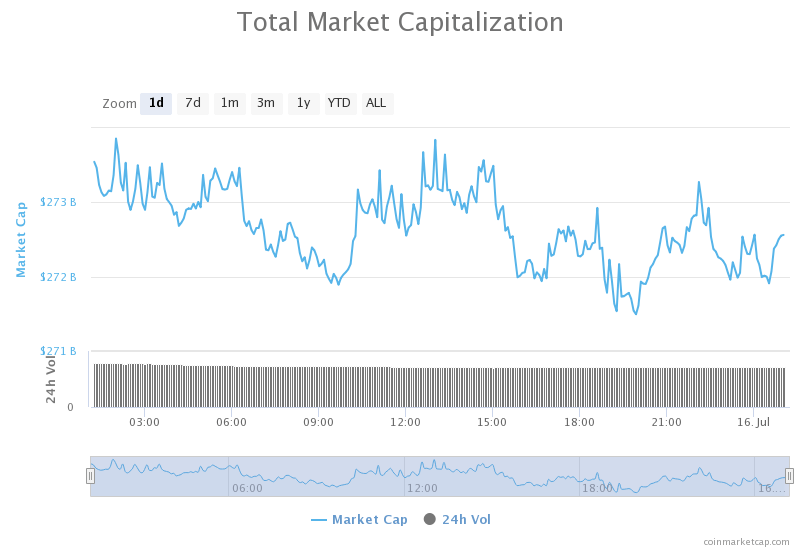
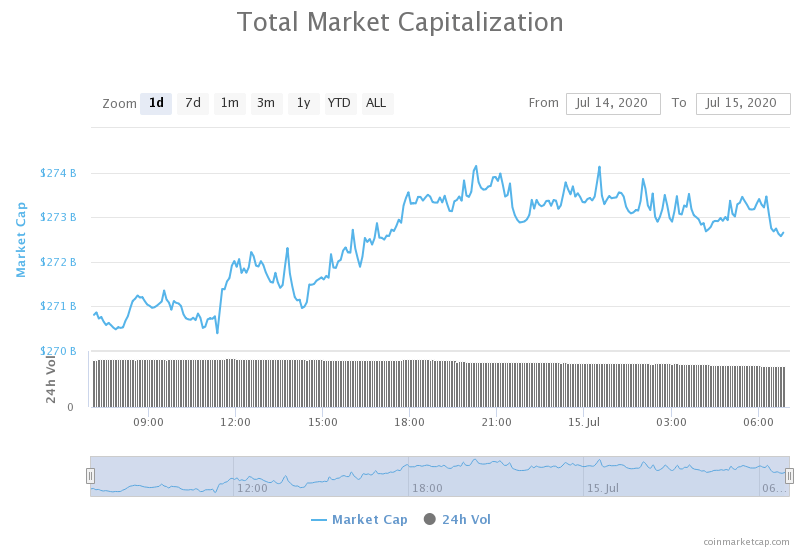
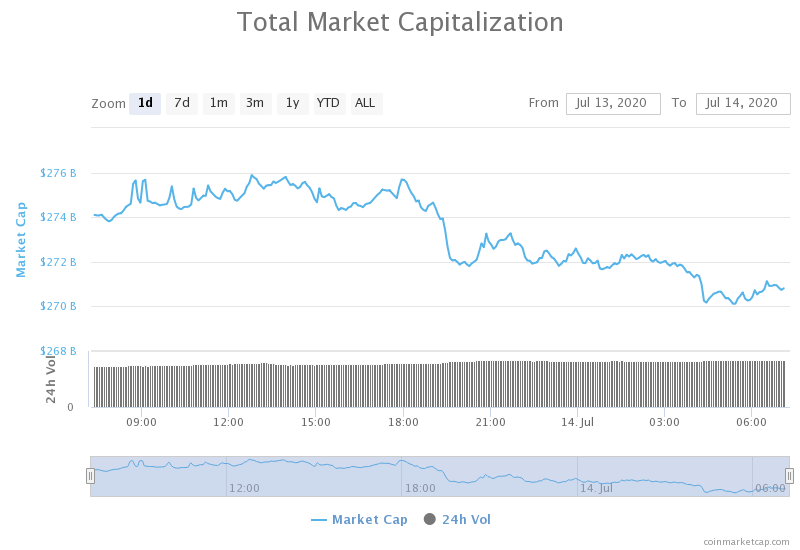
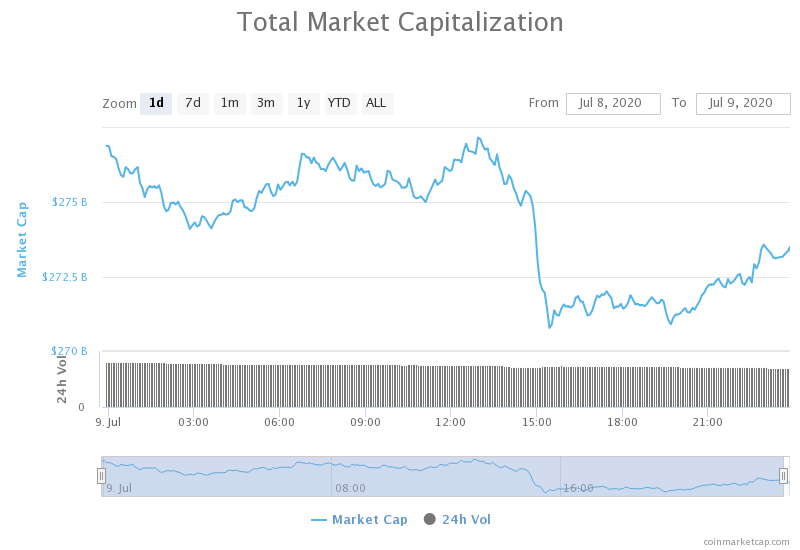
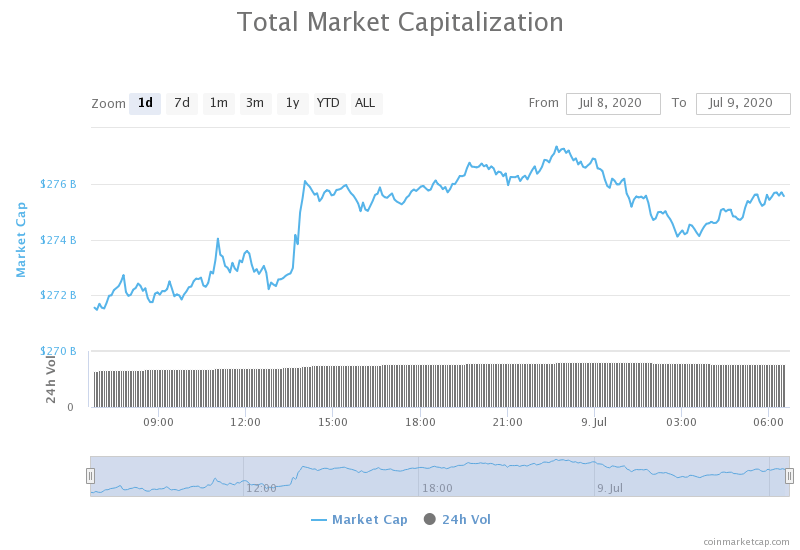
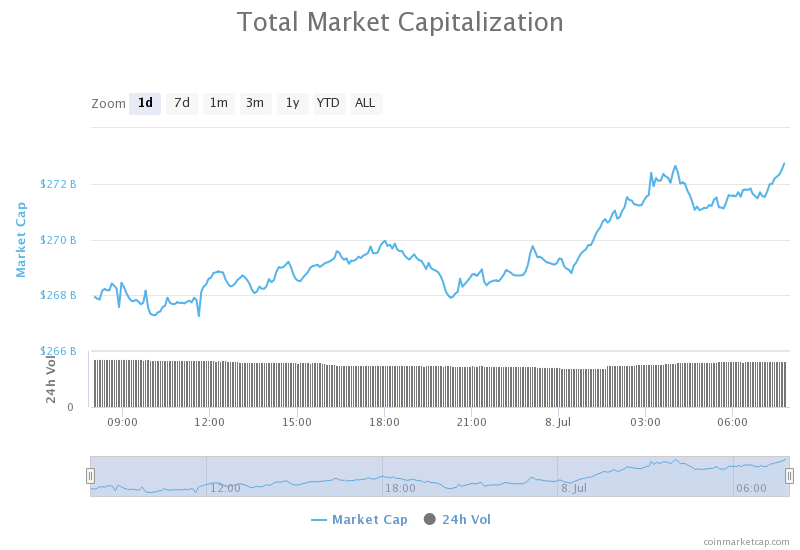
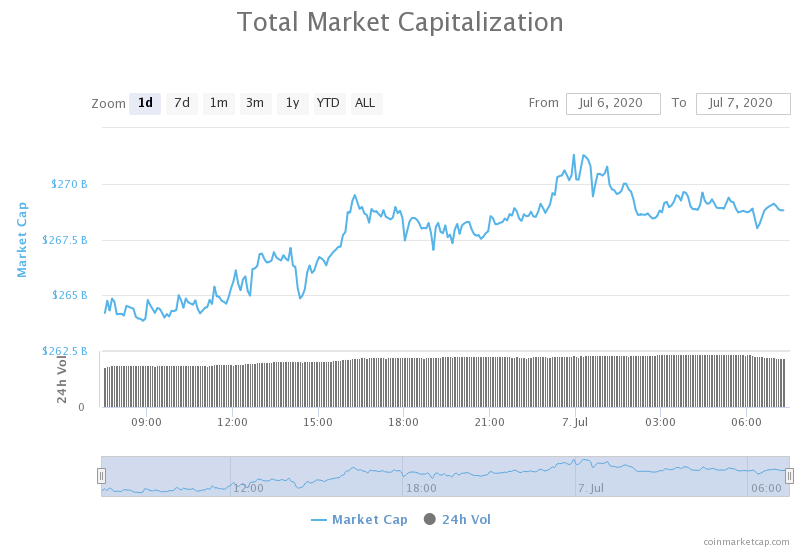
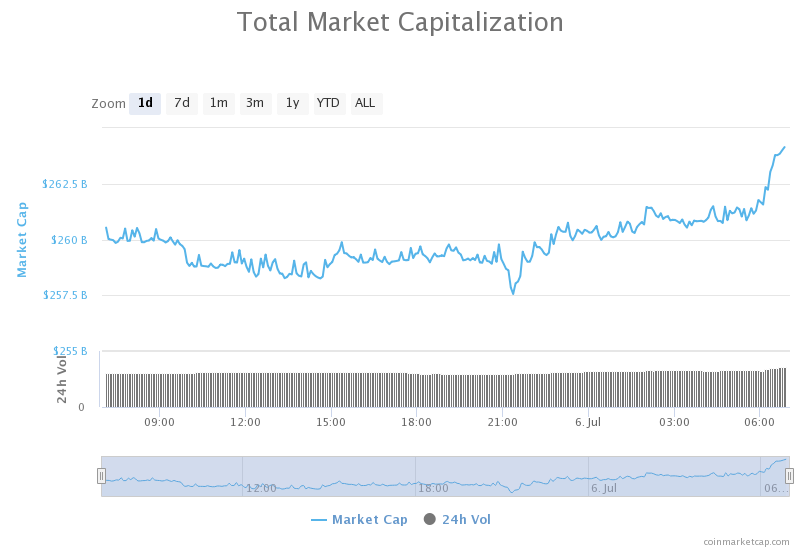
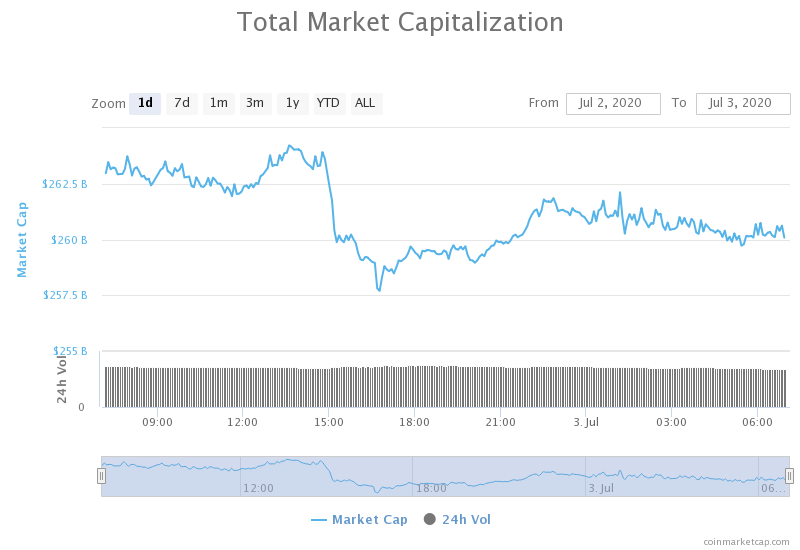
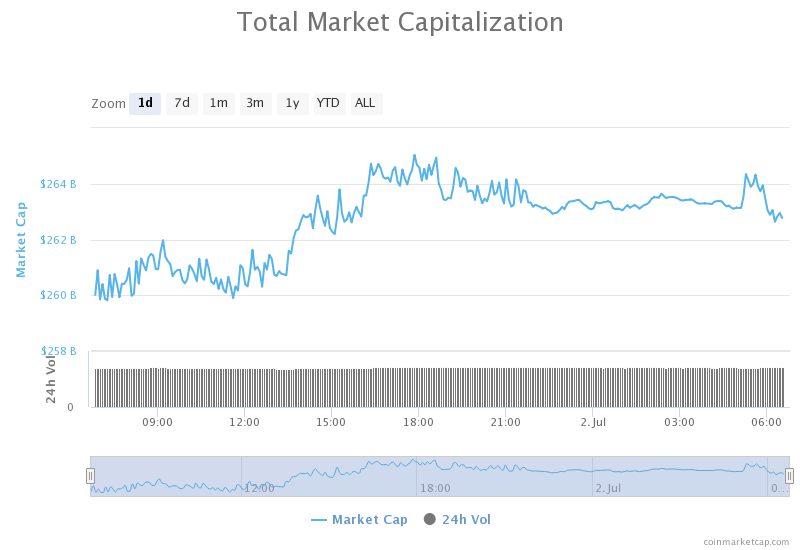
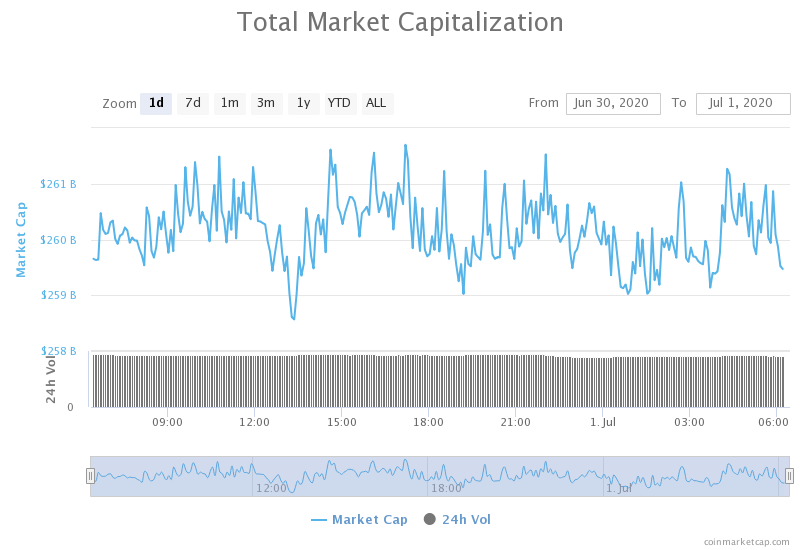
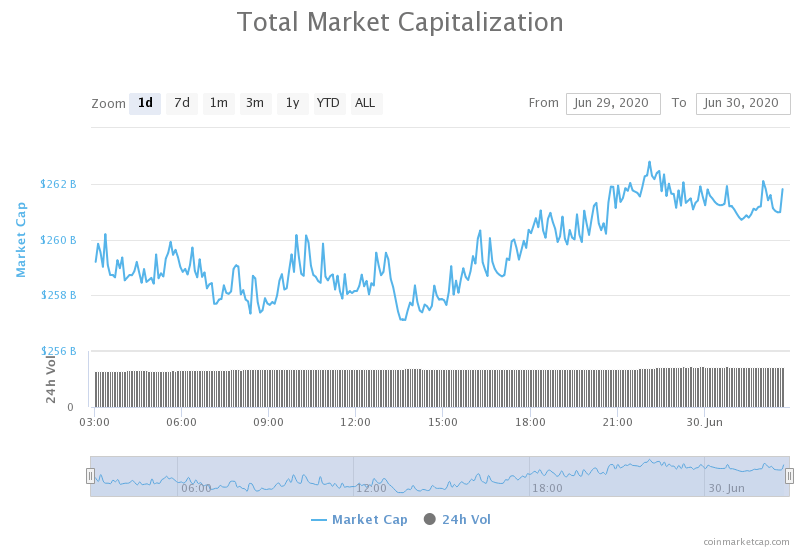
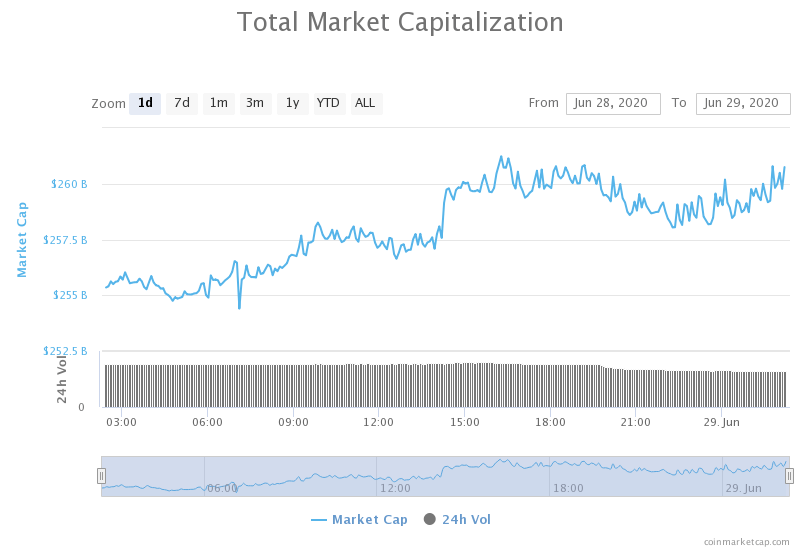
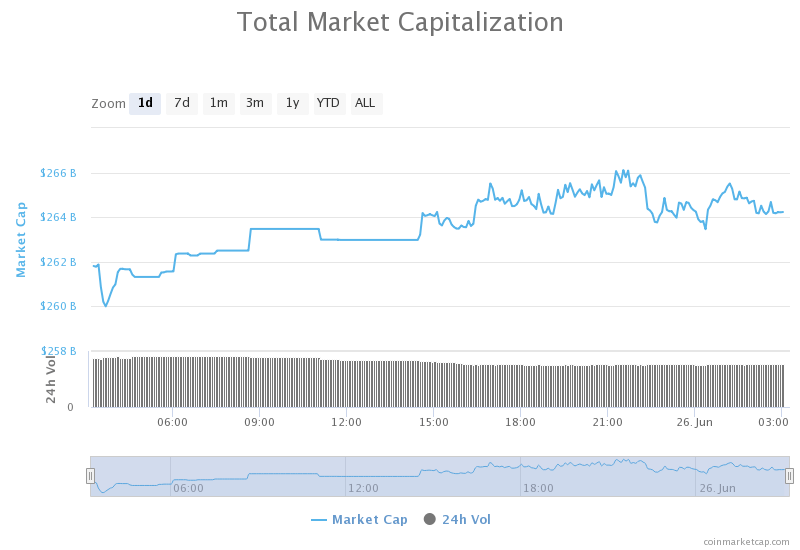
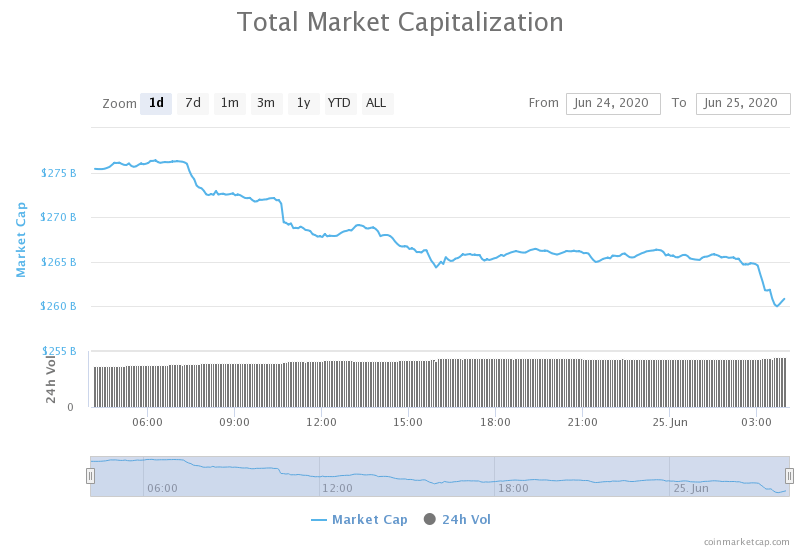
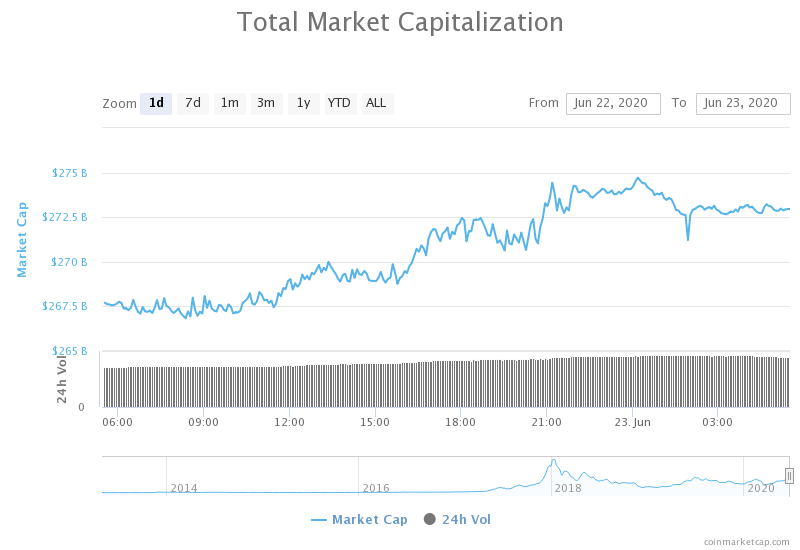
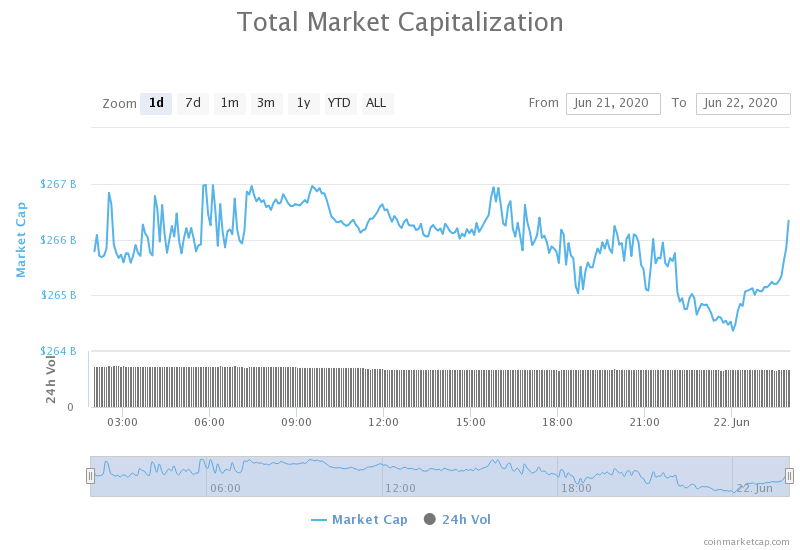
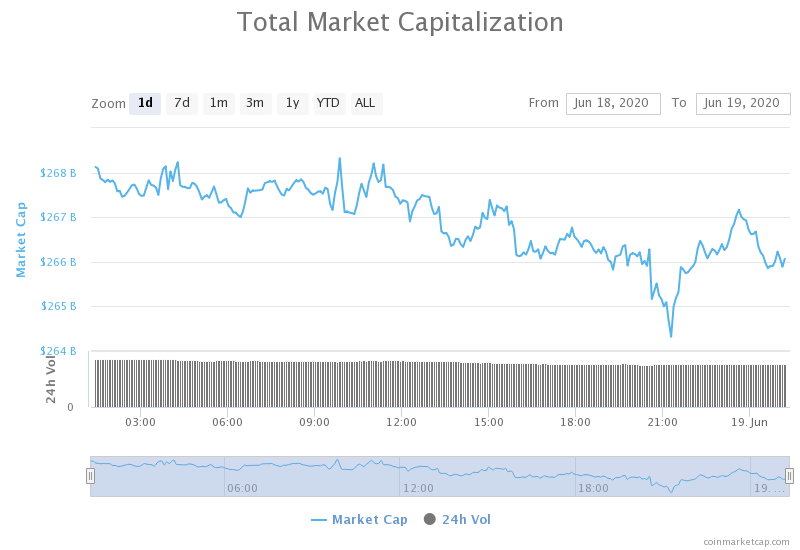
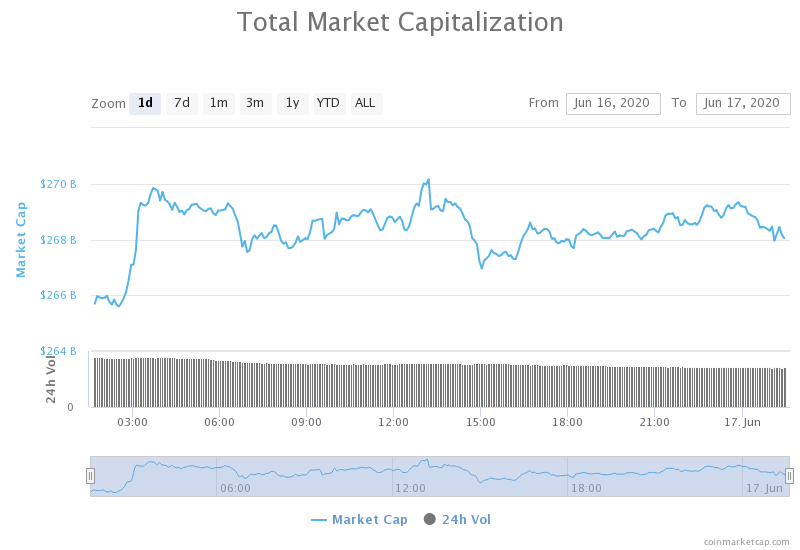
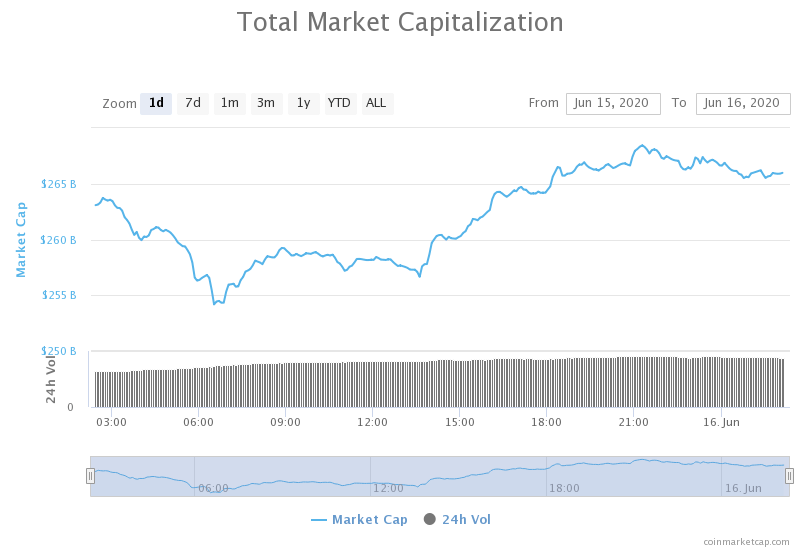
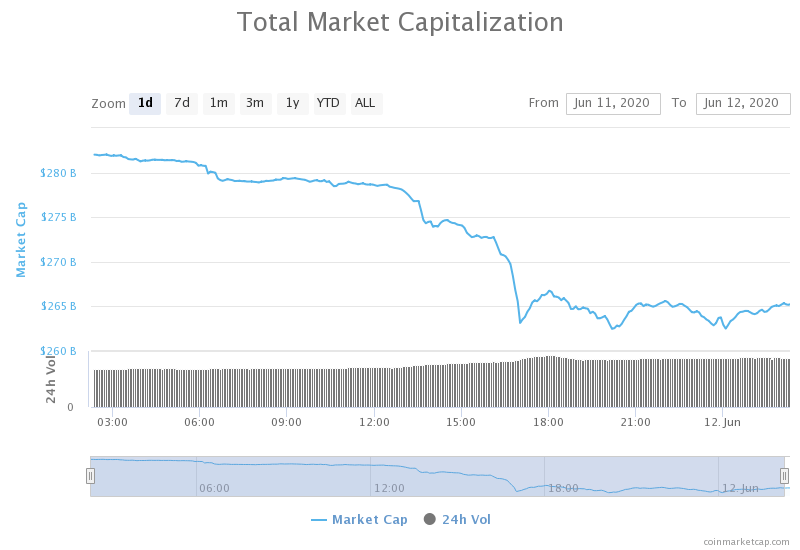
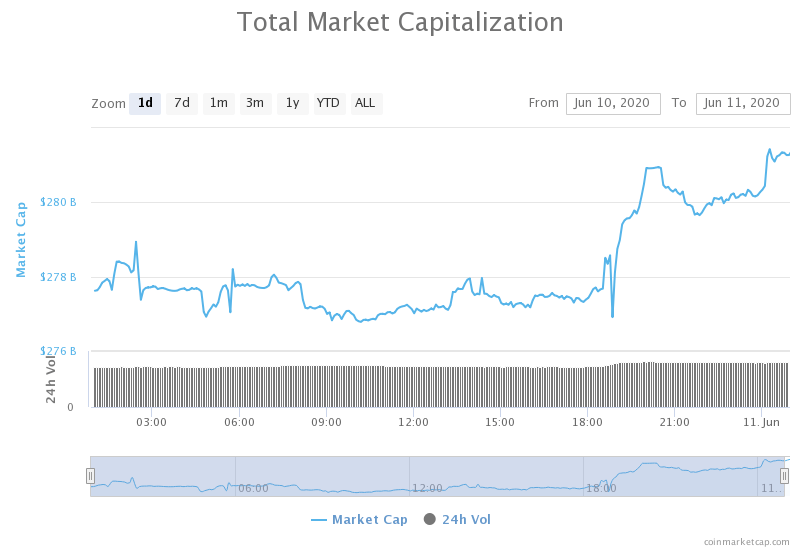
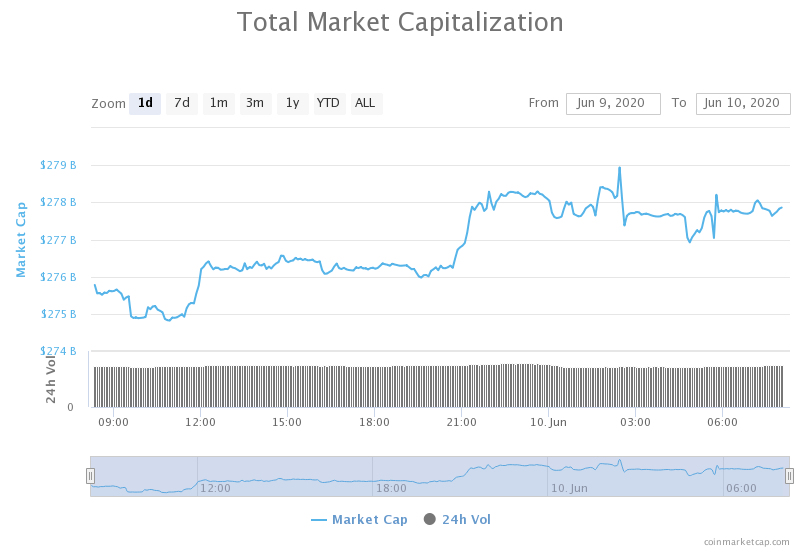
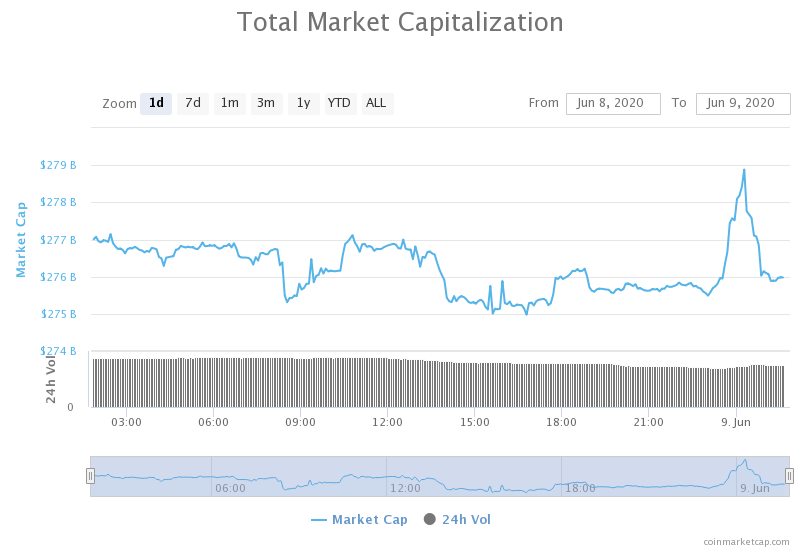
Daily Crypto Market Cap Chart
The cryptocurrency market capitalization skyrocketed and now confirmed its position above the $300 billion mark. Its current value is $320.99 billion, which represents an increase of $20.52 billion when compared to the value it had yesterday.
_______________________________________________________________________
What happened in the past 24 hours?
_______________________________________________________________________
- Bitcoin’s explosive rally liquidates over $300M; Strikes major blow to bears (Cryptoslate)
- As Ethereum skyrockets, 71% of ETH addresses are now in profit, setting a two-year high (Cryptoslate)
- Crypto fund expecting “99%” Chainlink (LINK) drop remains controversial (Cryptoslate)
- Coinbase CEO: Exchange Won’t List XMR Due to ‘Issue With Regulators’ (Cointelegraph)
- Ransomware Victims Are Fighting Back Against Their Attackers and Winning (Cointelegraph)
- Huawei Files for a Storage-Related Blockchain Patent (Cointelegraph)
- Tetras Capital Shuts Down Crypto Hedge Fund After 75% Loss (Coindesk)
- Cardano Plummets Ahead of Shelley, Rebound Expected (Cryptobriefing)
- Fueled by bitcoin’s rise, Bakkt reports record high volumes for its bitcoin futures market (The Block)
- ‘It’s a great time to be a bitcoin banker’ says Silvergate CEO during earnings call (The Block)
_______________________________________________________________________
Technical analysis
_______________________________________________________________________
Bitcoin
It’s safe to say that the largest cryptocurrency by market capitalization had another amazing day as it broke a major benchmark of $11,000 and reaching a final price of $11,394 before cooling down. The moment Bitcoin broke $10,000, on-chain activity registered a great increase in exchange inflow, which ultimately led to this fast price increase. During the process, Bitcoin managed to liquidate over $300 million in sell orders.
BTC traders should look for a trade opportunity either with another move up (aggressive) or when the price cools down slightly and makes a top (safer).
BTC/USD 4-hour Chart
Technical factors:
- Price is currently above its 50-period EMA and its 21-period EMA
- Price is slightly below its top B.B.
- RSI is in severely overbought territory (84.33)
- Volume greatly increased
Key levels to the upside Key levels to the downside
1: $10,855 1: $10,505
2: $11,090 2: $10,015
3: $11,630 3: $9,870
Ethereum
Ethereum looks like it has found its top at $330 after rising in price for the past 6 days. The final move brought the second-largest cryptocurrency by market cap to the highs of $333 before cooling off a bit. Ethereum now seems like it will (if nothing major happens to Bitcoin) possibly head towards the nearest support level to test it.
Ethereum traders should look for a trade opportunity in Ethereum’s pullbacks and confirmations.
ETH/USD 4-hour Chart
Technical Factors:
- Price is above the 50-period EMA and the 21-period EMA
- Price is below the top B.B.
- RSI elevated (64.32)
- Extremely high volume
Key levels to the upside Key levels to the downside
1: $340 1: $302
2: $362 2: $289
3: $278
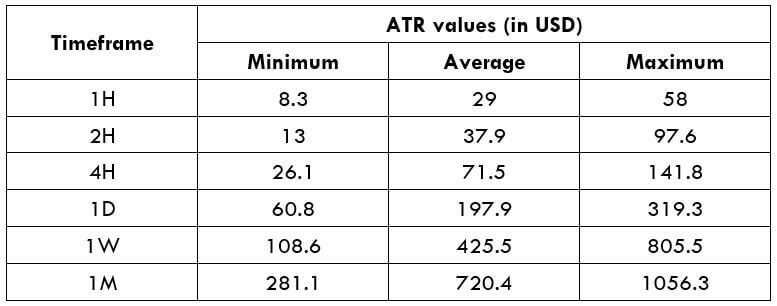
Ripple
The third-largest cryptocurrency by market cap had quite a stable day as it confirmed its path above $0.214. XRP then bounced up and tried to make a break above the $0.227. However, the move was unsuccessful due to the wall of sellers present. XRP will most likely continue to trade within a range, bound by $0.214 to the downside and $0.227 to the upside.
XRP traders can look for an opportunity within the range XRP is currently trading in.
XRP/USD 4-hour Chart
Technical factors:
- XRP in a mid-term descending trend (though it broke the trend in the short-term)
- Price above 21-period and the 50-period EMA
- Price is below the top B.B.
- RSI is elevated (61.27)
- Average/slightly higher than average volume
Key levels to the upside Key levels to the downside
1: $0.227 1: $0.214
2: $0.235 2: $0.205
3: $0.245 3: $0.2