Categories
Crypto Guides

Could Bitcoin Ever Beat Gold & Get The Safe-Haven Status?

Introduction

The traditional investors from the last few months are trying to understand the unprecedented financial system. The world is suffering from economic uncertainties, where 20% of the US workforce lost their jobs due to the COVID pandemic situation. At the same time, the precious metal “gold” hit an all-time high in this 2020 summer and stayed on a hike for a long time ever since.

The gold rush in the market might be due to various reasons – US dollar fall, US-China deteriorating relations, and general global economic crisis. Also, cryptocurrency investors advocated that Bitcoin perhaps can beat gold as the safe-haven, but researchers pointed out the fact that BTC is not so performing. As with the stock market fall, the market worth of Bitcoin was also down – which means that BTC can’t be classed as a safe-haven asset.

Bitcoin and Gold Market Risk

Bitcoin and gold have emerged as a leading investment unit to stabilize the economic downfall. In the finance industry, there is no guarantee for returns on investment, so there is always high risk. It’s not true that the value of gold will always rise because, in 2012-2015, it was dropped by $20,000 per ounce. Similarly, BTC value bounces up and down. Gold is not so volatile as Bitcoin currency. Gold is acting as a safe-haven from the last 100 years, and bitcoin is in the market from the last decade.

Can Bitcoin be called a Safe-Haven Asset?

Amid all economic crises, bitcoin price hardly reached $9,011, and that too, with a high risk. So, it can’t be considered as a safe-haven asset due to the following two reasons:

Reason 1

The Bitcoin volume in the market is so small to validate the concept of the safe-haven asset. A safe-haven in the traditional market is the asset whose price rises typically. When there is any risk, the investors simply shift their money from risky assets to a safe one to avoid the loss and to retain their investment value.

In the traditional market, Bitcoin’s share is less than $200 billion US dollar, which is not enough to perform as a safe-haven asset. It lacks federal regulations for transactions, and there is a high risk of scams in the Bitcoin cryptocurrency industry. That’s why the Securities and Exchange Commission also rejected the Bitcoin ETF proposal.

Reason 2

Bitcoin can’t be accessed or used in the environment, having no internet connection. In extreme places, you may be cut-off from the cryptocurrency exchange and Bitcoin traders due to limited internet connectivity. For example, due to any major strikes, most of the time, the government shut down the internet accessibility to slow down the protests and all.

In the meantime, due to no internet connection bitcoin wallet and exchange system get hampered instantly. Therefore, bitcoin can’t be used in the emergency situation, so it can’t be considered as an alternative currency or safe-haven asset.

Conclusion

Gold is a risky asset because of sharp falls, and bitcoin, too, has speculative risk factors. In the case of the safe-haven concept, gold is already declared as a safe-haven asset in the traditional market, while Bitcoin is battling for the title. A wide range of economic forces across the world doesn’t impact its value, as BTC trade executes independently. Despite the global recession and high unemployment, BTC is doing great in the market. But for now, we believe that this is not enough to qualify as a safe-haven asset.

Categories
Crypto Market Analysis

Daily Crypto Review, Sept 22 – Crypto Sector Plummets Alongside Stocks and Gold; Markets Preparing for the US Presidential Election

The cryptocurrency sector has dropped severely as the traditional markets tumbled and caused the crypto market to do the same. Bitcoin is currently trading for $10,458, representing a decrease of 4.38% on the day. Meanwhile, Ethereum lost 7.68% on the day, while XRP lost 5.87%.

 Daily Crypto Sector Heat Map

If we look at the top100 cryptocurrencies, only three have actually increased in value. Orchid gained 25.73% on the day, making it the most prominent daily gainer. Loopring (5.88%) and Hyperion (5.03%) also did great. On the other hand, Celo lost 19.17%, making it the most prominent daily loser. It is followed by Uniswap’s loss of 19.04% and Aave’s loss of 16.93%.

Top 10 24-hour Performers (Click to enlarge)

Bottom 10 24-hour Performers (Click to enlarge)

Bitcoin’s dominance level experienced an increase since our last report (as it always happens when the market drops), with its value currently being at 61.29%. This value represents a 0.67% difference to the upside when compared to when we last reported.

Daily Crypto Market Cap Chart

The crypto sector capitalization has lost value over the course of the past 24 hours. Its current value is $330.84 billion, which represents a decrease of $21.61 billion when compared to our previous report.

_______________________________________________________________________

What happened in the past 24 hours?

_______________________________________________________________________

_______________________________________________________________________

Technical analysis

_______________________________________________________________________

Bitcoin

Bitcoin has spent the day in a bearish pullback, which stopped at the 23.6% Fib retracement. However, its current position is just below that line, which makes it possible that it will continue its drop towards $9,300 to $9,500 levels. This push towards the downside was a bit premature, and most likely caused by the traditional market plummeting. Traditional markets have historically been slightly bearish before the presidential election, while they quickly recovered shortly after.

BTC/USD 4-hour Chart

If we take a look at the 4-hour time frame, the largest cryptocurrency by market cap has bounced off of the pink line after failing to break it, pushing further towards the downside, and ultimately breaking the 23.6% Fib retracement level. Bitcoin’s immediate position will be determined by whether it can break the 23.6% Fib retracement, but its overall short-term position is still bearish.

BTC/USD 4-hour Chart

Bitcoin’s short-term technicals have turned bearish as BTC dropped in price. However, its longer-term technicals are still bullish. With that being said, we can expect Bitcoin to drop a bit further before turning towards the upside.

BTC/USD 4-hour Technicals

Technical factors (4-hour Chart):
  • Price is far below its 50-period EMA and its 21-period EMA
  • Price slightly above its bottom Bollinger band
  • RSI is extremely close to being oversold (34.92)
  • Volume is slowly descending from a massive spike
Key levels to the upside          Key levels to the downside

1: $10,630                                 1: $10,500

2: $10,850                                 2: $10,015

3: $11,000                                  3: $9,880

Ethereum

While fundamental traders are calling for ETH’s price increase, most traders that take technical indicators into account are calling for a pullback towards $300. Etherum has lost over 7% of its value in the past 24 hours, with the move towards the downside ending at $340.

ETH/USD 4-hour Chart

Ethereum’s short-term technicals are still extremely bearish, while its mid-term technicals are tilted towards the bear side just a bit. With that being said, we can expect Ethereum to push towards the $300 level, unless Bitcoin pulls out of its bearish sentiment and pushes the market upwards.

ETH/USD 4-hour Technicals

Technical Factors (4-hour Chart):
  • The price is far below both its 21-period and its 50-period EMA
  • The slightly above its bottom Bollinger band
  • RSI is recovering from being oversold (32.42)
  • Volume is descending from its spike during the downswing
Key levels to the upside          Key levels to the downside

1: $360                                     1: $340

2: $371                                     2: $300

3: $400                                      3: $289

Ripple

XRP has spent the day (as almost every single cryptocurrency) pushing towards the downside. While the overall market move seemed premature and looked like it was pushed by the traditional markets, that may not be the case with XRP. If we take a look at the 4-hour chart, XRP’s 4th leg of the Elliot impulse wave has ended, which prompted the price to go towards the downside. Traders can most likely expect XRP’s price pushing towards $0.21.

XRP/USD 4-hour Chart

Taking a look at the technicals, XRP is showing bearish sentiment with both its short-term and long-term indicators. Its indicators change from just bearish to extremely bearish the longer we go in time, which implies an inherent bearishness when it comes to XRP.

XRP/USD 4-hour Technicals

Technical factors (4-hour Chart):
  • The price is well below both its 21-period EMA and its 50-period EMA
  • Price is slightly above its bottom Bollinger band
  • RSI is oversold but recovering (27.50)
  • Volume is coming back to normal after a huge spike (low)
Key levels to the upside          Key levels to the downside

1: $0.235                                   1: $0.227 

2: $0.2454                                 2: $0.221

3: $0.266                                  3: $0.214


Categories
Crypto Market Analysis

Daily Crypto Review, Sept 21 – Crypto Market is Preparing For a Bearish Move; UNI Token Booming

The cryptocurrency sector has mostly stayed at the same place over the weekend as Bitcoin was trying to break the psychological $11,000 resistance. Bitcoin is currently trading for $10,935, which represents an increase of 0.28% on the day. Meanwhile, Ethereum lost 1.58% on the day, while XRP lost 1.27%.

 Daily Crypto Sector Heat Map

If we look at the top100 cryptocurrencies, Celo gained an astonishing 45.37% on the day, making it the most prominent daily gainer. ZB Token (33.20%) and DigiByte (15.24%) also did great. On the other hand, HedgeTrade lost 13.52%, making it the most prominent daily loser. It is followed by Flexacoin’s loss of 12.67% and yearn.finance’s loss of 9.63%.

Top 10 24-hour Performers (Click to enlarge)

Bottom 10 24-hour Performers (Click to enlarge)

Bitcoin’s dominance level experienced a slight increase since our last report, with its value currently being at 60.62%. This value represents a 0.48% difference to the upside when compared to when we last reported.

Daily Crypto Market Cap Chart

The crypto sector capitalization stayed at virtually the same place over the weekend. Its current value is $351.13 billion, which represents a decrease of $3.37 billion when compared to our previous report.

_______________________________________________________________________

What happened in the past 24 hours?

_______________________________________________________________________

_______________________________________________________________________

Technical analysis

_______________________________________________________________________

Bitcoin

Bitcoin has spent the weekend trying to get past the psychological resistance of $11,000, but failed to do so. The daily chart shows a possible resistance level at the 61.8% Fib retracement from the Head and Shoulders pattern. If that happens, we may expect lows of $9,300 to $9,500.

BTC/USD 4-hour Chart

If we take a look at the 4-hour time frame, Bitcoin fell under the pink ascending line, which is now acting as resistance. However, this resistance is not as strong and may be surpassed with ease. Bitcoin is still struggling and trading within the range bound by $11,000 and $10,850 to the upside and downside, respectively.

BTC/USD 4-hour Chart

Bitcoin’s short-term technicals are showing bullish sentiment, while its mid-term technicals are slightly more bearish. While Bitcoin shows the most bullish sentiment out of the top three cryptocurrencies, we can expect a rebound from the current highs as BTC is unable to gain any meaningful bull push.

BTC/USD 4-hour Technicals

Technical factors (4-hour Chart):
  • Price is above its 50-period EMA and just slightly above its 21-period EMA
  • Price is at its middle Bollinger band
  • RSI is flat but overextended to the upside (53.96)
  • Volume is slowly descending
Key levels to the upside          Key levels to the downside

1: $11,000                                 1: $10,850

2: $11,090                                 2: $10,630

3: $11,460                                  3: $10,500

Ethereum

Ethereum’s price has been squeezed out of its current levels over the weekend, pushing it below the yellow bottom support (now resistance) line. However, the bears didn’t do much either, with ETH’s price descent ending after failing to break $371 to the downside. If this level breaks, we can expect a push towards the $360 support level.

ETH/USD 4-hour Chart

Ethereum’s technicals have turned towards the bear side as the price went down. While the DeFi surge should be taken into account, Ethereum looks like it will push towards the downside in the short-term.

ETH/USD 4-hour Technicals

Technical Factors (4-hour Chart):
  • The price is below both its 21-period and its 50-period EMA
  • The price below its middle Bollinger band
  • RSI neutral and stabilizing (45.44)
  • Volume is average (two-candle spike during the downswing)
Key levels to the upside          Key levels to the downside

1: $400                                     1: $371

2: $415                                     2: $360

3: $445                                      3: $340

Ripple

When taking a look at the 1-day chart, XRP has continued its Elliot Wave impulse pattern, nearly ending the fourth part of the wave. It is expected for XRP to push towards the downside (most likely towards $0.21) as a final leg of the impulse wave.

XRP/USD 1-day Chart

XRP spent its weekend in a slow push towards the upside as a continuation of its 4th leg of the impulse wave. With that being seemingly done, we can expect more bears to enter the market quite soon. This prediction is also confirmed by XRP finding much resistance at its 21-period and 50-period moving averages.

Taking a look at its technicals, XRP is (just as Ethereum) tilted towards the sell-side. Unlike Ethereum, however, XRP is showing even more bearish sentiment on longer time frames.

XRP/USD 4-hour Chart

XRP/USD 4-hour Technicals

Technical factors (4-hour Chart):
  • The price is below both its 21-period EMA and its 50-period EMA
  • Price is slightly below its middle Bollinger band
  • RSI is neutral and stabilizing (43.93)
  • Volume is average (low)
Key levels to the upside          Key levels to the downside

1: $0.266                                   1: $0.2454 

2: $0.285                                   2: $0.235

3: $0.31                                    3: $0.227


Categories
Crypto Guides

What Should You Know About ‘Automated DeFi-Styled Market Pool’ Launched By Binance

Introduction

The leading global cryptocurrency exchange “Binance” launched an automated DeFi-styled market pool for cryptocurrency investors to offer them with instant token swapping functionality. Binance officially brought this new trading platform from the decentralized finance (DeFi).

The platform will allow the money maker to deal with smart contracts. The cryptocurrency exchange system announced that it is an automated market maker (AMM) pool. The users are not only allowed to trade with funds but can also host liquidity pools. For the first time, an AMM pool is attached to the centralized trading exchange system. 

Binance Liquid Swap Product

The AMM pool product called “Binance Liquid Swap” will allow the users to keep their crypto funds in the pools for providing liquidity to the market. In return, they will earn the interest and share from the pool trading commission. They implemented an AMM model for pricing to provide users with stable pricing and low fees.

The AMM exchange model uses a predefined algorithm for pool liquidity to make markets. The exchanges provide liquidity to the pools regardless of the user’s token prior order size. The reward system and trading fee are yet to be disclosed. 

To start, the AMM pool provides the following trading pairs :

  • USDT/BUSD
  • USDT/DAI
  • BUSD/DAI

The security of the product is strengthened due to the Binance platform and also because of its move into the DeFi space with the launch of Binance Smart Chain. The smart chain is a highly performing Ethereum virtual machine. It is compatible with blockchain and works in parallel with the Binance chain. It offers users with smart contracts and allows them to stake a Binance coin. 

Binance Jump in DeFi 

In Binance, the liquid swap transaction fees and prices on AMM depend upon the asset number in each liquidity pool. The prices vary when currencies are added, removed, or swapped in the pool. The trader’s share in the pool will be collected every 7-day as an annual percentage yield (APY). The profit generated will be turned into assets for the respective pools. Binance introduced AMM pools to centralized exchange systems for more safety, security, and credibility.

As the decentralized Ethereum pool is highly risky due to huge market price fluctuations; hence, Binance went for the centralized approach, which would most probably minimize the big margin loss. The Binance is working to deliver instant swap liquidity in order to attract more participants and to incentivize the pool contributors for the community benefit. 

Conclusion

Binance designed this new DeFi “Binance Liquid Swap” having different liquidity pools so that users can earn income instantly and easily without much effort. The centralized AMM pool offers users to buy, stake, and trade their crypto assets. The instant swapping functionality will be executed via a centralized platform.

The users will be able to earn through interest and trading commission from the shares. This centralized platform is able to provide stable transaction prices and lower fees. The DeFi products perform better in the market if more investors are involved in providing liquidity to trade. Hence, to attract more liquidity providers, Binance is providing rewards in return. 

Categories
Crypto Market Analysis

Daily Crypto Review, Sept 18 – Uniswap’s UNI Token Surges Over 100% After Launch; Bitcoin Continues Fighting For $11,000

The cryptocurrency sector has mostly stayed at the same place as Bitcoin was fighting for the psychological $11,000 resistance. Bitcoin is currently trading for $10,938, which represents an increase of 0.46% on the day. Meanwhile, Ethereum gained 1.8% on the day, while XRP gained 1.33%.

 Daily Crypto Sector Heat Map

If we look at the top100 cryptocurrencies, |Uniswap gained an astonishing 112.59 % on the day, making it the most prominent daily gainer. ABBC Coin (28.18%) and SushiSwap (21.75%) also did great. On the other hand, Hyperion lost 19.78%, making it the most prominent daily loser. It is followed by Flexacoin’s loss of 12.93% and Celo’s loss of 11.74%.

Top 10 24-hour Performers (Click to enlarge)

Bottom 10 24-hour Performers (Click to enlarge)

Bitcoin’s dominance level experienced a slight decrease since our last report, with its value currently being at 60.14%. This value represents a 0.16% difference to the downside when compared to when we last reported.

Daily Crypto Market Cap Chart

The crypto sector capitalization stayed at the same place in the past 24 hours. Its current value is $354.50 billion, which represents an increase of $0.59 billion when compared to our previous report.

_______________________________________________________________________

What happened in the past 24 hours?

_______________________________________________________________________

_______________________________________________________________________

Technical analysis

_______________________________________________________________________

Bitcoin

Bitcoin has spent the day trying to confirm its position above $11,000 or to push above it yet again after it dropped below the level. The largest cryptocurrency by market capitalization struggled to cross this psychological resistance but confirmed the $10,850 support, which puts it in a narrow range that traders can use to their advantage.

Bitcoin’s short-term indicators are a bit less bullish than a couple of days ago, as Bitcoin did not manage to break the $11,000 mark. However, its long-term technicals are still extremely tilted towards the upside.

BTC/USD 4-hour Chart

Technical factors:
  • Price is above both its 50-period EMA and 21-period EMA
  • Price is right between its middle and top Bollinger band
  • RSI is flat but overextended to the upside (64.35)
  • Volume is slowly descending
Key levels to the upside          Key levels to the downside

1: $11,000                                 1: $10,850

2: $11,090                                 2: $10,630

3: $11,460                                  3: $10,500

Ethereum

Ethereum has followed its tight movement towards the ascending trend line, which took its price a bit higher than yesterday. Technicals, as well as the influx of people using Ethereum due to UNI token launching, bumped its price up to around 2% towards the upside.

With this being said, Ethereum’s technicals have turned extremely bullish as many traders called for the double bottom that formed, propelling ETH’s price up towards $400.

ETH/USD 4-hour Chart

Technical Factors:
  • The price is above both its 21-period and its 50-period EMA
  • The price slightly closer to its top Bollinger band than the middle one
  • RSI slowly descending (60.41)
  • Volume is average
Key levels to the upside          Key levels to the downside

1: $371                                     1: $360

2: $400                                     2: $340

3: $415                                      3: $300

Ripple

XRP has continued its push towards the upside and has continued heading towards the $0.266 resistance level. The steady push has slowed down a bit due to a decrease in volume but has shown no signs of completely stopping. XRP is in quite a good spot now, as many traders are calling for long positions (mostly on the 1-day and 1-week charts).

XRP saw a change of its short-term technicals to extremely bullish, while its mid-term technicals (1-month) are still tilted towards the sell-side. With that being said, more and more traders are slightly less bearish on XRP in the mid-term.

XRP/USD 4-hour Chart

Technical factors:
  • The price is well above its 21-period EMA and its 50-period EMA
  • Price is very close to its top Bollinger band
  • RSI is pushing towards overbought (64.37)
  • Volume is descending
Key levels to the upside          Key levels to the downside

1: $0.266                                   1: $0.2454 

2: $0.285                                   2: $0.235

3: $0.31                                    3: $0.227


Categories
Crypto Market Analysis

Daily Crypto Review, Sept 17 – Bitcoin Above $11,000; XRP Skyrocketing

The cryptocurrency sector has shot up as Bitcoin pushed towards $11,000. Most cryptos ended up in the green, with some even outperforming Bitcoin. Bitcoin is currently trading for $11,019, which represents an increase of 2.72% on the day. Meanwhile, Ethereum gained 5.58% on the day, while XRP gained an astonishing 7.24%.

 Daily Crypto Sector Heat Map

If we look at the top100 cryptocurrencies, DigiByte gained 23.07% on the day, making it the most prominent daily gainer. Hyperion (19.61%) and Kusama (11.85%) also did great. On the other hand, SushiSwap lost 15.68%, making it the most prominent daily loser. It is followed by Flexacoin’s loss of 11.46% and UMA’s loss of 11.43%.

Top 10 24-hour Performers (Click to enlarge)

Bottom 10 24-hour Performers (Click to enlarge)

Bitcoin’s dominance level experienced a slight decrease since our last report, with its value currently being at 60.30%. This value represents a 0.21% difference to the downside when compared to when we last reported.

Daily Crypto Market Cap Chart

The crypto sector capitalization has gone up significantly in the past 24 hours. Its current value is $353.89 billion, which represents an increase of $10.48 billion when compared to our previous report.

_______________________________________________________________________

What happened in the past 24 hours?

_______________________________________________________________________

_______________________________________________________________________

Technical analysis

_______________________________________________________________________

Bitcoin

Bitcoin has, as we said in our previous article, pushed towards the upside, attempting an $11,000 break. While it has broken the $11,000 psychological resistance, it got stopped out at the $11,090 resistance level. Bitcoin will have to make a confirmation move in order to stay above $11,000, which may be hard since it will be in such a tight range ($11,000 to $11,090).

Bitcoin’s short-term indicators are extremely bullish, but its longer-term indicators are also tilted towards the bull side. Traders should look out for how Bitcoin handles the $11,000 level and trade off of it.

BTC/USD 4-hour Chart

Technical factors:
  • Price is above both its 50-period EMA and 21-period EMA
  • Price is near its top Bollinger band
  • RSI is overextended to the upside (71.42)
  • Volume is stable (with a couple of spikes)
Key levels to the upside          Key levels to the downside

1: $11,000                                 1: $10,850

2: $11,090                                 2: $10,630

3: $11,460                                  3: $10,500

Ethereum

As we said in our previous article, it would take a strong push towards the upside to pull Ethereum out of the 35% downside prognosis, which many trades called since the ETH/USD pair created a bear flag. However, Bitcoin’s push towards $11,000 prompted Ethereum to push towards the upside and get back into the range.

With this being said, Ethereum hasn’t confirmed its position above the bear flag lower line, which is because the $371 level it passed will remain in our “key level to the upside” section until ETH confirms otherwise. Still, its short-term indicators have changed to a bit more bullish scenario.

ETH/USD 4-hour Chart

Technical Factors:
  • The price is above both its 21-period and its 50-period EMA
  • The price is right at its top Bollinger band
  • RSI is neutral but pushing towards the upside (59.82)
  • Volume is low and stable
Key levels to the upside          Key levels to the downside

1: $371                                     1: $360

2: $400                                     2: $340

3: $415                                      3: $300

Ripple

XRP had an amazing day, with its price pushing over 7% on the day. The third-largest cryptocurrency by market cap has used this influx of bulls to its fullest, confirming its position above $0.2454 and even pushing towards $0.266.

XRP has joined Ethereum in terms of technicals, with the short-term overview changing to a short-term buy, while its long-term technicals are still showing slight bearishness. Traders can look for a pullback that XRP will inevitably make and trade off of it.

XRP/USD 4-hour Chart

Technical factors:
  • The price is above its 21-period EMA and its 50-period EMA
  • Price is above its top Bollinger band
  • RSI is skyrocketing and pushing towards overbought (67.99)
  • Volume is low (but slowly increasing)
Key levels to the upside          Key levels to the downside

1: $0.266                                   1: $0.2454 

2: $0.285                                   2: $0.235

3: $0.31                                    3: $0.227


Categories
Crypto Market Analysis

Daily Crypto Review, Sept 16 – Ethereum Facing a 35% Drop; Bitcoin Remains Bullish

The cryptocurrency sector has ended up with almost every single cryptocurrency in the top100 in the red. Bitcoin is currently trading for $10,707, which represents a decrease of 0.52% on the day. Meanwhile, Ethereum lost 5.13% on the day, while XRP lost 3.44%.

 Daily Crypto Sector Heat Map

If we look at the top100 cryptocurrencies, ABBC Coin gained 11.74% on the day, making it the most prominent daily gainer. Nervos Network (11.40%) and Hyperion (9.41%) also did great. On the other hand, the SushiSwap lost 34.73%, making it the most prominent daily loser. It is followed by NXM’s loss of 27.55% and Aragon’s loss of 24.48%.

Top 10 24-hour Performers (Click to enlarge)

Bottom 10 24-hour Performers (Click to enlarge)

Bitcoin’s dominance level experienced an increase since our last report, with its value currently being at 60.51%. This value represents a 1.04% difference to the upside when compared to when we last reported.

Daily Crypto Market Cap Chart

The crypto sector capitalization has gone down in the past 24 hours. Its current value is $343.41 billion, which represents a decrease of $6.08 billion when compared to our previous report.

_______________________________________________________________________

What happened in the past 24 hours?

_______________________________________________________________________

_______________________________________________________________________

Technical analysis

_______________________________________________________________________

Bitcoin

After a strong push towards the upside, Bitcoin has tried to consolidate just below the $10,850 mark. The largest cryptocurrency by market cap grazed the RSI overbought territory while failing to push its momentum past the $10,850 level, which held up quite nicely. Bitcoin is now stabilizing around the $10,700 level, where it will try to gather enough bull presence for another push towards $11,000.

Bitcoin’s short-term indicators are showing a bit less bull presence compared to yesterday, while its long-term indicators are still bullish.

BTC/USD 4-hour Chart

Technical factors:
  • Price is above both its 50-period EMA and 21-period EMA
  • Price is between the middle and top Bollinger band
  • RSI is overextended to the upside but descending (63.56)
  • Volume is stable
Key levels to the upside          Key levels to the downside

1: $10,850                                1: $10,630

2: $11,000                                2: $10,500

3: $11,090                                 3: $10,360

Ethereum

Ethereum has experienced quite a massive drop, considering it was not caused by a Bitcoin selloff. The second-largest cryptocurrency by market cap started its price descent and confirmed its bear flag formation. If the bear flag prediction comes true, we may experience a 35% move towards the downside from Ethereum. However, if the $360 level holds and pushes the price back up, the current move towards the downside may be called a fakeout.

With this being said, after the price has left the bear flag and confirmed it, the indicators have turned to “strong sell”. This is certainly a strong bearish indicator (or rather a set of indicators).

ETH/USD 4-hour Chart

Technical Factors:
  • The price is below both its 21-period and its 50-period EMA
  • The price is right below the middle Bollinger band
  • RSI is neutral and descending (41.22)
  • Volume is low and stable
Key levels to the upside          Key levels to the downside

1: $371                                     1: $360

2: $400                                     2: $340

3: $415                                      3: $300

Ripple

XRP had quite a wild day when looking at its price movement. The third-largest cryptocurrency by market cap fell below the $0.2454 level, which triggered a massive selloff that brought its price to the $0.235 level. However, XRP bulls quickly reacted and brought the price back up near the $0.24 level, which is where XRP is at.

XRP has joined Ethereum in terms of technicals, with the short-term overview showing a “strong sell” sign.

XRP/USD 4-hour Chart

Technical factors:
  • The price is below its 21-period EMA and its 50-period EMA
  • Price is below its middle Bollinger band
  • RSI is neutral and descending (40.77)
  • Volume is low (one-candle spike during the selloff)
Key levels to the upside          Key levels to the downside

1: $0.2454                                  1: $0.235 

2: $0.266                                    2: $0.227

3: $0.285                                   3: $0.221


Categories
Crypto Market Analysis

Daily Crypto Review, Sept 15 – BTC Heading Towards $11,000; ETH Facing a 35% Drop?

The cryptocurrency sector has mostly been in the green in the past 24 hours, with Bitcoin leading the way towards the upside. Meanwhile, most of the tokens that ended up in the red on the daily were Ethereum (mostly DeFi) tokens. Bitcoin is currently trading for $10,763, which represents an increase of 4.09% on the day. Meanwhile, Ethereum gained 3.41% on the day, while XRP gained 2.42%.

 Daily Crypto Sector Heat Map

If we take a look at the top100 cryptocurrencies, Hyperion gained 51.28% on the day, making it the most prominent daily gainer. NXM (40.86%) and Bytom (18.97%) also did great. On the other hand, the UNUS SED LEO lost 6.72%, making it the most prominent daily loser. It is followed by Waves’ loss of 6.35% and Band Protocol’s loss of 5.57%.

Top 10 24-hour Performers (Click to enlarge)

Bottom 10 24-hour Performers (Click to enlarge)

Bitcoin’s dominance level experienced a slight increase since our last report, with its value currently being at 59.47%. This value represents a 0.1% difference to the upside when compared to when we last reported.

Daily Crypto Market Cap Chart

The crypto sector capitalization has skyrocketed in the past 24 hours. Its current value is $351.49 billion, which represents an increase of $15.59 billion when compared to our previous report.

_______________________________________________________________________

What happened in the past 24 hours?

_______________________________________________________________________

_______________________________________________________________________

Technical analysis

_______________________________________________________________________

Bitcoin

Bitcoin has made a move towards the upside, passing through its $10,360 and $10,500 levels. As we mentioned in our previous articles, this is a huge bullish sign, and the overall indicators are showing that as well. If the bulls regain momentum, we can expect a push towards $11,000 once the consolidation continues.

With that being said, Bitcoin’s current price movement got stopped at the $10,850 level. While this does mean that Bitcoin bulls have encountered some resistance, it certainly does not mean that the overall trend is over. Bitcoin has shown great resistance at the $10,000 psychological level, which prompted this push towards the upside.

BTC/USD 4-hour Chart

Technical factors:
  • Price is above both its 50-period EMA and 21-period EMA
  • Price is right at the top Bollinger band
  • RSI is overextended to the upside, though with more room to go up (67.45)
  • Volume is stable
Key levels to the upside          Key levels to the downside

1: $10,850                                1: $10,630

2: $11,000                                2: $10,500

3: $11,090                                 3: $10,360

Ethereum

Ethereum was extremely volatile in the past 24 hours. Its price movements were quite hectic, with the price pushing past the $371 level and reaching the $385 mark before coming back down to restest the newly-conquered level, only to go up again and down again. Ethereum is currently supported by both the 50-period and 21-period moving averages, which are right below its price level. On top of that, the $371 level was turned to a support level after a clean confirmation move.

While its technicals show a short-term buy opportunity, the long-term technicals are still tilted towards the sell side. On top of that, Ethereum has created a nice bear flag formation, which (if it turns out to be correct) can prompt a 35% move towards the downside.

ETH/USD 4-hour Chart

Technical Factors:
  • The price is right above both its 21-period and its 50-period EMA
  • The price is right above the middle Bollinger band
  • RSI is neutral (53.36)
  • Volume is low and stable
Key levels to the upside          Key levels to the downside

1: $400                                     1: $371

2: $415                                     2: $360

3: $445                                      3: $340

Ripple

XRP has managed to push itself above the $0.2454 level once again, but still hasn’t confirmed its position above it. A confirmation above this level and a slight push towards the upside will be crucial for the future of XRP, as many traders are calling for bearish scenarios and drawing a bearish flag (though this flag is a lot less picture-perfect as the one on the ETH/USD chart).

XRP is showing signs of slight short-term bullishness, while its longer-term technicals are still pointing towards the downside.

XRP/USD 4-hour Chart

Technical factors:
  • The price is just above its 21-period EMA and its 50-period EMA
  • Price is right above its middle Bollinger band
  • RSI is neutral and pushing towards the upside(54.88)
  • Volume is extremely low, but stable
Key levels to the upside          Key levels to the downside

1: $0.2454                                  1: $0.235 

2: $0.266                                    2: $0.227

3: $0.285                                   3: $0.221


Categories
Crypto Market Analysis

Daily Crypto Review, Sept 14 – The EU Regulating Stablecoins; Crypto Market Preparing For a Move

The cryptocurrency market managed to stay relatively healthy over the weekend as most cryptos tried to consolidate rather than move. Bitcoin is currently trading for $10,343, which represents a decrease of 0.85% on the day. Meanwhile, Ethereum lost 5.22% on the day, while XRP lost 2.06%.

 Daily Crypto Sector Heat Map

If we take a look at the top100 cryptocurrencies, Flexacoin gained 13.18% on the day, making it the most prominent daily gainer. OKB (13.14%) and Waves (12.08%) also did great. On the other hand, the NXM lost 18.45%, making it the most prominent daily loser. It is followed by DFI. Money’s loss of 17.46% and yearn .finance’s loss of 16.42%.

Top 10 24-hour Performers (Click to enlarge)

Bottom 10 24-hour Performers (Click to enlarge)

Bitcoin’s dominance level experienced an increase since our last report, with its value currently being at 59.37%. This value represents a 4.93% difference to the upside when compared to when we last reported.

Daily Crypto Market Cap Chart

The crypto sector capitalization has gone slightly down in the past 24 hours. Its current value is $335.90 billion, which represents a decrease of $2.27 billion when compared to our previous report.

_______________________________________________________________________

What happened in the past 24 hours?

_______________________________________________________________________

_______________________________________________________________________

Technical analysis

_______________________________________________________________________

Bitcoin

Bitcoin has spent the weekend steadily and slowly increasing and trying to reach past $10,500. While it has gotten past the $10,360 level once, it fell under it once the move couldn’t carry enough momentum to pass $10,500 as well. Bitcoin is currently fighting for the $360 level, with its price being right below it.

Our prediction regarding the price movement stays the same as Bitcoin did not move much over the course of the weekend. If Bitcoin doesn’t pass the $10,360 line soon, we should look for support at $9,600, and ultimately at the 200-day SMA ($9,080).

It is also important to note that, as the price movement has been muted for such a long time, it is extremely likely that, once the price moves past $10,360 or below $10,000 (with confidence), we might see a massive surge in volume extending that move. This will be a great opportunity for traders to trade on the way down, as well as the pullbacks.

BTC/USD 4-hour Chart

Technical factors:
  • Price is below the 50-period EMA and right at the 21-period EMA
  • Price is right at middle Bollinger band
  • RSI is neutral (50.27)
  • Volume is stable (slightly below average)
Key levels to the upside          Key levels to the downside

1: $10,360                                1: $10,015

2: $10,500                                2: $9,870

3: $10,630                                 3: $9,600

Ethereum

Ethereum’s price movement in the past couple of days looks exactly like Bitcoins in direction, but with much higher volatility. The second-largest crypto by market cap took the weekend to push towards $400, which ended unsuccessfully. As the move could not carry the momentum forward, bears took over and brought the price to its current position, where it is bound in a narrow range by $360 to the downside and $371 to the upside.

Ethereum’s volatility certainly comes from people investing in DeFi as Ethereum was never as volatile as it is now. However, its moves are still following Bitcoin. This volatility might be a good opportunity for traders to push for some trades.

ETH/USD 4-hour Chart

Technical Factors:
  • The price is right above its 21-period and its 50-period EMA
  • The price is at its middle Bollinger band
  • RSI is neutral (49.14)
  • Volume is low and stable
Key levels to the upside          Key levels to the downside

1: $371                                     1: $360

2: $400                                     2: $340

3: $415                                      3: $300

Ripple

XRP has not been much different from the aforementioned two cryptocurrencies. The third-largest cryptocurrency by market cap is still trading within a range bound by $0.235 to the downside and (more importantly) $0.2454 to the upside. XRP did have one a short period where it spiked above the resistance level, but the price quickly dwindled back down to its original level.

XRP is now fighting for the $0.2454 level, trying to surpass it. However, the extremely low volume shows us that this is will most likely not happen. Traders might have the opportunity to trade the pullback.

XRP/USD 4-hour Chart

Technical factors:
  • The price is just above its 21-period EMA and just below its 50-period EMA
  • Price is right above its middle Bollinger band
  • RSI is neutral (51.35)
  • Volume is extremely low, but stable
Key levels to the upside          Key levels to the downside

1: $0.2454                                  1: $0.235 

2: $0.266                                    2: $0.227

3: $0.285                                   3: $0.221


Categories
Crypto Market Analysis

Daily Crypto Review, Sept 11 – DeFi Sector Experiences Volatility; The Rest Of The Market Stable

The cryptocurrency market has experienced large volatility in the DeFi sector, while the rest of the market was relatively stable. Bitcoin is currently trading for $10,301, which represents a decrease of 0.68% on the day. Meanwhile, Ethereum lost 0.11% on the day, while XRP lost 0.73%.

 Daily Crypto Sector Heat Map

If we take a look at the top100 cryptocurrencies, aelf gained 152.47% on the day, making it the most prominent daily gainer. Flexacoin (45.07%) and Ampleforth (35.77%) also did great. On the other hand, the SushiSwap lost 14.95%, making it the most prominent daily loser. It is followed by Elrond’s loss of 7.82% and Serum’s loss of 6.08%.

Top 10 24-hour Performers (Click to enlarge)

Bottom 10 24-hour Performers (Click to enlarge)

Bitcoin’s dominance level experienced a massive drop since our last report, with its value currently being at 54.44 9.29%. This value represents a 4.85% difference to the downside when compared to when we last reported.

Daily Crypto Market Cap Chart

The crypto sector capitalization has gone up in the past 24 hours. Its current value is $337.66 billion, which represents an increase of $5.84 billion when compared to our previous report.

_______________________________________________________________________

What happened in the past 24 hours?

_______________________________________________________________________

_______________________________________________________________________

Technical analysis

_______________________________________________________________________

Bitcoin

Bitcoin has spent another day trying to push past the $10,360 resistance. However, every attempt in the past few days ended up in BTC passing the level, but then coming back under it due to being unable to confirm its position above. While the resistance level weakens each time Bitcoin attempts to pass it, it brings more bears to the game as most people intuitively trade in the direction opposite to the most recent failed attempt.

If Bitcoin doesn’t pass $10,360 soon, we should look for support at $9,600, and ultimately at the 200-day SMA ($9,080).

BTC/USD 4-hour Chart

Technical factors:
  • Price is below the 50-period EMA and right above the 21-period EMA
  • Price is slightly closer to the middle than the top Bollinger band
  • RSI is neutral (49.57)
  • Volume is stable
Key levels to the upside          Key levels to the downside

1: $10,360                                1: $10,015

2: $10,500                                2: $9,870

3: $10,630                                 3: $9,600

Ethereum

Ethereum has, unlike Bitcoin, managed to gain some value as it reached past its $360 level. However, the move has ended and Ethereum is now stuck in a narrow range between $360 to the downside and $371 to the upside. The second-largest cryptocurrency by market cap has repeatedly tried to get past it, but with no success.

Ethereum’s break above $371 should establish a short-term bullishness, while a break below $360 is not as relevant, and we may look for $340 as the next support.

ETH/USD 4-hour Chart

Technical Factors:
  • The price is above its 21-period while it is currently crossing the 50-period EMA
  • The price is near its top Bollinger band
  • RSI is neutral (52.77)
  • Volume is low and stable
Key levels to the upside          Key levels to the downside

1: $371                                     1: $360

2: $400                                     2: $340

3: $415                                      3: $300

Ripple

XRP failed to break its immediate resistance of $0.2454, which triggered a small pullback. The third-largest cryptocurrency by market cap doesn’t seem like it will be able to break this level any time soon unless it gets a massive influx of bulls. Unlike the aforementioned two cryptocurrencies, XRP is a bit more stable, and failing to push above a resistance level doesn’t necessarily mean that it will attempt a move towards the downside.

XRP/USD 4-hour Chart

Technical factors:
  • The price is just below its 21-period EMA and well below its 50-period EMA
  • Price is sitting at the middle Bollinger band
  • RSI is neutral and descending (47.20)
  • Volume is low and stable
Key levels to the upside          Key levels to the downside

1: $0.2454                                  1: $0.235 

2: $0.266                                    2: $0.227

3: $0.285                                   3: $0.221


Categories
Crypto Market Analysis

Daily Crypto Review, Sept 10 – Ethereum Double-Digit Gains; Crypto – S&P500 Correlation nears All-Time-Highs

The cryptocurrency market recovered today as Bitcoin bulls pushed past $10,360. On top of that, Ethereum skyrocketed, netting double-digit gains on the day. Bitcoin is currently trading for $10,391, which represents an increase of 3.90% on the day. Meanwhile, Ethereum gained 11.36% on the day, while XRP gained 5.48%.

 Daily Crypto Sector Heat Map

If we take a look at the top100 cryptocurrencies, Solana gained 42.61% on the day, making it the most prominent daily gainer. Yearn.finance (24.55%) and Aave (24.03%) also did great. On the other hand, the Hyperion lost 24.27%, making it the most prominent daily loser. It is followed by Blockstack’s loss of 5.21% and Tron’s loss of 2.60%.

Top 10 24-hour Performers (Click to enlarge)

Bottom 10 24-hour Performers (Click to enlarge)

Bitcoin’s dominance level decreased slightly since our last report, with its value currently being at 59.29%. This value represents a 0.60% difference to the downside when compared to when we last reported.

Daily Crypto Market Cap Chart

The crypto sector capitalization has gone up slightly in the past 24 hours. Its current value is $331.80 billion, which represents an increase of $4.90 billion when compared to our previous report.

_______________________________________________________________________

What happened in the past 24 hours?

_______________________________________________________________________

_______________________________________________________________________

Technical analysis

_______________________________________________________________________

Bitcoin

Bitcoin has spent the past 24 hours trying to push past the $10,360 resistance level, which is key if the largest cryptocurrency by market cap wants to continue its bullish presence. Even though the level has fallen, BTC needs to reliably pass it and confirm its position above it in order to encourage more bulls to enter the market. If Bitcoin positions itself above $10,360 well, the influx of bullish pressure will most likely send its price further up towards $10,500 or even $10,630

If, however, Bitcoin manages to fall below $10,000 and confirms its position below it, we can expect to see a bear push towards $9,600 and ultimately to the 200-day SMA ($9,080).

BTC/USD 4-hour Chart

Technical factors:
  • Price is below 50-period EMA while being above its 21-period EMA
  • Price is hitting the top Bollinger band
  • RSI is neutral and pushing towards the upside (54.00)
  • Volume is stable
Key levels to the upside          Key levels to the downside

1: $10,360                                1: $10,015

2: $10,500                                2: $9,870

3: $10,630                                 3: $9,600

Ethereum

Ethereum skyrocketed in the past 24 hours, with its price reaching double-digit gains. The second-largest cryptocurrency by market cap overcame the initial rejection of the $360 level and ultimately pushed past it, reaching the $371 level and getting stopped out there. The next move Ethereum makes will be crucial and will determine its short-term future.

If Ethereum manages to pull off a confirmation move above $360, we can expect a push towards $371. However, if that does not happen, we can expect ETH to return to its previous levels.

ETH/USD 4-hour Chart

Technical Factors:
  • The price is well above its 21-period while being slightly above its 50-period EMA
  • The price is above its top Bollinger band
  • RSI is neutral and pushing towards the upside (57.49)
  • Volume is low and stable
Key levels to the upside          Key levels to the downside

1: $360                                     1: $340

2: $371                                     2: $300

3: $400                                      3: $289

Ripple

XRP made a move towards the upside like Ethereum and Bitcoin, but its move was more alike to Bitcoin’s than Ethereum’s. The third-largest cryptocurrency by market cap managed to gather some bullish pressure and push towards the $0.2454, which barely touched at the time of writing). However, just like with Bitcoin, XRP did not conquer this resistance level yet, and it will have to confirm its position above it in order to bring the attention of more bulls.

XRP might face another resistance level in the form of its 50-period moving average, which sits very close to its current price.

XRP/USD 4-hour Chart

Technical factors:
  • The price is just above its 21-period EMA and right above its 50-period EMA
  • Price is above its top Bollinger band
  • RSI is neutral and moving towards the upside (54.76)
  • Volume is low and stable
Key levels to the upside          Key levels to the downside

1: $0.2454                                  1: $0.235 

2: $0.266                                    2: $0.227

3: $0.285                                   3: $0.221


Categories
Crypto Market Analysis

Daily Crypto Review, Sept 9 – Will DeFi Bubble Burst, Send Ethereum to Freefall?

The cryptocurrency market had another pullback today, with Bitcoin coming dangerously close to $10,000. Bitcoin is currently trading for $10,087, which represents a decrease of 2.29% on the day. Meanwhile, Ethereum lost 3.26% on the day, while XRP lost 2.52%.

 Daily Crypto Sector Heat Map

If we take a look at the top100 cryptocurrencies, IOST gained 11.86% on the day, making it the most prominent daily gainer. TRON (11.78%) and Ontology (7.92%) also did great. On the other hand, the SushiSwap lost 15.01%, making it the most prominent daily loser. It is followed by Hyperion’s loss of 14.32% and Ocean Protocol’s loss of 11.46%.

Top 10 24-hour Performers (Click to enlarge)

Bottom 10 24-hour Performers (Click to enlarge)

Bitcoin’s dominance level stayed at the same spot since our last report, with its value is currently at 59.89%. This value represents a 0.05% difference to the upside when compared to when we last reported.

Daily Crypto Market Cap Chart

The crypto sector capitalization has gone down slightly in the past 24 hours. Its current value is $326.90 billion, which represents a decrease of $6.34 billion when compared to our previous report.

_______________________________________________________________________

What happened in the past 24 hours?

_______________________________________________________________________

_______________________________________________________________________

Technical analysis

_______________________________________________________________________

Bitcoin

Bitcoin has been clinging to the $10,000 psychological resistance for the past 24 hours as bears took over the market yet again. The largest cryptocurrency by market cap fell well below $10,000, but quickly recovered and stayed just a bit up for the duration of the day. The reason for the sudden drop is most likely the inability to break the $10,360 resistance level. Lower time-frames show that Bitcoin might have formed a triple bottom formation, which would indicate some form of bullishness.

When it comes to predictions, we are one step closer to the bearish scenario than yesterday. A drop sustained drop below $10,000 could lead us to $9,600 and ultimately to the 200-day SMA ($9,080). On the other hand, if BTC manages to bounce off the current levels and surpass $10,500, a move to $11,000 is likely.


BTC/USD 4-hour Chart

Technical factors:
  • Price is well below its 50-period, while it’s slightly below its 21-period EMA
  • Price is slightly below middle Bollinger band
  • RSI is neutral (43.31)
  • Volume is stable
Key levels to the upside          Key levels to the downside

1: $10,360                                1: $10,015

2: $10,500                                2: $9,870

3: $10,850                                 3: $9,600

Ethereum

Ethereum had quite a bad day, with its price falling below the $340 mark. The second-largest cryptocurrency by market cap is already down over 30% from the $490 peak, with many indicators showing bearish scenarios. If the DeFi bubble pops, we can see Ethereum in freefall, though that is unlikely simply due to high yields current investors are collecting from staking.

On the other hand, while some DeFi enthusiasts cashed out and left the market due to the volatility, Ethereum’s gas prices have normalized from its Sept 2nd highs, which may be just enough to push the price slightly up or at least keep it stable.

Traders should pay attention to how Ether handles the $340 level.


ETH/USD 4-hour Chart

Technical Factors:
  • The price is slightly below its 21-period and well below its 50-period EMA
  • The price is right below its middle Bollinger band
  • RSI is neutral (41.08)
  • Volume is descending (low)
Key levels to the upside          Key levels to the downside

1: $340                                     1: $300

2: $360                                     2: $289

3: $371                                     

Ripple

XRP has lost a couple of percent of its value, though nothing to be scared of. The third-largest cryptocurrency by market cap tested its support level of $0.235 for a couple of times in the past 24 hours, and all attempts towards the downside failed. Many analysts are calling for XRP’s future rise, but we need to see a drastic change in volume for that to happen.

XRP traders should watch out for volume spikes, as even sideways trading is hard now due to the extremely low volume.

XRP/USD 4-hour Chart

Technical factors:
  • The price is just under its 21-period, while it is well below its 50-period EMA
  • Price is at its middle Bollinger band
  • RSI is neutral (45.18)
  • Volume is low
Key levels to the upside          Key levels to the downside

1: $0.2454                                  1: $0.235 

2: $0.266                                    2: $0.227

3: $0.285                                   3: $0.221


Categories
Crypto Market Analysis

Daily Crypto Review, Sept 8 – Peter Schiff Buying More Bitcoin; Investors Keep Buying BTC Despite Downside Potential

The cryptocurrency market was quite slow today, with most cryptocurrencies establishing their positions rather than pushing towards upside or downside. Bitcoin is currently trading for $10,329, which represents an increase of 0.64% on the day. Meanwhile, Ethereum lost 2.23% on the day, while XRP lost 0.36%.

 Daily Crypto Sector Heat Map

If we take a look at the top100 cryptocurrencies, BitShares gained 9.64% on the day, making it the most prominent daily gainer. Dash (8.35%) and Zcash (5.51%) also did great. On the other hand, the Reserve Rights lost 12.27%, making it the most prominent daily loser. It is followed by Kusama’s loss of 9.38% and Arweave’s loss of 9.26%.

Top 10 24-hour Performers (Click to enlarge)

Bottom 10 24-hour Performers (Click to enlarge)

Bitcoin’s dominance level has gone up slightly, with its value is currently at 59.84%, which represents a 0.23% difference to the upside when compared to when we last reported.

Daily Crypto Market Cap Chart

The crypto sector capitalization has gone up slightly in the past 24 hours. Its current value is $333.24 billion, which represents an increase of $1.71 billion when compared to our previous report.

_______________________________________________________________________

What happened in the past 24 hours?

_______________________________________________________________________

_______________________________________________________________________

Technical analysis

_______________________________________________________________________

Bitcoin

Bitcoin’s price has been holding to the psychological $10,000 support all weekend, trying to stay above it. While the largest cryptocurrency by market cap managed to stay above it, this has been the second day that it couldn’t pass the $10,360 resistance. On top of that, the past 24 hours showed us a much greater spike in volume during a support retest than a resistance test. Lower time frames show that Bitcoin has possibly made a double bottom, which calls for a slightly more bullish scenario.

When it comes to predictions, nothing has changed from yesterday. If the bulls fail to break the $10,360 level soon (and sustain it), the bears will most likely make another attempt to bring the price down. A drop to the 200-day SMA ($9,080) is highly likely. On the other hand, if BTC manages to bounce off the current level and surpass the next one ($10,500), a move to $11,000 is likely. While traders should wait for a bigger move to happen before trading, small profits can be made on sideways-movement trades.

BTC/USD 4-hour Chart

Technical factors:
  • Price is well below its 50-period, while it is at its 21-period EMA
  • Price is slightly above middle Bollinger band
  • RSI has recovered and is neutral (46.38)
  • Volume is stable
Key levels to the upside          Key levels to the downside

1: $10,360                                1: $10,015

2: $10,500                                2: $9,870

3: $10,850                                 3: $9,600

Ethereum

Ethereum has broken free from its descending trend as well, with its price consolidating between the $340 and $360 levels. Ethereum tested the $340 level with a strong push towards the downside, but the level held up quite nicely. This may give Ethereum the opportunity to gather its strength and push past the $360 level.

Ethereum’s gas prices have dropped slightly from the highs it reached on Sept 2nd, which may be just enough to push the price slightly up.

Traders should pay attention to how Ether handles the $360 level.


ETH/USD 4-hour Chart

Technical Factors:
  • The price is slightly below its 21-period and well below its 50-period EMA
  • The price is right at its middle Bollinger band
  • RSI is neutral (42.37)
  • Volume is descending (low)
Key levels to the upside          Key levels to the downside

1: $360                                     1: $340

2: $371                                     2: $300

3: $400                                      3: $289

Ripple

XRP has also taken the day to consolidate and establish its presence at the levels it reached after its price plummeted. The third-largest cryptocurrency by market cap is currently trading within the range bound by the $0.235 and $0.2454. The most recent retest of the support level showed that $0.235 will be hard to get through for bears, while the $0.2454, as well as the 21-period moving average, will require a lot more bullish presence to get conquered as well.

XRP traders should either trade within the range or wait for a breakout.

XRP/USD 4-hour Chart

Technical factors:
  • The price is just under its 21-period, while it’s well below its 50-period EMA
  • Price is slightly above its middle Bollinger band
  • RSI is neutral (44.06)
  • Volume is average
Key levels to the upside          Key levels to the downside

1: $0.2454                                  1: $0.235 

2: $0.266                                    2: $0.227

3: $0.285                                   3: $0.221


Categories
Crypto Market Analysis

Daily Crypto Review, Sept 7 – Peter Schiff: “I Was Wrong About Bitcoin”; Bitcoin Facing $9,000 or Recovering?

The cryptocurrency market has been trying to establish its position after the pullback that happened on Wednesday and Thursday. Bitcoin is currently trading for $10,260, which represents a decrease of 1.34% on the day. Meanwhile, Ethereum recovered from its big drop and gained 7.3% on the day, while XRP gained 2.67%.

 Daily Crypto Sector Heat Map

When taking a look at the top100 cryptocurrencies, SushiSwap gained 79.68% on the day, making it the most prominent daily gainer. UMA (31.22%) and Flexacoin (26.59%) also did great. On the other hand, the HedgeTrade lost 20.50%, making it the most prominent daily loser. It is followed by Hyperion’s loss of 15.70%. The rest of the market was either in the green or lost sub-1% of its value.

Top 10 24-hour Performers (Click to enlarge)

Bottom 10 24-hour Performers (Click to enlarge)

Bitcoin’s dominance level has gone up slightly, with its value is currently at 59.61%, which represents a 0.32% difference to the upside when compared to when we last reported.

Daily Crypto Market Cap Chart

The crypto sector capitalization has gone down slightly in the past 24 hours. Its current value is $331.58 billion, which represents a decrease of $3.07 billion when compared to our previous report.

_______________________________________________________________________

What happened in the past 24 hours?

_______________________________________________________________________

_______________________________________________________________________

Technical analysis

_______________________________________________________________________

Bitcoin

After failing to break the $12,000 mark, BTC bears have taken over the market, causing the price to plummet, reaching as low as $10,000. The largest cryptocurrency by market cap took the weekend to consolidate and establish its presence above $10,000. However, the $10,360 resistance level proves its strength once again, making Bitcoin’s rebound towards the upside that much harder.

If the bulls fail to break the $10,360 level and sustain it, the bears will most likely make one more attempt to bring the price down. In this case, a drop to the 200-day SMA ($9,080) is likely. However, if BTC manages to bounce off the current level and rise above $10,500, a move to $11,000 is likely.

Traders should pay close attention to Bitcoin’s price movement around the $10,360 level, as the next move will determine its short-term future.

BTC/USD 4-hour Chart

Technical factors:
  • Price is well below its 50-period and 21-period EMA
  • Price is at its middle Bollinger band
  • RSI is recovering from being in the oversold territory (38.77)
  • Volume is descending (from extremely high)
Key levels to the upside          Key levels to the downside

1: $10,360                                1: $10,015

2: $10,500                                2: $9,870

3: $10,850                                 3: $9,600

Ethereum

Ethereum had a similar weekend as Bitcoin, as its price consolidated and tried to establish itself above the most recent low of $310. While its price did get stuck at the $360 resistance level, it increased in value much more than Bitcoin, most likely due to the growing popularity of DeFi.

With all being said, Ethereum’s short-term future will be decided by the popularity of DeFi and the problems it will encounter with extremely high Gas fees.

Traders should pay attention to how ETH handles the $360 level.


ETH/USD 4-hour Chart

Technical Factors:
  • The price is well below its 21-period and 50-period EMA
  • The price is near its middle Bollinger band
  • RSI is neutral and recovering from being oversold (40.82)
  • Volume is descending (from high)
Key levels to the upside          Key levels to the downside

1: $371                                     1: $360

2: $400                                     2: $340

3: $415                                      3: $300

Ripple

While XRP suffered the same fate as Bitcoin and Ethereum in terms of price movement, the third-largest cryptocurrency by market cap did have slight differences in the move towards the downside. XRP had several bull comebacks that tried to push the price back up, but failed due to the overall bearishness of the market.

XRP is now consolidating between the $0.235 and $0.2454, with low volume and no signs of future movement (unless the technicals change drastically).

XRP traders should watch out for any form of break of the immediate support/resistance levels.

XRP/USD 4-hour Chart

Technical factors:
  • The price is well below its 21-period and 50-period EMA
  • Price is near its middle Bollinger band
  • RSI is recovering from being oversold (40.84)
  • Volume is low (back from elevated)
Key levels to the upside          Key levels to the downside

1: $0.2454                                  1: $0.235 

2: $0.266                                    2: $0.227

3: $0.285                                   3: $0.221


Categories
Crypto Market Analysis

Daily Crypto Review, Sept 4 – Bitcoin at $10,000: What Happened? Detailed Price Level Analysis

The cryptocurrency market has been decimated after Bitcoin plummeted below $11,000. Bitcoin is currently trading for $10,260, which represents a decrease of 10.02% on the day. Meanwhile, Ethereum lost 12.07% on the day, while XRP lost 9.21%.

 Daily Crypto Sector Heat Map

When taking a look at the top100 cryptocurrencies, TRON gained 15.35% on the day, making it the most prominent daily gainer. Celo (13.98%) and ZB Token (8.75%) also did great. On the other hand, the Ampleforth lost 33.29%, making it the most prominent daily loser. It is followed by Sushi Swap’s loss of 32.41% and DFI. Money’s drop of 32.28%.

Top 10 24-hour Performers (Click to enlarge)

Bottom 10 24-hour Performers (Click to enlarge)

Bitcoin’s dominance level has gone up slightly, with its value is currently at 59.29%, represents a 0.67% difference to the upside when compared to when we last reported.

Daily Crypto Market Cap Chart

The crypto sector capitalization has plummeted in the past 24 hours. Its current value is $334.65 billion, which represents a decrease of $39.74 billion when compared to our previous report.

_______________________________________________________________________

What happened in the past 24 hours?

_______________________________________________________________________

_______________________________________________________________________

Technical analysis

_______________________________________________________________________

Bitcoin

After failing to break the $12,000 mark, Bitcoin bears have taken over the market and the price plummeted, reaching as low as $10,000. While it was true that many people were bullish and called for a bull market, Bitcoin’s continuous failed attempts to break $12,000 took its toll and started a short-term bear trend that could reach $9,600 at some point.

There are many reasons that caused Bitcoin (and the rest of the crypto market) to plummet, mainly the US traditional market, DeFi, miners as well as traders.

  1. The US S&P 500 index pulled back on Thursday after reaching record highs just earlier this week. This happened because of a US report showing jobless claims of over 881,000 in August. While this number was, in fact, better than expected, it is still much larger than the one that the US saw during the 2009 recession high-point (665,000). Bitcoin is not completely uncorrelated from the traditional markets and has most likely reacted slightly to this news.
  2. While the DeFi craze is continuing, many believe that the fact that people are locking billions of dollars worth of Bitcoin may cause any form of market manipulation or influx of buyers/sellers much more significant due to reduced supply in circulation. It is also not implausible that DeFi is in a bubble (even some DeFi project leaders/creators such as Yearn Finance’s Andre Cronje say it), and that this is a form of a bubble “pop”.
  3. Miners and traders gathered up to sell Bitcoin at the $12,000 mark, which triggered this crash. Miners tried to secure their profits and play it safe, and traders most likely did the same, as they saw strong resistance sitting at the $12,000 level. All of the big mining pools saw large BTC outflows from the wallets, incidacting a market play with the intention to take profits and secure gains.

Traders should pay attention to Bitcoin’s price movement around $10,090 and $10,400.

BTC/USD 4-hour Chart

Technical factors:
  • Price is well below its 50-period and 21-period EMA
  • Price is just above its lower band
  • RSI is deep in the oversold territory (21.56)
  • Volume is elevated
Key levels to the upside          Key levels to the downside

1: $10,360                                1: $10,015

2: $10,500                                2: $9,870

3: $10,850                                 3: $9,600

Ethereum

Ethereum had a similar day to Bitcoin, with its price plummeting and reaching as low as $371. The second-largest cryptocurrency by market cap tried to break the downward pressure after dropping below $445. It quickly bounced off of $415 and pushed towards the upside. However, the $445 level was now resistance, and after a failed attempt to break it, ETH moved further down.

Ethereum is now in its consolidation/recovery stage near $380.

Traders should pay attention to any influx in volume as well as how ETH handles $415.


ETH/USD 4-hour Chart

Technical Factors:
  • The price is well below its 21-period and 50-period EMA
  • The price is just above the lower band
  • RSI is in the oversold territory (28.35)
  • Volume is descending (from extremely high)
Key levels to the upside          Key levels to the downside

1: $400                                     1: $371

2: $415                                     2: $360

3: $445                                                 

Ripple

XRP was no exception when it comes to today’s price movement. The third-largest cryptocurrency by market cap plummeted and reached as low as $0.238 before starting to recover. The price is now recovering at the $0.2454 support level, which is (at the moment) contested. It is still unsure of whether XRP will end up above or below it, so traders should watch out to a breakout to any side.

XRP/USD 4-hour Chart

Technical factors:
  • The price is far below its 21-period and 50-period EMA
  • Price is at its lower band
  • RSI is in the oversold area (29.09)
  • Volume is above average
Key levels to the upside          Key levels to the downside

1: $0.266                                   1: $0.2454 

2: $0.285                                   2: $0.235

3: $0.31                                    3: $0.227


Categories
Crypto Market Analysis

Daily Crypto Review, Sept 3 – DeFi Flippening: Unifi’s Volume Topples Coinbase

The crypto sector had quite a bad day as almost every single cryptocurrency ended up in the red. Bitcoin is currently trading for $11,376, which represents a decrease of 4.26% on the day. Meanwhile, Ethereum lost 6.82% on the day, while XRP lost 9.33%.

 Daily Crypto Sector Heat Map

When taking a look at the top100 cryptocurrencies, Kusama gained 24.25% on the day, making it the most prominent daily gainer. UMA (13.51%) and JUST (9.08%) also did great. On the other hand, the Ampleforth lost 26.14%, making it the most prominent daily loser. It is followed by OMG Network’s loss of 15.44% and Aragon’s drop of 15.44%.

Top 10 24-hour Performers (Click to enlarge)

Bottom 10 24-hour Performers (Click to enlarge)

Bitcoin’s dominance level has gone up slightly, with its value is currently at 58.62%, represents a 0.48% difference to the upside when compared to when we last reported.

Daily Crypto Market Cap Chart

The crypto sector capitalization has decreased significantly over the course of the day. Its current value is $375.41 billion, which represents a decrease of $15.64 billion when compared to our previous report.

_______________________________________________________________________

What happened in the past 24 hours?

_______________________________________________________________________

_______________________________________________________________________

Technical analysis

_______________________________________________________________________

Bitcoin

Bitcoin’s push towards the upside yesterday culminated by the cryptocurrency price reaching the $12,000 mark before triggering a bear push. The largest crypto by market cap couldn’t keep its price above the level, which triggered massive bearish volume that brought the price down as low as $11,150. Bitcoin is currently consolidating right below $11,460, which it is testing and trying to get past. However, this level has proven to be a strong resistance point at the moment.

Traders should pay attention to Bitcoin’s price movement around $11,460.

BTC/USD 4-hour Chart

Technical factors:
  • Price is below its 50-period and 21-period EMA
  • Price is just above its lower band
  • RSI is stable (38.13)
  • Volume is coming back to normal after a massive spike
Key levels to the upside          Key levels to the downside

1: $11,630                                1: $11,460

2: $12,015                                2: $11,090

3: $12,330                                 3: $10,855

Ethereum

Ethereum had a similar day to Bitcoin, with its price plummeting and reaching as low as $418 after failing to break $496 to the upside. The second-largest crypto by market cap is currently near the $445 level, which is resisting any current pushes towards the upside that Ethereum makes at the moment.

With all this being said, Ethereum is still looking extremely bullish as DeFi’s volume and the number of users is reaching its all-time highs. Traders should look for a break from the $445 level.

ETH/USD 4-hour Chart

Technical Factors:
  • The price is at its 21-period and below 50-period EMA
  • The price is just below the middle band
  • RSI is neutral (52.47)
  • Volume is descending (from extremely high)
Key levels to the upside          Key levels to the downside

1: $445                                     1: $415

2: $496                                     2: $400

                                                  3: $360

Ripple

XRP was no exception when it comes to today’s price movement. The third-largest crypto by market cap crashed, at one point reaching sub-$0.266 levels. However, the price recovered, and XRP is currently consolidating at the $0.272 level. However, unlike Bitcoin and Ethereum, which seem ready to test its resistance levels, XRP’s low volume as well as price position signal that there is almost no chance it will move towards the upside on its own.

Traders should look at XRP’s next move, which will be triggered by a volume spike.

XRP/USD 4-hour Chart

Technical factors:
  • The price is below its 21-period and 50-period EMA
  • Price is just above its lower band
  • RSI is stable and leaning towards the oversold area (39.55)
  • Volume is slightly below average
Key levels to the upside          Key levels to the downside

1: $0.285                                   1: $0.266 

2: $0.31                                     2: $0.2454

3: $0.32


Categories
Crypto Market Analysis

Daily Crypto Review, Sept 2 – Ethereum Pushing Towards $500; Decentralized Exchanges Volume Surges

While the top cryptocurrencies had quite a slow day, the DeFi market kept going up. Bitcoin is currently trading for $11,890, which represents an increase of 2.37% on the day. Meanwhile, Ethereum gained 7.57% on the day, while XRP gained 6.91%.

 Daily Crypto Sector Heat Map

When taking a look at top100 cryptocurrencies, DFI.Money gained 111.02% on the day, making it the most prominent daily gainer. SushiSwap (35.54%) and Flexacoin (23.70%) also did great. On the other hand, the bZx Protocol lost 16.28%, making it the most prominent daily loser. It is followed by Aragon’s loss of 10.47% and Kusama’s drop of 9.44%.

Top 10 24-hour Performers (Click to enlarge)

Bottom 10 24-hour Performers (Click to enlarge)

Bitcoin’s dominance level has gone down slightly, with its value is currently at 58.14%, represents a 0.26% difference to the downside when compared to when we last reported.

Daily Crypto Market Cap Chart

The crypto sector capitalization has increased significantly over the course of the day. Its current value is $391.05 billion, which represents an increase of $14.67 billion when compared to our previous report.

_______________________________________________________________________

What happened in the past 24 hours?

_______________________________________________________________________

_______________________________________________________________________

Technical analysis

_______________________________________________________________________

Bitcoin

After managing to fend off the bears and establish its presence above $11,630 yesterday, Bitcoin started moving towards the upside. The largest cryptocurrency by market cap pushed towards the upside and quickly reached the $12,000 mark. However, the cryptocurrency did not stay above it for long and fell under it yet again. Bitcoin is now on a path towards the downside.

Traders should pay attention to how Bitcoin’s price reacts to its moving averages, as well as to $11,630.

BTC/USD 4-hour Chart

Technical factors:
  • Price is above its 50-period and 21-period EMA
  • Price is at its middle band
  • RSI is neutral (52.80)
  • Volume is slightly increased
Key levels to the upside          Key levels to the downside

1: $11,630                                1: $11,460

2: $12,015                                2: $11,090

3: $12,330                                 3: $10,855

Ethereum

Ethereum had another extremely bullish day, where its parabolic rise continued. The second-largest cryptocurrency by market cap surged towards the upside and passed $445 with ease, only to be stopped a little under $490. Ethereum is now consolidating slightly below this level.

Ethereum’s parabolic price rise is attributed to a surge of interest in DeFi projects, and all they have to offer.

Ethereum traders should pay attention to DeFi announcements, as well as to how ETH will consolidate.

ETH/USD 4-hour Chart

Technical Factors:
  • The price is above its 21-period and 50-period EMA
  • The price is just below the upper band
  • RSI is in the overbought territory (73.71)
  • Volume is descending (from extremely high)
Key levels to the upside          Key levels to the downside

1: $445                                     1: $415

2: $496                                     2: $400

                                                  3: $360

Ripple

XRP, boosted by the other cryptos increasing in price, pushed towards the upside itself. The third-largest cryptocurrency by market cap managed to get past the $0.285 resistance level, and then quickly (and successfully) retested it. The move towards the upside got stopped at $0.305, and XRP is now consolidating slightly under it.

While XRP’s move seems like it ran out of steam, its volume is still relatively high, which may indicate a possibility of further volatility.

Traders should look at XRP’s volume spikes and check for any signs of its next move’s direction.

XRP/USD 4-hour Chart

Technical factors:
  • The price is above its 21-period and 50-period EMA
  • Price is just under its upper band
  • RSI is stable and extremely close to being overbought (63.57)
  • Volume is slightly above average
Key levels to the upside          Key levels to the downside

1: $0.31                                     1: $0.285 

2: $0.32                                     2: $0.266

3: $0.3328                                3:$0.2454


Categories
Crypto Market Analysis

Daily Crypto Review, Sept 1 – Binance Crypto Card Expanding To The US; YFI Token Up 1,000,000% Since July

While the top cryptocurrencies had quite a slow day, the DeFi market kept going up. Bitcoin is currently trading for $11,630, which represents a decrease of 0.38% on the day. Meanwhile, Ethereum gained 2.99% on the day, while XRP lost 0.59%.

 Daily Crypto Sector Heat Map

When taking a look at top100 cryptocurrencies, Sushi gained 110.98% on the day, making it the most prominent daily gainer. BitShares (72.48%) and Kusama (35.57%) also did great. On the other hand, DFI.Money lost 18.67%, making it the most prominent daily loser. It is followed by bZx Protocol’s loss of 13.96% and NXM’s drop of 9.34%.

Top 10 24-hour Performers (Click to enlarge)

Bottom 10 24-hour Performers (Click to enlarge)

Bitcoin’s dominance level has gone down slightly, with its value is currently at 58.40%, represents a 0.84% difference to the downside when compared to our last report.

Daily Crypto Market Cap Chart

The crypto market cap has increased significantly over the course of the day. Its current value is $375.72 billion, which represents an increase of $3 billion when compared to our previous report.

_______________________________________________________________________

What happened in the past 24 hours?

_______________________________________________________________________

_______________________________________________________________________

Technical analysis

_______________________________________________________________________

Bitcoin

After a weekend of steady gains, Bitcoin spent the day trying to establish its presence above the newly-conquered $11,630 level. While the fight is still in progress, it seems that the largest cryptocurrency by market cap will stay above the level, thus turning it into support.

Traders should take a look at how Bitcoin handles its next resistance, which is at around $11,820.

BTC/USD 4-hour Chart

Technical factors:
  • Price is above its 50-period EMA and 21-period EMA
  • Price is above its middle band
  • RSI is neutral but leaning towards overbought (57.26)
  • Volume is low
Key levels to the upside          Key levels to the downside

1: $11,630                                1: $11,460

2: $12,015                                2: $11,090

3: $12,330                                 3: $10,855

Ethereum

Unlike Bitcoin, Ethereum has had a great day. The second-largest cryptocurrency by market cap continued its rush towards the upside, fueled by the expansion of DeFi. The move towards the upside rekindled after ETH confirming its position above $415 and stopped (for now) at its next resistance level, which is sitting at $445. While Ethereum has a chance of breaking this level as well, it is unlikely that it will stay above it as the volume seems to be fading, while its RSI is in the overbought territory.

Ethereum traders should look for ETH’s pullback after the bullish move ends.

ETH/USD 4-hour Chart

Technical Factors:
  • Price is currently above its 21-period and 50-period EMA
  • Price is just below the upper band
  • RSI is in the overbought territory (74.23)
  • Volume is descending
Key levels to the upside          Key levels to the downside

1: $445                                     1: $415

2: $496                                     2: $400

                                                 3: $360

Ripple

XRP’s move towards the upside ended abruptly as the third-largest cryptocurrency by market cap failed to break the $0.285 resistance level. While it is still very close to it, XRP shows no signs of breaking the resistance any time soon, unless it gets external help in the form of BTC pushing the price of the whole crypto market.

On the other hand, XRP doesn’t show any signs of going down anytime soon, so we can expect some range-bound trading in the near future.

Traders should look for an opportunity within the range XRP is currently in.

XRP/USD 4-hour Chart

Technical factors:
  • The price is above its 21-period and 50-period EMA
  • Price is slightly above its middle band
  • RSI is stable and neutral (58.98)
  • Volume is low and relatively stable
Key levels to the upside          Key levels to the downside

1: $0.285                                   1: $0.266 

2: $0.31                                     2: $0.2454

3: $0.32                                    3:$0.235


Categories
Crypto Market Analysis

Daily Crypto Review, August 31 – Cryptos Making Steady Gains Over the Weekend; ETC Hit By Third 51% Attack

The crypto market had a good weekend, with almost every single top cryptocurrency ending up in a net gain. Bitcoin is currently trading for $11,664, which represents an increase of 0.66% on the day. Meanwhile, Ethereum gained 4.42% on the day, while XRP gained 2.19%.

 Daily Crypto Sector Heat Map

When taking a look at top100 cryptocurrencies, UMA gained 48.99% on the day, making it the most prominent daily gainer. Flexacoin (27.54%) and bZx Protocol (26.08%) also did great. On the other hand, DFI.Money lost 17.06%, making it the most prominent daily loser. It is followed by Golem’s loss of 10.16% and NEM’s drop of 7.06%.

Top 10 24-hour Performers (Click to enlarge)

Bottom 10 24-hour Performers (Click to enlarge)

Bitcoin’s dominance level has gone down quite a bit over the weekend and dropped below the 60% mark. Its value is currently at 59.24%, represents a 1.82% difference to the downside when compared to our last report.

Daily Crypto Market Cap Chart

The crypto market cap has increased significantly over the course of the weekend. Its current value is $372.72 billion, which represents an increase of $19.24 billion when compared to our previous report.

_______________________________________________________________________

What happened in the past 24 hours?

_______________________________________________________________________

_______________________________________________________________________

Technical analysis

_______________________________________________________________________

Bitcoin

Bitcoin spent the weekend slowly rising in price on low volume. The largest cryptocurrency by market cap rose above $11,460 and $11,630 resistance levels, turning them into support. The $11,630 level is currently being retested, but it looks like Bitcoin will stay above it unless a large spike of sellers suddenly comes to the market.

Traders should take a look at Bitcoin’s confirmation of the $11,630 level. If BTC stays above it, traders can consider Bitcoin to be moving in within a range, bound by $11,630 and $12,000.

BTC/USD 4-hour Chart

Technical factors:
  • Price is above its 50-period EMA and 21-period EMA
  • Price is slightly above its middle band
  • RSI is neutral but leaning towards overbought (57.95)
  • Volume is low
Key levels to the upside          Key levels to the downside

1: $11,630                                1: $11,460

2: $12,015                                2: $11,090

3: $12,330                                 3: $10,855

Ethereum

After passing the descending trend and moving above it, Ethereum had a couple of days of steady gains. The second-largest cryptocurrency by market cap slowly gained ground and passed the $400 as well as $415 resistance levels along the way. The move stopped just above $430, before starting to retrace. There is a big possibility that the $415 level will be tested as a support level.

Ethereum traders should look for ETH’s reaction when the price reaches $415 again.

ETH/USD 4-hour Chart

Technical Factors:
  • Price is currently above its 21-period and 50-period EMA
  • Price is slightly below the upper band
  • RSI is severely overbought (67.64)
  • Volume is average
Key levels to the upside          Key levels to the downside

1: $415                                     1: $400

2: $445                                     2: $360

3: $496                                      3: $340

Ripple

XRP also had a great weekend, with its price consistently moving towards the upside after briefly breaking the $0.266 support level to the downside, which is where the bullish move on Aug 27 started. While it made some progress towards the upside, XRP did not reach past any significant resistance levels. In fact, it got stopped by the $0.285 level, which it most likely won’t pass.

Due to its RSI being close to overbought, low volume, and price rejection around the $0.285 level, XRP will most likely start a move towards the downside now.

XRP traders should trade it on its way down towards $0.266 or possibly look for a bounce off of the support XRP will find on its way down.

XRP/USD 4-hour Chart

Technical factors:
  • The price is above its 21-period and 50-period EMA
  • Price is slightly below its upper band
  • RSI is nearly overbought but is moving towards neutral (58.17)
  • Volume is low and relatively stable
Key levels to the upside          Key levels to the downside

1: $0.285                                   1: $0.266 

2: $0.31                                     2: $0.2454

3: $0.32                                    3:$0.235


Categories
Crypto Daily Topic Crypto Guides

OneCoin Scam – What Should You Know?

Introduction

OneCoin was promoted as a blockchain-based cryptocurrency through an offshore company OneCoin Ltd. registered in Dubai and founded by Ruja Ignatova, a Bulgarian national. According to the claims made by the company, OneCoin is a cryptocurrency that works like any other digital currency system whose coins can be made through a mining process, and the coins can be used for making payments anywhere in the world.

But there is no specific clarity of the working blockchain model of OneCoin. OneCoin is also known for selling educational materials and courses for cryptocurrencies, investments, trading, and other subjects related to financial analysis. However, OneCoin has been labelled as a global Ponzi Scheme and the biggest cryptocurrency scam ever. Let’s navigate the details.

What is a Ponzi Scheme?

A Ponzi scheme is a type of financial fraud or investment scam where the investors are promised high rates of returns and profits with minimum risk. The scheme traps the investors into a false belief that the returns are generating from the sales of a product or any other means; however, they remain unaware of the fact that the source of funds is other investors. The returns for the early investors are generated by collecting the funds from the new investors. 

OneCoin: A Cryptocurrency Scam

OneCoin is an international Ponzi scheme and was created as a fake online cryptocurrency by its founders to deceive the investors. The company used the terminologies of real digital currencies to reflect a genuine and authentic impression of its business model. The target audience of OneCoin included all those people who were not aware of the cryptocurrency and technology mechanism. Even the education material and packages sold were plagiarized. 

The worst part of the entire scam is the company never had a blockchain, to begin with. The concept of ‘mining’ was fake, and the new miners were told to wait for at least three to six months before their currency can be mined. The transactions were observed without the use of blockchain technology. It was believed that they were using a centralized database to run OneCoin. Eventually, the company also revealed that the SQL database that was put into use was not capable of operating a blockchain.

OneCoin had an organizational structure similar to a pyramid scheme where everybody was actually paying to the individual above. So, there were two sections of the company. The first section was OneCoin itself responsible for marketing and spreading the platform.

In contrast, the other section of the company was composed of affiliates who were bringing in people for earning a commission. Local promoters would organize meetups to spread OneCoin, and even the webinars were also hosted. They had gathered maximum growth in Asia, particularly China, and that’s why the country was hit the hardest. OneCoin was successful in running a $2 billion cryptocurrency pyramid scheme in China. 

Conclusion

The founders of OneCoin and many other associated executives were formally charged, and the US Authorities had declared OneCoin to be a fraud. It is crucial for us to know the basics and fundamental concepts of crypto and blockchain to avoid getting affected by such scams. We should be able to identify the scams by analyzing and understanding the platforms properly before investing our money. 

Categories
Crypto Market Analysis

Daily Crypto Review, August 28 – Bitcoin Bearish as XRP Plummets

The crypto market was mostly bearish over the course of the day, with XRP losing the most out of the top cryptocurrencies. Bitcoin is currently trading for $11,341, which represents a decrease of 0.5% on the day. Meanwhile, Ethereum lost 0.44% on the day, while XRP lost 5%.

 Daily Crypto Sector Heat Map

When taking a look at top100 cryptocurrencies, Numeraire gained 29.44% on the day, making it the most prominent daily gainer. Serum (23.05%) and Uma (21.68%) also did great. On the other hand, Aragon lost 17.67%, making it the most prominent daily loser. It is followed by Kusama’s loss of 12.20% and Qtum’s drop of 11.12%.


Top 10 24-hour Performers (Click to enlarge)

Bottom 10 24-hour Performers (Click to enlarge)

Bitcoin’s dominance level has gone up quite a bit from when our previous report, with its value currently at 61.06%. This value represents a 0.71% difference to the upside when compared to our last report.

Daily Crypto Market Cap Chart

The cryptocurrency market cap has decreased slightly over the course of the day. Its current value is $353.48 billion, which represents a decrease of $6.8 billion when compared to our previous report.

_______________________________________________________________________

What happened in the past 24 hours?

_______________________________________________________________________

_______________________________________________________________________

Technical analysis

_______________________________________________________________________

Bitcoin

Bitcoin was extremely volatile in the past 24 hours, with its price ranging from $11,110 to $11,600. The largest cryptocurrency by market capitalization is still below the $11,460 resistance level and seems like its preparing a move (most likely to the downside).

The price of Bitcoin has declined by more than 6% in the last three days and that along with the fact that $700 million Bitcoin futures expiry is approaching, traders are nervous and have a bearish scenario in mind. Many technical analysts believe that Bitcoin has two paths ahead at the moment: $16,000 or $9,600.

Traders should take a look at Bitcoin’s movement around $11,460 before trading.

BTC/USD 4-hour Chart

Technical factors:
  • Price is below its 50-period EMA and 21-period EMA
  • Price is below its middle band
  • RSI is neutral but leaning towards oversold (41.82)
  • Volume is average (one-candle spike)
Key levels to the upside          Key levels to the downside

1: $11,460                                1: $11,090

2: $11,630                                2: $10,855

3: $12,015                                 3: $10,500

Ethereum

The second-largest cryptocurrency by market capitalization continued its path above the descending trend line. While being above this line is a positive thing, Ethereum is still losing value as it’s gripping the line and following it down. If ETH decides to test the upside, it will encounter some turbulence way before its major resistance at $415.

If, however, Ethereum pushes towards the downside, it will fall back into the trend and possibly rush towards the bottom trend line.

Ethereum traders should look for Ethereum’s volume spike and push towards the upside.

ETH/USD 4-hour Chart

Technical Factors:
  • Price is currently below its 21-period and 50-period EMA
  • Price is slightly below the middle band
  • RSI is neutral (45.39)
  • Volume is very low (With volume spike when the trend line was retested)
Key levels to the upside          Key levels to the downside

1: $415                                     1: $400

2: $445                                     2: $360

3: $496                                      3: $340

Ripple

XRP had an incredibly bad day, as bears took over the market and pushed its price down. The third-largest cryptocurrency by market cap dropped under the $0.266 support, and then immediately tried to head back up (without any success). While the price is still near the $0.266 level, it is unlikely that XRP will confidently move above it unless Bitcoin pulls the whole crypto market up by a sudden move to the upside.

XRP traders should look for how the cryptocurrency reacts to the $0.266 level and trade-off of that info.

XRP/USD 4-hour Chart

Technical factors:
  • The price is below its 21-period and 50-period EMA
  • Price is slightly above its lower band
  • RSI is at the oversold line (30.19)
  • Volume is unstable and cycling between average (low) and extremely high volume candles
Key levels to the upside          Key levels to the downside

1: $0.285                                   1: $0.266 

2: $0.31                                     2: $0.2454

3: $0.32                                    3:$0.235


Categories
Cryptocurrencies

Freewallet Review: Is It A Safe Cryptocurrency Wallet Or A Scam?

According to their website, Freewallet is specially designed to help you access, manage, and store crypto with ease. It comprises of both individual wallets for specific cryptocurrencies and Freewallet Lite – the multi-currency wallet. Single wallets are available as mobile apps, while the multi-currency wallet is available as a mobile app and a web interface. Some of Freewallet’s key features are its dynamic fee system, support for individual crypto wallets, and the fact that it is custodial.

But what makes Freewallet unique? Does its custodial nature make it safer than the next wallet, or is it a scam? We answer these questions in this Freewallet review by detailing some of its key operational and security features. We will also look at its pros and cons and compare its effectiveness with similar crypto wallets.

Key features:

In-built exchange: Freewallet features an inbuilt exchange that supports the trade of 100+ cryptocurrencies. Note, however, that this exchange is only available to the multi-currency wallet users. Plus, it is only accessible via the web wallet.

Single and multi-currency wallets: Freewallet hosts two types of crypto wallets: the Individual crypto wallets that host a specific digital coin like Bitcoin, Litecoin, Ethereum, or Dogecoin and the multi-currency Freewallet Lite that supports 100+ cryptocurrencies.

Free in-app transfers: Freewallet embraces the sidechain crypto technology within the Freewallet network. You, therefore, will not be charged when you transfer crypto to other Freewallet users.

Buy with card: In addition to exchanging crypto for crypto within the Freewallet network, you can also buy crypto with a credit card. And you don’t even have to go through such third party currency conversion sites as Changelly or Simplex.

Highly versatile: Freewallet is also compatible with multiple operating systems. You can access this browser extension via all the popular browsers. Plus, it’s also available in both the Android and iOS app versions.

Intuitive user interface: Both the single currency apps and the multi-currency web interface are highly intuitive. The display is highly intuitive, which makes navigating through the app and initiating transactions relatively easy. It also integrates some of the leading crypto exchanges that allow you to monitor the price performance of different coins and monitor your portfolio on one screen.

Freewallet security features:

Password + Biometric support: Like most other cryptocurrency wallets, Freewallet is secured with a passcode. You get to set this four-digit pin-code when installing and activating the wallet. Its support for biometrics also gives you a choice of securing the wallet with a fingerprint.

Two-factor authentication: 2FA is an additional boost to the security of your wallet. And you can choose to attach either your phone number or email address to the wallet. It is critical in restricting remote access and hacks by ensuring that only email/phone owners can log in and initiate transactions.

Hierarchically deterministic: The Freewallet is hierarchically deterministic and will automatically create a new address for every new transaction. This limits the exposure of your real wallet address, and you, therefore, don’t have to worry about trackers monitoring and tracing your crypto transactions.

Custodial cold storages: Freewallet is a custodial crypto vault that stores private keys on your behalf. And according to their website, these keys are stored in cold storages away from hackers. You, therefore, don’t have to worry about keeping your investments safe.

Active sessions control: Freewallet gives you near-absolute control over your wallet. It lets you monitor all the users’ active sessions by viewing their devices. You can then whitelist or block any unauthorized wallet users.

Multi-signature: You can activate the multi-signature feature of the Freewallet by linking it to up to five email addresses. In such a case, the transaction will not be initiated before confirmation from all linked email addresses.

Transaction limits: Freewallet will also let you set the daily, weekly, and monthly transaction limits. This limit ensures that even if a hacker was to gain access to your wallet, there is only so much they can offload.

Freewallet Setup and activation

Step 1: Open the Freewallet.org website and click on the ‘Wallets’ section. Decide on the type of wallet you wish to download. This can be an individual wallet for a specific crypto coin or the multi-currency Freewallet Lite.

Step 2: Register a user account by linking your wallet with your Facebook profile, Google profile, or phone number.

Step 3: Set a PIN code for the account.

Step 4: Activate the two-factor Authentication feature using either email or the phone number.

Step 5: The account is now active, and you can start adding and sending crypto.

How to add/receive crypto into Freewallet

Step 1: Log in to your Multicurrency Freewallet Lite and click on “Smart Pay In.”

Step 2: Select the currency you wish to use in topping up your wallet. This reveals both the wallet address and the QR code.

Step 3: Send the address or the code to the individual/party, sending you the coins.

Step 4: Wait for the coins to reflect in your wallet.

How to send crypto out of Freewallet

Step 1: Log in to your Freewallet account. Tap on the + icon and click “Send.”

Step 2: Enter the recipient’s wallet address and the number of coins you wish to send.

Step 3: Confirm that the details are correct and hit ‘Send.’

Step 4: Decide on the network fees – from the list of four price ranges.

Freewallet ease of use:

Freewallet app and web interface are highly intuitive and very easy to use. And it starts with a straightforward and easy registration process. Unlike other wallets with complicated account creation processes, Freewallet only requires you to link the wallet with your Facebook or Google profiles or mobile phone number.

From its dashboard, you have easy access to all of Freewallet’s key features, including the send/receive icons. Moreover, you get to monitor your balances and portfolio as well as the real-time price movements for various coins.

The wallet is also multi-lingual and is currently available in over 13 international languages.

Supported cryptocurrencies and countries

According to the Freewallet website, Freewallet Lite multi-currency wallet can support 130+ cryptocurrencies and tokens. However, crypto-specific wallet apps will only host one digital currency.

Currently, Freewallet is available to individuals in over 100 countries across the world, including the U.S, UK, Germany, France, and Russia.

Freewallet cost and fees

You will not be charged to download and activate the Freewallet app or create a user account on their web interface. Sending crypto from one wallet to another within the Freewallet network is also free.

When sending crypto to other users, however, you will be charged blockchain network fees. Freewallet nonetheless embraces the highly dynamic Reduce by Fee protocol that gives you the freedom to determine these transaction charges. There are four pricing levels, and the higher the fees, the faster the transaction processing speed.

Comparing Freewallet with other crypto wallets

Freewallet vs. eToro

Freewallet and eToro have several things in common. Chief among them is the fact that they are both custodial and store private keys on behalf of their clients. These can also be said to have some of the most intuitive user interfaces.

But unlike eToro that only has one type of crypto wallet, Freewallet has both the crypto-specific and multi-currency wallets. And while both their wallets are free, Freewallet uses sidechain technology to make transactions within the network for free. It also embraces a dynamic transaction pricing structure that lets the user set an individualized transaction cost.

What are the pros and cons of Freewallet

Pros:

  •         Transactions within the Freewallet network are free. And you also get to set the transaction fee for external transfers.
  •         You can choose to install multiple crypto-specific wallets for the coins you wish to trade or the multi-currency wallet.
  •         The web interface of a Freewallet has an in-built exchange.
  •         The wallet supports a relatively wide range of cryptocurrencies.
  •         Freewallet has integrated several security measures, including support for biometrics, two-factor authentication, and cold storage.

Cons:

  •         Freewallet stores the private keys on behalf of their clients – providing hackers with a central target.
  •         The wallet is hosted online, and this exposes it to such risks and threats as hacks and malware attacks.
  •         It requires a phone or Facebook profile when registering a user account.
  •         The wallet is not regulated.

Verdict? Is it safe or a scam?

Freewallet adopts a unique approach to the storage and management of cryptocurrencies. These include cold storages, two-factor authentication, active session control, and transaction limits. Some serve to discourage unauthorized access to your wallet while the rest limit the extent of the damage. We, therefore, consider their app and web interface relatively safe. We nevertheless would have been able to give a more qualified verdict if Freewallet adopted even more stringent safety protocols like providing users with recovery seeds and decentralizing the storage of private keys.

Categories
Crypto Market Analysis

Daily Crypto Review, August 27 – $700 Million of Bitcoin Options Expiring on Friday: Prepare for Volatility

The crypto market was split between cryptos that ended up in the green and in the red, with a bit more cryptocurrencies ending up gaining in the past 24 hours. Bitcoin is currently trading for $11,374, which represents an increase of 0.14% on the day. Meanwhile, Ethereum gained 0.77% on the day, while XRP lost 0.36%.

 Daily Crypto Sector Heat Map

When taking a look at top100 cryptocurrencies, Celo gained 56.49% on the day, making it the most prominent daily gainer. Aragon (36.44%) and Siacoin (17.45%) also did great. On the other hand, The Midas Touch lost 20.75%, making it the most prominent daily loser. It is followed by Kusama’s loss of 8.81% and Reserve Rights’ drop of 8.72%.

Top 10 24-hour Performers (Click to enlarge)

Bottom 10 24-hour Performers (Click to enlarge)

Bitcoin’s dominance level has stayed at the same place as we reported yesterday, with its value currently at 60.35%. This value represents a 0.01% difference to the upside when compared to our last report.

Daily Crypto Market Cap Chart

The cryptocurrency market cap has increased significantly over the course of the day. Its current value is $360.28 billion, which represents an increase of $24.61 billion when compared to our previous report.

_______________________________________________________________________

What happened in the past 24 hours?

_______________________________________________________________________

_______________________________________________________________________

Technical analysis

_______________________________________________________________________

Bitcoin

Bitcoin has had somewhat a slow day after bottoming out near $11,090. The largest cryptocurrency by market cap tried to break the $11,460 resistance level at one point, but it ended up unsuccessfully. Bitcoin will need to gather quite a strong bullish presence if it wants to reach $12,000 anytime soon, as the upside is guarded by way too many smaller and bigger resistance levels.

With $700 million of Bitcoin options expiring on Friday, we may see a nice spike in volume and volatility. Various analysts predict that the price at its current position would be a good buying opportunity for futures traders, while a price near $12,000 would be a good sell opportunity.

Traders should take a look at Bitcoin’s movement around $11,460.

BTC/USD 4-hour Chart

Technical factors:
  • Price is below its 50-period EMA and 21-period EMA
  • Price is between its lower and middle band
  • RSI is neutral but leaning towards oversold (41.02)
  • Volume is average
Key levels to the upside          Key levels to the downside

1: $11,460                                1: $11,090

2: $11,630                                2: $10,855

3: $12,015                                 3: $10,500

Ethereum

While it did not do much better than Bitcoin in terms of daily gains, Ethereum had a decent day. The second-largest cryptocurrency by market cap gathered a small bullish force to push through the descending trend. Not only did Ethereum push past it, but it also confirmed its position above it. With that being said, Ethereum needs a significant volume spike if it wants to reach past $400, or go any higher than that.

However, with DeFi booming and gathering interest from traders (and even creating new ones), Ethereum might be on the right track to show its true bullish nature in the mid-term.

Ethereum traders should look for Ethereum’s volume spikes and trade-off of that.

ETH/USD 4-hour Chart

Technical Factors:
  • Price is currently below its 21-period and 50-period EMA
  • Price is between its lower and middle band
  • RSI is neutral (44.63)
  • Volume is very low
Key levels to the upside          Key levels to the downside

1: $415                                     1: $400

2: $445                                     2: $360

3: $496                                      3: $340

Ripple

XRP was the only cryptocurrency in the red in the past 24 hours out of the top3 cryptocurrencies by market cap. After bottoming out near $0.266 and recovering to around $0.28, XRP started dropping slightly again, reaching the current price of $0.275. The low volume and candles with small bodies and small wicks show almost no volatility in trading.

XRP traders should look for a volume spike before even considering a trade.

XRP/USD 4-hour Chart

Technical factors:
  • Price is below its 21-period and 50-period EMA
  • Price is between its lower and middle band
  • RSI stable and leaning towards the oversold area (38.69)
  • Volume is below average and stable
Key levels to the upside          Key levels to the downside

1: $0.285                                   1: $0.266 

2: $0.31                                     2: $0.2454

3: $0.32                                    3:$0.235


Categories
Crypto Market Analysis

Daily Crypto Review, August 26 – Bitcoin in a Downtrend; Altcoins Following Bitcoin

Almost every single cryptocurrency in the top100 ended up in the red today, as Bitcoin fell below $11,630. Bitcoin is currently trading for $11,334, which represents a decrease of 2.34% on the day. Meanwhile, Ethereum lost 3.84% on the day, while XRP lost 2.57%.

 Daily Crypto Sector Heat Map

When taking a look at top100 cryptocurrencies, Kusama gained 35.49% on the day, making it the most prominent daily gainer. Aragon (18.33%) and The Reserve Rights (14.61%) also did great. On the other hand, Flexacoin lost 12.17%, making it the most prominent daily loser. It is followed by Ocean Protocol’s loss of 10.15% and Verge’s drop of 9.60%.

Top 10 24-hour Performers (Click to enlarge)

Bottom 10 24-hour Performers (Click to enlarge)

Bitcoin’s dominance level has increased slightly, with its value currently at 60.34%. This value represents a 0.3% difference to the upside when compared to our last report.

Daily Crypto Market Cap Chart

The cryptocurrency market cap decreased significantly over the course of the day. Its current value is $335.82 billion, which represents a decrease of $33.15 billion when compared to our previous report.

_______________________________________________________________________

What happened in the past 24 hours?

_______________________________________________________________________

_______________________________________________________________________

Technical analysis

_______________________________________________________________________

Bitcoin

Bitcoin has experienced yet another price drop in the past 24 hours. As we mentioned in our previous article, the largest cryptocurrency by market cap was preparing a move to either side and that the direction of the move will decide BTC’s faith in the short-term. As we can see, Bitcoin decided to go towards the downside and quickly dropped below its $11,630 and $11,460 support levels. It got stopped, however, by both the $11,090 and the descending trend line, which Bitcoin created ten days ago.

Traders should take a look at how Bitcoin resolves its current position and trade after they get more info.

BTC/USD 4-hour Chart

Technical factors:
  • Price is below its 50-period EMA and its 21-period EMA
  • Price is at its lower band
  • RSI bounced off of the oversold line (32.84)
  • Volume has increased
Key levels to the upside          Key levels to the downside

1: $11,460                                1: $11,090

2: $11,630                                2: $10,855

3: $12,015                                 3: $10,505

Ethereum

Ethereum also had a bad day, with bears dominating its price movements. The second-largest cryptocurrency by market cap has, over the course of the day, dropped back into the descending trend it just briefly escaped the day before. Ethereum’s position within the descending trend was confirmed after a small price spike couldn’t get past the trend’s upper level.

Ethereum traders should look for how ETH handles being in the level, and how it exits it.

ETH/USD 4-hour Chart

Technical Factors:
  • Price is currently below its 21-period and its 50-period EMA
  • Price is at its lower band
  • RSI is leaning towards oversold (37.87)
  • Volume is normal (but the past 24h saw a surge in volume at one point)
Key levels to the upside          Key levels to the downside

1: $415                                     1: $400

2: $445                                     2: $361

3: $496                                      3: $340

Ripple

XRP suffered from the same fate as BTC and ETH, with bears taking over the market and its price dropping in the past 24 hours. The third-largest cryptocurrency by market cap fell below $0.285 after not being able to properly confirm its position above it, and almost reached the $0.266 support in the process. XRP is now stabilizing at around $0.275 with low volume and volatility.

XRP traders should look for how the cryptocurrency reacts when it reaches its immediate support/resistance levels.

XRP/USD 4-hour Chart

Technical factors:
  • Price is below its 21-period and its 50-period EMA
  • Price is slightly above its lower band
  • RSI stable, but leaning towards the oversold area (38.10)
  • Volume is below average and stable (except a two-candle spike during the price drop)
Key levels to the upside          Key levels to the downside

1: $0.285                                   1: $0.266 

2: $0.31                                     2: $0.2454

3: $0.32                                    3:$0.235


Categories
Crypto Market Analysis

Daily Crypto Review, August 25 – Bitcoin Whales List Reaches All-Time High; DeFi Projects Still Booming

Cryptocurrencies had a steady day, with most of them being in the slight green. Bitcoin is currently trading for $11,768, which represents an increase of 1.22% on the day. Meanwhile, Ethereum gained 4.32% on the day, while XRP gained 1.85%.

 Daily Crypto Sector Heat Map

When taking a look at top100 cryptocurrencies, Aave gained 33.55% on the day, making it the most prominent daily gainer. Kusama (26.13%) and The JUST (17.30%) also did great. On the other hand, Nervos Network lost 7.95%, making it the most prominent daily loser. It is followed by OMG Network’s loss of 7.59% and Siacoin’s drop of 7.53%.

Top 10 24-hour Performers (Click to enlarge)

Bottom 10 24-hour Performers (Click to enlarge)

Bitcoin’s dominance level has decreased slightly, with its value currently at 60.04%. This value represents a 0.16% difference to the downside when compared to our last report.

Daily Crypto Market Cap Chart

The cryptocurrency market cap increased in value over the course of the day. Its current value is $368.97 billion, which represents an increase of $6.26 billion when compared to our previous report.

_______________________________________________________________________

What happened in the past 24 hours?

_______________________________________________________________________

_______________________________________________________________________

Technical analysis

_______________________________________________________________________

Bitcoin

Bitcoin is at an important crossroad that will decide its short-term future. While it is currently stuck between $11,630 and $12,000, the largest cryptocurrency by market cap will soon have to decide on its direction. Even though a retest of the $11,630 support seems much more plausible, that does not mean that BTC will make a sharp move towards the downside. If the level holds, Bitcoin might have a good chance of bouncing towards $12,000 yet again.

The low volume also shows that a bigger move is on the horizon.

Traders should look for what BTC will do after it hits one of its support/resistance levels before making a trade.

BTC/USD 4-hour Chart

Technical factors:
  • Price is below its 50-period EMA and below its 21-period EMA
  • Price is slightly above its middle band
  • RSI is neutral (50.15)
  • Volume is below average and stagnant
Key levels to the upside          Key levels to the downside

1: $12,015                                1: $11,630

2: $12,300                                2: $11,460

3: $12,900                                 3: $11,090

Ethereum

Unlike Bitcoin that’s preparing for a move and trading with reduced volume and volatility, Ethereum had a great day and ended up making good gains. The second-largest cryptocurrency by market cap had a small volume spike, which was significant enough to push the price up and past the descending trend it was in for a couple of days.

Ethereum is now stabilizing at around $400, while its volume is decreasing.

Ethereum traders should look for Bitcoin’s next move, which ETH will most likely follow.

ETH/USD 4-hour Chart

Technical Factors:
  • Price is currently above its 21-period and its 50-period EMA
  • Price is at its upper band
  • RSI is neutral (52.30)
  • Volume is slightly increased from the previous days
Key levels to the upside          Key levels to the downside

1: $415                                     1: $400

2: $445                                     2: $361

3: $496                                      3: $340

Ripple

XRP spent the day consolidating above $0.285 level, which is regained the previous day. The third-largest cryptocurrency by market cap focused on stabilizing above $0.285, but without much success. While it is still technically above it, XRP would need a small move towards the upside (or some other sort of a decisive move) to confirm its position.

XRP traders should be careful around the $.285 level and pick their trade carefully based on where XRP will go.

XRP/USD 4-hour Chart

Technical factors:
  • Price is above its 21-period and below its 50-period EMA
  • Price is slightly above the middle band
  • RSI is neutral (48.63)
  • Volume is below average and stable
Key levels to the upside          Key levels to the downside

1: $0.31                                     1: $0.285 

2: $0.32                                     2: $0.266

3: $0.332                                  3:$0.2454


Categories
Cryptocurrencies

LiteVault Wallet Review 2020: Features, Pros, Cons, and Fees

LiteValut is a Litecoin-specific web wallet. It was developed and introduced to the crypto industry by an anonymous crypto developer referred to as ‘Someguy123.’ Apart from its close association with the Litecoin blockchain, Litevault hosts unique operational and security features. Questions are, however, abound with regards to the safety of the web wallet given that it is not regulated, it is developed and maintained by anonymous entities, and stores its client’s private keys in company servers.

In this review, we will be explaining everything you need to know about the LiteVault web wallet. We will be examining factors such as its key operational features, security measures in place, ease of use, and the number of supported currencies before comparing it to equally popular web wallets.

Key Features:

Fast transaction processing: Litevault is extremely light. Unlike most other full-stack wallets and apps that require you to download the entire blockchain, Litevault is web-based. Private keys are stored online, and all the crypto-transactions are hosted on the company servers. This not only saves your computer space but also guarantees faster execution of Litecoin transactions.

Highly intuitive: Litevault also has a highly decongested user interface that makes it easy to use for both expert and beginner traders.

Single currency wallet: Litevault web wallet is Litecoin-specific. This implies that it will only support the Litecoin digital currency.

Integrates with payment processors: Ideally, the single currency nature of the web wallet means that you can only deposit Litecoin into the wallet. Litevault has, nevertheless, partnered with several payment-processing companies like Changelly that facilitate fiat-to-Litecoin conversions.

Custodial web wallet: Unlike most crypto wallet apps that give you absolute control over your wallet, Litevault is custodial. Instead of storing your private keys in your computer or mobile device, LiteVault stores your private keys on the company servers.

Multiple wallets: There is no limit to the number of Litecoin wallets you can attach to your Litevault crypto wallet.

Security features:

Password: Like any other web wallet or crypto wallet app, Litevault is password protected. You get to set a strong password during account registration. The password serves both the purposes of encrypting the wallet and restricting unauthorized access.

Two-factor authentication: In addition to password protection, Litevault adds a security layer through two-factor authentication. But unlike other wallets that use your phone number to activate 2FA, Litevault uses your email address.

Litevault encryption: Litevault uses in-browser cryptography to encrypt all the client-server communications. According to Litevault, the data is encrypted right after it leaves your browser, and before it reaches the Litevault servers. This ensures that the company employees never have access to your private keys or any other sensitive user data.

Open sourced: Litevault crypto wallet is built on an open-sourced technology that is vetted and approved by the crypto industry experts. The open-sourced nature of the platform ensures that virtually anyone can view and audit its source code.

Back up your keys in a physical device: While Litevault doesn’t store your private keys on your device, you can still backup and export your digital assets. You can export the decrypted version of the private keys as a JSON file and store it in a USB drive or another wallet.

How to set up Litevault wallet

Step 1: Head over to the official Litevault website and click ‘Register.’

Step 2: On the account registration page, enter your email address (optional), and click on ‘Create Account.’

Step 3: The Litevault site will provide you with a unique identifier that you can use as your username

Step 4: Your account is set, and you can now start adding and transacting in Litecoins.

(Note: While the email address is not mandatory, you are advised to add it to your account if you intend to activate two-factor authentication)

How to add/receive crypto into Litevault wallet

Step 1: Log in to your Litevault web wallet and on the dashboard, click on “Receive (manage address)”

Step 2: Copy the wallet address and send it to the parties sending you Litecoins.

Step 3: Wait for these Litecoins to reflect on your Litevault wallet.

How to send crypto from Litevault wallet

Step 1: Log in to your Litevault web wallet and on the user dashboard, click on the “Send” tab

Step 2: If you created multiple wallets, select the address from which you would like to send the crypto

Step 3: Enter the recipient’s wallet address and the number of Litecoins you would like to transfer

Step 4: Confirm that these details are okay and hit send.

Litevault wallet ease of use

The Litevault web wallet user dashboard is clean and easy to use. It is highly intuitive and only features the most important tabs, plus it recently introduced the colorism aspect where different color tags are used for easier in-wallet navigation.

Litevault wallet cost and fees

Creating a Litevault web wallet account is free. Further, you won’t be charged for storing your Litecoins in this wallet.

You, however, will be charged network fees in the name of transaction fees every time you send Litecoins to another wallet or exchange. This transaction fee is highly variable and largely depends on the transaction amounts. These are charged by the Litecoin network administrators and not Litevault.

You will also include currency conversion fees if you buy crypto using fiat through fiat-to-crypto conversion sites like Changelly. This amount includes the transaction charge imposed by your credit/debit card provider and the conversion fees by Changelly.

Litevault wallet customer support

There are two primary ways of getting assistance when using the Litevault web wallet. First, you can rely on their very elaborative FAQs section. Here they address some of the most common challenges LiteVault wallet users face. These may include missing transactions, incorrect balances, the send button not working, or the transaction fee tab that fails to capture the entire amount. The page explains how you can solve each of these changes.

If any of these problems persist, you can reach out to the LiteVault support team via email or directly message them on Twitter.

What are the pros and cons of LiteVault wallet

Pros:

  • Litevault web wallet is easy to use and has a straightforward registration process.
  • You can create multiple Litcoin addresses on one LiteVault web wallet.
  • Litevault has employed several security features that include open-sourcing its technology.
  • LiteVault makes it possible to backup and export it to a USB drive or another wallet.

Cons:

  • It is prone to inherent security limitations associated with hot wallets.
  • It is not regulated.
  • It stores your private keys on the company’s servers, and this increases the risk of loss.
  • It only supports one digital currency – Litecoin.

Comparing Litevault to other desktop Litecoin wallets.

LiteVault vs. Litecoin Core desktop client

LiteVault web wallet and the Litecoin Core desktop client have just but one significant similarity – they both are Litecoin-specific wallets. Their key differences include the fact that LiteVault is web-based and holds coins on behalf of its clients while Litecoin Core is a full-stack desktop client that hosts client private keys within their device. Registering on LiteVault is quite straightforward, as it doesn’t require you to download an app while LiteCoin Core demands that you download the entire blockchain.

Verdict? Is LiteVault wallet safe?

The web wallet has placed several security features aimed at making it the most secure web wallet. It has open-sourced the technology used to create the wallet, it is possible to backup and import your private keys, and uses in-browser cryptography to encrypt all user data. These play a key role in improving the wallet’s security. However, we must observe that while these make the wallet relatively safe, it is still exposed to the inherent problems associated with any hot crypto wallet.

Categories
Crypto Market Analysis

Daily Crypto Review, August 24 – YFI The Youngest DeFi Billionaire; IOTA Going Bankrupt

Cryptocurrencies spent most of the weekend recovering from the bearish move, which occurred late Friday and early Saturday. Bitcoin is currently trading for $11,731, which represents an increase of 1.11% on the day. Meanwhile, Ethereum gained 0.8% on the day, while XRP gained 1.71%.

 Daily Crypto Sector Heat Map

When taking a look at top100 cryptocurrencies, Cosmos gained 29.48% on the day, making it the most prominent daily gainer. IRISnet (21.33%) and The Midas Touch (18.49%) also did great. On the other hand, yearn.finance lost 8.32%, making it the most prominent daily loser. It is followed by Ren’s loss of 7.36% and Komodo’s drop of 6.67%.

Top 10 24-hour Performers (Click to enlarge)

Bottom 10 24-hour Performers (Click to enlarge)

Bitcoin’s dominance level has increased slightly and passed the 60% mark to the upside, with its value currently at 60.20%. This value represents a 0.46% difference to the upside when compared to our last report.

Daily Crypto Market Cap Chart

The cryptocurrency market cap experienced a decrease in value over the course of the weekend. Its current value is $362.71 billion, which represents a decrease of $10.46 billion when compared to our previous report.

_______________________________________________________________________

What happened in the past 24 hours?

_______________________________________________________________________

_______________________________________________________________________

Technical analysis

_______________________________________________________________________

Bitcoin

After a failed breakout of the ascending triangle, Bitcoin’s price started moving down until it reached $11,460 on Saturday. After reaching that level and not being able to pass it to the downside, Bitcoin bounced and started moving up slowly. The whole weekend was rather slow in terms of volatility, but extremely important in terms of where Bitcoin will end up. The fight for $11,630 was successful, and BTC is now above it, with the potential of going further up. However, the move to the upside will not go far with this volume, as it is way too low for any significant movement.

BTC traders should look for a trade near the $11,900 level, which might act as resistance.

BTC/USD 4-hour Chart

Technical factors:
  • Price is above its 50-period EMA as well as its 21-period EMA
  • Price is slightly above its middle band
  • RSI is neutral (54.45)
  • Volume is below average
Key levels to the upside          Key levels to the downside

1: $12,015                                1: $11,630

2: $12,300                                2: $11,460

3: $12,900                                 3: $11,090

Ethereum

Ethereum’s weekend was also spent in recovering from the bearish moves that occurred in the previous week. The second-largest cryptocurrency by market cap managed to stabilize at below-$400 levels, which it is now trying to pass to the upside. However, the moves which occurred in the past week created a downward-facing trend, which is creating resistance towards the upside, which Ethereum is struggling to pass with low volume, which it now has.

Ethereum traders can look for a trade after Ethereum breaks the trend (to any side).

ETH/USD 4-hour Chart

Technical Factors:
  • Price is currently above its 21-period and below its 50-period EMA
  • Price is at its middle band
  • RSI is neutral (49.72)
  • Volume is below average
Key levels to the upside          Key levels to the downside

1: $415                                     1: $400

2: $445                                     2: $361

3: $496                                      3: $340

Ripple

XRP’s chart looks no different than Bitcoin’s and Ethereum’s chart. The third-largest cryptocurrency by market cap spent the weekend recovering from what was lost during the bearish moves that occurred throughout the week. XRP stabilized at $0.28 and then gathered the strength to push past it. While the price is currently above the $0.285 level, it is not certain that it will stay that way. XRP would need a confirmation move in order to turn $0.285 into true support.

XRP traders can look for after XRP confirms its position, or after it drops below $0.285.

XRP/USD 4-hour Chart

Technical factors:
  • Price is currently above the 21-period and below the 50-period EMA
  • Price is slightly above the middle band
  • RSI is neutral (51.50)
  • Volume is stable and below average
Key levels to the upside          Key levels to the downside

1: $0.31                                     1: $0.285 

2: $0.32                                     2: $0.266

3: $0.332                                  3:$0.2454


Categories
Crypto Market Analysis

Daily Crypto Review, August 21 – OMG Network Token Up Over 100% Today; Tether Moving 1 Billion USDT From Tron to Ethereum Blockchain

While most of the top cryptocurrencies took the day to consolidate or advance slightly, Ethereum tokens were the most volatile and moved up or down with much more intensity. Bitcoin is currently trading for $11,835, which represents an increase of 0.56% on the day. Meanwhile, Ethereum gained 1.39% on the day, while XRP gained 1.01%.

 Daily Crypto Sector Heat Map

When taking a look at top100 cryptocurrencies, OMG Network gained 106.88% on the day, making it the most prominent daily gainer. 0x (48.58%) and Flexacoin (42.15%) also did great. On the other hand, Ren lost 14.05%, making it the most prominent daily loser. It is followed by Reserve Rights’ loss of 7.07% and Waves’ drop of 6.93%.

Top 10 24-hour Performers (Click to enlarge)

Bottom 10 24-hour Performers (Click to enlarge)

Bitcoin’s dominance level has decreased slightly and went under the 60% mark yet again, with its value currently at 59.74%. This value represents a 0.7% difference to the downside when compared to our last report.

Daily Crypto Market Cap Chart

The cryptocurrency market cap experienced a sharp increase in value over the course of the day. Its current value is $373.17 billion, which represents an increase of $9.41 billion when compared to our previous report.

_______________________________________________________________________

What happened in the past 24 hours?

_______________________________________________________________________

_______________________________________________________________________

Technical analysis

_______________________________________________________________________

Bitcoin

After a failed breakout of the ascending triangle, Bitcoin’s price started moving down sharply towards $11,630. The move, as we noted in our previous articles, stopped there. Bitcoin spent the past 24 hours mostly consolidating after a brief moment of bullish presence, which brought its price above $11,800 levels.

This move towards the upside, no matter how small it is, shows that Bitcoin is in a great spot at the moment, and it would take a lot to shake it out of this extremely bearish mid-term position.

BTC traders should be looking for a trade above $12,000, or after the push towards it fails.

BTC/USD 4-hour Chart

Technical factors:
  • Price is at its 50-period EMA and below its 21-period EMA
  • Price slightly below its middle band
  • RSI is neutral (48.45)
  • Volume is average (descending)
Key levels to the upside          Key levels to the downside

1: $12,015                                1: $11,630

2: $12,300                                2: $11,460

3: $12,900                                 3: $11,090

Ethereum

Ethereum spent the day struggling at the $415 level, as the fight for whether it will end up above or below the level is still continuing. The second-largest crypto by market cap recovered from its drop to $395 after hitting a semi-descending line, which acted as support/resistance since Aug 5.

This fight for $415 clearly shows the fight between two mindsets: bulls who are extremely bullish when it comes to DeFi and everything related, and bears which are scared of the skyrocketing ETH transaction fees as well as of the ICO scenario that happened around 2017.

Ethereum traders should wait for ETH to establish itself above or below $415 before trading.

ETH/USD 4-hour Chart

Technical Factors:
  • Price is currently at its 21-period and its 50-period EMA
  • Price is at its middle band
  • RSI is neutral (47.15)
  • Volume is slightly below average
Key levels to the upside          Key levels to the downside

1: $415                                     1: $400

2: $445                                     2: $361

3: $496                                      3: $340

Ripple

XRP’s chart looks a lot like BTC’s chart in the past couple of days. The third-largest cryptocurrency by market cap stopped moving towards the downside after hitting $0.285, which held up quite nicely. XRP then got a small boost towards the $0.29, where it is now consolidating.

With both 21-period and 50-period moving averages right above the price, XRP would require a strong bullish initiative in order to move towards $0.31, which (at the moment) seems unlikely.

Traders can look for an entry within the range between $0.285 and $0.31.

XRP/USD 4-hour Chart

Technical factors:
  • Price is currently below the 21-period and 50-period EMA
  • Price is slightly below the middle band
  • RSI is neutral (46.15)
  • Volume is descending (approaching average)
Key levels to the upside          Key levels to the downside

1: $0.31                                     1: $0.285 

2: $0.32                                     2: $0.266

3: $0.332                                  3:$0.2454


Categories
Crypto Market Analysis

Daily Crypto Review, August 20 – ETH Plummets Due To Skyrocketing Transaction Fees; $12,000 Level Too Strong For Bitcoin

While most of the top cryptos had a slightly red day, Ethereum tokens mostly did great. Bitcoin is currently trading for $11,732, which represents a decrease of 0.25% on the day. Meanwhile, Ethereum lost 1.26% on the day, while XRP lost 1.24%.

 Daily Crypto Sector Heat Map

When taking a look at top100 cryptocurrencies, OMG Network gained 26.67% on the day, making it the most prominent daily gainer. yearn.finance (20.13%) and Qtum (10.04%) also did great. On the other hand, Balancer lost 19.84%, making it the most prominent daily loser. It is followed by Compound’s loss of 9.50% and Waves’ drop of 8,97%.

Top 10 24-hour Performers (Click to enlarge)

Bottom 10 24-hour Performers (Click to enlarge)

Bitcoin’s dominance level has increased slightly and passed the 60% mark, with its value currently at 60.44%. This value represents a 0.77% difference to the upside when compared to our last report.

Daily Crypto Market Cap Chart

The cryptocurrency market cap experienced a slight increase in value over the course of the day. Its current value is $364.76 billion, which represents an increase of $0.56 billion when compared to our previous report.

_______________________________________________________________________

What happened in the past 24 hours?

_______________________________________________________________________

_______________________________________________________________________

Technical analysis

_______________________________________________________________________

Bitcoin

After a brief break of the $12,000 level, Bitcoin fell down and is controlled by BTC bears for the second day in a row. The largest cryptocurrency by market cap has moved towards the $11,630 support level (as we said in our previous article) and tried to test its strength. The level held up, and Bitcoin is now consolidating right above it.

This bear push was caused by several factors, but mostly because of the immense resistance at around $12,000 and the challenges Ethereum faces with its incredibly high transaction fees (Bitcoin acts as a “representative” to all the cryptos, so it affects others, but is also affected by others).

BTC traders should be looking for a trade when Bitcoin breaks $11,630 to the downside or pushes towards $12,000 again.

BTC/USD 4-hour Chart

Technical factors:
  • Price is below its 50-period EMA and its 21-period EMA
  • Price is between its lower and middle band
  • RSI is slightly tilted towards the oversold area (41.97)
  • Volume is average
Key levels to the upside          Key levels to the downside

1: $12,015                                1: $11,630

2: $12,300                                2: $11,460

3: $12,900                                 3: $11,090

Ethereum

Even though Ethereum’s social sentiment is still extremely high due to the craze over DeFi, it is a fact that ETH’s transaction fees have been skyrocketing as the demand for DeFi increased. This fact, along with Bitcoin not being able to break the $12,000 mark, caused the second-largest cryptocurrency by market cap to drop below its $415 support level (now resistance). The drop stopped around $400 and changed direction, trying to retake its previous highs. However, the $415 resistance level confirmed its strength, leaving ETH below it.

Ethereum traders should look for a trade when ETH breaks $415 to the upside.

ETH/USD 4-hour Chart

Technical Factors:
  • Price is currently below its 21-period and its 50-period EMA
  • Price is slightly above its lower band
  • RSI is descending (39.54) and approaching oversold levels
  • Volume is average
Key levels to the upside          Key levels to the downside

1: $415                                     1: $400

2: $445                                     2: $361

3: $496                                      3: $340

Ripple

XRP has had quite a bad day, as it essentially nullified any previous moves towards the upside. The third-largest cryptocurrency by market cap dropped to $0.285 levels (and even below it at one point). While the level held up and secured XRP’s position above it, for the time being, XRP does not look like it will make another move towards the upside soon.

Traders can look for a trade when XRP breaks $0.285 to the downside.

XRP/USD 4-hour Chart

Technical factors:
  • Price is currently below the 21-period and 50-period EMA
  • Price is slightly above the lower band
  • RSI is neutral (40.49)
  • Volume is descending (though it is slightly elevated)
Key levels to the upside          Key levels to the downside

1: $0.31                                     1: $0.285 

2: $0.32                                     2: $0.266

3: $0.332                                  3:$0.2454


Categories
Crypto Market Analysis

Daily Crypto Review, August 19 – Cryptos Heavily in the Red, YFI Token Breaks $11,000 and Approaches BTC’s Price Level

Almost every single cryptocurrency in the top100 was in the red today after Bitcoin broke $12,000 to the downside. Bitcoin is currently trading for $11,685, which represents a decrease of 4.7% on the day. Meanwhile, Ethereum lost 5.56% on the day, while XRP lost 9.4%.

 Daily Crypto Sector Heat Map

When talking about top100 cryptocurrencies, yearn.finance gained 19.51% on the day, making it the most prominent daily gainer. THETA (17.62%) and Swipe (17.28%) also did great. On the other hand, Numeraire lost 10.95%, making it the most prominent daily loser. It is followed by BitTorrent’s loss of 10.14% and Fetch.ai’s drop of 9.94%.

Top 10 24-hour Performers (Click to enlarge)

Bottom 10 24-hour Performers (Click to enlarge)

Bitcoin’s dominance level has increased slightly (even though it is still under the 60% mark), with its value currently at 59.77%. This value represents a 0.13% difference to the upside when compared to our last report.

Daily Crypto Market Cap Chart

The cryptocurrency market cap experienced a decrease in value over the course of the day. Its current value is $364.20 billion, which represents a decrease of $20 billion when compared to our previous report.

_______________________________________________________________________

What happened in the past 24 hours?

_______________________________________________________________________

_______________________________________________________________________

Technical analysis

_______________________________________________________________________

Bitcoin

After finally breaking $12,000 with confidence, Bitcoin is now falling hard below it (click on the arrow of the image). The largest cryptocurrency by market cap is dropping below $11,700 at the moment on bearish momentum. If the cryptocurrency manages to break below the 11,600 level, the next target will be 11,087. Right now, it is heavily oversold, so we can also expect a bounce back to near $12,000.

BTC traders should look for a trade after the cryptocurrency decides on whether it will end up above or below $11,600, as this is a strong support level.

BTC/USD 4-hour Chart

Technical factors:
  • Price is below its 50-period EMA and below its 21-period EMA
  • Price is below its lower band.
  • RSI is dropping (34) and approaching the oversold area
  • Volume is above average
Key levels to the upside          Key levels to the downside

1: $12,015                                1: $11,630

2: $12,300                                2: $11,460

3: $12,900                                 3: $11,090

Ethereum

Ethereum’s social sentiment is still on the rise with the increased interest in DeFi. Even though the second-largest cryptocurrency by market cap is losing heavily in the past 24 hours, the $400 support level should hold, and ETH is (for the time being) safe above it. The next move Ethereum makes will most likely be caused by Bitcoin’s move, as the largest cryptocurrency by market cap is preparing an explosive move towards (most likely) the upside. That, though, should wait a bit, since cryptos are still under selling pressure.

Traders should look for a trade when ETH regains a higher and steady volume.

ETH/USD 4-hour Chart

Technical Factors:
  • Price is currently below its 21-period and its 50-period EMA
  • Price is below its lower B.B.
  • RSI is descending (36) approaching oversold levels
  • Volume is average
Key levels to the upside          Key levels to the downside

1: $445                                      1: $415

2: $496                                     2: $400

                                                  3: $361

Ripple

XRP’s bold move towards the upside, which came after announcing that its company (Ripple) will focus its business model on the XRP token rather than using it as a side solution, got nullified. The third-largest cryptocurrency by market cap dropped below the $0.31 level and as low as $0.29 (which is where it is at now).

Traders can look for a trade after XRP moves above or below its immediate support/resistance levels, or within the current trading level.

XRP/USD 4-hour Chart

Technical factors:
  • Price is currently below the 21-period and 50-period EMA
  • Price is below the lower B.B.
  • RSI is dropping (38.6)
  • Volume increased in the last hours
Key levels to the upside          Key levels to the downside

1: $0.32                                     1: $0.31  

2: $0.332                                   2: $0.285

                                                3:$0.266


Categories
Crypto Guides

What Should You Know About Instant Crypto Exchanges?

Introduction

Whether we need to buy, sell, or trade crypto, exchanges are the most convenient way to do so. It provides us with several functions that make the work easy. But when we need the task to be done on an immediate basis, we can opt for instant crypto exchanges. With these options, we don’t have to go through the lengthy procedure of buying, selling, or trading crypto. Here are a few benefits that can be obtained from instant crypto exchanges over the traditional methods.

They Are Not-Custodial

In the traditional exchanges, our money will be held on the servers of the exchange. That means the exchange had our money’s custody for a while. This not only extends the transaction time but also put our money at risk. The year 2019 saw twelve crypto exchange hacks, which accounted for over $290 million of funds.

However, there are no such issues with the instant crypto exchanges. As soon as they receive the funds, these instant exchanges deposit the conversion in your wallet immediately. That means you don’t lose custody over your cryptocurrency, and there is no exchange theft associated with it.

They Are Quick

The custodial crypto exchanges require you weeks to get the account approved. By that time, you can’t buy, sell, or trade crypto. But you can do the work fast with the instant option. The name itself indicates that these are “instant” crypto exchanges. So you won’t have to waste much time in getting your currency exchanged. You will have to put only 5 to 60 minutes for each transaction to complete.

Price Aggregation

When you go for the traditional crypto exchanges, you will have to deal with an extensive interface. That is because the entire order book depth and price are shown to make the trade. However, it only includes orders from that particular exchange, and you will have to work accordingly. On the other hand, instant crypto exchanges aggregate multiple exchanges’ price. So you get access to deeper liquidity, and the risk of slippage lowers down.

Fixed/Floating Prices

While making a trade in the conventional exchange, you encounter a specific limit. The system executes a trade only when the prices are at or better than the specified limit. The feature was definitely beneficial, but the instant crypto exchanges have something better to offer. The two options available are:

Floating

When making a transaction, the floating rates get executed at the most excellent possible price. It can be either a little lower or higher than the quoted price.

Fixed

This fixes a specific rate for making the trade. That means, when that price is reached, the system automatically executes the transaction.

Ease Of Use

Last but not least, instant crypto exchanges are effortless to use. If you have already used traditional exchanges, you must be aware of their verification and registration formalities that you need to go through. When it comes to instant crypto exchanges, there are no such issues. You will get registered quickly with an email, and sometimes you can trade without any account or registration.

Examples of Instant Crypto Exchanges

As of today, there are only a few credible and reliable Instant Crypto Exchanges that we can rely on. One of the pioneers in this space would be a well-known exchange called Changelly. With this instant crypto exchange, we get to buy or exchange more than 150 cryptocurrencies. Some of the other popular instant exchanges include CoinSwitch, ChangeNow, FixedFloat, etc. All of these are instant and reliable, so you can confidently make your crypto trades with them.

Bottom line

Though it is quite clear that there are several benefits of opting for instant crypto exchanges, you still need to think twice before using them. This is because of their less sophisticated wallets and heftier exchange fees. You can look up to them and make your mind about whether you want to try them or not.

Categories
Crypto Market Analysis

Daily Crypto Review, August 18 – Crypto Fundamentals Booming: Bitcoin Above $12,000; XRP Skyrocketing to $0.315

The cryptocurrency market made gains over the course of the day as Bitcoin broke the $12,000 mark. Bitcoin is currently trading for $12,247, which represents an increase of 3.61% on the day. Meanwhile, Ethereum gained 1.12% on the day, while XRP gained 5.14%.

 Daily Crypto Sector Heat Map

When talking about top100 cryptocurrencies, Flexacoin gained 27.98% on the day, making it the most prominent daily gainer. yearn.finance (26.80%) and Fetch.ai (25.97%) also did great. On the other hand, Algorand lost 14.78%, making it the most prominent daily loser. It is followed by Chainlink’s loss of 12.26% and THORChain’s drop of 10.18%.

Top 10 24-hour Performers (Click to enlarge)

Bottom 10 24-hour Performers (Click to enlarge)

Bitcoin’s dominance level has increased slightly (though it is still under the 60% mark), with its value currently at 59.64%. This value represents a 0.47% difference to the upside when compared to our last report.

Daily Crypto Market Cap Chart

The cryptocurrency market cap experienced a solid increase in value over the course of the day. Its current value is $384.43 billion, which represents an increase of $11.03 billion when compared to our previous report.

_______________________________________________________________________

What happened in the past 24 hours?

_______________________________________________________________________

_______________________________________________________________________

Technical analysis

_______________________________________________________________________

Bitcoin

Bitcoin finally broke $12,000 with confidence, after a couple of days slowly preparing for this move. The largest cryptocurrency by market cap broke out from a large ascending triangle formation and pushed up to $12,470 before falling back down slightly. However, for now, Bitcoin is safe above $12,000 even though it is moving towards the downside. It will most likely test the closest support level in the short term.

This (relatively) sudden break above $12,000 came as a result of many things, but mostly increased interest in DeFi which is making people enter the crypto space (which they do through Bitcoin) and because of institutional investors such as Pantera capital (which just recently announced raising $165 million)

BTC traders should look for a trade after Bitcoin retests its support level.

BTC/USD 4-hour Chart

Technical factors:
  • Price is above its 50-period EMA and its 21-period EMA
  • Price is slightly below its top B.B.
  • RSI is elevated (63.83)
  • Volume is decreasing (one-candle spike)
Key levels to the upside          Key levels to the downside

1: $12,000                                1: $11,630

2: $12,300                                2: $11,460

                                                 3: $11,090

Ethereum

Ethereum’s social sentiment was booming as more and more people started investing in DeFi tokens. As this happened, more and more institutional investors grabbed ETH. This made the second-largest cryptocurrency by market cap establish its place above $415 with no signs of going below it in the short future.

When talking about the past 24 hours, Ethereum made a push towards $450 (accompanied by skyrocketing volume), which it did not have the strength to complete. The move died down, and Ethereum is now consolidating at the $430 level.

Traders should look for a trade when ETH regains steady volume.

ETH/USD 4-hour Chart

Technical Factors:
  • Price is currently above its 21-period and its 50-period EMA
  • Price is at its middle B.B.
  • RSI is neutral (52.68)
  • Volume is average (one-candle spike)
Key levels to the upside          Key levels to the downside

1: $445                                      1: $415

2: $496                                     2: $400

                                                  3: $361

Ripple

XRP made a bold move towards the upside after announcing that its company (Ripple) will focus its business model on the XRP token. As more emphasis was put on developing XRP as the main solution rather than a side solution, more investors flocked and bought XRP.

The third-largest cryptocurrency by market cap pushed past $0.31 and even $0.32, ultimately reaching $0.3275 as the top of the move. As it could not sustain itself above the $0.32 level, XRP fell below it and started a consolidation/confirmation period right between $0.31 and $0.32.

Traders can look for a trade after XRP moves towards $0.32 to break it or towards $0.31 to test the support level.

XRP/USD 4-hour Chart

Technical factors:
  • Price is currently above the 21-period and 50-period EMA
  • Price is slightly below the top B.B.
  • RSI is elevated (63.26)
  • Average volume (two-candle spike)
Key levels to the upside          Key levels to the downside

1: $0.32                                     1: $0.31  

2: $0.332                                   2: $0.285

                                                3:$0.266


Categories
Cryptocurrencies

Abra Wallet Review: Here is Everything You Need To Know About Abra Crypto Wallet

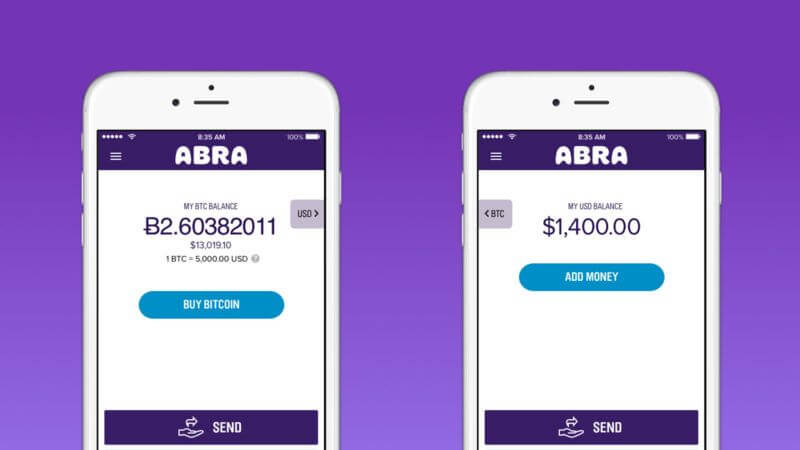
Abra Wallet is a leading virtual service company specializing in blockchain technology and cryptocurrencies. On their website, the Abra crypto wallet is hailed for its simplicity, accessibility, and flexibility. It is a versatile app that is compatible with most operating systems. The crypto wallet is also highly intuitive and simplifies the process of storing and trading cryptos for its users. Launched in 2014 in Silicon Valley and headquartered in The Philippines, Abra supports over 54 world currencies.

But how does it work, how secure is the wallet, how many cryptos can it hold, and what key features make it rise above the competition?

We have tried Abra Crypto Wallet and interacted with its different features. In this review, we tell you how it works, its security features, its usability, and everything else you need to know before downloading and installing the crypto app.

Abra wallet key features:

Simple to use: The Abra crypto wallet app is quite user-friendly and accessible to virtually everyone. It has a simplistic and highly customizable design that makes it easy to use for both beginners and expert traders.

In-built exchange: The Abra crypto wallet app also features an in-built exchange. Here, you can engage in both fiat-to-crypto and crypto-to-crypto conversions. The exchange is quite straightforward and relatively easy to use.

Highly versatile: The Abra crypto wallet app is highly versatile and compatible with both the Android and iOS operating systems. Moreover, it supports a wide range of both crypto and fiat currencies.

Portfolio creation tools: Abra wallet is more than a crypto storage app; it is a crypto investment app. In addition to storing your digital assets securely, the app will also let you invest in leading stocks from different international markets. It especially lets international crypto traders invest in U.S stocks.

Supports fiat-to-crypto purchases: Abra crypto wallet app features an in-built exchange. This tool lets you convert fiat to crypto and engage in crypto-to-crypto exchanges.

Support cash deposits: Unlike most other crypto wallet apps, Abra makes it possible for you to purchase crypto directly via different forms of cash payments. These include credit/debit card purchases and direct bank wire transfers.

Abra wallet users in the Philippines can also pay for their crypto using the Teller Payment System. Note, however, that all your funds in Abra are by default held as Bitcoin (except for Bitcoin Cash and Litecoin), but you can choose to denominate them in the form of any other currency.

Abra wallet security features:

Passcode: Your Abra wallet app has to be secured with a four-digit passcode. You get to set this PIN code when installing and activating the app.

Recovery seed: When installing the crypto wallet app, and after setting the passcode, you will be provided with a recovery seed. Record on a hardy piece of paper and keep it in a highly secure place. You will need it when resetting your app password or when recovering lost private keys.

Two-factor authentication: The Abra crypto wallet app also integrates the two-step verification security feature. This allows you to link your app with your phone number and ensures that you receive an SMS verification code when logging into the wallet and when transferring coins out.

Military-grade encryption: According to Abra wallet developers Bill Barhydt and Pete Kelly, this app collects as little sensitive information of their clients as possible. Additionally, the user data stored within the app – including passwords and private keys – is highly encrypted. All of the app’s interactions with third-party apps and websites, including payment systems, are also highly encrypted.

Non-custodial wallets: Abra wallet developers don’t store your private keys or their copies within the company servers. All the private keys are stored in individual wallets within the wallet of the owner’s devices. This effectively gives you near-absolute control over your private keys.

Hierarchically deterministic: The Abra crypto is also hierarchically deterministic, implying that it automatically generates new wallet addresses for different crypto transactions. This promotes anonymity as it makes it impossible for third parties to track your crypto transactions.

How to set up and activate the Abra Crypto wallet app:

Step 1: Start by downloading the Abra cryptocurrency app from the Google Play Store or Apple Store. You can also download these apps from the Abra’s official website.

Step 2: Initiate the installation process and proceed with creating a user account. Here, you are required to fill in your personal details, including your name, email address, physical address, and your mobile phone number.

Step 3: Activate the two-factor authentication protocol by using the code sent to your mobile number.

Step 4: Proceed to set the four-digit PIN code that secures your Abra crypto wallet.

Step 5: The app will now provide you with recovery phrases. Write them down and keep them safe.

Step 6: The installation is now complete, and the crypto mobile wallet app activated. You can start adding funds, converting/exchanging different currencies, and investing.

How to receive funds/add crypto into your Abra crypto wallet:

Step 1: Start by launching the Abra crypto wallet app and clicking on Portfolio.

Step 2: Click on ‘Add Money’ and choose the cryptocurrency you wish to add/receive into your wallet. This reveals the coin’s wallet address and its corresponding QR Code.

Step 3: Send the address to the parties sending you cash or have them scan the QR code

Step 4: Wait for the cryptocurrency to reflect on your wallet.

How to send crypto out of Abra wallet:

Step 1: Start by launching your Abra Crypto wallet app and clicking on ‘Portfolio.’

Step 2: Click on ‘Send Money’ and choose the cryptocurrency you wish to transfer.

Step 3: Key in the recipient’s wallet address or scan their wallet’s QR code and enter the amount of crypto you wish to send.

Step 4: Confirm that the wallet address and amounts entered are correct and hit send.

Abra Wallet’s ease of use

Abra crypto wallet is very user friendly. The registration process, for instance, is rather quick and straightforward. The fact that the crypto wallet app handles fiat transactions, plus its registration as a Financial Services Provider, means that you will be subjected to the different KYC and AML protocols. It also means that your crypto transactions won’t be wholly anonymous.

Unlike most other crypto apps that require you to pass through third party currency conversion systems like Simplex or Changelly, Abra processes direct fiat deposits. Here, you can make crypto purchases directly using your debit or credit cards, direct bank wire transfers, or the Teller Payment System.

One of the most unique aspects of the Abra Crypto wallet app is that your deposits into the wallet app are held as Bitcoins By default. This implies that if you deposited $10,000 into the wallet, this amount is automatically converted into its Bitcoin equivalent (say 1 BTC). Therefore, if Bitcoin’s value surges by 25%, your balances increase by a similar margin and vice versa. The account can, however, be denominated by any currency and you are free to change the default BTC base currency into any other currency at any time.

Abra wallet supported currencies and countries.

According to the Abra wallet website, the crypto vault is now accessible to residents of over 150 countries – including the U.S.

Abra users in the United States can interact with over 30 of the most popular cryptocurrencies and as much as 50 fiat currencies.

Abra crypto wallet users outside the U.S however, have access to a wider range of currencies as they get to interact with over 200 crypto+fiat currencies.

Abra wallet’s inbuilt exchange is nonetheless highly versatile and there is no limit of either crypto-to-crypto or fiat-to-crypto pairs.

Abra wallet cost and fees:

You will not be charged to download and install the Abra crypto wallet app. And neither will you be charged to activate or for storing your digital assets on your Abra Crypto wallet.

A variable transaction processing fee will, however, apply and debited from your Abra cryptocurrency wallet every time you send cryptocurrencies out of the wallet. These fees are collected by the blockchain miners or network administrators and not Abra wallets and are largely dependent on such factors as the type of cryptocurrency and the transaction amounts involved.

Within the app, you will also incur currency conversion fees in the form of spreads. And this markup price for the different cryptos is set by Abra.

Note that while Abra wallet doesn’t impose withdrawal fees, your payment processor will often charge transaction fees when you deposit into Abra.

Cash Deposit and Withdrawal limits

The app has set limits on the amount of cash you can deposit or withdraw from your Abra crypto wallet app. For instance, U.S residents can only transfer a maximum of $30,000 per wire daily. Additionally, you can only make a bank deposit or withdrawal of a maximum $2,000 daily, up to $4,000 weekly, and $8,000 monthly, while daily credit card deposits/withdrawals have a daily and monthly limit of $200 and $1,000 respectively.

While there is no limit to the number of BTC or LTC conversions you can make, non-BTC/LTC conversions have a daily limit of 5 BTC.

Abra wallet customer support

Abra Wallet’s customer support starts with the wallet’s highly elaborate FAQs page featured on the Abra website. The wallet also features a highly informative blog and the two are key towards addressing some common challenges experienced by Abra Users.

For more personalized queries, consider contacting Abra’s customer support team on their different social media pages like Telegram, Twitter, Reddit, and Facebook. You may also contact them by raising a support ticket on the Abra website.

What are the pros and cons of the Abra crypto wallet app?

Pros:

  • Abra is an all-in-one wallet that doesn’t just let you store your cryptocurrencies but also lets you invest in the stock exchange.
  • The mobile crypto app also features an in-built exchange.
  • Abra wallet supports both fiat and cryptocurrencies.
  • It allows you to change the base currency of your wallet from the highly volatile Bitcoin to Fiat, effectively guarding your assets against possible crypto falls.
  • Installing the app and storing coins therein is free.

Cons:

  • One may consider the currency conversion rates for the wallet’s inbuilt exchange rather high.
  • By holding your cash deposits into the app in the form of Bitcoin, the wallet subjects your cash to volatility risks.
  • The app subjects you to both KYC and AML procedures, which defeats the purpose of Blockchain and cryptos anonymity.

How does Abra Crypto wallet compare to other popular cryptocurrency wallets

When compared to such other crypto wallet apps as eToro, Abra carries the day because of its ease of use and the number of features included. For instance, unlike eToro’s inbuilt exchange that has a limited number of trading/exchange pairs, the Abra Crypto wallet is highly versatile and has an unlimited number of trading pairs. It also supports a wider range of deposit and withdrawal methods that include Teller payment systems. eToro, however, supports a wider range of cryptocurrencies and tokens and can also be considered more secure.

Abra crypto wallet, however, pales in the face of leading Crypto hardware wallets in terms of security and number of supported currencies. Ledger Nano S, for instance, supports more than 1000 cryptocurrencies and tokens and also stores these digital assets offline. The Abra Crypto app can, however, be considered more convenient and easier to access.

Bottom line: Is Abra wallet safe?

Abra has made significant strides towards creating the most sophisticated, versatile, and easy to use trading platform. Their app is not only freely available to all crypto enthusiasts but also integrates some of the most advanced trading and analysis tools.

It also gives its users access to direct crypto market data, including crypto prices and the blockchain industry event calendar. But more importantly, it has put in place several sophisticated security features that make its wallet highly secure while giving you absolute control over your private keys.

Categories
Crypto Market Analysis

Daily Crypto Review, August 17 – DeFi Craze Continues: More BTC Tokenized Than Mined

The cryptocurrency market spent most of its weekend consolidating, with only a couple of cryptocurrencies moving significantly. Bitcoin is currently trading for $11,817, which represents a decrease of 0.64% on the day. Meanwhile, Ethereum lost 1.27% on the day, while XRP lost 0.47%.

 Daily Crypto Sector Heat Map

When talking about top100 cryptocurrencies, OMG Network gained 50.69% on the day, making it the most prominent daily gainer. Waves (26.69%) and Ren (24.74%) also did great. On the other hand, Quant lost 6.55%, making it the most prominent daily loser. It is followed by Divi’s loss of 5.80% and Ampleforth’s drop of 5.08%.

Top 10 24-hour Performers (Click to enlarge)

Bottom 10 24-hour Performers (Click to enlarge)

Bitcoin’s dominance level has decreased slightly and dropped under the 60% mark, with its value currently at 59.17%. This value represents a 0.91% difference to the downside when compared to our last report.

Daily Crypto Market Cap Chart

The cryptocurrency market cap experienced a slight increase in value over the weekend. Its current value is $373.40 billion, which represents an increase of $5.33 billion when compared to our previous report.

_______________________________________________________________________

What happened in the past 24 hours?

_______________________________________________________________________

_______________________________________________________________________

Technical analysis

_______________________________________________________________________

Bitcoin

Bitcoin was on a slightly upward slope over the course of the weekend, trying to reach $12,000 before attempting a strong push. The largest cryptocurrency by market cap saw good support in the 21-period moving average, which kept it on its path. The descending RSI and incredibly low volume indicate that the cryptocurrency will move very soon. Meanwhile, Bitcoin’s hashrate reached its new all-time high of 129 EH/s.

BTC traders should look for a trade when a volume spike happens.

BTC/USD 4-hour Chart

Technical factors:
  • Price is above its 50-period EMA and its 21-period EMA
  • Price is at its middle B.B
  • RSI is neutral (52.88)
  • Volume is decreasing (Low)
Key levels to the upside          Key levels to the downside

1: $12,000                                1: $11,630

2: $12,300                                2: $11,460

                                                 3: $11,090

Ethereum

Unlike Bitcoin, Ethereum was not moving slow throughout the weekend. After breaking the $415 mark, Ethereum needed to consolidate above it and show strength, which it did. The second-largest cryptocurrency by market cap retested its support (successfully) and is now safely at the $425 mark.

Traders should look for a trade when ETH regains volume.

ETH/USD 4-hour Chart

Technical Factors:
  • Price is currently above its 21-period and its 50-period EMA
  • Price is above its top B.B.
  • RSI is neutral (52.85)
  • Volume is below average
Key levels to the upside          Key levels to the downside

1: $445                                      1: $415

2: $496                                     2: $400

                                                  3: $361

Ripple

XRP spent its weekend consolidating between the $0.285 and $0.31 support and resistance levels. Low volatility, as well as volume, made XRP virtually untradeable over the course of the weekend. However, as much as XRP doesn’t seem like it doesn’t have the strength to push through $0.31 by itself (without Bitcoin moving first), the state it is currently in is still more bullish than bearish.

Traders can look for a trade after XRP increases its volume and heads towards $0.31.

XRP/USD 4-hour Chart

Technical factors:
  • Price is currently above the 21-period and 50-period EMA
  • Price is between its middle and top B.B.
  • RSI is neutral (55.30)
  • Low volume
Key levels to the upside          Key levels to the downside

1: $0.31                                     1: $0.285  

2: $0.32                                     2: $0.266

3: $0.245


Categories
Crypto Market Analysis

Daily Crypto Review, August 14 – ETH Price Skyrocketing; BitMEX Implementing KYC Procedures

The cryptocurrency market had mad a slight rally in the past 24 hours, with Ethereum leading the way with a price gain of almost 8%. Bitcoin is currently trading for $11,723, which represents an increase of 1.33% on the day. Meanwhile, Ethereum gained 7.61% on the day, while XRP gained 4.96%.

 Daily Crypto Sector Heat Map

When talking about top100 cryptocurrencies, Waves gained 36.29% on the day, making it the most prominent daily gainer. Algorand (34.02%) and Reserve Rights (25.27%) also did great. On the other hand, Ampleforth lost 14.74%, making it the most prominent daily loser. It is followed by Aragon’s loss of 12.46% and yearn.finance’s drop of 11.04%.

Top 10 24-hour Performers (Click to enlarge)

Bottom 10 24-hour Performers (Click to enlarge)

Bitcoin’s dominance level has decreased slightly since we last reported, with its value currently at 60.08%. This value represents a 0.76% difference to the downside when compared to yesterday’s value.

Daily Crypto Market Cap Chart

The cryptocurrency market cap experienced an increase in value since we last reported. Its current value is $368.07 billion, which represents an increase of $9.15 billion when compared to yesterday’s value.

_______________________________________________________________________

What happened in the past 24 hours?

_______________________________________________________________________

_______________________________________________________________________

Technical analysis

_______________________________________________________________________

Bitcoin

Bitcoin spent the day trying to get back near $12,000 after a day of consolidation. Its price made a sharp move towards the upside and broke the $11,630 resistance level, but stopped at $11,850 and then started to retrace. This retracement is most likely a test of the newly-passed resistance (now support). If Bitcoin’s price holds up above it, there is a good chance that we can see another move towards the $12,000 mark in the near term.

BTC traders should look for an opportunity when BTC spikes after the confirmation of its position.

BTC/USD 4-hour Chart

Technical factors:
  • Price is currently above its 50-period EMA and its 21-period EMA
  • Price is above its middle B.B
  • RSI is neutral (54.81)
  • Volume is decreasing
Key levels to the upside          Key levels to the downside

1: $12,000                                1: $11,630

2: $12,300                                2: $11,460

                                                 3: $11,090

Ethereum

Ethereum is the star of the day, as its price has skyrocketed over the course of the last 24 hours. The second-largest cryptocurrency by market cap saw a massive increase in volume while its price went from below-$400 levels all the way up to $432. Ethereum is now consolidating at around $420 and trying to test the $415 support level.

Traders should look for a trade when Ethereum confirms its position above $415 (or fails to do so).

ETH/USD 4-hour Chart

Technical Factors:
  • Price is above its 21-period and its 50-period EMA
  • Price is above its top B.B.
  • RSI is overbought (71.94)
  • Volume is average (one-candle spike)
Key levels to the upside          Key levels to the downside

1: $415                                     1: $$400

2: $496                                     2: $361

                                                  3: $340

Ripple

XRP had a great day and outperformed Bitcoin as well. The third-largest cryptocurrency by market cap ended up gaining almost 5% on the day after breaking above the $0.285 resistance level. As we noted in our previous report, breaking this level is key to pushing further towards the upside, and XRP’s future moves towards $0.31 are a bit more realistic now. However, for the time being, the current progress got stopped by the top B.B. at $0.3, and XRP started consolidating and (possibly) testing $0.285 as support.

Traders can look for an opportunity right after XRP increases in volume and heads towards $0.31.

XRP/USD 4-hour Chart

Technical factors:
  • Price is above the 21-period and 50-period EMA
  • Price is between its middle and top B.B.
  • RSI is neutral (57.75)
  • Low volume
Key levels to the upside          Key levels to the downside

1: $0.31                                     1: $0.285  

2: $0.32                                     2: $0.266

3: $0.245


Categories
Crypto Market Analysis

Daily Crypto Review, August 13 – Crypto Loans Entering the Market; Bitcoin Temporarily Stuck at $11,600

The cryptocurrency market had a day where almost no cryptocurrencies ended up in the red. Even though the gains were mostly small, only five cryptocurrencies lost in the past 24 hours. Bitcoin is currently trading for $11,582, which represents an increase of 1.88% on the day. Meanwhile, Ethereum gained 4.37% on the day, while XRP gained 1.11%.

 Daily Crypto Sector Heat Map

When talking about top100 cryptocurrencies, Numeraire gained 161.01% on the day, making it the most prominent daily gainer. Aragon (90.43%) and BitShares (41.67%) also did great. On the other hand, Divi lost 4.38%, making it the most prominent daily loser. It is followed by Compound’s loss of 2.5% and Aave’s loss of 1.85%.

Top 10 24-hour Performers (Click to enlarge)

Bottom 10 24-hour Performers (Click to enlarge)

Bitcoin’s dominance level has decreased slightly since we last reported, with its value currently at 60.84%. This value represents a 0.53% difference to the downside when compared to yesterday’s value.

Daily Crypto Market Cap Chart

The cryptocurrency market cap experienced a major increase in value since we last reported. Its current value is $358.92 billion, which represents an increase of $13.32 billion when compared to yesterday’s value.

_______________________________________________________________________

What happened in the past 24 hours?

_______________________________________________________________________

_______________________________________________________________________

Technical analysis

_______________________________________________________________________

Bitcoin

After a day of sharp decline, Bitcoin spent the day trying to restore the lost value. However, while the largest cryptocurrency by market cap did gain a few percent and rose to $11,600 levels, the $11,630 resistance seems to be holding the price in place quite well. Bitcoin will need to pass this level confidently (and soon), or BTC bears will consider this the start of a bear move.

BTC traders should look for an opportunity when BTC crosses $11,630.

BTC/USD 4-hour Chart

Technical factors:
  • Price is currently below its 50-period EMA but above its 21-period EMA
  • Price is slightly above its middle B.B
  • RSI is neutral (48.49)
  • Volume is decreasing
Key levels to the upside          Key levels to the downside

1: $11,630                                 1: $11,460

2: $12,000                                 2: $11,090

3: $12,300                                  3: $10,850

Ethereum

Ethereum had a slightly better day than its rival Bitcoin in terms of gains, as it returned to the level it was on the night before the selloff. However, the $400 level seems like it has great resistance, and it is yet unknown whether ETH will be able to break it. The move that will break $400 needs to be extremely strong, and it will most likely be caused by BTC’s move to the upside.

Traders should look for an opportunity when Ethereum breaks $400 or collapses after failing to do so.

ETH/USD 4-hour Chart

Technical Factors:
  • Price is above its 21-period EMA and its 50-period EMA
  • Price is between its middle and top B.B.
  • RSI is elevated (58.91)
  • Volume is average
Key levels to the upside          Key levels to the downside

1: $400                                     1: $361

2: $415                                     2: $340

3: $496                                      3: $302

Ripple

Unlike Bitcoin and Ethereum, XRP did not have such a good day today. The third-largest cryptocurrency by market cap did end up in the green on the day, but it failed to break the $0.285 level. Breaking this level is key to pushing further towards the upside, but the 21-period and 50-period moving average are also above the price and very near $0.285, making it incredibly difficult for XRP to move towards the upside.

Traders can look for an opportunity right after XRP breaks $0.285.

XRP/USD 4-hour Chart

Technical factors:
  • Price is below its 21-period and 50-period EMA
  • Price is slightly below its B.B.
  • RSI is neutral (42.19)
  • Low volume
Key levels to the upside          Key levels to the downside

1: $0.285                                    1: $0.266  

2: $0.31                                     2: $0.245

3: $0.32                                    3: $0.235


Categories
Cryptocurrencies

BTC.Com Wallet Review: What Makes This Crypto Wallet App Unique?

Developed and maintained by Bitmain, BTC.com is a crypto wallet app and web wallet that seeks to provide users with the most secure yet easy to use crypto storage. This online wallet has made it relatively easy to earn, store, and spend your Bitcoin without having to worry about the insecurities that come with storing your crypto in an exchange or the complicated interfaces of the hardware wallets.

Unlike most of its competitors with shadowy reputations, BTC.com has the solid backing of Bitmain. This is a Bitcoin-focused technology company that’s best known for pioneering and popularizing antminer rigs, running two of the largest bitcoin mining pools, and developing other bitcoin-related products. The company introduced the BTC.com wallet to the crypto industry in 2016, and it has gone on to become the favorite wallet for most Bitcoin miners, traders, and investors.

In this BTC.com wallet review, we look at the factors that help the Bitmain-sponsored crypto wallet app stand out. We detail its key operational and security features, its ease of use and level of customer support, highlight its pros and cons, and compare its efficiency with that offered by similar crypto wallets.

Key features:

Highly reputable:

One of BTC.com wallet’s strengths and biggest selling point is that it is maintained by the highly reputable and security-conscious Bitmain company. This, plus the fact that it has never suffered a significant security breach, endears it to most users.

Multiplatform:

There are two primary versions of the BTC.com wallet – the mobile app and internet-based wallet. Both are versatile and work well with the two main mobile operating systems and popular internet browsers.

Straightforward setup:

We also like the BTC.com wallet’s user-friendliness highlighted by its quick and straightforward user account set up process. This aligns with BTC.com’s commitment to being the most secure yet highly secure crypto wallet.

Integration with mining pools:

The BTC.com wallet also gives you access to the mining pools operated by Bitmain. And if you contributed your RAM to either of the pools, your portion of earnings will be automatically deposited to the BTC.com wallet from which you can sell them at an exchange.

Hardware wallet integration:

In addition to the wallet’s close ties with Bitmain Bitcoin mining pools, BTC.com also integrates with some of the leading hardware wallets. This provides it with an added layer of security and makes it possible for you to hold more than just two (BTC + BCH) cryptocurrencies.

Phone contacts synchronization:

This revolutionary BTC.com feature ensures that you don’t always have to key in the complex wallet addresses when sending cryptos. You can give the wallet app permission to access your phone book and send cryptos to your contacts without necessarily having to copy or import their wallet address.

BTC.com wallet security features:

Password:

When installing the BTC.com wallet app and creating your user account, you will be required to set a highly unique password. This becomes the central-most form of protection for your crypto wallet and its contents.

Two-factor authentication:

You can reinforce the effectiveness of the wallet password in deterring illegal access to your private keys by activating two-factor authentication. You can activate this using your mobile phone number whereby you receive calls or SMS verification codes or via the Google authenticator app.

Non-custodial:

BTC.com wallet app is a non-custodial wallet – implying that the wallet developers don’t store your private keys in central servers. Rather, they are stored in your phone when using an app and on your computer if you are using the chrome browser extension. This essentially means that you have absolute control over your digital assets.

Hierarchically deterministic:

The BTC.com wallet will auto-generate a new wallet address every time you initiate a bitcoin/bitcoin cash transaction. This ensures that you rarely get to share your real wallet address with the public, which then minimizes the chances of third parties tracking your bitcoin expenditure or crypto activity.

Open-sourced code:

The BTC.com wallet is built on an open-sourced technology, effectively providing a guarantee of safety and transparency. The fact that it is open-sourced means that it has been subjected to a lot of scrutiny and vetting by experienced industry experts who have found it safe for public use.

Multi-signature:

The BTC.com wallet also supports multi-signature transactions that require the authorization of two or more third parties. This makes it ideal for copay and organizational use as it requires 2-of-3 signatures for a transaction to be validated.

Replay protection:

The replay protection feature that applies to Bitcoin and its forks are ideally meant to cushion you and your funds from the risk of double payments if you ever initiate a Bitcoin payment at a time when a Bitcoin hard fork is being generated. BTC.com wallet developers announced that they are taking measures to prevent this from happening.

How to set up the BTC.com crypto wallet app:

Step 1: Start by downloading the BTC.com mobile wallet app from Google play store or Apple’s app store. The app and the browser extension can also be downloaded from BTC.com official website.

Step 2: Install the crypto app and also key fill in the account registration form that captures your email address.

Step 3: Create a password for your wallet address and agree to the wallet app’s terms of service.

Step 4: Download the wallet’s recovery datasheet. This is availed in PDF Format and captures your wallet’s recovery seed.

Step 5: Access your user account dashboard and click on ‘Create New Wallet’ to generate your primary wallet address.

Step 6: You can start adding Bitcoin and bitcoin cash to your wallet, trading or investing

How to add/receive crypto into your BTC.com wallet

Step 1: Log in to your BTC.com bitcoin wallet

Step 2: On the MyWallet section, click on Bitcoin or Bitcoin cash to reveal the wallet address for the crypt you wish to receive

Step 3: Copy the wallet address or the QR code and send them to the party from who you wish to receive the coins.

Step 4: Wait for the cryptos to reflect in your BTC.com wallet.

How to send crypto into your BTC.com crypto wallet:

Step 1: Log in to your BTC.com Bitcoin wallet, and on My Wallet section, click ‘Send.’

Step 2: Click on the crypto you wish to send – Bitcoin or Bitcoin cash.

Step 3: On the popup window that appears, key in the recipient’s wallet address or scan their QR code. Alternatively, use the app’s contact connect feature to send cryptos to saved contacts on your phone.

Step 4: Confirm that the wallet address and amounts you wish to send are correct and click send.

BTC.com ease of use:

According to the BTC.com website, the Bitcoin wallet app has security and ease of use as its key driving pillars. Both the mobile crypto app and the web wallet feature decongested and highly intuitive interfaces. The app is also infused with a wide range of features that make it easy to use.

It, for instance, has the contacts-synchronization feature that gives the app permission to access your phone contacts, which eliminates the need to memorize the wallet address. Similarly, the downloadable recovery seed option minimizes the common errors most crypto users face when copying the backup phrases. Further, it gives you the option of saving the seed as an electronic copy, printing it, or both.

Unlike most other Bitcoin wallets that can be considered opaque, both the BTC.com mobile app and web wallet allow you to view your crypto transaction history.

BTC.com supported currencies

BTC.com is a Bitcoin-biased wallet and will only support the legacy crypto coin Bitcoin and its Bitcoin Cash hard fork.

The wallet app is nonetheless highly versatile and can easily integrate with some of the most popular hardware wallets like Ledger Nano S. Anyone looking to add a security layer to the app or increase their digital assets portfolio without losing access to the Bitcoin mining pools connected wallet, should consider integrating it with their hardware wallet.

BTC.com cost and fees:

The BTC.com wallet is free. You will not be charged to download or install the crypto app. Neither will you incur any fees for storing your Bitcoins or Bitcoin Cash.

When sending Bitcoins to other wallets or exchanges, however, the bitcoin blockchain network may impose transaction charges. These are highly variable and largely dependent on the Crypto transaction volume.

Additionally, the bitcoin trading platform further adopts a highly dynamic fee structure. This allows you to chose from a three-tier fee system where low-fees translate to low transaction processing, moderate charges equal medium transaction speeds, and high transaction fees result in near-instant transaction processing.

BTC.com customer support:

BTC.com features an extensively elaborated FAQ page as well as a highly informative Blog. They both address some of the common challenges you might face during installation and when using the app.

You are also advised to join the BTC.com online community forum. Here, you get to interact with numerous BTC.com users – both newbie and experienced BTC.com clients – as well as the crypto wallet developers. The forum allows anyone to contribute by way of asking questions and providing solutions to common challenges faced by wallet users. You get to learn the tips and tricks of using the app and get help from developers.

More personalized queries regarding the use of the app can be directed to BTC.com’s customer support team by raising a support ticket, email, or through a call. Alternatively, you can message them on their different social media pages that include Twitter, Reddit, and Facebook.

What are the pros and cons of the BTC.com crypto wallet app?

Pros:

  • The fact that the BTC.com wallet doesn’t store the entire blockchain on your device makes transaction processing relatively fast and doesn’t eat up your phone’s RAM.
  • The wallet features a highly responsive customer support team that is available via social media, community forums, and even on the phone.
  • The Bitcoin wallet has the backing of one of the most reputable crypto industry players.
  • The bitcoin wallet features a wide range of security features, including the fact that it is hierarchically deterministic, open-sourced, and supports two-factor authentication.
  • Installing and using the app is quite straightforward.
  • Your private keys are stored in your device, giving you absolute control of your funds.

Cons:

  • The crypto wallet will only support two cryptocurrencies – Bitcoin and Bitcoin cash.
  • It doesn’t feature an in-built wallet, and neither does it allow for direct bitcoin purchases using fiat currencies.
  • While it has the backing of a reputable company, it still is an unregulated crypto wallet.
  • Its online nature exposes it to the inherent risks associated with online crypto-wallets.

Comparing BTC.com wallet with other crypto wallets

Comparing BTC.com to eToro

BTC.com can be said to have more security features than the eToro crypto wallet, including the fact it is developed on an open-sourced technology. eToro crypto can, on the other hand, be considered more convenient and easy to use. It, for instance, has an inbuilt exchange and supports both crypto-to-crypto and fiat-to-crypto conversions.

Unlike BTC.com that only supports two bitcoin-related cryptos, eToro supports 10+ cryptocurrencies and numerous fiat currencies. And while they both have the backing of highly popular technology companies, eToro is considered more reputable as it is also highly regulated.

Verdict? Is the BTC.com wallet safe?

Well, the BTC.com wallet has adopted some highly innovative security protocols that are aimed at keeping your private keys truly private. Its non-custodial nature, for instance, eliminates a possible central point of attack by storing your private keys in the device hoisting the wallet and not the company’s servers. Other features that endear BTC.com wallet to its users include its ease of use, compatibility with other wallets, and the fact that it is highly customizable.

We nevertheless believe that BTC.com could be even more popular within the crypto industry circles if it were regulated, supported more crypto coins and tokens, and featured an inbuilt crypto trading or exchange platform.

Categories
Crypto Market Analysis

Daily Crypto Review, August 12 – Crypto Selloff Brings Bitcoin to $11,000 Mark; What’s Next?

The cryptocurrency market was in the red in the past 24 hours, with most altcoins’ prices falling down over 5%. Bitcoin is currently trading for $11,375, which represents a decrease of 4.05% on the day. Meanwhile, Ethereum lost 4.84% on the day, while XRP lost 7.59%.

 Daily Crypto Sector Heat Map

When talking about top100 cryptocurrencies, Compound gained 31.08% on the day, making it the most prominent daily gainer. Swipe (16.13%) and Maker (12.37%) also did great. On the other hand, Band Protocol lost 16.42%, making it the most prominent daily loser. It is followed by yearn.finance’s loss of 14.86% and Nervos Network’s loss of 14.41%.

Top 10 24-hour Performers (Click to enlarge)

Bottom 10 24-hour Performers (Click to enlarge)

Bitcoin’s dominance level has increased slightly since we last reported, with its value currently at 61.39%. This value represents a 0.17% difference to the upside when compared to yesterday’s value.

Daily Crypto Market Cap Chart

The cryptocurrency market cap experienced a major decrease in value since we last reported. Its current value is $345.60 billion, which represents an increase of $7.98 billion when compared to yesterday’s value.

_______________________________________________________________________

What happened in the past 24 hours?

_______________________________________________________________________

_______________________________________________________________________

Technical analysis

_______________________________________________________________________

Bitcoin

Bitcoin experienced a large selloff as a result of bulls failing to successfully break the $12,000 mark. The largest cryptocurrency by market cap fell to $11,090 support level before rallying slightly to $11,400 levels. However, Bitcoin might have another bullish move as the RSI is dangerously close to the oversold territory while the volume is high, and since the $11,090 support level held up nicely, Bitcoin confirmed it almost certainly will not go below.

BTC traders should look for an opportunity when BTC makes another move towards the upside and breaks $11,460.

BTC/USD 4-hour Chart

Technical factors:
  • Price is currently below its 50-period EMA, as well as its 21-period EMA
  • Price is above its lower B.B
  • RSI is near the oversold territory (35.52)
  • Volume is decreasing from above-average levels
Key levels to the upside          Key levels to the downside

1: $11,460                                 1: $11,090

2: $11,630                                 2: $10,850

3: $12,000                                  3: $10,500

Ethereum

Ethereum also experienced a selloff, partly because of not being able to go past $400 and partly because of Bitcoin’s move towards the downside. The price broke the triangle formation to the downside (as we said in the previous article) as there was not enough pressure for it to get past the $415 mark. The second-largest cryptocurrency by market cap tested the $361 support, which held up nicely and did not let ETH fall below. Ethereum is now at the $375 mark and is showing no signs of dropping further below.

Traders should look for a trade opportunity when Ethereum makes a bounce towards the upside or falls below $361.

ETH/USD 4-hour Chart

Technical Factors:
  • Price is below its 21-period EMA and its 50-period EMA
  • Price is at its bottom B.B.
  • RSI is near the oversold territory (33.99)
  • Volume is average
Key levels to the upside          Key levels to the downside

1: $400                                     1: $361

2: $415                                     2: $340

3: $496                                      3: $302

Ripple

XRP was no different than Bitcoin and Ethereum in terms of the direction of its movement throughout the day, but it did differ in terms of intensity of the move. The third-largest cryptocurrency by market cap lost over 8% of its value at one point, as bears took over the market when XRP couldn’t break $0.31. The price fell to as low as $0.266 but quickly recovered to its current position ($0.278).

Traders can look for an opportunity to trade after XRP breaks $0.285.

XRP/USD 4-hour Chart

Technical factors:
  • Price is below its 21-period and 50-period EMA
  • Price is slightly above its bottom B.B.
  • RSI is near the oversold territory (35.64)
  • Low volume (slightly increased)
Key levels to the upside          Key levels to the downside

1: $0.285                                    1: $0.266  

2: $0.31                                     2: $0.245

3: $0.32                                    3: $0.235


Categories
Crypto Market Analysis

Daily Crypto Review, August 11 – yEarn Finance Token Explodes After Binance Listing; BTC Hashrate Unaffected by the Price Upswing

The cryptocurrency market tried to catch up to Bitcoin after it pushed up yesterday. Bitcoin is currently trading for $11,938, which represents an increase of 1.26% on the day. Meanwhile, Ethereum gained 1.27% on the day, while XRP lost 4.73%.

 Daily Crypto Sector Heat Map

When talking about top100 cryptocurrencies, yearn.finance gained 50.03% on the day, making it the most prominent daily gainer. JUST (39.71%) and Terra (28.27%) also did great. On the other hand, Balancer lost 13.90%, making it the most prominent daily loser. It is followed by Band Protocol’s loss of 9.52% and iExec RLC’s loss of 6.35%.

Top 10 24-hour Performers (Click to enlarge)

Bottom 10 24-hour Performers (Click to enlarge)

Bitcoin’s dominance level has decreased slightly since we last reported, with its value currently at 61.22%. This value represents a 0.56% difference to the downside when compared to yesterday’s value.

Daily Crypto Market Cap Chart

The cryptocurrency market cap has increased since we last reported. Its current value is $363.58 billion, which represents an increase of $0.89 billion when compared to yesterday’s value.

_______________________________________________________________________

What happened in the past 24 hours?

_______________________________________________________________________

_______________________________________________________________________

Technical analysis

_______________________________________________________________________

Bitcoin

Bitcoin has spent the day trying to regain what’s been lost after the failed attempt to break the $12,000 mark. However, the price doesn’t seem like it will be able to push past this level unless a surge in volume and bull pressure happens. Meanwhile, Bitcoin is locked between $11,630 and $12,000. When it comes to moves towards the downside, Bitcoin is well protected by the 21-period and 50-period moving averages.

BTC traders should look for an opportunity when BTC makes another push and breaks $12,000.

BTC/USD 4-hour Chart

Technical factors:
  • Price is currently above its 50-period EMA, as well as its 21-period EMA
  • Price between its middle B.B (20-period SMA) and its top B.B.
  • RSI is neutral (56.12)
  • Volume is decreasing
Key levels to the upside          Key levels to the downside

1: $12,000                                 1: $11,630

2: $12,330                                 2: $11,460

3: $13180                                   3: $11,090

Ethereum

Ethereum was quite stable in the past 24 hours, making small gains in an attempt to catch up to Bitcoin’s gains that happened yesterday. However, if we take a look at this month’s price movement, we can interpret the moves as a triangle formation, which will make a breakout very soon. It is more likely that the second-largest cryptocurrency by market cap will break the triangle formation towards the downside unless Bitcoin’s move pushes it up.

Traders should look for a trade opportunity when Ethereum breaks the formation.

ETH/USD 4-hour Chart

Technical Factors:
  • Price is above its 21-period EMA and its 50-period EMA
  • Price is slightly below its top B.B.
  • RSI is neutral (56.42)
  • Volume decreasing
Key levels to the upside          Key levels to the downside

1: $400                                     1: $361

2: $415                                     2: $340

3: $496                                      3: $302

Ripple

XRP is the cryptocurrency that gained the most in the past 24 hours (when compared to Bitcoin and Ethereum) as its price increased close to 5% on the day. The third-largest cryptocurrency by market cap made another push towards the $0.31 resistance level, but the move failed to even reach the level, let alone break it.

Traders can look for an opportunity to trade XRP within the range it is currently in.

XRP/USD 4-hour Chart

Technical factors:
  • Price is above its 21-period and 50-period EMA
  • Price is above its top B.B.
  • RSI is slightly elevated (58.52)
  • Low volume (slightly increased)
Key levels to the upside          Key levels to the downside

1: $0.31                                     1: $0.285  

2: $0.32                                     2: $0.266

3: $0.3328                                3: $0.245


Categories
Crypto Market Analysis

Daily Crypto Review, August 10 – Chainlink Surpasses LTC’s Market Cap Despite Major Bearish Signals

The cryptocurrency market had an interesting weekend, with Bitcoin pushing towards 12,000 and actually passing it at the time of writing. Bitcoin is currently trading for $12,003, which represents an increase of 2.24% on the day. Meanwhile, Ethereum gained 0.18% on the day, while XRP lost 0.11%.

 Daily Crypto Sector Heat Map

When talking about top100 cryptocurrencies, Balancer gained 45.17% on the day, making it the most prominent daily gainer. Band Protocol (32.27%) and Nervos Network(26.64%) also did great. On the other hand, Flexacoin lost 16.27%, making it the most prominent daily loser. It is followed by Decentraland’s loss of 9.91% and Elrond’s loss of 6.81%.

Top 10 24-hour Performers (Click to enlarge)

Bottom 10 24-hour Performers (Click to enlarge)

Bitcoin’s dominance level has increased slightly since we last reported, with its value currently at 61.78%. This value represents a 0.28% difference to the upside when compared to Friday’s value.

Daily Crypto Market Cap Chart

The cryptocurrency market capitalization has increased since we last reported. Its current value is $362.67 billion, which represents an increase of $3.77 billion when compared to Friday’s value.

_______________________________________________________________________

What happened in the past 24 hours?

_______________________________________________________________________

_______________________________________________________________________

Technical analysis

_______________________________________________________________________

Bitcoin

Bitcoin has spent the weekend pushing towards $12,000 and finally passing it in a major push just a couple of hours ago. However, the price didn’t fully (or at all) establish itself above the major mark. Bitcoin will need to confirm its position above $12,000 (and confidently) before being considered as officially above it. For now, this level is still a resistance level.

BTC traders should look for an opportunity to make a trade when BTC confirms its position above or below $12,000.

BTC/USD 4-hour Chart

Technical factors:
  • Price is currently above its 50-period EMA, as well as its 21-period EMA
  • Price above its top B.B.
  • RSI is elevated (65.89)
  • Volume elevated (on the increase)
Key levels to the upside          Key levels to the downside

1: $12,000                                 1: $11,630

2: $12,330                                 2: $11,460

3: $13180                                   3: $11,090

Ethereum

Unlike Bitcoin, Ethereum spent the weekend without much movement towards the upside. However, the second-largest cryptocurrency by market cap did fall back to the $361 level and tested its support, which held up quite nicely. Once the price bounced back to its previous highs, it continued slowly moving towards the upside, but without any real strength. Ethereum still has a way to go before it reaches past $400.

Traders should look for a trade opportunity when Ethereum increases its volume.

ETH/USD 4-hour Chart

Technical Factors:
  • Price is above its 21-period EMA and its 50-period EMA
  • Price is slightly below its top B.B.
  • RSI is elevated (58.51)
  • Volume increasing slightly
Key levels to the upside          Key levels to the downside

1: $400                                     1: $361

2: $415                                     2: $340

3: $496                                      3: $302

Ripple

XRP had quite a turbulent weekend, with its price failing to stay above the previously broken triangle formation levels. This happened as, even though XRP managed to break the triangle formation to the upside, it did not reach past the $0.31 resistance level. Instead, bears stepped into the market and brought the price down to below $0.285 levels (at one point). However, the $0.285 level held up and XRP has confirmed its position above this support.

Traders can look for an opportunity to trade when XRP reaches the $0.31 mark and decides if it will reach above it or fall below once again.

XRP/USD 4-hour Chart

Technical factors:
  • Price is above its 21-period and 50-period EMA
  • Price is slightly above its middle B.B. (20-period SMA)
  • RSI is neutral (51.45)
  • Low volume
Key levels to the upside          Key levels to the downside

1: $0.31                                     1: $0.285  

2: $0.32                                     2: $0.266

3: $0.3328                                3: $0.245


Categories
Crypto Guides

The Basics of Cryptocurrency Lending And Staking

Introduction

Crypto trading has become one of the hot topics of the market. With the security of cryptography and interesting rates of the currency, everyone wants to get their share of the pie. That is why more people are looking for opportunities to generate some income with the help of cryptocurrency. Two best methods you can opt for making money through cryptocurrency are lending and staking. Let’s dive into the two techniques and see which one can be beneficial for you.

Crypto Lending

The concept of crypto lending can be understood as a simple cryptocurrency collateralized loan. A borrower can utilize their crypto assets for getting a stablecoin or fiat loan. In exchange for this, the lender gets a fixed (agreed-upon) interest rate. Alternatively, the borrower can also use their stablecoins as collateral for borrowing crypto assets.

The whole process raises the cryptocurrency’s productivity by reallocating it to people who are in immediate need (borrowers) from those who are not (lenders). That is why crypto lending proves to be a powerful financial primitive in the crypto market that traditionally had only two options: trade and HODL.

The only drawback to crypto lending is that you got to have some capital or assets at your disposal to get the loan. That means they are over collateralized and don’t offer all advantages of true credit.

Crypto Staking

You may find people talking about staking as just holding some crypto and earning rewards in exchange for it. However, there is more to this concept. Staking involves the Proof-of-Stake mechanism, where new blocks get produced and verified through staking.

So unlike mining, you don’t need special computers to solve problems here. But you do need to follow some conditions to become a new block validator, such as:

  • Your cryptocurrency wallet must hold a minimum amount.
  • Your wallet must remain online throughout the day and every day.
  • Your wallet should support crypto staking.

Other than these, different blockchains may apply different rules. So you need to check with the blockchain for how you can stake. Plus, staking is not supported by every cryptocurrency, and you have to choose only from the provided options.

In exchange for holding these staking processes, you get a fixed percentage of rewards per year. You can also opt for a pool, where multiple holders keep their coins together. This increases the overall chances of validating a block and getting higher revenues.

Lending vs. Staking: Which One To Opt?

It would be wrong to state that either of them is better than the other. They both have pros and cons. Your choice majorly depends on the type of investor you are. In case you need instant stable coins with the help of assets, lending would be more beneficial for you. On the other hand, you can opt for staking if you want to generate a significant amount of money by holding the crypto coins in your wallet.

The crucial point here is to keep an eye on the blockchain in which you are investing. You need to look through all the aspects before putting money in a particular investment method.

Categories
Crypto Market Analysis

Daily Crypto Review, August 7 – Goldman Sachs Launching its Own Stablecoin; DeFi Platforms Traffic Surging

The cryptocurrency market ended up mostly in the green, with Bitcoin continuing its path towards $12,000. Bitcoin is currently trading for $11,831, which represents an increase of 1.34% on the day. Meanwhile, Ethereum lost 0.18% on the day, while XRP gained 1.4%.


 Daily Crypto Sector Heat Map

When talking about top100 cryptocurrencies, Balancer gained 23.90% on the day, making it the most prominent daily gainer. Aave (20.29%) and Decentraland (15.99%) also did great. On the other hand, Aurora lost 12.10%, making it the most prominent daily loser. It is followed by Ampleforth’s loss of 7.98% and The Midas Touch’s loss of 5.50%.

Top 10 24-hour Performers (Click to enlarge)

Bottom 10 24-hour Performers (Click to enlarge)

Bitcoin’s dominance level has increased slightly since we last reported, with its value currently at 61.50%. This value represents a 0.02% difference to the upside when compared to yesterday’s value.

Daily Crypto Market Cap Chart

The cryptocurrency market capitalization has increased since we last reported. Its current value is $358.90 billion, which represents an increase of $5.42 billion when compared to the value it had yesterday.

_______________________________________________________________________

What happened in the past 24 hours?

_______________________________________________________________________

_______________________________________________________________________

Technical analysis

_______________________________________________________________________

Bitcoin

The largest cryptocurrency by market capitalization kept increasing in price slowly throughout the day as sentiment turned even more bullish. However, the path towards $12,000 will not be easy, as the sell wall at the resistance is not small. On the other hand, if Bitcoin fails to break $12,000, it will create a double top and most likely fall down towards $11,630 and then $11,460 as well.

BTC traders should look for an opportunity to make a trade when BTC breaks $12,000 or fails to break it.

BTC/USD 4-hour Chart

Technical factors:
  • Price is currently above its 50-period EMA, as well as its 21-period EMA
  • Price is near its top B.B.
  • RSI is elevated (65.50)
  • Volume elevated (stable)
Key levels to the upside          Key levels to the downside

1: $11,630                                 1: $11,460

2: $12,000                                 2: $11,090

                                                  3: $10,855

Ethereum

Ethereum spent the day flattening out its movement and mostly trading sideways. The second-largest cryptocurrency by market capitalization stayed below the $400 mark and couldn’t get past it. However, with volume dying down and such low volatility, we may expect an attempt to break the $400 (and then $415) level soon.

Traders should look for a trade opportunity when Ethereum increases its volume.

ETH/USD 4-hour Chart

Technical Factors:
  • Price is above its 21-period EMA and its 50-period EMA
  • Price is slightly above its middle B.B. (20-period SMA)
  • RSI is elevated (58.42)
  • Descending volume
Key levels to the upside          Key levels to the downside

1: $400                                     1: $362

2: $415                                     2: $340

3: $496                                      3: $302

Ripple

XRP broke out from its triangle formation to the upside, but couldn’t reach past $0.31 mark. However, the pullback from a failed move didn’t discredit XRP’s break from the triangle formation, as the cryptocurrency managed to stay above the triangle. With the confirmed break, traders can expect XRP to either stay near $0.31 or push above it in the short-term unless some other catalyst sparks a movement to the downside.

Traders can look for an opportunity to trade when XRP breaks $0.31.

XRP/USD 4-hour Chart

Technical factors:
  • Price is above its 21-period and 50-period EMA
  • Price is below its middle B.B. (20-period SMA)
  • RSI is neutral (55.99)
  • Low volume
Key levels to the upside          Key levels to the downside

1: $0.31                                     1: $0.285  

2: $0.32                                     2: $0.266

3: $0.3328                                3: $0.245


Categories
Crypto Market Analysis

Daily Crypto Review, August 6 – ‘Ethereum Is a Ponzi Scheme’ – Adam Back; ETC Suffers Yet Another 51% Attack

The cryptocurrency market ended up mostly in the green, with (of course) a few exceptions. Bitcoin is currently trading for $11,665, which represents an increase of 3,46% on the day. Meanwhile, Ethereum gained 1.6% on the day, while XRP gained 1.41%.

 Daily Crypto Sector Heat Map

When talking about top100 cryptocurrencies, Band Protocol gained 36.21% on the day, making it the most prominent daily gainer. Travala.com (24%) and Bancor (22.19%) also did great. On the other hand, Nexohas lost 21.32%, making it the most prominent daily loser. It is followed by The Midas Touch’s loss of 8.47% and THORChain’s loss of 7.70%.

Top 10 24-hour Performers (Click to enlarge)

Bottom 10 24-hour Performers (Click to enlarge)

Bitcoin’s dominance level has increased since we last reported, with its value currently at 61.48%. This value represents a 0.31% difference to the upside when compared to yesterday’s value.

Daily Crypto Market Cap Chart

The cryptocurrency market capitalization has increased since we last reported. Its current value is $353.48 billion, which represents an increase of $12.09 billion when compared to the value it had yesterday.

_______________________________________________________________________

What happened in the past 24 hours?

_______________________________________________________________________

_______________________________________________________________________

Technical analysis

_______________________________________________________________________

Bitcoin

The largest cryptocurrency by market capitalization continued its move towards the upside after a few days of indecisiveness and consolidation. Bitcoin saw a slight increase in volume, which brought the price above the $11,460 resistance level and up to $11,820. However, the move stopped there (for now), and Bitcoin is currently consolidating above the $11,460 level, testing it as support.

BTC traders should look for an opportunity to make a trade when BTC confirms or fails to confirm its position with $11,460.

BTC/USD 4-hour Chart

Technical factors:
  • Price is currently above its 50-period EMA, as well as its 21-period EMA
  • Price is near its top B.B
  • RSI is elevated (62.37)
  • Volume is increasing
Key levels to the upside          Key levels to the downside

1: $11,460                                 1: $11,090

2: $11,630                                 2: $10,855

 3: $12,000                                 3: $10,505

Ethereum

Ethereum seems to be back on its steady upwards path, which began on July 21. The second-largest cryptocurrency by market cap rose steadily throughout the day, trying to reach past the $415 resistance. While the price did not yet reach this mark, it did increase slightly, supported by the 21 and 50-period moving averages.

Traders should look for a trade opportunity within the range ETH is currently in.

ETH/USD 4-hour Chart

Technical Factors:
  • Price is above its 21-period EMA and its 50-period EMA
  • Price is slightly above its middle B.B. (20-period SMA)
  • RSI is elevated (60.26)
  • Descending volume
Key levels to the upside          Key levels to the downside

1: $415                                     1: $362

2: $496                                     2: $340

                                                  3: $302

Ripple

XRP experienced sideways movement on low volume throughout the day. The third-largest cryptocurrency by market capitalization was trading near the top of its triangle formation, unable to break it yet. However, the decreasing volume, as well as the price approaching the 80% mark of the formation, indicate a move which will take XRP out of the triangle formation. While it is too early to speculate, XRP seems to have a better chance of breaking to the upside.

Traders can look for an opportunity to trade when XRP breaks its triangle formation.

XRP/USD 4-hour Chart

Technical factors:
  • Price is above its 21-period and 50-period EMA
  • Price is below the middle B.B. (20-period SMA)
  • RSI is neutral (55.62)
  • Low volume
Key levels to the upside          Key levels to the downside

1: $0.32                                    1: $0.285  

2: $0.3328                                2: $0.266

                                               3: $0.245


Categories
Crypto Daily Topic Crypto Guides

Here’s What You Need To Know About ChainLink Cryptocurrency

Introduction

Blockchain has revolutionized the digital industry with its amazing benefits. It has secured the payment methods and has provided people with a brand-new way to trade digitally. There are plenty of crypto platforms that are working on blockchain right now. ChainLink is one such decentralized network that offers real-world data to smart contracts. Link is the cryptocurrency or the digital token of the ChainLink platform, which you can use to pay for the services they offer.

What’s The Issue With Smart Contracts?

Smart contracts are indeed an integral part of the blockchain system, which are basically agreements to evaluate the information entered and execute the conditions. These Smart contracts help in establishing a sense of trust among the traders. The only limitation that smart contracts have right now is the ability to connect with blockchain in a language that both can easily understand. If that limitation has been addressed, the use of smart contracts can be widely enhanced.

Oracle As The Much Needed Solution

Oracle is the ideal solution to all these problems. It is basically a middle software that works as a translator for converting data from the real world to smart contracts and vice versa. Oracles are the recent additions into the blockchain and crypto ecosystem with an aim to bring together off-chain data and on-chain smart contracts. However, there is a loophole that makes oracles less efficient. Centralized oracles will decrease the efficiency of on-chain smart contracts due to the faulty and untrustworthy nature.

How ChainLink Makes a Difference?

ChainLink emerges as a savior in the situation. It is a decentralized oracle network that sources data and information off blockchain and transfers it to blockchain smart contracts. The primary purpose of ChainLink is to minimize the reliability issue with oracles. In a nutshell, ChainLink has found a reliable way to take the information from and for the blockchain in the safest manner.

How Does It Work To Provide More Security?

The ChainLink works by providing data to the purchase in return of the data in a secure way. Purchasers have to select the data, and the providers have to bid on that data. Providers will make a stake of LINK tokens during the bid.

With a view to improving the oracles and data security, ChainLink bought a startup, i.e., TownCrier. The technology of TownCrier helped ChainLink to enhance security with a trusted execution environment.

The Bottom Line

Blockchains are a popular way of securing digital transactions because it uses cryptography to establish security and trust. It is important to understand that each set of blockchain is a universe that needs to be explored. The information transfer in and out of the blockchain can make it vulnerable. To restrict the blockchain from compromising, ChainLink entered the crypto ecosystem as a decentralized oracle network.

Bridging the gap between real-world data and on-chain smart contracts, ChainLink was able to address the pain point. It acts as the middleware between off-chain data and an on-chain smart contract. Today, ChainLink is the most successful and powerful blockchain network that still has the potential to outgrow itself.

Categories
Crypto Market Analysis

Daily Crypto Review, August 5 – XRP Drops by 6% Despite Fundamentals Booming

The cryptocurrency market had a day without much movement. Bitcoin is currently trading for $11,166, which represents a decrease of 1.52% on the day. Meanwhile, Ethereum lost 2.66% on the day, while XRP lost 6%.

 Daily Crypto Sector Heat Map

When talking about top100 cryptocurrencies, Band Protocol gained 15.33% on the day, making it the most prominent daily gainer. The Midas Touch (13.97%) and Kava.io (12.79%) also did great. On the other hand, Quant has lost 15.75%, making it the most prominent daily loser. It is followed by Ampleforth’s loss of 14.84% and MCO’s loss of 11.32%.

Top 10 24-hour Performers (Click to enlarge)

Bottom 10 24-hour Performers (Click to enlarge)

Bitcoin’s dominance level has increased since we last reported, with its value currently at 61.17%. This value represents a 0.37% difference to the upside when compared to yesterday’s value.

Daily Crypto Market Cap Chart

The cryptocurrency market capitalization has decreased slightly since we last reported. Its current value is $341.39 billion, which represents a decrease of $6.78 billion when compared to the value it had yesterday.

_______________________________________________________________________

What happened in the past 24 hours?

_______________________________________________________________________

_______________________________________________________________________

Technical analysis

_______________________________________________________________________

Bitcoin

The largest cryptocurrency by market cap had a slow day, with its price being locked in a range bound by The $11,460 resistance and $11,090 support. Bitcoin continuously retested its immediate support, but the lack of volume and pressure towards the downside brought nothing to the BTC bears. Bitcoin’s downside is also guarded by the 50-period moving average, which is sitting right under $11,090.

BTC traders should look for an opportunity to make a trade when BTC breaks $11,460 or falls below $11,090.

BTC/USD 4-hour Chart

Technical factors:
  • Price is currently above its 50-period EMA, but below its 21-period EMA
  • Price is near its middle B.B (20-period SMA)
  • RSI is neutral (47.67)
  • Volume decreasing
Key levels to the upside          Key levels to the downside

1: $11,460                                 1: $11,090

2: $11,630                                 2: $10,855

 3: $12,000                                 3: $10,505

Ethereum

Ethereum has a slow day as well, with its volume normalizing and volatility fading. The second-largest cryptocurrency by market capitalization oscillated between $401 and $380 over the course of the day. The cryptocurrency seems like it will be trading within the range bound by $415 and $362 for some time now.

Traders should look for a trade opportunity within the range ETH is currently in.

ETH/USD 4-hour Chart

Technical Factors:
  • Price is above its 21-period EMA and its 50-period EMA
  • Price is currently at its middle B.B. (20-period SMA)
  • RSI is elevated (57.69)
  • Descending volume
Key levels to the upside          Key levels to the downside

1: $415                                     1: $362

2: $496                                     2: $340

                                                  3: $302

Ripple

XRP experience a day with a bit more volatility than Bitcoin and Ethereum, with its price dropping down to below $0.3 levels. While the move to the downside seems to be stopped by the 21-period moving average for now, XRP will certainly move somewhere (more likely to the downside. On top of that, XRP has formed a triangle formation, which gives us a possible time estimate of its next move.

Traders can look for an opportunity to trade when XRP breaks the triangle formation.

XRP/USD 4-hour Chart

Technical factors:
  • Price above 21-period and the 50-period EMA
  • Price is below the middle B.B. (20-period SMA)
  • RSI is neutral (54.18)
  • Average volume
Key levels to the upside          Key levels to the downside

1: $0.32                                    1: $0.285  

2: $0.3328                                2: $0.266

                                               3: $0.245


Categories
Crypto Market Analysis

Daily Crypto Review, August 4 – BTC Establishes Itself Above $11,000; Altcoins Taking Over The Market

The cryptocurrency market ended up in the green today, with Bitcoin establishing its place above $11,000 and most altcoins gaining substantial value. Bitcoin is currently trading for $11,350, which represents an increase of 1.86% on the day. Meanwhile, Ethereum gained 4.8% on the day, while XRP gained 6.87%.

 Daily Crypto Sector Heat Map

When talking about top100 cryptocurrencies, MCO gained 41.91% on the day, making it the most prominent daily gainer. Ocean Protocol (28.92%) and Energy Web Token (22.88%) also did great. On the other hand, Ampleforth has lost 12.73%, making it the most prominent daily loser. It is followed by Aave’s loss of 6.32% and Celsius’ loss of 3.80%.

Top 10 24-hour Performers (Click to enlarge)

Bottom 10 24-hour Performers (Click to enlarge)

Bitcoin’s dominance level has decreased since we last reported, with its value currently at 60.80%. This value represents a 0.82% difference to the downside when compared to Friday’s value.

Daily Crypto Market Cap Chart

The cryptocurrency market capitalization has increased since we last reported. Its current value is $347.17 billion, which represents an increase of $9.74 billion when compared to the value it had yesterday.

_______________________________________________________________________

What happened in the past 24 hours?

_______________________________________________________________________

_______________________________________________________________________

Technical analysis

_______________________________________________________________________

Bitcoin

The largest cryptocurrency by market capitalization confirmed its position above $11,000 in the past 24 hours (at least in the short term) Its price kept slowly going up until it hit a (possibly) new resistance level of $11,460. The price then took a small dive but returned to sideways movements. Bitcoin is in a good spot to create a move that will lead it towards (or above) $12,000 in the near future.

BTC traders should look for an opportunity to make a trade when BTC breaks $11,460 or falls below $11,090.

BTC/USD 4-hour Chart

Technical factors:
  • Price is currently above its 50-period EMA, but below its 21-period EMA
  • Price is between its bottom B.B. and its middle B.B (20-period SMA)
  • RSI is neutral (51.35)
  • Volume increased
Key levels to the upside          Key levels to the downside

1: $11,630                                1: $11,090

2: $12,000                                2: $10,855

                                                 3: $10,505

Ethereum

Ethereum continued pushing towards the upside, pretty much unaffected by the “flash crash” that brought its price down from $415 to $320. The second-largest cryptocurrency by market capitalization is moving upwards and having the 21-period and 50-period moving averages as support. The price is currently just below $400.

Ethereum traders should look for an opportunity in a pullback, which will most likely happen after the current move towards the upside.

ETH/USD 4-hour Chart

Technical Factors:
  • Price is above its 21-period EMA and its 50-period EMA
  • Price is currently between its top B.B. and its middle B.B. (20-period SMA)
  • RSI is elevated (63.95)
  • Above-average volume
Key levels to the upside          Key levels to the downside

1: $340                                    1: $302

2: $362                                    2: $289

                                                 3: $278

Ripple

XRP was also one of the altcoins that made significant progress towards the upside in the past 24 hours. The third-largest cryptocurrency by market cap recovered from the “flash crash” quickly and hurled upwards, reaching past the $0.31 resistance level (now support) once again.

XRP traders can look for an opportunity in the range between $0.31 and $0.32.

XRP/USD 4-hour Chart

Technical factors:
  • Price above 21-period and the 50-period EMA
  • Price is between the top B.B. and the middle B.B. (20-period SMA)
  • RSI is elevated (66.85)
  • Elevated volume
Key levels to the upside          Key levels to the downside

1: $0.32                                    1: $0.285  

2: $0.3328                                2: $0.266

                                               3: $0.245


Categories
Crypto Market Analysis

Daily Crypto Review, August 3 – More than $1 Billion Positions Liquidated; Crypto Market Booming Despite the “Flash-Crash”

The cryptocurrency market had quite a weird weekend in terms of price performance. The market and most of its cryptocurrencies had a “flash crash,” but quickly recovered to a price slightly below the previous highs. Bitcoin is currently trading for $11,160, which represents a decrease of 6.59% on the day. Meanwhile, Ethereum lost 4.04% on the day, while XRP gained 1.03%.

 Daily Crypto Sector Heat Map

When talking about top100 cryptocurrencies, Loopring gained 17.24% on the day, making it the most prominent daily gainer. Terra (14.69%) and Synthetix Network (13.73%) also did great. On the other hand, Ampleforth has lost 20.21%, making it the most prominent daily loser. It is followed by The Midas Touch’s loss of 18.78% and Quant’s loss of 15.89%.

Top 10 24-hour Performers (Click to enlarge)

Bottom 10 24-hour Performers (Click to enlarge)

Bitcoin’s dominance level decreased since we last reported, with its value currently at 61.62%. This value represents a 1.29% difference to the downside when compared to Friday’s value.

Daily Crypto Market Cap Chart

The cryptocurrency market capitalization increased since we last reported. Its current value is $337.43 billion, which represents an increase of $9.65 billion when compared to the value it had on Friday.

_______________________________________________________________________

What happened in the past 24 hours?

_______________________________________________________________________

_______________________________________________________________________

Technical analysis

_______________________________________________________________________

Bitcoin

The largest cryptocurrency by market capitalization spent the weekend crashing down to $10,555 and then recovering from the drop. After the price going up all the way up to $12,000, Bitcoin suddenly dropped to $10,555, which liquidated $1 billion of positions. However, the price quickly recovered and went over $11,000. It is still unsure if the price will end up being above this support level, but it is more likely that BTC will remain above, rather than fall below it.

BTC traders should look for a trade opportunity when BTC bounces from $11,000 or falls below it.

BTC/USD 4-hour Chart

Technical factors:

  • Price is currently below its 50-period EMA and its 21-period EMA
  • Price is between its bottom B.B. and its middle B.B (20-period SMA)
  • RSI is neutral (47.02)
  • Volume increased (descending)

Key levels to the upside          Key levels to the downside

1: $11,630                                1: $11,090

2: $12,000                                2: $10,855

                                                 3: $10,505

Ethereum

Ethereum acted pretty much the same as Bitcoin over the weekend, with its price reaching a major high of $415, and then plummeting down to $320 before recovering to $380 levels. While the current price is considerably lower than the $415 high, but Ethereum made insane gains over the course of the week and month.

Ethereum traders should look for a trade opportunity after the cryptocurrency decides its price direction.

ETH/USD 4-hour Chart

Technical Factors:

  • Price is above the 50-period EMA and the 21-period EMA
  • Price is between its top B.B. and its middle B.B (20-period SMA)
  • RSI is elevated (61.44)
  • Above-average volume (descending)

Key levels to the upside          Key levels to the downside

1: $340                                    1: $302

2: $362                                    2: $289

                                                 3: $278

Ripple

XRP spent the weekend reaching the resistance level of $0.32, which it could not pass over, and then dropping towards the downside. The third-largest cryptocurrency reached a low of $0.241 before bouncing back to above $0.285 level, where it currently is consolidating (and rising slowly).

XRP traders can look for an opportunity in the range between $0.285 and $0.31.

XRP/USD 4-hour Chart

Technical factors:

  • Price above 21-period and the 50-period EMA
  • Price is between the top B.B. and the middle B.B. (20-period SMA)
  • RSI is elevated (63.79)
  • Elevated volume (descending)

Key levels to the upside          Key levels to the downside

1: $0.32                                    1: $0.285  

2: $0.3328                                2: $0.266

                                               3: $0.245


Categories
Crypto Market Analysis

Daily Crypto Review, July 31 – Binance Debit Cards Now in Europe; XRP Whales Started Buying?

The cryptocurrency market mostly traded sideways as Bitcoin still continues its fight for $11,000. Bitcoin is currently trading for $11,065, which represents a decrease of 0.43% on the day. Meanwhile, Ethereum gained 4.76% on the day, while XRP gained 2.04%.

 Daily Crypto Sector Heat Map

When talking about top100 cryptocurrencies, Chilliz gained 29.75% on the day, making it the most prominent daily gainer. Bancor (14%) and VeChain (12.22%) also did great. On the other hand, Ampleforth has lost 45.57%, making it the most prominent daily loser. It is followed by Flexacoin’s loss of 8.58% and Quant’s loss of 8.06%.

Top 10 24-hour Performers (Click to enlarge)

Bottom 10 24-hour Performers (Click to enlarge)

Bitcoin’s dominance level decreased slightly since we last reported, with its value currently at 62.91%. This value represents a 0.75% difference to the downside when compared to yesterday’s value.

Daily Crypto Market Cap Chart

The cryptocurrency market capitalization increased slightly since we last reported. Its current value is $328.13 billion, which represents an increase of $3.04 billion when compared to the value it had yesterday.

_______________________________________________________________________

What happened in the past 24 hours?

_______________________________________________________________________

_______________________________________________________________________

Technical analysis

_______________________________________________________________________

Bitcoin

The largest cryptocurrency by market capitalization spent the day fighting for $11,000 yet again. The sideways movement ranged from the support of $10,855 to a little above $11,090 resistance level. While it is still unsure of whether Bitcoin will end up above or below $11,000, the rally from the $9,000 levels has been extremely successful. As for the short-term future of Bitcoin, it is still unsure, as some analysts call for an immediate correction while others predict a price increase to $11,500 levels.

BTC traders should look for a trade opportunity when BTC bounces off of $10,855 or falls below it.

BTC/USD 4-hour Chart

Technical factors:

  • Price is currently above its 50-period EMA and its 21-period EMA
  • Price is between its top B.B. and its middle B.B (20-period SMA)
  • RSI is elevated (60.82)
  • Volume increased (descending)

Key levels to the upside          Key levels to the downside

1: $11,090                                1: $10,855

2: $11,630                                2: $10,505

                                                 3: $10,015

Ethereum

Ethereum broke off from its period of stagnation and moved towards the upside. The second-largest cryptocurrency by market cap moved to $340 before being stopped. ETH is now consolidating just above the previous consolidation phase.

Ethereum traders should look for a trade opportunity after the cryptocurrency moves back below $324 or if it makes another move towards the upside.

ETH/USD 4-hour Chart

Technical Factors:

  • Price is above the 50-period EMA and the 21-period EMA
  • Price is at the top B.B.
  • RSI is elevated (66.5)
  • Above-average volume (descending)

Key levels to the upside          Key levels to the downside

1: $340                                    1: $302

2: $362                                    2: $289

                                                 3: $278

Ripple

XRP spent its day mostly trading sideways, but also gaining in value slightly. The third-largest cryptocurrency by market cap failed (so far) to break the $0.2454 level completely, but it has approached that event considerably. If, however, XRP doesn’t break the resistance level soon, it might fall back and retest the support level of $0.235.

XRP traders can look for an opportunity when the cryptocurrency breaks its ranging moves to either side.

XRP/USD 4-hour Chart

Technical factors:

  • XRP in a mid-term descending trend (though it broke the trend in the short-term)
  • Price above 21-period and the 50-period EMA
  • Price is between the top B.B. and the middle B.B. (20-period SMA)
  • RSI is elevated (61.84)
  • Elevated volume (descending)

Key levels to the upside          Key levels to the downside

1: $0.245                                  1: $0.235  

                                                2: $0.227

                                               3: $0.214


Categories
Crypto Market Analysis

Daily Crypto Review, July 30 – Bitcoin Confirmed as Better Hedge than Gold? BTC fighting for $11,000

The cryptocurrency market mostly traded sideways as Bitcoin was fighting to regain $11,000. Bitcoin is currently trading for $11,065, which represents an increase of 1.2% on the day. Meanwhile, Ethereum gained 0.33% on the day, while XRP gained 0.45%.

 Daily Crypto Sector Heat Map

When talking about top100 cryptocurrencies, Travala.com gained 21.78% on the day, making it the most prominent daily gainer. Digitex Futures (16.68%) and Aave (11.94%) also did great. On the other hand, Ampleforth has lost 35.64%, making it the most prominent daily loser. It is followed by Aurora’s loss of 10% and iExec RLC’s loss of 8.31%.

Top 10 24-hour Performers (Click to enlarge)

Bottom 10 24-hour Performers (Click to enlarge)

Bitcoin’s dominance level increased slightly since we last reported, with its value currently at 63.66%. This value represents a 0.35% difference to the upside when compared to yesterday’s value.

Daily Crypto Market Cap Chart

The cryptocurrency market capitalization increased since we last reported. Its current value is $325.17 billion, which represents an increase of $4.246 billion when compared to the value it had yesterday.

_______________________________________________________________________

What happened in the past 24 hours?

_______________________________________________________________________

_______________________________________________________________________

Technical analysis

_______________________________________________________________________

Bitcoin

The largest cryptocurrency by market capitalization had another slow day, where it tried to pass $11,000 and consolidate above it. However, while it has passed the threshold, BTC hasn’t confirmed its position above it, making the $11,000 mark uncertain. The $10,855 support level is, on the other hand, a strong support that has been confirmed.

BTC traders should look for a trade opportunity when BTC bounces off of $10,855 or falls below it.

BTC/USD 4-hour Chart

Technical factors:

  • Price is currently above its 50-period EMA and its 21-period EMA
  • Price is between its top B.B. and its middle B.B (20-period SMA)
  • RSI is elevated (62.24)
  • Volume increased (descending)

Key levels to the upside          Key levels to the downside

1: $10,855                               1: $10,505

2: $11,090                               2: $10,015

3: $11,630                                3: $9,870

Ethereum

Ethereum spent its day consolidating above the $315 level, finding support at the 21-period moving average. The second-largest cryptocurrency by market cap ensured its position above $302 (at least in the short-term). Its future movement will most likely be determined by Bitcoin’s next move.

Ethereum traders should look for a trade opportunity after the cryptocurrency breaks its consolidation phase.

ETH/USD 4-hour Chart

Technical Factors:

  • Price is above the 50-period EMA and the 21-period EMA
  • Price is under the middle B.B. (20-period SMA)
  • RSI has normalized (56.41)
  • Above-average volume (descending)

Key levels to the upside          Key levels to the downside

1: $340                                    1: $302

2: $362                                    2: $289

                                                 3: $278

Ripple

Unlike Bitcoin and Ethereum, the third-largest cryptocurrency by market cap maintained high volume and tried to make a move that would break its current ranging position. XRP first moved to the upside, trying to break $0.2454, but failed to do so, which triggered a reaction from XRP bears. The cryptocurrency then made an attempt to break $0.235 to the downside but failed in doing that as well, therefore “locking” XRP in a range between the two resistances.

XRP traders can look for an opportunity when the cryptocurrency breaks its ranging moves to either side.

XRP/USD 4-hour Chart

Technical factors:

  • XRP in a mid-term descending trend (though it broke the trend in the short-term)
  • Price above 21-period and the 50-period EMA
  • Price is between the top B.B. and the middle B.B. (20-period SMA)
  • RSI is elevated (65.63)
  • Elevated volume

Key levels to the upside          Key levels to the downside

1: $0.235                                  1: $0.227 

2: $0.245                                  2: $0.214

                                               3: $0.205


Categories
Crypto Market Analysis

Daily Crypto Review, July 29 – BTC consolidating under $11,000; XRP Skyrocketing

The cryptocurrency market mostly traded sideways after major breakthroughs in the past ten days. Bitcoin is currently trading for $10,880, which represents a decrease of 2.76% on the day. Meanwhile, Ethereum lost 3.38% on the day, while XRP gained 2.42%.

 Daily Crypto Sector Heat Map

When talking about top100 cryptocurrencies, Aave gained 20.59% on the day, making it the most prominent daily gainer. iExec RLC (20.52%) and THORChain (19.48%) also did great. On the other hand, Ampleforth has lost 16.44%, making it the most prominent daily loser. It is followed by Digitex Futures’ loss of 12.01% and HedgeTrade’s loss of 11.28%.

Top 10 24-hour Performers (Click to enlarge)

Bottom 10 24-hour Performers (Click to enlarge)

Bitcoin’s dominance level decreased since we last reported, with its value currently at 63.31%. This value represents a 1.02% difference to the downside when compared to yesterday’s value.

Daily Crypto Market Cap Chart

The cryptocurrency market capitalization skyrocketed and now confirmed its position above the $300 billion mark. Its current value is $320.93 billion, which represents a decrease of $0.06 billion when compared to the value it had yesterday.

_______________________________________________________________________

What happened in the past 24 hours?

_______________________________________________________________________

_______________________________________________________________________

Technical analysis

_______________________________________________________________________

Bitcoin

The largest cryptocurrency by market capitalization had a rather slow day, unlike the past days, which passed in BTC making significant gains. The volume is slowly fading away while the price is trying to find resistance. Bitcoin fell under $11,000 and is currently consolidating above the $10,855 support level. However, it is still unsure if Bitcoin will stay above it or fall under.

BTC traders should look for a trade opportunity when BTC breaks $10,855 to the downside or $11,090 to the upside.

BTC/USD 4-hour Chart

Technical factors:

  • Price is currently above its 50-period EMA and its 21-period EMA
  • Price is between its top B.B. and its middle B.B (20-period SMA)
  • RSI is elevated (69.73
  • Volume greatly increased (descending)

Key levels to the upside          Key levels to the downside

1: $10,855                               1: $10,505

2: $11,090                               2: $10,015

3: $11,630                                3: $9,870

Ethereum

Ethereum also had a slow day, while its price drop reflected Bitcoin’s drop (percentage-wise). The second-largest cryptocurrency by market capitalization is trying to consolidate around the $315 mark, while its volume is fading. Ethereum has strong support at $302, which might get challenged shortly.

Ethereum traders should look for a trade opportunity after the cryptocurrency is done with consolidating.

ETH/USD 4-hour Chart

Technical Factors:

  • Price is above the 50-period EMA and the 21-period EMA
  • Price is at the middle B.B. (20-period SMA)
  • RSI is elevated (58.66)
  • Extremely high volume (descending)

Key levels to the upside          Key levels to the downside

1: $340                                    1: $302

2: $362                                    2: $289

                                                 3: $278

Ripple

Unlike Bitcoin and Ethereum, the third-largest cryptocurrency by market cap had quite a good day, which brought its price above $0.227 and $0.235 resistance levels. XRP made a move, which was sparked by an influx of buyers. The move is still not over, and XRP is fighting to stay above $0.235, though that is unlikely unless the cryptocurrency pushes its price towards the $0.245 level.

XRP traders can look for an opportunity in pullbacks after the bullish move.

XRP/USD 4-hour Chart

Technical factors:

  • XRP in a mid-term descending trend (though it broke the trend in the short-term)
  • Price above 21-period and the 50-period EMA
  • Price is above the top B.B.
  • RSI is in the overbought territory (73.69)
  • Elevated volume

Key levels to the upside          Key levels to the downside

1: $0.235                                  1: $0.227 

2: $0.245                                  2: $0.214

                                               3: $0.205