The blockchain market is estimated to exceed $39.7 billion by 2025, thanks to a growing need for smooth supplier management and simplified business operations. Blockchain promises secure data and easier recording of the transaction value.
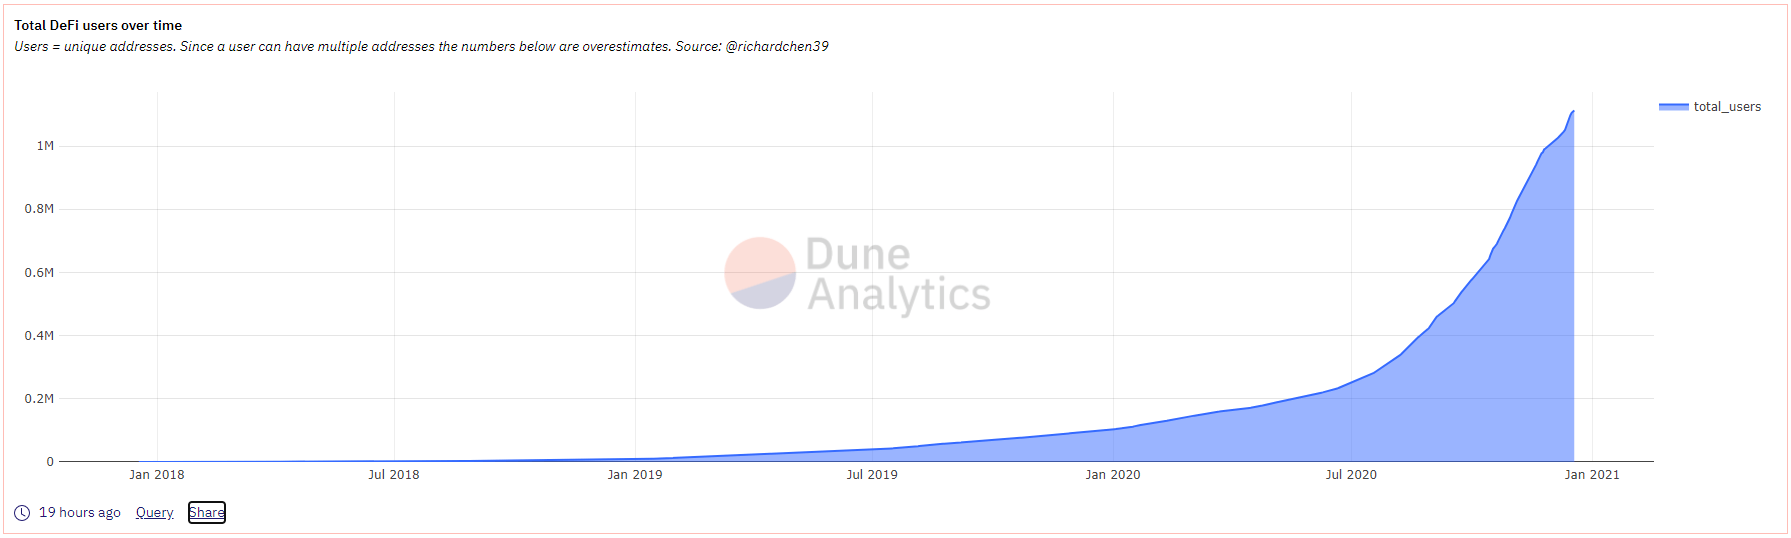
Since its introduction in 2009, blockchain has been a revelation for businesses looking to use technology to transform their current business model for more reliability, security, and transparency. Similar to 2020, blockchain technology is transitioning from the experimental stage to real business-ready solutions.
The adoption rate across different markets is expected to rise, and this presents a business opportunity. If you are looking to make your mark through blockchain technologies, then the following ideas will come in handy.
Blockchain Digital Identity
Contemporary businesses often collect a lot of personal information, creating new business risks. Investments in powerful data vaults are not viable in the long run, as the tight-lipped systems can affect the drive for true customer understanding and product development.
By 2025, the number of interconnected devices is estimated to rise to 22 billion. The majority of IoT technologies do not incorporate critical access and identity controls. There are already some major IT vendors providing IoT management systems to bridge the gap, but they often fall short.
The mismatching standards and hundreds of traditional servers make it complicated to implement management capabilities across devices. Blockchain promises practical solutions for interconnected devices.
The Distributed Ledger technology based on blockchain will ensure secure data storage in a tamper-proof, unified, and interoperable infrastructure. The benefit is a smooth and straightforward identification for employees and clients in some of the most sensitive industries.
Blockchain digital identity is expected to improve manageability and control of personally identifiable information. So far, IBM and Accenture are some of the companies throwing their hat into the ring and already making significant progress with the blockchain digital identity project.
Healthcare Medical Records Management
There are claims that blockchain technology can save billions in support function costs, staff costs, data breach, and IT-related costs in the healthcare industry.
A decentralized and secure blockchain-powered platform can support the storage and exchange of personal medical data. Hospital staff can then easily use the technology to update medical records.
One of the industry pioneers is Medicalchain, and they are already making significant progress, having signed a cooperation agreement with Mayo clinic. But still, the healthcare industry is largely uncharted territory, especially in the management of medical records, and therefore a great blockchain project idea for 2021.
Stock Market Application
The stock market has transformed many people’s lives and is an essential foundation for a country’s economy. It has its shortcomings, and the application of blockchain technology can significantly enhance its efficiency.
One area that blockchain can transform tremendously is the settlement process that every trade has to go through, which takes several days. The delays come from exchanges, clearinghouses, and regulatory processes.
A blockchain system can potentially reduce the settlement process time to only a few minutes. The system is more efficient, and stock market trading will become more efficient with the advantage of decreasing errors.
A blockchain-based stock market application has the following advantages:
- Easy to use
- Enhanced transparency and fairness
- Improved interoperability to increase trust
- The clearing and settlement process becomes quick and easy
- Risk containment mechanism
Logistics and Transport
Most of the logistics and supply chain systems are ineffective and outdated. Getting rid of intermediaries and improving transparency and efficiency in logistics can save companies millions of dollars.
Typically, a decentralized supply chain system that leverages blockchain technology and the Internet of Things (IoT) can improve transactions’ reliability and automate product traceability. Authentication for the transactions can be through blockchain to minimize errors and replace ineffective manual practices. The blockchain-enabled controls will reduce the chances of introducing counterfeit products into the supply chain, thereby ensuring integrity.
In transport, the blockchain technologies are scalable, immediate, easy to authenticate and track. With the blockchain’s help, businesses can easily track their truck components on a digital ledger for efficiency and reduced costs. The decentralized public ledger will record all adjustments in real-time and reduce clerical errors.
The following factors are some of the things that make this an exciting blockchain project idea for 2021:
- Reduced transport costs
- Easy documentation and coordination
- Improved security and authentication
- Quick and easy approval and clearance
Although companies such as Chronicled have already started the project in 2020, there is still much to do in logistics and supply chain management for 2021.
Decentralized Apps
Basing a business on Bitcoin (BTC) is not the wisest decision, as the system is vulnerable to high fees and instability. Currently, the BTC developers do not have a clear roadmap, which can sometimes affect the business model in the future.
Decentralized applications (dApps) are based on blockchain and outside the control of a single entity. A standard web application such as Facebook runs on a computer system, where a single organization controls its backend.
Building Dapps on Tezos and other smart contract platforms is a sensible thing to do to ensure business continuity. Beyond the control of a single entity, the decentralized environment is more transparent, secure, stable, and easier to use. The built-in medium of exchange in Dapps will potentially boost the adoption of cryptocurrencies.
As a result, many observers predict that Dapps will have an extensive global impact.
Dapps are a viable project idea that you can sell to the numerous organizations and startups using bitcoin core and who seek stability for the future.
Blockchain Consultancy
No doubt, the blockchain market is growing exponentially, and the need for a consultant increases by the day. In the following few years, more and more businesses will be lining up to leverage blockchain technology to stay relevant in the market.
What makes it an excellent project idea for 2021 is the increasing number of businesses and individuals willing to listen to your blockchain project proposals. Unlike in the past, decision-makers in the business sector already know the benefits of blockchain and will be ready to hear how to make blockchain work for them.
There are various areas to specialize in as a blockchain consultant. For example, you can help strategize and develop a cryptocurrency community, airdrops, and logistics. Even though the industry is in its infancy, many businesses and people need help to leverage technology and ensure sustainability on-the-market.
Voting Apps
The voting process, especially in developing countries, is usually a source of conflict that mostly erodes some of the gains made between the voting periods. The problem is generally tampering with the voting process and privacy.
Blockchain-based voting applications can streamline the voting process, protect critical data, reduce fraud, and enhance accountability. It can eliminate weaknesses that some proponents bank on to delegitimize the entire process while also maintaining the security of government and citizen’s data.
Some of the benefits of a voting app blockchain project include:
- Improved security and safety
- Streamlined processes
- Reduced redundancies
- Improved integrity of the data
- Cost reduction
- Efficient process
Cryptocurrency Oracle
First conceived in the 1990s by researcher Nick Szabo, smart contracts have taken off with the advent of blockchain technology. The use of software and protocols to enforce an agreement’s performance or negotiation eliminates the need for laws or third parties. However, smart contracts are not sufficient on their own. Smart contracts need translator software to understand the terms, and that is where a cryptocurrency oracle comes in.
An oracle is a translator that provides critical data to trigger smart contracts after the original terms are met. The demand for the middleware software models is growing as businesses and governments implement blockchain platforms.
Apart from smart contracts, the other blockchain areas where oracle can prove useful include financial derivatives and betting. However, this is a very demanding project where you need to be a blockchain programming guru.
Personal Finance Management
More than ever, people are focused on their finances and are taking action to ensure financial stability. A personal finance application has the potential to give businesses a fair amount of traction in an increasingly competitive market.
A blockchain-based app can easily categorize income and expenses in real-time and help manage finances. Such a system can easily connect with financial institutions to automatically update data and activate notifications.
What makes it a viable project idea for 2021 is its potential to help individuals take charge of their finances. Transparency, decreased error, traceability, and reconciliation are always welcome features in such a finance app. The added advantage of security and safety will significantly improve its standing.
Final Thoughts
Like any other nascent technology, the early years of blockchain were characterized by growth spurts and evolving personality, much like a child that entered puberty. Blockchain , which just turned 11 a few weeks ago, is already exceeding expectations, which is more than you can expect from a technology still in its youth. The technology is now mature, and enterprise-ready solutions are hitting the market.
For the technically savvy, blockchain presents a golden opportunity for such projects as blockchain consultancy, stock market application, and decentralized apps. You can be part of the blockchain pioneers that create solutions with the capability to disrupt entire industries in 2021.


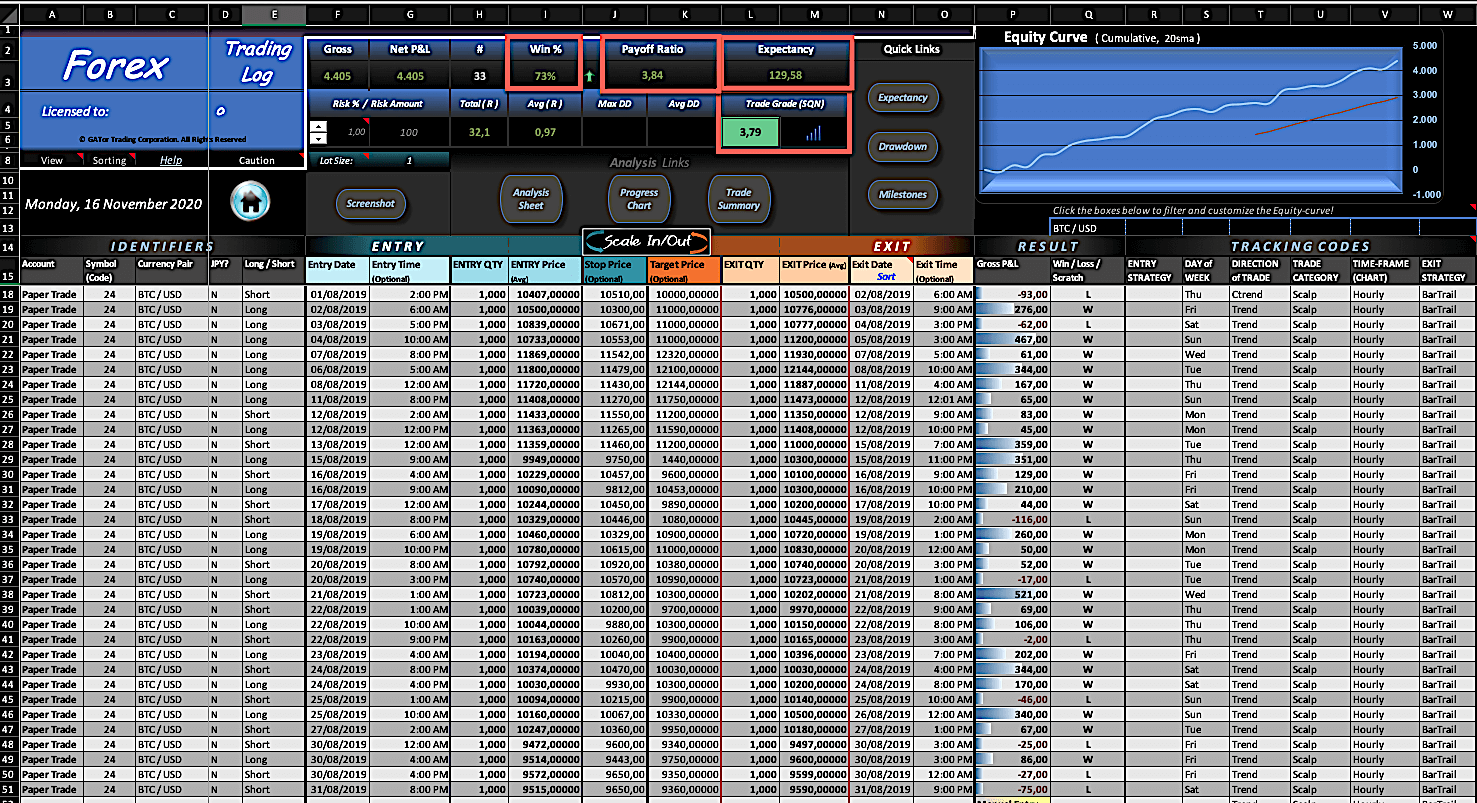
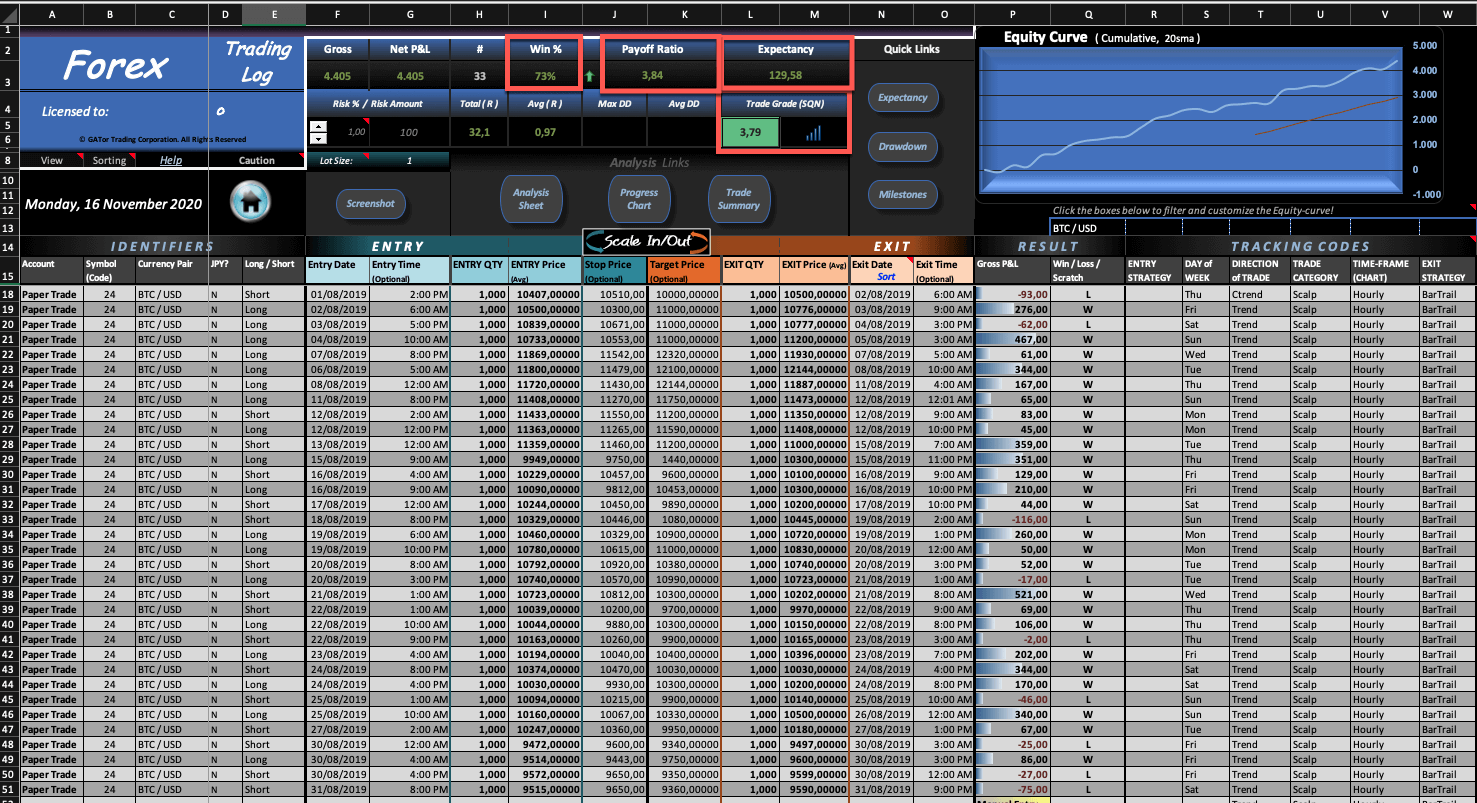
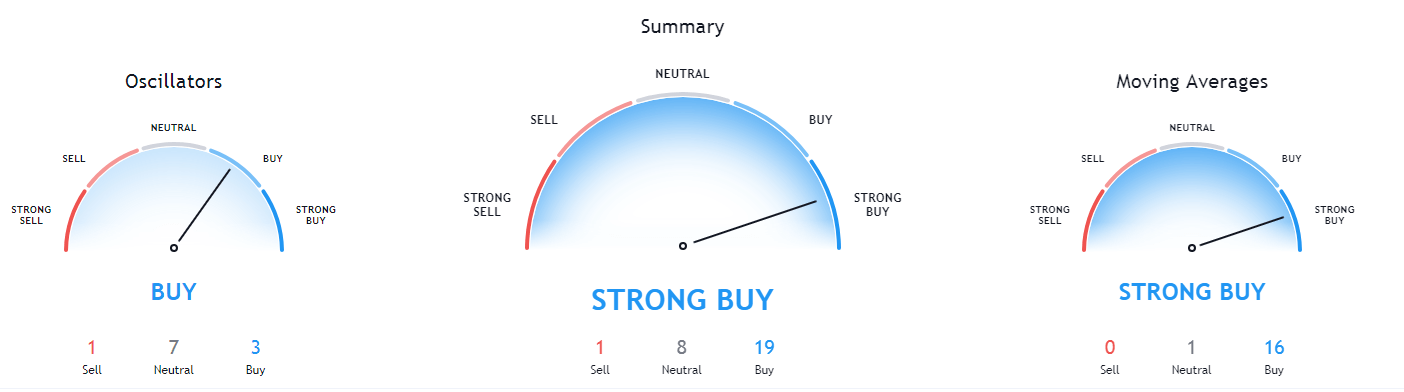
 As said in our previous video, financial markets are unbounded territories where each trader needs to set his own rules; otherwise, they will be influenced by his emotions and fail. A trading system is their set of rules that enable them a long-term success.
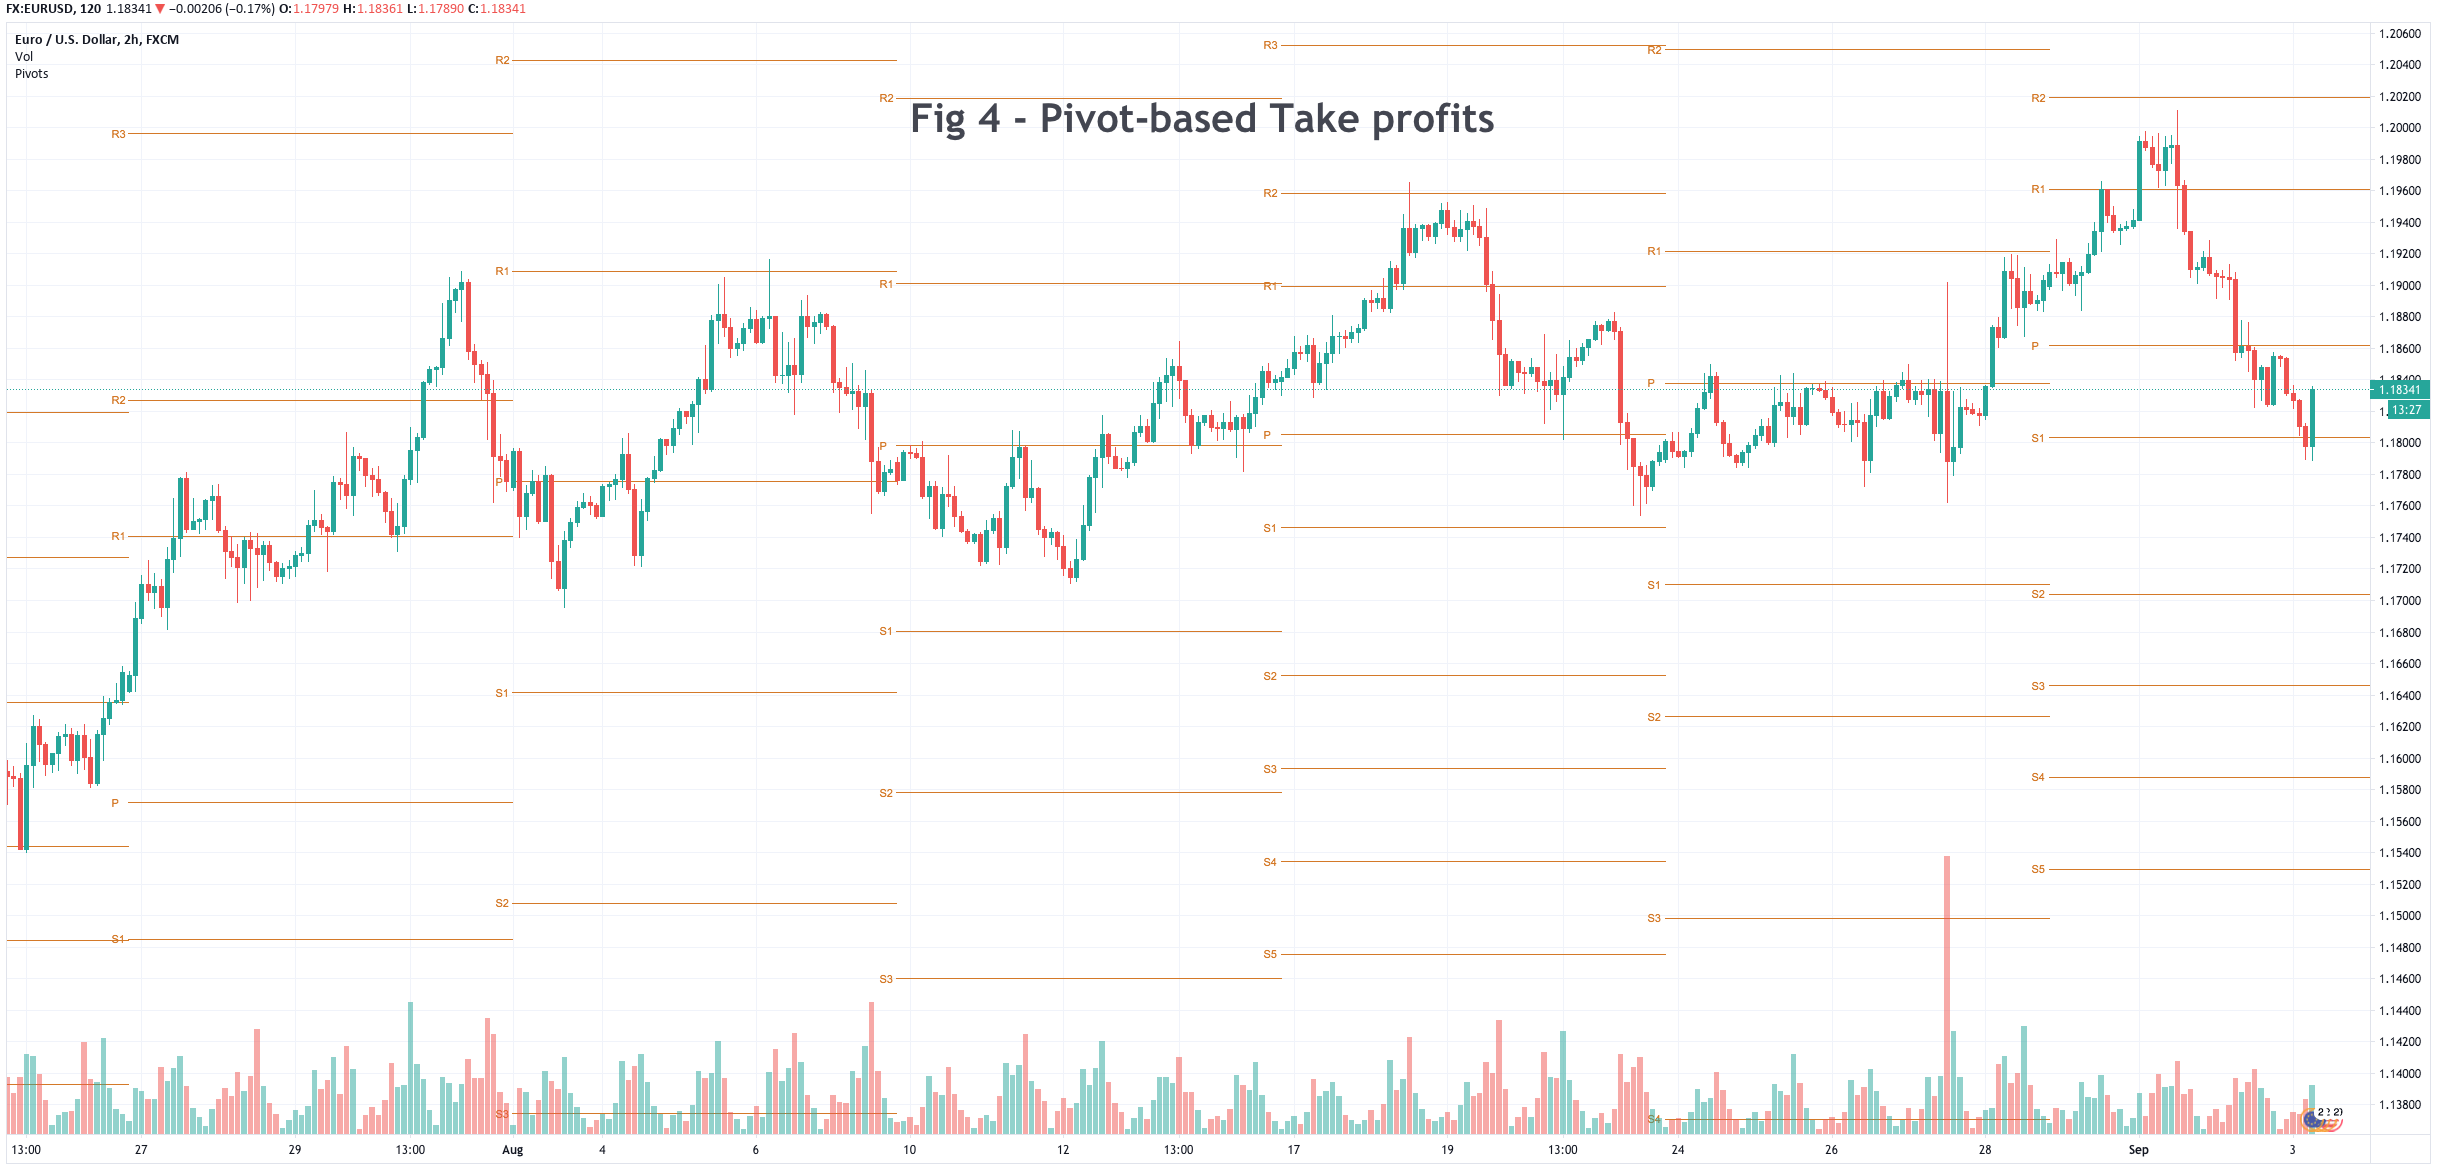
 The chosen timeframe should match the availability to trade. A trader with a day job would need to select a daily or a 12-hour timeframe, whereas a full-time trader could use shorter frames, such as 15-min, one, two, or four-hour timeframes.
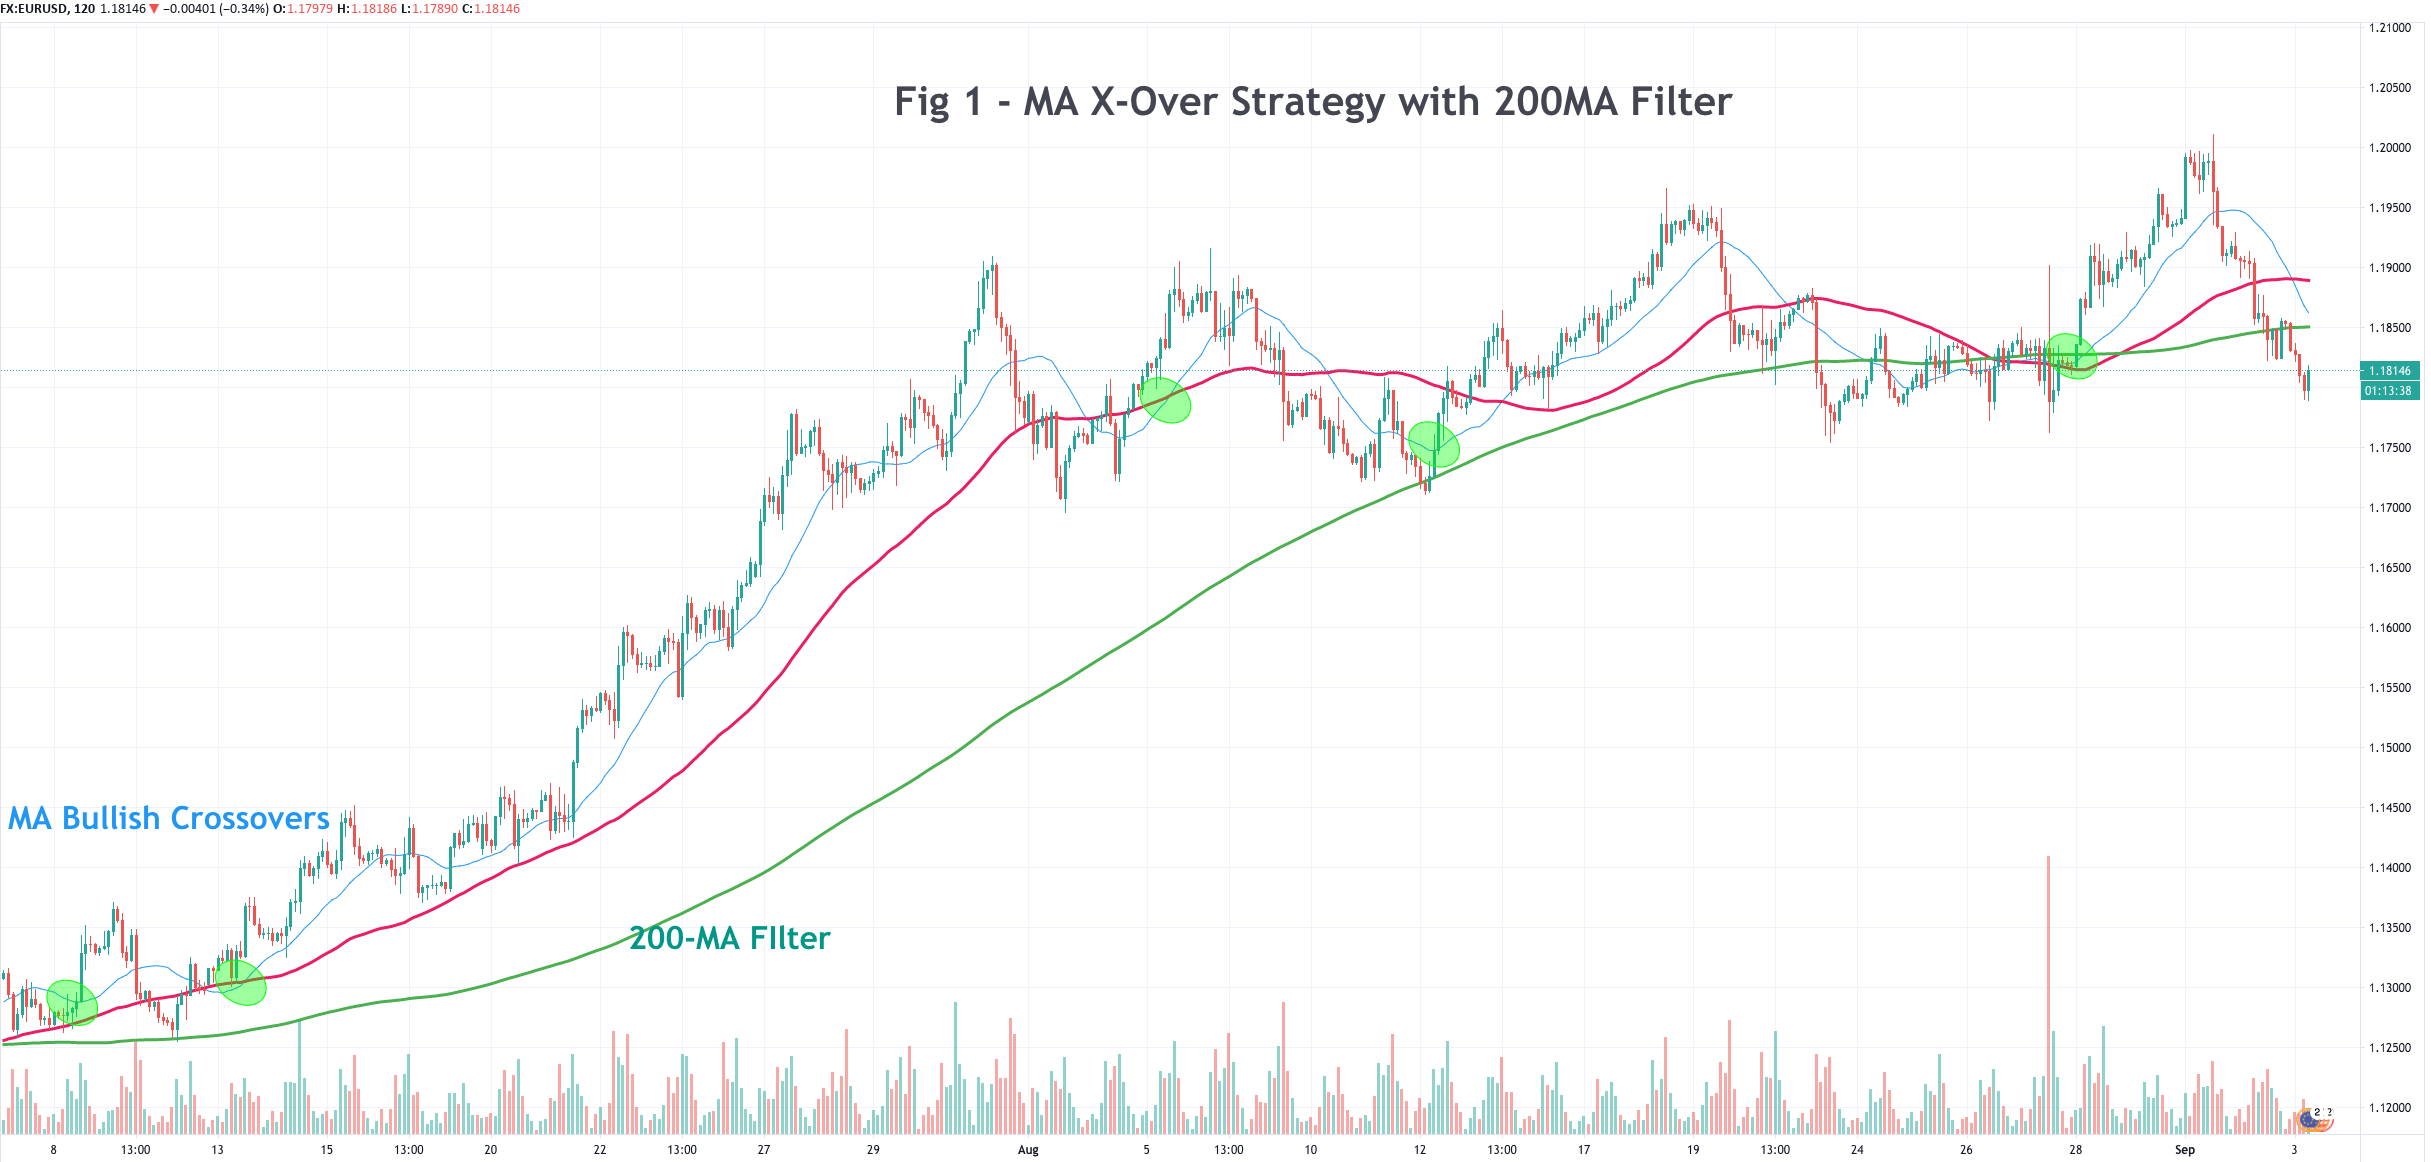
 A permisioning filter is a way to avoid trading under determined circumstances. It can be a filter that allows only trading in the direction of the primary trend or an overbought/oversold sign that should be on for a determined candlestick or pattern formation to be valid.

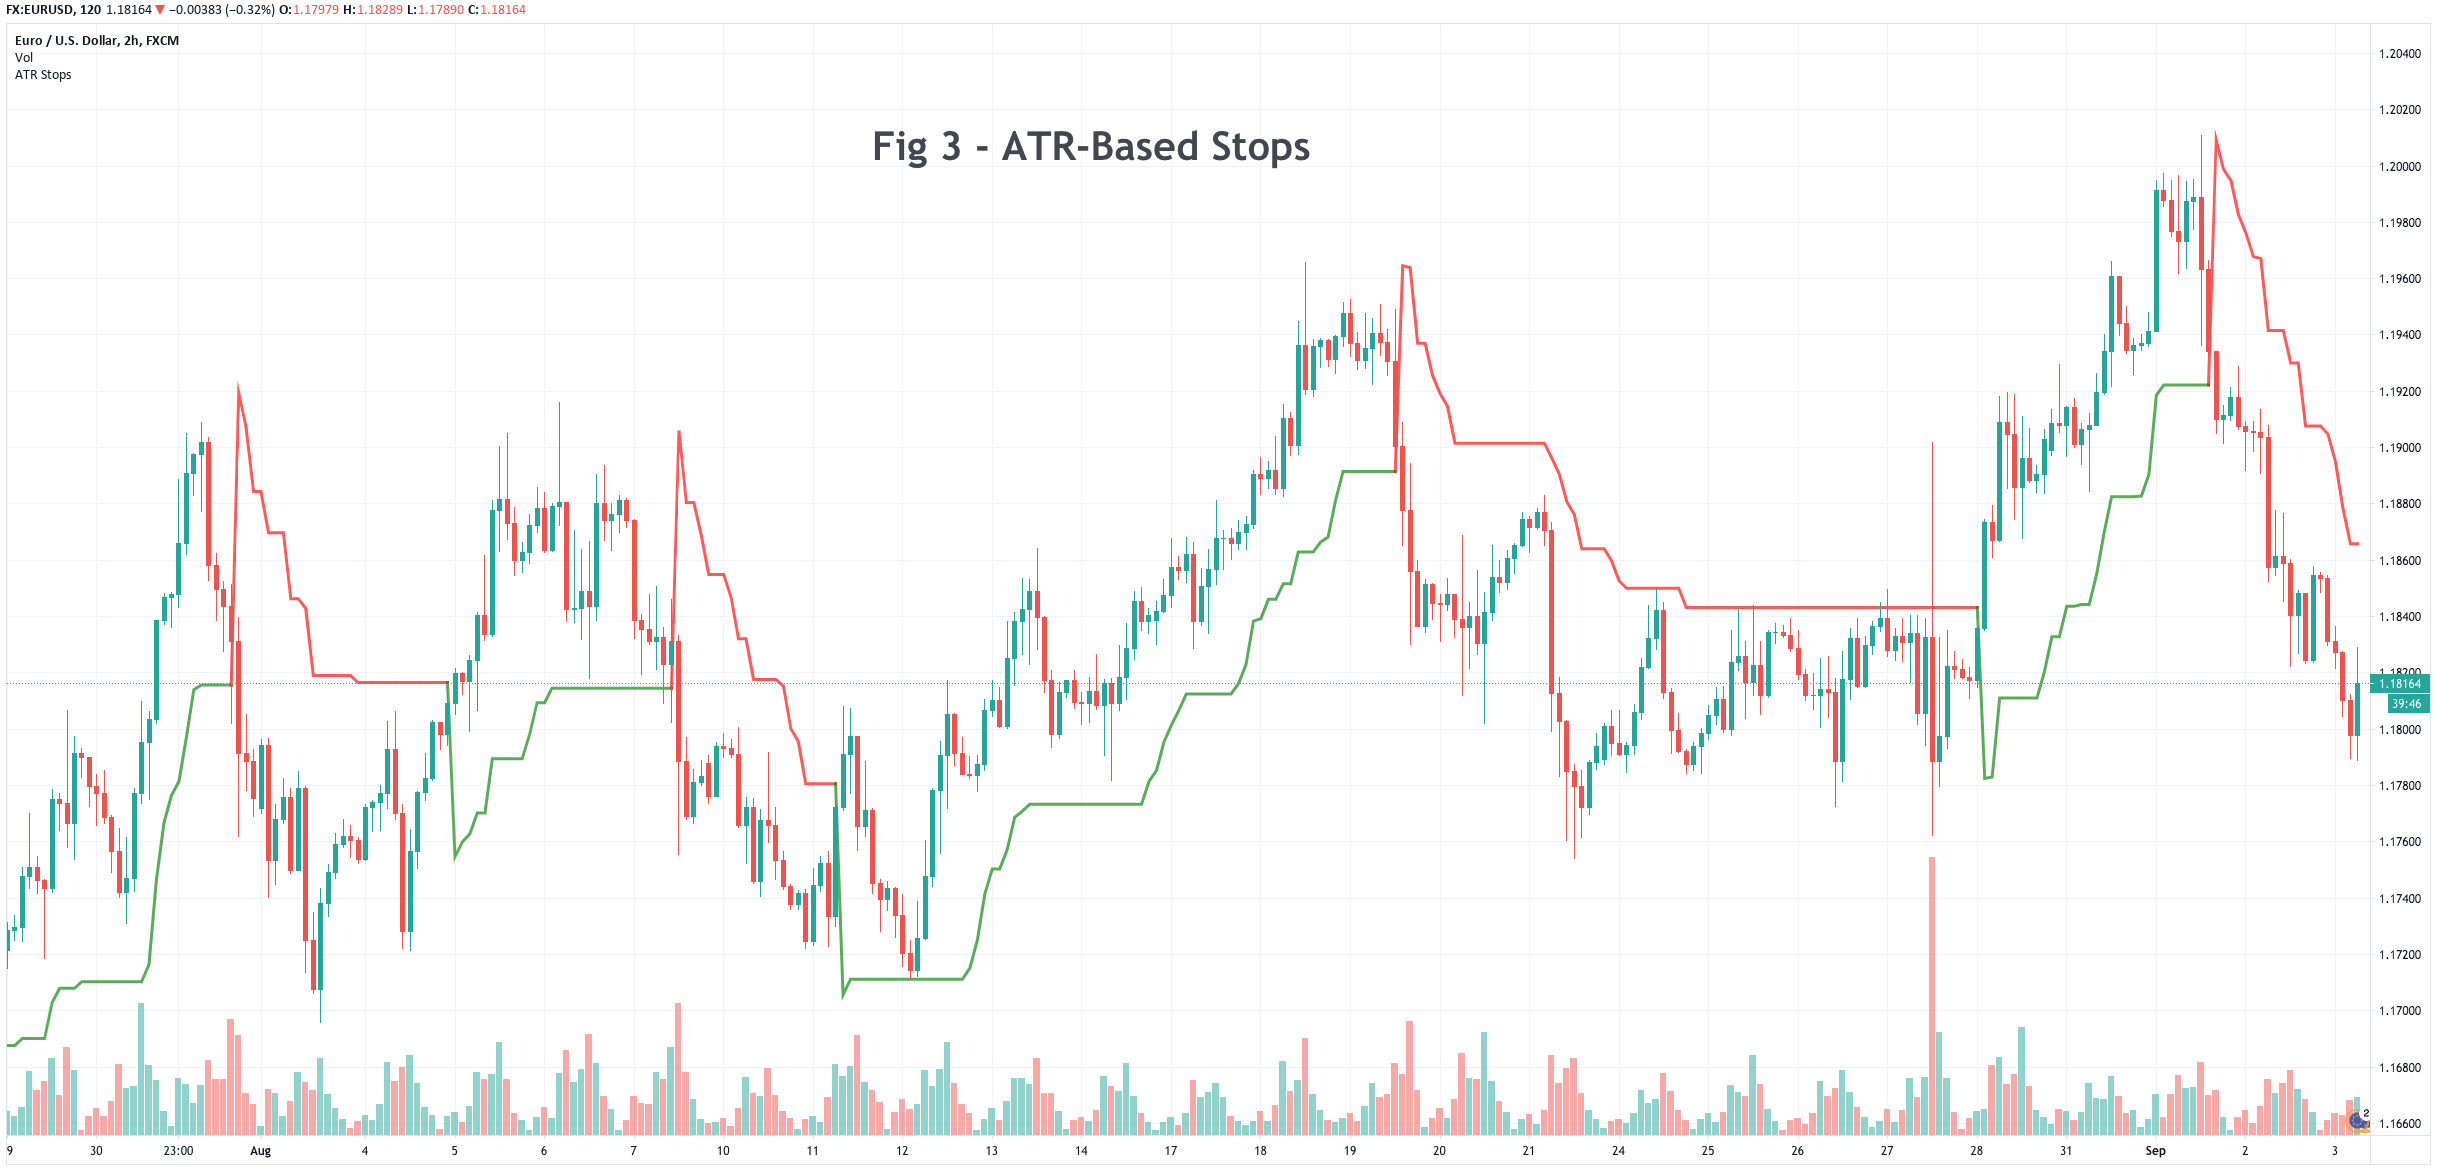
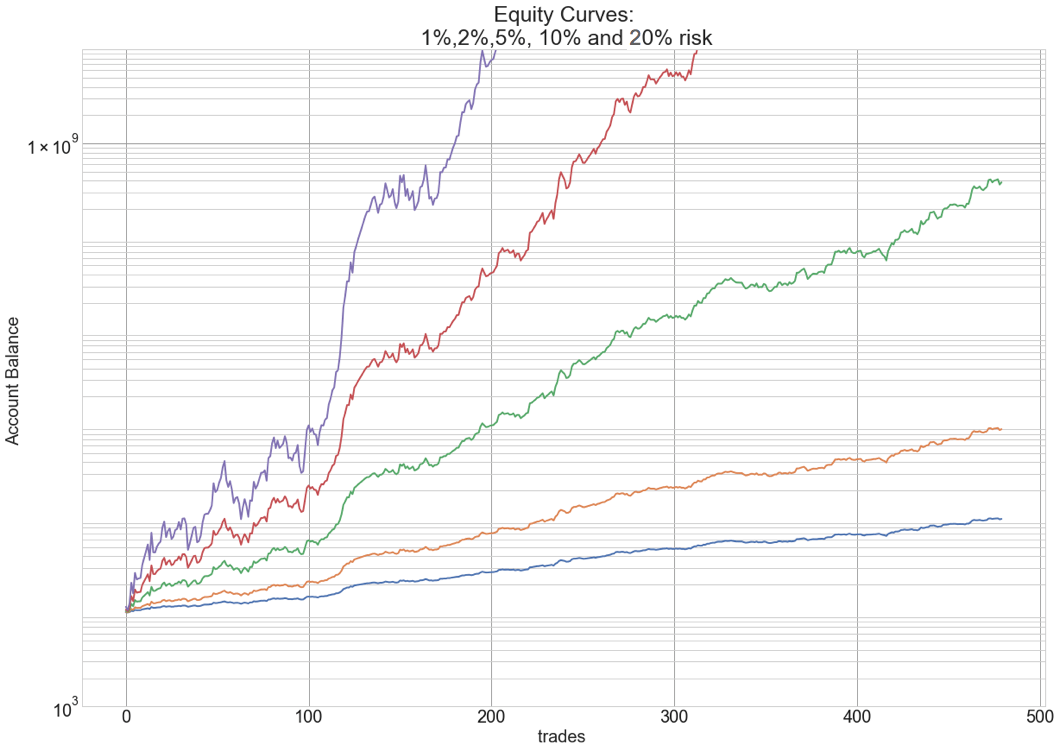
 Position sizing is the part of your plan that tells you how much risk you should take on a trade. We have had a