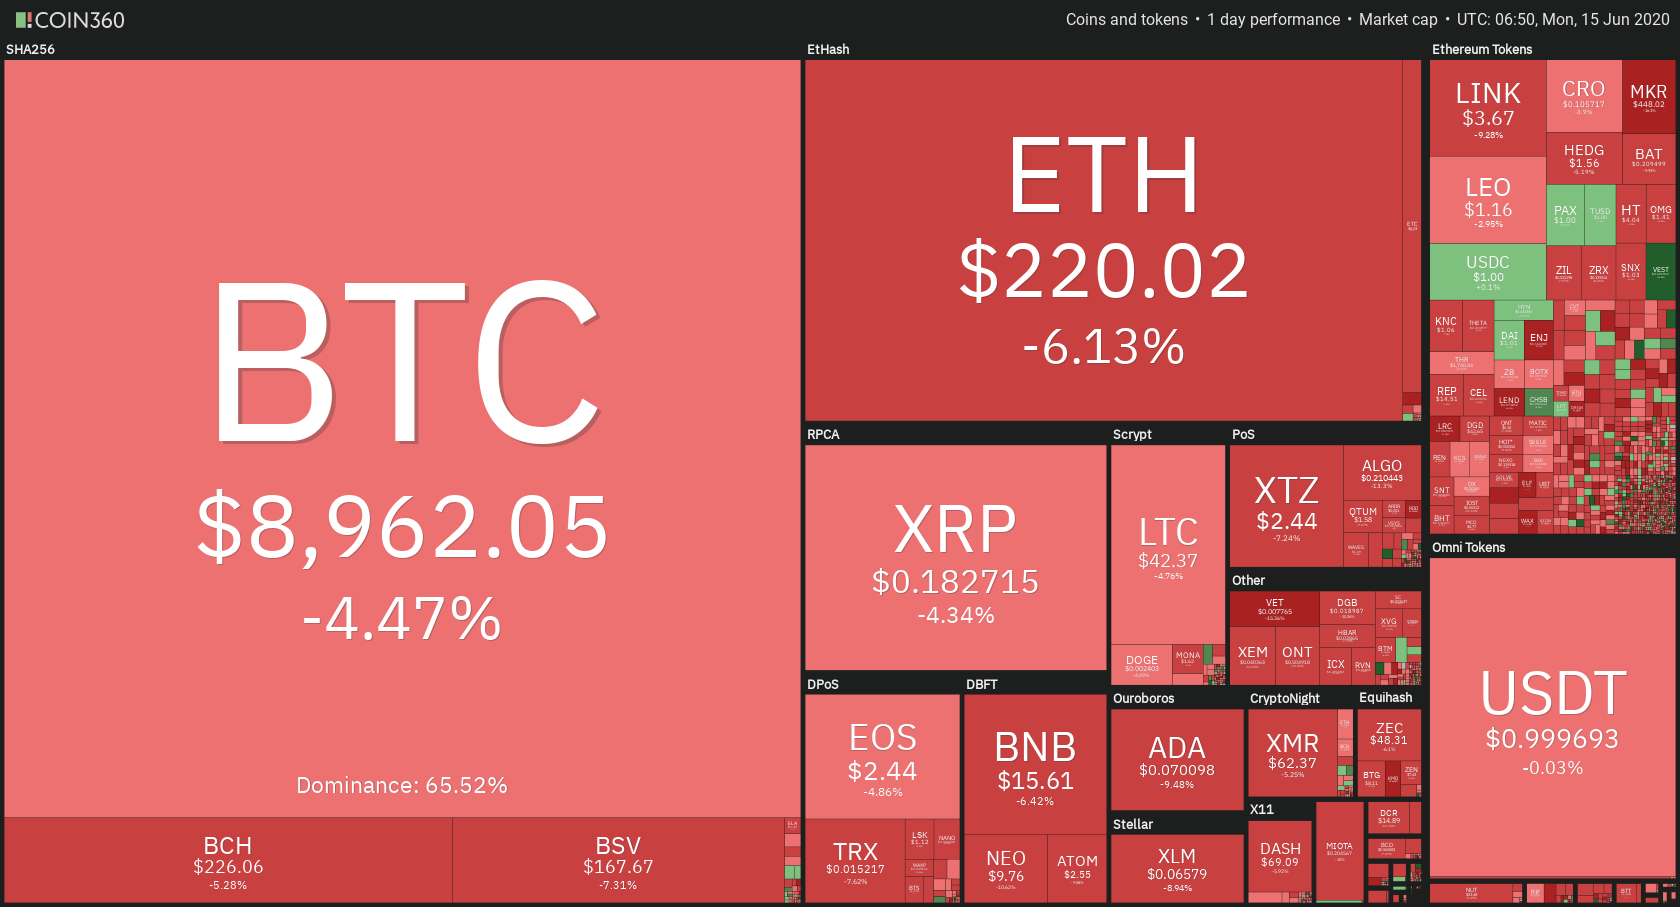
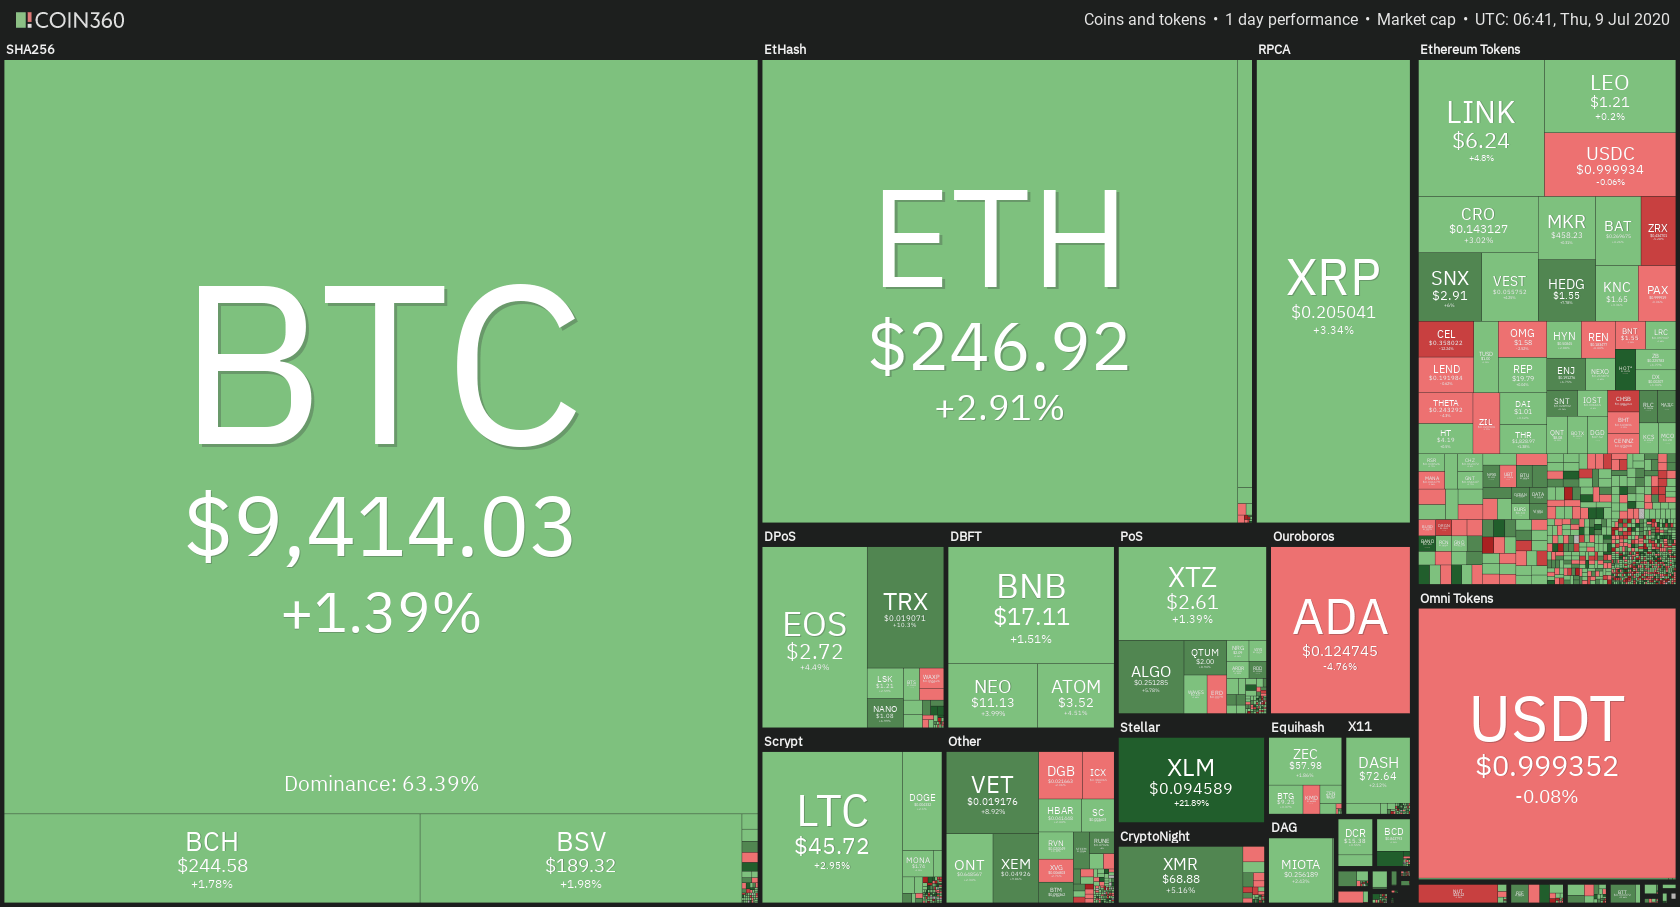
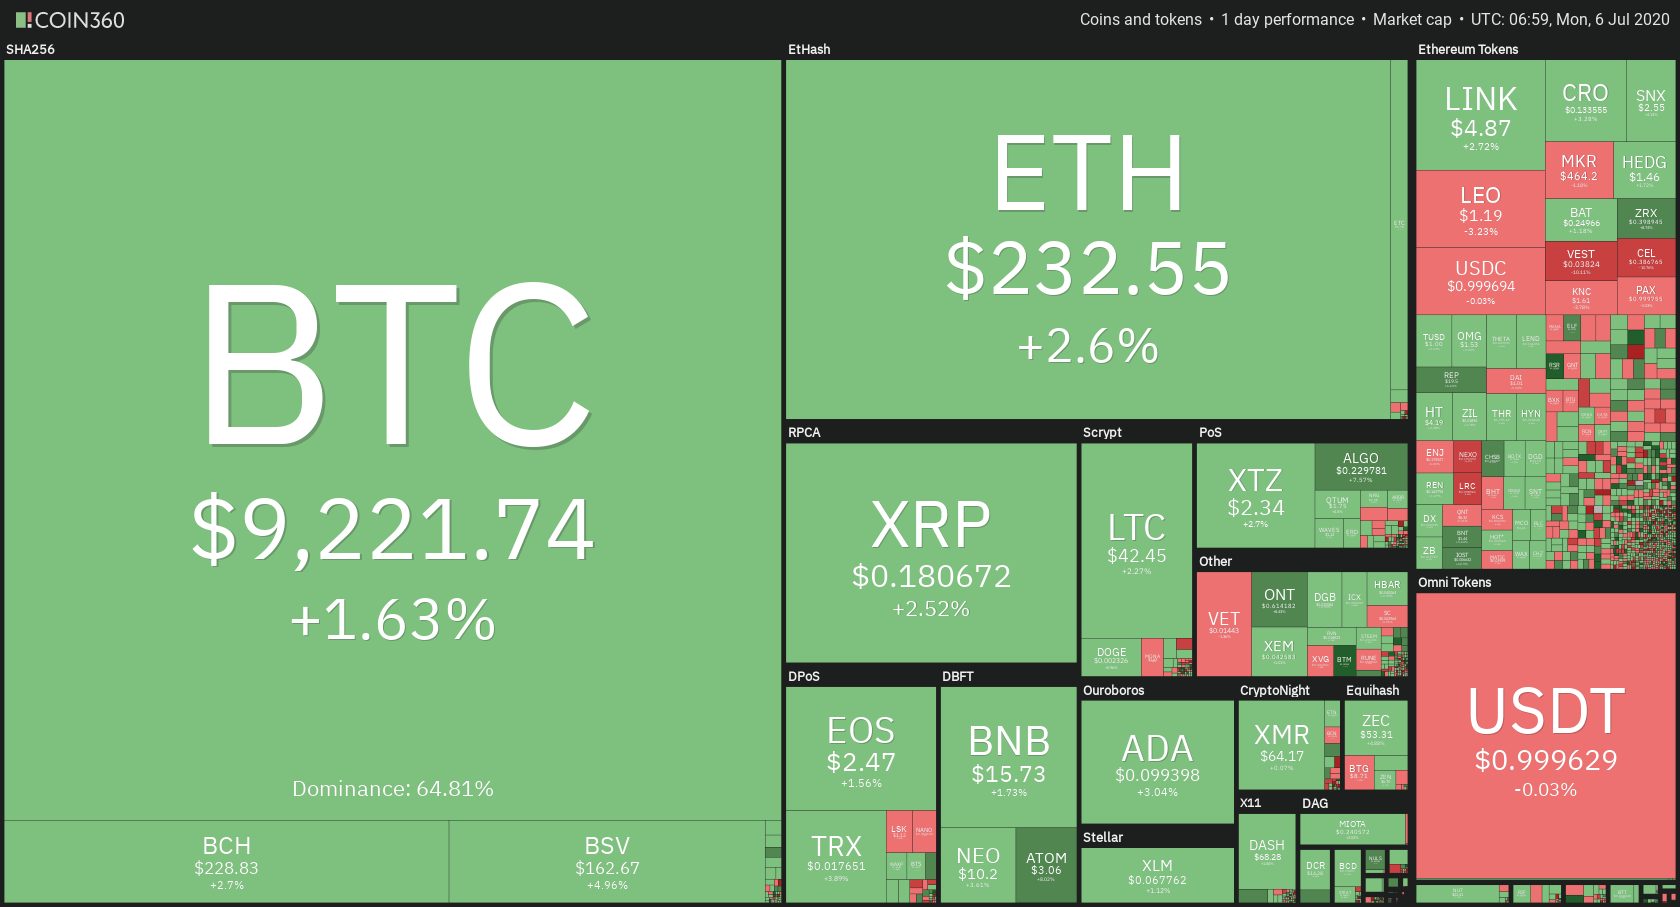
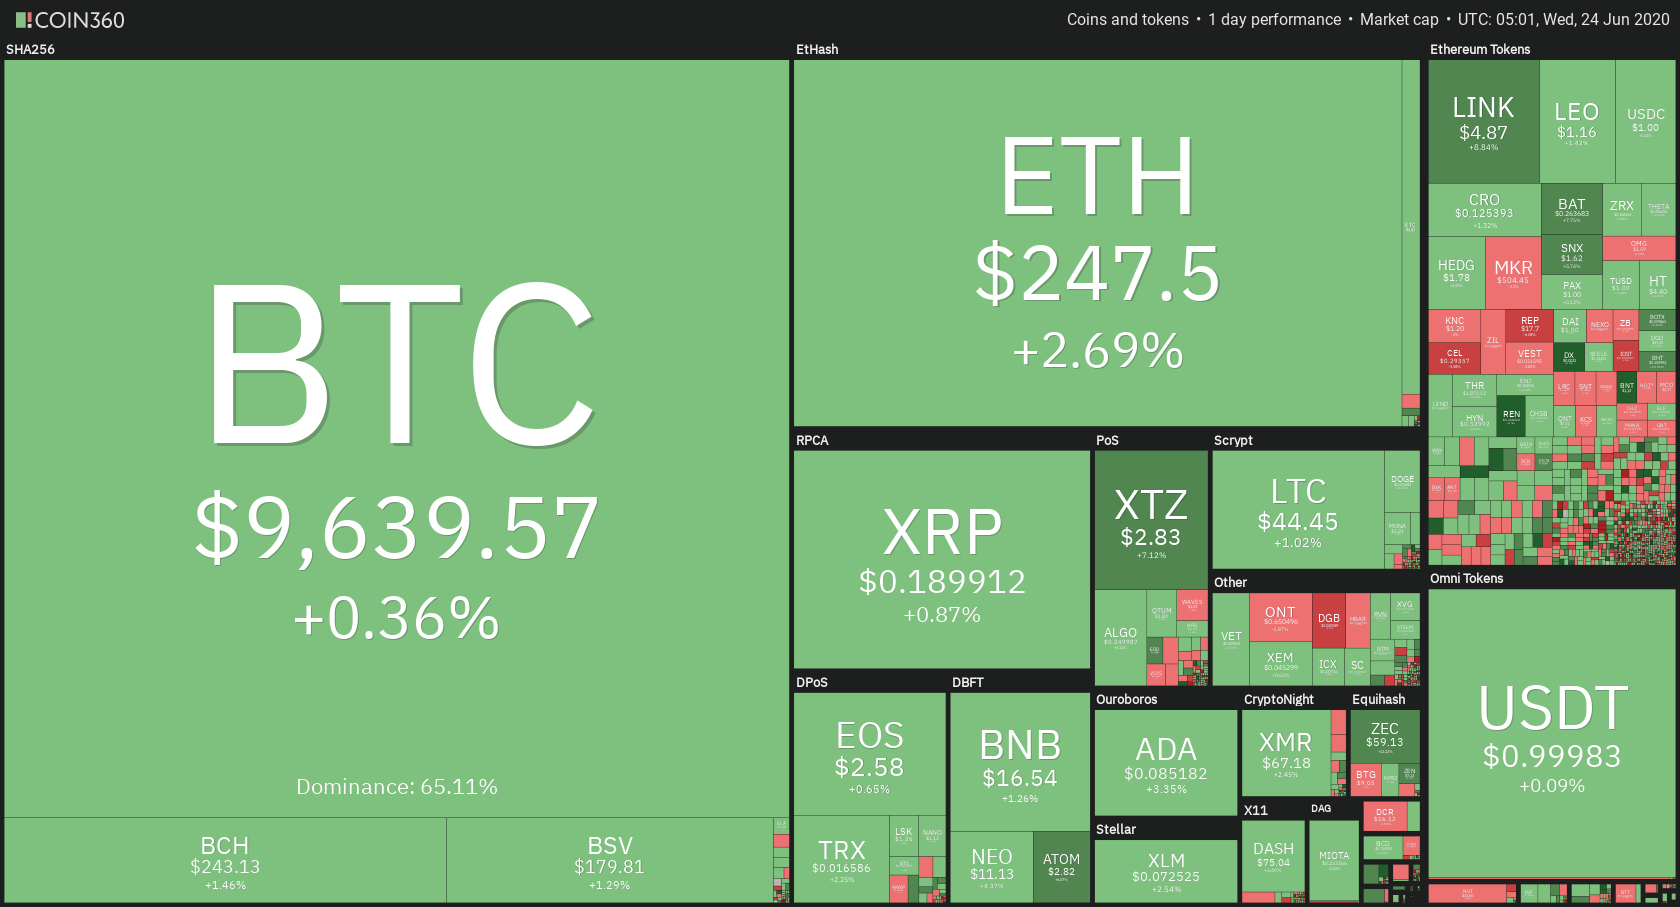
The cryptocurrency market was mostly in the red in the past 24 hours, with Bitcoin currently trading for $9,169, which represents a decrease of 2.62% on the day. Meanwhile, Ethereum lost 3.73% on the day, while XRP lost 4.45%.
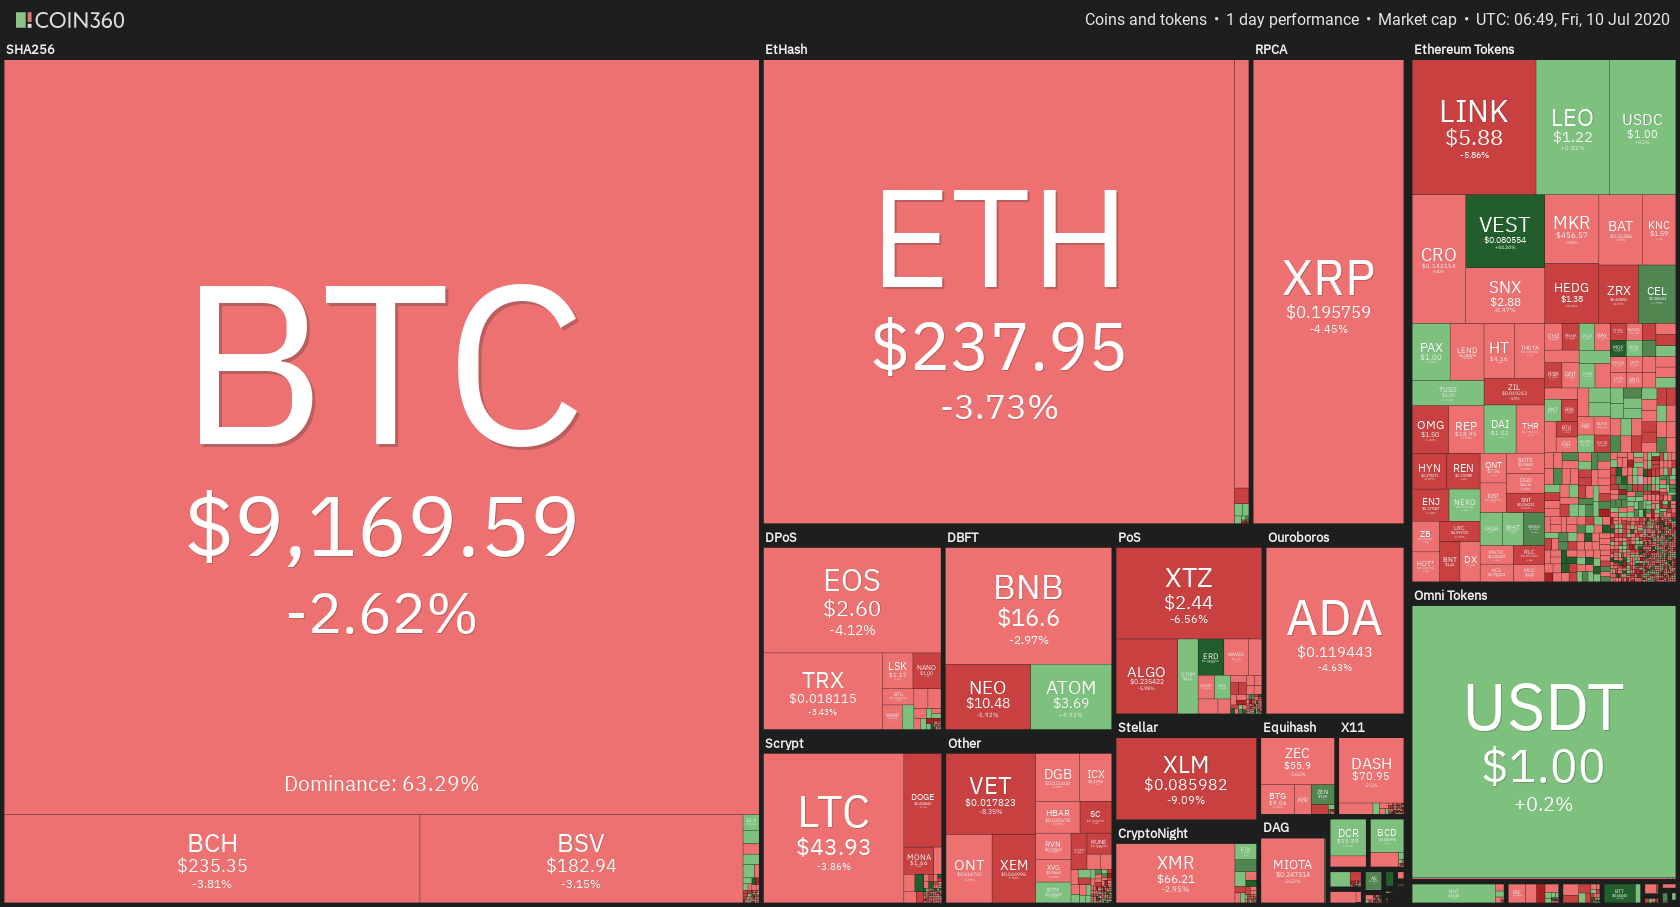
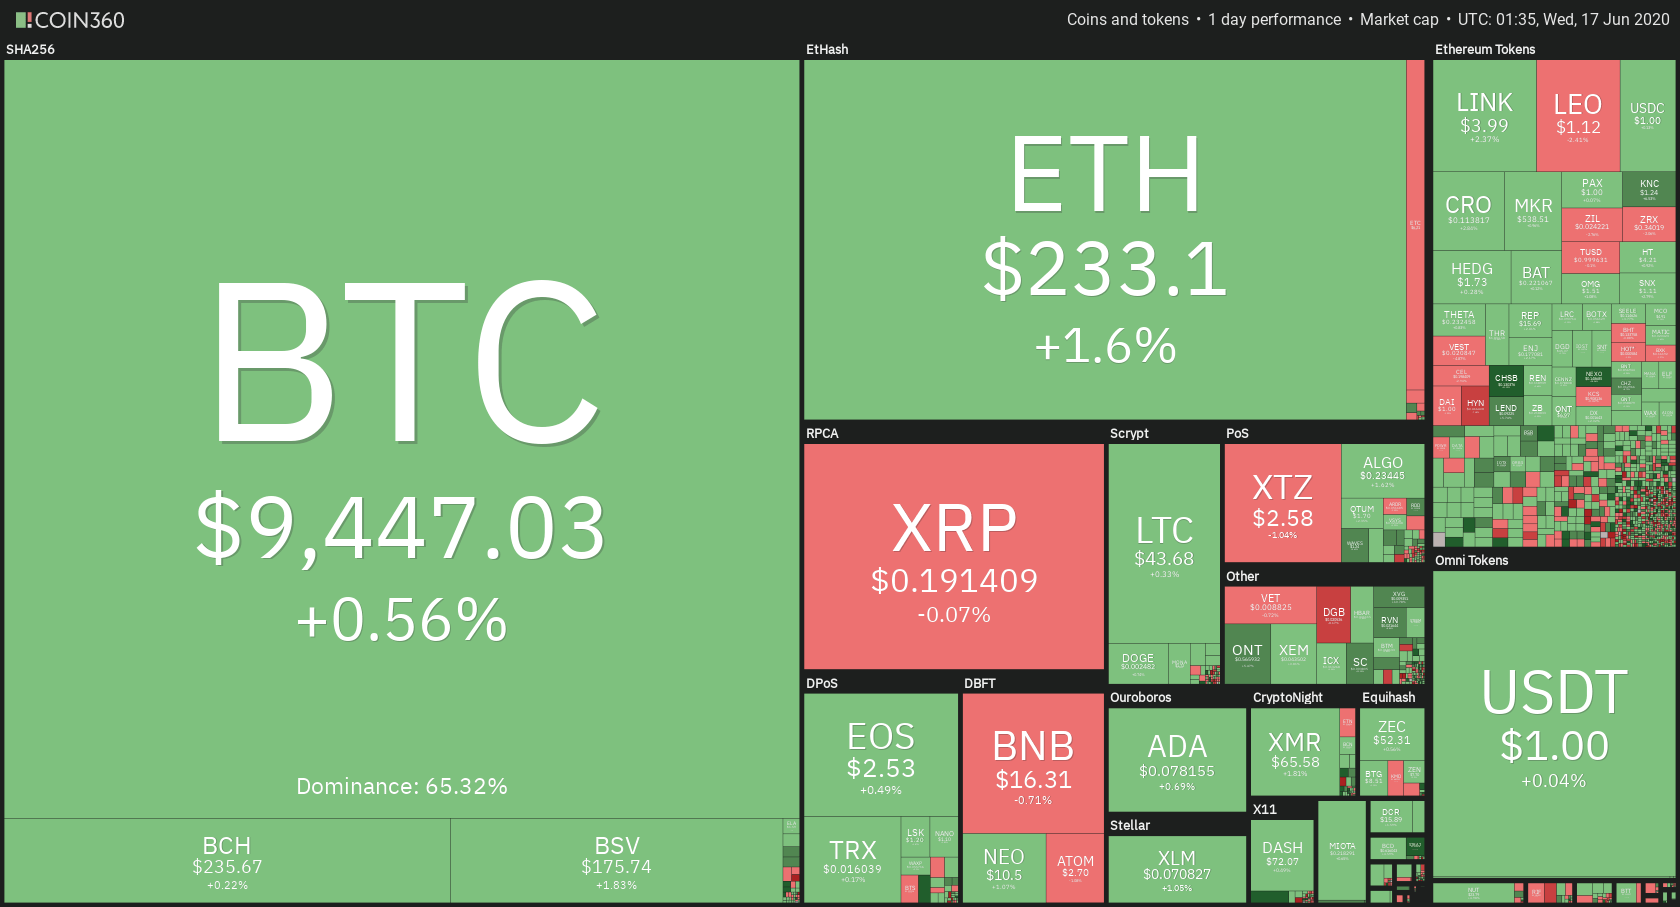
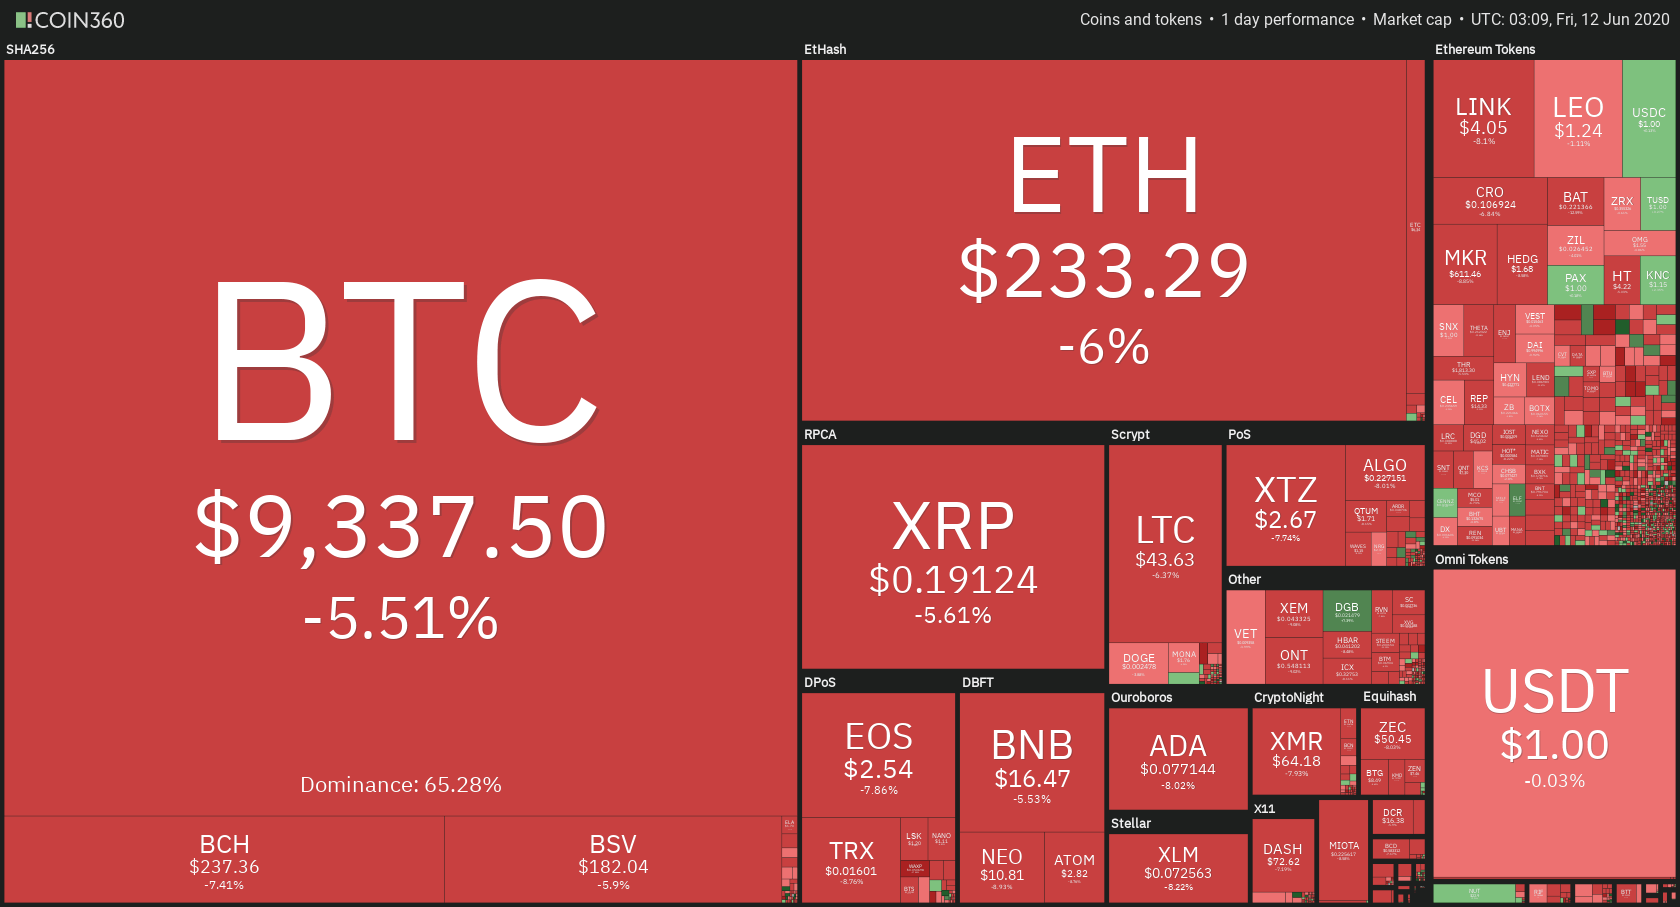
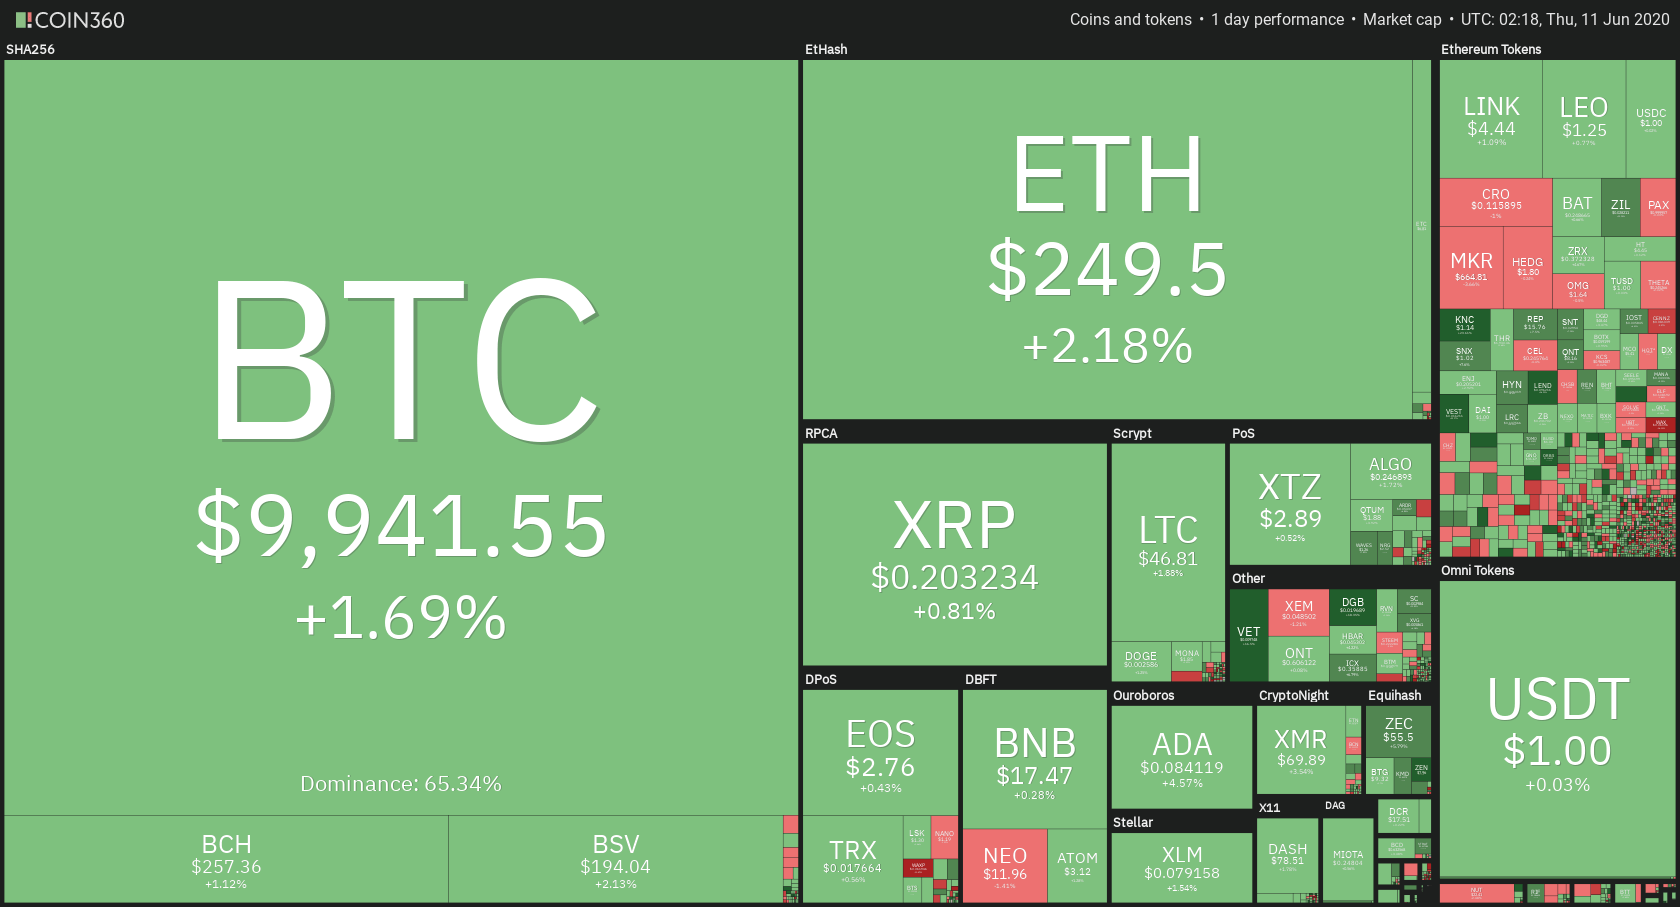
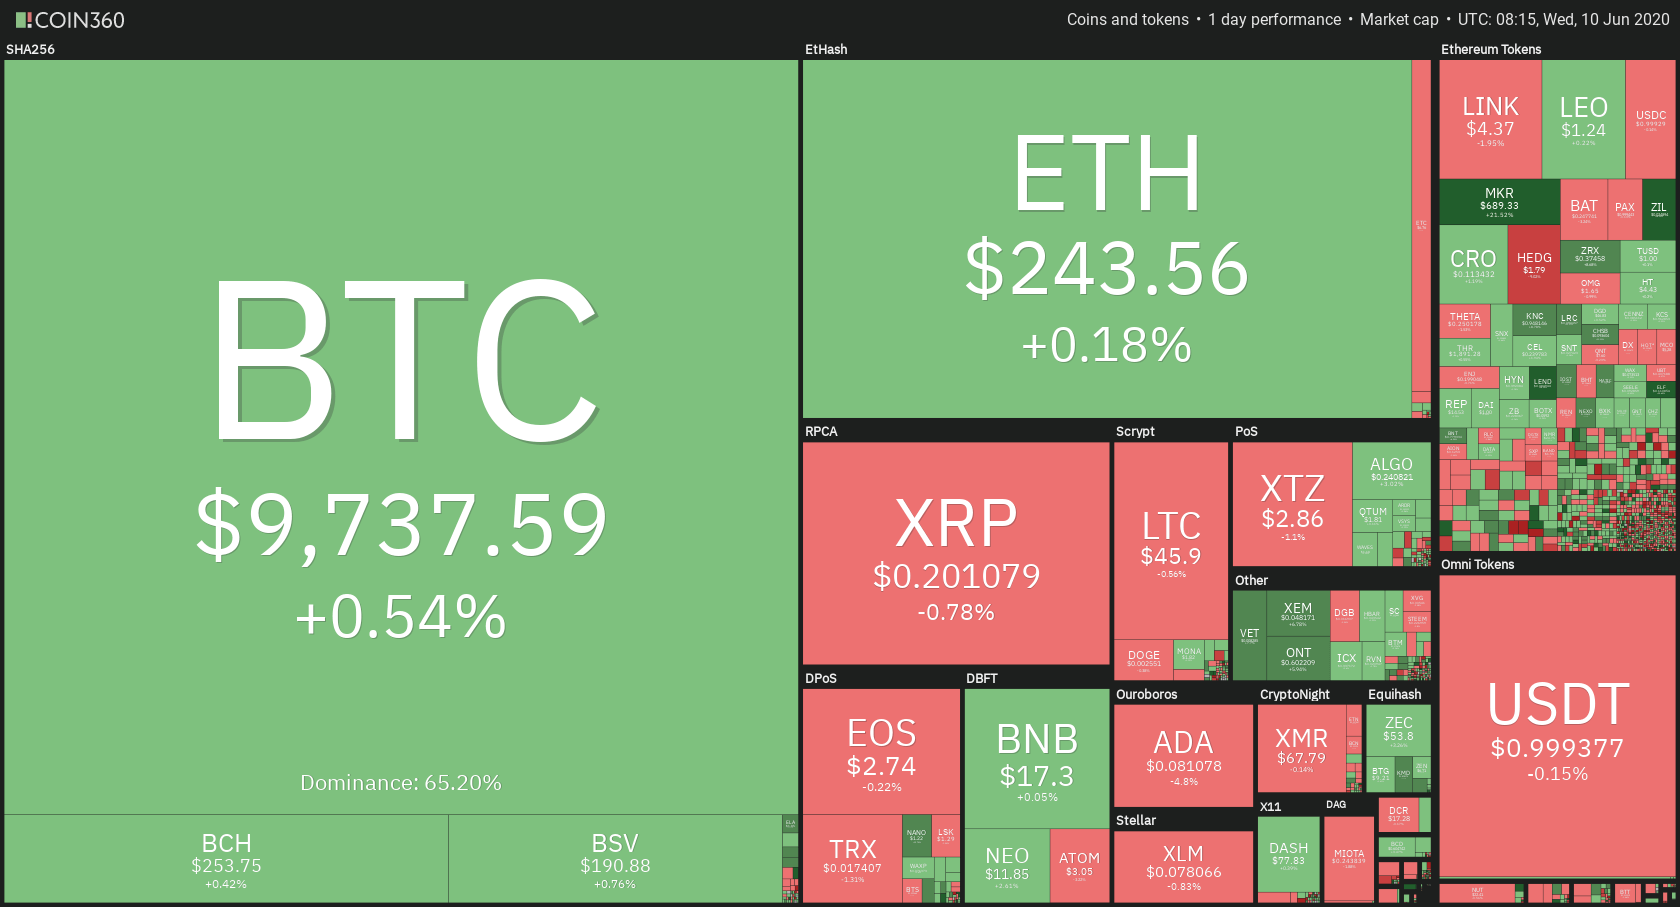
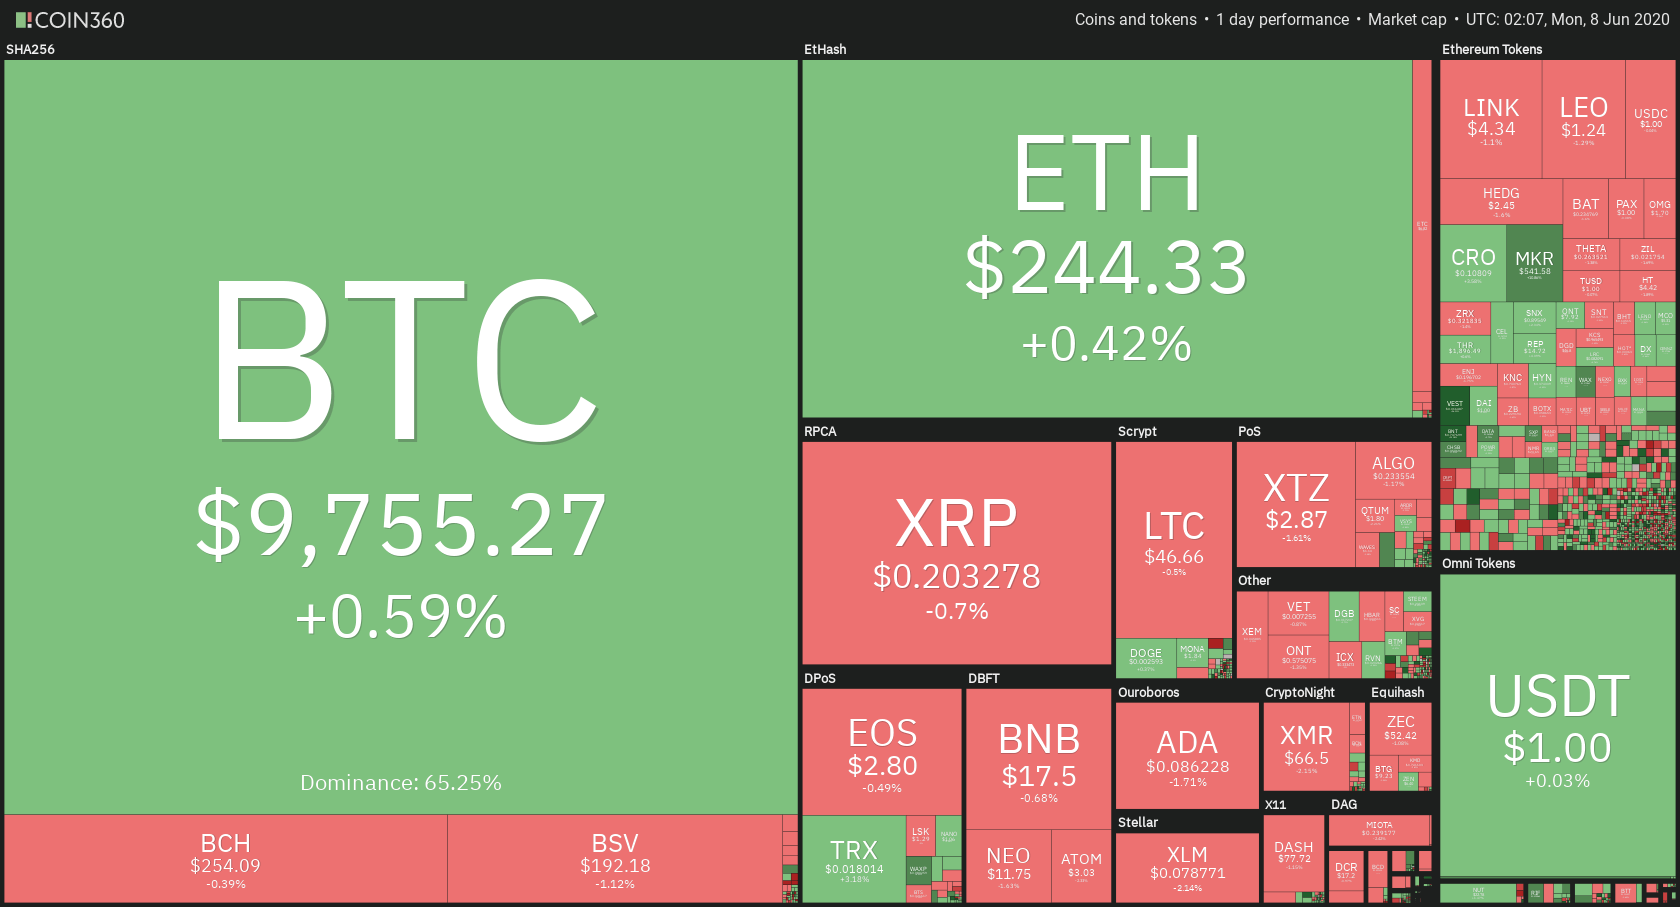
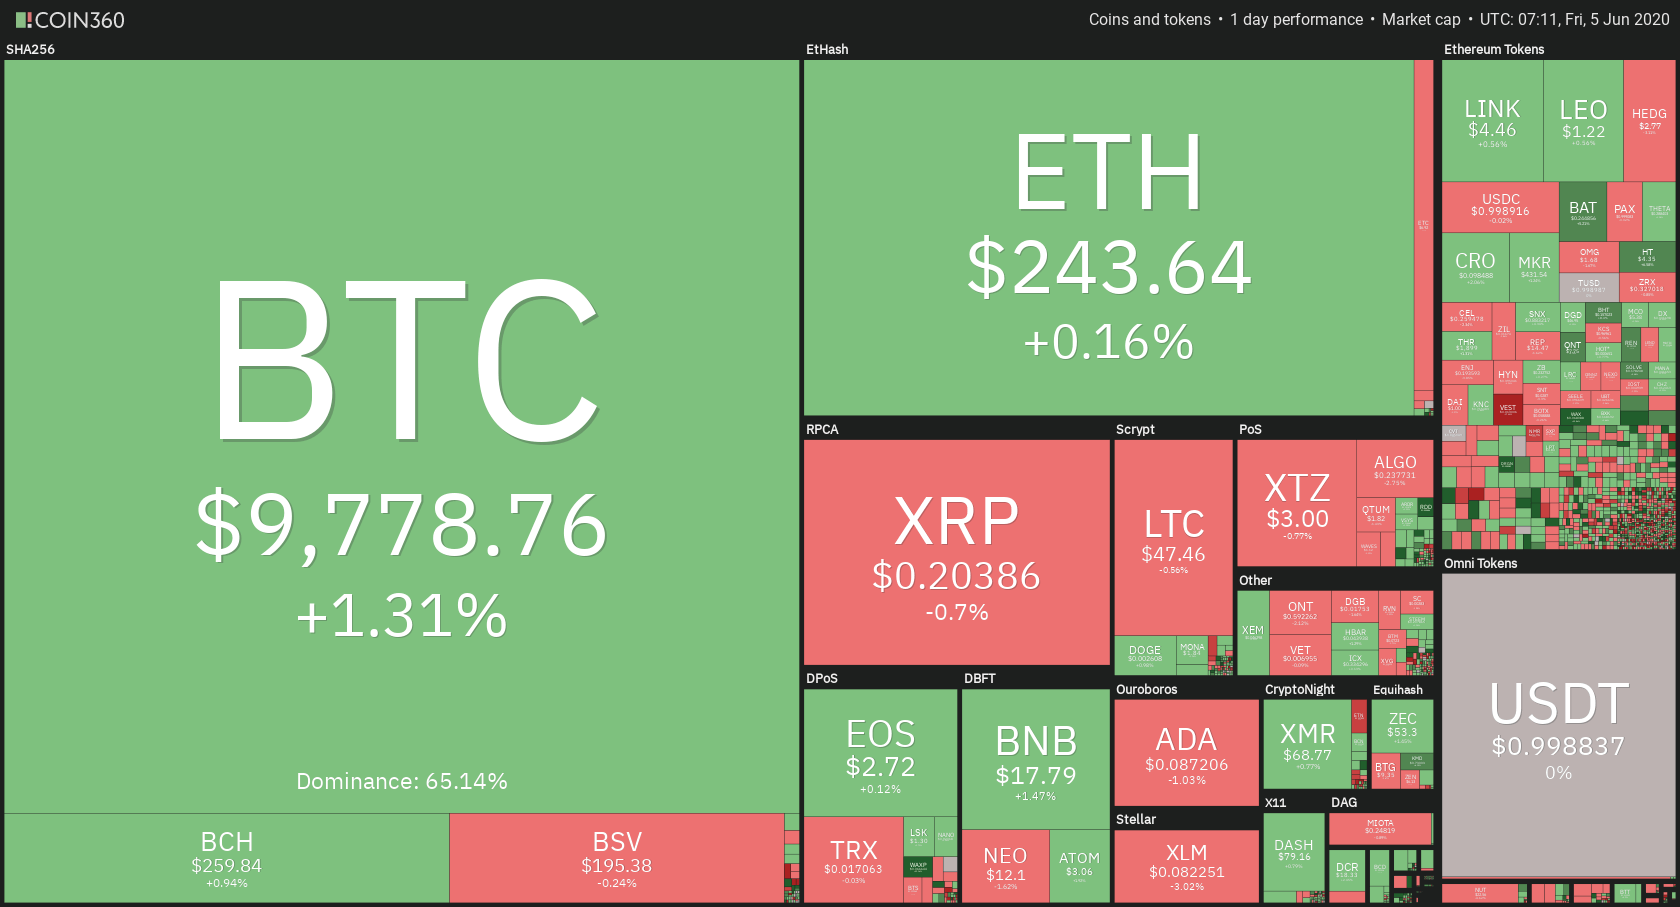
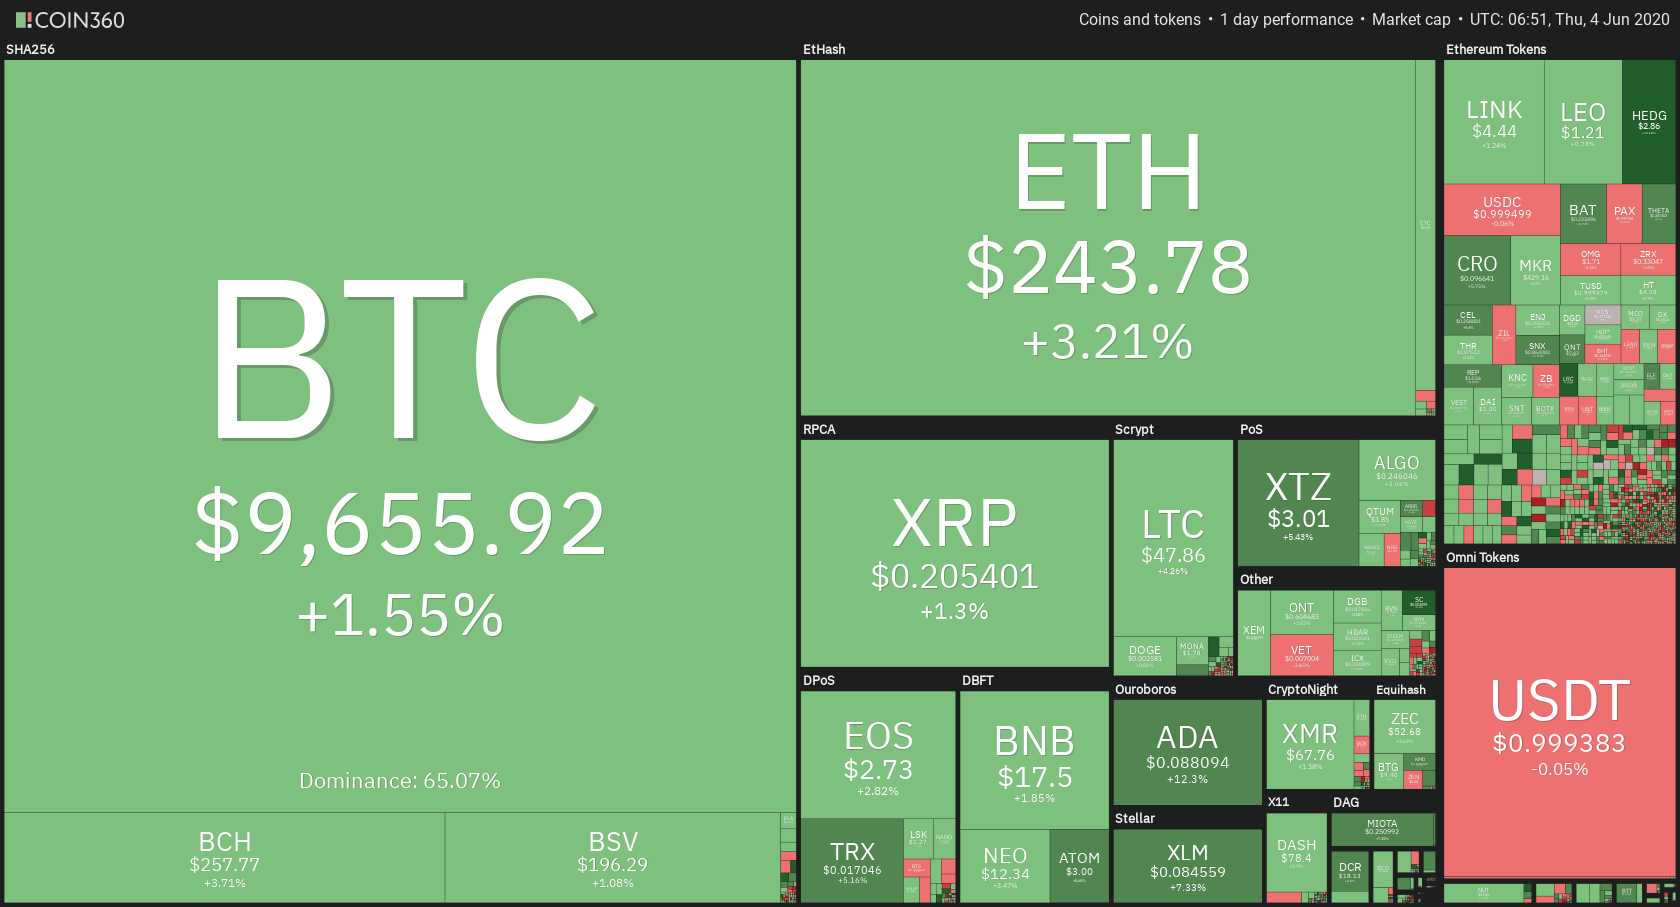
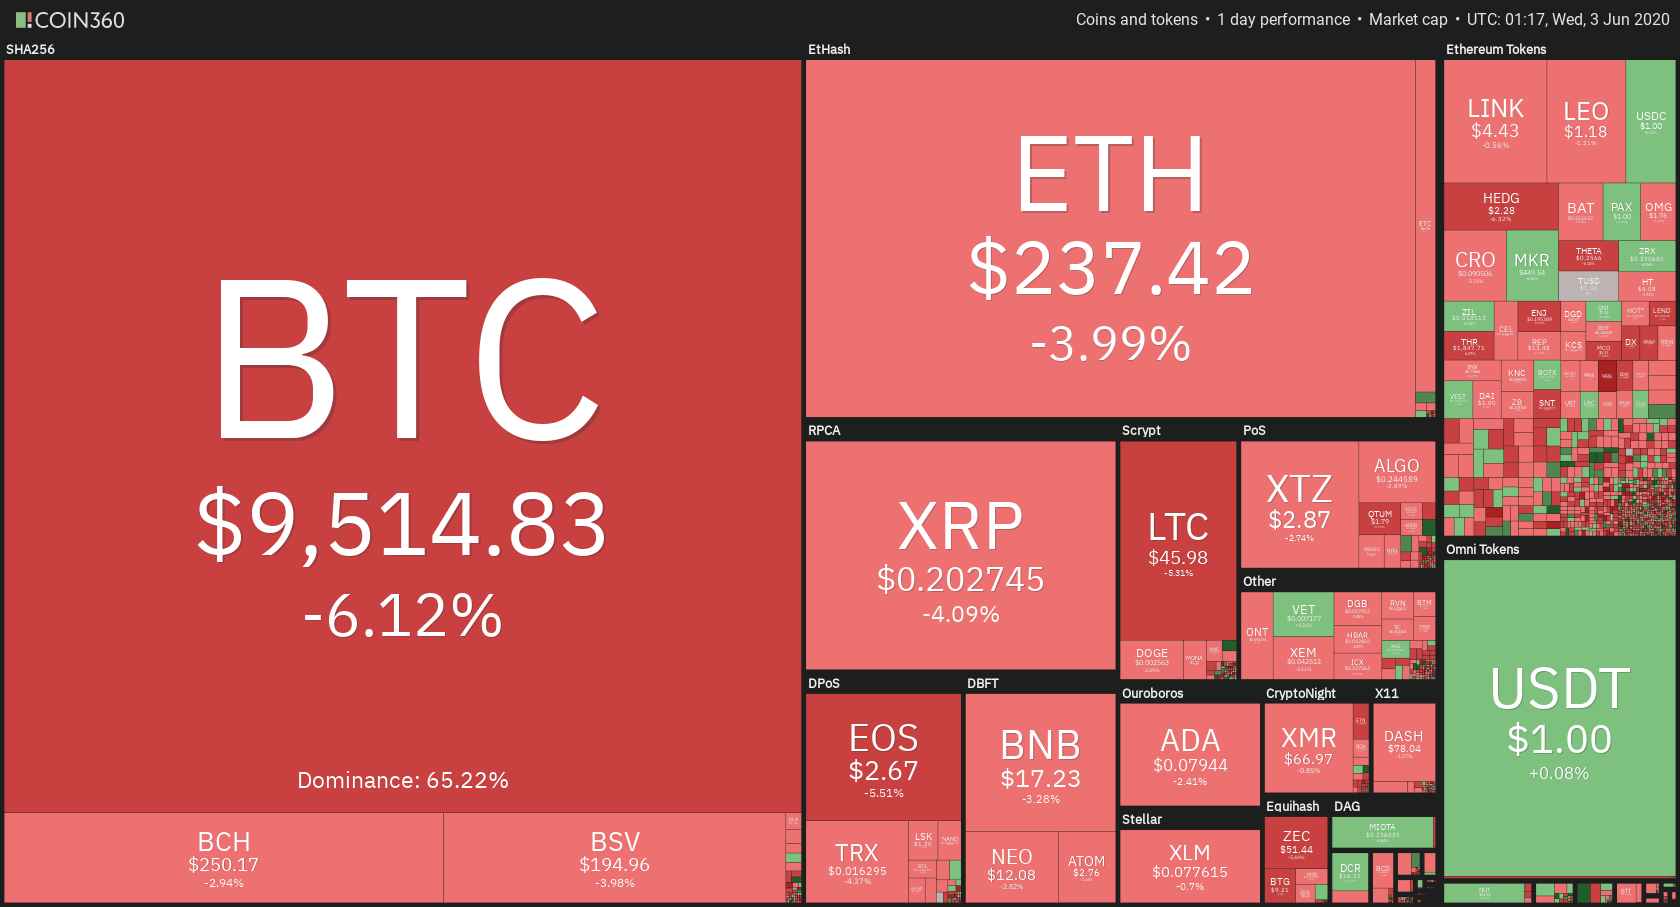
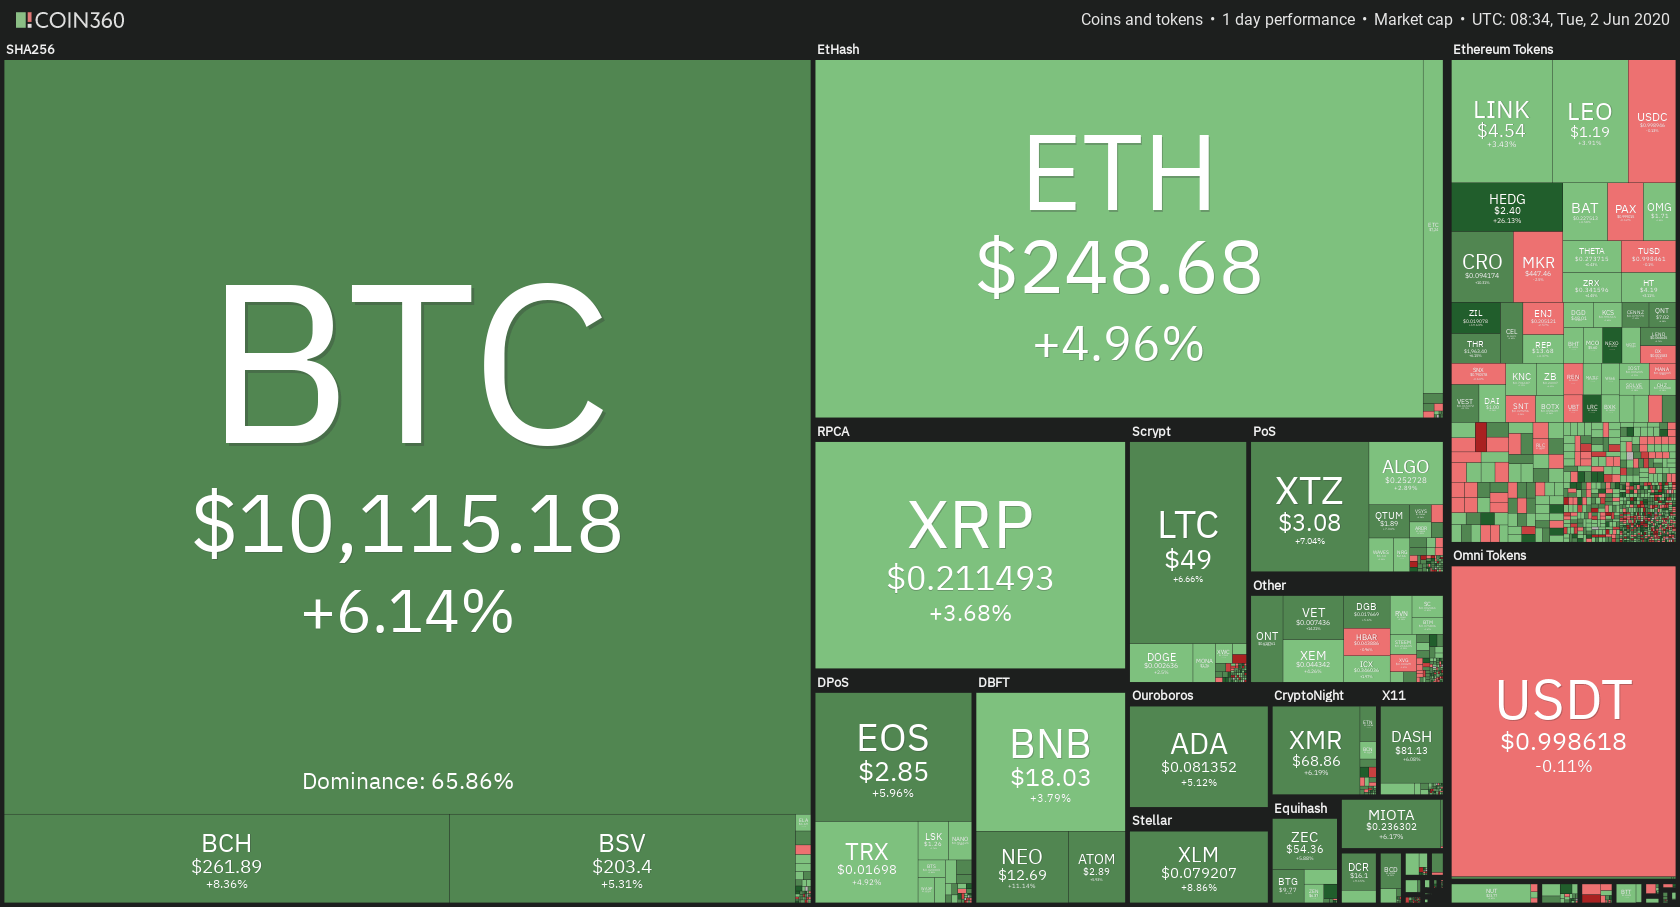
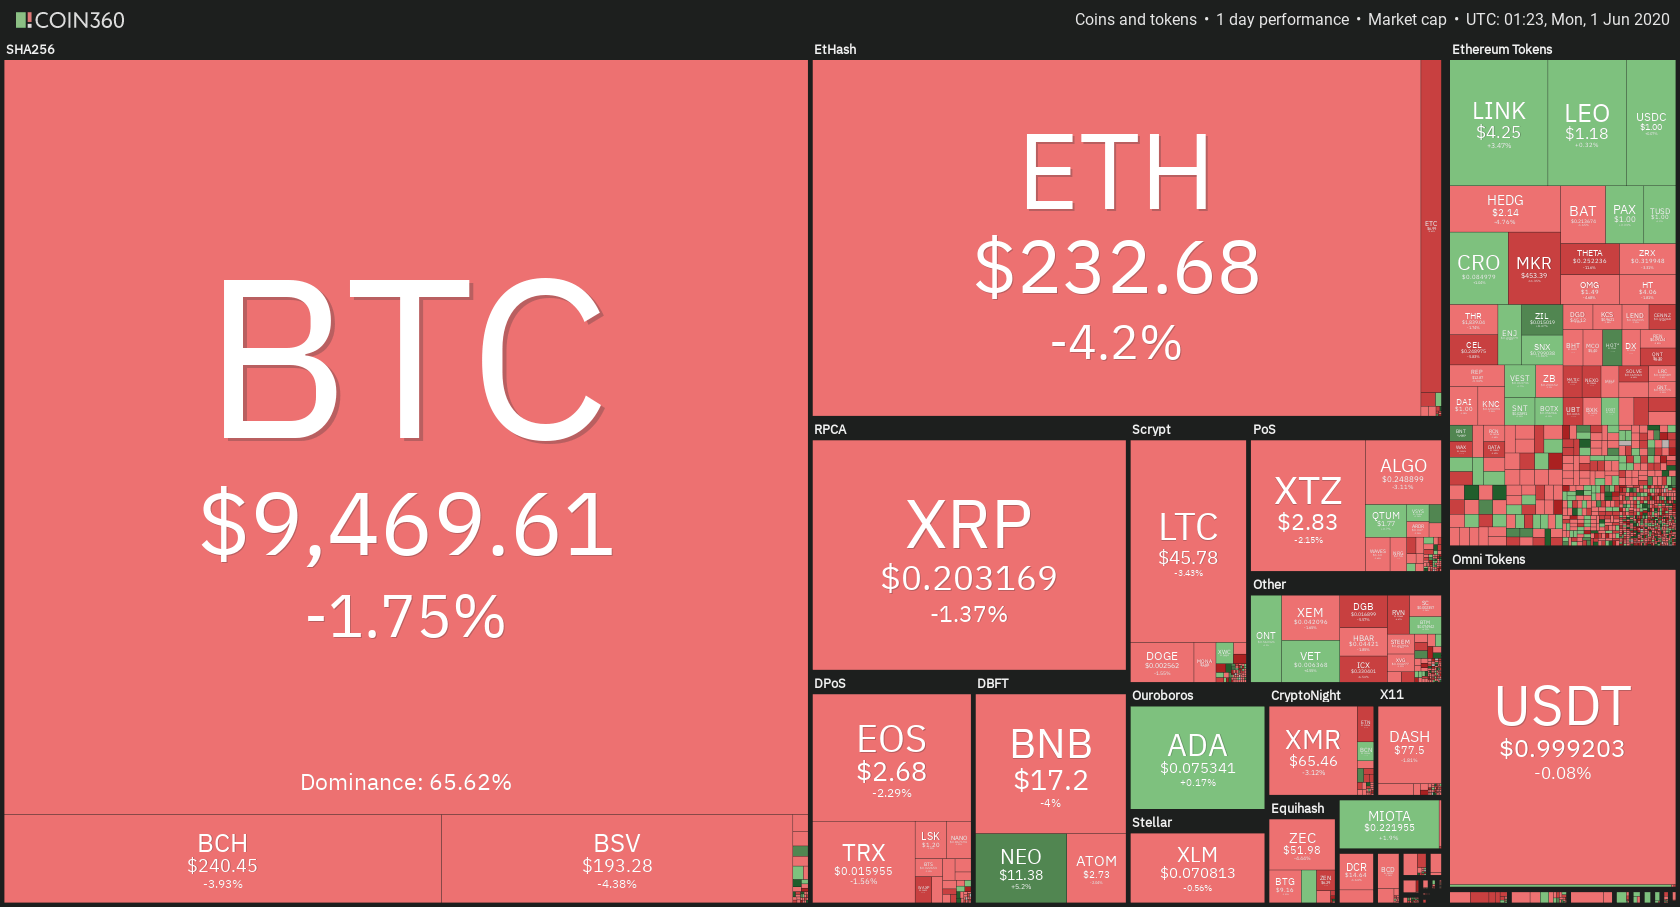
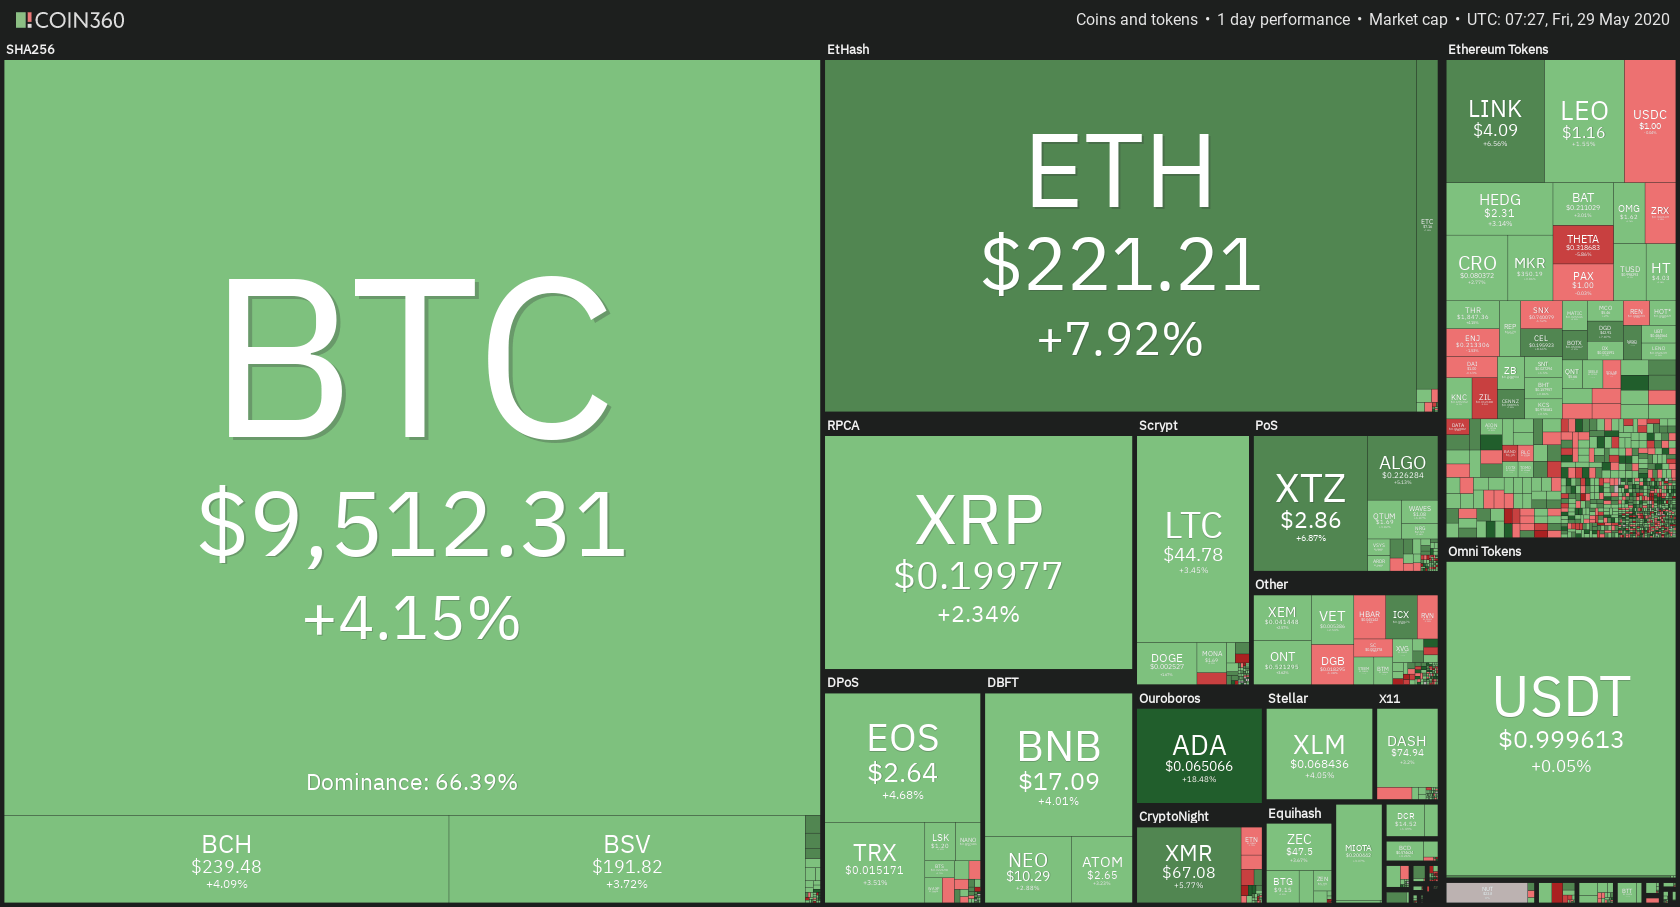
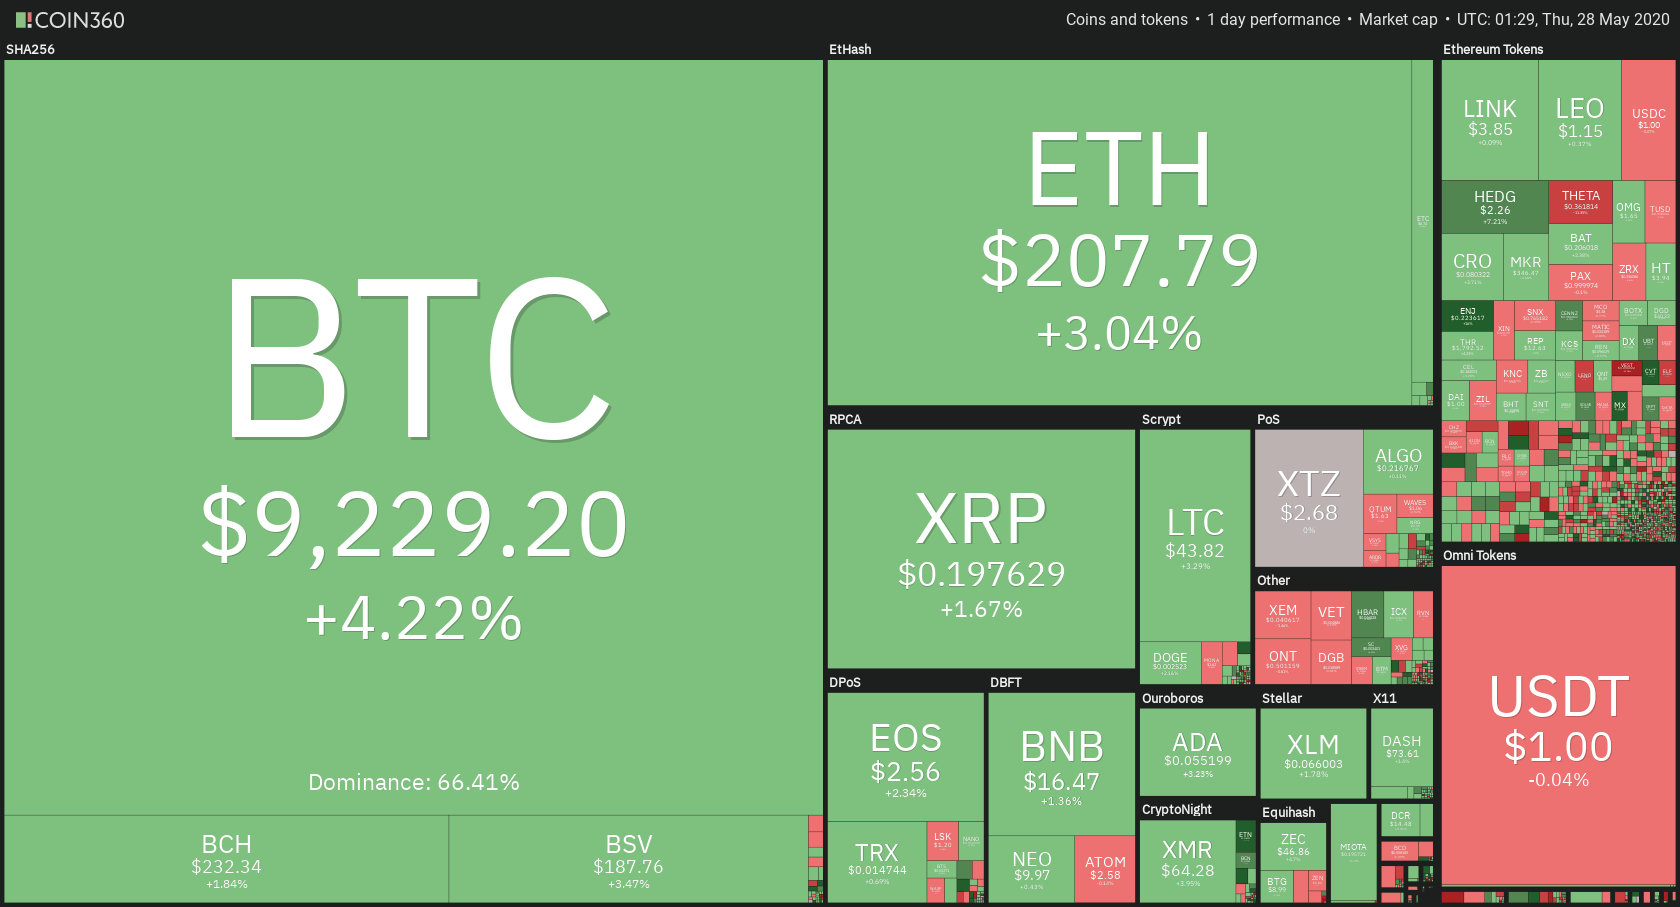
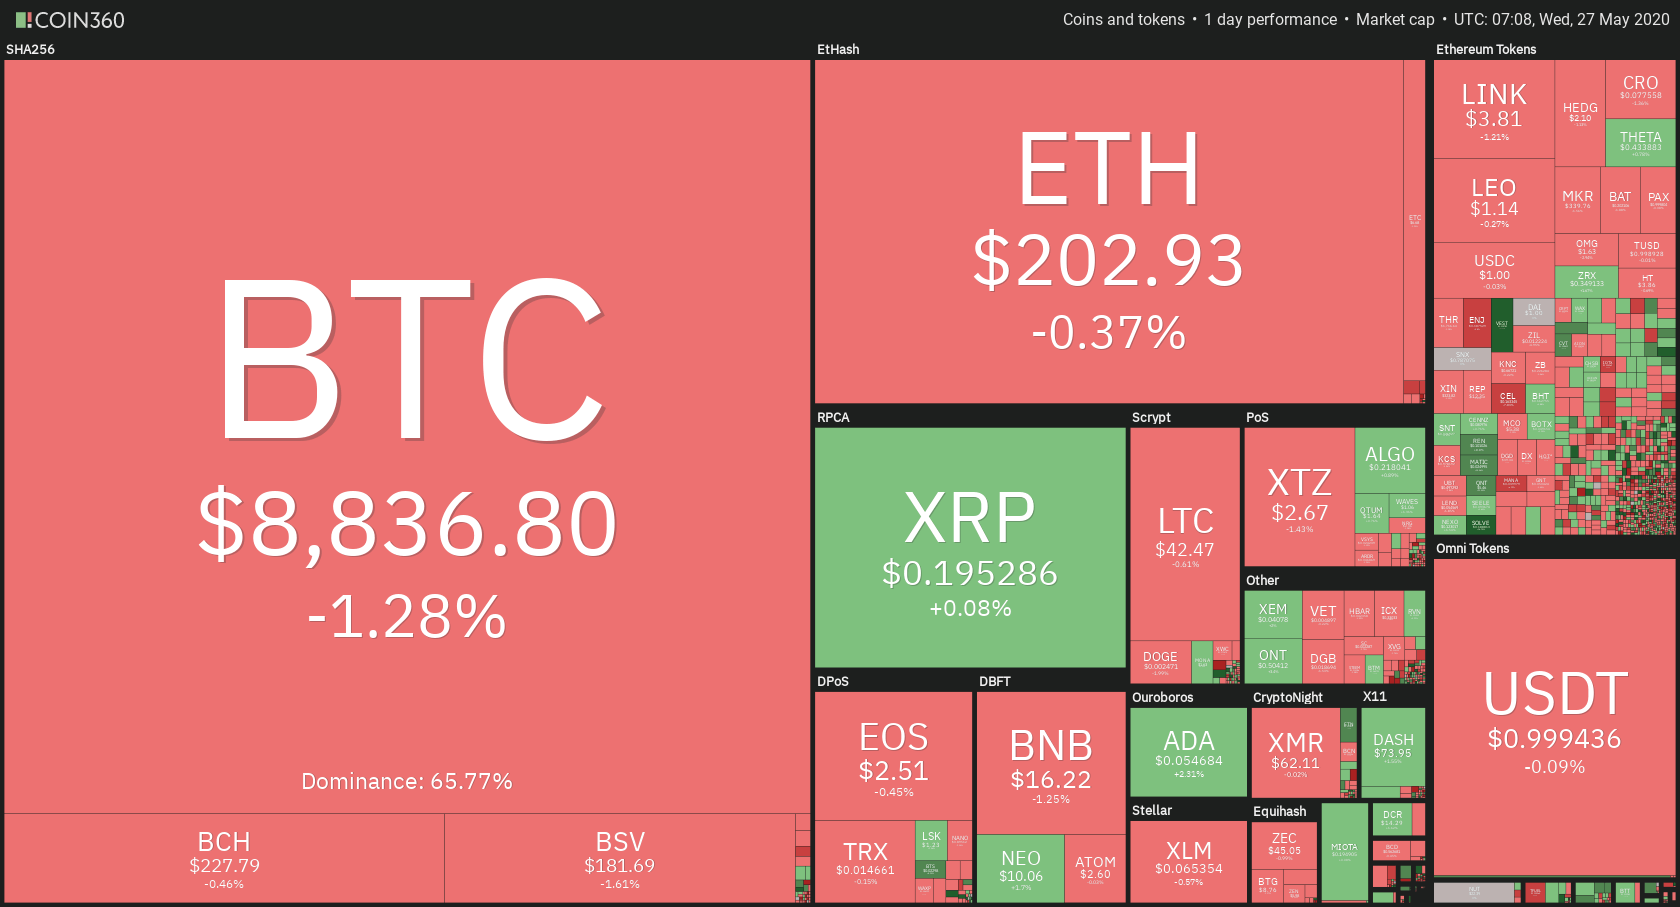
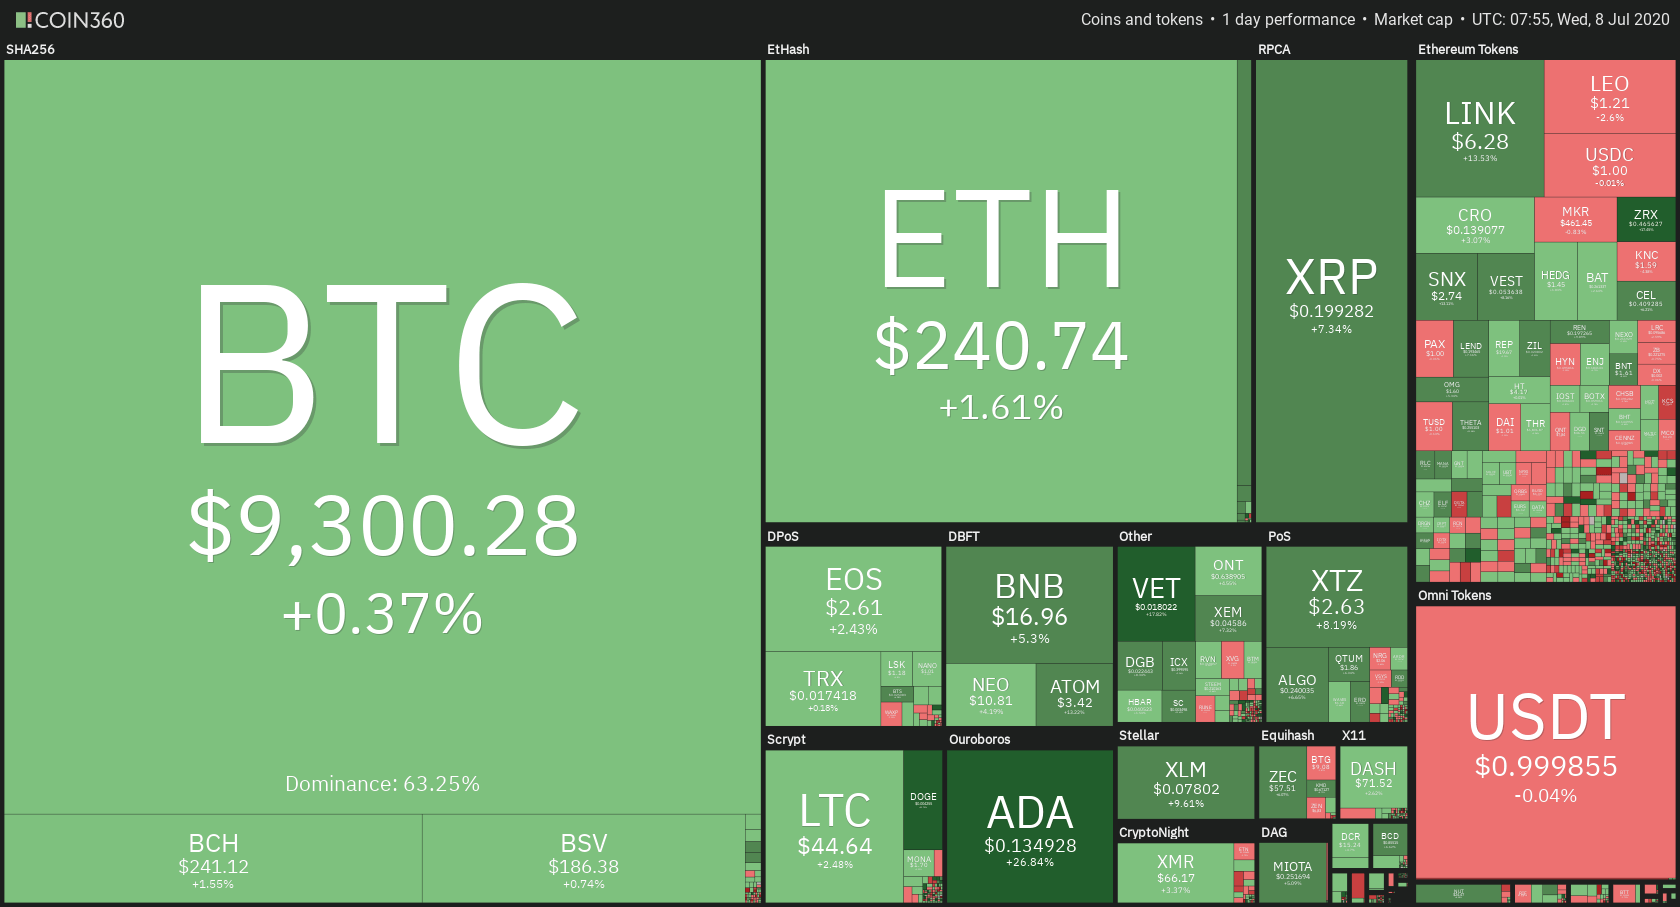
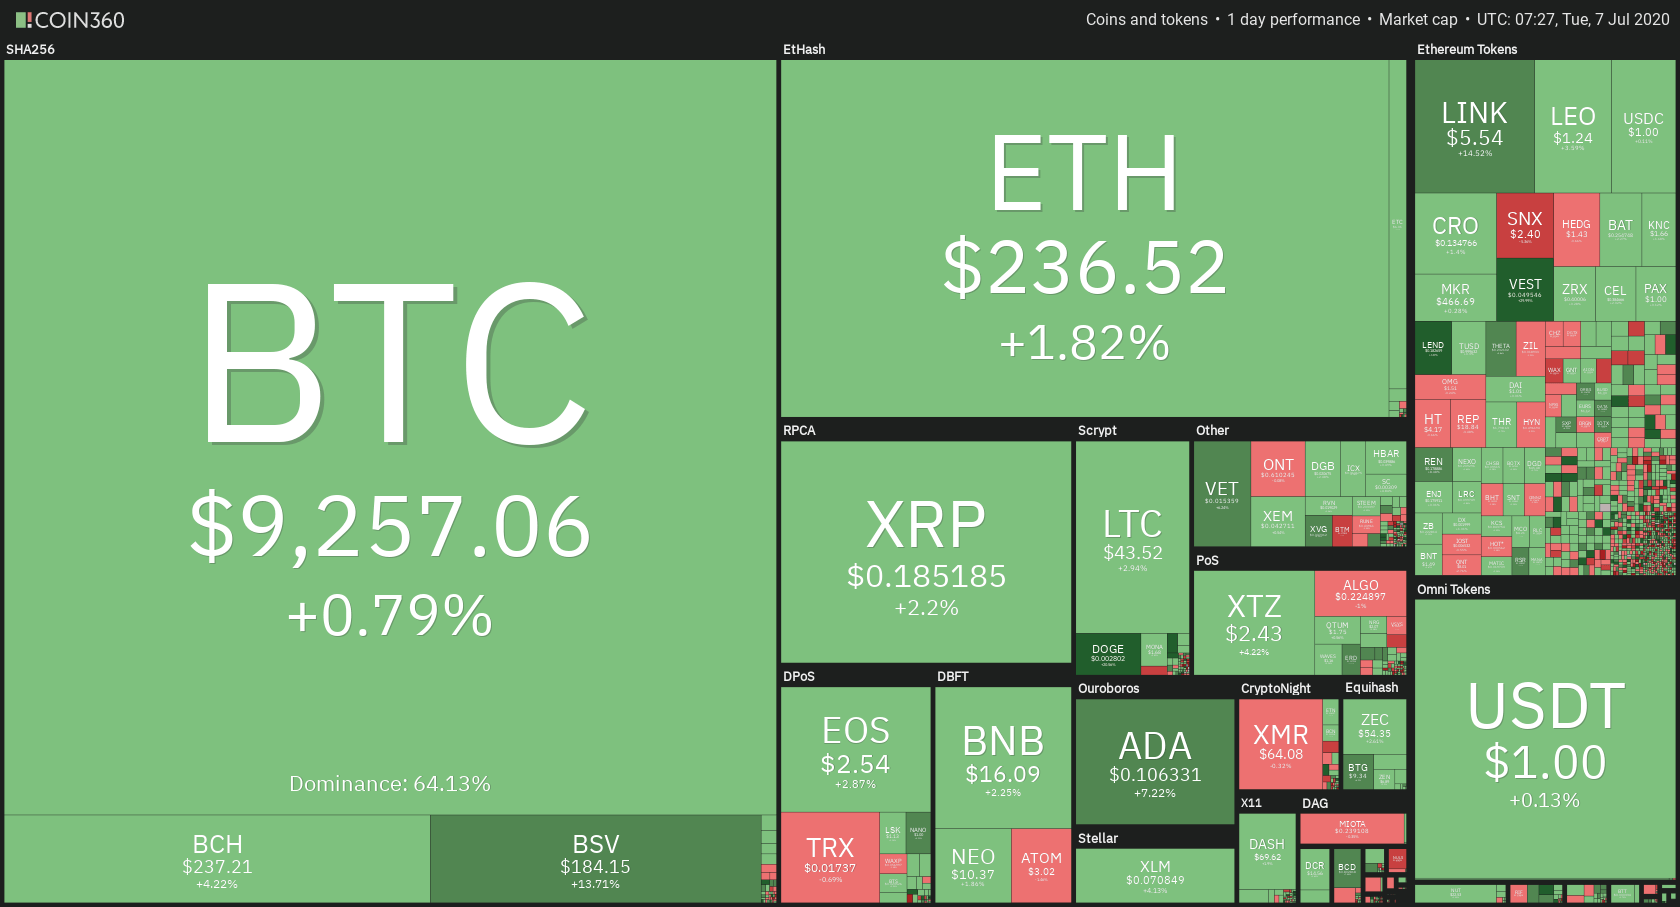
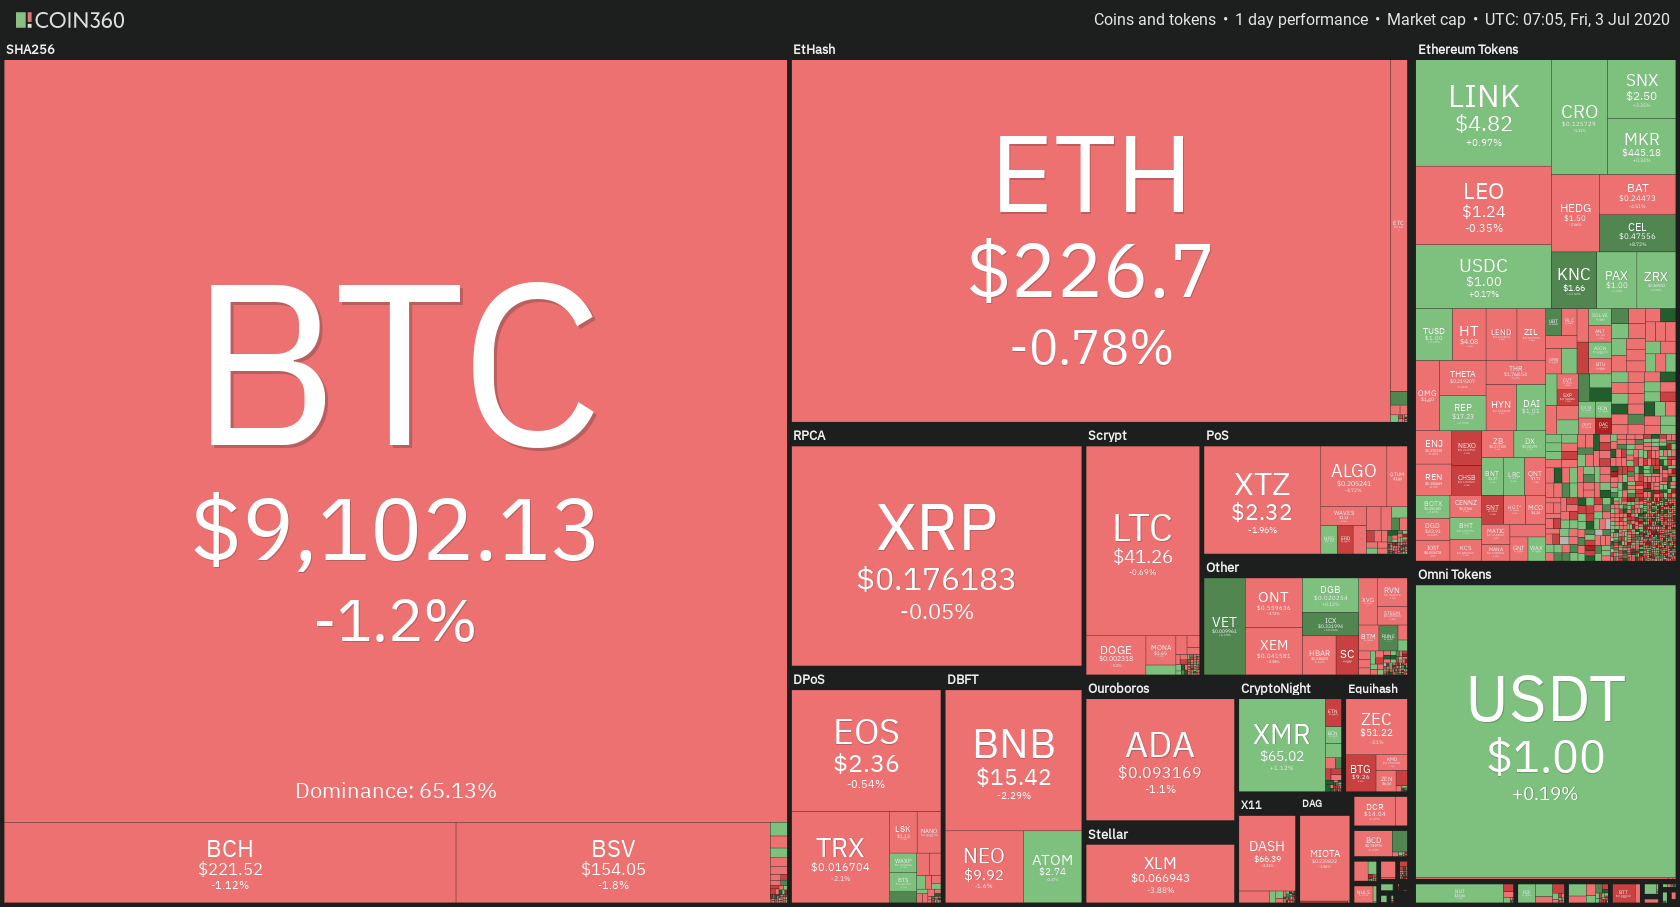
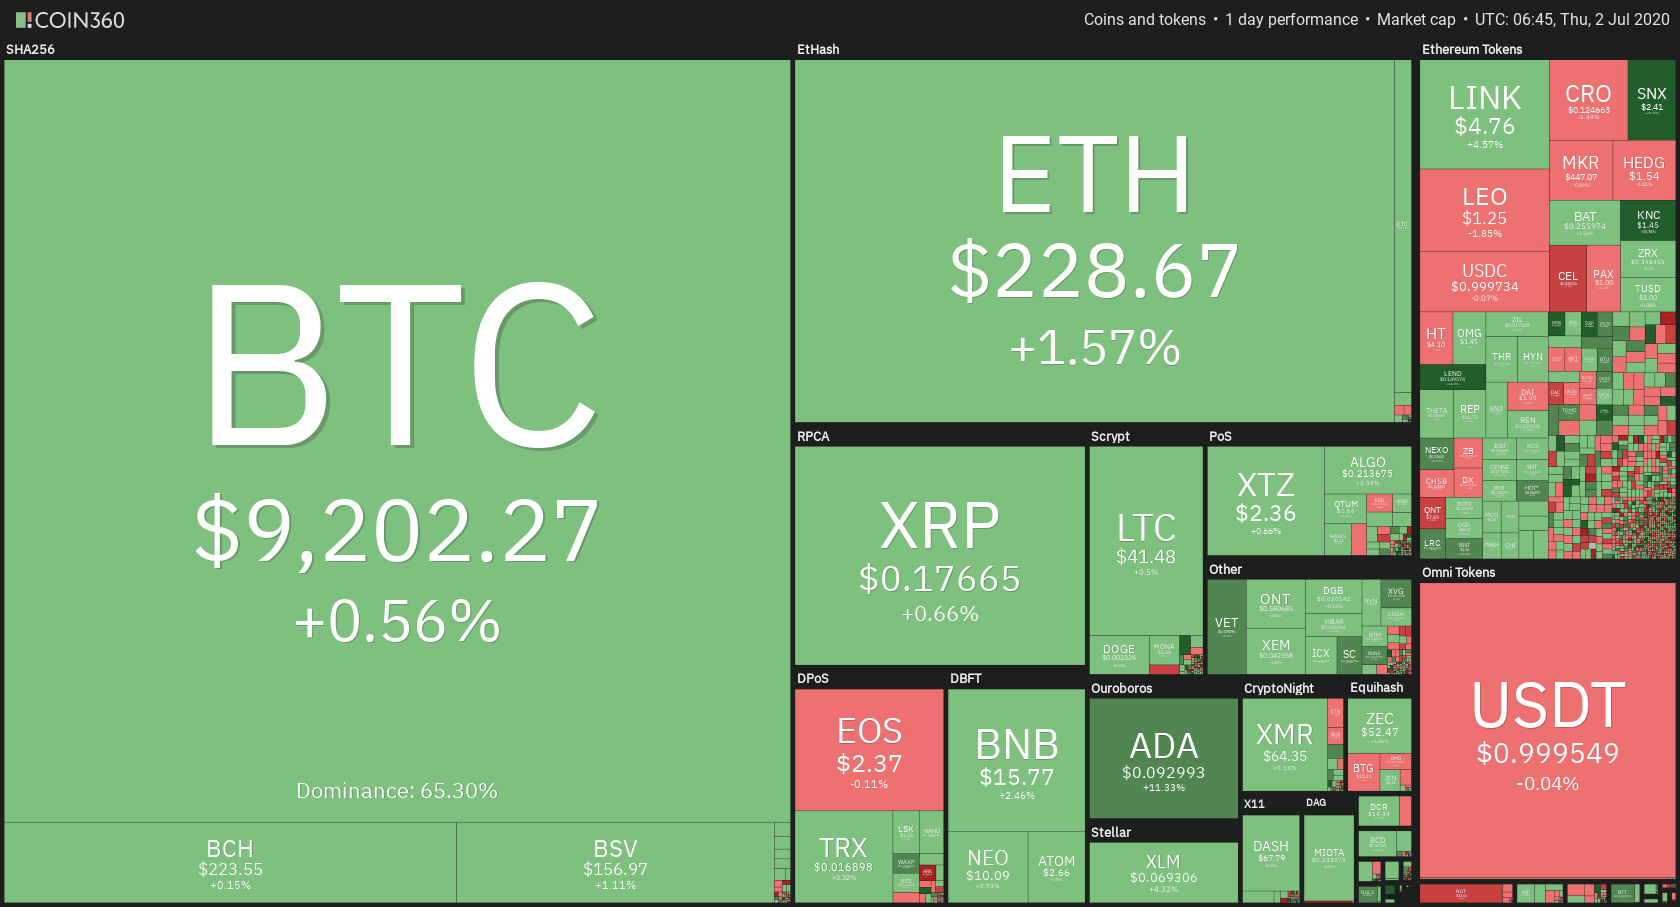
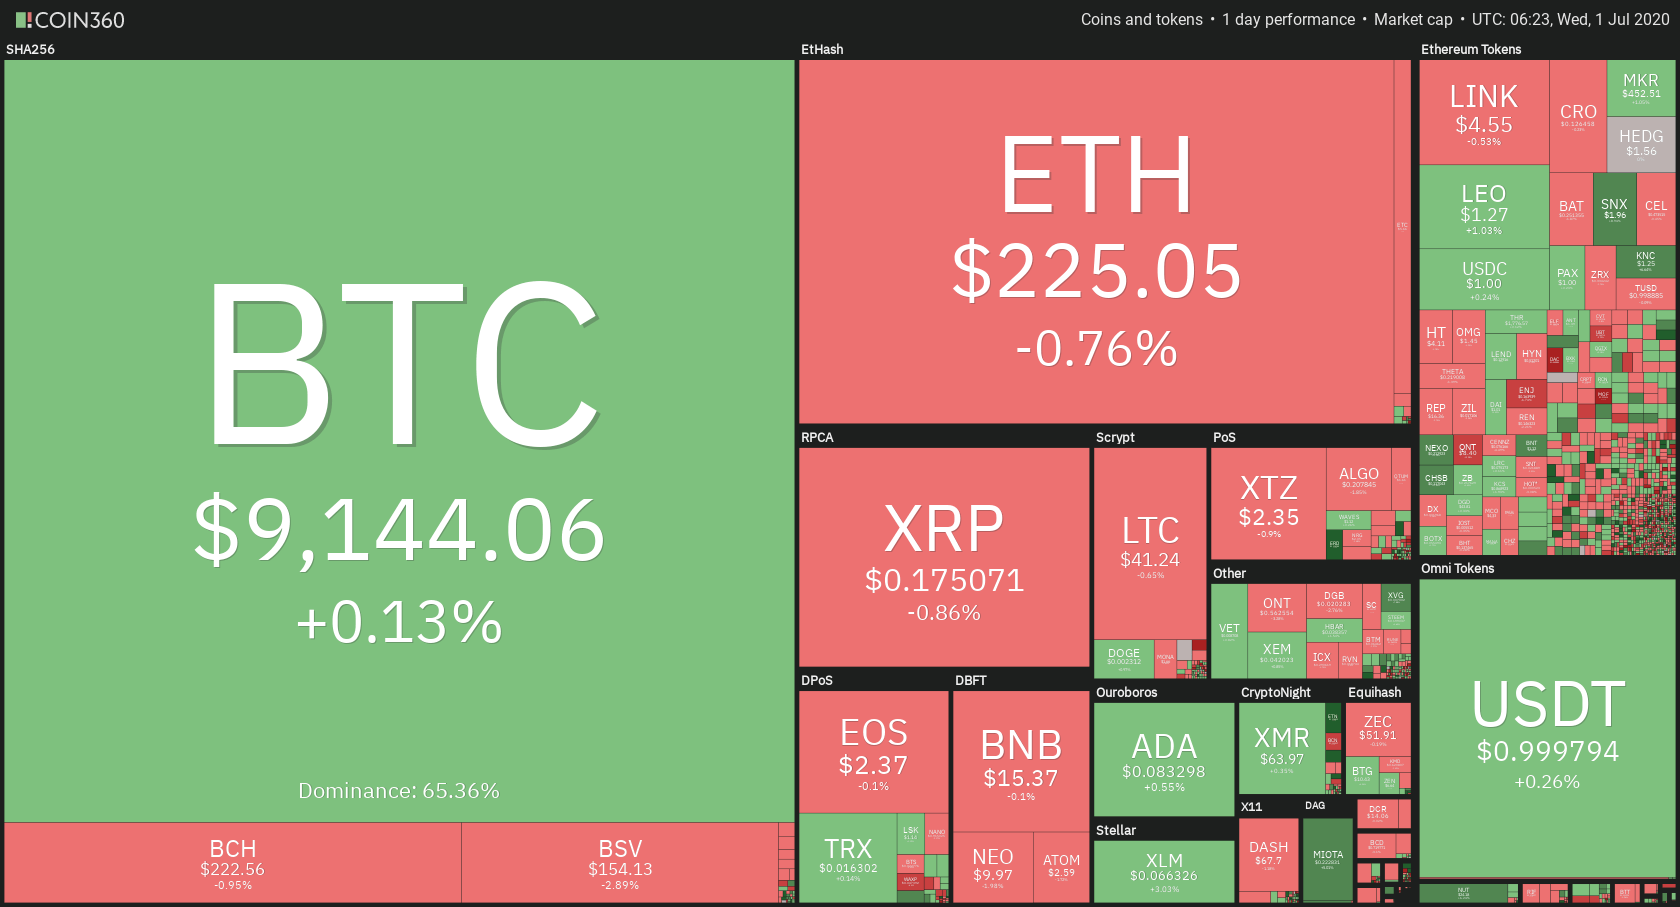
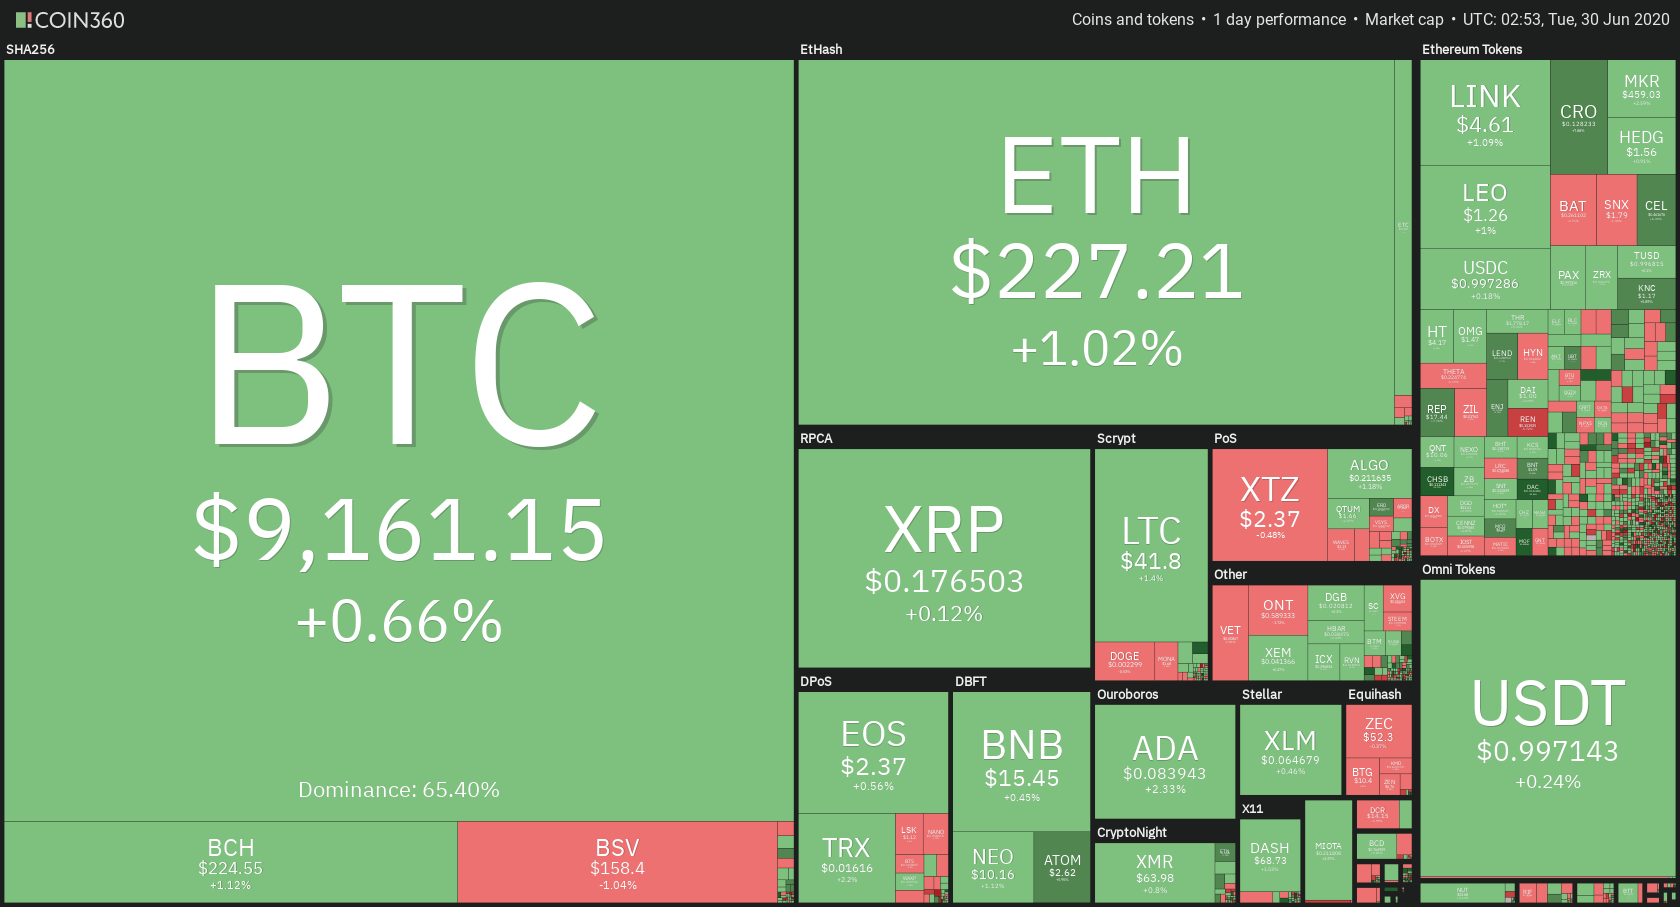
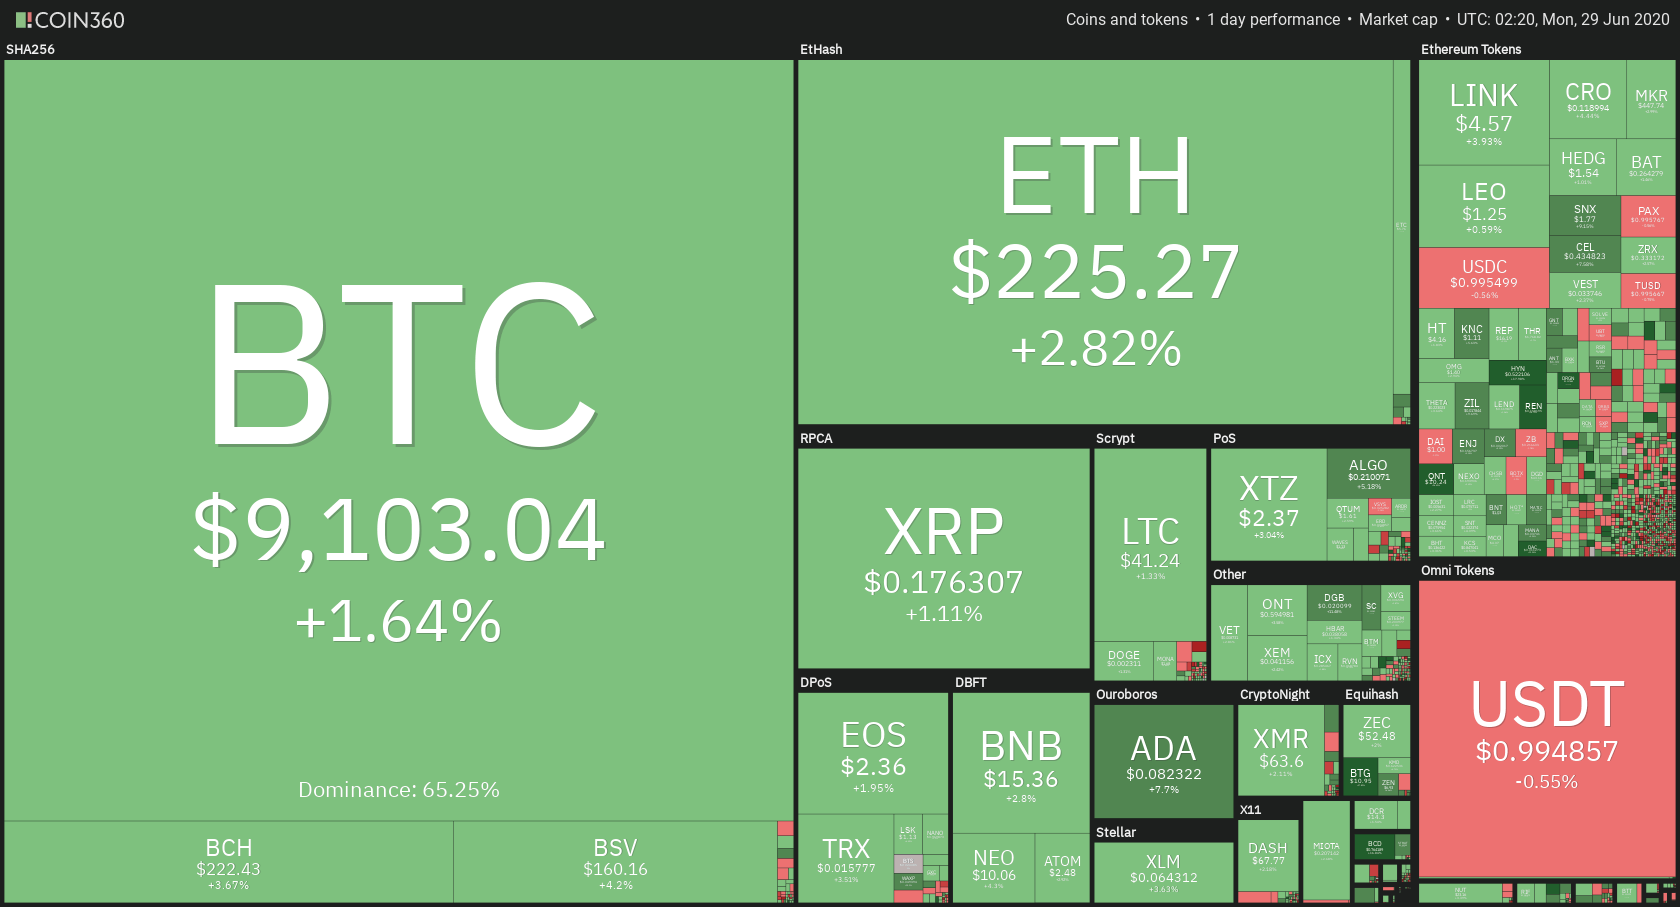
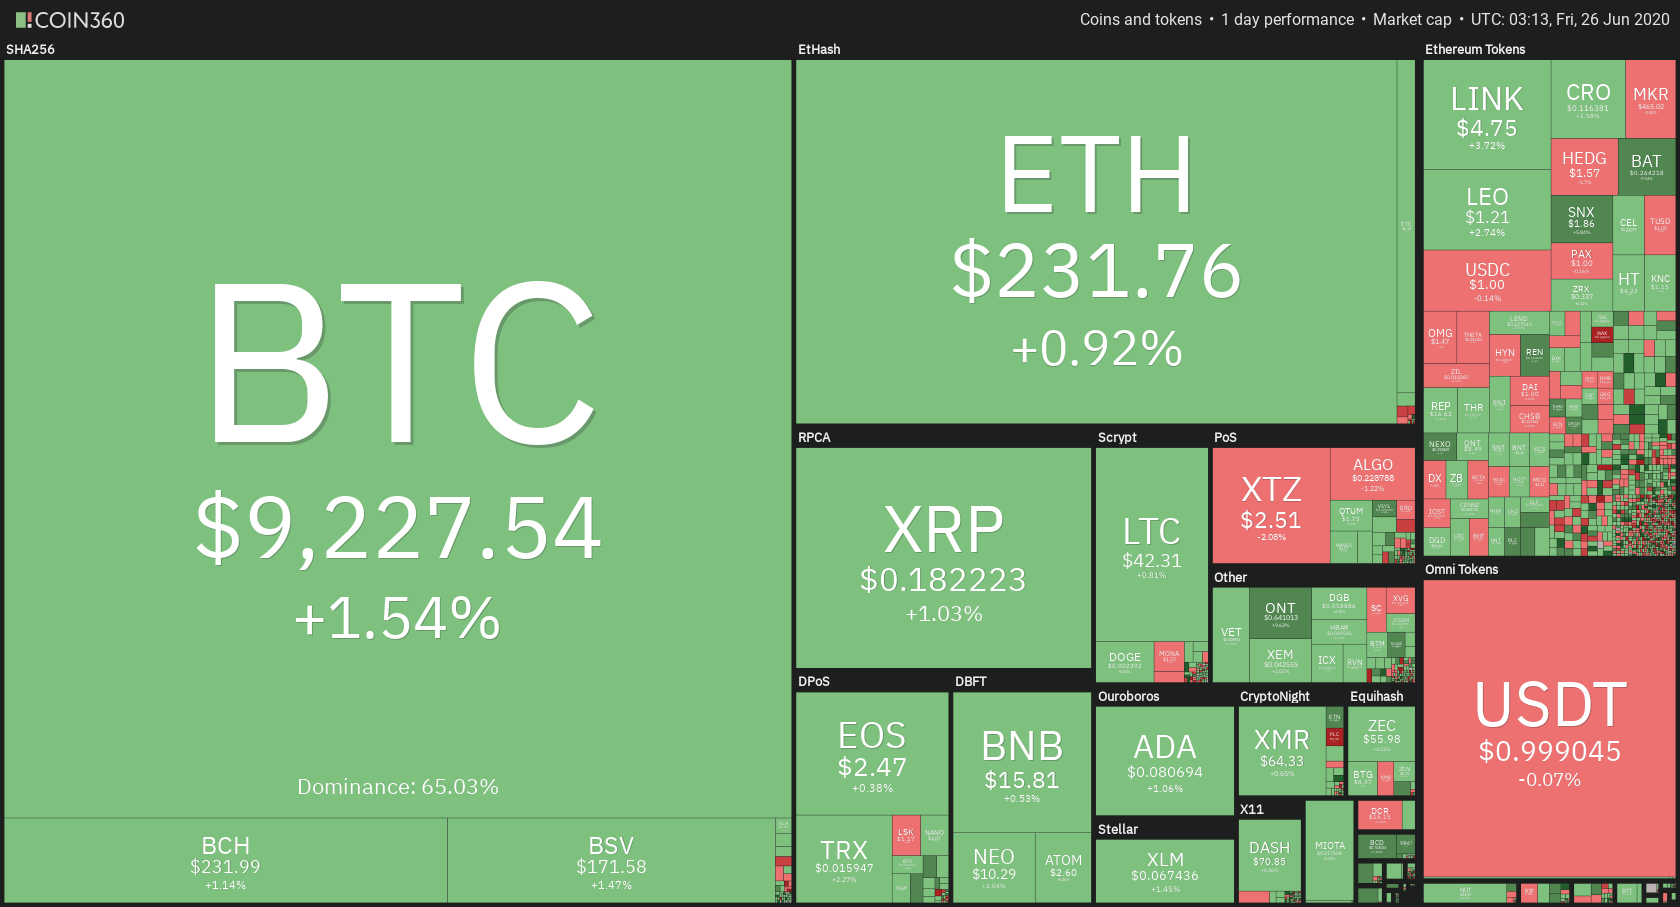
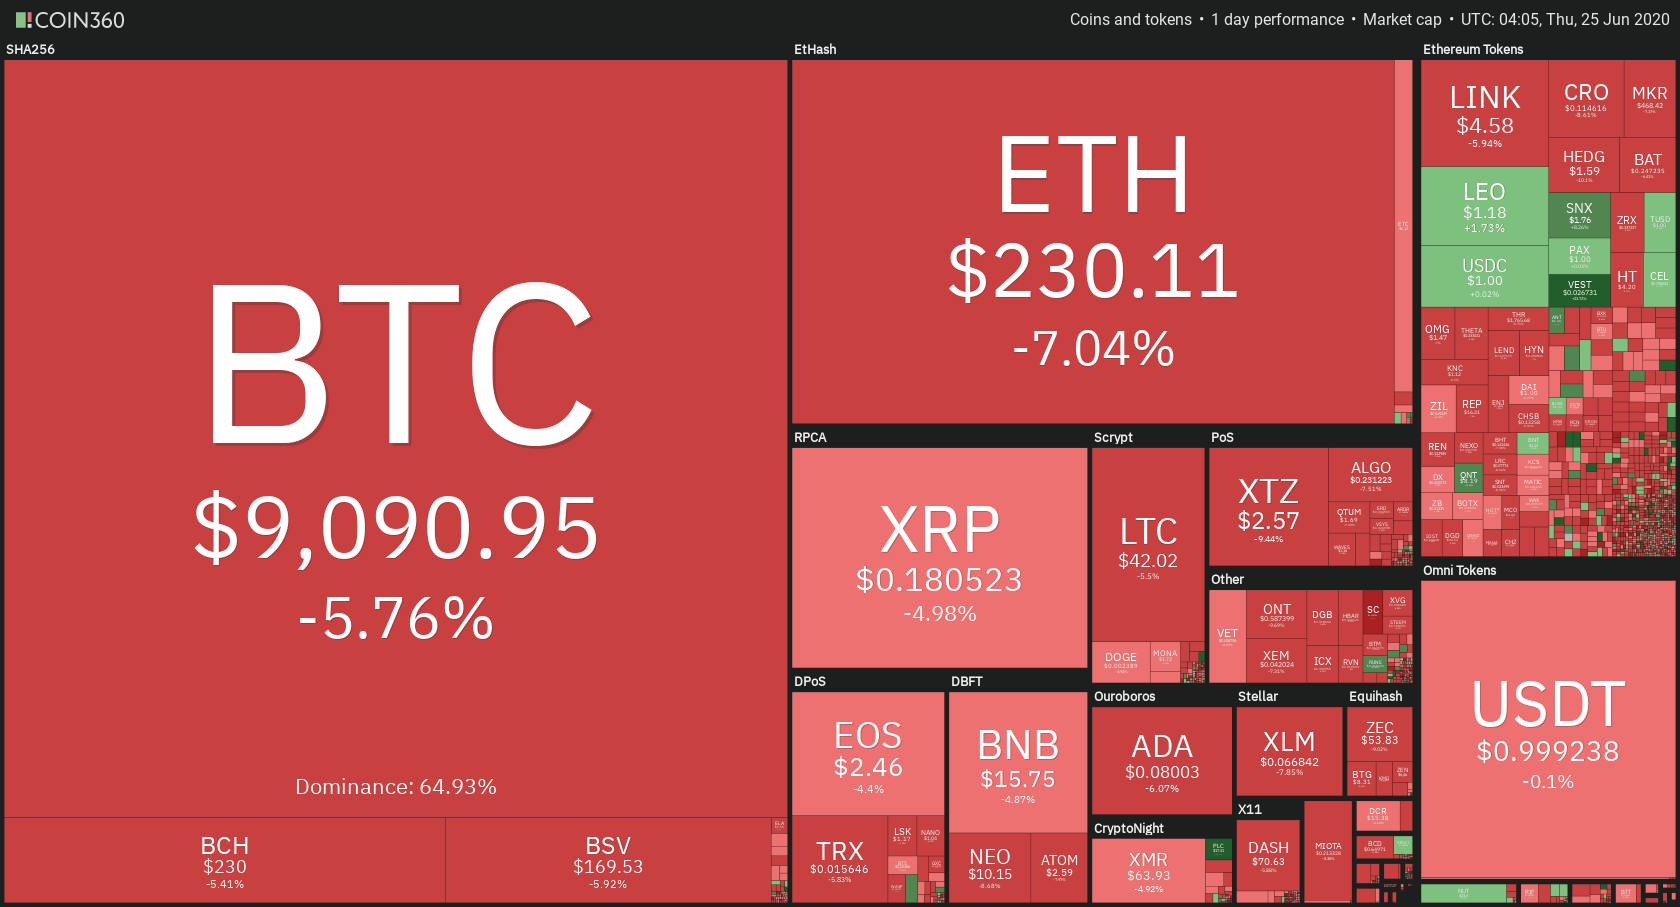
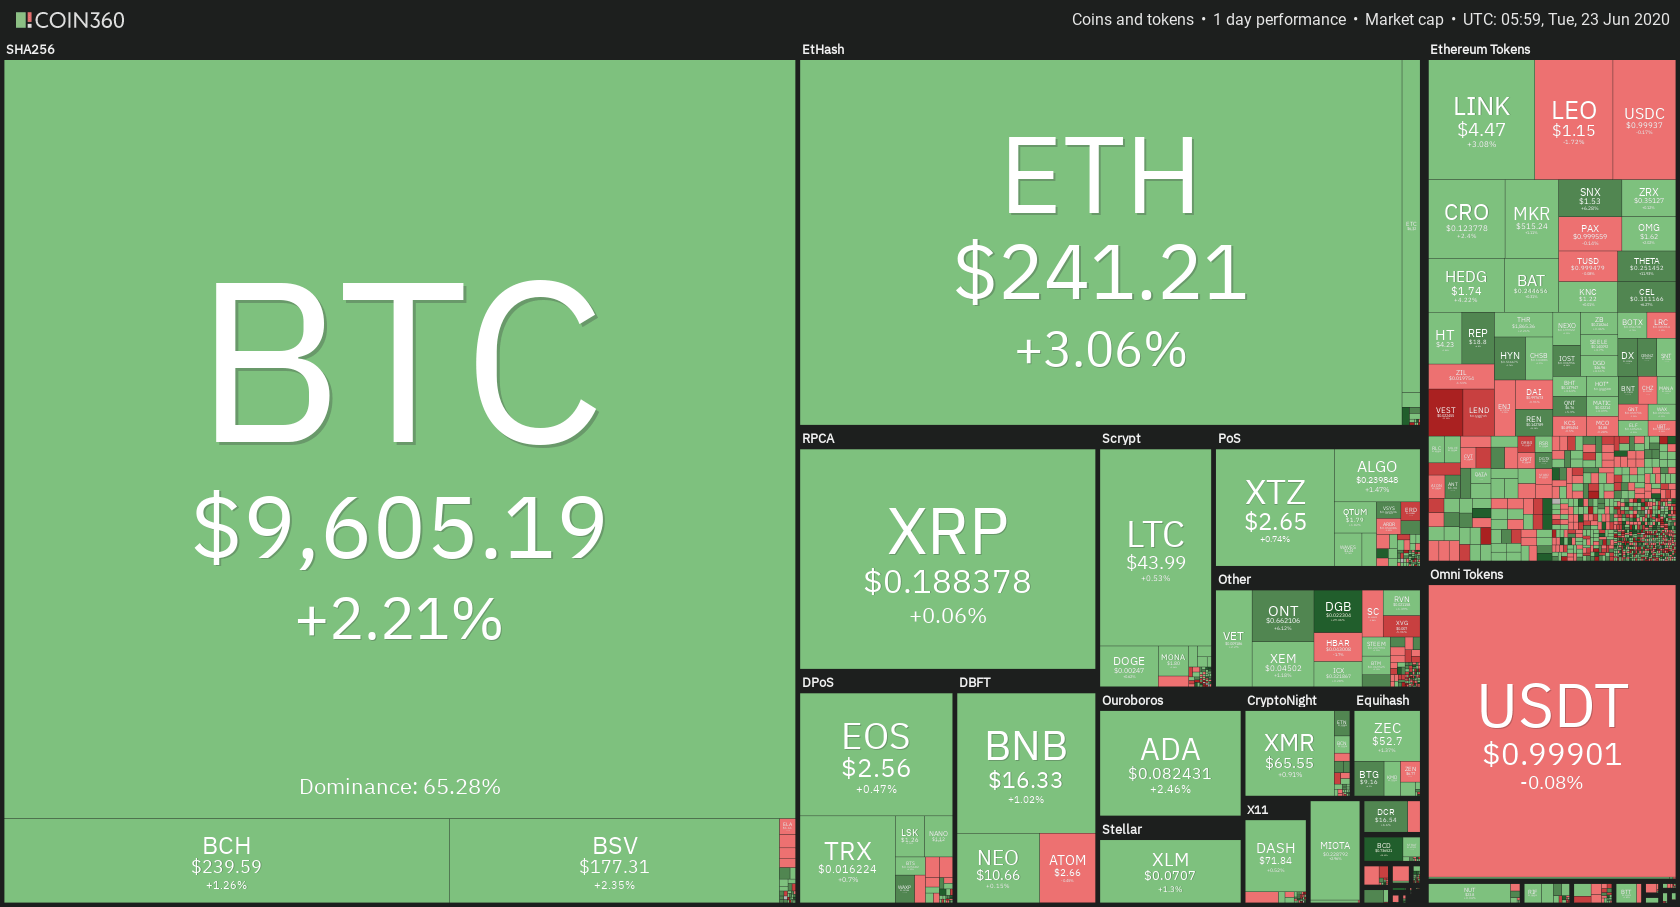
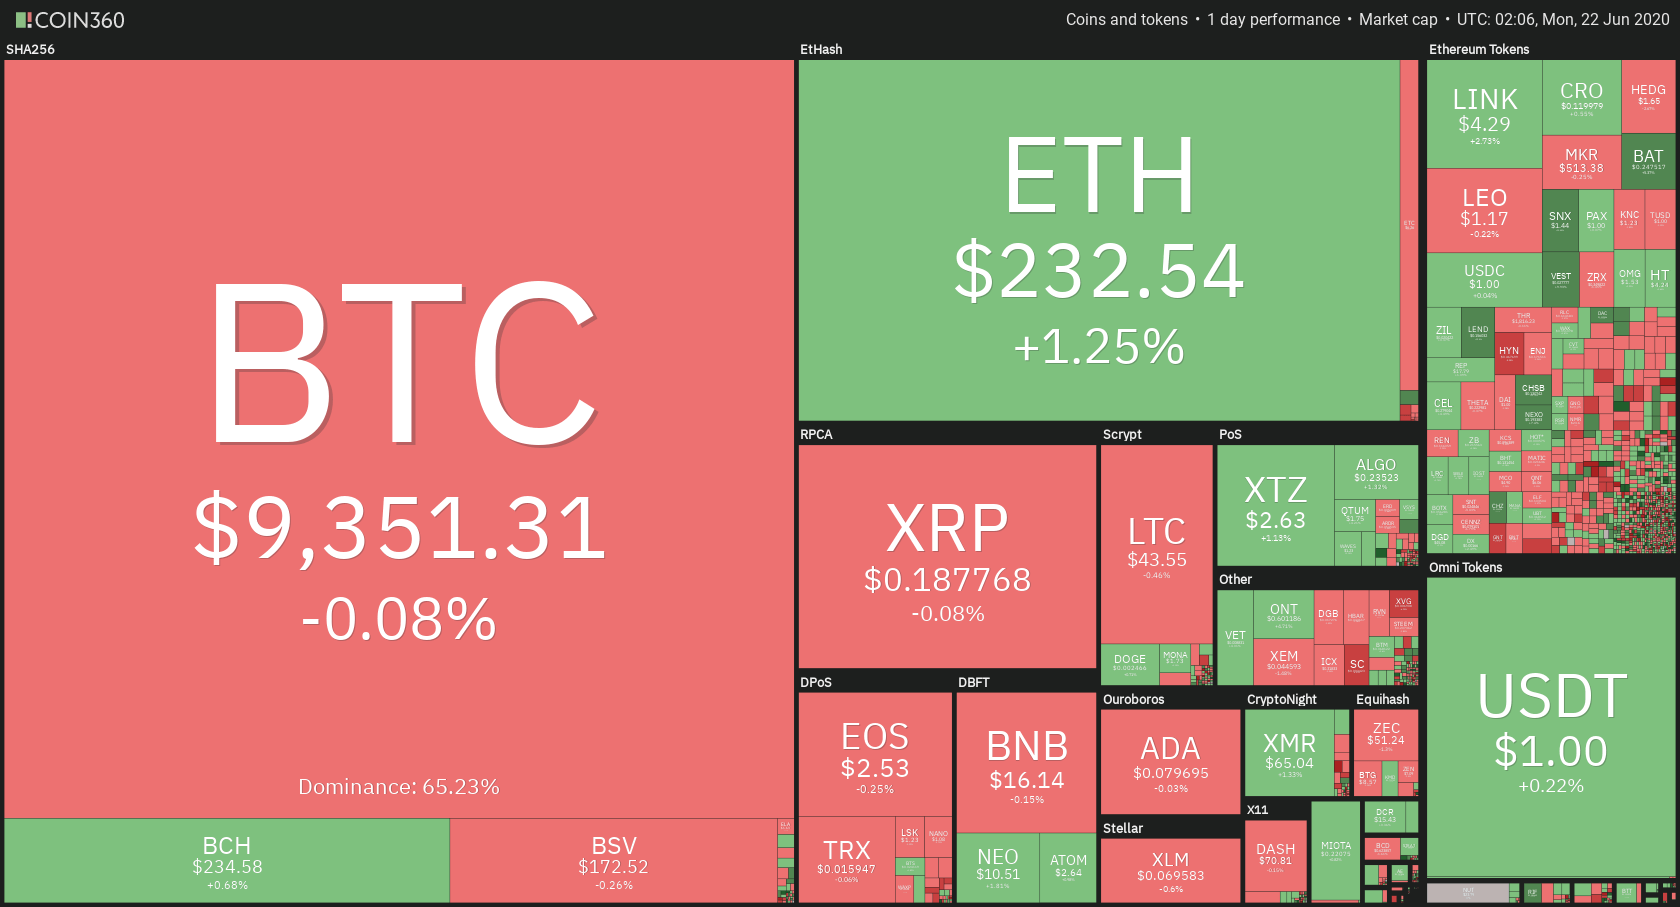
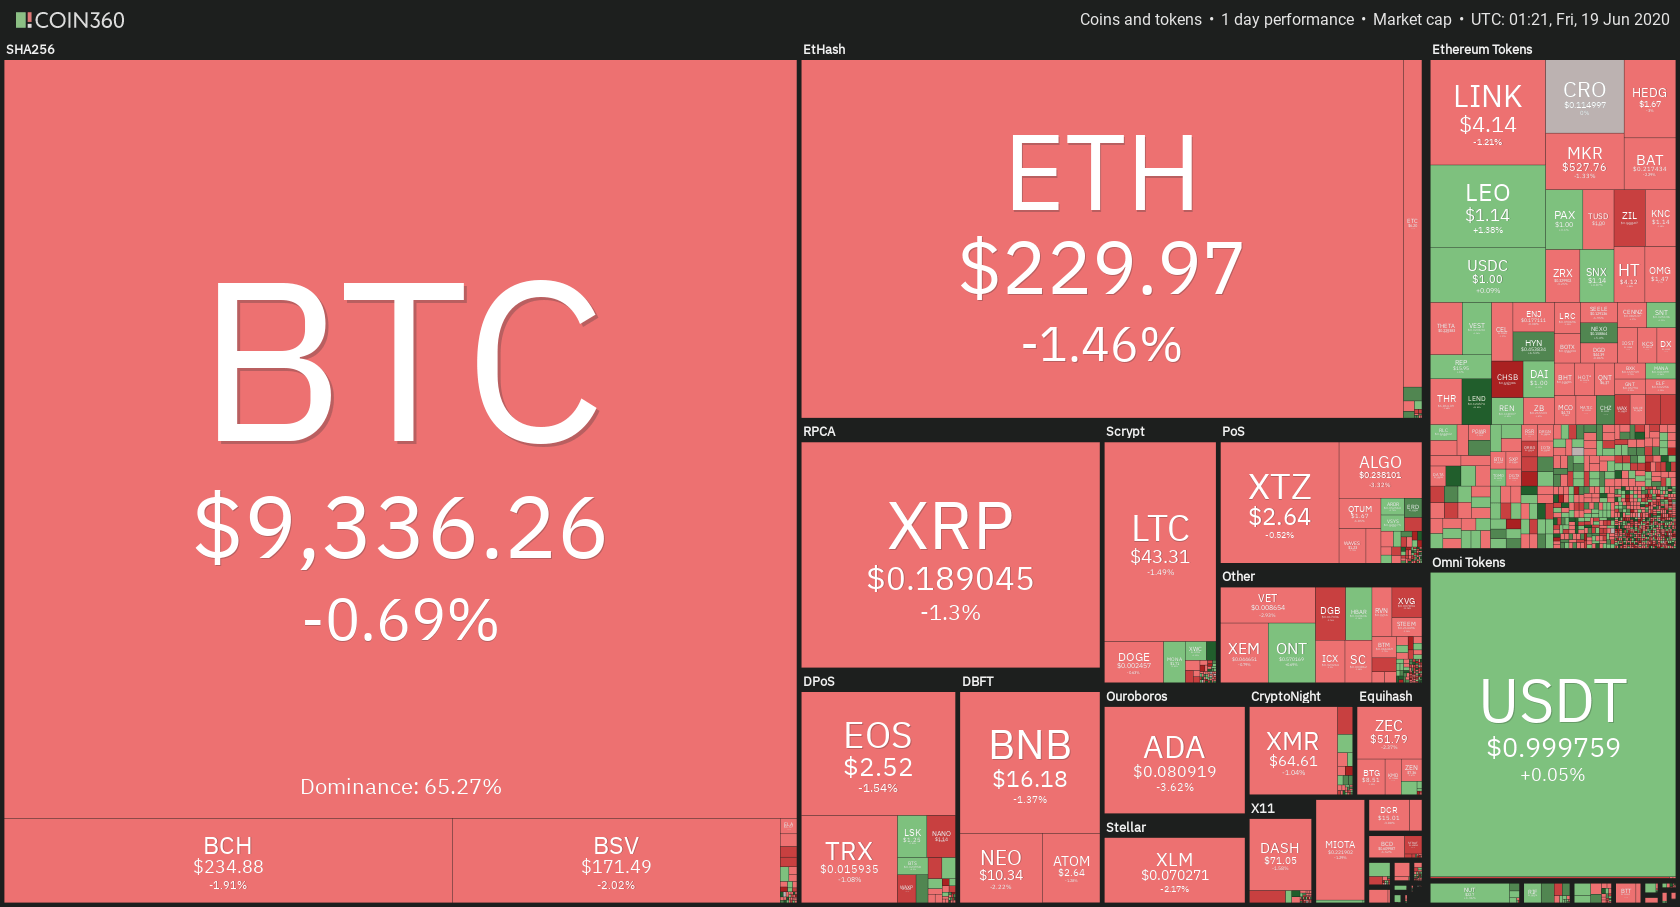
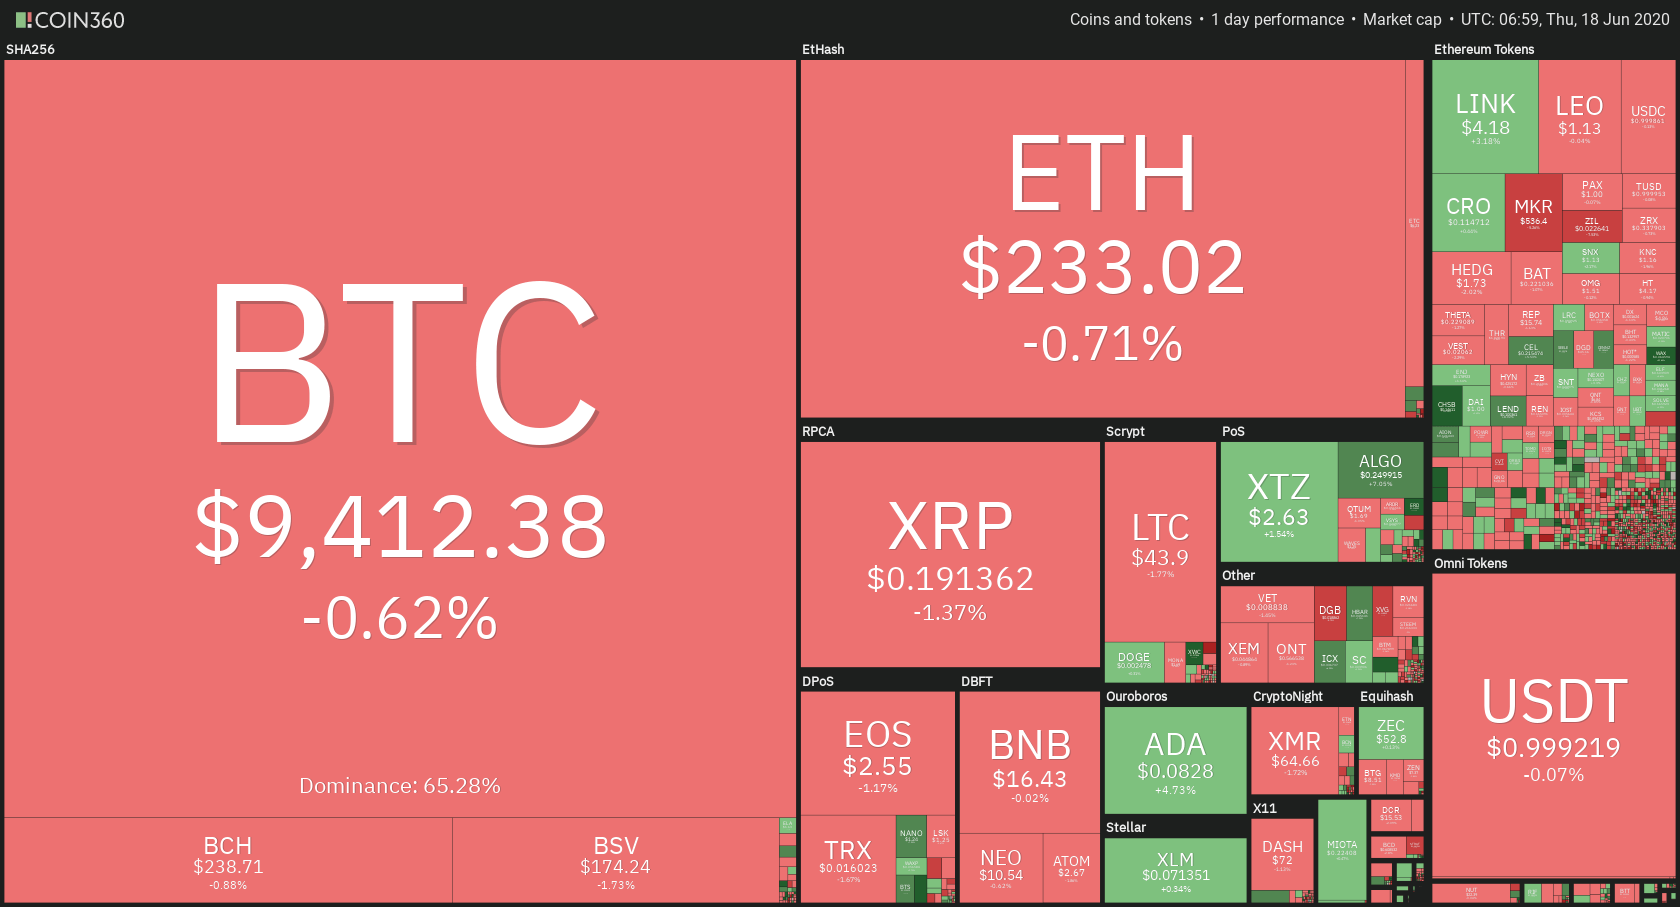
Daily Crypto Sector Heat Map
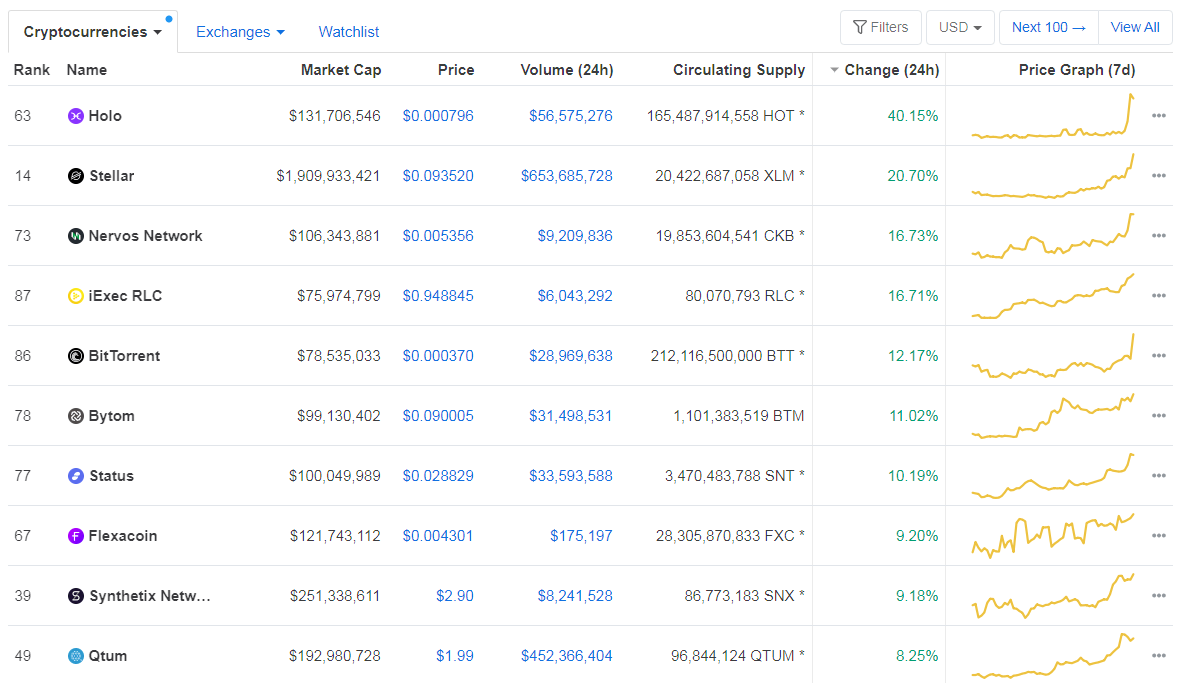
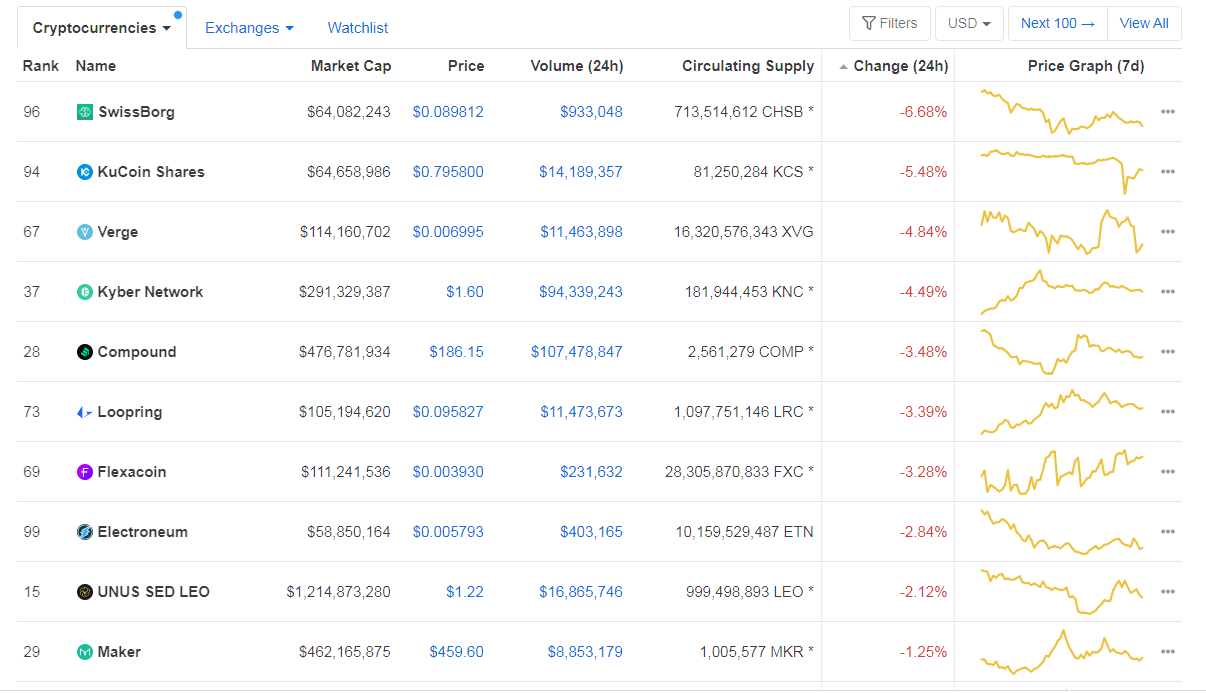
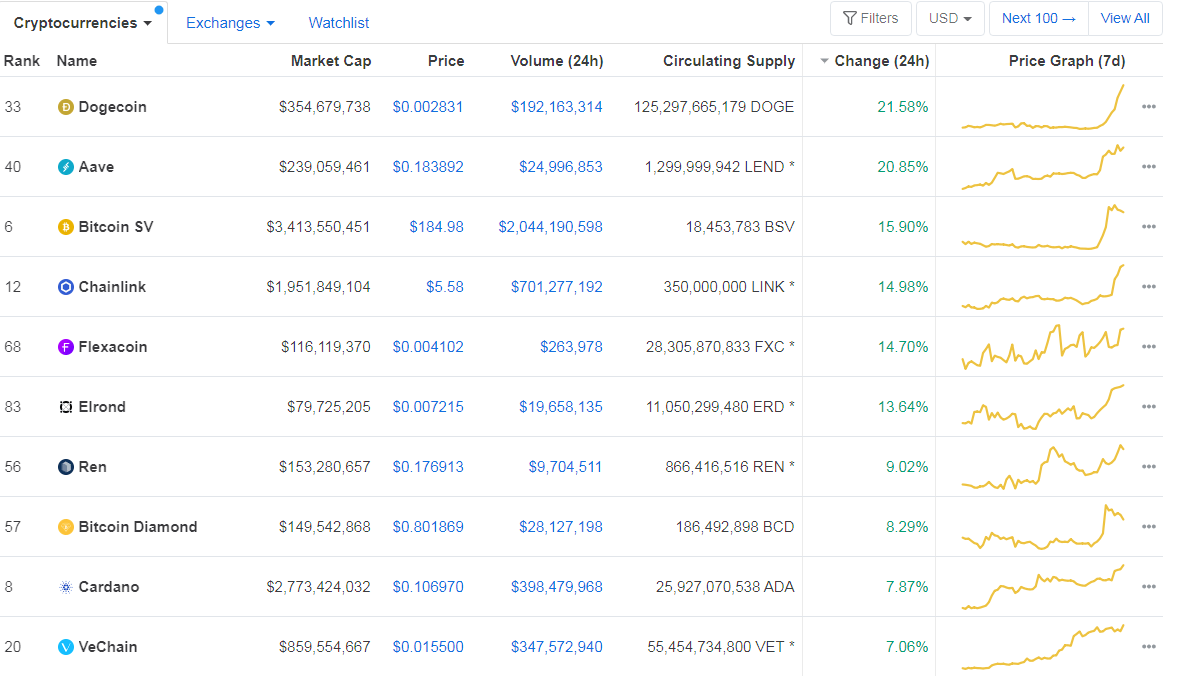
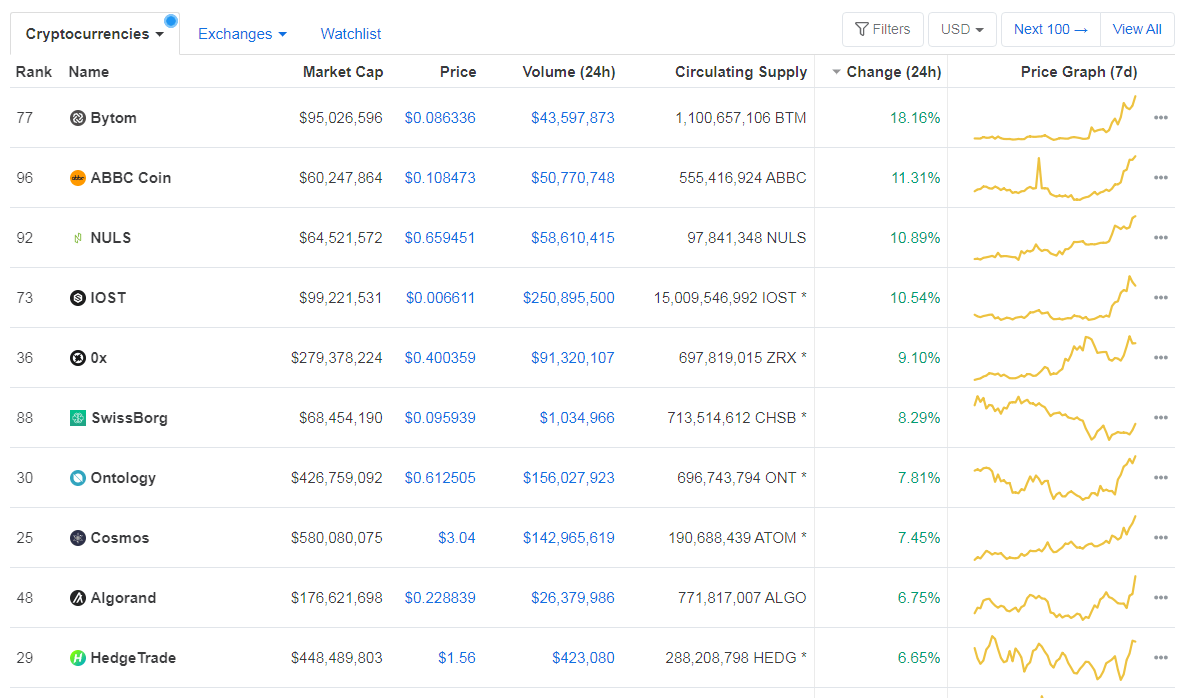
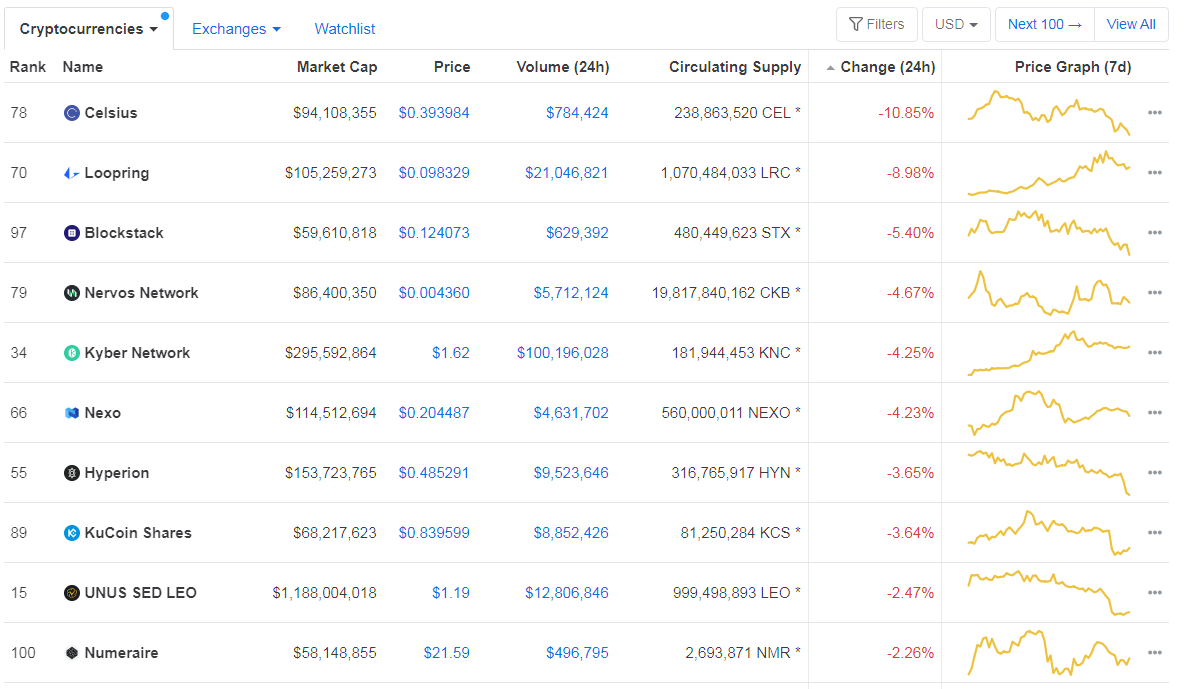
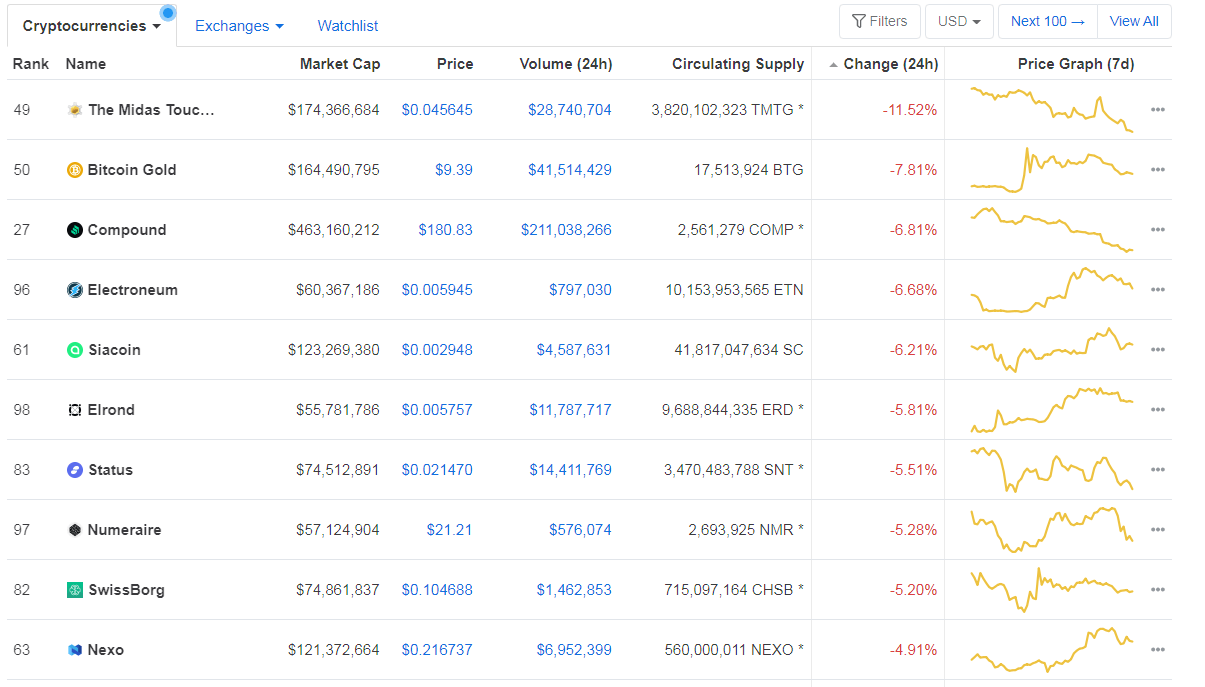
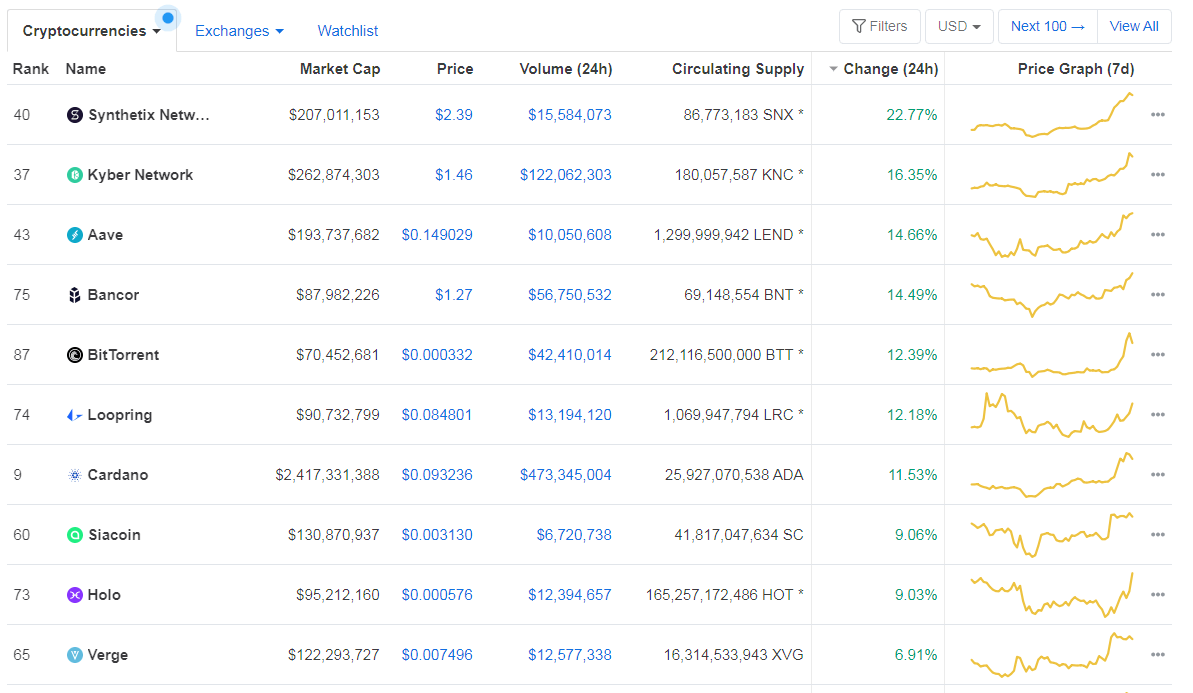
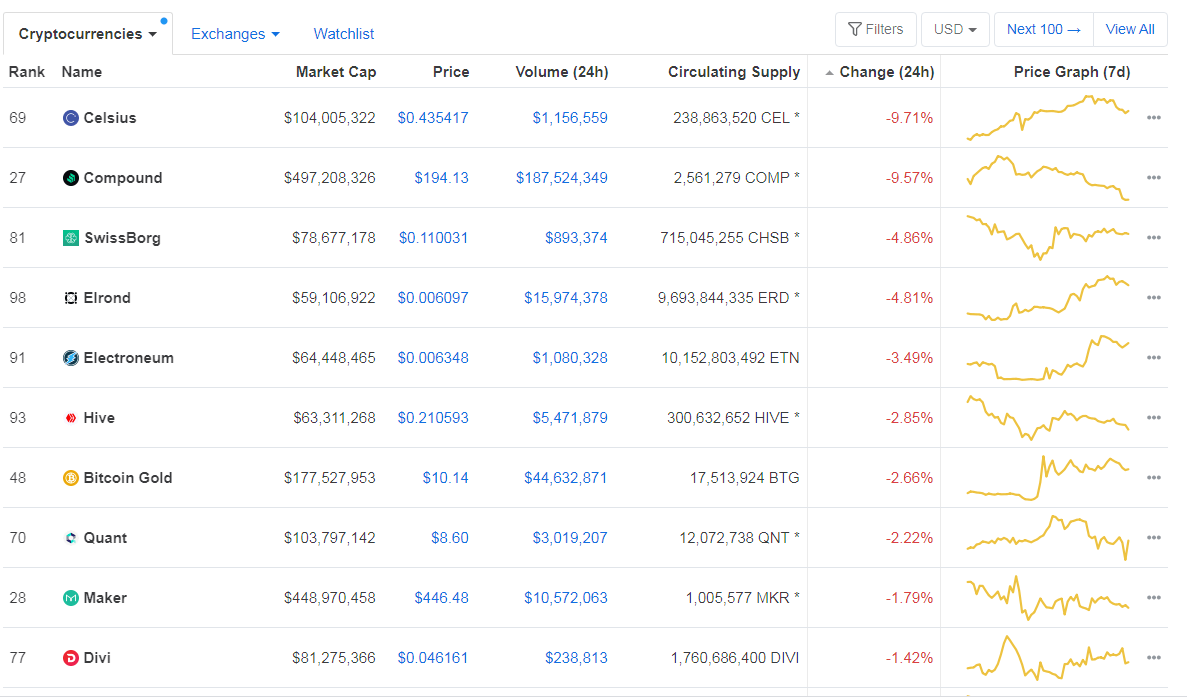
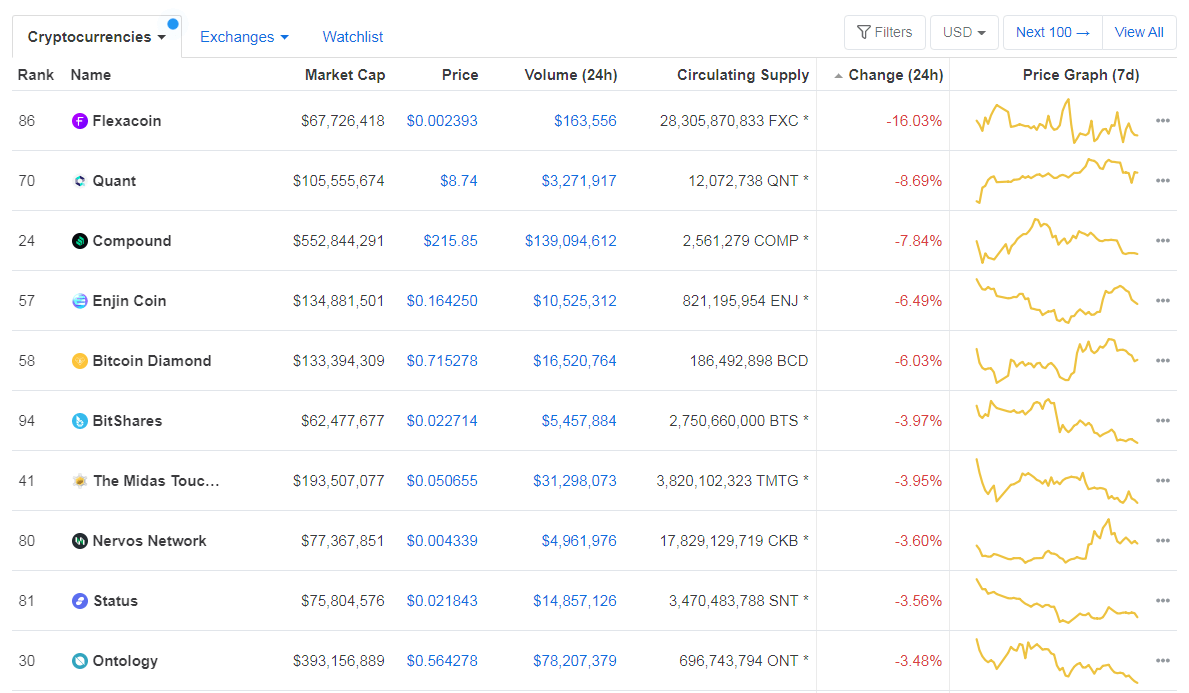
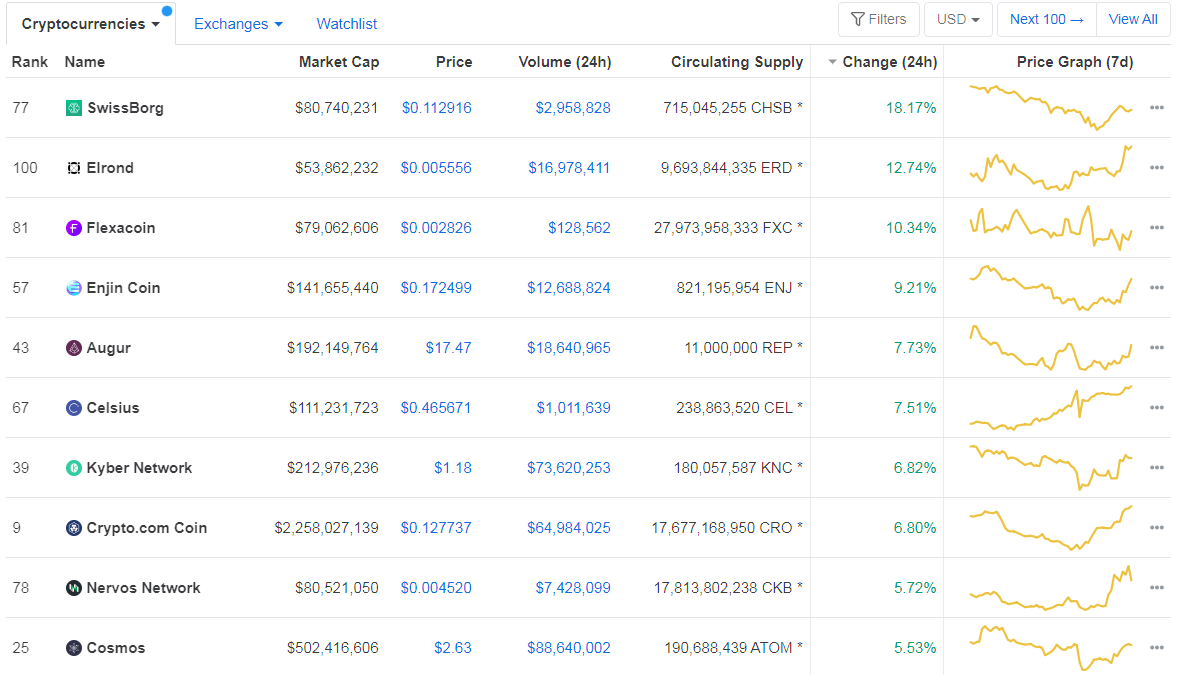
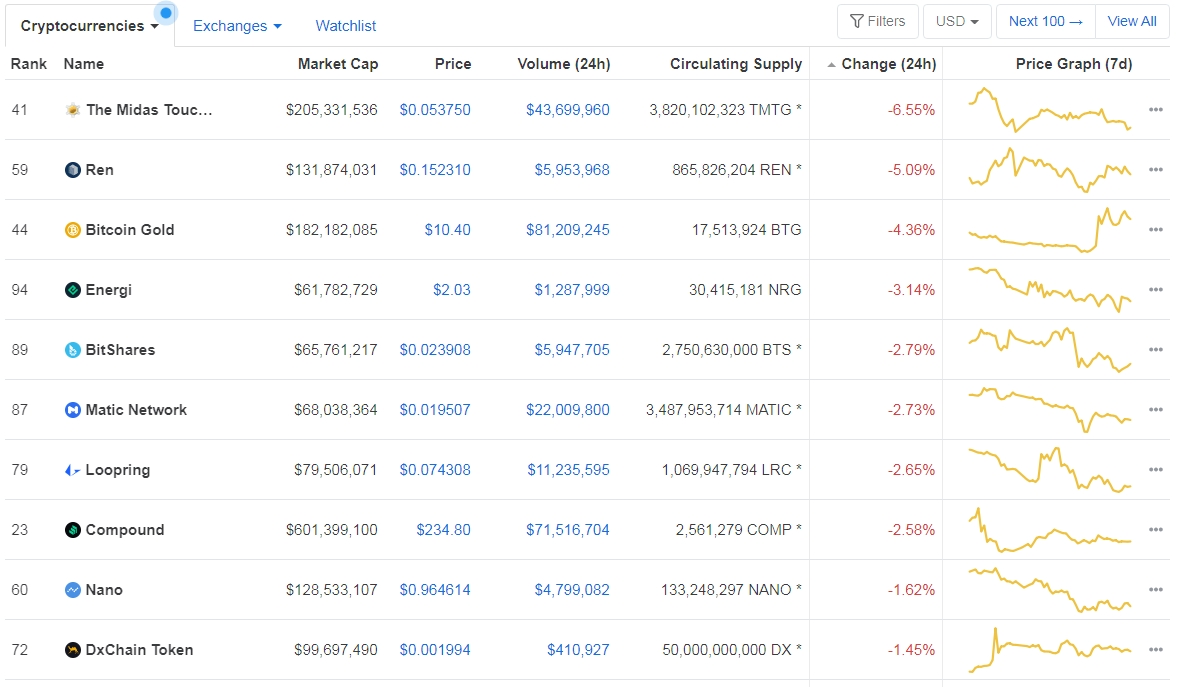
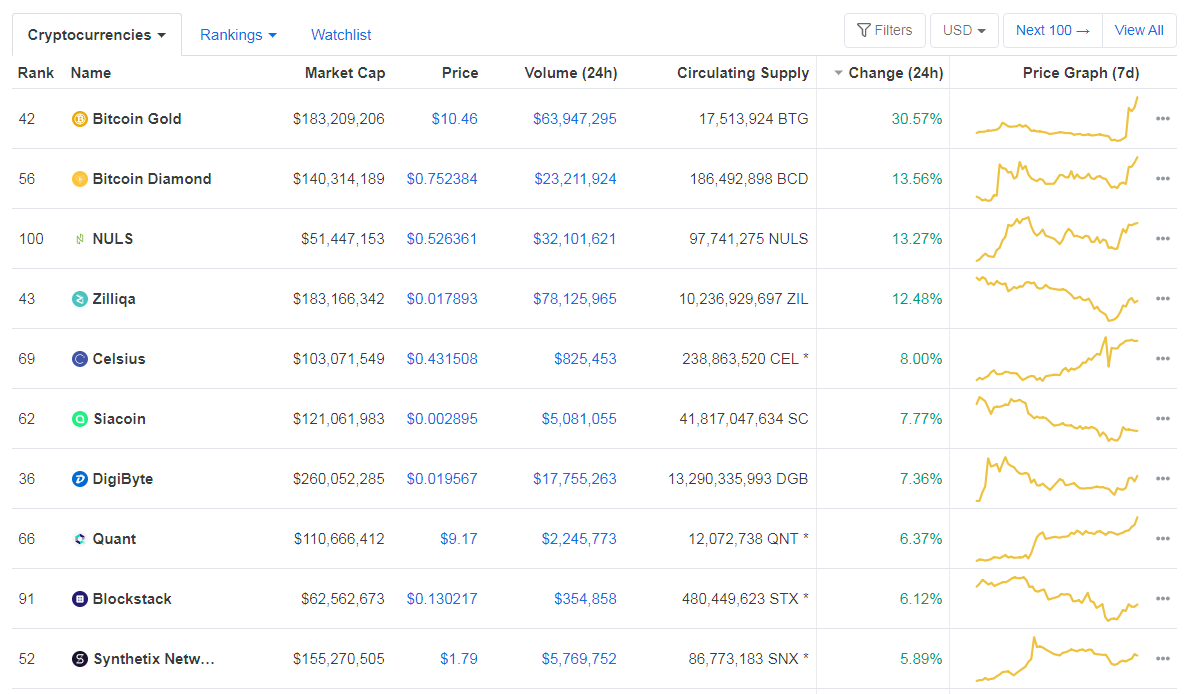
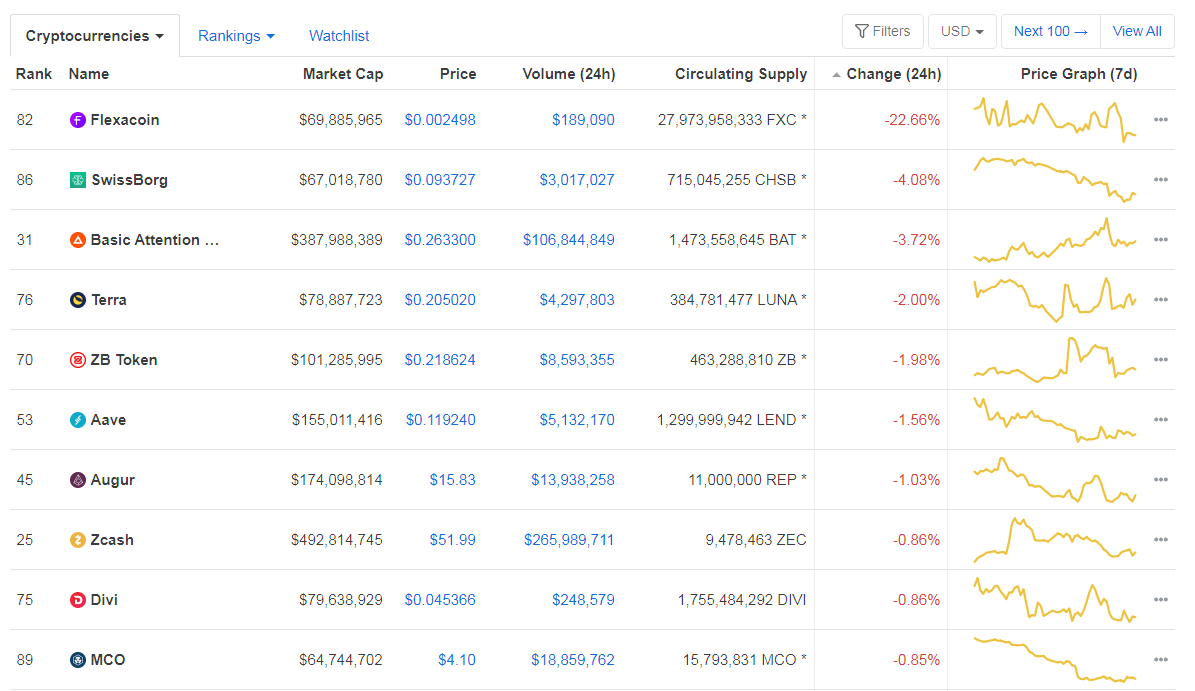
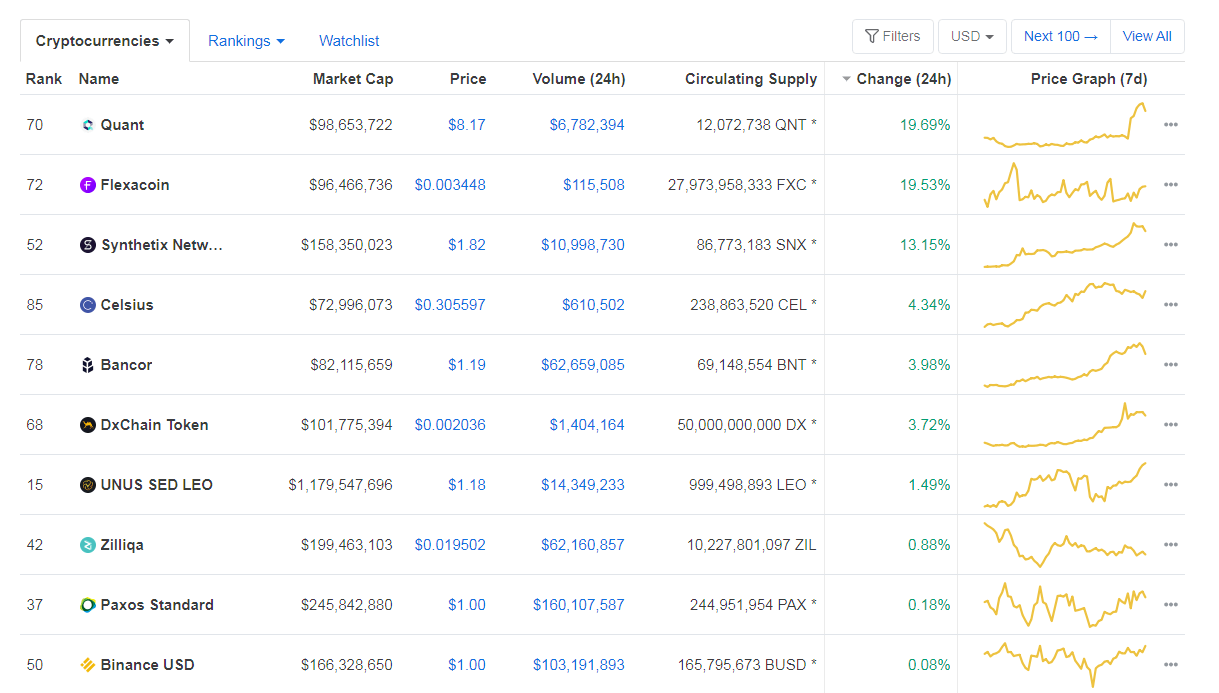
When talking about top100 cryptocurrencies, Holo gained 25.95% on the day, making it by far the most prominent daily gainer. Nervos Network (13.81%) and The Midas Touch (13.38%) also did great. On the other hand, Flexacoin has lost 13.72%, making it the most prominent daily loser. It is followed by Quant’s loss of 11.26% and Siacoin’s loss of 9.81%.
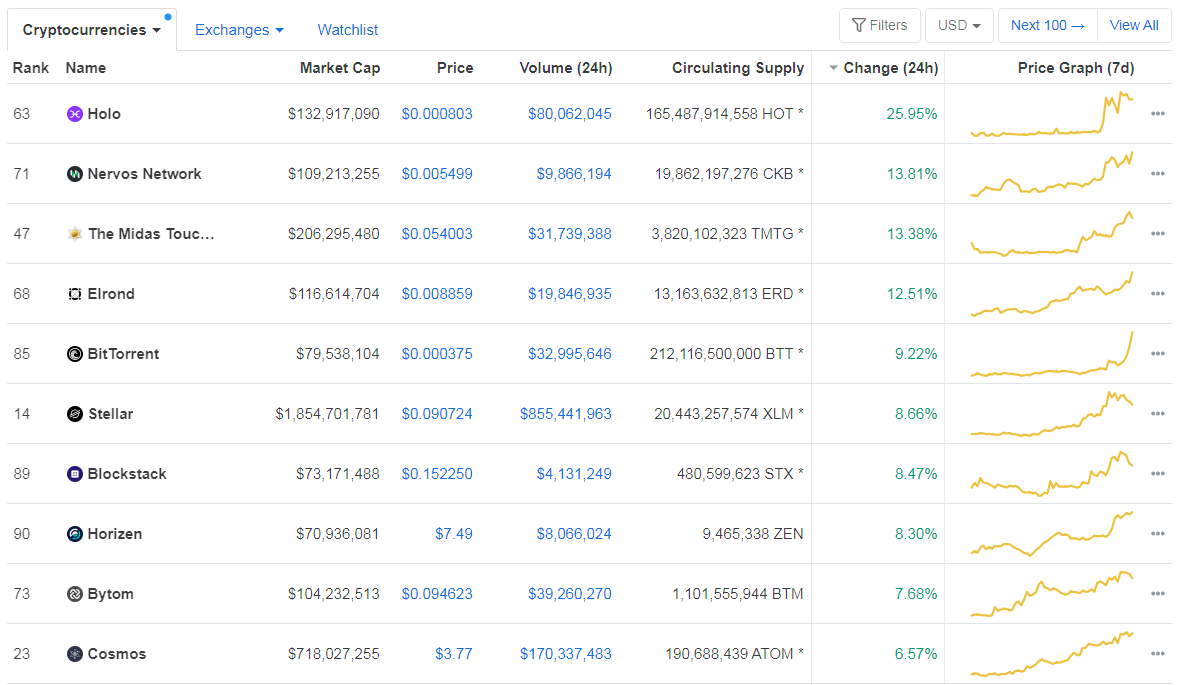
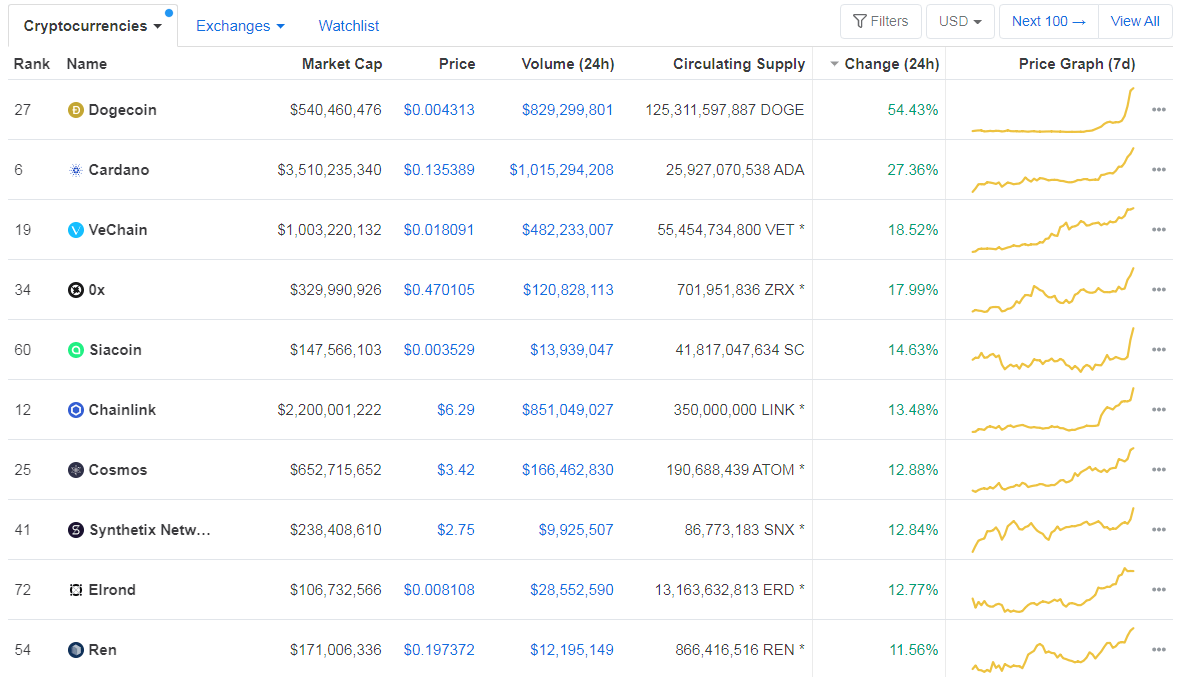
Top 10 24-hour Performers (Click to enlarge)
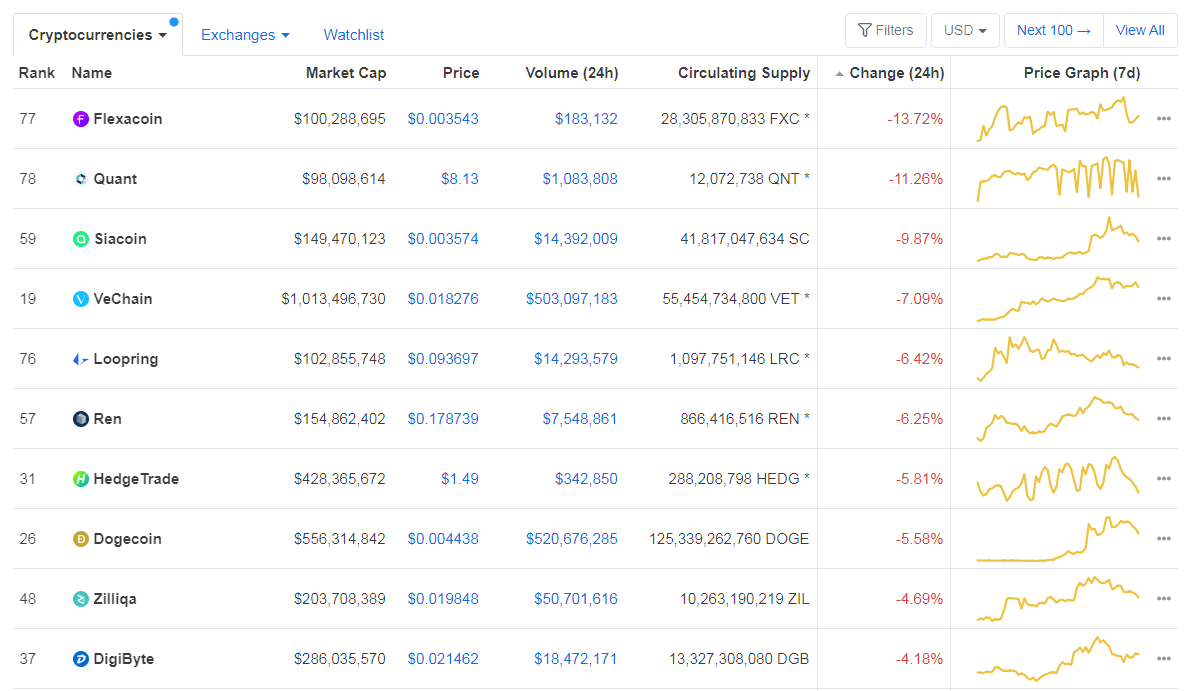
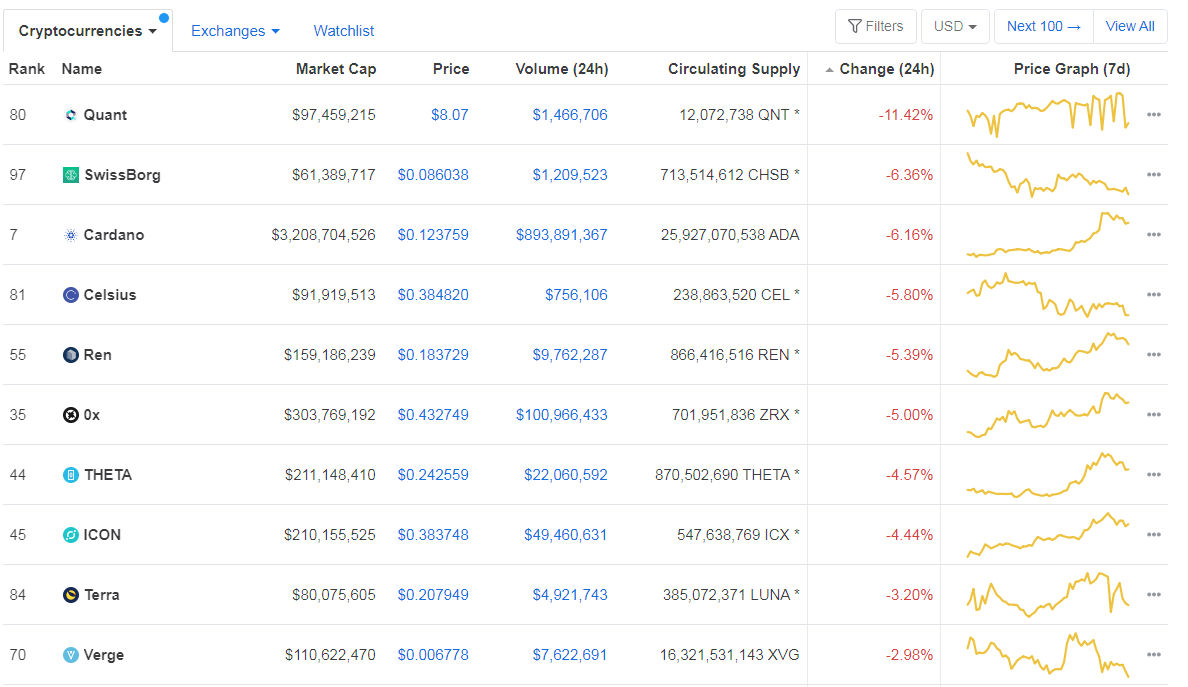
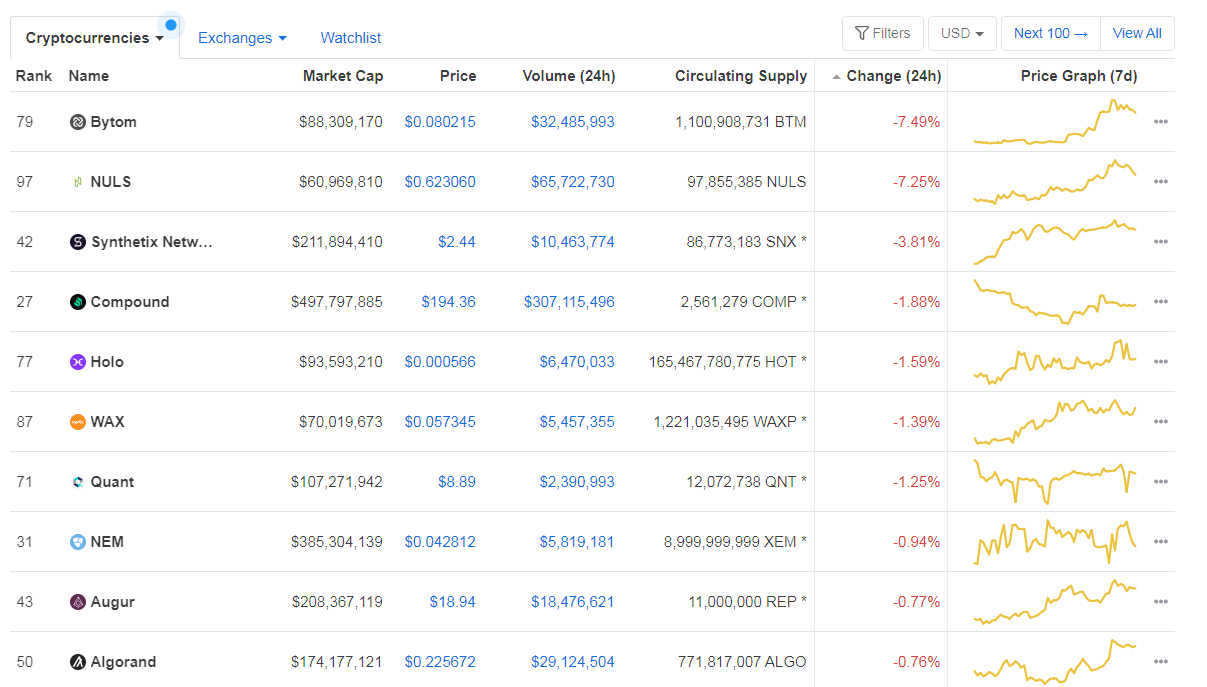
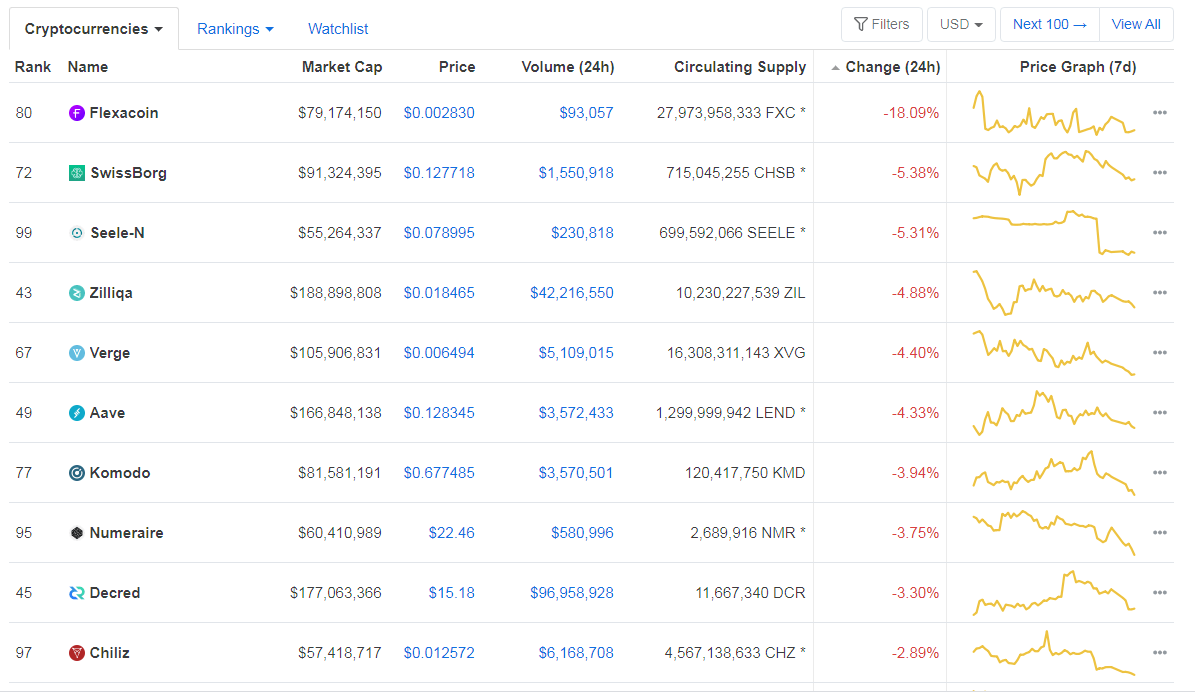
Bottom 10 24-hour Performers (Click to enlarge)
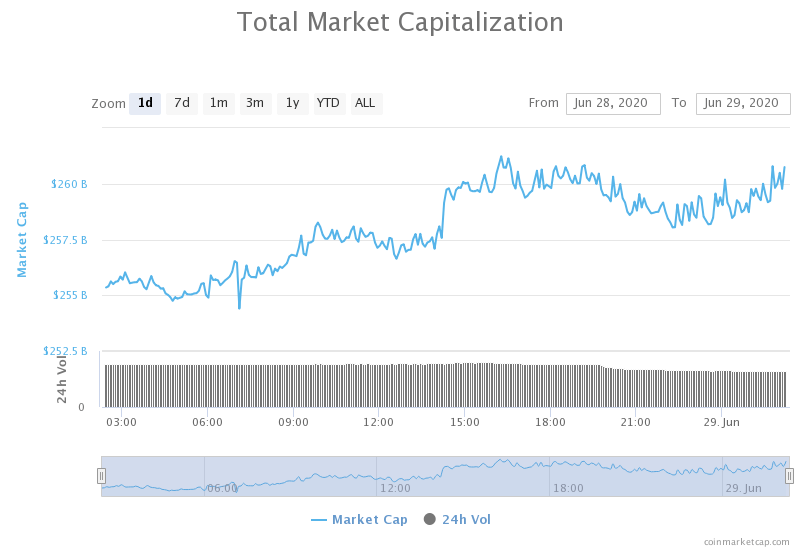
Bitcoin’s dominance level decreased slightly since we last reported, with its value currently at 63.29%. This value represents a 0.1% difference to the downside when compared to yesterday’s value.
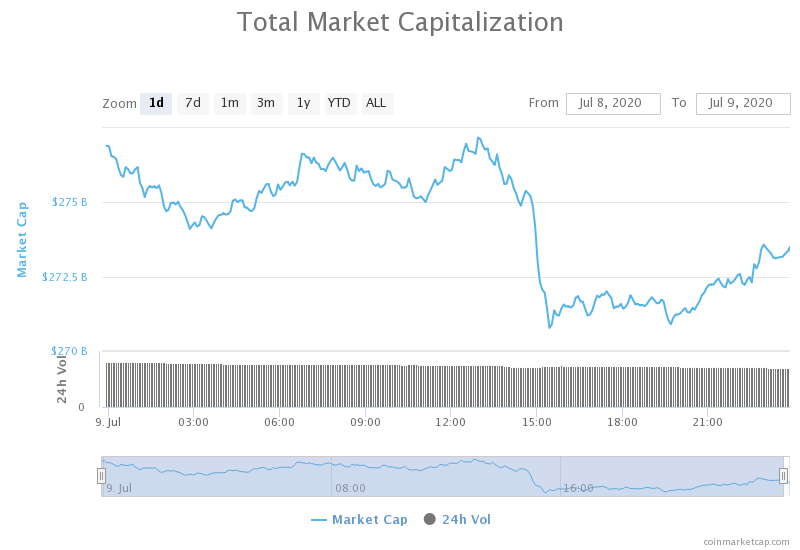
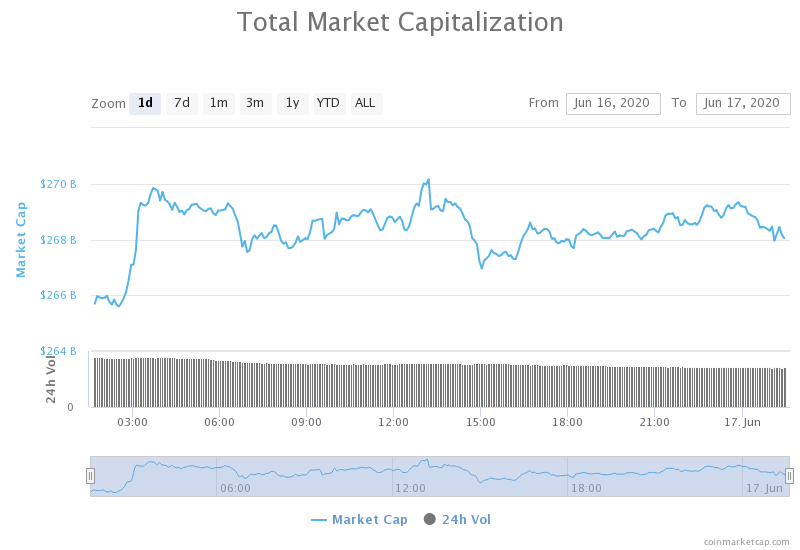
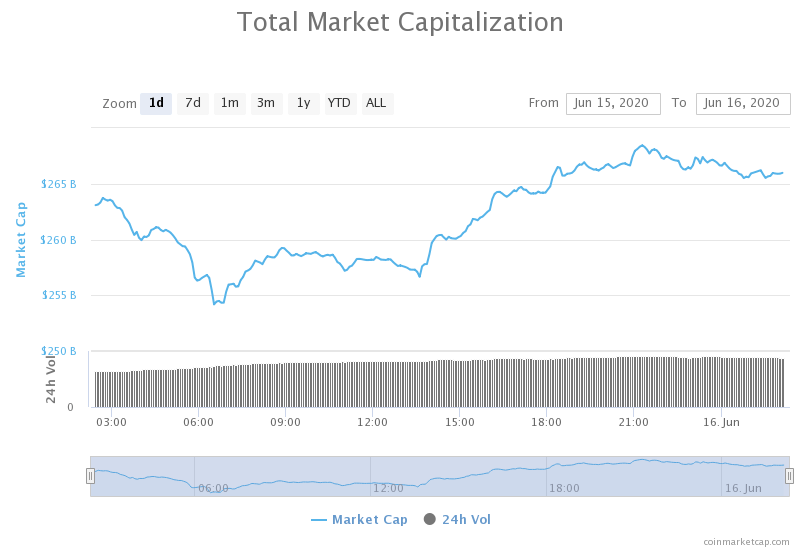
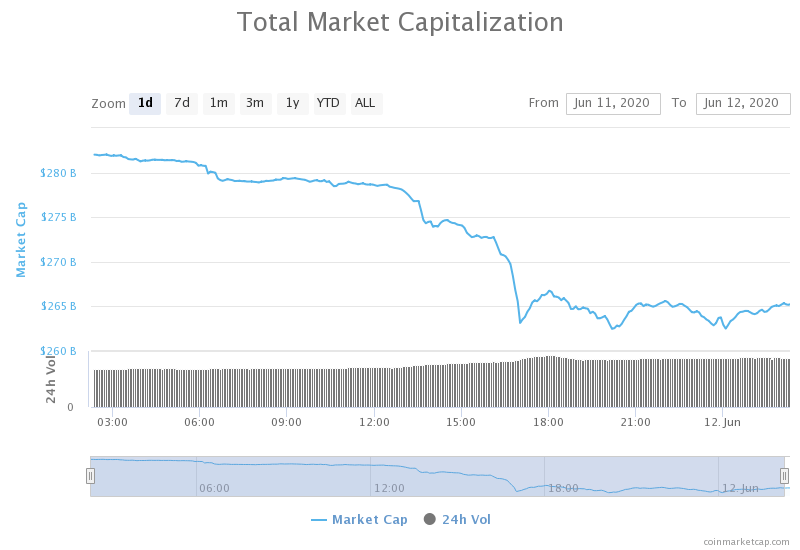
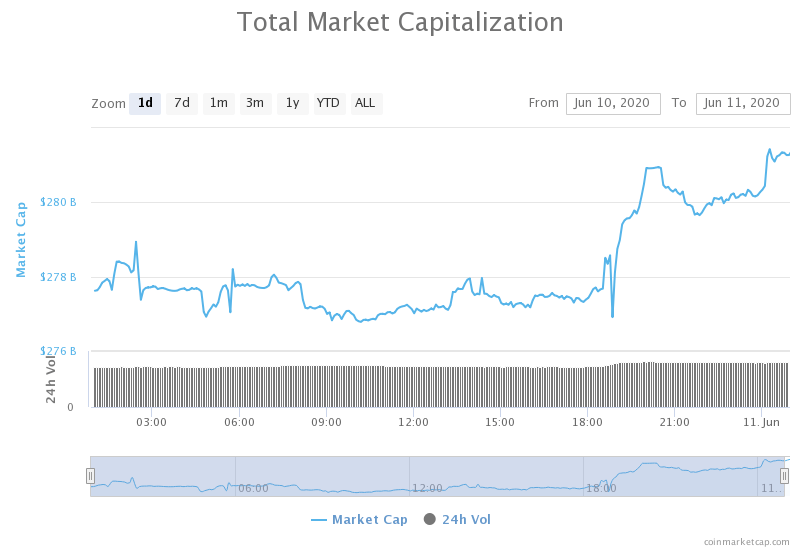
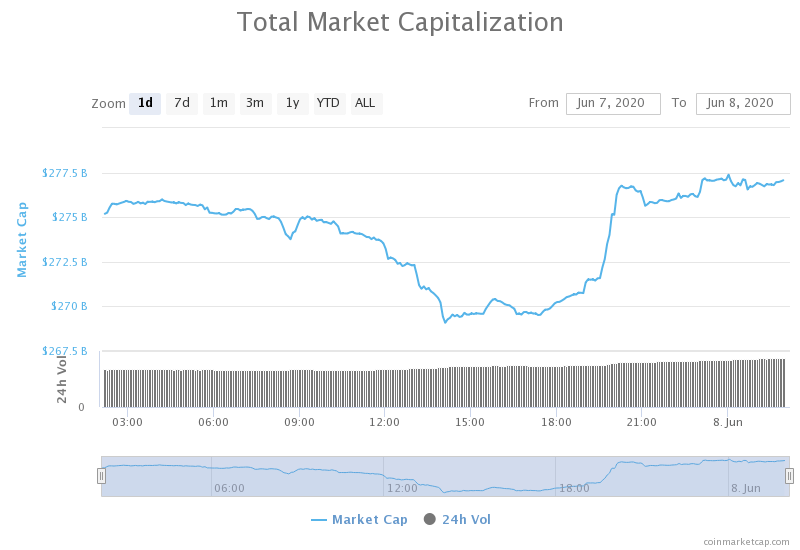
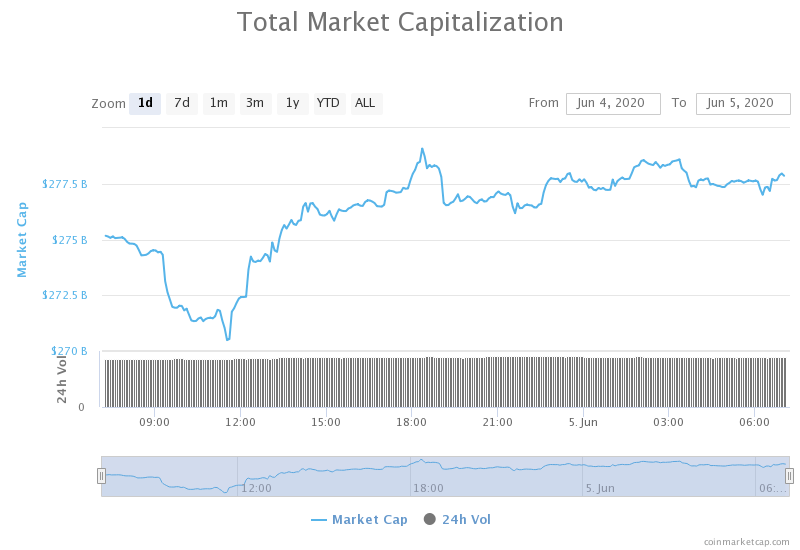
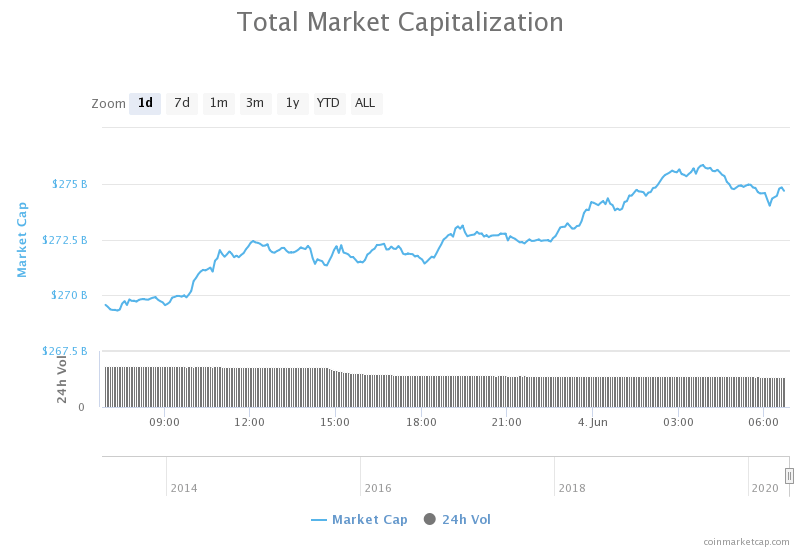
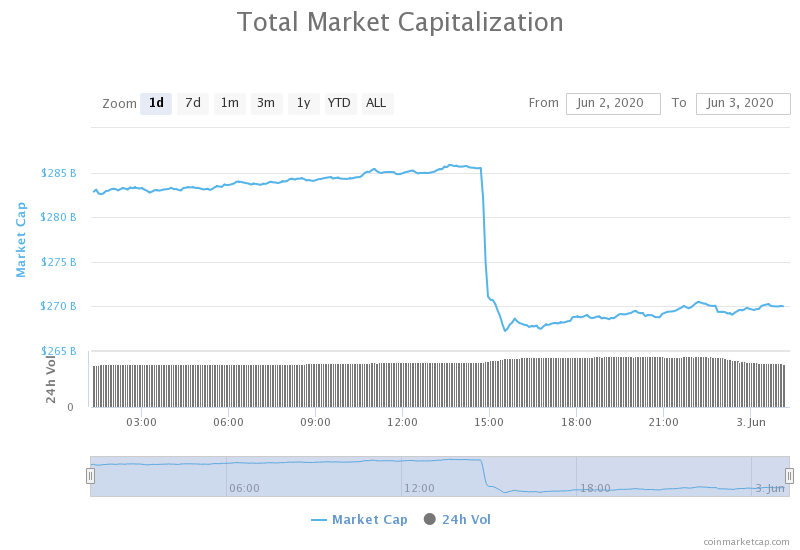
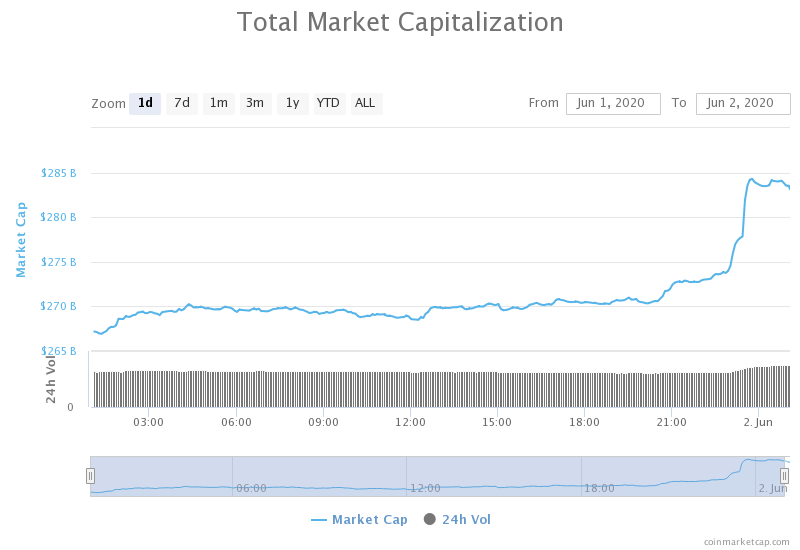
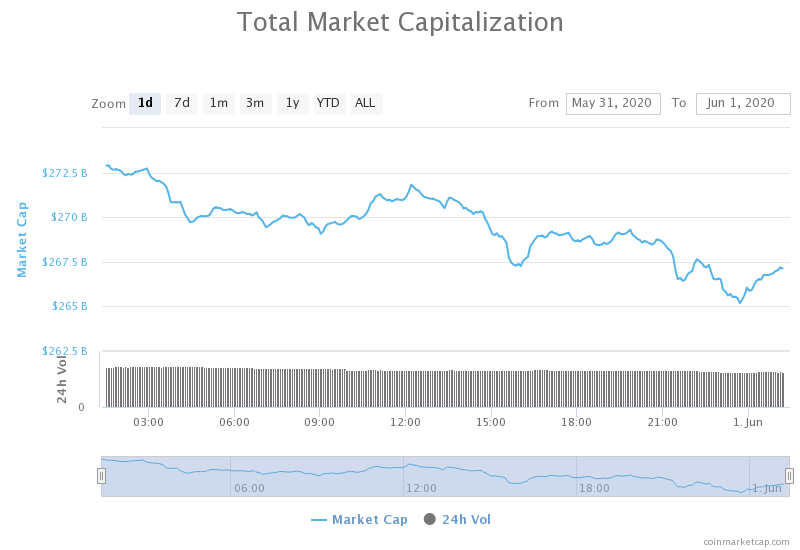
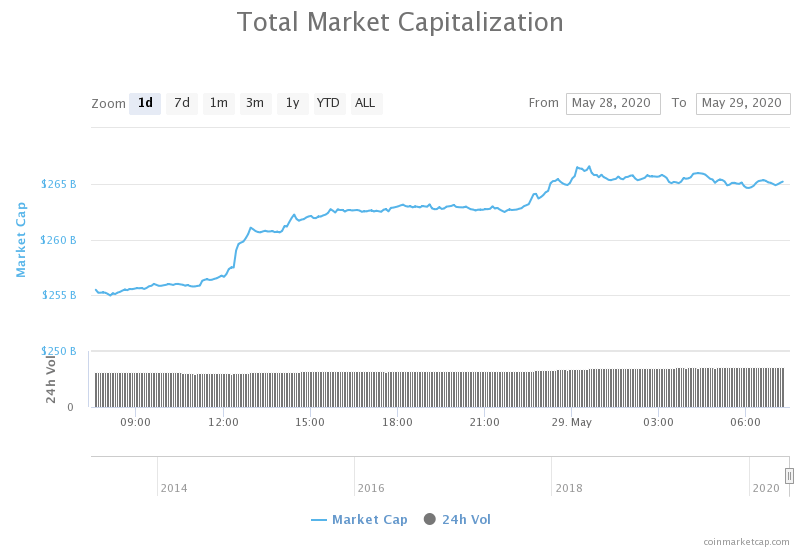
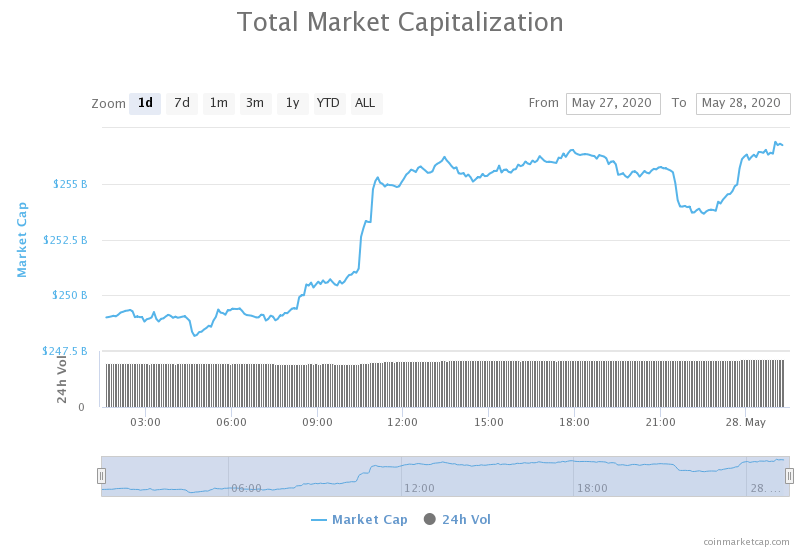
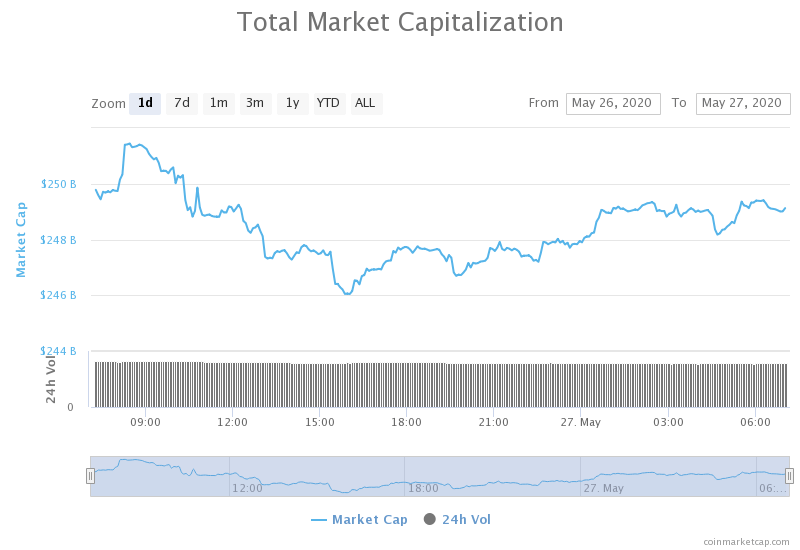
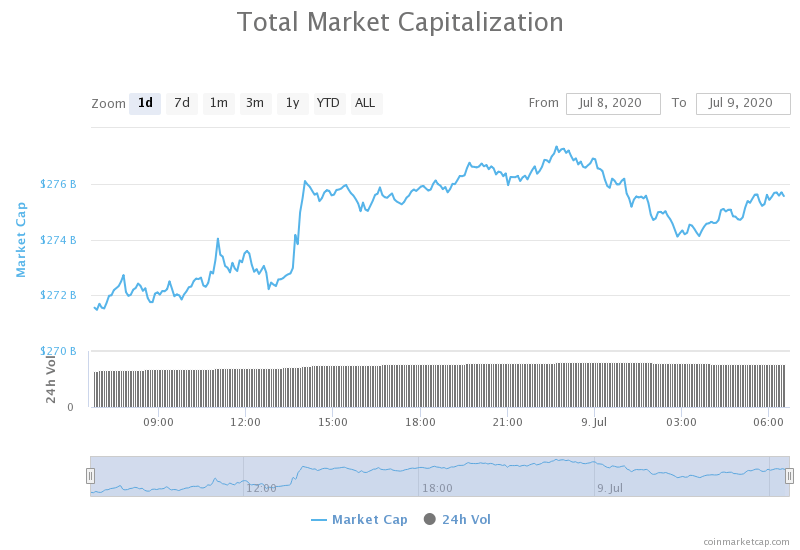
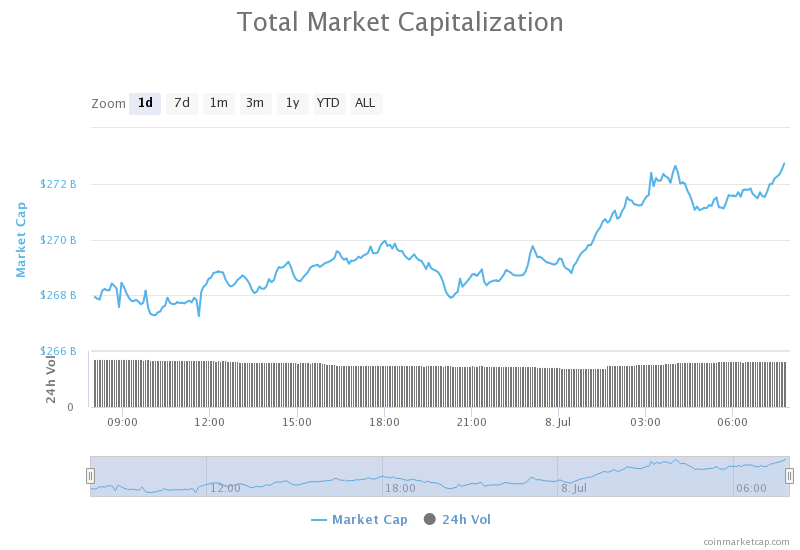
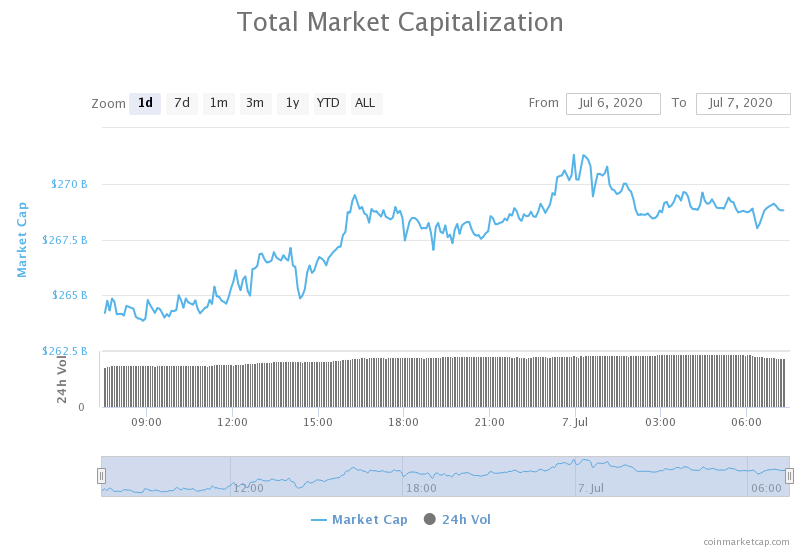
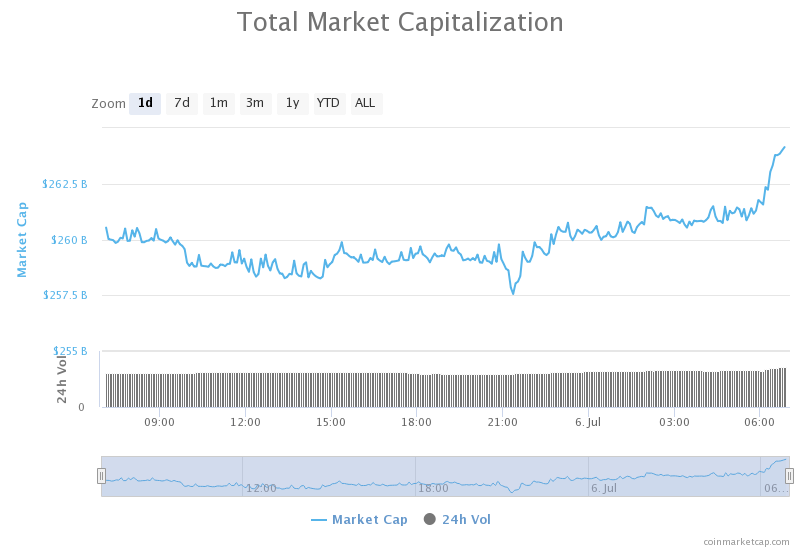
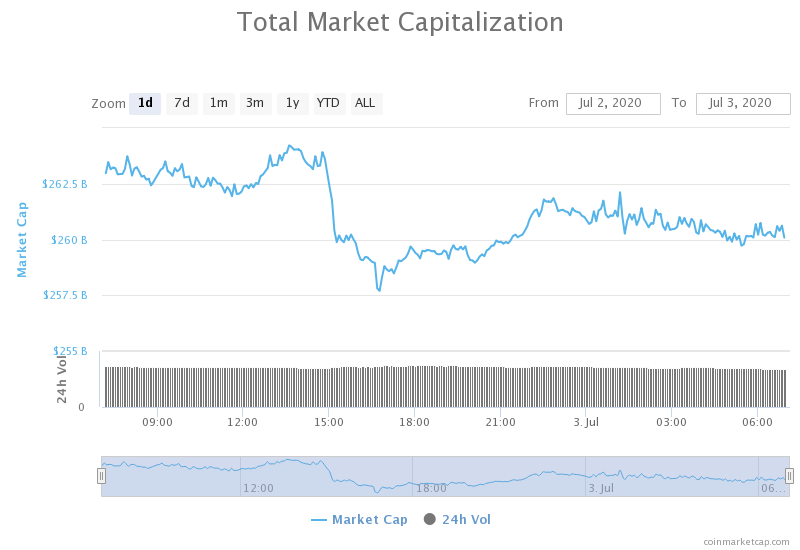
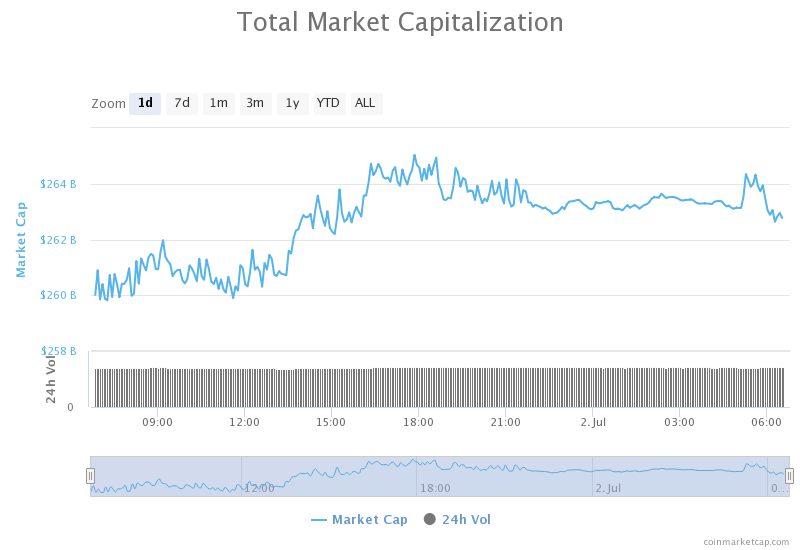
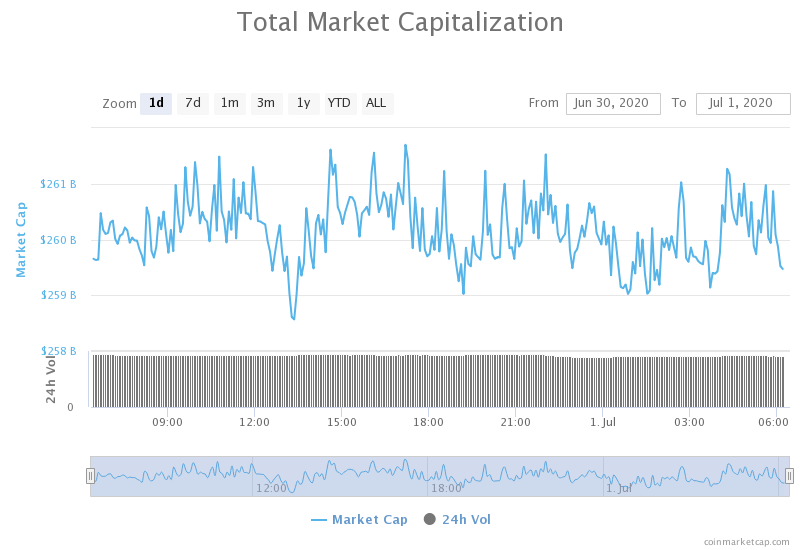
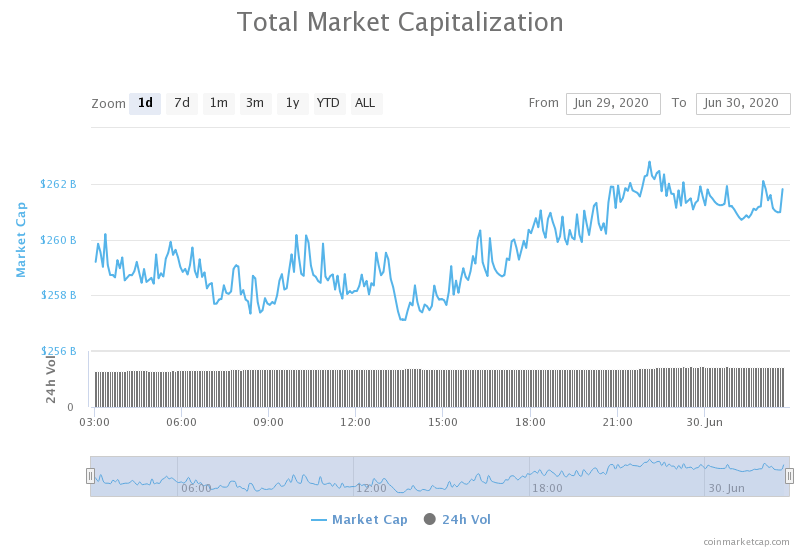
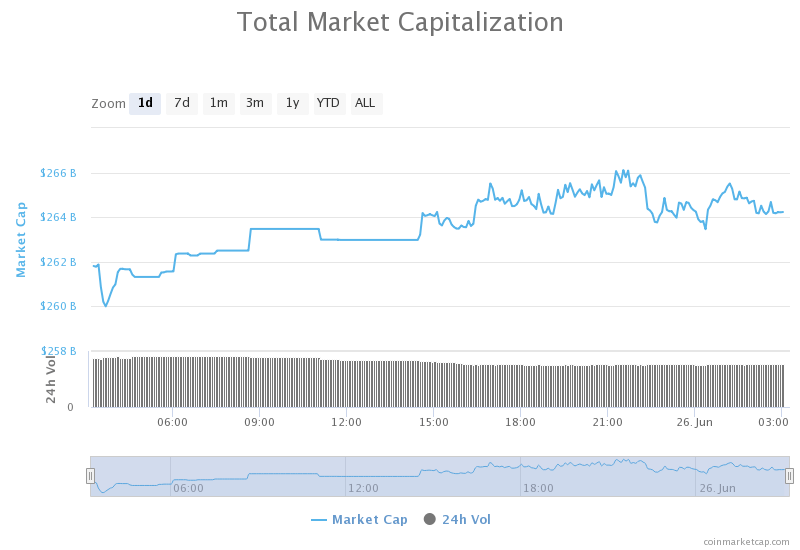
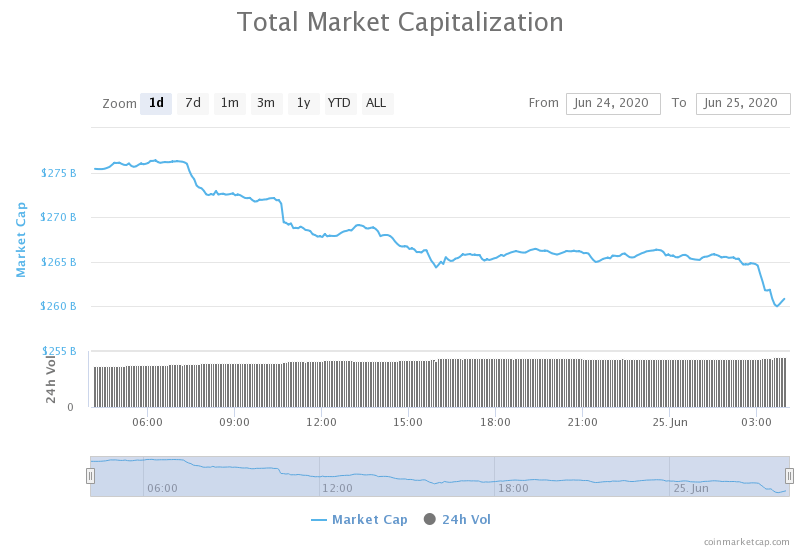
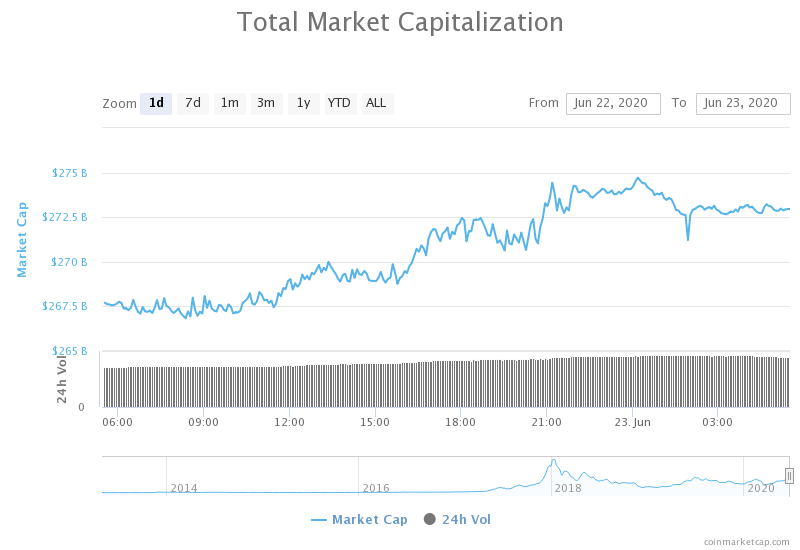
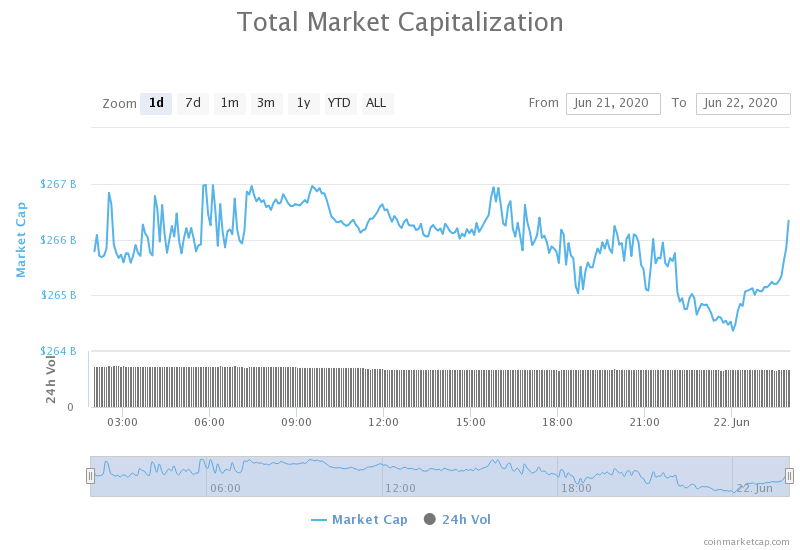
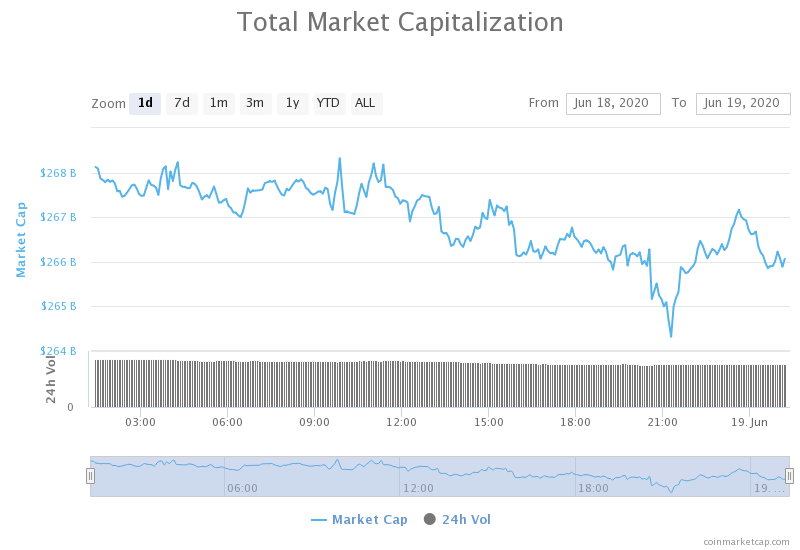
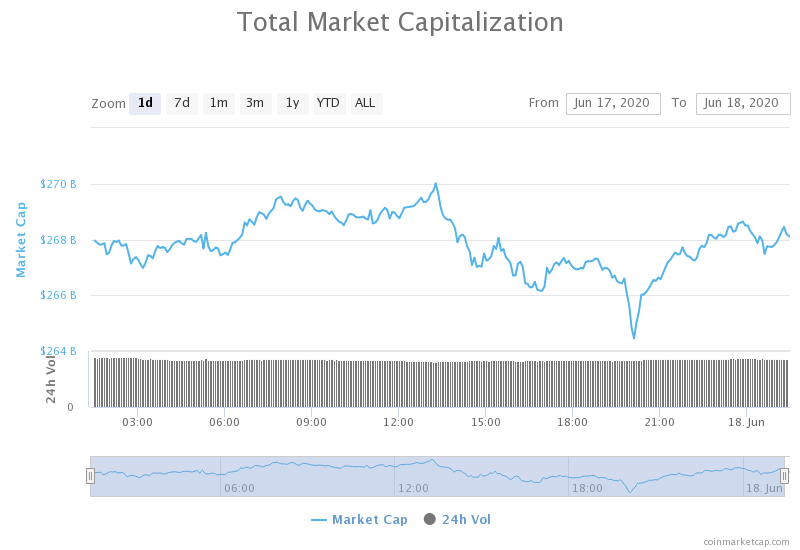
Daily Crypto Market Cap Chart
The cryptocurrency market capitalization decreased when compared to when we last reported, with the market’s current value being $273.13 billion. This value represents a decrease of $2.57 billion when compared to the value it had yesterday.
_______________________________________________________________________
What happened in the past 24 hours?
_______________________________________________________________________
- Switching Bitcoin to 100% ASIC Mining Could Increase Security 2000X (Cointelegraph)
- Tether-Bitfinex Must Stand Trial Over $850 Million in Lost Customer Funds (Cryptobriefing)
- Tether Can Freeze Your USDT, 39 Addresses Containing Millions Blacklisted (Cryptobriefing)
- Coinbase Is Preparing to IPO, Big Win for Crypto (Cryptobriefing)
- ‘Libra Will Never See The Light Of Day’: Monetary Historian (Cointelegraph)
- Smart Contracts ‘Have Limited Potential’ Without IoT Sensors (Cointelegraph)
- Bitcoin and the need for financial privacy (The Block)
- Why Vanguard is convinced it needs a blockchain for over-the-counter FX trading (The Block)
- Binance CEO has an explanation for a possible TikTok-driven altseason (Cryptoslate)
- BitClub Programmer Admits Mining Scheme Stole $722M in Bitcoin (Coindesk)
_______________________________________________________________________
Technical analysis
_______________________________________________________________________
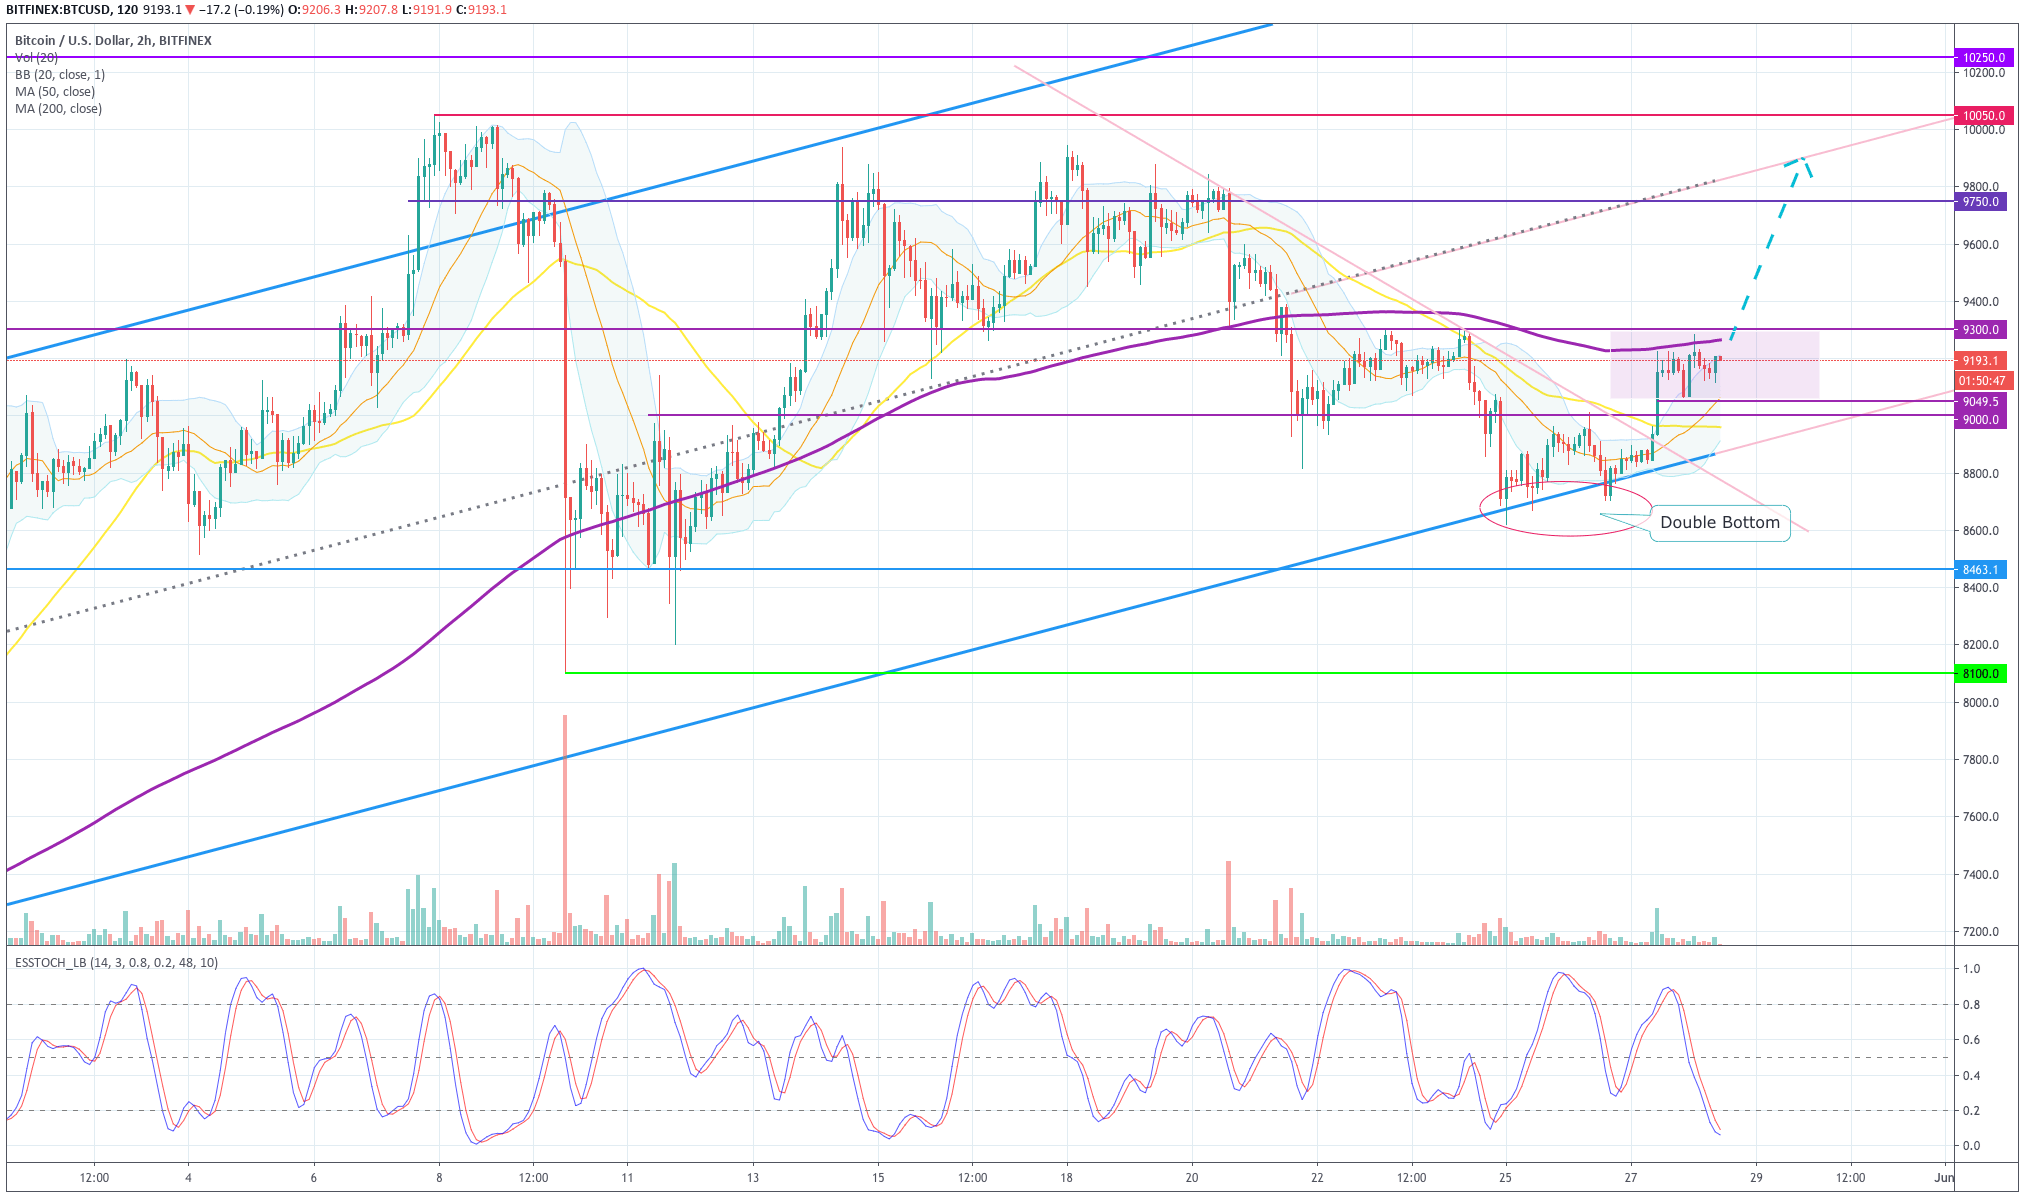
Bitcoin
The largest cryptocurrency by market capitalization had a red day, as bears pushed the price back down towards the $9,000. The descending line Bitcoin broke previously fell under the bearish pressure, and Bitcoin started rushing towards the downside. The bearish move got stopped by the $9,120 level, which held up quite nicely. However, bears have not reached exhaustion, which means that the $9,120 level is not safe yet.
BTC trades should look for the retracement move for a safe trade.
BTC/USD 4-hour Chart
Technical factors:
- Price is below its 50-period EMA and its 21-period EMA
- Price at the lower B.B.
- RSI at the lower levels (37.8)
- Increased volume
Key levels to the upside Key levels to the downside
1: $9,580 1: $9,251
2: $9,735 2: $9,120
3: $9,870 3: $8,980
Ethereum
Ethereum made a move towards the downside as well, falling below the ascending line it previously broke, as well as below the $240 level. The move was (for now) stopped by the 4-hour 50-period moving average, and ETH seems to be starting a consolidation phase near the $240 level.
Ethereum traders should look for an opportunity in trading pullbacks from the moving averages or horizontal levels. They should also pay close attention to Bitcoin’s movement, as BTC is mostly the main factor that causes ETH’s volatility.
ETH/USD 4-hour Chart
Technical Factors:
- Price above the 50-period EMA and below the 21-period EMA
- Price slightly below the middle B.B. (20-period SMA)
- RSI near the middle (45.8)
- Increased volume
Key levels to the upside Key levels to the downside
1: $240 1: $228
2: $251.4 2: $225.4
3: $260 3: $217.7
Ripple
The third-largest cryptocurrency by market cap ended up in the red as well. After bulls reaching exhaustion at $0.212, bears took over and caused the price to reach the lows of $0.192, therefore breaking $0.205 and $0.2 support levels. XRP has strong support at the $0.19 line (both the horizontal support line and the 50-period moving average are there), so there is almost no chance XRP will move down (unless BTC makes a sharp move down).
XRP traders can look for an opportunity to trade in a range, as XRP is pretty much bound within $0.19 to $0.20 range unless BTC makes a move.
XRP/USD 4-hour Chart
Technical factors:
- XRP in a mid-term descending trend (though it broke the trend in the short-term)
- XRP lacks strong support levels below $0.178
- Price is below the 21 and above the 50-period EMA
- Price slightly below the middle B.B. (20-period SMA)
- RSI is neutral (50.6)
- Increased volume
Key levels to the upside Key levels to the downside
1: $0.205 1: $0.2
2: $0.214 2: $0.19
3: $0.227 3:$0.178


 Craig Wright’s legal team seems to have alleged that Wright controls one of the BTC addresses that is affiliated with the Mt. Gox hack.