Categories
Forex Market Analysis

Daily F.X. Analysis, May 12 – Top Trade Setups In Forex – U.S. Inflation Ready to Play! 

The latest economic data from the United States fueled expectations that the Federal Reserve will stimulate more in the next meeting, and markets started to price in for a negative interest rate environment. Donald Trump, while considering the state of Beijing amid coronavirus lockdown, threatened to impose new tariffs if China failed to buy $200 worth U.S. farm goods. After that, trade representatives from both sides held a meeting via phone call and announced a positive report hence created optimism about the US-China relationship.

Economic Events to Watch Today 


EUR/USD – Daily Analysis

The EUR/USD prices were closed at 1.08066 after placing a high of 1.08504 and a low of 1.08004. Overall the movement of the EUR/USD pair remained bearish throughout the day.

EUR/USD pair dropped on Monday and posted a fresh daily low of 1.0801. The downward trend of the EUR/USD pair was due to the strength of the U.S. dollar. The U.S. Dollar Index was up by 0.45% and was back to above 100.00; it was pushed by higher U.S. yields on Monday.

On the data front, at 13:00 GMT, the Italian Industrial Production in the month of March showed a decline in production activity by 28.4% against the forecasted decline of 20.0%. It weighed on single currency euro and added in the downward track of EUR/USD pair. 

Furthermore, the EUR was also affected by the news about filing a case against the German constitutional Court. On Sunday, the European Union Commission announced that it could open a legal case against the German Constitutional Court ruling of European Central Bank’s easing programs.

The president of the European Commission, Ursula von der Leyen, has said that the judges in the German Constitutional Court have overreached their authority by calling the part of ECB’s bond-buying program illegal, which was critical and necessary to stabilize the economy in coronavirus crisis.

However, the loss in EUR/USD prices gained after new six coronavirus cases started to reappear from Wuhan city after more than a month when lockdown restrictions were eased in the city, which is considered as the epicenter of coronavirus outbreak.

The E.U. and U.K. resumed talks on Monday with rising pressure on both sides to make some progress as the deadline to reach a deal is coming closer. 2 rounds of talks have been made, which included first face-to-face in March and another in April via video conference.

Daily Support and Resistance  

  • R3 1.089
  • R2 1.0871
  • R1 1.084

Pivot Point 1.082

  • S1 1.0789
  • S2 1.0769
  • S3 1.0738

EUR/USD– Trading Tips

The EUR/USD price is trading slightly bearish below an immediate resistance level of 1.0823, which is extended by the 50 EMA. On the 4 hour timeframe, the 50 EMA is pushing the EUR/USD pair around 1.0820. Below this, we may see EUR/USD prices falling until 1.0777, while bullish breakout of 1.0850 can lead EUR/USD prices towards 61.8% Fibonacci retracement level of 1.0869 level. Later today, the U.S. retail sales will help determine further trends in the EUR/USD prices. 

GBP/USD – Daily Analysis

The GBP/USD pair was closed at 1.23326 after placing a high of 1.24376 and a low of 1.22827. Overall the movement of GBP/USD pair remained bearish throughout the day. 

The GBP/USD pair remained relatively quiet above 1.2400 level at the start of the day but came under intense bearish pressure in late trading sessions. GBP/USD pair dropped to a fresh four day low of 1.2282 on the back of U.S. dollar strength and GBP weakness. However, it maintained to recover some of its losses in late session and ended up closing the day in a negative trend. 

The U.K. government has published its recovery-strategy on Monday, which noted that the coronavirus was expected to circulate for an extended period of time and with the periodic waves. According to the strategy, the financial measures taken by the government to cope up with the damage caused by coronavirus to the economy were very expensive and that these measures could not be sustained for a longer period.

Furthermore, PM Boris Johnson has said that different parts of the U.K. will stay in lockdown longer than other parts. He added that any wrong move would be disastrous for the U.K. economy, and they will show no hesitation in reintroducing the measures if needed.

On Sunday, PM Johnson announced that restrictions will be lifted from local travel and local parks after six weeks of lockdown and that workers who cannot do work from home like construction & manufacturing industries were encouraged to return to their jobs. 

However, he spared the details about how they could continue the work and not spread the virus. So, on Monday, groups representing U.K. businesses and workers criticized the government’s plan to ease lockdown. They complained that PM Johnson missed the crucial details while announcing the easing of lockdown, that how companies should prepare for safe return to work.

Daily Support and Resistance

  • R3 1.2577
  • R2 1.2508
  • R1 1.2422

Pivot Point 1.2353

  • S1 1.2268
  • S2 1.2198
  • S3 1.2113

GBP/USD– Trading Tip

The GBP/USD sideways trading continues in between a narrow trading range of 1.2360 – 1.2285. The Cable is still holding below 50 EMA, which is extending resistance around 1.2370 level today. On the 4 hour chart, the GBP/USD is gaining support at 1.2285 level while the 50 EMA and horizontal resistance stay at 1.2365 level. Today, the positive retail sales may drive the selling trend in the GBP/USD pair to lead its prices towards an immediate support level of 1.2280 and 1.2250. Conversely, the worse than expected retail sales data will lead the GBP/USD pair towards 1.2360 and 1.2450. 

USD/JPY – Daily Analysis

The USD/JPY pair was closed at 107.651 after placing a high of 107.766 and a low of 106.472. Overall the movement of the USD/JPY pair remained bullish throughout the day. USD/JPY pair climbed to 2 weeks high above 107.70 level on Monday on the back of U.S. dollar strength. The pair USD/JPY moved up by 0.85% on the day amid U.S. dollar strength due to increased risk-on market sentiment. 

The increased risk sentiment of the market made it difficult for JPY safe-haven currency to find demand on Monday hence gave a push to the USD/JPY pair prices. On Monday, the Bank of Japan signaled more measures in order to avoid the 2nd Great Depression caused by the coronavirus pandemic.

In its report published on Monday, BoJ announced that it would lift the cap from government & corporate bond purchases and also pointed to take additional measures if needed. BoJ had already decided to expand its monetary stimulus program on April 27 when it held its last meeting in which it described the current economic situation as “increasingly severe.”

BoJ, in its monthly meeting, forecasted that country’s economy would experience a contraction between 5 and 3 percent in the current year. Japan’s current coronavirus cases are recorded as 15,777, with 624 deaths. The increased number of appearing cases after the easing of lockdown has made BoJ take additional measures to put the world’s third-largest economy back on track.

On another note, on Monday, the Central Bank of Japan appointed its first woman executive director since it has originated. Tokiko Shimizu, a 55-year-old banker, was appointed as a first-ever female executive director in 138 years.

Daily Support and Resistance    

  • R3 109.37
  • R2 108.57
  • R1 108.12

Pivot Point 107.33

  • S1 106.88
  • S2 106.09
  • S3 105.64

USD/JPY – Trading Tips

The USD/JPY traded sharply bullish to place a high around 107.850 amid stronger U.S. dollar and the risk-on sentiment. On the 4 hour timeframe, the USD/JPY pair is now trying to exhibit some correction as it’s price fell from 107.850 area to 107.400 support zone. 

However, the 50 periods EMA are still suggesting strong odds of bullish bias, along with the MACD, which are also supporting the bullish trend in the USD/JPY pair. The violation of an immediate resistance level may extend buying until 107.900 level. Conversely, the closing of selling candles below 107.460 can continue selling bias until 107 and 106.850. The 50 EMA is supporting the bullish bias around the 106.650 area. All the best for today! 

Categories
Forex Market Analysis

Daily F.X. Analysis, May 11 – Top Trade Setups In Forex – Choppy Sessions In Play! 

The latest economic data from the United States fueled expectations that the Federal Reserve will stimulate more in the next meeting, and markets started to price in for a negative interest rate environment. Donald Trump, while considering the state of Beijing amid coronavirus lockdown, threatened to impose new tariffs if China failed to buy $200 worth U.S. farm goods. After that, trade representatives from both sides held a meeting via phone call and announced a positive report hence created optimism about the US-China relationship.

Economic Events to Watch Today 


EUR/USD – Daily Analysis

The EUR/USD currency pair failed to stop its Friday’s winning streak and rose just under the 4-hour chart 100-candle average at 1.0852 from the 1.0822 level, mainly due to the U.S. dollar weakness on the on back of the risk-on market sentiment. However, the reason for the risk-on market sentiment could be attributed to the on-going optimism about the easing of coronavirus-led restrictions in the U.S. and around the world. 

The EUR/USD is trading at 1.0848 and is consolidating in the range between 1.0825 and 1.0851. At the USD front, the U.S. dollar erased its gains from the earlier session as most of the countries plan to ease the lockdown. As in result, the investor’s confidence got boost in the wake of risk-on market sentiment.

On the other hand, the Netherlands and France are pushing the European Union (E.U.) to use trade policy instruments and tariffs, to ensure the implementation of international environmental and labor standards. The initiative came after E.U. and Britain have tried to negotiate about the new trade deal, and it has raised concerns that Britain might seek to undercut the E.U. labor & environmental standards to boost its competitiveness.

The involvement of pro-free trade Netherlands might be able to change the attitude of the European Union E.U. towards thinking on the need to protect domestic industry and job, as per a French Diplomat.

However, it will remain to see if the proposal by France and the Netherlands can get support from other members and considered by Trade Commissioner Phil Hogan, as we know Phil Hogan is scheduled to announce a policy review later this year although the increase of protectionism may weigh on the shared currency.

At the virus front, the number of confirmed coronavirus cases rose to 169,575, with a total of 7,417 deaths reported so far on Monday, While the cases increased slightly by 357 in Germany on Monday against Friday’s +667. The death toll increased by 22, as per the German disease and epidemic control center, Robert Koch Institute (RKI).

If talking about recoveries, so approximately 145,600 people are reported to have recovered from the coronavirus so far. Looking forward, the economic calendar is empty, and the pair is expected to continue taking cues from the action in the stock markets. The fresh virus updates will be key to watch.

Daily Support and Resistance  

  • S1 1.0722
  • S2 1.0783
  • S3 1.0811

Pivot Point 1.0843

  • R1 1.0871
  • R2 1.0904
  • R3 1.0964

EUR/USD– Trading Tips

The EUR/USD price is trading slightly bearish below an immediate resistance level of 1.0853, which is extended by the 50 EMA. On the 4 hour timeframe, the 50 EMA is pushing the EUR/USD pair around 1.0850. By the way, it’s the same level at which the EUR/USD completes the 50% Fibonacci retracement. Below this, we may see EUR/USD prices falling until 1.0780, while bullish breakout of 1.0850 can lead EUR/USD prices towards 61.8% Fibonacci retracement level of 1.0869 level. Above this, the next resistance may be found around 1.0900. Consider staying bearish below 1.0852 today. 

GBP/USD – Daily Analysis

The GBP/USD currency pair extended its Friday’s bullish moves and continued to take bids around 1.2432 while representing 0.16% gains on the day. As well as, the currency pair cheered the fresh optimism about easing lockdowns statements by UK PM Boris Johnson’s. Moreover, the reason for the bullish run-up of the GBP/USD pair could also be attributed to the expectations surrounding an extension of wage aid.

However, the pair’s traders are cautious about placing any strong bids ahead of the third round of Brexit negotiations between the U.K. and European Union (E.U.). The UK PM Boris Johnson recently took a step to ease the lockdown restrictions from level 4 to 3 of the new five-tier ranking system, whereas the meaning of level 1 will be that coronavirus is no longer existing.

As well as, the Tory government also announced that the people could join their workplaces from Monday to those who cannot work from home. The previous stance of government was only to go if they must have too, but now the government has announced that anyone who cannot work from homes like construction and manufacturing business should go to their works. 

On the other hand, the greenback gain traction in earlier sessions on optimism about easing lockdown restrictions, which eventually boosted the investor’s confidence in the market in the wake of risk-on market sentiment. Whereas, California, Michigan, and Ohio, three of the important states for U.S. manufacturing, permitted to open factories and some businesses, which eventually kept the U.S. dollar steady. While the U.S. Dollar Index that tracks the greenback against a basket of other currencies slipped 0.04% to 99.725 by 11: 25 PM ET (4:25 AM GMT).

At the coronavirus front, as per the latest report by the Department of Health, Britain’s COVID-19 death toll has increased by 269 to 31,855.

The UK Chancellor Rishi Sunak is expected to announce the extension of wage aid on Monday. The report hints that the Ministers are expected to extend the state bankrolling of wages by the end of September, although at a reduced rate of 60pc, while also boosted the salary packages of staff returned to work on a part-time basis.

At the US-China front, U.S. President Donald Trump fueled the US-China tension once again by claiming China for the virus outbreak, while China defied roughly. However, the UK PM Johnson has already rejected the agreement that ensures E.U. fishermen’s long-term access to British waters, while insisting the focus should be on annual negotiations.

Daily Support and Resistance

  • S1 1.2188
  • S2 1.2299
  • S3 1.2352

Pivot Point 1.241

  • R1 1.2464
  • R2 1.2521
  • R3 1.2632

GBP/USD– Trading Tip

The GBP/USD continues trading bearish below 50 EMA, which is extending resistance around 1.2420 level today. On the 4 hour chart, the GBP/USD is gaining support at 1.2313 level while the 50 EMA extends resistance at 1.2315 level. We can also see a strong selling candle right below 50 EMA, which suggests the potential of a selling bias in the GBP/USD pair. The more robust NFP figures have also driven selling bias in the GBP/USD pair, which is leading the GBP/USD pair towards 1.2315 and 1.2255 level. Conversely, a bullish breakout of 1.2470 level may influence the GBP/USD prices towards the next resistance level of 1.2488 level. 

USD/JPY – Daily Analysis

The USD/JPY pair was closed at 106.609 after placing a high of 106.746 and a low of 106.219. Overall the pair USD/JPY moved in a bullish trend that day. At 4:30 GMT, the Average Cash Earnings for the year from Japan came in line with the expectations of 0.1%. The Household Spending for the Year from Japan was dropped by -6.0% against the expected drop by -6.3% and supported Yen.

At 17:30 GMT, the closely watched Average Hourly Earnings, Non-Farm Employment Change, and the Unemployment rate from the United States was released, which came in better than the expectations and raised the bars for U.S. dollar across the board. The Average Hourly Earnings were increased to 4.7% against the forecasted 0.5% in the month of April. 

The Unemployment Rate from the United States was increased to 14.7% in April against the expectations of 16% and in comparison to March’s 4.4%. The Non-Farm Payrolls, which lost during April month, were recorded as 20.5M against the expected loss by 22 M and gave strength to the U.S. dollar.

If we look at the results, the drop in jobs was higher ever recorder as 20.5M but was under the expected value, so gave strength to the U.S. dollar. The huge number of lost jobs in a single month was even higher than it was in the Great Depression. However, it still managed to support the U.S. dollar.

On the other hand, the recorder unemployment rate was also high in the month of April in comparison to the previous month’s rate, but it still managed to support the U.S. dollar on Friday as it did not exceed the expected rise of rate.

Daily Support and Resistance    

  • R3 107.31
  • R2 106.99
  • R1 106.63

Pivot Point 106.31

  • S1 105.95
  • S2 105.63
  • S3 105.27

USD/JPY – Trading Tips

The USD/JPY is trading sharply bullish at 117.450 in the wake of sharp bullish bias in the U.S. dollar since the release of less bad than expected economic data. On the 4 hour timeframe, the USD/JPY pair has formed three white soldiers who are likely to drive bullish bias in the USD/JPY pair. These may lead the USD/JPY prices further higher towards the next resistance level of 107.460. 

The violation of an immediate resistance level may extend buying until 107.900 level. Conversely, the closing of selling candles below 107.460 can extend selling bias until 107 and 106.850. The 50 EMA is supporting the bullish bias around the 106.650 area. All the best for today! 

Categories
Crypto Market Analysis

Daily Crypto Review, May 11 – Bitcoin Hours from its Halving Event; Traders Entering the “Greed” Stage

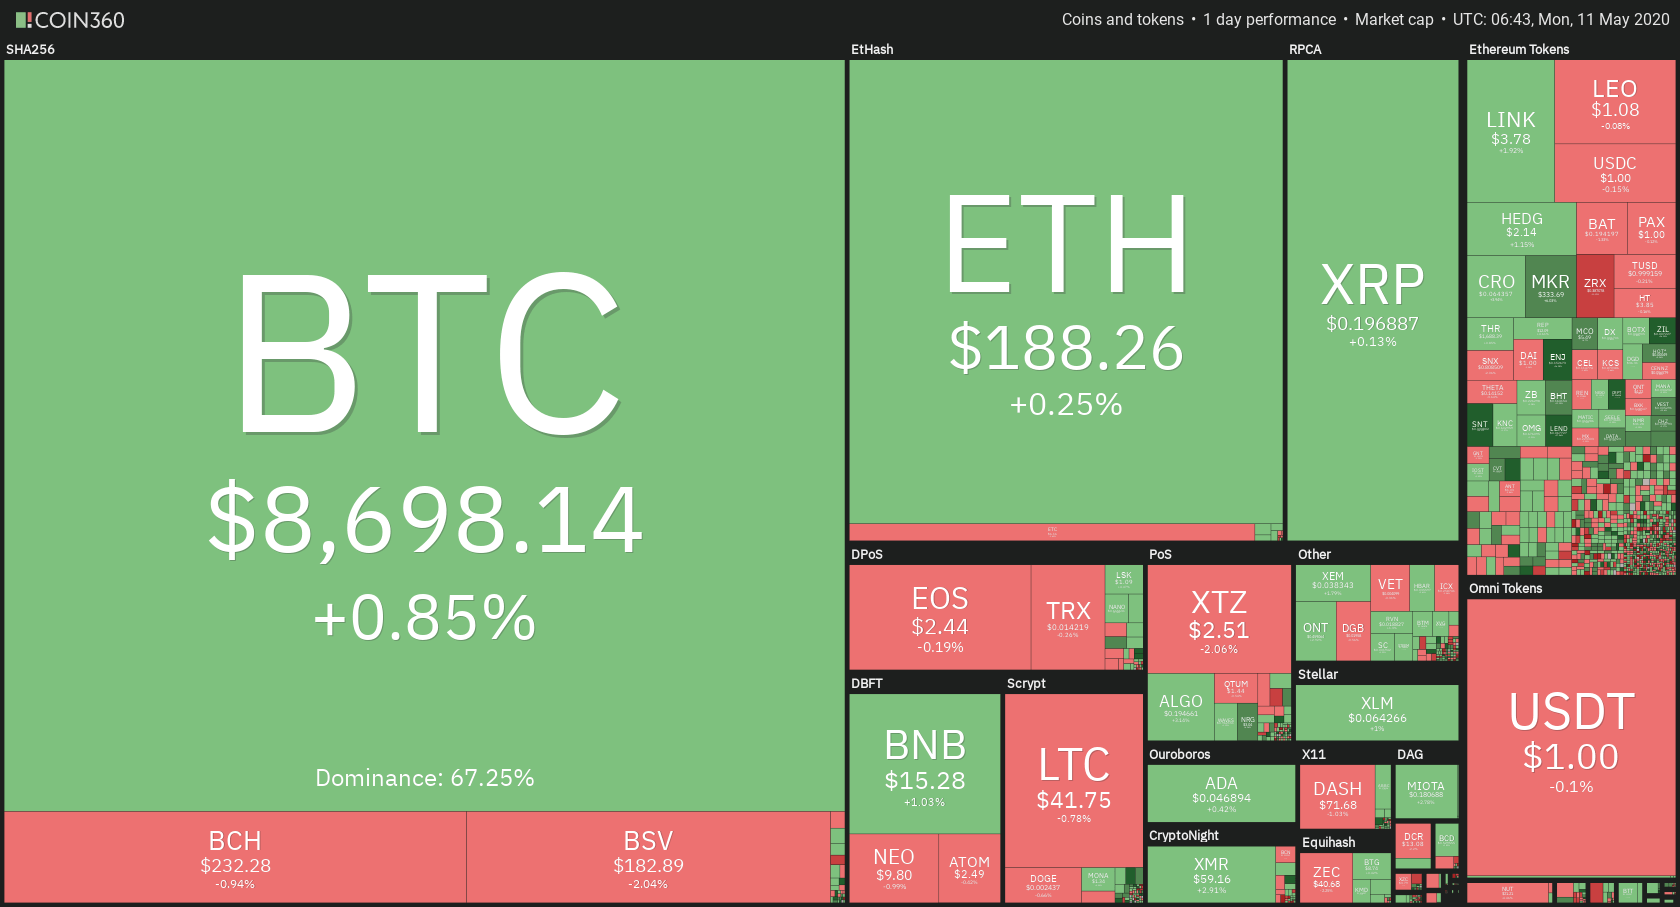
The cryptocurrency market has spent the weekend closely watching the timer to Bitcoin’s halving. Most cryptos had an over 10% price decrease on Sunday. Bitcoin is currently trading for $8,698, which represents an increase of 0.85% on the day. Meanwhile, Ethereum gained 0.25% on the day, while XRP went up by 0.13%.

Crypterium took the position of today’s most prominent daily gainer, with gains of 31.95%. Hyperion lost 22.39% of its daily value, making it the most prominent daily loser.

Bitcoin’s dominance decreased over the weekend, with its value currently at 67.25%. This value represents a 0.68% difference to the downside.

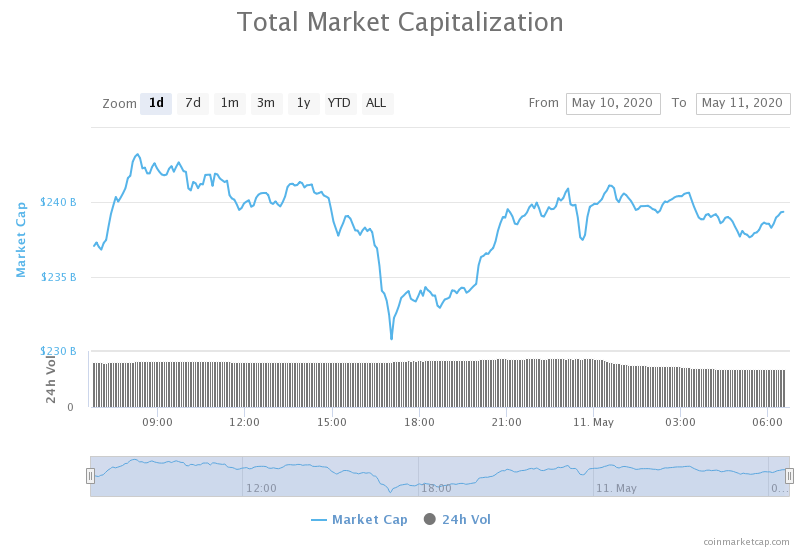
The cryptocurrency market capitalization decreased when compared to Friday’s value, with its current value being $239.74 billion. This value represents a decrease of $25.81 billion when compared to the value it had on Friday.

What happened in the past 24 hours

With Bitcoin halving being just hours away, everyone is looking at the biggest and most well-known cryptocurrency. However, just like before the previous halving in 2016, Bitcoin’s price dropped right before the event.

People are not scared though, as the fear and greed index shows that Bitcoin investors are in the greed phase, which shows us that people are quite interested in grabbing their Bitcoin before it becomes too late.

_______________________________________________________________________

Technical analysis

_______________________________________________________________________

Bitcoin

The largest cryptocurrency by market cap has, after failing to break the $10,000 resistance, started testing support levels in order to find one it can consolidate at. However, one support level by another fell and Bitcoin quickly reached double-digit losses, standing at under $9,000. It is currently bound by its immediate resistance at $8,880 and support at $8,650. It is important to note that Bitcoin fell back into a long-term upwards facing trend, which its price reacted to.


Key levels to the upside                    Key levels to the downside

1: $8,820                                           1: $8,650

2: $8,980                                           2: $8,000

3: $9,120                                            3: $7,750

Ethereum

Ethereum also lost quite a bit of its value over the weekend. The second-largest cryptocurrency by market cap failed to break $217.6 which triggered a downturn that brought its price to $178.65 levels. However, the price quickly recovered and Ethereum is back above $185. Ethereum is, unlike  Bitcoin, in a descending trend which its price completely respected and acknowledged.


Key levels to the upside                    Key levels to the downside

1: $193.6                                            1: $185

2: $198                                              2: $178.65

3: $217.6                                            3: $167.8

Ripple

XRP pretty much followed the market when it comes to price movement over the weekend. The third-largest cryptocurrency by market cap also had an over 10% loss, which resulted in XRP falling below the $0.214 support (now turned resistance).


XRP managed to stabilize above $0.19, where it is trading at the moment.

Key levels to the upside                    Key levels to the downside

1: $0.2                                               1: $0.19

2: $0.205                                           2: $0.178

3: $0.214                                            3: $0.147


Categories
Crypto Market Analysis

Daily Crypto Review, May 8 – Bitcoin Contesting $10,000 as Halving Nears – What’s Next?

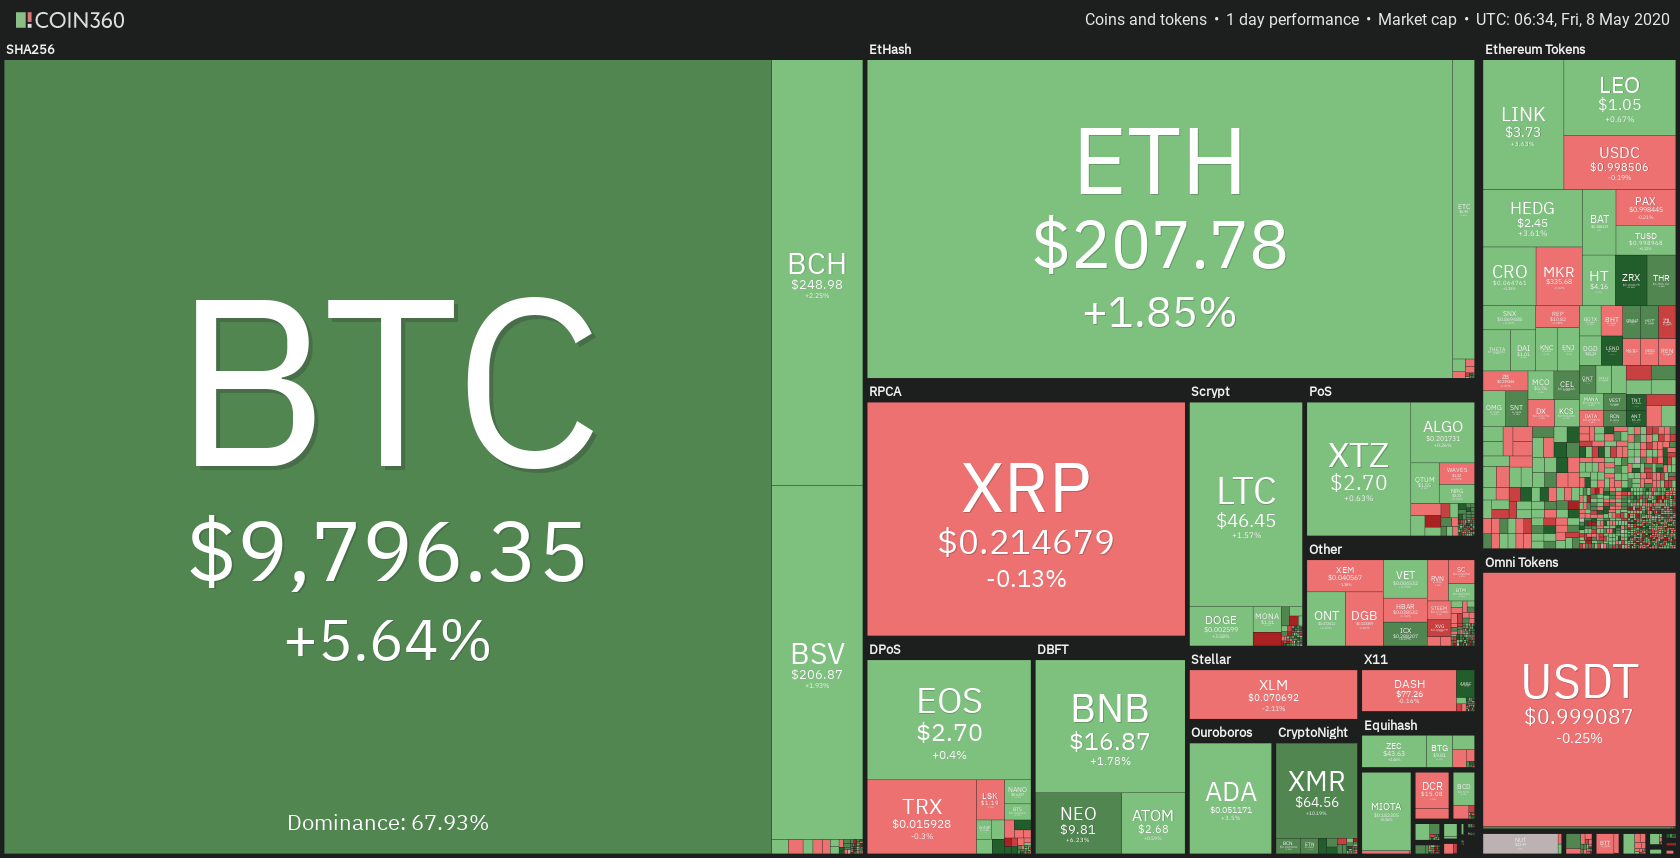
The cryptocurrency market has spent the day mainly watching Bitcoin’s price rise prior to the halving. With all eyes on Bitcoin as its halving event nears, other cryptos moved far less than the biggest cryptocurrency. Bitcoin is currently trading for $9,796, which represents an increase of 5.64% on the day. Meanwhile, Ethereum gained 1.85% on the day, while XRP went down by 0.13%.

Crypterium took the position of today’s most prominent daily gainer, with gains of 65.26%. Numeraire lost 8.48% of its daily value, making it the most prominent daily loser.

Bitcoin’s dominance increased even more in the past 24 hours as it was one of the few cryptos that managed to pass its resistance levels, with its value currently at 67.93%. This value represents a 0.74% difference to the upside.

The cryptocurrency market capitalization increased when compared to yesterday’s value, with its current value being $265.97 billion. This value represents an increase of $8.08 billion when compared to the value it had yesterday.

What happened in the past 24 hours

Although the worldwide coronavirus pandemic has created global economic difficulties, we see cryptocurrencies growing in price, volume as well as the number of transactions. According to Brad Robertson, the head of a blockchain incubator Polyent labs, digital currencies seem appealing in the short term due to the price increase they have undergone in the past few weeks.

With the increased interest in crypto, constant printing of fiat currencies (especially during the coronavirus outbreak), and Bitcoin halving, we may see a bull run sooner than we think.

_______________________________________________________________________

Technical analysis

_______________________________________________________________________

Bitcoin

The largest cryptocurrency by market cap spent the day trying to reach above $10,000. After it spent some time consolidating at the $9,200 area, Bitcoin spiked and tried to tackle the $10,000 level. However, the price could not get past it even with an extreme increase in volume, so Bitcoin fell down to $9,800 levels. Even so, the daily gains are more than substantial.


Bitcoin’s volume almost tripled on the day, while its RSI level reached overbought territory during the spike, but left it soon after.

Key levels to the upside                    Key levels to the downside

1: $9,880                                           1: $9,740

2: $10,015                                         2: $9,580

3: $10,350                                          3: $9,250

Ethereum

Ethereum spent the day after leaving the descending trend mostly in trying to find a place to consolidate at. The second-largest cryptocurrency by market cap rejected the $217.6 level and fell down. However, the downtrend was quickly stopped by the top descending trend line, therefore confirming that Ethereum no longer belongs to that trend.


Ethereum’s volume doubled during the move, which brought it out of the trend but normalized after. Its RSI level currently hovers just above the value of 51.

Key levels to the upside                    Key levels to the downside

1: $217.6                                            1: $198

2: $225.5                                           2: $193.6

3: $240                                               3: $185

Ripple

XRP continued creating lower highs even today. It is the only cryptocurrency out of the top3 to not be in the green on the day. While its price is heavily guarded against falling down by the $0.214 support level, if the cycle of lower lows continues, XRP will have no other option but to give up on this level.


XRP’s volume increased slightly during one period of the day but quickly normalized. Its RSI level is currently just above the value of 47.

Key levels to the upside                    Key levels to the downside

1: $0.227                                           1: $0.214

2: $0.235                                           2: $0.205

3: $0.285                                            3: $0.2


Categories
Crypto Market Analysis

Daily Crypto Review, May 7 – Libra Reinforcing its Team; Bitcoin at $9,200

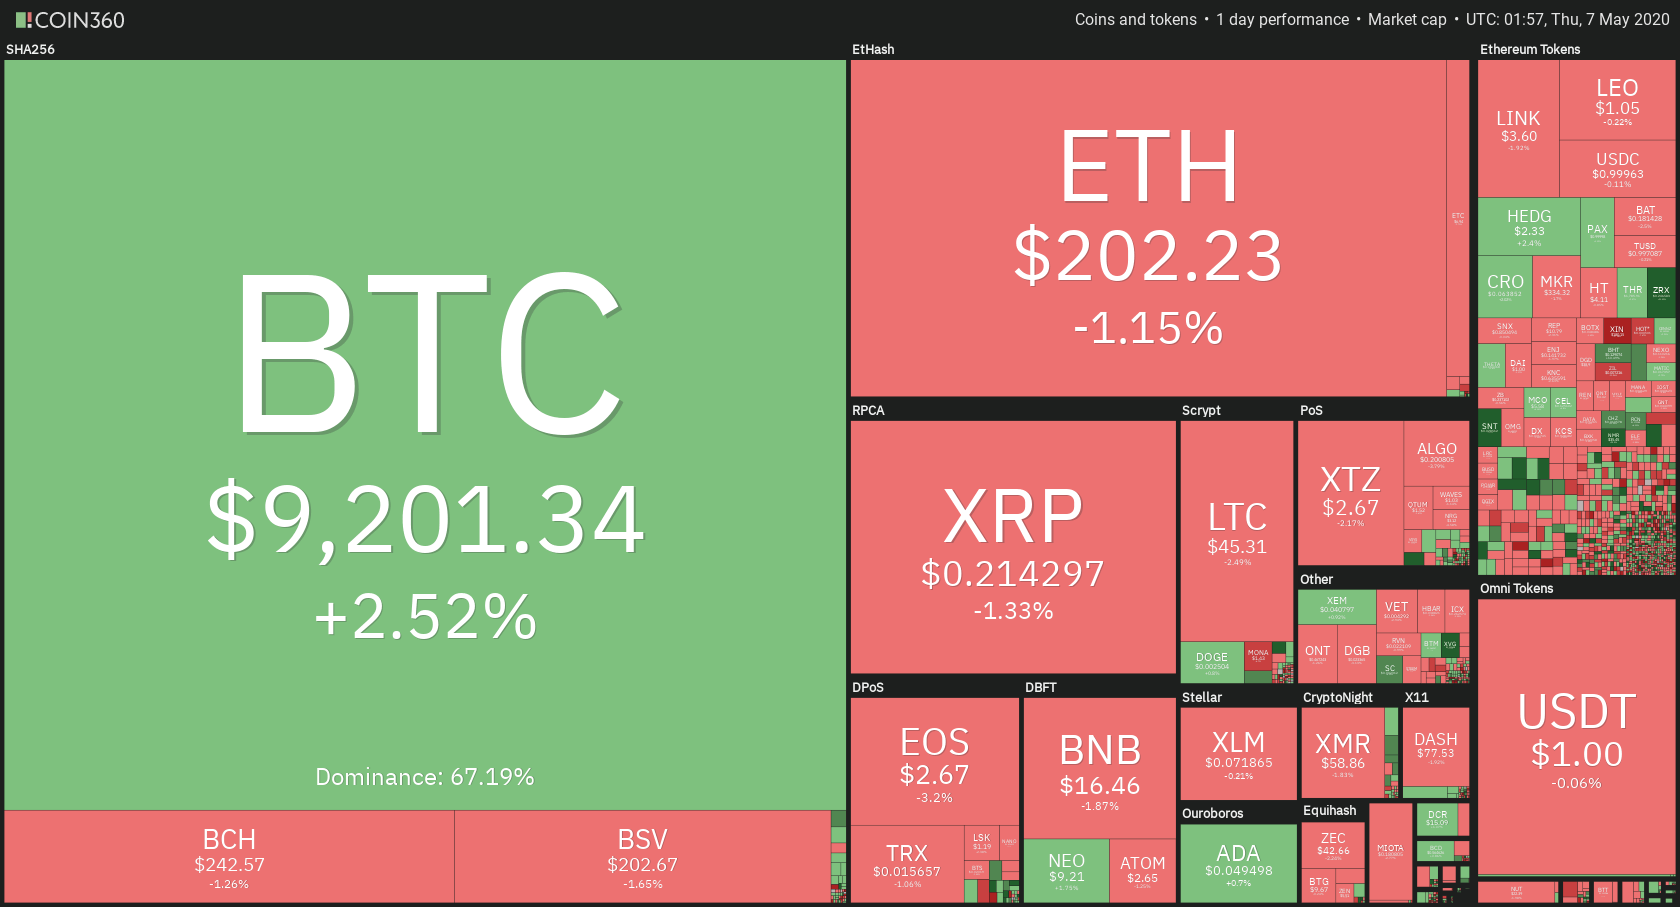
The cryptocurrency market has spent the day trying to break the levels it was bound by. Bitcoin is currently trading for $9,201, which represents an increase of 2.52% on the day. Meanwhile, Ethereum lost 1.15% on the day, while XRP went down by 1.33%.

ReddCoin took the position of today’s most prominent daily gainer, with gains of 48.23%. Zilliqa lost 9.94% of its daily value, making it the most prominent daily loser.

Bitcoin’s dominance increased in the past 24 hours as it was one of the few cryptos that managed to pass its resistance levels, with its value currently at 67.19%. This value represents a 0.65% difference to the upside.

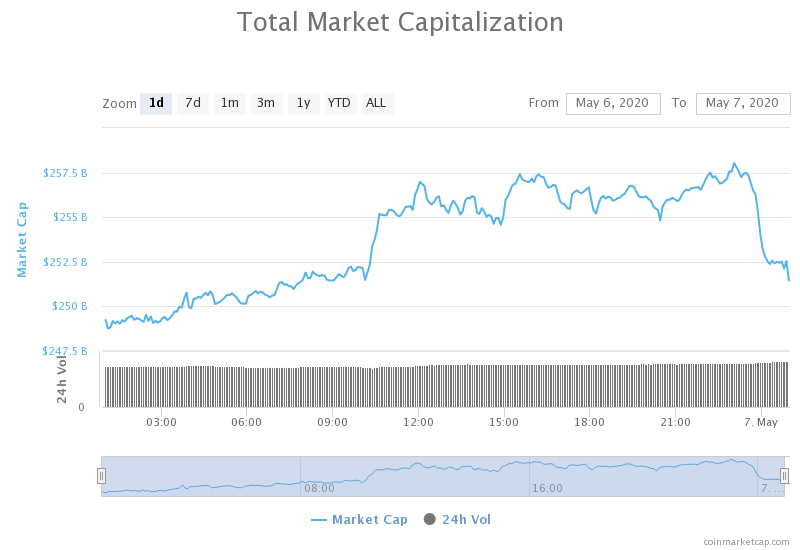
The cryptocurrency market capitalization increased when compared to yesterday’s value, with its current value being $257.89 billion. This value represents an increase of $9 billion when compared to the value it had yesterday.

Honorable mention

Libra reinforcing its team

Facebook’s digital currency made an announcement that Stuart Levey would be joining the project “later this summer.” His job will be overseeing Libra’s “combining technology innovation with robust compliance as well as regulatory framework.”

Levey has previously served the US government as the Under Secretary of the Treasury for Terrorism and Financial Intelligence.

_______________________________________________________________________

Technical analysis

_______________________________________________________________________

Bitcoin

The largest cryptocurrency by market cap spent the day trying to break out of the range it was bound by. Strong bullish presence managed to push Bitcoin’s price up and away from the triangle formation it was in. While it is good news that Bitcoin broke to the upside, the fact that its price did not reach past the previous high of $9,500 is not so encouraging.


With its RSI close to the overbought territory, we can expect Bitcoin to retrace or trade sideways for some time before making another move.

Key levels to the upside                    Key levels to the downside

1: $9,120                                           1: $8,980

2: $9,250                                           2: $8,820

3: $9,580                                            3: $8,650

Ethereum

Ethereum tried to mirror Bitcoin’s movements and reach above its previous highs but failed to do so. The second-largest cryptocurrency by market cap bounced off of the descending trend it is currently in and started to drop in price. A major drop was, however, prevented by the $198 support level.


Key levels to the upside                    Key levels to the downside

1: $217.6                                            1: $198

2: $225.5                                           2: $193.6

3: $240                                               3: $185

Ripple

XRP continued creating lower highs while maintaining lows at a similar price. Today’s move stopped at $0.222 and then reverted and started moving downwards. XRP’s price fell under the $0.214 support level, turning it into resistance. However, the fight for $0.214 is still not over, as XRP might recover.


The $0.214 level will be moved to the “upside” key levels if XRP confirms its price below it.

Key levels to the upside                    Key levels to the downside

1: $0.227                                           1: $0.214

2: $0.235                                           2: $0.205

3: $0.285                                            3: $0.2


Categories
Forex Market Analysis

Daily F.X. Analysis, May 06 – Top Trade Setups In Forex – Eyes on Services PMI Figures! 

The U.S. dollar was also supported by the re-opening of economies by many countries, including several states of the U.S., which resulted in the risk-on sentiment in the market. Meanwhile, the announcement Trump made against China about imposing tariffs in case China fails to meet the condition of buying U.S. goods worth 200$. On Wednesday

Economic Events to Watch Today


EUR/USD – Daily Analysis

Today in the early Asian session, the EUR/USD currency pair struggling to break a bearish channel around 1.09 after the registered biggest daily drop by 0.67% to 1.0899 level in over a month on Monday due to broad-based U.S. dollar strength.

At 11:45 GMT, the French Government Budget Balance by the French Treasury Agency was released, which showed a deficit of 52.5B. At 12:00 GMT, the Spanish Unemployment Change fell short of expectations of 500K and showed that during April, 282.9K people were jobless. At 14:00 GMT, the Producer Price Index for March showed a decline of 1.5% against the expected decline by 1.3%.

The Factory Orders dropped to a record of 10.3% during the month of March against the forecasted 9.7% decline. However, in contrast to the economic data, the U.S. Dollar Index remained strong during Monday when it gained about 0.4% and it to 99.59 level, which is the highest since Thursday. The key factor will be the NFP data on Friday this week, and investors will be looking forward to it.

U.S. dollar was also supported by the re-opening of economies by many countries, including several states of the U.S., which resulted in the risk-on sentiment in the market. Meanwhile, the announcement Trump made against China about imposing tariffs in case China fails to meet the condition of buying U.S. goods worth $200.

The renewed fears of a trade war between China & the U.S. also helped the greenback to gain traction against its rival currency EUR, and hence, the EUR/USD pair declined on Tuesday. Strong U.S. dollar amid better than expected economic data along with the weak EUR due to German court ruling on Tuesday caused EUR/USD pair to drop to 1.08257 level.

Daily Support and Resistance

  • R3 1.0927
  • R2 1.0921
  • R1 1.0912

Pivot Point 1.0906

  • S1 1.0896
  • S2 1.0891
  • S3 1.0881

EUR/USD– Trading Tips

The EUR/USD price trading slightly bearish falling to 1.0837 level after violating the upward trendline at 1.0889. On the 4 hour chart, the EUR/USD has formed a strong bearish engulfing candle, which is proposing selling bias among traders. Typically such a pattern reveals that buyers are weakened, and sellers may control the market. On the downside, the EUR/USD may encounter next support around 1.0835 level and violation of which can open further opportunity for selling until 1.07600 level. 

GBP/USD – Daily Analysis

The GBP/USD is currently trading at 1.2428 and consolidates in the range between the 1.2410 – 1.2440. However, the traders are cautious about placing any position due to mixed market sentiment ahead of the U.S. Advance Nonfarm Payroll data, which is coming out during the New York session today. 

Furthermore, the Bank of England will hold its official monetary policy meeting in the coming Thursday this week, and investors will be waiting for it. The BoE is expected to keep its interest rates unchanged at 0.10%. However, the speech and briefing will be new to Pound traders.

The pair GBP/USD roughly made a move on Tuesday and rose about only 0.05%. However, Cable has the potential to move in an upward direction and give a strong performance in the coming months. The U.K. & the U.S. talks will take effect from today over the matter of post-Brexit trade deal with E.U. It should be noted that this deal could help economies to recover from the COVID-19 pandemic.

On Tuesday, the International Trade Secretary Liz Truss started the trade talks via video conference with the U.S. trade representative Robert Lighthizer. Pound traders will keep an eye on the talks for further investment.

The drop of GBP/USD pair in the absence of any macroeconomic data and news from Great Britain was caused by the strength of the U.S. dollar across the board. Despite the poor Factory Orders data from the U.S. on Monday, the U.S. Dollar Index rose about 0.4% and remained strong against its rival currencies.

Daily Support and Resistance

  • R3 1.2597
  • R2 1.255
  • R1 1.2497

Pivot Point 1.2451

  • S1 1.2398
  • S2 1.2352
  • S3 1.2299

GBP/USD– Trading Tip

On Wednesday, the GBPUSD pair unchanged and holding mostly above 1.2435, testing a triple bottom pattern around 1.2425. The recent Doji pattern on GBP/USD pair is suggesting chances of bullish correction over 1.2425 support level. This may lead the GBP/USD prices towards 1.2515 level. On the lower side, the violation of 1.2420 support can lead the Sterling prices towards the next target level of 1.2316. Overall, the trading bias of GBP/USD is neutral right now, but the violation of 1.2420 can drive selling until the next support level of 1.2345 and 1.2310 level today. 

USD/JPY – Daily Analysis

The USD/JPY currency pair finally broke out of trading ranges to trade at the 106.530marksk and recovered almost 25 pips from the initials low. The risk-on market sentiment is keeping the Japanese yen under pressure and provided support to the pair. On the other hand, the broad-based U.S. dollar weakness kept a lid on any gains in the currency pair. 

The USD/JPY is trading at 106.35 and is consolidating in the range between the 106 – 106.80. However, traders are cautious about placing any strong position ahead of the fresh catalyst. The reason behind the recovery of the risk sentiment is the sign of easing lockdowns, which provided a positive mood around the equity markets. As in result, the Japanese yen became weaker in the wake of decrease safe-haven demand and seen as a key factor behind the pair’s modest uptick.

Moreover, a drop in the rate of virus-led fatalities has also helped in risk recovery sentiment. At the USD front, the U.S. dollar lost its bullish traction and struggled to gain any follow-through traction on Tuesday. The weak U.S. dollar was considered as a barrier to restrict currency pair’s gains at least for now.

Anyhow, the currency pair stopped its 2-day decline streak, and now it will be interesting to see if the buyers can maintain the move due to the concerns about a US-China spat about the origin of the coronavirus.

Looking forward, the market traders will now keep their eyes on the U.S. economic docket, which will release the ISM Non-Manufacturing PMI. This coming data will likely influence the USD price moves and produce some short-term trading opportunities.

Daily Support and Resistance    

  • R3 107.36
  • R2 107.14
  • R1 106.86

Pivot Point 106.64

  • S1 106.37
  • S2 106.14
  • S3 105.87

USD/JPY – Trading Tips

The technical side of USD/JPY has turned bearish as the pair continues to trade bearish after violating the symmetric triangle support level of 106.700. As we can see in the 4-hour chart above, the USD/JPY pair has crossed below the symmetric triangle, which is now extending resistance around 106.650. The 50 M.A. is also keeping pressure on the pair around the same level of 107.050. Below this level, we may see a selling trend in the USD/JPY pair until the next target levels of 106

All the best for today! 

Categories
Crypto Market Analysis

Daily Crypto Review, May 6 – China’s Digital Yuan to Fully Replace Cash? Former BoC President Discusses

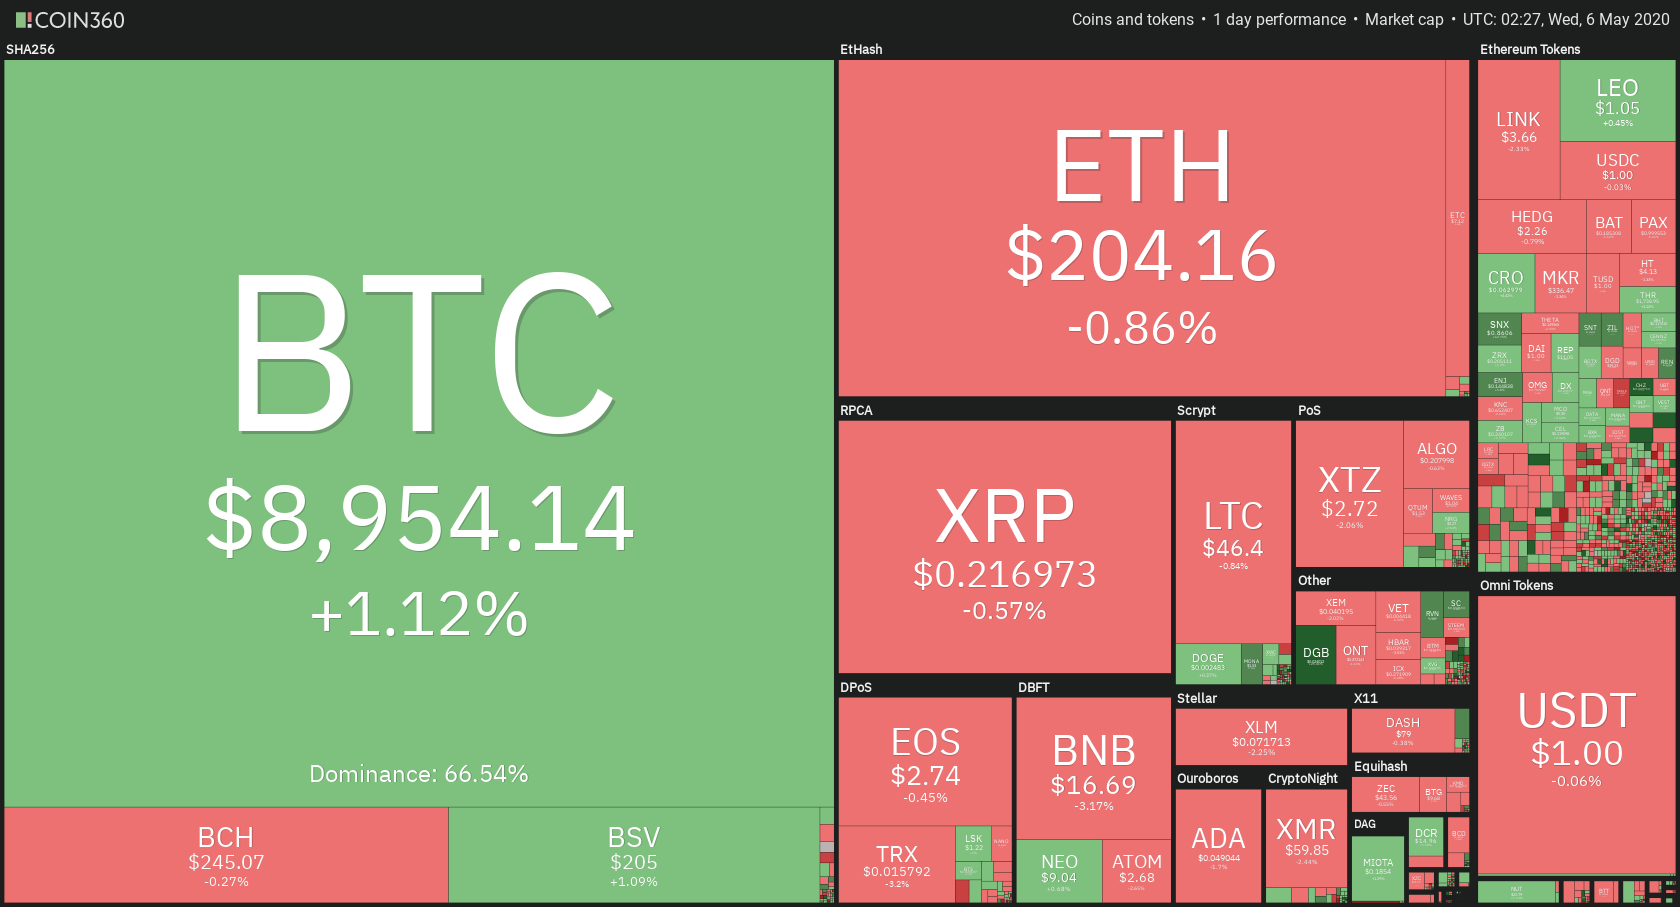
The cryptocurrency market has spent the day consolidating and testing its support and (in a rare case) resistance levels. Bitcoin is currently trading for $8,954, which represents n increase of 1.12% on the day. Meanwhile, Ethereum lost 0.86% on the day, while XRP went down by 0.57%.

DigiByte took the position of today’s most prominent daily gainer, with gains of 23.49%. Hyperion lost 31.82% on the day, making it the most prominent daily loser.

Bitcoin’s dominance stayed at the same place in the past 24 hours, with its value currently at 66.54%. This value represents a 0.09% difference to the upside.

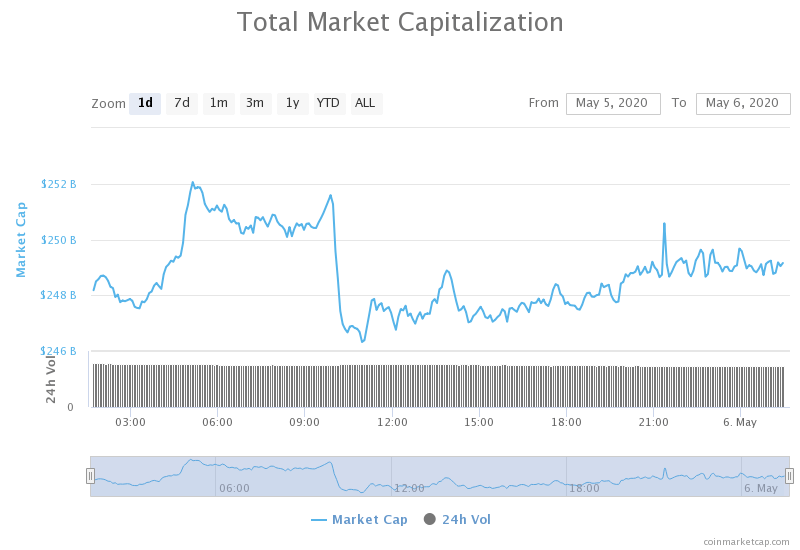
The cryptocurrency market capitalization stayed at the same place when compared to yesterday’s value, with its current value being $248.89 billion. This value represents an increase of $0.24 billion when compared to the value it had yesterday.

Honorable mention

Digital Yuan replacing cash

Li Lihui, former Bank of China President, announced that the launch of the digital yuan is certain and that it could replace cash, but only if four circumstances are met. These features of digital yuan would be:

  • greater efficiency
  • lower transaction costs
  • enough economic scale alongside commercial value
  • peoples’ acceptance

The central bank of China is currently testing digital yuan. The tests are currently showing great interest approval of the current users, as well as a surge of new users.

_______________________________________________________________________

Technical analysis

_______________________________________________________________________

Bitcoin

The largest cryptocurrency by market cap spent another day trying to find its place to consolidate at or to escape the narrow ranges it has been in for the past couple of days. Bitcoin tested both the $8,820 support and $9,120 resistance, as well as the middle level of $8,980. While the price is currently slightly below the $8,980 level, it is unknown where Bitcoin will go in the short term, and traders should wait for a move towards either side with large enough volume.


Key levels to the upside                    Key levels to the downside

1: $8,980                                           1: $8,820

2: $9,120                                           2: $8,650

3: $9,250                                            3: $8,000

Ethereum

Ethereum lost some of the gains it made as the price had a mini-meltdown that brought it from $212 to $200. Ethereum is trading in a wide range, bound by the $198 support level and the $217.6 resistance level. One more level between these two might emerge in the very near future. Traders should proceed with caution around $210-$215 levels but can trade within this range.


Key levels to the upside                    Key levels to the downside

1: $217.6                                            1: $198

2: $225.5                                           2: $193.6

3: $240                                               3: $185

Ripple

XRP spent its day testing its $0.214 support level. The price fell under the level a couple of times but managed to spring back up extremely fast. While the support seems strong enough, the lack of volatility and volume indicates preparation for the next big move. Whether the move will be caused by Bitcoin’s rise/fall or if it will be caused by XRP itself is unknown. However, traders should have an easy time spotting the difference in volume and trading alongside the move that is to come.


Key levels to the upside                    Key levels to the downside

1: $0.227                                           1: $$0.214

2: $0.235                                           2: $0.205

3: $0.285                                           3: $0.2


Categories
Crypto Market Analysis

Daily Crypto Review, May 5 – Bitcoin Breaking $9,000 Again; Craig Wright’s Satoshi Nakamoto Case Court Date Set

The cryptocurrency market has spent the day retesting support levels only to bounce off of them later on. Bitcoin is currently trading for $9,084, which represents an increase of 4.76% on the day. Meanwhile, Ethereum gained 5.45% on the day, while XRP went up by 4.55%.

Hyperion took the position of today’s most prominent daily gainer, with gains of 79.20%. Maker lost 6.49% on the day, making it the most prominent daily loser.

Bitcoin’s dominance increased slightly in the past 24 hours, with its value currently at 66.45%. This value represents a 0.13% difference to the upside.

The cryptocurrency market capitalization decreased when compared to yesterday’s value, with its current value being $248.65 billion. This value represents a decrease of $4.68 billion when compared to the value it had yesterday.

Honorable mention

Craig Wright Satoshi court case

Lawyers representing both sides told the public that the trial would start on July 6. This case is extremely important for the cryptocurrency community as it will effectively decide if Craig Wright has access to the 1.1 billion BTC that were initially mined.

There should be no more postponing to the trial as the lawyers confirmed that they are not planning to delay the trial.

_______________________________________________________________________

Technical analysis

_______________________________________________________________________

Bitcoin

The largest cryptocurrency by market cap successfully held up when its $8,650 support level was tested, only to bounce right after the support level “test” was concluded. With bears reaching exhaustion, BTC quickly bounced from $8,650 all the way up above $9,120. It was stopped at the resistance level, and it is not trying to find its price level above $8,980 and below $9,120.


The volume was steady throughout the day, while the RSI level increased to 61.

Key levels to the upside                    Key levels to the downside

1: $8,980                                           1: $8,820

2: $9,120                                           2: $8,650

3: $9,250                                            3: $8,000

Ethereum

Ethereum had a good day as well, with its price steadily growing after bouncing off the $198 support level. After the level held up successfully, the second-largest cryptocurrency by market cap started increasing in price and reached $212.5, where it stopped (for now). Since Ethereum is in the middle of the range, there are no tells where the price can go from here. However, traders should look for bounces off of the resistance or support levels after they have been reached.


Key levels to the upside                    Key levels to the downside

1: $217.6                                            1: $198

2: $225.5                                           2: $193.6

3: $240                                               3: $185

Ripple

XRP fell under the $0.214 level, all the way to $0.21, just to recover and push above $0.214 again. Ever since, the price has been steadily rising. The third-largest cryptocurrency by market cap established its price above $0.214 but seems to have slightly lost momentum towards the upside.


XRP’s volume has decreased in the most recent trading hours, while its RSI is at the value of 53.5

Key levels to the upside                    Key levels to the downside

1: $0.227                                           1: $$0.214

2: $0.235                                           2: $0.205

3: $0.285                                           3: $0.2


Categories
Forex Market Analysis

Daily F.X. Analysis, May 04 – Series of E.U. Manufacturing PMI In Highlights! 

On the forex front, the ICE U.S. Dollar Index marked a day-low of 98.64 Friday before paring losses to close flat at 99.08. Research firm Markit will publish final readings of April Manufacturing PMI for the Eurozone (33.6 expected), Germany (34.4 expected), France (31.5 expected). The Eurozone Sentix Investor Confidence Index for May will be released (-28.0 expected). The Commerce Department will report March factory orders (-9.4% on month expected) and final readings of durable goods orders (-14.4% on month expected).

Economic Events to Watch Today


EUR/USD – Daily Analysis

The EUR/USD currency pair stopped its three-day winning streak and dropped to 1.0936 while representing 0.33% declines on the day mainly due to the broad-based U.S. dollar strength in the wake of risk-off market sentiment. However, the reason for the risk-off market sentiment could be attributed to the intensifying trade war between the U.S. and China. 

The EUR/USD is trading at 1.0936 and consolidates in the range between the 1.0935 – 1.0975. As we all well aware that the currency pair rose 0.48%, 0.75%, and 0.24% on Wednesday, Thursday, and Friday, respectively, but failed to extend its bullish rally on the first day of trading this week.

The GDP of the Eurozone dropped 3.8% in this quarter from the previous 14.4%. The ECB expects a 5% – 12% contraction in Eurozone’s economy this year. The International Monetary Fund (IMF) has forecasted the same Eurozone’s economic contraction as 5%, which was in line with the ECB’s projection. The ECB Vice President Luis de Guindos said in April that he expected a worse recession to be faced by the European economy than the rest of the world.

Furthermore, the President of the United States, Donald Trump, on Friday, announced to punish China for not holding the virus in its Wuhan city and mishandling the coronavirus outbreak by imposing tariffs. He said that trade relations with China were on his secondary importance now after the coronavirus outbreak. This also helped the EUR/USD pair to move upward.

The EUR was boosted by the hopes and hype of an early reopening of the economy across the globe. The pair EUR/USD was also helped by the developments made in COVID-19 vaccines, which caused the decreased demand for the U.S. dollar as a funding currency. EUR was also supported by the decreasing number of deaths and appearing cases in Germany, Italy, Spain, and France. Overall the EUR/USD pair has recovered from its March corona caused the lowest level of 1.0637 to its multi-week highest of 1.1019 on Friday.

Daily Support and Resistance

  • R3 1.1005
  • R2 1.0993
  • R1 1.0977

Pivot Point 1.0965

  • S1 1.095
  • S2 1.0937
  • S3 1.0922

EUR/USD– Trading Tips

On Monday, the EUR/USD price is holding at 1.0924 area, after placing a high of 1.0948 during the Asian session. On the 4 hour chart, the EUR/USD has formed a candlesticks pattern three black crows around 1.0927 level. Typically such a pattern shows that buyers are exhausted, and sellers may enter into the market soon. On the lower side, the EUR/USD pair has already completed 38.2% Fibonacci retracement at 1.0920, and now it can go for 50% retracement at 1.0900 mark. Both of the leading indicators are supporting the bullish trend, but a slight retracement can be expected. The resistance is likely to be found around 1.0971 and 1.0992. Consider staying bearish below 1.099 level today.  

GBP/USD – Daily Analysis

The GBP/USD failed to stop its Friday’s losses and dropped below 1.2450 level while representing 0.36% losses on the day as the U.S. dollar is benefitting again from the risk-off sentiment in the financial markets. However, the reason behind the risk-off market sentiment is the intensifying trade tussle between the U.S. and China. 

The on-going crisis of the UK Tory government about the mishandling of the virus situation also keeps the British Pound under pressure. The GBP/USD currency pair is currently trading at 1.2448 and consolidates in the range between the 1.2440 – 1.2487. On the other hand, the PMI from the U.S. also dropped to its 11 years lowest level at 41.5 and weakened the U.S. dollar across the board. However, the pair GBP/USD ignored US PMI and continued falling on Friday.

As for the news, Boris Johnson’s announcement for coming up with a plan on how to restart the economy next week did not give much impact to GBP. The biggest risks nowadays to the U.K.’s economy and the British Pound include the Brexit & coronavirus. 

As for Brexit, both parties Britain and the European Union has its differences in the future relationship. Another challenge of Brexit is the timeline for securing a deal because Johnson has insisted that the transition period will not be extended by his government. 

If Johnson will not seek an extension, which can only be applied before June 31, there is a possibility that both sides will not have a deal before the deadline of December. European Union insisted that an agreement of this size needs several years to be hammered. 

Daily Support and Resistance

  • R3 1.2544
  • R2 1.2524
  • R1 1.249

Pivot Point 1.247

  • S1 1.2436
  • S2 1.2416
  • S3 1.2382

GBP/USD– Trading Tip

The GBPUSD pair showed strong bearish movement to trade at 1.2445, testing a double top pattern around 1.2425. The recent Doji pattern on GBP/USD pair is suggesting chances of bullish correction over 1.2425 support level. This may lead the GBP/USD prices towards 1.2515 level. On the lower side, the violation of 1.2420 support can lead the Sterling prices towards the next target level of 1.2316. Overall, the trading bias of GBP/USD remains bullish, considering the 50 EMA as it’s keeping the Cable bullish above 1.2420 today.  

USD/JPY – Daily Analysis

The USD/JPY pair was closed at 106.903 after placing a high of 107.405 and a low of 106.603. Overall the movement of USD/JPY remained bearish throughout the day. The USD/JPY pair during the America Session started to move upward towards the 107 level but failed to hold and preserve the recovery due to weak PMI.

At 4:30 GMT, the Tokyo Core CPI for the year was released, which showed a decline of -0.1% against the expected 0.1%. At 5:30 GMT, the Final Manufacturing PMI from Japan was released by the Bank of Japan for March, which showed that the manufacturing sector in Japan contracted to 41.9.

It was expected to remain the same as the previous month’s 43.7. The decline in manufacturing activity due to coronavirus pandemic resulted in weak Japanese Yen against the U.S. dollar. As for the U.S. data, at 18:45 GMT, the Final Manufacturing PMI form the U.S. was released, which came as 36.1 against the expectations of 36.9, and it weakened the U.S. dollar. At 19:00 GMT, the ISM Manufacturing PMI for the month of April was released, which was dropped to its 11 years lowest level at 41.5 from the previous month’s 49.1.

The drop in U.S. manufacturing activities due to a pandemic, which disturbed the supply chain across the globe, made the US PMI fell to its records low, and this weakened the U.S. dollar across the board on Friday. The weakened U.S. dollar pulled the pair USD/JPY to 106.6 level at the ending day of the week.

At 19:00 GMT, the Construction Spending from the U.S. also released, which came in as 0.9% against the -3.5% and supported the U.S. dollar. The ISM Manufacturing prices were also increased to 35.5 from the forecasted 30.7. The Wards Total Vehicle Sales during April were recorded as 8.6M against the 7.0M forecasted.

Daily Support and Resistance    

  • R3 108.76
  • R2 108.14
  • R1 107.66

Pivot Point 107.03

  • S1 106.55
  • S2 105.92
  • S3 105.44

USD/JPY – Trading Tips

The USD/JPY pair take’s a bearish turn in the wake of mixed sentiment to trade around 106.700. As we can see in the 4-hour chart above, the USD/JPY pair is struggling to cross over the downward trendline, which is extending resistance around 106.950. The 50 EMA is also keeping pressure on the pair around the same level of 107.050. Below this level, we may see a selling trend in the USD/JPY pair until the next target levels of 106.44 and 106. The 50 EMA and MACD are also suggesting selling bias for the USD/JPY pair. Taking a selling trade below 106.950 can be a good idea today.

All the best for today! 
Categories
Crypto Market Analysis

Daily Crypto Review, May 4 – Bitcoin Hash Rate reached All-Time Highs before the Halving

The cryptocurrency market has spent the weekend trying to find a level to consolidate at and testing narrow ranges. Bitcoin is currently trading for $8,767, which represents a decrease of 3/69% on the day. Meanwhile, Ethereum lost 5.7% on the day, while XRP lost 4.76%. However, when compared to the prices on Friday, the market hasn’t moved that much, if at all.

Hive took the position of today’s most prominent daily gainer, with gains of 22.27%. Unibright lost 17.28% on the day, making it the most prominent daily loser.

Bitcoin’s dominance increased over the weekend, with its value currently at 66.32%. This value represents a 0.66% difference to the upside.

The cryptocurrency market capitalization decreased when compared to Friday’s value, with its current value being $243.97. This value represents a decrease of $3.58 billion when compared to the value it had on Friday.

Honorable mention

Bitcoin hash rate

Bitcoin’s third halving event is roughly two weeks away, and the BTC mining hash rate is pushing into record highs. Bitcoin hashing power plummeted by 40% just two weeks after setting its previous all-time high on March 8.

However, the hash rate increased by 90% in the following six weeks, reaching a new all-time high at 142 exahashes per second.

_______________________________________________________________________

Technical analysis

_______________________________________________________________________

Bitcoin

The largest cryptocurrency by market cap spent the weekend trying to find a good place to consolidate at. The narrow resistance ranges of $8,650, $8,820, $8,980 and $9,120 were tested over the weekend. Bitcoin’s price spent the majority of the weekend below $9,000, and most recently retested the $8,650 resistance. That resistance has proven its strength yet again and BTC bounced back up.


The next few days will lead up to Bitcoin either breaking down below $8,650, which would trigger a downturn, or above $9,120, which would trigger an uptrend.

Key levels to the upside                    Key levels to the downside

1: $8,820                                           1: $8,650

2: $8,980                                           2: $8,000

3: $9,120                                            3: $7,750

Ethereum

Ethereum has spent the weekend bouncing between the $200 and $217.6. The second-largest cryptocurrency by market cap is currently on the path down as the $217.6 resistance level held up twice already. With the volume normalizing and the RSI falling back in the lower half of the range, we can expect a few more days of consolidation from Ethereum, unless a run-up or down gets triggered by an external factor (Bitcoin’s movement or fundamentals).


Key levels to the upside                    Key levels to the downside

1: $217.6                                            1: $198

2: $225.5                                           2: $193.6

3: $240                                               3: $185

Ripple

XRP is also trading in a tight range, bound by $0.214 to the downside and $0.227 to the upside. However, the most recent retest of the support level has brought the price all the way down to $0.208 before recovering above $0.214. This level seems to be barely holding for now, and it is likely that it will not hold up if being tested for much longer. If $0.214 fails, we can expect XRP to fall to the $0.205 or $0.2 levels.


Key levels to the upside                    Key levels to the downside

1: $0.227                                           1: $$0.214

2: $0.235                                           2: $0.205

3: $0.285                                           3: $0.2


Categories
Forex Market Analysis

Daily F.X. Analysis, May 01 – Top Trade Setups In Forex – Eyes on U.S. ISM Manufacturing PMI

The U.S. dollar traded with a selling bias in the wake of weaker economic data. The closely watched Unemployment Claims for a previous week from the United States weighed on the U.S. dollar when it came in as 3839K against the expected 3500K. The Personal Spending for the month of March from the U.S. was declined by -7.5% against the expected decline by -4.8% and added in the weakness of the U.S. dollar.

The Core Price Index for the month of March came in line with the expectations of -0.1% and had a null effect on the U.S. dollar. The Employment Cost for the first quarter of this year came in favor of the U.S. dollar when it exceeded 0.8% against the expectations of 0.7%. Later today, the market is expected to show thin volatility in the wake of Labor day holiday. However, investors will be focusing on the ISM Manufacturing PMI figures from the United States to drive further price action in the market. 

Economic Events to Watch Today     


EUR/USD – Daily Analysis

The direct currency pair EUR/USD surged dramatically to close the day at 1.09517, having placed a high of 1.09725 and a low of 1.08327 yesterday. The ECB held its rates unchanged on Thursday and said that it expects the rates to remain at the present level or lower levels until the inflation of the Eurozone meet the level or reach near the projection of 2%. ECB also said that it was ready to adjust all of its instruments to achieve its projected aim of inflation in a sustained manner.

The Euro gained bullish momentum, although French Flash GDP for the First Quarter dropped more than expectations. It was expected to decline by -4.0 % in the first quarter of this year, but the results showed that the actual drop in French Flash GDP was recorded as -5.8%. While the German Retail Sales data decline by -5.6% against the expectations of -8.1%, it was in favor of the single currency Euro as the actual drop in German Retail Sales was less than its forecasted value.

At 11:45 GMT, the French Consumer Spending in the month of March was dropped by -17.9%, which were assumed to be dropped by -5.7%, and hence it weighed on single currency Euro. The French Prelim Consumer Price Index for the month of April came in favor of Euro as 0.1%, which was expected to decline by -0.2%.

The Spanish Flash Gross Domestic Product (GDP) for the First Quarter of year also dropped more than expected and weighed on Euro. The drop-in Spanish GDP was recorded as -5.2% at 12:00 GMT, whereas it was expected to drop by -4.2%. The Spanish Flash Consumer Price Index (CPI) for the year also showed a decline in April by -0.7% when it was expected as-0.5% and weighed on Euro currency.

The single currency Euro remained supportive by the data and ECB’s decisions on Thursday and gave strength to EUR/USD pair. Though the quarterly GDP of the Eurozone dropped to its lowest level since the records, the EUR/USD pair still managed to remain bullish throughout the day. 

Daily Support and Resistance

  • R3 1.115
  • R2 1.1062
  • R1 1.1009

Pivot Point 1.0921

  • S1 1.0869
  • S2 1.078
  • S3 1.0728

EUR/USD– Trading Tips

On Friday, the EUR/USD price is holding at 1.0944 area, after placing a high of 1.0973 during the U.S. session on Thursday. On the 4 hour chart, the EUR/USD has formed a candlesticks pattern hanging man around 1.0955 level. Typically such a pattern shows that buyers are exhausted, and sellers may enter into the market soon. On the lower side, the EUR/USD pair can go for completing 38.2% Fibonacci retracement at 1.0920 and 50% retracement at 1.0900 mark. The trading sentiment for the EUR/USD continues to be bullish, especially after the bullish crossover of 50 EMA and MACD. Both of the leading indicators are supporting the bullish trend, but a slight retracement can be expected. The resistance is likely to be found around 1.0971 and 1.0992. Consider staying bearish below 1.099 level today.  

GBP/USD – Daily Analysis

During Thursday’s Asian session, the GBP/USD is trading slightly bearish around 1.2562, maintaining the overall trading range of 1.2644 to 1.2525. Most of the buying triggered in the wake of weaker U.S. Jobless Claims figures 

The U.K. Prime Minister, Boris Johnson, informed that the latest figure of 81,011 tests was hopeful, which were conducted on Wednesday, close to the government target of 100,000 tests per day by the end of April. He also said to the business community that he acknowledge their patience but informed that they have to keep going the way they are doing business now for the time being.

On the other hand, surgeons across the U.K. have warned that if the U.K. comes out of the lockdown too soon, it will cause the death of thousands. The Royal College of surgeons urged Prime Minister Boris Johnson to consider the service that saved his life when discussing the lifting of restrictions from lockdown.

Furthermore, there was no economic data or major event from the U.K. side, so the movement of the GBP/USD pair remained solely on USD. The U.S. dollar remained weak throughout the day because of poor economic data on Thursday. 

The unemployment claims for the previous week from the U.S. were recorded as 3839K against the expectations of 3500K. An increased number of unemployed people weighed on the U.S. dollar and helped the pair GBP/USD to move in an upward direction and close the month with a bullish candle.

Daily Support and Resistance

  • R3 1.2896
  • R2 1.2769
  • R1 1.2682

Pivot Point 1.2555

  • S1 1.2467
  • S2 1.2341
  • S3 1.2253

GBP/USD– Trading Tip

The GBPUSD pair showed strong bullish movement to trade at 1.2540 after making a double top pattern around 1.2644. The recent bearish engulfing pattern on GBP/USD pair suggesting chances of selling in Sterling. On the lower side, the GBP/USD may find support around 1.2520. Below this, the GBP/USD prices have the potential to go after 1.2470. 

Overall, the trading bias of GBP/USD remains bullish, considering the 50 EMA and MACD, both of the indicators are supporting selling bias. Consider staying bullish above 1.2510 and bearish trades below 1.2638 level today. 

USD/JPY – Daily Analysis

The USD/JPY pair was closed at 107.169 after placing a high of 107.497 and a low of 106.404. Overall the movement of USD/JPY remained Bullish throughout the day. The USD/JPY pair posted gains on Thursday despite the weakness of the U.S. dollar across the board amid poor than expected economic data. Throughout the day, the USD/JPY pair moved back and forth but managed to post gains in the ending day of the month.

On Thursday, Federal Reserve announced to expand the scope of its main street lending in order to support the small and medium-sized businesses by giving them credit. The scheme would now provide the credit flow to the financially sound small & medium-sized companies which were in good condition before the pandemic.

Federal Reserve announced to allow finance to companies with up to 15,000 employees and $5 Billion in revenue, which was previously set for companies with up to10,000 employees and $2.5 Billion in revenue during the period of the pandemic, which affected the business activity across the United States.

At 17: 30 GMT, the closely watched Unemployment Claims for a previous week from the United States weighed on U.S. dollar when came in as 3839K against the expected 3500K. The Personal Spending for the month of March from the U.S. was declined by -7.5% against the expected decline by -4.8% and added in the weakness of the U.S. dollar.

Daily Support and Resistance    

  • R3 108.76
  • R2 108.14
  • R1 107.66

Pivot Point 107.03

  • S1 106.55
  • S2 105.92
  • S3 105.44

USD/JPY – Trading Tips

The USD/JPY pair take’s a bullish turn in the wake of risk-on sentiment to trade around 107.180. As we can see in the 4-hour chart above, the USD/JPY pair is struggling to cross over the downward trendline, which is extending resistance around 107.250. The 50 EMA is also keeping pressure on the pair around the same level of 107.250. Below this level, we may see a selling trend in the USD/JPY pair until the next target levels of 106.99 and 106.960. The 50 EMA and MACD are also suggesting selling bias for the USD/JPY pair. Taking a selling trade below 107.350 and buying above 107.030 can be a good idea today.

All the best for today! 
Categories
Crypto Market Analysis

Daily Crypto Review, May 1 – XRP supported by the first Crypto Bank; Crypto market consolidating after a sharp move up

The cryptocurrency market has spent the past 24 hours trying to find a level to consolidate at after dropping in price due to the lack of bull pressure. Bitcoin is currently trading for $8,770, which represents a decrease of 6.11% on the day. Meanwhile, Ethereum lost 4.74% on the day, while XRP lost 5.89%.

Hyperion took the position of today’s most prominent daily gainer, with gains of 14.4%. Hive lost 13.59% on the day, making it the most prominent daily loser.

Bitcoin’s dominance increased another half a percent from yesterday’s dominance levels. Its value is now 65.69%, which represents a 0.5% difference to the upside.

The cryptocurrency market capitalization decreased when compared to yesterday, with its current value being $247.55. This value represents a decrease of $3.25 billion when compared to the value it had yesterday.

Honorable mention

XRP supported by the first Crypto bank

The first FINMA licensed cryptocurrency bank, Sygnum Bank, has made an announcement on April 30 that Ripple’s XRP token is now available through its platform. Users can deposit, exchange, as well as credit services using the third-largest cryptocurrency.

Sygnum Bank customers can use fiat deposits such as the Swiss franc, the US Dollar, the Euro, the Singapore dollar, to buy, hold as well as trade XRP tokens on the Sygnum platform.

_______________________________________________________________________

Technical analysis

_______________________________________________________________________

Bitcoin

The largest cryptocurrency by market cap spent the day retracing and looking for a place to consolidate at. After a bull run which brought its price above $9,000, the price had to retrace in order for the price increase to be considered “healthy. BTC initially dropped all the way to $8,400, but recovered and started its consolidation phase within a range bound by $8,650 to the downside and $8,820 to the upside. This is the time for traders that like range-trading to play around the support and resistance levels that bitcoin is bound by.


BTC’s volume decreased drastically in the past few candlesticks as the sharp moves subsided. Its RSI has also left the overbought area.

Key levels to the upside                    Key levels to the downside

1: $8,820                                           1: $8,650

2: $8,980                                           2: $8,000

3: $9,120                                            3: $7,750

Ethereum

Ethereum’s chart looks awfully similar to Bitcoin’s chart for the past few days. They acted almost exactly the same when it came to rising in price, retracing, and then consolidating. The second-largest cryptocurrency by market cap fell from its $225.5 highs to around $200 before going back up and consolidating at the ~$215 level.


Ethereum’s volume started normalizing after the sharp moves, while its RSI left the overbought territory with the current value of 59.

Key levels to the upside                    Key levels to the downside

1: $217.6                                            1: $198

2: $225.5                                           2: $193.6

3: $240                                               3: $185

Ripple

XRP lived through the same fate through the past 24 hours, where it reached new highs, retraced hoping to find stable support, and then started its consolidation phase. The third-largest cryptocurrency by market cap dropped from its $0.235 highs all the way down to $0.208 before going above the $0.214 level yet again.


XRP’s volume normalized after the explosive moves, while its RSI dropped to the value of 58, therefore leaving the overbought zone.

Key levels to the upside                    Key levels to the downside

1: $0.227                                           1: $$0.214

2: $0.235                                           2: $0.205

3: $0.285                                           3: $0.2


Categories
Forex Market Analysis

Daily F.X. Analysis, April 30 – Top Trade Setups In Forex – Brace for ECB Rate Decision! 

On the forex front, the ICE U.S. Dollar Index fell 0.4% on the day to a two-week low of 99.48, posting a four-day decline. The European Central Bank will announce its interest rates decision (deposit facility rate unchanged at -0.5% expected). The European Commission will post 1Q GDP (-3.4% on year expected) and March jobless rate (7.8% expected).

The U.S. Labor Department will release initial jobless claims in the week ended April 25 (3.5 million expected). The Commerce Department will report March’s spending (-5.0% on month expected) and personal income (-1.5% on month expected). The Market News International will release April Chicago PMI (37.7 expected).

Economic Events to Watch Today     


EUR/USD – Daily Analysis

The EUR/USD soared over 0.5% to 1.0876. The economic figures revealed that the eurozone’s Economic Confidence Index slipped to 67.0 in April (73.1 expected) from 94.2 in March. Meantime, traders are awaiting the European Central Bank to maintain its key rates unchanged later today. Also, the eurozone’s first-quarter GDP (-3.4% on year estimated) and March jobless rate (7.8% expected) will be reported.

At the USD front, the dollar index’s (DXY) bounce from the 13-day low of 99.45 reached during Tuesday’s American trading hours, and it ran out of steam near 99.90 early on Wednesday. It’s mostly because both the S&P 500 futures and Asian stocks climbed, as in result greenback is losing its haven demand. 

On the flip side, the European Central Bank will likely hold its policy unchanged and show a willingness to give more monetary stimulus if required. The EUR will likely give importance to the ECB’s moves on sentiment than traditional monetary policy signals.

At the USD front, the monthly safe-haven demand for the U.S. dollar also kept currency pair under pressure during the April month. The U.S. Dollar Index hit a daily low at 99.54 earlier in the morning but remained above Tuesday’s lows. Equity prices held on to gain.

At the coronavirus front, the number of confirmed coronavirus cases rose to 159,119, with a total of 6,288 deaths reported as per the German disease and epidemic control center report. While. The cases rose by 1,478 in Germany, the daily rate of increase shows rise to 0.9% from 0.8% on Wednesday. The death losses rose by 173 vs. 202 seen a day before.

Traders will keep their focus on the Eurozone CPI and GDP data ahead of the ECB policy decision. The coronavirus headlines and U.S. dollar dynamics could entertain the traders during the day ahead.


Daily Support and Resistance

  • S1 1.0774
  • S2 1.082
  • S3 1.0847

Pivot Point 1.0867

  • R1 1.0894
  • R2 1.0913
  • R3 1.0959

EUR/USD– Trading Tips

The technical side of the EUR/USD is more or less the same as yesterday. The EUR/USD is trading bullish around 1.0877 as the U.S. dollar seems to face bearish pressure due to dovish FOMC. The EUR/USD has the potential to go after 1.0882, and bullish breakout of this level may drive EUR/USD prices further higher until the next resistance level of 1.0960. 

The trading sentiment for the EUR/USD continues to be bullish, especially after the bullish crossover of 50 EMA and MACD. Both of the leading indicators are supporting bullish trend with immediate support around 1.0814. We should consider taking buying trades above 1.0840 today. 

GBP/USD – Daily Analysis

During Thursday’s Asian session, the GBP/USD currency pair extended its recovery moves from 1.2430 to 1.2470 but still considered bearish and trading below the 1.2500 level while representing 0.05% losses on the day mainly due to the broad-based U.S. dollar recovery pullback. The persistence criticism on Tory government policymakers’ performance about securing the personal protective equipment keeps the British Pound under pressure. 

The GBP/USD is currently trading at 1.2478 and consolidates in the range between the 1.2429 – 1.2485. However, traders are cautious about placing any strong position ahead of coronavirus briefings by the UK PM Boris Johnson.

The Tory leader failed to head any daily coronavirus briefings even after the UK PM Boris Jonson returned to the office. Whereas, the reason behind the British PM Johnson’s little presence yesterday could be the news of his fiancée giving birth to a baby boy. On the other hand, the United Kingdom leader met with opposition Labour Party leader Keir Starmer and discussed the proceedings to combat the crisis.

The Tory party has been under pressure mainly due to the latest coronavirus report, which shows the U.K. as having the second-highest death toll in Europe. As well as, the criticism about the policymakers’ performance on securing the personal protective equipment (PPE) added further pressure on the Tory government. Despite this, the UK Tory government still claims to be on the top of performance while showing a coronavirus tracking app that warns the user when the contact with peoples infected by COVID-19,

On the flip side, the Foreign Secretary Dominic Raab said that the U.K. must pass and secure a Brexit deal by the end of the year to provide businesses, and this will be the best chance to ‘bouncing back’ economy from the coronavirus pandemic.

At the US-China front, U.S. President Donald Trump’s fueled fresh trader war between China and the United States, which sent the currency pair lower as the dollar caught bids in the wake of safe-haven demand. On the other hand, the Fed’s dovish pause and positive updates on the virus medicine have weighed on the U.S. dollar previously.

Daily Support and Resistance

  • S1 1.2315
  • S2 1.2371
  • S3 1.24

Pivot Point 1.2427

  • R1 1.2456
  • R2 1.2483
  • R3 1.2539

GBP/USD– Trading Tip

The GBP/USD continues to trade upward around 1.2479 area, as it’s maintaining a fresh trading range of 1.2525 – 1.2396. The GBP/USD has developed a bullish channel, which is supporting it around 1.2396 along with resistance around 1.2501. On the higher side, a bullish breakout of 1.2520 opens up further room for buying until 1.2560 and 1.2626 level. 

The GBP/USD pair is holding a buying zone, above 50 EMA, which is also supporting the cable around 1.2409. Since the MACD is holding above 0, which demonstrates that one should be looking to enter a buying trades in the GBP/USD pair. Consider staying bullish above 1.2430 and bearish trades below 1.2520 level today. 

USD/JPY – Daily Analysis

The USD/JPY lost 0.2% to trade around 106.61. The economic figures showed that Japan’s industrial production fell 3.7% on month in March, which is less than expectations of -5.0%, and retail sales declined by 4.5%. The currency pair failed to cheer the Japanese yen’s weakness and dropped to 6-weeks low yesterday. 

The USD/JPY is trading at 106.64 and consolidates in the range between the 106.39 – 106.89. Whereas, the safe-haven demand for the U.S. dollar continues to lose due to risk-on sentiments in the stock market amid hopes of re-opening of the economies in Australia, New Zealand, and parts of Europe. 

The currency pair continues to follow the broad-based U.S. dollar directions so far this week, with the latest stop in the dollar decline offering some support. The U.S. dollar index trades at 99.70 after hitting a daily low of 99.63. 

The reason behind the risk-on market sentiment could also be the upbeat comments from the BOJ Governor. The Bank of Japan (BOJ) Governor Haruhiko Kuroda said that Japan’s financial system remains firm because a whole as bank groups have satisfactory capital buffers. Lastly, weakness in the U.S. dollar is also weighing on the USD/JPY. As expected, the Federal Reserve kept its benchmark interest rates unchanged at 0.00%-0.25%. The central bank acknowledged that the coronavirus pandemic is posting a considerable risk to the medium-term outlook for the economy.

Daily Support and Resistance    

  • R3 108.1
  • R2 107.72
  • R1 107.3

Pivot Point 106.93

  • S1 106.51
  • S2 106.14
  • S3 105.72

USD/JPY – Trading Tips

The USD/JPY pair has traded mostly in line with the forecast to drop from 106.980 level to 106.350 level. At the moment, the USD/JPY pair is trading at 106.650, gaining immediate support around 106.350, and violation of this level can extend selling bias until 105.850. On the 4 hour chart, we can see the USD/JPY pair is holding below descending triangle pattern, which may keep the pair in a bearish mode under 106.980 resistance. At the same time, the 50 EMA and MACD are also suggesting selling bias for the USD/JPY pair. Taking a selling trade below, 106.850 seems to be a good idea today.

All the best for today! 

Categories
Crypto Market Analysis

Daily Crypto Review, Apr 30 – Bitcoin +17% moves above $9,000, Altcoins follow as bullish Sentiment Prevails

The cryptocurrency market had an incredible day as most cryptocurrencies recorded daily gains of over 5%, some even reaching the double-digit gain levels. This move was led by Bitcoin reaching and surpassing $9,000. Bitcoin is currently trading for $9,201, which represents an increase of 17.21% on the day. Meanwhile, Ethereum gained 11.9% on the day, while XRP gained 7.9%.

Streamr DATAcoin took the position of today’s most prominent daily gainer, with gains of 60.65%. Aave lost 2.18% on the day, making it the most prominent daily loser.

Bitcoin’s dominance soared compared to yesterday’s dominance levels. Its value is now 65.19%, which represents a 1.29% difference to the upside.

The cryptocurrency market capitalization increased significantly when compared to yesterday, with its current value being $250.8. This value represents an increase of $25.92 billion when compared to the value it had yesterday.

Honorable mention

Coinbase and Binance amid Crypto Surge

Bitcoin’s price jump April 29 brought a few interesting things about certain exchanges to light. Binance, the world’s largest crypto exchange at the moment, has hit $11 billion in trading volume just for the past 24 hours, therefore reaching an all-time high. The last time the exchange even came near $11 billion was back in early 2018.

Unlike Binance’s thriving volume, Coinbase has experienced several major outages that stopped trading. Their status page, website, mobile app, as well as API website, experienced the outages.

_______________________________________________________________________

Technical analysis

_______________________________________________________________________

Bitcoin

The largest cryptocurrency by market cap explosively bounced to the upside, breaking the ascending trend. The price quickly rose from $7,750 levels all the way up to $8,980, where it was stopped. However, the newest push by the bulls brought the price above the $8,980 resistance level as well as the $9,120 level. The move was stopped by the $9,250 resistance level.


BTC’s volume increased greatly, while its RSI level stepped deep into the overbought territory on all time frames. Its current value on the 4-hour time frame is 90.

Key levels to the upside                    Key levels to the downside

1: $9,250                                           1: $9,120

2: $9,735                                           2: $8,980

3: $9,870                                            3: $8,820

Ethereum

Ethereum followed Bitcoin’s bullish pattern and gained quite of bit of value in the past 24 hours. The second-largest cryptocurrency by market cap passed the $198 level and soared towards the $217 level, where it got stopped by a large number of sellers. However, the most recent bullish move brought the price above $217. The move reached exhaustion at the $225.5 resistance level, where the price started descending.


Ethereum’s volume almost doubled today, while its RSI level reached 82.5 on the 4-hour chart.

Key levels to the upside                    Key levels to the downside

1: $225.5                                            1: $217.6

2: $240                                              2: $198

                                                           3: $193.6

Ripple

XRP also broke out of its usual pattern and soared, reaching the price level of $0.235. The third-largest cryptocurrency broke the $0.227 after some consolidation and testing of the resistance level. The price is now trying to find a place to consolidate at as well as to test the $0.227 support level.


XRP’s volume skyrocketed, while its RSI level reached the value of 85. The key level of $0.227 will remain on the “upside” side until XRP resolves its price uncertainty.

Key levels to the upside                    Key levels to the downside

1: $0.235                                           1: $0.227

2: $0.285                                           2: $0.205

3: $0.296                                            3: $0.2


Categories
Forex Market Analysis

Daily F.X. Analysis, April 29 – Top Trade Setups In Forex – Eyes on FOMC & U.S. GDP Today! 

On the forex front, the ICE U.S. Dollar Index slipped 0.1% on the day to 99.96 on Tuesday, as investors awaited U.S. first-quarter GDP data and the Federal Reserve’s interest rates decision due later today. The U.S. Federal Reserve will announce its interest rate decision (hold at 0.00% – 0.25% expected). The European Commission will post the Eurozone’s April Economic Confidence Index (73.1 expected).

Moreover, the European Central Bank will report the Eurozone’s M3 money supply in March (+5.5% on-year expected).

Economic Events to Watch Today     


EUR/USD – Daily Analysis

Today in the early Asian session, the EUR/USD currency pair erasing yesterday’s losses and crossed above key support at 1.0809 while representing a 0.27% gains on the day mainly due to the broad-based U.S. dollar weakness in the wake of risk-on market sentiment. 

The better mood in the risk market supports the shared currency. At the time of writing, the EUR/USD currency pair is currently trading at 1.0847 and consolidates in the range between the 1.0818 – 1.0855. However, the traders are cautious about placing nay strong position ahead of the all-important Federal Reserve (Fed) rate decision. 

At the USD front, the dollar index’s (DXY) bounce from the 13-day low of 99.45 reached during Tuesday’s American trading hours, and it ran out of steam near 99.90 early on Wednesday. It’s mostly because both the S&P 500 futures and Asian stocks climbed, as in result greenback is losing its haven demand. 

The greenback dropped to multi-week lows against the JPY currency and faced notable declines against the Aussie dollar and the New Zealand dollar mainly due to the better sentiments in the risk market. However, the reason behind the renewed risk-on market sentiment could be the lack of negative updates related to coronavirus. The slight stability in the oil market also keeps the market calm.

Later today, the U.S. Federal Reserve will announce its interest rate decision (hold at 0.00% – 0.25% expected). The U.S. Commerce Department will post 1Q annualized GDP (-4.0% on quarter). The National Association of Realtors will publish pending home sales for March (-13.6% on month expected).

Daily Support and Resistance

  • S1 1.0682
  • S2 1.0761
  • S3 1.0792

Pivot Point 1.084

  • R1 1.087
  • R2 1.0919
  • R3 1.0998

EUR/USD– Trading Tips

The EUR/USD is trading bullish at 1.0868 as the U.S. dollar seems to face bearish pressure ahead of Fed fund rate decision. On the higher side, the EUR/USD has the potential to go after 1.0882, and bullish breakout of this level may drive EUR/USD prices further higher until the next resistance level of 1.0960. The overall trading bias continues to be bullish, especially after the bullish crossover of 50 EMA and MACD. Both of the leading indicators are supporting bullish trend with immediate support around 1.0814. We should consider taking buying trades above 1.0840 today. 

GBP/USD – Daily Analysis

During Wednesday’s Asian session, the GBP/USD currency pair flashing green and taking bids near the 1.2475 while representing 0.40% gains on the day mainly due to broad-based U.S. dollar fresh weakness in the wake of renewed risk-on sentiment in the market. The currency pair erased Tuesday’s losses, which were caused by doubt regarding the U.K. government’s coronavirus (COVID-19) figures. 

Currently, the GBP/USD is trading at 1.2475 and consolidates in the range between the 1.2423 – 1.2486. However, the pre-FOMC and US GDP sentiments are boosting the currency pair’s strength.

On Tuesday, the official death toll of 552 shows further flattening of the virus curve in the U.K., while the update from the Office of National Statistics (ONS) indicates that the actual death toll in England to April 17 was 54% higher than the government released data report.

On the other hand, the U.S. dollar hit the multi-week lows against the JPY currency and suffered notable declines against the Aussie dollar and the New Zealand dollar mainly due to lack of its demand ahead of FOMC and U.S. GDP. The Dollar index’s (DXY) climbed from the 13-day low of 99.45 reached during Tuesday’s American trading hours ran out of steam near 99.90 early Wednesday, as the S&P 500 futures and Asian stocks rose, as in result greenback is losing its haven demand.

At the Brexit front, the report came that the discussions between the European Union (E.U.) and the U.K. regarding new trade arrangements from next year continue to postponed mainly due to disagreements and the coronavirus crisis. Besides this, the U.K.’s international trade secretary Liz Truss said that the E.U. is expected to stick under pressure and agree to a post-Brexit trade deal with the U.K.

Daily Support and Resistance

  • S1 1.2315
  • S2 1.2371
  • S3 1.24

Pivot Point 1.2427

  • R1 1.2456
  • R2 1.2483
  • R3 1.2539

GBP/USD– Trading Tip

The GBP/USD is exhibiting bullish bias around 1.2449 area, as it’s maintaining a fresh trading range of 1.2525 – 1.2396. On the 4 hour chart, the cable has also formed a bullish channel, which is supporting it around 1.2396 along with resistance around 1.2501. On the higher side, a bullish breakout of 1.2520 opens up further room for buying until 1.2560 and 1.2626 level. 

The GBP/USD pair is holding a buying zone, above 50 EMA, which is also supporting the cable around 1.2409. Since the MACD is holding above 0, we should look for buying trades in the GBP/USD pair. Let’s look for buying trades above 1.2410 and bearish trades below 1.2520 level today. 

USD/JPY – Daily Analysis

During the Asian session, the USD/JPY currency pair extended its 6-day losing streak and dropped to 106.41 while representing 41% declines on the day mainly due to broad-based U.S. dollar weakness in the wake of the risk-on market sentiment. However, the currency pair failed to cheer Japanese yen weakness and dropped to 6-weeks low. As of writing, the USD/JPY currency pair is currently trading at 106.44 and consolidates in the range between the 106.39 – 106.89. 

Whereas, the safe-haven demand for the U.S. dollar continues to lose due to the better mood in the equity market as hopes of re-opening of the economies in Australia, New Zealand, and parts of Europe boosting the market sentiment. Moreover, the dismal U.S. C.B. Consumer Confidence data, as well as the hopes of sharp U.S. economic contraction, keeps the U.S. dollar under pressure.

The currency pair continues to follow the broad-based U.S. dollar directions so far this week, with the latest stop in the dollar decline offering some support. The U.S. dollar index trades at 99.70 after hitting a daily low of 99.63.

The reason behind the risk-on market sentiment could also be the upbeat comments from the BOJ Governor. The Bank of Japan (BOJ) Governor Haruhiko Kuroda said on Tuesday that Japan’s financial system remains firm because a whole as bank groups have satisfactory capital buffers.

Daily Support and Resistance    

  • R3 108.1
  • R2 107.72
  • R1 107.3

Pivot Point 106.93

  • S1 106.51
  • S2 106.14
  • S3 105.72

USD/JPY – Trading Tips

On the technical front, the USD/JPY was facing solid support around 107, the round figure, but it got violated over increased demand for safe-haven yen. At the moment, the USD/JPY is facing strong resistance around 107, along with support at 106.500, but this support seems weaker, and we may see USD/JPY prices falling further until 106.240 later today. Looking at the leading indicators on the 4-hour timeframe, we may see USD/JPY prices are holding below 50 periods EMA, and at the same time, the MACD is also holding into a negative zone. Let’s look for selling trades below 106.800 today. 

All the best for today! 
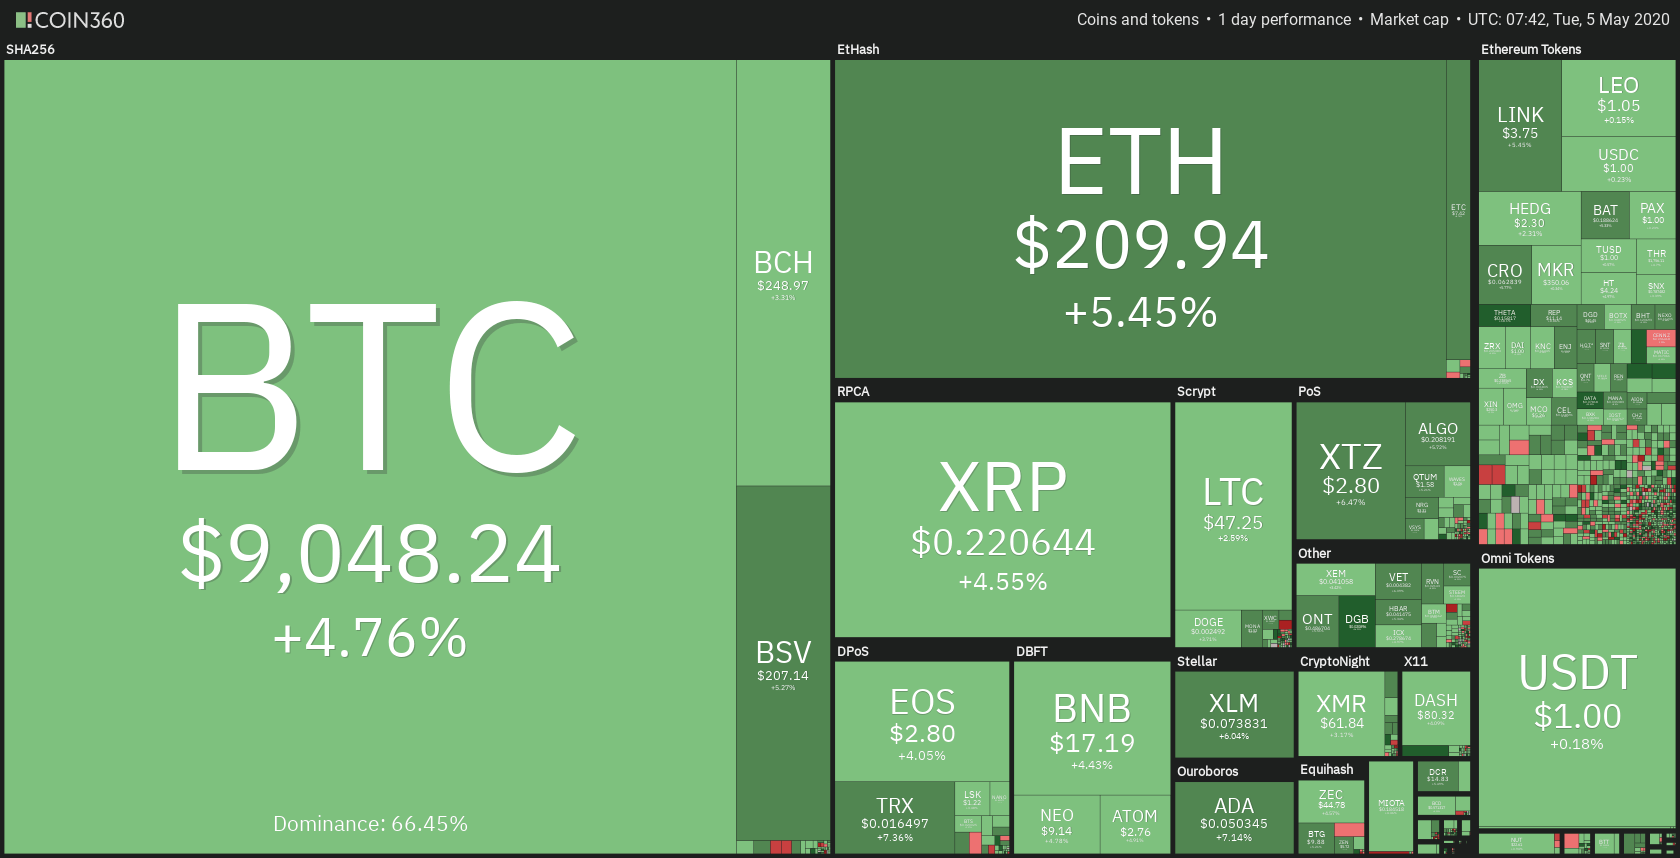
Categories
Crypto Market Analysis

Daily Crypto Review, Apr 29 – Small Bitcoin addresses skyrocketing; XRP exploding to the upside

The cryptocurrency market continued its past moves by slowly going towards the upside. Bitcoin is currently trading for $7,809, which represents an increase of 1.48% on the day. Meanwhile, Ethereum gained 2.74% on the day, while XRP gained 10.32%.

Aave took the position of today’s most prominent daily gainer, with gains of 25.55%. Hive lost 20.55% on the day, making it the most prominent daily loser.

Bitcoin’s dominance increased slightly compared to yesterday’s dominance levels. Its value is now 63.90%, which represents a 0.53% difference to the upside.

The cryptocurrency market capitalization pretty much stayed at the same place when compared to yesterday, with its current value being $224.88. This value represents an increase of $2.38 billion when compared to the value it had yesterday.

Honorable mention

Bitcoin network addresses reaching all-time highs

Glassnode’s data shows that the number of network addresses that hold at least 0.1 BTC continued growing throughout time, signifying a great increase in interest for Bitcoin. The numbers keep going up, passing 3,010,784 on Monday.

The number of addresses began to increase drastically around mid-February.

_______________________________________________________________________

Technical analysis

_______________________________________________________________________

Bitcoin

The largest cryptocurrency by market cap continued its slow move towards the upside along the ascending channel. Yesterday’s consolidation tested the downside of this channel, which kept up nicely and propelled the price up. In the meantime, Bitcoin passed the $7,750 resistance level and continued to move up.


BTC’s volume stayed steady over the course of the day, while its RSI level is currently dangerously close to the overbought area on the 4-hour time frame.

Key levels to the upside                    Key levels to the downside

1: $8,000                                           1: $7,750

2: $8,650                                           2: $7,420

3: $8,820                                            3: $7,085

Ethereum

Ethereum was stuck within a range bound by $193.6 to the downside and $198 to the upside for the majority of the day. However, the past couple of hours brought additional bull support, and Ethereum is now breaking this level. The price is currently above $198, but it will take some more time and testing to confirm the level breaking.


Ethereum’s volume was on the same level as it was the previous couple of days, while its RSI level started increasing. It is currently at a value of 62.5.

Key levels to the upside                    Key levels to the downside

1: $198                                               1: $193.6

2: $217                                              2: $185

                                                           3: $178.6

Ripple

XRP had a massive uptick that brought its price from $0.1965 all the way up to $0.2185. The move was accompanied by massive volume. This uptick broke through $0.2 as well as $0.205 resistance levels, stopping above (and retesting) the $0.214 level, which wasn’t really acknowledged since early March 2020.


XRP’s massive price increase brought its RSI level to overbought levels on every single time-frame. Its value on the 4-hour time-frame is currently sitting at 78.5. The $0.214 level will not be included in the “key level” section yet due to the uncertainty of it maintaining relevance.

Key levels to the upside                    Key levels to the downside

1: $0.227                                           1: $0.205

2: $0.285                                           2: $0.2

3: $0.296                                            3: $0.10


Categories
Crypto Market Analysis

Daily Crypto Review, Apr 28 – Ethereum up 50% in 2020; Crypto market a safe haven?

The cryptocurrency market has spent the past 24 hours mostly consolidating and preparing for the next move. Bitcoin is currently trading for $7,713, which represents an increase of 0.01% on the day. Meanwhile, Ethereum lost 1.08% on the day, while XRP lost 0.75%.

Stellar took the position of today’s most prominent daily gainer, with gains of 11.24%. Hive lost 33.46% on the day, making it the most prominent daily loser.

Bitcoin’s dominance decreased slightly compared to yesterday’s dominance levels. Its value is now 63.37%, which represents a 0.41% difference to the downside.

The cryptocurrency market capitalization pretty much stayed at the same place when compared to yesterday, with its current value being $222.50. This value represents a decrease of $0.52 billion when compared to the value it had yesterday.

Honorable mention

Ethereum

This year has not been good for financial markets. However, cryptocurrencies seem to be surviving the current situation a lot better. While not much has been made about Bitcoin’s gains of 7$ since the start of 2020, Ether has been performing amazingly. Its year-to-date price increase is roughly 50%. Ether’s price was trading for $129.89 on January 1st, 2020.

Many call the cryptocurrency market a safe haven. However, while it is true that it was less affected than the traditional markets, cryptos showed some degree of correlation with the other markets.

_______________________________________________________________________

Technical analysis

_______________________________________________________________________

Bitcoin

The largest cryptocurrency by market cap had a day of consolidating, with one attempt of breaking the $7,750 resistance level. While the price did break the level, it was short-lived, and BTC went below the level soon after. As it failed to break the $7,750 level, BTC started gaining momentum to the downside.


BTC’s volume stayed steady over the course of the day, while its RSI level went down from the near-overbought levels to just under 60.

Key levels to the upside                    Key levels to the downside

1: $7,750                                           1: $7,420

2: $8,000                                           2: $7,085

3: $8,650                                            3: $6,850


Ethereum

Ethereum spent the day consolidating as well. Unlike Bitcoin, the pressure was not just towards the upside. Ether had a couple of small pushes towards the upside and a couple of stronger ones to the downside. The $198 resistance level and $193.6 support level held up quite nicely, and the price remained within a range bound by these two levels. However, this narrow of a range will not last long, and Ethereum will have to break out to either side.


Key levels to the upside                    Key levels to the downside

1: $198                                                1: $193.6

2: $217                                              2: $185

                                                           3: $178.6


Ripple

XRP did not differ in its movements much from the other two top cryptocurrencies. After one shy attempt to break the $0.2 resistance level, which did not even reach the resistance line, XRP started moving towards the middle of the range-bound by $0.2 to the upside and $0.19 to the downside. There are no current indications of the short-term direction of XRP.


XRP’s volume remained at the same levels over the past couple of days, while its RSI level started dropping, currently being at 53.5.

Key levels to the upside                    Key levels to the downside

1: $0.2                                                1: $0.19

2: $0.205                                            2: $0.178

3: $0.227                                             3: $0.165

LAST HOUR NOTICE: Ripple just has made a large movement that broke the 0.2 resistance and made a new top above the one made on April 07. This 5 percent impulse has put it directly in an overbought condition but signaled a clear bullish move for this digital asset. It is expected a consolidation after the candle, but buyers may enter on the breakout of the 0.21 level.

Categories
Forex Market Analysis

Daily F.X. Analysis, April 28 – Top Trade Setups In Forex – Get Ready for C.B. Consumer Confidence

On Tuesday, the eyes will be on the U.S. Commerce Department, which will release March wholesale inventories (-0.5% on month expected) and advance goods trade balance (55.0 billion dollars deficit expected). The Conference Board will publish April Consumer Confidence Index (87.9 expected)S.P.SP/Case-Shiller will report 20-City Composite Home Price Index for February (+0.4% on month expected). Let’s look at today’s trade setups.

Economic Events to Watch Today     


EUR/USD – Daily Analysis

Today in the early Asian session, the EUR/USD currency pair is flashing red, and, having faced rejection at 1.0860, it pulled back mainly because the European leaders failed to reach on the agreement and left the ECB alone for the fight against coronavirus recession. That keeps the shared currency under pressure.

The broad-baseU.S.S. dollar latest recovery sentiment also pushes the currency pair lower. However, the pair’s sentiment will remain neutral while the pair is confined within the trading range of 1.0727-1.0860. A breakout could pave the way for at least a 100-pip rally, while a range breakdown would show the 2020 low of 1.0636. As of writing, the EUR/USD currency pair is currently trading at 1.0820 and consolidates in the range between the 1.0817 – 1.0837.

The direction in the currency pair would depend on Fed & ECB actions. It remains to see what the Federal Reserve and the European Central Banks Deliver during this week. Although, there is an option of increased bond purchases for both Central Banks but having eased aggressively between meetings.

The United States is struggling over the past two months in the fight against the coronavirus and having used multiple ways to tame this outbreak. So, as in result, the Federal Reserve can be quiet and measure the situation about the virus front, and the impact of the multiple easing measures announced over the past two months. 

In the meantime, the European leaders did not succeed in reaching an agreement on spending last week, left the European Central Bank alone during its tough time in a fight against the coronavirus-induced recession. Most of the observers think the ECB could hint that it will be ready to provide additional easing during the month of June. As a result, EUR/USD is more likely to suffer a range breakdown. 

Daily Support and Resistance

  • S1 1.0748
  • S2 1.0792
  • S3 1.0811

Pivot Point 1.0836

  • R1 1.0855
  • R2 1.0879
  • R3 1.0923

EUR/USD– Trading Tips

On Tuesday, the EUR/USD is trading sideways around 1.0828, despite the stronger Spanish Spanish Unemployment Rate from the Eurozone. The overall trading bias continues to be bearish as the EUR/USD prices are holding below 50 EMA, which is extending resistance around 1.0837 level. On the 4-hour chart, the EUR/USD may find resistance around 1.0837 level, and bullish breakout of this level can continue buying until 1.0889 level. Conversely, the bearish breakout of 1.0765 level can drive selling until 1.0649 level today, let’s look for selling trades below 1.0770 level today.  

GBP/USD – Daily Analysis

During Tuesday’s early Asian session, the GBP/USD currency pair failed to extend its four-day winning streak and dropped from the weekly high to 1.2415 while representing 0.13% losses on the day, as the broad-baseU.S.S. dollar regains the bids on optimism about reopening thU.S.S. economy. In the meantime, the intensifying fears and uncertainty abouU.K.K. lockdowns extension in the wake of coronavirus (COVID-19) also keeps the currency pair under pressure. The GBP/USD pair is trading at 1.2442 and consolidates in the range between the 1.2407 – 1.2450.

News oU.K.K. Prime Minister Boris Johnson returning back to the office helped the currency pair to register a 3-day winning streak on Monday after the Tory leader gave a cautious statement regarding the pandemic fears and showed some willingness to ease the lockdown despite coming coronavirus cases.

As per the latest report, the virus figures from thU.K.K. registered further 360 people died due to the virus in hospitals, reaching the total number of deaths to 21,092. Whereas, the death toll fell to the lowest in a month as compared to previous months.

Apart from this, the on-going criticism on Tory government’s about the handling of coronavirus crisis, and shortage of medical supplies also keeps the UK PM worried about lifting the lockdowns restrictions.

On the other hand, the Tory government’s struggles for further tests in order to achieve 100,000 a day target as well as calling for public questions to be discussed in the daily briefings also showing the UK PM Johnson and Tory party’s interest for the country while the chancellor’s struggles to keep small companies comfortable are also favorable for Tory’s despite recent criticism about the cracks in the mechanism.

Daily Support and Resistance

  • S1 1.2315
  • S2 1.2371
  • S3 1.24

Pivot Point 1.2427

  • R1 1.2456
  • R2 1.2483
  • R3 1.2539

GBP/USD– Trading Tip

The GBP/USD is exhibiting bullish bias as it’s trading at 1.2459 area, having violated the sideways trading range of 1.2450 – 1.2396. Closing of candles outside this range will determine further trends in the market. The Cable has closed candles above 50 EMA, which are extending support to the GBP/USD pair. 

On the upper side, the GBP/USD may find resistance around 1.2523, and violation of this can lead Sterling further higher until 1.2626 area. While immediate support holds around 1.2396 level, let’s look for buying trades above 1.2399 and bearish trades below 1.2520 level today. 

USD/JPY – Daily Analysis

The USD/JPY lost 0.2% to 107.28. The Bank of Japan announced that it would purchase the required amount of Japanese government bonds with no border, compared with a previous target of Y80 trillion, while keeping its benchmark rate at -0.1% unchanged. This morning, official data showed that Japan’s jobless rate edged up to 2.5% in March (as expected) from 2.4% in February.

ThU.S.S. Dollar Index, which dropped below the 100 marks earlier in the day, is up 0.12% on the day at 100.47 and stays on track to close the 4th-straight day in the positive area. The latest pullback of the U.S. dollar kept a lid on bullish moves in the pair. Currently, the USD/JPY is trading at 107.27 and consolidates in the range between the 106.98 – 107.86. However, investors are cautious and waiting for a fresh catalyst before placing any position.

Looking forward, the virus headlines will be the key catalyst, while thU.S.S. data about the Consumer Confidence and Richmond Fed Manufacturing could offer intermediate moves. ThU.S.S. Commerce Department will release March wholesale inventories (-0.5% on month expected) and advance goods trade balance (55.0 billion dollars deficit expected). 

The Conference Board will publish April Consumer Confidence Index (87.9 expected). S.P./Case-Shiller will report the 20-City Composite Home Price Index for February (+0.4% on month expected).

Daily Support and Resistance    

  • R3 108.25
  • R2 107.94
  • R1 107.59

Pivot Point 107.29

  • S1 106.94
  • S2 106.64
  • S3 106.29

USD/JPY – Trading Tips

The USD/JPY is trading with a bearish bias on Tuesday, as its prices are holding above the triple bottom support level of 107. Since Japanese yen is gaining bullish momentum, driving USD/JPY down, the violation of the 107 level can lead the pair towards the next support area of 106.550. The resistance today stays around 107.400, and above this, the next resistance may be found around 107.640. 

The 50 EMA is left around 107.570, which is far away around from current market prices of 107.045. While the MACD is suggesting selling bias among USD/JPY traders, so let’s keep an eye on the 107 level as we may see selling below this, and buying above this level today. 

All the best for today! 
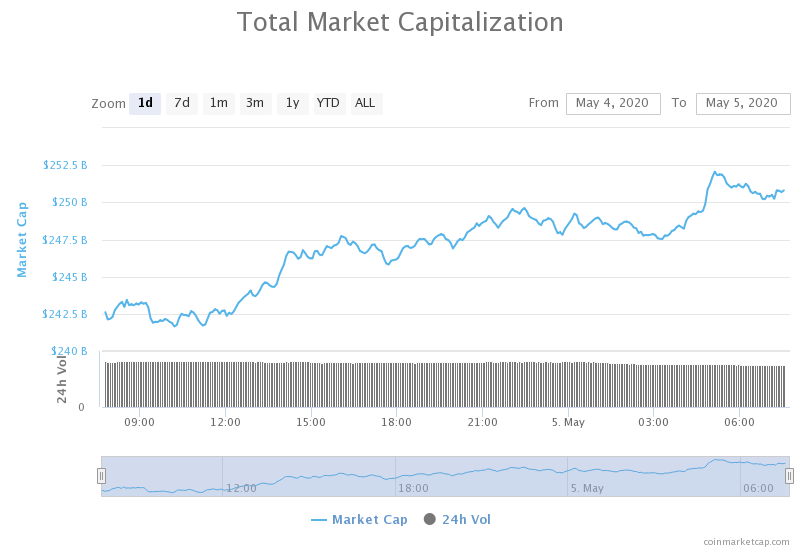
Categories
Forex Market Analysis

Daily F.X. Analysis, April 27 – Top Trade Setups In Forex – COVID19 Continues to Play! 

On the forex front, the U.S. dollar eased against other major currencies, with the Dollar Index slipping 0.2% on the day to 100.29. In the U.S., the Federal Reserve Bank of Dallas will release its Manufacturing Activity Index for April (-75.0 expected).

Economic Events to Watch Today     


EUR/USD – Daily Analysis

The EUR/USD currency pair continues to taking bids and rose above 1.0840 regions, mainly due to the positive German virus stats report. The broad-based U.S. dollar draw offers and reporting losses on the day in the wake of risk-on market sentiment, which eventually supports the currency pair. 

The bullish trend in the currency pair could be short-lived because the European leaders failed to agree on a comprehensive coronavirus stimulus package last week. The EUR/USD pair is currently trading at 1.0841 and consolidates in the range between the 1.0812 – 1.0843.

On the other hand, the German Chancellor Merkel showed some willingness to offer almost EUR 1 trillion as financial support for a coronavirus recovery package. The leaders failed to reach an agreement on the size of the fund, and it should share the burden of financing with those countries that run fiscal and trade surpluses.

As per the German disease and epidemic control center, Robert Koch Institute (RKI) showed the number of confirmed coronavirus cases increased to 155,193, with a total of 5,750 deaths registered so far. Moreover, the institute surveyed that a total of 114,500 people has recovered from the virus. 

Daily Support and Resistance

  • R3 1.0847
  • R2 1.0836
  • R1 1.0829

Pivot Point 1.0819

  • S1 1.0812
  • S2 1.0802
  • S3 1.0795

EUR/USD– Trading Tips

The EUR/USD pair continues trading in a buying mode around 1.0858, despite weaker manufacturing and services PMI figures from the Eurozone. The overall trading bias continues to be bearish as the EUR/USD prices are holding below 50 EMA, which is extending resistance around 1.08500 level. On the 4-hour chart, the EUR/USD is likely to find resistance below the symmetric triangle pattern, which may drive the selling bias in the pair. Currently, it’s holding the pair over 1.08580, which is the triple yop level. Above this, a slight bullish recovery can be seen until 1.0889 level. While bearish breakout of 1.0765 level can drive selling until 1.0649 level today, let’s look for selling trades below 1.0770 level today.  

GBP/USD – Daily Analysis

The GBP/USD currency pair succeeded in extending its 4th consecutive day winning streak and rose above mid-1.2400 while representing 0.60% gains on the day mainly due to the broad-based U.S. dollar weakness in the wake of better mood in the market. Apart from this, the on-going criticism about the U.K.’s handling of the coronavirus (COVID-19) crisis and Tory government’s stand on Brexit keeps the currency pair’s gain limited for the time being. A

The GBP/USD pair is currently training at 1.2452 and consolidates in the range between the 1.2360 – 1.2455. However, the UK PM Boris Johnson came back from the pandemic infection, which satisfied the buyers. The Uk PM Boris Johnson will likely take its seat back from the acting chief Dominic Raab after getting permission from the doctors at the Chequers. Although, Boris Johnson said that he is looking forward to going to Downing Street on Monday.

The U.k. PM Boris Johnson was absent since early April due to the coronavirus decease. Whereas, the UK Tory government getting an inadequate response from the entire nation about the handling of the coronavirus (COVID-19) crisis despite the hard efforts from the Chancellor Rishi Sunak and Health Secretary Matt Hancock, and the Deputy PM Dominic Raab.

Although, the shortage of medical supplies and the surge in the death toll have forced the United Nations (U.N.) poverty expert Philip Alston to attack the U.K.’s coronavirus response as “utterly hypocritical.

Moreover, the Health Secretary’s optimistic target of 100,000 tests a day got a surprise on Saturday after the government needed to avail the military helps to overcome the 29,000 marks.

Daily Support and Resistance

  • R3 1.2379
  • R2 1.2375
  • R1 1.2371

  Pivot Point 1.2367

  • S1 1.2363
  • S2 1.2359
  • S3 1.2356

GBP/USD– Trading Tip

The GBP/USD showed a slight bullish reversal to place a high around 1.2434, although the bullish trend wasn’t long enough as prices recorded soon. At the moment, the Cable is trading at 1.2437 area, after violating the resistance level of 1.2420 level and now this level is working as a support. A bullish breakout of 1.2368 level can extend the buying trend until 1.2420 level today. Elsewhere, the support continues to hold around 1.2258 level. The 50 EMA and MACD are both are suggesting selling bias in the Cable. So let’s look for selling trades below 1.2399 and bullish above 1.2420 level today. 

USD/JPY – Daily Analysis

The USD/JPY is consolidating in a tight trading range of 107.675 level to 106.950 level, mainly due to the risk-on market sentiment keeps the safe-haven Japanse lower and providing support to the currency pair. The U.S. announced 4.427 million initial jobless claims for the preceding week overnight, with an unparalleled 26 million people dropping their jobs since late March.

At the USD front, the U.S. dollar took bids due to mixed risk sentiment, which is starting to dominate the markets and caused the bearish pressure to remain intact. The U.S. Dollar Index, which dropped below the 100 marks earlier in the day, is up 0.12% on the day at 100.47 and stays on track to close the 4th-straight day in the positive area.

The latest pullback of the U.S. dollar kept a lid on bullish moves in the pair. Currently, the USD/JPY is trading at 107.27 and consolidates in the range between the 106.98 – 107.86. However, investors are cautious and waiting for a fresh catalyst before placing any position.

Whereas, the multiple diverging factors failed to provide any meaningful direction or assist the pair in breaking through a narrow trading band held since the beginning of this week. The reason behind the risk-on market sentiment is the report regarding the passage of another $484 billion U.S. economic support package by the U.S. Senate. 

While the latest modest recovery in crude oil prices also keeps the market sentiment calm. Looking ahead, the eyes will remain on the Core Durable Goods Orders m/mas that’s due during the U.S. session in order to forecast further trends in the USD related pairs. 

Daily Support and Resistance    

  • R3 107.84
  • R2 107.73
  • R1 107.62

Pivot Point 107.51

  • S1 107.4
  • S2 107.29
  • S3 107.17

USD/JPY – Trading Tips

The USD/JPY is mostly trading bearish within a narrow trading range of 107.720 – 107 zones. At the moment, the USD/JPY is holding at 107.197, and the triangle pattern that is formed during the previous week still lasts.  

The triangle pattern is prolonging resistance around 107.550, along with support around 106.980. If USD/JPY manages to violate the descending triangle pattern, we may see pair dropping towards 106.200. While on the upper side, a bullish breakout of 108 can lead USD/JPY prices towards 109.100. The leading indicator, such as MACD and 50 EMA, are supporting bearish bias in the market today. 

All the best for today! 

Categories
Crypto Market Analysis

Daily Crypto Review, Apr 27 – Bitcoin stopped by the $7,750 resistance – What’s to come next?

The cryptocurrency market continued its bullish momentum and went after new highs over the weekend. Bitcoin is currently trading for $7,698, which represents an increase of 1.52% on the day. Meanwhile, Ethereum gained 0.95% on the day, while XRP gained 1.4%.

Kyber Network took the position of today’s most prominent daily gainer, with gains of 28.05%. DigiByte lost 12.59% on the day, making it the most prominent daily loser.

Bitcoin’s dominance decreased slightly compared to Friday’s dominance levels. Its value is now 63.78%, which represents a 0.34% difference to the downside.

The cryptocurrency market capitalization increased over the weekend, with its current value being $223.02. This value represents an increase of $12.77 billion when compared to the value it had on Friday.

Honorable mention

StorJ

Storj, a decentralized storage network, has launched a program that provides free storage to COVID-19 research participant organizations on April 22.

Storj’s storage program is set to provide each of the qualifying organizations with 1 (one) terabyte of cloud storage completely free of charge. Storj has decided to commit up to 5 (five) petabytes of storage toward COVID-19 research in total. It will also consider requests for additional resources exceeding 1 (one) terabyte.

_______________________________________________________________________

Technical analysis

_______________________________________________________________________

Bitcoin

The largest cryptocurrency by market cap had a weekend of consolidation and indecisiveness. While the most recent spike brought BTC to higher levels and reach $7,811, the fact of the matter is that the $7,750 level held up quite nicely and that the Bitcoin bears did not let the price to stay above this level.


If Bitcoin goes over $7,750 support level, we can expect a sharp increase in price. However, if that does not happen, we are more likely to expect a heavy selloff at below $7,420.

Key levels to the upside                    Key levels to the downside

1: $7,750                                           1: $7,420

2: $8,000                                           2: $7,085

3: $8,650                                            3: $6,850


Ethereum

Ethereum followed Bitcoin to the upside and ended up in a narrow range between $193.6 and $198. However, Ethereum’s move towards the upside was much more stable than Bitcoin’s move. The second-largest cryptocurrency by market cap will not be staying in this range for long as it is too narrow. Its fair will most likely be decided by Bitcoin’s movement in the near future.


Ethereum’s volume held its level throughout the weekend, while its RSI is at 65.

Key levels to the upside                    Key levels to the downside

1: $198                                                1: $193.6

2: $217                                              2: $185

                                                           3: $178.6


Ripple

XRP made a slight increase in value over the weekend as well but had the same fate as Bitcoin. While its price increase is not insignificant, the fact that it got stopped by the $0.2 resistance level says a lot in regards to the bull vs. bear presence. XRP might be forming a double top at the $0.2 level, which may trigger a selloff in the short term.


XRP’s volume stayed at the same level throughout the weekend, while its RSI level shot up to 62.

Key levels to the upside                    Key levels to the downside

1: $0.2                                                1: $0.19

2: $0.205                                            2: $0.178

3: $0.227                                             3: $0.165

Categories
Crypto Market Analysis

Daily Crypto Review, Apr 24 – Bitcoin transaction fees jumping up by 50% in the past 24 hours; Cryptos making new gains

The cryptocurrency market continued its bullish momentum and tried reaching new highs, but got stopped by the resistance levels. While most cryptocurrencies ended up in the green, the gains they ended up making were far lower due to the price consolidating at lower levels. Bitcoin is currently trading for $7,503, which represents an increase of 4.62% on the day. Meanwhile, Ethereum gained 0.26% on the day, while XRP gained 2.5%.

DigiByte took the position of today’s most prominent daily gainer, with gains of 22.01%. Synthetix Network lost 3.97% on the day, making it the most prominent daily loser.

Bitcoin’s dominance increased slightly compared to yesterday’s dominance levels. Its value is now 64.12%, which represents a 0.4% difference to the upside.

The cryptocurrency market capitalization increased over the past 24 hours, with its current value being $213.26. This value represents an increase of $6.94 billion when compared to the value it had yesterday.

What happened in the past 24 hours

Bitcoin – Transaction Fee Increase

The total fees that were paid for on-chain Bitcoin transactions over the past 24 hours increased over 50% when compared to yesterday’s transactions paid.

Glassnode (an on-chain data analytics service) reported that total Bitcoin fees paid over the past 24 hours increased by 50.7%, amounting to over $9,500. On top of that, the Bitcoin fees paid by users increased by 58.8%, reaching the amount of $0.78 per transaction (on average).

Meni Rosenfeld (currently the Chairman of the Israeli Bitcoin Association), however, stated that he believes 24-hour fees are too short of a timeframe to be considered particularly significant. He also stated that the historical data suggests that the Bitcoin transaction fee is far more volatile than Bitcoin’s price itself.

_______________________________________________________________________

Technical analysis

_______________________________________________________________________

Bitcoin

The largest cryptocurrency by market cap had quite a volatile day. BTC managed to spike up and reach the price of $7,750, where it was stopped by the resistance level. The failure to break this level stopped Bitcoin’s momentum, then triggering a pullback. While Bitcoin made some gains on the day, they are nowhere as significant as they would be if it broke the $7,750 resistance level.


Bitcoin is now consolidating at the $7,500 level, with the possibility to test the $7,420 level.

Key levels to the upside                    Key levels to the downside

1: $7,750                                           1: $7,420

2: $8,000                                           2: $7,085

3: $8,650                                            3: $6,850


Ethereum

Ethereum ended up making a slight gain in the past 24 hours, mainly as a result of increased bullish momentum, which broke the $185 resistance level. The second-largest cryptocurrency by market cap was, however, stopped in the move by the resistance at $193.6. The pullback brought the price near the $185, which now acts as a support level.


Ethereum’s RSI level is hovering around and under the overbought territory.

Key levels to the upside                    Key levels to the downside

1: $193.6                                             1: $185

2: $198                                              2: $178.6

3: $217                                               3: $175.5


Ripple

XRP broke its steady gain phase and entered a “speedrun” to the upside. The third-largest cryptocurrency managed to reach the resistance at $0.2 before being brought back to consolidating levels. XRP is now trading in the middle of the range, bound by $0.19 to the downside and $0.2 to the upside.


Key levels to the upside                    Key levels to the downside

1: $0.2                                                1: $0.19

2: $0.205                                            2: $0.178

3: $0.227                                             3: $0.165

Categories
Forex Market Analysis

Daily F.X. Analysis, April 24 – Top Trade Setups In Forex – Retail Sales & Business Climate Ahead! 

The U.S. dollar soared versus major currencies despite bounce off in the crude oil prices, at the same time, the U.K. Brent also made some bullish recovery. The U.S. House of Representatives assumes to establish a nearly $500 billion coronavirus relief bill, which once again can trigger safe-haven demand of the U.S. dollar. 

During the Asian session, the U.S. dollar is headed for its best week since early April, as plunging oil prices pressures on commodity currencies and division over Europe’s emergency fund dragged on the euro. The market will mostly move based upon U.K. retail sales and German business climate figures today. 

Economic Events to Watch Today     


EUR/USD – Daily Analysis

The EUR/USD has traded bearishly at 1.0771 level after having violated the symmetric triangle pattern, which was supporting it around 1.0850. A daily close under 1.0783 level is likely to drive more sell-off below this level. Traders seem worries about potential recession since the release of worse than expected PMI figures. 

The drop in business activity not only in Germany but also in overall Europe has expanded in April, with both services and manufacturing witnessing a historic dip in output as a consequence of the COVID-19 pandemic and subsequent lockdown.

The headline Flash Germany Composite PMI recorded 17.1 in April, down distinctly from 35.0 in March, and by far, it’s the lowest reading since comparable figures were first collected more than 22 years ago. The preliminary figures were based on replies received between April 7-22. Shutdowns caused by the COVID-19 did not influence the survey response rate.

There remains some uncertainty that Europe is still not ready to deepen fiscal integration, and the finance ministers will likely be unable to give an appropriate fiscal stimulus. As in result, the peripheral bond spreads may widen, which may booster further losses in the EUR/USD currency pair.

The eurozone economy experienced the sheerest declines in business activity and employment ever registered during April as a consequence of actions taken to restrain the coronavirus break, according to provisional PMI survey figures. Later today, the focus will remain on the German Ifo Business Climate figures to determine further trends in the EUR/USD pair.

Daily Support and Resistance

  • R3 1.0917
  • R2 1.0881
  • R1 1.0828

Pivot Point 1.0792

  • S1 1.0739
  • S2 1.0703
  • S3 1.065

EUR/USD– Trading Tips

On Friday, the EUR/USD pair continues trading in a selling mode around 1.0773, perhaps due to weaker manufacturing and services PMI figures. The overall trading bias continues to be bearish as the EUR/USD prices are holding below 50 EMA, which is extending resistance around 1.0837 level.

On the 4-hour chart, the EUR/USD has violated the symmetric triangle pattern, which is driving the selling trend in the pair. Currently, it’s holding the pair over 1.077, which is the triple bottom level. Above this, a slight bullish recovery can be seen until 1.0850 level. While bearish breakout of 1.0765 level can drive selling until 1.0649 level today, let’s look for selling trades below 1.0770 level today.  

GBP/USD – Daily Analysis

The GBP/USD price is consolidating in a narrow trading range of 1.2424 – 1.2300. Sterling’s overall bias remains bearish since the release of manufacturing data. General business shutdowns at local and international levels in reply to the coronavirus infection 2019 (COVID-19) pandemic unsurprisingly ended in a speedy decline in U.K. private-sector production during April. 

The latest Markit report on Flash U.K. manufacturing PMI signaled by far the most robust drop in business activity since comparable figures were first collected over two decades ago. The latest Markit Flash U.K. Manufacturing PMI was recorded between 7-21 April 2020, and shutdowns did not influence the survey response rate in place due to the COVID-19 break.

The United States President Donald Trump continues to push for the economic re-start, whereas giving worse warnings to Iran. He indicated a decrease in the further coronavirus outbreak. The GBP/USD currency pair flashing buy and sell, now holding at 1.2345 while reporting 0.07% losses on the day, probably due to the Tory government growing criticism about the mishandling coronavirus crisis.  

Daily Support and Resistance

  • R3 1.0917
  • R2 1.0881
  • R1 1.0828

Pivot Point 1.0792

  • S1 1.0739
  • S2 1.0703
  • S3 1.065

GBP/USD– Trading Tip

The GBP/USD showed a slight bullish reversal to place a high around 1.2414, but the bullish trend wasn’t long enough as prices recorded soon. At the moment, the Cable is trading at 1.2347 area, which is also a resistance level extended by the downward channel. The 50 periods EMA also extend resistance at the same level 1.2368. A bullish breakout of 1.2368 level can extend the buying trend until 1.2420 level today. Elsewhere, the support continues to hold around 1.2258 level. The 50 EMA and MACD are both are suggesting selling bias in the Cable. So let’s look for selling trades below 1.2399 and bullish above 1.2420 level today. 

USD/JPY – Daily Analysis

On Friday, the USD/JPY is consolidating in a narrow trading range of 108.00 level to 107.500 level, mainly due to the risk-on market sentiment keeps the safe-haven Japanse lower and providing support to the currency pair. The U.S. announced 4.427 million initial jobless claims for the preceding week overnight, with an unparalleled 26 million people dropping their jobs since late March.

At the USD front, the U.S. dollar took bids due to mixed risk sentiment, which is starting to dominate the markets and caused the bearish pressure to remain intact. The U.S. Dollar Index, which dropped below the 100 marks earlier in the day, is up 0.12% on the day at 100.47 and stays on track to close the 4th-straight day in the positive area.

The latest pullback of the U.S. dollar kept a lid on bullish moves in the pair. Currently, the USD/JPY is trading at 107.67 and consolidates in the range between the 107.66 – 107.86. However, investors are cautious and waiting for a fresh catalyst before placing any position.

Whereas, the multiple diverging factors failed to provide any meaningful direction or assist the pair in breaking through a narrow trading band held since the beginning of this week. The reason behind the risk-on market sentiment is the report regarding the passage of another $484 billion U.S. economic support package by the U.S. Senate. While the latest modest recovery in crude oil prices also keeps the market sentiment calm. 

Looking ahead, the eyes will remain on the Core Durable Goods Orders m/mas that’s due during the U.S. session in order to forecast further trends in the USD related pairs. 

Daily Support and Resistance    

  • S1 105.92
  • S2 106.84
  • S3 107.44

Pivot Point 107.76

  • R1 108.36
  • R2 108.69
  • R3 109.61

USD/JPY – Trading Tips

The USD/JPY is mostly trading sideways within a narrow trading range of 108.020 – 107.300 zones. At the moment, it’s holding at 107.597, having formed a descending triangle pattern on the 4-hour timeframe. The triangle pattern is extending resistance around 107.850, along with support around 106.980. If USD/JPY manages to violate the descending triangle pattern, we may see pair dropping towards 106.200. While on the upper side, a bullish breakout of 108 can lead USD/JPY prices towards 109.100. The leading indicator, such as MACD and 50 EMA, are supporting bearish bias in the market today. 

All the best for today! 

Categories
Forex Market Analysis

Daily F.X. Analysis, April 23 – Top Trade Setups In Forex -U.S. Unemployment Figures Ahead! 

On the forex front, the U.S. Dollar Index surged 0.1% on the day to 100.35, surging for a third consistent session. The U.K. Office for National Statistics will release March public sector net borrowing, excluding banking groups (1.8 billion pounds expected).

The U.S. Labor Department will release initial jobless claims in the week ended April 18 (4.5 million expected). The Commerce Department will report March new home sales (640,000 units expected).

Economic Events to Watch Today     


EUR/USD – Daily Analysis

The EUR/USD fell to trade below 1.0800, the lowest level in nearly two weeks. The official figures revealed that the eurozone’s Consumer Confidence Index slips to -22.7 in April (-20.0 expected) from -11.6 in March. At the coronavirus front, as per the latest report, the number of confirmed coronavirus cases grew to 145,694, with 4,879 deaths reported in Germany so far. As the incidents increased by 2,237 in Germany, a 1.6% rise picking-up pace from Tuesday’s 1.3% increment, the death toll moved sharply up by 281 vs. 194 a day before.

There remains some uncertainty that Europe is still not ready to deepen fiscal integration, and the finance ministers will likely be unable to give an appropriate fiscal stimulus. As in result, the peripheral bond spreads may widen, which may booster further losses in the EUR/USD currency pair.

The eurozone economy experienced the sheerest declines in business activity and employment ever registered during April as a consequence of actions taken to restrain the coronavirus break, according to provisional PMI survey figures. 

The flash IHS Markit Eurozone Composite PMI plunged to an all-time low of 13.5 in the month of April, falling from a previous historic low of 29.7 in March. It registers by far the most significant monthly breakdown in production recorded in over two decades of survey data collection.

Daily Support and Resistance

  • S1 1.0673
  • S2 1.0755
  • S3 1.0789
  • Pivot Point 1.0837
  • R1 1.0871
  • R2 1.0919
  • R3 1.1001

EUR/USD– Trading Tips

The EUR/USD is trading bearish at 1.0793, as traders are selling euro on the back of weaker than anticipated manufacturing and services PMI figures. The overall bias prevails bearish as the EUR/USD prices are holding below 50 EMA, which is extending resistance around 1.0837 level. Continuation of a selling trend below 1.0837 level may lead EUR/USD pair until the next support area of 1.0772, whereas below this, the next support prevails around 1.0652 level. The pair may find an immediate resistance level of around 1.0837, while the bullish breakout of this level can extend buying until the next resistance level of 1.0922. Conversely, we should look for selling trades below 1.0830 level today.  

GBP/USD – Daily Analysis

The GBP/USD surged 0.3% to 1.2325. Government economic figures reported that U.K. CPI soared 1.5% on year in March (as expected). On the other hand, the Markit U.K. Manufacturing PMI (42.0 estimated) and Services PMI (27.8 expected) for April will be published later today.

The latest and modest recovery in the U.S. dollar keeps the currency pair under pressure. The GBP/USD currency pair is currently trading at 1.2363 and consolidates in the range between the 1.2313 – 1.2369. However, the traders are keenly waiting for the key UK PMI, and U.S. Jobless Claims data. They are cautious about placing any strong bids.

The members of the cabinet got the chance for the first time to criticize Prime Minister Boris Johnson and Company’s poor performance about managing the coronavirus crisis in the U.K. However, the members did not only criticized for the lack of medical supplies, but they also indicated the shortage of nurses.

In return, the deputized PM indicated the nearness to the peak of the outbreak. The Health Secretary Matt Hancock is suggesting the start of the human trials over 300,000 people in a year.

On the positive side, the report came that the Prime Minister johnson will attend his conversation with the Queen through telephone after this week, although his deputy Dominic Raab is officially leading the country due to his absence.

On the other hand, the United States President Donald Trump continues to push for the economic re-start, whereas giving worse warnings to Iran. He indicated a decrease in the further coronavirus outbreak. The GBP/USD currency pair flashing red and dropped to 1.2325 while representing 0.07% losses on the day, possibly due to the Tory government getting criticism about the mishandling coronavirus crisis.  

Daily Support and Resistance

  • S1 1.1974
  • S2 1.2148
  • S3 1.2223

Pivot Point 1.2322

  • R1 1.2397
  • R2 1.2496
  • R3 1.2671

GBP/USD– Trading Tip

The GBP/USD showed a slight bullish reversal after testing the target level of 1.2254 area. At the moment, the Cable is trading at 1.2347 area, which is also a resistance level extended by the downward channel. The 50 periods EMA also extend resistance at the same level 1.2368. 

A bullish breakout of 1.2368 level can extend the buying trend until 1.2420 level today. Elsewhere, the support continues to hold around 1.2258 level. The 50 EMA and MACD are both are suggesting selling bias in the Cable. So let’s look for selling trades below 1.2399 and bullish above 1.2420 level today. 

USD/JPY – Daily Analysis

During the Thursday’s European session, the USD/JPY currency pair flashing green but remained confined between the range between 108.00 Handles mainly due to the risk-on market sentiment keeps the safe-haven Japanse lower and providing support to the currency pair. 

The latest pullback of the U.S. dollar kept a lid on bullish moves in the pair. Currently, the USD/JPY is trading at 107.67 and consolidates in the range between the 107.66 – 107.86. However, investors are cautious and waiting for a fresh catalyst before placing any position.

Whereas, the multiple diverging factors failed to provide any meaningful direction or assist the pair in breaking through a narrow trading band held since the beginning of this week. The reason behind the risk-on market sentiment is the report regarding the passage of another $484 billion U.S. economic support package by the U.S. Senate. While the latest modest recovery in crude oil prices also keeps the market sentiment calm. 

The U.S. dollar drew offer and erased its previous session gains and turned out to be one of the key factors that kept a lid on any additional gains in the pair, at least for now. At the same time, the risk recovery in the global risk sentiment weakens the Japanese yen’s safe-haven demand and collaborates in the pairs gains. The risk-on sentiment was bolstered by a modest rise in the U.S. Treasury bond yields, which extend some support to the U.S. Dollar.

Daily Support and Resistance    

  • S1 105.92
  • S2 106.84
  • S3 107.44

Pivot Point 107.76

  • R1 108.36
  • R2 108.69
  • R3 109.61

USD/JPY – Trading Tips

On Thursday, the USD/JPY is trading mostly sideways within a narrow trading range of 108.020 – 107.300 zones. At the moment, it’s holding at 107.597, having formed a descending triangle pattern on the 4-hour timeframe. The triangle pattern is extending resistance around 107.850, along with support around 106.980. If USD/JPY manages to violate the descending triangle pattern, we may see pair dropping towards 106.200. While on the upper side, a bullish breakout of 108 can lead USD/JPY prices towards 109.100. The leading indicator, such as MACD and 50 EMA, are supporting bearish bias in the market today. Let’s wait for a breakout before taking more trades today.

All the best for today! 
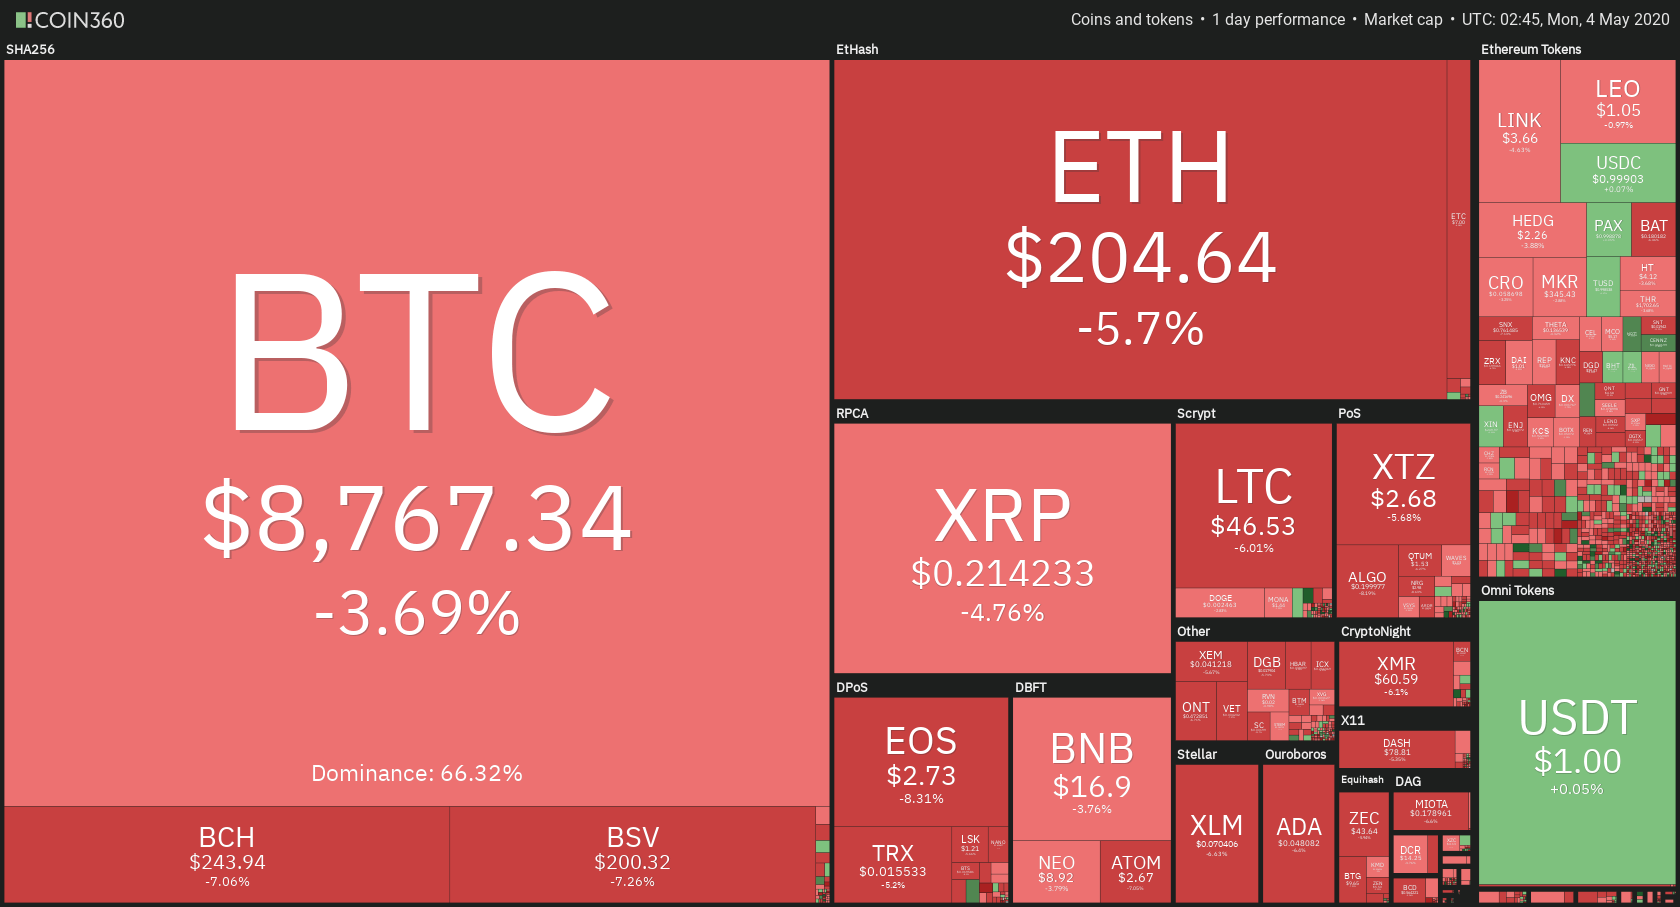
Categories
Crypto Market Analysis

Daily Crypto Review, Apr 23 – Binance confirms – Facebook’s Libra back in play; Bitcoin above $7,000

The cryptocurrency market gathered bullish momentum as Bitcoin passed $7,000 to the upside once again. Most cryptocurrencies ended up in the green, some even recording double-digit gains. Bitcoin is currently trading for $7,142, which represents an increase of 4.3% on the day. Meanwhile, Ethereum gained 6.94% on the day, while XRP gained 3.77%.

DigiByte took the position of today’s most prominent daily gainer, with gains of 22.37%. Quant lost 3.4% on the day, making it the most prominent daily loser.

Bitcoin’s dominance stayed at the same place when compared to yesterday. Its value is now 63.72%, which represents a 0.2% difference to the downside.

The cryptocurrency market capitalization increased over the past 24 hours, with its current value being $206.32. This value represents an increase of $8.06 billion when compared to the value it had yesterday.

What happened in the past 24 hours

Libra

Binance Research looked into Libra’s most recent whitepaper, which was updated as the regulators were not particularly happy with the previous iteration of the whitepaper. A lengthy report came from their research team, in part claiming that Facebook’s Libra could alter the payments world in a major way.

They mentioned that Libra’s global payment system could possibly do to the payment industry what Elon Musk’s SpaceX did to the space industry.

_______________________________________________________________________

Technical analysis

_______________________________________________________________________

Bitcoin

The largest cryptocurrency by market cap managed to gather bullish momentum and push for $7,000 once again. Bitcoin managed to break through $7,000 as well as the $7,085 resistance levels. On top of that, the $7,085 level got tested and held up quite nicely. We can expect a move towards the upside from Bitcoin, but we have to look for any cueues when it comes to price reversal, as Bitcoin is possibly on its way of creating a double top formation. However, the current outlook is slightly bullish.


Key levels to the upside                    Key levels to the downside

1: $7,420                                           1: $7,085

2: $7,750                                           2: $6,850

3: $8,000                                            3: $6,640


Ethereum

Ethereum also ended up being in the green on the daily, even more so than Bitcoin. ETH bulls pushed its price above the $175.5 as well as $178.6 resistance levels, which were overcome pretty easily. Ethereum’s move towards the upside was stopped by the $185 level for a short while, and the level is currently being tested.


Ethereum’s RSI level is approaching overbought territory while its volume is fading, which is a strong indicator of an end of the move. However, Ethereum still has a chance to approach $193.6 if the volume returns.

Key levels to the upside                    Key levels to the downside

1: $185                                                1: $175.5

2: $193.6                                            2: $178.6

3: $198                                                3: $168


Ripple

XRP had a good day as well, with its price steadily rising towards the $0.19 level, and breaking it as well. The main difference between XRP’s price gain and the one of Bitcoin and Ethereum was the intensity of the move. XRP performed steadily, while BTC and ETH were quite explosive. While XRP managed to break the $0.19 resistance level, it is still undecided where the price will consolidate at, as the level was not tested out.


For this reason, the $0.19 level will not be moved to the downside key levels yet.

Key levels to the upside                    Key levels to the downside

1: $0.19                                              1: $0.178

2: $0.2                                                2: $0.165

3: $0.205                                             3: $0.147

Categories
Forex Market Analysis

Daily F.X. Analysis, April 22 – Top Trade Setups In Forex -U.K. Inflation Stabilises! 

On the forex front, the U.S. dollar gained traction against other major currencies, with the Dollar Index climbing 0.3% on the day to 100.20. The U.S. official data showed that Existing Homes Sales fell to an annualized rate of 5.27 million units in March (5.25 million units expected).

The British Consumer Prices Index (CPI), including owner-occupiers’ housing inflation rate, came out at 1.5% in March 2020. Although it’s down from 1.7% in February 2020, it’s not as bad as investors were expecting considering the lockdown in global markets. 

Economic Events to Watch Today     


 EUR/USD – Daily Analysis

The EUR/USD fell by nearly 0.1% to trade at 1.0865. While Spain’s central bank announced, the country’s GDP could fall by 6.8% to 12.4% this year. Later in the today, the major focus will stay on the German ZEW Current Situation Index for April will be released (-75.0 estimated).  

After the Eurozone divided on community debt, most of the analytes are worried that the finance ministers’ may unable to provide a suitable fiscal stimulus to support growth. So, the shared currency could remain under pressure ahead of the Thursday summit.

At the coronavirus front, as per the latest report, the number of confirmed coronavirus cases grew to 145,694, with 4,879 deaths reported in Germany so far. As the cases increased by 2,237 in Germany, a 1.6% rise picking-up pace from Tuesday’s 1.3% increment, the death toll moved sharply up by 281 vs. 194 a day before.

Looking forward, the upbeat Eurozone Consumer Confidence, which is scheduled to release at 14:00 GMT, may put a bid under EUR/USD currency pair. However, the pair trend will remain sluggish until the pair break the trading range of 1.0897 to 1.08616. 

Daily Support and Resistance

  • S1 1.0724
  • S2 1.0788
  • S3 1.0823

Pivot Point 1.0852

  • R1 1.0887
  • R2 1.0916
  • R3 1.098

EUR/USD– Trading Tips

On Wednesday, the EUR/USD is trading sideways at 1.0825, as investors seem to wait for a solid reason to enter the market. The overall bias remains bearish as the EUR/USD prices are holding below 50 EMA, which is extending resistance around 1.08945 level. Continuation of a selling trend below 1.08945 level can continue selling until the next support area of 1.0772, but on the way, the pair may find support around 1.0815 level. 

The EUR/USD is likely to find support around 1.0772, but below this, the next support prevails around 1.0652 level. The pair may find an immediate resistance level of around 1.09230, where the bullish breakout of this level can extend buying until the next resistance level of 1.1036. Conversely, we should look for selling trades below 1.0894.  


GBP/USD – Daily Analysis

The GBP/USD soared 0.3% to trade at 1.2318 as the British Consumer Prices Index (CPI), including owner-occupiers’ housing inflation rate, came out at 1.5% in March 2020. Although it’s down from 1.7% in February 2020, it’s not as bad as investors were expecting considering the lockdown in global markets. 

 At the USD front, investors prefer to choose the U.S. dollar because of its safe-haven-demand in the market due to the fears of economic fallout, which is caused by the coronavirus outbreak. The dollar index, which measures the worth of the greenback against majors, rose 0.20% to levels above 100.00.

The reason behind the decline in GBP/USD pair could also be the immediate rise in COVID-19 cases, with the curve still not notably peaking. It indicates that there is still a high chance that lockdowns could last longer than expected, while the Bankruptcy and bad loans will likely boost the risk-off sentiment in the market and provide further support to the U.S. dollar again.

Apart from the U.K., U.S. President Donald Trump suggested that approximately 20 states ready for re-open while also showing a willingness to sign the bill that stops immigration into the U.S. for 60 days. As in result, the risk sentiment remains under pressure.

The reason behind the risk-off market sentiment could also be the early Asian news surrounding the U.S. Senate’s passage of $484 billion COVID-19 relief package and BOJ’s likely decline of economic and price forecasts. Moreover, statements from the BOE’s Bailey were also necessary to remark during the early Asian session.

As in result, the U.S. 10-year Treasury yields declined by 2-basis points (bps) to 0.55%, after dropping 4-bps on Tuesday, while the most stocks in Asia-Pacific flashing losses by the pres time.


Daily Support and Resistance

  • S1 1.1974
  • S2 1.2148
  • S3 1.2223

Pivot Point 1.2322

  • R1 1.2397
  • R2 1.2496
  • R3 1.2671

GBP/USD– Trading Tip

Yesterday, the GBP/USD fell sharply to trade at 1.2250 after violating the horizontal support level of 1.2424. On the 4 hour chart, the Cable has closed Doji candle above 1.2250 level can drive bullish bias until 1.2350. On the upper side, the Sterling may find next resistance around 1.2426, it’s the same level that supported the pair previously, and now it’s likely to drive selling bias in the GBP/USD pair. On the lower side, the violation of the 1.2265 level can lead the GBP/USD prices towards 1.2175. The 50 EMA and MACD are both are suggesting selling bias in the Cable. So let’s look for selling trades below 1.2322 and bullish above the same level today. 

USD/JPY – Daily Analysis

On Wednesday, the USD/JPY is trading around 107.500 level, mostly exhibiting sideways trading due to a lack of major economic events in the market. The U.S. dollar index slipped to the fresh lows of 100.07 ahead of recovering some ground, still bearish by 0.15% on the day.

The Japanese yen seems to suffer due to a lack of confidence when the state of emergency is being lifted in Japan. While drop-in, the domestic macroeconomic indicators are expected to keep the Japanese yen’s in a bearish mode while maintaining the USD/JPY bullish. Lately, the uptrend in the JPY could be limited due to the forecast of the Bank of Japan (BOJ) support measures to boost funding for the companies due to be announced next week. 

The U.S. Treasury prices advanced as investors continued to seek safe-haven assets. The benchmark 10-year U.S. Treasury yield declined to 0.571% from 0.625% Monday.

On the negative side, the greenback gained ground due to the oil price crash triggered a dash for cash. The high uncertainty in the market also boosted the greenback demand. So, if that trend continues during the ay ahead, the yellow metal could come under pressure.

Daily Support and Resistance    

  • S1 105.92
  • S2 106.84
  • S3 107.44

Pivot Point 107.76

  • R1 108.36
  • R2 108.69
  • R3 109.61

USD/JPY – Trading Tips

The USD/JPY is trading mostly sideways within a narrow trading range of 108.020 – 107.300 zones. At the moment, it’s holding at 107.597, having formed a descending triangle pattern on the 4-hour timeframe. The triangle pattern is extending resistance around 107.850, along with support around 106.980.  

In case, the USD/JPY violates the descending triangle pattern; we may see pair dropping towards 106.200. While on the upper side, a bullish breakout of 108 can lead USD/JPY prices towards 109.100. The leading indicator, such as MACD and 50 EMA, are supporting bearish bias in the market today. Let’s wait for a breakout before taking more trades today.

All the best for today! 
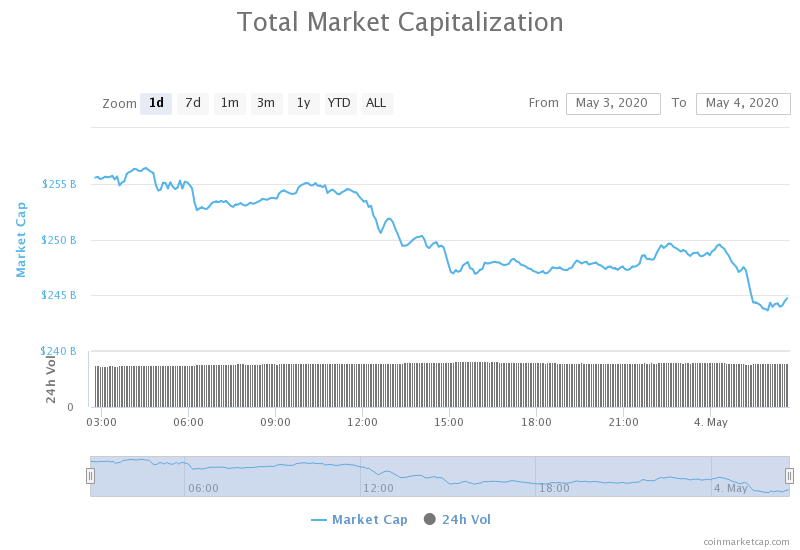
Categories
Crypto Market Analysis

Daily Crypto Review, Apr 22 – The Netherlands testing grounds for EU digital currency; Ripple Labs suing YouTube

The cryptocurrency market didn’t move much in the past 24 hours, but rather took the time to consolidate and establish support and resistance levels. Bitcoin is currently trading for $6,849, which represents a decrease of 0.32% on the day. Meanwhile, Ethereum lost 0.55% on the day, while XRP dropped 0.19% from yesterday’s price.

DigiByte took the position of today’s most prominent daily gainer, with gains of 7.96%. MaidSafeCoin lost 5.02% on the day, making it the most prominent daily loser.

Bitcoin’s dominance stayed at the same place when compared to yesterday. Its value is now 63.92%, which represents a 0.09% difference to the upside.

The cryptocurrency market capitalization decreased as most cryptos were in the red. Its current value is $198.26. This value represents a decrease of $1.13 billion when compared to the value it had yesterday.

What happened in the past 24 hours

The 45-page CBDC report is that the Netherlands’ Dutch Central Bank (DNB) wants to become a digital currency “test subject” for the Eurosystem.

The DNB said that the development of a euro-based digital currency could contribute to diversity as well as innovation in the payment market. They believe that the Netherlands provides a suitable place for such an experiment.

Honorable mention

Ripple

Ripple Labs (ran by its CEO Brad Garlinghouse) filed a lawsuit against Youtube LLC in California’s Northern District on Apr 21. Ripple seeks damages for Youtube’s inability to stop XRP scammers as well as impersonators.

The plaintiffs are taking action against Youtube to, as they said, change the expectation of accountability in the current industry that Youtube is in.

_______________________________________________________________________

Technical analysis

_______________________________________________________________________

Bitcoin

The largest cryptocurrency by market cap had a slow day and kept to the price it was at yesterday. Bitcoin seems to be fighting for the $6,850 level and whether it will end up above or below it is highly debatable. However, once the price establishes, we can expect a further move to that side. The probabilities are slightly in favor of the downside.


Bitcoin’s volume was on the levels it was at over the weekend, while its RSI level stayed around the value of 43.

Key levels to the upside                    Key levels to the downside

1: $7,085                                           1: $6,850

2: $7,420                                           2: $6,640

3: $7,750                                            3: $5,960


Ethereum

Ethereum spent the past 24 hours consolidating and establishing its position above the $168 support level. The attempt to do that was so far successful, and there is no reason for expecting ETH to go below it unless strong selling BTC pressure appears (due to the correlation these two cryptocurrencies have).


Ethereum’s volume stayed at the same level as the previous day, while its RSI level is in the middle of the value range.

Key levels to the upside                    Key levels to the downside

1: $175.5                                             1: $168

2: $178.6                                            2: $158 

3: $185                                                3: $147.5


Ripple

After confirming its position above the descending trend, XRP continued moving sideways and consolidating. The low volume and indecisiveness translated into the chart, which we can prove by seeing large wicks and small candlestick bodies in the past 24 hours.


XRP’s volume was descending throughout the day, while its RSI level kept its position around the value of 43.

Key levels to the upside                    Key levels to the downside

1: $0.19                                              1: $0.178

2: $0.2                                                2: $0.165

3: $0.205                                             3: $0.147

Categories
Forex Market Analysis

Daily F.X. Analysis, April 21 – Top Trade Setups In Forex – Economic Sentiment in Highlights! 

On the forex front, the U.S. dollar firmed against its major peers, with the Dollar Index gaining 0.2% on the day to 99.95. The ZEW survey results of April will be released for Germany (current situation at -75.0, expectations at -42.0 expected) and the Eurozone.

The U.K. Office for National Statistics will report a jobless rate for the three months to February (steady at 3.9% expected). While in the U.S., the National Association of Realtors will report March existing home sales (5.30 million units expected).

Economic Events to Watch Today     


EUR/USD – Daily Analysis

The EUR/USD fell by nearly 0.1% to trade at 1.0865. While Spain’s central bank announced, the country’s GDP could fall by 6.8% to 12.4% this year. Later in the today, the major focus will stay on the German ZEW Current Situation Index for April will be released (-75.0 estimated).  

European stocks were mostly trading higher, with the Stoxx Europe 600 Index surging 0.7%. Both Germany’s DAX and the U.K.’s FTSE 100 added 0.5%, and France’s CAC was up 0.7%, which are somehow supporting the Euro, the single currency. 

As of now, the market participants seem very concerned about the negative impact of the oil prices Monday’s declines and keeps their eyes on it. As in result, the U.S. dollar could continue to gain ground during the Europan trading hours ahead while the S&P 500 futures are now reporting a 0.65% drop. 

The additional bearish pressure could arise from President Trump’s decision to delay immigration to the U.S. to control the coronavirus outbreak. Let’s brace to trade ZEW survey results of April will be released for Germany (current situation at -75.0, expectations at -42.0 expected) and the Eurozone. 

Daily Support and Resistance

  • S1 1.0758
  • S2 1.0813
  • S3 1.084

Pivot Point 1.0869

  • R1 1.0896
  • R2 1.0924
  • R3 1.098

EUR/USD– Trading Tips

Technically, the EUR/USD is trading with a slightly bearish bias at 1.0825, exhibiting a bearish crossover below 50 EMA, which is now extending resistance around 1.0903 level. Continuation of a selling trend below 1.0903 level can extend selling until the next support area of 1.0772, but on the way, the pair may find support around 1.0815 level. The EUR/USD is likely to find support around 1.0772, but below this, the next support prevails around 1.0652 level. The pair may find an immediate resistance level of around 1.09230, where the bullish breakout of this level can extend buying until the next resistance level of 1.1036. Conversely, we should look for selling trades below 1.0870.

GBP/USD– Daily Analysis

The GBP/USD slid 0.5% to 1.2442. Investors will focus on the U.K. jobless rate for the three months to February due later in the day (steady at 3.9% expected). The United Kingdom and European Union Brexit drama keep moving while the latest news recommending to keep a check of Britain’s £39 billion has also been underlined by the cost of dealing with coronavirus, especially the economic £250 billion rescue package announced by Chancellor Rishi Sunak to protect jobs and businesses.

At the USD front, investors prefer to choose the U.S. dollar because of its safe-haven-demand in the market due to the fears of economic fallout, which is caused by the coronavirus outbreak. The dollar index, which measures the worth of the greenback against majors, rose 0.20% to levels above 100.00.

Later today, the U.S. dollar could continue to gain ground during the Europan trading hours ahead due to high safe-haven demand in the market in the wake of intensifying coronavirus fears while the S&P 500 futures are now reporting a 0.65% drop. 

On the other hand, the reason behind the cable’s pair declines could also be the immediate rise in COVID-19 cases, with the curve still not notably peaking. It indicates that there is still a high chance that lockdowns could last longer than expected, while the Bankruptcy and bad loans will likely boost the risk-off sentiment in the market and provide further support to the U.S. dollar again.

Looking forward, traders are keenly waiting for the key U.K. data which is scheduled to release during this day ahead As well as, the coronavirus related headlines also will be key to watch for taking fresh directions in the U.S. dollar.


Daily Support and Resistance

  • S1 1.2298
  • S2 1.2374
  • S3 1.2407

Pivot Point 1.245

  • R1 1.2483
  • R2 1.2526
  • R3 1.2601

GBP/USD– Trading Tip

Taking a look at the 4-hour timeframe, the GBP/USD is trading at 1.2394 level, violating the support level of 1.2400 level. A bearish breakout of 1.2400 support area is expected to trigger a sell-off until 1.2310. The 50 periods EMA is also keeping the GBP/USD pair under pressure while extending resistance around 1.2430. Thus, the bounce off above this level can lead the GBP/USD pair towards the next resistance level of 1.2657. While bearish breakout of 1.2460 can open up further room for selling until the next support area of 1.2220. 

USD/JPY – Daily Analysis

On Tuesday, the USD/JPY is trading with a selling bias around 107.350, due to intensifying coronavirus fears as increased risk sentiment is driving the demand for the safe-haven currency. The slump in the Japanese exports for March keeps Japanese yen down, which also supports the currency pair to stay at the upside. 

The U.S. dollar extends taking bids mostly due to its safe-haven demand in the wake of intensified coronavirus fears. Considering the fresh report that the United States death toll surged over 40,000, whereas SkyNews mentions the U.K. has a bit over 16,000 people who died from the virus.

Looking forward, the North Korean leader’s health and oil moves will be key to watch, and coronavirus updates could be the driver seat for taking fresh directions. Alongside, the trader will keep their eyes on the U.S. dollar dynamics.

Daily Support and Resistance    

  • S1 105.92
  • S2 106.84
  • S3 107.44

Pivot Point 107.76

  • R1 108.36
  • R2 108.69
  • R3 109.61

USD/JPY – Trading Tips

The USD/JPY is trading slightly bearish at 107.339, having formed a descending triangle pattern on the 4-hour timeframe. The triangle pattern is extending resistance around 107.850 along with resistance around 106.980. As we know, the descending triangle pattern usually breakout on the lower side, and if this happens, the violation of 106.980 level may send the USD/JPY currency pair towards 105.850 level. 

All the best for today! 

Categories
Crypto Market Analysis

Daily Crypto Review, Apr 21 – BTC Under $7,000 as WTI Crude Futures reach negative value

The cryptocurrency market had a slight price decline in the past 24 hours. Most people connect this price drop with the WTI crude Futures market plummeting yesterday. Bitcoin is currently trading for $6,886, which represents a decrease of 3.91% on the day. Meanwhile, Ethereum lost 5.19% on the day, while XRP dropped 4.95%.

Stellar took the position of today’s most prominent daily gainer, with gains of 2.01%. Numeraire lost 11.21% on the day, making it the most prominent daily loser.

Bitcoin’s dominance stayed at the same place when compared to yesterday. Its value is now 63.83%, which represents a 0.25% difference to the upside.

The cryptocurrency market capitalization decreased as most cryptos were in the red. Its current value is $199.39. This value represents a decrease of $9.39 billion when compared to the value it had yesterday.

What happened in the past 24 hours

Bitcoin vs. WTI Crude

The Futures contract for West Texas Intermediate Crude for the month of May dropped more than 100% on Monday. Its worst the price managed to reach negative $37.63. This phenomenon has never happened before.

Bitcoin’s price also corrected on Monday as WTI futures imploded. However, the decline that Bitcoin had was relatively small.

_______________________________________________________________________

Technical analysis

_______________________________________________________________________

Bitcoin

The largest cryptocurrency by market cap did not manage to keep its price above $7,000 on Monday. Therefore, its price fell under and reached the low of $6,750 before springing back. Its price is currently above the $6,850 level, but there are no indications about what the price will do next at the time of writing.


Bitcoin’s volume almost doubled during the downswing, while its current volume is on the lower side of the scale. Its RSI level is bouncing from the 40’s levels.

Key levels to the upside                    Key levels to the downside

1: $7,085                                           1: $6,850

2: $7,420                                           2: $6,640

3: $7,750                                            3: $5,960


Ethereum

Ethereum followed Bitcoin to the downside, and, as it usually goes with all altcoins, dropped more in price than Bitcoin did. The second-largest cryptocurrency by market cap fell from its highs of $190 slowly to $186 over many hours, until an influx of sellers came to the market. Ethereum’s price then fell to $166.5, but acknowledged the $168 support level and stayed above it. Ethereum looks safe above this level (for the time being).


Ethereum’s volume (on average) increased in the past 24 hours, while its RSI level bounced back from the value of 40 to around 47.

Key levels to the upside                    Key levels to the downside

1: $175.5                                             1: $168

2: $178.6                                            2: $158 

3: $185                                                3: $147.5


Ripple

Even though XRP followed the market down, an extremely bullish thing emerged from the price drop. The third-largest cryptocurrency by market cap fell from its most recent highs all the way down to $0.178. However, the price sprang back up and recovered to the price of $0.185. The highest level of the price recovery isn’t the thing we should pay attention to, though, but rather the descending trend which XRP entered during its price drop. With its price going up, XRP managed to escape this trend and then confirm its price above it, which is huge for the XRP bulls.


Key levels to the upside                    Key levels to the downside

1: $0.19                                              1: $0.178

2: $0.2                                                2: $0.165

3: $0.205                                             3: $0.147

Categories
Crypto Market Analysis

Daily Crypto Review, Apr 20 – Blockchain Jobs Booming; Lightning Network Unsafe?

The cryptocurrency market spent the weekend consolidating. Bitcoin is currently trading for $7,166, which represents an increase of 0.38% on the day. Meanwhile, Ethereum gained 2.83% on the day, while XRP gained 0.03%.

MaidSafeCoin took the position of today’s most prominent daily gainer, with gains of 112.34%. Synthetix Network lost 4.92% on the day, making it the most prominent daily loser.

Bitcoin’s dominance dropped almost a whole percent during the weekend. Its value is now 63.58%, which represents a 0.75% difference to the downside.

The cryptocurrency market capitalization increased slightly over the weekend. Its current value is $208.78. This value represents an increase of $5.42 billion when compared to the value it had on Friday.

What happened in the past 24 hours

Blockchain is becoming one of the most demanded business skills for 2020. Blockchain technology is (as the research shows) the most sought-after hard skill in 2020.

While the coronavirus pandemic is continuing to “take” jobs from people, blockchain-related jobs have been on a constant rise.

Honorable mention

Bitcoin

Researchers from the Norwegian University, as well as the University of Luxembourg, have published an interesting research paper that detailed a network attack that tries to deanonymize the transactions broadcast across the Bitcoin’s Lightning Network.

The paper describes this ‘probe attack’ as possible and doable in “under a minute per channel.” On top of that, they said they required moderate capital commitment and no expenditures to perform the attack.

_______________________________________________________________________

Technical analysis

_______________________________________________________________________

Bitcoin

The largest cryptocurrency by market cap spent a slow weekend (from a price perspective). After the price broke the $7,085 level, it established itself above and confirmed $7,085 as its support. The volume over the weekend decreased when compared to the previous week but stayed at the same level throughout the days.

One thing to note is that Bitcoin rarely “stops” its movement like this, and whenever this happens Bitcoin is likely to have a volatile move to either upside or downside.


Key levels to the upside                    Key levels to the downside

1: $7,420                                           1: $7,085

2: $7,750                                           2: $6,850

3: $8,000                                            3: $6,640


Ethereum

Unlike Bitcoin, Ethereum spent the weekend attempting to reach new highs. The second-largest cryptocurrency by market cap managed to break out and surpass $168 resistance level as well as $175.5 and $178.6 resistance levels. The cryptocurrency reached a price of $190, but quickly rebounded and fell in a tight range between $178.6 and $185.


Ethereum’s volume decreased over the weekend (if we exclude the volume increase during the few hours of the price spike), while its RSI level is at 61.

Key levels to the upside                    Key levels to the downside

1: $185                                                1: $178.6

2: $193.6                                            2: $175.5 

3: $198                                                3: $168


Ripple

XRP went through the weekend without much price movement. The third-largest cryptocurrency by market cap retested the previously passed $0.19 support line, which received enough support and confirmed itself as a support level. However, XRP is looking towards the downside again, and it is likely that it will retest this support level once again.


XRP’s volume was descending during the whole weekend, while its RSI reached the value of 52.

Key levels to the upside                    Key levels to the downside

1: $0.2                                                1: $0.19

2: $0.205                                            2: $0.165

3: $0.221                                             3: $0.147

Categories
Forex Market Analysis

Daily F.X. Analysis, April 20 – Top Trade Setups In Forex – Eurozone Events in Focus! 

On the forex front, the U.S. Dollar Index eased 0.2% on the day to 99.72. On the economic data front, the Conference Board U.S. Leading Index dropped 6.7% on month in March (-7.2% expected). Today, the focus will be on the Eurozone’s economic events, which include the Trade balance, PPI, and current account, and these are due during the European session.

Economic Events to Watch Today     


EUR/USD – Daily Analysis

The EUR/USD gained 0.4% to 1.0878 and GBP/USD rebounded 0.3% to 1.2501. The markets are now concerned about extended lockdowns indicating a deeper economic recession than previously forecasted. Moving on, the market sentiment is expected to stay pro-risk during the day ahead. 

European stocks rebounded further, with the Stoxx Europe 600 Index gaining 2.6%. Germany’s DAX climbed 3.2%, the U.K.’s FTSE 100 increased by 2.8%, and France’s CAC jumped 3.4%.

The coronavirus outbreak has brought the deep divides among the member states on fiscal spending. Italy and Spain have blamed northern nations led by Germany and the Netherlands – of not doing enough.

Whereas Italy, Spain, France, and some other countries need debt mutualization through corona bonds, Germany and the Netherlands are still not buying the idea of community debt needed to control the economic fallout from the virus outbreak. 

Looking forward, as the data calendar is light with no first-tier releases scheduled for release in the Eurozone and the U.S. The traders keep their eyes on the coronavirus related updates for meaningful direction.

Daily Support and Resistance

  • S1 1.0698
  • S2 1.0779
  • S3 1.0826

Pivot Point 1.0859

  • R1 1.0907
  • R2 1.094
  • R3 1.1021

EUR/USD– Trading Tips

On Monday, the EUR/USD is trading sideways at 1.0835, exhibiting a bearish crossover below 50 EMA, which is now extending resistance around 1.0903 level. Continuation of a selling trend below 1.0903 level can extend selling until the next support area of 1.0772, but on the way, the pair may find support around 1.0815 level. The EUR/USD is likely to find support around 1.0772, but below this, the next support prevails around 1.0652 level. 

At this moment, the EUR/USD is holding at 1.0835, having an immediate resistance level of around 1.09230, where the bullish breakout of this level can extend buying until the next resistance level of 1.1036. Conversely, we should look for selling trades below 1.0870.

GBP/USD– Daily Analysis

The GBP/USD rebounded 0.3% to 1.2501 and consolidated in the range between the 1.2604 – 1.2450. However, the currency pair traders did not give any major attention to the coronavirus (COVID-19) crisis at home because the cases are comparatively more significant in the U.S. 

Moreover, the United Kingdom and European Union Brexit drama keep moving while the latest news recommending to keep a check of Britain’s £39 billion has also been underlined by the cost of dealing with coronavirus especially the economic £250 billion rescue package announced by Chancellor Rishi Sunak to protect jobs and businesses.

On the other hand, U.S. President Donald Trump showed some willingness for another relief plan while also supporting an economic re-open plan.

Looking forward, all traders will keep their eyes on the coronavirus headlines due to a light economic calendar. However, any surprise announcement of stimulus might grab the spotlight.

Daily Support and Resistance

  • S1 1.2254
  • S2 1.2365
  • S3 1.2433

Pivot Point 1.2475

  • R1 1.2544
  • R2 1.2586
  • R3 1.2697

GBP/USD– Trading Tip

The GBP/USD is trading with a neutral bias over 1.2420 support areas to trade around 1.2446. The GBP/USD pair is likely to find support around 1.2420, which is extended by the triple bottom level that we can see on the 4-hour timeframe. A bearish breakout of 1.2425 support area is expected to trigger a sell-off until 1.2210. The 50 periods EMA is also keeping the GBP/USD pair supported around 1.2430. Thus, the bounce off above this level can lead the GBP/USD pair towards the next resistance level of 1.2657. While bearish breakout of 1.2460 can open up further room for selling until the next support area of 1.2220. 

USD/JPY – Daily Analysis

The USD/JPY is flashing green and registered fresh gains near the 107.94, mainly due to the broad-based U.S. dollar strength in the wake of intensifying coronavirus fears, keeps the market tone heavy on the day. The slump in the Japanese exports for March keeps Japanese yen down, which also supports the currency pair to stay at the upside. The USD/JPY is trading at 107.84 and consolidates in the range between the 107.50 – 107.94.

At the USD front, the U.S. dollar continues to take bids mainly due to its safe-haven demand in the wake of intensified coronavirus fears. As per the latest report that the United States death toll rose above 40,000, whereas SkyNews mentions the U.K. has a bit over 16,000 people who died from the virus.

On the other hand, the reason behind the fresh risk-off market sentiment is the rise in the coronavirus (COVID-19) related death figures from the U.S. and the U.K. Whereas, the lack of clarity on the easing lockdown keeps the investors confused, as the new infections continue to rise globally.

Daily Support and Resistance    

  • S1 105.92
  • S2 106.84
  • S3 107.44

Pivot Point 107.76

  • R1 108.36
  • R2 108.69
  • R3 109.61

USD/JPY – Trading Tips

The technical side of the USD/JPY has not changed much as it’s price continues to hold above the triple bottom area of 107.039. The MACD and 50 periods of EMA are suggesting bearish bias. Therefore, a downward breakout of this level can extend selling until 105.300, while the resistance holds around 108.640. We should look for selling trades below 107 to target 106.630, and buying can be seen above the same 107.360 level today.  

All the best for today! 

Categories
Forex Market Analysis

Daily F.X. Analysis, April 17 – Top Trade Setups In Forex – Risk-on Sentiment In Play! 

On the forex front, the U.S. dollar strengthened against its major peers for a second straight session, with the ICE Dollar Index gaining 0.3% on the day to 99.93. Today, eyes will remain on the European Commission as it will post final readings of March CPI (+1.0% on-year expected). In the U.S., the Conference Board will release its Leading Index for March (-7.1% on month expected).

Economic Events to Watch Today     


EUR/USD – Daily Analysis

The EUR/USD fell 0.4% to a week-low of 1.0862. Official data reported that the Euro zone’s industrial production slipped 0.1% on month in February as expected). The European Commission will post final readings of March CPI (+1.0% on-year expected).

The official data which is scheduled to release at 09:00 GMT is expected to show that Eurozone’s industrial production decreased by 0.2% month-on-month in February. 

European stocks stabilized after a 3% loss in the prior session, with the Stoxx Europe 600 Index rising 0.6%. Germany’s DAX increased by 0.2%, the U.K.’s FTSE 100 climbed 0.6% while France’s CAC was little changed.

Markets are now concerned about extended lockdowns indicating a deeper economic recession than previously forecasted. Moving on, the market sentiment is expected to stay pro-risk during the day ahead. 

As in result, the EUR/USD currency pair could continue to gain altitude. At the data front, the Eurozone Consumer Price Index (CPI) is scheduled for release, while the U.S. data calendar is thin with just Baker Hughes US Oil Rig Count number expected to release at 17:00 GMT. 

Daily Support and Resistance  

  • S1 1.0684
  • S2 1.0772
  • S3 1.0815

Pivot Point 1.086

  • R1 1.0904
  • R2 1.0949
  • R3 1.1037

EUR/USD– Trading Tips

The EUR/USD is trading bearish at 1.0835, exhibiting a bearish crossover below 50 EMA, which is now extending resistance around 1.0903 level. Continuation of a selling trend below 1.0903 level can extend selling until the next support area of 1.0772. 

On Friday, the EUR/USD is likely to find support around 1.0772, but below this, the next support prevails around 1.0652 level. At this moment, the EUR/USD is holding at 1.0835, having an immediate resistance level of around 1.09230, where the bullish breakout of this level can extend buying until the next resistance level of 1.1036. Conversely, we should look for selling trades below 1.0870.

GBP/USD– Daily Analysis

GBP/USD dropped 0.8% to 1.2523 and consolidated in the range between the 1.2604 – 1.2450. However, the currency pair traders did not give any major attention to the coronavirus (COVID-19) crisis at home because the cases are comparatively more significant in the U.S. 

At the U.K. Crisis front, the United Kingdoms’ coronavirus death toll rose above 11,000. Still, the buyers are ignoring this probably because the death toll is comparatively larger in the U.S. almost 20,000 deaths have been registered so far. The GBP/USD is exhibiting selling bias in the wake of a stronger dollar. 

The U.S. official data showed that Initial Jobless Claims declined to 5.245 million for the week ended April 11 (5.500 million expected), and Housing Starts fell to an annualized rate of 1.216 million units in March (1.300 million units expected). Later today, the Conference Board U.S. Leading Index will be reported (-7.2% on month in March expected).

Later today, eyes will be on the U.S., the Conference Board will release its Leading Index for March (-7.1% on month expected) to determine further bias in the pair.

Daily Support and Resistance

  • S1 1.2181
  • S2 1.2353
  • S3 1.244

Pivot Point 1.2525

  • R1 1.2612
  • R2 1.2697
  • R3 1.2869

GBP/USD– Trading Tip

On Friday, GBP/USD is trading with a neutral bias over 1.2450 support areas to trade around 1.2486. The GBP/USD pair is likely to find support around 1.2450, which is extended by the triple top level, which got violated on the previous Friday.

On the 4-hour chart, the GBP/USD has formed a small bullish channel, which is likely to extend bullish bias for the pair. The 50 periods EMA is also keeping the GBP/USD pair supported around 1.2450. Thus, the bounce off above this level can lead the GBP/USD pair towards the next resistance level of 1.2657. While bearish breakout of 1.2460 can open up further room for selling until the next support area of 1.2220. 

USD/JPY – Daily Analysis

The USD/JPY pair is flashing red and struggling towards above 108.00 level, mainly due to the broad-based U.S. dollar weakness in the wake of risk-on market sentiment. In the meantime, the weaker safe-haven Japanese yen keeps the pair supportive and turned out to be one of the key data that placed a lid on any additional losses in the currency pair, at least for now. 

Currently, the USD/JPY pair is trading at 107.81 and consolidates in the range between the 107.64 – 108.08. At the USD front, the U.S. dollar continues to lose its buying momentum across the board, as the U.S. stocks futures and the Asian equities are flashing green mainly after the renewed hopes for coronavirus treatment. 

The greenback that tracks the greenback against a basket of other currencies dropped 0.25% to 99.862. It should be noted that the investors failed to prefer the greenback, which is traditionally viewed as a safe-haven, mainly because of the United States President Donald Trump’s step to reopening the economy, which could continue to add bullish pressure around the equities during the day ahead. 

Daily Support and Resistance    

  • S1 105.92
  • S2 106.84
  • S3 107.44

Pivot Point 107.76

  • R1 108.36
  • R2 108.69
  • R3 109.61

USD/JPY – Trading Tips

The technical side of the USD/JPY has not changed much as it’s price continues to hold above the triple bottom area of 107.039. The MACD and 50 periods of EMA are suggesting bearish bias. Therefore, a downward breakout of this level can extend selling until 105.300, while the resistance holds around 108.640. We should look for selling trades below 107 to target 106.630, and buying can be seen above the same 107.360 level today.  

All the best for today! 

Categories
Crypto Market Analysis

Daily Crypto Review, Apr 17 – Bitcoin above $7,000; The US expanding on the idea of the Digital Dollar

The cryptocurrency market spent the past 24 hours reaching new highs. Bitcoin is currently trading for $7,094, which represents an increase of 6.98% on the day. Meanwhile, Ethereum gained 12.66% on the day, while XRP gained 6.71%.

DigiByte took the position of today’s most prominent daily gainer, with gains of 56.51%. Swipe lost 2.38% on the day, making it the most prominent daily loser.

Bitcoin’s dominance stayed at pretty much the same place when compared to yesterday’s value. Its value is now 64.33%, which represents a 0.09% difference to the upside.

The cryptocurrency market capitalization increased in the past 24 hours. Its current value is $203.36 billion. This value represents an increase of $6.36 billion when compared to the value it had yesterday.

What happened in the past 24 hours

Chicago Mercantile Exchange (CME) has seen a great increase in Bitcoin futures. The increase is as high as 70% from the March lows. This spike is indicating a comeback of institutions to the market.

The number of futures contracts outstanding on CME on Wednesday was $181 million, a 70% increase from $106 million contracts that were recorded on Mar 22.

Honorable mention

Digital Dollar

Congresswomen Rashida Tlaib and Pramila Jayapal introduced a new proposal regarding the federal government issuing $2,000 per month to the US residents. The US would do this by minting a pair of $1 trillion coins, which would be used to back the payments.

Under the ABC Act, the US Congress would authorize the Federal Reserve for the creation of “FedAccounts,” which are nothing else than digital wallets.

_______________________________________________________________________

Technical analysis

_______________________________________________________________________

Bitcoin

After a red day of bears retesting the $6,640 lows, Bitcoin surged above $7,000 and seemingly stabilized there. The largest cryptocurrency by market cap went as low as $6,460 before suddenly spiking and reaching $7,220. BTC is now trading at slightly above $7,000, right above the $7,085 support level. This level was quickly retested and confirmed.


Bitcoin’s volume (surprisingly) did not increase much during the price spike. Its RSI level, however, did. Its current value is 61.

Key levels to the upside                    Key levels to the downside

1: $7,420                                           1: $7,085

2: $7,750                                           2: $6,850

3: $8,000                                            3: $6,640


Ethereum

Ethereum was the best performing crypto asset out of the top3 cryptocurrencies by market cap. Its gains happened during the same time as Bitcoin’s did. After testing the $147.5 lows, the price spiked and reached $175.5, where it stopped. It seems that a new resistance level might be exactly at that level, as this level stopped ETH from going up several times now.


Unlike Bitcoin, Ethereum’s volume increased severalfold during the spike, while its RSI reached a value of 67.5.

Key levels to the upside                    Key levels to the downside

1: $175.5                                             1: $168

2: $178.6                                            2: $158 

3: $185                                                3: $147.5


Ripple

XRP was the most stable crypto asset out of the top3, but also the one with the least gains. The third-largest cryptocurrency by market cap was heading down towards testing the descending trend line, but quickly bounced back and reached above $0.19 as well as the top line of the descending trend. This is a huge move for XRP, even though the gains have been overshadowed by the aforementioned Bitcoin and Ethereum.


XRP’s volume was descending during the price surge, while its RSI reached the value of 58.

Key levels to the upside                    Key levels to the downside

1: $0.2                                                1: $0.19

2: $0.205                                            2: $0.165

3: $0.221                                             3: $0.147

Categories
Forex Market Analysis

Daily F.X. Analysis, April 16 – Top Trade Setups In Forex – U.S. Jobless Claims Under Spotlight! 

On the forex front, the U.S. Dollar Index recouped losses seen in the prior session, rising 0.7% on the day the to 99.57. Later today, the European Commission will report February industrial production (-0.1% on month expected). The German Federal Statistical Office will report final readings of March CPI (+1.4% on-year expected). 

Economic Events to Watch Today     


EUR/USD – Daily Analysis

The EUR/USD dipped 0.7% to 1.0905. Later today, the Euro zone’s industrial production for February will be reported (-0.1% on month expected).

Lately, the European stocks were broadly lower, with the Stoxx Europe 600 Index sinking 3.3%. Germany’s DAX shed 3.9%, France’s CAC dropped 3.8%, and the U.K.’s FTSE 100 was down 3.3%. A sell-off in the stock market seems to weight on the EUR/USD currency pair. 

The official data which is scheduled to release at 09:00 GMT is expected to show that Eurozone’s industrial production decreased by 0.2% month-on-month in February. Markets are now concerned about extended lockdowns indicating a deeper economic recession than previously forecasted. The U.S. Labor Department will release initial jobless claims in the week ended April 11 (5.5 million expected). 

The Commerce Department will report March housing starts (1.3 million units expected) and building permits (1.3 million units expected). The Philadelphia Federal Reserve will post its Business Outlook Index for April (-32.0 expected).

Daily Support and Resistance

  • S1 1.067
  • S2 1.0792
  • S3 1.0851

Pivot Point 1.0915

  • R1 1.0973
  • R2 1.1037
  • R3 1.116

EUR/USD– Trading Tips

The EUR/USD is trading bearish at 1.0885, exhibiting a bearish crossover below 50 EMA, which is now extending resistance around 1.0923 level. Continuation of a selling trend below 1.09230 level can extend selling until the next support area of 1.0772. The EUR/USD is likely to find support around 1.0850, but below this, the next support prevails around 1.0772 level.

At this moment, the EUR/USD is holding at 1.08820, having an immediate resistance level of around 1.09230, where the bullish breakout of this level can extend buying until the next resistance level of 1.1036. Conversely, we should look for selling trades below 1.09230 today.


GBP/USD– Daily Analysis

GBP/USD dropped 0.8% to 1.2523 and consolidated in the range between the 1.2604 – 1.2450. However, the currency pair traders did not give any major attention to the coronavirus (COVID-19) crisis at home because the cases are comparatively more significant in the U.S. 

At the U.K. Crisis front, the United Kingdoms’ coronavirus death toll rose above 11,000, but the buyers are ignoring this probably because the death toll is comparatively larger in the U.S. almost 20,000 deaths have been registered so far.

The Brexit talks, which will be video conferencing between the European Union and the United Kingdom, are expected to happen and will likely entertain the cable traders as both sides have been stuck on the deadlines while the U.K. recently gave warning the bloc to change tactics or face serious ‘problems.

The market’s risk-tone remains heavy with shares in Asia and the U.S. stocks registering losses on the day. At the USD front, the greenback continues to gain support as a safe-haven asset. Although, the deadly virus recession fears are forcing investors to save cash, preferably in the form of the greenback. 

Looking forward, the U.S. Jobless Claims, housing market data, and Philadelphia Fed Manufacturing Survey, as well as the BOE’s first quarter (Q1) Credit Conditions Survey, will be key to watch. Moreover, the traders are keenly awaited for the speech by the BOE policymaker Silvana Tenreyro for taking fresh clues.

Daily Support and Resistance

  • S1 1.2181
  • S2 1.2353
  • S3 1.244

Pivot Point 1.2525

  • R1 1.2612
  • R2 1.2697
  • R3 1.2869

GBP/USD– Trading Tip

The GBP/USD is trading with a bearish bias over 1.2450 support areas to trade around 1.2486. The GBP/USD pair is likely to find support around 1.2450, which is extended by the triple top level, which got violated on April 10. On the 4-hour chart, the GBP/USD has formed a small bullish channel, which is likely to extend bullish bias for the pair. 

The 50 periods EMA is also keeping the GBP/USD pair supported around 1.2450. Thus, the bounce off above this level can lead the GBP/USD pair towards the next resistance level of 1.2657. While bearish breakout of 1.2460 can open up further room for selling until the next support area of 1.2220. 


USD/JPY – Daily Analysis

Today in the early Asian session, the USD/JPY currency pair failed to maintain its early uptick above 108.00 level and has now reversed almost 30 pips from the daily high. Although, the currency pair continues to taking bids as the U.S. dollar is getting strong and catch a safe-haven bid mainly due to on-going fears of global recession from the coronavirus outbreak. Currently, the USD/JPY pair is trading at 107.78 and consolidates in the range between the 107.36 – 108.08. 

At the greenback front, the U.S. dollar continues to gain support from its safe-haven status as continuing worries over the economic fallout from the coronavirus pandemic is keeping the global financial markets on their knees. The continued strong movement of the U.S. dollar lifted the pair to fresh high over the 108.00 level from the sub-107.00 level, while the bullish trend remains intact for the second consecutive session on Thursday.

At the coronavirus front, the U.K.’s death losses have recently decreased by 761 against 778 the previous day. On the other hand, the highest single-day rise by 2,371 to 30,817 in the death toll in the United States keeps the risk-off sentiment in the market.

Daily Support and Resistance    

  • S1 105.75
  • S2 106.52
  • S3 106.84

Pivot Point 107.3

  • R1 107.62
  • R2 108.08
  • R3 108.85

USD/JPY – Trading Tips

The USD/JPY is trading with a bullish bias, and it is pretty much likely to find support around the triple bottom area of 107.039. A downward breakout of this level can extend selling until 105.300, while the resistance holds around 108.640. The MACD and 50 periods of EMA are suggesting bearish bias, while the fundamentals side is also in favor of selling. Since we the U.S. Jobless Claims, which are due during the U.S. session, traders will focus on the news to drive the next movement in the market. Hence, we should look for selling trades below 107 to target 106.630, and buying can be seen above the same 107.360 level today.  

All the best for today! 
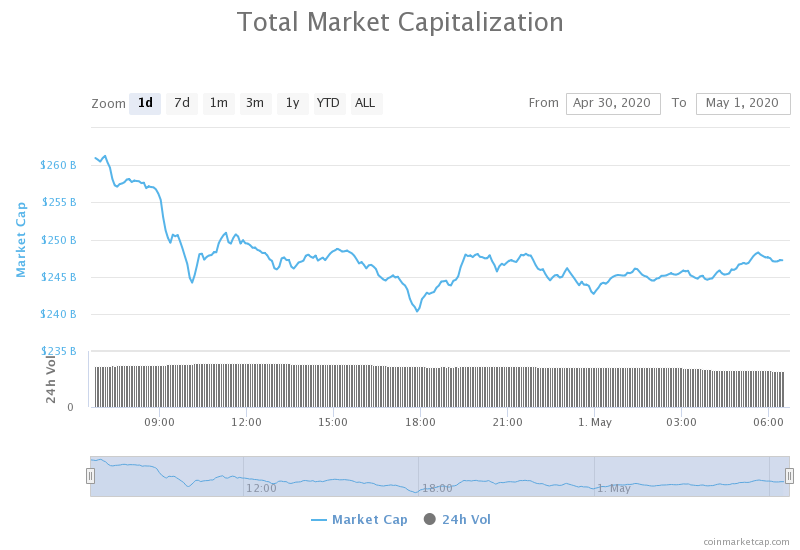
Categories
Crypto Market Analysis

Daily Crypto Review, Apr 16 – China launched Digital Yuan; Cryptos pushing up after retesting lows

The cryptocurrency market spent the past 24 hours mostly consolidating and staying at the same price levels. Bitcoin is currently trading for $6,924, which represents an increase of 0.51% on the day. Meanwhile, Ethereum gained 3.32% on the day, while XRP lost 0.81%.

ABBC Coin took the position of today’s most prominent daily gainer, with gains of 22.93%. Insolar lost 8.47% on the day, making it the most prominent daily loser.

Bitcoin’s dominance decreased when compared to yesterday’s value. Its value is now 63.69%, which represents a 0.55% difference to the downside.

The cryptocurrency market capitalization stayed almost at exactly the same place for the past 24 hours. Its current value is $197.50 billion. This value represents an increase of $0.5 billion when compared to the value it had yesterday.

What happened in the past 24 hours

International agriculture magnates, Agrocorp and Cargill, traded $12 million worth of wheat. The cargo was traveling from North America to Indonesia. The interesting part is that the trade was settled via the blockchain.

The transaction was made possible by the Singapore-based blockchain platform called dltledgers, which is based on Hyperledger Fabric.

Honorable mention

Digital Yuan

Screenshots of the pilot version wallet app of the Chinese digital yuan are currently circling all over on social media.

Ling Zhang, Binance’s executive director of M&A and Global Fiat, shared the images first. The images were then retweeted by Changpeng Zhao, the exchange’s CEO. According to what Zhang said, the app is already available for download in four Chinese cities selected for the trial. Those cities are Shenzhen, Chengdu, Suzhou, and Xiongan.

______________________________________________________________

Technical analysis

_______________________________________________________________________

Bitcoin

Bitcoin bears have dominated in the past 24 hours, dropping the price below $6,850 and retesting the $6,640 lows. The price even fell all the way down to $6,470 at one point, but quickly recovered. The support level of $6,640 held up well and Bitcoin stayed above it. On top of that, it gathered the strength to push back up and retake the $6,850 level.


Bitcoin’s volume is on the same level as yesterday, while its RSI level is at 52.5.

Key levels to the upside Key levels to the downside

1: $7,085 1: $6,850

2: $7,420 2: $6,640

3: $7,750 3: $5,960


Ethereum

Ethereum mirrored Bitcoin’s movements, even though it performed slightly better than Bitcoin. The ETH bears took its price below the $158 support level and then all the way down to the $147.5 level. This support, however, held up well, and Ethereum stabilized and gathered the strength to push back up. The second-largest cryptocurrency pushed above $158 and even reached $168, but failed to pass this resistance level due to the lack of bull pressure.


Ethereum’s volume increased greatly over the past 24 hours, while its RSI level is just above 60.

Key levels to the upside Key levels to the downside

1: $168 1: $158

2: $178.6 2: $147.5

3: $185 3: $139


Ripple

XRP is in a pretty rough spot in the short term at the moment. It is constantly creating lower lows and lower highs. Once again, the third-largest cryptocurrency bumped into $0.19 without being able to cross it. This happened right after the bears gave up on taking the price down as they couldn’t pass the $0.174 level.


XRP’s volume almost doubled in the past 8 hours, while its RSI level is at 52.5.

Key levels to the upside Key levels to the downside

1: $0.19 1: $0.165

2: $0.2 2: $0.147

3: $0.205 3: $0.1

Categories
Forex Market Analysis

Daily F.X. Analysis, April 15 – Top Trade Setups In Forex – Brace for Retail Sales & BOC Policy!  

On the forex front, the U.S. Dollar Index was seldom changed at 99.5 amid thin holiday trading. The economic calendar is muted a bit. The only focus today will be on the U.S. Labor Department, which will release March’s import price index (-3.2% on month expected). 

Later in the day, the U.S. Commerce Department will post March retail sales (-8.0% on month expected) and February business inventories (-0.4% on month expected). The New York Federal Reserve will publish April Empire Manufacturing Index (-35.0 expected). The Federal Reserve will release March industrial production (-4.0% on month expected), capacity utilization (74.0% expected), and its latest Beige Book.

Economic Events to Watch Today     


EUR/USD – Daily Analysis

The EUR/USD climbed 0.7% to 1.0987, French Finance Minister Bruno Le Maire said his government sees 2020 GDP contracting 8%, compared with a decline of 6% previously estimated.

The fresh uptick in the oil prices and above-forecast China trade data also helping restore the risk-sentiment. At the moment, the EUR/USD is trading at 1.0941 and consolidates in the range between the 1.0893 – 1.0967. At the coronavirus front, Australia has shown very sharp declines in the virus cases as compared to other countries and also registered declines in the death toll as per the latest report. 

On the other hand, the macro-environment also supported the EUR/USD, and so do technical charts, especially Tuesday’s marubozu candle, which is indicative of strong bullish sentiment. 

Looking forward, Spain and Italy are ready to release the report of inflation numbers for the month of March and will be essential to watch. Apart from this, the traders will also keep their eyes on U.S. Retail Sales and Industrial Production numbers for March. 


Daily Support and Resistance

  • S1 1.0811
  • S2 1.0887
  • S3 1.0936

Pivot Point 1.0964

  • R1 1.1012
  • R2 1.104
  • R3 1.1116

EUR/USD– Trading Tips

The EUR/USD prices fell after testing 1.09885 resistance level, and the pair now seems to reverse back to the long-held trading range of 1.0922 – 1.0765. The EUR/USD is likely to find support around 1.0922 level. At this moment, the EUR/USD is holding at 1.09320, having an immediate support level of around 1.09060, where the bearish breakout of this level can extend selling until the next support level of 1.0846 and 1.07990. Conversely, the resistance stays at 1.0970 and 1.1035. The MACD is tossing above and below 0, converting the bearish sentiment into bullish and vice versa. Let’s consider staying bullish over 1.0960 today. 

GBP/USD– Daily Analysis

The GBP/USD rose 0.9% to 1.2629. The GBP/USD is currently trading at 1.2508 and consolidates in the range between the 1.2604 – 1.2494. However, the currency pair traders did not give any major attention to the coronavirus (COVID-19) crisis at home because the cases are comparatively more significant in the U.S.

At the U.K. Crisis front, the United Kingdoms’ coronavirus death toll rose above 11,000, but the buyers are ignoring this probably because the death toll is comparatively larger in the U.S. almost 20,000 deaths have been registered so far.

The Brexit talks, which will be video conferencing between the European Union and the United Kingdom, are expected to happen and will likely entertain the cable traders as both sides have been stuck on the deadlines while the U.K. recently gave warning the bloc to change tactics or face serious ‘problems.

On the flip side, the headlines related to the expected British lockdown extension will likely keep the traders busy during the day ahead. Looking forward, the U.S. data, including the Retail Sales, activity numbers, and the Fed’s Beige Book, will be key to watch. The virus updates could keep the driver’s seat.


Daily Support and Resistance

  • S1 1.2352
  • S2 1.2475
  • S3 1.255

Pivot Point 1.2599

  • R1 1.2674
  • R2 1.2723
  • R3 1.2846

GBP/USD– Trading Tip

The GBP/USD is trading with a bearish bias over 1.2500 support areas to trade around 1.2516. The cable is likely to find support around 1.2490, which is extended by the triple top level, which got violated on Monday. As we can see on the 4-hour chart, the GBP/USD sideways channel has already been violated, and now it’s likely to keep the pair bullish outside this range of 1.2479 – 1.2185. 

Ahead of the U.S. retail sales, the U.S. dollar is gaining bullish momentum, driving the bearish trend in the GBP/USD pair. However, the overall bias remains bullish as the prices are holding above 50 periods EMA. Conversely, the MACD is crossing into the bearish zone, opposing the EMA signal. So let’s consider taking buying trades over 1.2472 with a target of 1.2560. 

USD/JPY – Daily Analysis

During Wednesday’s European session, the USD/JPY currency pair has succeded to recover almost 50 pips from the previous session lows and rose to a fresh session high near the 107.35 level in the last hour mainly due to the fresh upticks in the U.S. dollar. The USD/JPY is currently trading at 107.36 and consolidates in the range between the 106.94 – 107.46.

The pair for the second straight session on Wednesday showed some resilience below the 107.00 round-figure marks and attracted some dip-buying near monthly lows set on April 1.

Despite the latest positive news about decreasing the new coronavirus cases and deaths across the world, investors still worried about the economic fallout from the deadly coronavirus. This eventually supported the USD’s status as the global reserve currency and started some fresh selling around the major.

On the other hand, the risk-off market sentiment and declines in the global equity markets keep supporting the Japanese yen’s safe-haven status, which eventually keeps the currency pair limited.

Daily Support and Resistance    

  • S1 105.75
  • S2 106.52
  • S3 106.84

Pivot Point 107.3

    • R1 107.62
    • R2 108.08
    • R3 108.85

USD/JPY – Trading Tips

The USD/JPY is trading with a bearish bias, and it is pretty much likely to find support around the triple bottom area of 107.039. A downward breakout of this level can extend selling until 105.300, while the resistance holds around 108.640. The MACD and 50 periods of EMA are suggesting bearish bias, while the fundamentals side is also in favor of selling. Since we the U.S. retail sales due during the U.S. session, traders will focus on the news to drive the next movement in the market. Hence, we should look for selling trades below 107 to target 106.630, and buying can be seen above the same 107 level today.  

All the best for today! 

Categories
Crypto Market Analysis

Daily Crypto Review, Apr 15 – Libra vs Bitcoin again? Cryptos preparing for a move

The cryptocurrency market spent the past 24 hours in the slight green. Bitcoin is currently trading for $6,873, which represents an increase of 0.56% on the day. Meanwhile, Ethereum gained 1.85% on the day, while XRP gained 1.67%.

Lisk took the position of today’s most prominent daily gainer, with gains of 12.33%. Nervos Network lost 4.24% on the day, making it the most prominent daily loser.

Bitcoin’s dominance decreased slightly when compared to yesterday’s value. Its value is now 64.24%, which represents a 0.37% difference to the upside.

The cryptocurrency market capitalization stayed at exactly the same place for the past 24 hours. Its current value is $197 billion. This value represents an increase of $0.35 billion when compared to the value it had yesterday.

What happened in the past 24 hours

Bitfinex’s Bitcoin holdings have reduced by 66,000 BTC in the past four weeks. The exchange counted 200,140 BTC on Mar 17. However, the data from Apr 13 shows that this amount went down to 134,091.

The massive decrease is not related just to this one exchange. We can also see the data on BitMEX, which had a 38% percent decline in its Bitcoin holdings.

Honorable mention

Libra

Economist and academic John Vaz said he believes Bitcoin still faces competition from Facebook’s Libra project.

He explained that Bitcoin has scaling challenges as far as payments go. On top of that it was used as a speculation vehicle. In contrast, he said, Libra has been with its only purpose to be a scalable payment network.

_______________________________________________________________________

Technical analysis

_______________________________________________________________________

Bitcoin

Bitcoin had a pretty slow day after the upswing which brought its price above $6,850. The largest cryptocurrency by market cap managed to stay above this support level, but did not go far from it. BTC is actually “hugging” this level and testing it every few hours. However, $6,850 is holding well and showing no signs of breaking.


Bitcoin’s volume is quite low, while its RSI level is at 49.

Key levels to the upside                    Key levels to the downside

1: $7,085                                           1: $6,850

2: $7,420                                           2: $6,640

3: $7,750                                            3: $5,960


Ethereum

Ethereum had a slightly better day than Bitcoin and outperformed it in terms of price gain. The second-largest cryptocurrency by market cap managed to push its price above $158 and establish its level above it. ETH’s chart looks almost identical to Bitcoin’s, with the exception that BTC crossed its resistance level earlier, while ETH did that in the past 24 hours. However, they both seem to “hug” the now-support level and keep retesting it.


Ethereum’s volume is descending and on comparatively low levels, while its RSI is at 52.

Key levels to the upside                    Key levels to the downside

1: $168                                                1: $158

2: $178.6                                            2: $147.5 

3: $185                                                3: $139


Ripple

XRP ended up in the green over the past 24 hours even though it found a level it can’t pass. The third-largest cryptocurrency by market cap tried to break the $19 resistance level for a day and a half now, without success. Low volume alongside overall stagnation in the crypto market makes the situation for XRP to break $0.19 almost impossible. However, the current price position can be quite responsive to both sides (up or down) and the next movement will most likely be preceded by Bitcoin’s move.


XRP’s volume is descending when compared to the past week, while its RSI level is currently at 61.

Key levels to the upside                    Key levels to the downside

1: $0.19                                              1: $0.165

2: $0.2                                                2: $0.147

3: $0.205                                             3: $0.1

Categories
Crypto Market Analysis

Daily Crypto Review, Apr 14 – Blockchain Immunity Passport for COVID-19?

The cryptocurrency market recovered from the price drop it experienced during the weekend and made its move towards the upside. Bitcoin is currently trading for $6,888, which represents an increase of 3.02% on the day. Meanwhile, Ethereum gained 3.77% on the day, while XRP gained 2.58%.

MaidSafeCoin took the position of today’s most prominent daily gainer, with gains of 25.25%. Digibyte lost 8.89% on the day, making it the most prominent daily loser.

Bitcoin’s dominance increased slightly when compared to yesterday’s value. Its value is now 64.61%, which represents a 0.44% difference to the upside.

The cryptocurrency market capitalization increased slightly over the past 24 hours. Its current value is $196.65 billion. This value represents an increase of $4.11 billion when compared to the value it had yesterday.

What happened in the past 24 hours

The COVID-19 Credentials Initiative (also known as CCI) is working on a digital certificate that will enable users to show proof that they have recovered from the COVID-19 virus. The certificate will work by using the W3C verifiable credentials standard. The certificate will show whether a person has antibodies for coronavirus or if it got a vaccine.

This form of certificate would act as an immunity passport, which could help stop the spreading of COVID-19 as well as helping individuals return to their lives prior to the pandemics.

Honorable mention

Bitcoin

One of the biggest and most well-known exchanges, Binance, has officially launched Bitcoin options on the Binance futures trading platform.

Binance has hinted that this might be the case earlier in April, but the main announcement came on April 13. The options are currently limited to the mobile app.

_______________________________________________________________________

Technical analysis

_______________________________________________________________________

Bitcoin

Bitcoin started recovering from the fall below some of its key support levels and made an attempt to reach its previous levels. The largest cryptocurrency by market capitalization has been moving up steadily over the past 24 hours, making its way above $6,850 and establishing its price there. Low volume might indicate that a move will end soon unless some form of new money comes to the market.


Bitcoin’s volume was descending in the past 24 hours, while its RSI level went to a value of 50.

Key levels to the upside                    Key levels to the downside

1: $7,085                                           1: $6,850

2: $7,420                                           2: $6,640

3: $7,750                                            3: $5,960


Ethereum

Ethereum established its position above $147.5  and started moving above the key level over the past 24 hours. The second-largest cryptocurrency is currently trading around the price of $158, with volume a bit low to progress further. However, the support level of $147.5 will hold (at least in the short-term) as there is no bear pressure at the moment.


Ethereum’s volume is on low levels, preventing any unstable movement. Its RSI level is currently at 48.

Key levels to the upside                    Key levels to the downside

1: $158                                                1: $147.5

2: $168                                               2: $139 

3: $178.6                                             3: $128


Ripple

XRP increased as well over the past 24 hours but had a pretty rough day. If we take a look at the chart, we can see its price increasing and trying to follow the ascending trend line. However, the uptick was stopped by the $0.19 key resistance level. As the price stopped rising, XRP started making moves towards the downside. There is a possibility that XRP might lose today’s gains very soon.


XRP’s volume decreased when compared to yesterday, while its RSI level is at 44.

Key levels to the upside                    Key levels to the downside

1: $0.19                                              1: $0.165

2: $0.2                                                2: $0.147

3: $0.205                                             3: $0.1

Categories
Forex Market Analysis

Daily F.X. Analysis, April 14 – Top Trade Setups In Forex – Eyes on G7 Meeting via Satellite! 

On the forex front, the U.S. Dollar Index was little changed at 99.49 amid thin holiday trading. The economic calendar is a bit muted, but the only focus today will be on the U.S. Labor Department will release the March import price index (-3.2% on month expected). 

Economic Events to Watch Today     


EUR/USD – Daily Analysis

The EUR/USD found bids and crossed above 1.09 level while representing 0.37% gains, mainly due to the recent broad-based U.S. dollar weakness after risk recovery in the market sentiment in the wake of fresh measured optimism about coronavirus outbreak. 

The fresh uptick in the oil prices and above-forecast China trade data also helping restore the risk-sentiment. At the moment, the EUR/USD is trading at 1.0941 and consolidates in the range between the 1.0893 – 1.0967.

At the coronavirus front, Australia has shown very sharp declines in the virus cases as compared to other countries and also registered declines in the death toll as per the latest report. Meanwhile, India’s flow is starting to drop, as the growth rate of new cases has consecutively declined after April 6. Moreover, the discussion of easing restrictions on activity is taking attention in the U.S. and other parts of the world. 

On the other hand, the above-forecast China trade data, especially imports, which registered a growth of 2.4%, contradicting expectations for a 2.4% decline, and the uptick in the crude oil prices, is helping improve the risk sentiment. 

The EUR currency got supported by multiple factors, the figures of newly infected peoples and death toll showing a sign slowing down across the hotspots in Europe and boosted the sentient around the shared currency. The Eurogroup has reached a half a trillion euros virus rescue package gave further support to the common currency bulls.

Looking forward, the USD moves and virus updates will continue to play an important role. Traders will keep their eyes on the G7 meeting for the fresh trading sentiment.

Daily Support and Resistance

  • S1 1.0772
  • S2 1.0847
  • S3 1.0877
  • Pivot Point 1.0923
  • R1 1.0953
  • R2 1.0998
  • R3 1.1073

EUR/USD– Trading Tips

Last week, the EUR/USD violated the asymmetric triangle pattern, which has lead the EUR/USD prices further higher towards the next resistance level of 1.09299 area. The long-held trading range of 1.0922 – 1.0765 as it’s been already violated, and now the pair is holding above this level. 

At this moment, the EUR/USD is holding at 1.09320, having an immediate support level of around 1.09060, where the bearish breakout of this level can extend selling until the next support level of 1.0846 and 1.07990. Conversely, the resistance stays at 1.0970 and 1.1035. The MACD is tossing above and below 0, converting the bearish sentiment into bullish and vice versa. Let’s consider staying bullish over 1.0960 today. 

GBP/USD– Daily Analysis

Today in the Asian trading hours, the GBP/USD currency pair found bids and hit the monthly high near above 1.2550, mainly due to fresh declines in the broad-based U.S. dollar in the wake of risk-on market sentiment. As well as, the latest statement that the UK PM Boris Johnson has discharged from the hospital and still recovering from coronavirus, this news also helped the pairs quote. The GBP/USD currency pair is currently trading at 1.2568 and consolidates in the range between the 1.2504 – 1.2574. However, the currency pair traders did not give any major attention to the coronavirus (COVID-19) crisis at home because the cases are comparatively larger in the U.S.

At the U.K. Crisis front, the United Kingdoms’ coronavirus death toll rose above 11,000, but the buyers are ignoring this probably because the death toll is comparatively larger in the U.S. almost 20,000 deaths have been registered so far.

On the other hand, the reason behind the pair’s bullish moves could also be the UK PM Boris Johnson’s health recovery as Johnson left the hospital. Though, The Guardian relied on his spokesman to say that He is “focusing on recovery.”

On the negative side, there are many chances to extend the U.K. lockdown for another month. Sir Patrick Vallance, Government Chief Scientific Adviser, said that the deaths toll from coronavirus could continue to rise this week or that could last for up to 3-weeks. It is worth mentioning that Chris Hopson, chief executive of NHS (National Health Services) Providers, indicates the lack of medical supplies.

Daily Support and Resistance    

  • S1 1.2366
  • S2 1.2436
  • S3 1.2474
  • Pivot Point 1.2505
  • R1 1.2544
  • R2 1.2575
  • R3 1.2645

GBP/USD– Trading Tip

The GBP/USD is trading with a bullish bias over 1.2500 to trade around 1.2496 but still holds within a sideways channel. The GBP/USD sideways channel has already been violated as the GBP/USD is holding around 1.2520 and along with resistance around 1.2770. Considering the weakness in the U.S. dollar, the chances of selling remains low, but the bullish bias remains solid over 1.2500 level. 

Since the resistance level of 1.2500 has already been violated, we may see GBP/USD prices going towards the next resistance level of 1.2720. The MACD and 50 EMA are also supporting the bullish bias, so let’s consider taking buying trades over 1.2432 with a target of 1.2500 first and then buying over 1.2500 to target 1.2610. 

USD/JPY – Daily Analysis

 the USD/JPY currency pair failed to continue its winning moves and dropped to 2-weeks low near the 107.53, mainly due to the fresh losses in the broad-based U.S. dollar in the wake of risk-on market sentiment. On the flip side, the risk-on market sentiment also weakened the Japanese yen and helped limit the downside in the currency pair, at least for the time being. 

The USD/JPY is trading at 107.69 and consolidates in the range between the 107.53 – 107.81. The reason behind the global risk-on market sentiment could also be better-than-expected Chinse trade data, which keeps the U.S. dollar U.S.wer and provided the goodish boost to the riskier currencies.

At the data front, the data showed China’s exports improved in March and fell 6-6% YoY as compared to a 17.2% slide in the previous month. Moreover, imports reversed the previous month’s decline and rose 2.4% during the reported month.

While the futures on the S&P 500 are representing a 1.27% gain at press time and the U.S. dollar U.S.ntinues to lose its momentum across the board. The dollar index, which measures the worth of the greenback against majors, is reporting a 0.30% drop. 

Daily Support and Resistance    

  • S1 106.59
  • S2 107.18
  • S3 107.46
  • Pivot Point 107.77
  • R1 108.05
  • R2 108.36
  • R3 108.95

USD/JPY – Trading Tips

The USD/JPY is trading with a bearish bias, and it is pretty much likely to find support around the triple bottom area of 107.039. A bearish breakout of this level can extend selling until 105.300. While the resistance holds around 108.640. The MACD and 50 periods of EMA are suggesting bearish bias, while the fundamentals side is also in favor of selling. Since we don’t have any major fundamental coming out shortly, traders will focus on the technical side and levels. Hence, we should look for selling trades below 108 to target 107.030 today.  

All the best for today! 

Categories
Crypto Market Analysis

Daily Crypto Review, Apr 13 – Bitfinex confirmed: $1.1 billion in Bitcoin for $0.68!

The cryptocurrency market saw most coins drop in price slightly over the weekend. Bitcoin is currently trading for $6,711, which represents a decrease of 1.7% on the day. Meanwhile, Ethereum lost 2.68% on the day, while XRP lost 2.16%.

Komodo took the position of today’s most prominent daily gainer, with gains of 11.13%. Maker lost 7.80% on the day, making it the most prominent daily loser.

Bitcoin’s dominance stayed at almost exactly the same place from where it was on Friday. Its value is now 64.17%, which represents a 0.39% difference to the upside when compared to Friday.

The cryptocurrency market capitalization went down slightly over the weekend. Its current value is $192.51 billion. This value represents a decrease of $11.78 billion when compared to the value it had on Friday.

What happened in the past 24 hours

Blockchain software and tax services company called Lukka is chosen to provide a crypto taxation software to the fifth-largest accounting company in the US, RSM.

Lukka CCO Jeremy Drane, as well as RSM senior manager of international tax and blockchain Jamison Sites, spoke about the partnership and how it could benefit both companies.

Honorable mention

Bitcoin

Someone transferred 161,500 Bitcoin for a fee of only 0.00010019 BTC on April 10. When translated into dollars, this is $0.68 for a $1.1 billion transaction.

Of that amount, 15,000 Bitcoin was sent to a certain wallet, while the remainder of the transaction (146,500 BTC) was returned to the original address.

_______________________________________________________________________

Technical analysis

_______________________________________________________________________

Bitcoin

Bitcoin fell under $7,000 again, after failing to reach above $7,420 many times. With bulls showing such sign of weakness, bears took over and pushed the price down a few times until the $7,000 level was broken. Bitcoin has now fell under the $6,850 support as well, but found its stability at the $6,640 key level. Traders should most definitely look at the volume when trading, as that may be the best indicator of when the move is coming at the moment.


Bitcoin’s volume is rose over the weekend but is pretty low at the moment. Its RSI level is currently at 39.

Key levels to the upside                    Key levels to the downside

1: $6,850                                           1: $6,640

2: $7,085                                           2: $5,960

3: $7,420                                            3: $5,000


Ethereum

Ethereum’s chart looks more or less the same as Bitcoin’s. Once the bulls couldn’t handle the resistance levels, bears took over and brought Ether’s price down. The wall of $158 fell, and ETH had do find another support level, which it did. The $147.5 line responded well to the pressure, and Ethereum is consolidating above it.


Ethereum’s volume increased slightly over the weekend while it is back to normal at the moment. The RSI level is currently at 40.

Key levels to the upside                    Key levels to the downside

1: $158                                                1: $147.5

2: $168                                               2: $139 

3: $178.6                                             3: $128


Ripple

XRP was following the ascending trend line until the drop of April 10. The third-largest cryptocurrency crashed and fell under this line and then retesting it only to fail to break it to the upside. Over the weekend, this like got tested once again as XRP pushed to $0.1965. However, the resistance level held up, and XRP bears responded by bringing the price down to $0.183.


XRP’s volume increased greatly during the most recent drop, while its RSI level is at 39.

Key levels to the upside                    Key levels to the downside

1: $0.19                                              1: $0.165

2: $0.2                                                2: $0.147

3: $0.205                                             3: $0.1

Categories
Forex Market Analysis

Daily F.X. Analysis, April 10 – Top Trade Setups In Forex – U.S. CPI Under the Spotlight! 

The greenback dropped broadly due to the downbeat U.S. Initial Jobless Claims data release, which showed that the weekly new claims exceeded 6 million for the second straight time last week. The fresh fears of economic difficulty, indicated by the Fed Chair Powell, also keeps the USD lower, which leads a 0.06% drop in the U.S. dollar to trade at 99.46, having hit a daily high at 99.63 in early Asia. Today, the major focus of traders will be on the U.S. inflation report as most of the market is off due to good Friday. Let’s take a look at the technical and fundamental’s outlook.

Economic Events to Watch Today     


EUR/USD – Daily Analysis

The single currency EUR gained a slight bullish momentum against the U.S. dollar on reports that the U.S. jobless claims performed worst than expected. A day before, the European Union finance ministers failed to agree on a coronavirus relief package. Meanwhile, the Bank of France sees the first-quarter GDP shrinking 6% from the previous quarter, the most significant decline since World War II, amid nationwide lockdown due to the coronavirus outbreak.

On the other hand, the EUR currency got supported by multiple factors, the figures of newly infected peoples and death toll showing a sign slowing down across the hotspots in Europe and boosted the sentient around the shared currency. In the meantime, the Eurogroup finally reached a half a trillion euros virus rescue package gave further support to the common currency bulls.

Looking forward, the USD moves and virus updates will continue to play an important role. Traders will keep their eyes on the Fed’s Mester’s speech, the U.S. Consumer Price Index (CPI), and the G20 energy ministers meeting for the fresh trading sentiment.

Daily Support and Resistance

  • S1 1.0685
  • S2 1.0796
  • S3 1.0862

Pivot Point 1.0907

  • R1 1.0973
  • R2 1.1018
  • R3 1.1129

EUR/USD– Trading Tips

The EUR/USD has violated the asymmetric triangle pattern, which is leading; it’s price further higher towards the next resistance level of 1.0960. The pair was following 1.0922 – 1.0765 trading, which is now likely to give support to the EUR/USD pair. At this moment, the EUR/USD is holding at 1.0940, having an immediate support level of around 1.09110, where the bearish breakout of this level can extend selling until the next support level of 1.0846 and 1.07990.

The MACD has crossed over 0, converting the bearish sentiment into bullish. At the same time, the 50 periods exponential moving average is also keeping the EUR/USD in a bullish mode, extending an immediate resistance around 1.08996. So, let’s consider taking buying trades above 1.0907 to target 1.0970 today. 


GBP/USD– Daily Analysis

The GBP/USD rebounded for a second straight session, gaining 0.4% to 1.2392. U.K. government spokesman James Slack said Prime Minister Boris Johnson is in a stable condition and responding to coronavirus treatment in hospital. 

The reason behind the GBP strength could also be the fresh pessimism surrounding Brexit date because the new Labour Party shadow Chancellor Anneliese Dodds asked ministers to beware putting “ideology over the national interest. Whereas, the U.K. Express conveyed the headlines indicating the Transition period delay could cost U.K. taxpayer £26 billion a year.

On the other hand, the U.S. Federal Reserve (Fed) Chair Jerome Powell expecting downbeat economics during the 2nd-quarter (Q2) of 2020 before expecting the recovery in the second half of the year.

As in result, Japan’s TOPIX recently rose to 1,424, up 0.56%, while stocks in China remain mixed by the reporting time. Looking ahead, traders will keep their focus on the coronavirus updates for intermediate direction. However, the expectedly downbeat U.S. inflation figures for March will likely keep the pair strong.

Daily Support and Resistance    

  • S1 1.2187
  • S2 1.231
  • S3 1.2381

Pivot Point 1.2432

  • R1 1.2504
  • R2 1.2555
  • R3 1.2678

GBP/USD– Trading Tip

The GBP/USD soars to trade around 1.2496 but still holds within a sideways channel. The GBP/USD sideways channel is supporting the GBP/USD pair around 1.220 and along with resistance around 1.2490.

Considering the weakness in the U.S. dollar, the chances of selling remains low, but the bullish bias remains solid over 1.2500 level. Violation of this can lead the GBP/USD prices until 1.2720. The MACD and 50 EMA are also supporting the bullish bias, so let’s consider taking buying trades over 1.2432 with a target of 1.2500 first and then buying over 1.2500 to target 1.2610. 


USD/JPY – Daily Analysis

Today in the early Asian session, the USD/JPY currency pair dropped to 108.33, mainly due to the risk-off market sentiment in the wake of intensified concerns about coronavirus (COVID-19). The fresh declines in the U.S. dollar, which are based on downbeat data and depressed signals from the Fed Chair, keeps the pair lower.

The USD/JPY is currently trading at 108.39 and consolidates in the range between the 108.33 – 108.61. At the USD front, the greenback dropped broadly due to the downbeat U.S. Initial Jobless Claims data release, which showed that the weekly new claims exceeded 6 million for the second straight time last week.

The fresh fears of economic difficulty, indicated by the Fed Chair Powell, also keeps the USD lower; as in result, the U.S. dollar index drops 0.06% to 99.46, having hit a daily high at 99.63 in early Asia.

At the coronavirus front, as per the latest report, the 427,460 cases of coronavirus registered an increase of 32,449 cases from its previous count and said the number of deaths also rose 1,942 to 14,696. It should also be noted that the Centers for Disease Control and Prevention (CDC) earlier announced ‘no sail’ order to all cruise ships. As in result, the U.S. continues marked as the world’s second-worst affected nation due to the virus after Italy.

Daily Support and Resistance    

  • S1 107.84
  • S2 108.34
  • S3 108.59

Pivot Point 108.85

  • R1 109.09
  • R2 109.35
  • R3 109.86

USD/JPY – Trading Tips

The USD/JPY’s symmetric triangle pattern has already been violated, which was supporting the pair around 108.570. Closing of candles below this level is suggesting bearish bias among traders, which can lead the USD/JPY, the safe-haven currency pair, towards the next support level of 107.850. The 50 EMA is also suggesting a bearish bias for the USD/JPY pair. 

On the higher side, the support level 108.500, which got violated earlier, is going to work as resistance now, and it may offer us selling traders in the USD/JPY today.  The USD/JPY may exhibit buying until 108.580, and violation of this can open more room for buying until 108.8500. On the lower side, support continues to hold around 107.850. Let’s look for selling traders below 108.550 today.  

All the best for today! 
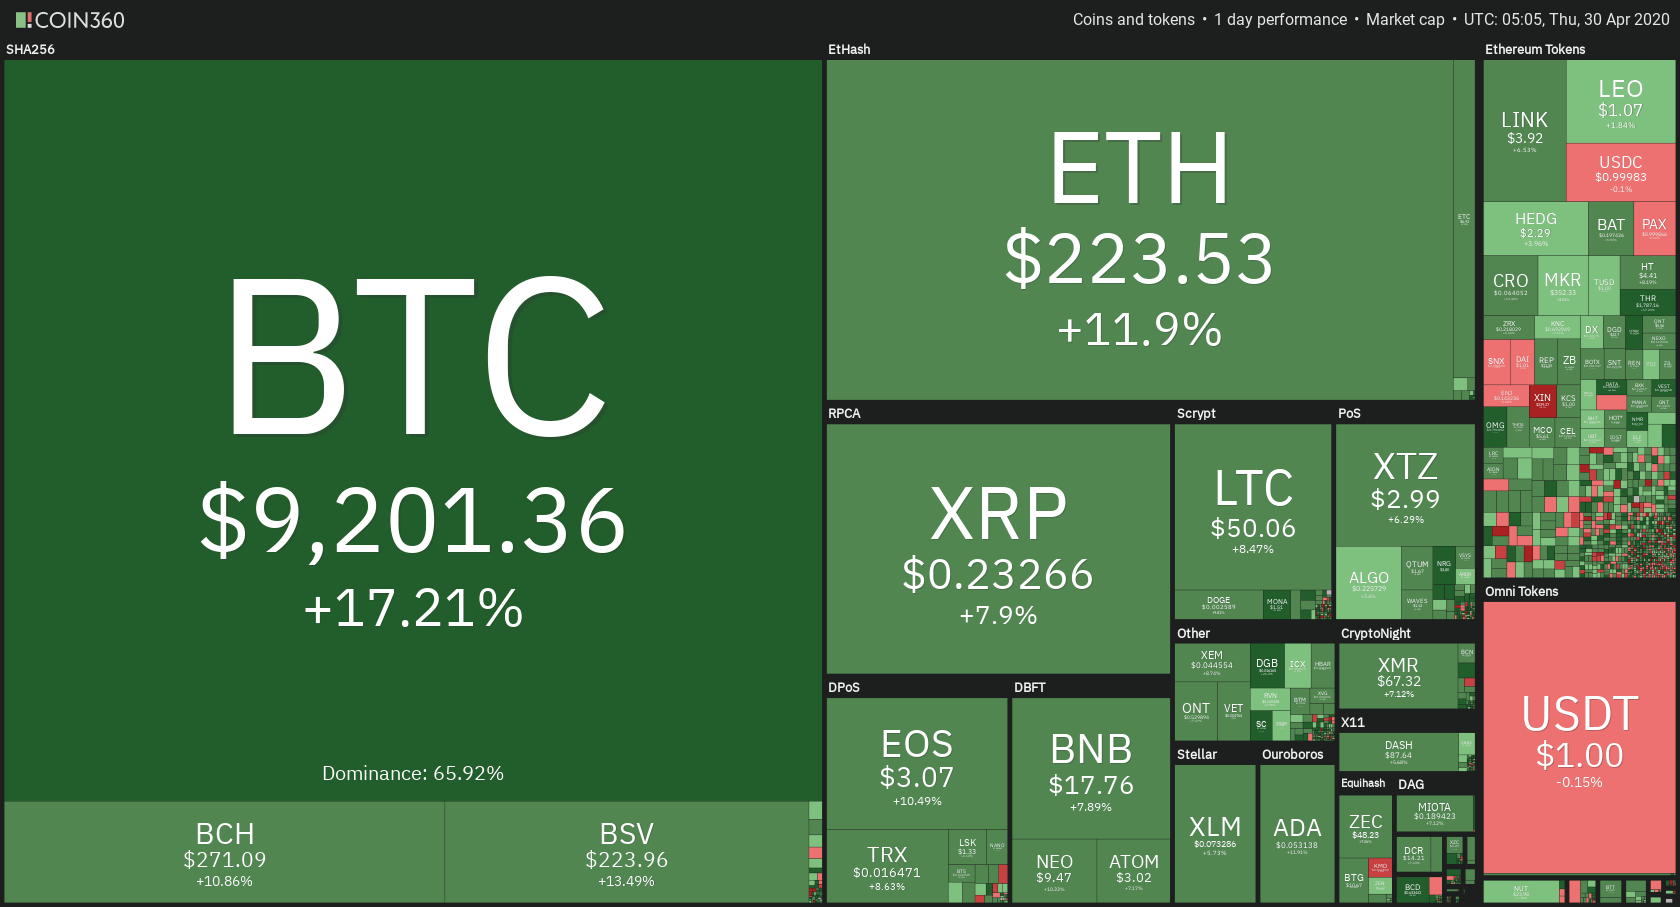
Categories
Crypto Market Analysis

Daily Crypto Review, Apr 10 – Canada launching a BTC fund; Cryptos retesting support levels

The cryptocurrency market had a slightly red day as it consolidated and tested slightly lower prices overall. Bitcoin is currently trading for $7,133, which represents a decrease of 2.08% on the day. Meanwhile, Ethereum lost 3.84% on the day, while XRP lost 2.11%.

Dash took the position of today’s most prominent daily gainer, with gains of 7.03%. Seele lost 11.05% on the day, making it the most prominent daily loser.

Bitcoin’s dominance increased a tiny bit. Its value is now 64.56%, which represents a 0.31% difference to the upside when compared to yesterday.

The cryptocurrency market capitalization went down slightly in the past 24 hours. Its current value is $204.27 billion. This value represents a decrease of $4.22 billion when compared to the value it had yesterday.

What happened in the past 24 hours

Canadian asset manager 3iQ announced that they would finally launch a fund tied to Bitcoin on the Toronto Stock Exchange. This news came after three years of legal issues.

‘The Bitcoin Fund’ started trading yesterday. It listed almost 1.5 million Class A ‘QBTC.U’ shares the exchange on April 9. The fund’s company shares are currently trading for somewhere around $11 each.

Honorable mention

Ethereum

Investors seem to be liking Ethereum, as some of them are ready to pay five times more than its price. Grayscale Ethereum Trusts offers Ether at a 515% premium, and people still like it.

It costs $90.55 to buy one share in the Grayscale Investments’ Ethereum Trust. However, this share currently only holds $16.10 worth of Ether.

_______________________________________________________________________

Technical analysis

_______________________________________________________________________

Bitcoin

Bitcoin has spent the day consolidating and dropping in price slightly. However, things do not look well as Bitcoin is taking a retest of the lows with slightly increased volume. While it is currently trying to breach $7,000 and trade under it, nothing is settled yet.


Bitcoin’s volume is slowly increasing, while its RSI is currently at the value of 40.

Key levels to the upside                    Key levels to the downside

1: $7,420                                           1: $7,085

2: $7,750                                           2: $6,850

3: $8,000                                            3: $6,640


Ethereum

Ethereum spent the past 24 hours trying to establish a price above the $168 support level. However, the latest push down broke the level, and ETH went below $168. It looks like the second-largest crypto will retest at least the $158 level, if not more.


Ethereum’s volume skyrocketed during the price drop, while its RSI level is at 46.

Key levels to the upside                    Key levels to the downside

1: $168                                                1: $158

2: $178.6                                            2: $147.5 

3: $185                                                3: $139


Ripple

XRP spent the past couple of days fighting to stay above $0.2. However, the tight range between $0.2 and $0.205 was not enough for XRP, so the price had to move somewhere. A slight increase in bearish presence brought the price down to rested the $0.19 levels and solidified XRP’s position below $0.2. The level seems to be holding up nicely so far, which means that $0.19 will not fall unless the volume increases dramatically.


XRP’s RSI level has been dropping for the past couple of days, now being at 45.

Key levels to the upside                    Key levels to the downside

1: $0.2                                                1: $0.19

2: $0.205                                            2: $0.165

3: $0.227                                             3: $0.147

Categories
Forex Market Analysis

Daily F.X. Analysis, April 09 – Top Trade Setups In Forex – Brace for High Impact Events! 

On the forex front, the U.S. dollar stabilized against its major peers on Wednesday, as the ICE Dollar Index gained 0.2% on the day to 100.16. Eyes will remain on the German Federal Statistical Office, which is due to report February trade balance (16.5 billion euros surplus expected) and current account balance (17.0 billion euros surplus expected).

The U.K. Office for National Statistics will post February monthly GDP (+0.1% on month expected), industrial production (+0.1% on month expected), manufacturing production (+0.1% on month expected) and trade balance (1 billion pounds surplus expected).

Economic Events to Watch Today     


 EUR/USD – Daily Analysis

The EUR weakened against the U.S. dollar on reports that European Union finance ministers failed to agree on a coronavirus relief package. EUR/USD slid 0.3% to 1.0862.

German leading institutes expect the country’s GDP to slump 9.8% in the second quarter compared with the prior quarter and drop 4.2% for the whole year, citing the coronavirus pandemic. Meanwhile, the Bank of France sees the first-quarter GDP shrinking 6% from the previous quarter, the largest decline since World War II, amid nationwide lockdown due to the coronavirus outbreak.

Moving on, the shared currency may face deeper losses if a discussion about the stimulus package again fails to happen on the day or end on a sour note. It’s worth noting that the ECB is already running a negative interest rate policy and a massive asset purchase program. As a result, markets are increasingly expecting governments to do their bit by providing fiscal stimulus. 

Looking forward, the ECB minutes, which are scheduled to happen at 11:30 GMT, are expected to repeat downside risks to the economy and willingness to do more if required. On the data front, Germany is set to report trade figures for the month of February at 07:00 GMT. 

Daily Support and Resistance

  • S1 1.0742
  • S2 1.08
  • S3 1.0829

Pivot Point 1.0858

  • R1 1.0887
  • R2 1.0917
  • R3 1.0975

EUR/USD– Trading Tips

The EUR/USD continues trading within a symmetric triangle pattern, which is keeping the pair within 1.0922 – 1.0765 trading zone. At this moment, the EUR/USD is holding at 1.0866, having an immediate support level of around 1.0835, where the bearish breakout of this level can extend selling until the next support level of 1.07990 and 1.0765.

The MACD has still tossing above and below 0, converting the bearish sentiment into bullish. At the same time, the 50 periods exponential moving average is also keeping the EUR/USD in a neutral mode, extending an immediate resistance around 1.08856. So, let’s consider taking selling trades below 1.0835 to target 1.0775 and bullish above the same to target 1.0910 and 1.0970 today.

GBP/USD– Daily Analysis

The GBP/USD rebounded for a second straight session, gaining 0.4% to 1.2392. U.K. government spokesman James Slack said Prime Minister Boris Johnson is in a stable condition and responding to coronavirus treatment in hospital. 

Later today, U.K. monthly GDP data and manufacturing production for February will be released (both +0.1% on month expected). Whereas, the market risk sentiment getting heavy due to the rise in the U.S. cases, marked as a second highly infected nation, after Italy, in the world. 

As in result, early Asia risk-on sentiment, mainly due to U.S. President Donald Trump’s push for restarting the economy, failed to extend while the U.S. 10-year treasury yields dropped 2-basis points to 0.746% with stocks in Asia flashing mixed results.  

Looking ahead, the traders may not give any major attention to the U.K.’s data-dump comprising Manufacturing Production, Industrial Production, and monthly GDP due to being before the virus outbreak period. 

However, the weekly release of U.S. Jobless Claims and speech from the Federal Reserve Chairman Jerome Powell will be essential to watch. Apart from this, virus updates will not lose its importance and will be essential to watch for new directions.

Daily Support and Resistance

  • S1 1.2104
  • S2 1.2236
  • S3 1.2315

Pivot Point 1.2368

  • R1 1.2447
  • R2 1.25
  • R3 1.2632

GBP/USD– Trading Tip

On Thursday, the GBP/USD soars to trade around 1.2398 within a sideways channel. The channel is supporting the Cable at 1.220 and along with resistance around 1.2490. The release of GDP figures from the U.K. can help drive a breakout in the market. In the case market breaks bellow 1.2278, we may see GBP/USD prices heading into the selling zone until 1.2100 and 1.2005. 

Whereas, the chances of buying remains solid over 1.2275 until 1.2520. The MACD and 50 EMA are also supporting the neutral bias, so let’s consider taking buying trades over 1.2368 with a target of 1.2470 and sell trades below 1.2368  

USD/JPY – Daily Analysis

During Thursday’s Asian session, the USD/JPY currency pair flashing green and continued its previous session recovery rally toward above the 109.00 level. The currency pair rose from 108.60 to 109.06, mainly due to the recent risk reset market sentiment. 

Currently, the USD/JPY is currently trading at 108.94 and consolidates in the range between the 108.80 – 109.06. However, the Japanese yen earlier weakened caused by risk-on market sentiment in the wake of expectation of further stimulus and an easy run for the favorite candidate for the U.S. President’s post.

During the Newyork trading session, the attention was on the Federal Reserve Open Market Committee’s minutes of the unscheduled meeting on March 15. The minutes indicated anxiety about the virus and the extremely large degree of uncertainty. There was a muted reaction to the minutes because they didn’t show anything that hasn’t already been priced in by market traders. They just decided to cut the benchmark rate to nearly zero and restart bond-buying programs.

Moreover, Japan’s Prime Minister Abe has announced a state of emergency in Tokyo and 6-other provinces. He plans to control the economic fallout of COVID-19 as well as a substantial fiscal stimulus package. The package, worth ¥16.5trn, equates to 20% of GDP. Consequently, the USD/JPY currency pair is moving nowhere as investors seem confused about whether to buy USD/JPY over a stronger dollar or sell over the increased safe-haven appeal. 

As per the latest comments from the U.S. and Japanese policymakers also indicated that more stimulus to control the coronavirus (COVID-19) is on their way. On the flip side, Bernie Sanders turned from the U.S. Presidential Candidate’s race, giving an edge to the market favorite Joe Biden and helping to improve the trading sentiment.

Daily Support and Resistance    

  • S1 107.84
  • S2 108.34
  • S3 108.59

Pivot Point 108.85

  • R1 109.09
  • R2 109.35
  • R3 109.86

USD/JPY – Trading Tips

On Thursday, the USD/JPY’s symmetric triangle pattern continues to play due to a lack of high impact economic events. Choppy sessions continue to trade around 108.884, and it’s strictly following a narrow trading range of 108.650 – 107.250. The technical side of USD/JPY is mostly the same as the USD/JPY’s pair continues to find support around 108.700. On the 4 hour timeframe, the Japanese pair has closed a bullish engulfing candle over 50 EMA, which is suggesting odds of more buying in the USD/JPY currency pair. The USD/JPY may exhibit further room for buying until 109.680, and violation of this can open more room for buying until 110.500 and 111.450. On the lower side, support continues to hold around 108.750. Let’s look for buying traders over 108.850 today.  

All the best for today! 
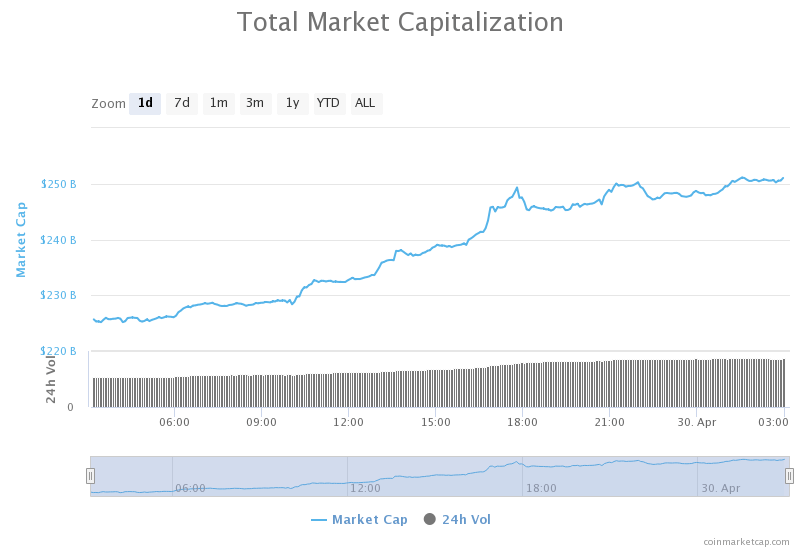
Categories
Crypto Market Analysis

Daily Crypto Review, Apr 9 – BCH surges after halving, BSV outperforming

The cryptocurrency market had a slow day, losing a bit of its value while it consolidated. Bitcoin is currently trading for $7,289, which represents a decrease of 0.77% on the day. Meanwhile, Ethereum lost 1.35% on the day, while XRP lost 0.76%.

Seele took the position of today’s most prominent daily gainer, with gains of 20.9%. CyberVein lost 12.12% on the day, making it the most prominent daily loser.

Bitcoin’s stayed at the same place dominance-wise. Its value is now 64.25%, which represents a 0.01% difference to the upside when compared to yesterday.

The cryptocurrency market capitalization did not change much in the past 24 hours. Its current value is $208.49 billion. This value represents a decrease of $0.85 billion when compared to the value it had yesterday.

What happened in the past 24 hours

The Cardano Foundation made an announcement that they will be partnering with the South African National Blockchain Alliance. This partnership aims to explore further ways to strengthen (mostly blockchain) technology’s adoption all throughout South Africa.

According to the official announcement, Cardano will be using blockchain technology to boost socio-economic growth throughout South Africa.

Honorable mention

BCH/BSV

Bitcoin Cash completed its first block reward halving on Wednesday, Apr 9. The halving created a price surge, with the coin gaining 11.2% on the day.

Bitcoin SV made a bit of a stronger move, with its block halving on schedule for Friday, Apr 10. However, the cryptocurrency gained 19.4% in the same time period as Bitcoin Cash and outperformed it despite not completing the block reward halving yet.

_______________________________________________________________________

Technical analysis

_______________________________________________________________________

Bitcoin

Bitcoin has spent the day consolidating. The volume was low and the price action was almost non-existent. The largest cryptocurrency by market cap is showing that it will take a lot of work to get past $7,420, as it endured every attempt of breaking it so far (and there were many). This is a perfect time for traders to use their ranging market strategies.


Bitcoin’s volume is significantly lower than yesterday, while its RSI dropped to 60

Key levels to the upside                    Key levels to the downside

1: $7,420                                           1: $7,085

2: $7,750                                           2: $6,850

3: $8,000                                            3: $6,640


Ethereum

Ethereum spent the past 24 hours retesting the $168 support level that it went above during the most recent price surge. The support level held up well, and ETH is currently secure above it. As the retesting is still in play, we can’t rule out the option of price falling below the $168 level and retesting $158. However, there probably won’t be any chance of the price going down further due to the lack of volume.


Ethereum’s volume gradually reduced to extremely low levels, while its RSI went back down to 64.

Key levels to the upside                    Key levels to the downside

1: $178.6                                             1: $168

2: $185                                              2: $158 

3: $193.6                                            3: $147.5


Ripple

XRP fought to stay between a tight range of $0.2 and $0.205. However, while the $0.2 level did get recognized, it did not pose a big threat to the price. After a while, bulls and bears moved almost freely throughout the 0.2 zone. The price is currently just below $0.2. There are no indications of the direction of the movement yet. Still, with the volume at this low level, the chance of going above $0.205 or below $0.19 is almost non-existent.


XRP’s RSI level dropped from the oversold territory and is currently at 61.

Key levels to the upside                    Key levels to the downside

1: $0.2                                                1: $0.19

2: $0.205                                            2: $0.165

3: $0.227                                             3: $0.147

Categories
Forex Market Analysis

Daily F.X. Analysis, April 08 – Top Trade Setups In Forex – Choppy Sessions Continued! 

Daily F.X. Analysis, April 08 – Top Trade Setups In Forex – Choppy Sessions Continued! 

On the forex front, the U.S. dollar weakened against its major peers, with the ICE Dollar Index dropping 0.8% on the day to 99.91. Later in the day, the U.S. Federal Reserve will release its latest monetary meeting minutes. Whereas, the Bank of France will report Industry Sentiment Indicator for March (90 expected).

Economic Events to Watch Today     


EUR/USD – Daily Analysis

The EUR/USD rebounded 0.9% to 1.0895, snapping a six-day decline. Official data showed that German industrial production grew 0.3% on month in February (-0.8% expected). Previously, an uptick in German’s industrial production for February may not provide support to the EUR/USD because the futures tied to the S&P 500 futures are starting to reporting a 0.60% drop and will likely draw bids for the greenback during the day ahead. 

The European stocks remained on the upside, with the Stoxx Europe 600 Index gaining 1.9%. Germany’s DAX jumped 2.8%, France’s CAC rose 2.1%, and the U.K.’s FTSE 100 was up 2.2%, which is extending slight support to the single currency Euro.

Today, the European data docket is light, so apart from this, Federal Reserve’s March meeting minutes will be key to watch, which are scheduled to release at 18:00 GMT. While on the technical side, the immediate bias would remain bearish in the pair until the hourly chart descending trendline drawn from overnight highs is intact. 

Daily Support and Resistance

  • S1 1.0647
  • S2 1.0762
  • S3 1.0827

Pivot Point 1.0876

  • R1 1.0941
  • R2 1.0991
  • R3 1.1106

EUR/USD– Trading Tips

Looking at the 4-hour timeframe, the EUR/USD is trading within a symmetric triangle pattern, which is keeping the pair within 1.0922 – 1.0765 trading zone. Right now, the pair is trading at 1.0858, having an immediate support level of around 1.07990 and 1.0765. The EUR/USD violated the support level of 1.085, which is now working as a resistance. A bearish breakout of 1.07990 level may extend selling bias until the next support level of 1.0650 while the MACD has crossed over 0, converting the bearish sentiment into bullish. 

We can’t fully really on the MACD right now as the lack of trends in the market is causing its value to toss above and below 0, signaling a neutral bias. But the 50 periods exponential moving average is also keeping the EUR/USD in a bearish mode, extending an immediate resistance around 1.08856. So, let’s consider taking selling trades below 1.091 to target 1.0775 and bullish above the same to target 1.0946 today.

GBP/USD– Daily Analysis

The GBP/USD bounced 0.9% to 1.2340. The pair doesn’t seem to show much interest as the death toll from the coronavirus increased by 621 to 4,934. The total number of confirmed infections rose to 47,806. Apart from the coronavirus intensifying concerns, the GBP currency could remain bearish in the European trading hours, mainly due to the sluggish data. As in result, the U.S. 10-year Treasury yields remain flashing green around 0.68% with major Asian stocks marking gains.

At the Brexit front, the European Union and many others are forcing the Tory administration for the delay in the Brexit deadline while Cabinet Office Minister Michael Gove showing a willingness to leave talks unless there was a broad outline of a deal.

At the USD front, the U.S. Dollar taking bids on the day, as the S&P 500 futures slumped by 0.5%, indicating the risk-off sentiment in the global market after New York reported 731 deaths from coronavirus on Monday- the biggest daily rise. On the other hand, Spain’s daily losses of coronavirus deaths also increased for the 1st-time in 5-days.

Looking forward, investors will keep their eyes on every incoming detail about the virus for fresh direction. Moreover, Brexit headlines will also key to watch as the EU-UK policymakers are finalizing the timetable for further Brexit talks in April and May.

Daily Support and Resistance

  • S1 1.2075
  • S2 1.2201
  • S3 1.2269

Pivot Point 1.2327

  • R1 1.2395
  • R2 1.2453
  • R3 1.2578

GBP/USD– Trading Tip

On Wednesday, the GBP/USD continues trading around 1.2298 within a symmetric triangle pattern, which is supporting Sterling at 1.220 and along with resistance around 1.2490. On the 4-hour timeframe, the GBP/USD pair may find resistance around 1.2470, along with support around 1.2278. In the case of market breaks bellow 1.2278, we may see GBP/USD prices heading into the selling zone until 1.2100 and 1.2005. Whereas, the chances of buying remains solid over 1.2275 until 1.2520. The MACD and 50 EMA are also supporting the neutral bias, so let’s consider taking buying trades over 1.2209 with a target of 1.2400 and sell trades below 1.2335. 

USD/JPY – Daily Analysis

During Wednesday’s early Asian session, the USD/JPY currency pair flashing green and struggles to cross above the 109.00 level mainly due to the latest recovery in the U.S. Dollar in the wake of the risk-off market sentiment. Whereas, the fresh bid in the safe-haven Japanse yen is one of the key factors behind the limit to the pair’s gains. 

Right now, the USD/JPY pair is trading at 108.81 and consolidates in the range between the 108.50 – 109.00. Yesterday’s risk-on sentiment extended to Europe due to the optimism that the pace of new COVID-19 cases may be slowing, but the U.S. markets were failed to hold. Despite this, the U.S. Secretary of Housing said there are signs that COVID-19 cases in the U.S. could level out sooner than predicted.

At the USD front, the U.S. Dollar taking bids on the day, as the S&P 500 futures slumped by 0.5%, indicating the risk-off sentiment in the global market after New York reported 731 deaths from coronavirus on Monday- the most prominent daily rise. On the other hand, Spain’s daily losses of coronavirus deaths also increased for the 1st-time in 5-days.

At the U.K. front, the Foreign Secretary looking confident about the UK PM Boris Johnson’s health and said that he would recover from pandemic while describing him as a “fighter.” Moreover, Japan’s Prime Minister Abe has announced a state of emergency in Tokyo and 6-other provinces. He plans to control the economic fallout of COVID-19 as well as a substantial fiscal stimulus package. The package, worth ¥16.5trn, equates to 20% of GDP. Consequently, the USD/JPY currency pair is moving nowhere as investors seem confused about whether to buy USD/JPY over a stronger dollar or sell over the increased safe-haven appeal. 

Daily Support and Resistance

  • S1 105.37
  • S2 106.64
  • S3 107.08

Pivot Point 107.91

  • R1 108.35
  • R2 109.17
  • R3 110.44

USD/JPY – Trading Tips

As we can see on the 4-hour timeframe, the USD/JPY’s symmetric triangle pattern still remains intact, perhaps due to a lack of high impact economic events in the market. The USD/JPY is trading choppy above and below 108.884, and it’s strictly following a narrow trading range of 108.650 – 107.250. With that being said, the USD/JPY’s immediate support is likely to be found around 108.700. On the 4 hour timeframe, the Japanese pair has closed a bullish engulfing candle over 50 EMA, which is suggesting odds of more buying in the USD/JPY currency pair. 

The USD/JPY may exhibit further room for buying until 109.680, and violation of this can open more room for buying until 110.500 and 111.450. On the lower side, support continues to hold around 108.750. Let’s look for buying traders over 108.850 today.  

All the best for today! 

Categories
Crypto Market Analysis

Daily Crypto Review, Apr 8 – BCH and BSV halving countdown; Cryptos consolidating after a move up

The cryptocurrency market established its position after the gains it made yesterday. Bitcoin is currently trading for $7,338, which represents an increase of 0.76% on the day. Meanwhile, Ethereum gained 0.42% on the day, while XRP gained 1.33%.

CyberVein took the position of today’s most prominent daily gainer, with gains of 47.18%. Bytecoin lost 8.52% on the day, making it the most prominent daily loser.

Bitcoin’s stayed at the same place dominance-wise. Its value is now 64.25%, which represents a 0.1% difference to the downside when compared to yesterday.

The cryptocurrency market capitalization increased over the past 24 hours. Its current value is $209.34 billion. This value represents an increase of $4.65 billion when compared to the value it had yesterday.

What happened in the past 24 hours

Twitter CEO, as well as the founder of Square Jack Dorsey, has started a fund, which will help with fighting COVID-19. The fund is called Start Small LLC. Dorsey is seeding the fund with $1 billion, which is roughly 28% of his wealth.

Honorable mention

BCH/BSV

Bitcoin Cash will complete its block reward halving in the next 9 hours, with Bitcoin Satoshi’s Vision following shortly after.

By performing a block reward halving, Bitcoin Cash will cut its block reward from 12.5BCH down to 6.25BCH.

_______________________________________________________________________

Technical analysis

_______________________________________________________________________

Bitcoin

Bitcoin has spent the day consolidating and testing the upside and downside relative to the level it is in right now. The largest cryptocurrency tried to break the $7,420 resistance level many times, but with no success. It also tested the $7,085 level once again, but the bulls quickly reacted to the price going down and jumped in to help stabilize the market.


Bitcoin’s volume is slightly lower than yesterday, while its RSI dropped out of the overbought territory and is now at the value of 64.

Key levels to the upside                    Key levels to the downside

1: $7,420                                           1: $7,085

2: $7,750                                           2: $6,850

3: $8,000                                            3: $6,640


Ethereum

Ethereum spent the past 24 hours fighting to stay above the $168 level. After a sharp increase in price, ETH dropped down from $176 to $162. However, the ETH bulls jumped in and brought the price above the $168 resistance level, making it support.


Though Ethereum’s volume reduced by quite a bit, it is still elevated compared to the previous week. Its RSI level is currently at 69.

Key levels to the upside                    Key levels to the downside

1: $178.6                                             1: $168

2: $185                                              2: $158 

3: $193.6                                            3: $147.5


Ripple

XRP also tested where it will find a suitable place to consolidate. The price fluctuated between the $0.19 and $0.205, trying to find the stabilization point. XRP failed to break $0.205 to the upside, but also retested $0.19 right after failing to break to the upside. After failing to break to the downside as well, XRP consolidated right below the $0.2 level.


XRP’s volume is just slightly lower when compared to yesterday, while its RSI level is at 67.

Key levels to the upside                    Key levels to the downside

1: $0.2                                                1: $0.19

2: $0.205                                            2: $0.165

3: $0.227                                             3: $0.147

Categories
Forex Market Analysis

Daily F.X. Analysis, April 07 – Top Trade Setups In Forex – Risk-off Sentiment In Play! 

On the forex front, the ICE U.S. Dollar Index was little changed on the day at 100.79. On Tuesday, eyes will be on the series of low impact economic events from the Eurozone, U.K., and U.S. economy, but these may not drive major price action in the market. So we should focus on the technical side of the market. The German Federal Statistical Office will report February industrial production (-0.9% on month expected).

France’s INSEE will release the February trade balance (5.05 billion euros deficit expected). The U.S. Labor Department will report JOLTS job openings for February (6.5 million expected). The Federal Reserve will post February consumer credit (+14.0 billion dollars expected).

Economic Events to Watch Today     


EUR/USD – Daily Analysis

The EUR/USD slipped 0.1% to 1.0796, down for a sixth straight session. Official data showed that German factory orders dropped 1.4% on month in February (-2.5% expected). On the other hand, the eurozone Sentix Investor Confidence Index declined to -42.9 in April (-37.5 expected) from -17.1 in March.

The uptick in German’s industrial production for February may not provide support to the EUR/USD because the futures tied to the S&P 500 futures are starting to reporting a 0.60% drop and will likely draw bids for the greenback during the day ahead.

In the meantime, if the German data represents that the manufacturing output was already facing a renewed recession ahead of COVID-19 concerns seen in March, the EUR currency may draw offer, possibly testing support at 1.0770.  

It is worth mentioning that Industrial Production usually releases by the Statistisches Bundesamt Deutschland, which measures outputs of the German factories and mines. Whereas, the changes in industrial production are broadly watched as a significant sign of strength in the manufacturing sector. A high figure is understood as positive or bullish for the EUR. Hence, a low reading is seen as negative (or bearish). The German Federal Statistical Office will report February industrial production (-0.9% on month expected).

Daily Support and Resistance

  • S1 1.0653
  • S2 1.0732
  • S3 1.0769

Pivot Point 1.081

  • R1 1.0847
  • R2 1.0889
  • R3 1.0967

EUR/USD– Trading Tips

On Tuesday, the EUR/USD is trading bearish at 1.088, having an immediate support level of around 1.07990. On the 4-hour chart, the EUR/USD has violated the support level of 1.085, which is now working as a resistance. A bearish breakout of 1.07990 level may extend selling bias until the next support level of 1.0650. While the MACD is staying below 0, supporting the odds selling movements in the market. At the same time, the 50 periods exponential moving average is also keeping the EUR/USD in a bearish mode. Bearish crossover of 1.081 area can open further room for selling until 1.065 level. So, let’s consider taking selling trades below 1.081 and bullish above the same to target 1.0946 today.

GBP/USD– Daily Analysis

The GBP/USD lost 0.3% to 1.2224. U.K. Prime Minister Boris Johnson has been admitted to intensive care as his coronavirus symptoms worsened. Meanwhile, the Markit U.K. Construction PMI slid to 39.3 in March (44.0 estimated) from 52.6 in February.

As per the latest report, the death toll from the coronavirus increased by 621 to 4,934. The total number of confirmed infections rose to 47,806. Apart from the coronavirus intensifying concerns, the GBP currency could remain bearish in the European trading hours, mainly due to the sluggish data. As in result, the U.S. 10-year treasury yields remain flashing green around 0.68% with major Asian stocks marking gains.

At the coronavirus front, the decreasing fear of coronavirus is also the reason behind the risk-on market sentiment. While the declining figures from Spain, Italy, and the U.K., the recent decline in the British death losses from the top of April 04 figures of 708 to 439 providing support to the market, but it seems doubtful as per the experts.

At the USD front, the U.S. dollar losing its bullish momentum on the day, mainly due to the risk recovery sentiment in the market. The fresh stimulus package hints from the U.S. also keeps the USD lower. Looking forward, investors will keep their eyes on the coronavirus updates. As well as, the government/central bank struggles to control the deadly disease will also be essential to watch for near-term direction.


Daily Support and Resistance

  • S1 1.1909
  • S2 1.21
  • S3 1.2184

Pivot Point 1.229

  • R1 1.2375
  • R2 1.248
  • R3 1.267

GBP/USD– Trading Tip

The GBP/USD is trading at 1.2330 within a symmetric triangle pattern, which is supporting Sterling at 1.220 and along with resistance around 1.2490. On the 4-hour timeframe, the GBP/USD pair may find resistance around 1.2470, along with support around 1.2278. In the case of market breaks bellow 1.2278, we may see GBP/USD prices heading into the selling zone until 1.2100 and 1.2005. Whereas, the chances of buying remains solid over 1.2275 until 1.2520. The MACD and 50 EMA are also supporting the bullish bias, so let’s consider taking buying trades over 1.2209 with a target of 1.2400. 

USD/JPY – Daily Analysis

During Tuesday’s Asian session, the USD/JPY currency pair failed to continue its 3-days winning streak and faced some fresh supply while dropped to 108.67 level, mainly due to modest declines in the U.S. dollar in the wake of risk-on market sentiment. The fresh recovery in the risk market weakened the safe-haven JPY and collaborated the pair limit the downside. The USD/JPY is trading at 108.79 and consolidates in the range between the 108.67 – 109.28.

The decreasing number of new coronavirus cases is also the reason behind the risk-on market sentiment. While the declining figures from Spain, Italy, and the U.K., the recent decline in the British death losses from the top of April 04 figures of 708 to 439 providing support to the market and weakened the Japanese yen’s safe-haven status.

Moreover, the risk-on market sentiment could also be attributed to the fresh pickup in the U.S. Treasury bond yields. The Japanese government is showing a willingness to declare a state of emergency for Tokyo, and other big cities further weighed on the Japanese yen, which was also seen as a factor helping limit the downside.

On the other hand, the United States President Donald Trump is also showing a readiness to declare another aid package after the House Speaker Nancy Pelosi gave hints for the same. The risk sentiment got a boost, driving the Japanese yen higher.

Daily Support and Resistance

  • S1 105.37
  • S2 106.64
  • S3 107.08

Pivot Point 107.91

  • R1 108.35
  • R2 109.17
  • R3 110.44

USD/JPY – Trading Tips

The USD/JPY is also forming a symmetric triangle pattern on the 4-hour chart in the wake of thin volatility and trading volume in the market. The USD/JPY is trading choppy around 108.884, still staying above previously violated the choppy trading range of 108.650 – 107.250. With this, the USD/JPY’s best immediate support is likely to be found around 108.700. On the 4 hour timeframe, the Japanese pair has closed a bullish engulfing candle over 50 EMA, which is suggesting odds of more buying in the USD/JPY currency pair. The USD/JPY may exhibit further room for buying until 109.680, and violation of this can open more room for buying until 110.500 and 111.450. On the lower side, support continues to hold around 108.750. Let’s look for buying traders over 108.850 today.  

All the best for today! 

Categories
Crypto Market Analysis

Daily Crypto Review, Apr 7 – BTC secures its place above $7,000; Altcoins surge with ETH leading the way

The cryptocurrency market had another great day while Bitcoin established its price above the $7,000 level. Altcoins increased in value significantly, with many of them surpassing Bitcoin’s gains. Bitcoin is currently trading for $7,330, which represents an increase of 3.92% on the day. Meanwhile, Ethereum gained an astonishing 15.08% on the day, while XRP gained 7.36%.

Digibyte took the position of today’s most prominent daily gainer, with gains of 20.97%. Swipe lost 1.16% on the day, making it the most prominent daily loser.

Bitcoin’s lost some dominance in the past 24 hours as many altcoins surpassed its gains. Its value is now 64.35%, which represents a 1.15% difference to the downside when compared to yesterday.

The cryptocurrency market capitalization increased considerably over the past 24 hours. Its current value is $204.99 billion. This value represents an increase of $7.87 billion when compared to the value it had yesterday.

What happened in the past 24 hours

The Bank of Korea has launched a new pilot program for its central bank digital currency. This launch came rather early as Korea was afraid some other country could take the lead in the industry.

The South Korean central bank reevaluated the CBDC proposal after closely observing what other developed nations, such as Japan and the US, were doing.

Honorable mention

Steem

Tensions between Steem and the Hive community continue to escalate as Steem executes a soft fork so it could freeze up to 20 accounts that were owned by the network’s former witnesses.

These frozen accounts hold around 17.6 million STEEM, which is worth approximately $3.2 million and equates to nearly 5% of Steem’s total supply.

_______________________________________________________________________

Technical analysis

_______________________________________________________________________

Bitcoin

Bitcoin bulls pushed the price up yet again, establishing the level above $7,000. On top of that, Bitcoin broke many resistance levels. Besides $6,850, which was broken yesterday,Bitcoin went through the 7,085 one as well. However, the $7,420 level stopped its uptick as there was simply no pressure to reach above that one too.


Bitcoin’s volume increased slightly, while its RSI on the 4-hour chart is deep in the overbought, standing at the value of 76.

Key levels to the upside                    Key levels to the downside

1: $7,420                                           1: $7,085

2: $7,750                                           2: $6,850

3: $8,000                                            3: $6,640


Ethereum

Ethereum had a fantastic day as ETH bulls pushed its price up more than 15%. The second-largest cryptocurrency pushed through $147.5 and $158 and $168 resistances, only to be stopped at the $178.6 resistance level. This parabolic move is pretty unstable and might require a pullback to stabilize.


Ethereum’s volume increased substantially, while its RSI level is unbelievably high, sitting at 89.5.

Key levels to the upside                    Key levels to the downside

1: $178.6                                             1: $168

2: $185                                              2: $158 

3: $193.6                                            3: $147.5


Ripple

XRP had a great couple of days, with its price constantly rising. However, the past 24 hours were especially great as XRP managed to break its $0.19 resistance level. The move was stopped by the $0.2 key level as there wasn’t enough bullish presence.


XRP’s volume almost doubled during the spike, while its RSI level went deep into the overbought territory, currently sitting at 85.

Key levels to the upside                    Key levels to the downside

1: $0.2                                                1: $0.19

2: $0.205                                            2: $0.165

3: $0.227                                             3: $0.147

Categories
Forex Market Analysis

Daily F.X. Analysis, April 06 – Top Trade Setups In Forex – Risk-off Sentiment In Play! 

On the forex front, the U.S. dollar continued to see safe-haven buying. The ICE U.S. Dollar Index rose 0.4% on the day to 100.58, extending its rally to a third straight session. Later today, the Research firm Markit will publish March U.K. Construction PMI (44.0 expected). The eurozone Sentix Investor Confidence Index for April will be released (-37.5 expected). The German Federal Statistical Office will report February factory orders (-2.5% on month expected).

Economic Events to Watch Today     


EUR/USD – Daily Analysis

The EUR/USD slid 0.5% to 1.0809, posting a five-day losing streak. Official data revealed that the eurozone’s retail sales surged 0.9% on month in February (+0.1% expected). Later today, the eurozone Sentix Investor Confidence Index for April will be released (-37.5 expected).

Speaking about the Germans Factory orders data, this data release by the Deutsche Bundesbank, which indicates the shipments, inventories, and new orders. A surged in the factory order total may show progress in the German economic growth, and it could also be a factor to boost inflation.

It is worth noting that the German Factory influences by two-ways either positively or negatively, the total Eurozone GDP. A high figure is considered as a positive or bullish for the EUR, while a low reading is negative.

Therefore, the pair could drop to 1.0773 previously low on mixed Ferman data. Moreover, if the greenback catches fresh bids on the turnaround in the risk sentiment, the EUR/USD currency pair could suffer in a more profound drop below 107.00 ahead.

As per the coronavirus latest report, the cases rose by 3,677 in Germany when compared with Sunday’s 5,936 new infections, showing the 4th-straight drop in the daily rate. The death toll rose by 92. Consequently, the EUR/USD is suffering badly and may trade sideways as the dollar also suffers alongside. 


Daily Support and Resistance

  • S1 1.0653
  • S2 1.0732
  • S3 1.0769

Pivot Point 1.081

  • R1 1.0847
  • R2 1.0889
  • R3 1.0967

EUR/USD– Trading Tips

The EUR/USD is trading bearish at 1.080, having an immediate support level of around 1.07990. On the 4-hour chart, the EUR/USD has violated the support level of 1.085, which is now working as a resistance. As of now, a bearish breakout of 1.07990 level may extend selling bias until the next support level of 1.0650. While the MACD is staying below 0, supporting the odds selling movements in the market. 

At the same time, the 50 periods exponential moving average is also keeping the EUR/USD in a bearish mode. Bearish crossover of 1.081 area can open further room for selling until 1.065 level. So, let’s consider taking selling trades below 1.081today.

GBP/USD– Daily Analysis

The GBP/USD sank 1.1% to 1.2262. The Markit U.K. Construction PMI for March will be released later in the day (44.0 expected). As per the latest report, the coronavirus cases rose to 33,718 as of 08:00 GMT on April 02, whereas there was a 24% rise in the death toll to 2,921 at the same time.

Meanwhile, the Washington Governor extended the stay-at-home order, whereas S&P declared its U.S. rating at AA+ with expectations of a recovery in 2021. As in result, the market’s risk-tone remains moderately heavy with the U.S. 10-year treasury yields dropped below 0.60%, and most Asian stocks are also flashing red.

As per the latest report, the death toll from the coronavirus increased by 621 to 4,934. The total number of confirmed infections rose to 47,806. Apart from the coronavirus intensifying concerns, the GBP currency could remain bearish in the European trading hours mainly due to the sluggish data, which is released early Monday and showed the British consumer confidence declined to the weakest since February 2009. 

On the flip side, the USD has ignored 7 million drops in the U.S. jobs for March, because the upbeat US ISM Non-Manufacturing PMI boded well for the greenback. However, the U.K. Services PMI data for March was revised down to 34.5 points, which will likely push the GBP lower.

Looking forward, the headlines related to the PM Johnson’s condition will remain driver seats. The U.S. dollar dynamics also will be critical to watch for fresh directions. Meanwhile, traders, all eyes will be on the U.K. government COVID-19 meeting, which is scheduled to happen at 0815GMT for new trading impetus. The meeting will be chaired by the U.K. Foreign Secretary Raab and include the advisers and officials.


Daily Support and Resistance

  • S1 1.1909
  • S2 1.21
  • S3 1.2184

Pivot Point 1.229

  • R1 1.2375
  • R2 1.248
  • R3 1.267

GBP/USD– Trading Tip

The technical side of the GBP/USD hasn’t changed much as it continues trading sideways in between the same trading range of 1.2275 – 1.2425. On the 4 hour timeframe, the GBP/USD is forming neutral candles despite worse than expected NFP figures from the U.S. Hence, the pair has gained slight support and recovered over 1.2265 resistance level, which is now working as a support. 

On the 4-hour timeframe, the GBP/USD pair may find resistance around 1.2470, along with support around 1.2278. In the case of market breaks bellow 1.2278, we may see GBP/USD prices heading into the selling zone until 1.2100 and 1.2005. Whereas, the chances of buying remains solid over 1.2275 until 1.2520.

USD/JPY – Daily Analysis

During Monday’s Asian session, the USD/JPY currency pair flashing green and continue to gaining its traction for the 3rd-consecutive session mainly due to fresh risk recovery in the market.

The U.S. bond yields exhibited an uptick, which is providing support to the greenback and also kept the USD/JPY pair higher. Right now, the USD/JPY is trading at 109.25 and consolidates in the range between the 108.37 – 109.38.

However, the USD/JPY pair added to its intraday gains and rose further beyond the 109.00 round-figure marks, hitting fresh one-week tops in the last hour. A fresh drop in the death and cases of coronavirus gave a high relief to the trader. Whereas, the strong gain in the U.S. equity futures weakened the Japanese yen’s safe-haven demand.

On the other hand, the reason behind the Japanese bearish bias could also be TBS News report that the Japanese government is considering 6-months for a state of emergency declaration to control the coronavirus outbreak in Tokyo.

Daily Support and Resistance

  • S1 105.37
  • S2 106.64
  • S3 107.08

Pivot Point 107.91

  • R1 108.35
  • R2 109.17
  • R3 110.44

USD/JPY – Trading Tips

Technically, the USD/JPY pair is trading bullish a 109.177, having violated the choppy trading range of 108.650 – 107.250. With this, the USD/JPY’s best immediate support is likely to be found around 108.700. On the 4 hour timeframe, the Japanese pair has closed a bullish engulfing candle over 50 EMA, which is suggesting odds of more buying in the USD/JPY currency pair. 

With this, the USD/JPY may exhibit further room for buying until 109.680, and violation of this can open more room for buying until 110.500 and 111.450. On the lower side, support continues to hold around 108.750. Let’s look for buying traders over 108.850 today.  

All the best for today! 

Categories
Crypto Market Analysis

Daily Crypto Review, Apr 6 – Bitcoin above $7,000 – but will it stay there?

The cryptocurrency market had quite a good day as volume increased, and bulls gathered. Bitcoin led the market up to new highs and finally broke the $7,000 mark. It is currently trading for $7,067, which represents an increase of 4.33% on the day. Meanwhile, Ethereum gained 5.27% on the day, while XRP gained 3.39%.

Zilliqa took the position of today’s most prominent daily gainer, with gains of 16.97%. Steem lost 4.14% on the day, making it the most prominent daily loser.

Bitcoin’s dominance stayed at almost the same place over the weekend. Its value is now 65.5%, which represents a 0.23% difference to the downside when compared to Friday.

The cryptocurrency market capitalization increased greatly over the weekend. Its current value is $197.12 billion. This value represents an increase of $7.33 billion when compared to the value it had on Friday.

What happened in the past 24 hours

Michael Stay, a former Google’s software engineer as well as the current CTO of a DApp company Pyrofex, claims to have successfully hacked a certain zip file containing the private keys leading to over $300,000 in Bitcoin (BTC).

Honorable mention

Ripple

A new blockchain course that the Australian National University law school is offering this year now has full support from Ripple’s University Blockchain Research Initiative.

This partnership between ANU and UBRI will work on finding out more about how blockchain can disrupt the legal industry.

_______________________________________________________________________

Technical analysis

_______________________________________________________________________

Bitcoin

Bitcoin bulls pushed to reach new highs all throughout the weekend. The price went far above the resistance line of $6,850 three times, but came back quickly the past 2 times. This is the third time that its price has crossed the resistance. However, all three times, there wasn’t enough buying power to reach above $7,085. If Bitcoin doesn’t hold its gains, bears might get courageous and attack the downside.


Bitcoin’s volume increased compared to the previous week, while its RSI level on the 4-hour chart is 65.

Key levels to the upside                    Key levels to the downside

1: $7,085                                           1: $6,850

2: $7,420                                           2: $6,640

3: $7,750                                            3: $5,960


Ethereum

Ethereum followed Bitcoin in its jump up and even outperformed it. The second-largest cryptocurrency passed its $139 resistance level (for the first time, unlike Bitcoin passing through for the third time) and reached the level of $151. However, that level was quickly denied. Ethereum is still fighting to stay above this (now) support line as it enters the overbought territory.


Ethereum’s volume increased during the spike, while its RSI is currently in the overbought territory (at the value of 72).

Key levels to the upside                    Key levels to the downside

1: $168                                                1: $128

2: $178.6                                            2: $122.5 

3: $185                                                3: $100


Ripple

Even though XRP was the cryptocurrency that gained the least out of the top3, it still performed extremely well. XRP spent the weekend consolidating and preparing for a move, which is now happening. The third-largest cryptocurrency by market cap is reaching higher levels but is currently stuck around $0.185.


XRP’s volume increased when compared to the prior week, while its RSI level on the 4-hour chart reaches near the overbought territory, with the current value of 68.

Key levels to the upside                    Key levels to the downside

1: $0.19                                             1: $0.165

2: $0.2                                               2: $0.147

3: $0.205                                             3: $0.1

Categories
Forex Market Analysis

Daily F.X. Analysis, April 03 – Top Trade Setups In Forex – U.S. Labor Market In Highlights! 
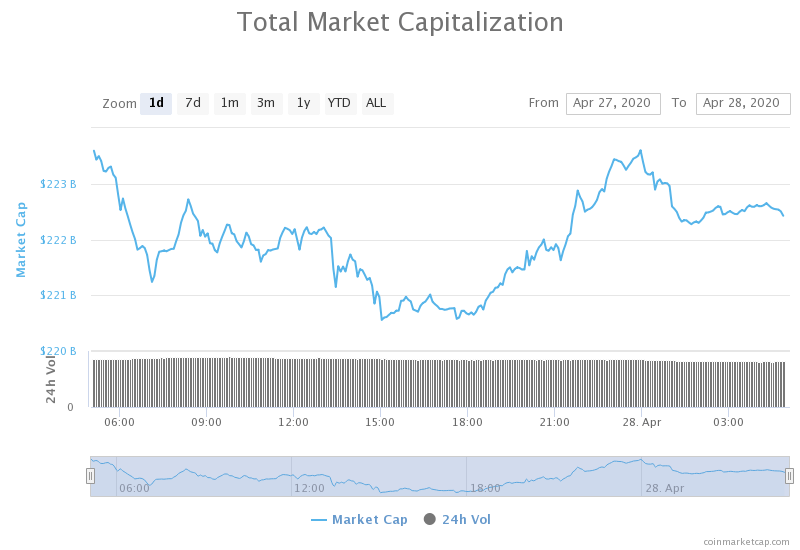
On the forex front, the U.S. dollar strengthened against its major peers, with the ICE Dollar Index climbing 0.6% on the day to 100.10. Today’s eyes will be on the Markit that will publish final readings of March Services PMI for the eurozone (28.2 expected), Germany (34.2 expected), France (29.0 expected), the U.K. (34.8 expected) and the U.S. (38.5 expected). The European Commission will post February retail sales (+0.1% on month expected).

Economic Events to Watch Today     


EUR/USD – Daily Analysis

The EUR/USD sank 1.1% to 1.0845, posting a four-day decline. Later today, the eurozone’s retail sales data for February will be reported (+0.1% on month expected). The market is lacking trading volume and volatility, but the focus will remain on the European economic events. The European Commission will report February January PPI (-0.8% on year expected).

Italy is showing some signs of slowing down in the virus cases despite this the market traders already priced in a recession in the Europan economy, especially in Germany, because the circumstances in Spain continue to rise very fast. The lockdown across Europe continues to weigh on economic activities.

The market risk-off sentiment could more worsen if the U.S. initial jobless claims ignore past expectations, which will send the EUR/USD currency pair to the fresh lowest level. 

Besides the weekly data, the 

Looking forward, the USD moves will continue to play a significant role, as attention shifts to the Euro area Final Services PMI report. Services PMI for the eurozone (28.2 expected), Germany (34.2 expected), France (29.0 expected), the U.K. (34.8 expected), and the U.S. (38.5 expected). The European Commission will post February retail sales (+0.1% on month expected). 

Most importantly, the U.S. Non-Farm Payrolls and ISM Non-manufacturing PMI data are scheduled to release later this Friday. The coronavirus related headline could also drag attention.

Daily Support and Resistance

  • S1 1.0772
  • S2 1.0886
  • S3 1.0958

Pivot Point 1.0999

  • R1 1.1071
  • R2 1.1112
  • R3 1.1226

EUR/USD– Trading Tips

The EUR/USD is trading bearish at 1.090, having an immediate support level of around 1.07990. On the 8-hour timeframe, the EUR/USD has violated the support level of 1.085, which is now working as a resistance. Now, a bearish breakout of 1.07990 level may extend selling bias until the next support level of 1.0650. 

The MACD has also crossed below 0, confirming the chances of more bearish movements in the market. The 50 EMA is also keeping the EUR/USD in a selling mode. For now, the eyes will remain on the U.S. NFP figures to determine further trends in the market. Bearish crossover of 1.1050 area can open further room for selling until 1.065 level. Let’s consider taking selling trades below 1.07990 today.

GBP/USD– Daily Analysis

The GBP/USD edged up 0.1% to 1.2390. The United Kingdom politics are getting warm after the voting to replace the opposition Labour Party leader Jeremy Corbyn closes. Moreover, the top U.K. judge gave warning that the British judiciary system will take hints from the European rules unless last Brexit-day.

As per the latest report, the coronavirus cases rose to 33,718 as of 08:00 GMT on April 02, whereas there was a 24% rise in the death toll to 2,921 at the same time.

Meanwhile, the Washington Governor extended the stay-at-home order, whereas S&P declared its U.S. rating at AA+ with expectations of a recovery in 2021. As in result, the market’s risk-tone remains moderately heavy with the U.S. 10-year treasury yields dropped below 0.60%, and most Asian stocks are also flashing red.

The U.S. Labor Department will release March nonfarm payrolls report (-100,000 jobs, jobless rate at 3.8% expected). The Institute for Supply Management will post its Non-manufacturing Index for March (43.0 expected). It’s going to be a big day, not only for the GBP/USD but also for the rest of the dollar related currency pairs. 


Daily Support and Resistance

  • S1 1.217
  • S2 1.2278
  • S3 1.2334

Pivot Point 1.2387

  • R1 1.2443
  • R2 1.2495
  • R3 1.2604

GBP/USD– Trading Tip

The GBP/USD trade sideways in between the same trading range of 1.2275 – 1.2425. On the 4 hour timeframe, the Cable has formed neutral candles as we may not see further trends until and unless the pair manages to come out of this narrow range. For that reason, the pair needs a solid fundamental reason, which we are not expecting from the United Kingdom today. Let’s see if U.S. claims help drive some price action in the market. On the 4-hour timeframe, the GBP/USD pair is pretty much likely to find resistance around 1.2470, along with support around 1.2278. In the case of market breaks bellow 1.2278, we may see GBP/USD prices heading into the selling zone until 1.2100 and 1.2005. Whereas, the chances of buying remains solid over 1.2275 until 1.2520.

USD/JPY – Daily Analysis

The USD/JPY currency pair continues to taking bids and rose above the 108.00 level despite the high risk-off sentiment in the market, which would typically keep the Japanese yen secure. However, the pair’s bullish trend could be attributed to the sharp rise in oil prices. The USD/JPY currency pair is currently trading at 108.25 and consolidates in the range between the 107.81 – 108.27. The broad-based greenback strength also keeps the pair higher. 

As per the latest report, the COVID-19 cases have surpassed one million worldwide with over a death toll rate of over 50,000. Meanwhile, the Washington Governor extended the stay-at-home order, whereas S&P declared its U.S. rating at AA+ with expectations of a recovery in 2021. 

As well as, Japan is now facing a rise in cases that are increasing the market risk tone time by time, which eventually will likely be good for the safe-haven Japanese yen currency. As in result, the U.S. 10-year Treasury yields fell below 0.60%, down 3-basis points (bps), whereas the U.S. stock futures also mark losses of near 1.0% by the press time. Even so, stocks in Asia-Pacific are moderately positive after the recent Aussie, Japan data.

Lastly, Tokyo also reporting a record hit in daily coronavirus (COVID-19) cases extended school holidays through May 06. Recently, Japan’s Economy Minister Nishimura said that we would consider support for production rise and adopting of ECMO as part of the economic plans to combat from the COVID-19.

Daily Support and Resistance

  • S1 105.37
  • S2 106.64
  • S3 107.08

Pivot Point 107.91

  • R1 108.35
  • R2 109.17
  • R3 110.44

USD/JPY – Trading Tips

On Friday, the technical side of the market continues to exhibit choppy trading sessions within a wide trading range of 108.650 – 107.250. The best idea is to buy at the lower limit 107.250 and sell below 108.650 for now, but on the news release of U.S. nonfarm payroll, we can experience a potential breakout in the USD/JPY pair. 

The USD/JPY is trading at 108.270, consolidating sideways, right above a next support level of 107.750. On the higher side, a bullish breakout of 108.650 resistance level can lead the USD/JPY prices higher towards 109.750 level. Until then, we should look for doing choppy trading by selling below 108.600 and buying over 107.250. Below 107.200, the next support will stay around 105.990.

All the best for today!