Categories
Crypto Market Analysis

Daily Crypto Review, Apr 3 – Bitcoin over $7,000? Is the downtrend finally over?

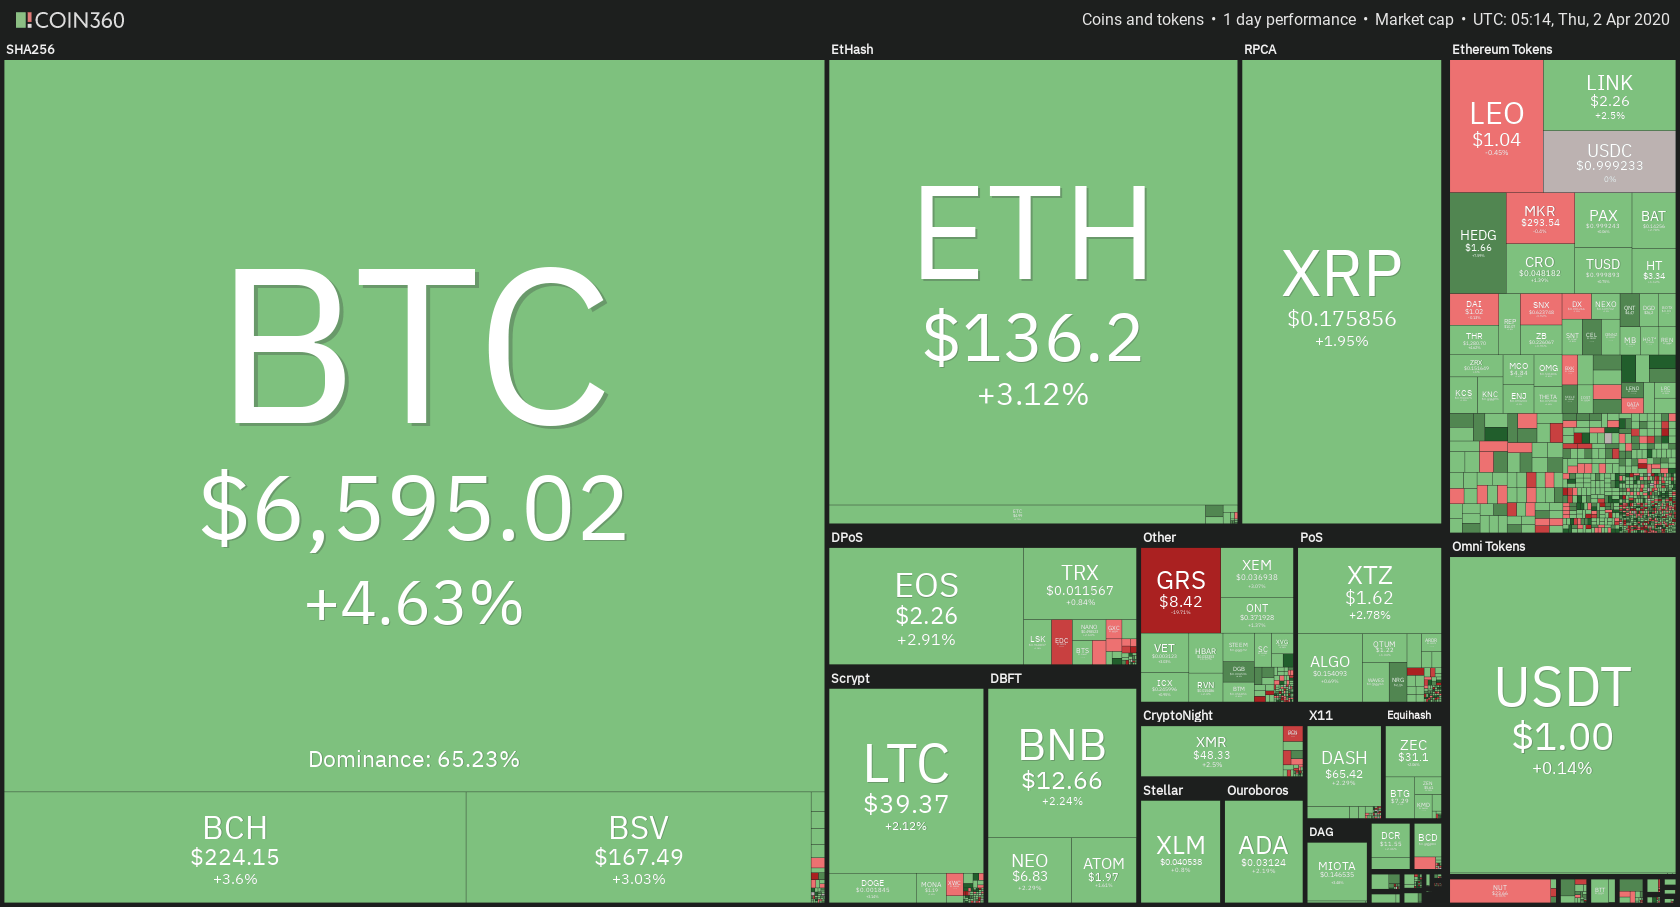
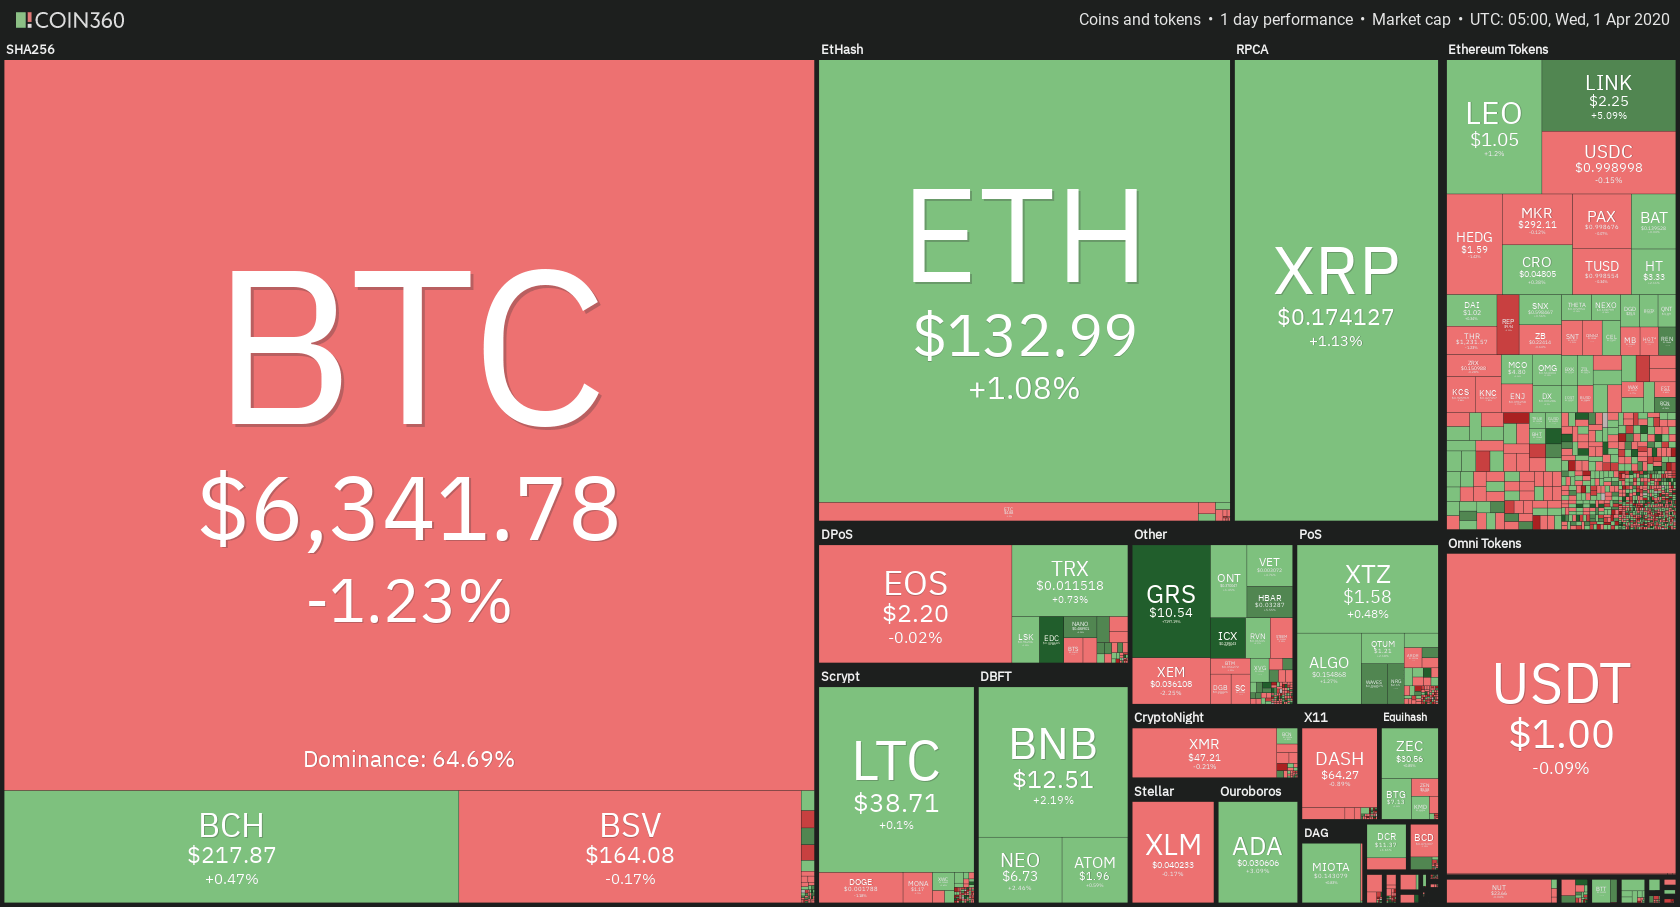
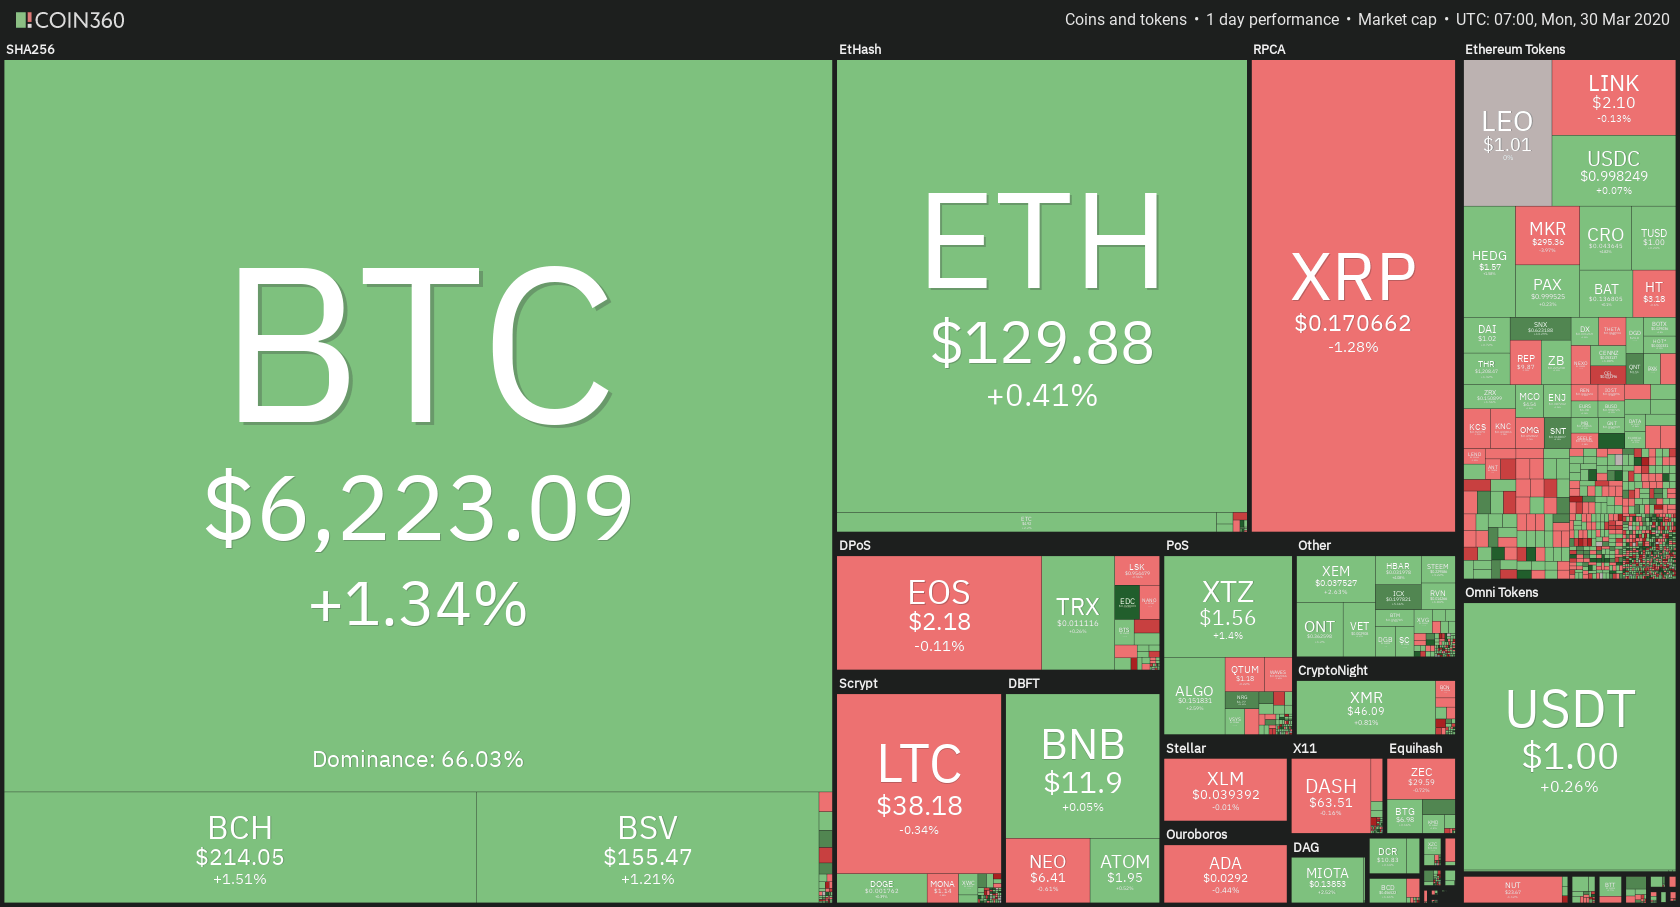
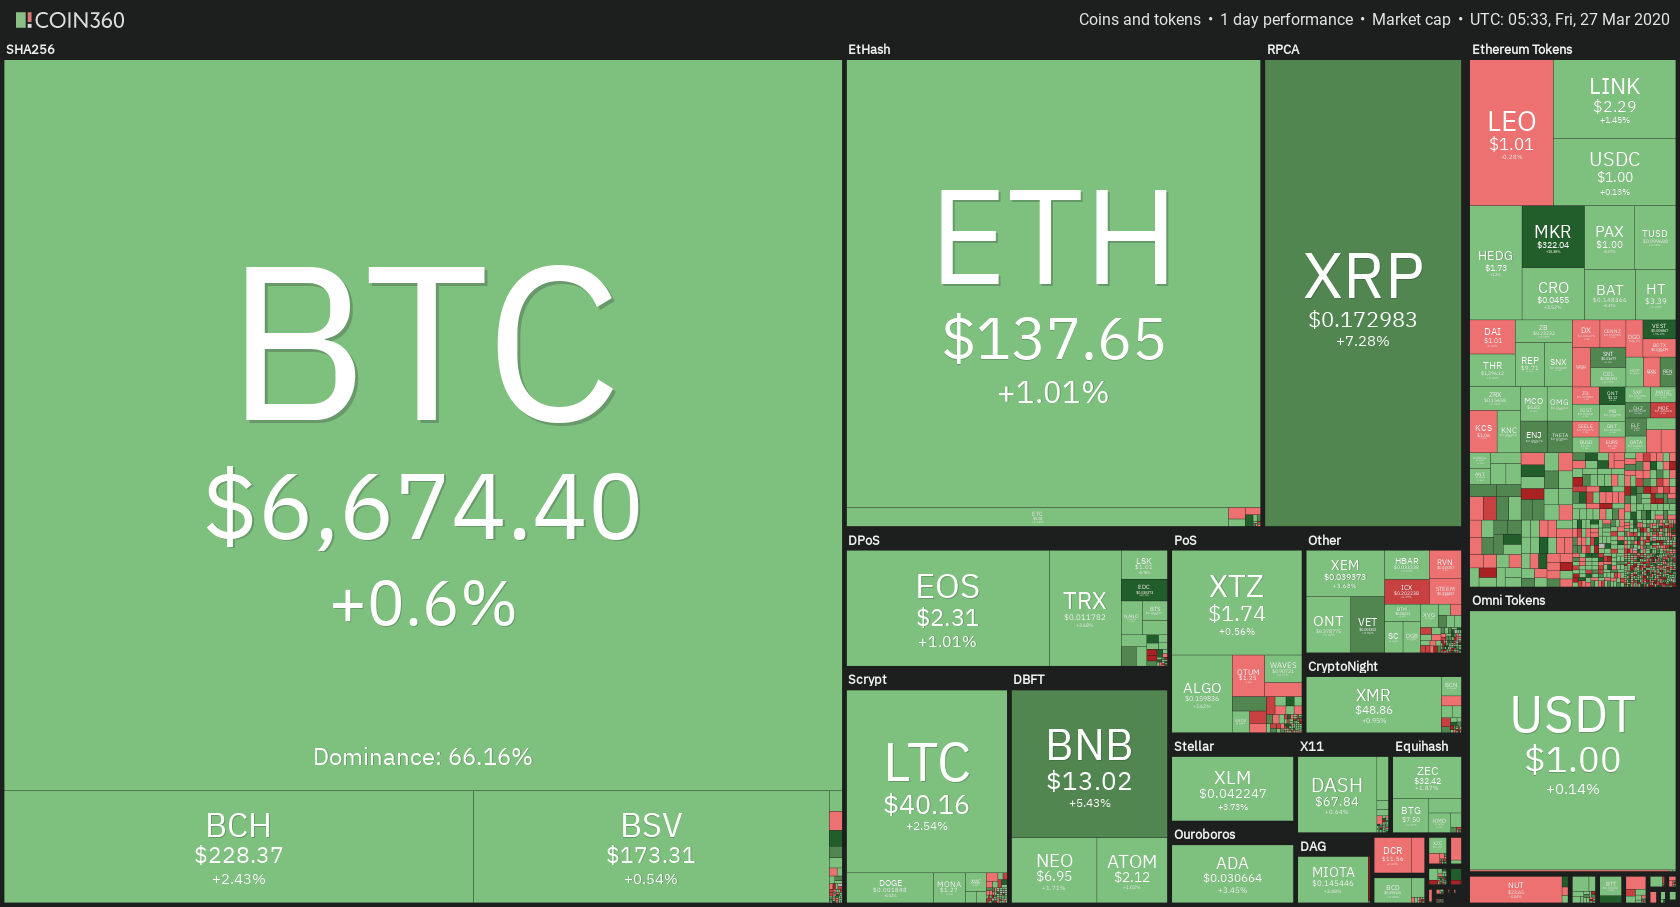
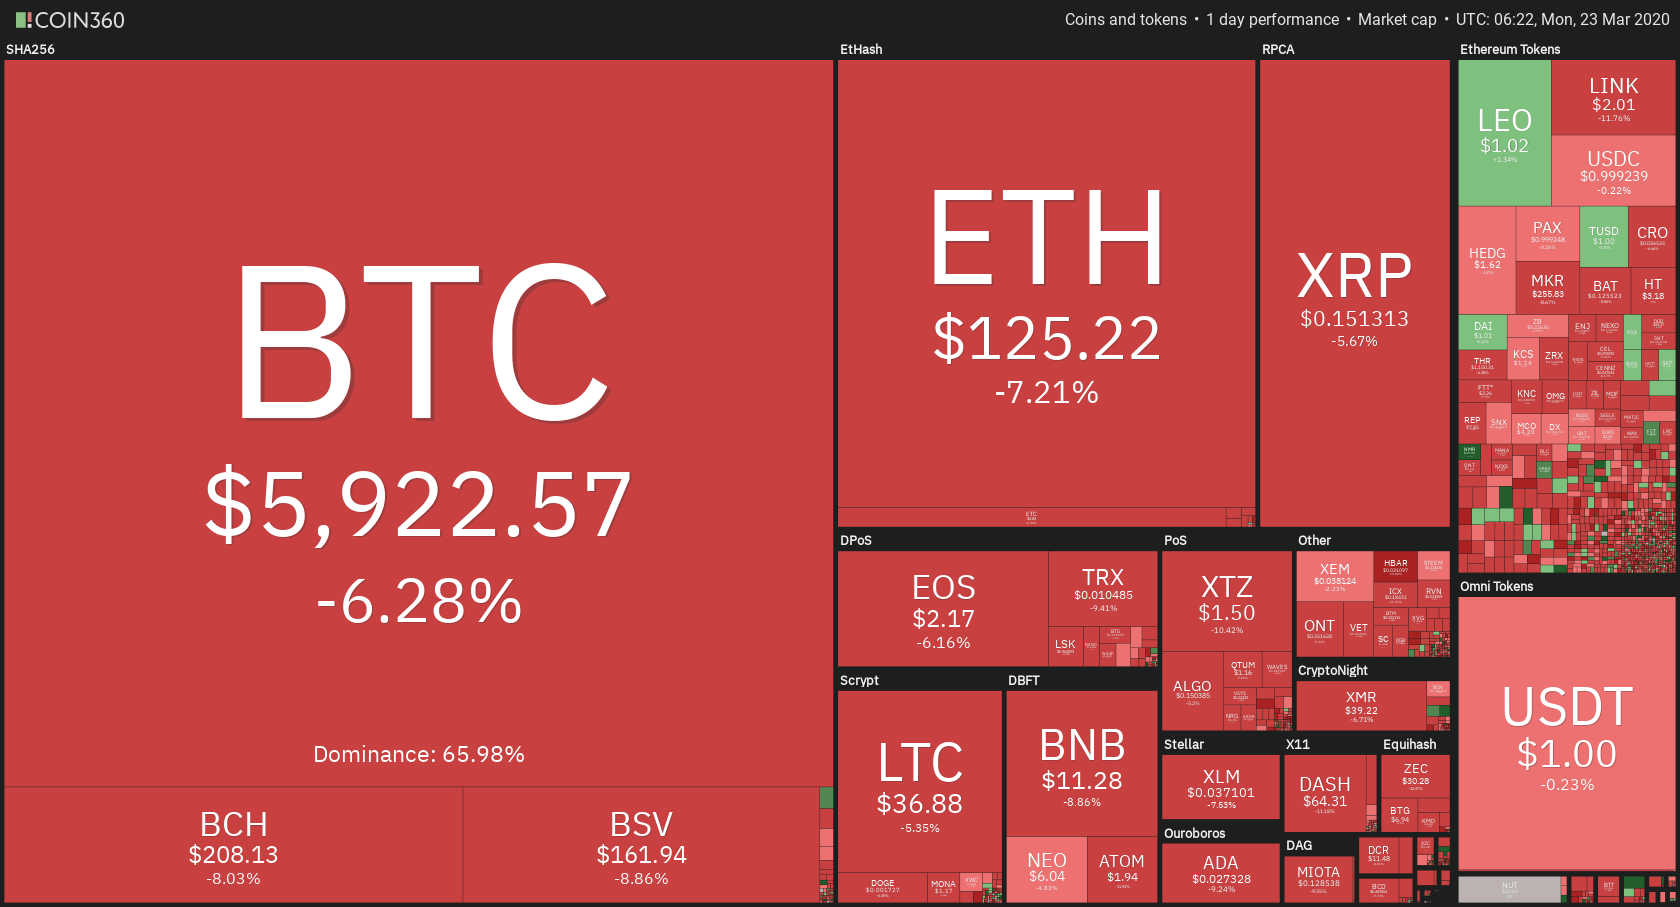
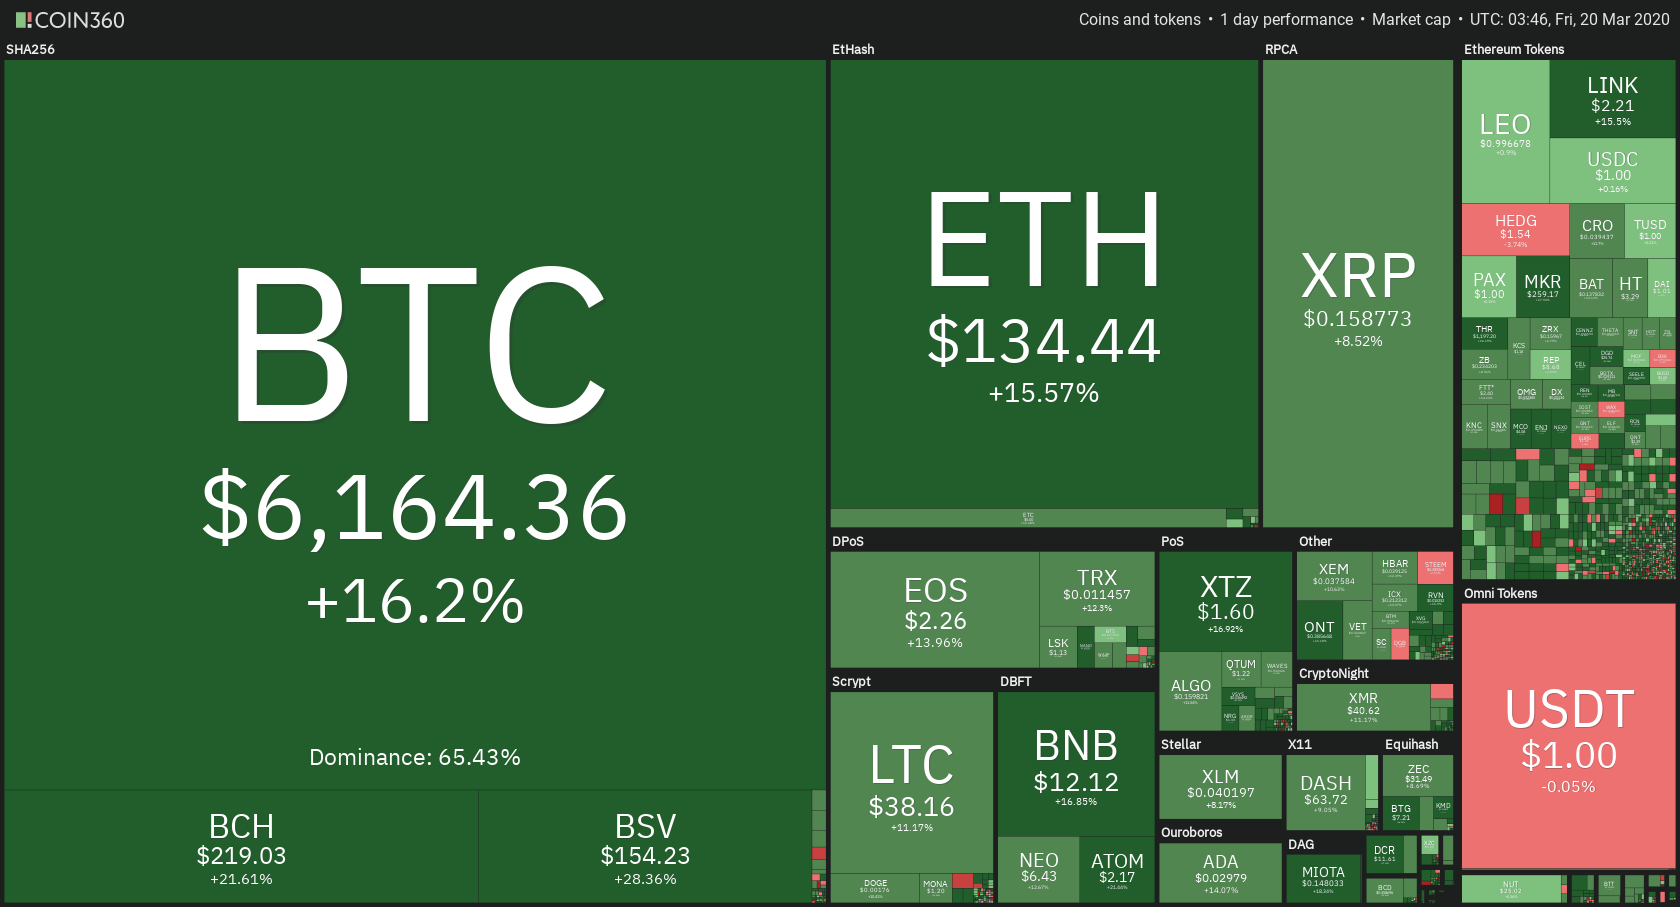
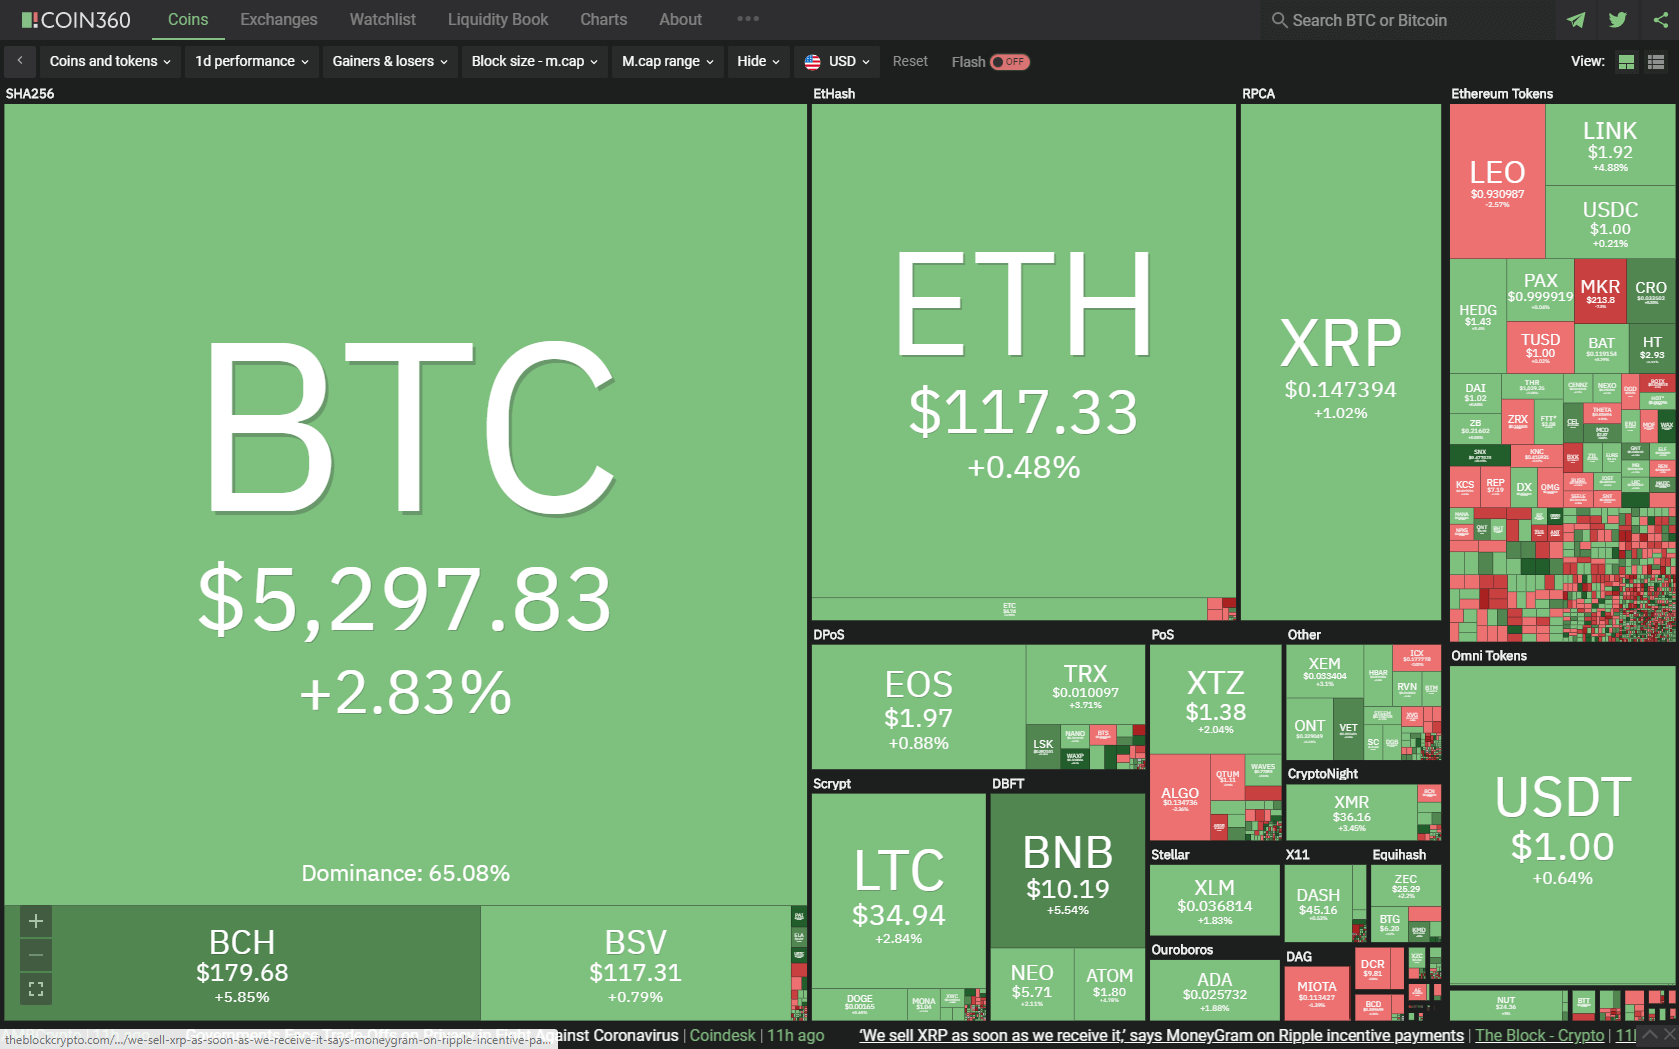
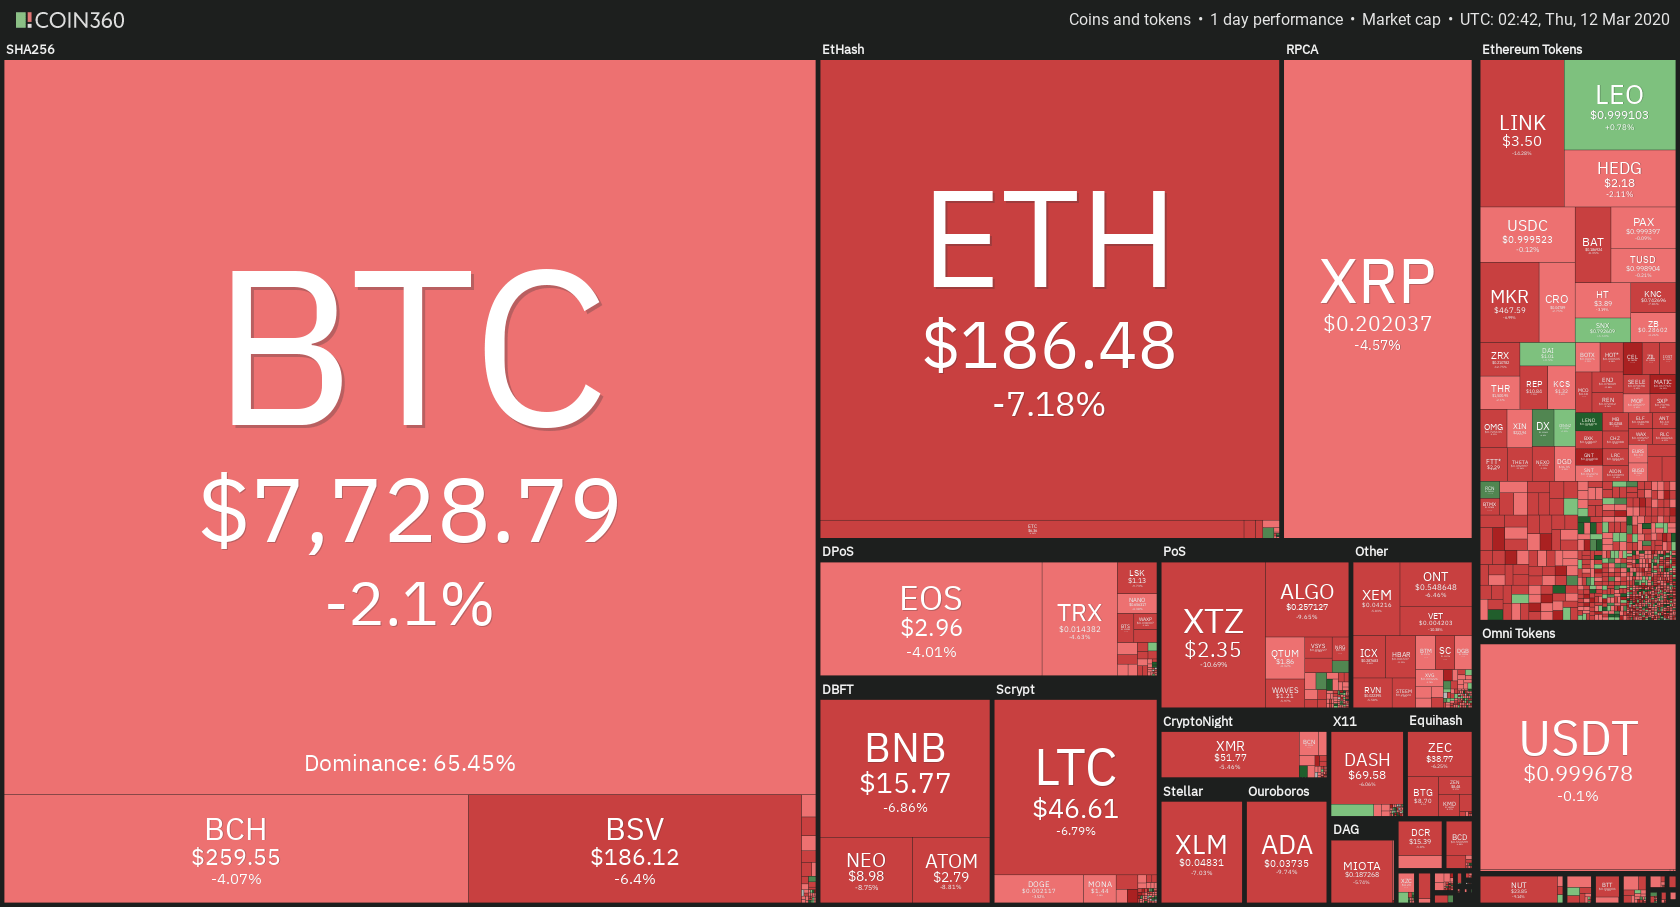
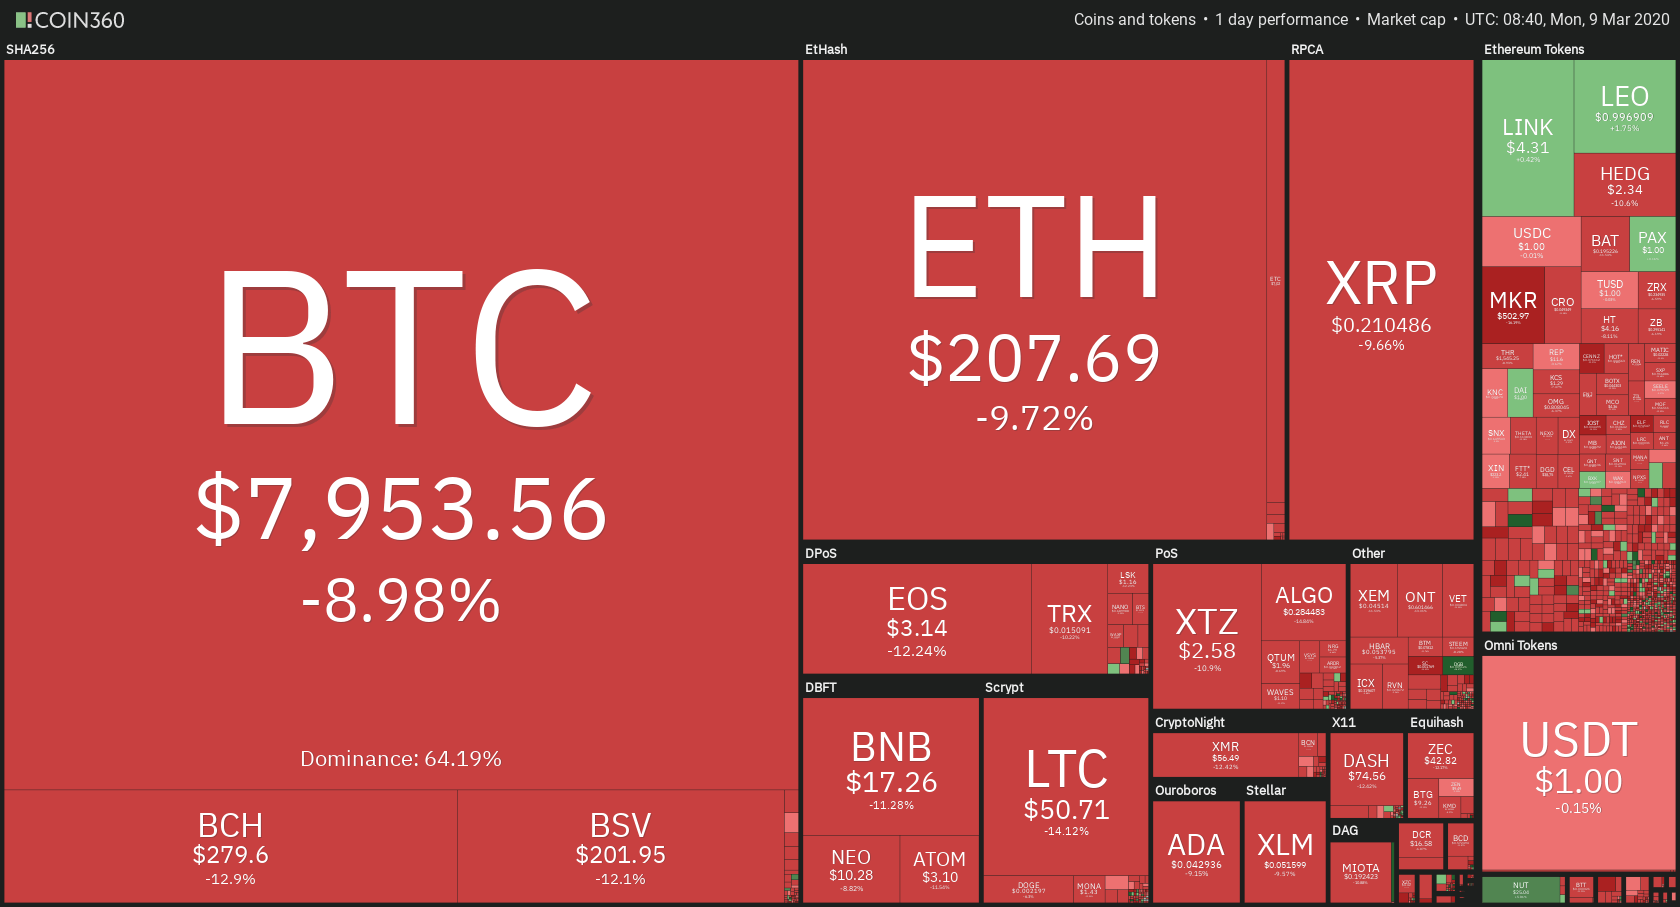
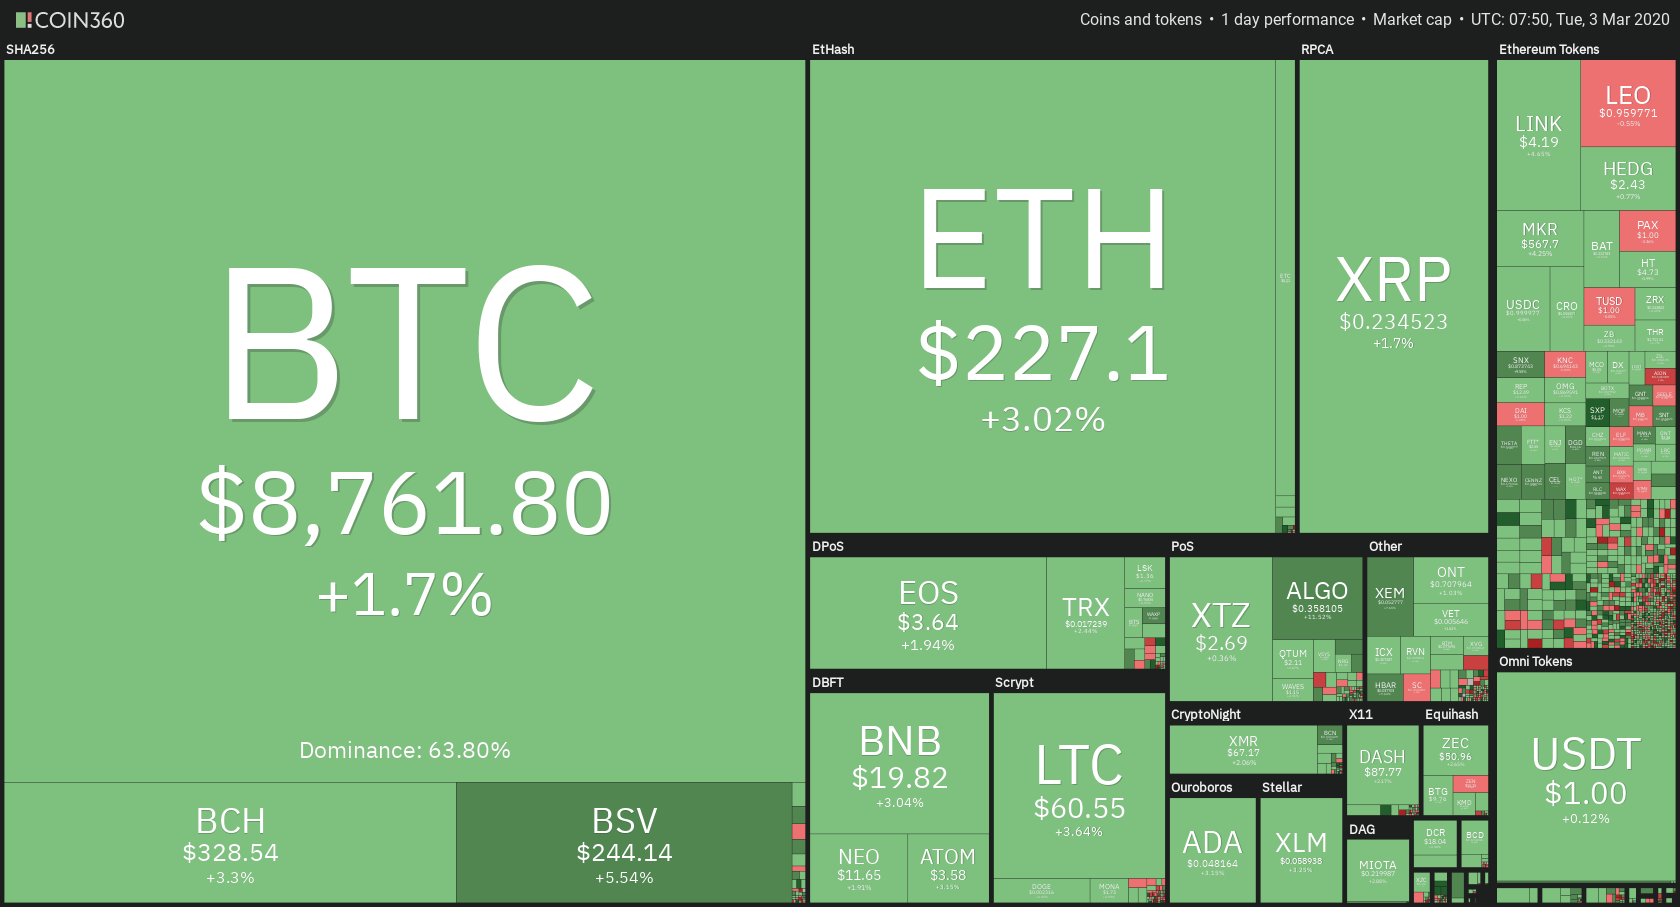
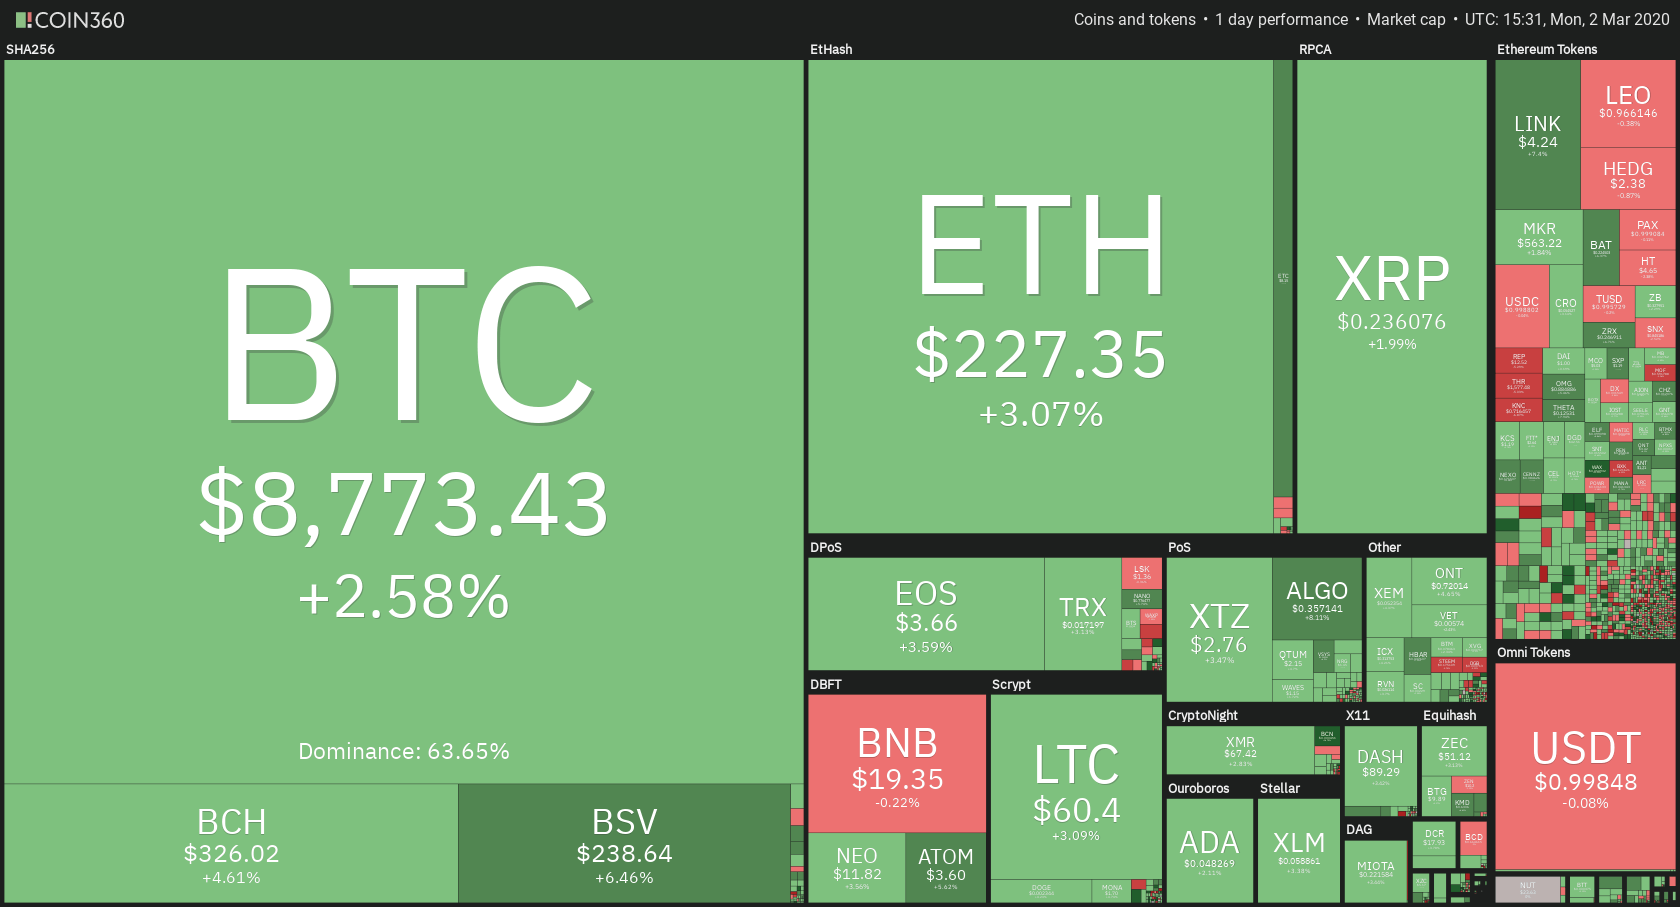
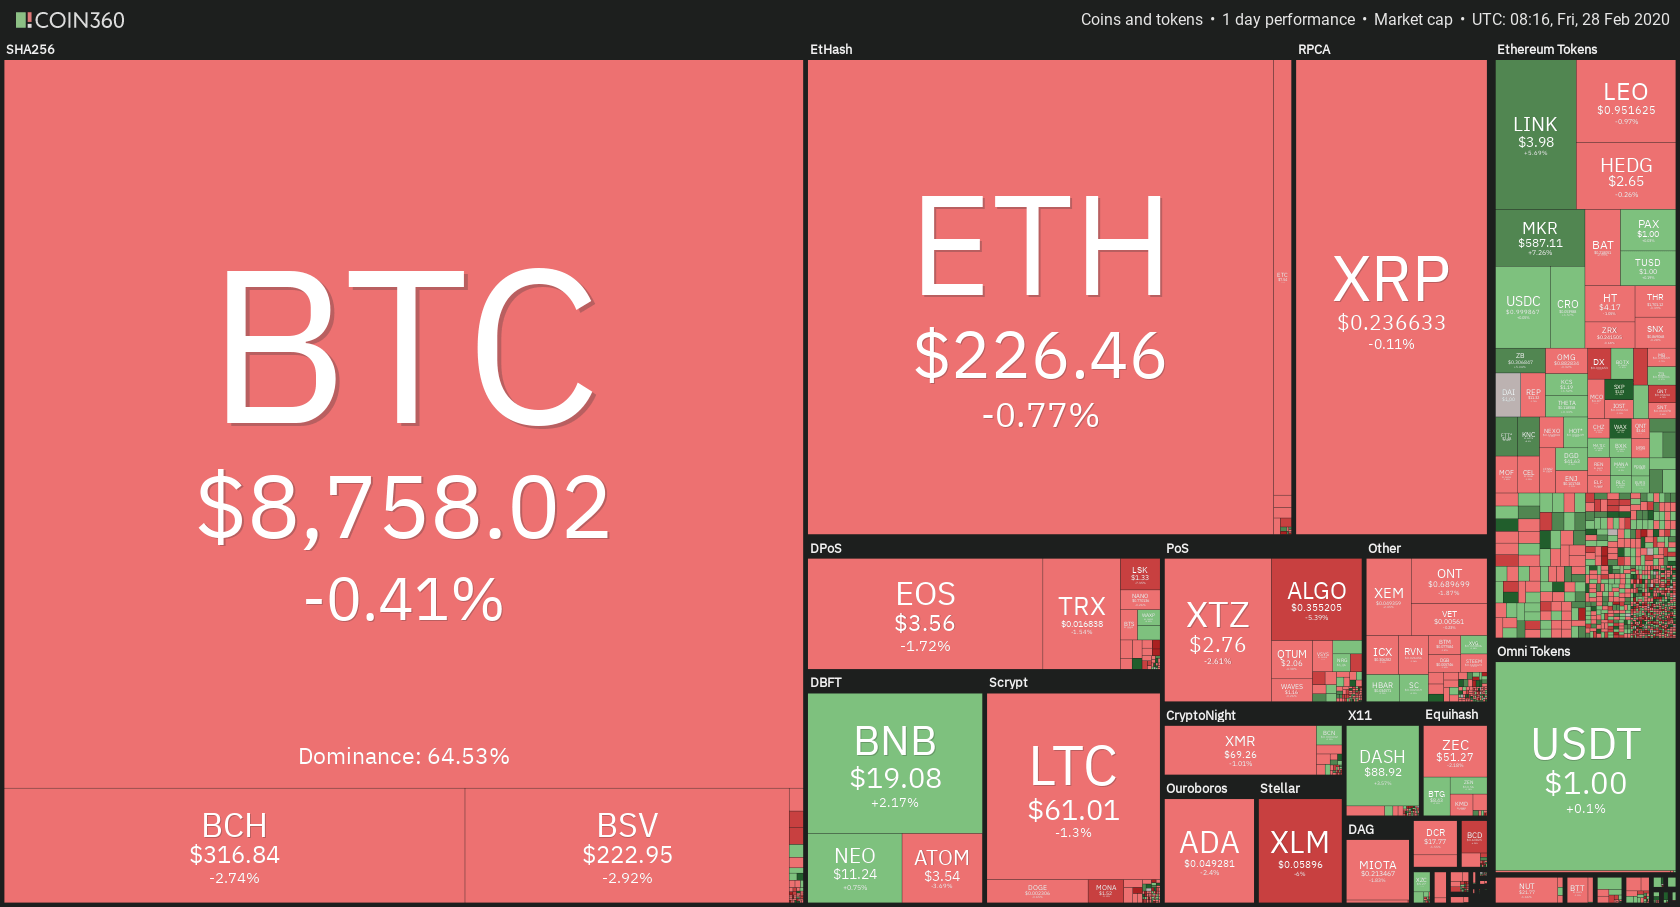
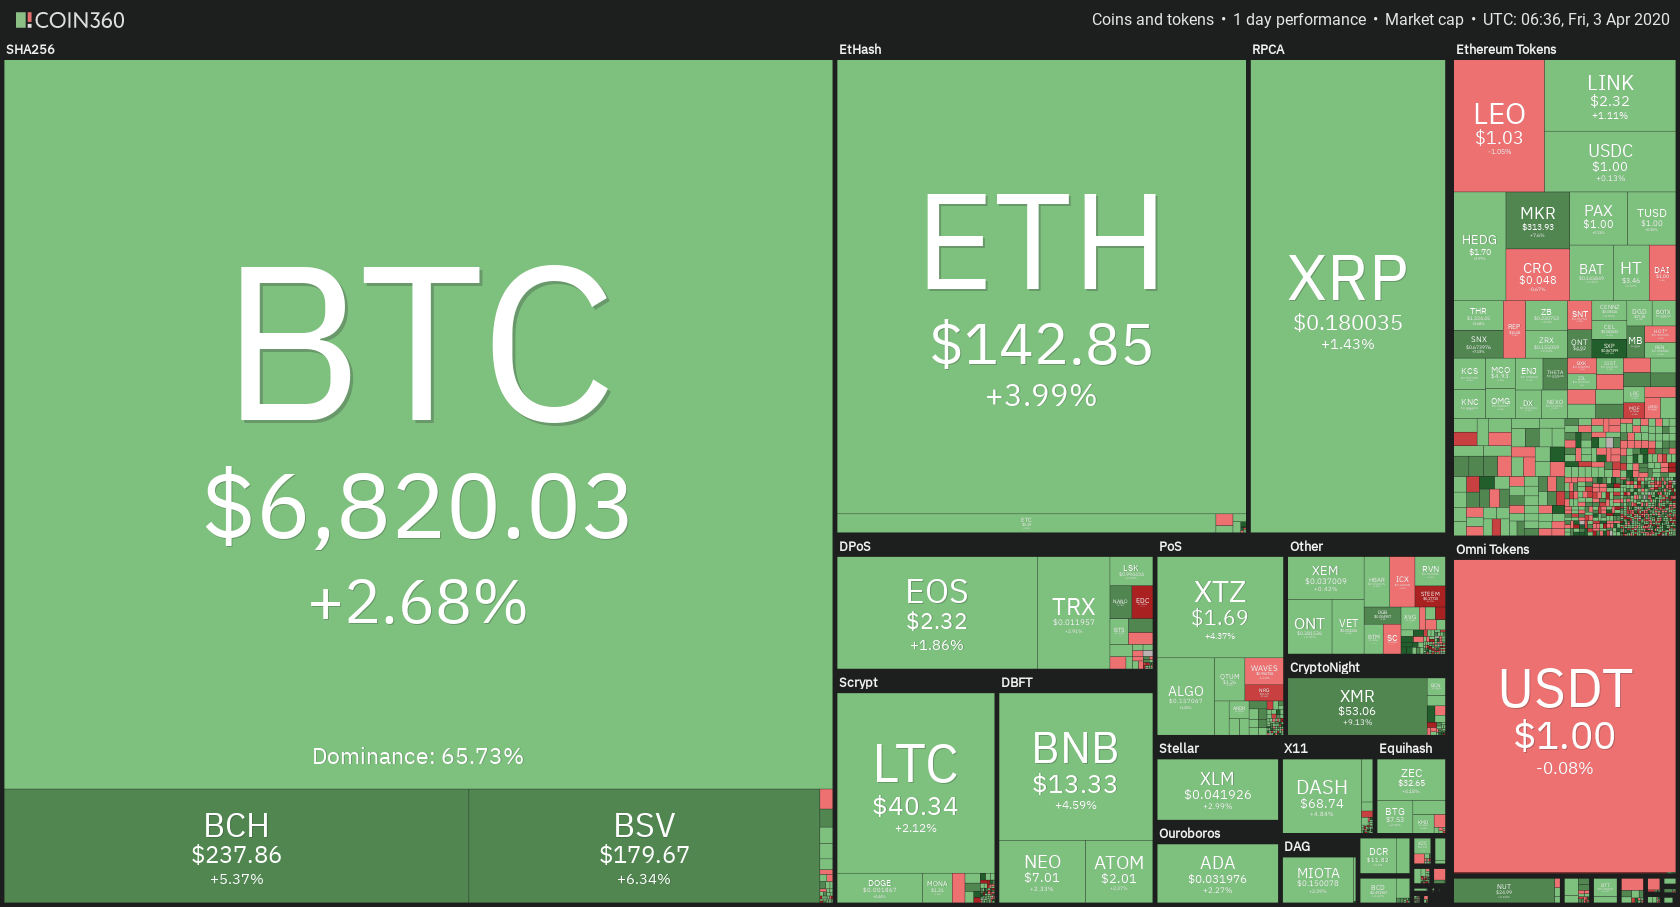
The cryptocurrency market had another, even more, successful push to the upside. The upswing was led by Bitcoin, which broke its immediate resistance. However, many altcoins outperformed it during the spike. Bitcoin is currently trading for $6,820, which represents an increase of 2.68% on the day. Meanwhile, Ethereum gained 3.99% on the day, while XRP gained 1.43%.

Swipe took the position of today’s most prominent daily gainer, with gains of 109.03%. Energi lost 5.453% on the day, making it the most prominent daily loser.

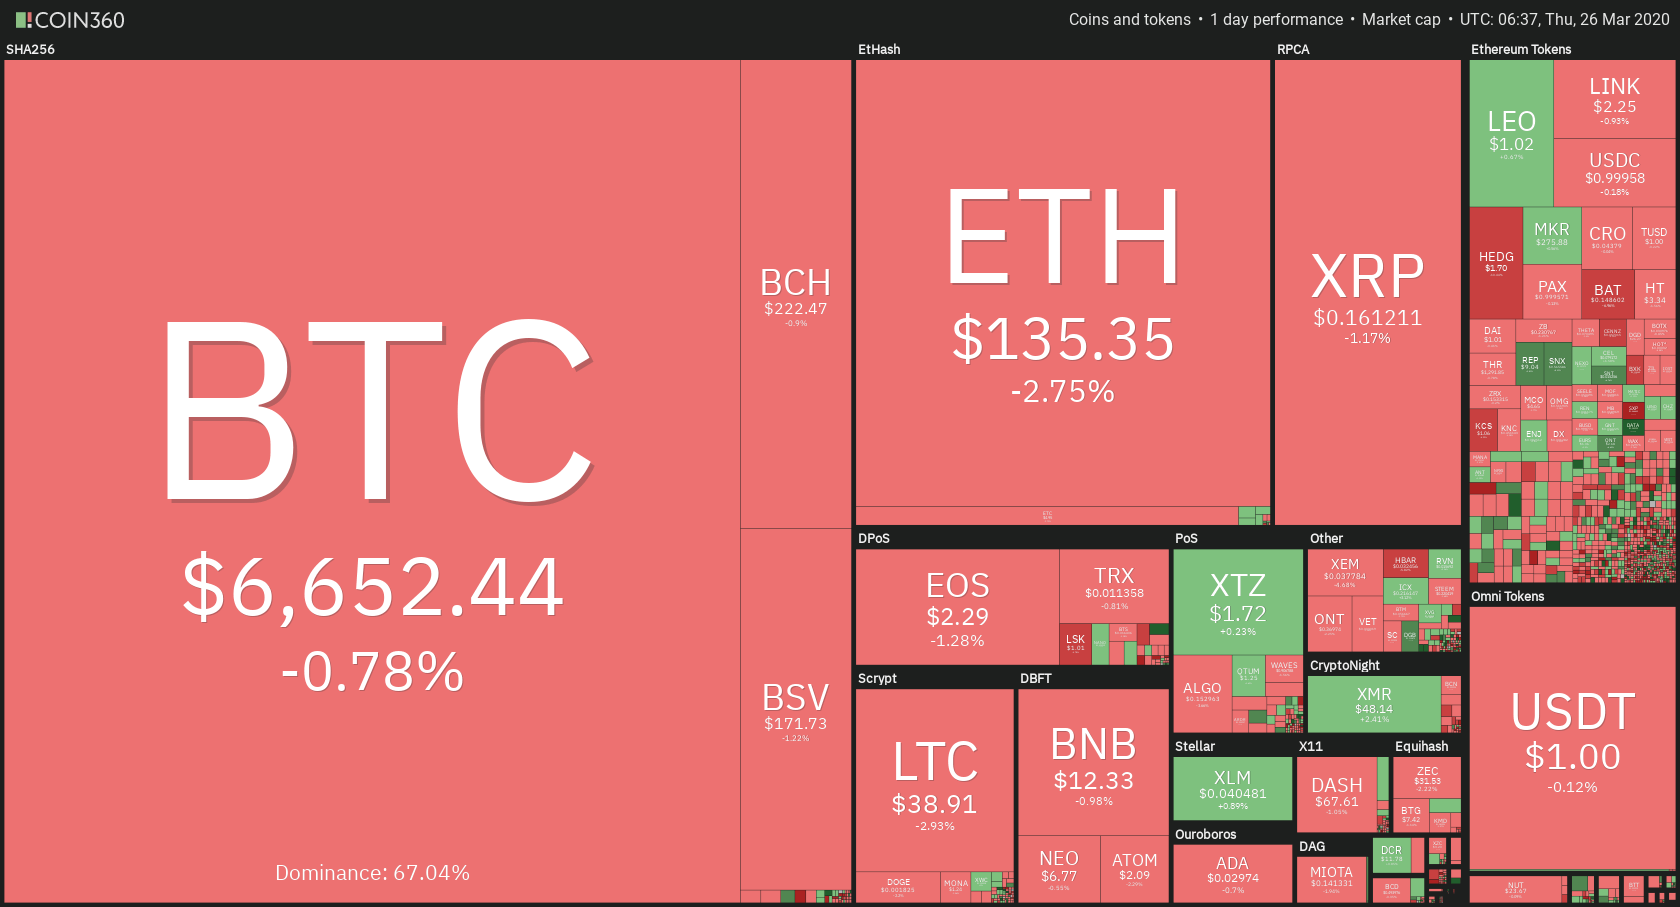
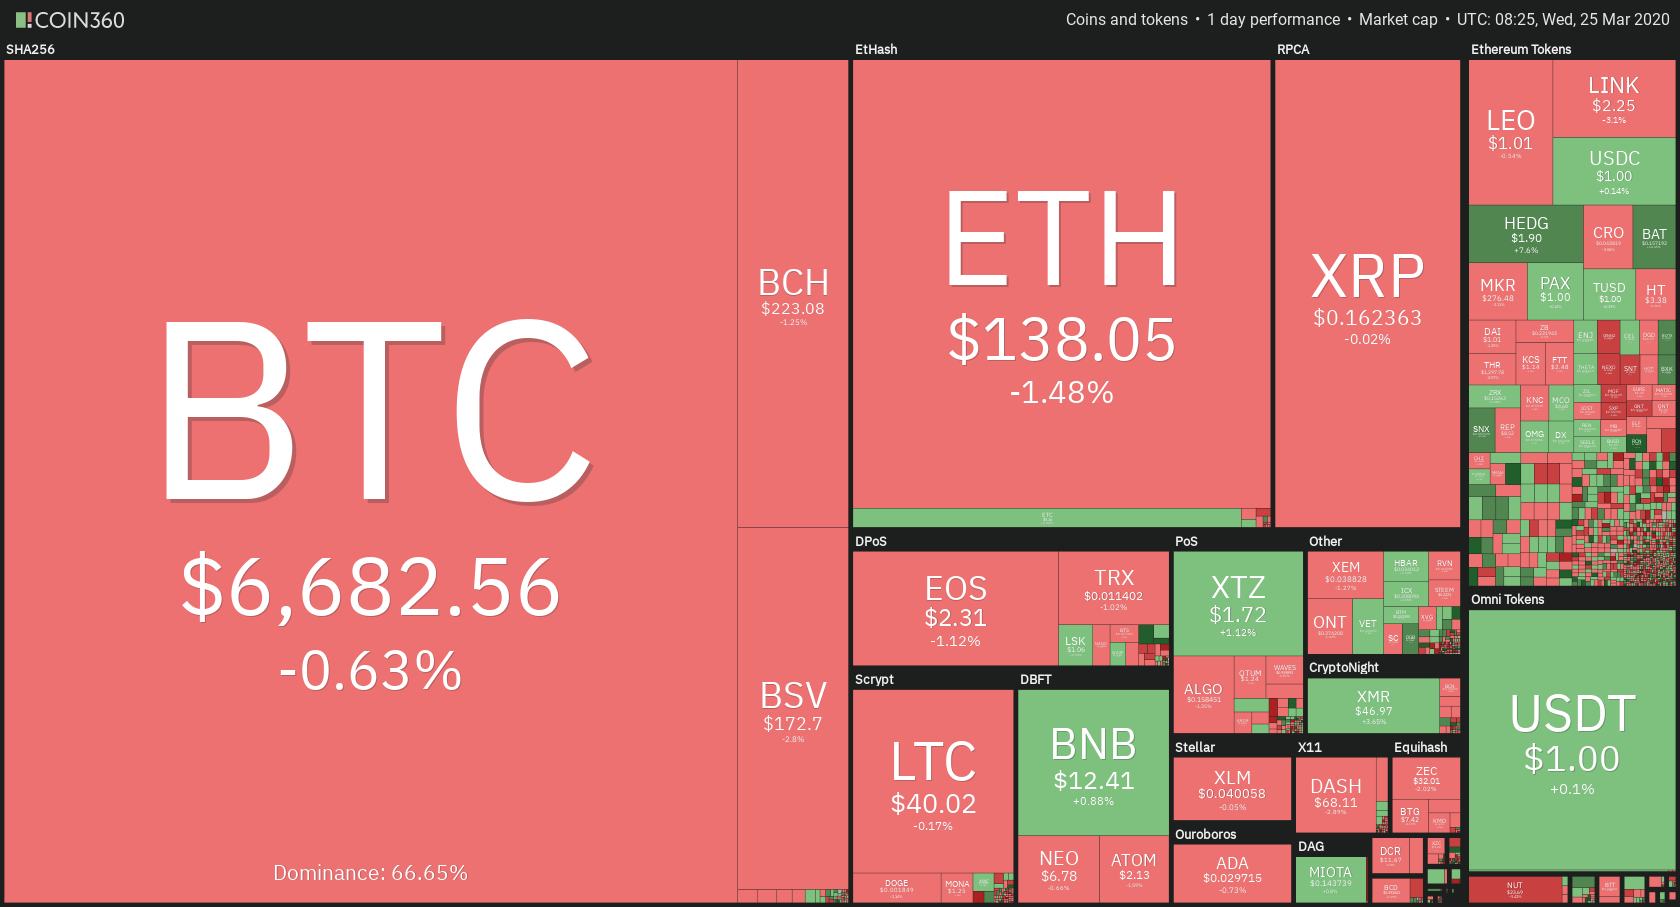
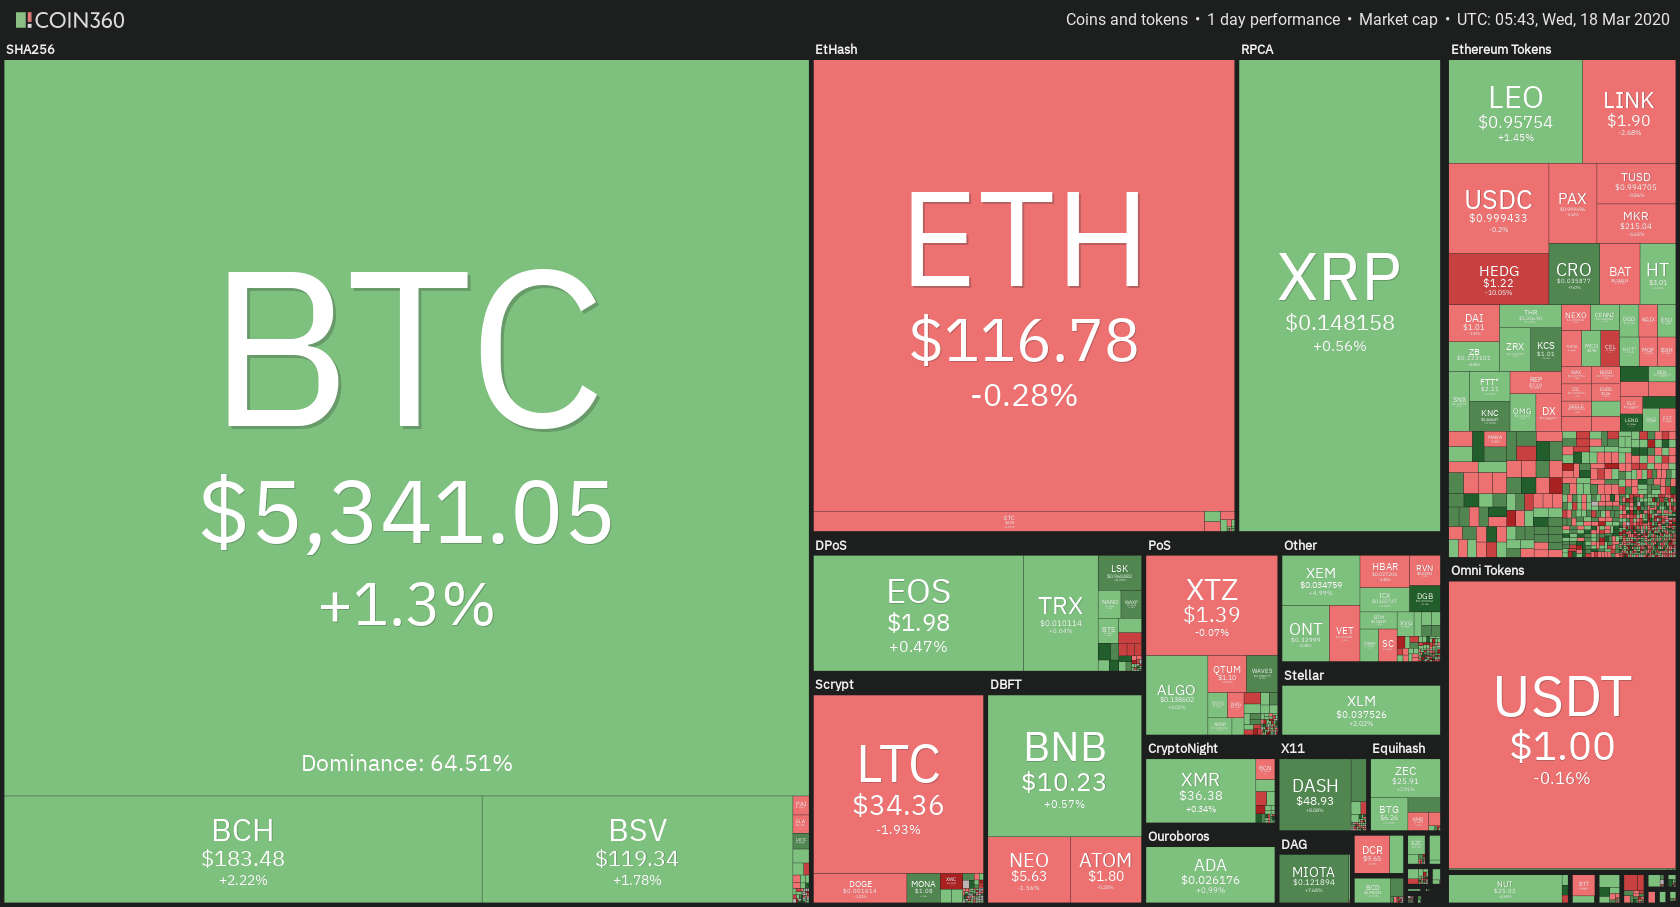
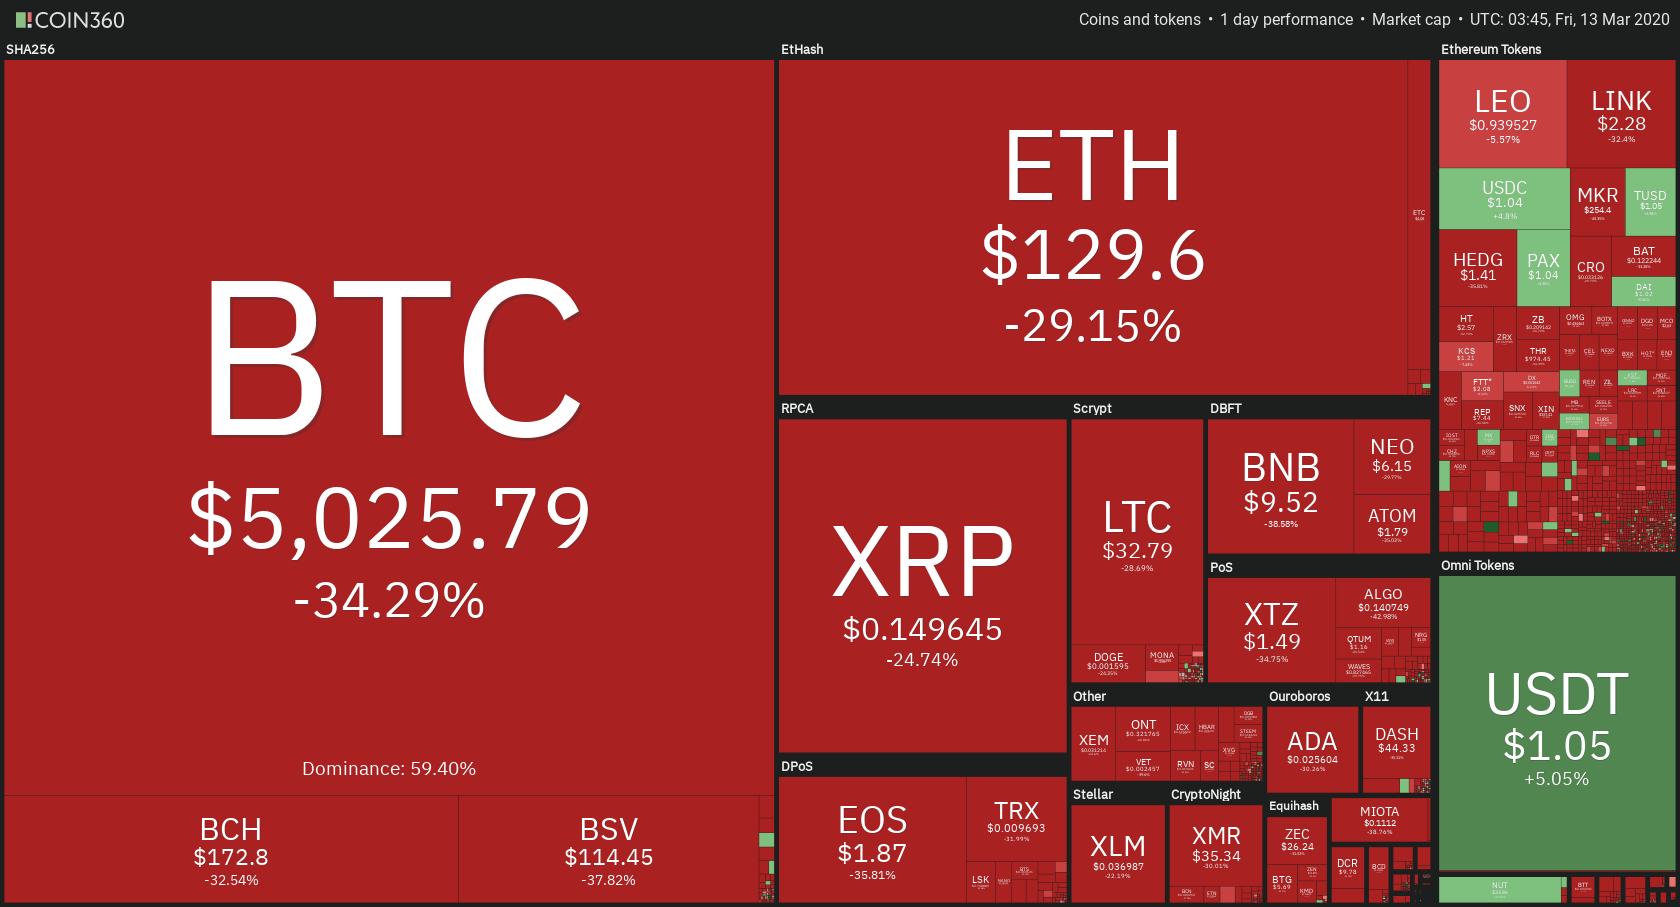
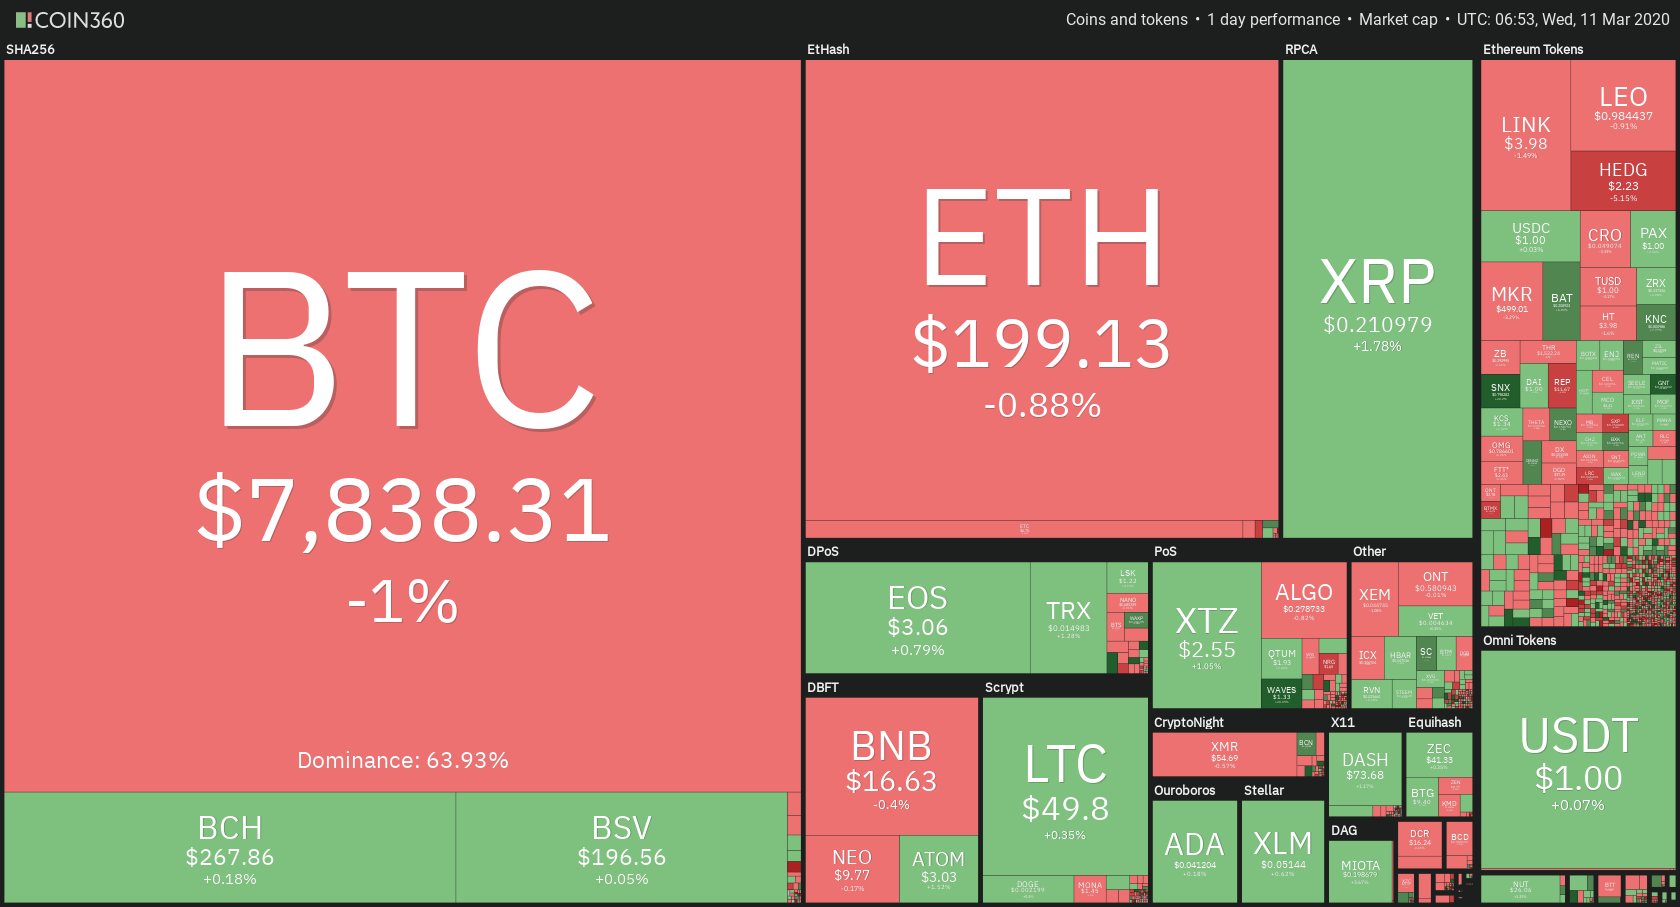
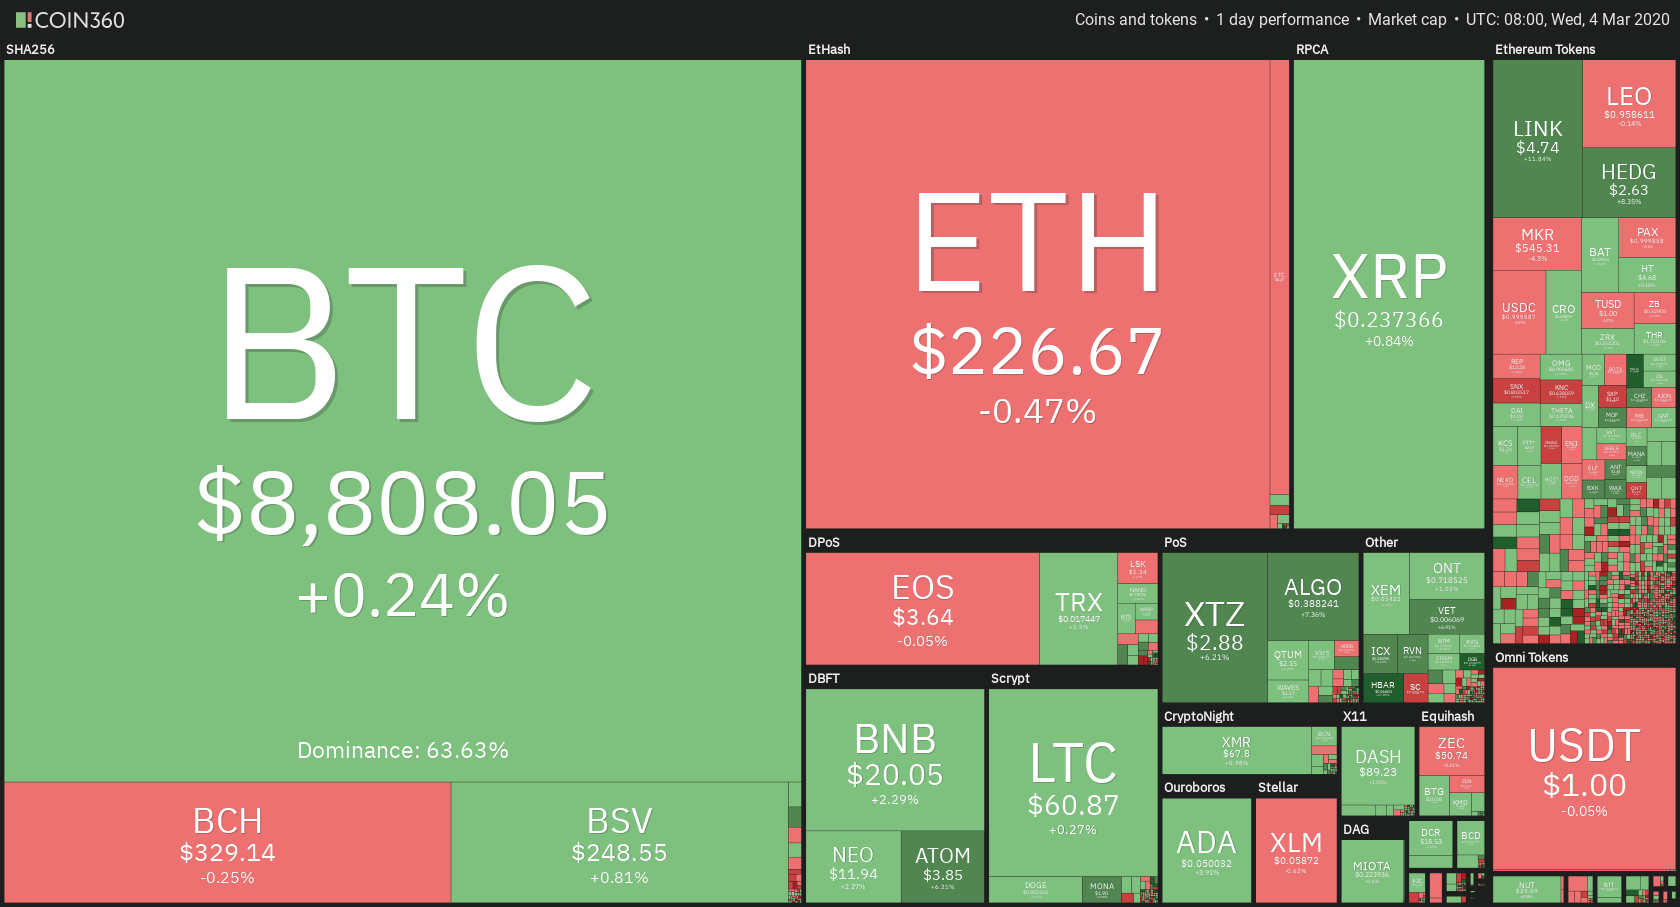
Bitcoin’s dominance increased half a percent in the past 24 hours as it was the one leading the push and gaining the most in value. Its value is now 65.73%, which represents a 0.5% difference to the upside when compared to yesterday.

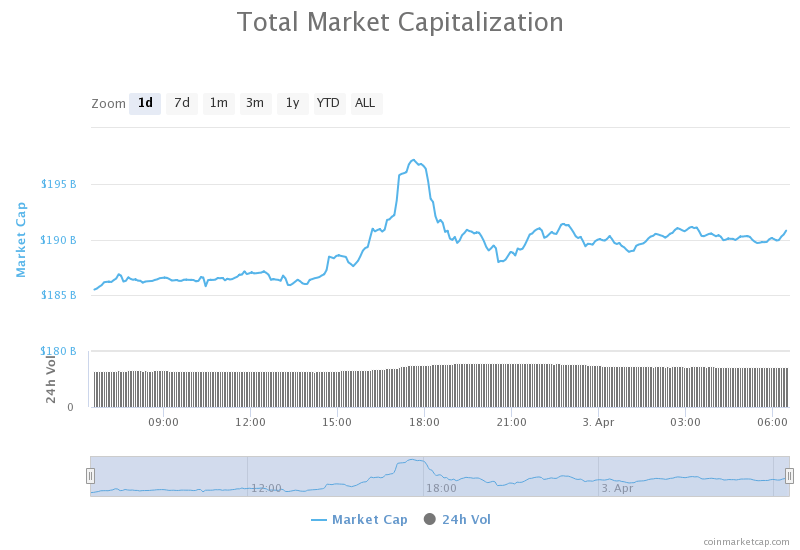
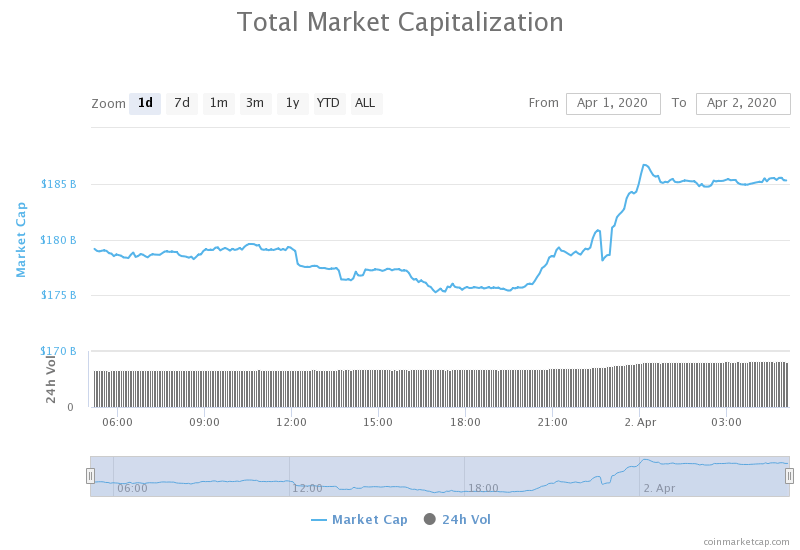
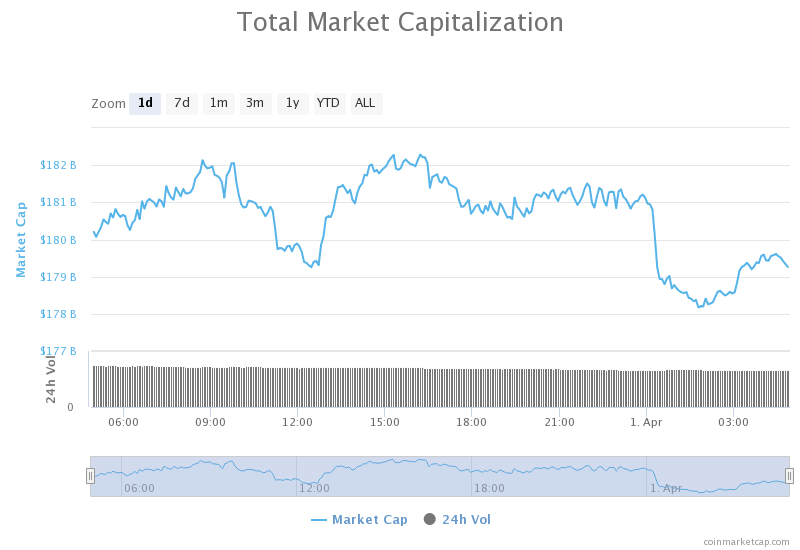
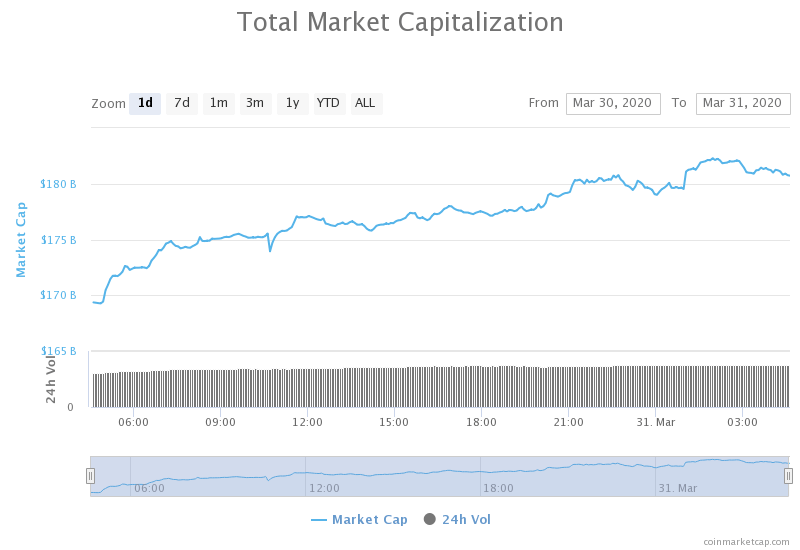
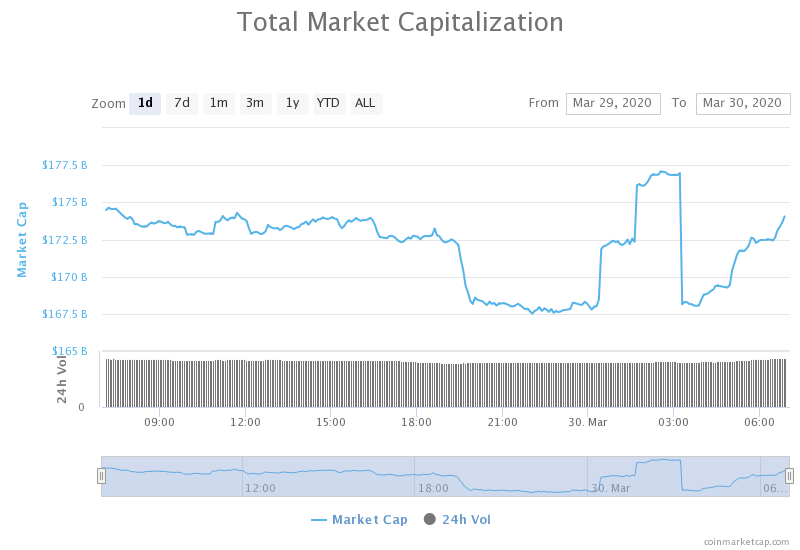
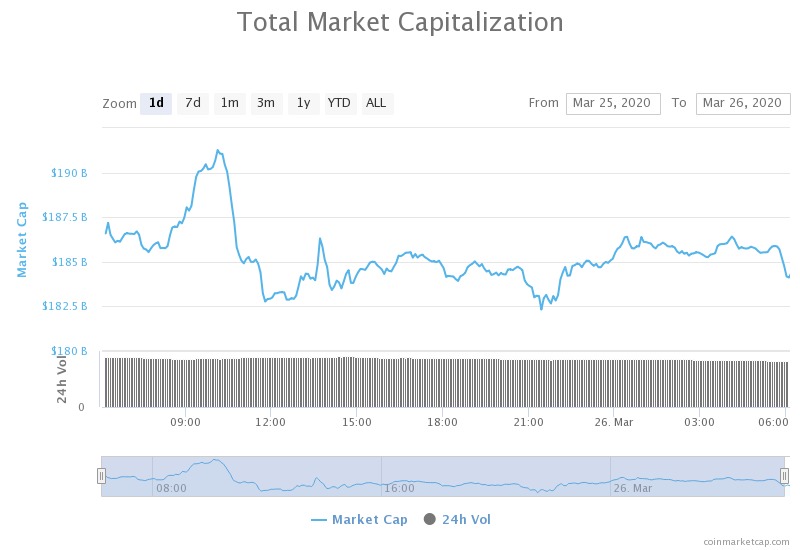
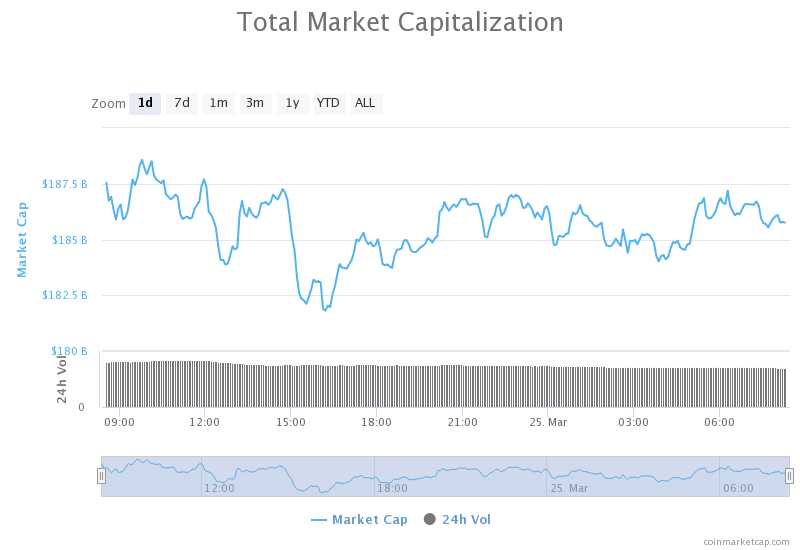
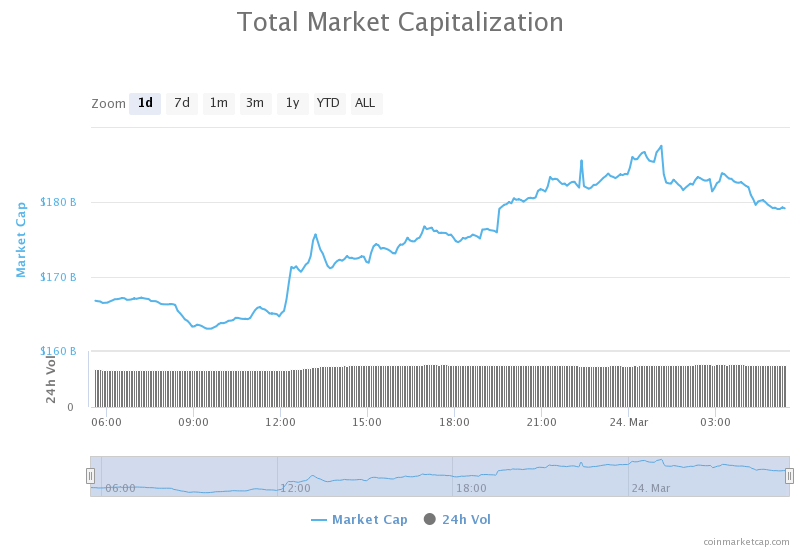
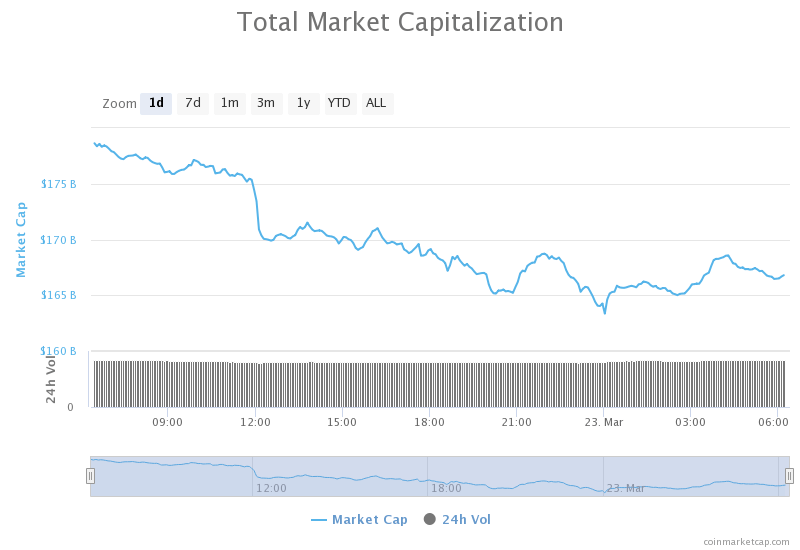
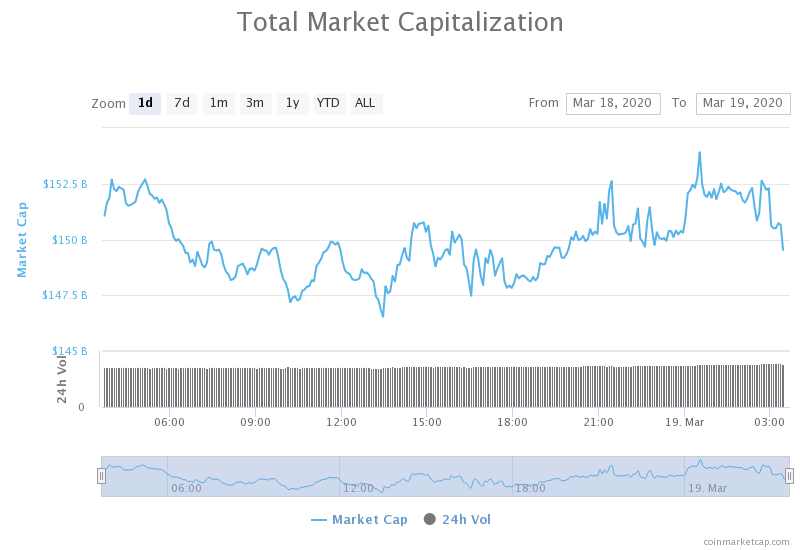
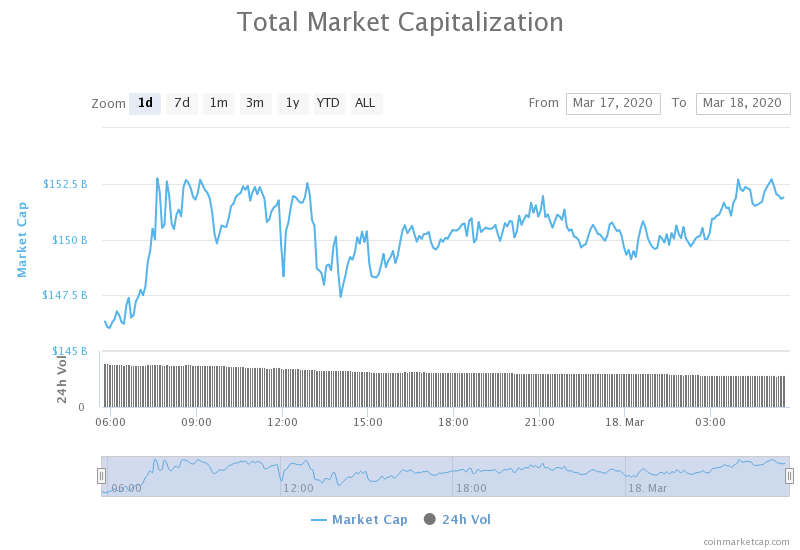
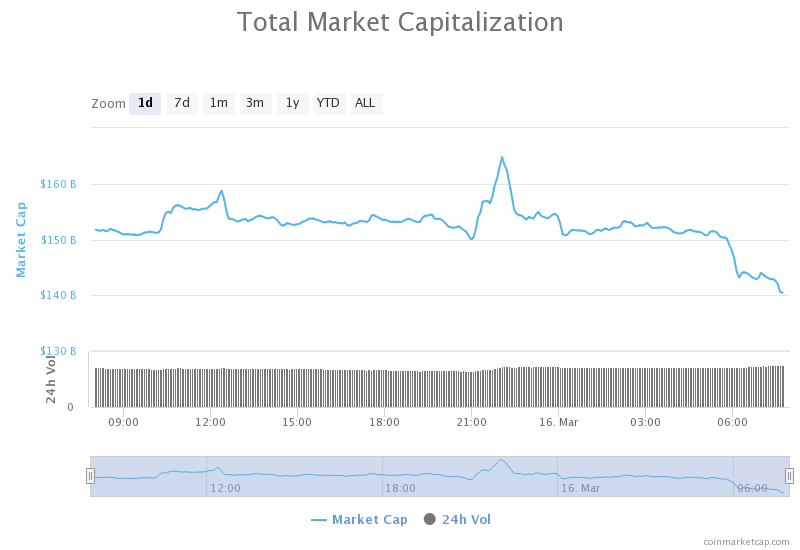
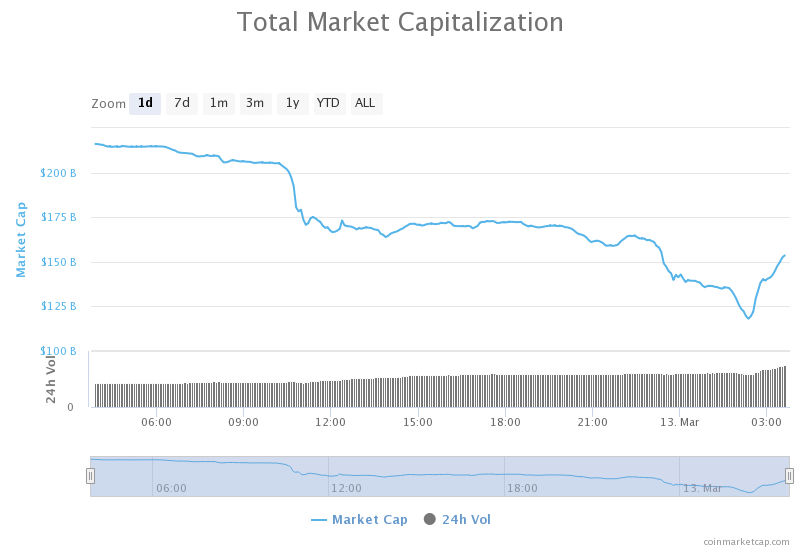
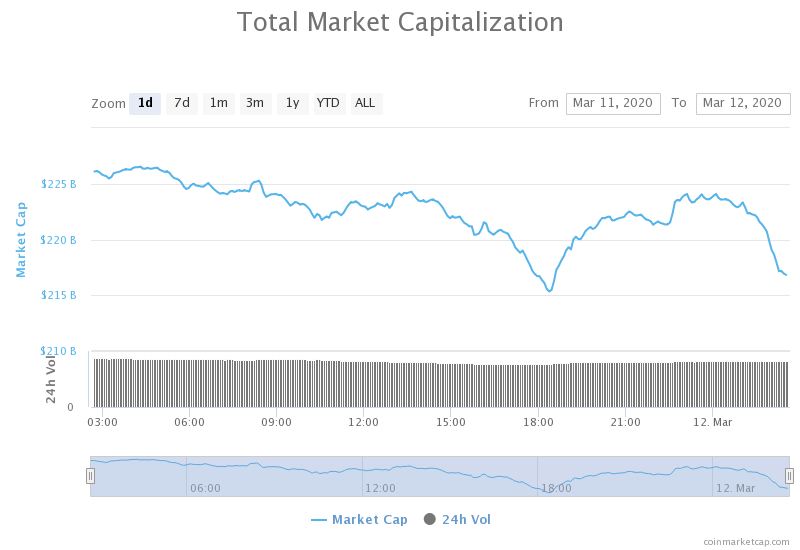
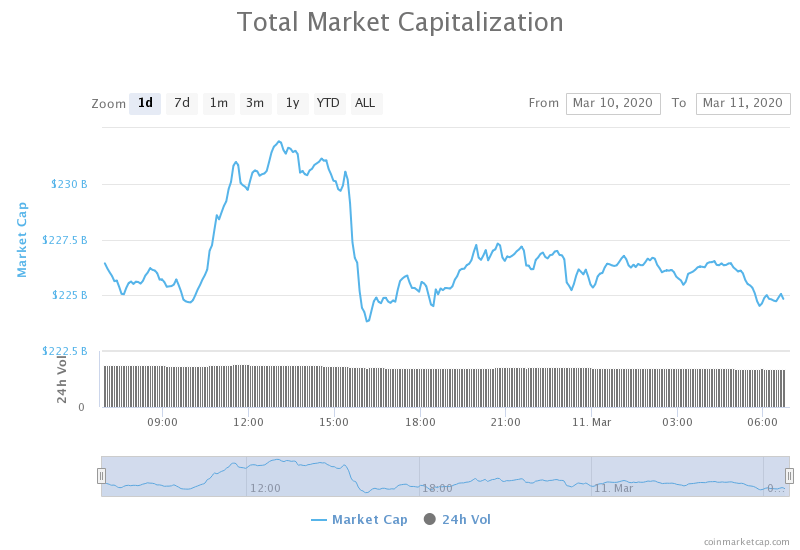
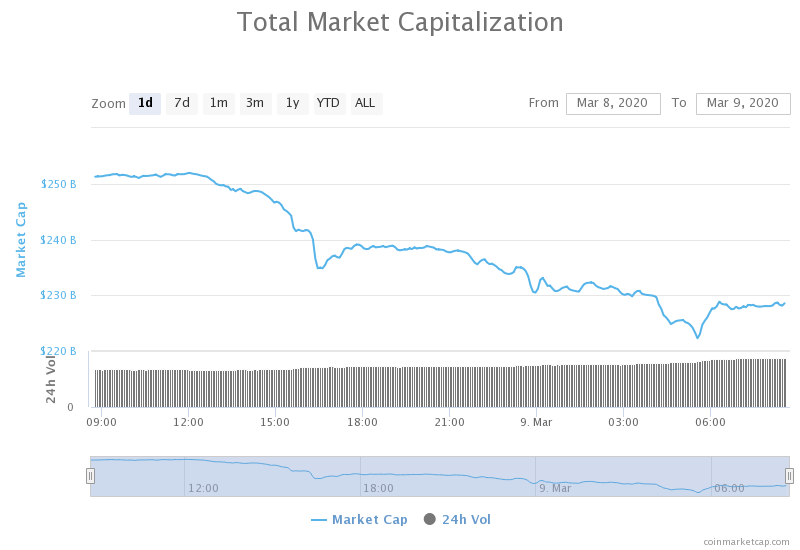
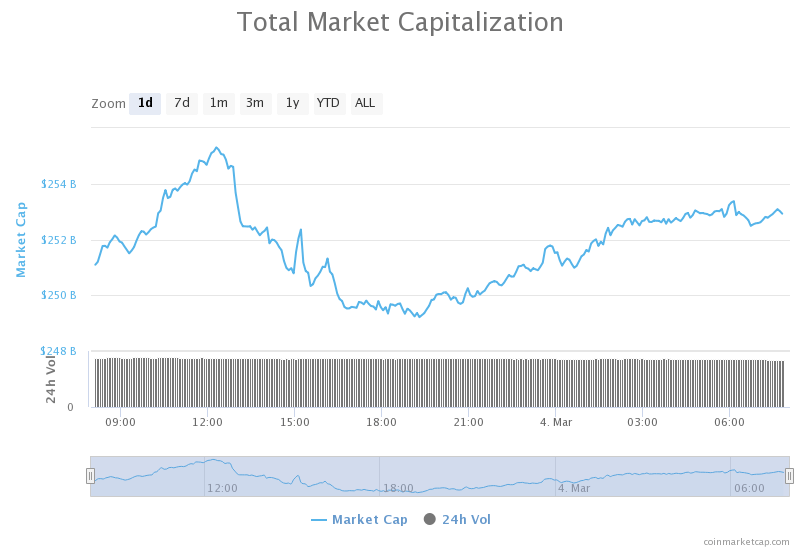
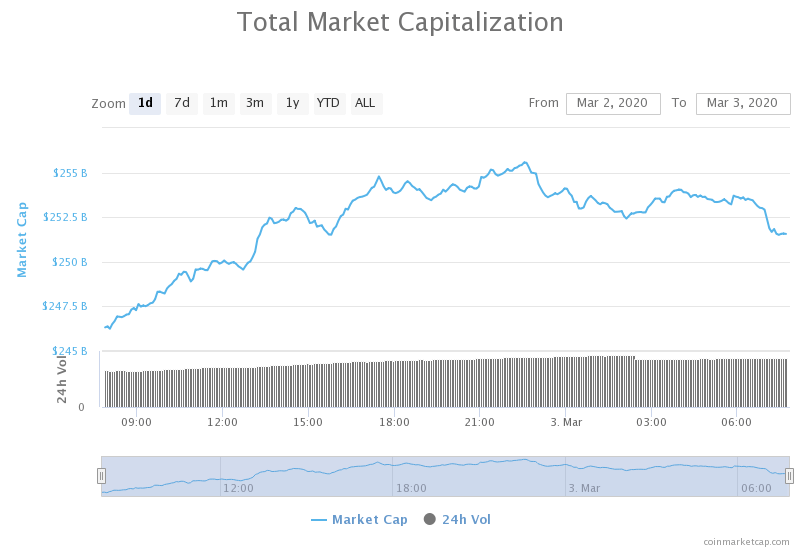
The cryptocurrency market capitalization increased in the past 24 hours. Its current value is $190.79 billion. This value represents an increase of $5.49 billion when compared to the value it had yesterday.

What happened in the past 24 hours

The largest crypto exchange by market volume, Binance, has acquired the most popular crypto indexing website, CoinMarketCap. The purchase was made in secret, which means that the price is still undisclosed.

Binance CEO Changpeng Zhao announced that the deal officially closed March 31, even though a verbal agreement was there “a few months ago.”

Honorable mention

Stellar Lumens (XLM)

The Stellar Development Foundation has shown that it is thinking of the endangered during the times of crisis. It decided to dedicate 2.5 million Lumens to 6 non-profit organizations to help the coronavirus crisis. On top of that, they are very vocal in calling out the community to help.

The foundation will start the initiative off by donating 100,000 Lumens to each of the six charities, while the remaining funds will be used to match the community contributions on a 1-1 basis throughout the month of April.

_______________________________________________________________________

Technical analysis

_______________________________________________________________________

Bitcoin

Bitcoin bulls finally mustered enough strength to reach above the immediate resistance of $6,640, which was contested many times over the past couple of days. The push was gradual rather than sudden, and BTC managed to even contest the next resistance level ($6,850) which held up well. However, one candle brought extreme volume and pushed Bitcoin just below $7,300 just briefly.


Bitcoin’s volume increased when compared to the previous days, while its RSI level is hovering below the overbought territory.

Key levels to the upside                    Key levels to the downside

1: $6,850                                           1: $6,640

2: $7,085                                           2: $5,960

3: $7,420                                            3: $5,000


Ethereum

Ethereum had a clean, steady run to the upside, with its price going from $130 all the way up to $143, where it is trading at the time of writing. The second-largest cryptocurrency by market cap finally had an increase in volume after a long period of low-volume trading. The price, at one point, briefly spiked all the way up to the $150 but was quickly brought back down.


Ethereum’s RSI level is currently in the overbought territory on the 4-hour chart, sitting at around $74. A few resistance levels have been added, but they have not been confirmed as key levels yet.

Key levels to the upside                    Key levels to the downside

1: $168                                                1: $128

2: $178.6                                            2: $122.5 

3: $185                                                3: $100


Ripple

Ever since XRP has left the descending trend, it has been quite stable and upside-oriented. However, its gains did not match the rest of the crypto market. This is the case with today’s gains as well, as XRP gained the least out of the top3 cryptos. However, the move to the upside was steady, and the volume was increased.


XRP’s volume increased multiple times during one 4-hour candle, while it was slightly increased over the rest of the day. Its RSI level is currently at 61.

Key levels to the upside                    Key levels to the downside

1: $0.19                                             1: $0.165

2: $0.2                                               2: $0.147

3: $0.205                                             3: $0.1

Categories
Forex Market Analysis

Daily F.X. Analysis, April 02 – Top Trade Setups In Forex – U.S. Jobless Claims Shares the Stage

On the forex front, the ICE U.S. Dollar Index rose 0.5% on the day, to 99.47, supported by weak but better-than-expected U.S. economic data. On Thursday, the eyes will remain on the European Commission, which is due to report February January PPI (-0.8% on year expected). In the U.K., the Nationwide Building Society will publish its house price index for March (flat on month expected). 

The U.S. Labor Department will post initial jobless claims in the week ended March 28 (3.5 million expected). The Commerce Department will report February trade balance (40 billion dollars deficit expected), factory orders (+0.2% on month expected), and final readings of durable goods orders (+1.2% on month expected).

Economic Events to Watch Today     


EUR/USD – Daily Analysis

The EUR/USD slid 0.7% to 1.0952. Official data showed that the eurozone’s jobless rate fell to 7.3 in February (7.4% expected and in February), while German retail sales grew 1.2% on the month (+0.1% estimated). 

Overall, the market is lacking trading volume and volatility, but the focus will remain on the European economic events. The European Commission will report February January PPI (-0.8% on year expected).

The market risk-off sentiment could more worsen if the U.S. initial jobless claims ignore past expectations, which will send the EUR/USD currency pair to the fresh lowest level. 

Besides the weekly data, the EUR/USD currency pair will likely take clues from the U.S. trade balance and factory orders, which both are scheduled to release during the North American trading hours. The European data calendar seem empty with just Eurozone Producer Price Index, due for release at 09:00 GMT. 

Daily Support and Resistance

  • S1 1.0772
  • S2 1.0886
  • S3 1.0958

Pivot Point 1.0999

  • R1 1.1071
  • R2 1.1112
  • R3 1.1226

EUR/USD– Trading Tips

On Thursday, the EUR/USD is trading bearish at 1.097, having an immediate support level of around 1.0910. On the 4-hour chart, the EUR/USD has violated the support level of 1.0965, which is now working as a resistance. The horizontal breakout support may drive the selling trend in the EUR/USD pair until 1.0845. On the higher side, the EUR/USD pair is facing resistance at 1.1050 area. Bullish crossover of 1.1050 area can open further room for buying until 1.1145 level. Let’s consider taking selling trades below 1.0960 today.


GBP/USD– Daily Analysis

The GBP/USD lost 0.3% to 1.2382. Yesterday, Sterling surged as traders reconciled their portfolios before the end of the first quarter of 2020, although analysts said the currency remained fragile. While than expected, economic events throughout the first quarter continued to weigh on the market’s risk-tone during the early Asian session.

The virus forced the global rating agency Fitch towards taking action on the eighteen United Kingdom Banking sector to reflect the downside risks to their credit profiles. To control the deadly disease, the British policymakers ordered almost 2-million testing kits from China; half of them will come this week, whereas officials are still evaluating the accuracy of kits.

Whereas, Wall Street dropped 4% because President Trump already gave warning to the USA about the painful two weeks ahead. Although, the White House expected that the coronavirus pandemic could take 100,000 to 240,000 lives, even if the U.S. follows social distancing guidelines. 

While the U.S. cases crossed the 200,000 marks, moreover, the Fed also took measures to keep large banks liquid. Looking forward, the U.S. and the U.K. government’s respective policy measures to control the disease will be the major event to watch for near-term direction; the U.S. Jobless Claims will also be essential to watch. 

Later in the day, the U.S. initial jobless claims are scheduled to release at 12:30 GMT. After a record, 3.283 million claims in the week to March 21, the Bloomberg median forecast is for an even more stunning 3.70 million claims were lodged this week. Continuing claims for the week to March 21 are seen jumping from 1.8mn to 4.94mn, which is causing a surge in the safe-haven appeal.

Daily Support and Resistance

  • S1 1.217
  • S2 1.2278
  • S3 1.2334

Pivot Point 1.2387

  • R1 1.2443
  • R2 1.2495
  • R3 1.2604

GBP/USD– Trading Tip

The GBP/USD trade sideways in between the same trading range of 1.2275 – 1.2425. On the 4 hour timeframe, the cable has formed neutral candles as we may not see further trends until and unless the pair manages to come out of this narrow range. For that reason, the pair needs a solid fundamental reason, which we are not expecting from the United Kingdom today. Let’s see if U.S. claims help drive some price action in the market. 

On the 4-hour timeframe, the GBP/USD pair is pretty much likely to find resistance around 1.2470, along with support around 1.2278. In the case of market breaks bellow 1.2278, we may see GBP/USD prices heading into the selling zone until 1.2100 and 1.2005. Whereas, the chances of buying remains solid over 1.2275 until 1.2520.


USD/JPY – Daily Analysis

The USD/JPY is flashing green but reversed almost 30 pips from the early Asian high level. The pair is still struggling to hold its gain above 107.00 due to the greenback, which is exhibiting a fresh mild weakness after moderate recovery in the equity market. However, the slight improvement in the global risk sentiment also weakened the safe-haven Japanese yen and provided some lift to the pair during the early part of Thursday. 

At this moment, the USD/JPY is trading at 107.22 and consolidates in the range between the 107.06 – 107.57. Where, the intensifying fears regarding the economic recession from the coronavirus pandemic and a recent decline in the U.S. Treasury bond yields capped further gains in the pair, instead prompted some fresh selling at higher levels.

On the other hand, Tokyo also reporting a record hit in daily coronavirus (COVID-19) cases extended school holidays through May 06. Recently, Japan’s Economy Minister Nishimura said that we would consider support for production rise and adopting of ECMO as part of the economic plans to combat from the COVID-19.

Daily Support and Resistance

  • S1 105.37
  • S2 106.64
  • S3 107.08

Pivot Point 107.91

  • R1 108.35
  • R2 109.17
  • R3 110.44

USD/JPY – Trading Tips

The USD/JPY is trading at 107.270, consolidating sideways, right above an immediate support level of 107. The USD/JPY’s trading range has narrowed further as it continues to trade within 107.600 – 106.900. We see neutral candles, which may trigger a breakout at any side of the market. But the bullish breakout of 108.650 resistance level can lead the USD/JPY prices higher towards 109.750 level. Until then, we should look for doing choppy trading by selling below 108.600 and buying over 107.250. Below 107.200, the next support will stay around 105.990. All the best for today!  

Categories
Crypto Market Analysis

Daily Crypto Review, Apr 2 – Bitcoin failing to break $6,640; What’s next?

The cryptocurrency market attempted another push towards new highs as Bitcoin bulls tried to get its price above $6,640. Even though most cryptos are in the green, the push was not successful, which may pose a problem in the short term. Bitcoin is currently trading for $6,595, which represents an increase of 4.63% on the day. Meanwhile, Ethereum gained 3.12% on the day, while XRP gained 1.95%.

Digitex Futures took the position of today’s most prominent daily gainer, with gains of 26.06%. IOTA lost 4.53% on the day, making it the most prominent daily loser.

Bitcoin’s dominance increased over half a percent over the past 24 hours as it was the one leading the push and gaining the most in value. Its value is now 65.23%, which represents a 0.54% difference to the upside when compared to yesterday.

The cryptocurrency market capitalization increased in the past 24 hours. Its current value is $185.3 billion. This value represents an increase of $5.8 billion when compared to the value it had yesterday.

What happened in the past 24 hours

Statistics on crypto adoption came out recently, showing that online purchases using Bitcoin went down during Q1 of 2020. However, the same goes for Visa and some other apps. However, crypto exchanges saw a major increase in new accounts in 2020, showing that people are responding to the price drop opportunistically.

What seems to be the case here is that people recognize crypto as a way to hedge their portfolios, so they are investing. However, due to the economic crisis knocking at our doors, people that do not have enough funds simply can’t spend it on online purchases, which is reducing the real-world use cases significantly.

Honorable mention

Ripple

The class-action lawsuit against Ripple had an amendment which includes additional claims of false advertising as well as unfair competition, now claiming that XRP might not be a security.”

The investors’ sixth and seventh claims would appear to be a direct hedge for the event that the judge rules “against” the original suit, basically saying that XRP was an unregistered security, and therefore sold as such.

_______________________________________________________________________

Technical analysis

_______________________________________________________________________

Bitcoin

After a steady day of consolidating, Bitcoin attempted another swift push towards the $6,640 resistance level. Even though the price reached over the level, it was quickly pushed down, announcing the fail of the push. Bitcoin is currently trading just under this key level. If the trend of Bitcoin failing to break the immediate resistances continues, we may expect a retest of the lows very soon.


Bitcoin’s volume almost tripled during the push, but quickly normalized. Its RSI level is now descending and is currently at the value of 59.

Key levels to the upside                    Key levels to the downside

1: $6,640                                           1: $5,960

2: $6,850                                           2: $5,000

3: $7,085                                            3: $4,300


Ethereum

We said yesterday that Ethereum would most likely not move without Bitcoin moving first, therefore deciding its direction. This is exactly what happened today. Ethereum followed Bitcoin to the upside, but only managing to reach its $139 resistance level before stopping the move. This key level held up strong, and ETH did not even manage to go above it.


Ethereum’s volume increased during the upswing but quickly dwindled to its usual low levels. Its RSI level is currently at 60.5.

Key levels to the upside                    Key levels to the downside

1: $168                                                1: $128

2: $178.6                                            2: $122.5 

3: $185                                                3: $100


Ripple

XRP didn’t have as good a day as BTC or ETH did, as its price didn’t increase as much. However, the fact that XRP didn’t go back under the descending trend seems to be good enough. XRP seems to be responding to a level between $0.1765 and $0.1785.


XRP’s volume increased each time the cryptocurrency retested the descending trend line. Its RSI is currently sitting at the value of 56.

Key levels to the upside                    Key levels to the downside

1: $0.19                                             1: $0.165

2: $0.2                                               2: $0.147

3: $0.205                                             3: $0.1

Categories
Forex Market Analysis

Daily F.X. Analysis, April 01 – Top Trade Setups In Forex – Eyes on Advance ADP Figures 

The U.S. dollar failed to keep its momentum, with the Dollar Index marking a day-high of 99.93 before closing down 0.2% on the day to 99.01. Later today, eyes will be on the Markit as it will publish final readings of March Manufacturing PMI for the eurozone (44.6 expected), Germany (45.5 expected), France (42.9 expected), the U.K. (47.0 expected) and the U.S. (48.0 expected). The European Commission will report February jobless rate (steady at 7.4% expected). The German Federal Statistical Office will post February retail sales (+0.1% on month expected). Here’s a technical and fundamental outlook for today.

Economic Events to Watch Today     


EUR/USD – Daily Analysis

The EUR/USD was broadly flat at 1.1027. Official data showed that the eurozone’s CPI grew 0.7% on year in March (+0.8% expected), while the German jobless rate was steady at 5.0% (5.1% estimated). Later today, the eurozone’s February jobless rate (7.4% expected) and German retail sales (+0.1% on month estimated) will be released.

Italy marked as the second-highest country of confirmed cases in the world after the United States (140,470). Total cases are 92,472 confirmed, marking up the highest death rate in the world. 

Today, the manufacturing data are also scheduled to release in this day later. A disappointment on expectations by a big margin will likely send the greenback lower across the board. The European Commission will report February jobless rate (steady at 7.4% expected). The German Federal Statistical Office will post February retail sales (+0.1% on month expected).

Looking forward, all traders now keep their eyes on the German retail sales and manufacturing data, which is scuddled to release on at 06:00 GMT. The coronavirus headlines will take a driver’s seat while investors are likely to hold cash in the form of U.S. dollars due to intensifying coronavirus concerns.

Daily Support and Resistance

  • S1 1.0772
  • S2 1.0886
  • S3 1.0958

Pivot Point 1.0999

  • R1 1.1071
  • R2 1.1112
  • R3 1.1226

EUR/USD– Trading Tips

On Wednesday, the EUR/USD is trading slightly bearish at 1.097, having an immediate support level of around 1.0947. As we can see on the 4-hour chart above, the EUR/USD had formed a bullish channel supported the pair around 1.1060, but has now been violated. The breakout of an upward channel has a huge potential to drive the selling trend in the EUR/USD currency pair.

On the higher side, the EUR/USD pair is facing resistance at 1.1050 area. Bullish crossover of 1.1050 area can open further room for buying until 1.1145 level. Whereas, the chances of a bearish bias will remain strong if the pair closes a 4-hour candle below 1.0950 level today. On the lower side, the target is likely to target 1.0947 and 1.0885. 


GBP/USD– Daily Analysis

The GBP/USD was little changed at 1.2413. A day before, Sterling surged as traders reconciled their portfolios before the end of the first quarter of 2020, although analysts said the currency remained fragile.

However, the worse than expected economic events throughout the first quarter continued to weigh on the market’s risk-tone during the early Asian session.

Today, the US ADP Employment report and the ISM Manufacturing data are scheduled to release in this day later. A miss on expectations by a significant margin will likely send the greenback lower across the board. However, the losses could be temporary, mainly because the coronavirus outbreak is not showing any sign of slowing down with the number of cases in the U.S. continue to rise and reached above 177,000 so far. 

The economic calendar is mostly empty for the U.K.; therefore, the coronavirus updates will keep the driver’s seat until the U.S. session. Moreover, the ADP Employment Change and March month activity numbers from the world’s largest economy will be essential to watch for taking fresh direction.

Daily Support and Resistance

  • S1 1.202
  • S2 1.2208
  • S3 1.2319

Pivot Point 1.2396

  • R1 1.2507
  • R2 1.2584
  • R3 1.2772

GBP/USD– Trading Tip

The GBP/USD hasn’t moved much as it continues trading sideways around within a narrow trading range of 1.2275 – 1.2425. On the 4 hour timeframe, the Cable is forming bullish and bearish candles, showing a tug of war between the bulls and bears. We may not see further trends until and unless the pair manages to come out of this narrow range. In order to do this, the pair needs a solid fundamental reason, which we are not expecting from the United Kingdom.

On the 4-hour timeframe, the GBP/USD pair is pretty much likely to find resistance around 1.2470, along with support around 1.2278. In the case of market breaks bellow 1.2278, we may see GBP/USD prices heading into the selling zone until 1.2100 and 1.2005. Whereas, the chances of buying remains solid over 1.2275 until 1.2520.


USD/JPY – Daily Analysis

The USD/JPY currency pair looking flat and hit the high of 107.95 from the low o 107.25 mainly due to the greenback continue to pick the bids as a safe-haven demand after the report in the U.S. said that experts expecting the virus could kill almost 100,000 and 240,000 Americans despite social distancing measures. 

The USD/JPY got support also from the Bank of Japan’s Tankan corporate survey, which showed Japanese manufacturers turned downbeat for the first time in seven years. The USD/PY is trading at 107.58 and consolidates in the range between the 107.25 – 107.94.

Besides, the risk sentiment in the market is getting worse time by time due to intensifying concerns over the coronavirus (COVID-19). As in result, the USD/JPY pair dropped earlier as JPY was getting strong bids due to its safe-haven demand while the U.S. dollar strength was supporting the pair to stay bullish. 

As per the latest report, the coronavirus outbreak is not showing any sign of slowing down with the number of cases in the U.S. continue to rise and reached above 177,000 so far. The coronavirus cases continue to increase in Europe, with Spain and Italy reporting a total of 200,000 cases so far.

The U.S. President Trump was increasing the possibilities of another major infrastructure package or some $2trn within the next relief bill. At the same time, the Democratic House Speaker, Nancy Pelosi, also declared that the United States should start developing and discussing the 4th stimulus bill. Thus, the USD/JPY pair can trade bearish in the wake of a weaker dollar and stronger yen.

Daily Support and Resistance

  • S1 105.37
  • S2 106.64
  • S3 107.08

Pivot Point 107.91

  • R1 108.35
  • R2 109.17
  • R3 110.44

USD/JPY – Trading Tips

On Wednesday, the USD/JPY is trading at 107.570, consolidating sideways, right above an immediate support level of 107.200. The USD/JPY’s trading range remains narrow as the upper limit stays at 108.500, and the lower limit rests at 107.150. 

We see neutral candles, which may trigger a breakout at any side of the market. But the bullish breakout of 108.650 resistance level can lead the USD/JPY prices higher towards 109.750 level. Until then, we should look for doing choppy trading by selling below 108.600 and buying over 107.250. Below 107.200, the next support will stay around 105.990. All the best for today!  

Categories
Crypto Market Analysis

Daily Crypto Review, Apr 1 – Crypto Outperforming Traditional Markets in Q1

The cryptocurrency market had a pretty stable day as most cryptos consolidated within previously achieved levels. Bitcoin is currently trading for $6,341, which represents a decrease of 1.23% on the day. Meanwhile, Ethereum gained 1.08% on the day, while XRP gained 1.13%.

ICON took the position of today’s most prominent daily gainer, with gains of 15.80%. Nervos Network lost 8.51% on the day, making it the most prominent daily loser.

Bitcoin’s dominance dropped almost a whole percent over the past 24 hours. Its value is now 64.69%, which represents a 0.78% difference to the downside when compared to yesterday.

The cryptocurrency market capitalization did not move much throughout the day. Its current value is $179.50 billion. This value represents a decrease of $0.41 billion when compared to the value it had yesterday.

What happened in the past 24 hours

Digital payments company PayPal posted a new job listing, where it seeks to hire an Anti-Money-Laundering and Blockchain Strategy director that will work in their Global Financial Crimes (GFC) division.

The new director, which will be based in New York, will be in charge of evaluating the use cases of blockchain for the prevention of financial crimes.

Honorable mention

Bitcoin vs. the Traditional markets

April 1 brings us to the Q2 2020, as well as reports and analyses on how assets performed in Q1. Nikkei 225 was down 20%, which represents the worst quarter since 2008. The FTSE fell 14% for the period, which its second-worst quarterly performance ever. The S&P 500 lost 18% to close out Q1 2020, which is its worst quarterly performance since 1938.

While cryptocurrencies operate 24/7 and don’t exactly have quarters, it is important to look at them as well and compare the crypto market’s performance with the performances of other assets. The crypto market was down just 10% for 2020’s first three months, which is significantly less than the aforementioned traditional markets.

However, despite its relative resilience, bitcoin (and the rest of the market) has been trending downward along with traditional markets, which shows some form of correlation. This correlation across all assets can be explained by the saying that “macro matters more than micro.”

_______________________________________________________________________

Technical analysis

_______________________________________________________________________

Bitcoin

Bitcoin had a pretty stable day as there was no real volume to push the price up or down. The largest cryptocurrency by market cap still trades within a range, bound by $6,640 to the upside and $5,960 to the downside. As the price could not break the resistance level, we can expect a slow decline towards the support level if nothing changes on a macro level.


Bitcoin’s volume was steady and low in the past 24 hours. Its RSI level is currently at the value of 50.

Key levels to the upside                    Key levels to the downside

1: $6,640                                           1: $5,960

2: $6,850                                           2: $5,000

3: $7,085                                            3: $4,300


Ethereum

Ethereum spent the day with virtually no fluctuations. Its chart is mostly consisting of doji candles, hammer and inverted hammer candles, meaning that there is low volume, as well as great price direction indecisiveness. Ethereum gained just slightly over 1% on the day, which was just catching up to Bitcoin’s gains, which happened the day before. Ethereum most likely won’t move without Bitcoin moving first and deciding its direction.


Ethereum’s volume is extremely low, while its RSI value is currently at 53.

Key levels to the upside                    Key levels to the downside

1: $168                                                1: $128

2: $178.6                                            2: $122.5 

3: $185                                                3: $100


Ripple

XRP had a great day, even though its price gains do not show it. The third-largest cryptocurrency managed to get out of the descending range, which it was in for around a week. The price broke the upper trend line and then successfully retested the line, which held well.


XRP’s volume increased greatly during the retest of the trend line, while the rest of the day passed without much volume. Its RSI is currently at 54.

Key levels to the upside                    Key levels to the downside

1: $0.19                                             1: $0.165

2: $0.2                                               2: $0.147

3: $0.205                                             3: $0.1

Categories
Forex Market Analysis

Daily F.X. Analysis, March 31 – Top Trade Setups In Forex – Consumer Confidence Under Spotlight! 

On Tuesday, the market is mostly focusing on the major and medium impact economic events due to come out from the Eurozone and the United States. In the U.S., the Conference Board will publish March Consumer Confidence Index (110.0 expected). The Market News International will release March Chicago PMI (40.0 expected). S.P./Case-Shiller will report the 20-City Composite Home Price Index for January (+0.4% on month expected). 

Economic Events to Watch Today     


EUR/USD – Daily Analysis

The EUR/USD retreated 1.0% to 1.1029, snapping a five-day rally. Official data revealed that the eurozone’s Economic Confidence Index slid to 94.5 in March (91.6 expected) from 103.4 in February. 

Later today, the eurozone’s March CPI (+0.6% on-year estimated) and German jobless rate (5.1% expected, 5.0% in February) will be reported. The global equities recovered last week, as in result, the greenback weakened its bid tone and helped EUR/USD rise from 1.0636 to 1.1148. 

That was mainly due to the U.S. Federal Reserve declaring an open-ended asset purchase program, and the U.S. Senate passed a special $2 trillion fiscal relief package. 

Italy marked as the second-highest country of confirmed cases in the world after the United States (105,470). Total cases are 92,472 confirmed, marking up the highest death rate in the world. 

The eyes will be on the risk market sentiment, which could turn pro-risk, as the China data released in Asia showed the manufacturing activity recovered sharply to above-50 levels or expansion territory.

The risk-on rally could weaken the safe-haven demand for the U.S. dollar and send EUR/USD higher. On the data front, the German Import Price Index for February and the Unemployment Rate is scheduled to release with the preliminary Eurozone Consumer Price Index for March. Besides this, the U.S. Consumer Confidence and the Chicago Purchasing Managers’ Index are also scheduled to release.

Daily Support and Resistance   

  • S1 1.0862
  • S2 1.0958
  • S3 1.1002

Pivot Point 1.1054

  • R1 1.1099
  • R2 1.1151
  • R3 1.1247

EUR/USD– Trading Tips

Technically, the EUR/USD is trading slightly bearish at 1.099, having an immediate support level of around 1.0947. The major currency pair has formed a bullish channel which is supporting the EUR/USD pair around 1.1060, and below this, the next support is likely to be found around 1.1000. 

On the higher side, the EUR/USD pair is facing resistance at 1.1150 area. Bullish crossover of 1.1060 area can open further room for buying until 1.1185 level. Whereas, the chances of a bearish bias will remain strong if the pair continues to hold below 1.1060 level today. On the lower side, the target is likely to stay at 1.0947 and 1.0885. 


GBP/USD– Daily Analysis

The GBP/USD dropped 0.7% to 1.2364. We haven’t seen much movement in the GBP/USD as the United Kingdom continues to struggle efforts and seems very close to open the world’s biggest hospital, which built-in 10-days. They are also ordering approximately 15,000 ventilators more while saying that it needs to cope with the coronavirus outbreak.

The global news agency, Guardian, indicates the risk for the European Union citizens who have made their houses in the U.K. illegally. Whereas, Dr. Jenny Harries, deputy chief medical officer for England, said during his daily press conference on Sunday that the current limitations and lockdowns in the U.K. could continue for six months.

At the USA front, U.S. President Donald Trump did not suggest the overall lockdown in the country and said no to nationwide stay-at-home order while helping to continue the previous day’s risk-on tone. As in result, the U.S. ten-year treasury yields and most Asian stocks flashing green and mark moderate gains by the press time.

Looking forward, the final figures of the U.K.’s fourth quarter (Q4) GDP, expected to march 0.0% initial forecast, will likely offer fresh direction ahead of the U.S. data. However, news regarding the Brexit and the virus updates will be kay to watch.

Daily Support and Resistance

  • S1 1.2131
  • S2 1.2256
  • S3 1.2319

Pivot Point 1.238

  • R1 1.2444
  • R2 1.2505
  • R3 1.263

GBP/USD– Trading Tip

Technically, the GBP/USD is trading sideways around within a narrow trading range of 1.2275 – 1.2425. Since the Sterling has already crossed over 1.2275 resistance area, this is now going to work as a support. The MACD is still heading into the bullish zone, suggesting strong chances of buying the GBP/USD pair.

On the 4 hour timeframe, the GBP/USD pair is pretty much likely to find resistance around 1.2520, along with support around 1.2278. In the case of market breaks bellow 1.2278, we may see GBP/USD prices heading into the selling zone until 1.2100 and 1.2005. Whereas, the chances of buying remains solid over 1.2275 until 1.2520.


USD/JPY – Daily Analysis

The USD/JPY currency pair found on the bullish track and rose to 108.72, mainly because the risk sentiment remains positive. The slight recovery in the greenback also keeps the pair higher. Elsewhere, the traders gave a little attention to Japan’s data-dump. 

Right now, the USD/JPY is currently tradings at 108.52 and consolidates in the range between the 107.78 – 108.72. However, the currency pair also took from the U.S. policymaker’s statement.

At the data front, Japan’s February month data dump, including Retail Sales, Industrial Production and Unemployment Rate, overall flashed upbeat signals. Whereas the Retail Sales (YoY) surprised markets by crossing -1.2% forecast to 1.7%, the preliminary figures of Industrial Production (MoM) also increased above 0.1% expected to 0.4%. While the Unemployment Rate remained stable at 2.4% with Job/Applicants Ratio returning below 1.47 forecast to 1.45.

At the U.S. economic front, U.S. President Donald Trump did not suggest the total lockdown in the country and suggested no to nationwide stay-at-home order while helped to continue the previous day’s risk-on tone. As in result, the U.S. ten-year treasury yields gain 5-basis points (bps) to 0.72%, and most Asian stocks flashing green and mark moderate gains by the press time. Consequently, the USD/JPY pair is exhibiting bullish and bearish biases both. Let’s look at the technical side. 

Daily Support and Resistance

  • S1 105.89
  • S2 106.85
  • S3 107.35

Pivot Point 107.82

  • R1 108.31
  • R2 108.79
  • R3 109.76

USD/JPY – Trading Tips

Technically, the USD/JPY is trading at 108.270, heading north to examine the resistance level of around 108.615. At the moment, the USD/JPY pair is consolidating within a narrow range, where the upper limit is 108.500, and the lower limit stays at 107.150. 

The USD/JPY may face a bullish pressure in the wake of the bullish engulfing candle, which has been formed on the 4-hour chart around 108.500 area. Such a pattern represents the dominance of bulls in the market. Consequently, the bullish breakout of 108.650 resistance level can lead the USD/JPY prices higher towards 109.750 level. Until then, we should look for doing choppy trading by selling below 108.600 and buying over 107.250. All the best for today!  

Categories
Crypto Market Analysis

Daily Crypto Review, Mar 31 – Opera browser openly supporting crypto; Markets in the green as BTC pushes towards $6,640

The cryptocurrency market has recovered from the downside push as Bitcoin regained strength and reconquered $6,000. In the past 24 hours, almost every single crypto was in the green. Bitcoin is currently trading for $6,419, which represents an increase of 6.53% on the day. Meanwhile, Ethereum gained 3.21% on the day, while XRP gained 2.4%.

Energi took the position of today’s most prominent daily gainer, with gains of 18.77%. There were no big losers on the other side as only two cryptos out of the top100 managed to be in the red. Status lost 1.444% on the day, making it the most prominent daily loser.

Bitcoin’s dominance dropped half a percent over the past 24 hours. Its value is now 65.47%, which represents a 0.56% difference to the downside when compared to yesterday.

The cryptocurrency market capitalization steadily increased over the course of the day. Its current value is $180.91 billion. This value represents an increase of $6.9 billion when compared to the value it had yesterday.

What happened in the past 24 hours

A web browser Opera now enables its users to access decentralized web pages with the .crypto domain extension. They made it possible through a partnership with Unstoppable Domains. This will allow users to access and surf decentralized websites, as well as to make cryptocurrency payments.

Honorable mention

Tron

Tron (TRX) founder Justin Sun posted a tweet announcing the release of Djed on Mar 28. Djed is a system for collateralized loans that he described as “something new.” However, the Djed platform was immediately criticized by the market as many think it is a copy of MakerDAO (MKR).

_______________________________________________________________________

Technical analysis

_______________________________________________________________________

Bitcoin

Bitcoin quickly and efficiently recovered from its most recent push down as its price regained previous levels. The largest cryptocurrency by market capitalization went over $6,000 yesterday, while it established its position today and even made a push towards new highs (namely the immediate resistance of $6,640). However, the push failed due to a lack of volume. Bitcoin’s future is still uncertain mostly due to external difficulties the world is facing rather than Bitcoin’s internal problems.


Bitcoin’s volume was somewhat higher than yesterday, but still at low levels. Its RSI level on the 4-hour chart is just above the middle of the range.

Key levels to the upside                    Key levels to the downside

1: $6,850                                           1: $5,960

2: $7,085                                           2: $5,000

3: $7,420                                            3: $4,300


Ethereum

Bitcoin’s downturn pushed Ethereum below the $128 support level, but as Bitcoin recovered, so did Ethereum. The second-largest cryptocurrency by market cap regained its previous support level and pushed higher up. The lack of volume prevented it from even reaching the $139 resistance level, forcing the price to consolidate within the range. Ethereum will most likely keep following Bitcoin’s price movements in the short term.


Ethereum’s volume is currently lower than the previous week’s volume, as well as overall. Its RSI level is just below the mid-range, with a value of 49.

Key levels to the upside                    Key levels to the downside

1: $168                                                1: $128

2: $178.6                                            2: $122.5 

3: $185                                                3: $100


Ripple

XRP passed over the $0.165 resistance level over the weekend, which was a great milestone towards establishing a stable price. However, the most recent downturn brought its price below this key level yet again. XRP quickly recovered and regained $0.165 as Bitcoin increased in price and pulled the whole market with it. However, the short-term future does not look good for XRP if it keeps trading within the descending range, making lower lows and lower highs.


XRP’s volume is on the same level as it was the previous week, while its RSI level is slowly descending. At the time of writing, its RSI has a value of 50.5.

Key levels to the upside                    Key levels to the downside

1: $0.19                                             1: $0.165

2: $0.2                                               2: $0.147

3: $0.205                                             3: $0.1

Categories
Forex Market Analysis

Daily F.X. Analysis, March 30 – Top Trade Setups In Forex – German Inflation Figures Ahead! 

The U.S. Dollar Index slid 0.9% on the day to 98.36 on Friday, wiping out most of its gains made in the prior week. During the day ahead, eyes will be on the European Commission will report the Eurozone’s March Economic Confidence Index (93.1 expected) and final readings of the Consumer Confidence Index (-11.6 previously).

The German Federal Statistical Office will post March CPI (+1.4% on-year expected). The Bank of England will release the number of mortgage approvals in February (68,200 expected) and the M4 money supply.

Economic Events to Watch Today    


EUR/USD – Daily Analysis

The EUR/USD jumped 1.0% to 1.1142, posted a five-day rally. Later today, the eurozone’s March Economic Confidence Index (93.1 expected) and German CPI (+1.4% on-year estimated) will be reported.

A series of economic fundamentals drove the pair, and even today market is likely to move on news. In particular, the U.S. initial jobless claims are expected to have risen to 1,000K from the preceding week’s 281K figure in the week ended March 20. The European Union’s upcoming emergency meeting to discuss further steps to combat the virus will be essential to watch. 

Global equities recovered last week, as in result, the greenback weakened its bid tone and helped EUR/USD rise from 1.0636 to 1.1148. That was mainly due to the US Federal Reserve declaring an open-ended asset purchase program, and the US Senate passed a special $2 trillion fiscal relief package. 

At the coronavirus front, Italy marked as the second-highest country of confirmed cases in the world after the United States (105,470). Total cases are 92,472 confirmed, marking up the highest death rate in the world. 

Looking forward, the traders will keep their eyes on the Eurozone consumer and business sentiment indices, which are scheduled to release along with the preliminary German Consumer Price index for March. Apart from this, the eyes will be on the Pending Home Sales and the Dallas Fed Manufacturing Index for taking near-term directions.

Daily Support and Resistance

  • S1 1.0673
  • S2 1.0835
  • S3 1.0935

Pivot Point 1.0997

  • R1 1.1097
  • R2 1.1159
  • R3 1.1321

EUR/USD– Trading Tips

On Monday, the direct currency pair EUR/USD is trading slightly bearish at 1.1025, having an immediate support level of around 1.0947. The major currency pair has formed a bullish channel which is supporting the EUR/USD pair around 1.1060, and below this, the next support is likely to be found around 1.1000. 

On the higher side, the EUR/USD pair is facing resistance at 1.1150 area. Bullish crossover of 1.1150 area can open further room for buying until 1.1195 level. Whereas, the chances of a bearish bias will remain strong if the pair continues to break below 1.1060 level today. On the lower side, the target is likely to stay at 1.0947 and 1.0885. 

GBP/USD– Daily Analysis

The GBP/USD surged 2.1% to a two-week high of 1.2457. The Bank of England (BOE) failed to offer any fireworks due to a lack of resources while disappointing U.K. Retail Sales, to 0.0% from 0.8% YoY forecast, also couldn’t recall the bears.

Guardian indicates the risk for the European Union citizens who have made their houses in the UK illegally. Whereas, Dr. Jenny Harries, deputy chief medical officer for England, said during his daily press conference on Sunday that the current limitations and lockdowns in the UK could continue for six months.

On the other hand, the United States President Donald Trump expects the virus figures to grow sharply in the next 2-weeks if they do not take lockdown seriously. As in result, the market’s risk-tone continues to flash red, with the US 10-year treasury yields declining below 0.70% and most Asian stocks marking losses by the press time.

Looking forward, the U.S. Dallas Fed Manufacturing and Pending Home Sales will be a key watch. Besides, the traders will also keep eyes on the virus headlines.

Daily Support and Resistance

  • S1 1.1678
  • S2 1.2019
  • S3 1.2234

Pivot Point 1.236

  • R1 1.2576
  • R2 1.2701
  • R3 1.3042

GBP/USD– Trading Tip

Technically, the GBP/USD is trading sideways around within a narrow trading range of 1.2275 – 1.2425. Since the Sterling has already crossed over 1.2275 resistance area, this is now going to work as a support. The MACD is still heading into the bullish zone, suggesting strong chances of buying the GBP/USD pair.

On the 4 hour timeframe, the GBP/USD pair is pretty much likely to find resistance around 1.2520, along with support around 1.2278. In the case of market breaks bellow 1.2278, we may see GBP/USD prices heading into the selling zone until 1.2100 and 1.2005. Whereas, the chances of buying remains solid over 1.2275 until 1.2520.

USD/JPY – Daily Analysis

The USD/JPY currency pair just started to flashing green and rose above 108.00 level at the press time, mainly due to the broad-based greenback recovery. However, China’s rate cut by 20 basis points on early Monday and infusion of $7 billion liquidity into the banking system started to giving some support to the equity market and turns the market risk-off tone into risk-on. 

The USD/JPY pair is currently trading at 108.08 and consolidates in the range between the 107.14 – 108.20. The USD/JPY pair was recently trading near 107.25 and was representing a 0.60% loss on the day, having hit a session low of 107.12 a few minutes before press time, but now the pair got boost after slight recovery came in the equity market.

The People’s Bank of China cut the seven-day reverse repo rate to 2.2% from 2.4% and injected $7 billion or 50 billion Japanese yuan into the banking system, which recently gave some support to the equity market.

Before some time, the action by China had failed to put a bid under the risky assets. The futures on the S&P 500 were keeping losses and was reporting a 1% decline on the day. Stocks in Asia were also feeling the pull of gravity with Japan’s Nikkei index was dropping 3.4%. As a result, the safe-haven Japanese yen was getting bid as safe-haven demand.

Looking forward, the currency pair may drop to their lowest level in the future, mainly due to the fears about the Japanese government may declare a state of emergency due to intensifying coronavirus fears. 

Daily Support and Resistance

  • S1 106.51
  • S2 108.16
  • S3 108.75

Pivot Point 109.8

  • R1 110.4
  • R2 111.45
  • R3 113.09

USD/JPY – Trading Tips

The USD/JPY is trading at 107.570, heading towards testing double bottom support around 107.615. For now, the pair is stuck in a narrow range, where the upper limit is 108.500, and the lower limit stays at 107.050. The USD/JPY is facing a bearish pressure in the wake of an increased number of coronavirus cases around the globe which are driving safe-haven appeal in the market.  

Consequently, the bearish breakout of 108.150 support level can lead the USD/JPY prices lower towards 105.950 level. Until then, we should look for doing choppy trading by selling below 108.400 and buying over 108.250. All the best for today!  

Categories
Crypto Market Analysis

Daily Crypto Review, Mar 30 – Bitcoin back above $6,000 as Trump publicly supports printing $6.2 trillion

The cryptocurrency market, as it could not break the immediate resistances ahead, had a leg down over the weekend. The market stabilized with Bitcoin at above $6,000 for now. Bitcoin is currently trading for $6,223, which represents an increase of 1.34% on the day. Meanwhile, Ethereum gained 0.41% on the day, while XRP lost 1.28%.

Energi took the position of today’s most prominent daily gainer, with gains of 10.57%. On the other side, Steem lost 8.34% on the day, making it the most prominent daily loser.

Bitcoin’s dominance stayed at virtually the same place when compared to Friday’s value. Its value is now 66.03%, which represents a 0.13% difference to the downside when compared to before the weekend.

The cryptocurrency market capitalization took a big hit in the past 24 hours due to a sharp move down. Its current value is $174.01 billion. This value represents an increase of $13.06 billion when compared to the value it had on Friday.

What happened in the past 24 hours

Bitcoin (BTC) gains more and more support after the US President Donald Trump appeared to say he fully supported manipulating the dollar by printing $6.2 trillion.

Trump defended the Federal Reserve for printing more than $6 trillion with the words “It’s our money, we are the ones, it’s our currency,” which got quite a backlash.

Honorable mention

Ethereum

Data published the co-founder Covalent (an Ethereum analysis firm) Ganesh Swami announced that DeFi transactions are increasing its share of Ethereum block space, which goes at the expense of ETH transfers.

Swami said that the gas costs incurred by Ethereum transactions went up progressively.

_______________________________________________________________________

Technical analysis

_______________________________________________________________________

Bitcoin

After not being able to break the $6,850 resistance for quite some time, a leg down from Bitcoin was to be expected (check our previous reports). The largest cryptocurrency by market capitalization fell below $6,000 psychological support (and $5,960 support level), but quickly recovered and stayed above it. Bitcoin is currently trading at just above $6,200.


Bitcoin’s volume is average when compared to the previous week, while its RSI level on the 4-hour chart went from severely oversold to the middle of the range.

Key levels to the upside                    Key levels to the downside

1: $6,850                                           1: $5,960

2: $7,085                                           2: $5,000

3: $7,420                                            3: $4,300


Ethereum

Ethereum went through a similar price path as Bitcoin did. Its price fell down below the $128 support level as bulls could not break the $139 reliably, but quickly recovered and went above the support level. It is currently trading at above $130, where it looks pretty safe from any downturns in the short-term.


Ethereum’s volume is on the same low levels as it was the previous week. Its RSI level has risen to the middle of the value range after almost reaching oversold territory during the price drop.

Key levels to the upside                    Key levels to the downside

1: $168                                                1: $128

2: $178.6                                            2: $122.5 

3: $185                                                3: $100


Ripple

XRP received a great surge in volume as its price rose above the $0.165. The weekend brought bad news for XRP as bears took over and brought its price below the key level of $0.165. However, the third-largest cryptocurrency quickly overcome the downtrend and went back up above this key level.


XRP’s volume increased greatly during the spike, while the rest of the volume is average when compared to the past week. Its RSI level is on the upswing, currently passing the value of 55.

Key levels to the upside                    Key levels to the downside

1: $0.19                                             1: $0.165

2: $0.2                                               2: $0.147

3: $0.205                                             3: $0.1

Categories
Forex Market Analysis

Daily F.X. Analysis, March 27 – Top Trade Setups In Forex – Weaker Dollar In Play! 

The greenback fell against its major peers, with the Dollar Index dipping 0.7% on the day to 100.94, down for a 4th consecutive session. France’s INSEE will release March Consumer Confidence Index (91 expected).

The U.S. Commerce Department will report February personal spending (+0.2% on month expected) and personal income (+0.4% on month expected). The University of Michigan (UOM) will report its final rea1dings of the March Consumer Sentiment Index (90.0 expected).

 Economic Events to Watch Today    


EUR/USD – Daily Analysis

The EUR/USD rallied 1.5% to 1.1047, posting a four-day winning streak. The risk-on market sentiment is also pushing the U.S. Dollar lower and sending the pair higher. The recovery in the risk-sentiment came after the U.S. Senate approved of the original $2 trillion fiscal stimulus package.

A series of economic fundamentals drove the pair, and even today market is likely to move on news. In particular, the U.S. initial jobless claims are expected to have risen to 1,000K from the preceding week’s 281K figure in the week ended March 20. 

If jobless claims fall in the 2 to 3 million range, which seems fairly possible, we will likely see a notable sell-off in the greenback. In that case, the EUR/USD currency pair could find a bid over the 50-day moving average at 1.10. 

On the other hand, the EUR/USD currency pair will also take cues from the Kansas Fed Manufacturing Activity index for March. The European Union’s upcoming emergency meeting to discuss further steps to combat the virus will be essential to watch. 

Markets are assuming that the Eurozone is going for a deep slowdown, and they need aggressive stimulus to stop the fallout from the virus outbreak. Later today, eyes will be on France’s INSEE, which is due to release March Consumer Confidence Index (91 expected).

Daily Support and Resistance

  • S1 1.0673
  • S2 1.0835
  • S3 1.0935

Pivot Point 1.0997

  • R1 1.1097
  • R2 1.1159
  • R3 1.1321

EUR/USD– Trading Tips

The EUR/USD is trading bullish at 1.1025, having an immediate support level of around 1.0947. The bullish channel has already been violated on the higher side, and it’s supporting is the bullish bias in the EUR/USD pair. On the higher side, the EUR/USD pair is facing resistance at 1.1070 area. 

Bullish crossover of 1.1070 area can open further room for buying until 1.1194 level. Whereas, the chances of a bearish bias will remain strong if the pair continues to hold below 1.1070 level today. On the lower side, the target is likely to stay at 1.0947 and 1.0885. 

GBP/USD– Daily Analysis

The GBP/USD surged 2.6% to 1.2192. The Bank of England said, after announcing a rate cut and additional bonds purchase last Thursday, it can expand asset purchases further if necessary. On the other hand, official data showed that U.K. retail sales declined 0.3% on month in February (+0.2% expected).

The policymakers could be called with the 24-hour prior notice to vote on the coronavirus support package on Friday. On the U.S. front, the coronavirus fears in the U.S. also increased with the death losses crossed 1,000 figures and an increase of 12,000 cases recorded in the single day on Wednesday.

The Bank of England (BOE) failed to offer any fireworks due to a lack of resources while disappointing U.K. Retail Sales, to 0.0% from 0.8% YoY forecast, also couldn’t recall the bears.

Later today, the U.S. Commerce Department will report February personal spending (+0.2% on month expected) and personal income (+0.4% expectation). The University of Michigan will report Consumer Sentiment Index (90.0 expected).


Daily Support and Resistance

  • S1 1.1339
  • S2 1.1535
  • S3 1.1662

Pivot Point 1.1731

  • R1 1.1858
  • R2 1.1927
  • R3 1.2122

GBP/USD– Trading Tip

The GBP/USD has violated the double top resistance level of 1.1945, and the pair now trades around 1.2180, the level which is marked as horizontal resistance. Today, the bullish breakout of the 1.2300 level can open the buying trend until the next resistance level of 1.2338 (50% Fibo level) and 1.2510 level, which accounts for a 61% retracement. On the lower side, the Cable can find support around 1.2035 and 1.1930. Let’s look for buying trades over the 1.1945 support level and selling below 1.2350 today. 

USD/JPY – Daily Analysis

The USD/JPY currency pair flashing red and hit the session low near the 108.50, mainly due to broad-based U.S. Dollar weakness. While the greenback continues to lose its ground in the wake of the U.S. relief package. At the time of writing, the USD/JPY is trading at 108.78 and consolidates in the range between the 108.25 – 109.72. 

However, the currency pair faced rejection at 109.72 in early Asia and dropped below the 100-day average support at 109.00 a few minutes before press time to hit a session low of 108.55.

Whereas, the major Asian equity indices like Japan’s Nikkei, Hong Kong’s Hang Seng and South Korea’s Kospi are flashing green.

It is worth to mention that the traders did not give much more attention to the Japanese Yen demand. So, the reason behind the pairs declines is the broad-based greenback weakness. The dollar index, which tracks the value of the greenback against majors, is currently trading at weekly lows near 99.30, having declined by nearly 200 pips on Thursday.

The U.S. dollar continues to lose its ground due to the unprecedented fiscal and monetary stimulus by the U.S. government and the Federal Reserve in the last five days.


Daily Support and Resistance

  1. S1 106.51
  2. S2 108.16
  3. S3 108.75
  4. Pivot Point 109.8
  5. R1 110.4
  6. R2 111.45
  7. R3 113.09

USD/JPY – Trading Tips

On Friday, the demand for safe-haven assets such as gold and Japanese yen has surged in the wake of an increased number of coronavirus cases around the globe. Consequently, the USD/JPY pair has dropped to trade at 108.350, down from the 109 level. On the 4 hour chart, the USD/JPY has violated the bullish channel, which is now suggesting bearish bias in the USD/JPY. 

The USD/JPY prices are holding around the next support level of 108.350, and around this level, we can expect USD/JPY to bounce off until 109.850. But in case, the USD/JPY exhibits a bearish breakout below 108.350 level; the pair may drop further until 106.450. 

All the best for today!  

Categories
Crypto Market Analysis

Daily Crypto Review, Mar 27 – XRP recording double-digit gains as Ripple Labs donates $200,000 to fight COVID-19

The cryptocurrency market is still in consolidation mode, with most cryptocurrency prices at almost the exact same level that they were yesterday. Bitcoin is currently trading for $6,574, which represents an increase of 0.6% on the day. Meanwhile, Ethereum gained 1.01% on the day, while XRP gained a solid 7.28%.

Quant took the position of today’s most prominent daily gainer, with gains of 31.45%. On the other side, EDC Blockchain lost 29.88% on the day, making it the most prominent daily loser.

Bitcoin’s dominance decreased by slightly less than 1% over the past 24 hours. Its value is now 66.16%, which represents a 0.88% difference to the downside when compared to yesterday’s value.

The cryptocurrency market capitalization was a bit more turbulent in movements in the past 24 hours than it was the day before. Its current value is $187.07 billion. This value represents an increase of $2.8 billion when compared to the value it had yesterday.

What happened in the past 24 hours

A report announced by the derivatives analysis firm Acuiti has shown a growing interest in supporting and listing crypto assets among trading firms. The study surveyed 86 companies from the buy-side, sell-side, as well as prop trading groups.

The survey showed that 26% of these firms had adopted cryptocurrencies in one way or another.

Honorable mention

Ripple

Ripple Labs announced that they had made a donation of $200,000 on Mar 25, going to two different non-profit organizations. These donations are made with the intention to aid the fight to contain the coronavirus throughout the US.

Ripple Labs stated that half the funds will go to the Tipping Point Emergency’s Response Fund, while the other half will go to the Silicon Valley Community Foundation’s COVID Regional Response Fund.

_______________________________________________________________________

Technical analysis

_______________________________________________________________________

Bitcoin

Bitcoin did not show any major volatility throughout the day, but has made a couple attempts to break its immediate resistance of $6,850. All of the attempts were, however, quickly stopped as the resistance was too much to handle with such low volume. If the pattern of failing to get above resistances continues, we might see a move down and retest of the support level.


Bitcoin’s volume is at the same level as it was the day before, while its RSI level fell down to 56.

Key levels to the upside                    Key levels to the downside

1: $6,850                                           1: $6,640

2: $7,085                                           2: $5,960

3: $7,420                                            3: $5,000


Ethereum

Ethereum has not moved much, but all the moves it made were with deliberation. The second-largest cryptocurrency by market capitalization tried to break the $139 resistance level, which is only recently showed any significance. It did manage to go above it, but quickly returned below, where it is at at the time of writing.


Ethereum’s volume is just barely higher than yesterday, while its RSI level is currently at the value of 54. We are not listing the $139 resistance as a key level, as it is still considered a pivot point (as well as too insignificant historically).

Key levels to the upside                    Key levels to the downside

1: $168                                                1: $128

2: $178.6                                            2: $122.5 

3: $185                                                3: $100


Ripple

XRP, unlike the other two aforementioned cryptocurrencies, had quite a splendid day. Its price reached double-digit gains as it jumped from $0.16 all the way up to $0.18. However, the bulls could not take the price any higher, and the move ended there. XRP has fallen slightly since then and is currently trading at around $0.171.


XRP’s volume increased greatly during the price spike. While it has descended since, it is still higher than the average volume for the past week. XRP’s RSI level has left the overbought territory on the 4-hour chart and is currently sitting at the value of 62.5.

Key levels to the upside                    Key levels to the downside

1: $0.19                                             1: $0.165

2: $0.2                                               2: $0.147

3: $0.205                                             3: $0.1

Categories
Forex Market Analysis

Daily F.X. Analysis, March 26 – Top Trade Setups In Forex – U.K. Monetary Policy In Focus! 

The greenback weakened against its major rivals, with the U.S. Dollar Index dropping 0.7% on the day to 100.94, down for a fourth straight session. For now, the focus shifts to the major economic events which will be releasing through the day. 

The Bank of England (BOE) will hold its monetary policy meeting, after a rate cut and additional bonds purchase announced last Thursday (March 19). The European Central Bank will publish the Eurozone’s M3 money supply in February (+5.2% on-year expected).

Germany’s GfK Consumer Confidence Index for April will be released (7.5 expected). France’s INSEE will release March indicators on business confidence (97 expected) and manufacturing confidence (93 expected).

Economic Events to Watch Today    


EUR/USD – Daily Analysis

The EUR/USD jumped 0.9% to 1.0888, posting a three-day rebound. Most of the moment, the pair was driven by a series of economic fundamentals, and even today market is likely to move on news. In particular, the U.S. initial jobless claims are expected to have risen to 1,000K from the preceding week’s 281K figure in the week ended March 20

If jobless claims fall in the 2 to 3 million range, which seems fairly possible, we will likely see a notable sell-off in the greenback. In that case, the EUR/USD currency pair could find a bid over the 50-day moving average at 1.10. On the other hand, the EUR/USD currency pair will also take cues from the Kansas Fed Manufacturing Activity index for March. 

Meanwhile, the European Union’s upcoming emergency meeting to discuss further steps to combat the virus will be essential to watch. Markets are assuming that the Eurozone is going for a deep slowdown, and they need aggressive stimulus to stop the fallout from the virus outbreak.

Looking forward, the European Central Bank will release its monthly Economic Bulletin while the weekly Initial Jobless Claims, Goods Trade Balance, and Q4 Gross Domestic Product (GDP) data from the U.S. will be key to watch.

Daily Support and Resistance

  • S1 1.0531
  • S2 1.0673
  • S3 1.0742

Pivot Point 1.0815

  • R1 1.0885
  • R2 1.0957
  • R3 1.11

EUR/USD– Trading Tips

On Thursday, the EUR/USD is trading bullish at 1.0935, having an immediate support level of around 1.0890. The bullish channel that you can see in the chart above is also supporting the bullish bias in the EUR/USD pair, and it’s supporting the direct currency pair at 1.0890. 

Closing of the bullish engulfing candle and three bearish two-hourly candles above 1.0890 support is signifying a bullish breakout, which can lead the pair towards 1.0959 resistance level. While the bearish breakout of 1.0890 can lead the EUR/USD prices towards 1.0780. Let’s consider staying bullish above 1.0890 today with an initial target of 1.0950. 

GBP/USD– Daily Analysis

The GBP/USD climbed 0.6% to 1.1833. Official data showed that U.K. CPI grew 1.7% on year in February as expected, compared with a 1.8% growth in January. Later today, the Bank of England will hold its monetary policy meeting, after a rate cut and additional bonds purchase announced last Thursday. Also, U.K. retail sales data for February will be released (+0.2% on month estimated).

The policymakers could be called with the 24-hour prior notice to vote on the coronavirus support package on Friday. On the U.S. front, the coronavirus fears in the U.S. also increased with the death losses crossed 1,000 figures and an increase of 12,000 cases recorded in the single day on Wednesday.

Later in the day, the Bank of England will hold its monetary policy meeting, after a rate cut and additional bonds purchase announced last Thursday (March 19). While the U.K. Retail Sales are expected to remain unchanged at 0.80% YoY but any major chances likely offer a new direction to the GBP/USD prices. The U.K. Office for National Statistics will report February retail sales (+0.2% on month expected).

Daily Support and Resistance

  • S1 1.1339
  • S2 1.1535
  • S3 1.1662

Pivot Point 1.1731

  • R1 1.1858
  • R2 1.1927
  • R3 1.2122

GBP/USD– Trading Tip

The GBP/USD has violated a broad trading range of 1.1400 – 1.1885, and the pair now trades around 1.1930, the level which is marked as a triple top. The Bank of England’s rate decision today will play a major role in determining it’s a trend. Today, the bullish breakout of the 1.1930 level can open the buying trend until the next resistance level of 1.2185 (38.2% Fibo level) and 1.2300 level, which accounts for a 50% retracement. On the lower side, the Cable can find support around 1.1665 and 1.1445. Let’s look for buying trades over the 1.1945 resistance level and selling below the same today. 

USD/JPY – Daily Analysis

During Thursday’s early Asian session, the USD/JPY dropped to a session low of 110.45 from the high of 111.30 after the market sentiment shifts, mainly due to the United States Congress, which failed to come together and agree on relief package plan after facing recent hurdles. While the broad-based USD weakness also undermines the currency pair. 

At the moment, the USD/JPY is trading at 110.52 and consolidates in the range between the 110.38 – 111.31. However, the safe-haven Japanese yen is continuing its bullish move, which seen in early Asia sessions due to fresh losses in the U.S. stock futures.

The risk-off market sentiment strengthened, pushing the futures tied to the S&P 500 futures lower. At press time, the index futures are reporting a 1% decline. On the other hand, the coronavirus outbreak is not showing any sign of slowing down in the U.S., Japan, and European countries. 

There was a sharp rise in cases in Tokyo and gave a warning about the lockdown, which eventually strengthing the risk-off market sentiment and boosting the safe-haven Japanese yen.

Daily Support and Resistance    

  • S1 107.85
  • S2 109.43
  • S3 110.32

Pivot Point 111.02

  • R1 111.91
  • R2 112.6
  • R3 114.19

USD/JPY – Trading Tips

The intensified safe-haven demand has started driving the bearish trend in the USD/JPY currency pair as it trades at 110.350, down from 111 level. On the 4 hour chart, the USD/JPY was trading in a bullish channel, which supported the USD/JPY prices around 110.650. Since this level has already been violated, now it’s going to work as a resistance for the USD/JPY. 


As forecasted earlier, a bearish breakout of 110.600 can lead its prices toward 109.600 level, and that’s what the market is trying to do now. The USD/JPY prices are heading towards the next support level of 109.850, and around this level, we can expect USD/JPY to bounce off a bit. However, in case of a bearish breakout of 109.850 level, the pair may drop further until 108.450. 

All the best for today!  

Categories
Crypto Market Analysis

Daily Crypto Review, Mar 26 – The calm before the storm? Cryptocurrency price analysis

The cryptocurrency market had a pretty steady day when it comes to price movements. Most cryptos remained at their levels of 1 day ago. Bitcoin is currently trading for $6,652, which represents a decrease of 0.78% on the day. Meanwhile, Ethereum lost 2.75% on the day, while XRP lost 1.17%.

EDC Blockchain took the position of today’s most prominent daily gainer, with gains of 871.81%. On the other side, Swipe lost 12.67% on the day, making it the most prominent daily loser.

Bitcoin’s dominance has increased over the past 24 hours. Its value is now 67.04%, which represents a 0.39% difference to the upside when compared to yesterday’s value.

The cryptocurrency market capitalization did not move much in the past 24 hours. Its current value is $184.21 billion. This value represents a decrease of $0.14 billion when compared to the value it had yesterday.

What happened in the past 24 hours

Bitcoin mining difficulty dropped by 15.95% in the past 24 hours. This is the second-largest decline in its history. Bitcoin price plummeted more than 50% percent last time a decline like this happened.

Though this is not a surefire way to determine the price direction, it is very much possible that Bitcoin will go down some more in the short-term.

Honorable mention

GRAM

Cardano launched Ouroboros Hydra, its off-chain scalability protocol on Mar 25. This protocol has gone live after five years of development.

The protocol increased scalability greatly for the Cardano blockchain. On top of that, it is using very little storage on the network’s nodes. Hydra could theoretically scale to 1,000,000 transactions per second.

_______________________________________________________________________

Technical analysis

_______________________________________________________________________

Bitcoin

Bitcoin had a pretty stale day price-wise, as it did not move almost at all from yesterday. The largest digital currency by market cap is still trading just below the $6,850 resistance level without much fluctuation. While its price is above the weekly 200-period moving average, if the price doesn’t move to the upsidein the next couple of days, we can expect a leg down towards lower $6,000’s, or even lower.


Bitcoin’s volume drastically reduced from yesterday, while its RSI level dropped slightly towards the middle of the value range, currently being at the value of 56.

Key levels to the upside                    Key levels to the downside

1: $6,850                                           1: $6,640

2: $7,085                                           2: $5,960

3: $7,420                                            3: $5,000


Ethereum

Ethereum has almost mirrored the movements of Bitcoin for the past 24 hours. The second-largest cryptocurrency had close to no movement on the day, with its price being right below the $139 resistance line. However, the only change from yesterday is exactly the $139 level. While it was undecided whether the price will end up below or above it yesterday, it is quite clear that Ethereum will trade below this level for the time being.


Ethereum’s volume also dropped severely from yesterday, while its RSI level is currently at the value of 51.

Key levels to the upside                    Key levels to the downside

1: $168                                                1: $128

2: $178.6                                            2: $122.5 

3: $185                                                3: $100


Ripple

XRP had a bit more movement than Bitcoin and Ethereum in the past 24 hours. Namely, its price moved down to $0.157 but quickly recovered to its previous level of around $0.16. XRP is trading between the resistance of $0.165 and support of $0.147 for five days now, without any signs of going up or down.


XRP’s volume decreased slightly over the past 24 hours, while its RSI level dropped to 53.

Key levels to the upside                    Key levels to the downside

1: $0.165                                            1: $0.147

2: $0.19                                              2: $0.1

3: $0.2                                              

Categories
Forex Market Analysis

Daily F.X. Analysis, March 25 – Top Trade Setups In Forex – Brace for U.K. Inflation Figures! 

The U.S. stocks soared on news of Congress is close to passing a substantial coronavirus relief bill. The sentiment was further boosted by President Donald Trump’s comments that he would like the U.S. economy to reopen by Easter in mid-April. The Dow Jones Industrial Average surged 2113 points (+11.4%) to 20,704, its biggest one-day percentage gain since 1933. The S&P 500 jumped 209 points (+9.4%) to 2,447, and the Nasdaq 100 rose 546 points (+7.8%) to 7,553. 

Later today, February durable goods orders (preliminary reading, -1.0% on month expected) will be reported. 

Economic Events to Watch Today    


EUR/USD – Daily Analysis

The EUR/USD advanced 0.8% to 1.0809. The Markit Eurozone Manufacturing PMI slid to 44.8 in March (39.0 expected) from 49.2 in February and Services PMI sank to 28.4 (39.5 expected) from 52.6. 

The EUR/USD currency could drop below the 1.08 if the coming German IFO Expectations Index for March disappoints expectation of 82, strengthening recession fears. Apart from this, U.S. Durable Goods data for February is also scheduled to release. 

The traders need progress soon in the global market; otherwise, the risk assets may suffer another selloff, boosting haven demand for the U.S. dollar. At press time, the S&P 500 futures are reporting a 1.4% drop. 

The U.S. dollar continues trading in the red territory against majors, as shown by the 0.3% drop in the dollar index. Federal Reserve’s unlimited quantitative easing plan has decreased pressure in funding markets and bought time for the politicians. 

The headlines regarding coronavirus and stimulus package by the Federal Reserve will be key to watch. Eyes will be on the German IFO Expectations Index for taking new directions.

Daily Support and Resistance 

  • S1 1.0531
  • S2 1.0673
  • S3 1.0742

Pivot Point 1.0815

  • R1 1.0885
  • R2 1.0957
  • R3 1.11

EUR/USD– Trading Tips

On Wednesday, the EUR/USD is trading sideways, forming higher’s high and higher’s a low pattern, which indicates stronger chances of a bullish bias in the market. The EUR/USD is trading around 1.0815, and it’s forming neutral candles while trading in an upward channel, which may support the pair around 1.0775. 

On the higher side, the EUR/USD pair may face resistance around 1.0880, and above this, the pair has the potential to target the next resistance level of 1.0930 while the EUR/USD has odds of staying bearish below 1.0920 to target 1.0805.


GBP/USD– Daily Analysis

The GBP/USD surged 2.1% to 1.1789 after the U.K. government ordered lockdown measures to stop coronavirus spreading. On the other hand, the Markit U.K. Manufacturing PMI fell to 48.0 in March (45.0 expected) from 51.7 in February, and Services PMI dipped to 35.7 (45.0 estimated) from 53.2.

The GBP/USD currency pair may drop to their lowest level if the UK CPI data releases sluggish while a surprise positive figures could help the pair extend its fresh recovery rally from the multi-year low.

The Consumer Price Index published by the Office for National Statistics is a gauge of price moves by the comparison among the retail prices goods and services. The purchasing power of GBP is slowed down by inflation.

The CPI is a leading indicator to measure inflation and show changes in purchasing trends. Usually, a high figure is understood as positive (or bullish) for the GBP, while a sluggish figure is seen as negative (or Bearish). Let’s look at the technical side of the market. 

Daily Support and Resistance

  • S1 1.1339
  • S2 1.1535
  • S3 1.1662

Pivot Point 1.1731

  • R1 1.1858
  • R2 1.1927
  • R3 1.2122

GBP/USD– Trading Tip

The direct currency pair GBP/USD maintains a broad trading range of 1.1400 – 1.1885 for another day as traders seem to wait for the U.K. Inflation today and Bank of England’s rate decision tomorrow. Today, the bullish breakout of the 1.1889 level can open the buying trend until the next resistance level of 1.2185 (38.2% Fibo level) and 1.2300 level, which accounts for a 50% retracement. On the lower side, the Cable can find support around 1.1665 and 1.1445.

A bearish breakout of 1.1425 level can lead the Cable towards the next support area of 1.1050. The MACD is tossing above and below zero as investors are unable to determine the trend of the market. 

USD/JPY – Daily Analysis

During the Wednesday early Asian session, the USD/JPY currency pair found on the bullish track and hit the session high near 111.58, mainly due to the recovery in the market risk sentiment because the United States policymakers agreed on COVID-19 bill. The USD/JPY is trading at 111.48 and consolidates in the range between the 110.75 – 111.56. 

After the two-days of disappointment, the Senate Democrats and Republicans ultimately agreed on the Trump administration-backed stimulus package plan. However, the raised expectations of the expected $2 trillion package to control the deadly virus impact and fresh strategy of reducing coronavirus (COVID-19) cases from Italy also improved the market risk sentiment.

Whereas, the United States 10-year treasury yields rose 4-basis points (bps) to 0.853% while the U.S. stock futures also decreased earlier losses. The Asian stocks flashing green and marked slight gains by the press time, which show’s drop in demand for safe-haven assets such as gold and Japanese yen.

For the time being, the traders are keenly awaiting the details of the voting as well as the times of the package for taking additional direction. However, the U.S. Durable Goods Orders for January and additional coronavirus headlines will be key to watch.


Daily Support and Resistance    

  • S1 107.85
  • S2 109.43
  • S3 110.32

Pivot Point 111.02

  • R1 111.91
  • R2 112.6
  • R3 114.19

USD/JPY – Trading Tips

Technically, the safe-haven currency pair USD/JPY hasn’t changed a lot as it continues to consolidate around 111.300. On the 4 hour chart, the USD/JPY has formed a bullish channel that is still intact, and it’s pretty much likely to support the USD/JPY prices around 110.650. 

A bearish breakout of 110.600 can lead its prices toward 109.600 level. The USD/JPY prices towards the next support level of 108.350, and around this level, we can expect USD/JPY to bounce off again. Conversely, the pair faces resistance around 111 and 112.190 today. Let’s stay bullish above 109.650 and bearish below the same level today. 

All the best for today!  

Categories
Crypto Market Analysis

Daily Crypto Review, Mar 25 – BTC failing to break above $7,000; What to expect next?

The cryptocurrency market attempted to go up and reach new highs but failed to do so as Bitcoin couldn’t break above the $6850 resistance successfully. Bitcoin is currently trading for $6,682, which represents a decrease of 0.63% on the day. Meanwhile, Ethereum lost 1.48% on the day, while XRP lost 0.02%.

ZEON took the position of today’s most prominent daily gainer, with gains of 272.17%. On the other side, Molecular Future lost 11.20% on the day, making it the most prominent daily loser.

Bitcoin’s dominance has increased over the past 24 hours. Its value is now 66.65%, which represents a 0.26% difference to the upside when compared to yesterday’s value.

The cryptocurrency market capitalization increased over the past 24 hours, with a current value of $184.35 billion. This value represents an increase of $4.7 billion when compared to the value it had yesterday.

What happened in the past 24 hours

Blockchain analysis firm Coin Metrics found out that even though Bitcoin was experiencing tough times (especially the one when its price had the biggest daily loss in the last seven years), stablecoins bloomed.

This company released its State of the Network report on Mar 23. Stablecoins gained a lot of the market share, which everyone could see. However, spreads on spot and futures markets widened, while transfer fees went up as people rushed to deposit coins.

Honorable mention

GRAM

A United States District Court has ruled against Telegram for the issue of using GRAM tokens without declaring that they are securities prior to the ICO.

Prior to that, the Securities and Exchange Commission’s requested a preliminary injunction, to which the Court answered that it finds that the SEC has shown great likelihood of success in proving the contracts and understandings at issue. This would be including the sale of 2.9 billion Grams to 175 purchasers which netted Telegram $1.7 billion.

_______________________________________________________________________

Technical analysis

_______________________________________________________________________

Bitcoin

Bitcoin had somewhat a turbulent day, with its price going from all the way to $7,000 and then back down to $6500, only to stabilize at just sligtly higher levels than yesterday. The largest cryptocurrency did not manage to break the $6,850 resistance successfuly, so the bears stepped in and brought the price back down. BTC is now holding below $6,850 and above $6,640. This move might be percieved as a fakeout above $6,850 and the market might look for a leg down towards the low $6,000’s or lower.


Bitcoin’s volume did not increase during the spike, which is quite interesting. Its RSI level is currently at the level of 62.

Key levels to the upside                    Key levels to the downside

1: $6,850                                           1: $6,640

2: $7,085                                           2: $5,960

3: $7,420                                            3: $5,000


Ethereum

Ethereum is currently fighting for where it will go next. Its price is stuck right at the $139 level, not knowing whether it will go up or down. However, a break to any side will not be as significant as the moves that Bitcoin makes, and could only bring the price up or down so far.


Ethereum’s volume is still at extremely low levels, while its RSI level is currently just above the mid-point of the value range, sitting at the value of 57.

Key levels to the upside                    Key levels to the downside

1: $168                                                1: $128

2: $178.6                                            2: $122.5 

3: $185                                                3: $100


Ripple

XRP had a day of virtually no movement. However, this is not quite due to its price, not wanting to move. The third-largest cryptocurrency was trading right below the $0.165 level, constantly failing to break it. This exact thing happened in the past 24 hours as well, as the price kept trying to go above the resistance, failing, and then going back to its previous levels.


XRP’s volume saw no increase or decrease on the day, while its RSI level is currently at 57.

Key levels to the upside                    Key levels to the downside

1: $0.165                                            1: $0.147

2: $0.19                                              2: $0.1

3: $0.2                                              

Categories
Forex Market Analysis

Daily F.X. Analysis, March 24 – Top Trade Setups In Forex – Eyes on Manufacturing PMI Figures! 

The U.S. Dollar Index regained bullish bias at 102.81, while U.S. stock scored daily downside limits. Federal Reserve Bank of St. Louis President James Bullard said U.S. jobless rate might soar to 30% in the second quarter, and the Fed can provide more support if necessary. The U.S. official data showed that existing home sales amounted to an annualized rate of 5.77 million units in February, higher than expected.

Later today, eyes will be on the U.K. and U.S. manufacturing figures, which have the potential to price action

Economic Events to Watch Today    


EUR/USD – Daily Analysis

This morning, EUR/USD fell 0.2% to 1.0673, following a 0.4% gain on Friday. Later today, the eurozone’s March Consumer Confidence Index (-14.0 expected) will be released. The EUR/USD pair may cross the strong resistance level if the risk-off market sentiment gets more worsens ahead. Eventually, it will likely fuel deeper losses in the greenback and may increase demand for the common currency.

The EUR/USD currency pair may come under pressure in the coming European session if the Eurozone and German preliminary Manufacturing PMIs for March ignore expectations. The data is expected to surprise on the lower side, in the wake of the coronavirus outbreak and may show investors how much economy is affected by the COVID-19 impact.

Looking forward, the traders will keep their eye on the Eurozone and German preliminary Manufacturing PMIs for taking fresh direction, and it will likely leave the impact on the pair movement ahead. As well as, the United States and Federal Reserve incomplete deal-related headlines also will be key to watch.

Daily Support and Resistance

  • S1 1.043
  • S2 1.0592
  • S3 1.0678

Pivot Point 1.0753

  • R1 1.0839
  • R2 1.0914
  • R3 1.1075

EUR/USD– Trading Tips

The EUR/USD traded bearishly as it as violated and closed below horizontal support becomes a resistance level of 1.0990. The EUR/USD is trading around 1.0750, and it’s forming a lower-lows pattern on the 4-hour chart, which mostly drives a continuation of a selling trend. 

Right now, the EUR/USD is trading at 1.0720, consolidating in a narrow trading range of 1.0817 – 1.0660. The EUR/USD is facing hurdles around 1.0817, and above this, the pair has the potential to target the next resistance level of 1.0930. While the EUR/USD has odds of staying bearish below 1.0920 to target 1.0805. On the daily chart, a violation of 1.0605 can extend the selling trend until 1.0550.


GBP/USD– Daily Analysis

The GBP/USD retreated 0.7% to 1.1557, after a 1.4% rally in the prior session. The GBP/USD pair slipped due to a stronger dollar after the U.S. official data showed that housing starts posted at an annualized rate of 1.599 million units in February (1.500 million units expected). The U.K.’s emergency coronavirus legislation will also reach the House of Lords for additional discussion before turning into the law some time by the end of the week.

However, the risk-sentiment continues to flash green with the U.S. ten-year treasury yields, S&P 500 Futures, and Asian stocks are all on their ways to recover the latest losses; while the headline Manufacturing and Services PMIs from the U.K. and the U.S. are likely to move into the contraction phase, with readings below 50.00. 

Looking forward, the traders will keep their eye on the Flash Manufacturing PMI and FPC Meeting Minutes for taking fresh direction. As well as, the United States and Federal Reserve incomplete deal-related headlines also will be key to watch.


Daily Support and Resistance

  • S1 1.105
  • S2 1.1318
  • S3 1.1456

Pivot Point 1.1586

  • R1 1.1724
  • R2 1.1853
  • R3 1.2121

GBP/USD– Trading Tip

On Tuesday, the GBP/USD continues to consolidate in a broad trading range of 1.1400 – 1.1885 as the trend of the market isn’t clear. On the higher side, the bullish breakout of the 1.1885 level can open the buying trend until the next resistance level of 1.2185 (38.2% Fibo level) and 1.2300 level, which markets 50% retracement while the pair has solid chances of bouncing off over 1.1450 level. 

A bearish breakout of 1.1425 level can lead the Cable towards the next support area of 1.1050. The MACD is tossing above and below zero as investors are unable to determine the trend of the market. 


USD/JPY – Daily Analysis

At the starting of Tuesday’s Asian session, the USD/JPY currency pair hit the bearish track. They dropped to an intra-day low of 110.10, representing 0.69% losses mainly due to broad-based greenback weakness after rising expectations of further delays in the US COVID-19 bill. The USD/JPY is trading at 110.53 and consolidates in the range between the 110.09 – 111.30. Moreover, the currency pair gave little attention to the preliminary readings of Japan’s Jibun Bank PMIs and continued its declining streak.

At the data front, the preliminary readings of March month Jibun Bank Manufacturing PMI dropped below 47.6 to 44.8 in March. Moreover, the Services index dropped from 46.8 before 32.7, the lowest since September 2007. After the U.S. Senators’ failure to receive the much-awaited coronavirus (COVID-19) package bill, U.S. President, Vice President and Treasury Secretary tried to confirm traders that the stimulus package will be agreed soon. Still, he did not succeed in hiding fears of further delays in the relief package. 

However, the report came that the Senate is not expected to vote on the Bill today too, and indicated further delays in President Trump’s ‘major’ response to the coronavirus.

On the positive side, the U.S. inflation expectations recovered slightly from the record low after the latest Federal Reserve statement that there is no limit to their Quantitative Easing program. 

Daily Support and Resistance    

  • S1 105.08
  • S2 107.59
  • S3 109.24

Pivot Point 110.1

  • R1 111.75
  • R2 112.61
  • R3 115.13

USD/JPY – Trading Tips

The USD/JPY pair has shown a slight bearish movement, falling from 110.65 level to 109.580. On the 4 hour chart, the USD/JPY has formed a bullish channel that is still intact, and it’s pretty much likely to support the USD/JPY prices around 109.650. 

A bearish breakout of 109.600 level can lead the USD/JPY prices towards the next support level of 108.350, and around this level, we can expect USD/JPY to bounce off again. Conversely, the pair faces resistance around 111 and 112.190 today. Let’s stay bullish above 109.650 and bearish below the same level today. 

All the best for today!  

Categories
Crypto Market Analysis

Daily Crypto Review, Mar 24 – Bitcoin recording double-digit gains as it reaches $6,500

The cryptocurrency market managed to pull its weight to the upside as Bitcoin surged and recorded double-digit gains in the past 24 hours. Bitcoin is currently trading for $6,488, which represents an increase of 10.73% on the day. Meanwhile, Ethereum gained 8.91% on the day, while XRP gained 6.27%.

Bytecoin took the position of today’s most prominent daily gainer, with gains of 17.64%. On the other side, Steem lost 1.82% on the day, making it the most prominent daily loser. At the moment, it seems that the market moves as a whole (or at least in the same direction) and that not many cryptos differ from this rule.

Bitcoin’s dominance has increased over the past 24 hours. Its value is now 66.39%, which represents a 0.41% difference to the upside when compared to yesterday’s value.

The cryptocurrency market capitalization increased over the past 24 hours, with a current value of $180.28 billion. This value represents an increase of $3.5 billion when compared to the value it had yesterday.

What happened in the past 24 hours

Democrats in the US House of Representatives are looking to implement the US-made digital dollar in order to streamline payments to its citizens outside of the traditional financial system. This idea has come up as many people were in need of some form of a stimulus package as a response to the economic crisis caused by the COVID-19 outbreak.

Honorable mention

MakerDAO

The MakerDAO (MKR) has recently announced an auction to recover the DAI collateral debt. This auction is almost complete, even with the procedure suffering some technical setbacks. The MakerDAO community largely remains optimistic as they think that Maker is handling the situation quite well.

_______________________________________________________________________

Technical analysis

_______________________________________________________________________

Bitcoin

Bitcoin managed to pull itself out of the falling price by creating lower lows pattern. The largest cryptocurrency soared above $6,000 once it broke the $5,960 resistance. The price was, however, stopped by the $6,640 resistance. Bitcoin is now consolidating right below this key level, trading at around $6,500 at the time of writing.


Bitcoin’s volume increased slightly during the price surge, while its RSI reached above 60 values on the 4-hour timeframe.

Key levels to the upside                    Key levels to the downside

1: $6,640                                           1: $5,960

2: $6,850                                           2: $5,000

3: $7,085                                            3: $4,300


Ethereum

Ethereum followed Bitcoin price-wise and increased in value as well, though not quite as much. The second-largest cryptocurrency has broken its $128 resistance quite quickly and moved towards future resistances. However, a new key resistance level has formed at the $139 level, which stopped the price from increasing twice in the past 24 hours.


Ethereum’s volume increased only during the duration of the candle, which brought its price over $128, while the rest of the day went by with regular volume. Its RSI level increased and is now at a value of 55.5.

Key levels to the upside                    Key levels to the downside

1: $168                                                1: $128

2: $178.6                                            2: $122.5 

3: $185                                                3: $100


Ripple

XRP increased in price as well over the past 24 hours. However, a pattern that is present for a couple of runs (to the upside as well as the downside) is that XRP did not break any support or resistance levels. XRP couldn’t get past the $165 level and is now trading at the $158.5 level, performing consolidation.


XRP’s volume increased only slightly when compared to the past couple of days. Its RSI level increased to the value of 55.

Key levels to the upside                    Key levels to the downside

1: $0.165                                            1: $0.147

2: $0.19                                              2: $0.1

3: $0.2                                              

Categories
Forex Market Analysis

Daily F.X. Analysis, March 23 – Top Trade Setups In Forex – Fundamentals Side Remains Light! 

During Asian trading hours Monday, the ICE U.S. Dollar Index regained strength at 102.81, while U.S. stock futures hit daily downside limits. Federal Reserve Bank of St. Louis President James Bullard said U.S. jobless rate might soar to 30% in the second quarter, and the Fed can provide more support if necessary.

Later in the day, the European Commission will release the eurozone’s March Consumer Confidence Index (-14.0 expected). In the U.S., the Federal Reserve Bank of Chicago will post February National Activity Index (-0.29 expected).

Economic Events to Watch Today    


EUR/USD – Daily Analysis

This morning, EUR/USD fell 0.2% to 1.0673, following a 0.4% gain on Friday. Later today, the eurozone’s March Consumer Confidence Index (-14.0 expected) will be released. The German IFO Business Climate Index dropped to 87.7 in March (88.0 expected) from 96.0 in February.

Moving on, the greenback may come under pressure and may allow EUR/USD to extend the recovery seen in the Asian session if the risk market further recovers in the European trading hour ahead. After the announcement of stimulus, the ECB President Christine Lagarde showed a willingness to use all essential tools to stop the negative impacts of the deadly virus. 

Moving on, the EUR/USD pair may cross the strong resistance level if the risk-off market sentiment gets more worsens ahead. Eventually, it will likely fuel deeper losses in the greenback and may increase demand for the common currency.

The economic calendar is light today with the German Bundesbank’s monthly report is scheduled to release during the European trading session. Therefore, the traders may also take cues from the Eurozone Consumer Confidence for March and the Chicago Fed National Activity Index for February for new directions.

Daily Support and Resistance

  • S1 1.0335
  • S2 1.0529
  • S3 1.0615

Pivot Point 1.0723

  • R1 1.0809
  • R2 1.0917
  • R3 1.1111

EUR/USD– Trading Tips

On Monday, the major currency pair EUR/USD traded bearishly as it as violated and closed below horizontal support becomes a resistance level of 1.0990. The EUR/USD is trading around 1.0750, and it’s forming a lower-lows pattern on the 4-hour chart, which mostly drives a continuation of a selling trend. 

Right now, the EUR/USD is trading at 1.0720, consolidating in a narrow trading range of 1.0817 – 1.0660. The EUR/USD is facing hurdles around 1.0817, and above this, the pair has the potential to target the next resistance level of 1.0930. 

While the EUR/USD has odds of staying bearish below 1.0920 to target 1.0805. On the daily chart, a violation of 1.0605 can extend the selling trend until 1.0550.


GBP/USD– Daily Analysis

The GBP/USD retreated 0.7% to 1.1557, after a 1.4% rally in the prior session. During the previous week, the Bank of England lowered its benchmark rate by 15 basis points to 0.10%. It announced that it would increase its holdings of U.K. government bonds and sterling non-financial investment-grade corporate bonds by GBP200 billion, to counter the economic shock caused by the coronavirus.

The GBP/USD pair slipped due to a stronger dollar after the U.S. official data showed that housing starts posted at an annualized rate of 1.599 million units in February (1.500 million units expected).

On the other hand, the U.S. Senate’s failure to pass the much-awaited COVID-19 Bill sent the Treasury yields and Asian stocks down. Apart from this, the conference by the G20 Finance Ministers may also offer some intermediate clues, and it will be key to watch. In contrast, the US Chicago Fed National Activity may also give some meaningful inspiration.

The PM’s Chief adviser Dominic Cummings faced criticism about supporting herd immunity. Therefore any progress in the story could also entertain the GBP/USD traders. 

Daily Support and Resistance

  • S1 1.0953
  • S2 1.1333
  • S3 1.1492

Pivot Point 1.1713

  • R1 1.1872
  • R2 1.2094
  • R3 1.2474

GBP/USD– Trading Tip

On Monday, the GBP/USD prices are consolidating in a broad trading range of 1.1400 – 1.1885. Yet, the trend of the market isn’t clear as investors are waiting for a solid fundamental to drive further movement in the market. On the higher side, the bullish breakout of the 1.1885 level can open the buying trend until the next resistance level of 1.2185 (38.2% Fibo level) and 1.2300 level, which markets 50% retracement while the pair has solid chances of bouncing off over 1.1450 level. A bearish breakout of 1.1425 level can lead the Cable towards the next support area of 1.1050. The MACD is tossing above and below zero as investors are unable to determine the trend of the market. 


USD/JPY – Daily Analysis

During the early Asian session, the USD/JPY currency pair flashing red and dropped below the 110 marks, representing 0.73% losses on the day mainly due to the U.S. Senate’s failure to pass the much-awaited COVID-19 Bill triggered the strong risk-off market sentiment. 

The Japanese yen is now finding bids as a safe-haven demand has sent the USD/JPY pair lower. The USD/JPY is trading at 110.08 right now, and it continues to consolidate in the range between the 109.67 – 111.260. However, the USD/JPY was initially trading near 111.25 on Friday, due to broad-based USD strength.

Despite positive signals from U.S. President Donald Trump, the Senate declined to pass the much-awaited incentive to control the deadly virus impact. This news initially sent the U.S. equity futures to the limit down.

The President of the Federal Reserve Bank of Minneapolis, Neel Kashkari, followed the role of St. Louis Federal Reserve President James Bullard, who expected the 2nd-quarter (Q2) GDP to decrease by 50% and the increase in Unemployment Rate to 30%. Meanwhile, the Minneapolis head mentioning that the Fed has unlimited cash to support the financial system. As a result, they are trying to support the U.S. dollar.

On the other hand, the coronavirus (COVID-19) fears continue to increase because numbers of the death toll from the U.S. and Italy rising day by day. The 36 cases reported in New Zealand, which is currently taking the market’s attention. Lastly, Japanese media signaled that the Asian countries might soon ban entries of U.S. travelers.

Daily Support and Resistance    

  • S1 105.08
  • S2 107.59
  • S3 109.24

Pivot Point 110.1

  • R1 111.75
  • R2 112.61
  • R3 115.13

USD/JPY – Trading Tips

On Monday, the USD/JPY pair has shown a slight bearish movement, falling from 110.65 level to 109.580. On the 4 hour chart, the USD/JPY has formed a bullish channel that is still intact, and it’s pretty much likely to support the USD/JPY prices around 109.650. 

A bearish breakout of 109.600 level can lead the USD/JPY prices towards the next support level of 108.350, and around this level, we can expect USD/JPY to bounce off again. Conversely, the pair faces resistance around 111 and 112.190 today. Let’s stay bullish above 109.650 and bearish below the same level today. 

All the best for today!  

Categories
Crypto Market Analysis

Daily Crypto Review, Mar 23 – Bitcoin uncertainty amid worldwide COVID-19 economy shutdown

The cryptocurrency market spent the weekend falling down, possibly indicating a further drop towards the lows of the end of 2018/start of 2019. Bitcoin is currently trading for $5,922, which represents a decrease of 6.28% on the day. Meanwhile, Ethereum lost 7.21% on the day, while XRP lost 5.67%.

UNUS SED LEO took the position of today’s most prominent daily gainer, with gains of 1.62%. On the other side, Hedera Hashgraph lost 16.12% on the day, making it the most prominent daily loser.

Bitcoin’s dominance has increased over the weekend. Its value is now 65.98%, which represents a 0.55% difference to the upside when compared to Friday’s value.

The cryptocurrency market capitalization decreased over the weekend, with a current value of $166.74 billion. This value represents a decrease of $3.03 billion when compared to the value it had on Friday.

What happened in the past 24 hours

Catherine Coley, the CEO of the US branch of Binance, revealed that the coronavirus quarantine in Asia led to increased trade volumes. She announced this statistic during a Bloomberg interview, where she also talked about the increasing correlation between Bitcoin and the S&P 500.

On the subject of the increased correlation between Bitcoin and the S&P 500, Coley said that both the traditional markets as well as the cryptocurrency market are playing out a well-known long-term cycle.

Honorable mention

Tezos

The Tezos Foundation announced that they would settle a $25 million consolidated class-action lawsuit. This will settle more than two years of fighting in court. The foundation chose to settle due to the time and financial expenses that would keep piling up.

The settlement proceedings are currently pending court approval.

_______________________________________________________________________

Technical analysis

_______________________________________________________________________

Bitcoin

While most analysts claim that Bitcoin has not gone under the $5,900 level and therefore stabilized above it, they fail to notice that it might be more plausible that Bitcoin is facing resistance at the $5,960 level. If this is the case, then Bitcoin fell under one of its key support levels over the weekend. However, this does not signal that it will keep going further down. That being said, the situation in the world economy alongisde the coronavirus outbreak does not bring good news to any market, cryptocurrency included.


Bitcoin’s volume decreased over the weekend, while its RSI level is currently near the middle of the value range, sitting at the value of 47.

Key levels to the upside                    Key levels to the downside

1: $5,960                                           1: $5,000

2: $6,640                                           2: $4,300

3: $6,850                                            


Ethereum

Ethereum, as a cryptocurrency that is highly correlated to Bitcoin and its movement, did not differ much from the largest cryptocurrency by market cap. Ether’s price fell under the $128 support level but found its stability near the $122.5 support. Ethereum is now trading in the middle of the range, bound by these two key levels.


Ethereum’s volume decreased over the weekend, while its RSI level is currently at the value of 44.

Key levels to the upside                    Key levels to the downside

1: $128                                                1: $122.5

2: $168                                              2: $100 

3: $178.6                                                


Ripple

XRP fell below its $0.165 support level over the weekend after just briefly going over it. The third-largest cryptocurrency is, again, trading between the levels of $165 to the upside and $0.1 to the downside. The only change in terms of key levels seems to be that XRP now responded to a pre-2017 support level of $0.147.


XRP’s volume is on extremely low levels, while its RSI level is currently at the value of just above 44.

Key levels to the upside                    Key levels to the downside

1: $0.165                                            1: $0.147

2: $0.19                                              2: $0.1

3: $0.2                                              

Categories
Forex Market Analysis

Daily F.X. Analysis, March 20– Top Trade Setups In Forex – Stronger Dollar In Play! 

The U.S. dollar strengthened further as other major central banks eased their monetary policies. The ICE Dollar Index jumped 1.8% on the day to 102.94, posting a three-day rally to the strongest level since Jan. 2017.

Later today, the European Central Bank will post January’s current account balance. The German Federal Statistical Office will report February PPI (+0.2% on-year expected).

The U.K. Office for National Statistics will release February public sector net borrowing, excluding banking groups (0.8 billion pounds expected).

Economic Events to Watch Today    


EUR/USD – Daily Analysis

EUR/USD plunged 2.6% to 1.0662, the lowest level since April 2017. The German IFO Business Climate Index dropped to 87.7 in March (88.0 expected) from 96.0 in February.

Moving on, the greenback may come under pressure and may allow EUR/USD to extend the recovery seen in the Asian session if the risk market further recovers in the European trading hour ahead. After the announcement of stimulus, the ECB President Christine Lagarde showed a willingness to use all essential tools to stop the negative impacts of the deadly virus. 

European stocks returned to positive territory, with the Stoxx Europe 600 Index gaining 2.9%. Germany’s DAX rebounded 2.0%, France’s CAC rose 2.7%, and the U.K.’s FTSE 100 was up 1.4%. A slight improvement in the stocks is also driving the bullish movement in the EUro. 

At the press time, the EUR/USD currency pair turned lower from 1.0980 to below 1.08 due to the strong haven bid around the dollar rose, producing significant gains for the greenback against the bucket of currencies. At the data front, all trader’s eyes on Germany’s Producer Price Index for February and the Eurozone Current Account data for January. Apart from this, the U.S. will release Existing Home Sales for February at 14:00 GMT. 

Daily Support and Resistance

  • S1 1.0434
  • S2 1.0677
  • S3 1.0795

Pivot Point 1.092

  • R1 1.1038
  • R2 1.1163
  • R3 1.1406

EUR/USD– Trading Tips

Lately, the currency pair EUR/USD traded bearishly as it as violated and closed below horizontal support becomes a resistance level of 1.0990. The EUR/USD is currently trading around 1.0750, and it’s forming a lower-lows pattern on the 4-hour chart, which mostly drives a continuation of a selling trend. 

At the moment, the EUR/USD is trading at 1.0750, essentially taking a bullish retracement. The EUR/USD is expected to find a hurdle around 1.0820, and above this, the pair has the potential to target the next resistance level of 1.0930. While the EUR/USD has robust odds of lingering bearish below 1.0920 to target 1.0805. On the daily chart, a violation of 1.0605 can extend the selling trend until 1.0550.


GBP/USD– Daily Analysis

The GBP/USD dipped 0.9% to 1.1499, down for an eighth straight session. The Bank of England lowered its benchmark rate by 15 basis points to 0.10% and announced that it would increase its holdings of U.K. government bonds and sterling non-financial investment-grade corporate bonds by GBP200 billion, to counter the economic shock caused by the coronavirus.

The GBP/USD pair slipped due to a stronger dollar after the U.S. official data showed that housing starts posted at an annualized rate of 1.599 million units in February (1.500 million units expected).

The Coronavirus cases rose from 643 to 3,269 during the last 24 hours in the U.K., but the separation of U.K.e Brexit Chief David Frost got major attention. The reason being his counterpart in the European Union (E.U.), Michel Barnier, also E.U.cing the flu-like deadly disease. As in result, it puts a question mark on the further Brexit talks.

As in result, the Asian stocks follow the foot-steps of Wall Street’s recovery, whereas the U.S. ten-year treasury yieldU.S.also rise to 1.158% by the press time. Due to the lack of major data, investors will keep their eyes on the coronavirus headlines.

Daily Support and Resistance

  • S1 1.0821
  • S2 1.1191
  • S3 1.1328

Pivot Point 1.1561

  • R1 1.1698
  • R2 1.1931
  • R3 1.2301

GBP/USD– Trading Tip

The GBP/USD is finally recovering a bit in the wake of bullish correction and trades around 1.1850. The pair continues to drop for a second consecutive week but seems to close a candle a bit higher this time. On the weekly timeframe, the GBP/USD pair has violated the descending triangle pattern, which supports it around the 1.2030 level. Below the 1.2030 level, the GBP/USD has expected to drop further until the next support level of 1.1245. Since the market was oversold, traders have entered buying to take profit before the weekends. As forecasted, we see bullish correction above 1.1245 level until 1.1885 or 1.2045 level, but then again, chances of selling will remain strong. 

USD/JPY – Daily Analysis

Today in the early Asian session, the USD/JPY currency pair flashing red and turned from the one-month high set earlier. However, the currency pair failed to maintain its early Asian session’s gains and dropped to 109.300 from the high of 111.35, mainly due to the long U.S. Dollar bearish sentiment. As of writing, the USD/JPY currency pairs currently trading at 109.67 and consolidates in the range between the 109.33 – 111.36.

A strong effort by central banks across the world to quiet investor’s moods and decrease fears about the global recession sent the USD lower on the last trading day of the week and was seen as one of the key factors behind the pair’s ongoing corrective drop.

Meanwhile, the losses seemed unaffected by a strong recovery in the global risk sentiment, which seems to weaken the Japanese yen’s safe-haven demand. Investors’ looking for perceived riskier assets due to a positive mood in the equity.

Daily Support and Resistance    

  • S1 105.08
  • S2 107.59
  • S3 109.24

Pivot Point 110.1

  • R1 111.75
  • R2 112.61
  • R3 115.13

USD/JPY – Trading Tips

On Friday, the safe-haven currency pair is trading above 108.400, the previously violated the double top resistance level of 107.950, and closing of candles above this level may drive further buying in the pair. On the 4 hour timeframe, the USD/JPY is trading within an upward channel, which is likely to drive further buying in the pair. 

On Friday, we may see USD/JPY finding support at 108.100 level, and above this, the chances of buying remain stable until the next resistance level of 110. Let’s stay bullish above 108.850 today. 

All the best for today!  

Categories
Crypto Market Analysis

Daily Crypto Review, Mar 20 – Cure for Coronavirus found? Crypto surging, Bitcoin above $6,000

The cryptocurrency market had another surprise in its sleeve today. Bitcoin rose above $6,000, while other cryptos followed. Bitcoin is currently trading for $6,164, which represents a staggering increase of 16.2% on the day. Meanwhile, Ethereum gained 15.57% on the day, while XRP gained 8.52%.

v.systems took the position of today’s most prominent daily gainer, with gains of 38.24%. On the other side, Bytecoin lost 6.22% on the day, making it the most prominent daily loser.

Bitcoin’s dominance has increased over the past 24 hours. Its value is now 65.43%, which represents a 0.76% difference to the upside when compared to yesterday’s value.

The cryptocurrency market capitalization increased exponentially, with a current value of $169.77 billion. This value represents an increase of $17.41 billion when compared to the value it had yesterday.

What happened in the past 24 hours

This time, the “what happened in the past 24 hours” section will not be about cryptocurrencies. However, it is connected to the market as it influences it highly. Apparently, a cure for the notorious COVID-19 virus which struck the world has been found.

A drug that treats malaria developed over half a century ago is showing great signs of being the cure for COVID-19, especially in combination with an antibiotic. The study showed great results in treating the virus.

Honorable mention

Tether

The world’s largest stablecoin by market cap has launched its operation on the Bitcoin Cash network. USDT will, at the time of writing, be available on the Bitcoin Cash network. On top of this, it is also available on many other networks, such as Ethereum, Algorand, Liquid Network, EOS, Omni, and Tron.

Tether (USDT) has seen a great surge of interest in recent weeks as the market has been going down. With people not wanting to get out of crypto, but wanting to protect their investments, Tether has been one of the main destinations for their funds.

_______________________________________________________________________

Technical analysis

_______________________________________________________________________

Bitcoin

Bitcoin experienced a surge in price in the past 24 hours. The largest cryptocurrency by market cap managed to increase in value by over 15%, reaching a price of over $6,000. The resistance level of $5,960 has been broken and became a support level.The price push has ended and Bitcoin is now consolidating at the $6,100 level.


Bitcoin’s volume increased only slightly during the upswing, while its RSI grazed the overbought area on the 4-hour chart, but did not pass it.

Key levels to the upside                    Key levels to the downside

1: $6,640                                           1: $5,960

2: $6,850                                           2: $5,000

3: $7,085                                            3: $4,300


Ethereum

Ethereum followed Bitcoin and had a day with a double-digit increase in price. The second-largest cryptocurrency rose over 15% and managed to tackle the $122.5 as well as the $128 resistance levels, turning them into support.


Ethereum’s volume increased greatly during the upswing but died down as the move ended. Its RSI level also increased, with the value currently being at 61.

Key levels to the upside                    Key levels to the downside

1: $168                                                1: $128

2: $178.6                                            2: $122.5 

3: $185                                                3: $100


Ripple

XRP had a great day, as it increased in price by over 5%. However, its fortune is not as great as the other two aforementioned cryptos. The third-largest cryptocurrency by market cap did manage to gain some value but failed to break the $0.165 resistance level, which plays a crucial role in the future price development of XRP.


XRP’s volume increased slightly during the upswing but is back to normal levels now. Its RSI level is currently at the value of 56.

Key levels to the upside                    Key levels to the downside

1: $0.165                                            1: $0.1

2: $0.19

3: $0.2                                              

Categories
Forex Market Analysis

Daily F.X. Analysis, March 19 – Top Trade Setups In Forex – Trump Set to Speak on Coronavirus! 

On the forex front, the ICE U.S. Dollar Index surged 1.3% on the day to 100.91, the highest level since April 2017. The U.S. Labor Department will release initial jobless claims in the week ended March 14 (220,000 expected).

The U.S. official data showed that housing starts posted at an annualized rate of 1.599 million units in February (1.500 million units expected).

Later today, initial jobless claims for the week ended March 14 (220,000 expected), and the Conference Board Leading Index for February (+0.1% on month expected) will be reported. The Commerce Department will report 4Q current account balance (108.5 billion dollars deficit expected). The Philadelphia Federal Reserve will post its Business Outlook Index for March (9.0 expected).

The U.S. dollar strengthened versus its major peers, with the ICE Dollar Index jumping 1.3% to a three-week high of 99.38. Later in the day, the European Commission will post final readings of February CPI (+1.2% on-year expected) and January trade balance (19.2 billion euros surplus expected).

During the U.S. session, the eyes will be on the U.S. Commerce Department, which is due to report February housing starts (1.5 million units expected) and building permits (1.5 million units expected).

Economic Events to Watch Today    


EUR/USD – Daily Analysis

The EUR/USD marked a day-low of 1.0802 before rebounding to close at 1.0962, down 0.3%. The European Central Bank announced a 750 billion-euro bond-buying program to counter the coronavirus impacts. ECB President Christine Lagarde said, “there are no limits” to their commitment to the euro.

The Trump administration announced that Trump administration is planning to give checks directly to Americans in the shape of a $1 trillion stimulus program. Moving ahead, the EUR/USD currency pair may return and possibly break below Tuesday’s low of 1.0955 if the stocks cheer the substantial monetary and fiscal stimulus.

After the announcement of stimulus, the ECB President Christine Lagarde showed a willingness to use all important tools to stop the negative impacts of the deadly virus. At the press time, the EUR/USD currency pair turned lower from 1.0980 to below 1.08 due to the strong haven bid around the dollar rose, producing big gains for the greenback against the bucket of currencies.

Daily Support and Resistance

  • S1 1.0434
  • S2 1.0677
  • S3 1.0795

Pivot Point 1.092

  • R1 1.1038
  • R2 1.1163
  • R3 1.1406

EUR/USD– Trading Tips

On Thursday, the major currency pair EUR/USD continues to trade bearish as it as violated and closed below horizontal support becomes a resistance level of 1.0990. The EUR/USD is currently trading around 1.0970, and it’s forming a lower-lows pattern on the 4-hour chart, which mostly drives a continuation of a selling trend. 

At the moment, the EUR/USD is trading at 1.0890, essentially following the bearish bias. The EUR/USD is expected to find a hurdle around 1.0920, and beyond this, the pair has the potential to target the next resistance level of 1.1030. While the EUR/USD has robust odds of lingering bearish below 1.0920 to target 1.0805. On the daily chart, a violation of 1.0805 can extend the selling trend until 1.0670.


GBP/USD– Daily Analysis

The GBP/USD plunged 3.5% to 1.1633, the weakest level since 1985, as U.K. Prime Minister Boris Johnson’s response to the coronavirus pandemic failed to convince investors. 

The GBP/USD pair slipped due to a stronger dollar after the U.S. official data showed that housing starts posted at an annualized rate of 1.599 million units in February (1.500 million units expected).

As per the latest report, the death losses rose to 99 on Wednesday vs. Tuesday’s 67, reporting a 48% jump. As of March 18, 2,626 people in the United Kingdom were tested for coronavirus. The test numbers have been increasing from just over 1,000 a day at the end of February, when testing started, to more than 6,000 per day by mid-March.

Looking forward, the investors will now keep their eyes on the global measures to control the negative impacts of the virus for taking the near-term direction. However, the greenback may keep benefiting from the same due to its safe-haven status.

Daily Support and Resistance

  • S1 1.038
  • S2 1.1049
  • S3 1.1316

Pivot Point 1.1718

  • R1 1.1986
  • R2 1.2388
  • R3 1.3057

GBP/USD– Trading Tip

The GBP/USD continues to encounter bloodshed in the wake stronger dollar and weakness in the GBP. The direct currency pair continues to drop for a second consecutive week, and so far, it’s has traded bearishly from 1.3000 level to 1.1540 level just in two weeks. 

On the weekly timeframe, the GBP/USD pair has violated the descending triangle pattern, which supports it around the 1.2030 level. Below the 1.2030 level, the GBP/USD is expected to drop further until the next support level of 1.1245. Since the market is oversold, traders may see a bullish correction above 1.1245 level until 1.1885 or 1.2045 level, but then again, chances of selling will remain strong. 


USD/JPY – Daily Analysis

The USD/JPY extended its rally for a second straight session, climbing 0.6% to 108.38. During the Asian session, the USD/JPY currency pair hit the session high of 109.06 before the time of writing, representing 0.70% gains and continued its 3-day bullish streak near above the 108.50 after the latest downbeat data from Japan. As well as, broad-based USD strength also keeps the pair bullish. At the time of writing, the USD/JPY currency pair is currently trading at 108.86 and consolidates in the range between the 107.89 – 109.55.

At the data front, Japan’s National Consumer Price Index (CPI) came in below 0.8% forecast on MoM to 0.4%, whereas the CPI ex Food, Energy (YoY) slipped beneath 0.9% expectations to 0.6% for February.

Following the data, the BOJ minutes for the January monthly meeting announced further support for the Japanese central bank’s Quantitative Easing (Q.E.). As in result, the Japanese yen got another burden to carry, as the Japanese press pushes for government stimulus, which in turn offered additional support to the USD/JPY pair.

Daily Support and Resistance

  • S1 104.02
  • S2 105.92
  • S3 107

Pivot Point 107.83

  • R1 108.9
  • R2 109.73
  • R3 111.63

USD/JPY – Trading Tips

The stronger U.S. dollar has also driven the bullish trend in the USD/JPY currency pair, and it’s currently trading over 109. The indirect currency pair has also violated the double top resistance level of 107.950, and closing of candles above this level may drive further buying in the pair. 

On the 4 hour timeframe, the USD/JPY is still trading within an upward channel, which is likely to drive further buying in the pair. Therefore, the pair may find support at 108.100 level, and above this, the chances of buying remain strong until the next resistance level of 110. Let’s stay bullish above 108.250 today. 

All the best for today!  

Categories
Crypto Market Analysis

Daily Crypto Review, Mar 19 – BitMEX discussing Central Bank Digital Currencies; Cryptos consolidating

The cryptocurrency market has spent yet another day without much movement. Bitcoin is currently trading for $5,305, which represents an increase of 1.62% on the day. Meanwhile, Ethereum lost 0.75% on the day, while XRP lost 2.04%.

Steem took the position of today’s most prominent daily gainer, with gains of 95.53%. On the other side, WAX lost 21.91% on the day, making it the most prominent daily loser.

Bitcoin’s dominance increased by a slight margin over the past 24 hours. Its value is now 64.67%, which represents a 0.16% difference to the upside when compared to yesterday’s value.

The cryptocurrency market capitalization remained at basically the same place, with a current value of $152.36 billion. This value represents an increase of $0.61 billion when compared to the value it had yesterday.

What happened in the past 24 hours

BitMEX Research posted a thought that discusses the two approaches that governments can take regarding the issuance of a Central Bank Digital Currency as well as the ramifications for the economy. BitMEX posted its opinion on Mar 18.

The post said that “From a liquidity perspective, the largest deposit-taking institutions in an economy have an almost unconstrained capability to create new loans since the funds loaned out will automatically get placed back into their own bank as a deposit.”

Honorable mention

MakerDAO

The MakerDAO community has locked in an auction in hopes to cover a multi-million dollar hole in the DAI collateral. The funds were “gone” after the sudden Ethereum price crash on Mar 12.

The proceeds from the auction sale will be used to recapitalize and revitalize the system as well as to compensate the losses suffered by the borrowers. They lost their money as their Ethereum collateral got auctioned off for zero DAI.

_______________________________________________________________________

Technical analysis

_______________________________________________________________________

Bitcoin

Bitcoin had a pretty quiet day with virtually no price movement. There was, at one point, an attempt made by the BTC bears to push the price below $5,000. However, that push ended up quickly and Bitcoin was back to its previous level in no time.


Bitcoin’s volume is stable at the moment, though on quite low levels. Its RSI level is currently sitting at the value of 47.

Key levels to the upside                    Key levels to the downside

1: $5,960                                           1: $5,000

2: $6,640                                           2: $4,300

3: $6,850                                            3: 3,100


Ethereum

Ethereum had a similar day as Bitcoin, though with some differences. Namely, while Bitcoin had an attempted push to the downside, Ethereum tried to break its upside resistance level. However, that ended up without much effect, and Ethereum is now back to its previous level.


Ethereum’s volume is still extremely low and is keeping these levels. Its RSI level is currently slightly below the middle of the value range, sitting at 43.

Key levels to the upside                    Key levels to the downside

1: $122.5                                             1: $100

2: $128                                              2: $80 

3: $168                                           


Ripple

XRP also experienced a slow day with almost no price movement. However, its price moved a bit more than Ethereum’s and Bitcoin’s price. XRP managed to slide down in price by 2%. It is still kept within the same range, currently trading at just above $0.146.


XRP’s volume is extremely low, while its RSI level is sitting at 45 at the time of writing.

Key levels to the upside                    Key levels to the downside

1: $0.165                                            1: $0.1

2: $0.19

3: $0.2                                              

Categories
Forex Market Analysis

Daily FX. Analysis, March 18 – Top Trade Setups In Forex – Inflation Figures Under the Spotlight! 

The US dollar strengthened against its major peers, with the ICE Dollar Index jumping 1.3% to a three-week high of 99.38. Later in the day, the European Commission will post final readings of February CPI (+1.2% on-year expected) and January trade balance (19.2 billion euros surplus expected).

During the US session, the eyes will be on the US Commerce Department, which is due to report February housing starts (1.5 million units expected) and building permits (1.5 million units expected).

Economic Events to Watch Today    


EUR/USD – Daily Analysis

The EUR/USD plunged from 1.5% to 1.1015. The ZEW German Current Situation Index dropped to -43.0 in March (-30.0 estimated) from -15.7 in February and Expectations Index dipped to -49.5 (-30.0 expected) from 8.7. It is worth to mention that the Eurozone’s powerhouse Germany has closed all borders, schools, public places, and unnecessary shops in the wake of intensifying coronavirus. As a result, the continuous decline in the economy could take the speed in the near term, which may add bearish pressures around the EUR.

Looking forward, the traders will keep their eyes on the broader market sentiment. If the global equities flash red, the USD will likely find buyers. At press time, the futures on the S&P 500 are reporting a 3 % decline.

The Federal Reserve and other major central banks have recently delivered rate cuts to ease the economic shock of the coronavirus pandemic. Meanwhile, the Fed has also launched a quantitative easing program worth $700 billion. Other major central banks have also played roles by cutting rates. 

The Trump administration announced on Tuesday that Trump administration is planning to give checks directly to Americans in the shape of a $1 trillion stimulus program. Moving ahead, the EUR/USD currency pair may return and possibly break below Tuesday’s low of 1.0955 if the stocks cheer the heavy monetary and fiscal stimulus.

Daily Support and Resistance

  • S1 1.0882
  • S2 1.1024
  • S3 1.1096

Pivot Point 1.1166

  • R1 1.1239
  • R2 1.1309
  • R3 1.1451

EUR/USD– Trading Tips

On Wednesday, the major currency pair EUR/USD continues to trade mostly lower after violating the horizontal support level pf 1.1095. The EUR/USD is currently trading around 1.0970, and it’s forming a lower-lows pattern on the 4-hour chart, which mostly drives a continuation of a selling trend. 

On the lower side, a continuation of a bearish bias can extend sell-off until 1.0920 and 1.0865. While the bullish breakout of 1.1096 can drive more buying until 1.1240 area. Consider staying bearish below 1.0970 today. 


GBP/USD– Daily Analysis

The GBP/USD sank 1.2% to 1.2118. Official data showed that the UK jobless rate for the three months to January climbed to 3.9% (steady at 3.8% expected). The US continues to struggle from every level, as well as the Federal Reserve, also doing the same to make sure that the world’s largest economy doesn’t getting infected due to the deadly virus. 

At the USD front, the greenback got support from the moves on Tuesday; the early-day decline could have taken clues from US Treasury Secretary Steve Mnuchin that the lack of action could send the Unemployment Rate to 20%.

Later today, the US Commerce Department will report February housing starts (1.5 million units expected) and building permits (1.5 million units expected), which may help determine further trends in the GBP/USD pair.  

The investors will keep their eyes on virus headlines and take clues from the coronavirus relating headlines while the US Senate voting on President Donald Trump’s major stimulus plan as well as the UK PM’s action will be essential to watch. 

Daily Support and Resistance

  • S1 1.1938
  • S2 1.211
  • S3 1.2189

Pivot Point 1.2282

  • R1 1.2362
  • R2 1.2454
  • R3 1.2626

GBP/USD– Trading Tip

A day before, the GBP/USD fell sharply to trade around 1.2060 level and has closed a bearish engulfing candle followed by Doji candles. It’s suggesting the odds of more selling in the market. The Cable has immediate support around 1.2170 level, and above this, the Cable can extend the continuation of a bullish bias until 1.1980 level and 1.1805. The MACD is consistently forming bearish histograms below zero, supporting the selling trend in the GBP/USD pair, which is why we should consider selling below 1.2100 today to target 1.1985 at first.  


USD/JPY – Daily Analysis

The USD/JPY rebounded 1.4% to 107.35. The USD/JPY currency pair dropped below the 107.00 and hit the fresh session lows in the last hours, mainly due to fresh risk catalysts boosted the safe-haven demand. As of writing, the USD/JPY currency pair is currently trading at 107.17 and consolidates in the range between the 106.77 – 107.72. However, the currency pair trading bearish despite the Fed’s continued action mode and downbeat comments from the US policymakers as well as doubt between Japanese firms.

As we know, the currency pair failed to continue its previous day’s strong intraday positive move of over 200 pips and faced some fresh supply during the Asian session on Wednesday, mainly due to improving demand for traditional safe-haven assets.

Despite organized struggles by global central banks and many government stimulus measures to balance the negative economic impact from the coronavirus pandemic, the fears of an expected global slowdown continued losing the investor’s confidence. 

It should be noted that the major reason behind the pair’s decline is the benefitted Japanese yen, which got support as perceived safe-haven status and turned out to be one of the key factors that leave some fresh downward pressure on the pair.

Daily Support and Resistance    

  • S1 101.97
  • S2 104.1
  • S3 105.19

Pivot Point 106.23

  • R1 107.32
  • R2 108.37
  • R3 110.5

USD/JPY – Trading Tips

The USD/JPY is trading at 107.800 and continues to face double top resistance around 108.065. Below this, the USD/JPY is exhibiting a correction which is likely to lead the USD/JPY prices towards 105.960. Closing of 4-hour candle above this level has confirmed the chances of further buying in the pair until 108. Whereas, below 105.950, we may see further selling until 103.750. On the leading indicator’s front, the USD/JPY is in a bullish mode, and we should consider buying trades over 105. All the best for today!  

Categories
Crypto Market Analysis

Daily Crypto Review, Mar 18 – Bitcoin will save the world from crisis, Tim Draper announces

The cryptocurrency market managed stayed at almost the same place as yesterday. Bitcoin climbed above the $5,000 mark and is currently stagnating and consolidating there. Bitcoin is currently trading for $5,341, which represents an increase of 1.3% on the day. Meanwhile, Ethereum lost 0.28% on the day, while XRP gained 0.56%.

Dragon Coins took the position of today’s most prominent daily gainer, with gains of 62.43%. On the other side, Terra lost 4.53% on the day, making it the most prominent daily loser.

Bitcoin’s dominance increased by a slight margin over the past 24 hours. Its value is now 64.51%, which represents a 0.57% difference to the downside when compared to yesterday’s value.

The cryptocurrency market capitalization went up slightly, with a current value of $151.75 billion. This value represents an increase of $5.61 billion when compared to the value it had yesterday.

What happened in the past 24 hours

Right as bitcoin recovered slightly after a number of back-to-back market crashes last week, investor Tim Draper announced another optimistic forecast about Bitcoin.

Draper announced that decentralization powered by Bitcoin as well as other new technologies is one of the tools that has the “ability to transform the biggest industries in the world.”

Honorable mention

NEO

NEO-based DEX Switcheo partnered with the Zilliqa platform to allow trading of Ethereum-based and EOS-based assets on their platform.

According to a Mar 16 announcement, after the launch, Zilliqa holders will have access to Ethereum-based assets for the first time. Switcheo also plans to add Bitcoin (BTC) support soon.

_______________________________________________________________________

Technical analysis

_______________________________________________________________________

Bitcoin

Bitcoin experienced almost no price movement in the past 24 hours. The price was completely flat while the volume lowered slightly. This area of no movement happened ever since Bitcoin stepped into the $5,300 area.


Bitcoin’s volume is quite low, while its RSI level is in the middle of the value spectrum (currently at 45).

Key levels to the upside                    Key levels to the downside

1: $5,960                                           1: $5,000

2: $6,640                                           2: $4,300

3: $6,850                                            3: 3,100


Ethereum

Ethereum did pretty much the same as Bitcoin by mirroring its movement (or lack thereof). The second-largest cryptocurrency did nothing but move sideways for the whole day, with the price hovering right below the $122.5 resistance.


Ethereum’s volume decreased further, while its RSI level is currently at 40. There were no changes in key levels due to no movement to the upside or downside.

Key levels to the upside                    Key levels to the downside

1: $122.5                                             1: $100

2: $128                                              2: $80 

3: $168                                           


Ripple

XRP, for the first time in a while, didn’t just follow the general direction of the market but actually mirrored Bitcoin’s and Ethereum’s movement. The lack of volume resulted in sideways trading with no price movement whatsoever. The third-largest cryptocurrency is moving in a range between $0.1 and $0.165.


XRP’s volume decreased even more in the past 24 hours, while its RSI level is currently at the 44 mark.

Key levels to the upside                    Key levels to the downside

1: $0.165                                            1: $0.1

2: $0.19

3: $0.2                                              

Categories
Crypto Market Analysis

Daily Crypto Review, Mar 17 – Bitcoin back up above $5,000 as bulls gather up

The cryptocurrency market managed to recover slightly from the fall it had yesterday. Bitcoin went above the $5,000 mark and regained some confidence. Bitcoin is currently trading for $5,297, which represents an increase of 2.83% on the day. Meanwhile, Ethereum gained 0.48% on the day, while XRP gained 1.02%.

WAX took the position of today’s most prominent daily gainer, with gains of 29.55%. On the other side, Komodo lost 13.25% on the day, making it the most prominent daily loser.

Bitcoin’s dominance increased by a slight margin over the past 24 hours. Its value is now 65.08%, which represents a 0.7% difference to the upside when compared to yesterday’s value.

The cryptocurrency market capitalization went up slightly, with a current value of $146.14 billion. This value represents an increase of $5.38 billion when compared to the value it had yesterday.

What happened in the past 24 hours

The fight against the Coronavirus pandemic is even present in the sphere of GPU mining, as the US chip manufacturer NVIDIA proposed for all users to use their computers to help the cause.

This initiative will accept donations of unused GPU computing power and then distribute it to an international processing power network. This will, in turn, be used to research COVID-19.

Honorable mention

Cardano

Earlier today, March 16, The Cardano Foundation made announced on its website that Z/Yen Group Limited (based in the UK) has initiated legal proceedings against the foundation.

Z/Yen Group Limited is a fintech company (think tank) as well as a former research partner of the Cardano Foundation.

_______________________________________________________________________

Technical analysis

_______________________________________________________________________

Bitcoin

After breaking $5,000 to the downside, Bitcoin bulls managed to gather and push its price back up. After struggling for a whole day, Bitcoin finally managed to break the $5,000 barrier and to reach consolidation above it. The largest cryptocurrency is now trading near the $5,250 area.


Bitcoin’s volume increased slightly during the breakout but quickly returned to normal. Its RSI level on the 4-hour chart is approaching the middle of the value range, currently being at around 44.

Key levels to the upside                    Key levels to the downside

1: $5,960                                           1: $5,000

2: $6,640                                           2: $4,300

3: $6,850                                            3: 3,100


Ethereum

Ethereum, unlike Bitcoin, did not move much in the past 24 hours. While it tried to replicate Bitcoin’s movements to the upside, the bull presence wasn’t strong enough to push the price above the $122.5 mark.


Ethereum’s volume is quite low, which is one of the main factors contributing to ETH not breaking the $122.5 resistance level. Its RSI level on the 4-hour chart is currently slightly above the oversold area.

Key levels to the upside                    Key levels to the downside

1: $122.5                                             1: $100

2: $128                                              2: $80 

3: $168                                           


Ripple

Our yesterday’s report said that XRP was in a better spot at that moment as it did not break any support levels during the price drop. This is true (but to the upside now) in today’s case as well. XRP gained some value as the bulls gathered up for a push, but the third-largest cryptocurrency did not break any significant levels (now to the upside).


XRP’s volume is quite low at the moment, while its RSI level on the 4-hour chart is currently 44.

Key levels to the upside                    Key levels to the downside

1: $0.165                                            1: $0.1

2: $0.19

3: $0.2                                              

Categories
Forex Market Analysis

Daily F.X. Analysis, March 16 – Top Trade Setups In Forex – G7 Meetings In Highlights! 

During Asian trading hours on Monday, the ICE U.S. Dollar Index dropped 1.1% to 97.67, giving up most of its gains made in the prior session, as the Fed slashed interest rates over the weekend. The U.K. house price grew 1.0% on month in March (+0.8% in February), according to the home-listing website Rightmove.

In the U.S., the New York Federal Reserve will publish March Empire Manufacturing Index (4.9 expected).

Economic Events to Watch Today    


EUR/USD – Daily Analysis

On Monday, the European Union finance ministers plan to agree on an economic acknowledgment to the coronavirus pandemic, with the European Commission forecasting the consequences of the virus could drive the European Union into a recession.

The central bank kept rates unchanged on Thursday and raised its asset purchase program by EUR120B. They introduced a new program of cheap loans that would necessarily pay banks up to 0.75% to give to small businesses. However, the EUR traders were not impressed, as indicated by the long-tail (seller exhaustion) attached to Thursday’s candle. 

Whereas, the broad market recession fears continue to increase the progress into the U.S. bonds, which translates into lower returns on the bonds, ultimately keep the greenback under pressure. The U.S. dollar index trades around 98.25, down 0.50% on the day, having stopped its recovery just shy of 98.50. 

Looking forward, the markets now keep their eyes on the European Union (E.U.) Finance Ministers’ and G7 leaders’ economic response to the virus outbreak, which is due later on Monday for taking fresh near-term trading opportunities in the main currency pair. 


Daily Support and Resistance

  • S1 1.0654
  • S2 1.0918
  • S3 1.1045

Pivot Point 1.1182

  • R1 1.1309
  • R2 1.1447
  • R3 1.1711

EUR/USD– Trading Tips

The EUR/USD has traded mostly lower, bouncing off the double bottom support level of 1.1095 level. The EUR/USD is currently trading around 1.1165, and it’s forming a lower-lows pattern on the 4-hour chart, which mostly drives a continuation of a selling trend. On the lower side, a continuation of a bearish bias can extend sell-off until 1.1100 and 1.1095. While the bullish breakout of 1.1350 can drive more buying until 1.1454 area. Consider staying bullish over 1.1182 and bearish below the same level today. 


GBP/USD– Daily Analysis

The GBP/USD dropped to 1.2321. Over the weekend, the global coronavirus pandemic worsened, particularly in Europe. Italy saw the number of coronavirus cases surge past 24,700 (1809 deaths), while Spain reported over 7,800 cases in total, Germany over 5,800 cases and France over 5,400 cases. In the U.S., the number of cases jumped to nearly 3,600 (68 deaths).

On Sunday, U.S. Federal Reserve slashed interest rates to near zero percent while announcing plans to purchase 700 billion dollars in bonds and securities to stabilize financial markets and support the economy. 

It is worth mentioning that the global markets remain sluggish despite the Fed, and the RBNZ announced an unscheduled rate cut while the BOJ is in the pipeline. As in result, the risk-tone remains on the back foot with the U.S. treasury yields falling almost 30 basis points while markets in Asia also flash losses by the press time.

Looking forward, the coronavirus headlines and the central bank updates will be the key to watch for near-term direction, while the traders will keep their eyes on the EU-UK disputes regarding Brexit.

On Monday open, U.S. stock futures dropped nearly 5% to their daily limit.

U.K. house price grew 1.0% on month in March (+0.8% in February), according to the home-listing website Rightmove.

Daily Support and Resistance

  • S1 1.1957
  • S2 1.2295
  • S3 1.2436

Pivot Point 1.2633

  • R1 1.2774
  • R2 1.297
  • R3 1.3308

GBP/USD– Trading Tip

The GBP/USD fell sharply to trade around 1.2360 level and has closed a bullish candle followed by strong selling candles. The Cable has immediate support around 1.2270 level, and above this, the Cable can extend the continuation of a bullish bias until 1.2450 level and 1.2625.  

The MACD is consistently forming bearish histograms below zero, supporting the selling trend in the GBP/USD pair, which is why we should consider selling below 1.2633 today. Recently, the GBP/USD has closed a bullish candle that can drive buying in the GBP/USD, and it may lead its prices higher towards 1.2685 level. 


USD/JPY – Daily Analysis

Today in the Asian session, the USD/JPY currency pair flashing red and trading below the 107.00, representing 1.40% losses on the day after the Bank of Japan avoided delivering the rate cut ahead of the European open on Monday.

During its emergency 1-day monetary policy meeting, the Bank of Japan (BOJ) board members decided to keep rates unchanged at -10bps whereas maintaining a10-yr JGB yield target at 0.00%. Although, the decision on maintaining its interest rate targets was made by a 7-2 vote with board members Goushi Kataoka and Yutaka Harada dissenting.

At the BOJ front, the BoJ Interest Rate Decision is announced by the Bank of Japan. Usually, if the BoJ raises the interest rates, it is positive, or bullish, for the JPY. Likewise, if the BoJ has a dovish view on the Japanese economy and cuts the interest rate, it is considered negative or bearish.

On the other hand, the U.S. Federal Reserve (Fed) announced a surprise rate cut to 0.25% in addition to $700 billion worth of Quantitative Easing. As well as, the Fed policymakers signaled that there would not be any Federal Open Market Committee (FOMC) during this week, which was earlier scheduled for Wednesday.

Whereas, the RBA indicated that it would purchase bonds while holding a special meeting on Thursday, whereas RBNZ finally also joined the role of major central bankers that offered significant rate cuts in order to control the coronavirus (COVID-19). 


Daily Support and Resistance

  • S1 99.26
  • S2 102
  • S3 103.37

Pivot Point 104.74

  • R1 106.11
  • R2 107.47
  • R3 110.21

USD/JPY – Trading Tips

The USD/JPY is trading at 107.800 and has already completed a 61.8% Fibonacci retracement level at 108.065. Below this, the USD/JPY is exhibiting a correction which is likely to lead the USD/JPY prices towards 105.960. Closing of 4-hour candle above this level has confirmed the chances of further buying in the pair until 108. Whereas, below 105.950, we may see further selling until 103.750. On the leading indicator’s front, the USD/JPY is in a bullish mode, and we should consider buying trades over 105. All the best for today!  

Categories
Crypto Market Analysis

Daily Crypto Review, Mar 16 – Bitcoin under $5,000, how far down can we go?

The cryptocurrency market had yet another meltdown of epic proportions today. Bitcoin fell under $5,000 while most altcoins witnessed a price decrease that even goes into double digits on the daily. Bitcoin is currently trading for $4,847, which represents a staggering 7.93% decrease on the day. Meanwhile, Ethereum lost 11.82% on the day, while XRP lost 7.65%.

Dragon Coins took the position of today’s most prominent daily gainer, with gains of 117.84%. On the other side, Ren lost 27.37% on the day, making it the most prominent daily loser.

Bitcoin’s dominance decreased greatly over the weekend after falling over 5% in just one day. Its value is now 64.38%, which represents a 4.98% difference to the upside when compared to Friday’s value.

The cryptocurrency market capitalization went down significantly yet again, with a current value of $140.72 billion. This value represents a decrease of $12.8 billion when compared to the value it had on Friday.

What happened in the past 24 hours

Coinbase, which is one of the biggest US exchanges, recently revealed a new feature on its platform called Bitcoin batching. This feature is designed to save users money on transaction fees.

This move was taken by Coinbase in order to improve the customer experience, as it will allow single on-chain crypto transactions to be bundled into one.

Honorable mention

Tezos (XTZ)

A digital asset marketplace Binance.US will list Tezos’s XTZ token on March 16th. According to the announcement on Binance’s website, XTZ/USD, as well as XTZ/BUSD trading pairs, will be available to traders on Monday, March 16th.

_______________________________________________________________________

Technical analysis

_______________________________________________________________________

Bitcoin

After a pretty stable weekend of trading just above $5,000, Bitcoin’s price experienced some turbulence. At first, it seemed that the bulls have taken the lead and Bitcoin started moving up. However, the move slowed down as Bitcoin aproached $6,000. This newfound resistance got confirmed as Bitcoin’s price bounced back to $5,300, and then began falling even further. The largest cryptocurrency managed to go under the major support level of $5,000, which is a major psychological point. If the price continues going down this way, we can expect a major pinpoint to be the low of $3,100.


Bitcoin’s volume is average, except during the times of the price increases or decreases when it goes up. Its RSI level is currently in the oversold territory on the 4-hour chart.

Key levels to the upside                    Key levels to the downside

1: $5,000                                           1: $4,300

2: $5,960                                           2: $3,100

3: $6,640                                            


Ethereum

Ethereum shared a similar faith to Bitcoin. The second-largest cryptocurrency went above the $128 resistance level, but the bullish move quickly got shut down as bears took over. Ethereum then fell under the $128 and $122.5 support levels and is now trading just under $110.


Ethereum’s volume is quite low, while its RSI is in the oversold area on the 4-hour chart.

Key levels to the upside                    Key levels to the downside

1: $122.5                                             1: $100

2: $128                                              2: $80 

3: $168                                           


Ripple

Even though XRP almost mirrored the move that Ethereum made as far as price movement goes, it is in a much better spot at the moment. The third-largest cryptocurrency tried moving up but got stopped at the $0.165 resistance level. Right after that, the price started falling, and XRP reached the price of around $0.135. However, the price is slowly recovering, and the move to the downside didn’t break and support levels.


XRP’s volume is low, while its RSI level just went out of the oversold area on the 4-hour chart.

Key levels to the upside                    Key levels to the downside

1: $0.165                                            1: $0.1

2: $0.19

3: $0.2                                              

Categories
Forex Market Analysis

Daily F.X. Analysis, March 13 – Top Trade Setups In Forex – Market Tosses in Profits & Losses Amid Coronavirus! 

On the forex front, the U.S. dollar gained traction on Thursday, with the ICE Dollar Index climbing 1.0% on the day to 97.50. The U.S. official data showed that producer prices declined 0.6% on month in February (-0.1% expected), and initial jobless claims fell to 211,000 in the week ended March 7 (220,000 expected).

Later today, March University of Michigan’s Consumer Sentiment Index (preliminary reading, 95.0 expected) will be reported.

U.S. official data showed that producer prices declined 0.6% on month in February (-0.1% expected), and initial jobless claims fell to 211,000 in the week ended March 7 (220,000 expected).

Later today, March University of Michigan’s Consumer Sentiment Index (preliminary reading, 95.0 expected) will be reported.

Economic Events to Watch Today    


EUR/USD – Daily Analysis

The EUR/USD lost 0.8% to 1.1181. The European Central Bank expanded its asset purchase program by EUR120 billion while keeping its key interest rates unchanged. ECB President Christine Lagarde said, “the spread of the coronavirus Covid-19 has been a major shock to the growth prospects of the global economy and the euro areas economy, and it has heightened market volatility”.

The central bank kept rates unchanged on Thursday and raised its asset purchase program by EUR120B. They introduced a new program of cheap loans that would necessarily pay banks up to 0.75% to give to small businesses. However, the EUR traders were not impressed, as indicated by the long-tail (seller exhaustion) attached to Thursday’s candle. 

It should be noted that the 3-month euro-dollar and dollar-yen swap spreads had widened to levels last seen in 2017 on Thursday. Notably, spreads widened by nearly 40 basis points, the most significant single-day increase since December 2008, highlighting stress in the dollar funding markets. Whereas, the Federal Reserve injected liquidity by $1.5 billion. As a result, the credit markets could normalize ahead of the weekend.

The German Federal Statistical Office will report final readings of February CPI (+1.7% on-year expected). France’s INSEE will post final readings of February CPI (+1.4% on-year expected).


Daily Support and Resistance

  • S1 1.0654
  • S2 1.0918
  • S3 1.1045

Pivot Point 1.1182

  • R1 1.1309
  • R2 1.1447
  • R3 1.1711

EUR/USD– Trading Tips

The EUR/USD has traded mostly lower to test the double bottom support level of 1.1095 level. The EUR/USD is currently trading around 1.1195, and it’s forming a lower-lows pattern on the 4-hour chart, which mostly drives a continuation of a selling trend. On the lower side, a continuation of a bearish bias can extend sell-off until 1.1100 and 1.1095. While the bullish breakout of 1.1350 can drive more buying until 1.1454 area. Consider staying bullish over 1.1182 and bearish below the same level today. 


GBP/USD– Daily Analysis

The GBP/USD plunged 1.9% to 1.2576, the lowest level since last October. Sterling fell against the U.S. dollar despite weaker than expected U.S. economic events. The U.S. official data showed that producer prices declined 0.6% on month in February (-0.1% expected), and initial jobless claims fell to 211,000 in the week ended March 7 (220,000 expected).

At the U.K. front, there are fewer chances that the British PM Johnson will announce any significant stimulus after the BOE joined the budgetary push to defeat the virus the previous day. However, Traders should wait for the final announcement because we all know that the Tory leader is famous for providing surprises.

Apart from the coronavirus headlines, traders will likely pay a little attention to the U.S. data. However, the Bank Of England minutes could offer a robust near-term direction after the central bank marked a surprise cut during the week. “Minutes are released at noon GMT from MPC’s “special” March 10 meeting, where they decided to coordinate the inter-meeting easing package announced Wednesday.

Later in the day, the U.S. Labor Department will release the February import price index (-1.0% expected). The University of Michigan will publish its Consumer Sentiment Index for March (95.0 expected).


Daily Support and Resistance

  • S1 1.2523
  • S2 1.2695
  • S3 1.2758

Pivot Point 1.2867

  • R1 1.293
  • R2 1.3039
  • R3 1.3211

GBP/USD– Trading Tip

On Friday, the GBP/USD continues to trade in a bearish mode due to the BOE rate cut decision. The GBP/USD has dropped further after violating the immediate support level of 1.2750, which is now working as a resistance. The sell-off in the GBP/USD was so solid that it’s pricing fell down to 1.2506 level which is now working as a support. 

Recently, the GBP/USD has closed a bullish candle that can drive buying in the GBP/USD, and it may lead its prices higher towards 1.2685 level. The MACD is consistently forming bearish histograms below zero, supporting the selling trend in the GBP/USD pair, which is why we should consider selling below 1.2825 today. 


USD/JPY – Daily Analysis

During the early Asian session, the USD/JPY currency pair flashing green but dropped from the session highs, because the Japanese yen is finding bids, mainly due to the sharp decline in the U.S. stock futures. At the press time, the USD/JPY currency pair is currently trading at 105.41 and consolidates in the range between the 104.51 – 106.03. However, the pair dropped from 105.20 to 104.68 in the 60 minutes to 01:30 UTC and was last seen trading around 104.89. 

The futures Wall Street’s benchmark equity index S&P 500 are currently down 1.64 percent, having started the Asian session on a relatively less risk-off note. 

Whereas, the global equities and the U.S. stock markets are expected to trade red on Friday. In the time being, the Asian equities are flashing red with Japan’s Nikkei reporting a 9% drop. 

The BOJ offered a liquidity injection of 500 billion yen early Friday, but so far, but that has failed to improve the risk sentiment and weaken the Japanese yen.


Daily Support and Resistance

  • S1 99.41
  • S2 102.11
  • S3 103.7

Pivot Point 104.81

  • R1 106.4
  • R2 107.51
  • R3 110.21

USD/JPY – Trading Tips

The USD/JPY is trading at 105.800 and has already bounced off a double bottom support level of 104.100. Closing of 4-hour candle above this level has confirmed the chances of further buying in the pair. The recent candles on the 4-hour chart are three white soldiers who are bullish nature and typically drive buying in the market. 

The immediate resistance that USD/JPY can face is around 106.150 level, and violation of this can extend more buying until 107.450 marks. On the lower side, support stays around 104. All the best for today!  

Categories
Crypto Market Analysis

Daily Crypto Review, Mar 13 – Cryptos staring into the abyss as Bitcoin drops to $3,800

The cryptocurrency market had a meltdown of epic proportions today. Almost every single cryptocurrency dropped over 20% in value. However, almost all the other markets are bleeding heavily as well due to the halt of the economy, which is caused by the Coronavirus outbreak. Bitcoin is currently trading for $5.025, which represents a staggering 34.29% decrease on the day. Meanwhile, Ethereum lost 29.15 % on the day, while XRP lost 24.74%.

Multi-collateral DAI took the position of today’s most prominent daily gainer, with gains of 7%. On the other side, Synthetix Network lost 49.74% on the day, making it the most prominent daily loser.

Bitcoin’s dominance decreased greatly over the past 24 hours. Its value is now 59.4%, which represents a 5.95% difference to the downside when compared to yesterday’s value.

The cryptocurrency market capitalization melted down, with a current value of $153.59 billion. This value represents a decrease of a whopping $63.64 billion when compared to the value it had yesterday.

What happened in the past 24 hours

The European Central Bank (ECB) announced that it would provide a $135 billion stimulus to the market. This number certainly dwarfs Bitcoin’s entire market cap. This move is not unique, as similar efforts have been shown from the US Federal Reserve on Mar 10.

In an effort to combat currently struggling markets, The European Central Bank made a decision to not cut interest rates any further, but to rather allocate 120 billion Euros to its asset purchase program.

Honorable mention

Enjin (ENJ)

Blockchain-based gaming ecosystem Enjin has just launched its Multiverse Program. The platform is now seeking applications coming from interested developers.

The Multiverse program is designed to attract developers to enter and explore Enjin’s Multiverse platform, which is a gaming platform supporting the creation of in-game digital assets. These assets can be transferred as well as used across multiple games that are hosted in the multiverse.

_______________________________________________________________________

Technical analysis

_______________________________________________________________________

Bitcoin

Bitcoin’s price had quite a meltdown in the past 24 hours. All technical analysis seems to be out of the game as BTC’s price went down from $7,400 to $3,830 in a matter of hours. The price broke every possible line and anchor it could hang onto and dropped to the lows of $3,830. However, the price quickly moved back up to just over $5,000 which is where it is at the moment.


Bitcoin’s volume increased greatly due to the selloff, while its RSI is deep in the oversold territory on every chart except for the weekly chart.

Key levels to the upside                    Key levels to the downside

1: $6,640                                           1: $5,000

2: $6,850                                           2: $4,300

3: $7,060                                            3: $3,100


Ethereum

Ethereum took a big hit as well, alongside other altcoins. In a price drop led by Bitcoin, Ethereum lost over 20% of its value in the past 24 hours. Its price fell to a staggering $90 all the way up from above $185 levels. The price has stabilized since and is trading at around $125. Unlike Bitcoin, though, Ethereum found resistance closeby, which is at the $122.5 level.


Ethereum’s volume increased due to the selloff, while its RSI level is oversold on every single chart except for the weekly chart.

Key levels to the upside                    Key levels to the downside

1: $128                                                1: $122.5

2: $168                                              2: $100 

3: $178.6                                            3: $80


Ripple

XRP was no different than other altcoins in terms of price development over the past 24 hours. Its price dumped as well, dropping to lows of $0.1. The price has recovered since and is now trading and consolidating near $0.14. However, XRP might be in the worst position out of the top3 cryptocurrencies as it does not have an anchor point to the downside.


XRP’s volume increased greatly, while its RSI level dropped to deeply oversold levels except for the weekly chart, where it is nearing the oversold area as well.

Key levels to the upside                    Key levels to the downside

1: $0.165                                            1: $0.1

2: $0.19

3: $0.2                                              

Categories
Forex Market Analysis

Daily F.X. Analysis, March 12 – Top Trade Setups In Forex – Brace for ECB Interest Rate Decision! 

The U.S. dollar strengthened versus its major peers for a second straight session, with the ICE Dollar Index bouncing 0.2% on the day to 96.60. The European Central Bank will announce its key policy rates (deposit facility rate at -0.5% expected). The European Commission will report January industrial production (+1.5% on month expected). During the U.S. session, the U.S. Labor Department will release February PPI (+1.8% on-year expected), and initial jobless claims in the week ended March 7 (220,000 expected).

Economic Events to Watch Today   


EUR/USD – Daily Analysis

The EUR/USD fell 0.2% to 1.1263. It is reported that the European Central Bank President Christine Lagarde told European Union leaders that Europe is facing a major economic shock, and that ECB is looking at all of its tools for the monetary policy meeting due later today.

There are so high chances of a slowdown in the Eurozone, especially in Germany, in the wake of dangerous coronavirus. So, possibly the European Central Bank will go with another stimulus measure on Thursday to soften the economic fallout, which may hurt the shared currency very well. 

The European Central Bank will announce its key policy rates (deposit facility rate at -0.5% expected). The European Commission will report January industrial production (+1.5% on month expected).

Considering the slowdown in the economy, the markets are expecting a cut in the deposit rate, which currently stands at -0.5%. Therefore, the EUR could see a sharp rise if the central bank keeps rates unchanged. The traders are keenly awaiting the ECB rate decision to take new directions. The Italian Quarterly Unemployment Rate, Industrial Production m/m, Italian 10-y Bond Auction also will be key to watch.

Daily Support and Resistance

  • S1 1.106
  • S2 1.1176
  • S3 1.1218

Pivot Point 1.1293

  • R1 1.1335
  • R2 1.1409
  • R3 1.1526

EUR/USD– Trading Tips

The EUR/USD is trading with a mixed bias around 1.1305 on Thursday as it seems to extend the bearish trend even after completing the 38.2%% and 50% Fibonacci retracement levels around 1.1350 and 1.1275.  

The EUR/USD is currently trading around 1.1305, and it’s forming lowers low pattern on the 4-hour chart, which mostly drives a continuation of a selling trend. On the lower side, a continuation of a selling bias can extend sell-off until 1.1200 and 1.1095. While the bullish breakout of 1.1350 can drive more buying until 1.1454 area. Consider staying bullish over 1.1275 and bearish below the same level today. 


GBP/USD– Daily Analysis

The GBP/USD dropped 0.7% to 1.2817. The Bank of England slashed its benchmark rate by 50 basis points to 0.25% after a special meeting, citing economic shock from the coronavirus. On the other hand, official data showed that the U.K.’s GDP growth was flat on month in January (+0.2% estimated), and industrial production declined 0.1% in February (+0.3% expected).

Whereas, the U.S. 10-year Treasury yields failed to continue the previous day’s run-up, current down by 8-basis points (bps) to 0.67%.

The U.K. Office for National Statistics will report January monthly GDP (+0.2% on month expected), industrial production (+0.3% on month expected), manufacturing production (+0.2% on month expected) and trade balance (356 million pounds deficit projected). 

At the U.K. front, there are fewer chances that the British PM Johnson will announce any major stimulus after the BOE joined the budgetary push to defeat the virus the previous day. However, Traders should wait for the final announcement because we all know that the Tory leader is famous for providing surprises.

Looking forward, the US PPI and Jobless Claims will likely entertain the momentum traders. The overall PPI was likely lower due to the weakening in energy prices, similar to the pattern in the CPI (TD -0.2%). The core measures were probably moderately weak as well after the above-trend readings in January.

Daily Support and Resistance

  • S1 1.2523
  • S2 1.2695
  • S3 1.2758

Pivot Point 1.2867

  • R1 1.293
  • R2 1.3039
  • R3 1.3211

GBP/USD– Trading Tip

On Thursday, the GBP/USD continues to trade in a bearish mode due to the BOE rate cut decision. The GBP/USD has dropped further after violating the immediate support level of 1.2850, which is now working as a resistance. 

Continuation of a selling trend can lead the GBP/USD prices towards 1.2740 and 1.2720. On the higher side, the GBP/USD is likely to trade bullish until 1.2840 level, and bullish breakout of which may drive further buying until 1.2910 level. The MACD is consistently forming bearish histograms below zero, supporting the selling trend in the GBP/USD pair, which is why we should consider selling below 1.2825 today. 


USD/JPY – Daily Analysis

The USD/JPY currency pair hit the bearish track and dropped below the 104.00, mainly due to a sharp decline in the equity market. U.S. President Donald Trump failed to ease the fears about intensifying coronavirus slowdown in the global economy, which later boosted the safe-haven Japanese yen and sent the USD/JPY pair lower near the 103.30. As of writing, the safe haven pair is trading at 107.30 and consolidates in the range between the 103.09 – 104.81.

Trump said during his speech that the U.S. would ban all flights from Europe to the U.S. for the next 30 days effective Friday at midnight. While also says that travel bans will not apply to the U.K., He said that the U.S. would take emergency action to provide financial relief for workers who are ill, hospitalized, or caring for others due to coronavirus. Whereas also says that we will provide capital and liquidity to the small firms which are affected by the coronavirus, provide low-interest loans as well. Trump promised to provide $200 billion in additional liquidity in the fight against coronavirus. 

As we already mentioned that the investors were expecting a more potent stimulus and sold risk after Trump’s speech. The S&P 500 futures, which traded 0.5% lower ahead of President’s address, are now reporting a 2.4% decline. Meanwhile, the yield on the U.S. 10-year Treasury registering losses by 5-basis points at 0.76%. 

Daily Support and Resistance

  • S1 99.41
  • S2 102.11
  • S3 103.7

Pivot Point 104.81

  • R1 106.4
  • R2 107.51
  • R3 110.21

USD/JPY – Trading Tips

The USD/JPY is trading at 103.800 and has already violated the double bottom support level of 104.100. Closing of 4-hour candle below this level confirms the chances of further selling in the pair. The recent candle on the 4-hour chart is bearish engulfing in nature as it’s covering the full body of the precious candle, and it signifies the chances of further selling in the USD/JPY pair. 

Below 104.250, the selling trend continuation can lead the USD/JPY prices towards 101.670, whereas, further buying over 104.250 can lead the USD/JPY to 106.250 area.

All the best for today!  

Categories
Crypto Market Analysis

Daily Crypto Review, Mar 12 – The US creating AmeriCoin? Altcoins plunging while Bitcoin increases its dominance

The cryptocurrency market moved down yet again in the past 24 hours. However, Bitcoin held up much better than most cryptos. Bitcoin is currently trading for $7,728, which represents a 2.1% decrease on the day. Meanwhile, Ethereum lost 7.18 % on the day, while XRP lost 4.57%.

Aave took the position of today’s most prominent daily gainer, with whopping gains of 35.9%. On the other side, WAX lost 20.15% on the day, making it the most prominent daily loser.

Bitcoin’s dominance increased greatly over the past 24 hours. Its value is now 65.45%, which represents a 1.52% difference to the upside when compared to yesterday’s value.

The cryptocurrency market capitalization lost a lot of value over the past 24 hours due to altcoins plunging. It is currently valued at $217.23 billion, which represents a decrease of $7.83 billion when its value is compared to the value it had yesterday.

What happened in the past 24 hours

Adam Kokesh, the first libertarian US 2020 presidential election candidate, just appointed Alastair Caithness as his personal chief blockchain policy advisor. The main purpose of Caithness’s role is to work on the development of a US-made sovereign cryptocurrency, better-known as AmeriCoin.

Caithness will focus on developing a cryptocurrency that is pegged to all the assets of the Federal government. The assets included will be the US government’s substantial land, gold, energy, timber, and mineral reserves.

Honorable mention

Basic Attention Token (BAT)

Brave purchased a whopping amount of 534,441 Basic Attention Tokens (BAT) on Mar 9. The event of purchasing BAT tokens happens just one day before Brave made an announcement of a partnership with TAP Network. This partnership will enable convertibility of BAT tokens into “gift cards from hundreds of national brands”.

_______________________________________________________________________

Technical analysis

_______________________________________________________________________

Bitcoin

Bitcoin is slowly continuing its price drop as bears took over the market. The biggest cryptocurrency by market cap fell under the $7,760 support level, but did not go too far down from it. BTC is currently trading between $7,600 and $7,700, with the next significant support level standing at $7,420.


Bitcoin’s volume has maintained levels it had yesterday, while its RSI value is declining towards oversold again.

Key levels to the upside                    Key levels to the downside

1: $7,760                                           1: $7,420

2: $8,000                                           2: $7,085

3: $8,650                                            3: $6,850


Ethereum

Ethereum took a big hit in the past 24 hours. The second-largest cryptocurrency by market cap fell under the support level of $198 as well as the $193.5 level. The next support, which is sitting at $185, held up quite well and held back the bears for now. However, the short-term outlook is certainly not positive.


Ethereum’s volume is low when compared to the previous days, while it is keeping the levels of the beginning of March. Its RSI level is on the verge of reaching oversold territory.

Key levels to the upside                    Key levels to the downside

1: $193.6                                             1: $185

2: $198                                              2: $178.5 

3: $217.7                                             3: $167.8


Ripple

XRP followed the daily trend of altcoins underperforming Bitcoin. The third-largest cryptocurrency by market cap lost almost 5% on the daily, but still outperformed Ethereum. XRP’s price fell below the support level of $0.2 but did not reach the $0.1985 level yet.


XRP’s volume is quite low when compared to the past couple of days, while its RSI level is approaching the oversold area, hovering around the value of 34.

Key levels to the upside                    Key levels to the downside

1: $0.221                                            1: $0.2

2: $0.227                                            2: $0.1985

3: $0.235                                             3: $0.19

Categories
Forex Market Analysis

Daily F.X. Analysis, March 11 – Top Trade Setups In Forex – Who’s Up for U.S. Inflation Rate? 

On the forex front, the ICE U.S. Dollar Index rebounded 1.7% on the day to 96.45, snapping a three-day losing streak, as investors anticipated that fiscal stimulus from the U.S. government would limit the scope for interest rates cut. The U.S. Labor Department will report February CPI (+2.2% expected). The Treasury will post the February monthly budget statement (236.8 billion dollars deficit expected). Here’s an update on the technical side of the market. 

Economic Events to Watch Today   


EUR/USD – Daily Analysis

The EUR/USD retreated 1.2% to 1.1312. Most of the movement in the EUR/USD is triggered in the wake of low impact economic events. Regarding the U.S. economic data, the Small Business Optimism Index by the National Federation of Independent Business (NFIB) rose to 104.5 in February (102.8 expected).

Euro also slipped in the wake of the bearish stock market. The European stocks were broadly lower, with the Stoxx Europe 600 Index declining 1.1%. Germany’s DAX slid 1.4%, France’s CAC lost 1.5%, and the U.K.’s U.K.’s FTSE 100 was down 0.1%.

Overall, the level of uncertainty rose in Italy, where 16 million people in Lombardy and different sections of the north are presently below quarantine, there were 133 life losses announced on Sunday, drawing the sum to 366. More than 7,000 people in the country have been verified to have the disease. 

There are so high chances of a slowdown in the Eurozone, especially in Germany, in the wake of dangerous coronavirus. So, possibly the European Central Bank will go with another stimulus measure on Thursday in order to soften the economic fallout, which may hurt the shared currency very well. 

Looking forward, the traders will keep their eyes on the incoming virus updates and its impact on the risk sentiment and dollar trades ahead of the US CPI data, which is scheduled to release later today at 1230 GMT.

Daily Support and Resistance

  • S1 1.107
  • S2 1.1197
  • S3 1.1245

Pivot Point 1.1323

  • R1 1.1371
  • R2 1.145
  • R3 1.1576

EUR/USD– Trading Tips

On Wednesday, the EUR/USD is trading with a mixed bias around 1.1315. The EUR/USD seems to extend the bearish trend in the wake of completing the 38.2%% and 50% Fibonacci extension level, out of which 38.2% has already been achieved until 1.1280. 

At the moment, the EUR/USD is trading at 1.1315, and a bullish breakout of 1.1350 resistance level can extend buying until 1.1458 level. On the lower side, the EUR/USD may find support around 1.1280, and bearish breakout of 1.1280 can extend sell-off until 1.1238. The RSI and MACD are in the buying zone as the MACD’s histograms are over zero, the bullish zone. Consider taking buy trades above 1.1280.


GBP/USD– Daily Analysis

The GBP/USD fell 1.7% at 1.2907. Later today, the U.K.’s U.K.’s January GDP data (+0.2% on month expected) and February industrial production (+0.3% on month estimated) will be released. The U.S. official data revealed that the economy added 273,000 non-farm payrolls in February (+175,000 expected), and the jobless rate dropped to 3.5% (3.6% expected). Average hourly earnings were up 0.3% on the month (as expected). 

January trade deficit was posted at US$45.3 billion (US$46.2 billion expected), and wholesale inventories (final reading) fell 0.4% on the month (-0.2% expected). Despite mixed economic events, the U.S. dollar is getting weaker and driving the GBP/USD pair higher. 

Whereas, the U.S. 10-year Treasury yields failed to continue the previous day’s run-up, current down by 8-basis points (bps) to 0.67%.

The U.K. Office for National Statistics will report January monthly GDP (+0.2% on month expected), industrial production (+0.3% on month expected), manufacturing production (+0.2% on month expected) and trade balance (356 million pounds deficit expected).

Whereas, Chancellor Rishi Sunak is scheduled to announce a significant relief to the U.K. business houses and will try his hands to keep entrepreneurs attached to Britain after the actual Brexit (which may lose the London’s powerhouse status). 

Daily Support and Resistance

  • S1 1.252
  • S2 1.2733
  • S3 1.281

Pivot Point 1.2945

  • R1 1.3023
  • R2 1.3158
  • R3 1.337

GBP/USD– Trading Tip

The GBP/USD has triggered a dramatic sell-off in the wake of stronger dollar and weakness in Sterling as the pair slipped to test 1.2850. Continuation of a selling trend can lead the GBP/USD prices towards 1.2740, but the way Cable has closed a Doji candle above 1.2850, it seems to trigger a bullish reversal. 

On the higher side, the GBP/USD is likely to trade bullish until 1.3020 level, and breakout of which may drive further buying until 1.3100 level. The MACD is consistently forming bearish histograms below zero, supporting the selling trend in the GBP/USD pair. Let’s consider buying over 1.2925. 


USD/JPY – Daily Analysis

The USD/JPY currency pair flashing red and dropped below the 105.00 level, mainly due to equity markets, which turned lower. At the press time, the USD/JPY is trading at 104.90 and consolidates in the range between the 104.11 – 105.67.

The hopes of fiscal stimulus by the Trump administration boosted investors’ appetite for riskier assets on Tuesday, which allowed the U.S. Treasury bond yields to recover sharply from historic lows and helped revive the USD demand. But as of now, the delay in the incentive package offered by U.S. President Donald Trump to diminish the economic influence of the coronavirus epidemic, which he had promised on Tuesday also weighing on the greenback and risk-tone.

The safe-haven flows were further strengthened by a fresh drop in the U.S. equity futures and the U.S. bond yields, which kept the USD bulls on the defensive and turned out to be one of the key factors exerting some pressure on the pair.

Whereas the bearish bias remained cushioned for now, because investors now seemed unwilling to place any aggressive bets, instead preferred to wait on the sidelines ahead of the latest U.S. inflation figures and the U.S. budget for fiscal 2021.

The U.S. Treasury Secretary Steven Mnuchin will testify on the Proposed the Fiscal Year 2021 Budget, which might provide fresh details about the administration’s new policies.

Daily Support and Resistance

  • S1 99.41
  • S2 102.11
  • S3 103.7

Pivot Point 104.81

  • R1 106.4
  • R2 107.51
  • R3 110.21

USD/JPY – Trading Tips

The USD/JPY is trading at 104.800, testing the bearish trendline resistance level at 105.600. The increased reduced demand for safe-haven assets is driving strong bullish correction in the USD/JPY currency pairs. The USD/JPY has closed two consecutive selling candles, which are followed by the bullish engulfing candle on the 4-hour timeframe, and these are suggesting odds of selling in the USD/JPY currency pair. Below 104.250, the selling trend continuation can lead the USD/JPY prices towards 101.670, whereas, further buying over 104.250 can lead the USD/JPY to 106.250 area.

All the best for today!  

Categories
Crypto Market Analysis

Daily Crypto Review, Mar 11 – Youtube crypto ban; XRP’s price rises

The cryptocurrency market had a pretty slow day when compared to the past couple of days. Bitcoin is currently trading for $7,838, which represents a 1% decrease on the day. Meanwhile, Ethereum lost 0.88 % on the day, while XRP managed to gain 1.78%.

Contentos took the position of today’s most prominent daily gainer, with whopping gains of 330.4%. On the other side, Swipe lost 6.49% on the day, making it the most prominent daily loser.

Bitcoin’s dominance managed to decrease slightly over the past 24 hours. Its value is now 63.93%, which represents a 0.63% difference to the downside when compared to yesterday’s value.

The cryptocurrency market capitalization maintained its levels over the past 24 hours. It is currently valued at $225.06 billion, which represents a decrease of $0.47 billion when its value is compared to the value it had yesterday.

What happened in the past 24 hours

In another attempt of censorship, social media giant YouTube has deleted two posted videos form two crypto channels.

Ivan on Tech, a crypto reporter and programmer, posted a tweet about YouTube deleting one of his videos on Mar 9. The Moon, a (mostly) cryptocurrency technical analyst and news reporter, also told that the content platform deleted one of his videos on Mar 10.

Honorable mention

Ethereum (Synthetix)

Ethereum-based asset issuance platform is currently adding new features, which even include derivatives trading.

In a Mar 10 blog post, the Synthetix platform announced plans for trading binary options in Q3 of this year. Binary options are a form of derivatives where the buyer is down to two outcomes: they either receive a payout or they lose their investment.

_______________________________________________________________________

Technical analysis

_______________________________________________________________________

Bitcoin

Bitcoin’s spent the day mainly trading between the support of $7,760 and $8,000. The price managed to break $8,000 at one point, even reaching $8,150, but quickly dwindling back below $8,000. The $7,760 level has proven to be quite stable and the bears are not able to break it at the moment.


Bitcoin’s volume is slowly declining while its RSI level has risen above oversold levels.

Key levels to the upside                    Key levels to the downside

1: $8,000                                           1: $7,760

2: $8,650                                           2: $7,420

3: $8,825                                            3: $7,085


Ethereum

Ethereum, just like Bitcoin, had a pretty slow day. The second-largest cryptocurrency found a strong support near the$198 level, which held up quite well. Its current price moves are narrowing down and might form a triangle pattern in the near future.


Ethereum’s volume is quite low at the moment, while its RSI level is just below the oversold line.

Key levels to the upside                    Key levels to the downside

1: $217.7                                             1: $198

2: $225.5                                            2: $193.6  

3: $240                                                3: $185


Ripple

Unlike Bitcoin and Ethereum, who mostly consolidated, XRP ended up gaining some value in the past 24 hours. The third-largest cryptocurrency bounced off of the $0.2 support and tried to move its price up, which it succeeded. The price slowly moved up over the past day and reached $0.216, where it stopped and started consolidating. XRP is currently trading near the $0.21 level.


XRP’s volume is extremely low, while its RSI level is in the 40’s range.

Key levels to the upside                    Key levels to the downside

1: $0.221                                            1: $0.2

2: $0.227                                            2: $0.1985

3: $0.235                                             3: $0.19

Categories
Forex Market Analysis

Daily F.X. Analysis, March 10 – Top Trade Setups In Forex – Choppy Trading In Play! 

The U.S. Dollar Index sank 0.9% on the day to 95.07, down for a third straight session. Investors were speculating a steep cut in U.S. interest rates, though the expectations retreated as President Donald Trump announced that he would announce “very dramatic” actions to support the economy. The Dollar Index rebounded to 95.33. The European Commission will post final readings of 4Q GDP (+0.9% on-year expected).

France’s INSEE will report January industrial production (+1.8% on month expected) and manufacturing production (+1.7% on month expected).

Economic Events to Watch Today  


EUR/USD – Daily Analysis

The EUR/USD rose 1.1% to 1.1410. Official data showed that German industrial production grew 3.0% on month in January (+1.7% expected). The coronavirus breaks in China and South Korea seem to be lagging, as countries outside in the world embrace drastic steps to try and stamp out the virus. 

In Italy, where 16 million people in Lombardy and different sections of the north are presently below quarantine, there were 133 life losses announced on Sunday, drawing the sum to 366. More than 7,000 people in the country have been verified to have the disease. 

In Iran, there were 49 new deaths. Some 194 people have now expired from COVID-19 there. Although the latest numbers from China and South Korea suggest, the virus seems to be diminishing in northeast Asia.

The ECB is expecting to deliver a rate cut to control the economic fallout from the deadly coronavirus outbreak. Moreover, an unexpectedly bigger decline in the Eurozone Sentix Investor Confidence for March, a lead indicator, also continues to burdening the EUR currency.

Looking forward, the trader’s eyes remain on the Eurozone final GDP while the general market bias and USD dynamics will proceed to play a pivotal role.

Daily Support and Resistance

  • S1 1.1196
  • S2 1.1315
  • S3 1.1384

Pivot Point 1.1434

  • R1 1.1503
  • R2 1.1553
  • R3 1.1672

EUR/USD– Trading Tips

The EUR/USD is trading with a bullish bias around 1.1445. The EUR/USD seems to extend the bullish trend in the wake of completing the 161.8% and 261.8% Fibonacci extension level, out of which 161.8% has already been achieved until 1.1258. 

At the moment, the EUR/USD is trading at 1.1458, and bullish breakout of this level can extend buying until 1.1610 level. On the lower side, the EUR/USD may find support around 1.1400 and 1.1296. The RSI and MACD are in the buying zone as the MACD’s histograms are over zero, the bullish zone. Consider taking buy trades above 1.1380.


GBP/USD– Daily Analysis

The GBP/USD gained 0.3% at 1.3083.to hit its highest mark in a week to the greenback. This came after the forecasts waned for an urgent Bank of England rate cut to follow this week’s emergency movement from the U.S. Federal Reserve to accommodate coronavirus damage. 

The U.S. official data revealed that the economy added 273,000 non-farm payrolls in February (+175,000 expected), and the jobless rate dropped to 3.5% (3.6% expected). Average hourly earnings were up 0.3% on the month (as expected). 

January trade deficit was posted at US$45.3 billion (US$46.2 billion expected), and wholesale inventories (final reading) fell 0.4% on the month (-0.2% expected). Despite mixed economic events, the U.S. dollar is getting weaker and driving the GBP/USD pair higher. 

The GBP/USD currency pair buyers are still hopeful because the BBC reports a bumper £5billion boost for British exports by the first post-Brexit budget, which is scheduled to release on Wednesday. Chancellor Rishi Sunak will also announce supportive news for salaried employees in his first budget.

Looking ahead, due to the few economic data/events on the economic calendar, all traders keep their eyes on COVID-19/Brexit headlines for taking fresh directions.

Daily Support and Resistance

  • S1 1.278
  • S2 1.2946
  • S3 1.3023

Pivot Point 1.3111

  • R1 1.3188
  • R2 1.3277
  • R3 1.3443

GBP/USD– Trading Tip

The GBP/USD is showing some severe bullish moves in the wake of a weaker dollar and strong Sterling. The GBP/USD soars to trade around 1.3060 and continuation of a bullish trend can extend buying until 1.3160 and even higher. The GBP/USD has formed a solid green candle on the 4-hour timeframe, which may help drive further buying in the Sterling. 

The MACD is consistently forming bullish histograms over zero points, supporting the buying trend in the GBP/USD pair. Let’s consider buying over 1.3025. 


USD/JPY – Daily Analysis

The USD/JPY currency pair stops its bearish rally and hit the high of 105.00 mainly due to risk sentiment improved in the wake of U.S. stimulus expectations. The hopes of the U.S. stimulus put a bid on the U.S. equity futures, treasury yields. 

At the press time, the USD/JPY currency pair is currently trading at 104.78 and consolidates in the range between the 102.02 – 105.05. The U.S. Vice President Mike Pence took U-turn from his Friday’s comments and signaling a lack of enough testing kits in the labs.

The USD/JPY currency pair recovered from the lowest since late-2016 mainly because U.S. President Donald Trump’s suggested to ‘major’ economic measures in order to control coronavirus (COVID-19) triggered the risk-on.

Looking forward, traders are now keeping their eyes on the U.S. President Trump’s real means to tame the adverse implications of the virus. However, the significant risk recovery could only occur if there is news of any cures.

Daily Support and Resistance

  • S1 98.73
  • S2 100.42
  • S3 101.35

Pivot Point 102.12

  • R1 103.05
  • R2 103.81
  • R3 105.5

USD/JPY – Trading Tips

The USD/JPY is trading at 104.200, testing the bearish channel, which supported the Japanese yen at 104.400. The increased reduced demand for safe-haven assets is driving strong bullish correction in the USD/JPY currency pairs. 

The USD/JPY has closed two consecutive bullish candles, which are followed by the bearish breakout setup and suggesting odds of further bullish bias until 104.650. 

Below 104.550, the selling trend continuation can lead the USD/JPY prices towards 101.670 whereas, further buying over 104.550 can lead the USD/JPY to 106.250 area

All the best for today!  

Categories
Crypto Market Analysis

Daily Crypto Review, Mar 10 – Crypto markets consolidating, Bitcoin still under $8,000

The cryptocurrency market spent the past 24 hours consolidating after a severe price drop. Bitcoin is currently trading for $7,898, which represents an 0.72% decrease on the day. Meanwhile, Ethereum lost 3.96 % on the day, while XRP lost 1.92%.

Loopring took the position of today’s most prominent daily gainer, with gains of 16.05%. On the other side, Swipe lost 12.25% on the day, making it the most prominent daily loser.

Bitcoin’s dominance managed to increase slightly over the past 24 hours. Its value is now 64.56%, which represents a 0.37% difference to the upside when compared to yesterday’s value.

The cryptocurrency market capitalization maintained its levels over the past 24 hours. It is currently valued at $225.53 billion, which represents a decrease of $7.18 billion when its value is compared to the value it had yesterday.

What happened in the past 24 hours

The VIX volatility index, one of the stock market’s main risk indicators, showed a value of 55 on March 9. This is the highest level it was on since 2009. In the meantime, the international oil price went all the way down to $36.20, down 20% from the previous session.

The Dow Jones tanked 6.9% as it was heading for its biggest daily loss ever to be recorded. On the other side, the UK’s FTSE went down 7.7%. Japan’s Nikkei ended up 5.1% below Friday’s close.

Honorable mention

Libra

Marc Bhargava, the co-founder of Tagomi, a company that has recently joined the Libra Association, spoke about the current market cryptocurrency downturn. Since Tagomi is well connected with some of the biggest exchanges as well as some of the biggest crypto traders, he may see the market movement from another perspective.

Bhargava believes that cryptocurrency is not a safe haven asset. This goes against the beliefs of other analysts. “BTC as well as crypto are currently a risk-on asset, more alike tech and VC rather than gold.”

_______________________________________________________________________

Technical analysis

_______________________________________________________________________

Bitcoin

Bitcoin’s price got destroyed over the weekend. After falling to the $8,000 levels, many analysts thought that this price level would hold up. However, Bitcoin continued its drop and ended up stopping at the $7,760 support level. The price bounced there and Bitcoin is now trading in a range between the support of $7,760 and the $8,000 resistance level.


Bitcoin’s volume decreased as the price began to rise, while its RSI level is still in the oversold area.

Key levels to the upside                    Key levels to the downside

1: $8,000                                           1: $7,760

2: $8,650                                           2: $7,420

3: $8,825                                            3: $7,085


Ethereum

Ethereum, just like Bitcoin, went into consolidation mode. Its price started to recover a bit earlier than Bitcoin’s but suffered another bear move, which ended at the $193.6 support level. Ethereum has recovered since and is currently trading above the $198 support level.


Ethereum’s volume decreased greatly since it stopped the downturn, while its RSI level left the oversold area.

Key levels to the upside                    Key levels to the downside

1: $217.7                                             1: $198

2: $225.5                                            2: $193.6  

3: $240                                                3: $185


Ripple

XRP ended up consolidating and finding anchor points as well in the past 24 hours. The third-largest cryptocurrency found a bottom to the downturn at the $0.1985 level and quickly recovered to above $0.2 levels. It is currently stable and trading just above this support line.


XRP’s volume decreased greatly once the move to the downside stopped, while its RSI level just left the oversold area and is hovering around 34.

Key levels to the upside                    Key levels to the downside

1: $0.221                                            1: $0.2

2: $0.227                                            2: $0.1985

3: $0.235                                             3: $0.19

Categories
Crypto Market Analysis

Daily Crypto Review, Mar 9 – Blood on the streets, BTC under $8,000

It is quite a good statement when we say that the crypto market is bleeding over the weekend. Cryptocurrencies dropped in price a great amount as bears took over the market. Bitcoin is currently trading for $7,953, which represents an 8.98% decrease on the day. Meanwhile, Ethereum lost 9.72 % on the day, while XRP lost 9.66%.

UNUS SED LEO took the position of today’s most prominent daily gainer, with gains of 3.08%. On the other side, Swipe lost 26% on the day, making it the most prominent daily loser.

Bitcoin’s dominance managed to increase slightly over the weekend. Its value is now 64.19%, which represents a 0.4% difference to the upside when compared to yesterday’s value.

The cryptocurrency market capitalization dropped severely over the weekend. It is currently valued at $232.71 billion, which represents a decrease of $26.49 billion when its value is compared to the value it had on Friday.

What happened in the past 24 hours

Boeing has partnered with a multinational aerospace conglomerate Honeywell in order to use its GoDirect blockchain-based platform to track and sell $1 billion worth of airplane parts that they don’t need.

The partnership got revealed at the Hyperledger Global Forum 2020, which took place in Arizona. All the airplane parts were uploaded to the GoDirect Trade marketplace over the last weekend.

Honorable mention

Bitcoin (start of the bear trend)

Bitcoin began its sudden crash (which, in turn, brought all other cryptos down as well) due to another giant selloff coming from the PlusToken pyramid scheme.

According to various online Blockchain data sources, participants in the $2.9 billion pyramid scheme are attempting to sell their BTC holdings again. Ergo, the Twitter account that tracks PlusToken’s activities, showed that 13,000 BTC or roughly $210 million were involved in this sale.

_______________________________________________________________________

Technical analysis

_______________________________________________________________________

Bitcoin

Bitcoin’s price got destroyed over the weekend. Many analysts said that the sharp move to the downside will end at above $8,000. However, BTC dropped under it and can not get above again. This price drop was, as we mentioned above, caused by a pyramid scheme PlusToken giant attempting to get rid of its Bitcoin holdings.


Bitcoin’s volume increased as the price-drop occurred. Its RSI level is currently deep into the oversold territory.

Key levels to the upside                    Key levels to the downside

1: $8,000                                           1: $7,760

2: $8,650                                           2: $7,420

3: $8,825                                            3: $7,085


Ethereum

Ethereum also lost a great deal of its value but managed to spring back a bit (sooner and a bit more than Bitcoin). Its price went from $253 all the way down to $196.5. However, bulls took over and brought the price above the $198 support and slightly above (to around $208 at the moment of writing).


Ethereum’s volume increased greatly during this bear trend, while it is dropping at bulls took over. Its RSI level is just above the oversold territory on the 4-hour trading chart.

Key levels to the upside                    Key levels to the downside

1: $217.7                                             1: $198

2: $225.5                                            2: $193.6  

3: $240                                                3: $185


Ripple

XRP was no exception to the bleeding market. Its price dropped severely as well. The third-largest cryptocurrency dropped from $0.2454 all the way down to $0.2, where bulls took over. The price is currently rising at a slow pace, with XRP being traded for around $0.211 at the time of writing.


XRP’s volume increased immensely during the selloff but dropped down closer to normal when the bulls took over. Its RSI level is currently just slightly in the oversold territory.

Key levels to the upside                    Key levels to the downside

1: $0.221                                            1: $0.2

2: $0.227                                            2: $0.1985

3: $0.235                                             3: $0.19

Categories
Forex Market Analysis

Daily F.X. Analysis, March 09 – Top Trade Setups In Forex – Risk Sentiment Keeps the Market in Action! 

The U.S. Dollar Index plunged 0.9% on the day to 95.95 on Friday, as treasury yields slumped amid sinking investors’ risk appetite. The Eurozone Sentix Investor Confidence Index for March will be released (-11.4 expected). The German Federal Statistical Office will announce January industrial production (+1.6% on month expected) and trade balance (15.3 billion euros surplus expected).

The Bank of France will post February Industry Sentiment Indicator (95 expected).

Economic Events to Watch Today  


EUR/USD – Daily Analysis

The EUR/USD climbed 0.4% to 1.1286. Official data showed that German factory orders grew 5.5% on month in January (+1.3% expected). The coronavirus breaks in China and South Korea seem to be lagging, as countries outside in the world embrace drastic steps to try and stamp out the virus. 

In Italy, where 16 million people in Lombardy and different sections of the north are presently below quarantine, there were 133 life losses announced on Sunday, drawing the sum to 366. More than 7,000 people in the country have been verified to have the disease. 

In Iran, there were 49 new deaths. Some 194 people have now expired from COVID-19 there. Although the latest numbers from China and South Korea suggest, the virus seems to be diminishing in northeast Asia.

At the data front, the German Industrial Production and the Current Account data are scheduled to release at 07:00 GMT, followed by the Eurozone Sentix Investor Confidence at 09:30 GMT. The German Federal Statistical Office will report January industrial production (+1.6% on month expected) and trade balance (15.3 billion euros surplus expected).

Daily Support and Resistance

  • S1 1.1016
  • S2 1.1152
  • S3 1.1221

Pivot Point 1.1288

  • R1 1.1356
  • R2 1.1424
  • R3 1.1559

EUR/USD– Trading Tips

The EUR/USD is trading with a bullish bias around 1.1445. The EUR/USD seems to extend the bullish trend in the wake of completing the 161.8% and 261.8% Fibonacci extension level, out of which 161.8% has already been achieved until 1.1258. At the moment, the EUR/USD is trading at 1.1458, and bullish breakout of this level can extend buying until 1.1610 level. On the lower side, the EUR/USD may find support around 1.1400 and 1.1296. The RSI and MACD are in the buying zone as the MACD’s histograms are over zero, the bullish zone. Consider taking buy trades above 1.1380.


GBP/USD– Daily Analysis

The GBP/USD climbed 0.6% at 1.2951 to hit its highest mark in a week to the greenback. This came after the forecasts waned for an urgent Bank of England rate cut to follow this week’s emergency movement from the U.S. Federal Reserve to accommodate coronavirus damage. 

The U.S. official data showed that the economy added 273,000 non-farm payrolls in February (+175,000 expected), and the jobless rate dropped to 3.5% (3.6% expected). Average hourly earnings were up 0.3% on the month (as expected). 

January trade deficit was posted at US$45.3 billion (US$46.2 billion expected), and wholesale inventories (final reading) fell 0.4% on the month (-0.2% expected). Despite mixed economic events, the U.S. dollar is getting weaker and driving the GBP/USD pair higher. 

On Monday, the Sterling languished to a five-month low against the Euro, amidst a fresh market panic about the coronavirus outbreak that has prompted significant falls in stocks and oil.

Daily Support and Resistance    

  • S1 1.281
  • S2 1.2913
  • S3 1.2981

Pivot Point 1.3017

  • R1 1.3084
  • R2 1.312
  • R3 1.3224

GBP/USD– Trading Tip

On Monday, the GBP/USD is showing some severe bullish moves in the wake of a weaker dollar and strong Sterling. The GBP/USD soars to trade around 1.3180 and continuation of a bullish trend can extend buying until 1.3200 and even higher. 

During the start of the day, the GBP/USD opened with a dramatic gap, but it soon recovered to fill the gap around 1.3032. Right now, the GBP/USD has formed a solid green candle on the 240 minutes timeframe, which may help drive further buying in the Sterling. The MACD is consistently forming bullish histograms over zero points, supporting the buying trend in the GBP/USD pair. Let’s consider buying over 1.3145. 


USD/JPY – Daily Analysis

The USD/JPY currency pair flashing red and dropped to multi-year lows mainly due to the early-Asian risk-off market sentiment in the wake of coronavirus fears and fall in oil prices. However, the pair is struggled to gain its recovery of over 100 pips from the 3-year lows after downbeat GDP data and trading above mid-102.00s. The USD/JPY currency pair is currently trading at 102.64 and consolidates in the range between the 101.59 – 104.58 on the day.

Moreover, the U.S. yields have recovered slightly from the lows seen after the U.S. Fed’s rate cut. The 2-year yield is currently trading at 0.68%, representing a seven basis point gain on the overnight low of 0.61%, and the 10-year yield has recovered to 0.98% from $0.91%. The currency pair continued to its recent heavy losses and still trading under some heavy selling pressure for the 2nd-consecutive session on Friday.  

On the fundamental side, the headlines growth figure confirms the -1.7% market consensus versus -1.6% initial forecast. The GDP data confirms further challenges to the Asian economy due to coronavirus (COVID-19) fears that have been pushing to the quote downwards.

Daily Support and Resistance

  • R3: 109.46
  • R2: 107.99
  • R1: 107.08

Pivot Point 106.52

  • S1: 105.61
  • S2: 105.06
  • S3: 103.59

USD/JPY – Trading Tips

The USD/JPY is trading at 102.200, breaking below the bearish channel, which supports the Japanese yen at 104.400. The increased demand for safe-haven assets is driving strong bearish trends in the USD/JPY currency pairs. Recently, the USD/JPY has closed two consecutive selling candles, which are followed by the bearish breakout setup and suggesting odds of further bearish bias until 101.650. 

Selling trend continuation can lead the USD/JPY prices towards 101.670 whereas, further selling can lead the USD/JPY to 100.450 area

All the best for today!  

Categories
Forex Market Analysis

Daily F.X. Analysis, March 06 – Top Trade Setups In Forex – Who’s Up for the U.S. Nonfarm Payroll? 

On the forex front, the U.S. dollars weakened further against its major peers on Thursday, with the ICE Dollar Index dropping 0.8% on the day to a two-month low of 96.60. The German Federal Statistical Office will report January factory orders (+1.3% on month expected). France’s INSEE will post the January trade balance (4.8 billion euros deficit expected).

Economic Events to Watch Today  


EUR/USD – Daily Analysis

The EUR/USD jumped 0.8% to 1.1227. Later today, German factory orders for January will be released (+1.3% on month expected). The European Commission warned that France and Italy could fall into a technical recession, two-quarters of economic contraction, amid coronavirus impacts. On the other hand, official data showed that the eurozone’s retail sales grew 0.6% on month in January, and German retail sales were up 0.9%, both as expected.

If the risk-on sentiment continues to boost, the selling interest around the EUR could increase. If the OPEC meeting strengthens an oil price bounce, the risk sentiment will likely increase, pushing the EUR currency and other safe-haven currencies lower. The pair is currently sidelined just below 1.1140.

Besides this, the currency pair will likely take cues from the German Federal Statistical Office will report January factory orders (+1.3% on month expected). France’s INSEE will post the January trade balance (4.8 billion euros deficit expected). The doors remain open for EUR/USD to extend gains toward the next significant resistance near 1.1282 (July 19, 2019 high). 

Daily Support and Resistance

  • S1 1.0949
  • S2 1.1075
  • S3 1.1156

Pivot Point 1.12

  • R1 1.1281
  • R2 1.1326
  • R3 1.1451

EUR/USD– Trading Tips

On Friday, the EUR/USD is trading with a bullish bias around 1.1245. The EUR/USD may drop to complete the bearish retracement. On the lower side, the 38.2% Fibonacci retracement is likely to support the EUR/USD at 1.1180, and violation of this level can drive more selling until 1.1155 which marks the 61.8% Fibonacci level. On the higher side, the bullish breakout 1.1245 can lead EUR/USD prices further higher towards 1.1300 and 1.1335. The RSI and MACD are in the buying zone as the MACD’s histograms are over zero, the bullish zone. Consider taking buy trades above 1.1230.


GBP/USD– Daily Analysis

The GBP/USD climbed 0.6% at 1.2951 to hit its highest mark in a week to the greenback. This came after the forecasts waned for an urgent Bank of England rate cut to follow this week’s emergency movement from the U.S. Federal Reserve to accommodate coronavirus damage. 

The GBP/USD currency pair may come under pressure in Europe if the pair do not cross the key hurdle. On the data front, the focus will be on the U.K. Halifax House Prices and the U.S. Nonfarm Payrolls report. 

At the Brexit front, the EU-UK Brexit negotiators complete their first round of trade talks. However, no conclusion has been received so far, while fisheries and the E.U. jurisdiction continue to remain as the key hurdles.

At the coronavirus front, the deadly virus continues to spread outside China, with California recently declaring a state of emergency. However, the global policymakers struggle to control the same, and it seems to have helped the risk-tone sentiment. As in result, the U.S. 10-year Treasury yields remain positive above 1%, whereas stocks in Asia are also positive by the press time.

Daily Support and Resistance

  • S1 1.2631
  • S2 1.2734
  • S3 1.28

Pivot Point 1.2837

  • R1 1.2903
  • R2 1.294
  • R3 1.3043

GBP/USD– Trading Tip

On Friday, the GBP/USD is trading with bullish bias after having violated the horizontal resistance level of 1.2885, and it’s heading towards the next target level of 1.3000, which is also a psychological resistance level for GBP/USD. 

The GBP/USD’s immediate support is likely to be found around 1.2917, and below this level, the GBP/USD may aim for the 1.2860 area. The MACD and RSI are in the buying zone, supporting the bullish bias for the GBP/USD. Let’s look for long positions above 1.2937 today.  


USD/JPY – Daily Analysis

The USD/JPY currency pair flashing red and trading below the 106.00 level mainly due to the on-going risk-off market sentiment in the wake of Coronavirus intensifying fears. As well as, the currency pair hit the 6-months lows level. For now, the currency pair is currently trading at 105.94 and consolidates in the range between the 105.75 – 106.34.

Moreover, the U.S. yields have recovered slightly from the lows seen after the U.S. Fed’s rate cut. The 2-year yield is currently trading at 0.68%, representing a seven basis point gain on the overnight low of 0.61%, and the 10-year yield has recovered to 0.98% from $0.91%. 

The currency pair continued to its recent heavy losses and still trading under some heavy selling pressure for the 2nd-consecutive session on Friday.  

The reason behind all negative factors could be the market’s fear of coronavirus-led economic pessimism. Whereas, the latest numbers from the U.S., China, and South Korea suggested that the deadly virus continues to spread despite the governments’ struggles.

As in result, the safe-haven demand for the yen has weakened in Asia. As we already mentioned that the USD/JPY pair is currently trading at 107.27, representing a 0.17% gain on the day, having hit a high of 107.52 a few minutes before press time. 

Daily Support and Resistance

  • R3: 109.46
  • R2: 107.99
  • R1: 107.08

Pivot Point 106.52

  • S1: 105.61
  • S2: 105.06
  • S3: 103.59

USD/JPY – Trading Tips

The USD/JPY is trading at 105.900, breaking below the sideways trading range of 108.500 to 107.100 in the wake of safe-haven appeal. The pair is now in the oversold zone, but the market isn’t moving much as investors seem to wait for the NFP figures, which are coming out during the U.S. session.  

The USD/JPY has formed a Doji pattern near 105.613, and the violation of this could trigger further selling off until 104.300. We need to pay attention to the USD/JPY as the closing of candlesticks above 105.613 level can provide us with buying trade with a take profit of around 107. 

All the best for today! 

Categories
Crypto Market Analysis

Daily Crypto Review, Mar 6 – Bitcoin above $9,000; Steem performing a network takeover

The crypto market managed to push up once again, with Bitcoin leading the way as it crossed the $9,000 mark. Bitcoin is currently trading for $9,061, which represents a 2.15% increase on the day. Meanwhile, Ethereum gained 1.31% on the day, while XRP gained 1.92%.

ABBC coin took the position of today’s most prominent daily gainer, with gains of 24.58%. On the other side, v.systems lost 7.02% on the day, making it the most prominent daily loser.

Bitcoin’s dominance managed to increase slightly over the past 24 hours. Its value is now 63.79%, which represents a 0.19% difference to the upside when compared to yesterday’s value.

The cryptocurrency market capitalization increased slightly in the past 24 hours. It is currently valued at $259.2 billion, which represents an increase of $3.75 billion when its value is compared to the value it had yesterday.

What happened in the past 24 hours

While multiple countries are testing and theorizing about the validity of a central bank digital currency, the US dollar remains physical and still sits in a place of dominance. However, how long will the dollar be so dominant if it doesn’t get digital? ING economist Carlo Cocuzzo said that “The dollar is the dominant currency today,” on a panel at London Blockchain Week, but added that “90% of forex turnover is in dollars, so the US stands to lose in this game.”

Honorable mention

Steem

The Steem blockchain experienced some problems recently, where the blockchain’s entire governance system had a couple of disturbances. Tron founder Justin Sun, who now owns the Steemit social network which is based on the Steem token, seems to have successfully executed a takeover of Steem tokens by leveraging not only the tokens that were directly controlled but also the tokens held on several major exchanges. If this is true, then the customers of these exchanges most likely had their funds used without their consent.

_______________________________________________________________________

Technical analysis

_______________________________________________________________________

Bitcoin

Bitcoin bulls managed to gather up for another push, which brought BTC above the $9,000 psychological mark. Bitcoin broke the $8,980 resistance without much effort, and continued to push up on the way to $9,115. However, the move ended with bulls getting exhausted at the $9,170 mark.


Bitcoin’s volume increased slightly when compared to yesterday, while it’s still considered average when compared to the rest of the week. Its RSI level is currently near the higher end of the value range on the 4-hour chart.

Key levels to the upside                    Key levels to the downside

1: $9,115                                           1: $8,980

2: $9,250                                           2: $8,825

3: $9,580                                            3: $8,650


Ethereum

Ethereum gained some value as well in the past 24 hours but did not break any major resistance levels. Ethereum moved within the range bound by $225.5 to the downside and $240 to the upside. Its price did drop below $225.5 earlier during the day, but quickly got back above and increased to $235.


Ethereum’s volume is extremely low, while its RSI is near the middle of the value range, sitting at around 53 on the 4-hour chart. There were no changes in the upside or downside levels.

Key levels to the upside                    Key levels to the downside

1: $240                                                1: $225.5

2: $251.3                                            2: $217.7  

3: $259.5                                             3: $198


Ripple

XRP also made some gains today. Its price went from right below $0.235 to almost breaking $0.2454 at one point in time. However, the bull pressure was not as strong, and the price could not pass this resistance level. XRP is now trading at around $0.24.


XRP’s volume is currently far below average, while its RSI level is slightly above the value range, sitting at around 57 on the 4-hour chart. There were no changes in the upside or downside levels.

Key levels to the upside                    Key levels to the downside

1: $0.2454                                          1: $0.235

2: $0.266                                            2: $0.227

3: $0.285                                             3: $0.221

Categories
Forex Market Analysis

Daily F.X. Analysis, March 05 – Top Trade Setups In Forex – Traders Braces for Choppy Sessions! 

On the forex front, the U.S. Dollar Index rebounded 0.2% on the day to 97.37, snapping a four-day decline, supported by better-than-expected U.S. economic data. The Research firm Markit will publish February German Construction PMI.

The U.S. Commerce Department will post January factory orders (-0.1% on month expected) and final readings of durable goods orders (-0.2% on month expected). The Labor Department will report initial jobless claims in the week ended February 29 (215,000 expected).

Economic Events to Watch Today  


EUR/USD – Daily Analysis

The EUR/USD retreated 0.3% to 1.1138, halting a four-day rally. The European Commission warned that France and Italy could fall into a technical recession, two-quarters of economic contraction, amid coronavirus impacts. On the other hand, official data showed that the eurozone’s retail sales grew 0.6% on month in January, and German retail sales were up 0.9%, both as expected.

If the risk-on sentiment continues to boost, the selling interest around the EUR could increase. At press time, major Asian indices like Japan’s Nikkei, South Korea’s Kospi, Hong Kong’s Hang, and the Shanghai Composite index are reporting notable gains. The S&P 500 futures, however, are shedding 0.90%.

If the OPEC meeting strengthens an oil price bounce, the risk sentiment will likely increase, pushing the EUR currency and other safe-haven currencies lower. The pair is currently sidelined just below 1.1140.

Besides this, the currency pair will likely take cues from the U.S. weekly unemployment claims, Challenger Job Cuts data for February, and the 4th-quarter Unit Labor Costs figure scheduled for release during the North American trading hours. The European data docket is thin.

Daily Support and Resistance

  • S1 1.0955
  • S2 1.1047
  • S3 1.109

Pivot Point 1.1139

  • R1 1.1182
  • R2 1.1231
  • R3 1.1323

EUR/USD– Trading Tips

On Tuesday, the EUR/USD is trading sideways around 1.1179. The EUR/USD may drop to complete the bearish retracement. On the lower side, the 38.2% Fibonacci retracement is likely to support the EUR/USD at 1.1109, and violation of this level can drive more selling until 1.1085 which marks the 61.8% Fibonacci level. The RSI and MACD are in the buying zone but seems to take a bearish. The MACD’s histograms are becoming smaller on the buying side, which suggests the odds of selling in the EUR/USD. Consider taking buy trades above 1.1119.  


GBP/USD– Daily Analysis

The GBP/USD rose 0.5% at 1.2873. The officials from the European Union and the United Kingdom continue to oppose each other in every phase of post-Brexit trade deal talks. The Fisheries matter is the key factor for the British negotiators, and they have given a warning to the deploy Navy to safeguard the waters from the bloc’s ships if no deal is agreed by June.

It is worth to mention that the Sky News spots former business secretary Andrea Leadsom while saying that the government’s previous willingness for a possible no-deal Brexit. Which

Att he coronavirus front, the deadly virus continues to spread outside China with California recently declaring a state of emergency. However, the global policymakers struggle to control the same, and it seems to have helped the risk-tone sentiment. As in result, the U.S. 10-year Treasury yields remain positive above 1%, whereas stocks in Asia are also positive by the press time.

The BOE Governor Mark Carney is scheduled to speak at University College London and will be key to watch for the U.K. central bank’s actions to control COVID-19 implications. However, the incoming Governor Andrew Bailey has already said that the BOE should wait for more clarity about the economic slowdown from the coronavirus outbreak before making any decision to cut interest rates ahead.

Daily Support and Resistance

  • S1 1.2631
  • S2 1.2734
  • S3 1.28

Pivot Point 1.2837

  • R1 1.2903
  • R2 1.294
  • R3 1.3043

GBP/USD– Trading Tip

The GBP/USD is trading with bullish bias after having violated the horizontal resistance level of 1.2885. As suggested earlier, the GBP/USD overall trading bias remains bullish, and it’s pretty much likely to go after the next resistance level of 1.3019.

The GBP/USD’s immediate support is likely to be found around 1.2870, and below this level, the GBP/USD may aim for the 1.2760 area. The MACD and RSI are in the buying zone, supporting the bullish bias for the GBP/USD. Let’s look for long positions above 1.2837 today.  


USD/JPY – Daily Analysis

The USD/JPY currency pair failed to maintain its overnight bullish trend and reached the fresh lower end of its daily trading range near the 107.30 level because of the greenback weakness. The USD/JPY currency pair 107.34 and consolidates in the interval between 107.0 – 107.73.

As we already mentioned that the pair failed to maintain on the previous day’s recovery move from 5-month lows and faced some fresh supply near the 107.75 regions on Thursday in the wake of subdued U.S. dollar price action.

Moreover, the U.S. yields have recovered slightly from the lows seen after the U.S. Fed’s rate cut. The 2-year yield is currently trading at 0.68%, representing a seven basis point gain on the overnight low of 0.61%, and the 10-year yield has recovered to 0.98% from $0.91%. 

As in result, the safe-haven demand for the yen has weakened in Asia. As we already mentioned that the USD/JPY pair is currently trading at 107.27, representing a 0.17% gain on the day, having hit a high of 107.52 a few minutes before press time. 

Daily Support and Resistance

  • S1 105.75
  • S2 106.93
  • S3 107.63

Pivot Point 108.1

  • R1 108.8
  • R2 109.28
  • R3 110.46

USD/JPY – Trading Tips

The USD/JPY is trading at 107.250, staying mostly outside the tight trading range of 108.400 – 107.400. It’s mostly due to the weakness in the U.S. dollar and a slight safe-haven appeal, which is triggered in the wake of Coronavirus. The pair has recovered a bit to complete retracement until 107.650. 

For now, the USD/JPY has formed a bearish series of Doji pattern over 107.013, which could trigger further selling if the 107.013 level gets violated. We need to pay attention to the USD/JPY as the closing of candlesticks below 107.013 level can provide us selling trade with a take profit of around 106.500 and 105.860.  

All the best for today! 

Categories
Crypto Market Analysis

Daily Crypto Review, Mar 5 – Bitcoin uncertainty leading to a lack of buying or selling pressure

The crypto market had a green day, with only a few cryptocurrencies ending up in the red. Bitcoin is currently trading for $8,882, which represents a 0.95% increase on the day. Meanwhile, Ethereum gained 0.53% on the day, while XRP lost 0.05%.

Energi took the position of today’s most prominent daily gainer, with gains of 27.96%. On the other side, Bitcoin SV lost 4.56% on the day, making it the most prominent daily loser.

Bitcoin’s dominance managed to increase quite a lot over the past 24 hours. Its value is now 63.6%, which represents a 0.98% difference to the upside when compared to the value from when we last reported.

The cryptocurrency market capitalization increased slightly in the past 24 hours. It is currently valued at $255.45 billion, which represents an increase of $2.45 billion when its value is compared to the value it had yesterday.

What happened in the past 24 hours

Andrew Bailey, the next governor of Bank of England, expressed his sentiment towards crypto yesterday in London. He argued that anyone putting money into Bitcoin should prepare to lose everything.

Bailey shared his thoughts on Bitcoin to members of the U.K. Parliament at a Treasury Select Committee hearing, which happened on Mar 4. Bailey expressed his dislike towards Bitcoin and other cryptocurrencies as a whole before saying that:

“If you want to buy Bitcoin, be prepared to lose all your money… [Bitcoin] has no intrinsic value.”

Honorable mention

Cardano

The legal leader at Big Four’s PwC, Gunther Dobrauz, recently expressed his opinion about Cardano and showed open support to the people responsible for Cardano’s development.

Dobrauz claimed that decentralization is the future, and that the Cardano Foundation and the team surrounding the IOHK CEO and founder Charles Hoskinson are certainly a “huge part of this” future in a tweet on Mar 3. IOHK is the blockchain company behind Cardano as well as Ethereum Classic.

_______________________________________________________________________

Technical analysis

_______________________________________________________________________

Bitcoin

Bitcoin had a slow day with quite predictable price movements. Buyers and sellers bound its price between $8,400 and $9,000. Bitcoin has been staying in this range for some time now with no real pressure to go up or down. When compared to the yesterday’s price, Bitcoin did manage to gain some value, breaking the $8,825 line, but quickly stopping at the $8,980 one.


Bitcoin’s volume is slightly below average when compared to this week, while its RSI level is starting to increase slightly. It is currently sitting at a value of 58.

Key levels to the upside                    Key levels to the downside

1: $8,980                                           1: $8,825

2: $9,115                                           2: $$8,650

3: $9,250                                            3: $8,535


Ethereum

Ethereum is in the same position as Bitcoin, as its price has been ranging for some time now, as well. There has been no sign of pressure towards any side. Ethereum is currently trading above the $225.5 line, bound by it to the downside and the $240 resistance to the upside. However, all pressure to the upside seems to fade far before Ethereum’s price reaches $240.


Ethereum’s volume is quite low, while its RSI is near the middle of the value range, sitting at around 52.

Key levels to the upside                    Key levels to the downside

1: $240                                                1: $225.5

2: $251.3                                            2: $217.7  

3: $259.5                                             3: $198


Ripple

XRP is the only crypto out of the top3 that ended up in the red. Its price is also bound in a range, sitting between $227 and $2454. XRP’s price is not pressured to any side and is trading freely within this range. However, with fading volume, the volatility is fading as well, and the up and down movements seem smaller and smaller. XRP is now trading slightly above the $0.235 support line.


XRP’s volume is currently below average, while its RSI level is near the middle of the value range, sitting at around 53.

Key levels to the upside                    Key levels to the downside

1: $0.2454                                          1: $0.235

2: $0.266                                            2: $0.227

3: $0.285                                             3: $0.221

Categories
Crypto Market Analysis

Daily Crypto Review, Mar 4 – Bitcoin and Altcoins Recover, Look for Further Strength

The crypto market had a pretty quiet but effective day. Most cryptos that were going down yesterday ended that move and gained some value. Bitcoin is currently trading for $8,808, which represents a 0.24% increase on the day. Meanwhile, Ethereum lost 0.47% on the day, while XRP gained 0.84%.

Matic Network took the position of today’s most prominent daily gainer, with gains of 21.46%. On the other side, Kyber Network lost 9% on the day, making it the most prominent daily loser.

Bitcoin’s dominance managed to decrease slightly over the past 24 hours. Its value is now 62.62%, which represents a 1.12% difference to the downside when compared to the value from when we last reported.

The cryptocurrency market capitalization stayed at the pretty much same spot from when we last reported. It is currently valued at $253 billion, which represents a decrease of $1.43 billion when its value is compared to the value it had yesterday.

What happened in the past 24 hours

The tax bureau of Beijing made an official announcement that it will start implementing invoicing via blockchain within the city on March 2. Beijing wants to bring transparency, traceability as well as immutability by using blockchain invoicing.

The Beijing tax bureau will slowly and gradually carry out the promotion of the blockchain invoicing service throughout the city.

Honorable mention

MakerDAO

Major decentralized finance (or DeFi for short) player MakerDAO established a partnership with the payment processor Simplex. This partnership came to life to create a fiat on-ramp for MakerDAO’s Dai decentralized stablecoin.

The partnership allows people to buy Dai with the credit and debit cards that Simplex’s partner firms issued.

_______________________________________________________________________

Technical analysis

_______________________________________________________________________

Bitcoin

Bitcoin had a pretty slow day. However, the downtrend price movement that happened yesterday ended and Bitcoin moved up slightly. After the whole day of price going down, BTC bounced off of its $8,650 support and changed direction. Bitcoin is now right below the $8,825 which is did not manage to pass yet.


Bitcoin’s volume is slightly below average when compared to this week, while its RSI level is in the middle of the value range, sitting at around 51.

Key levels to the upside                    Key levels to the downside

1: $8,825                                           1: $8,650

2: $9,115                                           2: $$8,535

3: $9,250                                            3: $8,250


Ethereum

Ethereum had a slow day as well. However, its price movement did not make it to the green side when compared to the price of 24 hours ago. The slight downwards-facing move seems to have ended, and Ethereum stabilized right above the $225.5 support level.


Ethereum’s volume is quite low, while its RSI is in the middle of the value range, sitting at around 49.

Key levels to the upside                    Key levels to the downside

1: $240                                                1: $225.5

2: $251.3                                            2: $217.7  

3: $259.5                                             3: $198


Ripple

XRP also made a similar move as Bitcoin and Ethereum did. Once the bear pressure was weakened, bulls took over and brought the price above $0.235. XRP is now consolidating in the middle of the range, bound by $0.235 level to the downside and $0.2454 level to the upside.


XRP’s volume is slightly below average, while its RSI level is in the middle of the value range, sitting at around 50.

Key levels to the upside                    Key levels to the downside

1: $0.2454                                          1: $0.235

2: $0.266                                            2: $0.227

3: $0.285                                             3: $0.221

Categories
Forex Market Analysis

Daily F.X. Analysis, March 04 – Top Trade Setups In Forex!

On the forex front, the U.S. dollar weakened against other major currencies, dragged by the Fed’s emergency rate cut. The ICE U.S. Dollar Index fell 0.2% on the day to 97.14. Most of this came in response to the U.S. Fed fund rate cut on Tuesday

Later today, February Automatic Data Processing (ADP) jobs report (+170,000 private jobs expected) and the Fed’s Beige Book economic report will be released.

February Markit U.S. Service PMI (final reading, 49.4 expected) and Institute for Supply Management’s (ISM) Non-Manufacturing PMI (54.9 expected) will also be reported.

Economic Events to Watch Today  


EUR/USD – Daily Analysis

The EUR/USD rose 0.4% to 1.1179, posting a four-day rally. Official economic figures revealed that the eurozone’s jobless rate was steady at 7.4% in January, and CPI grew 1.2% on year in February, both as expected.

The EUR currency performed as a safe-haven currency during the recent periods of Coronavirus. This is evident from EUR/USD’s near 90-degree surge from 1.0788 to 1.12 seen in the last 8- trading days. Therefore, the EUR currency will likely decrease further if the risk sentiment improves, allowing a big decline in EUR/USD. As in result, the futures on the S&P 500 are reporting a 1.2% gain. 

Looking forward, German and Eurozone retail sales and final German and Eurozone PMI readings will be key to watch by traders. The US ISM non-manufacturing (Feb) will take center stage. The research firm Markit will report data of February Services PMI for the eurozone (52.8 expected), Germany (53.3 expected), France (52.6 expected), the U.K. (53.3 expected), and the U.S. (49.4 expected).

The European Commission will post January retail sales (+0.6% on month expected). The German Federal Statistical Office will report January retail sales (+0.9% on month expected).

Daily Support and Resistance

  • S1 1.0826
  • S2 1.0972
  • S3 1.1053

Pivot Point 1.1119

  • R1 1.1199
  • R2 1.1265
  • R3 1.1412

EUR/USD– Trading Tips

The EUR/USD is trading upward near 1.1179, as the pair seems to trade in the overbought zone. Bulls seem to get exhausted, and sooner or later, the EUR/USD may drop to complete the bearish retracement. On the lower side, the 38.2% Fibonacci retracement is likely to support the EUR/USD at 1.1109, and violation of this level can drive more selling until 1.1085 which marks the 61.8% Fibonacci level. 

The RSI and MACD are in the buying zone but seems to take a bearish. The MACD’s histograms are becoming smaller on the buying side, which suggests the odds of selling in the EUR/USD. Consider taking buy trades above 1.1119.  


GBP/USD– Daily Analysis

The GBP/USD rebounded 0.6% at 1.2823, snapping a four-day losing streak. The Markit U.K. Construction PMI climbed to 52.4 in February (49.0 expected) from 48.4 in January.

The Asian markets got supported by the decisions of the nation of fiscal measures that their Western counterparts, like the Federal Reserve, which recently delivered the rate cut. While portraying the risk-recovery, the MSCI’s gauge of Asia-Pacific shares outside Japan registers 0.80% gains with Japan’s NIKKEI marking 0.40% profits by the time of writing.

Moving on, the investors will now keep their eyes on the coronavirus headlines as well as the related actions from the global policymakers for fresh impulse. 

On the economic front, final readings of the U.K. Services PMI for February, expected 53.3, followed by the US ISM Non-Manufacturing PMI, forecast 54.9 against 55.5 prior, will be key to watch.


Daily Support and Resistance

  • S1 1.2559
  • S2 1.267
  • S3 1.2712

Pivot Point 1.2781

  • R1 1.2823
  • R2 1.2892
  • R3 1.3003

GBP/USD– Trading Tip

The GBP/USD is rangebound, mostly trading in between 1.2850 – 1.2750 area. However, the GBP/USD overall trading bias remains primarily bearish. So far, the pair is forming neutral candles within this range, as it seems like investors are waiting for a solid reason to determine the next trends.

The GBP/USD’s immediate support is likely to be found around 1.2755, and below this level, the GBP/USD may aim for the 1.2660 area. The MACD and RSI are in the selling zone, supporting the bearish bias for the GBP/USD. Let’s look for short-trades below 1.2781 and bull trades above the same level today. 


USD/JPY – Daily Analysis

The USD/JPY currency pair flashing green and hit the bullish track from the 5-month lows mainly due to the uptick in the Asian equities, although, the bullish trend has been capped nearby 107.50 recently. But for now, the currency pair is currently trading at 107.59 and consolidates in the range between the 106.86 – 107.69.

At the equities front, the Major Asian indices, except Australia’s S&P/ASX 200, are reporting modest gains at press time. Asian investors seem to have taken heart from the decision by the U.S. Federal Reserve (Fed) to cut rates by 50 basis points, the single biggest cut in over a decade. 

Currently, Japan’s Nikkei is scoring 0.37%, and South Korea’s Kospi is up 1.4%. The Shanghai Composite index is also adding 0.14% along with a 0.80% gain in the S&P 500 futures. 

Moreover, the U.S. yields have recovered slightly from the lows seen after the U.S. Fed’s rate cut. The 2-year yield is currently trading at 0.68%, representing a seven basis point gain on the overnight low of 0.61%, and the 10-year yield has recovered to 0.98% from $0.91%. 

As in result, the safe-haven demand for the yen has weakened in Asia. As we already mentioned that the USD/JPY pair is currently trading at 107.27, representing a 0.17% gain on the day, having hit a high of 107.52 a few minutes before press time. 

Daily Support and Resistance

  • S1 105.75
  • S2 106.93
  • S3 107.63

Pivot Point 108.1

  • R1 108.8
  • R2 109.28
  • R3 110.46

USD/JPY – Trading Tips

On Wednesday, the safe-haven currency pair USD/JPY is trading at 107.550, having violated a narrow trading range of 108.400 – 107.400 due to the weakness in the U.S. dollar. However, the pair has recovered a bit to complete retracement until 107.650. The USD/JPY pair is still trading with a mixed bias around 107.555, and it has a high probability of moving towards the next support level of 107 and 1o6.65p.

We see on the 4-hour chart, the USD/JPY has created a bearish engulfing pattern under 108.350, which could trigger further selling until 107.338. We need to pay attention to the USD/JPY as the closing of candlesticks above 108.338 level can provide us with a secure buy trade with a take profit of around 109.650.  

All the best for today! 

Categories
Forex Market Analysis

Daily F.X. Analysis, March 03 – Top Trade Setups In Forex – Monetary Policy Report & G7 Meeting Under Spotlight! 

The Asian session was all about the Reserve Bank of Australia, and it’s a policy decision. The Reserve Bank of Australia’s (RBA) interest rate settlement at 0330 GMT was closely followed as it is the critical policy meeting since last week’s exciting change in money market pricing. The RBA has cut the interest rate by the 25-basis-point cut is all but inevitable, devising the Australian dollar exposed to a bearish bias.

The research firm Markit will publish February U.K. Construction PMI (49.0 expected). The European Commission will report February CPI (+1.2% on-year expected), January PPI (-0.4% on year expected), and jobless rate (steady at 7.4% expected).

Economic Events to Watch Today 


EUR/USD – Daily Analysis

The EUR/USD jumped 1.1% to 1.1146, the highest level since mid-January. European Central Bank President Christine Lagarde stated that ECB stands ready to “take appropriate and targeted measures,” amid risks to the economic outlook from the coronavirus epidemic.  

Later today, the eurozone’s January jobless rate (steady at 7.4% expected) and February CPI (+1.2% on-year estimated) will be reported.

Overall the risk sentiment remains mixed as the European stocks stabilized, with the Stoxx Europe 600 Index edging up 0.1%. The U.K.’s FTSE 100 rose 1.1%, and France’s CAC was up 0.4%, while Germany’s DAX dropped 0.3%.

Investor’s focus will remain on the research firm Markit which will publish February U.K. Construction PMI (49.0 expected). The European Commission will report February CPI (+1.2% on-year expected), January PPI (-0.4% on year expected), and jobless rate (steady at 7.4% expected).

Daily Support and Resistance

  • R3: 1.1412
  • R2: 1.1265
  • R1: 1.1199

Pivot Point 1.1119

  • S1: 1.1053
  • S2: 1.0972
  • S3: 1.0826

EUR/USD– Trading Tips

The EUR/USD is trading upward near 1.1109, as the pair seems to trade in the overbought zone. Bulls seem to get exhausted, and sooner or later, the EUR/USD may drop to complete the bearish retracement. On the lower side, the 38.2% Fibonacci retracement is likely to support the EUR/USD at 1.1095, and violation of this level can drive more selling until 1.1035 which marks the 61.8% Fibonacci level. 

The RSI and MACD are in the buying zone but seems to take a bearish. The MACD’s histograms are becoming smaller on the buying side, which suggests odds of selling in the EUR/USD. Consider taking sell trades below 1.1150. 


GBP/USD– Daily Analysis

The GBP/USD dropped 0.4% at 1.2804, down for a fourth straight session. Bank of England governor Mark Carney said BOE is working with the government and international authorities to “ensure all necessary steps are taken to protect financial and monetary stability”. The fury of the Coronavirus has led some investors to believe central banks will be expected to go behind dovish monetary policy to underpin the economy against the potential threat of a coronavirus. 

The Sterling continues trading with a bearish bias as the interest rate cut sentiment from 0.75% to 0.50% remains pretty stable. The Sterling also places a four-and-a-half-month low during the previous week versus the greenback as concerns of the economic collapse from the extensive Coronavirus provoked a dramatic selling in with worldwide markets.

The Bank of England announced it was serving with Britain’s finance ministry and international allies to ensure “all necessary measures are exercised” to preserve the banking system and the larger economy.

The GBP/USD also faced a bearish pressure as the global influence of the Coronavirus is beginning to show on a post-election improvement in U.K’s manufacturing, which came out on Monday. 

Daily Support and Resistance

  • R3: 1.3209
  • R2: 1.3015
  • R1: 1.2916

Pivot Point 1.2821

  • S1: 1.2722
  • S2: 1.2627
  • S3: 1.2432

GBP/USD– Trading Tip

The GBP/USD is consolidating in a sideways range, where the overall bias remains mostly bearish. The GBP/USD has already violated the previous narrow trading range of 1.2980 – 1.2880. On the 4-hour chart, the Cable has violated the descending triangle pattern, which is still keeping the pair under 1.2880. 

Below this level, the GBP/USD may aim for the 1.2660 area. The MACD and RSI are in the selling zone, supporting the bearish bias for the GBP/USD. Let’s look for short-trades below 1.2966 and bull trades above the same level today. 


USD/JPY – Daily Analysis

The USD/JPY rebounded 0.2% to 108.29. The safe-haven Japanese yen soared versus the greenback on Tuesday, as the traders curbed expectations for global monetary policy easing with concerns about its balance and effectiveness in fighting the economic collapse from the coronavirus break.

On Tuesday, the G7 finance diplomats and central bank directors carry a conference call later to consider steps to dispense with the outbreak and its widening economic radioactivity.

The call, which French and Italian experts, is scheduled at 1200 GMT, and with this, the traders are already betting on the sentiment that the U.S. Federal Reserve will begin a series of global monetary easing.

The dollar dropped 0.5% to 107.80 yen and trimmed lower on the Swiss franc to 0.9576 francs following a report that the G7 officials are meeting to decide no fresh fiscal or monetary pledges. In the U.S., the coronavirus-related death toll has grown to six. South Korea reported a total of 4,335 cases (28 deaths), Italy 2,036 cases (52 deaths), and Iran 1,501 cases (66 deaths).

Daily Support and Resistance

  • R3: 113.5
  • R2: 112.2
  • R1: 111.46

Pivot Point 110.9

  • S1: 110.16
  • S2: 109.6
  • S3: 108.29

USD/JPY – Trading Tips

The USD/JPY consolidates in a narrow trading range of 108.400 – 107.400 as the weakness in the U.S. dollar and stronger Japanese yen keeps the pair tossed. The USD/JPY pair recovered slightly in the wake of a bullish correction, but more selling pressure seems to come soon. The pair is trading bearish at 107.775, and it has high probability of moving towards the next support level of 107.338.

We can see on the 4-hour chart above, the USD/JPY has formed a bearish engulfing pattern below 108.350, which may trigger further selling until 107.338. We need to keep an eye in the USD/JPY as the closing of candles above 108.338 level can help us secure a buy trade with a take profit of around 109.650.  

All the best for today! 

Categories
Crypto Market Analysis

Daily Crypto Review, Mar 3 – Cryptocurrencies back to bear cycle? Argentina suspending its blockchain registering system

The crypto market ended its one-day uptrend and backtracked a bit from the gains it made over the past 24 hours. Bitcoin is currently trading for $8,761, which represents a 1.7% increase on the day. Meanwhile, Ethereum gained 3.02% on the day, while XRP gained 1.7%.

Aragon took the position of today’s most prominent daily gainer, with gains of 17.41%. On the other side, Aragon lost 7.56% on the day, making it the most prominent daily loser.

Bitcoin’s dominance managed to increase slightly over the past 24 hours. Its value is now 63.8%, which represents a 0.15% difference to the upside when compared to the value from when we last reported.

The cryptocurrency market capitalization stayed at the same spot from when we last reported. It is currently valued at $251.57 billion, which represents a decrease of $0.36 billion when its value is compared to the value it had yesterday.

What happened in the past 24 hours

The government of Argentina made an announcement that its national blockchain-based mechanism for registering new companies will be suspended for a period of 180 days.

This measure, according to the statements made by the head of General Inspectorate of Justice Ricardo Nissen to La Nación, is made so Argentina could reorder the registration of new companies so that the inspectorate could also participate in the entire process.

Honorable mention

EOS 

Block.one released EOSIO 2.0 in January 2020 as an upgrade to the protocol. Some cryptocurrency exchanges like Coinbase announced that there was trouble with the performance of the network once the new set of protocol improvements was installed. This implementation slowed down or even stopped deposits and withdrawals.

In the meantime, the EOS community voted to slash the network inflation from 5% down to 1%, which marked this event as the blockchain’s second massive token burn event ever since Q2 of 2019.

_______________________________________________________________________

Technical analysis

_______________________________________________________________________

Bitcoin

Bitcoin ended its one day long upswing which managed to reach all the way to $8980 before crashing slightly. The biggest cryptocurrency by market cap broke the $8,825 resistance and rushed towards price levels of above $9,000 but failed as bears kicked in. Bitcoin’s price is now dropping, currently trading just around the levels that BTC has when we last reported.


Bitcoin’s volume is quite average when compared to the past and this week, while its RSI level is just below the middle of the value range, sitting at around 48.

Key levels to the upside                    Key levels to the downside

1: $8,825                                           1: $8,650

2: $9,115                                           2: $$8,535

3: $9,250                                            3: $8,250


Ethereum

Ethereum more or less mirrored the actions of Bitcoin in the past couple of days. Its upswing also ended after price not being able to push above $235. ETH is now slowly dropping in price, possibly testing the support level of $225.5. However, so far, the price is safe above this support level.


Ethereum’s volume is quite low, while its RSI is just below the middle of the value range, sitting at around 48.

Key levels to the upside                    Key levels to the downside

1: $240                                                1: $225.5

2: $251.3                                            2: $217.7  

3: $259.5                                             3: $198


Ripple

XRP also moved in the same direction and played out the same patterns as Bitcoin and Ethereum. After its upswing ended, XRP started to move to the downside. However, the bear presence was strong, and XRP is now testing the $0.235 support. It is still unknown whether the price will end up above or below it as the fight for the level is continuing. However, there is a good probability that XRP will continue its path to the downside in the short term.


XRP’s volume is slightly below average, while its RSI level is just below the middle of the value range, sitting at around 46.

Key levels to the upside                    Key levels to the downside

1: $0.2454                                          1: $0.235

2: $0.266                                            2: $0.227

3: $0.285                                             3: $0.221

Categories
Crypto Market Analysis

Daily Crypto Review, Mar 2 – Cryptos regaining pre-weekend prices; Watch out for crypto-stealing Trojans

The crypto market had a pretty slow weekend, with prices at almost the same place as they were on Friday. Bitcoin is currently trading for $8,773, which represents a 2.58% increase on the day. Meanwhile, Ethereum gained 3.07% on the day, while XRP gained 1.99%.

Bytecoin took the position of today’s most prominent daily gainer, with gains of 22.74%. On the other side, Kyber Network lost 9.66% on the day, making it the most prominent daily loser.

Bitcoin’s dominance decreased slightly over the weekend. Its value is now 63.65%, which represents a 0.88% difference to the downside when compared to the value from when we last reported.

The cryptocurrency market capitalization gained some value on the daily chart, while it stayed at almost the same spot from when we last reported. It is currently valued at $251.93 billion, which represents an increase of $2.84 billion when its value is compared to the value it had on Friday.

What happened in the past 24 hours

ThreatFabric, an Amsterdam-based firm specializing in cybersecurity and threats to the financial industry, managed to identify “Cerberus” Trojan that is able to steal 2-Factor Authentication (2FA) codes that are generated by the Google Authenticator app.

Coinbase, which is one of the biggest crypto exchanges in the world, is one of the cryptocurrency platforms listed in Cerberus’ list of targets.

Honorable mention

IOTA 

Iota began its seed migration on Feb 29, while they will open the network around Mar 10. Although many have criticized the decision to close the Coordinator verifier, it may have saved quite a lot of funds from being stolen from users.

The Iota network got shut down on Feb 12, shortly after their team received multiple reports of breached and drained user wallets. This was all possible thanks to the presence of the Coordinator, which is a centralized transaction verifier that is used to operate the network.

_______________________________________________________________________

Technical analysis

_______________________________________________________________________

Bitcoin

Bitcoin spent the past 24 hours gaining some value after the yesterday’s drop to $8,400. The biggest cryptocurrency by market cap managed to bounce off this price level and reach the price it had on Friday. Bitcoin bulls also attempted an upswing above $8,825, which failed.


Bitcoin’s volume is average when compared to the past week, while its RSI level is rising above the middle of the value range.

Key levels to the upside                    Key levels to the downside

1: $8,825                                           1: $8,650

2: $9,115                                           2: $$8,535

3: $9,250                                            3: $8,250


Ethereum

Ethereum’s also gained some value in the past 24 hours. This price gain made up for the price drop, which happened yesterday, and brought the price to $212. Ethereum reached over $225.5 and regained its pre-weekend levels. It also broke the descending trend line that it formed right before the weekend.


Ethereum’s volume is average when compared to the previous week, with its RSI level right in the middle of the value range.

Key levels to the upside                    Key levels to the downside

1: $240                                                1: $225.5

2: $251.3                                            2: $217.7  

3: $259.5                                             3: $198


Ripple

XRP performed almost exactly the same as Ethereum. Its price dropped to lows of $0.224 but recovered to levels above $0.235 in the past 24 hours. The third-largest cryptocurrency by market cap broke the descending trend line as well, confirming that it will stay above it (at least in the short term).


XRP’s volume is slightly below average while its RSI level is in the middle of the value range.

Key levels to the upside                    Key levels to the downside

1: $0.2454                                          1: $0.235

2: $0.266                                            2: $0.227

3: $0.285                                             3: $0.221

Categories
Forex Market Analysis

Daily F.X. Analysis, March 02– Top Trade Setups In Forex – Buckle up for Series of Manufacturing PMI 

Earlier today, during the Asian trading hours, EUR/USD extended its rally to 1.1056, and GBP/USD edged up to 1.2826 as traders seem to do profit-taking in the Greenback.

The eyes now will remain on the research firm Markit will publish final readings of February Manufacturing PMI for the eurozone (49.1 expected), Germany (47.8 expected), France (49.6 expected), the U.K. (51.9 expected) and the U.S. (50.8 expected). The Bank of England will release the number of mortgage approvals in January (68,000 expected) and the M4 money supply.

Economic Events to Watch Today 


EUR/USD – Daily Analysis

The EUR/USD rose 0.2% to 1.1026. Official data showed that Germany’s jobless rate was steady at 5.0% in January, and CPI grew 1.7% on year in February, both as expected.

The dollar has traded near a three-month high against the Euro as worries over the outbreak of Coronavirus has driven sharp volatility in the market, mostly driving dollar prices higher. The Euro has tried to rally higher during the Asian trading session on Monday but continues to encounter resistance above. 

The European stocks were also deep in the red, with the Stoxx Europe 600 Index falling a further 3.5%. Germany’s DAX dropped 3.9%, the U.K.’s FTSE 100 lost 3.2%, and France’s CAC was down 3.4%.

The eyes will remain on the final readings of February Manufacturing PMI for the eurozone (49.1 expected), Germany (47.8 expected), France (49.6 expected), the U.K. (51.9 expected), and the U.S. (50.8 expected). The U.S. Commerce Department will report construction spending in January (+0.6% on month expected). The Institute for Supply Management will post its manufacturing index for February (50.5 expected).

Daily Support and Resistance

  • S1 1.092
  • S2 1.0842
  • S3 1.0799

Pivot Point 1.0963

  • R1 1.1041
  • R2 1.1084
  • R3 1.1162

EUR/USD– Trading Tips

The EUR/USD is trading bullish near 1.1116, as the pair seems to go further higher after violating double top resistance at 1.1097. Chances of further buying in the EUR/USD remains pretty high until 1.1140 and 1.1185. The pair may find immediate support around 1.1095, which is mostly extended horizontal support level. The MACD and RSI still stay on the bullish side and are signaling odds of more buying in the pair. The EUR/USD may find resistance around 1.1140 and 1.1185, so let’s look for bullish trends above 1.1085.


GBP/USD– Daily Analysis

The GBP/USD dropped 0.5% at 1.2821, the lowest level since mid-October last year. The U.K. government is expected to publish a negotiating mandate for the future relationship with the European Union. 

The outbreak of the Coronavirus has directed some traders to think central banks will be required to go after dovish monetary policy to support the economy against the potential threat of a coronavirus. The Sterling is still trading with a bearish bias as the interest rate cut sentiment from 0.75% to 0.50% remains pretty solid. 

Prime Minister Boris Johnson’s Tories succeeded December’s election, extending his hold on parliament and pushing some Brexit risk, the Sterling was trading near 83 pence per Euro, and it also gained some support against the U.S. dollar.

The Bank of England will release the number of mortgage approvals in January (68,000 expected) and the M4 money supply.

Daily Support and Resistance

  • R3: 1.3209
  • R2: 1.3015
  • R1: 1.2916
  • Pivot Point 1.2821
  • S1: 1.2722
  • S2: 1.2627
  • S3: 1.2432

GBP/USD– Trading Tip

The GBP/USD continues trading with a bearish bias, breaking out of a narrow trading range of 1.2980 – 1.2880. On the 4-hour chart, the Cable has formed violated the descending triangle pattern, which was supporting the Sterling around 1.2880. 

It’s was one of the most crucial trading levels, and violation of this has further open room for selling until 1.2755 area. Below this level, the GBP/USD has the potential to go after the 1.2660 area. The MACD and RSI are holding in the selling zone, supporting bearish bias for the GBP/USD pair. Let’s look for selling trades below 1.2966 and bullish above the same level today. 


USD/JPY – Daily Analysis

The USD/JPY rebounded to 109.30. This morning, government data showed that Japan’s fourth-quarter capital spending declined 3.5% on year (-2.6% expected). The USD/JPY extended its decline to 109.30. This morning, government data showed that Japan’s jobless rate rose to 2.4% in January (steady at 2.2% expected), while industrial production grew 0.8% on month in January (+0.2% expected) and retail sales climbed 0.6% (-0.1% expected).

The Coronavirus is growing in the Middle East, Europe, and another area of the world, as Brazil verified its initial case in Latin America, while other regions of China found to lower their emergency response level as the number of new cases recorded there proceeds to reduce.

The Greenback is now trading with a slightly bearish bias amid forecasts that the U.S. Federal Reserve may lower the interest rates this year to control downside influence on the economy produced by China’s coronavirus outbreak.

Daily Support and Resistance

  • R3: 113.5
  • R2: 112.2
  • R1: 111.46

Pivot Point 110.9

  • S1: 110.16
  • S2: 109.6
  • S3: 108.29

USD/JPY – Trading Tips

The USD/JPY continues with its bearish momentum on Monday in the wake of weakness in the U.S. dollar and stronger Japanese yen. The USD/JPY pair is recovered a bit in the wake of a bullish correction, but more selling seems to come soon. The USD/JPY is trading bearish at 107.775, and it has high odds of going towards the next support level of 107.338.

We can see on the 4-hour chart above, the USD/JPY has formed a bearish engulfing pattern below 108.350, which may trigger further selling until 107.338. We need to keep an eye in the USD/JPY as the closing of candles above 108.338 level can help us secure a buy trade with a take profit of around 109.650.  

All the best for today! 

Categories
Crypto Market Analysis

Daily Crypto Review, Feb 28 – CFTC approaching stablecoin projects; Crypto market preparing for a move

The crypto market pretty much stayed at the same place price-wise in the past 24 hours. Bitcoin is currently trading for $8,758, which represents a 0.41% decrease on the day. Meanwhile, Ethereum lost 0.77% on the day, while XRP lost 0.11%.

Swipe took the position of today’s most prominent daily gainer, with gains of 19.28%. On the other side, DxChain Token lost 9.85% on the day, making it the most prominent daily loser.

Bitcoin’s dominance increased in the past 24 hours as some altcoins dropped in price more than it did. Its value is now 64.53%, which represents a 0.45 difference to the upside when compared to the value from when we last reported.

The cryptocurrency market capitalization stayed in pretty much the same place in the past 24 hours. It is currently valued at $249.09 billion, which represents a decrease of $0.92 billion when its value is compared to the value it had yesterday.

What happened in the past 24 hours

One of Switzerland’s biggest stock exchanges, SIX Swiss Exchange, announced a partnership with Omniex, a US-based firm that specializes in developing trading platforms for institutional investors, mainly targeting the cryptocurrency market.

The partnership will provide SIX and its clients with a way to include crypto to their business.

Honorable mention

Stablecoins 

American financial regulators had a sitdown with three major stablecoin projects in an effort for them to better understand the industry.

The CFTC Advisory Committee organized and held a public meeting in hopes of learning more about stablecoins, crypto insurance, custody practices as well as cybersecurity. JPM Coin, MarkerDao and Paxo had their representatives attend the event, discussing different aspects of stablecoins.

_______________________________________________________________________

Technical analysis

_______________________________________________________________________

Bitcoin

Bitcoin spent the past 24 hours trading at pretty much the same level. However, while there was seemingly not much price movement, Bitcoin made one attempt of breaking $8,825, which it did for a while. However, the price quickly pulled back and Bitcoin is almost exactly where it’s at 24 hours ago.


Bitcoin’s volume dropped to average levels after yesterday’s spike. It’s RSI level is currently on the line the oversold territory and regular value range.

Key levels to the upside                    Key levels to the downside

1: $8,825                                           1: $8,650

2: $9,115                                           2: $$8,535

3: $9,250                                            3: $8,250


Ethereum

Ethereum’s was also pretty stagnant over the past 24 hours. Its price attempted to reach the $240 mark but did not manage to get to it before bears took over again and put an end to the move. Ethereum fell to its previous prices and even attempted to break $225.5 to the downside. While its price is currently above this support level, it is unknown how long that will hold.


Ethereum’s volume is extremely low at the moment, while its RSI level is in the lower part of the value range.

Key levels to the upside                    Key levels to the downside

1: $240                                                1: $225.5

2: $251.3                                            2: $217.7  

3: $259.5                                             3: $198


Ripple

XRP performed the best out of the three biggest cryptos once again. However, this time, it was not by much. Its price tried to move above the $2454 level but failed to do so. As a result, XRP started dropping in price and pulled back to the $0.235 support. It is currently trading just above this support level.


XRP’s volume is slightly elevated, but nothing compared to yesterday’s volume. Its RSI level is in the lower part of the value spectrum.

Key levels to the upside                    Key levels to the downside

1: $0.2454                                          1: $0.235

2: $0.266                                            2: $0.227

3: $0.285                                             3: $0.221

Categories
Forex Market Analysis

Daily F.X. Analysis, February 28 – Top Trade Setups In Forex – Brace for U.S. Economic Events!

On the forex front, the U.S. Dollar Index dropped 0.6% on the day to a three-week low of 98.39, as the European Central Bank played down the impact of the coronavirus outbreak. Meanwhile, Chicago Federal Reserve Bank President Charles Evans said the Fed “must be prepared to rely on unconventional tools” in the event of a recession.

Economic Events to Watch Today 


EUR/USD – Daily Analysis

The EUR/USD surged 1.1% to 1.1001. European Central Bank President Christine Lagarde said the Coronavirus was not yet at the stage where monetary policy response is required. On the other hand, official data showed that the Eurozone’s Economic Confidence Index climbed to 103.5 in February (102.8 expected) from 102.6 in January.

The dollar has traded near a three-month high against the Euro as worries over the outbreak of Coronavirus has driven sharp volatility in the market, mostly driving dollar prices higher. 

The Euro has tried to rally higher during the Asian trading session on Thursday but continues to encounter resistance above. We are in a strong downtrend, and the EUR/USD is exhibiting correction of that downtrend as it could lead the EUR/USD prices towards the next target level of 10925. 

The German Federal Statistical Office will report February jobless rate (steady at 5.0% expected) and CPI (+1.7% on-year expected). France’s INSEE will post final readings of 4Q GDP (+0.8% on-year expected) and February CPI (+1.5% on-year expected).

Daily Support and Resistance

  • S1 1.092
  • S2 1.0842
  • S3 1.0799

Pivot Point 1.0963

  • R1 1.1041
  • R2 1.1084
  • R3 1.1162

EUR/USD– Trading Tips

The EUR/USD is consolidating near 1.1016, as the pair seems to go further higher after violating the 61.8% Fibonacci retracement at 1.0970. Chances of further buying in the EUR/USD remains pretty high until 1.1020 and 1.1065. The pair may find immediate support around 1.09540, which is mostly extended horizontal support level. The MACD and RSI still remain on the bullish side and are signaling odds of more buying in the pair. The EUR/USD may find resistance around 1.1020 and 1.1065, so let’s look for bullish trends above 1.0963.


GBP/USD– Daily Analysis

The GBP/USD erased early gains to close down 0.1% at 1.2888. The British government said it might start planning for a no-deal Brexit if a trade deal with the European Union is not apparent by June.

The U.K. government is expected to publish a negotiating mandate for the future relationship with the European Union. James Slack, the Prime Minister’s spokesman, told reporters: “At the end of this year we will regain in full our political and economic independence.” On the other hand, it is reported that the government might delay its budget decision, which is scheduled for March 11, amid uncertainty over the economic outlook.

The outbreak of the Coronavirus has directed some traders to think central banks will be required to go after dovish monetary policy to support the economy against the potential threat of a coronavirus. The Sterling is still trading with a bearish bias as the interest rate cut sentiment from 0.75% to 0.50% remains pretty solid. 

Prime Minister Boris Johnson’s Tories succeeded December’s election, extending his hold on parliament and pushing some Brexit risk, the Sterling was trading near 83 pence per Euro, and it also gained some support against the U.S. dollar.

In the U.K., the Nationwide Building Society will publish its house price index for February (+0.4% on month expected).

Daily Support and Resistance

  • S1 1.2850
  • S2 1.2812
  • S3 1.2764

Pivot Point 1.2898

  • R1 1.2936
  • R2 1.2984
  • R3 1.3022

GBP/USD– Trading Tip

On Friday, the GBP/USD continues trading with a mixed bias, following a narrow trading range of 1.2980 – 1.2880. As we can see on the 4-hour chart above, the Cable has formed a descending triangle pattern which is supporting the Sterling around 1.2880. It’s one of the most crucial trading levels as a violation of this can open further room for selling until 1.2795 area. Alternatively, the GBP/USD has the potential to go after 1.3070 if it manages to trade above 1.2960 support. The MACD and RSI are holding in the selling zone, supporting bearish bias for the GBP/USD pair. Let’s look for selling trades below 1.2966 and bullish above the same level today. 


USD/JPY – Daily Analysis

The USD/JPY extended its decline to 109.30. This morning, government data showed that Japan’s jobless rate rose to 2.4% in January (steady at 2.2% expected), while industrial production grew 0.8% on month in January (+0.2% expected) and retail sales climbed 0.6% (-0.1% expected).

The Coronavirus is growing in the Middle East, Europe, and another area of the world, as Brazil verified its initial case in Latin America, while other regions of China found to lower their emergency response level as the number of new cases recorded there proceeds to reduce.

The Greenback is now trading with a slightly bearish bias amid forecasts that the U.S. Federal Reserve may lower the interest rates this year to control downside influence on the economy produced by China’s coronavirus outbreak.

The U.S. official data showed that the fourth-quarter GDP (second reading) grew 2.1% on the quarter (as expected). Durable goods orders (preliminary reading) declined 0.2% on month in January (-1.4% expected). The number of initial jobless claims rose to 219,000 in the week ended February 22 (212,000 expected). Consequently, the USD/JPY is trying to gain support in the wake of positive economic data. 

Daily Support and Resistance

  • R3: 113.5
  • R2: 112.2
  • R1: 111.46

Pivot Point 110.9

  • S1: 110.16
  • S2: 109.6
  • S3: 108.29

USD/JPY – Trading Tips

The USD/JPY continues with its bearish momentum on Friday in the wake of weakness in the U.S. dollar and stronger Japanese yen. The USD/JPY pair is holding trading dramatically bearish at 108.875, and it has high odds of going towards the next support level of 108.338. We can see on the 4-hour chart above, the USD/JPY has formed a bearish engulfing pattern below 109.650, which may trigger further selling until 108.338. We need to keep an eye in the USD/JPY as the closing of candles above 108.338 level can help us secure a buy trade with a take profit of around 109.650.  

All the best for today!