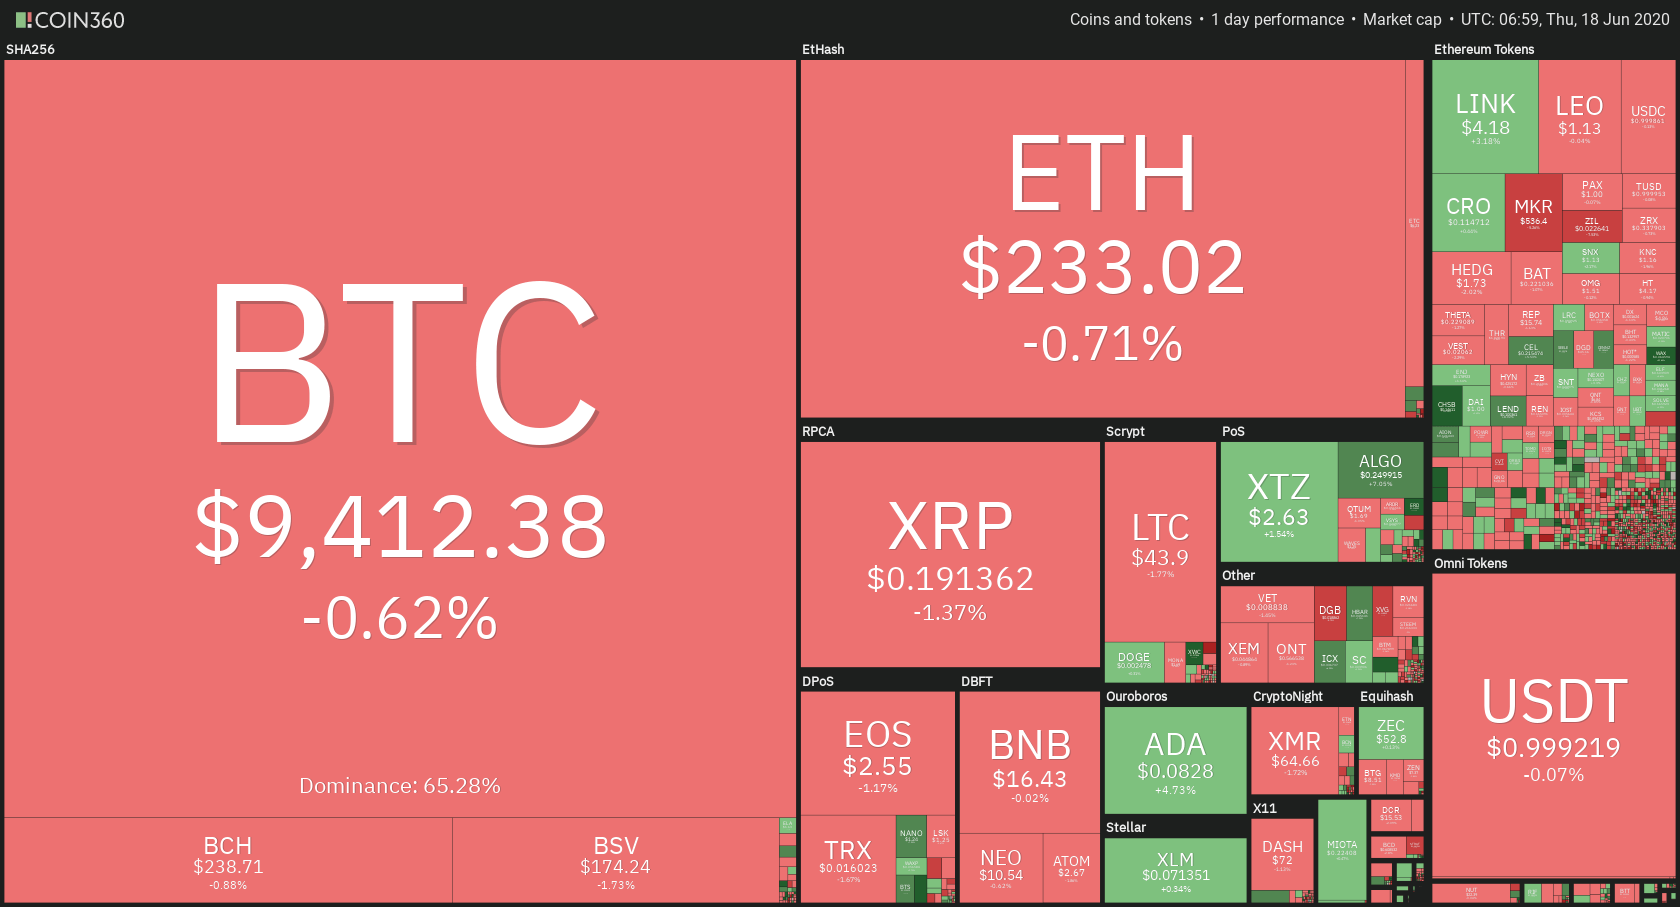
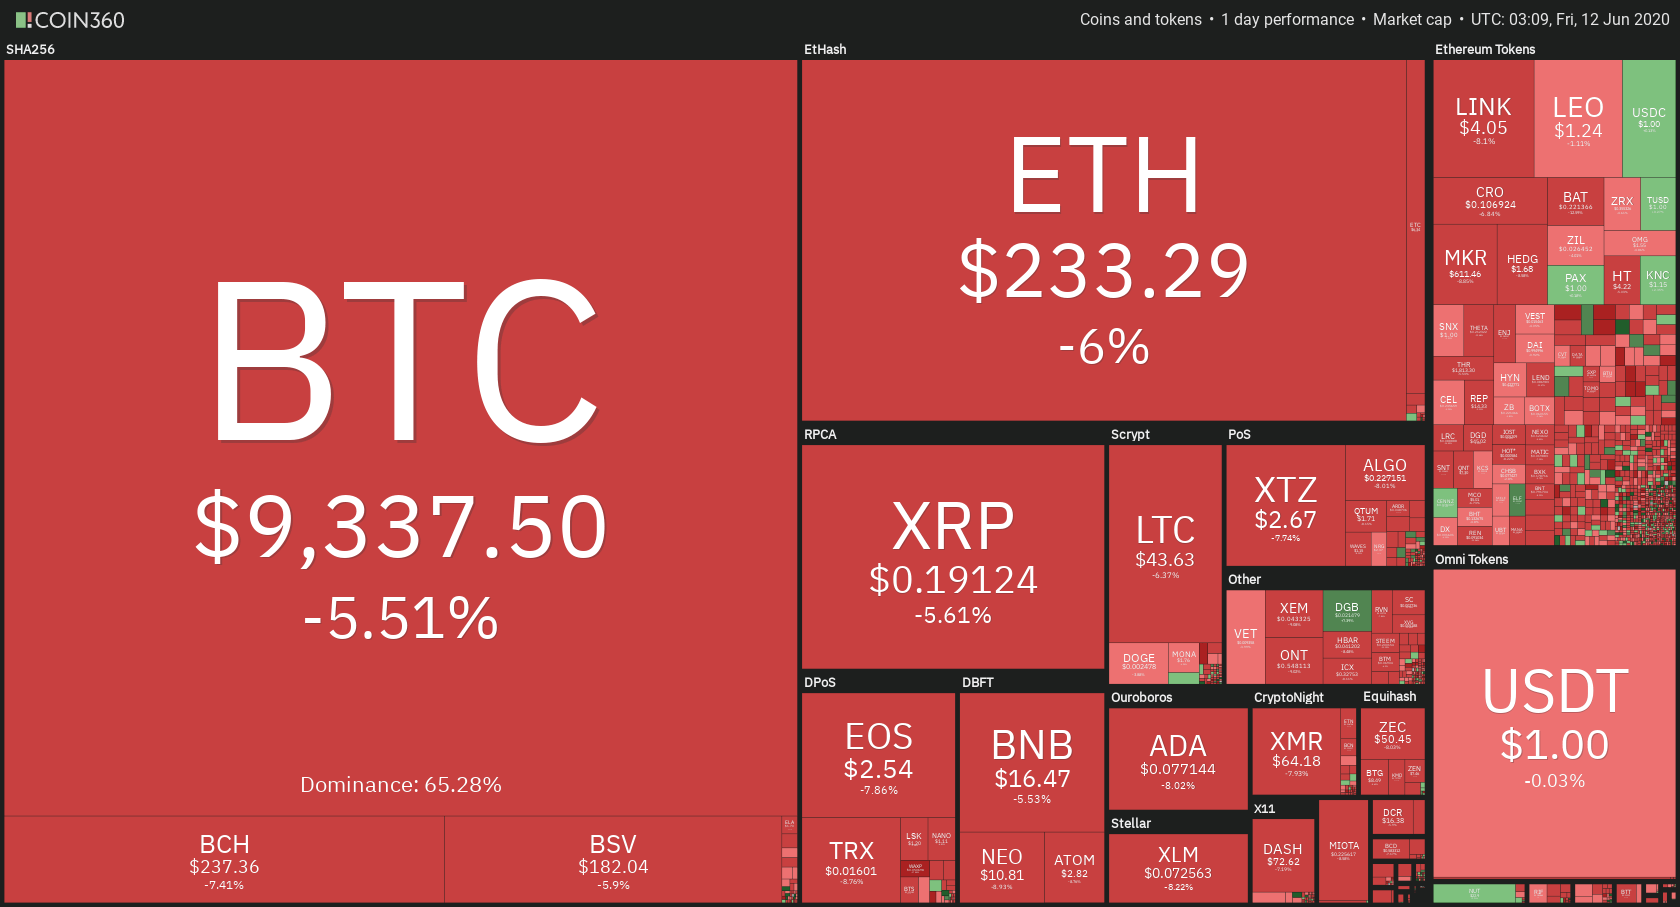
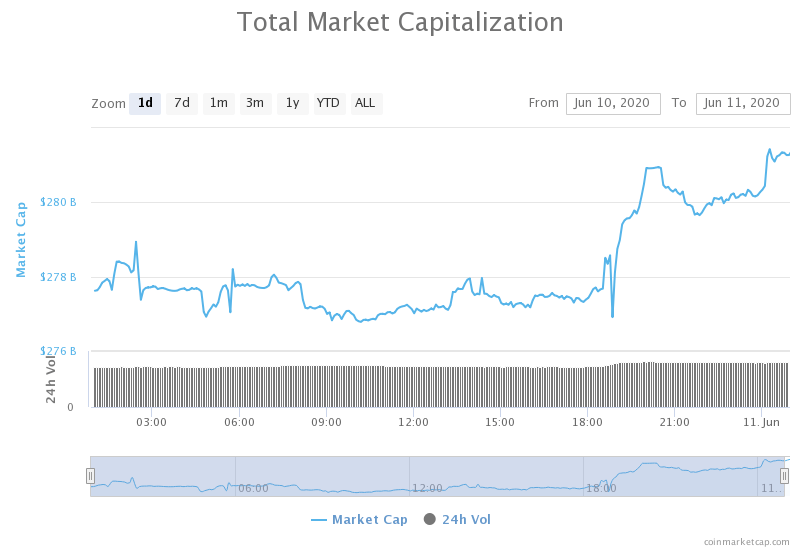
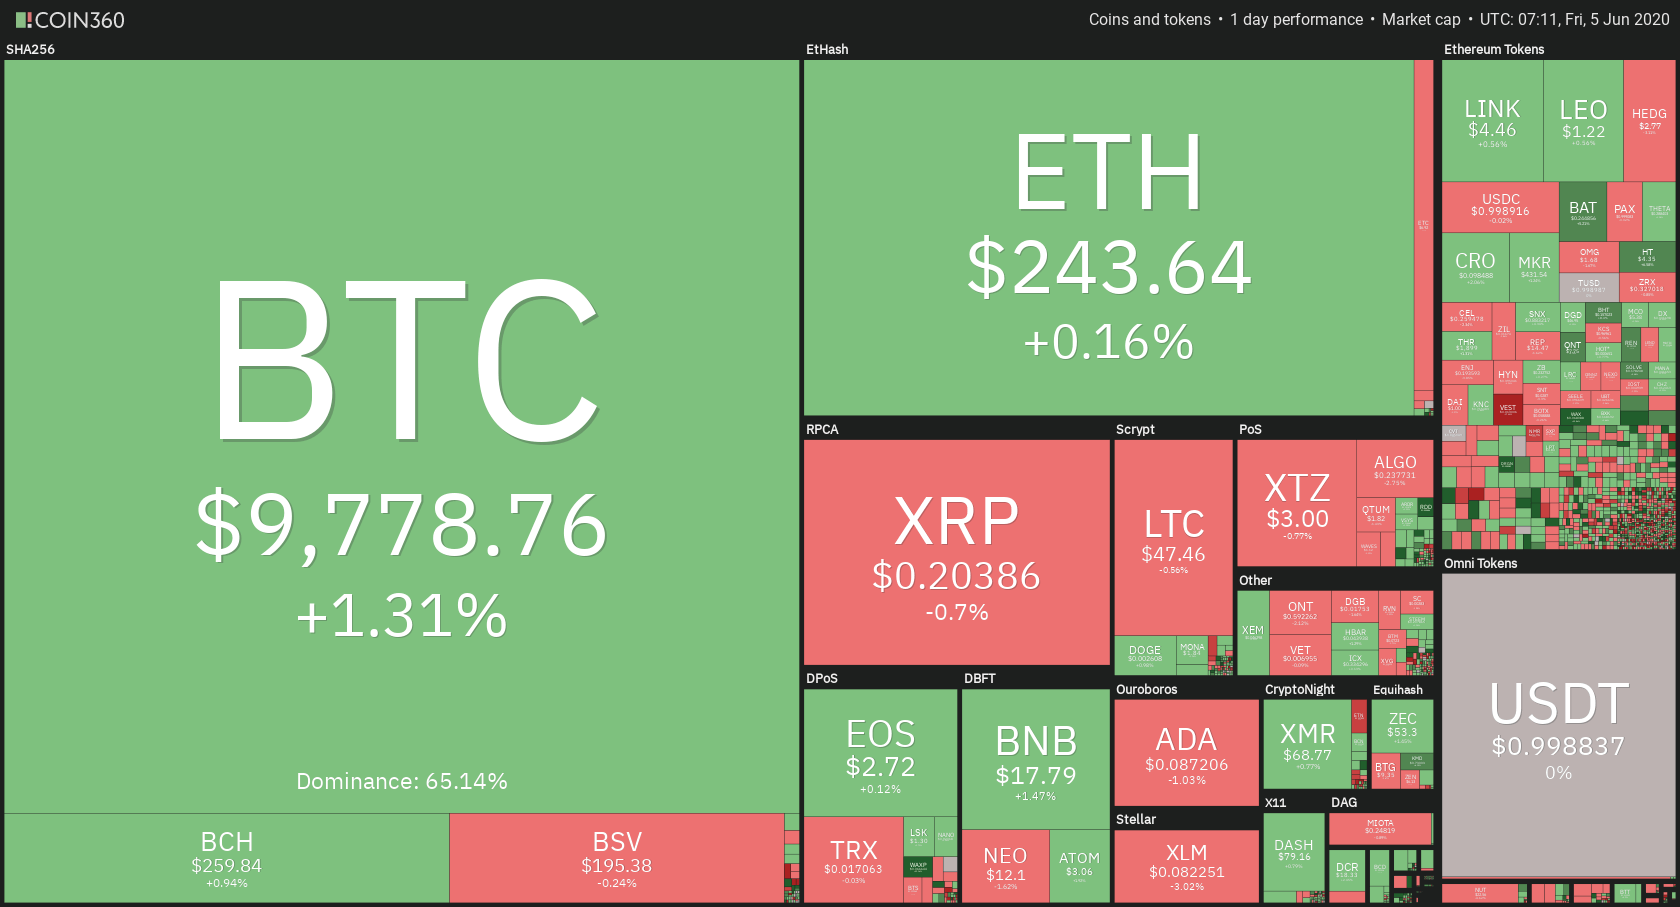
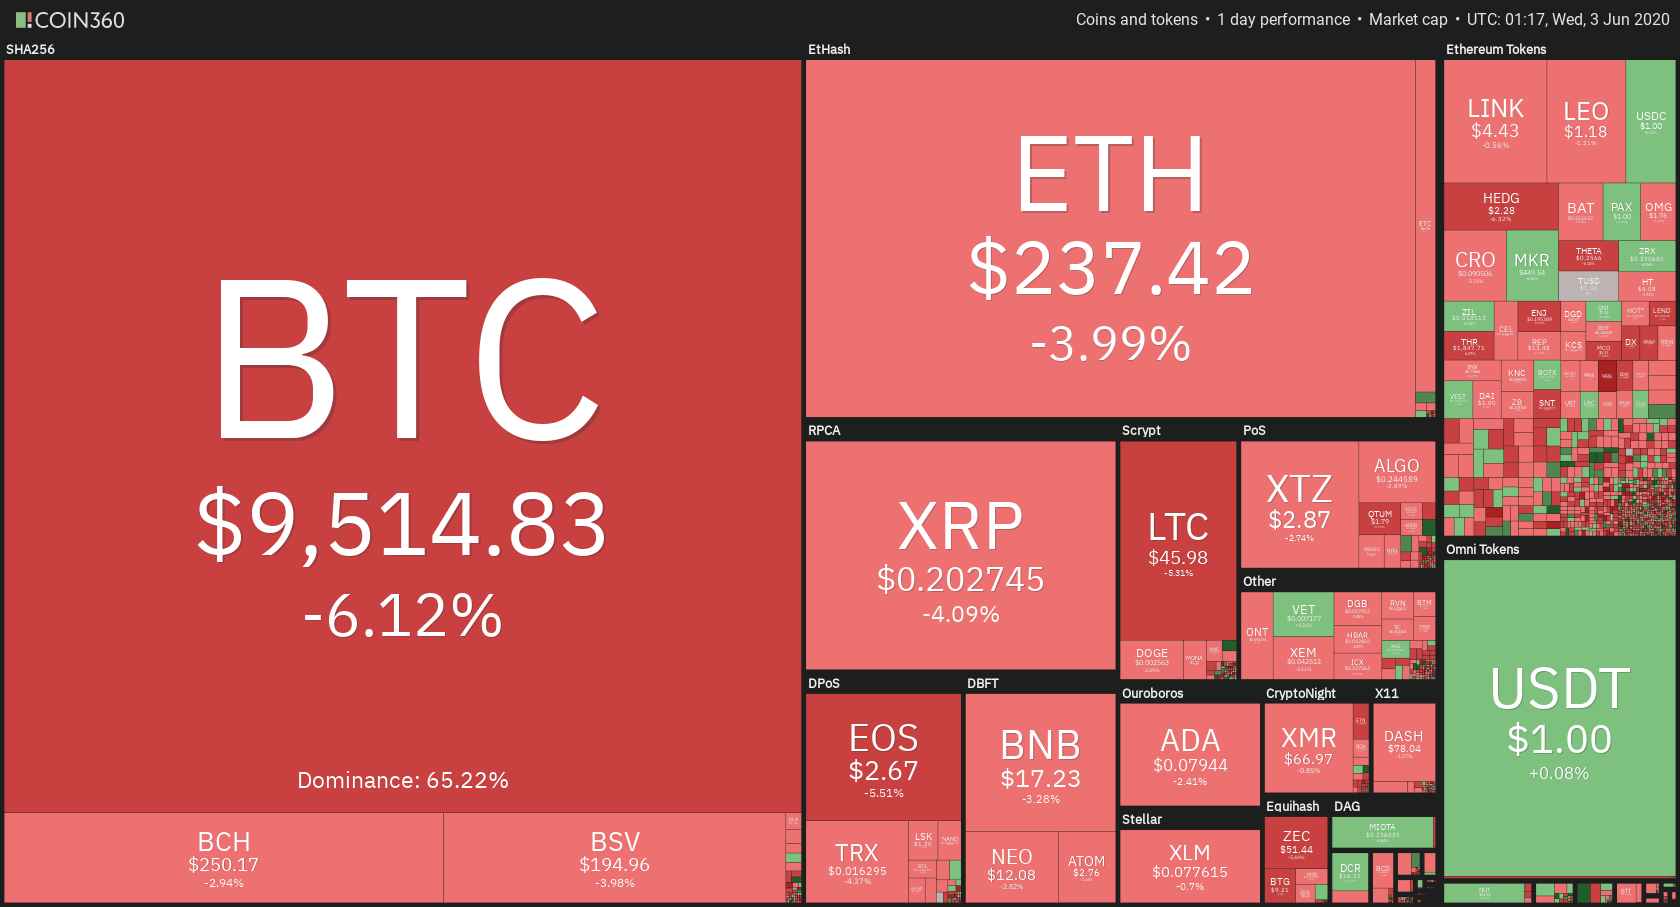
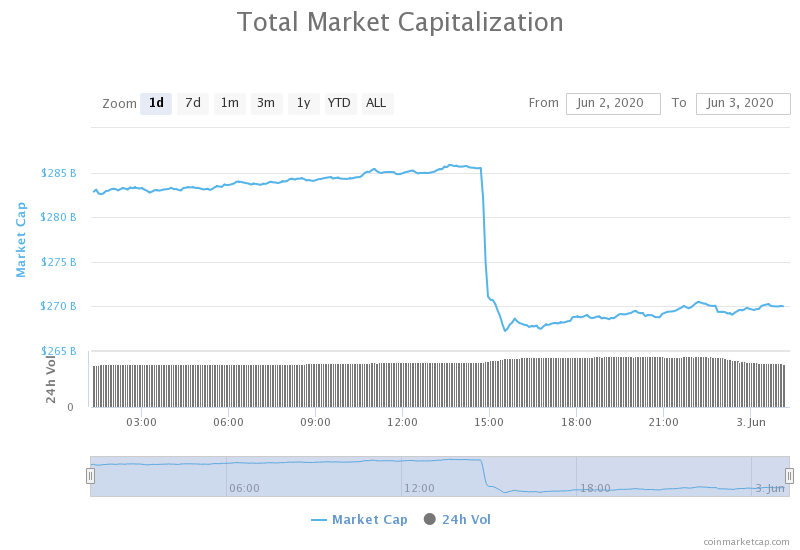
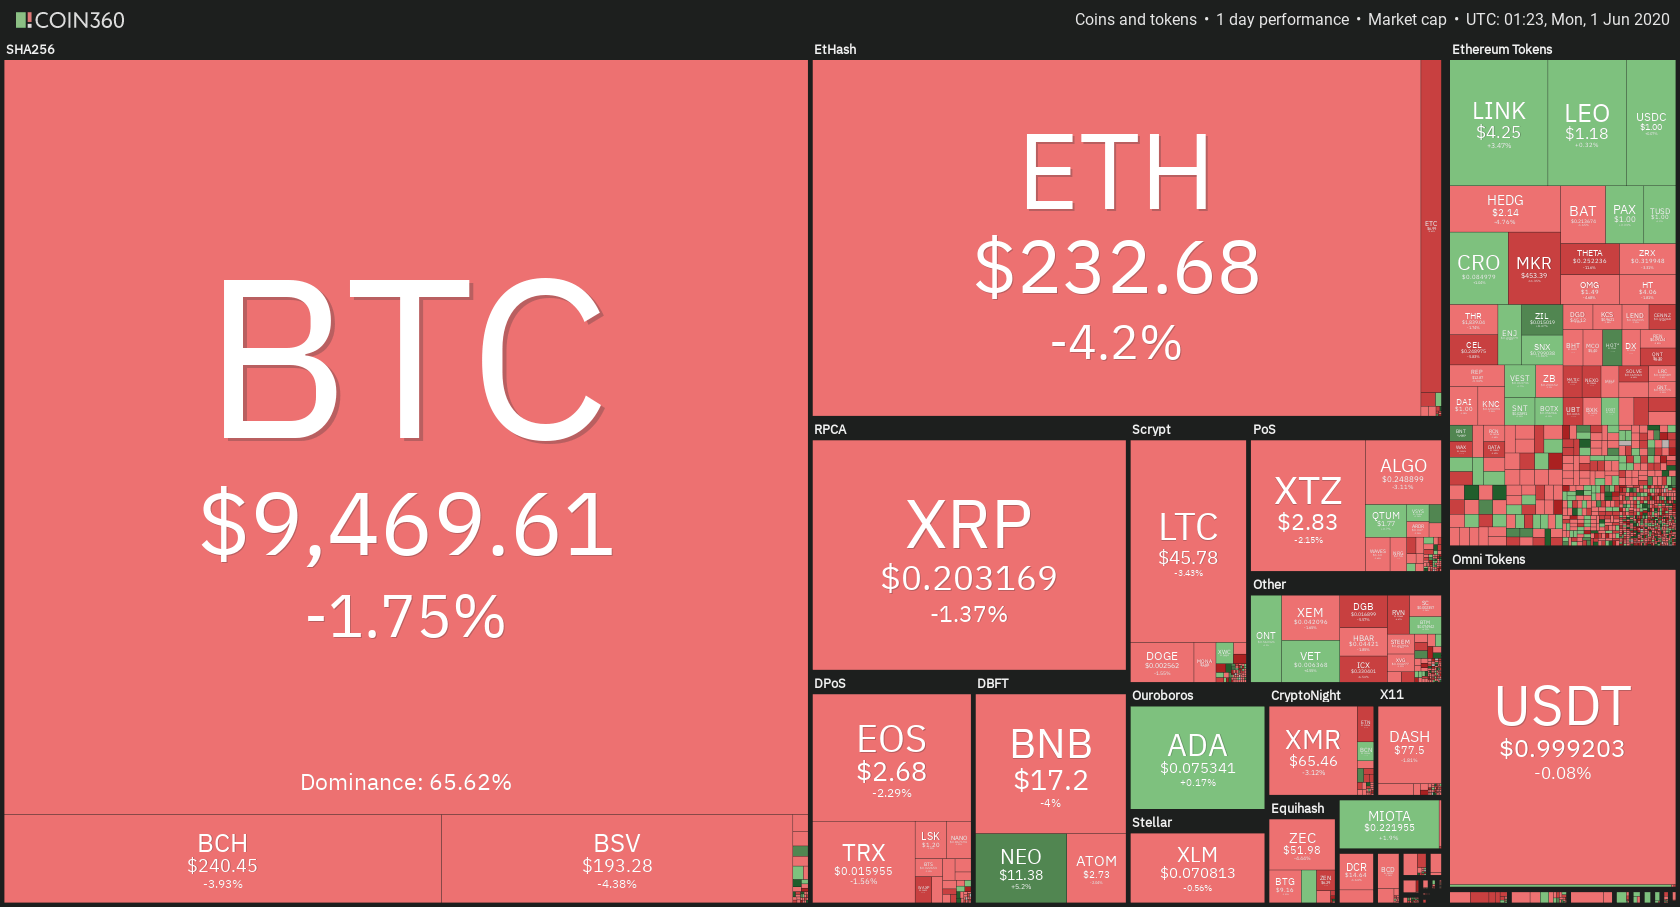
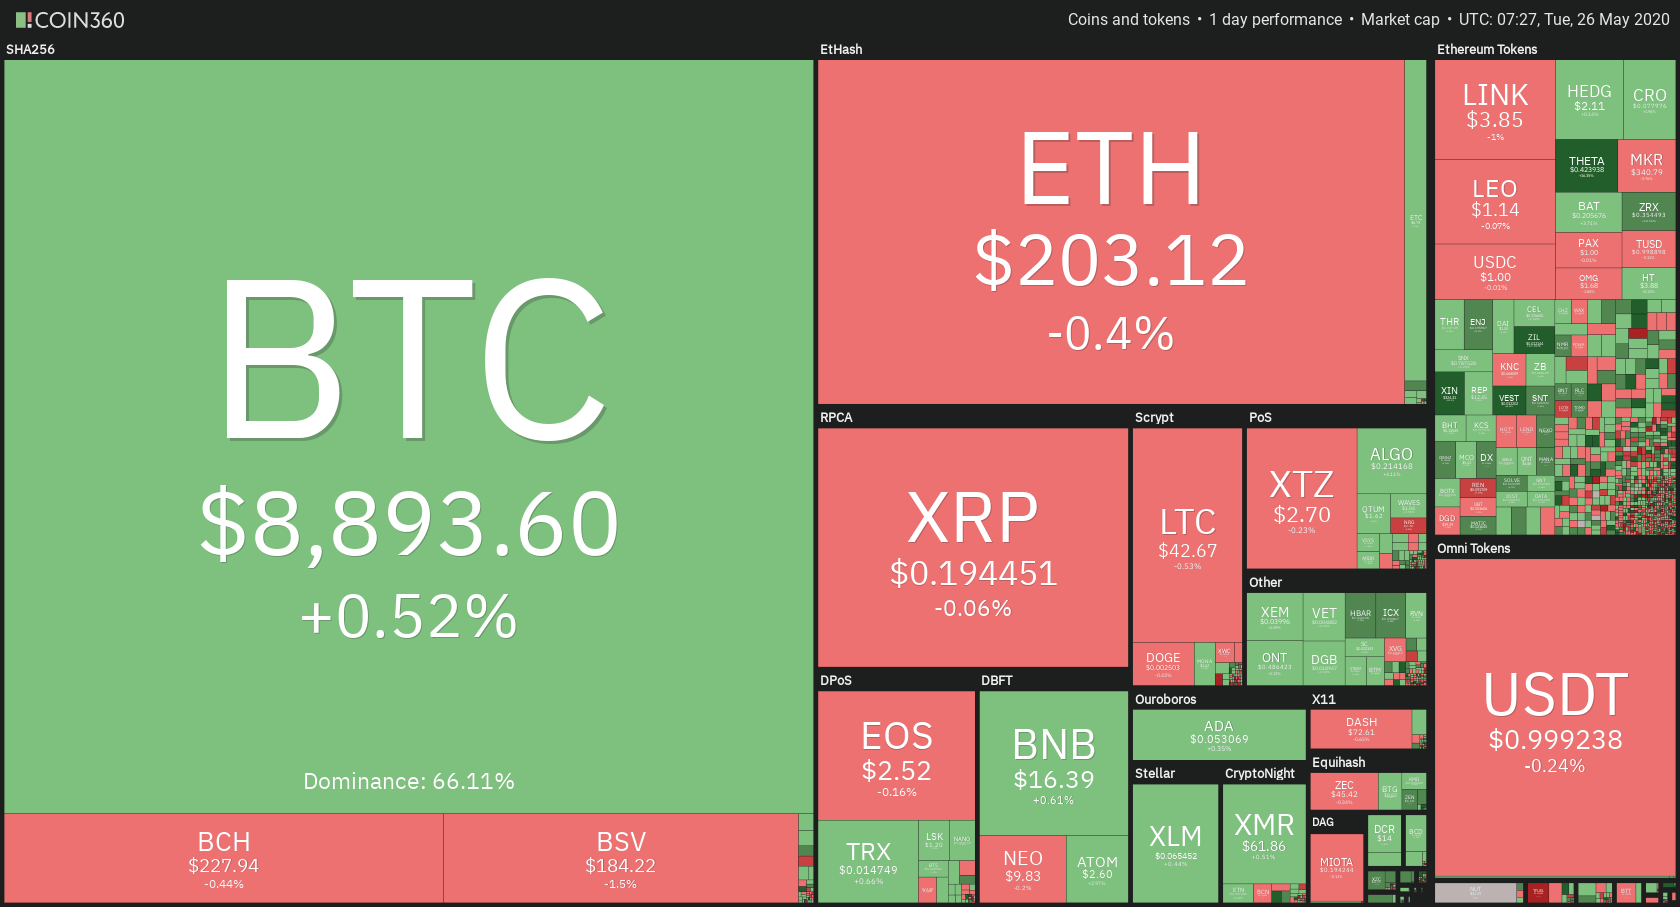
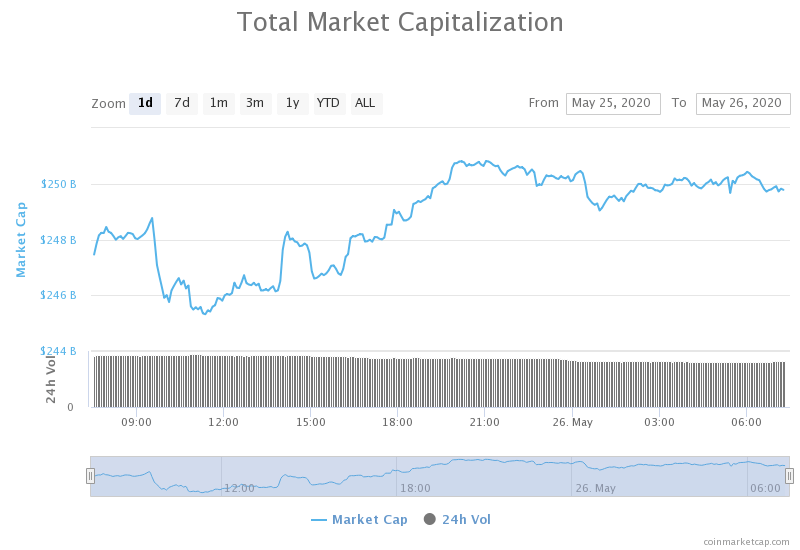
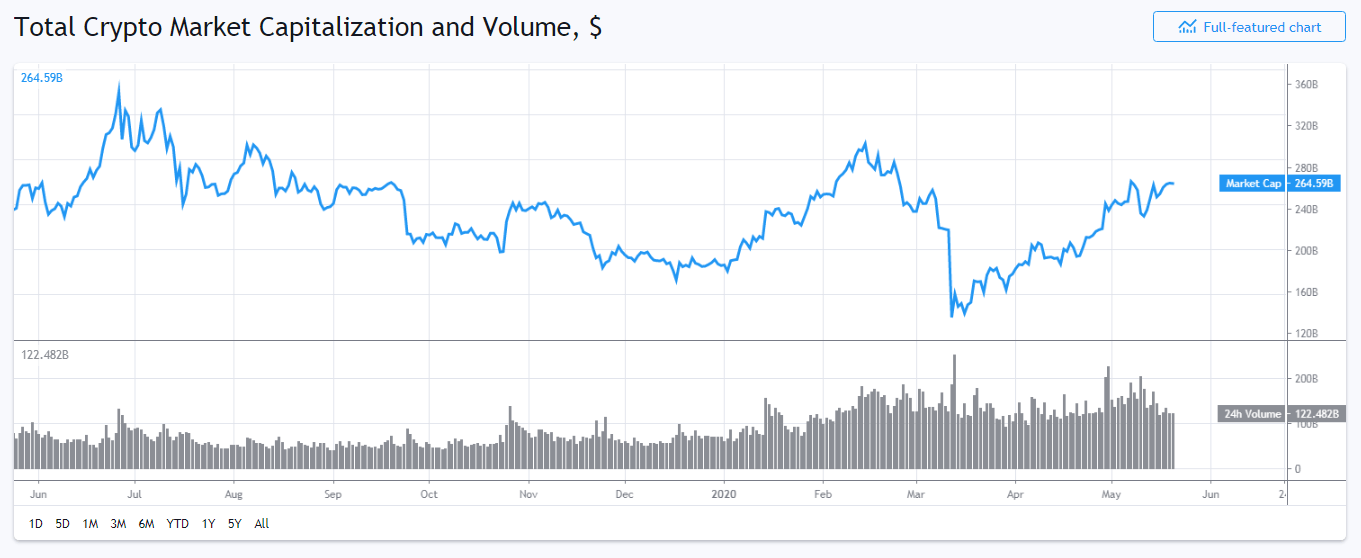
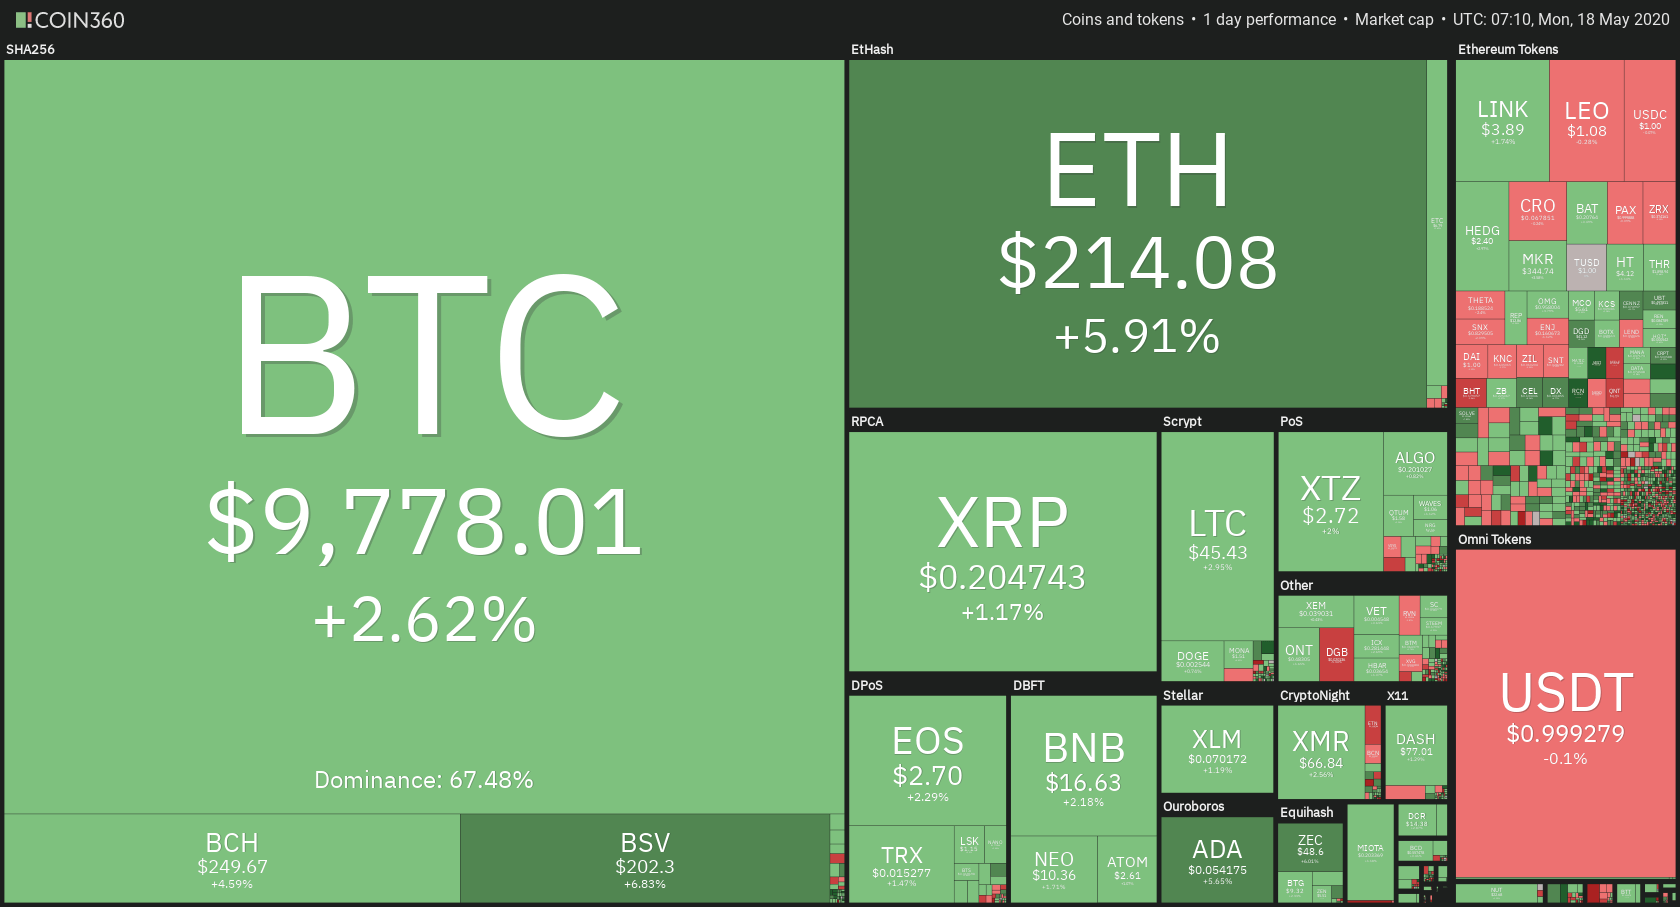
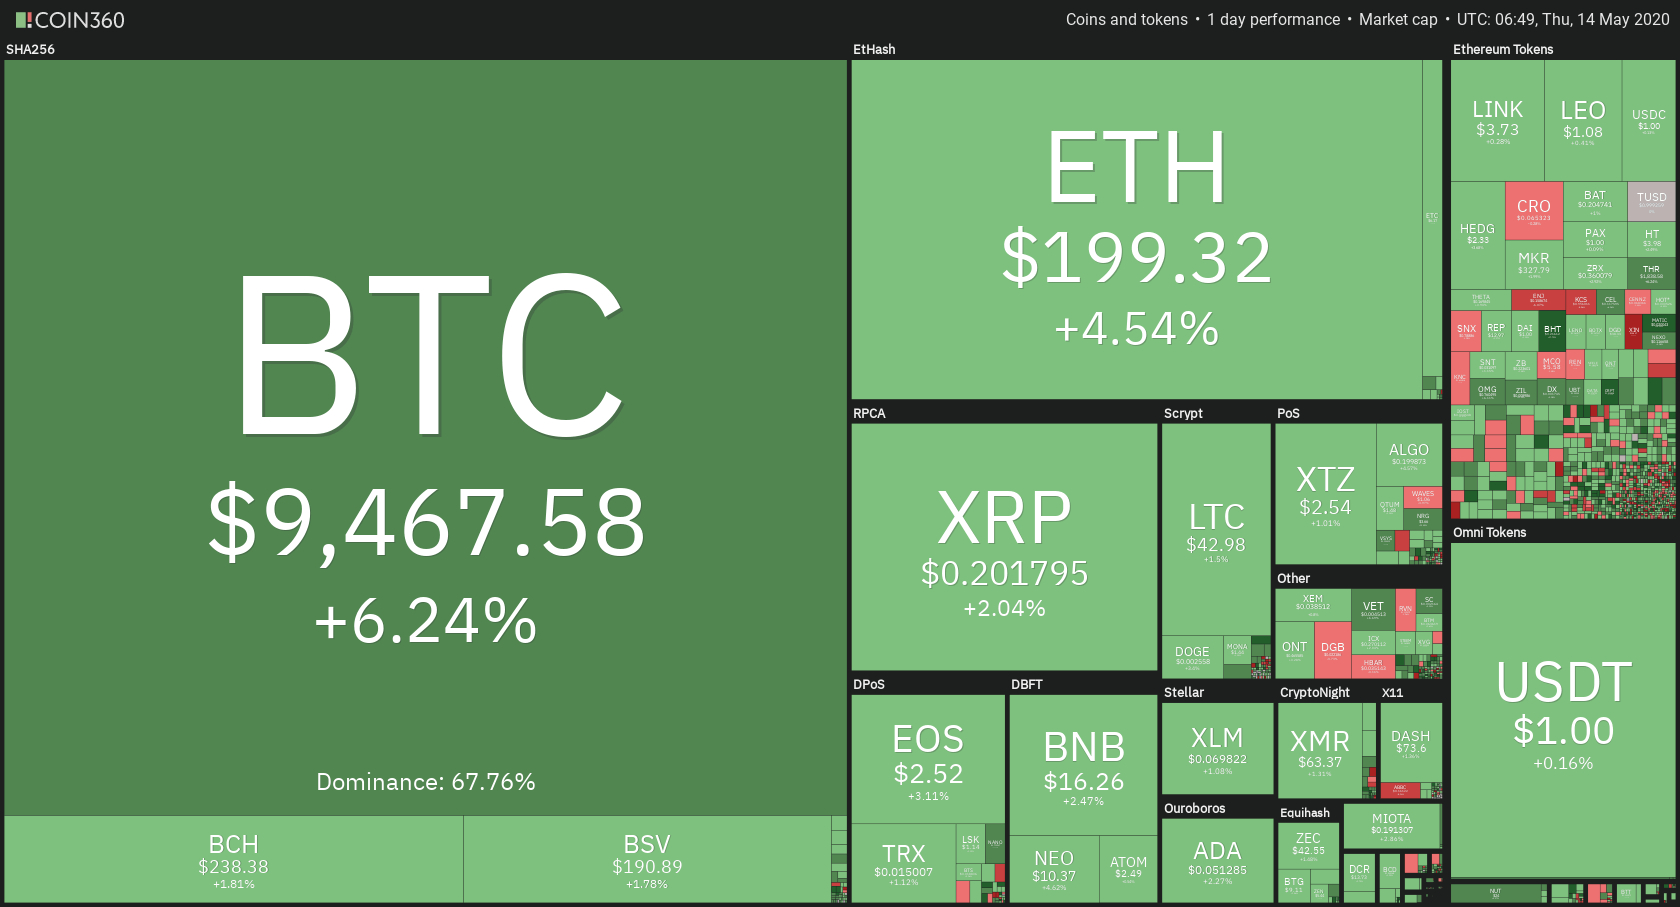
On Monday, the fears of the renewed spread of virus grew after the U.S. reported more than 2 million coronavirus cases as of June 12, and the infection cases were reported from the most populous states of America. The high level of new infections was reported from California, Texas, and Florida, which raised the possibility of a new wave of COVID-19 and prompted risk aversion.
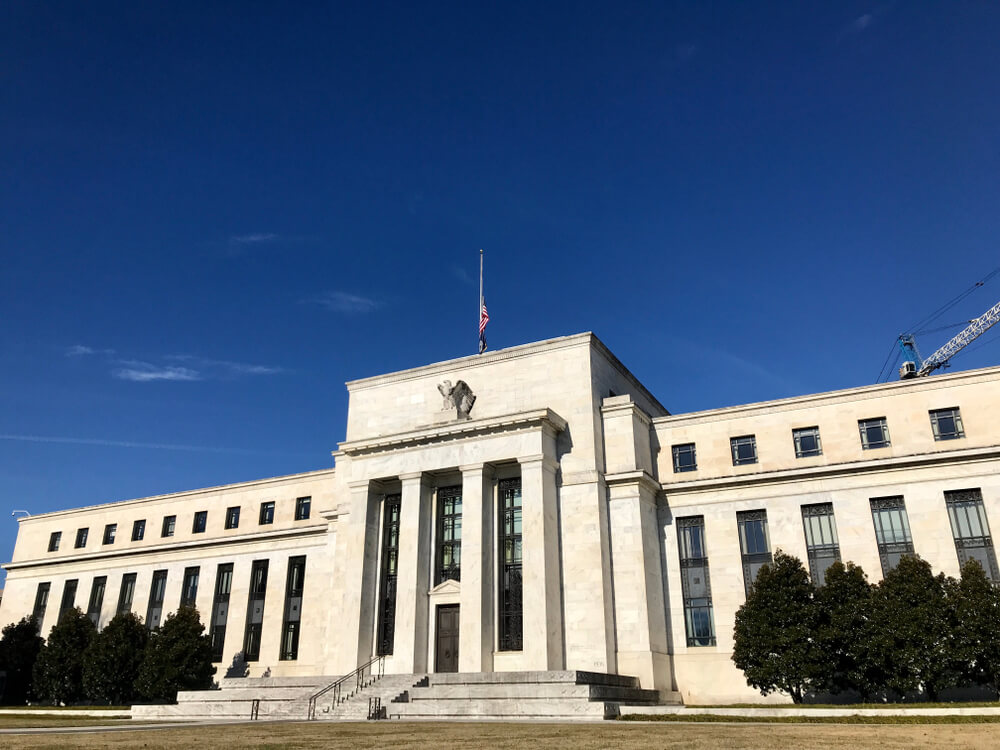
Risk appetite increased the demand for the U.S. dollar across the board as the bar for renewed restrictions of lockdown raised. Federal Reserve has already announced that the road to economic recovery will be longer than expected, which indicated more need for stimulus packaged from governments.
Economic Events to Watch Today
EUR/USD – Daily Analysis
The EUR/USD pair closed at 1.12563 after placing a high of 1.13403 and a low of 1.12124. Overall the movement of the EUR/USD pair remained bearish throughout the day. At 11:45 GMT, the French Final CPI for May came in as 0.1% against the expected 0.0% and supported Euro. At 13:00 GMT, the Italian Quarterly Unemployment Rate came in as 8.9% against the expected 8.8% and weighed on Euro. At 14:00 GMT, the Industrial Production in April was declined by 17.1% against the forecasted decline of 19.0% and weighed on Euro.
Poor than expected macroeconomic data from Eurozone weighed on shared currency Euro and dragged the pair EUR/USD to one week’s lowest level near 1.1212. On the other hand, the greenback was stronger on Friday, and the U.S. Dollar Index (DXY) jumped to 97.15 level. The strength of the U.S. dollar also added to the downfall of the EUR/USD currency pair at the ending day of the week.
From the American side, at 17:30 GMT, the Import Prices in May were surged by 1.0%, which were previously forecasted to increase by 0.6% and supported the U.S. dollar. At 19:00 GMT, the Prelim UoM Consumer Sentiment increased to 78.9 from the anticipated 75.0 in June and supported the U.S. dollar. The Prelim UoM Inflation Expectations decreased to 3.0% from previous months’ 3.2% in June and supported the U.S. dollar. After better than expected data from the American side, the pair EUR/USD was further dragged down towards its six day’s lowest level.
Furthermore, the Commissioner President of the European Union, Von der Leyen, will meet the Prime Minister of the United Kingdom, Boris Johnson, on Monday to revive the talks related to the post-Brexit deal. So far, there hasn’t been much progress on a free-trade agreement between U.K. & Brussels while there is not much time left to extend the deadline for a deal till end-2020.
However, on Thursday and Friday this week, the E.U. leaders will meet to discuss the proposed recovery fund to overcome the economic damage caused by the pandemic. All members except the Frugal Four I,e Netherland, Austria, Demark, and Sweden, support the recovery fund. All member’s acceptance is needed for the recovery fund to succeed, and any delay will be a major setback for the shared currency Euro.
Daily Support and Resistance
- R3 1.1293
- R2 1.1275
- R1 1.1263
Pivot Point 1.1245
- S1 1.1233
- S2 1.1215
- S3 1.1203
EUR/USD– Trading Tip
The EUR/USD pair is trading at 1.1260 level, having entered into the oversold zone. Today, we can expect bullish correction until 1.1270 and 1.1290 levels, which marks 50% and 61.8% Fibonacci retracement levels. Below these levels, the EUR/USD pair can show selling bias again as the 50 EMA can pressure the pair for selling. On the lower side, support continues to hold around 1.12250 and 1.1208.
GBP/USD – Daily Analysis
The GBP/USD pair was closed at 1.25414 after placing a high of 1.26533 and a low of 1.24735. Overall the movement of GBP/USD pair remained bearish throughout the day. The GBP/USD pair was dropped to its lowest of 8 days on Friday due to mediocre than expected economic data release and U.S. dollar strength. At the ending day of the week, British Pound dropped against the U.S. dollar after the British GDP contracted by a quarter year-on-year in April.
At 11:00 GMT, the Gross Domestic Product (GDP) in April from the United Kingdom was dropped to -20.4% from the expected -18.6% and weighed on GBP. The Manufacturing Production for April also dropped to negative 24.3% from the expectations of -15.0% and weighed on British Pound.
The Industrial Production in April was dropped to -20.3% against the forecasted -15.0% and added in the weight of British Pound. However, at 11:02 GMT, the Goods Trade Balance for April showed a deficit of 7.5B against the forecasted deficit of 11.0B and supported Pound.
At 11:03 GMT, the Construction Output in April was recorder to decline by 40.1% against the forecasted 240% decline and weighed on British Pound. However, the Index of Services was declined by 9.9% against the expected decline of 10.6%.
At 13:30 GMT, the Consumer Inflation Expectations for the United Kingdom were dropped to 2.9% for this quarter from 3.0% of the previous quarter. At 18:08 GMT, the Institute of Economic and Social Research (NIESR) Estimate for GDP in May was -17.6% against the previous months’ -10.3%. At 18:30 GMT, the C.B. Leading Index for April was dropped by 2.9% from the previous month’s 1.2%.
The poor-than-expected macroeconomic data from Great Britain exerted negative pressure on British Pound and dragged the pair to its one week’s lowest level below 1.2500 level.
Apart from negative macroeconomic data, the uncertainty surrounding Brexit also weighed on British Pound on Friday ahead of the PM Boris Johnson’s video conference with European Council President Charles Michel, European Commission President, Ursula von der Leyen and European Parliament President David Sassoli on Monday.
The lack of progress in Brexit talks with Brussels and the calls to review the policy options, including negative interest rates by BoE has also been lagging in the recovery of Pound. Ahead of the BoE meeting, it has already been confirmed on Friday that U.K.’s economy has contracted by 20.4% in April. This means that BoE will likely announce further easing in its policy next week. The current purchase plan of BOE comprises 200 Billion GBP, which is likely to extend further in the next meeting.
Furthermore, the latest round of talks with Brussels failed to deliver any significant progress in the post-Brexit trade deal, which has raised the odds for a no-deal exit from the E.U. As the transition period will expire on January 1, 2021.
On the other hand, from the American Side, the Prelim Consumer Sentiment from the University of Michigan increased in June to 78.9 from the expected 75.0 and supported the U.S. dollar. The U.S. dollar was already strong in the market, and after this release, it exerted even more pressure on the GBP/USD pair.
Daily Support and Resistance
- R3 1.2593
- R2 1.2568
- R1 1.2538
Pivot Point 1.2512
- S1 1.2482
- S2 1.2456
- S3 1.2426
GBP/USD– Trading Tip
The GBP/USD pair is trading with a bearish bias at a depth of 1.2470, following a downward channel extending resistance around the value of 1.2540. On the 4 hour timeframe, the Cable has entered the oversold zone as we can see the RSI and MACD both were holding below 20 and below 0 levels, respectively. On the lower side, the Cable may find initial support at a level of 1.2385 after the violation of 1.2455 level. On the higher side, the GBP/USD prices may find resistance at 1.2543 area today. Let’s consider sell positions below 1.2450 level.
USD/JPY – Daily Analysis
The USD/JPY was closed at 107.353 after placing a high of 107.552 and a low of 106.583. Overall the movement of USD/JPY remained bullish throughout the day. The USD/JPY gained strength after posting losses for the previous four consecutive days. The stronger U.S. dollar and negative macroeconomic data release from Japan might have added in the strength of this pair USD/JPY.
At 9:30 GMT, the Revised Industrial Production from Japan in April was declined by 9.8% against the forecasted 9.1% and weighed on Japanese Yen and moved the pair USD/JPY in the upward direction on Friday.
The brighter market sentiment due to come back of risk appetite in the market after the possibility of renewed lockdowns increased due to increased fears over the second wave of coronavirus outbreak.
The fears of the renewed spread of virus grew after the U.S. reported more than 2 million coronavirus cases as of June 12, and the infection cases were reported from the most populous states of America. The high level of new infections was reported from California, Texas, and Florida, which raised the possibility of a new wave of COVID-19 and prompted risk aversion.
Risk appetite increased the demand for the U.S. dollar across the board as the bar for renewed restrictions of lockdown raised. Federal Reserve has already announced that the road to economic recovery will be longer than expected, which indicated more need for stimulus packaged from governments.
However, the U.S. Dollar Index was up to 97 levels on Friday, and the strength of the U.S. dollar pushed the USD/JPY pair above 107.5 level.
Another factor aiding in the U.S. dollar’s strength was better than expected macroeconomic data from the USA. At 19:00 GMT, the Prelim Consumer Sentiment from the University of Michigan (UoM) surged to 78.9 in June from the expected 75.0 and supported the U.S. dollar. The Import Prices in May also increased by 1.0% from 0.6% of forecast and supported the U.S. dollar. The Prelim UoM Inflation expectation in June was reported as 3.0%.
Daily Support and Resistance
- R3 107.93
- R2 107.75
- R1 107.54
Pivot Point 107.36
- S1 107.15
- S2 106.97
- S3 106.75
USD/JPY – Trading Tips
The USD/JPY pair fell sharply after violating the upward channel, which supported the pair around 107.500. For now, this level is working as resistance for USD/JPY. The 50 periods EMA is also extending strong resistance at 107.650 area while immediate support stays around 106.600. The bearish trend in the USD/JPY pair can trigger a sell-off until the next support level of the 106.017 level today. Let’s wait for the market to test the 107.650 level before entering a sell in the USD/JPY today.
Good luck!