During Asian trading hours on Monday, the ICE U.S. Dollar Index dropped 1.1% to 97.67, giving up most of its gains made in the prior session, as the Fed slashed interest rates over the weekend. The U.K. house price grew 1.0% on month in March (+0.8% in February), according to the home-listing website Rightmove.
In the U.S., the New York Federal Reserve will publish March Empire Manufacturing Index (4.9 expected).
Economic Events to Watch Today
EUR/USD – Daily Analysis
On Monday, the European Union finance ministers plan to agree on an economic acknowledgment to the coronavirus pandemic, with the European Commission forecasting the consequences of the virus could drive the European Union into a recession.
The central bank kept rates unchanged on Thursday and raised its asset purchase program by EUR120B. They introduced a new program of cheap loans that would necessarily pay banks up to 0.75% to give to small businesses. However, the EUR traders were not impressed, as indicated by the long-tail (seller exhaustion) attached to Thursday’s candle.
Whereas, the broad market recession fears continue to increase the progress into the U.S. bonds, which translates into lower returns on the bonds, ultimately keep the greenback under pressure. The U.S. dollar index trades around 98.25, down 0.50% on the day, having stopped its recovery just shy of 98.50.
Looking forward, the markets now keep their eyes on the European Union (E.U.) Finance Ministers’ and G7 leaders’ economic response to the virus outbreak, which is due later on Monday for taking fresh near-term trading opportunities in the main currency pair.
Daily Support and Resistance
- S1 1.0654
- S2 1.0918
- S3 1.1045
Pivot Point 1.1182
- R1 1.1309
- R2 1.1447
- R3 1.1711
EUR/USD– Trading Tips
The EUR/USD has traded mostly lower, bouncing off the double bottom support level of 1.1095 level. The EUR/USD is currently trading around 1.1165, and it’s forming a lower-lows pattern on the 4-hour chart, which mostly drives a continuation of a selling trend. On the lower side, a continuation of a bearish bias can extend sell-off until 1.1100 and 1.1095. While the bullish breakout of 1.1350 can drive more buying until 1.1454 area. Consider staying bullish over 1.1182 and bearish below the same level today.
GBP/USD– Daily Analysis
The GBP/USD dropped to 1.2321. Over the weekend, the global coronavirus pandemic worsened, particularly in Europe. Italy saw the number of coronavirus cases surge past 24,700 (1809 deaths), while Spain reported over 7,800 cases in total, Germany over 5,800 cases and France over 5,400 cases. In the U.S., the number of cases jumped to nearly 3,600 (68 deaths).
On Sunday, U.S. Federal Reserve slashed interest rates to near zero percent while announcing plans to purchase 700 billion dollars in bonds and securities to stabilize financial markets and support the economy.
It is worth mentioning that the global markets remain sluggish despite the Fed, and the RBNZ announced an unscheduled rate cut while the BOJ is in the pipeline. As in result, the risk-tone remains on the back foot with the U.S. treasury yields falling almost 30 basis points while markets in Asia also flash losses by the press time.
Looking forward, the coronavirus headlines and the central bank updates will be the key to watch for near-term direction, while the traders will keep their eyes on the EU-UK disputes regarding Brexit.
On Monday open, U.S. stock futures dropped nearly 5% to their daily limit.
U.K. house price grew 1.0% on month in March (+0.8% in February), according to the home-listing website Rightmove.
Daily Support and Resistance
- S1 1.1957
- S2 1.2295
- S3 1.2436
Pivot Point 1.2633
- R1 1.2774
- R2 1.297
- R3 1.3308
GBP/USD– Trading Tip
The GBP/USD fell sharply to trade around 1.2360 level and has closed a bullish candle followed by strong selling candles. The Cable has immediate support around 1.2270 level, and above this, the Cable can extend the continuation of a bullish bias until 1.2450 level and 1.2625.
The MACD is consistently forming bearish histograms below zero, supporting the selling trend in the GBP/USD pair, which is why we should consider selling below 1.2633 today. Recently, the GBP/USD has closed a bullish candle that can drive buying in the GBP/USD, and it may lead its prices higher towards 1.2685 level.
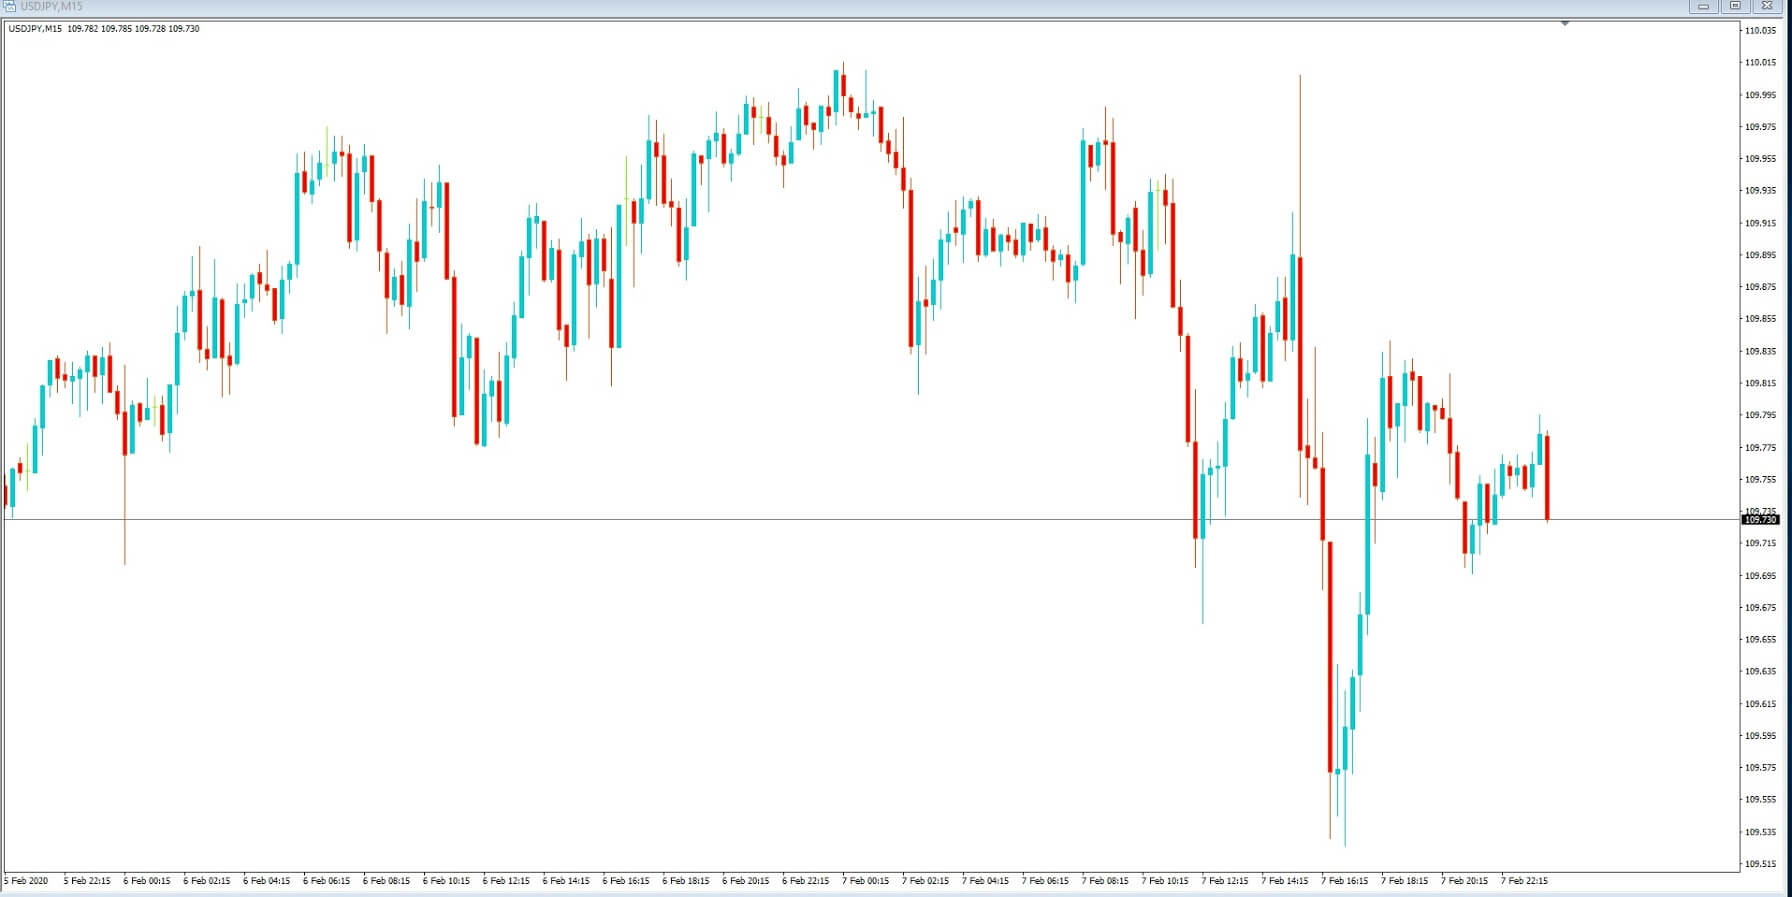
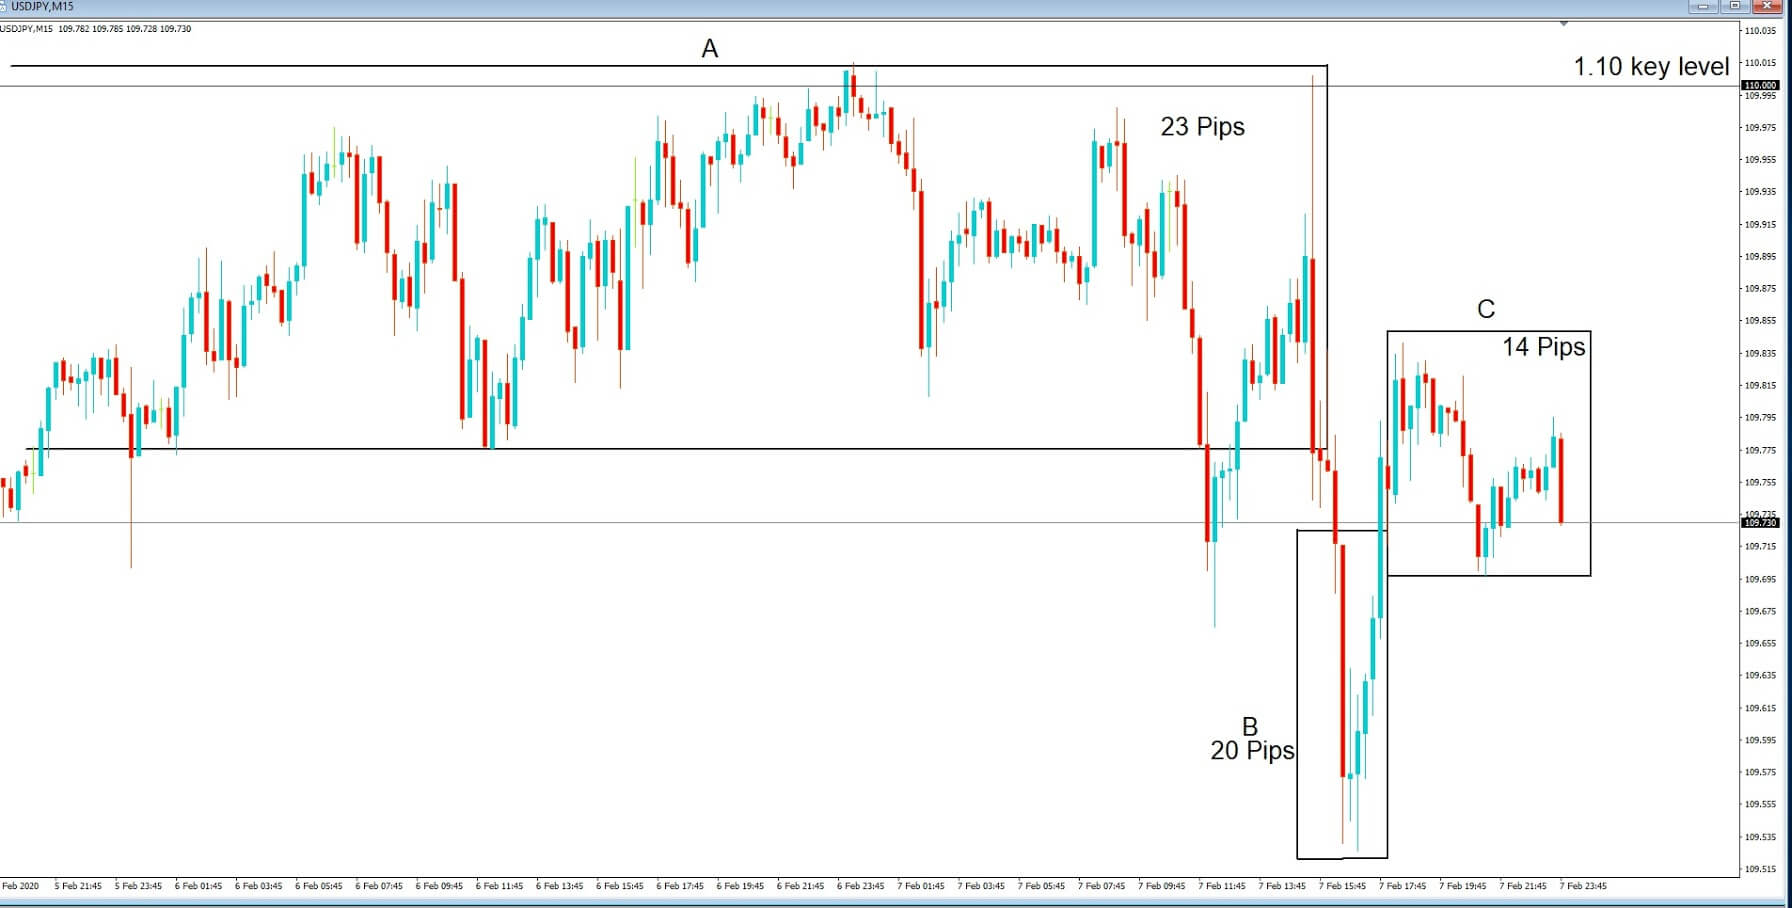
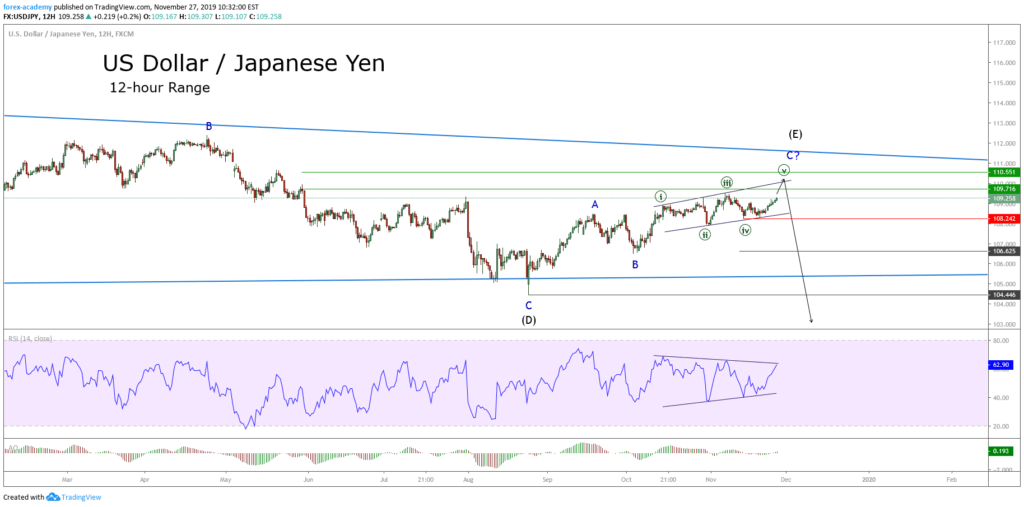
USD/JPY – Daily Analysis
Today in the Asian session, the USD/JPY currency pair flashing red and trading below the 107.00, representing 1.40% losses on the day after the Bank of Japan avoided delivering the rate cut ahead of the European open on Monday.
During its emergency 1-day monetary policy meeting, the Bank of Japan (BOJ) board members decided to keep rates unchanged at -10bps whereas maintaining a10-yr JGB yield target at 0.00%. Although, the decision on maintaining its interest rate targets was made by a 7-2 vote with board members Goushi Kataoka and Yutaka Harada dissenting.
At the BOJ front, the BoJ Interest Rate Decision is announced by the Bank of Japan. Usually, if the BoJ raises the interest rates, it is positive, or bullish, for the JPY. Likewise, if the BoJ has a dovish view on the Japanese economy and cuts the interest rate, it is considered negative or bearish.
On the other hand, the U.S. Federal Reserve (Fed) announced a surprise rate cut to 0.25% in addition to $700 billion worth of Quantitative Easing. As well as, the Fed policymakers signaled that there would not be any Federal Open Market Committee (FOMC) during this week, which was earlier scheduled for Wednesday.
Whereas, the RBA indicated that it would purchase bonds while holding a special meeting on Thursday, whereas RBNZ finally also joined the role of major central bankers that offered significant rate cuts in order to control the coronavirus (COVID-19).
Daily Support and Resistance
- S1 99.26
- S2 102
- S3 103.37
Pivot Point 104.74
- R1 106.11
- R2 107.47
- R3 110.21
USD/JPY – Trading Tips
The USD/JPY is trading at 107.800 and has already completed a 61.8% Fibonacci retracement level at 108.065. Below this, the USD/JPY is exhibiting a correction which is likely to lead the USD/JPY prices towards 105.960. Closing of 4-hour candle above this level has confirmed the chances of further buying in the pair until 108. Whereas, below 105.950, we may see further selling until 103.750. On the leading indicator’s front, the USD/JPY is in a bullish mode, and we should consider buying trades over 105. All the best for today!