The European Commission will post May CPI (+0.1% on-year expected). The European Central Bank will publish the eurozone’s M3 money supply in April (+8.2% on-year expected). The German Federal Statistical Office will report April retail sales (-12.0% on month expected). France’s INSEE will release final readings of 1Q GDP (-5.4% on year expected) and May CPI (+0.3% on-year expected). The U.S. Commerce Department will post April wholesale inventories (-0.7% on month expected), advance goods trade balance (65 billion dollars deficit expected), personal spending (-12.8% on month expected), and personal income (-6.0% on month expected). The Market News International will release May Chicago PMI (40.0 expected). The University of Michigan will report its final data of the May Consumer Sentiment Index (74.0 expected).
Economic Events to Watch Today
EUR/USD – Daily Analysis
The EUR/USD pair was closed at 1.10771 after placing a high of 1.10934 and a low of 1.09915. Overall the movement of the EUR/USD pair remained bullish throughout the day.
The EUR/USD pair continued its bullish streak for the 4th consecutive day on Thursday and rose near 1.1100level, highest since March 30. On Wednesday, the European Commission proposed an additional $18.2Billion for the European Union’s foreign spending as part of its COVID-19 recovery package. The proposed package gave relief to NGOs that had feared further rate cuts.
This proposal by the European Commission must be approved by E.U. states and would allocate 86 billion euros to the bloc’s development for 2021-2027. The additional resources would be drawn from the 750 billion euro recovery fund, which was also announced on Wednesday, which will be raised by borrowing on financial markets.
On the data front, the German Preliminary Consumer Price Index for May declined by -0.1% against the expected 0.1% and weighed on single currency Euro. While at 12:00 GMT, the Spanish Flash Consumer Price Index for the year came in line with the expectations of -1.0%.
The European Commission indicated that the Consumer Confidence Index in Eurozone edged higher to -18.8 from -22. Still, the Business Climate Index fell to -2.43 from -1.99 and stopped the shared currency from gathering strength against its rivals.
However, the risk-on market sentiment of the market continued to support the EUR/USD pair and weighing on the U.S. dollar. The potential coronavirus vaccines, reopening of economies across the globe, and potential risk for the second wave of corona kept the risk appetite in the market and continued weighing on the U.S. dollar. The weakness of the U.S. dollar gave a push to EUR/USD pair.
On American economic docket, the poor than expected data also kept the U.S. dollar under pressure on Thursday. The jobless claims from the United States for last week rose to 2.123M from the expected 2.1M and weighed on the U.S. dollar. At 19:00 GMT, the Pending Home Sales for April dropped more than expectations and weighed on the U.S. dollar. The actual figure came in as -21.8% against the expected -15%. The closely watched Prelim GDP for the quarter from the United States also weighed on the U.S. dollar when it was released as -5.0% against the expected -4.8%. The EUR/USD pair rose to its 12 weeks highest level on the back of broad-based U.S. dollar weakness on Thursday.
Daily Support and Resistance
- R3 1.122
- R2 1.1157
- R1 1.1117
Pivot Point 1.1054
- S1 1.1014
- S2 1.0951
- S3 1.0911
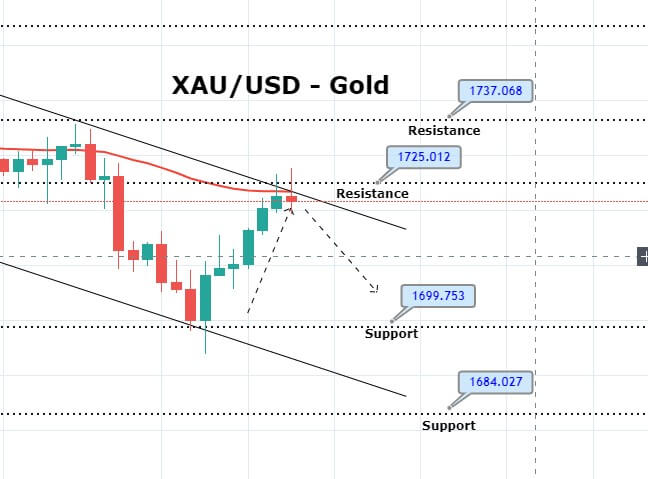
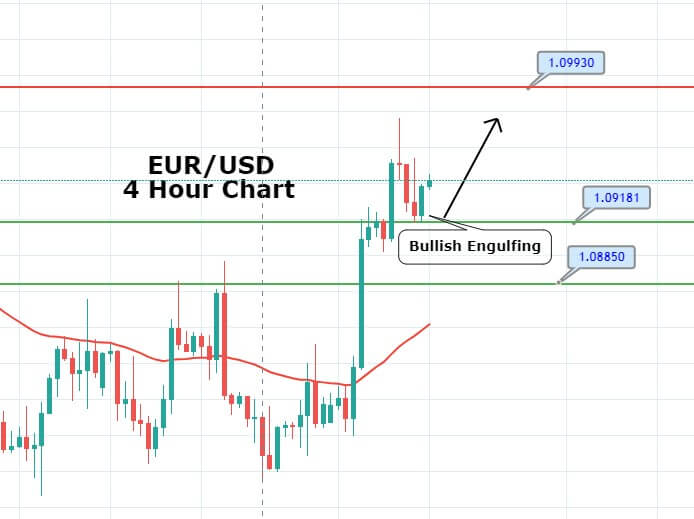
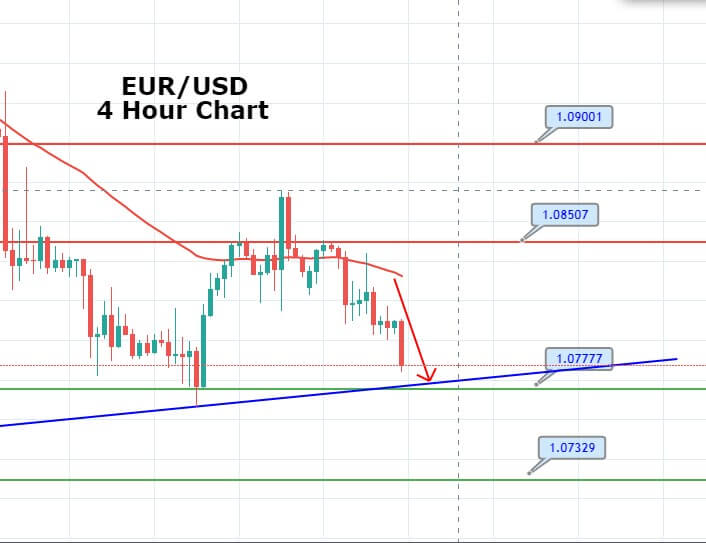
EUR/USD– Trading Tip
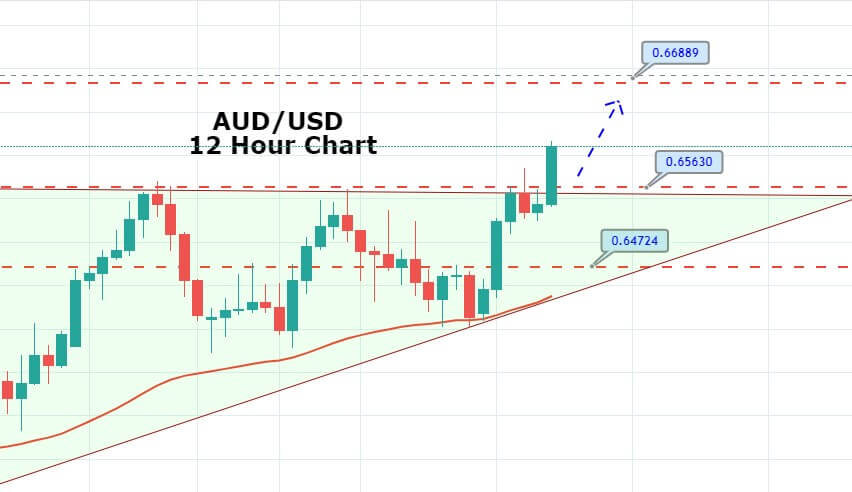
The bullish bias of the EUR/USD continues to prevail in the market as the EUR/USD is heading north towards the next target level of 1.1150 level. The pair have already violated the triple top resistance level of 1.09985, and bullish crossover of 1.1146 level may lead the EUR/USD prices further higher towards 1.12118 level. The closing of three white soldiers in the daily timeframe is also supporting an upward trend in the market.
GBP/USD – Daily Analysis
The GBP/USD pair was closed at 1.23222 after placing a high of 1.23443 and a low of 1.22336. Overall the movement of GBP/USD pair remained bullish throughout the day.
According to the policymaker of Bank of England, Michael Saunders, easing too much rather than easing a little by Bank of England was easier in response to the coronavirus pandemic. He said that the U.K. was at risk of relatively slow recovery than other countries from the coronavirus crisis, and it could prove damaging to the U.K.’s economy.
On Thursday, Saunders added that if Bank of England failed to add more stimulus measures in the economy, than it could slip the economy into an “inflation trap.” Saunders was one of two policymakers of BoE that wanted an expansion inn asset purchases in May. While the other majority wanted to wait, though accepted, more stimulus would be required.
The first speech of Saunders after COVID-19 was encouraging the central bank to cut interest rates to a record low of 0.1%, increase the bond-buying, and boost the capital. However, in response to his speech, British Pound came under pressure on Thursday and fell by 0.2%. On the other hand, the U.S. dollar also remained weak during the day because of risk-on market sentiment along with the poor economic data. The broad-based U.S. dollar weakness overshadowed the drop in GBP and raised the GBP/USD pair.
The closely watched Prelim GDP for the second quarter from the United States was dropped by -5.90% against the expected drop by -4.8% and weighed on the U.S. dollar. At 17:30 GMT, the Unemployment Claims from last weeks also reported higher than expectations of 2100K as 2123K and weighed on the U.S. dollar. At 19:00 GMT, the Pending Home Sales for April also declined by 21.8% against the expected decline by 15%.
Despite reopening all 50 states from coronavirus induced lockdowns, unemployment claims still showed higher than expected figures, which resulted in the broad-based U.S. dollar weakness on Thursday.
On Brexit front, the final round of talks between the U.K. & E.U. before a summit in June will be held next week. Because of the last negotiations that went bad after the exchange of letters between the British negotiator, David Frost, and his E.U. counterpart, Michel Barnier, the hopes for the success of final round talks have decreased. This has raised the bars for no-deal Brexit possibility.
U.K. Prime Minister, Boris Johnson will travel to Brussels for talks with European leaders next month to attempt to revive the negotiations. The two sides were still far apart on fisheries, and the U.K. has said that it would abandon the talks if “shape of a deal” has not emerged by the end of June. The U.K. traders will keep an eye onus data and Brexit updates for further actions.
Daily Support and Resistance
- R3 1.259
- R2 1.2477
- R1 1.2405
Pivot Point 1.2292
- S1 1.222
- S2 1.2107
- S3 1.2035
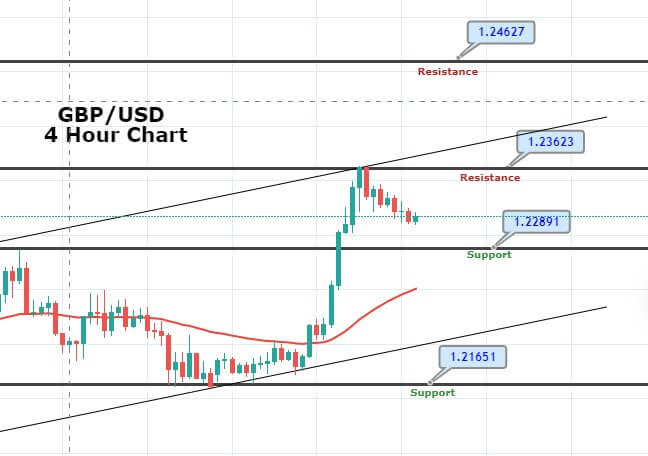
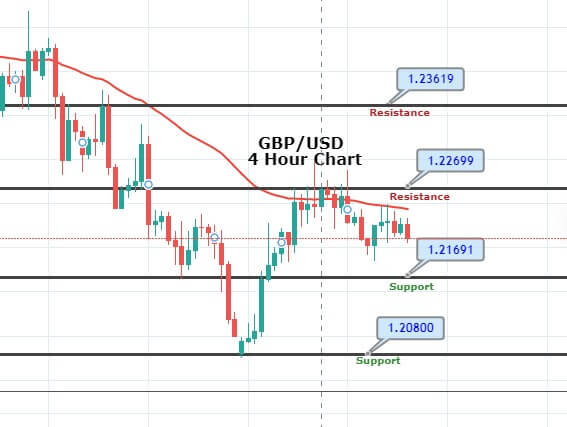
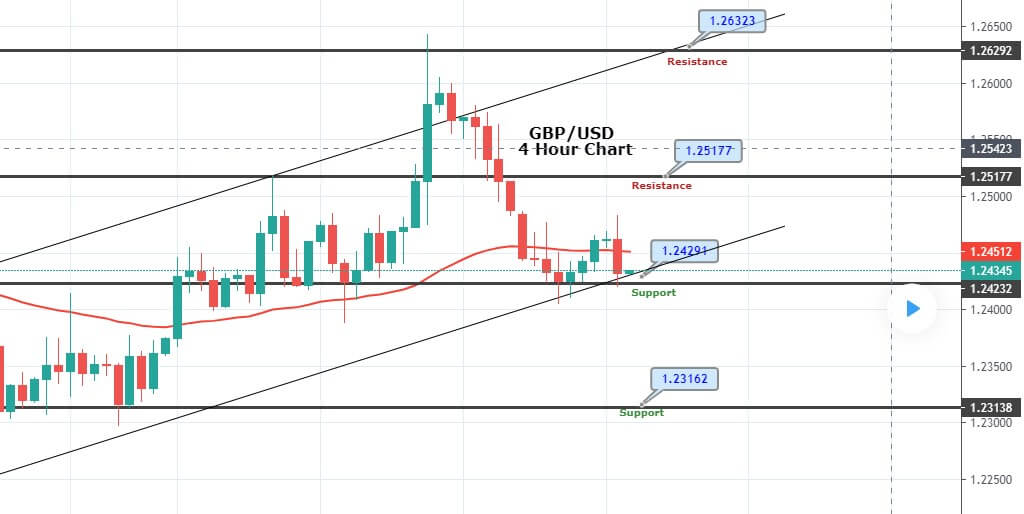
GBP/USD– Trading Tip
On Friday, the GBP/USD is trading with a slightly bullish bias, facing a double top resistance area around 1.2364 level. Bullish crossover of this level may extend the buying trend until 1.2458. On the 4-hour timeframe, the 50 EMA is suggesting bullish bias, and now the MACD is suggesting buying trend in the GBP/USD pair as the histograms are forming above zero levels.
Today, the Sterling may find immediate support around 1.2245 levels along with resistance at 1.2360 while the closing of candles above the 1.2360 level may drive buying until 1.2450 level. The violation of support is likely to push the cable further lower until 1.2160 level. Consider taking buying trades over 1.2162 and selling below the same level today.
USD/JPY – Daily Analysis
The USD/JPY currency pair extended its previous 2-days winning streak. They rose to 107.90 marks mainly due to the risk-on market sentiment, which undermined the Japanese yen’s safe-haven demand and exerted some bullish impact on the currency pair. On the other hand, the broad-based U.S. dollar weakness turned out to be one of the main factors that kept a lid on any additional gains in the pair. At this particular time, the USD/JPY currency pair is currently trading at 107.83 and consolidating in the range between 107.69 and 107.91.
However, the reason for the upbeat market sentiment could be attributed to the recent optimism about a possible COVID-19 vaccine and hopes of a global economic recovery, which eventually sent the currency pair higher.
Despite the bullish trend in the currency pair, the USD/JPY pair held well within a near two-week-old trading range. The reason behind the confined trading range could be the escalating tensions between the U.S. and China relations, which kept investors cautious about placing any strong position.
The intensifying tension between the United States and China was further bolstered by the U.S. Secretary of State Mike Pompeo’s statement in which he denied Hong Kong’s special status and said that it was no longer autonomous from China.
At the USD front, the broad-based U.S. dollar erased its previous day gains and slipped 0.16% to 98.900 on the day due to the rise in Asian shares and U.S. stock futures, which eventually limited the additional gains in the pair. Whereas, The U.S. Dollar Index that tracks the greenback against a basket of other currencies dropped 0.16% to 98.900 by 11:26 AM ET (4:26 GMT).
Daily Support and Resistance
- R3 108.39
- R2 108.16
- R1 107.86
Pivot Point 107.63
- S1 107.33
- S2 107.1
- S3 106.79
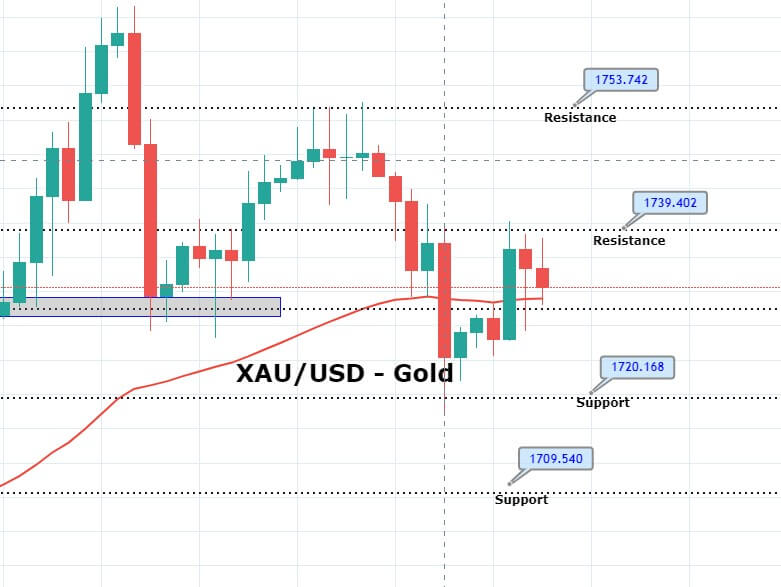
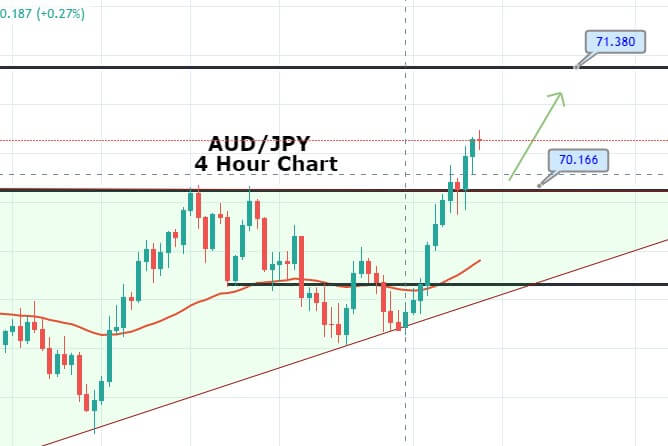
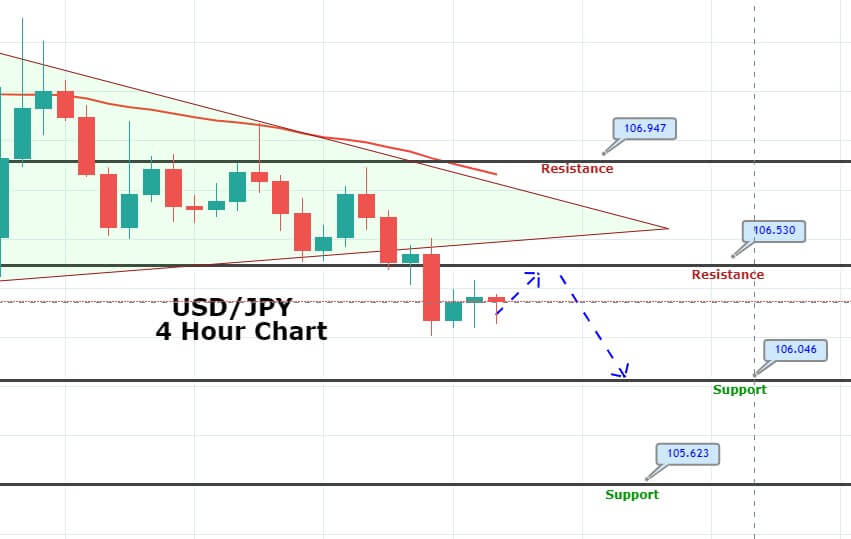
USD/JPY – Trading Tips
The safe-haven Japanese yen continues to gain bullish momentum in the wake of increased safe-haven appeal for JPY, and it’s dragging the USD/JPY pair lower at 107.120. The odds of selling in pair remains strong as the pair is likely to drop towards the next support level of 106.850. The recent strong selling candle also suggests odds of further selling in the USD/JPY pair today.
All the best for today!