On the forex front, the U.S. dollar gained traction against other major currencies, with the Dollar Index climbing 0.3% on the day to 100.20. The U.S. official data showed that Existing Homes Sales fell to an annualized rate of 5.27 million units in March (5.25 million units expected).
The British Consumer Prices Index (CPI), including owner-occupiers’ housing inflation rate, came out at 1.5% in March 2020. Although it’s down from 1.7% in February 2020, it’s not as bad as investors were expecting considering the lockdown in global markets.
Economic Events to Watch Today
EUR/USD – Daily Analysis
The EUR/USD fell by nearly 0.1% to trade at 1.0865. While Spain’s central bank announced, the country’s GDP could fall by 6.8% to 12.4% this year. Later in the today, the major focus will stay on the German ZEW Current Situation Index for April will be released (-75.0 estimated).
After the Eurozone divided on community debt, most of the analytes are worried that the finance ministers’ may unable to provide a suitable fiscal stimulus to support growth. So, the shared currency could remain under pressure ahead of the Thursday summit.
At the coronavirus front, as per the latest report, the number of confirmed coronavirus cases grew to 145,694, with 4,879 deaths reported in Germany so far. As the cases increased by 2,237 in Germany, a 1.6% rise picking-up pace from Tuesday’s 1.3% increment, the death toll moved sharply up by 281 vs. 194 a day before.
Looking forward, the upbeat Eurozone Consumer Confidence, which is scheduled to release at 14:00 GMT, may put a bid under EUR/USD currency pair. However, the pair trend will remain sluggish until the pair break the trading range of 1.0897 to 1.08616.
Daily Support and Resistance
- S1 1.0724
- S2 1.0788
- S3 1.0823
Pivot Point 1.0852
- R1 1.0887
- R2 1.0916
- R3 1.098
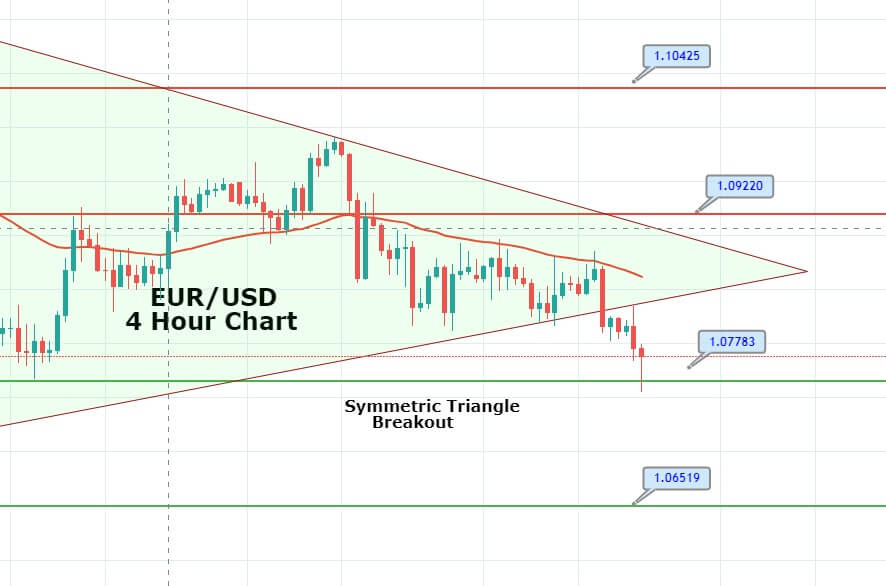
EUR/USD– Trading Tips
On Wednesday, the EUR/USD is trading sideways at 1.0825, as investors seem to wait for a solid reason to enter the market. The overall bias remains bearish as the EUR/USD prices are holding below 50 EMA, which is extending resistance around 1.08945 level. Continuation of a selling trend below 1.08945 level can continue selling until the next support area of 1.0772, but on the way, the pair may find support around 1.0815 level.
The EUR/USD is likely to find support around 1.0772, but below this, the next support prevails around 1.0652 level. The pair may find an immediate resistance level of around 1.09230, where the bullish breakout of this level can extend buying until the next resistance level of 1.1036. Conversely, we should look for selling trades below 1.0894.
GBP/USD – Daily Analysis
The GBP/USD soared 0.3% to trade at 1.2318 as the British Consumer Prices Index (CPI), including owner-occupiers’ housing inflation rate, came out at 1.5% in March 2020. Although it’s down from 1.7% in February 2020, it’s not as bad as investors were expecting considering the lockdown in global markets.
At the USD front, investors prefer to choose the U.S. dollar because of its safe-haven-demand in the market due to the fears of economic fallout, which is caused by the coronavirus outbreak. The dollar index, which measures the worth of the greenback against majors, rose 0.20% to levels above 100.00.
The reason behind the decline in GBP/USD pair could also be the immediate rise in COVID-19 cases, with the curve still not notably peaking. It indicates that there is still a high chance that lockdowns could last longer than expected, while the Bankruptcy and bad loans will likely boost the risk-off sentiment in the market and provide further support to the U.S. dollar again.
Apart from the U.K., U.S. President Donald Trump suggested that approximately 20 states ready for re-open while also showing a willingness to sign the bill that stops immigration into the U.S. for 60 days. As in result, the risk sentiment remains under pressure.
The reason behind the risk-off market sentiment could also be the early Asian news surrounding the U.S. Senate’s passage of $484 billion COVID-19 relief package and BOJ’s likely decline of economic and price forecasts. Moreover, statements from the BOE’s Bailey were also necessary to remark during the early Asian session.
As in result, the U.S. 10-year Treasury yields declined by 2-basis points (bps) to 0.55%, after dropping 4-bps on Tuesday, while the most stocks in Asia-Pacific flashing losses by the pres time.
Daily Support and Resistance
- S1 1.1974
- S2 1.2148
- S3 1.2223
Pivot Point 1.2322
- R1 1.2397
- R2 1.2496
- R3 1.2671
GBP/USD– Trading Tip
Yesterday, the GBP/USD fell sharply to trade at 1.2250 after violating the horizontal support level of 1.2424. On the 4 hour chart, the Cable has closed Doji candle above 1.2250 level can drive bullish bias until 1.2350. On the upper side, the Sterling may find next resistance around 1.2426, it’s the same level that supported the pair previously, and now it’s likely to drive selling bias in the GBP/USD pair. On the lower side, the violation of the 1.2265 level can lead the GBP/USD prices towards 1.2175. The 50 EMA and MACD are both are suggesting selling bias in the Cable. So let’s look for selling trades below 1.2322 and bullish above the same level today.
USD/JPY – Daily Analysis
On Wednesday, the USD/JPY is trading around 107.500 level, mostly exhibiting sideways trading due to a lack of major economic events in the market. The U.S. dollar index slipped to the fresh lows of 100.07 ahead of recovering some ground, still bearish by 0.15% on the day.
The Japanese yen seems to suffer due to a lack of confidence when the state of emergency is being lifted in Japan. While drop-in, the domestic macroeconomic indicators are expected to keep the Japanese yen’s in a bearish mode while maintaining the USD/JPY bullish. Lately, the uptrend in the JPY could be limited due to the forecast of the Bank of Japan (BOJ) support measures to boost funding for the companies due to be announced next week.
The U.S. Treasury prices advanced as investors continued to seek safe-haven assets. The benchmark 10-year U.S. Treasury yield declined to 0.571% from 0.625% Monday.
On the negative side, the greenback gained ground due to the oil price crash triggered a dash for cash. The high uncertainty in the market also boosted the greenback demand. So, if that trend continues during the ay ahead, the yellow metal could come under pressure.
Daily Support and Resistance
- S1 105.92
- S2 106.84
- S3 107.44
Pivot Point 107.76
- R1 108.36
- R2 108.69
- R3 109.61
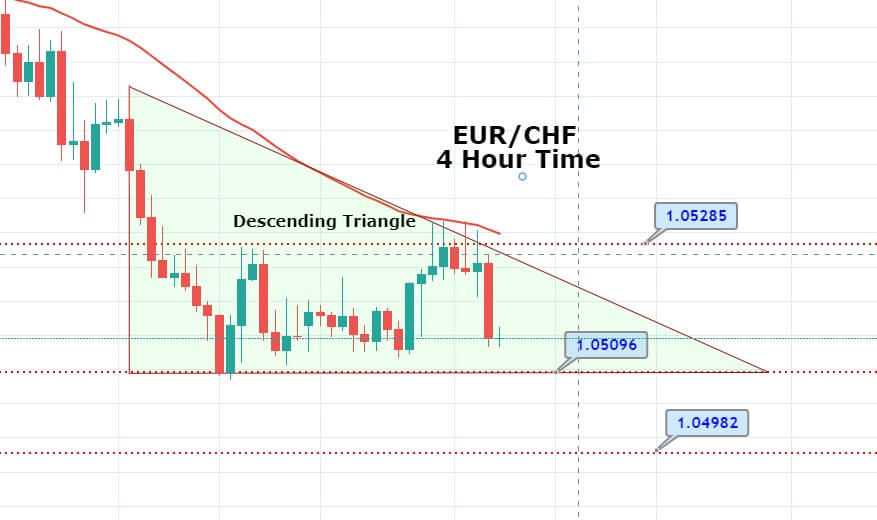
USD/JPY – Trading Tips
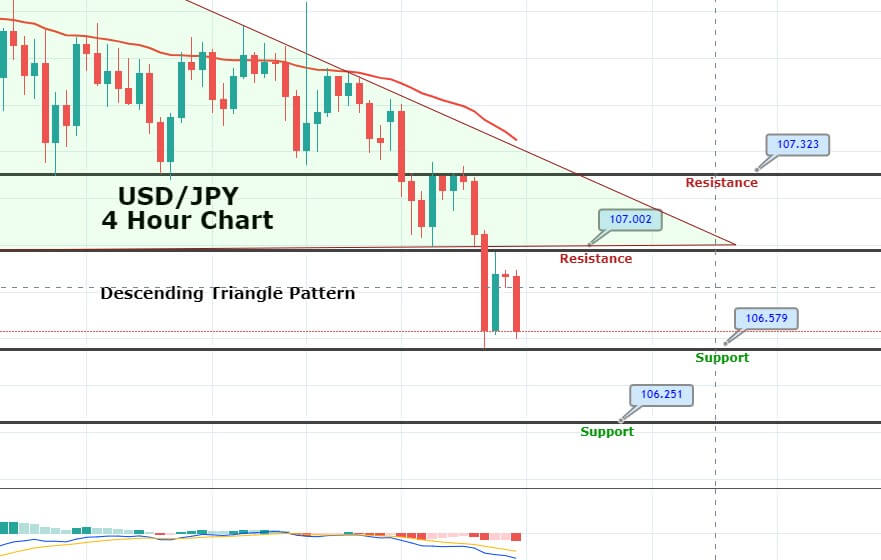
The USD/JPY is trading mostly sideways within a narrow trading range of 108.020 – 107.300 zones. At the moment, it’s holding at 107.597, having formed a descending triangle pattern on the 4-hour timeframe. The triangle pattern is extending resistance around 107.850, along with support around 106.980.
In case, the USD/JPY violates the descending triangle pattern; we may see pair dropping towards 106.200. While on the upper side, a bullish breakout of 108 can lead USD/JPY prices towards 109.100. The leading indicator, such as MACD and 50 EMA, are supporting bearish bias in the market today. Let’s wait for a breakout before taking more trades today.
All the best for today!