Categories
Forex Signals

EUR/CHF Descending Triangle Pattern – Time to Place a Sell Limit!  

The EUR/CHF is facing strong resistance around 1.05730, which is mostly extended by a downward trendline on the 4-hour timeframe. The 50 periods EMA is keeping the EUR/CHF pair around 1.0578. The Euro as a signal currency is still staying bearish in the wake of an increased number of COVID 19 cases around the globe.  

As per the coronavirus latest report, the cases rose by 3,677 in Germany when compared with Sunday’s 5,936 new infections, showing the 4th-straight drop in the daily rate. The death toll rose by 92.

On the other hand, the declines in the oil prices could be recovered during the day ahead mainly due to the risk recovery in the market, as the coronavirus cases are showing some sign of a slowdown in the US, Italy, and Spain slowing down over the weekend. 


The EUR/CHF continues to trade below a resistance level of 1.05750. Closing of candles below this level has the potential to lead the EUR/CHF prices further down towards the next support level of 1.05330. On the higher side, the bullish breakout of 1.0570 can lead the pair towards 1.0590. The RSI and Stochastic remain neutral, as its values are tossing in the bullish and bearish zone.

Sell Limit Price: Sell at 1.05741    

Take Profit  1.05241    

Stop Loss 1.06241

Risk/Reward 1.00

Profit & Loss Per Standard Lot = -$511/ +$511

Profit & Loss Per Micro Lot = -$51.1/ +$51.1

Categories
Forex Market Analysis

Safe-Haven-Metal Hit Weekly High $1660 – Recovery In Risk Sentiment Plays! 

The yellow-metal prices broke its early consolidation phase and hit the 1-week high near the $1660 mark in the last hour. Whereas, the gold traders did not give any significant attention to the goodish pickup in the US bond yields as well. The gold is currently trading at 1,665.60 and consolidates in the range between the 1,638.30 – 1,669.95.

The buyers of gold ignored robust recovery in the global risk sentiment, which is supported by a reduction in the number of deaths from COVID-19 and which tends to weaken the metal’s perceived safe-haven demand. Meanwhile, the risk-on sentiment was further strengthened by a strong pickup in the US Treasury bond yields.

On the other hand, the headline recently gave support to the gold prices that the 3-Swiss refineries in Ticino, Europe’s biggest gold refiner, announced yesterday that they got permission to open their factories on the limited basis. Whereas, this statement will ease the supply concerns which are caused by the coronavirus lockdowns and transport stops.

At the coronavirus front, COVID-19 weekend news is flashing recession fears and updates to the debacle, COVID-19, which has risen 1,253,919 global cases, 68,169 deaths, and 257,221 recoveries. 


Daily Support and Resistance

  • S1 1576.16
  • S2 1596.66
  • S3 1607.74

Pivot Point 1617.15

  • R1 1628.24
  • R2 1637.65
  • R3 1658.14

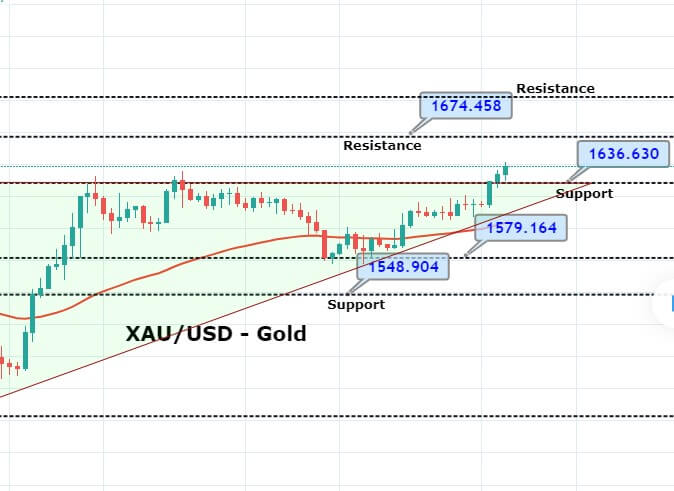
On the technical front, the precious metal gold has violated the ascending triangle which was providing resistance at 1,636 level. Closing of candles above this level is suggesting chances of more buying until the next resistance level of 1,671. While support continues to hold around 1,635. The leading indicator MACD is also supporting the bullish trend in gold. 

Gold seems to close three consecutive bullish candles on the 4-hour timeframe, which will become three white soldiers and will drive more buying until 1,671 level. Consider taking bullish trades over 1,636 levels to target 1,656 and 1,671. Good luck! 


Categories
Forex Market Analysis

Daily F.X. Analysis, April 06 – Top Trade Setups In Forex – Risk-off Sentiment In Play! 

On the forex front, the U.S. dollar continued to see safe-haven buying. The ICE U.S. Dollar Index rose 0.4% on the day to 100.58, extending its rally to a third straight session. Later today, the Research firm Markit will publish March U.K. Construction PMI (44.0 expected). The eurozone Sentix Investor Confidence Index for April will be released (-37.5 expected). The German Federal Statistical Office will report February factory orders (-2.5% on month expected).

Economic Events to Watch Today     


EUR/USD – Daily Analysis

The EUR/USD slid 0.5% to 1.0809, posting a five-day losing streak. Official data revealed that the eurozone’s retail sales surged 0.9% on month in February (+0.1% expected). Later today, the eurozone Sentix Investor Confidence Index for April will be released (-37.5 expected).

Speaking about the Germans Factory orders data, this data release by the Deutsche Bundesbank, which indicates the shipments, inventories, and new orders. A surged in the factory order total may show progress in the German economic growth, and it could also be a factor to boost inflation.

It is worth noting that the German Factory influences by two-ways either positively or negatively, the total Eurozone GDP. A high figure is considered as a positive or bullish for the EUR, while a low reading is negative.

Therefore, the pair could drop to 1.0773 previously low on mixed Ferman data. Moreover, if the greenback catches fresh bids on the turnaround in the risk sentiment, the EUR/USD currency pair could suffer in a more profound drop below 107.00 ahead.

As per the coronavirus latest report, the cases rose by 3,677 in Germany when compared with Sunday’s 5,936 new infections, showing the 4th-straight drop in the daily rate. The death toll rose by 92. Consequently, the EUR/USD is suffering badly and may trade sideways as the dollar also suffers alongside. 


Daily Support and Resistance

  • S1 1.0653
  • S2 1.0732
  • S3 1.0769

Pivot Point 1.081

  • R1 1.0847
  • R2 1.0889
  • R3 1.0967

EUR/USD– Trading Tips

The EUR/USD is trading bearish at 1.080, having an immediate support level of around 1.07990. On the 4-hour chart, the EUR/USD has violated the support level of 1.085, which is now working as a resistance. As of now, a bearish breakout of 1.07990 level may extend selling bias until the next support level of 1.0650. While the MACD is staying below 0, supporting the odds selling movements in the market. 

At the same time, the 50 periods exponential moving average is also keeping the EUR/USD in a bearish mode. Bearish crossover of 1.081 area can open further room for selling until 1.065 level. So, let’s consider taking selling trades below 1.081today.

GBP/USD– Daily Analysis

The GBP/USD sank 1.1% to 1.2262. The Markit U.K. Construction PMI for March will be released later in the day (44.0 expected). As per the latest report, the coronavirus cases rose to 33,718 as of 08:00 GMT on April 02, whereas there was a 24% rise in the death toll to 2,921 at the same time.

Meanwhile, the Washington Governor extended the stay-at-home order, whereas S&P declared its U.S. rating at AA+ with expectations of a recovery in 2021. As in result, the market’s risk-tone remains moderately heavy with the U.S. 10-year treasury yields dropped below 0.60%, and most Asian stocks are also flashing red.

As per the latest report, the death toll from the coronavirus increased by 621 to 4,934. The total number of confirmed infections rose to 47,806. Apart from the coronavirus intensifying concerns, the GBP currency could remain bearish in the European trading hours mainly due to the sluggish data, which is released early Monday and showed the British consumer confidence declined to the weakest since February 2009. 

On the flip side, the USD has ignored 7 million drops in the U.S. jobs for March, because the upbeat US ISM Non-Manufacturing PMI boded well for the greenback. However, the U.K. Services PMI data for March was revised down to 34.5 points, which will likely push the GBP lower.

Looking forward, the headlines related to the PM Johnson’s condition will remain driver seats. The U.S. dollar dynamics also will be critical to watch for fresh directions. Meanwhile, traders, all eyes will be on the U.K. government COVID-19 meeting, which is scheduled to happen at 0815GMT for new trading impetus. The meeting will be chaired by the U.K. Foreign Secretary Raab and include the advisers and officials.


Daily Support and Resistance

  • S1 1.1909
  • S2 1.21
  • S3 1.2184

Pivot Point 1.229

  • R1 1.2375
  • R2 1.248
  • R3 1.267

GBP/USD– Trading Tip

The technical side of the GBP/USD hasn’t changed much as it continues trading sideways in between the same trading range of 1.2275 – 1.2425. On the 4 hour timeframe, the GBP/USD is forming neutral candles despite worse than expected NFP figures from the U.S. Hence, the pair has gained slight support and recovered over 1.2265 resistance level, which is now working as a support. 

On the 4-hour timeframe, the GBP/USD pair may find resistance around 1.2470, along with support around 1.2278. In the case of market breaks bellow 1.2278, we may see GBP/USD prices heading into the selling zone until 1.2100 and 1.2005. Whereas, the chances of buying remains solid over 1.2275 until 1.2520.

USD/JPY – Daily Analysis

During Monday’s Asian session, the USD/JPY currency pair flashing green and continue to gaining its traction for the 3rd-consecutive session mainly due to fresh risk recovery in the market.

The U.S. bond yields exhibited an uptick, which is providing support to the greenback and also kept the USD/JPY pair higher. Right now, the USD/JPY is trading at 109.25 and consolidates in the range between the 108.37 – 109.38.

However, the USD/JPY pair added to its intraday gains and rose further beyond the 109.00 round-figure marks, hitting fresh one-week tops in the last hour. A fresh drop in the death and cases of coronavirus gave a high relief to the trader. Whereas, the strong gain in the U.S. equity futures weakened the Japanese yen’s safe-haven demand.

On the other hand, the reason behind the Japanese bearish bias could also be TBS News report that the Japanese government is considering 6-months for a state of emergency declaration to control the coronavirus outbreak in Tokyo.

Daily Support and Resistance

  • S1 105.37
  • S2 106.64
  • S3 107.08

Pivot Point 107.91

  • R1 108.35
  • R2 109.17
  • R3 110.44

USD/JPY – Trading Tips

Technically, the USD/JPY pair is trading bullish a 109.177, having violated the choppy trading range of 108.650 – 107.250. With this, the USD/JPY’s best immediate support is likely to be found around 108.700. On the 4 hour timeframe, the Japanese pair has closed a bullish engulfing candle over 50 EMA, which is suggesting odds of more buying in the USD/JPY currency pair. 

With this, the USD/JPY may exhibit further room for buying until 109.680, and violation of this can open more room for buying until 110.500 and 111.450. On the lower side, support continues to hold around 108.750. Let’s look for buying traders over 108.850 today.  

All the best for today! 

Categories
Forex Market Analysis

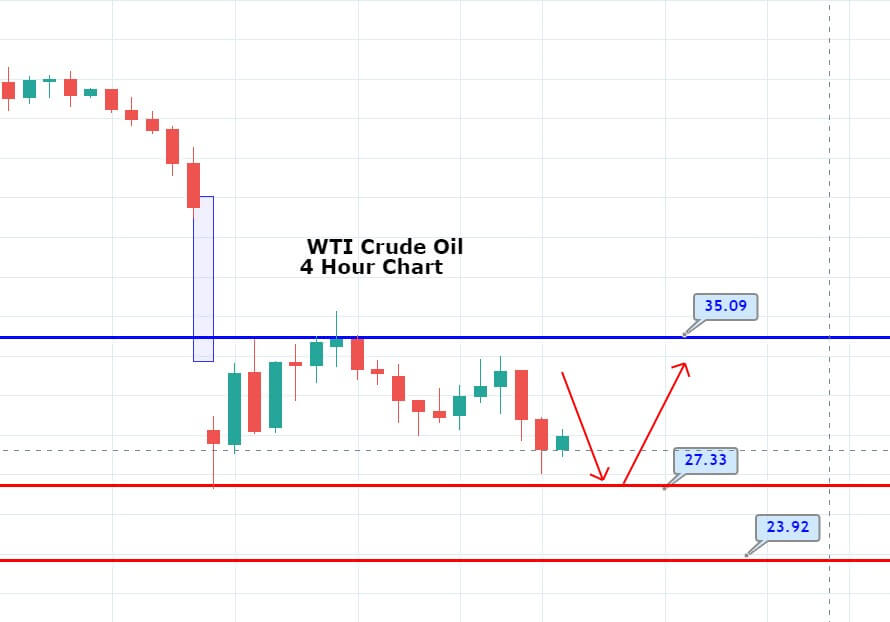
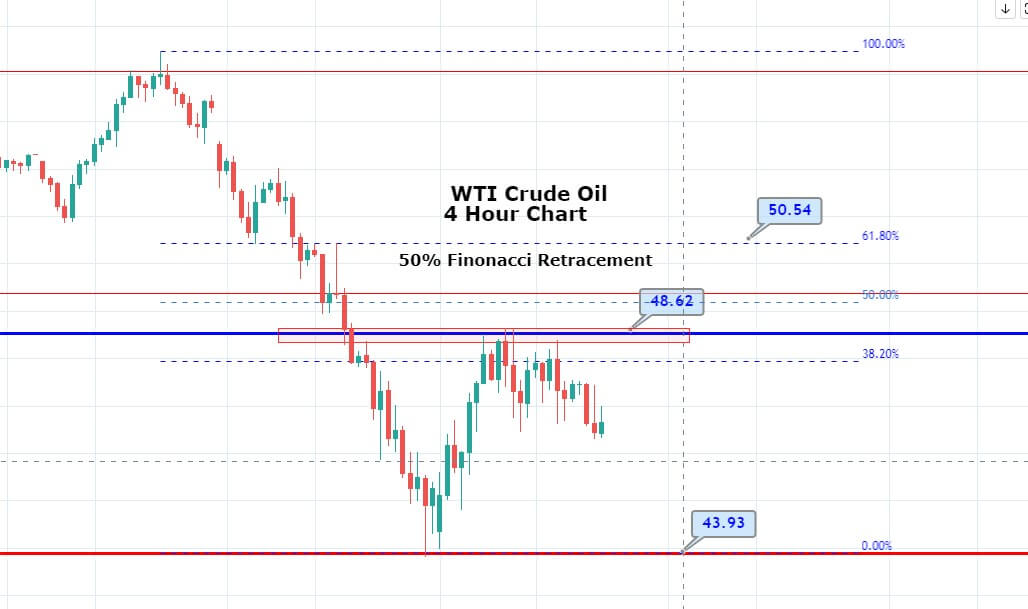
WTI Crude Oil Retest 28.30 – Is It a Good Idea to Sell Here? 

The U.S. crude oil futures soared 25.0% to $27.32 a barrel, and Brent was up 21.0% to $30.94 a barrel. One of the major reasons behind such a bullish trend was a tweet from U.S. President Trump.

He said in his tweet: “Just spoke to my friend MBS (Crown Prince) of Saudi Arabia, who spoke with President Putin of Russia, & I expect & hope that they will be cutting back approximately 10 Million Barrels, and maybe substantially more which, if it happens, will be GREAT for the oil & gas industry!”

The markets were supported by the sentiment of an oil production cut on Thursday in United States markets after news that President Donald Trump said the world oil industry has been ruined this year and has plans to attend meetings with industry executives later this week. Whereas the idea of tariffs on Gulf imports was floated Afterward, WTI rose to the $27 handle overnight. 

Looking forward, the oil traders will now keep their eyes on the U.S. President’s meeting with the key oil company leaders to determine if there are chances of production cut or not. 

WTI Crude Oil – Daily Technical Level

Support Resistance 

22.84     28.87

19.71     31.76

13.68     37.79

Pivot Point 25.74

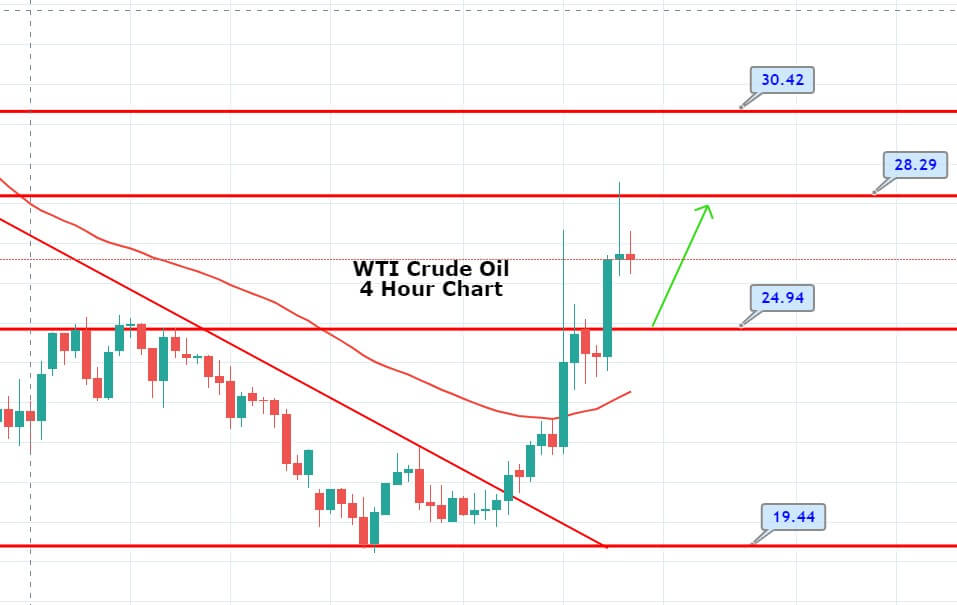
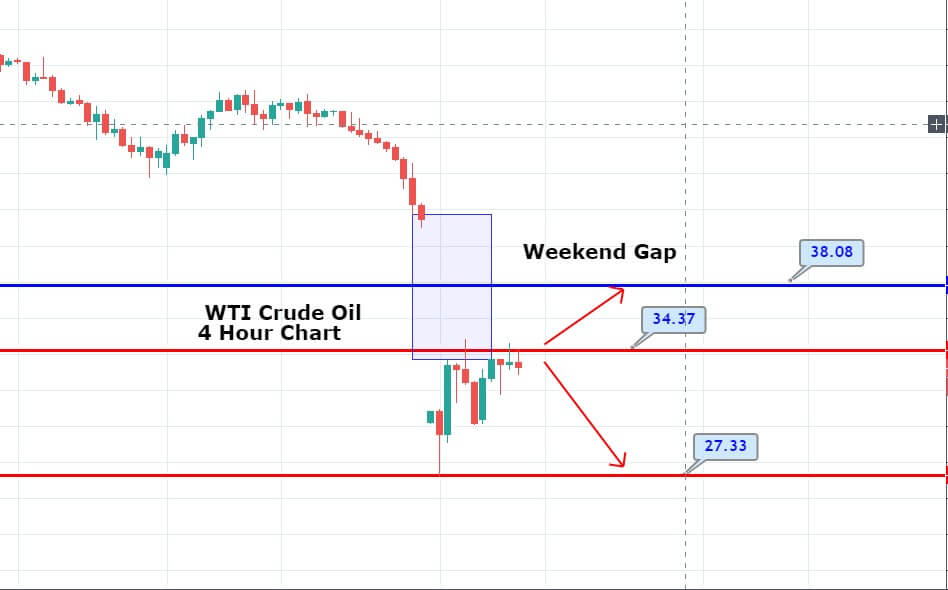
Technically, U.S. oil has passed over the resistance mark of 24.85, which has exposed additional opportunity for buying unto 28.29 level. Formation of candles beneath this level may support us to capture a bearish trade; however, at the same time, bullish trades can be taken instantly above a 24.85 resistance level. The MACD is making significant histograms, which is proposing the chances of further buying in crude oil. Good luck!

Categories
Forex Signals

EUR/JPY’s Double Top Pattern – Is It Going to Help Sellers? 

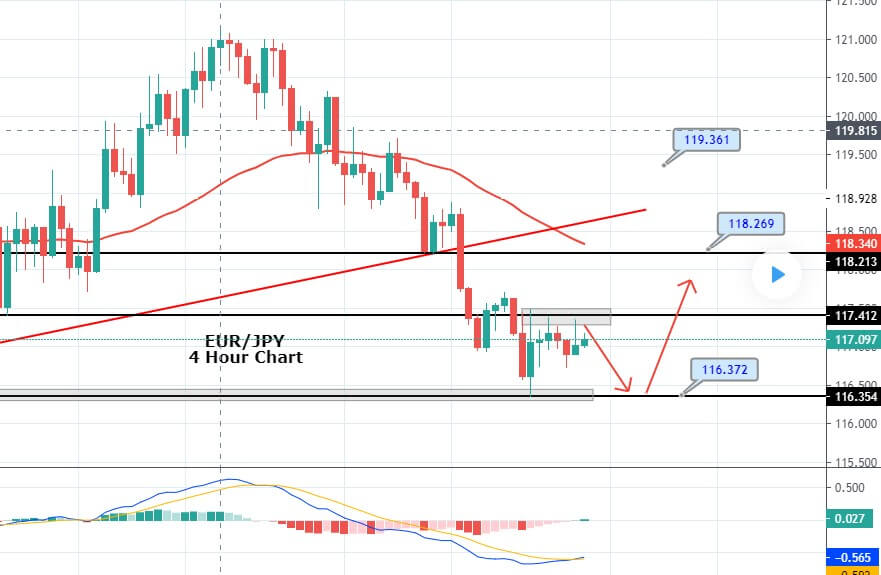
The EUR/JPY is trading at 117.150, holding mostly below a strong resistance level of 117.350, which is extended by the double top pattern. On the 4 hour timeframe, EUR/JPY may find a hard time breaking above 117.350 resistance due to an increased level of uncertainty and safe-haven appeal in the market. Alongside, a series of weaker than expected services PMI figures from the Eurozone may weigh on the EUR/JPY currency pair.

Fundamentally, the EUR/JPY may face bearish pressure due to weakness in the single currency euro. The Markit Eurozone Composite Output Index reported its biggest ever monthly drop in March to place a survey’s historic low of 29.7. Well, the figure isn’t just below the previous month’s 51.6 figure, but it also missed the economist’s forecast of 31.6, which is likely to drive sharp selling in Euro. 


Technically, the EUR/JPY is following a narrow range, which is extending selling bias below 117.450 and bull 116.350. The MACD is still holding around 0, suggesting neutral bias among traders. While the 50 periods EMA continues to support the selling trend in the pair. Today, the bullish breakout of 107.450/650 level may lead the EUR/JPY prices towards 118.300 level. Conversely, a bearish breakout of 116.900 level can drive selling until 116 and 115. 

Entry Price: Sell at 116.801

Take Profit 115.801

Stop Loss 117.601

Risk/Reward 1.25

Profit & Loss Per Standard Lot = -$737/ +$921

Profit & Loss Per Micro Lot = -$73.7/ +$92.1 

Categories
Forex Market Analysis

Daily F.X. Analysis, April 03 – Top Trade Setups In Forex – U.S. Labor Market In Highlights! 

On the forex front, the U.S. dollar strengthened against its major peers, with the ICE Dollar Index climbing 0.6% on the day to 100.10. Today’s eyes will be on the Markit that will publish final readings of March Services PMI for the eurozone (28.2 expected), Germany (34.2 expected), France (29.0 expected), the U.K. (34.8 expected) and the U.S. (38.5 expected). The European Commission will post February retail sales (+0.1% on month expected).

Economic Events to Watch Today     


EUR/USD – Daily Analysis

The EUR/USD sank 1.1% to 1.0845, posting a four-day decline. Later today, the eurozone’s retail sales data for February will be reported (+0.1% on month expected). The market is lacking trading volume and volatility, but the focus will remain on the European economic events. The European Commission will report February January PPI (-0.8% on year expected).

Italy is showing some signs of slowing down in the virus cases despite this the market traders already priced in a recession in the Europan economy, especially in Germany, because the circumstances in Spain continue to rise very fast. The lockdown across Europe continues to weigh on economic activities.

The market risk-off sentiment could more worsen if the U.S. initial jobless claims ignore past expectations, which will send the EUR/USD currency pair to the fresh lowest level. 

Besides the weekly data, the 

Looking forward, the USD moves will continue to play a significant role, as attention shifts to the Euro area Final Services PMI report. Services PMI for the eurozone (28.2 expected), Germany (34.2 expected), France (29.0 expected), the U.K. (34.8 expected), and the U.S. (38.5 expected). The European Commission will post February retail sales (+0.1% on month expected). 

Most importantly, the U.S. Non-Farm Payrolls and ISM Non-manufacturing PMI data are scheduled to release later this Friday. The coronavirus related headline could also drag attention.

Daily Support and Resistance

  • S1 1.0772
  • S2 1.0886
  • S3 1.0958

Pivot Point 1.0999

  • R1 1.1071
  • R2 1.1112
  • R3 1.1226

EUR/USD– Trading Tips

The EUR/USD is trading bearish at 1.090, having an immediate support level of around 1.07990. On the 8-hour timeframe, the EUR/USD has violated the support level of 1.085, which is now working as a resistance. Now, a bearish breakout of 1.07990 level may extend selling bias until the next support level of 1.0650. 

The MACD has also crossed below 0, confirming the chances of more bearish movements in the market. The 50 EMA is also keeping the EUR/USD in a selling mode. For now, the eyes will remain on the U.S. NFP figures to determine further trends in the market. Bearish crossover of 1.1050 area can open further room for selling until 1.065 level. Let’s consider taking selling trades below 1.07990 today.

GBP/USD– Daily Analysis

The GBP/USD edged up 0.1% to 1.2390. The United Kingdom politics are getting warm after the voting to replace the opposition Labour Party leader Jeremy Corbyn closes. Moreover, the top U.K. judge gave warning that the British judiciary system will take hints from the European rules unless last Brexit-day.

As per the latest report, the coronavirus cases rose to 33,718 as of 08:00 GMT on April 02, whereas there was a 24% rise in the death toll to 2,921 at the same time.

Meanwhile, the Washington Governor extended the stay-at-home order, whereas S&P declared its U.S. rating at AA+ with expectations of a recovery in 2021. As in result, the market’s risk-tone remains moderately heavy with the U.S. 10-year treasury yields dropped below 0.60%, and most Asian stocks are also flashing red.

The U.S. Labor Department will release March nonfarm payrolls report (-100,000 jobs, jobless rate at 3.8% expected). The Institute for Supply Management will post its Non-manufacturing Index for March (43.0 expected). It’s going to be a big day, not only for the GBP/USD but also for the rest of the dollar related currency pairs. 


Daily Support and Resistance

  • S1 1.217
  • S2 1.2278
  • S3 1.2334

Pivot Point 1.2387

  • R1 1.2443
  • R2 1.2495
  • R3 1.2604

GBP/USD– Trading Tip

The GBP/USD trade sideways in between the same trading range of 1.2275 – 1.2425. On the 4 hour timeframe, the Cable has formed neutral candles as we may not see further trends until and unless the pair manages to come out of this narrow range. For that reason, the pair needs a solid fundamental reason, which we are not expecting from the United Kingdom today. Let’s see if U.S. claims help drive some price action in the market. On the 4-hour timeframe, the GBP/USD pair is pretty much likely to find resistance around 1.2470, along with support around 1.2278. In the case of market breaks bellow 1.2278, we may see GBP/USD prices heading into the selling zone until 1.2100 and 1.2005. Whereas, the chances of buying remains solid over 1.2275 until 1.2520.

USD/JPY – Daily Analysis

The USD/JPY currency pair continues to taking bids and rose above the 108.00 level despite the high risk-off sentiment in the market, which would typically keep the Japanese yen secure. However, the pair’s bullish trend could be attributed to the sharp rise in oil prices. The USD/JPY currency pair is currently trading at 108.25 and consolidates in the range between the 107.81 – 108.27. The broad-based greenback strength also keeps the pair higher. 

As per the latest report, the COVID-19 cases have surpassed one million worldwide with over a death toll rate of over 50,000. Meanwhile, the Washington Governor extended the stay-at-home order, whereas S&P declared its U.S. rating at AA+ with expectations of a recovery in 2021. 

As well as, Japan is now facing a rise in cases that are increasing the market risk tone time by time, which eventually will likely be good for the safe-haven Japanese yen currency. As in result, the U.S. 10-year Treasury yields fell below 0.60%, down 3-basis points (bps), whereas the U.S. stock futures also mark losses of near 1.0% by the press time. Even so, stocks in Asia-Pacific are moderately positive after the recent Aussie, Japan data.

Lastly, Tokyo also reporting a record hit in daily coronavirus (COVID-19) cases extended school holidays through May 06. Recently, Japan’s Economy Minister Nishimura said that we would consider support for production rise and adopting of ECMO as part of the economic plans to combat from the COVID-19.

Daily Support and Resistance

  • S1 105.37
  • S2 106.64
  • S3 107.08

Pivot Point 107.91

  • R1 108.35
  • R2 109.17
  • R3 110.44

USD/JPY – Trading Tips

On Friday, the technical side of the market continues to exhibit choppy trading sessions within a wide trading range of 108.650 – 107.250. The best idea is to buy at the lower limit 107.250 and sell below 108.650 for now, but on the news release of U.S. nonfarm payroll, we can experience a potential breakout in the USD/JPY pair. 

The USD/JPY is trading at 108.270, consolidating sideways, right above a next support level of 107.750. On the higher side, a bullish breakout of 108.650 resistance level can lead the USD/JPY prices higher towards 109.750 level. Until then, we should look for doing choppy trading by selling below 108.600 and buying over 107.250. Below 107.200, the next support will stay around 105.990.

All the best for today! 

Categories
Forex Market Analysis

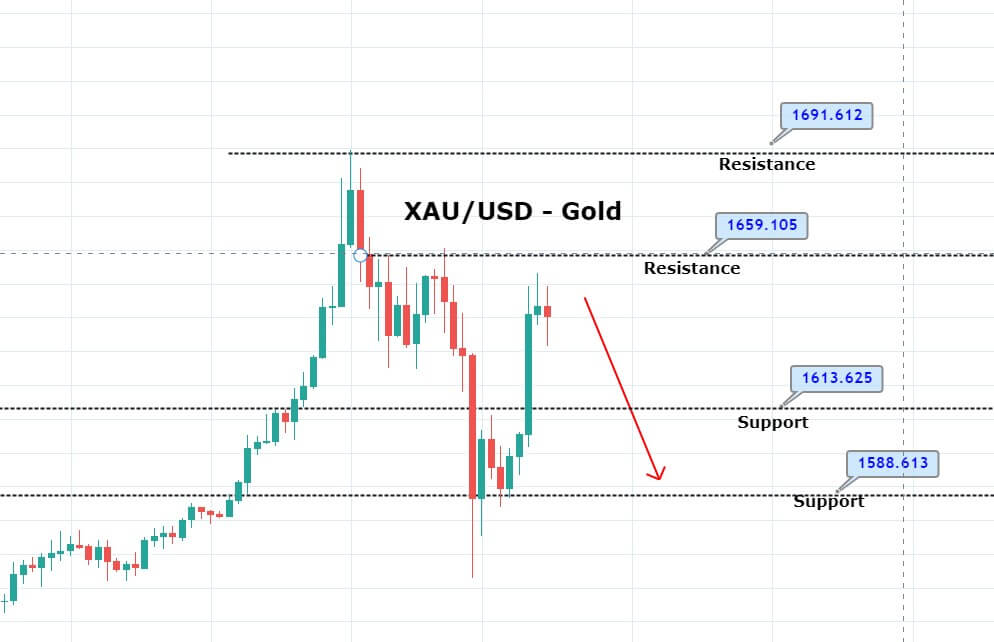
Gold’s Bullish Bias Remains Dominant – Is It Going After 1,633? 

On Thursday, the precious metal gold prices soared over 1% to trade around 1,608 in the wake of record-high U.S. jobless claims. The U.S. unemployment claims rose for a second week in a series over intensified concerns of economic damage because of coronavirus, which eventually drove traders towards the safe-haven metal.

The quantity of Americans registering jobless claims multiplied from the previous week to a record high of 6.65 million, as more areas of the U.S. enforced stay-at-home steps to curb the coronavirus. 

Global sentiment is getting worse time by time, despite the central banks’ and governments’ on-going struggles to fight against COVID-19. As a result, investors seem to move toward the gold as fears of a global recession stay in play, especially if noises start showing in the largest economy in the world. 

XAU/USD – Daily Technical Levels

Support       Resistance 

1,574.53      1,604.78

1,557.62     1,618.13

1,527.36     1,648.38

Pivot Point 1,587.87

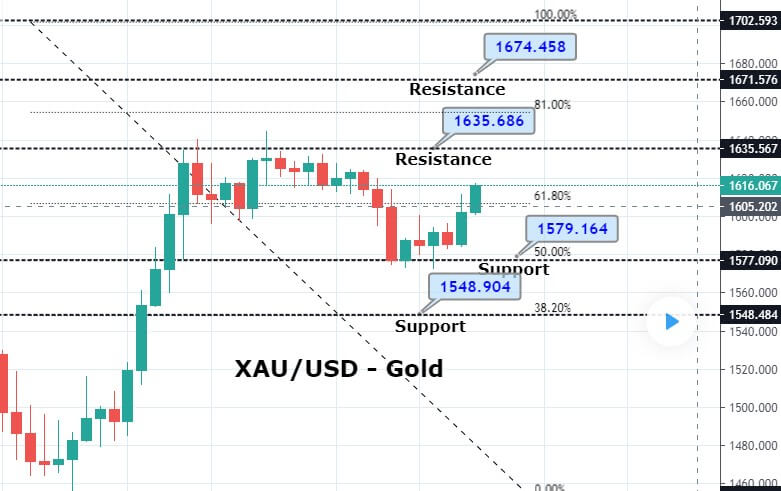
On the technical front, gold is trading at 1,610, and it’s maintaining a broad trading range of 1,635 – 1,577. On the 4 hour chart, gold has closed a bullish engulfing candle, which is suggesting chances of buying trend in gold. The XAU/USD may find an immediate resistance at 1,622 and 1,634, while support stays around 1,600 and 1,595 level. The MACD and RSI are crossing over on the bullish side, and these are also supporting a buying trend in gold. Consider taking buying trades over 1,610 with a target of 1,622 and 1,627. Good luck! 

Categories
Forex Signals

USD/CHF Ascending Triangle Drives Price Action -Who’s Up for Signal?

During the U.S. session, the USD/CHF pair is exhibiting some dramatic bullish movement as it’s prices are trading at 0.9745. What’s more surprising is, the U.S. unemployment claims figures are even worse than economists had expected, despite this, the U.S. dollar is gaining bullish momentum.

According to the U.S. labor market report, the week ending March 28, the advance numbers for initial jobless claims surged dramatically to 6,648,000, exhibiting an increase of 3,341,000 from the previous week’s updated level. This signifies the highest level of seasonally adjusted initial jobless claims in history. The prior week’s level was updated up by 24,000 from 3,283,000 to 3,307,000.

Since most of the data was already expected, considering the increased number of COVID 19 cases in the United States due to which the U.S. and people of other countries around the globe are locked down at homes. Despite this number, the U.S. dollar is making a bullish move, perhaps, it’s the technical analysis which is driving the buying trend in the USD/CHF. 


On the 4 hour timeframe, the USD/CHF prices are holding around 0.9772, and bullish breakout of this level can extend buying until the next target level of 0.9856. Below this level, we can expect selling in the pair; in fact, I will try to capture the selling once the market reaches 0.9856. On the lower side, immediate support stays around 0.9606.

Entry Price: Buy at 0.97385

Take Profit 0.98185

Stop Loss 0.96585

Risk/Reward 1

Profit & Loss Per Standard Lot = -$800/ +$800

Profit & Loss Per Micro Lot = -$80/ +$80 

Categories
Forex Market Analysis

Daily F.X. Analysis, April 02 – Top Trade Setups In Forex – U.S. Jobless Claims Shares the Stage

On the forex front, the ICE U.S. Dollar Index rose 0.5% on the day, to 99.47, supported by weak but better-than-expected U.S. economic data. On Thursday, the eyes will remain on the European Commission, which is due to report February January PPI (-0.8% on year expected). In the U.K., the Nationwide Building Society will publish its house price index for March (flat on month expected). 

The U.S. Labor Department will post initial jobless claims in the week ended March 28 (3.5 million expected). The Commerce Department will report February trade balance (40 billion dollars deficit expected), factory orders (+0.2% on month expected), and final readings of durable goods orders (+1.2% on month expected).

Economic Events to Watch Today     


EUR/USD – Daily Analysis

The EUR/USD slid 0.7% to 1.0952. Official data showed that the eurozone’s jobless rate fell to 7.3 in February (7.4% expected and in February), while German retail sales grew 1.2% on the month (+0.1% estimated). 

Overall, the market is lacking trading volume and volatility, but the focus will remain on the European economic events. The European Commission will report February January PPI (-0.8% on year expected).

The market risk-off sentiment could more worsen if the U.S. initial jobless claims ignore past expectations, which will send the EUR/USD currency pair to the fresh lowest level. 

Besides the weekly data, the EUR/USD currency pair will likely take clues from the U.S. trade balance and factory orders, which both are scheduled to release during the North American trading hours. The European data calendar seem empty with just Eurozone Producer Price Index, due for release at 09:00 GMT. 

Daily Support and Resistance

  • S1 1.0772
  • S2 1.0886
  • S3 1.0958

Pivot Point 1.0999

  • R1 1.1071
  • R2 1.1112
  • R3 1.1226

EUR/USD– Trading Tips

On Thursday, the EUR/USD is trading bearish at 1.097, having an immediate support level of around 1.0910. On the 4-hour chart, the EUR/USD has violated the support level of 1.0965, which is now working as a resistance. The horizontal breakout support may drive the selling trend in the EUR/USD pair until 1.0845. On the higher side, the EUR/USD pair is facing resistance at 1.1050 area. Bullish crossover of 1.1050 area can open further room for buying until 1.1145 level. Let’s consider taking selling trades below 1.0960 today.


GBP/USD– Daily Analysis

The GBP/USD lost 0.3% to 1.2382. Yesterday, Sterling surged as traders reconciled their portfolios before the end of the first quarter of 2020, although analysts said the currency remained fragile. While than expected, economic events throughout the first quarter continued to weigh on the market’s risk-tone during the early Asian session.

The virus forced the global rating agency Fitch towards taking action on the eighteen United Kingdom Banking sector to reflect the downside risks to their credit profiles. To control the deadly disease, the British policymakers ordered almost 2-million testing kits from China; half of them will come this week, whereas officials are still evaluating the accuracy of kits.

Whereas, Wall Street dropped 4% because President Trump already gave warning to the USA about the painful two weeks ahead. Although, the White House expected that the coronavirus pandemic could take 100,000 to 240,000 lives, even if the U.S. follows social distancing guidelines. 

While the U.S. cases crossed the 200,000 marks, moreover, the Fed also took measures to keep large banks liquid. Looking forward, the U.S. and the U.K. government’s respective policy measures to control the disease will be the major event to watch for near-term direction; the U.S. Jobless Claims will also be essential to watch. 

Later in the day, the U.S. initial jobless claims are scheduled to release at 12:30 GMT. After a record, 3.283 million claims in the week to March 21, the Bloomberg median forecast is for an even more stunning 3.70 million claims were lodged this week. Continuing claims for the week to March 21 are seen jumping from 1.8mn to 4.94mn, which is causing a surge in the safe-haven appeal.

Daily Support and Resistance

  • S1 1.217
  • S2 1.2278
  • S3 1.2334

Pivot Point 1.2387

  • R1 1.2443
  • R2 1.2495
  • R3 1.2604

GBP/USD– Trading Tip

The GBP/USD trade sideways in between the same trading range of 1.2275 – 1.2425. On the 4 hour timeframe, the cable has formed neutral candles as we may not see further trends until and unless the pair manages to come out of this narrow range. For that reason, the pair needs a solid fundamental reason, which we are not expecting from the United Kingdom today. Let’s see if U.S. claims help drive some price action in the market. 

On the 4-hour timeframe, the GBP/USD pair is pretty much likely to find resistance around 1.2470, along with support around 1.2278. In the case of market breaks bellow 1.2278, we may see GBP/USD prices heading into the selling zone until 1.2100 and 1.2005. Whereas, the chances of buying remains solid over 1.2275 until 1.2520.


USD/JPY – Daily Analysis

The USD/JPY is flashing green but reversed almost 30 pips from the early Asian high level. The pair is still struggling to hold its gain above 107.00 due to the greenback, which is exhibiting a fresh mild weakness after moderate recovery in the equity market. However, the slight improvement in the global risk sentiment also weakened the safe-haven Japanese yen and provided some lift to the pair during the early part of Thursday. 

At this moment, the USD/JPY is trading at 107.22 and consolidates in the range between the 107.06 – 107.57. Where, the intensifying fears regarding the economic recession from the coronavirus pandemic and a recent decline in the U.S. Treasury bond yields capped further gains in the pair, instead prompted some fresh selling at higher levels.

On the other hand, Tokyo also reporting a record hit in daily coronavirus (COVID-19) cases extended school holidays through May 06. Recently, Japan’s Economy Minister Nishimura said that we would consider support for production rise and adopting of ECMO as part of the economic plans to combat from the COVID-19.

Daily Support and Resistance

  • S1 105.37
  • S2 106.64
  • S3 107.08

Pivot Point 107.91

  • R1 108.35
  • R2 109.17
  • R3 110.44

USD/JPY – Trading Tips

The USD/JPY is trading at 107.270, consolidating sideways, right above an immediate support level of 107. The USD/JPY’s trading range has narrowed further as it continues to trade within 107.600 – 106.900. We see neutral candles, which may trigger a breakout at any side of the market. But the bullish breakout of 108.650 resistance level can lead the USD/JPY prices higher towards 109.750 level. Until then, we should look for doing choppy trading by selling below 108.600 and buying over 107.250. Below 107.200, the next support will stay around 105.990. All the best for today!  

Categories
Forex Market Analysis

Gold’s Choppy Session Continues -Quick Trade Setup! 

On Wednesday, the precious metal gold prices firmed as investors sought safe-haven securities following the U.S. economic figures, which heightened concerns of an economic slowdown amid growing global constraints and lockdowns to fight the coronavirus pandemic.

Gold prices fell nearly 0.9% at $1,585.08 an ounce during the U.S. session as the release of Advance Nonfarm payroll seems to have a muted impact on gold prices. The United States Federal Reserve has proved a temporary repo facility for foreign central banks and other international monetary authorities. 

Hence, this should continue to decrease the bullish pressure on the greenback and possibly move the ball into sellers court. Selling in the U.S. dollar can support gold, but right now, we aren’t seeing any significant movement in the market. 

The G20 finance ministers and central bankers meet bankers’ to come up with any meaningful results apart from committing to previous commitments given to respond to COVID-19. In addition to the current meeting, the next meeting is due on 15 April, which keeps the uncertainty high in the financial and commodities markets. 

Lastly, intensifying fears about an expected global recession further benefitted the USD’s safe-haven status, which helps improve dollar prices, while driving selling pressure on gold.


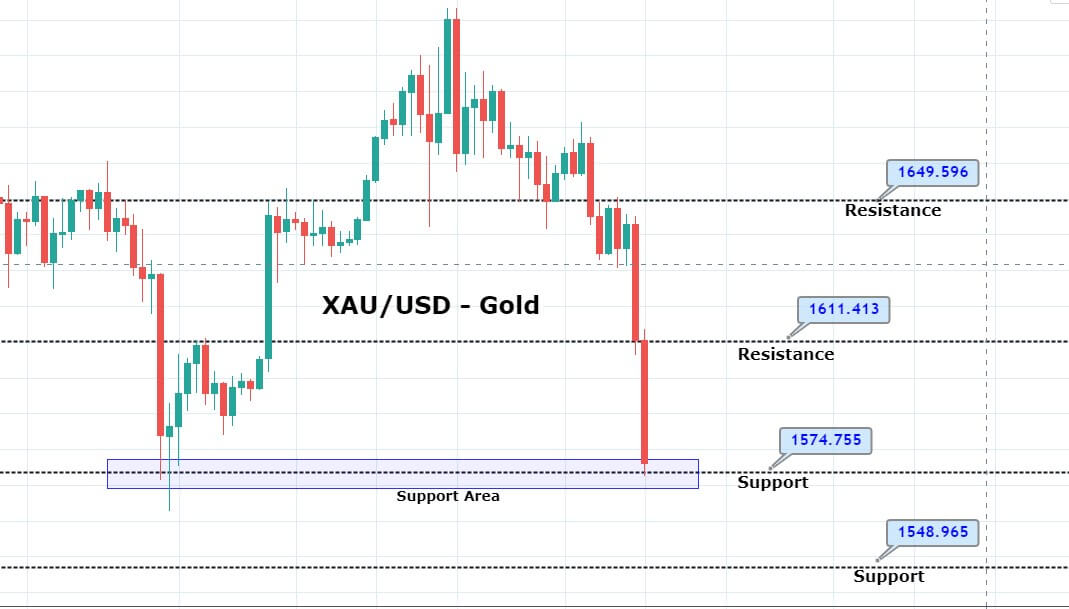
On the technical front, the precious metal is trading at 1,585 level, having immediate support at 1,577 and resistance at 1,600 level for now. Bullion has completed 50% Fibonacci retracement until 1,577 level, and violation of this level can open up further room for selling until the next support level of 1,548, which marks the 61.8% Fibo level. 

XAU/USD – Daily Technical Levels

Support     Resistance 

1,560.95     1,606.8

1,544.43     1,636.13

1,498.57     1,681.99

Pivot Point 1,590.28


On the higher side, a bullish breakout of 1,600 level can extend buying until 1,620 and 1,635 level. Consider staying bearish below 1,600 level today. Good luck! 

Categories
Forex Signals

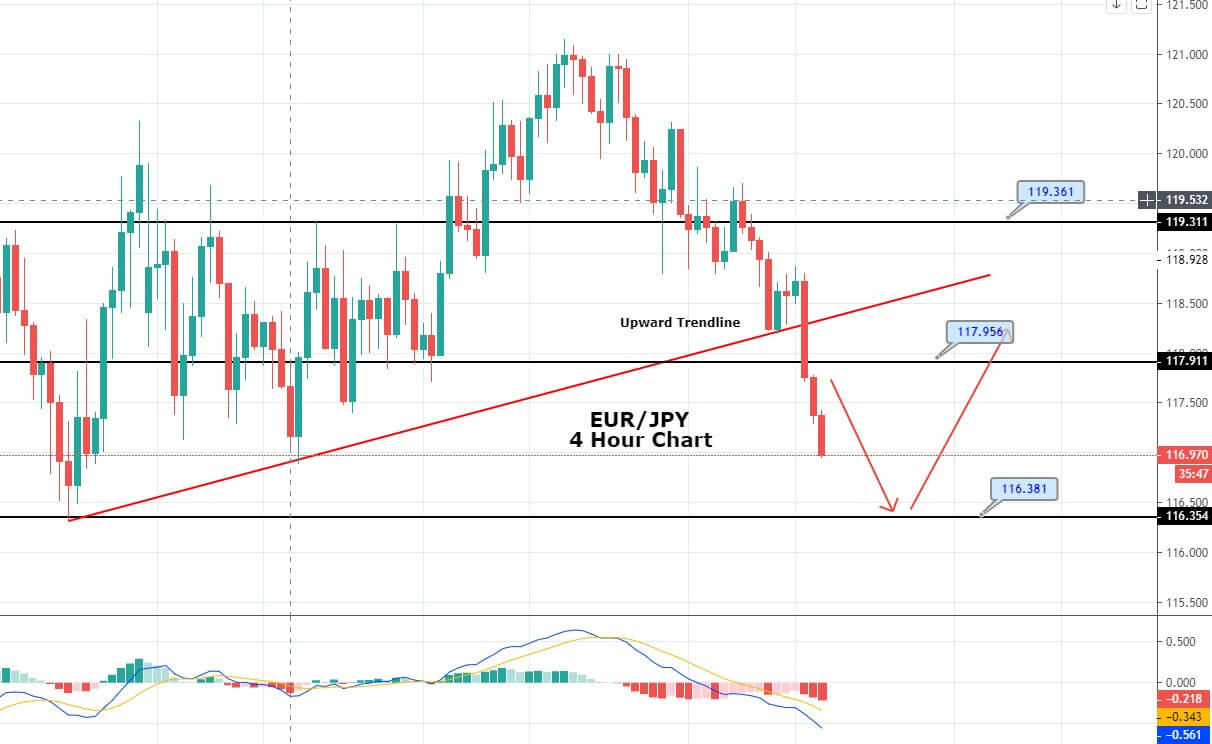
EUR/JPY Heading South to Examine Double Bottom – Buy Limit In Place 

The EUR/JPY is trading bearish, falling from 118.650 to 117 area in the wake of stronger Japanese yen and weaker Euro. On the fundamental’s front, most of the news is anti-Euro, and it’s likely to drive the selling trend in the Euro. 

The Italian administration is ramping up spending projects “significantly” to lessen the financial consequence of the coronavirus. The global central banks are on the move, so the Italian finance department is also pushing considering the death toll, which has now surpassed 12,000. 

At the same time, the headline Italy Manufacturing Purchasing Managers’ Index, which measures the progress in overall business conditions – dropped from 48.7 in February to 40.3 in March to indicate a decline in the health of the Italian manufacturing division for the eighteenth month running. 


On the technical front, the EUR/JPY currency pair is likely to find immediate support at 116.800, but it’s less likely to be held as the pair seems to fall further until 115.350 level. It’s the same level that supported the EUR/JPY pair back on March 9 and 12. Closing of the doji candle or bullish reversal candle will be an indication that investors are respecting this level and may drive buying sooner or later. 

Entry Price: Buy Limit at 116.307

Take Profit 117.307

Stop Loss 115.707

Risk/Reward 1.67

Profit & Loss Per Standard Lot = -$560/ +$934

Profit & Loss Per Micro Lot = -$56/ +$93.4

Categories
Forex Market Analysis

Daily F.X. Analysis, April 01 – Top Trade Setups In Forex – Eyes on Advance ADP Figures 

The U.S. dollar failed to keep its momentum, with the Dollar Index marking a day-high of 99.93 before closing down 0.2% on the day to 99.01. Later today, eyes will be on the Markit as it will publish final readings of March Manufacturing PMI for the eurozone (44.6 expected), Germany (45.5 expected), France (42.9 expected), the U.K. (47.0 expected) and the U.S. (48.0 expected). The European Commission will report February jobless rate (steady at 7.4% expected). The German Federal Statistical Office will post February retail sales (+0.1% on month expected). Here’s a technical and fundamental outlook for today.

Economic Events to Watch Today     


EUR/USD – Daily Analysis

The EUR/USD was broadly flat at 1.1027. Official data showed that the eurozone’s CPI grew 0.7% on year in March (+0.8% expected), while the German jobless rate was steady at 5.0% (5.1% estimated). Later today, the eurozone’s February jobless rate (7.4% expected) and German retail sales (+0.1% on month estimated) will be released.

Italy marked as the second-highest country of confirmed cases in the world after the United States (140,470). Total cases are 92,472 confirmed, marking up the highest death rate in the world. 

Today, the manufacturing data are also scheduled to release in this day later. A disappointment on expectations by a big margin will likely send the greenback lower across the board. The European Commission will report February jobless rate (steady at 7.4% expected). The German Federal Statistical Office will post February retail sales (+0.1% on month expected).

Looking forward, all traders now keep their eyes on the German retail sales and manufacturing data, which is scuddled to release on at 06:00 GMT. The coronavirus headlines will take a driver’s seat while investors are likely to hold cash in the form of U.S. dollars due to intensifying coronavirus concerns.

Daily Support and Resistance

  • S1 1.0772
  • S2 1.0886
  • S3 1.0958

Pivot Point 1.0999

  • R1 1.1071
  • R2 1.1112
  • R3 1.1226

EUR/USD– Trading Tips

On Wednesday, the EUR/USD is trading slightly bearish at 1.097, having an immediate support level of around 1.0947. As we can see on the 4-hour chart above, the EUR/USD had formed a bullish channel supported the pair around 1.1060, but has now been violated. The breakout of an upward channel has a huge potential to drive the selling trend in the EUR/USD currency pair.

On the higher side, the EUR/USD pair is facing resistance at 1.1050 area. Bullish crossover of 1.1050 area can open further room for buying until 1.1145 level. Whereas, the chances of a bearish bias will remain strong if the pair closes a 4-hour candle below 1.0950 level today. On the lower side, the target is likely to target 1.0947 and 1.0885. 


GBP/USD– Daily Analysis

The GBP/USD was little changed at 1.2413. A day before, Sterling surged as traders reconciled their portfolios before the end of the first quarter of 2020, although analysts said the currency remained fragile.

However, the worse than expected economic events throughout the first quarter continued to weigh on the market’s risk-tone during the early Asian session.

Today, the US ADP Employment report and the ISM Manufacturing data are scheduled to release in this day later. A miss on expectations by a significant margin will likely send the greenback lower across the board. However, the losses could be temporary, mainly because the coronavirus outbreak is not showing any sign of slowing down with the number of cases in the U.S. continue to rise and reached above 177,000 so far. 

The economic calendar is mostly empty for the U.K.; therefore, the coronavirus updates will keep the driver’s seat until the U.S. session. Moreover, the ADP Employment Change and March month activity numbers from the world’s largest economy will be essential to watch for taking fresh direction.

Daily Support and Resistance

  • S1 1.202
  • S2 1.2208
  • S3 1.2319

Pivot Point 1.2396

  • R1 1.2507
  • R2 1.2584
  • R3 1.2772

GBP/USD– Trading Tip

The GBP/USD hasn’t moved much as it continues trading sideways around within a narrow trading range of 1.2275 – 1.2425. On the 4 hour timeframe, the Cable is forming bullish and bearish candles, showing a tug of war between the bulls and bears. We may not see further trends until and unless the pair manages to come out of this narrow range. In order to do this, the pair needs a solid fundamental reason, which we are not expecting from the United Kingdom.

On the 4-hour timeframe, the GBP/USD pair is pretty much likely to find resistance around 1.2470, along with support around 1.2278. In the case of market breaks bellow 1.2278, we may see GBP/USD prices heading into the selling zone until 1.2100 and 1.2005. Whereas, the chances of buying remains solid over 1.2275 until 1.2520.


USD/JPY – Daily Analysis

The USD/JPY currency pair looking flat and hit the high of 107.95 from the low o 107.25 mainly due to the greenback continue to pick the bids as a safe-haven demand after the report in the U.S. said that experts expecting the virus could kill almost 100,000 and 240,000 Americans despite social distancing measures. 

The USD/JPY got support also from the Bank of Japan’s Tankan corporate survey, which showed Japanese manufacturers turned downbeat for the first time in seven years. The USD/PY is trading at 107.58 and consolidates in the range between the 107.25 – 107.94.

Besides, the risk sentiment in the market is getting worse time by time due to intensifying concerns over the coronavirus (COVID-19). As in result, the USD/JPY pair dropped earlier as JPY was getting strong bids due to its safe-haven demand while the U.S. dollar strength was supporting the pair to stay bullish. 

As per the latest report, the coronavirus outbreak is not showing any sign of slowing down with the number of cases in the U.S. continue to rise and reached above 177,000 so far. The coronavirus cases continue to increase in Europe, with Spain and Italy reporting a total of 200,000 cases so far.

The U.S. President Trump was increasing the possibilities of another major infrastructure package or some $2trn within the next relief bill. At the same time, the Democratic House Speaker, Nancy Pelosi, also declared that the United States should start developing and discussing the 4th stimulus bill. Thus, the USD/JPY pair can trade bearish in the wake of a weaker dollar and stronger yen.

Daily Support and Resistance

  • S1 105.37
  • S2 106.64
  • S3 107.08

Pivot Point 107.91

  • R1 108.35
  • R2 109.17
  • R3 110.44

USD/JPY – Trading Tips

On Wednesday, the USD/JPY is trading at 107.570, consolidating sideways, right above an immediate support level of 107.200. The USD/JPY’s trading range remains narrow as the upper limit stays at 108.500, and the lower limit rests at 107.150. 

We see neutral candles, which may trigger a breakout at any side of the market. But the bullish breakout of 108.650 resistance level can lead the USD/JPY prices higher towards 109.750 level. Until then, we should look for doing choppy trading by selling below 108.600 and buying over 107.250. Below 107.200, the next support will stay around 105.990. All the best for today!  

Categories
Forex Market Analysis

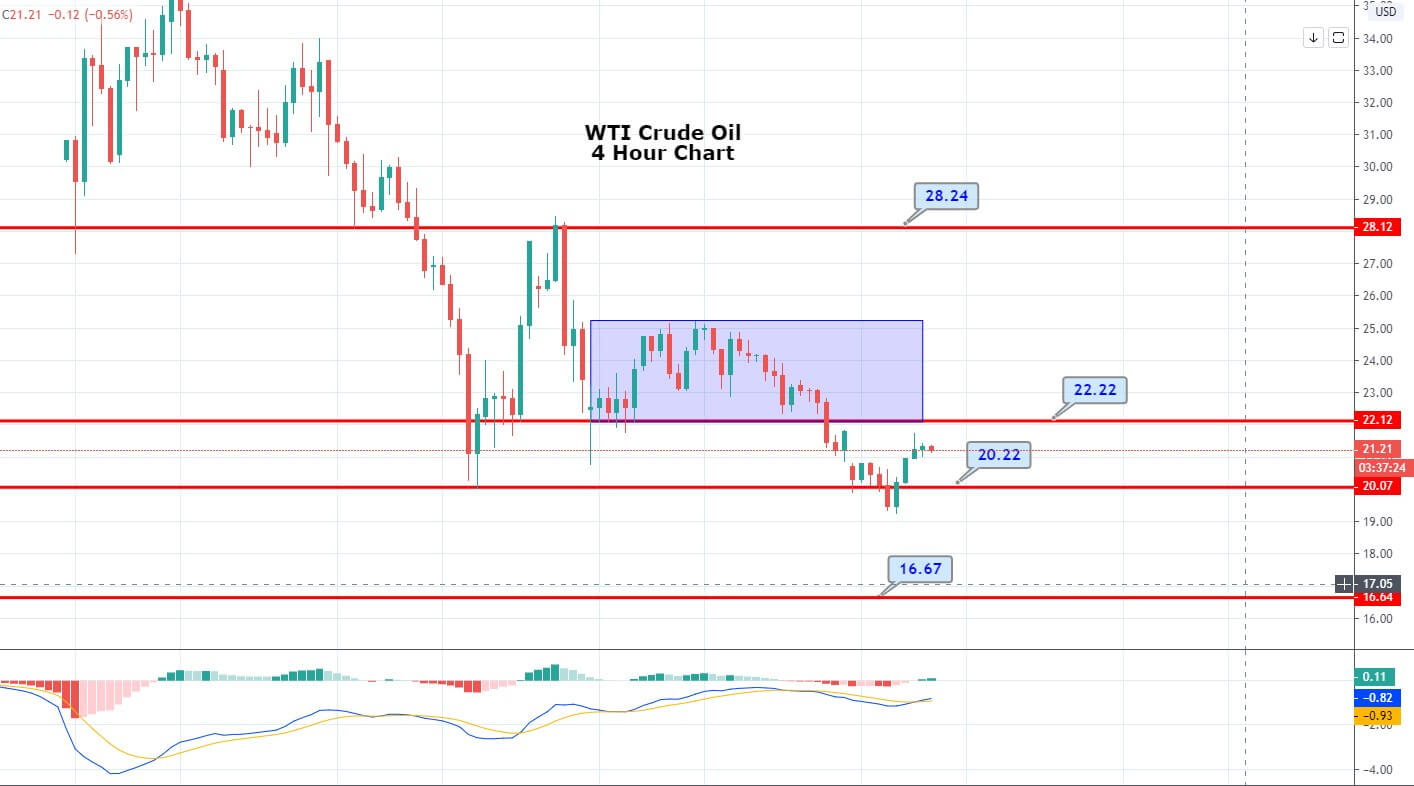
Descending Trendline Resisting Crude Oil’s Bullish Bias – Get Set for Selling! 

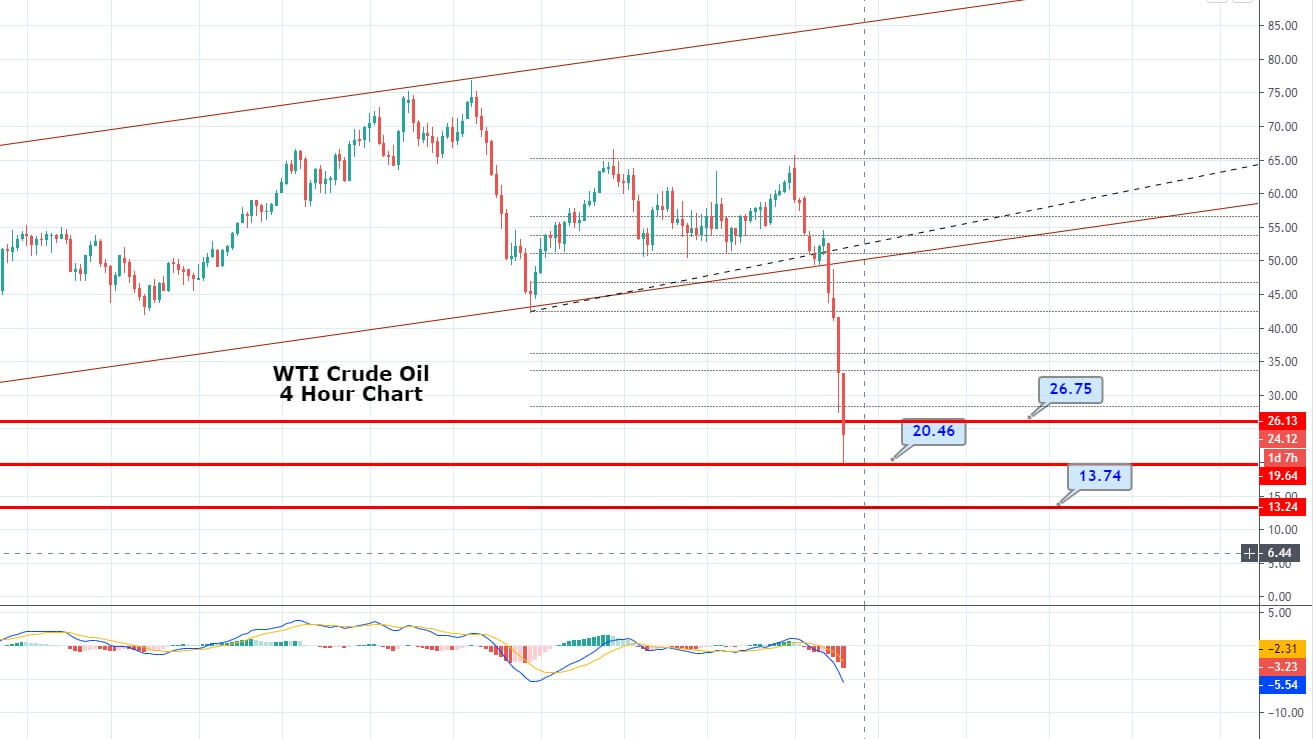
The WTI crude oil prices slid further, as the Trump administration extended social-distancing guidelines through April 30, leading traders to expect lower fuel consumption ahead. U.S. Nymex crude oil futures shed a further 6.6% to $20.09 a barrel, the lowest level since February 2002. Brent tumbled 8.7% to $22.76.

Crude oil prices are still facing selling pressure, even after the fresh, positive news in the market. The continued concerns about the global economic slowdown from the coronavirus pandemic kept giving some support to the U.S. dollars as a safe-haven demand. 

The negative correlation between the U.S dollar and commodities are keeping the WTI prices in a selling mode. During the beginning of this week, physical demand for WTI and its prices fell globally. 


WTI Crude Oil – Daily Technical Levels

Support Resistance 

20.95       22.42

20.13       23.06

18.66       24.53

Pivot Point 21.59

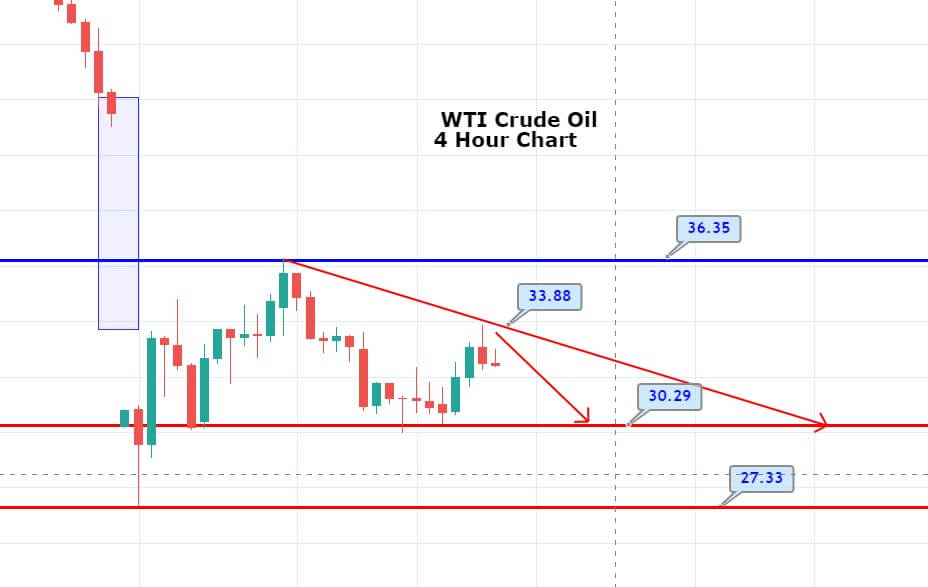
The WTI crude oil prices are facing resistance at 21.90, which is extended by the downward trendline. On the lower side, support stays at 19.45 level, which is also extended by horizontal support level. The MACD is suggesting bearish bias along with all the fundamentals in the market. Today we can look for adding selling trades below 20.75 with a target of 19.40. Good luck! 

Categories
Forex Market Analysis

Daily F.X. Analysis, March 31 – Top Trade Setups In Forex – Consumer Confidence Under Spotlight! 

On Tuesday, the market is mostly focusing on the major and medium impact economic events due to come out from the Eurozone and the United States. In the U.S., the Conference Board will publish March Consumer Confidence Index (110.0 expected). The Market News International will release March Chicago PMI (40.0 expected). S.P./Case-Shiller will report the 20-City Composite Home Price Index for January (+0.4% on month expected). 

Economic Events to Watch Today     


EUR/USD – Daily Analysis

The EUR/USD retreated 1.0% to 1.1029, snapping a five-day rally. Official data revealed that the eurozone’s Economic Confidence Index slid to 94.5 in March (91.6 expected) from 103.4 in February. 

Later today, the eurozone’s March CPI (+0.6% on-year estimated) and German jobless rate (5.1% expected, 5.0% in February) will be reported. The global equities recovered last week, as in result, the greenback weakened its bid tone and helped EUR/USD rise from 1.0636 to 1.1148. 

That was mainly due to the U.S. Federal Reserve declaring an open-ended asset purchase program, and the U.S. Senate passed a special $2 trillion fiscal relief package. 

Italy marked as the second-highest country of confirmed cases in the world after the United States (105,470). Total cases are 92,472 confirmed, marking up the highest death rate in the world. 

The eyes will be on the risk market sentiment, which could turn pro-risk, as the China data released in Asia showed the manufacturing activity recovered sharply to above-50 levels or expansion territory.

The risk-on rally could weaken the safe-haven demand for the U.S. dollar and send EUR/USD higher. On the data front, the German Import Price Index for February and the Unemployment Rate is scheduled to release with the preliminary Eurozone Consumer Price Index for March. Besides this, the U.S. Consumer Confidence and the Chicago Purchasing Managers’ Index are also scheduled to release.

Daily Support and Resistance   

  • S1 1.0862
  • S2 1.0958
  • S3 1.1002

Pivot Point 1.1054

  • R1 1.1099
  • R2 1.1151
  • R3 1.1247

EUR/USD– Trading Tips

Technically, the EUR/USD is trading slightly bearish at 1.099, having an immediate support level of around 1.0947. The major currency pair has formed a bullish channel which is supporting the EUR/USD pair around 1.1060, and below this, the next support is likely to be found around 1.1000. 

On the higher side, the EUR/USD pair is facing resistance at 1.1150 area. Bullish crossover of 1.1060 area can open further room for buying until 1.1185 level. Whereas, the chances of a bearish bias will remain strong if the pair continues to hold below 1.1060 level today. On the lower side, the target is likely to stay at 1.0947 and 1.0885. 


GBP/USD– Daily Analysis

The GBP/USD dropped 0.7% to 1.2364. We haven’t seen much movement in the GBP/USD as the United Kingdom continues to struggle efforts and seems very close to open the world’s biggest hospital, which built-in 10-days. They are also ordering approximately 15,000 ventilators more while saying that it needs to cope with the coronavirus outbreak.

The global news agency, Guardian, indicates the risk for the European Union citizens who have made their houses in the U.K. illegally. Whereas, Dr. Jenny Harries, deputy chief medical officer for England, said during his daily press conference on Sunday that the current limitations and lockdowns in the U.K. could continue for six months.

At the USA front, U.S. President Donald Trump did not suggest the overall lockdown in the country and said no to nationwide stay-at-home order while helping to continue the previous day’s risk-on tone. As in result, the U.S. ten-year treasury yields and most Asian stocks flashing green and mark moderate gains by the press time.

Looking forward, the final figures of the U.K.’s fourth quarter (Q4) GDP, expected to march 0.0% initial forecast, will likely offer fresh direction ahead of the U.S. data. However, news regarding the Brexit and the virus updates will be kay to watch.

Daily Support and Resistance

  • S1 1.2131
  • S2 1.2256
  • S3 1.2319

Pivot Point 1.238

  • R1 1.2444
  • R2 1.2505
  • R3 1.263

GBP/USD– Trading Tip

Technically, the GBP/USD is trading sideways around within a narrow trading range of 1.2275 – 1.2425. Since the Sterling has already crossed over 1.2275 resistance area, this is now going to work as a support. The MACD is still heading into the bullish zone, suggesting strong chances of buying the GBP/USD pair.

On the 4 hour timeframe, the GBP/USD pair is pretty much likely to find resistance around 1.2520, along with support around 1.2278. In the case of market breaks bellow 1.2278, we may see GBP/USD prices heading into the selling zone until 1.2100 and 1.2005. Whereas, the chances of buying remains solid over 1.2275 until 1.2520.


USD/JPY – Daily Analysis

The USD/JPY currency pair found on the bullish track and rose to 108.72, mainly because the risk sentiment remains positive. The slight recovery in the greenback also keeps the pair higher. Elsewhere, the traders gave a little attention to Japan’s data-dump. 

Right now, the USD/JPY is currently tradings at 108.52 and consolidates in the range between the 107.78 – 108.72. However, the currency pair also took from the U.S. policymaker’s statement.

At the data front, Japan’s February month data dump, including Retail Sales, Industrial Production and Unemployment Rate, overall flashed upbeat signals. Whereas the Retail Sales (YoY) surprised markets by crossing -1.2% forecast to 1.7%, the preliminary figures of Industrial Production (MoM) also increased above 0.1% expected to 0.4%. While the Unemployment Rate remained stable at 2.4% with Job/Applicants Ratio returning below 1.47 forecast to 1.45.

At the U.S. economic front, U.S. President Donald Trump did not suggest the total lockdown in the country and suggested no to nationwide stay-at-home order while helped to continue the previous day’s risk-on tone. As in result, the U.S. ten-year treasury yields gain 5-basis points (bps) to 0.72%, and most Asian stocks flashing green and mark moderate gains by the press time. Consequently, the USD/JPY pair is exhibiting bullish and bearish biases both. Let’s look at the technical side. 

Daily Support and Resistance

  • S1 105.89
  • S2 106.85
  • S3 107.35

Pivot Point 107.82

  • R1 108.31
  • R2 108.79
  • R3 109.76

USD/JPY – Trading Tips

Technically, the USD/JPY is trading at 108.270, heading north to examine the resistance level of around 108.615. At the moment, the USD/JPY pair is consolidating within a narrow range, where the upper limit is 108.500, and the lower limit stays at 107.150. 

The USD/JPY may face a bullish pressure in the wake of the bullish engulfing candle, which has been formed on the 4-hour chart around 108.500 area. Such a pattern represents the dominance of bulls in the market. Consequently, the bullish breakout of 108.650 resistance level can lead the USD/JPY prices higher towards 109.750 level. Until then, we should look for doing choppy trading by selling below 108.600 and buying over 107.250. All the best for today!  

Categories
Forex Signals

EUR/CHF Set to Test Major Resistance – Is It Good Time to Short? 


The EUR/CHF is trading at 1.05935 after testing the 61.8% Fibonacci support around 1.0570. Closing of candles above this level may drive buying in the market until 1.06060 and 1.06235 resistance areas. On the lower side, a bearish breakout of 1.0570 level can lead the EUR/CHF prices towards the next support level of 1.0530.

EUR currency may not find buyers due to intensifying recession fears. Moreover, the European Central Bank’s decision to launch a fresh EUR 750 billion worth of QE program could keep the EUR buyers quiet.


EUR/CHF- Daily Technical Levels

Support Resistance 

1.0563 1.0635

1.0527 1.0672

1.0455 1.0745

Pivot Point 1.06

Technically, EUR/CHF is keeping the bearish bias as the pair has closed a bearish engulfing candle below 1.0602 support become resistance area, and the MACD is also in the selling zone. Both support the sentiment that the pair has the potential to go after further lower towards 1.0560 soon. 

Entry Price: Sell at 1.05868

Take Profit 1.05468

Stop Loss 1.06268

Risk/Reward 1.00

Profit & Loss Per Standard Lot = -$410/ +$410

Profit & Loss Per Micro Lot = -$41/ +$41

Categories
Forex Market Analysis

Daily F.X. Analysis, March 30 – Top Trade Setups In Forex – German Inflation Figures Ahead! 

The U.S. Dollar Index slid 0.9% on the day to 98.36 on Friday, wiping out most of its gains made in the prior week. During the day ahead, eyes will be on the European Commission will report the Eurozone’s March Economic Confidence Index (93.1 expected) and final readings of the Consumer Confidence Index (-11.6 previously).

The German Federal Statistical Office will post March CPI (+1.4% on-year expected). The Bank of England will release the number of mortgage approvals in February (68,200 expected) and the M4 money supply.

Economic Events to Watch Today    


EUR/USD – Daily Analysis

The EUR/USD jumped 1.0% to 1.1142, posted a five-day rally. Later today, the eurozone’s March Economic Confidence Index (93.1 expected) and German CPI (+1.4% on-year estimated) will be reported.

A series of economic fundamentals drove the pair, and even today market is likely to move on news. In particular, the U.S. initial jobless claims are expected to have risen to 1,000K from the preceding week’s 281K figure in the week ended March 20. The European Union’s upcoming emergency meeting to discuss further steps to combat the virus will be essential to watch. 

Global equities recovered last week, as in result, the greenback weakened its bid tone and helped EUR/USD rise from 1.0636 to 1.1148. That was mainly due to the US Federal Reserve declaring an open-ended asset purchase program, and the US Senate passed a special $2 trillion fiscal relief package. 

At the coronavirus front, Italy marked as the second-highest country of confirmed cases in the world after the United States (105,470). Total cases are 92,472 confirmed, marking up the highest death rate in the world. 

Looking forward, the traders will keep their eyes on the Eurozone consumer and business sentiment indices, which are scheduled to release along with the preliminary German Consumer Price index for March. Apart from this, the eyes will be on the Pending Home Sales and the Dallas Fed Manufacturing Index for taking near-term directions.

Daily Support and Resistance

  • S1 1.0673
  • S2 1.0835
  • S3 1.0935

Pivot Point 1.0997

  • R1 1.1097
  • R2 1.1159
  • R3 1.1321

EUR/USD– Trading Tips

On Monday, the direct currency pair EUR/USD is trading slightly bearish at 1.1025, having an immediate support level of around 1.0947. The major currency pair has formed a bullish channel which is supporting the EUR/USD pair around 1.1060, and below this, the next support is likely to be found around 1.1000. 

On the higher side, the EUR/USD pair is facing resistance at 1.1150 area. Bullish crossover of 1.1150 area can open further room for buying until 1.1195 level. Whereas, the chances of a bearish bias will remain strong if the pair continues to break below 1.1060 level today. On the lower side, the target is likely to stay at 1.0947 and 1.0885. 

GBP/USD– Daily Analysis

The GBP/USD surged 2.1% to a two-week high of 1.2457. The Bank of England (BOE) failed to offer any fireworks due to a lack of resources while disappointing U.K. Retail Sales, to 0.0% from 0.8% YoY forecast, also couldn’t recall the bears.

Guardian indicates the risk for the European Union citizens who have made their houses in the UK illegally. Whereas, Dr. Jenny Harries, deputy chief medical officer for England, said during his daily press conference on Sunday that the current limitations and lockdowns in the UK could continue for six months.

On the other hand, the United States President Donald Trump expects the virus figures to grow sharply in the next 2-weeks if they do not take lockdown seriously. As in result, the market’s risk-tone continues to flash red, with the US 10-year treasury yields declining below 0.70% and most Asian stocks marking losses by the press time.

Looking forward, the U.S. Dallas Fed Manufacturing and Pending Home Sales will be a key watch. Besides, the traders will also keep eyes on the virus headlines.

Daily Support and Resistance

  • S1 1.1678
  • S2 1.2019
  • S3 1.2234

Pivot Point 1.236

  • R1 1.2576
  • R2 1.2701
  • R3 1.3042

GBP/USD– Trading Tip

Technically, the GBP/USD is trading sideways around within a narrow trading range of 1.2275 – 1.2425. Since the Sterling has already crossed over 1.2275 resistance area, this is now going to work as a support. The MACD is still heading into the bullish zone, suggesting strong chances of buying the GBP/USD pair.

On the 4 hour timeframe, the GBP/USD pair is pretty much likely to find resistance around 1.2520, along with support around 1.2278. In the case of market breaks bellow 1.2278, we may see GBP/USD prices heading into the selling zone until 1.2100 and 1.2005. Whereas, the chances of buying remains solid over 1.2275 until 1.2520.

USD/JPY – Daily Analysis

The USD/JPY currency pair just started to flashing green and rose above 108.00 level at the press time, mainly due to the broad-based greenback recovery. However, China’s rate cut by 20 basis points on early Monday and infusion of $7 billion liquidity into the banking system started to giving some support to the equity market and turns the market risk-off tone into risk-on. 

The USD/JPY pair is currently trading at 108.08 and consolidates in the range between the 107.14 – 108.20. The USD/JPY pair was recently trading near 107.25 and was representing a 0.60% loss on the day, having hit a session low of 107.12 a few minutes before press time, but now the pair got boost after slight recovery came in the equity market.

The People’s Bank of China cut the seven-day reverse repo rate to 2.2% from 2.4% and injected $7 billion or 50 billion Japanese yuan into the banking system, which recently gave some support to the equity market.

Before some time, the action by China had failed to put a bid under the risky assets. The futures on the S&P 500 were keeping losses and was reporting a 1% decline on the day. Stocks in Asia were also feeling the pull of gravity with Japan’s Nikkei index was dropping 3.4%. As a result, the safe-haven Japanese yen was getting bid as safe-haven demand.

Looking forward, the currency pair may drop to their lowest level in the future, mainly due to the fears about the Japanese government may declare a state of emergency due to intensifying coronavirus fears. 

Daily Support and Resistance

  • S1 106.51
  • S2 108.16
  • S3 108.75

Pivot Point 109.8

  • R1 110.4
  • R2 111.45
  • R3 113.09

USD/JPY – Trading Tips

The USD/JPY is trading at 107.570, heading towards testing double bottom support around 107.615. For now, the pair is stuck in a narrow range, where the upper limit is 108.500, and the lower limit stays at 107.050. The USD/JPY is facing a bearish pressure in the wake of an increased number of coronavirus cases around the globe which are driving safe-haven appeal in the market.  

Consequently, the bearish breakout of 108.150 support level can lead the USD/JPY prices lower towards 105.950 level. Until then, we should look for doing choppy trading by selling below 108.400 and buying over 108.250. All the best for today!  

Categories
Forex Signals

USD/JPY Bearish Price Action – Is It Heading for 107.450?

The USD/JPY has violated the horizontal support level of 108.300, which can ve seen on the 4-hour chart. Closing of candles below this level may extend selling bias until 107.450 as the demand for safe-haven assets remains solid. 

The Japanese yen is a safe-haven asset, whereas the market treat also greenback as a safe-haven currency during the time of crises. So, as in result, the dollar index rose sharply from 94.65 to 103.00 in the ten days to March 19. The crash in the equity markets triggered in the wake of margin calls and liquidity crises, forcing investors to seek safety in the U.S. dollar.

Consequently, the market sentiment remains weak, with the S&P 500 futures currently reporting over a 1% decline on the day. If the risk sentiment gets worsens, the U.S. dollar will be able to find haven bids again, allowing a bounce in USD/JPY. 

USD/JPY- Daily Technical Levels

Support Resistance 

108.73 110.37

108.14 111.44

106.5 113.08

Pivot Point 109.79

Technically, USD/JPY is keeping the bearish bias as the pair has closed a bearish engulfing candle at 108.200, and the MACD is also in the selling zone. Both support the sentiment that the pair has the potential to go after further lower towards 107.350. 


Entry Price: Sell at 107.984

Take Profit 106.734    

Stop Loss 109.034    

Risk/Reward 1.30

Profit & Loss Per Standard Lot = -$1000/ +$1300

Profit & Loss Per Micro Lot = -$100/ +$130

Categories
Forex Market Analysis

Daily F.X. Analysis, March 27 – Top Trade Setups In Forex – Weaker Dollar In Play! 

The greenback fell against its major peers, with the Dollar Index dipping 0.7% on the day to 100.94, down for a 4th consecutive session. France’s INSEE will release March Consumer Confidence Index (91 expected).

The U.S. Commerce Department will report February personal spending (+0.2% on month expected) and personal income (+0.4% on month expected). The University of Michigan (UOM) will report its final rea1dings of the March Consumer Sentiment Index (90.0 expected).

 Economic Events to Watch Today    


EUR/USD – Daily Analysis

The EUR/USD rallied 1.5% to 1.1047, posting a four-day winning streak. The risk-on market sentiment is also pushing the U.S. Dollar lower and sending the pair higher. The recovery in the risk-sentiment came after the U.S. Senate approved of the original $2 trillion fiscal stimulus package.

A series of economic fundamentals drove the pair, and even today market is likely to move on news. In particular, the U.S. initial jobless claims are expected to have risen to 1,000K from the preceding week’s 281K figure in the week ended March 20. 

If jobless claims fall in the 2 to 3 million range, which seems fairly possible, we will likely see a notable sell-off in the greenback. In that case, the EUR/USD currency pair could find a bid over the 50-day moving average at 1.10. 

On the other hand, the EUR/USD currency pair will also take cues from the Kansas Fed Manufacturing Activity index for March. The European Union’s upcoming emergency meeting to discuss further steps to combat the virus will be essential to watch. 

Markets are assuming that the Eurozone is going for a deep slowdown, and they need aggressive stimulus to stop the fallout from the virus outbreak. Later today, eyes will be on France’s INSEE, which is due to release March Consumer Confidence Index (91 expected).

Daily Support and Resistance

  • S1 1.0673
  • S2 1.0835
  • S3 1.0935

Pivot Point 1.0997

  • R1 1.1097
  • R2 1.1159
  • R3 1.1321

EUR/USD– Trading Tips

The EUR/USD is trading bullish at 1.1025, having an immediate support level of around 1.0947. The bullish channel has already been violated on the higher side, and it’s supporting is the bullish bias in the EUR/USD pair. On the higher side, the EUR/USD pair is facing resistance at 1.1070 area. 

Bullish crossover of 1.1070 area can open further room for buying until 1.1194 level. Whereas, the chances of a bearish bias will remain strong if the pair continues to hold below 1.1070 level today. On the lower side, the target is likely to stay at 1.0947 and 1.0885. 

GBP/USD– Daily Analysis

The GBP/USD surged 2.6% to 1.2192. The Bank of England said, after announcing a rate cut and additional bonds purchase last Thursday, it can expand asset purchases further if necessary. On the other hand, official data showed that U.K. retail sales declined 0.3% on month in February (+0.2% expected).

The policymakers could be called with the 24-hour prior notice to vote on the coronavirus support package on Friday. On the U.S. front, the coronavirus fears in the U.S. also increased with the death losses crossed 1,000 figures and an increase of 12,000 cases recorded in the single day on Wednesday.

The Bank of England (BOE) failed to offer any fireworks due to a lack of resources while disappointing U.K. Retail Sales, to 0.0% from 0.8% YoY forecast, also couldn’t recall the bears.

Later today, the U.S. Commerce Department will report February personal spending (+0.2% on month expected) and personal income (+0.4% expectation). The University of Michigan will report Consumer Sentiment Index (90.0 expected).


Daily Support and Resistance

  • S1 1.1339
  • S2 1.1535
  • S3 1.1662

Pivot Point 1.1731

  • R1 1.1858
  • R2 1.1927
  • R3 1.2122

GBP/USD– Trading Tip

The GBP/USD has violated the double top resistance level of 1.1945, and the pair now trades around 1.2180, the level which is marked as horizontal resistance. Today, the bullish breakout of the 1.2300 level can open the buying trend until the next resistance level of 1.2338 (50% Fibo level) and 1.2510 level, which accounts for a 61% retracement. On the lower side, the Cable can find support around 1.2035 and 1.1930. Let’s look for buying trades over the 1.1945 support level and selling below 1.2350 today. 

USD/JPY – Daily Analysis

The USD/JPY currency pair flashing red and hit the session low near the 108.50, mainly due to broad-based U.S. Dollar weakness. While the greenback continues to lose its ground in the wake of the U.S. relief package. At the time of writing, the USD/JPY is trading at 108.78 and consolidates in the range between the 108.25 – 109.72. 

However, the currency pair faced rejection at 109.72 in early Asia and dropped below the 100-day average support at 109.00 a few minutes before press time to hit a session low of 108.55.

Whereas, the major Asian equity indices like Japan’s Nikkei, Hong Kong’s Hang Seng and South Korea’s Kospi are flashing green.

It is worth to mention that the traders did not give much more attention to the Japanese Yen demand. So, the reason behind the pairs declines is the broad-based greenback weakness. The dollar index, which tracks the value of the greenback against majors, is currently trading at weekly lows near 99.30, having declined by nearly 200 pips on Thursday.

The U.S. dollar continues to lose its ground due to the unprecedented fiscal and monetary stimulus by the U.S. government and the Federal Reserve in the last five days.


Daily Support and Resistance

  1. S1 106.51
  2. S2 108.16
  3. S3 108.75
  4. Pivot Point 109.8
  5. R1 110.4
  6. R2 111.45
  7. R3 113.09

USD/JPY – Trading Tips

On Friday, the demand for safe-haven assets such as gold and Japanese yen has surged in the wake of an increased number of coronavirus cases around the globe. Consequently, the USD/JPY pair has dropped to trade at 108.350, down from the 109 level. On the 4 hour chart, the USD/JPY has violated the bullish channel, which is now suggesting bearish bias in the USD/JPY. 

The USD/JPY prices are holding around the next support level of 108.350, and around this level, we can expect USD/JPY to bounce off until 109.850. But in case, the USD/JPY exhibits a bearish breakout below 108.350 level; the pair may drop further until 106.450. 

All the best for today!  

Categories
Forex Signals

GBP/USD Breaks over Double Top Pattern – Buckle Up for Buying

The GBP/USD trades bullish around 1.2030 in the wake of less dovish than expected monetary policy decisions. The central bank left the interest rate unchanged at 0.10%. However, it has warned that the measure and term of the economic collapse arising from the coronavirus pandemic will be “wide and dramatic but should eventually prove short-lived.”

The BOE Monetary Policy Committee (MPC) fixes monetary policy to reach the 2% inflation mark and whereby advocates to support growth and employment. In that context, its challenge over recent weeks has been to return to the severe economic and financial disorder produced by the spread of Covid-19.


Technically, the GBP/USD pair has violated the double top resistance level of 1.1930 level on the 4-hour chart. Closing of candles above this confirms bullish breakout and opens up further room for buying until 38.2% Fibonacci resistance level of 1.2135. At the same time, the MACD is also staying in a bullish zone. Support can be found around the 1.1946 zones.

Entry Price: Buy at 1.20286
Take Profit 1.21686
Stop Loss 1.19086
Risk/Reward 1.17

Profit & Loss Per Standard Lot = -$1200/ +$1400
Profit & Loss Per Micro Lot = -$120/ +$140

Categories
Forex Market Analysis

Daily F.X. Analysis, March 26 – Top Trade Setups In Forex – U.K. Monetary Policy In Focus! 

The greenback weakened against its major rivals, with the U.S. Dollar Index dropping 0.7% on the day to 100.94, down for a fourth straight session. For now, the focus shifts to the major economic events which will be releasing through the day. 

The Bank of England (BOE) will hold its monetary policy meeting, after a rate cut and additional bonds purchase announced last Thursday (March 19). The European Central Bank will publish the Eurozone’s M3 money supply in February (+5.2% on-year expected).

Germany’s GfK Consumer Confidence Index for April will be released (7.5 expected). France’s INSEE will release March indicators on business confidence (97 expected) and manufacturing confidence (93 expected).

Economic Events to Watch Today    


EUR/USD – Daily Analysis

The EUR/USD jumped 0.9% to 1.0888, posting a three-day rebound. Most of the moment, the pair was driven by a series of economic fundamentals, and even today market is likely to move on news. In particular, the U.S. initial jobless claims are expected to have risen to 1,000K from the preceding week’s 281K figure in the week ended March 20

If jobless claims fall in the 2 to 3 million range, which seems fairly possible, we will likely see a notable sell-off in the greenback. In that case, the EUR/USD currency pair could find a bid over the 50-day moving average at 1.10. On the other hand, the EUR/USD currency pair will also take cues from the Kansas Fed Manufacturing Activity index for March. 

Meanwhile, the European Union’s upcoming emergency meeting to discuss further steps to combat the virus will be essential to watch. Markets are assuming that the Eurozone is going for a deep slowdown, and they need aggressive stimulus to stop the fallout from the virus outbreak.

Looking forward, the European Central Bank will release its monthly Economic Bulletin while the weekly Initial Jobless Claims, Goods Trade Balance, and Q4 Gross Domestic Product (GDP) data from the U.S. will be key to watch.

Daily Support and Resistance

  • S1 1.0531
  • S2 1.0673
  • S3 1.0742

Pivot Point 1.0815

  • R1 1.0885
  • R2 1.0957
  • R3 1.11

EUR/USD– Trading Tips

On Thursday, the EUR/USD is trading bullish at 1.0935, having an immediate support level of around 1.0890. The bullish channel that you can see in the chart above is also supporting the bullish bias in the EUR/USD pair, and it’s supporting the direct currency pair at 1.0890. 

Closing of the bullish engulfing candle and three bearish two-hourly candles above 1.0890 support is signifying a bullish breakout, which can lead the pair towards 1.0959 resistance level. While the bearish breakout of 1.0890 can lead the EUR/USD prices towards 1.0780. Let’s consider staying bullish above 1.0890 today with an initial target of 1.0950. 

GBP/USD– Daily Analysis

The GBP/USD climbed 0.6% to 1.1833. Official data showed that U.K. CPI grew 1.7% on year in February as expected, compared with a 1.8% growth in January. Later today, the Bank of England will hold its monetary policy meeting, after a rate cut and additional bonds purchase announced last Thursday. Also, U.K. retail sales data for February will be released (+0.2% on month estimated).

The policymakers could be called with the 24-hour prior notice to vote on the coronavirus support package on Friday. On the U.S. front, the coronavirus fears in the U.S. also increased with the death losses crossed 1,000 figures and an increase of 12,000 cases recorded in the single day on Wednesday.

Later in the day, the Bank of England will hold its monetary policy meeting, after a rate cut and additional bonds purchase announced last Thursday (March 19). While the U.K. Retail Sales are expected to remain unchanged at 0.80% YoY but any major chances likely offer a new direction to the GBP/USD prices. The U.K. Office for National Statistics will report February retail sales (+0.2% on month expected).

Daily Support and Resistance

  • S1 1.1339
  • S2 1.1535
  • S3 1.1662

Pivot Point 1.1731

  • R1 1.1858
  • R2 1.1927
  • R3 1.2122

GBP/USD– Trading Tip

The GBP/USD has violated a broad trading range of 1.1400 – 1.1885, and the pair now trades around 1.1930, the level which is marked as a triple top. The Bank of England’s rate decision today will play a major role in determining it’s a trend. Today, the bullish breakout of the 1.1930 level can open the buying trend until the next resistance level of 1.2185 (38.2% Fibo level) and 1.2300 level, which accounts for a 50% retracement. On the lower side, the Cable can find support around 1.1665 and 1.1445. Let’s look for buying trades over the 1.1945 resistance level and selling below the same today. 

USD/JPY – Daily Analysis

During Thursday’s early Asian session, the USD/JPY dropped to a session low of 110.45 from the high of 111.30 after the market sentiment shifts, mainly due to the United States Congress, which failed to come together and agree on relief package plan after facing recent hurdles. While the broad-based USD weakness also undermines the currency pair. 

At the moment, the USD/JPY is trading at 110.52 and consolidates in the range between the 110.38 – 111.31. However, the safe-haven Japanese yen is continuing its bullish move, which seen in early Asia sessions due to fresh losses in the U.S. stock futures.

The risk-off market sentiment strengthened, pushing the futures tied to the S&P 500 futures lower. At press time, the index futures are reporting a 1% decline. On the other hand, the coronavirus outbreak is not showing any sign of slowing down in the U.S., Japan, and European countries. 

There was a sharp rise in cases in Tokyo and gave a warning about the lockdown, which eventually strengthing the risk-off market sentiment and boosting the safe-haven Japanese yen.

Daily Support and Resistance    

  • S1 107.85
  • S2 109.43
  • S3 110.32

Pivot Point 111.02

  • R1 111.91
  • R2 112.6
  • R3 114.19

USD/JPY – Trading Tips

The intensified safe-haven demand has started driving the bearish trend in the USD/JPY currency pair as it trades at 110.350, down from 111 level. On the 4 hour chart, the USD/JPY was trading in a bullish channel, which supported the USD/JPY prices around 110.650. Since this level has already been violated, now it’s going to work as a resistance for the USD/JPY. 


As forecasted earlier, a bearish breakout of 110.600 can lead its prices toward 109.600 level, and that’s what the market is trying to do now. The USD/JPY prices are heading towards the next support level of 109.850, and around this level, we can expect USD/JPY to bounce off a bit. However, in case of a bearish breakout of 109.850 level, the pair may drop further until 108.450. 

All the best for today!  

Categories
Forex Signals

GBP/JPY to Gain Support Over Upward Trendline – Buying Limit!

The Japanese cross currency pair GBP/JPY has dropped to trade at 130.300 as investors are moving towards safe-haven assets such as gold and Japanese yen. At the same time, traders seem to cash out from Sterling, causing it to tumble to its lowest level on record versus the currencies of the United Kingdom’s major trading partners.

It seems like the effects of the coronavirus pandemic proceed to shred through markets. Besides this, the British Consumer Prices Index, which is also known as inflation, surged to 1.7% in the month of February 2020. Comparing it to the previous month, the CPI figure is down by 0.1% from 1.8% in January 2020, and it has also been weighing on the GBP/JPY.


Technically speaking, the GBP/JPY is likely to test the support level of 129.650, which is extended by a bullish trendline. At the same level, the 50 periods exponential moving average is also supporting the Japanese cross.

While the resistance becomes a support level holds around 129.120. So to be more secure, we are looking to place a buy limit at 130.330 with a stop loss below 129.750 and take a profit of around 131.850.

Buy Limit 130.335

Take Profit 131.875

Stop Loss 129.735

Risk/Reward 2.57

Profit & Loss Per Standard Lot = -$530/ +$1,380

Profit & Loss Per Micro Lot = -$53/ +$138

Categories
Forex Market Analysis

Daily F.X. Analysis, March 25 – Top Trade Setups In Forex – Brace for U.K. Inflation Figures! 

The U.S. stocks soared on news of Congress is close to passing a substantial coronavirus relief bill. The sentiment was further boosted by President Donald Trump’s comments that he would like the U.S. economy to reopen by Easter in mid-April. The Dow Jones Industrial Average surged 2113 points (+11.4%) to 20,704, its biggest one-day percentage gain since 1933. The S&P 500 jumped 209 points (+9.4%) to 2,447, and the Nasdaq 100 rose 546 points (+7.8%) to 7,553. 

Later today, February durable goods orders (preliminary reading, -1.0% on month expected) will be reported. 

Economic Events to Watch Today    


EUR/USD – Daily Analysis

The EUR/USD advanced 0.8% to 1.0809. The Markit Eurozone Manufacturing PMI slid to 44.8 in March (39.0 expected) from 49.2 in February and Services PMI sank to 28.4 (39.5 expected) from 52.6. 

The EUR/USD currency could drop below the 1.08 if the coming German IFO Expectations Index for March disappoints expectation of 82, strengthening recession fears. Apart from this, U.S. Durable Goods data for February is also scheduled to release. 

The traders need progress soon in the global market; otherwise, the risk assets may suffer another selloff, boosting haven demand for the U.S. dollar. At press time, the S&P 500 futures are reporting a 1.4% drop. 

The U.S. dollar continues trading in the red territory against majors, as shown by the 0.3% drop in the dollar index. Federal Reserve’s unlimited quantitative easing plan has decreased pressure in funding markets and bought time for the politicians. 

The headlines regarding coronavirus and stimulus package by the Federal Reserve will be key to watch. Eyes will be on the German IFO Expectations Index for taking new directions.

Daily Support and Resistance 

  • S1 1.0531
  • S2 1.0673
  • S3 1.0742

Pivot Point 1.0815

  • R1 1.0885
  • R2 1.0957
  • R3 1.11

EUR/USD– Trading Tips

On Wednesday, the EUR/USD is trading sideways, forming higher’s high and higher’s a low pattern, which indicates stronger chances of a bullish bias in the market. The EUR/USD is trading around 1.0815, and it’s forming neutral candles while trading in an upward channel, which may support the pair around 1.0775. 

On the higher side, the EUR/USD pair may face resistance around 1.0880, and above this, the pair has the potential to target the next resistance level of 1.0930 while the EUR/USD has odds of staying bearish below 1.0920 to target 1.0805.


GBP/USD– Daily Analysis

The GBP/USD surged 2.1% to 1.1789 after the U.K. government ordered lockdown measures to stop coronavirus spreading. On the other hand, the Markit U.K. Manufacturing PMI fell to 48.0 in March (45.0 expected) from 51.7 in February, and Services PMI dipped to 35.7 (45.0 estimated) from 53.2.

The GBP/USD currency pair may drop to their lowest level if the UK CPI data releases sluggish while a surprise positive figures could help the pair extend its fresh recovery rally from the multi-year low.

The Consumer Price Index published by the Office for National Statistics is a gauge of price moves by the comparison among the retail prices goods and services. The purchasing power of GBP is slowed down by inflation.

The CPI is a leading indicator to measure inflation and show changes in purchasing trends. Usually, a high figure is understood as positive (or bullish) for the GBP, while a sluggish figure is seen as negative (or Bearish). Let’s look at the technical side of the market. 

Daily Support and Resistance

  • S1 1.1339
  • S2 1.1535
  • S3 1.1662

Pivot Point 1.1731

  • R1 1.1858
  • R2 1.1927
  • R3 1.2122

GBP/USD– Trading Tip

The direct currency pair GBP/USD maintains a broad trading range of 1.1400 – 1.1885 for another day as traders seem to wait for the U.K. Inflation today and Bank of England’s rate decision tomorrow. Today, the bullish breakout of the 1.1889 level can open the buying trend until the next resistance level of 1.2185 (38.2% Fibo level) and 1.2300 level, which accounts for a 50% retracement. On the lower side, the Cable can find support around 1.1665 and 1.1445.

A bearish breakout of 1.1425 level can lead the Cable towards the next support area of 1.1050. The MACD is tossing above and below zero as investors are unable to determine the trend of the market. 

USD/JPY – Daily Analysis

During the Wednesday early Asian session, the USD/JPY currency pair found on the bullish track and hit the session high near 111.58, mainly due to the recovery in the market risk sentiment because the United States policymakers agreed on COVID-19 bill. The USD/JPY is trading at 111.48 and consolidates in the range between the 110.75 – 111.56. 

After the two-days of disappointment, the Senate Democrats and Republicans ultimately agreed on the Trump administration-backed stimulus package plan. However, the raised expectations of the expected $2 trillion package to control the deadly virus impact and fresh strategy of reducing coronavirus (COVID-19) cases from Italy also improved the market risk sentiment.

Whereas, the United States 10-year treasury yields rose 4-basis points (bps) to 0.853% while the U.S. stock futures also decreased earlier losses. The Asian stocks flashing green and marked slight gains by the press time, which show’s drop in demand for safe-haven assets such as gold and Japanese yen.

For the time being, the traders are keenly awaiting the details of the voting as well as the times of the package for taking additional direction. However, the U.S. Durable Goods Orders for January and additional coronavirus headlines will be key to watch.


Daily Support and Resistance    

  • S1 107.85
  • S2 109.43
  • S3 110.32

Pivot Point 111.02

  • R1 111.91
  • R2 112.6
  • R3 114.19

USD/JPY – Trading Tips

Technically, the safe-haven currency pair USD/JPY hasn’t changed a lot as it continues to consolidate around 111.300. On the 4 hour chart, the USD/JPY has formed a bullish channel that is still intact, and it’s pretty much likely to support the USD/JPY prices around 110.650. 

A bearish breakout of 110.600 can lead its prices toward 109.600 level. The USD/JPY prices towards the next support level of 108.350, and around this level, we can expect USD/JPY to bounce off again. Conversely, the pair faces resistance around 111 and 112.190 today. Let’s stay bullish above 109.650 and bearish below the same level today. 

All the best for today!  

Categories
Forex Market Analysis Forex Signals

Upward Trendline Supports the EUR/USD – Who’s Up for Buying?

The EUR/USD is showing sideways trading in between the narrow trading range of 1.0885 – 1.0770. On the hourly chart, the EUR/USD has formed an upward channel, which is a key setup right now. If the EUR/USD manages to break below 1.0775 area, we may see further selling in the pair until the next support level of 1.0720. Conversely, the closing of candles above 1.0770 can drive a bullish trend until 1.0850 and even higher towards 1.0885. 


Looking at the leading indicators, the MACD mixed bias as the histograms are tossing above and below 0. However, the stronger economic figures from the Eurozone are somewhat supporting the EUR/USD pair. 


As per the recent reports from the European Union, the German business activity declined distinctly in March, mostly led by a record contraction in the country’s service sector. But traders understand that this slowdown in manufacturing data is mostly due to the increased number of coronavirus cases, and this will get better as soon as markets resume business activities. 


Considering this, we have opened a buying signal with the following specifications:


Entry Price 1.07915 

Stop Loss 1.07515 

Take Profit 1.08515

Risk & Reward Ratio: 1: 1.2

Profit & Loss Per Standard Lot = -$400/ +$600

Profit & Loss Per Micro Lot = -$40/ +$60

All the best ^Stay tuned for more updates! 

Categories
Forex Market Analysis

Daily F.X. Analysis, March 24 – Top Trade Setups In Forex – Eyes on Manufacturing PMI Figures! 

The U.S. Dollar Index regained bullish bias at 102.81, while U.S. stock scored daily downside limits. Federal Reserve Bank of St. Louis President James Bullard said U.S. jobless rate might soar to 30% in the second quarter, and the Fed can provide more support if necessary. The U.S. official data showed that existing home sales amounted to an annualized rate of 5.77 million units in February, higher than expected.

Later today, eyes will be on the U.K. and U.S. manufacturing figures, which have the potential to price action

Economic Events to Watch Today    


EUR/USD – Daily Analysis

This morning, EUR/USD fell 0.2% to 1.0673, following a 0.4% gain on Friday. Later today, the eurozone’s March Consumer Confidence Index (-14.0 expected) will be released. The EUR/USD pair may cross the strong resistance level if the risk-off market sentiment gets more worsens ahead. Eventually, it will likely fuel deeper losses in the greenback and may increase demand for the common currency.

The EUR/USD currency pair may come under pressure in the coming European session if the Eurozone and German preliminary Manufacturing PMIs for March ignore expectations. The data is expected to surprise on the lower side, in the wake of the coronavirus outbreak and may show investors how much economy is affected by the COVID-19 impact.

Looking forward, the traders will keep their eye on the Eurozone and German preliminary Manufacturing PMIs for taking fresh direction, and it will likely leave the impact on the pair movement ahead. As well as, the United States and Federal Reserve incomplete deal-related headlines also will be key to watch.

Daily Support and Resistance

  • S1 1.043
  • S2 1.0592
  • S3 1.0678

Pivot Point 1.0753

  • R1 1.0839
  • R2 1.0914
  • R3 1.1075

EUR/USD– Trading Tips

The EUR/USD traded bearishly as it as violated and closed below horizontal support becomes a resistance level of 1.0990. The EUR/USD is trading around 1.0750, and it’s forming a lower-lows pattern on the 4-hour chart, which mostly drives a continuation of a selling trend. 

Right now, the EUR/USD is trading at 1.0720, consolidating in a narrow trading range of 1.0817 – 1.0660. The EUR/USD is facing hurdles around 1.0817, and above this, the pair has the potential to target the next resistance level of 1.0930. While the EUR/USD has odds of staying bearish below 1.0920 to target 1.0805. On the daily chart, a violation of 1.0605 can extend the selling trend until 1.0550.


GBP/USD– Daily Analysis

The GBP/USD retreated 0.7% to 1.1557, after a 1.4% rally in the prior session. The GBP/USD pair slipped due to a stronger dollar after the U.S. official data showed that housing starts posted at an annualized rate of 1.599 million units in February (1.500 million units expected). The U.K.’s emergency coronavirus legislation will also reach the House of Lords for additional discussion before turning into the law some time by the end of the week.

However, the risk-sentiment continues to flash green with the U.S. ten-year treasury yields, S&P 500 Futures, and Asian stocks are all on their ways to recover the latest losses; while the headline Manufacturing and Services PMIs from the U.K. and the U.S. are likely to move into the contraction phase, with readings below 50.00. 

Looking forward, the traders will keep their eye on the Flash Manufacturing PMI and FPC Meeting Minutes for taking fresh direction. As well as, the United States and Federal Reserve incomplete deal-related headlines also will be key to watch.


Daily Support and Resistance

  • S1 1.105
  • S2 1.1318
  • S3 1.1456

Pivot Point 1.1586

  • R1 1.1724
  • R2 1.1853
  • R3 1.2121

GBP/USD– Trading Tip

On Tuesday, the GBP/USD continues to consolidate in a broad trading range of 1.1400 – 1.1885 as the trend of the market isn’t clear. On the higher side, the bullish breakout of the 1.1885 level can open the buying trend until the next resistance level of 1.2185 (38.2% Fibo level) and 1.2300 level, which markets 50% retracement while the pair has solid chances of bouncing off over 1.1450 level. 

A bearish breakout of 1.1425 level can lead the Cable towards the next support area of 1.1050. The MACD is tossing above and below zero as investors are unable to determine the trend of the market. 


USD/JPY – Daily Analysis

At the starting of Tuesday’s Asian session, the USD/JPY currency pair hit the bearish track. They dropped to an intra-day low of 110.10, representing 0.69% losses mainly due to broad-based greenback weakness after rising expectations of further delays in the US COVID-19 bill. The USD/JPY is trading at 110.53 and consolidates in the range between the 110.09 – 111.30. Moreover, the currency pair gave little attention to the preliminary readings of Japan’s Jibun Bank PMIs and continued its declining streak.

At the data front, the preliminary readings of March month Jibun Bank Manufacturing PMI dropped below 47.6 to 44.8 in March. Moreover, the Services index dropped from 46.8 before 32.7, the lowest since September 2007. After the U.S. Senators’ failure to receive the much-awaited coronavirus (COVID-19) package bill, U.S. President, Vice President and Treasury Secretary tried to confirm traders that the stimulus package will be agreed soon. Still, he did not succeed in hiding fears of further delays in the relief package. 

However, the report came that the Senate is not expected to vote on the Bill today too, and indicated further delays in President Trump’s ‘major’ response to the coronavirus.

On the positive side, the U.S. inflation expectations recovered slightly from the record low after the latest Federal Reserve statement that there is no limit to their Quantitative Easing program. 

Daily Support and Resistance    

  • S1 105.08
  • S2 107.59
  • S3 109.24

Pivot Point 110.1

  • R1 111.75
  • R2 112.61
  • R3 115.13

USD/JPY – Trading Tips

The USD/JPY pair has shown a slight bearish movement, falling from 110.65 level to 109.580. On the 4 hour chart, the USD/JPY has formed a bullish channel that is still intact, and it’s pretty much likely to support the USD/JPY prices around 109.650. 

A bearish breakout of 109.600 level can lead the USD/JPY prices towards the next support level of 108.350, and around this level, we can expect USD/JPY to bounce off again. Conversely, the pair faces resistance around 111 and 112.190 today. Let’s stay bullish above 109.650 and bearish below the same level today. 

All the best for today!  

Categories
Forex Market Analysis

EUR/USD on a Bullish Run – Is It Going After 1.085?

The EUR/USD pair is trading with a bullish bias, bouncing off above 1.0640 level to trade at 1.0770 on the daily timeframe. Technically, the EUR/USD pair seems ready to show a bullish correction until 1.0990, but we can’t take the risk of holding swing trade considering the volatile nature of the market these days. 

So it’s better to open quick forex trading signals for 40/50 pips and then take profit to enter the next trade. Well, with that being said, I have opened a buying trade in the EUR/USD at 1.07839 with a stop loss of 1.07439 and a take profit of 1.08239. 


EUR/USD – Daily Technical Levels

Support Resistance 

1.0615     1.0809

1.0529     1.0917

1.0335     1.1111

Pivot Point 1.0723

On the daily chart, the EUR/USD’s MACD is holding in the oversold zone, suggesting strong bullish correction chances. Alongside this, the EUR/USD pair has also formed a Doji candle around 1.0700, which is followed by a strong bearish trend. 

Such a pattern shows indecision among traders and typically drives bullish reversals in the market. The EUR/USD may find support around 1.0700, while resistance is likely to be found around 1.0900 and 1.099 today.

EUR/USD Trading Signal

Entry Price:  1.07839

Stop Loss: 1.07439

Take Profit 1.08239

R/R Ratio 1:1

Good luck! 

Categories
Forex Market Analysis

Daily F.X. Analysis, March 23 – Top Trade Setups In Forex – Fundamentals Side Remains Light! 

During Asian trading hours Monday, the ICE U.S. Dollar Index regained strength at 102.81, while U.S. stock futures hit daily downside limits. Federal Reserve Bank of St. Louis President James Bullard said U.S. jobless rate might soar to 30% in the second quarter, and the Fed can provide more support if necessary.

Later in the day, the European Commission will release the eurozone’s March Consumer Confidence Index (-14.0 expected). In the U.S., the Federal Reserve Bank of Chicago will post February National Activity Index (-0.29 expected).

Economic Events to Watch Today    


EUR/USD – Daily Analysis

This morning, EUR/USD fell 0.2% to 1.0673, following a 0.4% gain on Friday. Later today, the eurozone’s March Consumer Confidence Index (-14.0 expected) will be released. The German IFO Business Climate Index dropped to 87.7 in March (88.0 expected) from 96.0 in February.

Moving on, the greenback may come under pressure and may allow EUR/USD to extend the recovery seen in the Asian session if the risk market further recovers in the European trading hour ahead. After the announcement of stimulus, the ECB President Christine Lagarde showed a willingness to use all essential tools to stop the negative impacts of the deadly virus. 

Moving on, the EUR/USD pair may cross the strong resistance level if the risk-off market sentiment gets more worsens ahead. Eventually, it will likely fuel deeper losses in the greenback and may increase demand for the common currency.

The economic calendar is light today with the German Bundesbank’s monthly report is scheduled to release during the European trading session. Therefore, the traders may also take cues from the Eurozone Consumer Confidence for March and the Chicago Fed National Activity Index for February for new directions.

Daily Support and Resistance

  • S1 1.0335
  • S2 1.0529
  • S3 1.0615

Pivot Point 1.0723

  • R1 1.0809
  • R2 1.0917
  • R3 1.1111

EUR/USD– Trading Tips

On Monday, the major currency pair EUR/USD traded bearishly as it as violated and closed below horizontal support becomes a resistance level of 1.0990. The EUR/USD is trading around 1.0750, and it’s forming a lower-lows pattern on the 4-hour chart, which mostly drives a continuation of a selling trend. 

Right now, the EUR/USD is trading at 1.0720, consolidating in a narrow trading range of 1.0817 – 1.0660. The EUR/USD is facing hurdles around 1.0817, and above this, the pair has the potential to target the next resistance level of 1.0930. 

While the EUR/USD has odds of staying bearish below 1.0920 to target 1.0805. On the daily chart, a violation of 1.0605 can extend the selling trend until 1.0550.


GBP/USD– Daily Analysis

The GBP/USD retreated 0.7% to 1.1557, after a 1.4% rally in the prior session. During the previous week, the Bank of England lowered its benchmark rate by 15 basis points to 0.10%. It announced that it would increase its holdings of U.K. government bonds and sterling non-financial investment-grade corporate bonds by GBP200 billion, to counter the economic shock caused by the coronavirus.

The GBP/USD pair slipped due to a stronger dollar after the U.S. official data showed that housing starts posted at an annualized rate of 1.599 million units in February (1.500 million units expected).

On the other hand, the U.S. Senate’s failure to pass the much-awaited COVID-19 Bill sent the Treasury yields and Asian stocks down. Apart from this, the conference by the G20 Finance Ministers may also offer some intermediate clues, and it will be key to watch. In contrast, the US Chicago Fed National Activity may also give some meaningful inspiration.

The PM’s Chief adviser Dominic Cummings faced criticism about supporting herd immunity. Therefore any progress in the story could also entertain the GBP/USD traders. 

Daily Support and Resistance

  • S1 1.0953
  • S2 1.1333
  • S3 1.1492

Pivot Point 1.1713

  • R1 1.1872
  • R2 1.2094
  • R3 1.2474

GBP/USD– Trading Tip

On Monday, the GBP/USD prices are consolidating in a broad trading range of 1.1400 – 1.1885. Yet, the trend of the market isn’t clear as investors are waiting for a solid fundamental to drive further movement in the market. On the higher side, the bullish breakout of the 1.1885 level can open the buying trend until the next resistance level of 1.2185 (38.2% Fibo level) and 1.2300 level, which markets 50% retracement while the pair has solid chances of bouncing off over 1.1450 level. A bearish breakout of 1.1425 level can lead the Cable towards the next support area of 1.1050. The MACD is tossing above and below zero as investors are unable to determine the trend of the market. 


USD/JPY – Daily Analysis

During the early Asian session, the USD/JPY currency pair flashing red and dropped below the 110 marks, representing 0.73% losses on the day mainly due to the U.S. Senate’s failure to pass the much-awaited COVID-19 Bill triggered the strong risk-off market sentiment. 

The Japanese yen is now finding bids as a safe-haven demand has sent the USD/JPY pair lower. The USD/JPY is trading at 110.08 right now, and it continues to consolidate in the range between the 109.67 – 111.260. However, the USD/JPY was initially trading near 111.25 on Friday, due to broad-based USD strength.

Despite positive signals from U.S. President Donald Trump, the Senate declined to pass the much-awaited incentive to control the deadly virus impact. This news initially sent the U.S. equity futures to the limit down.

The President of the Federal Reserve Bank of Minneapolis, Neel Kashkari, followed the role of St. Louis Federal Reserve President James Bullard, who expected the 2nd-quarter (Q2) GDP to decrease by 50% and the increase in Unemployment Rate to 30%. Meanwhile, the Minneapolis head mentioning that the Fed has unlimited cash to support the financial system. As a result, they are trying to support the U.S. dollar.

On the other hand, the coronavirus (COVID-19) fears continue to increase because numbers of the death toll from the U.S. and Italy rising day by day. The 36 cases reported in New Zealand, which is currently taking the market’s attention. Lastly, Japanese media signaled that the Asian countries might soon ban entries of U.S. travelers.

Daily Support and Resistance    

  • S1 105.08
  • S2 107.59
  • S3 109.24

Pivot Point 110.1

  • R1 111.75
  • R2 112.61
  • R3 115.13

USD/JPY – Trading Tips

On Monday, the USD/JPY pair has shown a slight bearish movement, falling from 110.65 level to 109.580. On the 4 hour chart, the USD/JPY has formed a bullish channel that is still intact, and it’s pretty much likely to support the USD/JPY prices around 109.650. 

A bearish breakout of 109.600 level can lead the USD/JPY prices towards the next support level of 108.350, and around this level, we can expect USD/JPY to bounce off again. Conversely, the pair faces resistance around 111 and 112.190 today. Let’s stay bullish above 109.650 and bearish below the same level today. 

All the best for today!  

Categories
Forex Market Analysis

Daily F.X. Analysis, March 20– Top Trade Setups In Forex – Stronger Dollar In Play! 

The U.S. dollar strengthened further as other major central banks eased their monetary policies. The ICE Dollar Index jumped 1.8% on the day to 102.94, posting a three-day rally to the strongest level since Jan. 2017.

Later today, the European Central Bank will post January’s current account balance. The German Federal Statistical Office will report February PPI (+0.2% on-year expected).

The U.K. Office for National Statistics will release February public sector net borrowing, excluding banking groups (0.8 billion pounds expected).

Economic Events to Watch Today    


EUR/USD – Daily Analysis

EUR/USD plunged 2.6% to 1.0662, the lowest level since April 2017. The German IFO Business Climate Index dropped to 87.7 in March (88.0 expected) from 96.0 in February.

Moving on, the greenback may come under pressure and may allow EUR/USD to extend the recovery seen in the Asian session if the risk market further recovers in the European trading hour ahead. After the announcement of stimulus, the ECB President Christine Lagarde showed a willingness to use all essential tools to stop the negative impacts of the deadly virus. 

European stocks returned to positive territory, with the Stoxx Europe 600 Index gaining 2.9%. Germany’s DAX rebounded 2.0%, France’s CAC rose 2.7%, and the U.K.’s FTSE 100 was up 1.4%. A slight improvement in the stocks is also driving the bullish movement in the EUro. 

At the press time, the EUR/USD currency pair turned lower from 1.0980 to below 1.08 due to the strong haven bid around the dollar rose, producing significant gains for the greenback against the bucket of currencies. At the data front, all trader’s eyes on Germany’s Producer Price Index for February and the Eurozone Current Account data for January. Apart from this, the U.S. will release Existing Home Sales for February at 14:00 GMT. 

Daily Support and Resistance

  • S1 1.0434
  • S2 1.0677
  • S3 1.0795

Pivot Point 1.092

  • R1 1.1038
  • R2 1.1163
  • R3 1.1406

EUR/USD– Trading Tips

Lately, the currency pair EUR/USD traded bearishly as it as violated and closed below horizontal support becomes a resistance level of 1.0990. The EUR/USD is currently trading around 1.0750, and it’s forming a lower-lows pattern on the 4-hour chart, which mostly drives a continuation of a selling trend. 

At the moment, the EUR/USD is trading at 1.0750, essentially taking a bullish retracement. The EUR/USD is expected to find a hurdle around 1.0820, and above this, the pair has the potential to target the next resistance level of 1.0930. While the EUR/USD has robust odds of lingering bearish below 1.0920 to target 1.0805. On the daily chart, a violation of 1.0605 can extend the selling trend until 1.0550.


GBP/USD– Daily Analysis

The GBP/USD dipped 0.9% to 1.1499, down for an eighth straight session. The Bank of England lowered its benchmark rate by 15 basis points to 0.10% and announced that it would increase its holdings of U.K. government bonds and sterling non-financial investment-grade corporate bonds by GBP200 billion, to counter the economic shock caused by the coronavirus.

The GBP/USD pair slipped due to a stronger dollar after the U.S. official data showed that housing starts posted at an annualized rate of 1.599 million units in February (1.500 million units expected).

The Coronavirus cases rose from 643 to 3,269 during the last 24 hours in the U.K., but the separation of U.K.e Brexit Chief David Frost got major attention. The reason being his counterpart in the European Union (E.U.), Michel Barnier, also E.U.cing the flu-like deadly disease. As in result, it puts a question mark on the further Brexit talks.

As in result, the Asian stocks follow the foot-steps of Wall Street’s recovery, whereas the U.S. ten-year treasury yieldU.S.also rise to 1.158% by the press time. Due to the lack of major data, investors will keep their eyes on the coronavirus headlines.

Daily Support and Resistance

  • S1 1.0821
  • S2 1.1191
  • S3 1.1328

Pivot Point 1.1561

  • R1 1.1698
  • R2 1.1931
  • R3 1.2301

GBP/USD– Trading Tip

The GBP/USD is finally recovering a bit in the wake of bullish correction and trades around 1.1850. The pair continues to drop for a second consecutive week but seems to close a candle a bit higher this time. On the weekly timeframe, the GBP/USD pair has violated the descending triangle pattern, which supports it around the 1.2030 level. Below the 1.2030 level, the GBP/USD has expected to drop further until the next support level of 1.1245. Since the market was oversold, traders have entered buying to take profit before the weekends. As forecasted, we see bullish correction above 1.1245 level until 1.1885 or 1.2045 level, but then again, chances of selling will remain strong. 

USD/JPY – Daily Analysis

Today in the early Asian session, the USD/JPY currency pair flashing red and turned from the one-month high set earlier. However, the currency pair failed to maintain its early Asian session’s gains and dropped to 109.300 from the high of 111.35, mainly due to the long U.S. Dollar bearish sentiment. As of writing, the USD/JPY currency pairs currently trading at 109.67 and consolidates in the range between the 109.33 – 111.36.

A strong effort by central banks across the world to quiet investor’s moods and decrease fears about the global recession sent the USD lower on the last trading day of the week and was seen as one of the key factors behind the pair’s ongoing corrective drop.

Meanwhile, the losses seemed unaffected by a strong recovery in the global risk sentiment, which seems to weaken the Japanese yen’s safe-haven demand. Investors’ looking for perceived riskier assets due to a positive mood in the equity.

Daily Support and Resistance    

  • S1 105.08
  • S2 107.59
  • S3 109.24

Pivot Point 110.1

  • R1 111.75
  • R2 112.61
  • R3 115.13

USD/JPY – Trading Tips

On Friday, the safe-haven currency pair is trading above 108.400, the previously violated the double top resistance level of 107.950, and closing of candles above this level may drive further buying in the pair. On the 4 hour timeframe, the USD/JPY is trading within an upward channel, which is likely to drive further buying in the pair. 

On Friday, we may see USD/JPY finding support at 108.100 level, and above this, the chances of buying remain stable until the next resistance level of 110. Let’s stay bullish above 108.850 today. 

All the best for today!  
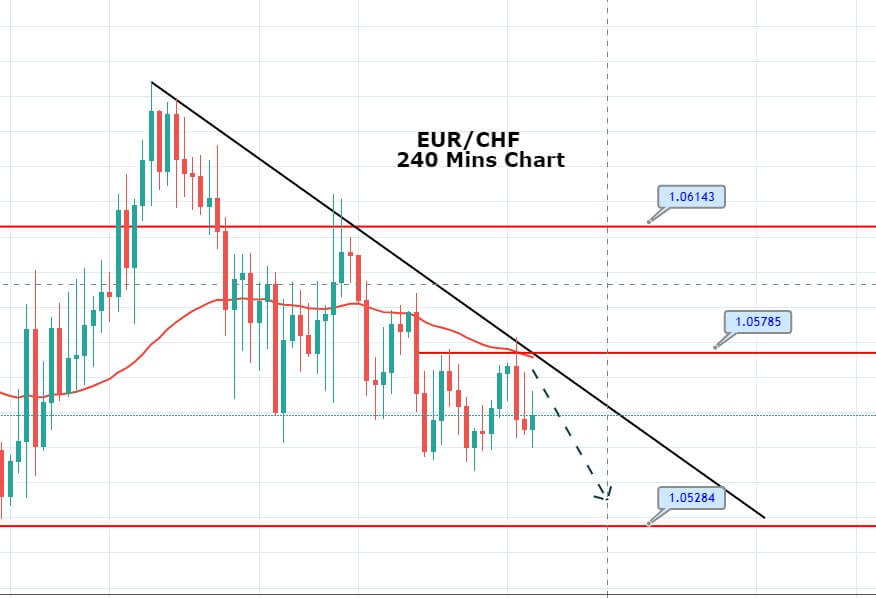
Categories
Forex Market Analysis

Crude Oil’s Bearish Bias Stays Strong – Quick Technical Outlook 

The WTI crude oil has dropped to the weekly support level of 20, before bouncing off to trade at 23.94. Despite the small recovery in oil prices, analysts continue to give a warning about the coronavirus negative impact on the global market because the cases continue to rise and death losses as well. 

Moreover, the continuing price war between producers Saudi Arabia and Russia is also not showing any ending probability, despite Russian hints at a preference for higher prices on Wednesday, as per the latest report. Whereas, the recently positive inventory numbers from the US failed to give any good signals to the buyers.

At the USD front, the greenback continues to flashing green and remains as the market favorite, mainly due to its safe-haven currency status. On the other hand, the moves offer unstable trading sessions due to the downbeat performances of the Asian stocks. A stronger dollar is also placing a bearish bias on the WTI prices due to it’s negative correlation. 

Investors will keep their eyes on the coronavirus headlines since the global struggles to control the pandemic. It should also be noted that the fears of the deadly virus continue to weigh on the markets’ risk-tone, but the US equity futures have recovered off-late after the ECB’s announcement. Eventually, the demand for crude oil is suffering. 


Support Resistance
19.75 26.79
16.61 30.7
9.57 37.74
Pivot Point 23.66

On the technical front, the WTI prices are likely to find support around 20. and 13, while the resistance stays around 26. The MACD and RSI are suggesting a sharp selling trend in the oil, especially after it has closed three black crows pattern on the weekly timeframe, which is making it a big deal. Let’s consider staying bearish below 26 and bullish above 20 today. Good luck! 

Categories
Forex Market Analysis

Daily F.X. Analysis, March 19 – Top Trade Setups In Forex – Trump Set to Speak on Coronavirus! 

On the forex front, the ICE U.S. Dollar Index surged 1.3% on the day to 100.91, the highest level since April 2017. The U.S. Labor Department will release initial jobless claims in the week ended March 14 (220,000 expected).

The U.S. official data showed that housing starts posted at an annualized rate of 1.599 million units in February (1.500 million units expected).

Later today, initial jobless claims for the week ended March 14 (220,000 expected), and the Conference Board Leading Index for February (+0.1% on month expected) will be reported. The Commerce Department will report 4Q current account balance (108.5 billion dollars deficit expected). The Philadelphia Federal Reserve will post its Business Outlook Index for March (9.0 expected).

The U.S. dollar strengthened versus its major peers, with the ICE Dollar Index jumping 1.3% to a three-week high of 99.38. Later in the day, the European Commission will post final readings of February CPI (+1.2% on-year expected) and January trade balance (19.2 billion euros surplus expected).

During the U.S. session, the eyes will be on the U.S. Commerce Department, which is due to report February housing starts (1.5 million units expected) and building permits (1.5 million units expected).

Economic Events to Watch Today    


EUR/USD – Daily Analysis

The EUR/USD marked a day-low of 1.0802 before rebounding to close at 1.0962, down 0.3%. The European Central Bank announced a 750 billion-euro bond-buying program to counter the coronavirus impacts. ECB President Christine Lagarde said, “there are no limits” to their commitment to the euro.

The Trump administration announced that Trump administration is planning to give checks directly to Americans in the shape of a $1 trillion stimulus program. Moving ahead, the EUR/USD currency pair may return and possibly break below Tuesday’s low of 1.0955 if the stocks cheer the substantial monetary and fiscal stimulus.

After the announcement of stimulus, the ECB President Christine Lagarde showed a willingness to use all important tools to stop the negative impacts of the deadly virus. At the press time, the EUR/USD currency pair turned lower from 1.0980 to below 1.08 due to the strong haven bid around the dollar rose, producing big gains for the greenback against the bucket of currencies.

Daily Support and Resistance

  • S1 1.0434
  • S2 1.0677
  • S3 1.0795

Pivot Point 1.092

  • R1 1.1038
  • R2 1.1163
  • R3 1.1406

EUR/USD– Trading Tips

On Thursday, the major currency pair EUR/USD continues to trade bearish as it as violated and closed below horizontal support becomes a resistance level of 1.0990. The EUR/USD is currently trading around 1.0970, and it’s forming a lower-lows pattern on the 4-hour chart, which mostly drives a continuation of a selling trend. 

At the moment, the EUR/USD is trading at 1.0890, essentially following the bearish bias. The EUR/USD is expected to find a hurdle around 1.0920, and beyond this, the pair has the potential to target the next resistance level of 1.1030. While the EUR/USD has robust odds of lingering bearish below 1.0920 to target 1.0805. On the daily chart, a violation of 1.0805 can extend the selling trend until 1.0670.


GBP/USD– Daily Analysis

The GBP/USD plunged 3.5% to 1.1633, the weakest level since 1985, as U.K. Prime Minister Boris Johnson’s response to the coronavirus pandemic failed to convince investors. 

The GBP/USD pair slipped due to a stronger dollar after the U.S. official data showed that housing starts posted at an annualized rate of 1.599 million units in February (1.500 million units expected).

As per the latest report, the death losses rose to 99 on Wednesday vs. Tuesday’s 67, reporting a 48% jump. As of March 18, 2,626 people in the United Kingdom were tested for coronavirus. The test numbers have been increasing from just over 1,000 a day at the end of February, when testing started, to more than 6,000 per day by mid-March.

Looking forward, the investors will now keep their eyes on the global measures to control the negative impacts of the virus for taking the near-term direction. However, the greenback may keep benefiting from the same due to its safe-haven status.

Daily Support and Resistance

  • S1 1.038
  • S2 1.1049
  • S3 1.1316

Pivot Point 1.1718

  • R1 1.1986
  • R2 1.2388
  • R3 1.3057

GBP/USD– Trading Tip

The GBP/USD continues to encounter bloodshed in the wake stronger dollar and weakness in the GBP. The direct currency pair continues to drop for a second consecutive week, and so far, it’s has traded bearishly from 1.3000 level to 1.1540 level just in two weeks. 

On the weekly timeframe, the GBP/USD pair has violated the descending triangle pattern, which supports it around the 1.2030 level. Below the 1.2030 level, the GBP/USD is expected to drop further until the next support level of 1.1245. Since the market is oversold, traders may see a bullish correction above 1.1245 level until 1.1885 or 1.2045 level, but then again, chances of selling will remain strong. 


USD/JPY – Daily Analysis

The USD/JPY extended its rally for a second straight session, climbing 0.6% to 108.38. During the Asian session, the USD/JPY currency pair hit the session high of 109.06 before the time of writing, representing 0.70% gains and continued its 3-day bullish streak near above the 108.50 after the latest downbeat data from Japan. As well as, broad-based USD strength also keeps the pair bullish. At the time of writing, the USD/JPY currency pair is currently trading at 108.86 and consolidates in the range between the 107.89 – 109.55.

At the data front, Japan’s National Consumer Price Index (CPI) came in below 0.8% forecast on MoM to 0.4%, whereas the CPI ex Food, Energy (YoY) slipped beneath 0.9% expectations to 0.6% for February.

Following the data, the BOJ minutes for the January monthly meeting announced further support for the Japanese central bank’s Quantitative Easing (Q.E.). As in result, the Japanese yen got another burden to carry, as the Japanese press pushes for government stimulus, which in turn offered additional support to the USD/JPY pair.

Daily Support and Resistance

  • S1 104.02
  • S2 105.92
  • S3 107

Pivot Point 107.83

  • R1 108.9
  • R2 109.73
  • R3 111.63

USD/JPY – Trading Tips

The stronger U.S. dollar has also driven the bullish trend in the USD/JPY currency pair, and it’s currently trading over 109. The indirect currency pair has also violated the double top resistance level of 107.950, and closing of candles above this level may drive further buying in the pair. 

On the 4 hour timeframe, the USD/JPY is still trading within an upward channel, which is likely to drive further buying in the pair. Therefore, the pair may find support at 108.100 level, and above this, the chances of buying remain strong until the next resistance level of 110. Let’s stay bullish above 108.250 today. 

All the best for today!  

Categories
Forex Market Analysis

Daily FX. Analysis, March 18 – Top Trade Setups In Forex – Inflation Figures Under the Spotlight! 

The US dollar strengthened against its major peers, with the ICE Dollar Index jumping 1.3% to a three-week high of 99.38. Later in the day, the European Commission will post final readings of February CPI (+1.2% on-year expected) and January trade balance (19.2 billion euros surplus expected).

During the US session, the eyes will be on the US Commerce Department, which is due to report February housing starts (1.5 million units expected) and building permits (1.5 million units expected).

Economic Events to Watch Today    


EUR/USD – Daily Analysis

The EUR/USD plunged from 1.5% to 1.1015. The ZEW German Current Situation Index dropped to -43.0 in March (-30.0 estimated) from -15.7 in February and Expectations Index dipped to -49.5 (-30.0 expected) from 8.7. It is worth to mention that the Eurozone’s powerhouse Germany has closed all borders, schools, public places, and unnecessary shops in the wake of intensifying coronavirus. As a result, the continuous decline in the economy could take the speed in the near term, which may add bearish pressures around the EUR.

Looking forward, the traders will keep their eyes on the broader market sentiment. If the global equities flash red, the USD will likely find buyers. At press time, the futures on the S&P 500 are reporting a 3 % decline.

The Federal Reserve and other major central banks have recently delivered rate cuts to ease the economic shock of the coronavirus pandemic. Meanwhile, the Fed has also launched a quantitative easing program worth $700 billion. Other major central banks have also played roles by cutting rates. 

The Trump administration announced on Tuesday that Trump administration is planning to give checks directly to Americans in the shape of a $1 trillion stimulus program. Moving ahead, the EUR/USD currency pair may return and possibly break below Tuesday’s low of 1.0955 if the stocks cheer the heavy monetary and fiscal stimulus.

Daily Support and Resistance

  • S1 1.0882
  • S2 1.1024
  • S3 1.1096

Pivot Point 1.1166

  • R1 1.1239
  • R2 1.1309
  • R3 1.1451

EUR/USD– Trading Tips

On Wednesday, the major currency pair EUR/USD continues to trade mostly lower after violating the horizontal support level pf 1.1095. The EUR/USD is currently trading around 1.0970, and it’s forming a lower-lows pattern on the 4-hour chart, which mostly drives a continuation of a selling trend. 

On the lower side, a continuation of a bearish bias can extend sell-off until 1.0920 and 1.0865. While the bullish breakout of 1.1096 can drive more buying until 1.1240 area. Consider staying bearish below 1.0970 today. 


GBP/USD– Daily Analysis

The GBP/USD sank 1.2% to 1.2118. Official data showed that the UK jobless rate for the three months to January climbed to 3.9% (steady at 3.8% expected). The US continues to struggle from every level, as well as the Federal Reserve, also doing the same to make sure that the world’s largest economy doesn’t getting infected due to the deadly virus. 

At the USD front, the greenback got support from the moves on Tuesday; the early-day decline could have taken clues from US Treasury Secretary Steve Mnuchin that the lack of action could send the Unemployment Rate to 20%.

Later today, the US Commerce Department will report February housing starts (1.5 million units expected) and building permits (1.5 million units expected), which may help determine further trends in the GBP/USD pair.  

The investors will keep their eyes on virus headlines and take clues from the coronavirus relating headlines while the US Senate voting on President Donald Trump’s major stimulus plan as well as the UK PM’s action will be essential to watch. 

Daily Support and Resistance

  • S1 1.1938
  • S2 1.211
  • S3 1.2189

Pivot Point 1.2282

  • R1 1.2362
  • R2 1.2454
  • R3 1.2626

GBP/USD– Trading Tip

A day before, the GBP/USD fell sharply to trade around 1.2060 level and has closed a bearish engulfing candle followed by Doji candles. It’s suggesting the odds of more selling in the market. The Cable has immediate support around 1.2170 level, and above this, the Cable can extend the continuation of a bullish bias until 1.1980 level and 1.1805. The MACD is consistently forming bearish histograms below zero, supporting the selling trend in the GBP/USD pair, which is why we should consider selling below 1.2100 today to target 1.1985 at first.  


USD/JPY – Daily Analysis

The USD/JPY rebounded 1.4% to 107.35. The USD/JPY currency pair dropped below the 107.00 and hit the fresh session lows in the last hours, mainly due to fresh risk catalysts boosted the safe-haven demand. As of writing, the USD/JPY currency pair is currently trading at 107.17 and consolidates in the range between the 106.77 – 107.72. However, the currency pair trading bearish despite the Fed’s continued action mode and downbeat comments from the US policymakers as well as doubt between Japanese firms.

As we know, the currency pair failed to continue its previous day’s strong intraday positive move of over 200 pips and faced some fresh supply during the Asian session on Wednesday, mainly due to improving demand for traditional safe-haven assets.

Despite organized struggles by global central banks and many government stimulus measures to balance the negative economic impact from the coronavirus pandemic, the fears of an expected global slowdown continued losing the investor’s confidence. 

It should be noted that the major reason behind the pair’s decline is the benefitted Japanese yen, which got support as perceived safe-haven status and turned out to be one of the key factors that leave some fresh downward pressure on the pair.

Daily Support and Resistance    

  • S1 101.97
  • S2 104.1
  • S3 105.19

Pivot Point 106.23

  • R1 107.32
  • R2 108.37
  • R3 110.5

USD/JPY – Trading Tips

The USD/JPY is trading at 107.800 and continues to face double top resistance around 108.065. Below this, the USD/JPY is exhibiting a correction which is likely to lead the USD/JPY prices towards 105.960. Closing of 4-hour candle above this level has confirmed the chances of further buying in the pair until 108. Whereas, below 105.950, we may see further selling until 103.750. On the leading indicator’s front, the USD/JPY is in a bullish mode, and we should consider buying trades over 105. All the best for today!  

Categories
Forex Market Analysis

WTI Crude Oil Slips Below $29- Coronavirus Outbreak Weights! 

The WTI crude oil prices flashing red falling from $30 to $28.70 in the wake of the coronavirus outbreak and uncertainties encompassing the price war between Saudi Arabia and Russia.

Improvements in the oil prices were limited today as new nations have announced COVID-19 lockdowns. Airlines are decreasing the number of regular flights because of increased numbers of cases and countries declaring quarantines to combat the new coronavirus. Canada and Malaysia are the two most recent countries to ban arrivals and close their borders.

The U.S. President Donald Trump said overnight that economic interruptions from the spread of the coronavirus and stimulus measures taken against it could start to a recession.

On the other hand, the ongoing price war between Saudi Arabia and Russia, two of the world’s biggest oil producers, also limits the oil price gains. Saudi Arabia’s Saudi Aramco threw down the gauntlet, with Chief Executive Officer Amin Nassar informing investors that the company is “very comfortable with oil prices below $30 a barrel”.  

Meanwhile, the group has decided to produce at maximum capacity of 12 million barrels a day next month, and there are no changes forecast for May. Consequently, crude oil prices are trading with a selling bias today.

Daily Support and Resistance

  • S1 23.34
  • S2 26.59
  • S3 27.96

Pivot Point 29.84

  • R1 31.21
  • R2 33.08
  • R3 36.33

On the technical side, crude oil seems to have formed a descending triangle pattern, which is likely to support crude oil around 27.70. Above this, the oil prices may trade bullish until 30 and 32.50. However, the bearish breakout of 27.70 can lead the WTI prices towards 25.65 and 23.85. Let’s consider staying bearish below $28.95. Good luck!  

Categories
Forex Market Analysis

Daily F.X. Analysis, March 17 – Top Trade Setups In Forex – Eyes on U.S. Retail Sales 

On the forex front, the U.S. dollar encountered a volatile trading session, with the ICE U.S. Dollar Index dropping 0.8% to 98.00. ZEW survey results in March will be released for Germany (current situation at -30.0, expectations at -27.2 expected) and the eurozone. The U.K. Office for National Statistics will publish a jobless rate for the three months to January (steady at 3.8% expected).

The U.S. Commerce Department will post February retail sales (+0.2% on month expected) and January business inventories (-0.1% on month expected). The Federal Reserve will release February industrial production (+0.4% on month expected) and capacity utilization (77.1% expected). The Labor Department will report JOLTS job openings for January (6.40M expected). The National Association of Home Builders will publish March Housing Market Index (74 expected).

Economic Events to Watch Today    


EUR/USD – Daily Analysis

EUR/USD rose 0.5% to 1.1160. Later today, the ZEW German Current Situation Index for March will be released (-30.0 estimated). The ZEW survey results in March will be released for Germany (current situation at -30.0, expectations at -27.2 expected) and the eurozone.

European stocks returned to negative territory, with the Stoxx Europe 600 Index losing 4.9%. Germany’s DAX dropped 5.3%, France’s CAC lost 5.8%, and the U.K.’s U.K.’sU.K.’s U.K.’s FTSE 100 fell 4.0%. Meanwhile, the European Union proposed a 30-day travel ban on non-essential travel for the whole of the union region.

Whereas, the broad market recession fears continue to increase the progress into the U.S. bonds, which translates into lower returns on the bonds, ultimately keep the greenback under pressure. The U.S. dollar index trades around 98.25, down 0.50% on the day, having stopped its recovery just shy of 98.50. 

Meanwhile, Treasury Secretary Steven Mnuchin said after a meeting with Senate Republicans that he was trying to attempt a significant stimulus package expected to support the economy due to the coronavirus outbreak. Looking forward, the focus will be on the German Zew Survey for March, which is scheduled to release at 10:00 GMT. During the American session, the spotlight will be on the U.S. Retail Sales, which is due at 12:30 GMT. 

Daily Support and Resistance

  • S1 1.0882
  • S2 1.1024
  • S3 1.1096

Pivot Point 1.1166

  • R1 1.1238
  • R2 1.1309
  • R3 1.1451

EUR/USD– Trading Tips

The EUR/USD has traded mostly lower, bouncing off the double bottom support level of 1.1095 level. The EUR/USD is currently trading around 1.1165, and it’s forming a lower-lows pattern on the 4-hour chart, which mostly drives a continuation of a selling trend. On the lower side, a continuation of a bearish bias can extend sell-off until 1.1100 and 1.1095. While the bullish breakout of 1.1350 can drive more buying until 1.1454 area. Consider staying bullish over 1.1182 and bearish below the same level today. 


GBP/USD– Daily Analysis

The GBP/USD marked a day-high of 1.2431 before retreating to close at 1.2268, broadly flat compared with the prior session. Investors will focus on the latest official jobs report due later in the day (jobless rate steady at 3.8% expected). For now, eyes will be on the U.K. Office for National Statistics as it will report a jobless rate for the three months to January (steady at 3.8% expected).

Market’s risk-tone seems to recover after the fresh stimulus from New Zealand and extended bond-buying from the BOJ. Also, supporting the risk recovery could be comments from Japan to coordinate with China and South Korea to tackle the pandemic. As in result, the U.S. ten-year treasury yields increase five basis points (bps) to 0.775%, whereas stocks in Asia also mark mild gains by the press time.

As we all know that the economic calendar is also active during the day ahead, markets will pay more attention to the COVID-19 headlines and the global struggles to stop the pandemic.

Daily Support and Resistance

  • S1 1.1938
  • S2 1.211
  • S3 1.2189

Pivot Point 1.2282

  • R1 1.2362
  • R2 1.2454
  • R3 1.2626

GBP/USD– Trading Tip

The GBP/USD fell sharply to trade around 1.2260 level and has closed a Doji candle followed by strong selling candles. The Cable has immediate support around 1.2170 level, and above this, the Cable can extend the continuation of a bullish bias until 1.2290 level and 1.2325.  

The MACD is consistently forming bearish histograms below zero, supporting the selling trend in the GBP/USD pair, which is why we should consider selling below 1.2282 today. Recently, the GBP/USD has closed a bullish candle that can drive buying in the GBP/USD, and it may lead its prices higher towards 1.2425 level. 


USD/JPY – Daily Analysis

The USD/JPY marked a day-low of 105.12 before closing at 106.25, down 1.5% on the day. The Bank of Japan kept its benchmark rate unchanged while doubling its target for the net purchase of ETFs to 12 trillion yen.

The USD/JPY currency pair are flashing green and trading above the mid-106.00 level, mainly due to the risk sentiment improved in the market. While the pair remain struggling to find acceptance above the 107.00, at the press time, the USD/JPY is trading at 106.86 and consolidates in the range between the 105.86 – 107.17.

The currency pair succeeded in recovering some positive traction on Tuesday and built on the overnight late bounce from the region of the key 105.00 psychological marks after a combination of supporting factors.

Notably, the moderate recovery in the global risk sentiment, as represented by positive sentiment in the equity markets, weakened the Japanese yen’s safe-haven demand and gave some support to the pair.

A hard struggle by major central banks to stop any negative impact from the coronavirus pandemic improved to boost investors’ confidence and turned the equity market positive.

The reason behind the risk-on sentiment could also be the goodish bounce in the U.S. Treasury bond yields, which improved the U.S. dollar demand and further added to the pair’s modest uptick.

Daily Support and Resistance

  • S1 99.26
  • S2 102
  • S3 103.37

Pivot Point 104.74

  • R1 106.11
  • R2 107.47
  • R3 110.21

USD/JPY – Trading Tips

The USD/JPY is trading at 107.800 and has already completed a 61.8% Fibonacci retracement level at 108.065. Below this, the USD/JPY is exhibiting a correction which is likely to lead the USD/JPY prices towards 105.960. Closing of 4-hour candle above this level has confirmed the chances of further buying in the pair until 108. Whereas, below 105.950, we may see further selling until 103.750. On the leading indicator’s front, the USD/JPY is in a bullish mode, and we should consider buying trades over 105. All the best for today!  

Categories
Forex Market Analysis

WTI Crude Oil Slips Beneath $29 as Coronavirus Outbreaks Further! 

Crude oil prices fell sharply to trade below $29 after showing a slight bullish recovery during the previous week. Crude oil prices benefited from President Trump’s saying that his government is to buy large quantities of crude oil for the Strategic Petroleum Reserve to take advantage of lower oil prices. Nymex crude oil futures rose 2.8% to $31.87 a barrel, and Brent rebounded 4.3% to $34.07.

Over the weekend, the global coronavirus pandemic worsened, particularly in Europe. Italy saw the number of coronavirus cases surge past 24,700 (1809 deaths), while Spain reported over 7,800 cases in total, Germany over 5,800 cases and France over 5,400 cases. In the U.S., the number of cases jumped to nearly 3,600 (68 deaths).

The RBA indicated that it would purchase bonds while holding a special meeting on Thursday. Whereas, RBNZ finally also joined the role of major central bankers that offered major rate cuts in order to control the coronavirus (COVID-19). 

China’s National Bureau of Statistics (NBS) said that China’s economy continues to stabilize despite the impact of coronavirus. The comments came after January-February month Retail Sales and Industrial Production disappointed markets. As in result, the risk-tone remains under pressure with the U.S. ten-year treasury yields decreased around 0.673% while stocks in Asia register mild losses due to pandemic fears.

Moving forward, traders will keep their eyes on central banker’s moves and announcements/surprises for near-term trade direction. On the other hand, coronavirus headlines will also be essential to watch.

Daily Support and Resistance

  • S1 26.84
  • S2 29.16
  • S3 30.25

Pivot Point 31.49

  • R1 32.57
  • R2 33.81
  • R3 36.13

On the technical front, crude oil has formed a bearish engulfing candle, which is strengthening the bearish bias among traders. On the lower side, the WTI prices may head further lower towards the support level of 27.33 level. Below this, the next support can be found around 23.95 level. Fundamentals are in favor of a selling trend, and but oil should break below 27.50 level before exhibiting further selling today. Let’s consider staying bearish below $31. Good luck!  

Categories
Forex Market Analysis

Daily F.X. Analysis, March 16 – Top Trade Setups In Forex – G7 Meetings In Highlights! 

During Asian trading hours on Monday, the ICE U.S. Dollar Index dropped 1.1% to 97.67, giving up most of its gains made in the prior session, as the Fed slashed interest rates over the weekend. The U.K. house price grew 1.0% on month in March (+0.8% in February), according to the home-listing website Rightmove.

In the U.S., the New York Federal Reserve will publish March Empire Manufacturing Index (4.9 expected).

Economic Events to Watch Today    


EUR/USD – Daily Analysis

On Monday, the European Union finance ministers plan to agree on an economic acknowledgment to the coronavirus pandemic, with the European Commission forecasting the consequences of the virus could drive the European Union into a recession.

The central bank kept rates unchanged on Thursday and raised its asset purchase program by EUR120B. They introduced a new program of cheap loans that would necessarily pay banks up to 0.75% to give to small businesses. However, the EUR traders were not impressed, as indicated by the long-tail (seller exhaustion) attached to Thursday’s candle. 

Whereas, the broad market recession fears continue to increase the progress into the U.S. bonds, which translates into lower returns on the bonds, ultimately keep the greenback under pressure. The U.S. dollar index trades around 98.25, down 0.50% on the day, having stopped its recovery just shy of 98.50. 

Looking forward, the markets now keep their eyes on the European Union (E.U.) Finance Ministers’ and G7 leaders’ economic response to the virus outbreak, which is due later on Monday for taking fresh near-term trading opportunities in the main currency pair. 


Daily Support and Resistance

  • S1 1.0654
  • S2 1.0918
  • S3 1.1045

Pivot Point 1.1182

  • R1 1.1309
  • R2 1.1447
  • R3 1.1711

EUR/USD– Trading Tips

The EUR/USD has traded mostly lower, bouncing off the double bottom support level of 1.1095 level. The EUR/USD is currently trading around 1.1165, and it’s forming a lower-lows pattern on the 4-hour chart, which mostly drives a continuation of a selling trend. On the lower side, a continuation of a bearish bias can extend sell-off until 1.1100 and 1.1095. While the bullish breakout of 1.1350 can drive more buying until 1.1454 area. Consider staying bullish over 1.1182 and bearish below the same level today. 


GBP/USD– Daily Analysis

The GBP/USD dropped to 1.2321. Over the weekend, the global coronavirus pandemic worsened, particularly in Europe. Italy saw the number of coronavirus cases surge past 24,700 (1809 deaths), while Spain reported over 7,800 cases in total, Germany over 5,800 cases and France over 5,400 cases. In the U.S., the number of cases jumped to nearly 3,600 (68 deaths).

On Sunday, U.S. Federal Reserve slashed interest rates to near zero percent while announcing plans to purchase 700 billion dollars in bonds and securities to stabilize financial markets and support the economy. 

It is worth mentioning that the global markets remain sluggish despite the Fed, and the RBNZ announced an unscheduled rate cut while the BOJ is in the pipeline. As in result, the risk-tone remains on the back foot with the U.S. treasury yields falling almost 30 basis points while markets in Asia also flash losses by the press time.

Looking forward, the coronavirus headlines and the central bank updates will be the key to watch for near-term direction, while the traders will keep their eyes on the EU-UK disputes regarding Brexit.

On Monday open, U.S. stock futures dropped nearly 5% to their daily limit.

U.K. house price grew 1.0% on month in March (+0.8% in February), according to the home-listing website Rightmove.

Daily Support and Resistance

  • S1 1.1957
  • S2 1.2295
  • S3 1.2436

Pivot Point 1.2633

  • R1 1.2774
  • R2 1.297
  • R3 1.3308

GBP/USD– Trading Tip

The GBP/USD fell sharply to trade around 1.2360 level and has closed a bullish candle followed by strong selling candles. The Cable has immediate support around 1.2270 level, and above this, the Cable can extend the continuation of a bullish bias until 1.2450 level and 1.2625.  

The MACD is consistently forming bearish histograms below zero, supporting the selling trend in the GBP/USD pair, which is why we should consider selling below 1.2633 today. Recently, the GBP/USD has closed a bullish candle that can drive buying in the GBP/USD, and it may lead its prices higher towards 1.2685 level. 


USD/JPY – Daily Analysis

Today in the Asian session, the USD/JPY currency pair flashing red and trading below the 107.00, representing 1.40% losses on the day after the Bank of Japan avoided delivering the rate cut ahead of the European open on Monday.

During its emergency 1-day monetary policy meeting, the Bank of Japan (BOJ) board members decided to keep rates unchanged at -10bps whereas maintaining a10-yr JGB yield target at 0.00%. Although, the decision on maintaining its interest rate targets was made by a 7-2 vote with board members Goushi Kataoka and Yutaka Harada dissenting.

At the BOJ front, the BoJ Interest Rate Decision is announced by the Bank of Japan. Usually, if the BoJ raises the interest rates, it is positive, or bullish, for the JPY. Likewise, if the BoJ has a dovish view on the Japanese economy and cuts the interest rate, it is considered negative or bearish.

On the other hand, the U.S. Federal Reserve (Fed) announced a surprise rate cut to 0.25% in addition to $700 billion worth of Quantitative Easing. As well as, the Fed policymakers signaled that there would not be any Federal Open Market Committee (FOMC) during this week, which was earlier scheduled for Wednesday.

Whereas, the RBA indicated that it would purchase bonds while holding a special meeting on Thursday, whereas RBNZ finally also joined the role of major central bankers that offered significant rate cuts in order to control the coronavirus (COVID-19). 


Daily Support and Resistance

  • S1 99.26
  • S2 102
  • S3 103.37

Pivot Point 104.74

  • R1 106.11
  • R2 107.47
  • R3 110.21

USD/JPY – Trading Tips

The USD/JPY is trading at 107.800 and has already completed a 61.8% Fibonacci retracement level at 108.065. Below this, the USD/JPY is exhibiting a correction which is likely to lead the USD/JPY prices towards 105.960. Closing of 4-hour candle above this level has confirmed the chances of further buying in the pair until 108. Whereas, below 105.950, we may see further selling until 103.750. On the leading indicator’s front, the USD/JPY is in a bullish mode, and we should consider buying trades over 105. All the best for today!  

Categories
Forex Market Analysis

WTI Crude Oil Prices Rose To $32.35 – Emergency Cash Injection U.S. Fed Hikes! 

The WTI crude oil prices flashing green and recovered to $32.35, mainly after the emergency liquidity injected from the United States Fedra Reserve. The fresh geopolitical tension from Iraq supporting the energy prices. Moreover, the reason behind the oil price recovery could also be the surprise infusion of liquidity from the Bank Of Japan. The U.S. Crude Oil WTI Futures traded 2.7% higher to $32.35. 

The WTI Crude Oil prices recovered today after the Federal Reserve moved to provide $1.5 trillion in short-term liquidity and changed durations of Treasuries it buys.

Despite today’s recoveries, crude oil markets fell almost 30% this week after Saudi Arabia and Russia prices war and decided not to cut production further and instead sell at lower prices, raising fears of a price war. 

Meanwhile, the U.S. decision to ban travel from some European countries as President Donald Trump’s main tactic to control COVID-19 also disappointed the investor’s sentiment.

Traders are expecting that the talks between U.S. President Donald Trump and Saudi Prince may help to stop the fall in crude prices while, on the other hand, Russia’s willingness to attend the OPEC+ meeting on March 18 adds smiles on the face of the oil trades.

Looking forward, qualitative catalysts could keep the driver’s seat, whereas the weekly release of the Baker Hughes US Oil Rig Counts, prior 682, will entertain the traders.

Daily Support and Resistance

  • S1 26.84
  • S2 29.16
  • S3 30.25

Pivot Point 31.49

  • R1 32.57
  • R2 33.81
  • R3 36.13

Technically, crude oil is trading at $32.36 per barrel, mostly maintaining sideways trading range of 34.40 – 27.33. At the moment, 34.35 resistance is very, very crucial for crude oil as the MACD is in the buying zone, and traders need a reason to go long on crude oil. Breakout of 34.35/40 can be that reason which may attract some buying in crude oil and may lead its prices towards 38. Let’s look to stay bearish below 34 as below this; crude can head to target the next support level of 31.50. Good luck! 

Categories
Forex Market Analysis

Daily F.X. Analysis, March 13 – Top Trade Setups In Forex – Market Tosses in Profits & Losses Amid Coronavirus! 

On the forex front, the U.S. dollar gained traction on Thursday, with the ICE Dollar Index climbing 1.0% on the day to 97.50. The U.S. official data showed that producer prices declined 0.6% on month in February (-0.1% expected), and initial jobless claims fell to 211,000 in the week ended March 7 (220,000 expected).

Later today, March University of Michigan’s Consumer Sentiment Index (preliminary reading, 95.0 expected) will be reported.

U.S. official data showed that producer prices declined 0.6% on month in February (-0.1% expected), and initial jobless claims fell to 211,000 in the week ended March 7 (220,000 expected).

Later today, March University of Michigan’s Consumer Sentiment Index (preliminary reading, 95.0 expected) will be reported.

Economic Events to Watch Today    


EUR/USD – Daily Analysis

The EUR/USD lost 0.8% to 1.1181. The European Central Bank expanded its asset purchase program by EUR120 billion while keeping its key interest rates unchanged. ECB President Christine Lagarde said, “the spread of the coronavirus Covid-19 has been a major shock to the growth prospects of the global economy and the euro areas economy, and it has heightened market volatility”.

The central bank kept rates unchanged on Thursday and raised its asset purchase program by EUR120B. They introduced a new program of cheap loans that would necessarily pay banks up to 0.75% to give to small businesses. However, the EUR traders were not impressed, as indicated by the long-tail (seller exhaustion) attached to Thursday’s candle. 

It should be noted that the 3-month euro-dollar and dollar-yen swap spreads had widened to levels last seen in 2017 on Thursday. Notably, spreads widened by nearly 40 basis points, the most significant single-day increase since December 2008, highlighting stress in the dollar funding markets. Whereas, the Federal Reserve injected liquidity by $1.5 billion. As a result, the credit markets could normalize ahead of the weekend.

The German Federal Statistical Office will report final readings of February CPI (+1.7% on-year expected). France’s INSEE will post final readings of February CPI (+1.4% on-year expected).


Daily Support and Resistance

  • S1 1.0654
  • S2 1.0918
  • S3 1.1045

Pivot Point 1.1182

  • R1 1.1309
  • R2 1.1447
  • R3 1.1711

EUR/USD– Trading Tips

The EUR/USD has traded mostly lower to test the double bottom support level of 1.1095 level. The EUR/USD is currently trading around 1.1195, and it’s forming a lower-lows pattern on the 4-hour chart, which mostly drives a continuation of a selling trend. On the lower side, a continuation of a bearish bias can extend sell-off until 1.1100 and 1.1095. While the bullish breakout of 1.1350 can drive more buying until 1.1454 area. Consider staying bullish over 1.1182 and bearish below the same level today. 


GBP/USD– Daily Analysis

The GBP/USD plunged 1.9% to 1.2576, the lowest level since last October. Sterling fell against the U.S. dollar despite weaker than expected U.S. economic events. The U.S. official data showed that producer prices declined 0.6% on month in February (-0.1% expected), and initial jobless claims fell to 211,000 in the week ended March 7 (220,000 expected).

At the U.K. front, there are fewer chances that the British PM Johnson will announce any significant stimulus after the BOE joined the budgetary push to defeat the virus the previous day. However, Traders should wait for the final announcement because we all know that the Tory leader is famous for providing surprises.

Apart from the coronavirus headlines, traders will likely pay a little attention to the U.S. data. However, the Bank Of England minutes could offer a robust near-term direction after the central bank marked a surprise cut during the week. “Minutes are released at noon GMT from MPC’s “special” March 10 meeting, where they decided to coordinate the inter-meeting easing package announced Wednesday.

Later in the day, the U.S. Labor Department will release the February import price index (-1.0% expected). The University of Michigan will publish its Consumer Sentiment Index for March (95.0 expected).


Daily Support and Resistance

  • S1 1.2523
  • S2 1.2695
  • S3 1.2758

Pivot Point 1.2867

  • R1 1.293
  • R2 1.3039
  • R3 1.3211

GBP/USD– Trading Tip

On Friday, the GBP/USD continues to trade in a bearish mode due to the BOE rate cut decision. The GBP/USD has dropped further after violating the immediate support level of 1.2750, which is now working as a resistance. The sell-off in the GBP/USD was so solid that it’s pricing fell down to 1.2506 level which is now working as a support. 

Recently, the GBP/USD has closed a bullish candle that can drive buying in the GBP/USD, and it may lead its prices higher towards 1.2685 level. The MACD is consistently forming bearish histograms below zero, supporting the selling trend in the GBP/USD pair, which is why we should consider selling below 1.2825 today. 


USD/JPY – Daily Analysis

During the early Asian session, the USD/JPY currency pair flashing green but dropped from the session highs, because the Japanese yen is finding bids, mainly due to the sharp decline in the U.S. stock futures. At the press time, the USD/JPY currency pair is currently trading at 105.41 and consolidates in the range between the 104.51 – 106.03. However, the pair dropped from 105.20 to 104.68 in the 60 minutes to 01:30 UTC and was last seen trading around 104.89. 

The futures Wall Street’s benchmark equity index S&P 500 are currently down 1.64 percent, having started the Asian session on a relatively less risk-off note. 

Whereas, the global equities and the U.S. stock markets are expected to trade red on Friday. In the time being, the Asian equities are flashing red with Japan’s Nikkei reporting a 9% drop. 

The BOJ offered a liquidity injection of 500 billion yen early Friday, but so far, but that has failed to improve the risk sentiment and weaken the Japanese yen.


Daily Support and Resistance

  • S1 99.41
  • S2 102.11
  • S3 103.7

Pivot Point 104.81

  • R1 106.4
  • R2 107.51
  • R3 110.21

USD/JPY – Trading Tips

The USD/JPY is trading at 105.800 and has already bounced off a double bottom support level of 104.100. Closing of 4-hour candle above this level has confirmed the chances of further buying in the pair. The recent candles on the 4-hour chart are three white soldiers who are bullish nature and typically drive buying in the market. 

The immediate resistance that USD/JPY can face is around 106.150 level, and violation of this can extend more buying until 107.450 marks. On the lower side, support stays around 104. All the best for today!  
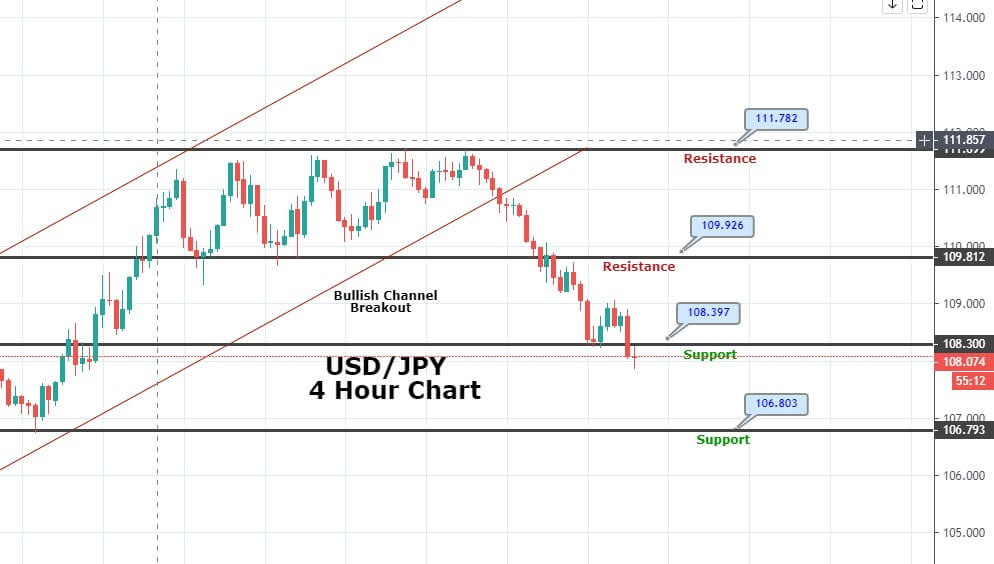
Categories
Forex Market Analysis

Gold Exhibits a Dramatic Dip – Is It Good Time to Go Long?

On Thursday, the precious metal fell dramatically despite worries about the economic influence of the coronavirus break on the global market.s The United States rejected flying from virus-infected Europe, although gains were capped as investors covered margin calls after plunge inequities.

The global coronavirus crisis deepened, as the number of cases surged to 7,375 (366 deaths) in Italy, to 7,313 (50 deaths) in South Korea, and 6,566 (194 deaths) in Iran. The situation is also worsening in France (1,126 cases), Germany (1,040 cases), Spain (674 cases), and the U.S. (534 cases). The New York Stock Exchange reopened trading following a brief pause initiated by a 7% slump quickly after the market opened. 

Support Resistance

1,646.71     1,696.48

1,619.68     1,719.22

1,569.91     1,768.99

Pivot Point 1,669.45

The yellow metal gold slips dramatically, falling from 1,649 high level to 1,573 level during the U.S. session open. Usually, gold get’s stronger when the stock market drops, but in today’s case, both the stock markets and billions are falling like a tit for tat situation. 

At the moment, gold is gaining support at 1,574 level, and violation of this can open the selling room until 1,562 mark. While the closing of candles above 1,573 can help us capture a quick retracement until 1,602 level. Let’s wait for the market to calm down a bit before we place further bets in gold. 

Good luck! 

Categories
Forex Market Analysis

Daily F.X. Analysis, March 12 – Top Trade Setups In Forex – Brace for ECB Interest Rate Decision! 

The U.S. dollar strengthened versus its major peers for a second straight session, with the ICE Dollar Index bouncing 0.2% on the day to 96.60. The European Central Bank will announce its key policy rates (deposit facility rate at -0.5% expected). The European Commission will report January industrial production (+1.5% on month expected). During the U.S. session, the U.S. Labor Department will release February PPI (+1.8% on-year expected), and initial jobless claims in the week ended March 7 (220,000 expected).

Economic Events to Watch Today   


EUR/USD – Daily Analysis

The EUR/USD fell 0.2% to 1.1263. It is reported that the European Central Bank President Christine Lagarde told European Union leaders that Europe is facing a major economic shock, and that ECB is looking at all of its tools for the monetary policy meeting due later today.

There are so high chances of a slowdown in the Eurozone, especially in Germany, in the wake of dangerous coronavirus. So, possibly the European Central Bank will go with another stimulus measure on Thursday to soften the economic fallout, which may hurt the shared currency very well. 

The European Central Bank will announce its key policy rates (deposit facility rate at -0.5% expected). The European Commission will report January industrial production (+1.5% on month expected).

Considering the slowdown in the economy, the markets are expecting a cut in the deposit rate, which currently stands at -0.5%. Therefore, the EUR could see a sharp rise if the central bank keeps rates unchanged. The traders are keenly awaiting the ECB rate decision to take new directions. The Italian Quarterly Unemployment Rate, Industrial Production m/m, Italian 10-y Bond Auction also will be key to watch.

Daily Support and Resistance

  • S1 1.106
  • S2 1.1176
  • S3 1.1218

Pivot Point 1.1293

  • R1 1.1335
  • R2 1.1409
  • R3 1.1526

EUR/USD– Trading Tips

The EUR/USD is trading with a mixed bias around 1.1305 on Thursday as it seems to extend the bearish trend even after completing the 38.2%% and 50% Fibonacci retracement levels around 1.1350 and 1.1275.  

The EUR/USD is currently trading around 1.1305, and it’s forming lowers low pattern on the 4-hour chart, which mostly drives a continuation of a selling trend. On the lower side, a continuation of a selling bias can extend sell-off until 1.1200 and 1.1095. While the bullish breakout of 1.1350 can drive more buying until 1.1454 area. Consider staying bullish over 1.1275 and bearish below the same level today. 


GBP/USD– Daily Analysis

The GBP/USD dropped 0.7% to 1.2817. The Bank of England slashed its benchmark rate by 50 basis points to 0.25% after a special meeting, citing economic shock from the coronavirus. On the other hand, official data showed that the U.K.’s GDP growth was flat on month in January (+0.2% estimated), and industrial production declined 0.1% in February (+0.3% expected).

Whereas, the U.S. 10-year Treasury yields failed to continue the previous day’s run-up, current down by 8-basis points (bps) to 0.67%.

The U.K. Office for National Statistics will report January monthly GDP (+0.2% on month expected), industrial production (+0.3% on month expected), manufacturing production (+0.2% on month expected) and trade balance (356 million pounds deficit projected). 

At the U.K. front, there are fewer chances that the British PM Johnson will announce any major stimulus after the BOE joined the budgetary push to defeat the virus the previous day. However, Traders should wait for the final announcement because we all know that the Tory leader is famous for providing surprises.

Looking forward, the US PPI and Jobless Claims will likely entertain the momentum traders. The overall PPI was likely lower due to the weakening in energy prices, similar to the pattern in the CPI (TD -0.2%). The core measures were probably moderately weak as well after the above-trend readings in January.

Daily Support and Resistance

  • S1 1.2523
  • S2 1.2695
  • S3 1.2758

Pivot Point 1.2867

  • R1 1.293
  • R2 1.3039
  • R3 1.3211

GBP/USD– Trading Tip

On Thursday, the GBP/USD continues to trade in a bearish mode due to the BOE rate cut decision. The GBP/USD has dropped further after violating the immediate support level of 1.2850, which is now working as a resistance. 

Continuation of a selling trend can lead the GBP/USD prices towards 1.2740 and 1.2720. On the higher side, the GBP/USD is likely to trade bullish until 1.2840 level, and bullish breakout of which may drive further buying until 1.2910 level. The MACD is consistently forming bearish histograms below zero, supporting the selling trend in the GBP/USD pair, which is why we should consider selling below 1.2825 today. 


USD/JPY – Daily Analysis

The USD/JPY currency pair hit the bearish track and dropped below the 104.00, mainly due to a sharp decline in the equity market. U.S. President Donald Trump failed to ease the fears about intensifying coronavirus slowdown in the global economy, which later boosted the safe-haven Japanese yen and sent the USD/JPY pair lower near the 103.30. As of writing, the safe haven pair is trading at 107.30 and consolidates in the range between the 103.09 – 104.81.

Trump said during his speech that the U.S. would ban all flights from Europe to the U.S. for the next 30 days effective Friday at midnight. While also says that travel bans will not apply to the U.K., He said that the U.S. would take emergency action to provide financial relief for workers who are ill, hospitalized, or caring for others due to coronavirus. Whereas also says that we will provide capital and liquidity to the small firms which are affected by the coronavirus, provide low-interest loans as well. Trump promised to provide $200 billion in additional liquidity in the fight against coronavirus. 

As we already mentioned that the investors were expecting a more potent stimulus and sold risk after Trump’s speech. The S&P 500 futures, which traded 0.5% lower ahead of President’s address, are now reporting a 2.4% decline. Meanwhile, the yield on the U.S. 10-year Treasury registering losses by 5-basis points at 0.76%. 

Daily Support and Resistance

  • S1 99.41
  • S2 102.11
  • S3 103.7

Pivot Point 104.81

  • R1 106.4
  • R2 107.51
  • R3 110.21

USD/JPY – Trading Tips

The USD/JPY is trading at 103.800 and has already violated the double bottom support level of 104.100. Closing of 4-hour candle below this level confirms the chances of further selling in the pair. The recent candle on the 4-hour chart is bearish engulfing in nature as it’s covering the full body of the precious candle, and it signifies the chances of further selling in the USD/JPY pair. 

Below 104.250, the selling trend continuation can lead the USD/JPY prices towards 101.670, whereas, further buying over 104.250 can lead the USD/JPY to 106.250 area.

All the best for today!  

Categories
Forex Market Analysis

Daily F.X. Analysis, March 11 – Top Trade Setups In Forex – Who’s Up for U.S. Inflation Rate? 

On the forex front, the ICE U.S. Dollar Index rebounded 1.7% on the day to 96.45, snapping a three-day losing streak, as investors anticipated that fiscal stimulus from the U.S. government would limit the scope for interest rates cut. The U.S. Labor Department will report February CPI (+2.2% expected). The Treasury will post the February monthly budget statement (236.8 billion dollars deficit expected). Here’s an update on the technical side of the market. 

Economic Events to Watch Today   


EUR/USD – Daily Analysis

The EUR/USD retreated 1.2% to 1.1312. Most of the movement in the EUR/USD is triggered in the wake of low impact economic events. Regarding the U.S. economic data, the Small Business Optimism Index by the National Federation of Independent Business (NFIB) rose to 104.5 in February (102.8 expected).

Euro also slipped in the wake of the bearish stock market. The European stocks were broadly lower, with the Stoxx Europe 600 Index declining 1.1%. Germany’s DAX slid 1.4%, France’s CAC lost 1.5%, and the U.K.’s U.K.’s FTSE 100 was down 0.1%.

Overall, the level of uncertainty rose in Italy, where 16 million people in Lombardy and different sections of the north are presently below quarantine, there were 133 life losses announced on Sunday, drawing the sum to 366. More than 7,000 people in the country have been verified to have the disease. 

There are so high chances of a slowdown in the Eurozone, especially in Germany, in the wake of dangerous coronavirus. So, possibly the European Central Bank will go with another stimulus measure on Thursday in order to soften the economic fallout, which may hurt the shared currency very well. 

Looking forward, the traders will keep their eyes on the incoming virus updates and its impact on the risk sentiment and dollar trades ahead of the US CPI data, which is scheduled to release later today at 1230 GMT.

Daily Support and Resistance

  • S1 1.107
  • S2 1.1197
  • S3 1.1245

Pivot Point 1.1323

  • R1 1.1371
  • R2 1.145
  • R3 1.1576

EUR/USD– Trading Tips

On Wednesday, the EUR/USD is trading with a mixed bias around 1.1315. The EUR/USD seems to extend the bearish trend in the wake of completing the 38.2%% and 50% Fibonacci extension level, out of which 38.2% has already been achieved until 1.1280. 

At the moment, the EUR/USD is trading at 1.1315, and a bullish breakout of 1.1350 resistance level can extend buying until 1.1458 level. On the lower side, the EUR/USD may find support around 1.1280, and bearish breakout of 1.1280 can extend sell-off until 1.1238. The RSI and MACD are in the buying zone as the MACD’s histograms are over zero, the bullish zone. Consider taking buy trades above 1.1280.


GBP/USD– Daily Analysis

The GBP/USD fell 1.7% at 1.2907. Later today, the U.K.’s U.K.’s January GDP data (+0.2% on month expected) and February industrial production (+0.3% on month estimated) will be released. The U.S. official data revealed that the economy added 273,000 non-farm payrolls in February (+175,000 expected), and the jobless rate dropped to 3.5% (3.6% expected). Average hourly earnings were up 0.3% on the month (as expected). 

January trade deficit was posted at US$45.3 billion (US$46.2 billion expected), and wholesale inventories (final reading) fell 0.4% on the month (-0.2% expected). Despite mixed economic events, the U.S. dollar is getting weaker and driving the GBP/USD pair higher. 

Whereas, the U.S. 10-year Treasury yields failed to continue the previous day’s run-up, current down by 8-basis points (bps) to 0.67%.

The U.K. Office for National Statistics will report January monthly GDP (+0.2% on month expected), industrial production (+0.3% on month expected), manufacturing production (+0.2% on month expected) and trade balance (356 million pounds deficit expected).

Whereas, Chancellor Rishi Sunak is scheduled to announce a significant relief to the U.K. business houses and will try his hands to keep entrepreneurs attached to Britain after the actual Brexit (which may lose the London’s powerhouse status). 

Daily Support and Resistance

  • S1 1.252
  • S2 1.2733
  • S3 1.281

Pivot Point 1.2945

  • R1 1.3023
  • R2 1.3158
  • R3 1.337

GBP/USD– Trading Tip

The GBP/USD has triggered a dramatic sell-off in the wake of stronger dollar and weakness in Sterling as the pair slipped to test 1.2850. Continuation of a selling trend can lead the GBP/USD prices towards 1.2740, but the way Cable has closed a Doji candle above 1.2850, it seems to trigger a bullish reversal. 

On the higher side, the GBP/USD is likely to trade bullish until 1.3020 level, and breakout of which may drive further buying until 1.3100 level. The MACD is consistently forming bearish histograms below zero, supporting the selling trend in the GBP/USD pair. Let’s consider buying over 1.2925. 


USD/JPY – Daily Analysis

The USD/JPY currency pair flashing red and dropped below the 105.00 level, mainly due to equity markets, which turned lower. At the press time, the USD/JPY is trading at 104.90 and consolidates in the range between the 104.11 – 105.67.

The hopes of fiscal stimulus by the Trump administration boosted investors’ appetite for riskier assets on Tuesday, which allowed the U.S. Treasury bond yields to recover sharply from historic lows and helped revive the USD demand. But as of now, the delay in the incentive package offered by U.S. President Donald Trump to diminish the economic influence of the coronavirus epidemic, which he had promised on Tuesday also weighing on the greenback and risk-tone.

The safe-haven flows were further strengthened by a fresh drop in the U.S. equity futures and the U.S. bond yields, which kept the USD bulls on the defensive and turned out to be one of the key factors exerting some pressure on the pair.

Whereas the bearish bias remained cushioned for now, because investors now seemed unwilling to place any aggressive bets, instead preferred to wait on the sidelines ahead of the latest U.S. inflation figures and the U.S. budget for fiscal 2021.

The U.S. Treasury Secretary Steven Mnuchin will testify on the Proposed the Fiscal Year 2021 Budget, which might provide fresh details about the administration’s new policies.

Daily Support and Resistance

  • S1 99.41
  • S2 102.11
  • S3 103.7

Pivot Point 104.81

  • R1 106.4
  • R2 107.51
  • R3 110.21

USD/JPY – Trading Tips

The USD/JPY is trading at 104.800, testing the bearish trendline resistance level at 105.600. The increased reduced demand for safe-haven assets is driving strong bullish correction in the USD/JPY currency pairs. The USD/JPY has closed two consecutive selling candles, which are followed by the bullish engulfing candle on the 4-hour timeframe, and these are suggesting odds of selling in the USD/JPY currency pair. Below 104.250, the selling trend continuation can lead the USD/JPY prices towards 101.670, whereas, further buying over 104.250 can lead the USD/JPY to 106.250 area.

All the best for today!  
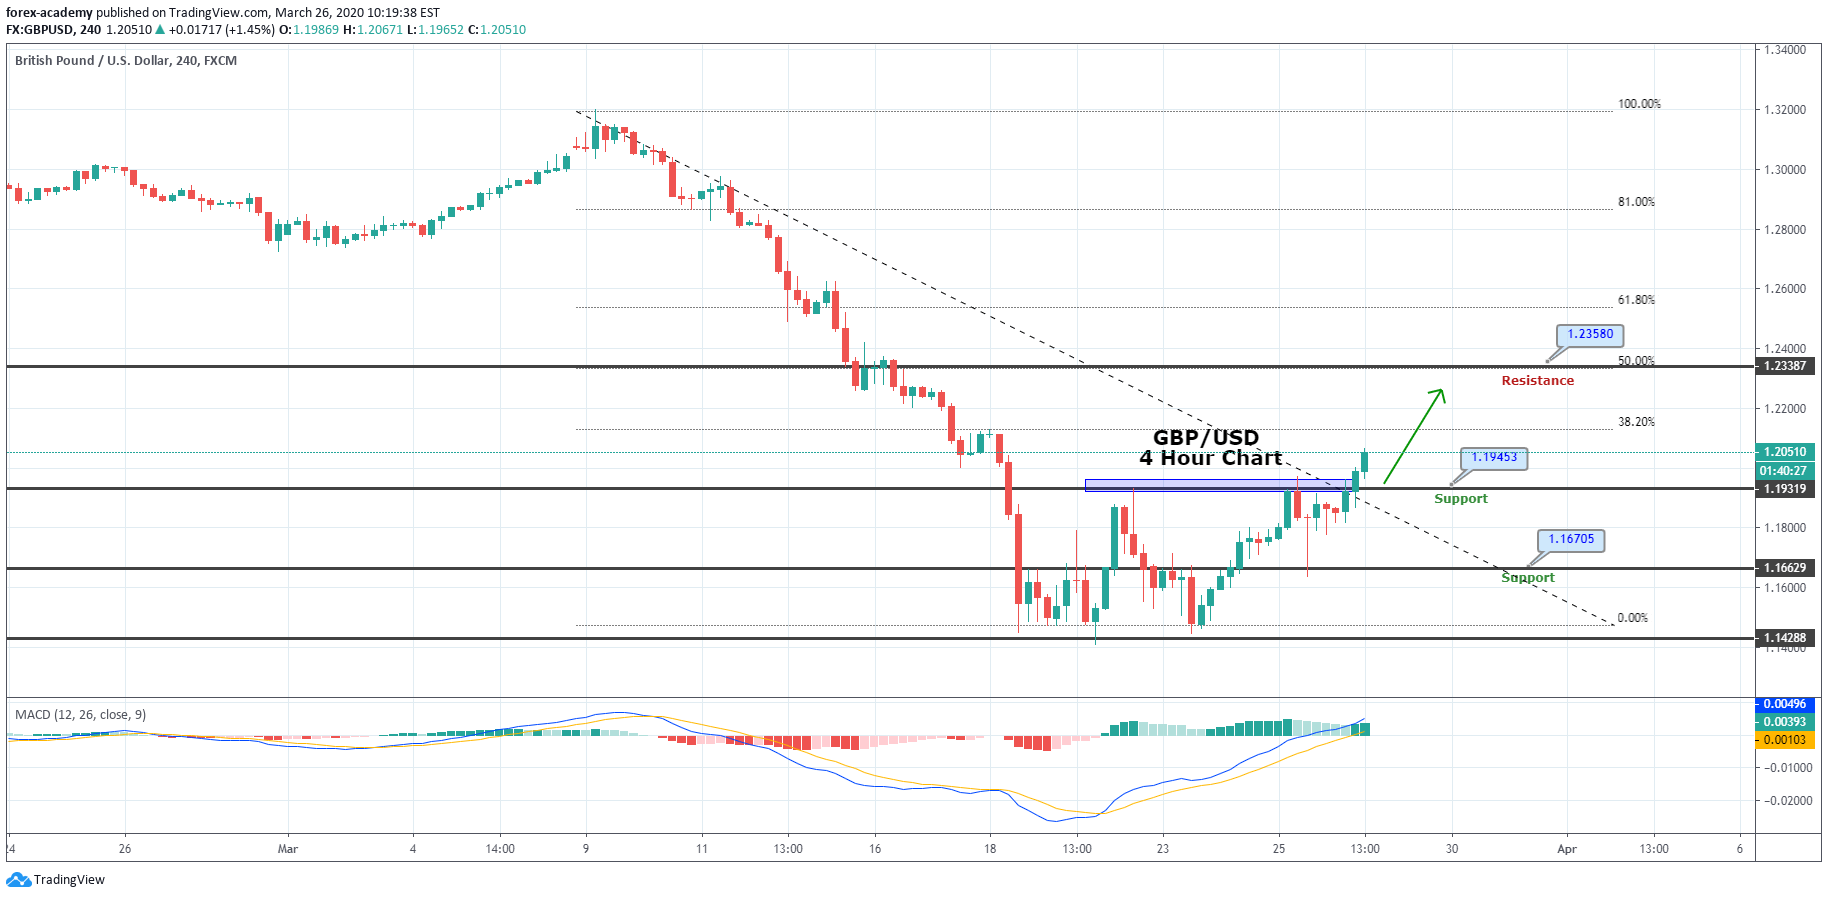
Categories
Forex Market Analysis

WTI Crude Oil Recovered Slightly From Yesterday’s Historical Fall – Trade Plan! 

The WTI crude oil prices recovered on the day, representing an 8% gain after yesterday’s historical drop, having hit a multi-year low of $27.40 on Monday. The U.S. Crude Oil WTI Futures gained 6.2% to $33.05. 

The WTI Crude Oil prices marked a historical 30% fall yesterday because tensions between Saudi Arabia and Russia escalated, whereas intensifying fears about the spread of the new coronavirus continued to affect investor sentiment.

After a failure in talks between OPEC and its allies last week, Saudi Arabia cut its April official selling prices by $6 to $8 to grab market share. It also plans to increase its crude output above 10 million barrels per day in April from 9.7 million BPD in recent months.

On the other hand, Russia also said that it might raise output and said that it could manage with low oil prices for six to ten years. It is worth to mention that possibly 50% of the public exploration and production companies will become bankrupt during the next two years as per the report that came from the Pioneer Natural Resources Co. Chief Executive Scott Sheffield. 

The risk-sentiment was also recovered after Chinese President Xi Jinping visited Wuhan, the epicenter of the coronavirus outbreak, for the first time since the disease started, and because of the spread of the virus in mainland China sharply decreases.

At the demand side, the International Energy Agency said oil demand was set to contract in 2020 for the first time since 2009.

Daily Support and Resistance

  • S1 16.27
  • S2 23.67
  • S3 27.07

Pivot Point 31.07

  • R1 34.47
  • R2 38.47
  • R3 45.87

Technically, crude oil is trading at $34 per barrel, mostly maintaining sideways trading range of 34.40 – 27.33. At the moment, 34.35 resistance is very, very crucial for crude oil as the MACD is extremely oversold, and traders need a reason to long on crude oil. Breakout of 34.35/40 can be that reason which may attract some buying in crude oil and may lead its prices towards 38. Let’s look to stay bearish below 34 and bullish above 34.40 area today. Good luck! 

Categories
Forex Market Analysis

Risk-off Sentiment Drives Dramatic Buying in Gold – Quick Trade Plan! 

On Monday, the yellow metal gold prices went to more than seven-year high as a stock market retreat on risks over the widening coronavirus break, and its economic influence drove traders to safe-haven assets, although profit-taking following unwound much of the metal’s rise.

Earlier today, the gold reached its highest since December 2012 at $1,702.56 before falling back 0.5% lower to trade at $1,665.68 per ounce. The U.S. gold futures dropped 0.4% to $1,666.

Over the weekend, the global coronavirus crisis deepened, as the number of cases surged to 7,375 (366 deaths) in Italy, to 7,313 (50 deaths) in South Korea, and 6,566 (194 deaths) in Iran. The situation is also worsening in France (1,126 cases), Germany (1,040 cases), Spain (674 cases), and the U.S. (534 cases). This morning, U.S. stock futures slid over 4%, while spot gold hit the key level of $1,700 an ounce.


Support Resistance
1646.71 1696.48
1619.68 1719.22
1569.91 1768.99
Pivot Point 1669.45

The yellow metal gold prices extend trading sideways, tossing in between green and red in the wake of increased demand for safe-haven assets. It earlier touched 1,702 and now drops to 1,662 level. On the lower side, the precious metal may fund support around 1,660 and 1,647, while resistance continues to stay at 1,670.

Good luck! 

Categories
Forex Market Analysis

Daily F.X. Analysis, March 10 – Top Trade Setups In Forex – Choppy Trading In Play! 

The U.S. Dollar Index sank 0.9% on the day to 95.07, down for a third straight session. Investors were speculating a steep cut in U.S. interest rates, though the expectations retreated as President Donald Trump announced that he would announce “very dramatic” actions to support the economy. The Dollar Index rebounded to 95.33. The European Commission will post final readings of 4Q GDP (+0.9% on-year expected).

France’s INSEE will report January industrial production (+1.8% on month expected) and manufacturing production (+1.7% on month expected).

Economic Events to Watch Today  


EUR/USD – Daily Analysis

The EUR/USD rose 1.1% to 1.1410. Official data showed that German industrial production grew 3.0% on month in January (+1.7% expected). The coronavirus breaks in China and South Korea seem to be lagging, as countries outside in the world embrace drastic steps to try and stamp out the virus. 

In Italy, where 16 million people in Lombardy and different sections of the north are presently below quarantine, there were 133 life losses announced on Sunday, drawing the sum to 366. More than 7,000 people in the country have been verified to have the disease. 

In Iran, there were 49 new deaths. Some 194 people have now expired from COVID-19 there. Although the latest numbers from China and South Korea suggest, the virus seems to be diminishing in northeast Asia.

The ECB is expecting to deliver a rate cut to control the economic fallout from the deadly coronavirus outbreak. Moreover, an unexpectedly bigger decline in the Eurozone Sentix Investor Confidence for March, a lead indicator, also continues to burdening the EUR currency.

Looking forward, the trader’s eyes remain on the Eurozone final GDP while the general market bias and USD dynamics will proceed to play a pivotal role.

Daily Support and Resistance

  • S1 1.1196
  • S2 1.1315
  • S3 1.1384

Pivot Point 1.1434

  • R1 1.1503
  • R2 1.1553
  • R3 1.1672

EUR/USD– Trading Tips

The EUR/USD is trading with a bullish bias around 1.1445. The EUR/USD seems to extend the bullish trend in the wake of completing the 161.8% and 261.8% Fibonacci extension level, out of which 161.8% has already been achieved until 1.1258. 

At the moment, the EUR/USD is trading at 1.1458, and bullish breakout of this level can extend buying until 1.1610 level. On the lower side, the EUR/USD may find support around 1.1400 and 1.1296. The RSI and MACD are in the buying zone as the MACD’s histograms are over zero, the bullish zone. Consider taking buy trades above 1.1380.


GBP/USD– Daily Analysis

The GBP/USD gained 0.3% at 1.3083.to hit its highest mark in a week to the greenback. This came after the forecasts waned for an urgent Bank of England rate cut to follow this week’s emergency movement from the U.S. Federal Reserve to accommodate coronavirus damage. 

The U.S. official data revealed that the economy added 273,000 non-farm payrolls in February (+175,000 expected), and the jobless rate dropped to 3.5% (3.6% expected). Average hourly earnings were up 0.3% on the month (as expected). 

January trade deficit was posted at US$45.3 billion (US$46.2 billion expected), and wholesale inventories (final reading) fell 0.4% on the month (-0.2% expected). Despite mixed economic events, the U.S. dollar is getting weaker and driving the GBP/USD pair higher. 

The GBP/USD currency pair buyers are still hopeful because the BBC reports a bumper £5billion boost for British exports by the first post-Brexit budget, which is scheduled to release on Wednesday. Chancellor Rishi Sunak will also announce supportive news for salaried employees in his first budget.

Looking ahead, due to the few economic data/events on the economic calendar, all traders keep their eyes on COVID-19/Brexit headlines for taking fresh directions.

Daily Support and Resistance

  • S1 1.278
  • S2 1.2946
  • S3 1.3023

Pivot Point 1.3111

  • R1 1.3188
  • R2 1.3277
  • R3 1.3443

GBP/USD– Trading Tip

The GBP/USD is showing some severe bullish moves in the wake of a weaker dollar and strong Sterling. The GBP/USD soars to trade around 1.3060 and continuation of a bullish trend can extend buying until 1.3160 and even higher. The GBP/USD has formed a solid green candle on the 4-hour timeframe, which may help drive further buying in the Sterling. 

The MACD is consistently forming bullish histograms over zero points, supporting the buying trend in the GBP/USD pair. Let’s consider buying over 1.3025. 


USD/JPY – Daily Analysis

The USD/JPY currency pair stops its bearish rally and hit the high of 105.00 mainly due to risk sentiment improved in the wake of U.S. stimulus expectations. The hopes of the U.S. stimulus put a bid on the U.S. equity futures, treasury yields. 

At the press time, the USD/JPY currency pair is currently trading at 104.78 and consolidates in the range between the 102.02 – 105.05. The U.S. Vice President Mike Pence took U-turn from his Friday’s comments and signaling a lack of enough testing kits in the labs.

The USD/JPY currency pair recovered from the lowest since late-2016 mainly because U.S. President Donald Trump’s suggested to ‘major’ economic measures in order to control coronavirus (COVID-19) triggered the risk-on.

Looking forward, traders are now keeping their eyes on the U.S. President Trump’s real means to tame the adverse implications of the virus. However, the significant risk recovery could only occur if there is news of any cures.

Daily Support and Resistance

  • S1 98.73
  • S2 100.42
  • S3 101.35

Pivot Point 102.12

  • R1 103.05
  • R2 103.81
  • R3 105.5

USD/JPY – Trading Tips

The USD/JPY is trading at 104.200, testing the bearish channel, which supported the Japanese yen at 104.400. The increased reduced demand for safe-haven assets is driving strong bullish correction in the USD/JPY currency pairs. 

The USD/JPY has closed two consecutive bullish candles, which are followed by the bearish breakout setup and suggesting odds of further bullish bias until 104.650. 

Below 104.550, the selling trend continuation can lead the USD/JPY prices towards 101.670 whereas, further buying over 104.550 can lead the USD/JPY to 106.250 area

All the best for today!  

Categories
Forex Market Analysis

Daily F.X. Analysis, March 09 – Top Trade Setups In Forex – Risk Sentiment Keeps the Market in Action! 

The U.S. Dollar Index plunged 0.9% on the day to 95.95 on Friday, as treasury yields slumped amid sinking investors’ risk appetite. The Eurozone Sentix Investor Confidence Index for March will be released (-11.4 expected). The German Federal Statistical Office will announce January industrial production (+1.6% on month expected) and trade balance (15.3 billion euros surplus expected).

The Bank of France will post February Industry Sentiment Indicator (95 expected).

Economic Events to Watch Today  


EUR/USD – Daily Analysis

The EUR/USD climbed 0.4% to 1.1286. Official data showed that German factory orders grew 5.5% on month in January (+1.3% expected). The coronavirus breaks in China and South Korea seem to be lagging, as countries outside in the world embrace drastic steps to try and stamp out the virus. 

In Italy, where 16 million people in Lombardy and different sections of the north are presently below quarantine, there were 133 life losses announced on Sunday, drawing the sum to 366. More than 7,000 people in the country have been verified to have the disease. 

In Iran, there were 49 new deaths. Some 194 people have now expired from COVID-19 there. Although the latest numbers from China and South Korea suggest, the virus seems to be diminishing in northeast Asia.

At the data front, the German Industrial Production and the Current Account data are scheduled to release at 07:00 GMT, followed by the Eurozone Sentix Investor Confidence at 09:30 GMT. The German Federal Statistical Office will report January industrial production (+1.6% on month expected) and trade balance (15.3 billion euros surplus expected).

Daily Support and Resistance

  • S1 1.1016
  • S2 1.1152
  • S3 1.1221

Pivot Point 1.1288

  • R1 1.1356
  • R2 1.1424
  • R3 1.1559

EUR/USD– Trading Tips

The EUR/USD is trading with a bullish bias around 1.1445. The EUR/USD seems to extend the bullish trend in the wake of completing the 161.8% and 261.8% Fibonacci extension level, out of which 161.8% has already been achieved until 1.1258. At the moment, the EUR/USD is trading at 1.1458, and bullish breakout of this level can extend buying until 1.1610 level. On the lower side, the EUR/USD may find support around 1.1400 and 1.1296. The RSI and MACD are in the buying zone as the MACD’s histograms are over zero, the bullish zone. Consider taking buy trades above 1.1380.


GBP/USD– Daily Analysis

The GBP/USD climbed 0.6% at 1.2951 to hit its highest mark in a week to the greenback. This came after the forecasts waned for an urgent Bank of England rate cut to follow this week’s emergency movement from the U.S. Federal Reserve to accommodate coronavirus damage. 

The U.S. official data showed that the economy added 273,000 non-farm payrolls in February (+175,000 expected), and the jobless rate dropped to 3.5% (3.6% expected). Average hourly earnings were up 0.3% on the month (as expected). 

January trade deficit was posted at US$45.3 billion (US$46.2 billion expected), and wholesale inventories (final reading) fell 0.4% on the month (-0.2% expected). Despite mixed economic events, the U.S. dollar is getting weaker and driving the GBP/USD pair higher. 

On Monday, the Sterling languished to a five-month low against the Euro, amidst a fresh market panic about the coronavirus outbreak that has prompted significant falls in stocks and oil.

Daily Support and Resistance    

  • S1 1.281
  • S2 1.2913
  • S3 1.2981

Pivot Point 1.3017

  • R1 1.3084
  • R2 1.312
  • R3 1.3224

GBP/USD– Trading Tip

On Monday, the GBP/USD is showing some severe bullish moves in the wake of a weaker dollar and strong Sterling. The GBP/USD soars to trade around 1.3180 and continuation of a bullish trend can extend buying until 1.3200 and even higher. 

During the start of the day, the GBP/USD opened with a dramatic gap, but it soon recovered to fill the gap around 1.3032. Right now, the GBP/USD has formed a solid green candle on the 240 minutes timeframe, which may help drive further buying in the Sterling. The MACD is consistently forming bullish histograms over zero points, supporting the buying trend in the GBP/USD pair. Let’s consider buying over 1.3145. 


USD/JPY – Daily Analysis

The USD/JPY currency pair flashing red and dropped to multi-year lows mainly due to the early-Asian risk-off market sentiment in the wake of coronavirus fears and fall in oil prices. However, the pair is struggled to gain its recovery of over 100 pips from the 3-year lows after downbeat GDP data and trading above mid-102.00s. The USD/JPY currency pair is currently trading at 102.64 and consolidates in the range between the 101.59 – 104.58 on the day.

Moreover, the U.S. yields have recovered slightly from the lows seen after the U.S. Fed’s rate cut. The 2-year yield is currently trading at 0.68%, representing a seven basis point gain on the overnight low of 0.61%, and the 10-year yield has recovered to 0.98% from $0.91%. The currency pair continued to its recent heavy losses and still trading under some heavy selling pressure for the 2nd-consecutive session on Friday.  

On the fundamental side, the headlines growth figure confirms the -1.7% market consensus versus -1.6% initial forecast. The GDP data confirms further challenges to the Asian economy due to coronavirus (COVID-19) fears that have been pushing to the quote downwards.

Daily Support and Resistance

  • R3: 109.46
  • R2: 107.99
  • R1: 107.08

Pivot Point 106.52

  • S1: 105.61
  • S2: 105.06
  • S3: 103.59

USD/JPY – Trading Tips

The USD/JPY is trading at 102.200, breaking below the bearish channel, which supports the Japanese yen at 104.400. The increased demand for safe-haven assets is driving strong bearish trends in the USD/JPY currency pairs. Recently, the USD/JPY has closed two consecutive selling candles, which are followed by the bearish breakout setup and suggesting odds of further bearish bias until 101.650. 

Selling trend continuation can lead the USD/JPY prices towards 101.670 whereas, further selling can lead the USD/JPY to 100.450 area

All the best for today!  
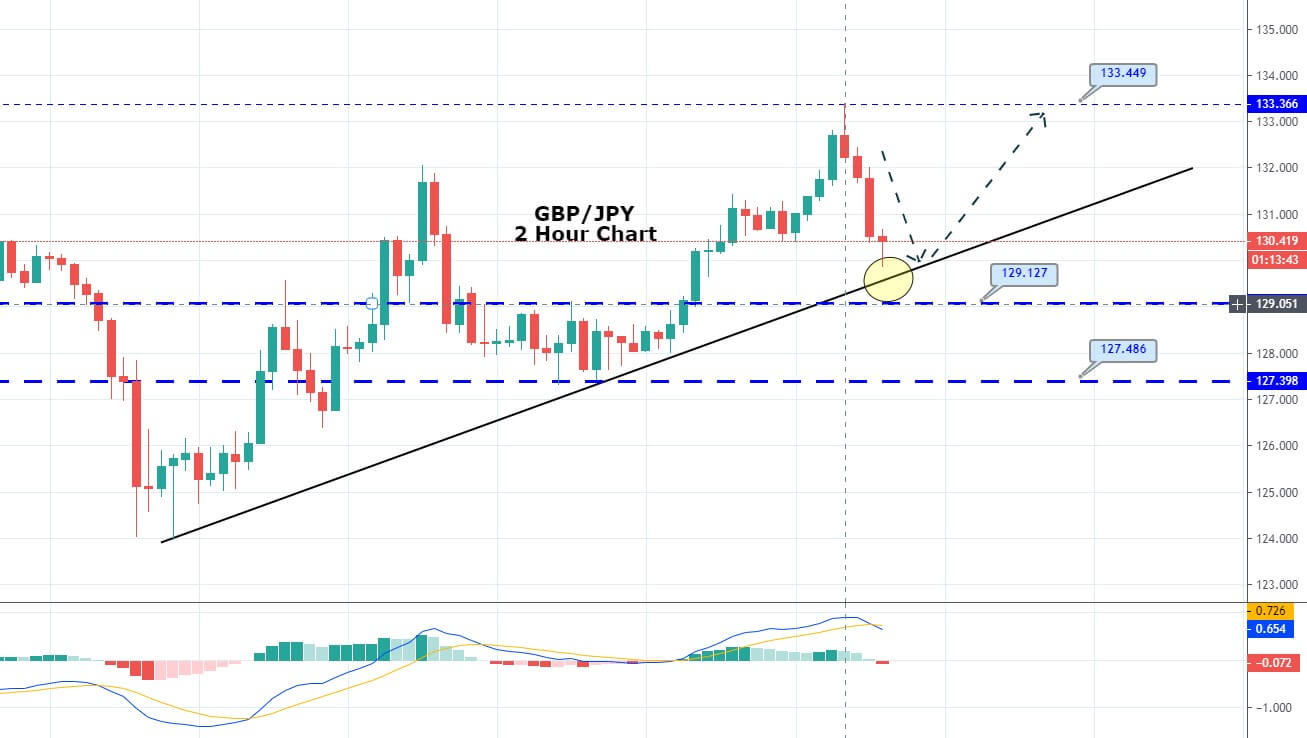
Categories
Forex Market Analysis

WTI Crude Oil Prices Came Under Pressure Despite OPEC Agreed To Cut Production! 

The WTI crude oil prices dropped despite the report that OPEC minister agreed to cut the oil output by 1.5 million barrels per day. It’s worth to mention that the cut is finalized after approval from Russia. A meeting of both OPEC and OPEC+ members later in the day is in focus. 

Russia’s willingness for deeper production cuts is still doubtful because recent reports suggested that Moscow was supporting an increase to the current level of cuts rather than a further reduction. The news failed to boost oil prices today because falling U.S. equities places a further burden on oil markets. 

Despite some improvement in prices this week, the WTI is still below 24% on the year, and the coronavirus is playing a major role. The coronavirus cases continue to rise in the world’s largest economy. Some time ago, the U.S. Vice President Mike Pence accepted that they have a shortage of virus testing kits for now. Moreover, New York officials also recently crossed wires while saying that the coronavirus infects nearly 2,733 people in the city, which is also putting bearish pressure on the crude oil prices.

Daily Support and Resistance

  • S1 42.01
  • S2 41.76
  • S3 41.42

Pivot Point 43.51

  • R1 43.72
  • R2 44.26
  • R3 45.01

On the technical front, the crude oil price has broken below the double bottom support level of 43.95, which opens up further room for selling until 40.95. Recently, the MACD of crude oil has also forming bigger histograms on the 4-hour chart, which are supporting the selling trend in the WTI prices. Closing of candles below 43.96 may confirm the chances of more bearish bias in the WTI prices today. Let’s consider staying bearish below 43 to target 42.25 and 41.75. Good luck! 

Categories
Forex Market Analysis

Daily F.X. Analysis, March 06 – Top Trade Setups In Forex – Who’s Up for the U.S. Nonfarm Payroll? 

On the forex front, the U.S. dollars weakened further against its major peers on Thursday, with the ICE Dollar Index dropping 0.8% on the day to a two-month low of 96.60. The German Federal Statistical Office will report January factory orders (+1.3% on month expected). France’s INSEE will post the January trade balance (4.8 billion euros deficit expected).

Economic Events to Watch Today  


EUR/USD – Daily Analysis

The EUR/USD jumped 0.8% to 1.1227. Later today, German factory orders for January will be released (+1.3% on month expected). The European Commission warned that France and Italy could fall into a technical recession, two-quarters of economic contraction, amid coronavirus impacts. On the other hand, official data showed that the eurozone’s retail sales grew 0.6% on month in January, and German retail sales were up 0.9%, both as expected.

If the risk-on sentiment continues to boost, the selling interest around the EUR could increase. If the OPEC meeting strengthens an oil price bounce, the risk sentiment will likely increase, pushing the EUR currency and other safe-haven currencies lower. The pair is currently sidelined just below 1.1140.

Besides this, the currency pair will likely take cues from the German Federal Statistical Office will report January factory orders (+1.3% on month expected). France’s INSEE will post the January trade balance (4.8 billion euros deficit expected). The doors remain open for EUR/USD to extend gains toward the next significant resistance near 1.1282 (July 19, 2019 high). 

Daily Support and Resistance

  • S1 1.0949
  • S2 1.1075
  • S3 1.1156

Pivot Point 1.12

  • R1 1.1281
  • R2 1.1326
  • R3 1.1451

EUR/USD– Trading Tips

On Friday, the EUR/USD is trading with a bullish bias around 1.1245. The EUR/USD may drop to complete the bearish retracement. On the lower side, the 38.2% Fibonacci retracement is likely to support the EUR/USD at 1.1180, and violation of this level can drive more selling until 1.1155 which marks the 61.8% Fibonacci level. On the higher side, the bullish breakout 1.1245 can lead EUR/USD prices further higher towards 1.1300 and 1.1335. The RSI and MACD are in the buying zone as the MACD’s histograms are over zero, the bullish zone. Consider taking buy trades above 1.1230.


GBP/USD– Daily Analysis

The GBP/USD climbed 0.6% at 1.2951 to hit its highest mark in a week to the greenback. This came after the forecasts waned for an urgent Bank of England rate cut to follow this week’s emergency movement from the U.S. Federal Reserve to accommodate coronavirus damage. 

The GBP/USD currency pair may come under pressure in Europe if the pair do not cross the key hurdle. On the data front, the focus will be on the U.K. Halifax House Prices and the U.S. Nonfarm Payrolls report. 

At the Brexit front, the EU-UK Brexit negotiators complete their first round of trade talks. However, no conclusion has been received so far, while fisheries and the E.U. jurisdiction continue to remain as the key hurdles.

At the coronavirus front, the deadly virus continues to spread outside China, with California recently declaring a state of emergency. However, the global policymakers struggle to control the same, and it seems to have helped the risk-tone sentiment. As in result, the U.S. 10-year Treasury yields remain positive above 1%, whereas stocks in Asia are also positive by the press time.

Daily Support and Resistance

  • S1 1.2631
  • S2 1.2734
  • S3 1.28

Pivot Point 1.2837

  • R1 1.2903
  • R2 1.294
  • R3 1.3043

GBP/USD– Trading Tip

On Friday, the GBP/USD is trading with bullish bias after having violated the horizontal resistance level of 1.2885, and it’s heading towards the next target level of 1.3000, which is also a psychological resistance level for GBP/USD. 

The GBP/USD’s immediate support is likely to be found around 1.2917, and below this level, the GBP/USD may aim for the 1.2860 area. The MACD and RSI are in the buying zone, supporting the bullish bias for the GBP/USD. Let’s look for long positions above 1.2937 today.  


USD/JPY – Daily Analysis

The USD/JPY currency pair flashing red and trading below the 106.00 level mainly due to the on-going risk-off market sentiment in the wake of Coronavirus intensifying fears. As well as, the currency pair hit the 6-months lows level. For now, the currency pair is currently trading at 105.94 and consolidates in the range between the 105.75 – 106.34.

Moreover, the U.S. yields have recovered slightly from the lows seen after the U.S. Fed’s rate cut. The 2-year yield is currently trading at 0.68%, representing a seven basis point gain on the overnight low of 0.61%, and the 10-year yield has recovered to 0.98% from $0.91%. 

The currency pair continued to its recent heavy losses and still trading under some heavy selling pressure for the 2nd-consecutive session on Friday.  

The reason behind all negative factors could be the market’s fear of coronavirus-led economic pessimism. Whereas, the latest numbers from the U.S., China, and South Korea suggested that the deadly virus continues to spread despite the governments’ struggles.

As in result, the safe-haven demand for the yen has weakened in Asia. As we already mentioned that the USD/JPY pair is currently trading at 107.27, representing a 0.17% gain on the day, having hit a high of 107.52 a few minutes before press time. 

Daily Support and Resistance

  • R3: 109.46
  • R2: 107.99
  • R1: 107.08

Pivot Point 106.52

  • S1: 105.61
  • S2: 105.06
  • S3: 103.59

USD/JPY – Trading Tips

The USD/JPY is trading at 105.900, breaking below the sideways trading range of 108.500 to 107.100 in the wake of safe-haven appeal. The pair is now in the oversold zone, but the market isn’t moving much as investors seem to wait for the NFP figures, which are coming out during the U.S. session.  

The USD/JPY has formed a Doji pattern near 105.613, and the violation of this could trigger further selling off until 104.300. We need to pay attention to the USD/JPY as the closing of candlesticks above 105.613 level can provide us with buying trade with a take profit of around 107. 

All the best for today! 

Categories
Forex Market Analysis

WTI Crude Oil Prices Rose – Eyes On OPEC Meeting

The WTI crude oil prices rose because the traders evaluated the latest headlines regarding OPEC’s meeting this week. At the moment, the U.S. Crude Oil WTI Futures gained 1.4% to $47.45.

According to earlier reports, the OPEC+ alliance will agree to a total production cut of at least 1 million barrels per day from this quarter onward to fight the impact caused by the deadly coronavirus outbreak.

On the other hand, the prices were also supported by a lower-than-expected rise in crude oil inventories in the United States, easing some concerns of oversupply in the world’s biggest oil consumer.

It is deserving to consider that Saudi Arabia wants extra cuts of 1 million to 1.5 million BPD for the next quarter and to retain current reductions of 2.1 million BPD in place until the end of 2020.

The geopolitical tensions in the Middle East also increased prices. The Saudi-led alliance fighting in Yemen said it had stopped an attack on an oil tanker off Yemen’s coast on the Arabian Sea.

The WTI crude oil inventories rose by 785,000 barrels for the week ended Feb. 28, the EIA said. That contrasted with forecasts for a build of 2.64 million barrels.

Daily Support and Resistance

  • S1 44.01
  • S2 45.76
  • S3 46.52

Pivot Point 47.51

  • R1 48.27
  • R2 49.26
  • R3 51.01

On the technical front, the WTI crude oil prices have completed the 38.2% Fibonacci retracement at 48.50 level. Closing of candles below 38.2% Fibo level is driving further bearish bias for the crude oil, and it may lead its prices towards the next support area of 45. Continuation of a selling trend can cause a further drop to 43.85. Alternatively, the bullish breakout of 48.50 can lead oil towards 50 and 50.54 levels. The MACD is crossing into the selling zone, supporting the bearish bias. Consider looking for sell trades below 47 today to target 46.10 and 45.86. Good luck! 

Categories
Forex Market Analysis

Daily F.X. Analysis, March 05 – Top Trade Setups In Forex – Traders Braces for Choppy Sessions! 

On the forex front, the U.S. Dollar Index rebounded 0.2% on the day to 97.37, snapping a four-day decline, supported by better-than-expected U.S. economic data. The Research firm Markit will publish February German Construction PMI.

The U.S. Commerce Department will post January factory orders (-0.1% on month expected) and final readings of durable goods orders (-0.2% on month expected). The Labor Department will report initial jobless claims in the week ended February 29 (215,000 expected).

Economic Events to Watch Today  


EUR/USD – Daily Analysis

The EUR/USD retreated 0.3% to 1.1138, halting a four-day rally. The European Commission warned that France and Italy could fall into a technical recession, two-quarters of economic contraction, amid coronavirus impacts. On the other hand, official data showed that the eurozone’s retail sales grew 0.6% on month in January, and German retail sales were up 0.9%, both as expected.

If the risk-on sentiment continues to boost, the selling interest around the EUR could increase. At press time, major Asian indices like Japan’s Nikkei, South Korea’s Kospi, Hong Kong’s Hang, and the Shanghai Composite index are reporting notable gains. The S&P 500 futures, however, are shedding 0.90%.

If the OPEC meeting strengthens an oil price bounce, the risk sentiment will likely increase, pushing the EUR currency and other safe-haven currencies lower. The pair is currently sidelined just below 1.1140.

Besides this, the currency pair will likely take cues from the U.S. weekly unemployment claims, Challenger Job Cuts data for February, and the 4th-quarter Unit Labor Costs figure scheduled for release during the North American trading hours. The European data docket is thin.

Daily Support and Resistance

  • S1 1.0955
  • S2 1.1047
  • S3 1.109

Pivot Point 1.1139

  • R1 1.1182
  • R2 1.1231
  • R3 1.1323

EUR/USD– Trading Tips

On Tuesday, the EUR/USD is trading sideways around 1.1179. The EUR/USD may drop to complete the bearish retracement. On the lower side, the 38.2% Fibonacci retracement is likely to support the EUR/USD at 1.1109, and violation of this level can drive more selling until 1.1085 which marks the 61.8% Fibonacci level. The RSI and MACD are in the buying zone but seems to take a bearish. The MACD’s histograms are becoming smaller on the buying side, which suggests the odds of selling in the EUR/USD. Consider taking buy trades above 1.1119.  


GBP/USD– Daily Analysis

The GBP/USD rose 0.5% at 1.2873. The officials from the European Union and the United Kingdom continue to oppose each other in every phase of post-Brexit trade deal talks. The Fisheries matter is the key factor for the British negotiators, and they have given a warning to the deploy Navy to safeguard the waters from the bloc’s ships if no deal is agreed by June.

It is worth to mention that the Sky News spots former business secretary Andrea Leadsom while saying that the government’s previous willingness for a possible no-deal Brexit. Which

Att he coronavirus front, the deadly virus continues to spread outside China with California recently declaring a state of emergency. However, the global policymakers struggle to control the same, and it seems to have helped the risk-tone sentiment. As in result, the U.S. 10-year Treasury yields remain positive above 1%, whereas stocks in Asia are also positive by the press time.

The BOE Governor Mark Carney is scheduled to speak at University College London and will be key to watch for the U.K. central bank’s actions to control COVID-19 implications. However, the incoming Governor Andrew Bailey has already said that the BOE should wait for more clarity about the economic slowdown from the coronavirus outbreak before making any decision to cut interest rates ahead.

Daily Support and Resistance

  • S1 1.2631
  • S2 1.2734
  • S3 1.28

Pivot Point 1.2837

  • R1 1.2903
  • R2 1.294
  • R3 1.3043

GBP/USD– Trading Tip

The GBP/USD is trading with bullish bias after having violated the horizontal resistance level of 1.2885. As suggested earlier, the GBP/USD overall trading bias remains bullish, and it’s pretty much likely to go after the next resistance level of 1.3019.

The GBP/USD’s immediate support is likely to be found around 1.2870, and below this level, the GBP/USD may aim for the 1.2760 area. The MACD and RSI are in the buying zone, supporting the bullish bias for the GBP/USD. Let’s look for long positions above 1.2837 today.  


USD/JPY – Daily Analysis

The USD/JPY currency pair failed to maintain its overnight bullish trend and reached the fresh lower end of its daily trading range near the 107.30 level because of the greenback weakness. The USD/JPY currency pair 107.34 and consolidates in the interval between 107.0 – 107.73.

As we already mentioned that the pair failed to maintain on the previous day’s recovery move from 5-month lows and faced some fresh supply near the 107.75 regions on Thursday in the wake of subdued U.S. dollar price action.

Moreover, the U.S. yields have recovered slightly from the lows seen after the U.S. Fed’s rate cut. The 2-year yield is currently trading at 0.68%, representing a seven basis point gain on the overnight low of 0.61%, and the 10-year yield has recovered to 0.98% from $0.91%. 

As in result, the safe-haven demand for the yen has weakened in Asia. As we already mentioned that the USD/JPY pair is currently trading at 107.27, representing a 0.17% gain on the day, having hit a high of 107.52 a few minutes before press time. 

Daily Support and Resistance

  • S1 105.75
  • S2 106.93
  • S3 107.63

Pivot Point 108.1

  • R1 108.8
  • R2 109.28
  • R3 110.46

USD/JPY – Trading Tips

The USD/JPY is trading at 107.250, staying mostly outside the tight trading range of 108.400 – 107.400. It’s mostly due to the weakness in the U.S. dollar and a slight safe-haven appeal, which is triggered in the wake of Coronavirus. The pair has recovered a bit to complete retracement until 107.650. 

For now, the USD/JPY has formed a bearish series of Doji pattern over 107.013, which could trigger further selling if the 107.013 level gets violated. We need to pay attention to the USD/JPY as the closing of candlesticks below 107.013 level can provide us selling trade with a take profit of around 106.500 and 105.860.  

All the best for today! 
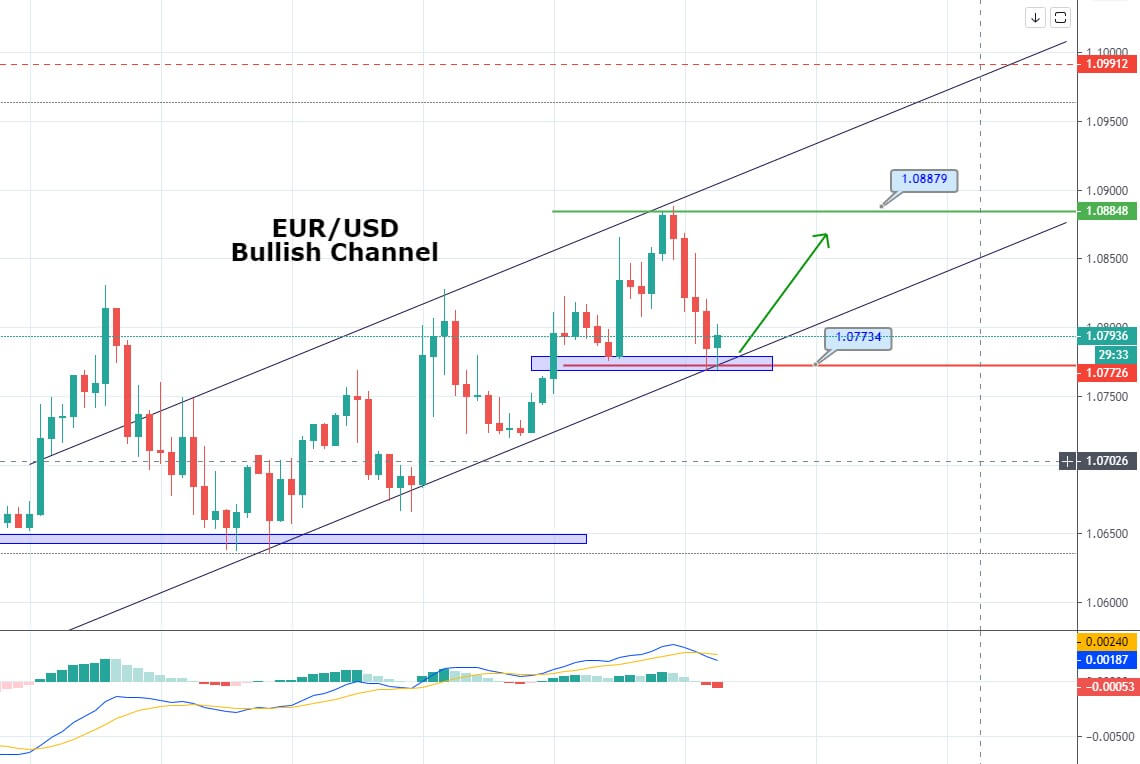
Categories
Forex Market Analysis

Gold Soars Aimed Fed Rate Cut Decision – Quick Trade Plan! 

On Wednesday, the gold prices trade sideways after trading mostly on the higher side on Tuesday. The bullish trend was seen on expectations of interest rate reductions by central banks as influencing policymakers from the Group of Seven (G7) countries gathered to address how to embrace the economic shock from the global coronavirus break.

The Fed made an emergency interest-rate cut, the first one since the global financial crisis of 2008. The cut was of half a percentage point (to a range of 1.00%-1.25%) in response to mounting anxieties about the economic influence of the coronavirus. Fed Chair Jerome Powell pointed out: “The virus and the measures that are being taken to contain it will inevitably weigh on economic activity for some time, both here and abroad, however, we do consider that our work will contribute a meaningful addition to the economy.

Besides, the Reserve Bank of Australia lowered its benchmark interest rate by 25 basis points to a record low of 0.50%, saying that it is prepared to ease monetary policy further to support the economy amid the impact of the coronavirus.

The gold will probably trade higher further as traders seek to park their funds into safe-haven assets such as gold. It is mostly due to concerns over the global economic slowdown. 

The coronavirus is presently expanding faster outside China, and the US Fed’s emergency rate reduction disturbed financial markets; thus, the demand for safe assets like gold will grow.


Daily Support and Resistance

Support    Resistance 

1,606.47    1,662.39

1,572.03    1,683.87

1,516.11    1,739.79

Pivot Point 1,627.95

At the moment, gold is expected to gain a critical resistance near 1,651 level, and breach of this can stretch the bullish trend till 1,662. As we can see on the 4-hour chart above, the gold has formed a Doji candle followed by a strong bullish candle, which is suggesting that there are chances of a bearish retracement below 1,652 level. On the lower side, the immediate support stays around 1,632 and 1,613. Let’s consider staying bullish above 1627.95 and bearish below 1,652 today. Good luck! 

Categories
Forex Market Analysis

Daily F.X. Analysis, March 04 – Top Trade Setups In Forex!

On the forex front, the U.S. dollar weakened against other major currencies, dragged by the Fed’s emergency rate cut. The ICE U.S. Dollar Index fell 0.2% on the day to 97.14. Most of this came in response to the U.S. Fed fund rate cut on Tuesday

Later today, February Automatic Data Processing (ADP) jobs report (+170,000 private jobs expected) and the Fed’s Beige Book economic report will be released.

February Markit U.S. Service PMI (final reading, 49.4 expected) and Institute for Supply Management’s (ISM) Non-Manufacturing PMI (54.9 expected) will also be reported.

Economic Events to Watch Today  


EUR/USD – Daily Analysis

The EUR/USD rose 0.4% to 1.1179, posting a four-day rally. Official economic figures revealed that the eurozone’s jobless rate was steady at 7.4% in January, and CPI grew 1.2% on year in February, both as expected.

The EUR currency performed as a safe-haven currency during the recent periods of Coronavirus. This is evident from EUR/USD’s near 90-degree surge from 1.0788 to 1.12 seen in the last 8- trading days. Therefore, the EUR currency will likely decrease further if the risk sentiment improves, allowing a big decline in EUR/USD. As in result, the futures on the S&P 500 are reporting a 1.2% gain. 

Looking forward, German and Eurozone retail sales and final German and Eurozone PMI readings will be key to watch by traders. The US ISM non-manufacturing (Feb) will take center stage. The research firm Markit will report data of February Services PMI for the eurozone (52.8 expected), Germany (53.3 expected), France (52.6 expected), the U.K. (53.3 expected), and the U.S. (49.4 expected).

The European Commission will post January retail sales (+0.6% on month expected). The German Federal Statistical Office will report January retail sales (+0.9% on month expected).

Daily Support and Resistance

  • S1 1.0826
  • S2 1.0972
  • S3 1.1053

Pivot Point 1.1119

  • R1 1.1199
  • R2 1.1265
  • R3 1.1412

EUR/USD– Trading Tips

The EUR/USD is trading upward near 1.1179, as the pair seems to trade in the overbought zone. Bulls seem to get exhausted, and sooner or later, the EUR/USD may drop to complete the bearish retracement. On the lower side, the 38.2% Fibonacci retracement is likely to support the EUR/USD at 1.1109, and violation of this level can drive more selling until 1.1085 which marks the 61.8% Fibonacci level. 

The RSI and MACD are in the buying zone but seems to take a bearish. The MACD’s histograms are becoming smaller on the buying side, which suggests the odds of selling in the EUR/USD. Consider taking buy trades above 1.1119.  


GBP/USD– Daily Analysis

The GBP/USD rebounded 0.6% at 1.2823, snapping a four-day losing streak. The Markit U.K. Construction PMI climbed to 52.4 in February (49.0 expected) from 48.4 in January.

The Asian markets got supported by the decisions of the nation of fiscal measures that their Western counterparts, like the Federal Reserve, which recently delivered the rate cut. While portraying the risk-recovery, the MSCI’s gauge of Asia-Pacific shares outside Japan registers 0.80% gains with Japan’s NIKKEI marking 0.40% profits by the time of writing.

Moving on, the investors will now keep their eyes on the coronavirus headlines as well as the related actions from the global policymakers for fresh impulse. 

On the economic front, final readings of the U.K. Services PMI for February, expected 53.3, followed by the US ISM Non-Manufacturing PMI, forecast 54.9 against 55.5 prior, will be key to watch.


Daily Support and Resistance

  • S1 1.2559
  • S2 1.267
  • S3 1.2712

Pivot Point 1.2781

  • R1 1.2823
  • R2 1.2892
  • R3 1.3003

GBP/USD– Trading Tip

The GBP/USD is rangebound, mostly trading in between 1.2850 – 1.2750 area. However, the GBP/USD overall trading bias remains primarily bearish. So far, the pair is forming neutral candles within this range, as it seems like investors are waiting for a solid reason to determine the next trends.

The GBP/USD’s immediate support is likely to be found around 1.2755, and below this level, the GBP/USD may aim for the 1.2660 area. The MACD and RSI are in the selling zone, supporting the bearish bias for the GBP/USD. Let’s look for short-trades below 1.2781 and bull trades above the same level today. 


USD/JPY – Daily Analysis

The USD/JPY currency pair flashing green and hit the bullish track from the 5-month lows mainly due to the uptick in the Asian equities, although, the bullish trend has been capped nearby 107.50 recently. But for now, the currency pair is currently trading at 107.59 and consolidates in the range between the 106.86 – 107.69.

At the equities front, the Major Asian indices, except Australia’s S&P/ASX 200, are reporting modest gains at press time. Asian investors seem to have taken heart from the decision by the U.S. Federal Reserve (Fed) to cut rates by 50 basis points, the single biggest cut in over a decade. 

Currently, Japan’s Nikkei is scoring 0.37%, and South Korea’s Kospi is up 1.4%. The Shanghai Composite index is also adding 0.14% along with a 0.80% gain in the S&P 500 futures. 

Moreover, the U.S. yields have recovered slightly from the lows seen after the U.S. Fed’s rate cut. The 2-year yield is currently trading at 0.68%, representing a seven basis point gain on the overnight low of 0.61%, and the 10-year yield has recovered to 0.98% from $0.91%. 

As in result, the safe-haven demand for the yen has weakened in Asia. As we already mentioned that the USD/JPY pair is currently trading at 107.27, representing a 0.17% gain on the day, having hit a high of 107.52 a few minutes before press time. 

Daily Support and Resistance

  • S1 105.75
  • S2 106.93
  • S3 107.63

Pivot Point 108.1

  • R1 108.8
  • R2 109.28
  • R3 110.46

USD/JPY – Trading Tips

On Wednesday, the safe-haven currency pair USD/JPY is trading at 107.550, having violated a narrow trading range of 108.400 – 107.400 due to the weakness in the U.S. dollar. However, the pair has recovered a bit to complete retracement until 107.650. The USD/JPY pair is still trading with a mixed bias around 107.555, and it has a high probability of moving towards the next support level of 107 and 1o6.65p.

We see on the 4-hour chart, the USD/JPY has created a bearish engulfing pattern under 108.350, which could trigger further selling until 107.338. We need to pay attention to the USD/JPY as the closing of candlesticks above 108.338 level can provide us with a secure buy trade with a take profit of around 109.650.  

All the best for today! 

Categories
Forex Market Analysis

Daily F.X. Analysis, March 03 – Top Trade Setups In Forex – Monetary Policy Report & G7 Meeting Under Spotlight! 

The Asian session was all about the Reserve Bank of Australia, and it’s a policy decision. The Reserve Bank of Australia’s (RBA) interest rate settlement at 0330 GMT was closely followed as it is the critical policy meeting since last week’s exciting change in money market pricing. The RBA has cut the interest rate by the 25-basis-point cut is all but inevitable, devising the Australian dollar exposed to a bearish bias.

The research firm Markit will publish February U.K. Construction PMI (49.0 expected). The European Commission will report February CPI (+1.2% on-year expected), January PPI (-0.4% on year expected), and jobless rate (steady at 7.4% expected).

Economic Events to Watch Today 


EUR/USD – Daily Analysis

The EUR/USD jumped 1.1% to 1.1146, the highest level since mid-January. European Central Bank President Christine Lagarde stated that ECB stands ready to “take appropriate and targeted measures,” amid risks to the economic outlook from the coronavirus epidemic.  

Later today, the eurozone’s January jobless rate (steady at 7.4% expected) and February CPI (+1.2% on-year estimated) will be reported.

Overall the risk sentiment remains mixed as the European stocks stabilized, with the Stoxx Europe 600 Index edging up 0.1%. The U.K.’s FTSE 100 rose 1.1%, and France’s CAC was up 0.4%, while Germany’s DAX dropped 0.3%.

Investor’s focus will remain on the research firm Markit which will publish February U.K. Construction PMI (49.0 expected). The European Commission will report February CPI (+1.2% on-year expected), January PPI (-0.4% on year expected), and jobless rate (steady at 7.4% expected).

Daily Support and Resistance

  • R3: 1.1412
  • R2: 1.1265
  • R1: 1.1199

Pivot Point 1.1119

  • S1: 1.1053
  • S2: 1.0972
  • S3: 1.0826

EUR/USD– Trading Tips

The EUR/USD is trading upward near 1.1109, as the pair seems to trade in the overbought zone. Bulls seem to get exhausted, and sooner or later, the EUR/USD may drop to complete the bearish retracement. On the lower side, the 38.2% Fibonacci retracement is likely to support the EUR/USD at 1.1095, and violation of this level can drive more selling until 1.1035 which marks the 61.8% Fibonacci level. 

The RSI and MACD are in the buying zone but seems to take a bearish. The MACD’s histograms are becoming smaller on the buying side, which suggests odds of selling in the EUR/USD. Consider taking sell trades below 1.1150. 


GBP/USD– Daily Analysis

The GBP/USD dropped 0.4% at 1.2804, down for a fourth straight session. Bank of England governor Mark Carney said BOE is working with the government and international authorities to “ensure all necessary steps are taken to protect financial and monetary stability”. The fury of the Coronavirus has led some investors to believe central banks will be expected to go behind dovish monetary policy to underpin the economy against the potential threat of a coronavirus. 

The Sterling continues trading with a bearish bias as the interest rate cut sentiment from 0.75% to 0.50% remains pretty stable. The Sterling also places a four-and-a-half-month low during the previous week versus the greenback as concerns of the economic collapse from the extensive Coronavirus provoked a dramatic selling in with worldwide markets.

The Bank of England announced it was serving with Britain’s finance ministry and international allies to ensure “all necessary measures are exercised” to preserve the banking system and the larger economy.

The GBP/USD also faced a bearish pressure as the global influence of the Coronavirus is beginning to show on a post-election improvement in U.K’s manufacturing, which came out on Monday. 

Daily Support and Resistance

  • R3: 1.3209
  • R2: 1.3015
  • R1: 1.2916

Pivot Point 1.2821

  • S1: 1.2722
  • S2: 1.2627
  • S3: 1.2432

GBP/USD– Trading Tip

The GBP/USD is consolidating in a sideways range, where the overall bias remains mostly bearish. The GBP/USD has already violated the previous narrow trading range of 1.2980 – 1.2880. On the 4-hour chart, the Cable has violated the descending triangle pattern, which is still keeping the pair under 1.2880. 

Below this level, the GBP/USD may aim for the 1.2660 area. The MACD and RSI are in the selling zone, supporting the bearish bias for the GBP/USD. Let’s look for short-trades below 1.2966 and bull trades above the same level today. 


USD/JPY – Daily Analysis

The USD/JPY rebounded 0.2% to 108.29. The safe-haven Japanese yen soared versus the greenback on Tuesday, as the traders curbed expectations for global monetary policy easing with concerns about its balance and effectiveness in fighting the economic collapse from the coronavirus break.

On Tuesday, the G7 finance diplomats and central bank directors carry a conference call later to consider steps to dispense with the outbreak and its widening economic radioactivity.

The call, which French and Italian experts, is scheduled at 1200 GMT, and with this, the traders are already betting on the sentiment that the U.S. Federal Reserve will begin a series of global monetary easing.

The dollar dropped 0.5% to 107.80 yen and trimmed lower on the Swiss franc to 0.9576 francs following a report that the G7 officials are meeting to decide no fresh fiscal or monetary pledges. In the U.S., the coronavirus-related death toll has grown to six. South Korea reported a total of 4,335 cases (28 deaths), Italy 2,036 cases (52 deaths), and Iran 1,501 cases (66 deaths).

Daily Support and Resistance

  • R3: 113.5
  • R2: 112.2
  • R1: 111.46

Pivot Point 110.9

  • S1: 110.16
  • S2: 109.6
  • S3: 108.29

USD/JPY – Trading Tips

The USD/JPY consolidates in a narrow trading range of 108.400 – 107.400 as the weakness in the U.S. dollar and stronger Japanese yen keeps the pair tossed. The USD/JPY pair recovered slightly in the wake of a bullish correction, but more selling pressure seems to come soon. The pair is trading bearish at 107.775, and it has high probability of moving towards the next support level of 107.338.

We can see on the 4-hour chart above, the USD/JPY has formed a bearish engulfing pattern below 108.350, which may trigger further selling until 107.338. We need to keep an eye in the USD/JPY as the closing of candles above 108.338 level can help us secure a buy trade with a take profit of around 109.650.  

All the best for today!