Categories
Forex Market Analysis

Gold Bearish Engulfing In-Play – Is It Gold time to Short Gold?

On Monday, the precious metal gold surged over 1.5%, improving from its most significant one-day drop in almost seven years, on the odds for Fed fund rate cut by the U.S. Federal Reserve to diminish the economic impact from the coronavirus break.

On Friday, the yellow metal slipped dramatically by more than 4.5% for its most significant daily decline since June 2013 as traders liquidated positions to meet margin calls in other securities.

Monday has been a painful start to the week for some investors with further drop-offs in a variety of markets occurring at the market open.

It marks the 6th day of declines in a row, which we have not seen in some time, so traders should prepare themselves for the possibility that this week will likely be filled with negative data, driven by coronavirus fears.

Last weekcoronavirus fear resurfaced, and this helped to trigger a good number of trend line breakout trades, which I hear that some of you have been able to catch.

The virus came back into focus late last week, and this tipped the U.S. major stock indices into negative territory; note how much of Saturday’s CNBC front-page was dedicated to virus-related issues.

XAU/USD – Daily Technical Levels

 Support      Resistance 

1,552.02      1,631.45

1,517.83      1,676.69

1,438.4        1,756.12

Pivot Point 1,597.26

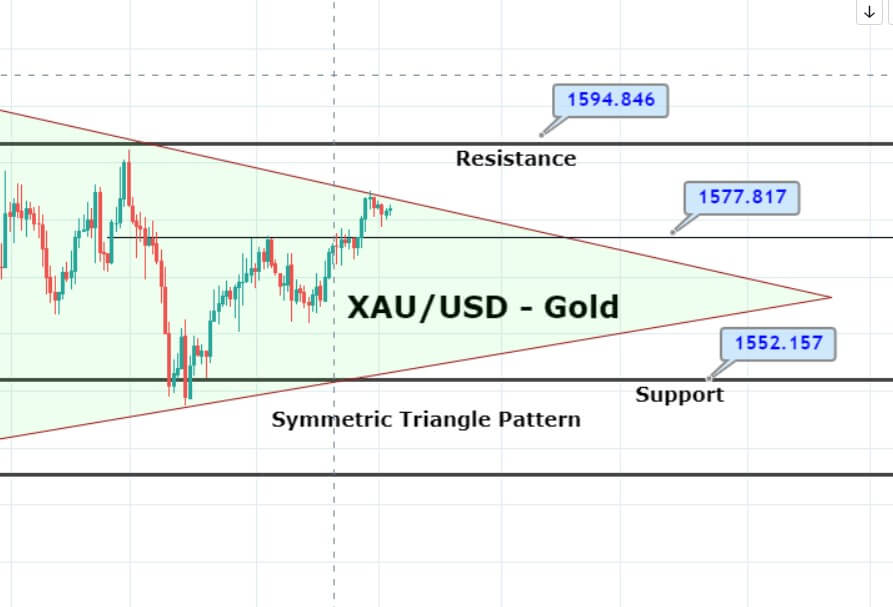
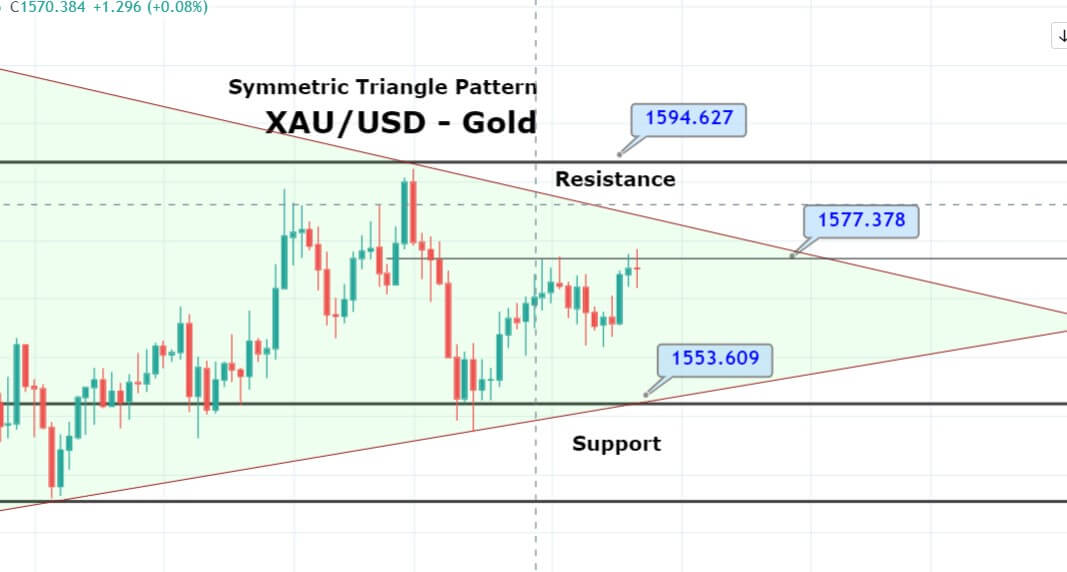
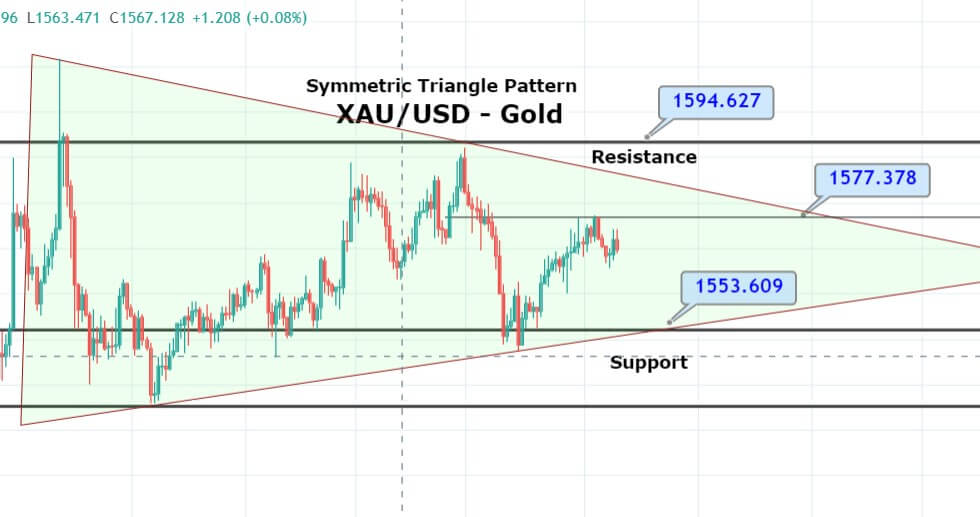
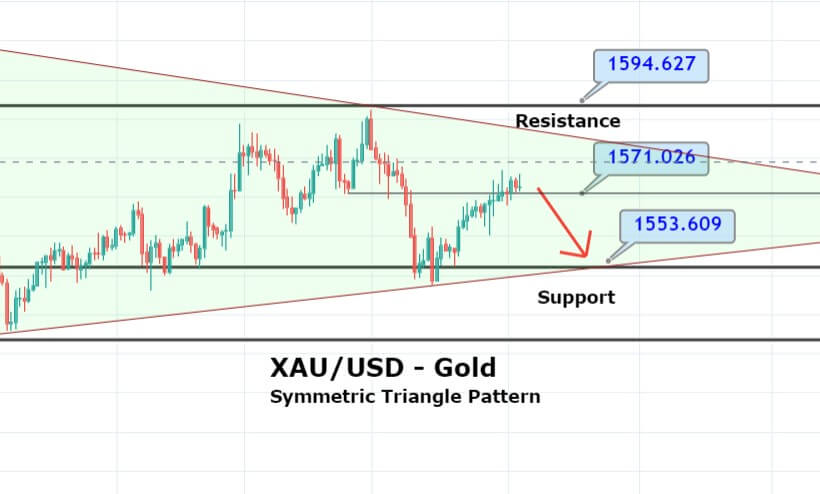
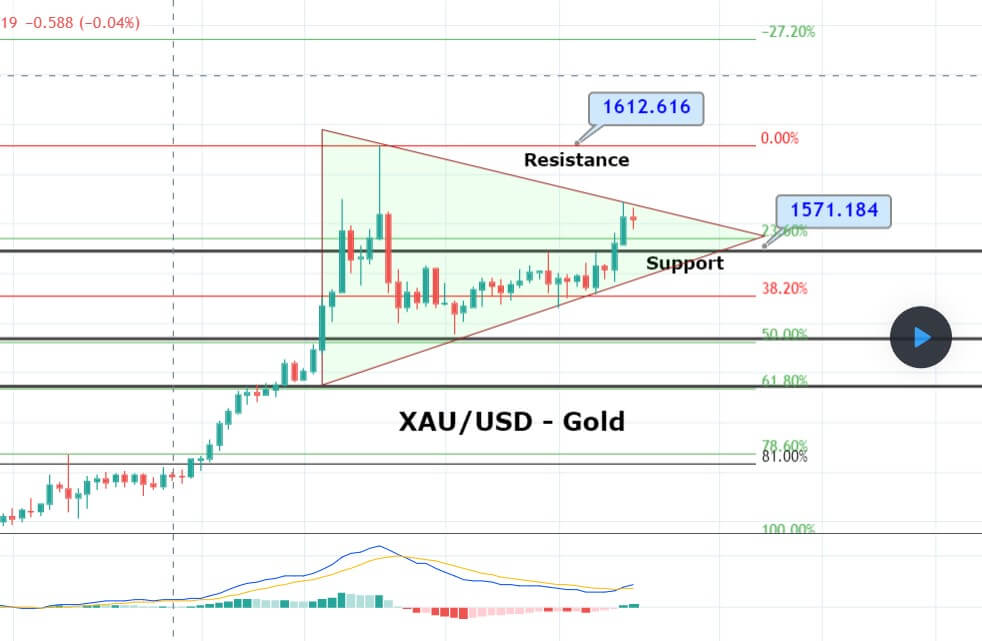
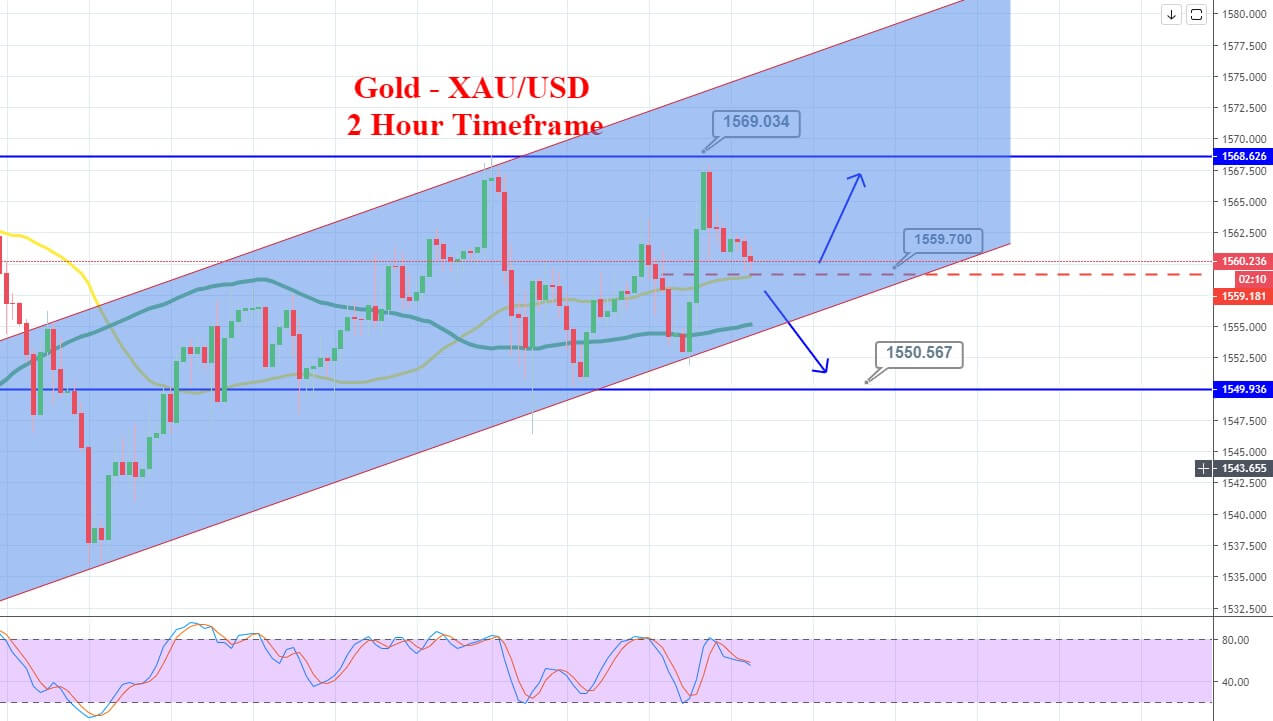
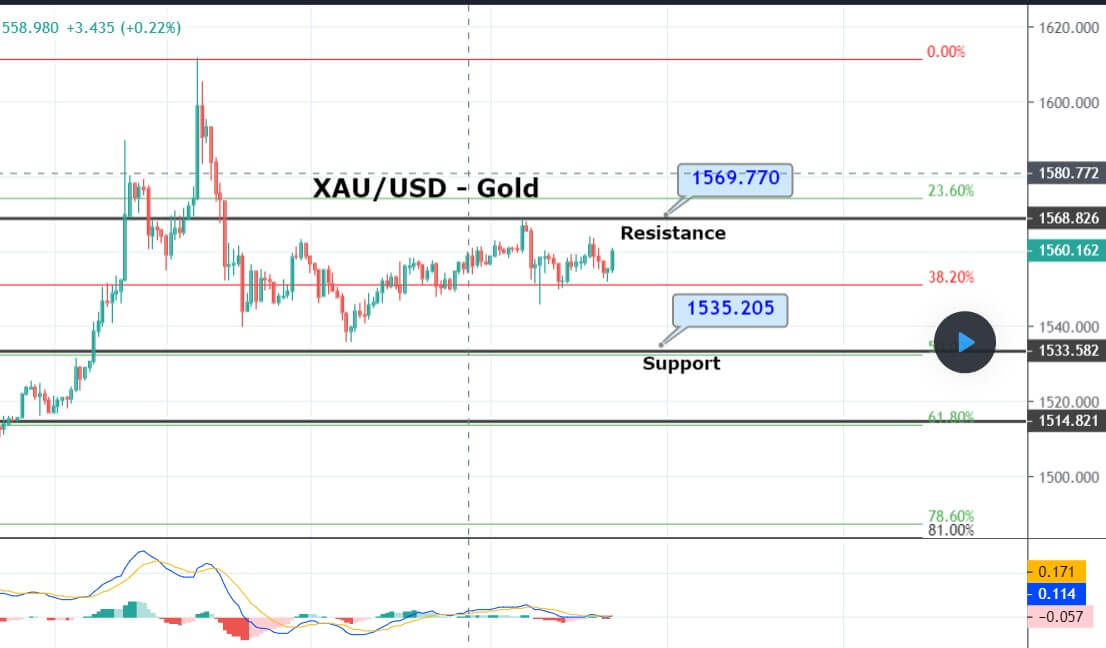
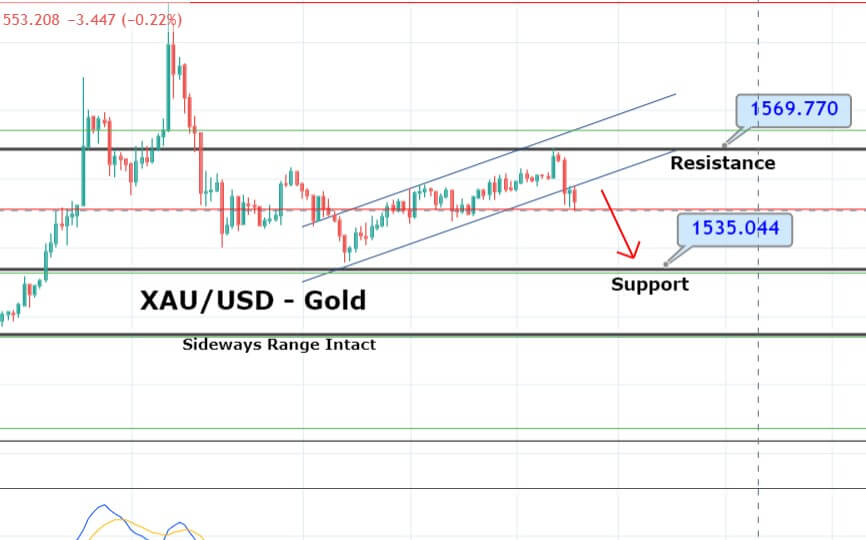
On the technical front, gold has closed a bearish engulfing candle around 1,593. Typically such patterns trigger further selling in the XAU/USD, and we may see gold prices going after the next immediate support level of 1,580. Violation of this level can extend further selling until 1,572. Alternatively, the resistance stays around 1,602. Let’s consider selling trade under 1,597 today. Good luck! 

Categories
Forex Market Analysis

Daily F.X. Analysis, March 02– Top Trade Setups In Forex – Buckle up for Series of Manufacturing PMI 

Earlier today, during the Asian trading hours, EUR/USD extended its rally to 1.1056, and GBP/USD edged up to 1.2826 as traders seem to do profit-taking in the Greenback.

The eyes now will remain on the research firm Markit will publish final readings of February Manufacturing PMI for the eurozone (49.1 expected), Germany (47.8 expected), France (49.6 expected), the U.K. (51.9 expected) and the U.S. (50.8 expected). The Bank of England will release the number of mortgage approvals in January (68,000 expected) and the M4 money supply.

Economic Events to Watch Today 


EUR/USD – Daily Analysis

The EUR/USD rose 0.2% to 1.1026. Official data showed that Germany’s jobless rate was steady at 5.0% in January, and CPI grew 1.7% on year in February, both as expected.

The dollar has traded near a three-month high against the Euro as worries over the outbreak of Coronavirus has driven sharp volatility in the market, mostly driving dollar prices higher. The Euro has tried to rally higher during the Asian trading session on Monday but continues to encounter resistance above. 

The European stocks were also deep in the red, with the Stoxx Europe 600 Index falling a further 3.5%. Germany’s DAX dropped 3.9%, the U.K.’s FTSE 100 lost 3.2%, and France’s CAC was down 3.4%.

The eyes will remain on the final readings of February Manufacturing PMI for the eurozone (49.1 expected), Germany (47.8 expected), France (49.6 expected), the U.K. (51.9 expected), and the U.S. (50.8 expected). The U.S. Commerce Department will report construction spending in January (+0.6% on month expected). The Institute for Supply Management will post its manufacturing index for February (50.5 expected).

Daily Support and Resistance

  • S1 1.092
  • S2 1.0842
  • S3 1.0799

Pivot Point 1.0963

  • R1 1.1041
  • R2 1.1084
  • R3 1.1162

EUR/USD– Trading Tips

The EUR/USD is trading bullish near 1.1116, as the pair seems to go further higher after violating double top resistance at 1.1097. Chances of further buying in the EUR/USD remains pretty high until 1.1140 and 1.1185. The pair may find immediate support around 1.1095, which is mostly extended horizontal support level. The MACD and RSI still stay on the bullish side and are signaling odds of more buying in the pair. The EUR/USD may find resistance around 1.1140 and 1.1185, so let’s look for bullish trends above 1.1085.


GBP/USD– Daily Analysis

The GBP/USD dropped 0.5% at 1.2821, the lowest level since mid-October last year. The U.K. government is expected to publish a negotiating mandate for the future relationship with the European Union. 

The outbreak of the Coronavirus has directed some traders to think central banks will be required to go after dovish monetary policy to support the economy against the potential threat of a coronavirus. The Sterling is still trading with a bearish bias as the interest rate cut sentiment from 0.75% to 0.50% remains pretty solid. 

Prime Minister Boris Johnson’s Tories succeeded December’s election, extending his hold on parliament and pushing some Brexit risk, the Sterling was trading near 83 pence per Euro, and it also gained some support against the U.S. dollar.

The Bank of England will release the number of mortgage approvals in January (68,000 expected) and the M4 money supply.

Daily Support and Resistance

  • R3: 1.3209
  • R2: 1.3015
  • R1: 1.2916
  • Pivot Point 1.2821
  • S1: 1.2722
  • S2: 1.2627
  • S3: 1.2432

GBP/USD– Trading Tip

The GBP/USD continues trading with a bearish bias, breaking out of a narrow trading range of 1.2980 – 1.2880. On the 4-hour chart, the Cable has formed violated the descending triangle pattern, which was supporting the Sterling around 1.2880. 

It’s was one of the most crucial trading levels, and violation of this has further open room for selling until 1.2755 area. Below this level, the GBP/USD has the potential to go after the 1.2660 area. The MACD and RSI are holding in the selling zone, supporting bearish bias for the GBP/USD pair. Let’s look for selling trades below 1.2966 and bullish above the same level today. 


USD/JPY – Daily Analysis

The USD/JPY rebounded to 109.30. This morning, government data showed that Japan’s fourth-quarter capital spending declined 3.5% on year (-2.6% expected). The USD/JPY extended its decline to 109.30. This morning, government data showed that Japan’s jobless rate rose to 2.4% in January (steady at 2.2% expected), while industrial production grew 0.8% on month in January (+0.2% expected) and retail sales climbed 0.6% (-0.1% expected).

The Coronavirus is growing in the Middle East, Europe, and another area of the world, as Brazil verified its initial case in Latin America, while other regions of China found to lower their emergency response level as the number of new cases recorded there proceeds to reduce.

The Greenback is now trading with a slightly bearish bias amid forecasts that the U.S. Federal Reserve may lower the interest rates this year to control downside influence on the economy produced by China’s coronavirus outbreak.

Daily Support and Resistance

  • R3: 113.5
  • R2: 112.2
  • R1: 111.46

Pivot Point 110.9

  • S1: 110.16
  • S2: 109.6
  • S3: 108.29

USD/JPY – Trading Tips

The USD/JPY continues with its bearish momentum on Monday in the wake of weakness in the U.S. dollar and stronger Japanese yen. The USD/JPY pair is recovered a bit in the wake of a bullish correction, but more selling seems to come soon. The USD/JPY is trading bearish at 107.775, and it has high odds of going towards the next support level of 107.338.

We can see on the 4-hour chart above, the USD/JPY has formed a bearish engulfing pattern below 108.350, which may trigger further selling until 107.338. We need to keep an eye in the USD/JPY as the closing of candles above 108.338 level can help us secure a buy trade with a take profit of around 109.650.  

All the best for today! 

Categories
Forex Market Analysis

Gold on a Bearish Mode, Coronavirus Continues to Outbreak! 

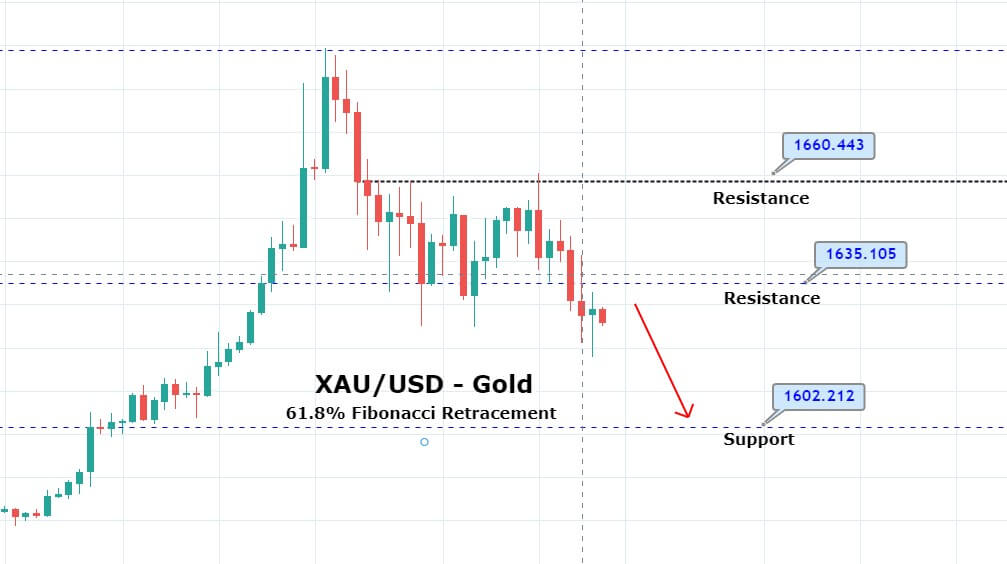
On Friday, the precious metal gold trades bearish, falling from 1,635 to 1,624 support level. It seems like traders are doing profit-taking ahead of the weekend. The bearish trend in gold continues despite a drop in stock prices. 

Global share prices directed for the most critical week since the world financial crunch in 2008 as traders braced for the disease to shift a pandemic and swiftly spread around the globe. Most of the selling triggered after mainland China had 327 new confirmed cases of infections on Thursday, the National Health Commission announced on Friday. 

Besides, Iran reported that its death toll climbed to 26, by far the highest figures outside China, and the total number of infected people held at 245, which also include several senior officials.


Gold – XAU/USD – Daily Technical Levels

Support Resistance 

1633.48 1658.64

1621.83 1672.15

1596.67 1697.32

Pivot Point 1646.99

On the technical side, the precious metal gold is trading at 1,623 level after violating the double bottom support area of 1,633 level. Looking at the leading technical indicators, the XAU/USD’s MACD has crossed below 0, which is suggesting chances of bearish trend continuation. 

Gold may find immediate support around 1,612 for now, and below this, the 61.8% will remain in focus, which may extend support around 1,602 level. Today, we can look for selling trades below 1,626 area. Good luck!   

Categories
Forex Market Analysis

Daily F.X. Analysis, February 28 – Top Trade Setups In Forex – Brace for U.S. Economic Events!

On the forex front, the U.S. Dollar Index dropped 0.6% on the day to a three-week low of 98.39, as the European Central Bank played down the impact of the coronavirus outbreak. Meanwhile, Chicago Federal Reserve Bank President Charles Evans said the Fed “must be prepared to rely on unconventional tools” in the event of a recession.

Economic Events to Watch Today 


EUR/USD – Daily Analysis

The EUR/USD surged 1.1% to 1.1001. European Central Bank President Christine Lagarde said the Coronavirus was not yet at the stage where monetary policy response is required. On the other hand, official data showed that the Eurozone’s Economic Confidence Index climbed to 103.5 in February (102.8 expected) from 102.6 in January.

The dollar has traded near a three-month high against the Euro as worries over the outbreak of Coronavirus has driven sharp volatility in the market, mostly driving dollar prices higher. 

The Euro has tried to rally higher during the Asian trading session on Thursday but continues to encounter resistance above. We are in a strong downtrend, and the EUR/USD is exhibiting correction of that downtrend as it could lead the EUR/USD prices towards the next target level of 10925. 

The German Federal Statistical Office will report February jobless rate (steady at 5.0% expected) and CPI (+1.7% on-year expected). France’s INSEE will post final readings of 4Q GDP (+0.8% on-year expected) and February CPI (+1.5% on-year expected).

Daily Support and Resistance

  • S1 1.092
  • S2 1.0842
  • S3 1.0799

Pivot Point 1.0963

  • R1 1.1041
  • R2 1.1084
  • R3 1.1162

EUR/USD– Trading Tips

The EUR/USD is consolidating near 1.1016, as the pair seems to go further higher after violating the 61.8% Fibonacci retracement at 1.0970. Chances of further buying in the EUR/USD remains pretty high until 1.1020 and 1.1065. The pair may find immediate support around 1.09540, which is mostly extended horizontal support level. The MACD and RSI still remain on the bullish side and are signaling odds of more buying in the pair. The EUR/USD may find resistance around 1.1020 and 1.1065, so let’s look for bullish trends above 1.0963.


GBP/USD– Daily Analysis

The GBP/USD erased early gains to close down 0.1% at 1.2888. The British government said it might start planning for a no-deal Brexit if a trade deal with the European Union is not apparent by June.

The U.K. government is expected to publish a negotiating mandate for the future relationship with the European Union. James Slack, the Prime Minister’s spokesman, told reporters: “At the end of this year we will regain in full our political and economic independence.” On the other hand, it is reported that the government might delay its budget decision, which is scheduled for March 11, amid uncertainty over the economic outlook.

The outbreak of the Coronavirus has directed some traders to think central banks will be required to go after dovish monetary policy to support the economy against the potential threat of a coronavirus. The Sterling is still trading with a bearish bias as the interest rate cut sentiment from 0.75% to 0.50% remains pretty solid. 

Prime Minister Boris Johnson’s Tories succeeded December’s election, extending his hold on parliament and pushing some Brexit risk, the Sterling was trading near 83 pence per Euro, and it also gained some support against the U.S. dollar.

In the U.K., the Nationwide Building Society will publish its house price index for February (+0.4% on month expected).

Daily Support and Resistance

  • S1 1.2850
  • S2 1.2812
  • S3 1.2764

Pivot Point 1.2898

  • R1 1.2936
  • R2 1.2984
  • R3 1.3022

GBP/USD– Trading Tip

On Friday, the GBP/USD continues trading with a mixed bias, following a narrow trading range of 1.2980 – 1.2880. As we can see on the 4-hour chart above, the Cable has formed a descending triangle pattern which is supporting the Sterling around 1.2880. It’s one of the most crucial trading levels as a violation of this can open further room for selling until 1.2795 area. Alternatively, the GBP/USD has the potential to go after 1.3070 if it manages to trade above 1.2960 support. The MACD and RSI are holding in the selling zone, supporting bearish bias for the GBP/USD pair. Let’s look for selling trades below 1.2966 and bullish above the same level today. 


USD/JPY – Daily Analysis

The USD/JPY extended its decline to 109.30. This morning, government data showed that Japan’s jobless rate rose to 2.4% in January (steady at 2.2% expected), while industrial production grew 0.8% on month in January (+0.2% expected) and retail sales climbed 0.6% (-0.1% expected).

The Coronavirus is growing in the Middle East, Europe, and another area of the world, as Brazil verified its initial case in Latin America, while other regions of China found to lower their emergency response level as the number of new cases recorded there proceeds to reduce.

The Greenback is now trading with a slightly bearish bias amid forecasts that the U.S. Federal Reserve may lower the interest rates this year to control downside influence on the economy produced by China’s coronavirus outbreak.

The U.S. official data showed that the fourth-quarter GDP (second reading) grew 2.1% on the quarter (as expected). Durable goods orders (preliminary reading) declined 0.2% on month in January (-1.4% expected). The number of initial jobless claims rose to 219,000 in the week ended February 22 (212,000 expected). Consequently, the USD/JPY is trying to gain support in the wake of positive economic data. 

Daily Support and Resistance

  • R3: 113.5
  • R2: 112.2
  • R1: 111.46

Pivot Point 110.9

  • S1: 110.16
  • S2: 109.6
  • S3: 108.29

USD/JPY – Trading Tips

The USD/JPY continues with its bearish momentum on Friday in the wake of weakness in the U.S. dollar and stronger Japanese yen. The USD/JPY pair is holding trading dramatically bearish at 108.875, and it has high odds of going towards the next support level of 108.338. We can see on the 4-hour chart above, the USD/JPY has formed a bearish engulfing pattern below 109.650, which may trigger further selling until 108.338. We need to keep an eye in the USD/JPY as the closing of candles above 108.338 level can help us secure a buy trade with a take profit of around 109.650.  

All the best for today! 

Categories
Forex Market Analysis

Daily F.X. Analysis, February 27 – Top Trade Setups In Forex – Brace for U.S. Economic Events!

On the forex front, the U.S. dollar stabilized on Wednesday, with the ICE U.S. Dollar Index gaining 0.2% on the day to 99.14. The European Central Bank will report the Eurozone’s M3 money supply in January (+5.3% on-year expected), February Economic Confidence Index (102.8 expected), and final readings of Consumer Confidence Index (-6.6 previously). Let’s take a look at trade ideas…

Economic Events to Watch Today 


EUR/USD – Daily Analysis

The EUR/USD pair managed to cross the high level of 1.0890 as the U.S. yields continue to flash red in the wake of coronavirus fears. Whereas, the 10-year Treasury note is currently trading at 1.37%, representing a five basis point profit on the record low of 1.32%. 

Overall, the Greenback has traded near a three-month high against the Euro as worries over the outbreak of Coronavirus has driven sharp volatility in the market, mostly driving dollar prices higher. 

The Euro has tried to rally higher during the Asian trading session on Thursday but continues to encounter resistance above. We are in a strong downtrend, and the EUR/USD is exhibiting correction of that downtrend as it could lead the EUR/USD prices towards the next target level of 10925. 

On Thursday, there won’t be any meaningful macroeconomic data releases from the Eurozone. Still, the markets will remain focused on coronavirus headlines and the U.S. economic figures, especially the Prelim GDP q/q and Durable Goods Orders m/m.

Daily Support and Resistance

  • S1 1.0747
  • S2 1.0807
  • S3 1.0844

Pivot Point 1.0867

  • R1 1.0905
  • R2 1.0928
  • R3 1.0988

EUR/USD– Trading Tips

The EUR/USD is consolidating near 1.0916, as the pair seems to go for completing 50% Fibonacci retracement at 1.0930. The pair appears to have initiate correction as it has previously achieved 38.2% Fibonacci retracement at 1.08930. The MACD is crossing above 0 level, which suggests.

Chances of further buying in the EUR/USD. The pair may find immediate support around 1.08540, which is mostly extended by the 50 EMA and a bullish trendline. On the higher side, the EUR/USD may find resistance around 1.0930 and 1.0980. Consider taking bullish trades above 1.0900 today. 


GBP/USD– Daily Analysis

On Thursday, the GBP/USD is trading at 1.2935, falling below the 1.2965 resistance to become a support level. The GBP dropped a day before as forecasts of the Bank of England (BOE) rate cut fueled over-optimism that expansionary fiscal policy would support the U.K. economy.

The outbreak of the Coronavirus has directed some traders to think central banks will be required to go after dovish monetary policy to support the economy against the potential threat of a coronavirus. The Sterling is still trading with a bearish bias as the interest rate cut sentiment from 0.75% to 0.50% remains pretty solid. 

The council approved a decision to allow the opening of the Brexit talks for a new partnership with the U.K. The Commission has also formally nominated the Commission as an E.U. negotiator. Besides, the council has also selected negotiating directives, which constitute a mandate to the Commission for the negotiations.

By comparison, when Prime Minister Boris Johnson’s Tories succeeded December’s election, extending his hold on parliament and pushing some Brexit risk, the Sterling was trading near 83 pence per Euro, and it also gained some support against the U.S. dollar.

Daily Support and Resistance

  • S1 1.2802
  • S2 1.2893
  • S3 1.2949

Pivot Point 1.2937

  • R1 1.304
  • R2 1.3074
  • R3 1.3165

GBP/USD– Trading Tip

On Thursday, the GBP/USD continues trading with a mixed bias, following a narrow trading range of 1.2980 – 1.2880. As we can see on the 4-hour chart above, the Cable has formed a descending triangle pattern which is supporting the Sterling around 1.2880. It’s one of the most crucial trading levels as a violation of this can open further room for selling until 1.2795 area. 

On the other hand, the GBP/USD has the potential to go after 1.3070 if it manages to trade above 1.2960 support. The MACD and RSI are holding in the selling zone, supporting bearish bias for the GBP/USD pair. Let’s look for selling trades below 1.2966 and bullish above the same level today. 


USD/JPY – Daily Analysis

The USD/JPY currency pair is flashing red, falling below the 110.350 resistance. The USD/JPY is holding at 110.14 and consolidates in the range between the 110 – 110.58. However, a stable market tends to weaken the Japanese yen’s safe-haven demand.

The Coronavirus is growing in the Middle East, Europe, and another area of the world, as Brazil verified its initial case in Latin America, while other regions of China found to lower their emergency response level as the number of fresh cases recorded there proceeds to reduce.

The Greenback is now trading with a slightly bearish bias amid forecasts that the U.S. Federal Reserve may lower the interest rates this year to control downside influence on the economy produced by China’s coronavirus outbreak.

The dollar initially traded bullish as the virus outbreak further around the globe, with traders eyeing all U.S. assets as safe-haven investments. Nevertheless, money managers now assume the Fed would be more prone to dovish monetary policy and cut rates, considering the ongoing uncertainties of Coronavirus. 

Daily Support and Resistance

  • R3: 113.5
  • R2: 112.2
  • R1: 111.46

Pivot Point 110.9

  • S1: 110.16
  • S2: 109.6
  • S3: 108.29

USD/JPY – Trading Tips

The USD/JPY has traded mostly in line with the previous forecast and stayed below the horizontal resistance level of 110.350. On the 4 hour timeframe, an upward trendline is extending resistance at 110.350, as the USD/JPY pair failed to break above this mark yesterday. 

For now, the USD/JPY has formed a bearish engulfing pattern below 110.350, which may trigger further selling until 109.50. We need to keep an eye in the USD/JPY as the closing of candles below 110.350 level can help us secure a selling trade with a take profit of around 109.650.  

All the best for today! 

Categories
Forex Market Analysis

Safe Haven Gold Completes 38.2% Retracement – Coronavirus Risk In Play! 

On Wednesday, the precious metal gold prices rose slightly following a sharp decline in the prior session, as a U.S. indication of an imminent pandemic urged traders to seek shelter in safe-haven assets.

Gold prices climbed 0.7% to $1,646.19, having decayed as much as 1.9% in the prior session. On Monday, prices reached their highest level in more than seven years at $1,688.66. Today, the yellow metal gold prices eased 0.1% to $1,648.30.

The United States announced it’s citizens to start planning for the virus to expand inside the country as outbreaks in Iran, South Korea, and Italy intensified. The consequences of the epidemic are expected to reflect beyond China as the most significant markets in the region are anticipated to either slow down significantly, stop or recoil entirely in the current quarter.

The speedy spread of the disease and its influence on global economic movements boosted chances for monetary policy easing by global central banks, with U.S. money market futures now entirely pricing in a 0.25% point cut by the end of June. Nevertheless, U.S. consumer confidence soared in February, implying a constant pace of consumer spending that could boost the economy despite rising fears over the fast-spreading disease.

XAU/USD – Daily Technical Levels

Support     Resistance 

1,643.69     1,682.16

1,628.07     1,705.01

1,589.6       1,743.48

Pivot Point 1666.54

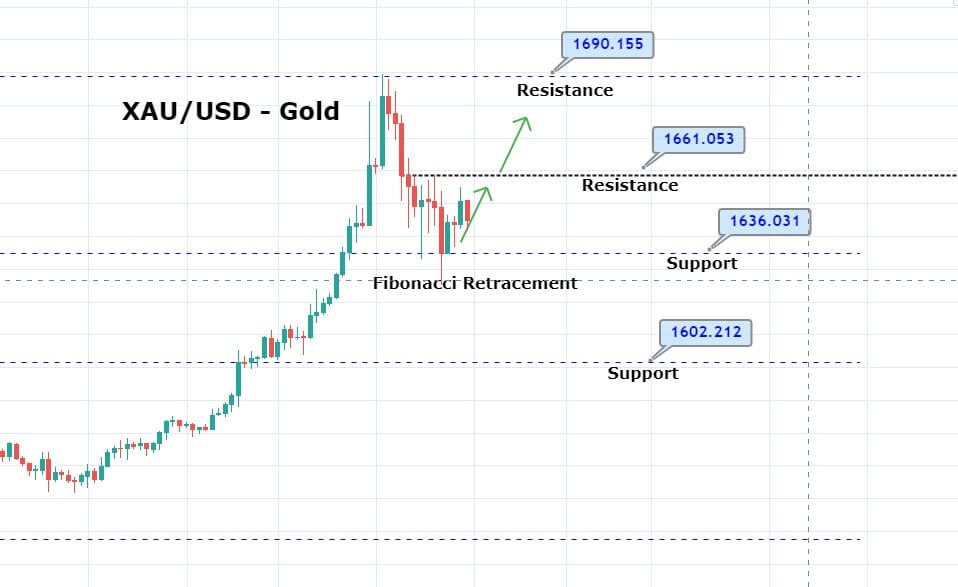
Gold has already completed the 38.2 %Fibonacci retracement at 1,636 level. The MACD and RSI are holding in the selling zone, supporting bearish bias for the gold. Gold has an immediate resistance around 1,660, which may keep gold prices in a bearish mode until this level gets violated. A bearish breakout of 1,636 level can lead to gold prices towards the next support level of 1,619 and 1,609. Both of these levels mark the 50% and 61.8% Fibonacci retracement levels. Let’s consider selling below 1,630 to target 1,626 today. Good luck


Categories
Forex Market Analysis

Daily F.X. Analysis, February 26 – Top Trade Setups In Forex – Mixed Sentiment Dominates! 

On the forex front, the U.S. dollar fell against its major peers, with the ICE Dollar Index declining 0.4% on the day to 99.00. France’s INSEE will release the February Consumer Confidence Index (103 expected).

The U.S. Commerce Department will report January’s new home sales (717,000 units expected). That’s all we have on the economic docket, so let’s take a look at the technical setups for today.

Economic Events to Watch Today 


EUR/USD – Daily Analysis

The EUR/USD fell back towards $1.08, and the Australian dollar dropped to an 11-year low amid the extension of the coronavirus outside China prompted concerns of a pandemic and led traders to take safe-haven shelter in the Greenback.

What’s more surprising is that the safe-haven Japanese yen and the Swiss franc has also gained bullish momentum, but not by much as the U.S. dollar. It seems like the investors are giving more weightage to Greenback, which is keeping the EUR/USD bearish. 

The EUR/USD pair seems to cross the high level of 1.0890 if the U.S. yields continue to flash red in the wake of coronavirus fears. Whereas, the 10-year Treasury note is currently trading at 1.37%, representing a five basis point gain on the record low of 1.32%. 

Looking forward, there won’t be any meaningful macroeconomic data releases on Wednesday, and markets will remain focused on coronavirus headlines.


Daily Support and Resistance

  • S1 1.0747
  • S2 1.0807
  • S3 1.0844
  • Pivot Point 1.0867
  • R1 1.0905
  • R2 1.0928
  • R3 1.0988

EUR/USD– Trading Tips

The EUR/USD pair is trading sideways due to the lack of major economic events. The EUR/USD is consolidating near 1.0850, as investors seem to do profit taking due to lack of volatility. The pair appears to have initiate correction as it has previously achieved 23.6% Fibonacci retracement at 1.08530. 

On the 4 hour timeframe, the EUR/USD pair seems to form a bearish flag that has the potential to drive further selling in the EUR/USD pair. The pair may find immediate support around 1.08540, which is mostly extended by the 50 EMA and a bullish trendline. Above this, the direct currency pair can bounce off until 1.0890, while bearish breakout can lead the pair towards the next support area of 1.0820.


GBP/USD– Daily Analysis

The GBP/USD is trading at 1.2975, above the 1.2965 resistance become a support level. Closings of candles above this level may help secure a buy trade around 1.2975 with a target of 1.3070. Whereas, a bearish breakout of 1.2965 can lead the Cable towards 1.2930

The stronger dollar has capped the gains for the GBP/USD pair. On Wednesday, the dollar has expanded by 0.2% versus a basket of currencies to 99.62. Even though the U.S. economic figures during the previous week came in under economists’ expectations. Money markets are presently pricing in a Federal Reserve interest rate reduction sentiment as Fed is expected to cut rate by 25 basis points in June. A stronger dollar in the wake of coronavirus can hurt the exports from the United States, and Trump may put more pressure on the Fed Chair Powell to introduce the dovish policy in the future. 

On the Brexit front, the council approved a decision to allow the opening of the Brexit talks for a fresh partnership with the U.K. The Commission has also formally nominated the Commission as an E.U. negotiator. Apart from this, the council selected negotiating directives, which constitute a mandate to the Commission for the negotiations.

On the fundamental side, the Sajid Javid’s abrupt departure as Chancellor of the Exchequer recently helped the GBP currency because markets started to price in the possibilities of a significant fiscal expansion in the U.K., repealing the Bank of England rate cut trade. 

Daily Support and Resistance

  • S1 1.2802
  • S2 1.2893
  • S3 1.2949
  • Pivot Point 1.2984
  • R1 1.304
  • R2 1.3074
  • R3 1.3165

GBP/USD– Trading Tip

Technically, the GBP/USD is trading with a mixed bias, following a narrow trading range of 1.2960 – 1.3010. At the moment, the Cable seems to head south to retest the resistance become support level of 1.2965, and closing of doji or reversal candles above this level may help support the GBP/USD pair. 

The GBP/USD has the potential to go after 1.3070 level only if it manages to trade above 1.2960 support. Bearish violation of this level can extend selling until 1.2900 level. The MACD and RSI are holding in the buying zone, supporting bullish bias for the GBP/USD pair. Let’s look for selling trades below 1.2984 and bullish above the same level today. 


USD/JPY – Daily Analysis

The USD/JPY currency pair flashing green rose above the 110.00 handles, the pair continued its recent recovery rally and reached above the 110.00 level mainly due to market stability. The USD/JPY is holding 110.36 and consolidates in the range between the 110.14 – 110.58. However, a stable market tends to weaken the Japanese yen’s safe-haven demand.

The modest recovery in the global risk sentiment allowed the U.S. Treasury bond yields to stage a goodish bounce from all-time lows. This ultimately continued some support to the U.S. dollar and remained supportive of the early uptick.

The renewed strength could be the cause of the uptick in the S&P 500 futures, which are now reporting a 0.70% gain on the day. The state of confusion between the traders is mainly due to the global outbreak of the deadly coronavirus, which is driving traders towards placing bullish bets on gold and the U.S. dollar instead of Japanese yen. Therefore, it will be a good idea to wait for putting some secure follow-through buying after confirming that the recent sharp corrective slide from multi-month tops has already ended.

Looking forward, there isn’t any major market-moving economic data scheduled to release on Wednesday. So, any fresh developments about the coronavirus will play a key role in producing some meaningful trading opportunities.

Daily Support and Resistance

  • R3: 113.5
  • R2: 112.2
  • R1: 111.46

Pivot Point 110.9

  • S1: 110.16
  • S2: 109.6
  • S3: 108.29

USD/JPY – Trading Tips

The USD/JPY has dropped from 112.160 level to 110.135 level just in two trading days. Earlier, we expected it to reverse after completing the 61.8% Fibonacci support level of 110.350, but this level has now been violated. 

On the 4 hour timeframe, an upward trendline was also extending support at 110.350, but the pair failed to hold above this mark, perhaps due to profit-taking in the Greenback. For now, the safe-haven pair is showing a slight bullish correction to retest the support become a resistance area of 110.350. Closing of candles below this level can help us secure a selling trade with a take profit of around 109.650.  

All the best for today! 

Categories
Forex Market Analysis

Daily F.X. Analysis, February 25 – Top Trade Setups In Forex – Coronovirus Dominates Market Sentiment! 

Later today, the Conference Board’s Consumer Confidence Index for February is expected to increase to 132.1. The number of confirmed coronavirus cases in South Korea has jumped to 833 with eight fatalities. Japan has recorded 850 cases (4 deaths), Italy announced there were 229 incidents (7 deaths). Singapore has also addressed 90 instances.

Save-haven assets, like U.S. government bonds and gold, kept receiving bids. The benchmark 10-year Treasury yield slid from 1.470% Friday to 1.377%, the lowest level since July 2016. And the 30-year yield shed 6.8 basis points to 1.849%.

Economic Events to Watch Today 


EUR/USD – Daily Analysis

On Tuesday, the EUR/USD remains lightly positive, +0.08%, while taking steps to 1.0860. The dollar slid on Tuesday following a recent bullish momentum amid heightened expectations that the expected hit to economic extension from the spread of the coronavirus will urge the U.S. Federal Reserve to decrease interest rates.

Expectations for the Federal Reserve interest rate cut have grown in the last few days to price in a 50-50 probability. Today is likely to be a quiet day ahead on the economic docket. Key economic figures will include Germany’s 2nd estimate GDP figures for the 4th quarter.

Lack of major deviation from 1st forecast is not likely to have too much of an influence on the EUR. Any drop in the U.S consumer confidence figure and risk sentiment could help capture a movement in the EUR/USD currency pair later during the U.S.s session today. 

Daily Support and Resistance

  • R3: 1.0977
  • R2: 1.091
  • R1: 1.0882

Pivot Point 1.0844

  • S1: 1.0815
  • S2: 1.0777
  • S3: 1.071

EUR/USD– Trading Tips

On Tuesday, the EUR/USD pair soars higher to trade around 1.0865, making a bullish engulfing pattern on the daily chart. This pattern suggests the odds of bullish trend continuation. The 50 periods EMA is also likely to extend support at 1.0815, and we may see a bounce off above this level. The same level also marks the 50% Fibonacci retracement, while 61.8% Fibo support prevails at 1.0815. On the higher side, resistance can be seen around 1.0845.


GBP/USD– Daily Analysis

The GBP/SD currency pair failed to continue its recent gains and dropped to 1.2940, representing 0.20% declines on the day mainly due to uncertainty and worries regarding the Brexit deal. The broad-based greenback strength also keeps the pair under pressure. At this moment, the GBP/USD currency pair is trading at 1.2978 and consolidates in the range between the 1.2934 – 1.3000.

The United Kingdom Prime Minister Boris Johnson will likely push for the U.S. trade deal by March 02, according to the Telegraph. The U.S. gave warning to the Tory government to avoid the greed checks on the good in the Irish Sea to secure the US-UK trade deal.

Besides, the on-going bearish pressure on the Cable is a reason for Greenback’s broad-based strength. The USD is getting gains due to the broad risk-off market sentiment in the wake of deadly coronavirus intensifying fears. As in result, the traders prefer the safe-haven assets like gold and dollar.

Yesterday, the British pound sank along with most currencies as traders blended out of assets considered riskier for the Greenback. Most of the economic analysts see the U.S. economy as nearly well-shielded should the coronavirus damage global economic growth heavily. Eyes will remain on the UK CBI Realized Sales for more trends in the GBP/USD pair.

Daily Support and Resistance

  • S1 1.2749
  • S2 1.2845
  • S3 1.2902

Pivot Point 1.2942

  • R1 1.2998
  • R2 1.3038
  • R3 1.3134

GBP/USD– Trading Tip

The GBP/USD is trading at 1.2975, above the 1.2965 resistance become a support level. Closings of candles above this level may help secure a buy trade around 1.2975 with a target of 1.3070. Whereas, a bearish breakout of 1.2965 can lead the Cable towards 1.2930

On the technical side, a daily closing beyond 100-day SMA level of 1.2955 can recall 1.3000 marks to the charts whereas February 13 top surrounding 1.3070 and 23.6% Fibonacci retracement at 1.3206 can entertain the buyers during further upside. The MACD and RSI are holding in the buying zone, supporting bullish bias for the GBP/USD pair. Let’s look for selling trades below 1.2965 and bullish above the same level today. 


USD/JPY – Daily Analysis

The USD/JPY sank 0.7% to 110.81 on increasing safe-haven demand. The USD/JPY pair failed to maintain its bullish momentum as investors started taking profit in the U.S. dollar, which leads the USD/JPY prices lower. The Japanese yen has now dropped back to the lower end against Greenback, and the pair now continues to trade around the 110.65-60 region.

Investors prefer safe-haven assets, mainly due to a rise in the number of coronavirus cases outside China, especially in South Korea and Italy. As per the latest report, the number of coronavirus cases in Italy’s Lombardy region rose from 54 on Sunday to 89, leaving the country with 150 confirmed infection, the highest in Europe, and around 5-times that of Germany whereas the news came as the total number of virus cases rose past 77,000 in China.

The USD/JPY currency pair may drop to levels below 111.30 if the German IFO data, which is scheduled to release at 09:00 GMT, prints below estimates, increasing recession fears and growing demand for the anti-risk Japanese yen.

Daily Support and Resistance

  • R3: 113.5
  • R2: 112.2
  • R1: 111.46

Pivot Point 110.9

  • S1: 110.16
  • S2: 109.6
  • S3: 108.29

USD/JPY – Trading Tips

The USD/JPY prices are trading with a bearish bias above 61.8% Fibonacci retracement level of 110.450. Closing of the candle above this level can extend buying until 110.850. Earlier, most of the bearish trend came after the USD/JPY violated the 38.2% Fibonacci retracement level on the 4-hour chart. On the lower side, the pair has the potential to go after the next support level of 109.650 in case of a bearish breakout of 110.250 support. Let’s consider staying bullish above 110.2 today to target 110.860. 

All the best for today! 

Categories
Forex Market Analysis

Overbought gold Seems to Head for 38.2% Fib – Quick Trade Plan! 

Gold prices climbed more than 2.5% to over the seven-year top as the extension of coronavirus outside China, and its potential collision on global economic growth pushed safe-haven buying.

Japan has recorded 837 coronavirus cases, including 691 cases related to the “Diamond Princess” cruise ship, with a fatality number of four. The number of confirmed cases in South Korea surged to 602 (6 deaths) as the country raised its infectious-disease warning to the highest level. 

Italy said there were over 150 cases across five regions (3 deaths). Meanwhile, in China, official numbers showed nearly 77,000 cases and over 2,400 deaths. The World Health Organization announced it is concerned about the growing number of problems without any apparent connection to China. Consequently, investors are moving funds into gold due to its safe-haven demand.

Gold – XAU/USD – Daily Technical Levels

Support     Resistance 

1,629.58    1,653.22

1,615.82    1,663.11

1,592.18    1,686.76

Pivot Point 1,639.47

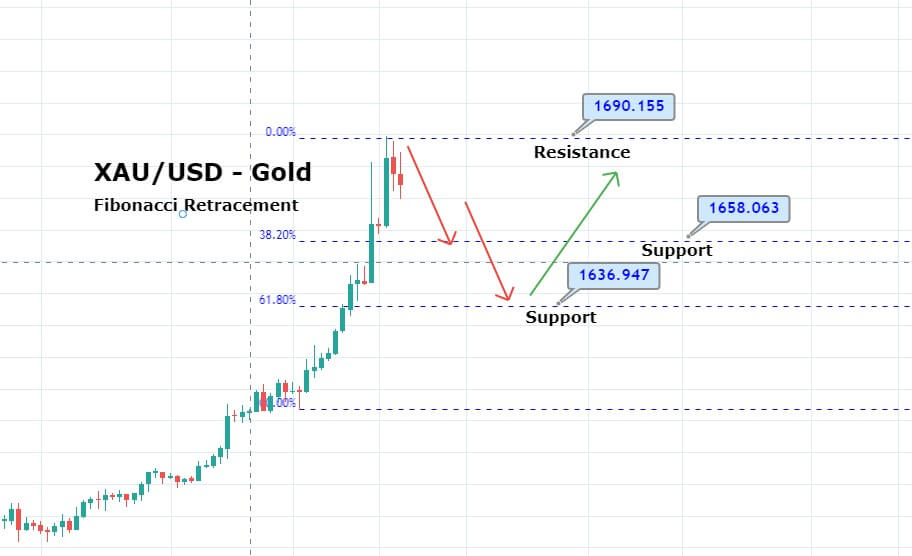
On the technical side, the XAU/USD is trading at 1,679 and has entered the overbought zone where the chances of bearish corrections pretty solid. On the lower side, gold may show bearish correction until 1,658, which marks 38.2%. On the higher side, resistance continues to stay around 1,690. A bullish breakout of 1,690 may lead to gold prices to prices 1,710 resistance. Let’s consider taking sell trades to capture the correction below 1,680 until 1,670/1,668. Good luck! 


Categories
Forex Market Analysis

Daily F.X. Analysis, February 24 – Top Trade Setups In Forex – Risk-off Sentiment In Play! 

On the forex front, the U.S. dollar retreated from the strongest level in nearly three years, as the ICE Dollar Index lost 0.6% on the day to 99.26. Germany’s IFO Institute reported its indexes for February (business climate at 95.0, current assessment at 98.4 and expectations at 91.6 expected). However, the actual figure surprised the market with a 96.1 gain.

In the U.S., the Federal Reserve Bank of Chicago will post January National Activity Index (-0.16 expected). The Federal Reserve Bank of Dallas will release its Manufacturing Activity Index for February (0 expected).

Economic Events to Watch Today 


EUR/USD – Daily Analysis

The EUR/USD rose 0.6% to 1.0845. Research firm Markit reported that the eurozone’s manufacturing PMI bounced to 49.1 in February (47.4 estimated) from 47.9 in January and Services PMI climbed to 52.8 (52.3 expected) from 52.5. Later today, the German IFO Business Climate Index will be released (95.0 expected).

The Euro is getting badly hit in the wake of coronavirus. At the virus front, the number of coronavirus cases in Italy’s Lombardy region rose from 54 on Sunday to 89, leaving the country with 150 confirmed infection, the highest in Europe and around 5-times that of Germany whereas the news came as the total number of virus cases rose past 77,000 in China.


Daily Support and Resistance

  • S1 1.0686
  • S2 1.076
  • S3 1.0804

Pivot Point 1.0834

  • R1 1.0878
  • R2 1.0908
  • R3 1.0982

EUR/USD– Trading Tips

The EUR/USD pair soars higher to trade around 1.0865, making a bullish engulfing pattern on the daily chart. This pattern suggests the odds of bullish trend continuation. 

The 50 periods EMA is also likely to extend support at 1.0815, and we may see a bounce off above this level. The same level also marks the 50% Fibonacci retracement, while 61.8% Fibo support prevails at 1.0815. On the higher side, resistance can be seen around 1.0845.


GBP/USD– Daily Analysis

The GBP/SD currency pair failed to continue its recent gains and dropped to 1.2940, representing 0.20% declines on the day mainly due to uncertainty and worries regarding the Brexit deal. The broad-based greenback strength also keeps the pair under pressure. At this moment, the GBP/USD currency pair is trading at 1.2938 and consolidates in the range between the 1.2934 – 1.2955.

The United Kingdom Prime Minister Boris Johnson will likely push for the U.S. trade deal by March 02, according to the Telegraph. The U.S. gave warning to the Tory government to avoid the greed checks on the good in the Irish Sea to secure the US-UK trade deal.

Besides, the on-going bearish pressure on the Cable is a reason for Greenback’s broad-based strength. The USD is getting gains due to the broad risk-off market sentiment in the wake of deadly coronavirus intensifying fears. As in result, the traders prefer the safe-haven assets like gold and dollar.

Looking forward, the traders will keep their eyes on the Brexit headlines because the British ministers are to approve the initial offer by Tuesday. On the other hand, the 2nd-tier project numbers from the US Dallas Fed and the US Chicago Fed will be the keys to watch.


Daily Support and Resistance

  • S1 1.2749
  • S2 1.2845
  • S3 1.2902

Pivot Point 1.2942

  • R1 1.2998
  • R2 1.3038
  • R3 1.3134

GBP/USD– Trading Tip

The GBP/USD is trading at 1.2898, below the 1.2965 resistance level. Closings of candles below this level may help secure a sell trade around 1.2875, whereas, a bullish breakout of 1.2975 can lead the Cable towards 1.3070. 

On the technical side, a daily closing beyond 100-day SMA level of 1.2955 can recall 1.3000 marks to the charts whereas February 13 top surrounding 1.3070 and 23.6% Fibonacci retracement at 1.3206 can entertain the buyers during further upside. The MACD and RSI are holding in the buying zone, supporting bullish bias for the GBP/USD pair. Let’s look for selling trades below 1.2951 today. 


USD/JPY – Daily Analysis

The USD/JPY currency pair flashing red and dropped from the session high mainly due to the risk-off market in the wake of escalating coronavirus fears. At press time, the USD/JPY pair is trading right now at 111.52 and consolidates in the range between the 111.34 – 111.69. However, the USD/JPY is struggling to keep the recent gans above the 111.50.

Investors prefer safe-haven assets, mainly due to a rise in the number of coronavirus cases outside China, especially in South Korea and Italy. As per the latest report, the number of coronavirus cases in Italy’s Lombardy region rose from 54 on Sunday to 89, leaving the country with 150 confirmed infection, the highest in Europe, and around 5-times that of Germany whereas the news came as the total number of virus cases rose past 77,000 in China.

The USD/JPY currency pair may drop to levels below 111.30 if the German IFO data, which is scheduled to release at 09:00 GMT, prints below estimates, increasing recession fears and growing demand for the anti-risk Japanese yen.

It should be noted that China is declining some limitations in the Wuhan province and may allow non-local citizens to leave the city at the center of the outbreak. Whereas Guangdong province in China, which has the most infected sectors by virus after the Hubei region, decreased its coronavirus emergency response level from its highest this morning.


Daily Support and Resistance

  • S1 110.57
  • S2 111.13
  • S3 111.35

Pivot Point 111.69

  • R1 111.91
  • R2 112.25
  • R3 112.81

USD/JPY – Trading Tips

On Monday, the USD/JPY prices are trading with a bearish bias above 38.2% Fibonacci retracement level of 111.280. Closing of candle below this level can extend selling until 110.850. Earlier, most of the bullish trend came after the USD/JPY violated the upward channel on the daily chart. 

This channel extended resistance around 111.01 level, and now this is going to extend support to the USD/JPY currency pair. On the upper side, the pair has the potential to go after the next resistance level of 112. Let’s consider staying bearish below 111.69 today to target 110.860. 

All the best for today! 

Categories
Forex Market Analysis

WTI Crude Oil Drops Amid Coronavirus Fears – 61.8% Fibonacci Level In Focus! 

The WTI crude oil prices flashing red and dropped to $53.42 because the fears of coronavirus burdened on the crude inventories. The U.S. Crude Oil WTI Futures dropped 0.9% to $53.42.

The WTI oil inventories increased by 414,000 barrels for the week ended Feb. 14, the EIA said. That compared with expectations for a build of 2.5 million barrels, according to forecasts. The data supported crude oil prices yesterday, which raised more than 1% before decreasing today due to intensifying fears of the new coronavirus.

The global risk-off sentiment increased further on Friday after the World Health Organization (WHO) officials gave warning that the new coronavirus may break out globally at any time. 

According to the latest report, there are now 74,675 cases of the coronavirus in China, including 2,121 deaths in the country. Outside of China, there are 1,076 confirmed cases in 26 countries. The Chinese Commerce Ministry stays ready to take further steps to control the economic impact of coronavirus.

On the other hand, the U.S. State Department recently reiterated its travel warnings while Japanese officials and German Finance Ministry reports also showed attention about the coronavirus negative impact. Looking forward, coronavirus headlines will be the key to watch for fresh direction.

Daily Support and Resistance

  • S1 51.55
  • S2 52.75
  • S3 53.24

Pivot Point 53.95

  • R1 54.44
  • R2 55.15
  • R3 56.35

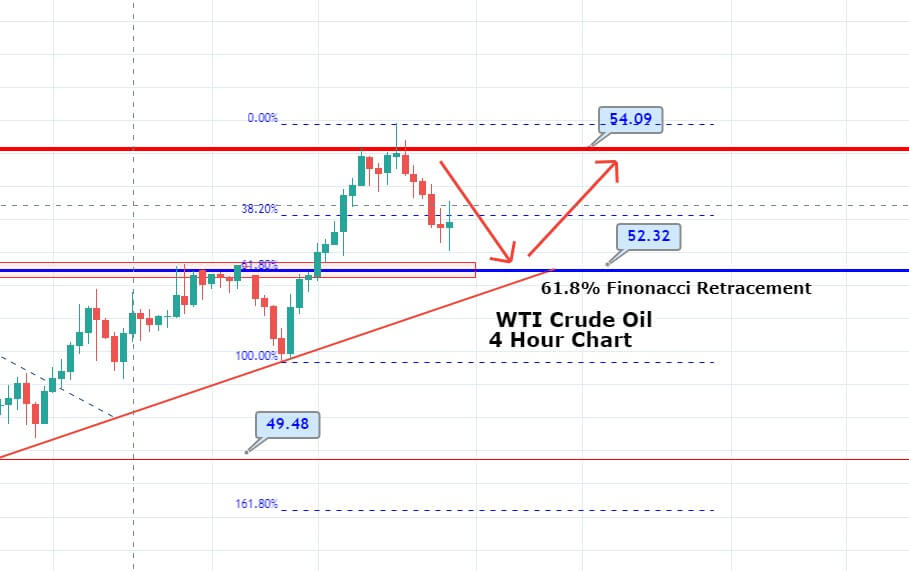
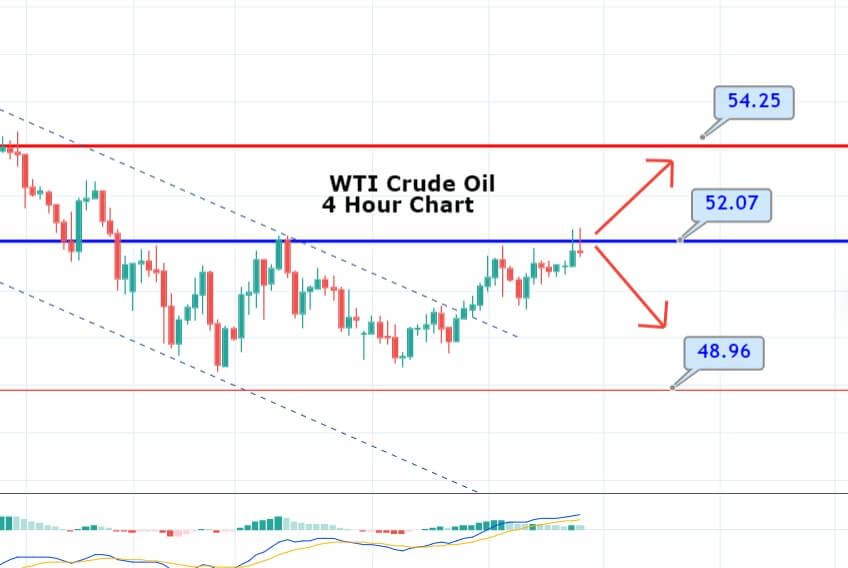
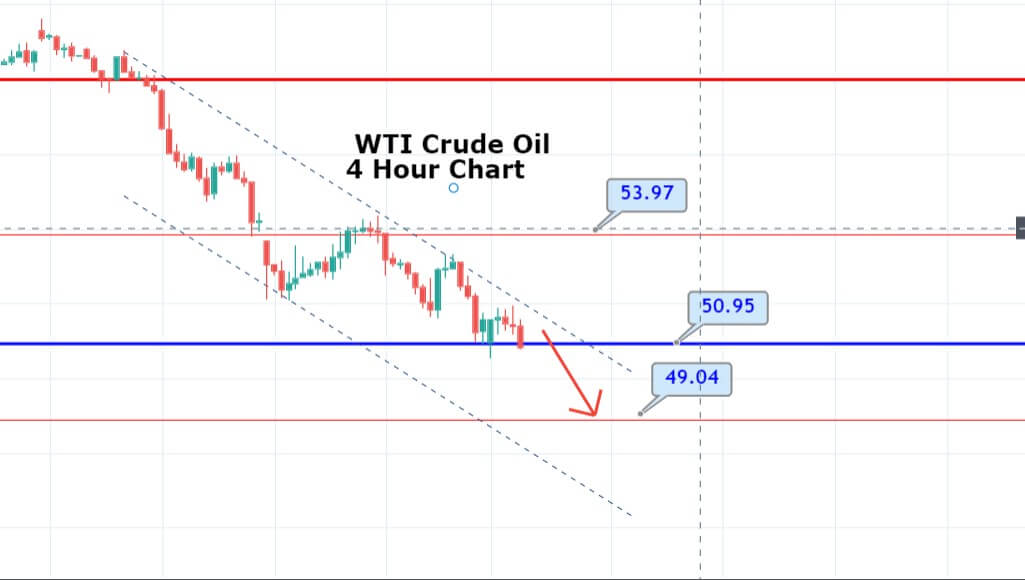
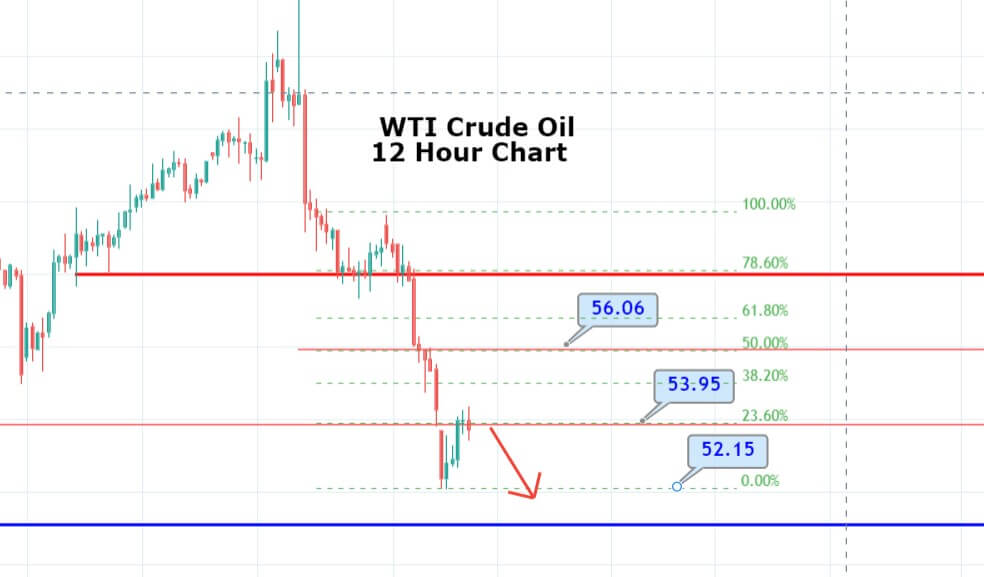
On the technical front, the WTI crude oil is trading at 52.94, heading towards 61.8% Fibonacci retracement at 52.25. On the 4 hour timeframe, the WTI prices are also expected to gain support around 52.25, which is the most extended by bullish trendline. Above this level, we may see bullish recovery in the WTI crude oil prices until 53.50 and 54. Good luck! 

Categories
Forex Market Analysis

Daily F.X. Analysis, February 21 – Top Trade Setups In Forex – U.K. Retail Sales In Highlights! 

On the forex front, the ICE U.S. Dollar Index advanced 0.2% on the day to 99.88, the strongest level in nearly three years, supported by broadly positive U.S. economic data. Official data revealed that the eurozone’s Consumer Confidence Index rose to -6.6 in February (-8.2 expected) from -8.1 in January, while the German GfK Consumer Confidence Index for March slipped to 9.8 (as expected) from 9.9 in February. Later today, research firm Markit will release eurozone’s February Manufacturing PMI (47.4 estimated) and Services PMI (52.3 expected).

Economic Events to Watch Today 


EUR/USD – Daily Analysis

The EUR/USD currency pair continues to bearish and found near the 1.0783 ahead of the German flash service PMIs. The EUR/USD currency pair is currently trading at 1.0791 and consolidates in the range between the 1.0783 – 1.0795. Traders are cautious about placing any position ahead of the German PMIs data.

At the data front, Germany’s flash manufacturing PMI for February, scheduled to release at 0830 GMT, is seen arriving at 44.8, down from January’s final print of 45.3, whereas the index for the services sector is seen declining to 53.8 this month against 54.2 last.

The forecast for the Eurozone flash manufacturing PMI (due at 0900 GMT) shows 47.5 for February against 47.9 seen in the previous month. The Eurozone services sector PMI is seen printing a tad weaker at 52.2 in February compared to January’s 52.5 reading. Whereas, the actual figure has been mixed as, but the Flash Services PMI soared to 52.8 while economists expected a figure of 47.4.

Germany’s export-oriented sector growth has decreased sharply, mainly due to the coronavirus outbreak, a recently published Zew survey of the financial market specialists showed.

However, the slowdown fears will grow if the German data prints below expectations. As in result, the shared currency could drop further and send the EUR/USD currency pair down to 1.0750.

On the flip side, the EUR currency may get support if the German PMI betters estimates by a significant margin, while the immediate technical bias of the pair will continue to bearish as far as the pair is holding at the declining 10-day average.

Daily Support and Resistance

  • S1 1.0708
  • S2 1.0751
  • S3 1.0768

Pivot Point 1.0795

  • R1 1.0811
  • R2 1.0838
  • R3 1.0881

EUR/USD– Trading Tips

The EUR/USD pair is mostly trading the same technical levels, as mentioned in the previous report. The EUR/USD pair appears to have formed neutral candles as the investors still didn’t find any solid reason to trigger bearish breakout at 1.0825 level. Today’s candle is slightly bearish, but it’s still no violating the previously placed low of 1.0775. It is pretty much likely to drive upward correction. Today, if the EUR/USD pair manages to drop below 1.0840, we may see EUR/USD prices going towards 1.0760. Let’s look for buying trade today above 1.0806. 

GBP/USD– Daily Analysis

The GBP/USD currency pair flashing green and registered 1st daily close under the 100-day moving average since October. The GBP/USD currently trading at 1.2896 and consolidates in the range between the 1.2878 – 1.2899. The currency pair representing modest gains on the day, having hit the 3-month low of 1.849 on Thursday.

The preliminary Markit Manufacturing PMI (Feb) is expected to print at 49.7, indicating a contraction in the activity after January’s neutral reading of 50.00. The selling interest around the GBP currency may increase if the PMI number prints below estimates. The actual results have come out and are supporting the GBP/USD pair. The U.K. manufacturing and services PMI performed slightly better than before. The Manufacturing PMI surged surprisingly to 51.3, crossing the 49.7 forecasts.

The GBP/USD pair slipped lower to test the next support level of 1.2880 and has formed bearish engulfing candle around, which is confirming the bearish breakout of 1.2974 support. Now his level is working as resistance, and it may keep the GBP/USD pair bearish. 

The GBP/USD has formed a descending triangle pattern that typically breaks on the lower side. Currently, this pattern is extending support at 1.2885, but the breakout of this level can extend selling until 1.2785 and even below this level. Therefore, 1.2885 is going to be one of the crucial trading levels. 

Daily Support and Resistance

  • S1 1.2719
  • S2 1.2835
  • S3 1.2879

Pivot Point 1.2951

  • R1 1.2995
  • R2 1.3067
  • R3 1.3183

GBP/USD– Trading Tip

On the technical side, a daily closing beyond 100-day SMA level of 1.2955 can recall 1.3000 marks to the charts whereas February 13 top surrounding 1.3070 and 23.6% Fibonacci retracement at 1.3206 can entertain the buyers during further upside. 

The GBP/USD is trading at 1.2906, below the 1.2975 resistance level. Closings of candles below this level may help secure a sell trade around 1.2875, whereas, a bullish breakout of 1.2975 can lead the Cable towards 1.3070. The MACD and RSI are holding in the buying zone, supporting bullish bias for the GBP/USD pair. Let’s look for selling trades below 1.2951 today. 

USD/JPY – Daily Analysis

The USD/JPY currency pair flashing red and dropped to 111.69 after the 2-days of bullish trend mainly due to the renewed risk-off market sentiment supporting the Japanese yen. The USD/JPY currency pair is currently trading at 111.75 and consolidates in the range between the 111.69 – 112.19. However, the Japanese Yen recently boosted to the highest since April 2019 after the broad-based U.S. Dollar rally and weak Japanese data.

The global risk sentiment increased further on Friday after the World Health Organization (WHO) officials gave warning that the new coronavirus may break out globally at any time. After 2-days of heavy selling, the Japanese yen found some support from the renewed risk-off tone.

As the latest data front, Japan’s National Consumer Price Index (CPI) (YoY) for January matched 0.7% forecast, whereas National CPI ex-Food, Energy (YoY) dropped below 0.9% forecast and before 0.8%. Further, the preliminary reading of Japan’s February month Jibun Bank Manufacturing PMI dropped below 49.00 estimates and 48.8 before 47.6.

The USD/JPY currency pair has now dropped below the 112.00 round-figure marks. However, the bearish trend is likely to remain warm, due to the backdrop of the recent weakness in the Japanese macro data and increasing concerns of deepening economic fallout from the coronavirus outbreak. Traders will now await All Industry Activity Index (MoM) data for December, prior 0.9%, for further direction.

Daily Support and Resistance

  • S1 110.12
  • S2 111
  • S3 111.55

Pivot Point 111.89

  • R1 112.44
  • R2 112.77
  • R3 113.66

USD/JPY – Trading Tips

On Friday, the bullish trend of the USD/JPY continues to hit the market as the pair has surged dramatically to trade at 111.800 level. Most of the bullish trend came after the USD/JPY violated the upward channel on the daily chart. This channel was extending resistance around 111 level, and now this is going to extend support to the USD/JPY currency pair. On the upper side, the pair has the potential to go after the next resistance level of 112.300. The MACD has also started forming histogram lines above 0, signaling bullish bias for the USD/JPY pair. Let’s consider staying bearish below 112.150 today to target 111.500. 

All the best for today! 

Categories
Forex Market Analysis

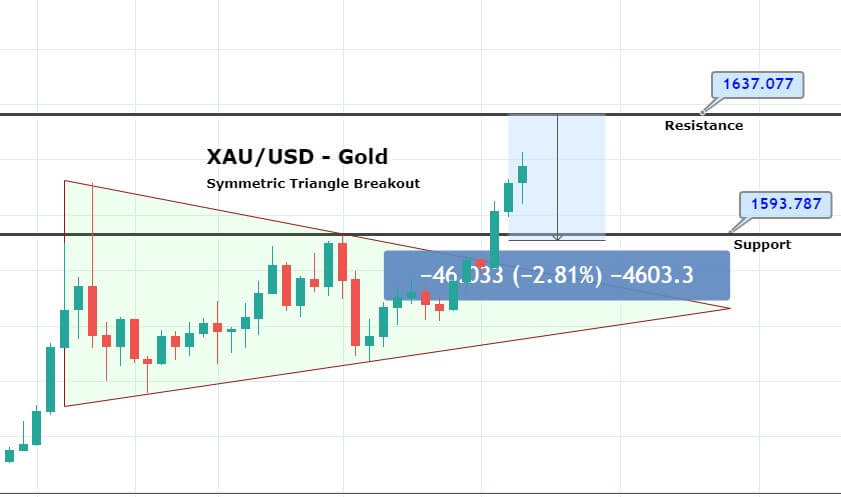
Gold’s Symmetric Triangle Breakout – Is It Going After 1,637? 

The precious metal gold is trading dramatically bullish at 1,622 in the wake of boosted safe-haven appeal. The U.S. stocks advanced, buoyed by China’s stance in supporting local businesses amid the impact of the coronavirus outbreak. At the same time, minutes of the Federal Reserve’s last monetary policy meeting showed that officials were optimistic about the U.S. economy.

The U.S. official data showed that the number of housing starts increased to an annualized rate of 1.567 million units in January (1.428 million units expected), and the producer price index (PPI) rose 0.5% on month in January (+0.1% expected). Later today, initial jobless claims for the week ended Feb. 15 (210,000 expected), and the Conference Board Leading Index for January (+0.4% on month expected) will be reported.

European stocks rebounded, as the Stoxx Europe 600 Index rose 0.8%. Germany’s DAX increased by 0.8%, France’s CAC added 0.9%, and the U.K.’s FTSE 100 was up 1.0%. Despite that, the gold’s demand is still at the peak, which is driving its prices higher. Let’s take a look at the technical side of the market. 


Support Resistance 

1,604.59     1,615.98

1,597.42     1,620.2

1,586.03     1,631.59

Pivot Point 1,608.81

Technically, the precious metal gold has violated the symmetric triangle pattern, which was keeping it under pressure at 1,591. A bullish breakout of this level has opened further room for buying until 1,627 and 1,637. While the support can be found around 1,612 now, let’s take with a bullish bias above 1,612 level for the targets mentioned. Good luck! 

Categories
Forex Market Analysis

Daily F.X. Analysis, February 20 – Top Trade Setups In Forex – U.K. Retail Sales In Highlights! 

On the forex front, U.S. Dollar Index gained 0.2% on the day to 99.59, as the Fed’s FOMC minutes confirmed that officials “viewed the current stance of policy as likely to remain appropriate for a time.”

The European Commission will release the eurozone’s January Consumer Confidence Index (-8.2 expected). The German Federal Statistical Office will report January PPI (-0.4% on year expected). The GfK Consumer Confidence Index for March will be released (9.8 expected). 

France’s INSEE will post final readings of January CPI (+1.5% on-year expected). The U.K. Office for National Statistics will report January retail sales (+0.7% on month expected).

Economic Events to Watch Today 


EUR/USD – Daily Analysis

The EUR/USD currency pair still found on the bearish track below the 1.08 handles ahead of the German data, having hit the high of 1.0815 in Asian trading hours. The EUR/USD currency pair is currently trading at 1.0798 and consolidates in the range between the 1.0792 – 1.0816. However, the traders are still struggling to keep the gains above the key hurdle ahead of the forward-looking German data. 

The currency pair got another failure to keep the pair above the 50-hour moving average located near 1.0810 during the Asian session

On the fundamental side, the German Gfk Consumer Confidence Survey, which is scheduled to release at 07:00 GMT, is expected to show a slight decline in the consumer sentiment in March. The index is anticipated to edge lower to 9.8 from February’s 9.9 figures. 

It should be noted that the euro may take further losses and drop towards the psychological support at 1.0750 if the German GFK Consumer Confidence Survey data disappoint expectations. 

On the other hand, the currency pair may hit the corrective bounce above the 50-hour M.A., currently placed at 1.0805 if the German data cheer expectations. Moreover, Germany will also report the Producer Price Index for January at 07:00 GMT. However, that data isn’t a big market mover. 

Daily Support and Resistance

  • S1 1.074
  • S2 1.077
  • S3 1.0788

Pivot Point 1.08

  • R1 1.0818
  • R2 1.083
  • R3 1.0859

EUR/USD– Trading Tips

The EUR/USD pair is mostly trading the same technical levels, as mentioned in the previous report. The EUR/USD pair appears to have formed neutral candles as the investors still didn’t find any solid reason to trigger bearish breakout at 1.0825 level. 

Today’s candle is slightly bearish, but it’s still no violating the previously placed low of 1.0775. It is pretty much likely to drive upward correction. Today, if the EUR/USD pair manages to drop below 1.0840, we may see EUR/USD prices going towards 1.0760. Let’s look for buying trade today above 1.0806. 


GBP/USD– Daily Analysis

The GBP/USD currency pair hit the 7-days low and dropped to 1.2910 ahead of the Retail Sales data. The GBP/USD is trading at 1.2912 and consolidates in the range between the 1.2901 – 1.2929. However, the European Union and the United Kingdom trade war, as well as the broad-based greenback strength, is keeping the pair under pressure and sent below the 7-day low.

Whereas the European Union’s chief Brexit negotiator Michel Barnier refused the U.K.’s signal for the Canada-style trade deal with the region. He is already aware that the Toris will stand ready to criticize this move. Moreover, the U.K.’s diplomats challenged the E.U. diplomat’s demand to return the Elgin Marbles under the post-Brexit trade deal. 

On the other hand, the opposition is using all the way to reject Home Secretary Priti Patel’s latest immigration plan, whereas the European Union stuck in the budget’s tension before the 1st E.U. summit post-Brexit.

Apart from U.K. politics, the greenbacks still flashing green and keep its gains higher because not only the risk-sentiment but the upbeat data is also sending the greenback higher. According to the latest update, the coronavirus numbers again shocked markets by using the re-revised methodology. Although, this doesn’t stop negative comments from the International Monetary Fund’s (IMF) Managing Director Kristalina Georgieva and rating giant S&P. Eventually, these are keeping the risk sentiment off. 

It is worth to mention that the fresh easing from the Peoples Bank of China (PBOC) and Australian employment data also gave support to the greenback, Moreover, the U.S. ten-year treasury yields, and Asian stocks again flashing red after rising the previous day.


Daily Support and Resistance

  • S1 1.2719
  • S2 1.2835
  • S3 1.2879

Pivot Point 1.2951

  • R1 1.2995
  • R2 1.3067
  • R3 1.3183

GBP/USD– Trading Tip

The GBP/USD pair slipped lower to test the next support level of 1.2880 and has formed bearish engulfing candle around, which is confirming the bearish breakout of 1.2974 support. Now his level is working as resistance, and it may keep the GBP/USD pair bearish. 

Zooming out on the 4-hour chart, the GBP/USD has formed a descending triangle pattern that typically breaks on the lower side. Currently, this pattern is extending support at 1.2885, but the breakout of this level can extend selling until 1.2785 and even below this level. Therefore, 1.2885 is going to be one of the crucial trading levels. 

The GBP/USD is trading at 1.3036, below the 1.3065 resistance level. Closings of candles below this level may help secure a sell trade around 1.3065, whereas, a bullish breakout of 1.3065 can lead the Cable towards 1.3200. The MACD and RSI are holding in the buying zone, supporting bullish bias for the GBP/USD pair. Let’s look for bullish trades above 1.3018 today. 


USD/JPY – Daily Analysis

The USD/JPY is flashing green, but the recovery from the session lows might be temporary because the U.S. equity index futures are now flashing red. The USD/JPY is trading at 111.70 and consolidates in the range between the 111.11 – 111.72. However, the currency pair hit the 9-months high of 111.59 during the previous sessions.

The pair’s buyers are struggling to lift the pair back to 111.80, possibly due to the uptick in the U.S. equity index futures. The S&P 500 traded bullish by around 0.25% in early Asia. 

The bid tone around the currency pair was declined in the past few minutes despite China passing an interest rate cut as anticipated. During press conference time, the futures are shedding 0.25%. Moreover, the U.S. 10-year yield is also reporting a two basis point drop at 1.55%. 

It’s worth mention that the Shanghai Composite index is soaring by 0.4%. Thus, the positive action in the Chinese stocks can also help support the U.S. index futures, and therefore the USD/JPY pair may hit fresh multi-month highs even above 112. 

Daily Support and Resistance

  • S1 107.85
  • S2 109.42
  • S3 110.4

Pivot Point 111

  • R1 111.97
  • R2 112.57
  • R3 114.14

USD/JPY – Trading Tips

The bullish trend of the USD/JPY continues to hit the market as the pair has surged dramatically to trade at 111.800 level. Most of the bullish trend came after the USD/JPY violated the upward channel on the daily chart. This channel was extending resistance around 111 level, and now this is going to extend support to the USD/JPY currency pair. 

On the higher side, the pair has the potential to go after the next resistance level of 112.300. The MACD has also started forming histograms above 0, signaling bullish bias for the USD/JPY pair. Let’s consider staying bullish above 111.450 today to target 112.200. 

All the best for today! 

Categories
Forex Market Analysis

Gold Prices Inched Up – Eyes On Fed’s Minutes! 

The safe-have-metal prices rose as traders await the U.S. Federal Reserve minutes of its latest meeting, which is scheduled to release later in the day. The gold gained 0.2% to $1,607.25 by the time of writing this update. 

Gold is higher 5.7% during this year because investors evaluate the impact of the disease on economic growth amid thinking that the Federal Reserve will feel increased pressure to deliver the rate cut. Moreover, fears of the new coronavirus and its impact on global growth pushed the safe-haven metal higher.

Official data showed that new cases in China declined for a second straight day. However, the World Health Organization has cautioned there is not enough data to know if the epidemic was being controlled.

China continues to struggle to achieve the identity of manufacturing in the world’s 2nd-largest economy again after imposing substantial travel restriction and city lockdown to control the virus that has killed more than 2000 peoples so far. However, investors still seem confident that the economic impact may be temporary.

The epidemic is expected to impact business in China and drag down its economic growth. Earlier this month, Moody’s Investors Service has lowered the growth forecast for China from 5.8% to 5.2% for 2020.


Daily Support and Resistance

  • S1 1556.92
  • S2 1577.08
  • S3 1589.29

Pivot Point 1597.25

  • R1 1609.46
  • R2 1617.41
  • R3 1637.58

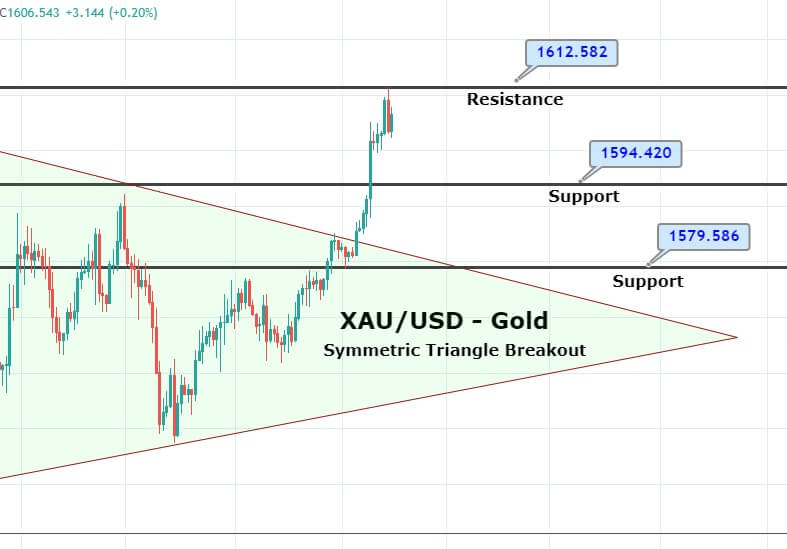
Technically, the gold prices are likely to face resistance around 1,612. Below this, gold prices are expected to gain support around 1,594 area. A bullish breakout of 1,612 can lead to gold prices towards the next resistance area of 1,622. At the moment, we can either wait for bearish retracement until 1,602 to take a buying trade or enter a buy trade above 1,612 level to target 1,620. Good luck! 

Categories
Forex Market Analysis

Daily F.X. Analysis, February 19 – Top Trade Setups In Forex – UK CPI Surprises! 

The U.S. Empire Manufacturing Index rose to 12.9 in February (5.0 expected). Later today, January reports on housing starts (an annualized rate of 1,425,000 units expected), and producer price index (+0.1% on month expected) will be released.

European stocks were broadly lower, as the Stoxx Europe 600 Index declined 0.4%. Germany’s DAX fell 0.8%, France’s CAC lost 0.5%, and the U.K.’s FTSE 100 was down 0.7%.

Economic Events to Watch Today 


EUR/USD – Daily Analysis

The EUR/USD dropped 0.4% to 1.0796, the lowest level since April 2017. The German ZEW Current Situation Index declined to -15.7 in February (-10.0 expected) from -9.5 in January. The research institute said economic development is rather fragile at the moment, and the outlook for export-intensive sectors has deteriorated particularly sharply, citing impacts of the coronavirus outbreak.

The single currency’s vulnerability has prompted by moderate or negative growth in Germany during the last year. Moreover, data from this Monday imply that the market has not yet attained its bottom, as the Bundesbank stated in its monthly statement that there are no indications the currency position is set to improve in the opening quarter of the year, while coronavirus’ risk scores a new course of risk.

The traders eagerly anticipated the German ZEW economic sentiment, which was expected to worsen to 21.5 in February against. 26.7 reported in January. As per the recent release, the ZEW Indicator of Economic Sentiment for Germany decreased sharply in February, dropping 18.0 points to a distinct reading of 8.7 points. 

The fundamental event is thus lightly beneath its December 2019 mark. The evaluation of the economic situation in Germany has also worsened when we compare it with the previous month.

Moreover, EUR/USD currency pair near-term technical outlook also shows a bearish picture, with a test of the psychological support at 1.0800 on the cards. The traders will have their sights on the coronavirus headlines for taking fresh clues.

Daily Support and Resistance

  • S1 1.0702
  • S2 1.0754
  • S3 1.0774

Pivot Point 1.0806

  • R1 1.0826
  • R2 1.0858
  • R3 1.091

EUR/USD– Trading Tips

The pair appears to have formed neutral candles as the investors still didn’t find any solid reason to trigger bearish breakout at 1.0825 level. Today’s candle is also neutral, and it is pretty much likely to drive upward correction. Today, if the EUR/USD pair manages to drop below 1.0840, we may see EUR/USD prices going towards 1.0760. Let’s look for buying trade today above 1.0806. 


GBP/USD– Daily Analysis

The GBP/USD slipped 0.1% to 1.3002. Official data showed that the U.K. jobless rate was steady at 3.8% in the three months to December as expected. Earlier today, the Sterling declined during but concerns about whether the current Chancellor of Exchequer will be ready to pass the budget on time. 

A report from U.K. Prime Minister Johnson’s spokesman confirmed that the U.K. is not asking anything distinct from the E.U. in trade discussions and that they are available to negotiate. 

Besides, the market risk-tone getting worse day-by-day mainly due to the coronavirus fears, which provides support to the greenback as a safe-haven currency. Despite lowering the pace of the death toll and infected peoples in China, the uncertainty and fears still surrounding the market.

On the forecasted views, the Bank of England’s last MPR looks for the unemployment rate to stay unchanged at 3.8% for the next 3-4 months, we look for an increase to 3.9% in December (mkt 3.8%), with the potential for another pop higher in January. 

As we already mentioned that many countries had banned travelers from China, and major airlines have delayed flights, something that China’s representative to the E.U. warned was fuelling panic and threatening attempts to resume business.


Daily Support and Resistance

  • S1 1.285
  • S2 1.2928
  • S3 1.2964

Pivot Point 1.3007

  • R1 1.3043
  • R2 1.3085
  • R3 1.3164

GBP/USD– Trading Tip

The GBP/USD pair slipped lower to test the next support level of 1.2960 and has formed a Doji candle around this corner before taking a sharp bullish reversal. 

The GBP/USD is trading at 1.3036, below the 1.3065 resistance level. Closings of candles below this level may help secure a sell trade around 1.3065, whereas, a bullish breakout of 1.3065 can lead the Cable towards 1.3200. The MACD and RSI are holding in the buying zone, supporting bullish bias for the GBP/USD pair. Let’s look for bullish trades above 1.3018 today. 


USD/JPY – Daily Analysis

The USD/JPY currency pair flashing green and rose to 110.08, mainly due to the uptick in the Asian stocks. As well as the sluggish data from Japan sent the pairs higher. As of writing, the USD/JPY currency pair is currently trading at 110.06 and consolidates in the range between the 109.86 – 110.09. However, the risk-reset based on catalysts from China.

Stocks in China, Hong Kong, Indonesia, and Japan are printing moderate gains ranging between 0.20% and 0.60% after the latest improvement in risk-tone. Also representing the risk reset is the U.S. 10-year treasury yields that rise one basis point to 1.563% by the press time.

The fundamental reason behind the pair’s bullish moves is the release of Japan’s Machinery Order and Merchandise Trade Balance Reports. As well as the positive comments from China’s President Xi Jinping and the World Health Organization (WHO) that we have to stay relaxed. Whereas, the opposing statement from Moody’s Investors Service has been ignored.

Whereas Caixin Media Company Ltd. increased uncertainties regarding the reducing coronavirus infected people on Tuesday, the latest figures from Hubei showed a confused picture. According to the report, there are 1,693 new cases on February 18 against 1,807 of February 17. This report also suggests 132 new deaths compared to 93 recorded the previous day.

Moving ahead, China-related headlines will be the key to watch, the U.S. housing market numbers and the Producer Price Index data will also be essential to watch.

Daily Support and Resistance

  • S1 109.26
  • S2 109.54
  • S3 109.7

Pivot Point 109.83

  • R1 109.99
  • R2 110.11
  • R3 110.4

USD/JPY – Trading Tips

The USD/JPY pair has violated the sideways trading range of 110.025 – 109.500 in the wake of a stronger dollar. The couple is heading north towards the next resistance level of 110.800. On the way, the pair may find 161.8% Fibo extension resistance at 110.450. 

The RSI and MACD are crossing on the higher side, suggesting chances of further bullish bias in the USD/JPY currency pair. Alternatively, the USD/JPY can drop after testing 110.850 resistance. 

All the best for today! 

Categories
Forex Market Analysis

Crude Oil’s Ascending Triangle Pattern Breakout – What’s Next?

The WTI crude oil prices dropped mainly due to falling demand in the wake of intensifying coronavirus fears. The U.S. Crude Oil fell 0.6% to trade at $51.99during the European session.

The crude oil prices recently dropped despite China’s report that the pace of virus infection in the region continued to decrease. It is worth to mention that the Chinese health authorities confirmed 1,886 new cases of coronavirus and 98 further deaths as per yesterday’s report.

China recently imposed tighter restrictions on travel and movement within the country to control the spread of the virus. The International Energy Agency announced this month that the virus could reduce oil demand by 435,000 barrels per day in the first 3-months of the year. In contrast, global experts stated it is yet too immature to announce the outbreak is being controlled.

The equity market risk-tone is getting worse, and U.S. stock futures slipped from record levels after tech giant Apple said on Monday that it would not reach its revenue target of the March quarter, due mainly to slower iPhone production and weaker demand in China, as a side effect of the coronavirus outbreak. 

Looking forward, the traders are also awaiting news from the Organization of the Petroleum Exporting Countries and its allies about deepening production cuts to support oil prices.


Daily Support and Resistance

  • S1 51.57
  • S2 52
  • S3 52.28

Pivot Point 52.44

  • R1 52.72
  • R2 52.88
  • R3 53.31

On the technical front, the WTI crude oil prices have violated the ascending triangle pattern on the lower side to trade at 51.45 level. The breakout patterns open further room for selling until 50.50 and 49.45. While the MACD has recently started forming histograms below zero level, which are suggesting odds of more selling in the WTI crude oil prices. In case the WTI crude oil violates 52.30 resistance mark, we may see crude oil prices heading towards 53.50. Good luck! 

Categories
Forex Market Analysis

Daily F.X. Analysis, February 18 – Top Trade Setups In Forex – Economic Events Disappoints 

On the forex front, the U.S. Dollar Index was broadly flat at 99.15 amid thin holiday trading. In the U.S., the New York Federal Reserve will publish February’s Empire Manufacturing Index (5.0 expected). The National Association of Home Builders will deliver January Housing Market Index (75 expected). Let’s take a look at trade plans.

Economic Events to Watch Today 


EUR/USD – Daily Analysis

The EUR/USD traded mostly around the 1.0830 price zone, a few pips above 1.0826, the multi-year low pasted last Friday. Market participants are struggling to find a catalyst, as the European macroeconomic calendar was empty yesterday due to the U.S. Presidents’ Day holiday. 

The traders eagerly anticipated the German ZEW economic sentiment, which was expected to worsen to 21.5 in February against. 26.7 reported in January. As per the recent release, the ZEW Indicator of Economic Sentiment for Germany decreased sharply in February, dropping 18.0 points to a distinct reading of 8.7 points. 

The fundamental event is thus lightly beneath its December 2019 mark. The evaluation of the economic situation in Germany has also worsened when we compare it with the previous month.

Moreover, EUR/USD currency pair near-term technical outlook also shows a bearish picture, with a test of the psychological support at 1.0800 on the cards. The traders will have their sights on the coronavirus headlines for taking fresh clues.

Daily Support and Resistance

  • S1 1.0795
  • S2 1.0817
  • S3 1.0826

Pivot Point 1.0839

  • R1 1.0848
  • R2 1.0861
  • R3 1.0883

EUR/USD– Trading Tips

On Tuesday, the EUR/USD trades near 1.0825 support level despite weaker than expected German ZEW economic sentiment data. At the moment, the pair appears to have formed neutral candles as the investors still didn’t find any solid reason to trigger bearish breakout at 1.0825 level. Today’s candle is also neutral, and it is pretty much likely to drive upward correction. Today, if the EUR/USD pair manages to drop below 1.0840, we may see EUR/USD prices going towards 1.0760. Let’s look for buying trade today above 1.0840. 


GBP/USD– Daily Analysis

The GBP/USD is trading sideways on Tuesday, but modest losses near the 1.3000 figure. Earlier today, the Sterling declined during but concerns about whether the current Chancellor of Exchequer will be ready to pass the budget on time. A report from U.K. Prime Minister Johnson’s spokesman confirmed that the U.K. is not asking anything distinct from the E.U. in trade discussions and that they are available to negotiate. 

Besides, the market risk-tone getting worse day-by-day mainly due to the coronavirus fears, which provides support to the greenback as a safe-haven currency. Despite lowering the pace of the death toll and infected peoples in China, the uncertainty and fears still surrounding the market.

On the forecasted views, the Bank of England’s last MPR looks for the unemployment rate to stay unchanged at 3.8% for the next 3-4 months, we look for an increase to 3.9% in December (mkt 3.8%), with the potential for another pop higher in January. As wage growth, we look for the recent pattern of deceleration to continue, with headline wage growth slowing to 3.0% y/y (mkt 3.0%), and private sector regular pay to 3.3% y/y (mkt: 3.3%). 

As the latter measure, the short-term trend growth rate has more than halved from a peak of 5.0% on a 3m/3m annualized basis in July to 2.2% as of November.

Daily Support and Resistance

  • S1 1.2912
  • S2 1.2965
  • S3 1.2985

Pivot Point 1.3018

  • R1 1.3038
  • R2 1.3072
  • R3 1.3125

GBP/USD– Trading Tip

The GBP/USD pair slipped lower to test the next support level of 1.2960 and has formed a Doji candle around this corner before taking a sharp bullish reversal. The bullish reversal is mostly caused by robust unemployment claims data, which is in support of the Sterling. 

The GBP/USD is trading at 1.3036, below the 1.3065 resistance level. Closings of candles below this level may help secure a sell trade around 1.3065, whereas, a bullish breakout of 1.3065 can lead the Cable towards 

The MACD and RSI are holding in the buying zone, supporting bullish bias for the GBP/USD pair. Let’s look for bullish trades above 1.3018 today. 


USD/JPY – Daily Analysis

The USD/JPY currency pair flashing red dropped to 109.70 from the 109.90, mainly due to safe-haven Japanese Yen strength in the wake of intensifying coronavirus fears. The USD/JPY is currently trading at 109.75 and consolidates in the range between the 109.66 – 109.90. However, the equity market again turned in red and sending Japanese yen higher.

The futures on the S&P 500 are currently reporting a 30% drop on the day. Meanwhile, stocks in South Korea and Hong Kong are presently dropping more than 1%. Major indices like Japan’s Nikkei and China’s Shanghai Composite are reporting a 1.2% and 0.30% drop, respectively. 

Whereas, the yield on the U.S. ten-year Treasury dropped nearly 3-basis points at 1.559%. The equity market flashing red and the uptick in the anti-risk Japanese yen could be the reason for on-going concerns on the economic impact of the coronavirus outbreak in China. 

The number of new virus cases in region China dropped below 2,000 on Tuesday for the first time since January; experts say it is too quick to say the outbreak has risen. 

On the other hand, China’s growth rate is expected to drop sharply in the 1st-quarter, while the officials seem not in favor of significant monetary stimulus. According to the MNI News, the officials have asked for a careful monetary policy action that will target only affected areas and avoid changing the current overall neutral stance. 

Looking forward, the risk-tone of the equity market may get worse, as tech giant Apple said on Monday that it would not reach its target income for the first quarter, largely because of to weaker iPhone production and softer market in China in the wake of coronavirus.


Daily Support and Resistance  

  • S1 109.6
  • S2 109.74
  • S3 109.81

Pivot Point 109.89

  • R1 109.96
  • R2 110.03
  • R3 110.18

USD/JPY – Trading Tips

The USD/JPY pair is trading 110.025 – 109.500 as the demand for safe-haven assets remains in check. At the moment, the USD/JPY pair is holding below 110 resistance as it failed to violate the horizontal resistance level of 110.025. In case, the USD/JPY manages to break above 110.025 level; we may see USD/JPY prices going towards 110.350 at first and then towards 110.850. Alternatively, the USD/JPY can drop to 109.300 in case of failure to break above 110.025. 

All the best for today! 

Categories
Forex Market Analysis

Gold Symmetric Triangle Continues to Play – Carnivorous Underpins Safe Haven! 

On Monday, the precious metal gold prices were near a two-week high mounted in the past session as doubt prevailed over the influence of the coronavirus disruption on the global economy. Gold is trading sideways around $1,582.08 per ounce, having placed the highest since Feb. 3 at $1,584.65 during the last week.

China advanced to reduce its medium-term lending rate to accommodate the economy against Caronovirus. While the emerging market currencies and stocks began the week on a firm basis as the move is anticipated to ease traders’ concern around the economic thrust from the coronavirus break.

A bullish reversal in the emerging market currencies could put stress on the U.S. Dollar. A weaker U.S. Dollar is suitable for gold rates. It serves to boost foreign trade for the dollar-denominated asset securities. 


Support     Resistance 

1,576.77     1,587.95

1,569.76     1,592.12

1,558.58     1,603.3

Pivot Point 1580.94

Technically, the gold hasn’t changed much as it’s price continues to trade in the symmetric triangle pattern. It’s keeping the gold prices under a resistance level of 1,584. On the lower side, gold’s immediate support stays around 1,577. A bullish breakout of 1,584 can lead to gold prices towards the next target level of 1,590. Conversely, the bearish breakout of 1,570 can lead to gold prices towards 1,560. The MACD is holding in a bullish zone, and it may help us capture a buying trade above 1,580 with a target of 1,588. Good luck! 

Categories
Forex Market Analysis

Daily F.X. Analysis, February 17 – Top Trade Setups In Forex – Presidents Day! 

The current week is anticipated to display a slow start with U.S. banks on holiday and light economic data. U.K. jobs data will be reported on Tuesday, and the Fed will publish minutes from their last conference on Wednesday.

The market awaits U.S. economic events, which are expected to drive some price action during the U.S. session today. The U.S. Commerce Department will report January retail sales (+0.3% on month expected) and December business inventories (+0.1% expected). 

The Labor Department will post the January import price index (-0.2% expected). The Federal Reserve will release January industrial production (-0.2% expected) and capacity utilization (76.8% expected). The University of Michigan will report its Consumer Sentiment Index for February (99.4 expected).

Economic Events to Watch Today 


EUR/USD – Daily Analysis

The EUR/USD placed a second consecutive weekly loss and dropped to levels not witnessed since April 2017 during the previous week. The euro was the most vulnerable amongst the majors, and deviation is seen in the dollar index (DXY).

Typically, the greenback and the EUR/USD shares a sharp inverse relationship. Last week, though, the greenback held beneath highs posted in September while the currency pair split to a notable low, which could be indicating a slowing of momentum in the greenback dollar. 

On Monday, the U.S. banks observance a holiday in the wake of President’sPresident’s day, and the economic calendar also remains light, which is why the current week is expected to have a quiet start. Volatility is expected to soar later in the week as the Fed publishes minutes from their latest meeting on Wednesday. On Friday, the PMI figures from Europe will be released and will help drive the movement in the market. 

Coronavirus concerns in the markets have sunk a great deal, and the S&P 500 placed a second back-to-back weekly gain to settle at a fresh record high. The German DAX supported the bullish momentum in the global stock markets and closed at a record high for the first time in 2 years.

Daily Support and Resistance

  • S1 1.0767
  • S2 1.0828
  • S3 1.0851

Pivot Point 1.0888

  • R1 1.0911
  • R2 1.0949
  • R3 1.1009

EUR/USD– Trading Tips

The EUR/USD dropped to trade around 1.0841 support level, and it appears to form a Doji candle today, perhaps due to a lack of trading volume and liquidity. Today’s candle is slightly bullish, and it is pretty much likely to form a bullish engulfing pattern or a tweezers top pattern to drive bullish reversal in the pair.

Today, if the EUR/USD pair manages to drop below 1.0840, we may see EUR/USD prices going towards 1.0760. Let’sLet’s look for buying trade today above 1.0840. 


GBP/USD– Daily Analysis

The GBP/USD traded slightly bullish last week after examining its 100-day moving average. The GBP/USD pair has made a remarkable recovery, although the bearish momentum from earlier in the month reaches to prevent further bullish bias.

The greenback, while posting a second back-to-back weekly rise, has exhibited signs of instability. During the previous week, the dollar weakened against the Sterling, which might be contributing an early sign for a pullback.

The current week is anticipated to display a slow start with U.S. banks on holiday and light economic data. U.K. jobs data will be reported on Tuesday, and the Fed will publish minutes from their last conference on Wednesday. Besides, the inflation figures coming from Britain will be posted on Wednesday. The CPI is anticipated to climb by 1.7% in the year to January versus growth of 1.3% in the previous reading.

The risk-tone stays sluggish with stocks in China contradicting those of India and Japan due to hopes of further monetary/fiscal measures to counter coronavirus risk. Looking forward, the U.S. markets are closed due to the President’sPresident’s Day Holiday, and therefore, fewer moves are expected to take place during the day ahead. However, the traders will keep thor eyes on the coronavirus/Brexit headlines.

Daily Support and Resistance

  • S1 1.2888
  • S2 1.2928
  • S3 1.2944

Pivot Point 1.2968

  • R1 1.2984
  • R2 1.3008
  • R3 1.3047

GBP/USD– Trading Tip

On Monday, the GBP/USD continues to trade sideways, holding below 1.3065 resistance market. The GBP/USD pair holds above 1.3000, which is the most crucial level, and the violation of this level can lead to GBP prices further lower towards 1.2965 and 1.2925. The MACD and RSI are holding in the buying zone, supporting bullish bias for the GBP/USD pair. Let’s look for bullish trades above 1.3000 and bearish below the same level today as the President Day holiday is likely to keep the market less volatile.  


USD/JPY – Daily Analysis

The USD/JPY currency pair flashing red and dropped to 109.75 despite the release of downbeat Japan’ Japan’ preliminary 4th-quarter (Q4) GDP data earlier today. The USD/JPY is currently trading at 109.81 and consolidates in the range between the 109.72 – 109.86. The traders are keeping their focus on qualitative catalysts.

On the forecasted view, Japan’s economic growth decreased and came out well below 0.9% figure to 1.6%, whereas the annual figures also disappoint with -6.3% against -3.7% expected.

The 1st economic recession after the 4th-consecutive quarter of growth pushes the policymakers of the Bank of Japan to take steps and understand how to secure the economy ahead. Whereas, the recent data regarding spending and activity figures were soft, while the traders should not ignore the International Monetary Fund’s (IMF) suggestion for taking fresh directions.

The Bank of Japan struggles to decrease the strength of the Japanese Yen, the safe-haven currency getting benefits from the risk-off market sentiment in the wake of China’s coronavirus, and Brexit fears. These two factors are the biggest reason behind the pair bearish sentiment.

At the coronavirus front, the Chinese officials have struggled too much to improve the risk-sentiment, which is severely disturbed by the fears of the coronavirus. The market showed a slight improvement in the risk-tone. However, the broad sentiment and the numbers have unchanged so far, so, the USD/JPY currency pair still trading on the bearish track.

Daily Support and Resistance  

  • S1 109.42
  • S2 109.6
  • S3 109.69

Pivot Point 109.79

  • R1 109.87
  • R2 109.97
  • R3 110.15

USD/JPY – Trading Tips

The USD/JPY pair is trading 110.025 – 109.500 due to a lack of economic events as the U.S. banks are closed in the observance of Presidents Day. At the moment, the USD/JPY pair is holding below 110 resistance as it failed to violate the horizontal resistance level of 110.025.

In case, the USD/JPY manages to break above 110.025 level; we may see USD/JPY prices going towards 110.350 at first and then towards 110.850. Alternatively, the USD/JPY can drop to 109.300 in case of failure to break above 110.025. 

All the best for today! 

Categories
Forex Market Analysis

Crude Oil Testing Double Top – U.S. Session Trade Setup!

The WTI crude oil prices rose slightly, mainly due to the hopes of deeper supply cuts from the major producers. The U.S. Crude Oil WTI Futures inched up 0.1% to $51.48 by 12:30 AM ET (04:30 GMT).

The Organization of the Petroleum Exporting Countries (OPEC) dropped its 2020 demand forecast for its crude by 200,000 barrels per day, indicating worries regarding the coronavirus outbreak in China, the world’s biggest oil importer.

While the International Energy Agency expected a drop of 435,000 barrels a day during the first 3-months of the year, it had previously expected world fuel consumption to rise by 800,000 barrels a day as compared to a year earlier.

The WTI oil prices have fallen nearly 20% from their tops in early January, mainly due to oil demand from China fell in the wake of travel restrictions. The China Health Commission, the epicenter Hubei province, reports 4,823 new cases on the second day of using the new diagnosing method. The number of people in severe and critical conditions rose to 9,638 from the prior figures of 7,084.

Daily Support and Resistance

  • S1 49.01
  • S2 50.24
  • S3 51.05

Pivot Point 51.47

  • R1 52.28
  • R2 52.7
  • R3 53.92

On the technical side, the WTI crude oil is holding below 52.07 resistance level, which is keeping the oil prices under pressure. The market is lacking volatility, as traders are staying out of the market ahead of the weekend. In any case, the bullish breakout of 52.07 level can extend buying until 53 and 53.25 while the selling can be seen below the 52.07 mark. The RSI and MACD are holding in the buying zone, suggesting chances of buying trends in the WTI. Today, we can place a buy stop around 52.15 to target 52.65. Good luck! 

Categories
Forex Market Analysis

Daily F.X. Analysis, February 14 – Top Trade Setups In Forex – Brace for U.S. Retail Sales!  

On Friday, the market awaits U.S. economic events, which are expected to drive some price action during the U.S. session today. The U.S. Commerce Department will report January retail sales (+0.3% on month expected) and December business inventories (+0.1% expected). 

The Labor Department will post the January import price index (-0.2% expected). The Federal Reserve will release January industrial production (-0.2% expected) and capacity utilization (76.8% expected). The University of Michigan will report its Consumer Sentiment Index for February (99.4 expected).

Economic Events to Watch Today 


EUR/USD – Daily Analysis

The EUR/USD dropped 0.3% to 1.0842, the lowest level since April 2017. Later today, the eurozone’s fourth-quarter GDP growth will be reported (+1.0% on-year expected)

The money markets are currently pricing approximately 6-basis points of a rate cut by the end of 2020, against a zero probability seen a month earlier. On the other hand, the EUR/USD currency pair may find some bids if the German data prints better-than-expectations. Whereas, the technical bias will remain bearish until the pair does not reach above the 10-day Moving average at 1.0940.

Traders are currently waiting for the German data to take new positions. The market will also keep their eyes on Italian Trade Balance and Flash Employment Change for taking fresh cues.

Later today, official reports on January retail sales (+0.3% on month expected), industrial production (-0.2% on month expected), and the University of Michigan consumer sentiment index (February preliminary reading, 99.4 expected) will be released.

Daily Support and Resistance

  • S1 1.0767
  • S2 1.0828
  • S3 1.0851

Pivot Point 1.0888

  • R1 1.0911
  • R2 1.0949
  • R3 1.1009

EUR/USD– Trading Tips

The EUR/USD fell dramatically to trade around 1.0841 support level, and it seems to form a Doji candle today, perhaps due to a lack of trading volume and liquidity. If this happens, we may see the bullish trend in the EUR/USD pair in the week ahead. At the same time, if the EUR/USD pair manages to drop below 1.0840, we may see EUR/USD prices going towards 1.0760. Let’s look for buying trade today above 1.0840. 


GBP/USD– Daily Analysis

The GBP/USD rose 0.7% on the day to 1.3046. U.K. Chancellor Sajid Javid has resigned from his position, and his deputy Rishi Sunak will succeed him. Investors speculated that this might pave the way for more fiscal stimulus.

On the other hand, the fears of coronavirus are decreasing and supporting the risk recovery. As a result, the U.S. 10-year Treasury yields stay modestly down to 1.61% while stocks in Asia are marking a recovery from Thursday’s declines.

Looking forward, the lack of U.K. data will push the cable traders to keep eyes on political/Brexit headlines, as well as coronavirus update. However, the U.S. Retail Sales and Michigan Consumer Sentiment Index will entertain the momentum traders during the later part of the day.

The GBP/USD broke above 1.2950 resistance level, which is now looking to test the next resistance around 1.3045. The following support level is likely to be found around 1.2950 for now. 

Daily Support and Resistance

  • S1 1.2888
  • S2 1.2928
  • S3 1.2944

Pivot Point 1.2968

  • R1 1.2984
  • R2 1.3008
  • R3 1.3047

GBP/USD– Trading Tip

On the 4 hour timeframe, 1.3000 is the most crucial level for the GBP/USD as a violation of this level can lead Sterling prices further higher towards 1.3045 and 1.3065 in the coming week. 

The MACD and RSI are holding in the buying zone, supporting bullish bias for the GBP/USD pair. Let’s look for bullish trades above 1.3000 today. 


USD/JPY – Daily Analysis

The USD/JPY slid 0.3% to 109.75. The USD/JPY is struggling to keep their gains ahead of key U.S. data and looking toward fresh developments in the coronavirus. The USD/JPY trades around at 109.78 and consolidates in the narrow range between the 109.76 – 109.87.

According to the news from China Health Commission, the epicenter Hubei province reports 4,823 new cases on the second day of using the new diagnosing method. The number of people is in severe and critical condition, and the number rose to 9,638 from the prior figures of 7,084.

It should be noted that China’s President Xi Jinping told on Thursday that the government’s struggles are starting to have positive effects on the Chinese economy.

It is worth to mention:

1: Reports 116 new deaths.

2: Total confirmed cases rise to 51,986.

3: Number of people in serious and critical condition 9,638, from 7,084 yesterday.

4:Around the globe, a total of 65,236 cases, 1,487 deaths.

As in result, the U.S. 2-year Treasury yields initially extended the reaction to the coronavirus news to 1.39% before rebounding to 1.44%, which is where they were pre-news. 10-year yields similarly fell to 1.57% before recovering to 1.62%. 

Daily Support and Resistance

  • R3: 110.63
  • R2: 110.33
  • R1: 110.21

Pivot Point 110.02

  • S1: 109.9
  • S2: 109.71
  • S3: 109.4

USD/JPY – Trading Tips

On Friday, the USD/JPY pair hasn’t changed much as it continues to trade with in the same trading 110.025 – 109.500. Apparently, it is due to a lack of economic events, but we may see movement during the U.S. session on the release of U.S. Retail Sales data. At the moment, the USD/JPY pair is holding below 110 resistance as it failed to violate the horizontal resistance level of 110.025.

In case, the USD/JPY manages to break above 110.025 level; we may see USD/JPY prices going towards 110.350 at first and then towards 110.850. Alternatively, the USD/JPY can drop to 109.300 in case of failure to break above 110.025. 

All the best for today! 

Categories
Forex Market Analysis

Gold’s Symmetric Triangle Remisn Intact – Investors Eye for a Breakout!

ouldThe precious metal gold traded bullish again since the inception of the trading day, topping the $1,576 level after the price dropped to the $1562 through the session. That has happened despite the words by the Chinese president that the corona situation is under control and that the disease is at its top; thus, the situation would be entirely contained by next April.

In addition to this, the U.S. Labor Department announced its U.S. Consumer Price Index increased 0.1% in January, following a 0.2% increase in December. The U.S. CPI figures were weaker than anticipated, as forecasts were for a growth rate of 0.2%.

The U.S. core CPI data increased in line with forecast, rising 0.2% during the previous month, following December’s surge of 0.1%. Annual core inflation climbed 2.3% last month, the report declared.


Support Resistance
1,561.75 1,570.37
1,557.54 1,574.77
1,548.92 1,583.38
Pivot Point 1,566.15

On the technical front, the precious metal gold is trading within a symmetric triangle pattern, which is keeping the yellow metal prices in a sideways range of 1,577 – 1,552. Typically, the symmetric triangle pattern signals the indecision among traders and demonstrates that the investors are looking for a solid reason to trigger a breakout while this breakout can be on either side. With that being said, we need to keep a close eye on the 1,577 level as the bullish breakout of this level can extend buying until 1,585 level. Good luck!

Categories
Forex Market Analysis

Daily F.X. Analysis, February 13 – Top Trade Setups In Forex – U.S. Inflation In Highlights! 

The U.S. government reported a budget deficit of 32.6 billion dollars for January, significantly above the expected deficit of 10.0 billion dollars.

Later today, the Labor Department will post Consumer Price Index for January (+0.2% on month expected), and Initial Jobless Claims for the week ended February 8 (210,000 expected). European stocks were broadly higher, with the Stoxx Europe 600 Index rising 0.6%. Germany’s DAX gained 0.9%, France’s CAC rose 0.8%, and the U.K.’s FTSE 100 was up 0.5%.

The U.S. government bond prices eased for a second session, as the benchmark 10-year Treasury yield settled higher at 1.629%.

Economic Events to Watch Today 


EUR/USD – Daily Analysis

The EUR/USD slid 0.4% to 1.0874, the lowest level since May 2017. Official data revealed that the Euro zone’s industrial production contracted 2.1% on month in December (-2.0% expected), the most significant decline in nearly four years.

The EUR/USD pair is prolonging the losses, and today, we are on the weakest levels since May 2017. On the news front, that is a blend of dovish ECB and concerns about retardation in the Eurozone, especially in Germany. 

In addition to this, the U.S. Fed Chair Powell kept his stand in testimonies to Congress, verifying that the Fed does not see to cut rates any time shortly. Nonetheless, the money markets proceed to price in another interest rate cut in the second half of the year.

The EUR currency will likely continue to flash red, having found acceptance under the critical support at 1.0879. Whereas, the bearish common currency could find bids if the U.S. Consumer Price Index (CPI) for January, which is listed to deliver at 13:30 GMT, exceeds the expectations by a significant margin. As better than expected CPI data will enable markets to price out probabilities of an additional interest rate cut by the Federal Reserve. 

Daily Support and Resistance

  • R3: 1.1009
  • R2: 1.0949
  • R1: 1.0911

Pivot Point 1.0888

  • S1: 1.0851
  • S2: 1.0828
  • S3: 1.0767

EUR/USD– Trading Tips

The EUR/USD is consolidating in a bearish zone around 1.0912 in the wake of a stronger dollar and weaker Euro. Presently, the pair is very near to the strong support mark of 1.0879, and the EUR/USD has also concluded a daily candle over this level. The pair has also formed a Doji candle accompanied by a robust bearish trend, which implies the odds of a downward reversal unto 1.0945 and 1.0980. Alternatively, the violation of 1.0925 can push buying in Euro; elsewhere, it may extend trading bearish unto 1.0880.


GBP/USD– Daily Analysis

The GBP/USD marked a day-high of 1.2991 before retreating to close at 1.2955, relatively flat on the day. At the USD front, the greenback getting support as a safe-haven flows from the coronavirus fears. Moreover, the United States economy is performing almost strong, as shown last week’s nonfarm payroll report.

As in result, the U.S. 10-year Treasury yields decreased nearly 3-basis points to 1.60%, whereas most of the Asian shares are also in negative territories.

Looking forward, the Brexit and political updates from the U.K., and the U.S. Consumer Price Index data for January will be the keys to watch whereas; the traders also keep their eyes on the coronavirus headlines.

Daily Support and Resistance

  • R3: 1.3047
  • R2: 1.3008
  • R1: 1.2984
    Pivot Point 1.2968
  • S1: 1.2944
  • S2: 1.2928
  • S3: 1.2888

GBP/USD– Trading Tip

The GBP/USD broke above 1.2950 resistance level, which is now looking to test the next resistance around 1.3045. The following support level is likely to be found around 1.2950 for now. On the 4 hour timeframe, 1.3000 is the most crucial level for the GBP/USD as a violation of this level can lead Sterling prices further higher towards 1.3045 and 1.3065 in the coming week. The MACD and RSI are holding in the buying zone, supporting bullish bias for the GBP/USD pair. Let’s look for bullish trades above 1.3000 today. 


USD/JPY – Daily Analysis

The safe-haven-metal prices got support and representing 0.30% gains on the day mainly due to risk-off market sentiment in the wake of coronavirus intensified fears. The yellow metal is currently trading at $1,570 per Oz, representing a 0.30% gain on the day.

The coronavirus is back in action, as the latest report in coronavirus infected and dead people from Hubei registered a sharp rise due to the change in the updated diagnostic standard. The numbers mention 14,840 new coronavirus cases, with the death toll rising by 242 to 1,310 at the end of February 12, 2020.

However, the renewed coronavirus fears could be the reason behind the risk-off sentiment, caused by the big jump seen in the coronavirus cases in China. As in result, the futures on the S&P 500 are currently down 0.30%, and so is the price of WTI oil. Japan’s Nikkei is also representing a 0.10% drop. 

Meanwhile, the Japanese yen is attracting bids against commodity dollars, AUD, NZD, and CAD currencies. The markets might review the historical data with the new methodology. If the trend is found to be slowing, the risk sentiment could improve, and ultimately decreasing the bid tone around the gold. 

Daily Support and Resistance

  • R3: 110.63
  • R2: 110.33
  • R1: 110.21
    Pivot Point 110.02
  • S1: 109.9
  • S2: 109.71
  • S3: 109.4

USD/JPY – Trading Tips

The USD/JPY pair is trading in a narrow range of 110.025 – 109.600 due to a lack of economic events during the Asian session, but we may see movement during the U.S. session on the release of CPI data. At the moment, the USD/JPY pair is looking to cross above the horizontal resistance level of 110.025. 

In case, the USDJPY manages to break above 110.025 level; we may see USD/JPY prices going towards 110.350 at first and then towards 110.850. Alternatively, the USD/JPY can drop to 109.600 in case of failure to break above 110.025. 

All the best for today! 

Categories
Forex Market Analysis

Daily F.X. Analysis, February 12 – Top Trade Setups In Forex – Fed Chair Powell Testimony Ahead! 

The U.S. National Federation of Independent Business’s Small Business Optimism Index posted at 104.3 for January, better than 103.5 expected.

Later today, the U.S. government is expected to post a monthly budget deficit of 10.0 billion dollars for January. The European stocks ended in positive territory, with the Stoxx Europe 600 Index rising 0.9%. Germany’s DAX advanced 1%, and both France’s CAC and the U.K.’s FTSE 100 were up 0.7%.

The Safe-haven assets were broadly lower in price. U.S. government bond prices eased, lifting the benchmark 10-year Treasury yield to 1.589% from 1.574% Monday.

Economic Events to Watch Today 


EUR/USD – Daily Analysis

The EUR/USD rebounded 0.1% to 1.0919, halting a six-day decline. European Central Bank President Christine Lagarde hinted that ECB might not ease monetary policy further, saying: “Monetary policy cannot, and should not, be the only game in town.” Later today, the Eurozone’s December industrial production will be reported (-2.0% on month expected).

The support to Euro came after the dovish remarks by the ECB President Lagarde, iterating that the slowing growth momentum in the Eurozone also decreased pressure on prices, which further helped the pair’s slide beneath the 1.0900 level for the first time after early October.

Looking forward, the shared currency will likely stay on the bullish track, mainly if the equities market continues to flash green in the wake of coronavirus development. Moreover, the riskier currencies like the NZD and the Aussie are also flashing green an picked up a strong bid at the press time.

In case the Eurozone industrial production disappoints expectations, the single currency may drop and revisit support at 1.0879 (October 1 low). Besides, the traders will keep their eyes on the German 10-y Bond Auction for taking fresh clues.

Daily Support and Resistance

  • S1 1.0826
  • S2 1.0876
  • S3 1.0893

Pivot Point 1.0925

  • R1 1.0943
  • R2 1.0975
  • R3 1.1025

EUR/USD– Trading Tips

The EUR/USD is consolidating in a bearish zone around 1.0912 in the wake of a stronger dollar and weaker Euro. Presently, the pair is very near to the strong support mark of 1.0879, and the EUR/USD has also concluded a daily candle over this level. The pair has also formed a Doji candle accompanied by a robust bearish trend, which implies the odds of a downward reversal unto 1.0945 and 1.0980. Alternatively, the violation of 1.0925 can push buying in Euro; elsewhere, it may extend trading bearish unto 1.0880.


GBP/USD– Daily Analysis

The GBP/USD rose 0.3% to 1.2954. Official data showed that the U.K. fourth-quarter GDP grew 1.1% on year (+0.8% expected, +1.1% in the third quarter).

The GBP/USD rate is growing higher this week as the moving average extends support alongside the weakness in the U.S. dollar. The GBP/USD was last seen around the 1.3000 resistance after placing a low around 1.2870 in the early week.

The GDP figures from the United Kingdom published on Tuesday had little influence on the GBP/USD price as economic growth was not surprising in the fourth quarter, which was widely anticipated. A recovery yesterday was held lower by a major technical mark at 1.2960, although the pair is seen climbing over it in early trading today.

Daily Support and Resistance   

  • S1 1.2762
  • S2 1.2837
  • S3 1.2876

Pivot Point 1.2911

  • R1 1.295
  • R2 1.2985
  • R3 1.306

GBP/USD– Trading Tip

The GBP/USD broke above 1.2950 resistance level, which is now looking to test the next resistance around 1.3045. The following support level is likely to be found around 1.2950 for now. On the 4 hour timeframe, 1.3000 is the most crucial level for the GBP/USD as a violation of this level can lead Sterling prices further higher towards 1.3045 and 1.3065 in the coming week. The MACD and RSI are holding in the buying zone, supporting bullish bias for the GBP/USD pair. Let’s look for bullish trades above 1.3000 today. 


USD/JPY – Daily Analysis

The USD/JPY currency pair is flashing green and struggling to cross the 1.10 level, mainly due to the Japanese yen weakness in the wake of risk-on market sentiment. Currently, the USD/JPY is currently trading at 109.89 and consolidates in the narrow trading range between the 109.77 – 109.90. 

In the market, traders are found on the waiting mode for economic data and a carefully optimistic Federal Reserve chair Jerome Powell who resumes his semi-annual congressional testimony, performing before the Senate Banking Committee later today in New York.

At the coronavirus front, the latest numbers China’s Health Commission gave showed 1,638 new cases of coronavirus contaminated people from Hubei. Compared to the prior day’s 2,097 incidents, the disease appears to decrease gradually. Moreover, the World Health Organization (WHO) has already said that the vaccine could be ready in 18 months, giving a boost to the risk-on.

As a result, it increased from 1.40% to 1.42%, ten-year yields from 1.57% to 1.59%, boosting the U.S. dollar and sending the yen and risk asset classes like gold lower. The S&P 500 and Nasdaq Composite each posting a record finish, and the Dow Jones Industrial Average was virtually unchanged.

So, this news has also improved risk sentiment and sentiment in global financial and commodity markets (copper +0.97%, CRB index +0.44% time of writing) as it is showing that the Chinese are making progress in fighting and controlling the virus. The Federal Reserve’s Chair, Jerome Powell, sounded dovish but had a cautious tone in his semi-annual testimony to Congress.


Daily Support and Resistance

  • S1 109.33
  • S2 109.54
  • S3 109.66

Pivot Point 109.76

  • R1 109.87
  • R2 109.97
  • R3 110.18

USD/JPY – Trading Tips

On Wednesday, the USD/JPY pair is trading in a narrow range of 110.025 – 109.600 due to a lack of economic events. At the moment, the USD/JPY pair is looking to cross above the horizontal resistance level of 110.025. 

In case, the USDJPY manages to break above 110.025 level; we may see USD/JPY prices going towards 110.350 at first and then towards 110.850. Alternatively, the USD/JPY can drop to 109.600 in case of failure to break above 110.025. 

All the best for today! 

Categories
Forex Market Analysis

Gold’s Sideways Trading Continues – Quick Trade Plan Today! 

Gold price edged up to $1,571, an ounce extending its rebound to a fourth session. On Tuesday, the precious metal gold edged lower as European stocks climbed to record highs and the dollar hit a four-month peak, after a fall in the number of new confirmed cases of coronavirus limited the appetite for lower-risk assets and drove buying elsewhere.

The U.S. government bond prices were steady as the benchmark 10-year Treasury yield edged down to 1.574% from 1.578% last Friday.

China’s virus disease may rise in February, and then plateau ere easing, the government’s topmost medical expert on the virus break announced.

The disease is the world’s second-largest marketplace that has hit more than 1,000 so far and frightened the country’s economic extension as companies strived to return to work after an extended Lunar New Year holiday.


Gold is trading sideways within the symmetric triangle pattern, which is keeping gold bearish below 1,583 and bullish above 1,570. The weaker dollar sentiment is keeping gold prices bullish as investors are feeling less confident about the U.S. dollar since the release of worse than the expected unemployment rate, released on Friday. 

Today, we can consider staying bullish above 1,568 as gold prices can soar towards 1,579/1,581. Good luck! 

Categories
Forex Market Analysis

Daily F.X. Analysis, February 11 – Top Trade Setups In Forex – Central Bank Speeches Ahead! 

On Tuesday, the U.S. Labor Department will post JOLTS job openings for December (6.85M expected). The National Federation of Independent Business (NFIB) will release January Small Business Optimism Index (103.3 expected).

The U.S. government bond prices were steady as the benchmark 10-year Treasury yield edged down to 1.574% from 1.578% last Friday.

Economic Events to Watch Today 


EUR/USD – Daily Analysis

The EUR/USD lost 0.4% to 1.0911. The eurozone’s Sentix Investor Confidence Index fell to 5.7 in February (5.9 expected) from 7.6 in January.

If Federal Reserve Chairman Jerome Powell ignores the impact of coronavirus, then the greenback may put strong bids mainly due to fewer chances of the rate cut. As in result, the EUR/USD currency pair drop further below the 1.079. 

The U.S. dollar continued its fresh rally versus the European counterpart and moved the EUR/USD pair to new 2020 lows on the first day of a new trading week. Despite a positive sentiment encompassing equity markets, concerns about the spread of the fatal coronavirus continued helping the greenback’s perceived safe-haven status and continued exerting pressure on the major.

Besides this, the currency pair will likely take clues from the Europan Central Bank head Christine Lagarde’s presentation at the European Parliament in Strasbourg at 2 pm. 


Daily Support and Resistance

  • S1 1.0874
  • S2 1.0916
  • S3 1.0931

Pivot Point 1.0957

  • R1 1.0972
  • R2 1.0998
  • R3 1.104

EUR/USD– Trading Tips

The EUR/USD collapsed beneath the horizontal support level of 1.0995, which is now working as a support level for the EUR/USD pair. Closing of candles below this 1.099 is confirming a breakout and demonstrates that this level is currently working as a resistance. It may keep the Euro bearish until 1.09374. 

On the 4 hour timeframe, the pair’s MACD is closing histograms under 0, demonstrating chances of further selling in the pair while the bearish channel is also likely to get violated until and unless Nonfarm payroll comes out better than expected. 


GBP/USD– Daily Analysis

The GBP/USD rebounded 0.2% to 1.2915, snapping a three-day losing streak. Later today, U.K. fourth-quarter GDP growth will be released (+0.8% on-year expected).

The U.K.’s data dump for December, including Trade Balance, Industrial Production and Manufacturing Production, will be the key to watch respecting the latest upbeat British data pushing BOE off from its bearish bias. However, the key will be the preliminary prints of the 4th-quarter (Q4) Gross Domestic Product (GDP). 

The growth measure is expected to decrease to 0.8% YoY from 1.1% earlier, while the QoQ GDP will shrink to 0.0% from 0.4% earlier. Moreover, the BOE’s Governor Mark Carney will also speak at the U.K. parliament and might reiterate his dislike for the Brexit. At Powell’s speech front, the Federal Reserve (Fed) chief Jay Powell will testify before Congress on Tuesday (15:00 GMT) and Wednesday. 

Whereas, the market’s traders are expecting dovish tone from the Powell mainly due to global economic slowdown in the wake of coronavirus outbreak. On the other hand, if Federal Reserve Chairman Jerome Powell ignores the impact of coronavirus, then the greenback may put strong bids mainly due to fewer chances of the rate cut.

Daily Support and Resistance

  • S1 1.2753
  • S2 1.2831
  • S3 1.2858

Pivot Point 1.2909

  • R1 1.2936
  • R2 1.2987
  • R3 1.3065

GBP/USD– Trading Tip

The GBP/USD broke below 1.2950 support is to test the next support level of 1.2925. It’s the most crucial level for the GBP/USD as a violation of this level can lead Sterling prices further down towards 1.2870 and 1.2830 in the coming week.  

At the moment, the GBP/USD has neutral candles below 1.2920 support level, which is suggesting a bearish trend in the GBP/USD. The MACD and RSI are holding in the bearish zone, supporting selling bias for the GBP/USD pair. 


USD/JPY – Daily Analysis

The USD/JPY currency pair is flashing green but still below the 110 handles; the currency pair is still struggling to hit the 110 level ahead of major events. The USD/JPY currency pair is currently trading at 109.90 and consolidates in the range between 109.74 – 109.95. 

The currency pair is getting support from the improving risk-tone after China’s liquidity support and the positive report of coronavirus vaccination. Besides, the fresh developments of the virus, the focus also shifts on the U.S. yields and the Federal Reserve this week. The U.S. 2-year treasury yields fell from 1.41% to 1.38%, while the 10-year yields moved from 1.59% to 1.55%. 

The markets have been pricing in a 10% chance of a rate cut at the next Fed decision on March 18, and a terminal rate of 1.12% (vs. Fed’s mid-rate at 1.63% currently). While stock markets remain solid, with the U.S. benchmarks rising to new highs, there is an underbelly of dissatisfaction in the bond markets, which may be a warning that investors are still complacent.

Although, the risk-tone recovers mainly due to China’s liquidity support and the report came that the experts in Shanghai recently have isolated strains of the novel coronavirus, which will raise the development of vaccine and medicine against the virus. 

Daily Support and Resistance

  • S1 108.57
  • S2 109.11
  • S3 109.47

Pivot Point 109.66

  • R1 110.01
  • R2 110.2
  • R3 110.75

USD/JPY – Trading Tips

On Tuesday, the USD/JPY pair is consolidating with a bullish bias in the wake of weakening Japanese yen. The pair has crossed over 109.300 resistance level, and it seems to head towards 109.850. On Wednesday, the USD/JPY is likely to find resistance around 110.300 after violating 109.850. While support remains at 109.250. The RSI and MACD have crossed over in the buying zone and are supporting the bullish bias. Let’s look for buying trades above 109.26 today.

All the best for today! 

Categories
Forex Market Analysis

Gold’s Symmetric Triangle Pattern Holds – What’s the Next Plan?

Despite the convincing outcome of the US January labor market report, the price of gold maintains a bullish return up to the $1,574 resistance mark during Friday’s trading session as the precious metal closed the week’s around the $1570 level. 

All this bullish movement came in response to the rising global concerns about the worsening of the situation in China due to the disruption of the Coronavirus. To date, there is no proper vaccine announced to cope up with this disease, and the number of victims is growing, whether by death or disease, and the disease has expanded to more than 20 nations throughout the world besides China.  

As we know, the precious metal gold is an absolute haven for traders during the times of uncertainty, as is the situation now with the world’s interests about Corona. The Chinese government declared that a 1,500-bed hospital was made in two weeks in Wuhan, and another 1,000-bed hospital was created in 10 days during the previous week. The city council, with a people of 11 million, has announced it will launch hygiene operations twice a day for hospitals, markets, public toilets, and other facilities.


Gold – XAU/USD – Daily Technical Levels

Support     Resistance 

1,562.34     1,576.29

1,554.3       1,582.19

1,540.35     1,596.14

Pivot Point 1,568.25

Gold is trading sideways within the symmetric triangle pattern, which is keeping gold bearish below 1,583 and bullish above 1,570. The weaker dollar sentiment is keeping gold prices bullish as investors are feeling less confident about the U.S. dollar since the release of worse than the expected unemployment rate, released on Friday. Today, we can consider staying bullish above 1,568 as gold prices can soar towards 1,579/1,581. Good luck! 

Categories
Forex Market Analysis

Daily F.X. Analysis, February 10 – Top Trade Setups In Forex – Post NFP Trade Plan! 

The U.S. Labor Department reported that the economy added 225,000 nonfarm payrolls in January, higher than the addition of 162,000 expected. Meanwhile, the jobless rate climbed to 3.6% (3.5% expected). Average hourly earnings grew 0.2% on month (+0.3% expected) and were up 3.1% on year (+3.0% expected).

Official data showed that wholesale inventories (final reading) fell 0.2% on month in December (-0.1% expected).

Economic Events to Watch Today 


EUR/USD – Daily Analysis

The EUR/USD dropped 0.3% to 1.0945, the lowest level since October. Official data showed that German industrial production contracted 3.5% on month in December (+0.6% expected), the largest decline in a decade.

The EUR/USD currency pair bullish moves could be limited mainly due to the risk-off market sentiment as coronavirus fears still on the peak and at the front of the latest news, recorded more than 37,000 known cases across the globe and 813 deaths so far.

The investors may ignore the China data in Asia due to coronavirus fears, which showed producer price index, a gauge of factory gate prices, edged up 0.1% on year in January, compared with a 0.5% decline in December. 

At the data front, Eurozone’s Sentix Investor Confidence (Feb) will be released at 09:00 GMT. On the other hand, the focus will be on the Federal Reserve President’s speech and short-term bill auctions.


Daily Support and Resistance

  • S1 1.0874
  • S2 1.0916
  • S3 1.0931

Pivot Point 1.0957

  • R1 1.0972
  • R2 1.0998
  • R3 1.104

EUR/USD– Trading Tips

On Friday, the EUR/USD broke below the horizontal support level of 1.0995, which is now working as a support level for the EUR/USD pair. Closing of candles below this 1.099 is confirming a breakout and demonstrates that this level is currently working as a resistance. It may keep the Euro bearish until 1.09374. 

On the 4 hour timeframe, the pair’s MACD is closing histograms under 0, demonstrating chances of further selling in the pair while the bearish channel is also likely to get violated until and unless Nonfarm payroll comes out better than expected. 


GBP/USD– Daily Analysis

The GBP/USD slid 0.3% to a six-week low of 1.2893, the weakest level since November. The currency pair bearish trend also could be the reason for coronavirus fears because investors were sacred and poured money into the safe-haven treasuries. As in result, the greenback succeeded in gaining support from it.

At the front of the latest news, I have recorded more than 37,000 known cases across the globe and 813 deaths so far. As a result, the U.S. ten-year treasury yields continue to positive around 1.58%, whereas Asian stocks register mild losses by the press time.

Looking forward, due to the lack of data in the economic calendar, the traders will find clues from China and the U.K. headlines for taking fresh directions. Whereas, the positive headlines will likely support the pair. 

The GBP/USD is gaining momentum over the weaker dollar as the U.S. Labor Department reported that the economy added 225,000 nonfarm payrolls in January, higher than the addition of 162,000 expected. Meanwhile, the jobless rate climbed to 3.6% (3.5% expected). Average hourly earnings grew 0.2% on month (+0.3% expected) and were up 3.1% on year (+3.0% expected).


Daily Support and Resistance

  • S1 1.2753
  • S2 1.2831
  • S3 1.2858

Pivot Point 1.2909

  • R1 1.2936
  • R2 1.2987
  • R3 1.3065

GBP/USD– Trading Tip

A day before, the GBP/USD broke below 1.2950 support is to test the next support level of 1.2925. It’s the most crucial level for the GBP/USD as a violation of this level can lead Sterling prices further down towards 1.2870 and 1.2830 in the coming week.  

At the moment, the GBP/USD has neutral candles below 1.2920 support level, which is suggesting a bearish trend in the GBP/USD. The MACD and RSI are holding in the bearish zone, supporting selling bias for the GBP/USD pair. 


USD/JPY – Daily Analysis

The USD/JPY currency pair flashing red and dropped below the 110 level, mainly due to greenback losing its bullish momentum ahead of the pre-NFP data. The USD/JPY currency pair s currently trading at 109.97 and consolidates in the range between the 109.81 – 110.03. The currency pair registered a fresh high at 110.03 during early Asia but failed to maintain and dropped again.

We have seen a strong run in U.S. equities despite the renewed threat of the coronavirus while the Japanese yen felt the stampede nonetheless. 

At the coronavirus front, China declared the latest update that there were an additional 73 deaths losses and 3,143 new cases of the coronavirus in China as of the end of February 6, the National Health Commission said in its daily update on Friday. This brings the total number of deaths in China to 636 and the total number of confirmed cases to 31,161.

Meanwhile, U.S. 2-year Treasury yields consolidate in the narrow range between 1.43% and 1.47%, and 10-year yields moved between 1.63% and 1.68%. Moreover, the markets are pricing a 10% chance of a rate cut at the next Fed decision on March 18, and a terminal rate of 1.18% (vs. Fed’s mid-rate at 1.63% currently).

Looking forward, the trader’s focus will be on January nonfarm payroll and hourly earning for taking fresh direction.

Daily Support and Resistance

  • S1 108.57
  • S2 109.11
  • S3 109.47

Pivot Point 109.66

  • R1 110.01
  • R2 110.2
  • R3 110.75

USD/JPY – Trading Tips

The USD/JPY pair is trading with a bullish bias in the wake of weakening Japanese yen. The pair has crossed over 109.300 resistance level, and it seems to head towards 109.850. On Wednesday, the USD/JPY is likely to find resistance around 110.300 after violating 109.850. While support remains at 109.250. The RSI and MACD have crossed over in the buying zone and are supporting the bullish bias. Let’s look for buying trades above 109.26 today.

All the best for today! 

Categories
Forex Market Analysis

WTI Crude Oil Trade Plan – Prices Rose Amid Possible Outputs Cuts by OPEC+

The WTI crude oil prices rose by 0.4% while registering $51.40, mainly due to the possible output cuts by the OPEC+. The U.S. West Texas Intermediate (WTI) crude (CLc1) futures were up 15 cents, or 0.3%, at $51.10 a barrel, also heading for a fifth consecutive week of losses.

It is worth to mention that the oil prices managed to recover despite registering an increase in the inventory numbers. By the way, oil prices got support after the latest activity figures from the global powerhouses like the U.S., E.U., and the U.K.

Crude oil prices sharply rose earlier in the session after China’s central bank governor said the world’s second-biggest economy could experience disruptions in the first quarter, while Japan announced a significant increase in confirmed coronavirus cases among thousands of passengers.

Traders now will keep their focus on the U.S. employment data and Baker Hughes Rig Counts for taking fresh directions. While January month employment figures from the U.S. are more expected to keep the U.S. dollar on the front foot, a continued drop in rig counts could help energy optimists.


Daily Support and Resistance

  • S1 46.76
  • S2 48.89
  • S3 50.08

Pivot Point 51.02

  • R1 52.22
  • R2 53.15
  • R3 55.29

The technical side of the crude oil remains bearish as the U.S. Oil is still trading bearish at 50.30, maintaining a bearish channel. Crude oil may find resistance at the double top level at 52.09, which is the same level where downward trend line tests the previous high, making it a more stronger level. On the lower side, the support is likely to be found around 49.75 and 49. Consider taking sell trades below 51.02 level today. Good luck! 

Categories
Forex Market Analysis

Daily F.X. Analysis, February 7 – Top Trade Setups In Forex – Brace for U.S. NFP Figures Today! 

On Friday, the investor’s major focus stays on the U.S. NFP data. Previously, the Automatic Data Processing (ADP) jobs report showed an addition of 291,000 private jobs in January, exceeding expectations of +157,000. The Markit U.S. Services Purchasing Managers Index (final reading) expanded to 53.4 in January (53.2 expected). The Institute for Supply Management’s (ISM) Non-Manufacturing Index rose to 55.5 (55.1 expected).

The U.S. trade deficit grew to 48.9 billion dollars in December (48.2 billion dollars deficit expected). Later today, the Labor Department will report initial jobless claims for the week ended February 1 (a drop to 215,000 expected).

Economic Events to Watch Today 


 EUR/USD – Daily Analysis

The EUR/USD lost 0.4% to 1.0999. Official data showed that the eurozone’s retail sales declined 1.6% on month in December (-1.1% expected). Later today, German December factory orders will be reported (+0.7% on month expected). Whereas, the Markit’s German Purchasing Managers’ Index (PMI) for manufacturing dropped to 43.7 in December from November’s 5-month high of 44.1, indicating a deeper contraction. 

Therefore, there are very few chances that Industrial Production data release on the positive track. On the other hand, the European stocks charged higher, with the Stoxx Europe 600 Index gaining 1.2%. Germany’s DAX closed 1.5% higher, France’s CAC rose 0.9%, and the U.K.’s FTSE 100 was up 0.6%.

The U.S. government bond prices sank further, as the benchmark U.S. 10-year Treasury yield climbed to 1.649% from 1.603% Tuesday. The EUR/USD currency pair will also take hints from the German Trade Balance data, which is scheduled to release at 07:00 GMT. During the North American session, the focus will be on the U.S. Nonfarm Payrolls report for January.

Daily Support and Resistance

  • S1 1.0905
  • S2 1.0959
  • S3 1.0979

Pivot Point 1.1014

  • R1 1.1033
  • R2 1.1068
  • R3 1.1122

EUR/USD– Trading Tips

On Friday, the EUR/USD broke below the horizontal support level of 1.0995, which is now working as a support level for the EUR/USD pair. Closing of candles below this 1.099 is confirming a breakout and demonstrates that this level is currently working as a resistance. It may keep the Euro bearish until 1.09374. 

On the 4 hour timeframe, the pair’s MACD is closing histograms under 0, demonstrating chances of further selling in the pair while the bearish channel is also likely to get violated until and unless Nonfarm payroll comes out better than expected. 


GBP/USD– Daily Analysis

The GBP/USD pair its gains in the prior session, retreating 0.3% to 1.2997. The pound to dollar market rate opened lower at the open this week and has been following constant selling bias within the week. 

A minor recovery mid-week after the U.K. services PMI figures were short-lived and a dash under major support yesterday, and it confers the pair is trading at its weakest level since late December. The markets are witnessing the pre-NFP dull trading session

Risk-tone bears the burden of fresh fears that the coronavirus will have a longer-lasting impact on the global economies than earlier expected. With this, the U.S. 10-year treasury yields snap the previous two-day winning streak while Asian stocks also weaken.

Meanwhile, the traders are cautious about placing any position ahead of the pre-NFP trading session. In contrast, the risk-tone is still surrounding the market due to long-lasting coronavirus impact on the global economies. With this, the U.S. ten-year treasury yields close the previous two-day winning streak while Asian stocks also decline.

Looking forward, traders will keep their eyes on the Brexit headlines. However, the January month’s employment data from the U.S. will be key to watch. Whereas, the pre-NFP will remain under the trader’s radar.

Daily Support and Resistance

  • S1 1.2782
  • S2 1.2896
  • S3 1.2949

Pivot Point 1.301

  • R1 1.3063
  • R2 1.3123
  • R3 1.3237

GBP/USD– Trading Tip

A day before, the GBP/USD broke below 1.2950 support is to test the next support level of 1.2925. It’s the most crucial level for the GBP/USD as a violation of this level can lead Sterling prices further down towards 1.2870 and 1.2830 in the coming week.  

At the moment, the GBP/USD has neutral candles below 1.2920 support level, which is suggesting a bearish trend in the GBP/USD. The MACD and RSI are holding in the bearish zone, supporting selling bias for the GBP/USD pair. 


USD/JPY – Daily Analysis

The USD/JPY is flashing red and dropped below the 110 level, mainly due to greenback, which is losing its bullish momentum ahead of the pre-NFP data. The USD/JPY is currently trading at 109.97 and consolidates in the range between the 109.81 – 110.03. The currency pair registered a fresh high at 110.03 during early Asia but failed to maintain and dropped again.

We have seen a strong run in the U.S. equities despite the renewed threat of the coronavirus while the Japanese yen felt the stampede nonetheless. 

At the coronavirus front, China declared the latest update that there were an additional 73 deaths losses and 3,143 new cases of the coronavirus in China as of the end of February 6, the National Health Commission said in its daily update on Friday. This brings the total number of deaths in China to 636 and the total number of confirmed cases to 31,161.

Meanwhile, the U.S. 2-year Treasury yields consolidate in the narrow range between 1.43% and 1.47%, and 10-year yields moved between 1.63% and 1.68%. Moreover, the markets are pricing a 10% chance of a rate cut at the next Fed decision on March 18, and a terminal rate of 1.18% (vs. Fed’s mid-rate at 1.63% currently).

Looking forward, the trader’s focus will be on January nonfarm payroll and hourly earning for taking fresh direction.

Daily Support and Resistance

  • S1 108.57
  • S2 109.11
  • S3 109.47

Pivot Point 109.66

  • R1 110.01
  • R2 110.2
  • R3 110.75

USD/JPY – Trading Tips

The USD/JPY pair is trading with a bullish bias in the wake of weakening Japanese yen. The pair has crossed over 109.300 resistance level, and it seems to head towards 109.850. On Wednesday, the USD/JPY is likely to find resistance around 110.300 after violating 109.850. While support remains at 109.250. The RSI and MACD have crossed over in the buying zone and are supporting the bullish bias. Let’s look for buying trades above 109.26 today.

All the best for today! 

Categories
Forex Market Analysis

Daily F.X. Analysis, February 6 – Top Trade Setups In Forex -Risk-On Sentiment In Play! 

The U.S. trade deficit grew to 48.9 billion dollars in December (48.2 billion dollars deficit expected).

Later today, the Labor Department will report initial jobless claims for the week ended February 1 (a drop to 215,000 expected).

On China’s coronavirus outbreak, the number of confirmed cases has surged across 27,000, and the related death toll has topped 560. Hong Kong’s government announced plans to impose a mandatory 14-day quarantine on all people entering the city from mainland China

Economic Events to Watch Today 


EUR/USD – Daily Analysis

The EUR/USD lost 0.4% to 1.0999. Official data revealed that the eurozone’s retail sales declined 1.6% on month in December (-1.1% expected). Later today, German December factory orders will be reported (+0.7% on month expected).

Its worth to mention that the Factory Orders may have recovered in December, as expected by economists. 

Therefore, the pair is currently flashing red and found near the 1.0995 and could hit the lowest level of October 8 at 1.0941 if the German data disappoints upbeat expectations. On the other side, the EUR currency put a strong bid if the German data release better-than-expected by a significant margin.

Looking forward, traders will keep their eyes on the German Factory Orders. Our focus will also point to the European Central Bank President, Lagarde, who is set to deliver her speech at 1:00 pm on the day. The traders will closely listen to Lagarde’s statement for clues about the fresh direction on the ECB policies.

Daily Support and Resistance

  • S1 1.0905
  • S2 1.0959
  • S3 1.0979

Pivot Point 1.1014

  • R1 1.1033
  • R2 1.1068
  • R3 1.1122

EUR/USD– Trading Tips

On Thursday, the EUR/USD continues to trade with a bearish bias bear 1.1000 psychological level. The bearish channel that we spoke about is still there, and it’s keeping the pair in a selling mode. 

At the moment, the EUR/USD pair is likely to face immediate support around 1.1020 level, and violation of this can lead the EUR/USD prices towards 1.0925. The EUR/USD pair as already retrace back 1.1098, and it has the potential to show further selling bias. On the lower side, a breakout of the support level of 1.0990 can lead EUR/USD prices towards the 1.0945 area. 


GBP/USD– Daily Analysis

The GBP/USD pared its gains in the prior session, retreating 0.3% to 1.2997. The currency pair did not get any support from the better-than-expected U.K. services PMI. Likewise, ISM Non-Manufacturing PMI and ADP Employment Change sent the U.S. dollar higher.

On the flip side, the market risk-sentiment is improving gradually despite the coronavirus cases increased time by time, mainly due to the equities of China, which gained support on better than expected economic events. 

Today, the U.K. economic calendar looking empty due to the lack of activities. Therefore, traders will keep their eyes on the Nonfarm Productivity and Average Labor Costs to determine the next movement in the market. 

Besides, the U.S. Jobless Claims and comments from the Federal Reserve Bank of Dallas President Robert Kaplan will be a pivotal event to watch today. The headlines regarding coronavirus and U.K. politics will keep the driver seats.


Daily Support and Resistance

  • S1 1.2782
  • S2 1.2896
  • S3 1.2949

Pivot Point 1.301

  • R1 1.3063
  • R2 1.3123
  • R3 1.3237

GBP/USD– Trading Tip

The GBP/USD broke below 1.3050 support is to test the next support level of 1.2965. It’s the most crucial level for the GBP/USD as a violation of this level can lead Sterling prices further down towards 1.2900 and 1.2830 in the coming week.  

At the moment, the GBP/USD has formed three black crows candles above 1.2960 support level, which is suggesting a bearish trend in the GBP/USD. The MACD and RSI are holding in the bearish zone, supporting selling bias for the GBP/USD pair. 


USD/JPY – Daily Analysis

The USD/JPY gained 0.2% to 109.79, posting a three-day rally. The USD/JPY flashing green but still trading below the 110 level because traders await the U.S. Nonfarm Payrolls data at the end of the week for more evidence of a hotter economic performance. 

The USD/JPY is trading at 109.96, representing 0.16% gains on the day and consolidates in the range between the 109.72 – 109.97. The pair rose to 109.80 from the 109.30, mainly due to the report that Chinese researchers have produced a medicine that will use in treating the coronavirus.

It is worth to mention that the pair’s buyers continue to struggle to cross the 110 level. On the other hand, the U.S. bond yields rose during the trading day despite the recovery in the U.S. on Wall street. 

Whereas, the U.S. 10-year yields led global bonds, putting on +6bps to test 1.66% (1.58% to 1.64% after the news came that Chinese researchers had developed a drug that was useful in treating the coronavirus).


Daily Support and Resistance

  • S1 108.57
  • S2 109.12
  • S3 109.47

Pivot Point 109.66

  • R1 110.02
  • R2 110.2
  • R3 110.75

USD/JPY – Trading Tips

On Thursday, the USD/JPY pair is trading with a bullish bias in the wake of weakening Japanese yen. The pair has crossed over 109.300 resistance level, and it seems to head towards 109.850. On Wednesday, the USD/JPY is likely to find resistance around 110.300 after violating 109.850. While support remains at 109.250.  

The RSI and MACD have crossed over in the buying zone and are supporting the bullish bias. Let’s look for buying trades above 109.26 today.

All the best for today! 

Categories
Forex Market Analysis

WTI Crude Oil Prices Rose Despite Rising Stockpiles! 

Today in the early Asian session, the WTI crude oil prices rose, although the report of the American Petroleum Institute (API) said U.S. oil inventories increased last week.

The U.S. Crude Oil WTI Futures gained 1.0% to $51.12. The WTI Crude Oil prices started tp recover yesterday after reports said the OPEC+ representatives meeting in Vienna discussed additional cuts of up to 1.0 million barrels per day to cope with lost demand from China’s coronavirus crisis.

Despite the gains this week, WTI crude oil is still down more than 20% since early January because of the coronavirus depressed global demand. It is worth to mention that the issue for the market will likely be increased if the restriction continues for an extended period because due to this demand loss will become increasingly difficult for the market to swallow.

The API said in its weekly report that crude stockpiles rose by 4.2 million barrels for the week ended Jan. 31, compared with a draw of about 4.3 million barrels reported for the week before.

At the coronavirus front, over 490 people have died in China from the coronavirus infection, said officials on Wednesday. Also, the confirmed number of infected citizens grew to 24,324 from 20,438 confirmed cases the day before.

There are still plenty to be concerned for, and the price of oil is valid, sliding further overnight to a low of $49.41bbls. Chinese oil demand has already dropped by 20% because of dwindling air travel, road transportation, and manufacturing.


Daily Support and Resistance

  • S3 45.79
  • S2 48
  • S1 48.77

Pivot Point 50.2

  • R1 50.98
  • R2 52.41
  • R3 54.62

Technically, the WTI crude oil seems to violate the downward channel at 51.50, which may drive the WTI prices higher until 51.70. A bullish breakout of this level can lead oil prices further higher towards 52.25 today. The EMA and MACD are pointing into the bullish zone, suggesting the chances of a bullish trend continuation. Let’s consider taking buying trade above 51.25 today to aim for 52.25. All the best! 

Categories
Forex Market Analysis

Daily F.X. Analysis, February 05 – Top Trade Setups In Forex -Brace for Advance NFP Figures! 

On Wednesday, January Automatic Data Processing (ADP) Employment Change (+158,000 private jobs expected), Markit U.S. Services Purchasing Managers Index (PMI, final reading, 53.2 expected), Institute for Supply Management’s (ISM) Non-Manufacturing Index (55.1 expected), and December trade balance (deficit of 48.2 billion dollars expected) will be reported.

The number of verified coronavirus patients in China has exceeded 20,000, with the related death toll marking 425. Hong Kong reported that a 39-year-old man died of the coronavirus, the first confirmed fatality in the city. And Macau ordered casinos to shut their doors for 15 days.

Meanwhile, it is reported that U.S. biopharmaceutical firm Gilead’s coronavirus drug trials could begin next week.

Economic Events to Watch Today


EUR/USD – Daily Analysis

The EUR/USD slipped 0.1% to 1.1044. Later today, the Eurozone’s December retail sales will be reported (-1.1% on month expected). The EUR/USD strived to rally in initial European trading sessions on Wednesday despite economic figures, which showed growth in the Eurozone economy.

The PMI numbers are out of the Eurozone, and these led to a growth in the marketplace with the industrial sector supporting while the services sector has held firmly extended. The final services PMI number arrived in at 52.5, beating the analyst forecast of 52.2, while the composite index climbed to highs not observed since August.

Furthermore, European retail sales figures will be published next. Later in the North American session, US Non-manufacturing and services PMI data will be published.

Daily Support and Resistance

  • S3 1.091
  • S2 1.099
  • S1 1.1043

Pivot Point 1.107

  • R1 1.1123
  • R2 1.115
  • R3 1.123

EUR/USD– Trading Tips

The EUR/USD is trading with a bearish bias as it is consolidating in a narrow trading range of 1.1100 – 1.1020 area. The bearish channel that we spoke about is still there, and it’s keeping the pair in a selling mode. At the moment, the EUR/USD pair is likely to face immediate support around 1.1020 level, and violation of this can lead the EUR/USD prices towards 1.0925. 

The EUR/USD pair as already retrace back 1.1098, and it has the potential to show further selling bias. On the lower side, a breakout of the support level of 1.0990 can lead EUR/USD prices towards the 1.0945 area. 


GBP/USD– Daily Analysis

The GBP/USD bounced 0.3% to 1.3031. The Markit Construction PMI climbed to 48.4 in January (47.1 expected) from 44.4 in December.

In the U.S., the Automatic Data Processing (ADP) will report January private jobs report (+158,000 jobs expected). The Commerce Department will release the November trade balance (48.2 billion dollars deficit expected). The Institute for Supply Management will post its Non-manufacturing Index for January (55.1 expected).

Looking forward, all traders will keep their eyes on the final figures of the U.K. Services PMI for January. The Key activity gauge is expected to remain unchanged at 52.9. However, any surprise upside may convert the early-day losses into recovery.

The U.S. economic calendar also has some critical data like employment, activity, and trade that are likely to justify the greenback’s strength. In this regard, We forecast the ISM non-manufacturing index to increase slightly to 55.3 in Jan after an already-strong 54.9 print in Dec, because the Phase One deal should give a marginal boost to sentiment. On the other hand, we anticipate a strong surge in ADP employment for Jan at 230k, up from 202k.

Daily Support and Resistance

  • S3 1.2795
  • S2 1.2901
  • S1 1.2966

Pivot Point 1.3006

  • R1 1.3071
  • R2 1.3112
  • R3 1.3218

GBP/USD– Trading Tip

The GBP/USD bounced off to trade at 1.3050 after testing the lower limit of a trading range, which is 1.2980. As you can see in the chart, the GBP/USD pair is still maintaining a narrow trading range of 1.3220 to 1.2980. 

At the moment, the GBP/USD has formed a bullish engulfing candle above 1.2980 support level, which is suggesting a bullish trend in the GBP/USD until 1.3100. On the lower side, a bearish breakout of 1.2980 level can extend selling until 1.2945 today. Let’s look for sell trades only below 1.3100 level and buying above the same today. 


USD/JPY – Daily Analysis

The USD/JPY was flashing green and rose to 108.60 overnight, mainly due to the risk sentiment improved in the global markets as coronavirus priced in. The greenback strength is also sending the pair higher. The USD/JPY is moving around 109.41 and consolidates in the range between the 109.37 – 109.59.

The commodity complex was firmer despite a bullish U.S. dollar, which rose around 0.2% on the day. Looking to Dr. Copper, ongoing liquidity operations from the PBoC is supporting to improve risk sentiment, and prices here were above $5,680 at some stage, +2.3% (Copper prices are a common benchmark for assessing the global market’s risk profile, usually strong when risk-on, weak when risk-off).

The market risk sentiment will likely be disturbed again due to coronavirus intensifying fears. At least 490 people in China died from the coronavirus infection, officials said on Wednesday. Also, the number of confirmed cases of infection rose to 24,324, up from 425 deaths and 20,438 confirmed cases the day before. 

There are still plenty to be concerned for, and the price of oil is compelling, sliding further overnight to a low of $49.41bbls. Chinese oil demand is already dropped by 20% because of dwindling air travel, road transportation, and manufacturing.

Daily Support and Resistance

  • S3 107.62
  • S2 108.44
  • S1 108.98

Pivot Point 109.26

  • R1 109.81
  • R2 110.09
  • R3 110.91

USD/JPY – Trading Tips

Since the safe-haven appeal is diminishing, the USD/JPY pair is trading with a bullish bias in the wake of weakening Japanese yen. The pair has crossed over 109.300 resistance level, and it seems to head towards 109.850. On Wednesday, the USD/JPY is likely to find resistance around 110.300 after violating 109.850. While support remains at 109.250.  

The RSI and MACD have crossed over in the buying zone and are supporting the bullish bias. Let’s look for buying trades above 109.26 today.

All the best for today! 

Categories
Forex Market Analysis

Daily F.X. Analysis, February 04 – Top Trade Setups In Forex -U.S. Factory Orders! 

Hong Kong, the government has closed more border checkpoints connected to China, while the city’s medical workers continued a strike demanding the closing of all such checkpoints.

Regarding U.S. economic data, the Markit U.S. Manufacturing Purchasing Managers Index (final reading) rose to 51.9 in January, above 51.7 expected. The Institute for Supply Management’s Manufacturing PMI increased to 50.9 in January, beating 48.5 expected. Monthly construction spending fell 0.2% on month in December, missing expectations of +0.5%.

Later today, the U.S. Commerce Department will report December factory orders (+1.2% on month expected), and durable goods orders (final reading, +2.4% expected).

Economic Events to Watch Today


EUR/USD – Daily Analysis

The EUR/USD climbed higher late last week but has grappled with continuing the skyward trend in the early week. The revival in the EUR/USD that took place lately may have been the effect of trades squaring before the month-end.

The single currency euro is sensitive to changes in risk sentiment as it is usually employed as a funding currency. Nevertheless, it is less sensitive when we compare it with the Japanese yen and Swiss franc, which are generally known as safe-haven currencies.

Considering the idea of risk appetite, both the RBA (Reserve bank of Australia) and the BOJ (Bank of Japan) kept the rates steady today. Some traders may have assumed a little more of a dovish stance from policymakers after the increase in the Coronavirus break during the previous week.

Regarding U.S. economic data, the Markit U.S. Manufacturing Purchasing Managers Index (final reading) rose to 51.9 in January, above 51.7 expected. The Institute for Supply Management’s Manufacturing PMI increased to 50.9 in January, beating 48.5 expected. Monthly construction spending fell 0.2% on month in December, missing expectations of +0.5%.

Daily Support and Resistance

  • S3 1.091
  • S2 1.099
  • S1 1.1043

Pivot Point 1.107

  • R1 1.1123
  • R2 1.115
  • R3 1.123

EUR/USD– Trading Tips

The EUR/USD is trading in a narrow trading range of 1.1100 – 1.1040 area, as it continues to maintain the downward channel. Right now, the pair is likely to face immediate support around 1.1040 level, and violation of this can lead the EUR/USD prices towards 1.0925. 

The EUR/USD pair as already retrace back 1.1098, and it has the potential to show further selling bias. On the lower side, a breakout of the support level of 1.0990 can lead EUR/USD prices towards the 1.0945 area. 


GBP/USD– Daily Analysis

The GBP/USD plunged from 1.5% to 1.2997. U.K. Prime Minister Boris Johnson rejected Europe Union chief negotiator Michel Barnier’s demand to respecting the bloc’s regulations under a trade deal. On the other hand, the Markit Construction PMI for January will be released later today (47.1 expected).

The latest risk recovery came possibly due to the Chinese officials’ that struggle to satisfy the traders and halt short-selling in the stock market. While Asian equities and the U.S. 10-year treasury yield recovers from Monday’s fall. Nevertheless, the increasing losses of coronavirus contagion keep the risk on the cards.

The total death losses have increased to 425, and the number of confirmed cases has risen to more than 20,000 due to coronavirus.

Looking forward, the final figures of the U.K. Construction PMI, which is expected to be 46.6 against 44.4, will be the key economic figure to watch on Tuesday. While markets are expecting no significant surprises in data, risk catalysts may lead to near-term GBP/USD pair movements.

Daily Support and Resistance

  • S3 1.2679
  • S2 1.2864
  • S1 1.293

Pivot Point 1.3049

  • R1 1.3114
  • R2 1.3234
  • R3 1.3418

GBP/USD– Trading Tip

The GBP/USD is consolidating in a narrow trading range of 1.3220 to 1.2980. Earlier today, the GBP/USD pair tried to break below 1.2985 support level, but it failed to continue its bearish momentum. 

Right now, 1.3220 is supporting the pair, and it’s very much likely to drive the bullish trend in the GBP/USD until the breakout occurs. Whereas, the bearish breakout of this level can extend selling until 1.2945 today. 

Let’s look for sell trades only below 1.2980 level and buying above the same today. 


USD/JPY – Daily Analysis

The USD/JPY currency pair found on the bullish track and rose to 108.78, mainly due to an uptick in the Asian stocks, but the pair is still trading below the 100-day Moving Average. The USD/JPY currency pair is currently consolidating at 108.75 and consolidates in the range between the 108.55 – 108.78. Notably, the pair has hit a low level of 108.55 an hour ago.

The reason behind the bullish sentiment in the pair could be the uptick in the S&P 500 futures and the Asian equity markets. China’s Shanghai Composite Index is scoring 0.65% at press time. 

On the front of the latest reports, the total death losses have increased to 425, and the number of confirmed cases has risen to more than 20,000 due to coronavirus.

It is worth to mention that Moody’s Investors Service responded on the increasing risks to chinas credit rating in the wake of the coronavirus outbreak. Whereas, the global rating giant announced expected drops in the consumption and its credit implications as the main catalysts.

Daily Support and Resistance

  • S3 107.87
  • S2 108.25
  • S1 108.47

Pivot Point 108.64

  • R1 108.85
  • R2 109.02
  • R3 109.4

USD/JPY – Trading Tips

On Tuesday, the USD/JPY pair is trading with slightly bullish bias after testing the support level around 108.500. The USD/JPY is maintaining the upward channel, which is keeping the safe-haven currency bullish. 

On Tuesday, the USD/JPY is likely to find resistance around 109.250, which is the same level that provided support to the USD/JPY earlier. We can see selling below this level until 108.520. 

Furthermore, the RSI and MACD have crossed over in the buying zone and are supporting the bullish bias. Let’s look for buying trades above 108.950 today.

All the best for today! 

Categories
Forex Market Analysis

WTI Crude Oil Prices Continue To drop Due To Coronavirus Fears! 

The WTI crude oil prices continue its losing streak mainly due to the worries of the lower demand in China in the wake of coronavirus outbreak fears. As we know, China is the biggest importer in the world.

WTI U.S. West Texas Intermediate (WTI) crude fell for a 4th-week in a row last week after airlines canceled flights to China. Supply chains across the world’s 2nd-largest economy have also been disturbed.

U.S. West Texas Intermediate (WTI) crude fell 24 cents to $51.32 a barrel, after earlier hitting a session low of $50.42. The front-month WTI price fell 15.6% in January, the most significant monthly drop since May.

At the China front, the Fears of coronavirus outbreak have increased stronger during the weekend because the number of affected peoples crossed 14,300, whereas the death losses rose above 300. Apart from the coronavirus, there is another virus that occurred in Hunan that name is H5N1 bird flu virus.

Whereas, the People’s Bank of China (PBoC) has announced to provide 1.2 trillion yuan liquidity to support money markets and ease the sell-off, whereas securities’ regulator said to stop short-selling stocks. Moreover, the authorities have also informed banks to continue to provide loans to those companies affected by the outbreak.

On the other hand, the Organization of the Petroleum Exporting Countries (OPEC) and its allies will likely do the meeting in February instead of in March, to discuss the impact on oil demand from the virus flare-up. Already, OPEC and non-OPEC’s Joint Technical Committee (JTC) have scheduled to meet in early February to assess the impact of the virus.


Daily Support and Resistance

  • S3 47.46
  • S2 49.74
  • S1 50.71

Pivot Point 52.01

  • R1 52.99
  • R2 54.29
  • R3 56.57

The WTI crude oil prices are holding above the double bottom level of 51.04, which is very much likely to get violated considering the ongoing fundamentals in the market. If this happens, the next target for WTI will be 49.05. Let’s wait for a breakout to enter a sell trade today. Good luck! 

Categories
Forex Market Analysis

Daily F.X. Analysis, February 03 – Top Trade Setups In Forex – ISM Manufacturing PMI In Focus! 

Regarding U.S. economic data, personal income grew 0.2% on month in December, below expectations of +0.3%, personal spending declined 0.3% in December (as expected).

The Market News International Chicago Business Barometer dropped to 42.9 in January, lower than 49.0 forecasts, and marking the lowest number since December 2015. The University of Michigan’s Consumer Sentiment Index (final reading) rose to 99.8 in January, exceeding 99.1 expected.

Economic Events to Watch Today


EUR/USD – Daily Analysis

The EUR/USD advanced 0.6% to 1.1094. The official data revealed that the eurozone’s 4th-quarter GDP grew 1.0% on year (+1.1% estimated), while core CPI rose 1.1% in January (+1.2% expected). Research firm Markit will post final readings of January Manufacturing PMI for the eurozone (47.8 expected), Germany (45.2 expected), France (51.0 expected), the U.K. (49.8 expected), and the U.S. (51.7 expected).

Looking forward, the breakout will likely be severe if the US ISM Manufacturing PMI (Jan) releases better-than-expected by a significant margin. By the way, the data is scheduled to release at 14:45 GMT. The currency pair may also take directions from the final German and Eurozone PMI numbers for January and speech by ECB’s De Guindos and German Bundesbank’s Weidmann. 

Besides, the U.S. Commerce Department will report construction spending in December (+0.5% on month expected). The ISM (Institute for Supply Management) will release its manufacturing index for January (48.4 expected). The WARD’s Automotive Group will report vehicle sales in the U.S. (16.8 million units expected).

Daily Support and Resistance

  • S3 1.091
  • S2 1.099
  • S1 1.1043

Pivot Point 1.107

  • R1 1.1123
  • R2 1.115
  • R3 1.123

EUR/USD– Trading Tips

On Monday, the EUR/USD hasn’t changed much than before as it continues to trade at 1.1020 area, testing the downward channel around 1.0990. It also marks a triple bottom level of around 1.0990. 

The EUR/USD pair may retrace back a bit until 1.1045 and 1.1065 before showing further selling bias. The EUR/USD can show bullish correction until 1.1060 and 1.1075 if it manages to stay above 1.0990. On the lower side, a breakout of the support level of 1.0990 can lead EUR/USD prices towards the 1.0945 area. 


GBP/USD– Daily Analysis

The GBP/USD jumped 0.8% to 1.3201, the highest level since January 01. Sterling accelerated distinctly higher late last week following the Bank of England unchanged interest rates decisions. Nevertheless, the pair is seen under pressure in the early day to wipe out Friday’s gain.

The final figures of January month British Manufacturing PMI, as well as the U.S. market Manufacturing PMI and ISM Manufacturing PMI, will be key to watch. 

As per the British PMI, the activity gauge is expected to confirm the initial 49.8 marks but will likely boost the GBP currency pair if it manages to cross 50.00. Besides this, U.S. numbers may provide better results and could strengthen the greenback.

Manufacturing figures out of both Europe and the U.K. gave indications of stabilizing and potential for additional recovery. Markit described the purchasing managers’ index in the U.K. for the manufacturing area to rise to 50, taking it out of a recession. 

Daily Support and Resistance

  • S3 1.2937
  • S2 1.3054
  • S1 1.313

Pivot Point 1.3171

  • R1 1.3247
  • R2 1.3288
  • R3 1.3405

GBP/USD– Trading Tip

The GBP/USD is peaking out of the symmetric triangle pattern, which was keeping the pair supported above 1.2961 along with resistance at 1.3050. For now, the pair may find resistance around the double top pattern around the 1.3155 area. The pair is very likely to trade with in the same range due to a lack of related economic events. However, a bullish breakout of 1.3150 level can cause a bullish trend in the GBP/USD prices until 1.3256. 

On the lower side, the support prevails at 1.2961 and 1.2900. Taking a look at the MACD and RSI, both are holding in the selling zone, and are supporting the concept of selling. Keeping this in mind, we can go for selling trade below 1.306 today. 


USD/JPY – Daily Analysis

The USD/JPY currency pair continues to flash red and hit the lowest level of 108.30 since early January, mainly due to the risk-off market sentiment in the wake of intensified fears of coronavirus outbreak. As d writing, the USD/JPY currency pair is currently trading at 108.50 and consolidates in the range between the 108.31 – 108.58.

On the news front, the Fears of coronavirus outbreak have increased stronger during the weekend because the numbers of affected peoples crossed 14,300, whereas the death losses rose above 300. Apart from the coronavirus, there is another virus that occurred in Hunan that name is H5N1 bird flu virus.

It should be noted that China’s market opened again for trading for the first time since January 23, which was closed due to the extended Lunar New Year holidays, but now its time to end the holidays. As we all well aware that during the holidays there have many changes came in the wake of coronavirus. Moreover, the coronavirus has pressurized the investors. 

However, the disease caused more than 300 lives in China and has affected 14,380, according to a report from China’s state broadcaster CCTV on Sunday. Whereas, the virus crossed SARS that threatened markets in 2002/03, while another reason behind the intensifying tension is an outbreak of the deadly H5N1 bird flu in a field in the Shuangqing area of Shaoyang City.

The Chinese government has wasted the New Year celebrations to save the peoples from the virus. However, Vice Governor of Hubei Province, where the infection started, conveyed his worries and poured cold water on the government’s efforts.

Daily Support and Resistance

  • S3 107
  • S2 107.8
  • S1 108.07

Pivot Point 108.59

  • R1 108.87
  • R2 109.38
  • R3 110.18

USD/JPY – Trading Tips

The USD/JPY pair continues to maintain the sideways trading range of 109.250 – 108.850. The pair is still holding within the upward channel, which is keeping the trading sentiment bullish. The USD/JPY may find resistance around 109.250, which is the same level that provided support to the USD/JPY earlier. We can see selling below this level until 108.520. Moreover, the RSI and MACD have crossed over in the selling zone and are supporting the selling bias. Let’s look for selling trades below 109.150 today.

All the best for today! 

Categories
Forex Market Analysis

Daily F.X. Analysis, January 31 – Top Trade Setups In Forex – Eyes on Canadian GDP!

The U.S. stocks erased early losses to close higher. The Dow Jones Industrial Average ended 124 points higher (+0.4%) at 28859, the S&P 500 added 10 points (+0.3%) to 3283 and the Nasdaq Composite was up 23 points (+0.3%) to 9298.

The benchmark U.S. 10-year Treasury yield remained subdued as it drifted lower to 1.545% from 1.593% Wednesday. Let’s take a look at trade ideas for today.


Economic Events to Watch Today


EUR/USD – Daily Analysis

The EUR/USD gained 0.2% to 1.1028. Official data showed that the German jobless rate was steady at 5.0% in January (as 5.0% expected). On the other hand, the eurozone’s fourth-quarter GDP growth will be released (+1.2% on-year estimated).

On the flip side, if the Retail Sales Data release disappoints expectations, then bears could try to cross the convincing break below 1.10. The U.S. Commerce Department reported that fourth-quarter GDP grew at an annualized rate of 2.1% on quarter, in line with expectations. Initial jobless claims declined to 216,000 in the week ended January 25, slightly higher than expected.

Looking forward, the trader’s eyes will be on the Eurozone Gross Domestic Product (GDP) for the 4th-quarter and the U.S. Personal Spending and Personal Income numbers as well. Whereas, the German Retail Sales is key to watch.


Daily Support and Resistance

  • S3 1.0961
  • S2 1.0993
  • S1 1.1013
  • Pivot Point 1.1026
  • R1 1.1045
  • R2 1.1059
  • R3 1.1091

EUR/USD– Trading Tips

On Friday, the EUR/USD hasn’t changed much than before as it continues to trade at 1.1020 area, testing the downward channel around 1.0990. It also marks a triple bottom level of around 1.0990. 

The EUR/USD pair may retrace back a bit until 1.1045 and 1.1065 before showing further selling bias. The EUR/USD can show bullish correction until 1.1060 and 1.1075 if it manages to stay above 1.0990. On the lower side, a breakout of the support level of 1.0990 can lead EUR/USD prices towards the 1.0945 area. 


GBP/USD– Daily Analysis

The GBP/USD rebounded 0.5% to 1.3086, snapping a five-day decline. The Bank of England held its benchmark rate at 0.75% unchanged as expected, while the number of officials who supported a rate-cut remained at two. 

It should be noted that the United Kingdom Prime Minster wants a deal with the European Union like Canada-style, but nothing has confirmed yet. The risk has seen again in the market in the wake of mixed headlines regarding China’s coronavirus. The World Health Organization finally had released a notification for a global emergency but later gave some hope that coronavirus will likely be controlled soon.

Looking forward, there will be many celebrations and sad farewell gatherings during the day ahead; the Tory leader’s speech, which is scheduled to happen during the day, will gain significant attention because all traders considerably wait for this. If the U.K. Prime Minister Boris Johnson says anything about future trade relations with the European Union, a surprise hint will be taken seriously. 

On the other hand, the U.S. economic calendar has many data, including Chicago PMI and Michigan Consumer Sentiment, which will entertain the traders during the day.

Daily Support and Resistance

  • S3 1.2795
  • S2 1.2928
  • S1 1.3011

Pivot Point 1.306

  • R1 1.3143
  • R2 1.3193
  • R3 1.3326

GBP/USD– Trading Tip

The GBP/USD is peaking out of the symmetric triangle pattern, which was keeping the pair supported above 1.2961 along with resistance at 1.3050. For now, the pair may find resistance around the double top pattern around the 1.3155 area. The pair is very likely to trade with in the same range due to a lack of related economic events. However, a bullish breakout of 1.3150 level can cause a bullish trend in the GBP/USD prices until 1.3256. 

On the lower side, the support prevails at 1.2961 and 1.2900. Taking a look at the MACD and RSI, both are holding in the selling zone, and are supporting the concept of selling. Keeping this in mind, we can go for selling trade below 1.306 today. 


USD/JPY – Daily Analysis

The USD/JPY currency pair flashing green and crossed the 109.00 level mainly due to the slight risk recovery in the wake of upbeat Chinese services sector data. As of writing, the USD/JPY currency pair is currently trading at 109.11 and consolidates in the range between the 108.88 – 109.14 day’s range.

However, the data was an improvement and a pleasant surprise. Whereas, the Chinese State Bureau said this was taken before some of the recent heightened coronaviruses headlines. The PMI survey was taken before January 20; it means that the result of the coronavirus is not fully shown.

Meanwhile, U.S. stocks closed in the green territory but were still down for the week so far. Positive earnings were a factor. However, USD/JPY will likely continue to flash green in the wake of risk-on sentiment, and U.S. yields continue to print lower lows. U.S. 2-year Treasury yields dropped from 1.41% to 1.37% but then back to 1.40% whereas UST ten-year yields dropped from 1.58% to 1.53% (a fresh four-month low), but then bounced to 1.57%.

Markets are expecting a slight chance of a rate cut at the next Fed decision on March 18, but a terminal rate of 1.10% (vs. Fed’s mid-rate at 1.63% currently). This comes after a slightly dovish tilt from, Jerome Powell, FED’s governor, who is stating his concerns over the persistently low inflation below the target of 2%. 

Daily Support and Resistance

  • S3 107.99
  • S2 108.42
  • S1 108.69

Pivot Point 108.85

  • R1 109.12
  • R2 109.28
  • R3 109.71

USD/JPY – Trading Tips

On Friday, the USD/JPY pair continues to maintain the sideways trading range of 109.250 – 108.850. The pair is still holding within the upward channel, which is keeping the trading sentiment bullish. The USD/JPY may find resistance around 109.250, which is the same level that provided support to the USD/JPY earlier. We can see selling below this level until 108.520. Moreover, the RSI and MACD have crossed over in the selling zone and are supporting the selling bias. Let’s look for selling trades below 109.150 today.

All the best for today! 

Categories
Forex Market Analysis

Daily F.X. Analysis, January 30 – Top Trade Setups In Forex – Brace for BOE Policy!

The U.S. stock indexes pared most of the early gains to close little changed. The Dow Jones Industrial Average soared higher 11 points to 28734, the S&P 500 declined 2 points to 3273, and the Nasdaq Composite added 5 points to 9275. 

The Bank of England will declare its interest rates decision (hold at 0.75% expected). The European Central Bank will post the January Economic Confidence Index (101.8 expected) and final readings of the Consumer Confidence Index (-8.1 previously).

Economic Events to Watch Today


EUR/USD – Daily Analysis

The EUR/USD was broadly flat at 1.1015. The GfK Consumer Confidence Index for February rose to 9.9 (9.6 expected) from 9.7 in January.

The data is listed to deliver at 08:55 GMT is expected to show the German economy added 5K jobs in December after November’s 8K raises. Meantime, the Unemployment Rate is anticipated to have remained stable at 5%. 

During the North American session ahead, the attention will shift to the US Gross Domestic Product Price Index (Q4) PREL, scheduled for release at 13:30 GMT. 

The Federal Reserve kept interest rates stable as anticipated on Wednesday. Chair Powell brought up concerns regarding inflation, which suggests another rate cut can’t be fully controlled out at this time. 

Powell further informed about the potential for an improvement in the global market following the current development in the US-China trade war but revealed anxieties over the Coronavirus outbreak. Powell noted that if China’s economy deteriorates as a result of the virus, the U.S. economy will also be affected, although not at the same level as some of China’s bordering countries.

Daily Support and Resistance

  • S3 1.0963
  • S2 1.0989
  • S1 1.1006

Pivot Point 1.1015

  • R1 1.1031
  • R2 1.104
  • R3 1.1066

EUR/USD– Trading Tips

The EUR/USD is trading at 1.1001 area, having formed a bearish engulfing candle around 1.0991 support level, particularly on the 4-hour timeframe. The bearish engulfing pattern is suggesting the probabilities of a bearish trend in the EUR/USD.

The EUR/USD can show bullish correction until 1.1060 and 1.1075 if it manages to stay above 1.0990. On the lower side, a breakout of the support level of 1.0990 can lead EUR/USD prices towards the 1.0945 area. 


GBP/USD– Daily Analysis

The GBP/USD slipped 0.1% to 1.3022, posting a five-day losing streak. The BOE is anticipated to keep its rate at 0.75% unchanged, while investors will watch closely whether there would be more officials to vote for an interest-rate cut (2 out of 9 members supported a rate cut previously).

Looking forward, there are 50-50 chances of announcing a rate cut by the Bank of England. Whereas the central bank is expected to keep the rate unchanged, meanwhile one MPC is anticipated to vote in support of a rate cut. However, Governor Carney’s speech will be closely watched afterward. 

After that, the preliminary reading of U.S. Q4 GDP will be in the trader’s eyes. The growth rate of the world’s largest economy is likely to stabilize around 2.1%. However, the latest Fed meeting indicated downside risk and hinted to stay ready for surprises. The Bank of England will publish its interest rates decision (hold at 0.75% expected).


Daily Support and Resistance

  • S3 1.2853
  • S2 1.2937
  • S1 1.2982

Pivot Point 1.3021

  • R1 1.3066
  • R2 1.3105
  • R3 1.3189

GBP/USD– Trading Tip

The GBP/USD is stuck in a symmetric triangle pattern, which is keeping the pair supported above 1.2961 along with resistance at 1.3050. Since all eyes remain in the Fed rate decision, it will be nice to wait for the outcome to have a better idea about the trend. 

The bearish breakout of 1.2961 support can lead the GBP/USD prices towards 1.2900. Taking a look at the MACD and RSI, both are holding in the selling zone, and are supporting the concept of selling. Keeping this in mind, we can go for selling trade below 1.3021 today. 


USD/JPY – Daily Analysis

The USD/JPY currency pair flashing red and hit the 5-day low, representing 0.12 drops on the day mainly due to risk-off sentiment in the wake of persistent Coronavirus-led. As well as, the Japanese yen got support from the risk-off market sentiment as a safe-haven currency. As of writing, the USD/JPY currency pair is currently trading at 108.93 and consolidates in the range between the 108.84 – 109.06.

As in result, the Asian stocks are again flashing red with Japan’s Nikkei leading the way with a 400 point or 2% decline. Stocks in Australia, South Korea, and Hong Kong are also reporting losses alongside the 0.5% drop in the futures on the S&P 500. 

At the dealy virus front, the market attention shifted again to China’s coronavirus because the death losses rose to 170, and forecasts spread that China will refresh 20-year low due to the disease. Japan’s Chief Cabinet Secretary was said a few minutes before press time, that 6 Japanese people, who recently come back from Wuhan China, have infected by the coronavirus. 

Apart from this, another reason behind the market’s risk-off sentiment could the US-China trade tension because the White House has recently refused to help China regarding tariffs even if coronavirus weighs on its GDP.

Because the risk-off sentiment showing no signs of decreasing, the pair risks increasing the losses toward the 50-day average support at 108.72 more so, as traders have hoped for the Fed rate cut by November’s meeting. The U.S. FED kept rates constant on Wednesday but gave expectation for delivering further rate cut in the wake of higher inflation.

Daily Support and Resistance

  • S3 108.14
  • S2 108.59
  • S1 108.87

Pivot Point 109.03

  • R1 109.31
  • R2 109.48
  • R3 109.93

USD/JPY – Trading Tips

A couple of days ago, the safe-haven pair USD/JPY violated long-held horizontal support level has already been violated at 109.250 level, and now, the USD/JPY is holding below this level. At the same level, the USD/JPY is also getting supported by the bullish channel, which can be seen in the chart above. 

The USD/JPY may find resistance around 109.250, which is the same level that provided support to the USD/JPY earlier. We can see selling below this level until 108.520. Moreover, the RSI and MACD have crossed over in the selling zone and are supporting the selling bias. 

All the best for today! 

Categories
Forex Market Analysis

Crude Oil Completes 23.6% Retracement – Who’s Up for Selling?

The WTI crude oil is trading with a bearish bias at 53.85 level, which marks the 23.6% Fibonacci retracement level. Most of the bullish recovering in oil prices came in response to the inventory report released by the API. 

The inventories of U.S. crude sank dramatically during the previous week. The API posted a dip of 4.3 million for the week concluded Jan. 24 versus the build of 1.6 million announced last week.

The WTI crude oil prices grew 1.6% in response to the report in post-settlement trading. For now, the eyes will remain on the Energy Information Administration report, which is due at 10:30 AM ET Wednesday. The economists are expecting a build in crude stocks of 482,000.


Daily Support and Resistance

S3 50.85
S2 52.21
S1 53.1
Pivot Point 53.58
R1 54.47
R2 54.95
R3 56.32

The WTI finally dispensed some bullish momentum. However, it still lingers beneath 55.30. The leading technical indicators such as the RSI and Stochastics are in the oversold area, though it’s attempting to come out of the oversold territory. 

Currently, U.S. Oil may find support nearby 51.30. So we can watch for bearish trades beneath 55.30 and bullish over 53.50.

Good luck!

Categories
Forex Market Analysis

Daily F.X. Analysis, January 29 – Top Trade Setups In Forex – Eyes on Federal Reserve Rate Decision! 

The forex traders are keeping their eyes on the Fed Fund Rate and Monetary Policy decisions, which are likely to drive some major price action in the market.  

The U.S. Commerce Department reported that durable goods orders (preliminary reading) increased 2.4% on month in December, much better than +0.4% expected. The C.B. Consumer Confidence Index surged to 131.6 in January (128.0 expected) from 128.2 in December.

Economic Events to Watch Today


EUR/USD – Daily Analysis

The EUR/USD was flat at 1.1018. Later today, the GfK Consumer Confidence Index for February will be released (9.6 expected). Although, the currency pair could hit the below level of 1.10 in the European session if the forward-looking German Gfk Consumer Confidence Survey (Feb) release below the estimate of 9.6. 

By the way, the data is scheduled for release at 07:00 GMT. As well as, the German Import Price Index will also hit the wires at 7:00 GMT. In Germany, the GfK Consumer Confidence Index for February will be released (9.6 expected). France’s INSEE will release January Consumer Confidence Index (102 expected).

As we all well aware that the EUR currency was poorly beaten last week, possibly due to the European Centra Bank’s President Christine Lagarde spoke unexpectedly dovish.

Daily Support and Resistance

  • S3 1.0963
  • S2 1.0989
  • S1 1.1006

Pivot Point 1.1015

  • R1 1.1031
  • R2 1.104
  • R3 1.1066

EUR/USD– Trading Tips

The EUR/USD is trading at 1.1001 area, having formed a bearish engulfing candle around 1.0991 support level, particularly on the 4-hour timeframe. The bearish engulfing pattern is suggesting the probabilities of a bearish trend in the EUR/USD. The Fed rate decision will be helping us determine further trends in the EUR/USD. 

The EUR/USD can show bullish correction until 1.1060 and 1.1075 if it manages to stay above 1.0990. On the lower side, a breakout of the support level of 1.0990 can lead EUR/USD prices towards the 1.0945 area. 


GBP/USD– Daily Analysis

The GBP/USD lost 0.2% to 1.3035, sliding for a fourth straight session.

At the Brexit side, the United Kingdom Prime Minister Boris Johnson’s immigration efforts are continuing to getting mixed responses with the ‘Australian-style’ immigration vision getting hit by the independent Migration Advisory Committee (MAC).

The U.S. Commerce Department will report December goods trade balance (65 billion dollars deficit expected) and wholesale inventories (+0.1% on month expected). The National Association of Realtors will issue pending home sales in December (+0.5% on month expected).

Looking forward, chances of the Bank of England’s (BOE) next move are standing on the confusing track due to recently mixed data and Brexit concerns, as well as Governor Carney’s dovish tone. 

Daily Support and Resistance

  • R3: 1.3189
  • R2: 1.3105
  • R1: 1.3066

Pivot Point 1.3021

  • S1: 1.2982
  • S2: 1.2937
  • S3: 1.2853

GBP/USD– Trading Tip

The GBP/USD is stuck in a symmetric triangle pattern, which is keeping the pair supported above 1.2961 along with resistance at 1.3050. Since all eyes remain in the Fed rate decision, it will be nice to wait for the outcome to have a better idea about the trend. 

The bearish breakout of 1.2961 support can lead the GBP/USD prices towards 1.2900. Taking a look at the MACD and RSI, both are holding in the selling zone, and are supporting the concept of selling. Keeping this in mind, we can go for selling trade below 1.3021 today. 


USD/JPY – Daily Analysis

The USD/JPY found on the bullish track mainly due to the mixed headlines from China. By the way, the par having hit the high of 109.30 and currently dropped to 109.12. As of writing, the USD/JPY currency pair is currently trading at 109.13 and consolidates in the range between the 109.00 – 109.30. Although traders are also preparing for today’s Federal Open Market Committee.

At the BOJ front, the Bank of Japan said that it should maintain low rate policy bias because it must be careful to risk Japan’s economy may lose momentum for hitting inflation. The statement also said to coordinate with govt’s fiscal policy, structural measures.

Whereas China’s promised to kill the coronavirus soon triggered the recent risk recovery, increasing the rate of death cases and newly infected cases keep risk-off sentiment in the market. 

As in result, the U.S. ten-year treasury yields remain mostly directionless around 1.65%, after bouncing off the early October lows on Tuesday, whereas S&P 500 Futures lose 0.1% to 3,275 by the press time.

Daily Support and Resistance    

  • S3 108.14
  • S2 108.59
  • S1 108.87

Pivot Point 109.04

  • R1 109.31
  • R2 109.48
  • R3 109.93

USD/JPY – Trading Tips

A couple of days ago, the safe-haven pair USD/JPY violated long-held horizontal support level has already been violated at 109.250 level, and now, the USD/JPY is holding below this level. At the same level, the USD/JPY is also getting supported by the bullish channel, which can be seen in the chart above. 

The USD/JPY may find resistance around 109.250, which is the same level that provided support to the USD/JPY earlier. We can see selling below this level until 108.520. Moreover, the RSI and MACD have crossed over in the selling zone and are supporting the selling bias. 

All the best for today! 

Categories
Forex Market Analysis

Daily F.X. Analysis, January 28 – Top Trade Setups In Forex – Brace for U.S. C.B. Consumer Confidence! 

A day before, the U.S. stock indexes slid over 1% as the coronavirus outbreak in China intensified. The Dow Jones Industrial Average slipped 453 points (-1.6%) to 28535, the S&P 500 dropped 51 points (-1.6%) to 3243, and the Nasdaq Composite tumbled 175 points (-1.9%) to 9139.

Shares in Semiconductors & Semiconductor Equipment (-3.91%), Technology Hardware & Equipment (-2.83%) and Energy (-2.76%) sectors lost the most.

Economic Events to Watch Today


EUR/USD – Daily Analysis

EUR/USD slipped 0.1% to 1.1018. The German IFO Business Climate Index unexpectedly fell to 95.9 in January (97.0 estimated) from 96.3 in December, and the Expectations Index dropped to 92.9 (94.8 expected) from 93.9. The EUR currency was beaten badly last week, possibly due to the European Centra Bank’s President Christine Lagarde spoke unexpectedly dovish.

Looking forward, the shared currency will likely continue its bearish bias during the week ahead because the safe-haven U.S. treasuries are putting the bids in the wake of Coronavirus fears. The buying sentiment around the greenback may increase further if the United States Durable Goods release better-than-expected, by the way, this data is scheduled to release at 13:30 GMT on Tuesday.

Daily Support and Resistance

  • S3 1.095
  • S2 1.0993
  • S1 1.1009

Pivot Point 1.1035

  • R1 1.1051
  • R2 1.1078
  • R3 1.112

EUR/USD– Trading Tips

The EUR/USD is trading at 1.1026 area, having formed a Doji candle above 1.1015 support level, particularly on the 4-hour timeframe. The bullish Doji pattern is suggesting the probabilities of a bullish and bearish trend both in the EUR/USD. The German Ifo Business Climate reported worse than expected figures falling below economists’ expectations of 96.3. 

The EUR/USD can show bullish correction until 1.1060 and 1.1075. On the lower side, a breakout of the support level of 1.1015 can lead EUR/USD prices towards the 1.0945 area. 

GBP/USD– Daily Analysis

The GBP/USD fell 0.2% to 1.3058, posting a three-day decline. The GBP/USD pair touched a daily high of 1.3105 but withdrew from that level later to conclude the day in a bearish mode, just a few pips above its intraday low of 1.3039. 

The GBP/USD has placed a little drop for another day, as the GBP/USD sees itself jus over the crucial 1.30 mark, which has psychological importance. Presently, the GBP/USD is holding at 1.3027, soaring 0.23% on the day. There are no significant GBP related economic events on the calendar.

 The Bank of England is holding it’s monetary policy conference this Thursday, and there are 50-50 possibilities of a rate decrease. Several MPC members have indicated that they would propose a rate cut, and there’s solid speculation that Governor Carney may want to drop the rate before giving his seat. Also, Brexit will finally happen this Friday, after over three years of back and forth.

At the Brexit front, another reason behind the risk-off market sentiment could be the uncertainty surrounding the Brexit trade talks between the United Kingdom and the Europan Union. Moreover, the Irish Taoiseach Leo Varadkar said that the European Union would have the leading authority in Brexit talks that may miss the deadline. In contrast, the U.K. politicians also not interested in respecting their old neighbors after got public support in the latest general election.

Daily Support and Resistance

  • S3 1.2937
  • S2 1.3002
  • S1 1.303

Pivot Point 1.3067

  • R1 1.3095
  • R2 1.3133
  • R3 1.3198

GBP/USD– Trading Tip

The GBP/USD has violated the symmetric triangle pattern, which is now keeping the pair support around the 1.3065 area. Closing of Doji candle above this level is likely to keep the GBP/USD bullish until 1.3170. Above 1.3170, the GBP/USD may go after the next resistance level of 1.3160. Whereas, a bearish breakout of 1.3065 can lead the GBP/USD prices towards 1.2975. The RSI and MACD support a mixed bias. Let’s look for selling trades below 1.3102 and bullish trades above 1.3044. 


USD/JPY – Daily Analysis

The USD/JPY currency pair hit the three-week lows and registered the 8-day losing streak, mainly due to the fears of China coronavirus, which has recently destroyed trade market sentiment. As of writing, the USD/JPY currency pair is currently trading at 109.06 and having dropped to 108.90 at the starting of the Asian session. By the way, the pair consolidates in the range between the 108.83 – 109.06.

The United States data came in mixed, whereas tensions in the Middle East also weighed on the market’s performance. At the Coronovirus front, the statement came from China’s health officials that the Coronavirus could be much more dangerous than earlier thought. As we know, this perilous virus has killed almost 100 lives, and more than 30,000 are infected so far in China. Meanwhile, the United States has advised all citizens not to travel to China.

On the other hand, diplomats in the U.S. and Iran ignore Iraq’s peace requests because Iran prepares for a satellite while the Trump administration joins side with France to make Irans’ act like a normal country.

Daily Support and Resistance

  • S3 108.4
  • S2 108.89
  • S1 109.08

Pivot Point 109.37

  • R1 109.56
  • R2 109.85
  • R3 110.33

USD/JPY – Trading Tips

The USD/JPY pair has violated long-held horizontal support level has already been violated at 109.250 level, and now, the USD/JPY is holding below this level. At the same level, the USD/JPY is also getting supported by the bullish channel, which can be seen in the chart above. 

Technically, the USD/JPY may find resistance around 109.250, which is the same level that provided support to the USD/JPY earlier. We can see selling below this level until 108.520. Moreover, the RSI and MACD have crossed over in the selling zone and are supporting the selling bias. 

All the best for today! 

Categories
Forex Market Analysis

Gold Flashing Green – China’s Coronavirus Outbreak Threats! 

The safe-haven-metal prices continued to flash green and rose to $1,588.70, mainly due to the risk-off market sentiment in the wake of China coronavirus outbreak threats. It is worth to mention that the gold prices recently got love from the fears of China’s coronavirus outbreak, as well as the headlines from the Middle East and the global trade news also add in the risk tone in the market.

According to the recent statement, the death toll in China due to coronavirus has risen to more than 80 from the 57. Meanwhile, Chinese authorities have recently updated the number of people affected by coronavirus as 30,400. Besides, more cases are also found in the United States, Japan, and Sydney. Whereas, the World Health Organization is likely to change its statement of delaying to call the coronavirus as International emergency amid the worldwide spread of the virus.

On the other hand, the renewed fears of the United States and Iran war also threatened the market risk-tone after repeated attacks on the US troops in Iraq on Sunday. The Sanctions on Iran from US Trump’s Administration has also added in the risk-off sentiment of the market.

Meanwhile, the US ten-year treasury yields hit the lowest from October 09 to 1.63%, whereas the S&P 500 decline more than 1.0% to 3,258 by the press time.

Looking forward, the traders will keep their eyes only on the trade and geopolitical news for fresh clues due to the lack of major data and events on the economic calendar in the wake of Australia and China’s holiday.

Daily Support and Resistance

  • S3 1529.51
  • S2 1548.81
  • S1 1560.32

Pivot Point 1568.11

  • R1 1579.62
  • R2 1587.41
  • R3 1606.71

On Monday, the boosted safe-haven demand has prompted a huge surge in the gold prices as it has opened with a gap from 1,572 to 1,581. Even now, gold prices are staying over 1,577 support zone, and bearish breakout of such level can prolong bearish trend unto 1,572 level. The general trend is bullish presently, but this gap should be swelled here we see further buying in gold. Good luck! 

Categories
Forex Market Analysis

Daily F.X. Analysis, January 27 – Top Trade Setups In Forex – Safe Haven Appeal Soars! 

The Friday major U.S. stock indexes closed in negative territory as the coronavirus outbreak in China intensified. The Dow Jones Industrial Average dropped 170 points (-0.6%) to 28989, the S&P 500 fell 30 points (-0.9%) to 3295, and the Nasdaq Composite was down 87 points (-0.9%) to 9314.

In Asian trading hours, EUR/USD edged up to 1.1030, while GBP/USD fell to 1.3058. The coronavirus outbreak continues to dent market sentiment, with Canada and Australia confirming their first cases of the virus over the weekend.

Economic Events to Watch Today


EUR/USD – Daily Analysis

The EUR/USD currency pair continued its longest weekly losing trend since November 2018 ahead of German IFO data. As of writing, the EUR/USD currency pair is currently trading at 1.1029 and consolidating in the range between the 1.1021 – 1.1037.

As we know, the currency pair represented 0.26% losses last week as the EUR currency faced selling pressure on the same day. That was mainly due to the European Central bank was seen more dovish after President Lagarde said that the risks to the economy have turned to the downside.

After that, the German PMI figures were released better-than-expected but failed to give some bids to the EUR currency. However, the EUR/USD currency pair has been moving in a bearish trend since the last week of January. At the data front, expectations are on the peak that the German IFO reading for January will hit the highest level since June 2019. 

Whereas the headline German business climate index was expected to rise to 97.2 (mkt 97.0), its highest level since June, but it came as 95.9 and weighed on Euro currency.

The shared currency continued its downward movement after the release of weaker than expected German Ifo Business Climate, which indicated a slowdown in the German economy. The short-run technical bias is expected to remain bearish until or unless the prices trade below the ascending trend line. 

Daily Support and Resistance    

  • S3 1.095
  • S2 1.0993
  • S1 1.1009

Pivot Point 1.1035

  • R1 1.1051
  • R2 1.1078
  • R3 1.112

EUR/USD– Trading Tips

The EUR/USD is trading at 1.1026 area, having formed a Doji candle above 1.1015 support level, particularly on the 4-hour timeframe. The bullish Doji pattern is suggesting the probabilities of a bullish and bearish trend both in the EUR/USD. The German Ifo Business Climate reported worse than expected figures falling below economists’ expectations of 96.3. 

The EUR/USD can show bullish correction until 1.1060 and 1.1075. On the lower side, a breakout of the support level of 1.1015 can lead EUR/USD prices towards the 1.0945 area. 


GBP/USD– Daily Analysis

The GBP/USD currency pair flashed red and continued its 3-day losing rally mainly due to China’s coronavirus outbreak & hard Brexit fears. As of writing, the GBP/USD currency pair is currently trading at 1.3062 and is consolidating in the range between the 1.3052 – 1.3079. 

At the Brexit front, the representative of the European Union and the United Kingdom are trying to expand the indirect fears regarding hard Brexit. The Brexit Secretary Stephen Barclay said that they would publish their objectives for the negotiations in due course after leaving E.U. on January 31. He also said that the U.K. would have control over its rules, and it would not diverge for the sake of diverging but would start from a position of alignment. 

On the other hand, British Home Secretary Priti Patel repeated this morning that Britain would diverge from Brussels after leaving E.U. despite warnings from European Union that they could rule out a free trade deal.

On the other hand, the European Union has already given a warning to the UK PM Boris Johnson that he will fail if he tries to use the support of a U.S. trade deal to strike better terms with Brussels.

At the China front, fears of China’s coronavirus explosion have threatened the global risk sentiment by crossing national boundaries and possibly affected more than 30,400 people within a few days.

As a result, the U.S. ten-year treasury yields fell to multi-week low while surrounding 1.63%, whereas most of the Asia-Pacific stocks also representing the risk-off sentiment in the wake of holidays in China and Australia.

Looking forward, traders will closely watch the 2nd-tier U.S. data on the economic calendar before Thursday’s monetary policy meeting by the Bank of England (BOE), which will show a final chance for rate change in the wake of mixed data. After that, the EU-UK will formally be departed at 21:00 GMT on January 31, 2020.

Daily Support and Resistance

  • S3 1.2865
  • S2 1.2984
  • S1 1.3028

Pivot Point 1.3102

  • R1 1.3146
  • R2 1.322
  • R3 1.3338

GBP/USD– Trading Tip

The GBP/USD has violated the symmetric triangle pattern, which is now keeping the pair support around the 1.3065 area. Closing of Doji candle above this level is likely to keep the GBP/USD bullish until 1.3170. 

Above 1.3170, the GBP/USD may go after the next resistance level of 1.3160. Whereas, a bearish breakout of 1.3065 can lead the GBP/USD prices towards 1.2975. The RSI and MACD support mixed bias. Let’s look for selling trades below 1.3102 and bullish trades above 1.3044. 


USD/JPY – Daily Analysis

The USD/JPY currency pair was found on the bearish track and dropped heavily on the day because the Japanese yen picked up a bid in the wake of bad news regarding the China coronavirus fears threatened the market risk sentiment. As of writing, the USD/JPY currency pair is currently trading at 109.05 and is consolidating in the range between the 108.73 and 109.11.

At the China front, fears of China’s coronavirus have threatened the global risk sentiment by crossing national boundaries and possibly affecting more than 30,400 people within a few days.

On the other hand, the Federal Reserve meeting is scheduled to happen during this week, and traders are keeping their eyes on the Federal Reserve rate decision. The agreement surrounding the Federal Reserve is of a neutral stance with much of the hard work done last year, and traders are expecting stability in the monetary policy for now.

As a result, the U.S. ten-year treasury yields fell to a multi-week low while surrounding near 1.63%. In contrast, most of the Asia-Pacific stocks are also representing the risk-off sentiment in the market on the back of holidays in China and Australia.

A report came in that Singapore has reported four cases of the coronavirus that has killed 80 people in China so far, and the numbers look to be increasing with the time. As in result, most currencies are under pressure due to risk-off market sentiment; on the other hand, the safe-haven currencies like Japanese yen are looking bullish.


Daily Support and Resistance    

  • S3 108.4
  • S2 108.89
  • S1 109.08

Pivot Point 109.37

  • R1 109.56
  • R2 109.85
  • R3 110.33

USD/JPY – Trading Tips

The USD/JPY pair has violated long-held horizontal support level has already been violated at 109.250 level, and now, the USD/JPY is holding below this level. At the same level, the USD/JPY is also getting supported by the bullish channel, which can be seen in the chart above. 

Technically, the USD/JPY may find resistance around 109.250, which is the same level that provided support to the USD/JPY earlier. We can see selling below this level until 108.520. Moreover, the RSI and MACD have crossed over in the selling zone and are supporting the selling bias. 

All the best for today! 

Categories
Forex Market Analysis

WTI Crude Oil Prices Rose Amid Fresh Fear of China Coronavirus! 

The WTI crude oil prices flashed green and rose to $55.84 after dropping to 9-week lows, mainly due to the fears regarding China coronavirus. The U.S. West Texas Intermediate futures (CLc1) were 24 cents up, or 0.4%, higher at $55.83 a barrel. The contract fell 2% on Thursday and is 5% lower for the week.

On the front of the main headlines, the market’s risk tone has already badly shaken by the headlines from China regarding the increased number of affected people and deaths because of coronavirus. China has reportedly blocked millions of people in two cities to prevent the virus spread.

Whereas the World Health Organization (WHO) still needs some time to understand the cause behind the coronavirus as an international threat. The SARS fighting team of China returned to find the reason and battle the coronavirus.

On the flip side, oil inventories dropped by 405,000, the EIA reported in its weekly report. Traders were looking for a drop of about 1 million barrels for oil inventories.

After the massive build in fuels during the previous two weeks, you can say that this is slightly positive news for the crude oil future buyers, as well as it did not prove to be much help because the market’s worries are all on China’s demand now, under the coronavirus problem.

While we had a near 1-million barrel decline in Cushing stockpiles, U.S. crude exports fell about 70,000 bpd on the week, and production remained at an unreasonable high of 13 million bpd.


Daily Support and Resistance       

S3 52.98

S2 54.25

S1 54.97

Pivot Point 55.51

R1 56.24

R2 56.78

R3 58.04

Technically, crude oil has violated the horizontal intraday support level of 55.90, which is now working as resistance for oil. It’s trading at 54.50, having formed strong bearish candles, which are known as “Three Black Crows.” These patterns are likely to drive more sales until 53.95, the next support level for crude oil. The MACD also supporting the strong bearish trend in the crude oil, although there’s a need for a bullish correction. Let’s consider to take sell tradings below 55 today to target 53.95. Good luck! 

Categories
Forex Market Analysis

Daily F.X. Analysis, January 24 – Top Trade Setups In Forex – Busy Friday Ahead! 

The U.S. Dollar Index gained 0.2% on the day to 97.69. The EUR/USD slid 0.4% to 1.1055, the lowest level since early December. The European Central Bank left its monetary policy steady (deposit facility rate at -0.50%). ECB President Christine Lagarde said there are signs of a moderate increase in underlying inflation, and the downside risks to the growth outlook are less pronounced. Later today, research firm Markit will release Eurozone January Manufacturing PMI (46.8 expected) and Services PMI (52.8 expected).

The U.S. Labor Department reported that initial jobless claims climbed to 211,000 in the week ended January 18, lower than 214,000 expected. The Conference Board Leading Index declined 0.3% on month in December (-0.2% expected).

Economic Events to Watch Today


EUR/USD – Daily Analysis

The EUR/USD currency pair is moving on the bearish track, after hitting the 7-weeks low of 1.1036 yesterday after the European Central Bank President Lagarde told during her conference that the risk to the Eurozone growth was still on the negative side. As of writing, the EUR/USD currency pair is currently trading at 1.1050 and is consolidating in the range between the 1.1047 – 1.1058.

Looking forward, Germany’s Markit Manufacturing PMI for January is expected to increase by 44.5 in January from December’s 43.7, while Eurozone’s Manufacturing PMI for January is expected to release as 46.9 against December’s 46.3.

It is worth to mention that the published Below-Forecast figures would confirm Lagarde’s concerns about downside risks to the Eurozone economy and increase the selling pressures on the EUR currency. As a result, the EUR/USD currency pair may test support at 1.0981 (November 29 low).

On the positive side, the common currency will likely to get bids if the PMI numbers exceed the estimation by a significant margin, although the bearish outlook would be canceled only if the pair succeeds to close above Thursday’s high of 1.1109.

As well as, the EUR/USD currency pair may also take directions from the ECB President Lagarde’s speech, which is scheduled to happen at 10:30 GMT and from the release of the U.S. Manufacturing PMI, which is scheduled to publish at 14:45 GMT.

Daily Support and Resistance

  • S3 1.0922
  • S2 1.0994
  • S1 1.1025
  • Pivot Point 1.1067
  • R1 1.1097
  • R2 1.1139
  • R3 1.1212

EUR/USD– Trading Tips

The EUR/USD is trading at 1.1036 area, having formed a series of Doji candles pattern above 1.1030 support level, particularly on the 4-hour timeframe. The bullish Doji pattern is proposing the odds of a bullish and bearish trend both in the EUR/USD. The recent manufacturing and services PMI economic events have performed really well and these may help support the EUR/USD currency pair today. 

The EUR/USD can show bullish correction until 1.1060 and 1.1075. On the lower side, a breakout of the support level of 1.1037 can lead EUR/USD prices towards the 1.0945 area. 


GBP/USD– Daily Analysis

The GBP/USD currency pair stopped the Thursday losses and recovered slightly, possibly due to the positive trade headlines. But the traders are looking careful ahead of the preliminary readings of January month’s PMI for fresh impulse. As of writing, the GBP/USD currency pair is currently trading at 1.3123 and is consolidating in the range between the 1.3113 – 1.3128.

On the front of Brexit, the leading news was that the Queen’s Royal approval had been given to the United Kingdom Prime Minister Boris Johnson’s Departure Agreement Bill (WAB). Now the United Kingdom is trying to make a trade deal with the United States and Japan before leaving the European Union.

 However, the United Kingdom Chancellor Sajid Javid gave a positive statement to satisfy the industries after his previous comment about the fear of hard Brexit. He assured that the U.K. would use the power to diverge from E.U. rules only when it would be in the interest of British business.

 Even after, the fears of the United States tariff cannot be decreased because the Tories Party gave permission to China’s Huawei Company to take part in 5G, whereas the Trump administration has repeatedly given notices against such action.

Moreover, United States President Donald Trump earlier warned to impose tariffs on the United Kingdom if it fines the digital service tax to major search engines like Facebook and Google.

More importantly, the European Union (E.U.) leaders are keeping the head high before the EU-UK trade discussions. The situation will continue to weigh on the risk tone. On the other hand, China’s explosion of coronavirus already gave the major shock to the global risk sentiment.

Looking forward, preliminary readings of January month PMIs from the U.K. and the U.S. will be the key to watch, whereas the recent increase in the U.K.’s earnings and CBI data have decreased the chances of the BOE’s easing. So, traders will keep their eyes on the PMIs for fresh directions.

Daily Support and Resistance

  • S3 1.3023
  • S2 1.3073
  • S1 1.31
  • Pivot Point 1.3123
  • R1 1.315
  • R2 1.3174
  • R3 1.3224

GBP/USD– Trading Tip

The GBP/USD has traded sideways in the wake strong dollar and strong Sterling. The GBP gained bullish momentum on the release of better than expected manufacturing figures which hurt the BOE’s interest rate cut sentiment. 

At the moment, the GBP/USD pair is trading at 1.3090 as it has violated the symmetric triangle pattern on 4 hourly charts. It seems to extend its bullish bias after retracing back to the 1.3080 level.

The GBP/USD pair may find support around the 1.3044 area today. Whereas, the RSI and MACD support the mixed bias. Let’s look for selling trades below 1.3123 and bullish trades above 1.3044. 


USD/JPY – Daily Analysis

The USD/JPY currency pair flashed green and recovered from the low of 109.27 to 109.58 because Japanese yen lost ground despite the upbeat Japanese inflation data. As of writing, the USD/JPY currency pair is currently trading at 109.53 and is consolidating in the range between the 109.44 – 109.58.

At the data front, Japan’s core consumer price index (CPI) increased 0.7% in December from a year earlier after November’s 0.5% rise. The headline CPI rose 0.8%, bettering the forecast of 0.4% by a big margin.

The inflation data was published at 23:30 GMT but did not find a bid tone around the Japanese yen so far. Ultimately, inflation remained well away from the central bank’s elusive 2% target despite the acceleration from the previous month.

At the BOJ front, the Bank of Japan’s (BOJ) December monetary policy meeting minutes were released a few minutes before press time and repeated the need for continued easing. As well as, most bank members agreed that it was right to continue easing consistently. The central bank has been operating an ultra-easy policy for almost above seven years, so its rate cut bias has been priced for long ago.

The Japanese yen could find bids tone if the equities remain risk-averse on coronavirus fear. As of January 23, there were 830 confirmed cases in China. Whereas, the futures on the S&P 500 are currently reporting marginal gains.


Daily Support and Resistance

  • S3 108.7
  • S2 109.09
  • S1 109.29
  • Pivot Point 109.47
  • R1 109.68
  • R2 109.86
  • R3 110.24

USD/JPY – Trading Tips

The USD/JPY pair has finally violated the double bottom level of 109.850, which is now leading the currency pair towards the next support level of 109.185. Technically, the USD/JPY may find resistance around 109.850, which is the same level that provided support to the USD/JPY earlier. We can see selling below this level until 109.250. Moreover, the RSI and MACD have crossed over in the selling zone. Today, I will be looking for selling trades below 109.850 and selling above 109.250 level. 

All the best for today! 

Categories
Forex Market Analysis

Gold Rose Slightly As Fear of Virus Continue To Raise – Trade Idea!

The safe-haven-metal prices slightly rose, mainly due to the spread of China’s coronavirus. There were reports that the virus has almost killed 17 people in China, and officials have completely closed the Wuhan city to prevent the infection from further spread. However, China is looking up to other nations as well for finding the cause behind this virus. It has been found so far that the virus is contagious and can be transmitted from person to person, and this has resulted in an increase of risk-tone in the financial market.

The latest coronavirus has refreshed the memories of the SARS virus, which was also started in China in 2002-2003 and resulted in dented economic growth and a slump of the travel business. The market’s risk sentiment has increased due to the possible effects of the virus on the world’s second-largest economy.

At the Sino-US trade font, the uncertainty regarding trade tensions eased around the globe when the US reported that it has decided to roll back some tariffs on Chinese products on Valentine’s Day.

On the other hand, US President Donald Trump gave the warning to impose 25% tariffs on the EU cars if it fails to deliver any trade deal. The EU Chief Von Der Leyen may visit Washington in early February to discuss the possibility of the trade deal.

Whereas, the Lower export figures from Japan in December also supported the safe-haven metal today. As well as the country’s exports fell 6.3% in December from a year earlier, the Ministry of Finance data showed on Thursday. Meanwhile, Imports decreased by 4.9% in the year to December, against the median estimate for a 3.4% decrease. They fell 15.7% in the previous month.


Daily Support and Resistance
S3 1538.86
S2 1547.56
S1 1553.22
Pivot Point 1556.26
R1 1561.92
R2 1564.96
R3 1573.66

Gold is trading with a neutral bias, keeping the trading rangebound within 1,566 – 1,549. On the 4 hour chart, it has produced a series of Doji and Spinning top candles, which indicates uncertainty among investors.

At the moment, gold may find immediate support nearby 1,555 levels, which is expected to keep it in a buying mode until the subsequent resistance level of 1.561.

A bullish violation of this level can encourage more buying to 1,565. On the lower side, the breach of 1,555 support level can spread selling unto 1,551 level today.

Categories
Forex Market Analysis

Daily F.X. Analysis, January 23 – Top Trade Setups In Forex – ECB Interest Rate In Highlights! 

The European Central Bank will deliver its interest rates decision (deposit facility rate expected to be unchanged at -0.50%). The European Commission will release the eurozone’s December Consumer Confidence Index (-7.0 expected).

The U.S. Labor Department will post initial jobless claims in the week ended January 18 (215,000 expected). The Conference Board will release its December Leading Index (-0.2% on month expected).

Economic Events to Watch Today


EUR/USD – Daily Analysis

The EUR/USD currency pair is moving flat and consolidating in the narrow range between the 1.1070 – 1.1120 ahead of the European Central Bank’s decision regarding rates. As of writing, the EUR/USD currency pair is currently trading at 1.1085. The pair have not attempted any move out of the range 1.1070 – 1.1120 since January 17.  

The European Central Bank is likely to keep interest rates and other essential policy tools unchanged. As we know, the ECB had delivered rate cut by ten basis points to -0.5% in September 2019. Moreover, the Bank also restarted bond purchases in October.

It is worth to mention that the purpose of Thursday’s meeting would be to announce the official strategy review, which would redefine its mission and tools. The Bank would also set the scope and parameters for the review, which could gain the attention of traders.

Moving ahead, the EUR currency will likely put strong bids if the speech of ECB President Lagarde decreases the chances of the possible change in the sense of the price stability and methods to achieve it.

On the other hand, the German economy is flashing green in the wake of optimism surrounding the United States and China trade deal. As we already mentioned that the EUR currency might pick up bid if Lagarde focuses on recent positive data, and confirm the need for more effort toward the economy.

On the negative side, the EUR currency could be subject to selling pressure if the Lagarde ignores the recent German/Eurozone economic recovery and focus more on the downside risks. Furthermore, any sign regarding Bank planning to adopt a higher inflation target in the future will likely push the EUR currency lower.


Daily Support and Resistance           

  • S3 1.1031
  • S2 1.1059
  • S1 1.1076
  • Pivot Point 1.1087
  • R1 1.1105
  • R2 1.1116
  • R3 1.1144

EUR/USD– Trading Tips

On Thursday, the EUR/USD is trading at 1.1086 area, having formed a series of Doji candles pattern above 1.1070 support level, particularly on the 4-hour timeframe. The bullish Doji pattern is proposing the odds of a bullish and bearish trend both in the EUR/USD as it depends upon the ECB rate decision. 

The EUR/USD can show bullish correction until 1.1106. On the lower side, a breakout of the support level of 1.1077 can lead EUR/USD prices towards the 1.1045 area. 


GBP/USD– Daily Analysis

The GBP/USD currency pair was flashing red, and it failed to continue its three-day bullish rally despite the United Kingdom’s Prime Minister Boris Johnson’s Brexit deal victory regarding Withdrawal Agreement Bill (WAB). As of writing, the GBP/USD currency pair is currently trading at 1.3015 and is consolidating in the range between the 1.3119 – 1.3152.

On the front of the leading news, despite seeing 5-amendments from the House of Lords, the Tory leader/UK PM Boris Johnson has passed his WAB Bill through the Parliament (without modification) in the wake of majority support. As of now, the bill will get the royal approval within 9-days to become law.

Whereas, the hard Brexit fears continue to surround the market. That is due to the European Union chief Von der Leyen saying that the United Kingdoms’ position would be weakened in the single market if it does not continue to sign up the European Union rules and regulations after Brexit withdrawal. The E.U. chief also said that the trade talks would start from February, after considering that there could be a further delay until March.

Moreover, the pair could weaken further in the wake of the U.S. threat to impose the sanctions if the United Kingdom moves forward in its punitive measures to impose digital service tax on search engines like Google and Facebook. Whereas France backed out after the warning from Washington and agreed with the U.S. to develop an international framework for digital taxation at the OECD level, but both disagree on ways to shape it.

At the China front, fears of a Chinese virus explosion and noises surrounding the US-China trade deal, as well as the U.S. President Donald Trump’s impeachment hearings, all are keeping the market under pressure.

As a result, the U.S. ten-year treasury yields remained under pressure around 1.75%, while the Asian stocks also gave mixed trade sentiment.

Daily Support and Resistance

  • S3 1.2879
  • S2 1.2994
  • S1 1.3067
  • Pivot Point 1.311
  • R1 1.3182
  • R2 1.3225
  • R3 1.3341

GBP/USD– Trading Tip

On the 4 hour timeframe, the GBP/USD is testing the resistance level, which is extended by the bearish channel at 1.3060. At the moment, the GBP/USD pair is trading at 1.3060, and it seems to extend its bullish bias until 1.3090.

The GBP/USD pair may find support around the 1.3044 area today. Whereas, the RSI and MACD support the bullish bias. Let’s look for selling trades below 1.3080 and bullish trades above 1.3010. 


USD/JPY – Daily Analysis

The USD/JPY currency pair failed to cross the 110.00 range and is still trading on the bearish track below the 110.00 level, mainly due to the risk-off market sentiment in the wake of global coronavirus spread. As of writing, the USD/JPY currency pair is currently trading at 109.55 and is consolidating in the range between the 109.50 – 109.86.

As we already mentioned, the USD/JPY currency pair failed to break the 110 handles because of the lack of events to distract the market attention from the virus fears as well as Trump’s impeachment trial. Whereas the U.S. stock markets had mixed sentiment and without the full commitment from U.S. dollar traders, the prices finally dropped.

The virus has killed 17 people so far in China, and leaders have almost closed Wuhan and also keeping the focus on the other nation to understand the cause behind the virus. By the way, the virus is known to be humanly transmitted. As a result, market risk-tone has severely disturbed.

At the Sino-US trade font, the U.S. has decided to reduce some part of its tariffs on Chinese products on this Valentines’ Day, as agreed in the phase-one deal, which resulted in ease in the uncertainty about the impact of the US-China deal on global financial markets.

Although the trade and geopolitical fears have been pushing the markets off lately, the rising trade optimism has given a cool tone to the market. Despite that, the U.S. ten-year treasury yields remained weak, around 1.77%, whereas global equities have also shown mixed results.

Looking forward, the Investors will keep their eyes on Japan’s trade figures, All Industry Activity Index, and Leading Economic Index, as well as the news headlines, to further invest in the market. On the negative side, a possible recovery in Japanese Yen will likely keep the pair under pressure. And on the positive side, the BOJ Governor’s overall dovish outlook in the latest meeting, as well as the broad greenback strength, could keep the pair bullish.

Daily Support and Resistance

  • S3 109.4
  • S2 109.65
  • S1 109.74
  • Pivot Point 109.9
  • R1 109.99
  • R2 110.15
  • R3 110.41

USD/JPY – Trading Tips

The USD/JPY pair has finally violated the double bottom level of 109.850, which is now leading the currency pair towards the next support level of 109.185. Technically, the USD/JPY may find resistance around 109.850, which is the same level that provided support to the USD/JPY earlier. We can see selling below this level until 109.250. Moreover, the RSI and MACD have crossed over in the selling zone. Today, I will be looking for selling trades below 109.850 and selling above 109.250 level. 

All the best for today! 
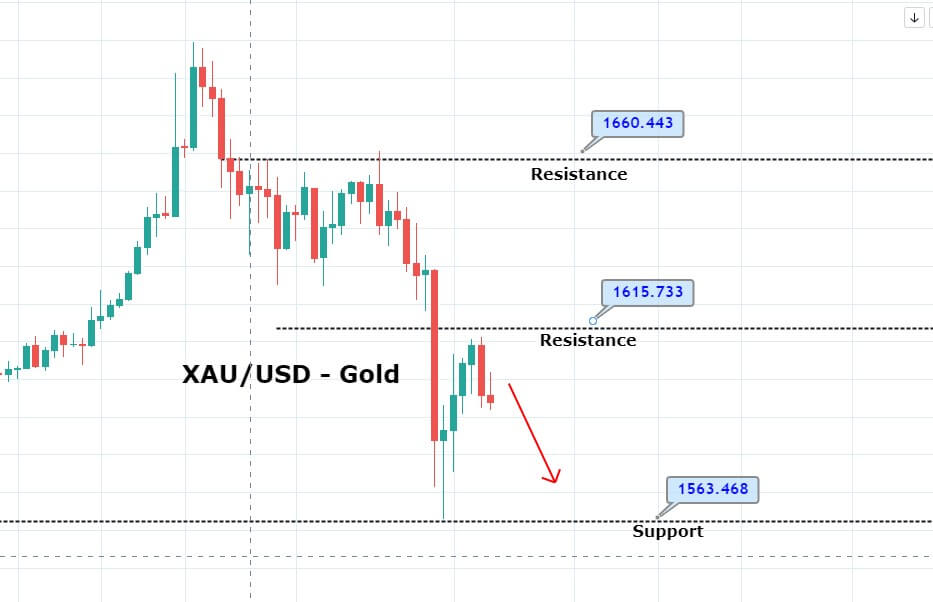
Categories
Forex Market Analysis

Daily F.X. Analysis, January 22 – Top Trade Setups In Forex – Weaker Dollar Sentiment In Play! 

In Asian trading hours, EUR/USD edged up to 1.1098, and GBP/USD climbed to 1.3011. The USD/JPY slid to 109.97. This morning, the Bank of Japan, as widely expected, kept its policy rate at -0.10% and a 10-year yield target at 0% unchanged. The central bank raised its 2020 Japan’s GDP growth forecast to 0.9% from 0.7% previously. Spot gold marked a day-high of $1,568.6 an ounce before easing to $1,566.0 an ounce.

The ZEW Financial Market Survey is an aggregation of the sentiments of almost 350 economists and analysts on the economic future of Germany is scheduled to release today. Germany, which is considered as the Eurozone’s manufacturing powerhouse, suffered a marked slowdown in 2019, in the wake of the Sino-US trade tensions.

Economic Events to Watch Today


EUR/USD – Daily Analysis

The EUR/USD slipped 0.1% to 1.1085. The German ZEW Current Situation Index bounced to -9.5 in January (-13.5 expected) from -19.9 in December.  

The EUR/USD currency pair bullish level above 1.11 was not long-lived. The pair closed the day with 0.11% losses, creating an inverted hammer and confirming a head-and-shoulders breakdown on the daily chart. 

Looking forward, Italy’s Business Climate, Industrial Sales, and Industrial Orders for November are scheduled to release today. However, these data could not influence the market as well as the U.S. housing data is expected to release and will likely leave the impact on the U.S. Dollar.

The ECB is not supposed to appear on Thursday, although Bloomberg announced that 90% of analysts anticipate a change to the inflation strategy. It will be the first move in 17 years if President Lagarde rules to perform the adjustment.

Daily Support and Resistance

  • S3 1.0996
  • S2 1.1051
  • S1 1.107
  • Pivot Point 1.1106
  • R1 1.1125
  • R2 1.1161
  • R3 1.1216

EUR/USD– Trading Tips

On the 4 hour timeframe, the EUR/USD is trading at 1.1086, having formed a Doji and bullish engulfing pattern above 1.1070 support level. The bullish engulfing pattern is proposing the odds of a bullish trend in the EUR/USD. The EUR/USD can show bullish correction until 1.1106. On the lower side, a breakout of the support level of 1.1077 can lead EUR/USD prices towards the 1.1045 area. 


GBP/USD– Daily Analysis

The GBP/USD rebounded 0.3% to 1.3046. Official data showed that the U.K. jobless rate for the three months to November remained steady at 3.8% (as expected), and average weekly earnings grew 3.2% on year (+3.1% estimated).

The U.K. Office for National Statistics will release December public sector net borrowing, excluding banking groups (5.3 billion pounds expected).

In the U.S., the Federal Reserve Bank of Chicago will post the December National Activity Index (0.15 expected). The National Association of Realtors will report December’s existing-home sales (5.43 million units expected). The FHFA will release November House Price Index (+0.3% on month expected).

The pound to dollar is striving to post a third continuous day of profits and is probing a vital resistance zone. GBP/USD set higher on Monday and spread gains yesterday following an upbeat U.K. jobs report.

Daily Support and Resistance

  • S3 1.2812
  • S2 1.2928
  • S1 1.2969
  • Pivot Point 1.3044
  • R1 1.3085
  • R2 1.316
  • R3 1.3276

GBP/USD– Trading Tip

On Wednesday, GBP/USD continues to trade bullish over a weaker dollar. On the 4 hour timeframe, the GBP/USD is testing the resistance level, which is extended by the bearish channel at 1.3060. At the moment, the GBP/USD pair is trading at 1.3060, and it seems to extend bullish bias until 1.3090.

The GBP/USD pair may find support around the 1.3044 area today. Whereas, the RSI and MACD support the bullish bias. Let’s look for selling trades below 1.3080 and bullish trades above 1.3010. 


USD/JPY – Daily Analysis

The USD/JPY closed at 109.859 after placing a high of 110.220 and a low of 109.760. Overall the movement of the USD/JPY pair remained strongly bearish that day.

On Tuesday, USD/JPY dropped to its one-week lowest after the Bank of Japan revised its growth projections for 2020. The Bank of Japan raised its growth estimates for the fiscal year beginning in April to 0.9%, which it previously estimated as 0.7% in October.

According to reports, the Bank of Japan kept its monetary policy on hold. It raised its forecasts for economic growth in 2020 because of the stimulus package of government and the decreasing pessimism over the global outlook. 

The Bank of Japan signaled the rising optimism over the global outlook after the United States and China agreed on the Phase-one trade deal to resolve their trade conflicts. Bank said that the risks surrounding the global perspective have decreased to some extent, and this has provided the bank with the possibility to increase its forecast for the growth of Japan’s economy in 2020.

Daily Support and Resistance

  • S3 109.73
  • S2 109.94
  • S1 110.04
  • Pivot Point 110.15
  • R1 110.25
  • R2 110.35
  • R3 110.56

USD/JPY – Trading Tips

On Wednesday, the USD/JPY pair continues to exhibit choppy trading sessions due to a lack of fundamentals. The USD/JPY has traded bearishly as it fell from 110.200 to trade at 109.950, but the pair continues to consolidate in a narrow trading range of 109.800 – 110.150.

Technically, the USD/JPY is supported above 109.850, and we can see buying above this level until 110.490. The USD/JPY may find a resistance level of 110.570. Moreover, the RSI and MACD have crossed over in the selling zone. Today, I will be looking for buying trades over 110.15 and selling below at the same level. 

All the best for today! 

Categories
Forex Market Analysis

The Safe-Haven-Metal Prices Rose on IMF Report & China Virus Headlines!

On Tuesday, gold prices inched up mainly due to the International Monetary Fund (IMF) report, which indicated a gloomy outlook for 2020. Gold traded 0.4% to $1,566.65 before falling to 1,555 during the European session.

The IMF decreased its forecast for global growth this year to 3.3% from 3.4% in October. The estimates for the U.S. and Eurozone were both lowered by the same amount. This report sent the prices of the safe-haven metal higher point, whereas the equities to the lower positions.

On the other hand, the safe-haven metal also got some support due to the risk-off market sentiment in the wake of the corona-virus outbreak in China.

Gold prices earlier boosted mainly due to the headlines regarding the China virus, which gained market attention. Because of the virus, four people were reported as dead in China, and an Australian man has also been recently tested for this human transmitted disease. As a precautionary measure, Wuhan has created a Wuhan Pneumonia control center to stop further spread of the disease. Meanwhile, he has also strongly suggested that markets and public transportation stations should be supervised strictly to prevent this virus from spreading further.

At the geopolitical front, unrest in Iraq during the weekend was also in focus, while it did not give any meaningful support to gold prices. At the USD front, the reason behind the greenback strength could be the rising expectations because of upbeat economic events that the economy of the United States will continue to expand.

Daily Support and Resistance

S3 1551.67
S2 1556.16
S1 1558.45
Pivot Point 1560.65
R1 1562.94
R2 1565.14
R3 1569.63

On the 4 hour chart, gold has violated the bullish channel, which was supporting it around 1,553. Violation of this level can extend selling until 1,549. Besides that, gold has formed a bearish engulfing pattern is also suggesting chances of a bearish trend in the gold. The violation of 1,549 can open bearish bias until 1,544 today. Good luck!