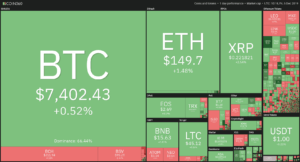
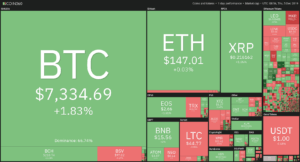
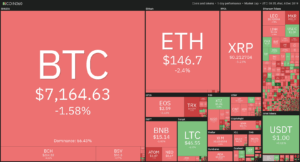
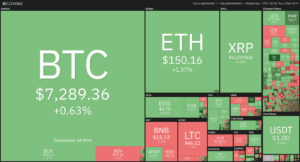
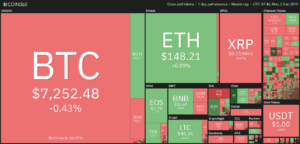
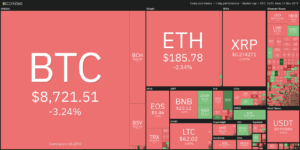
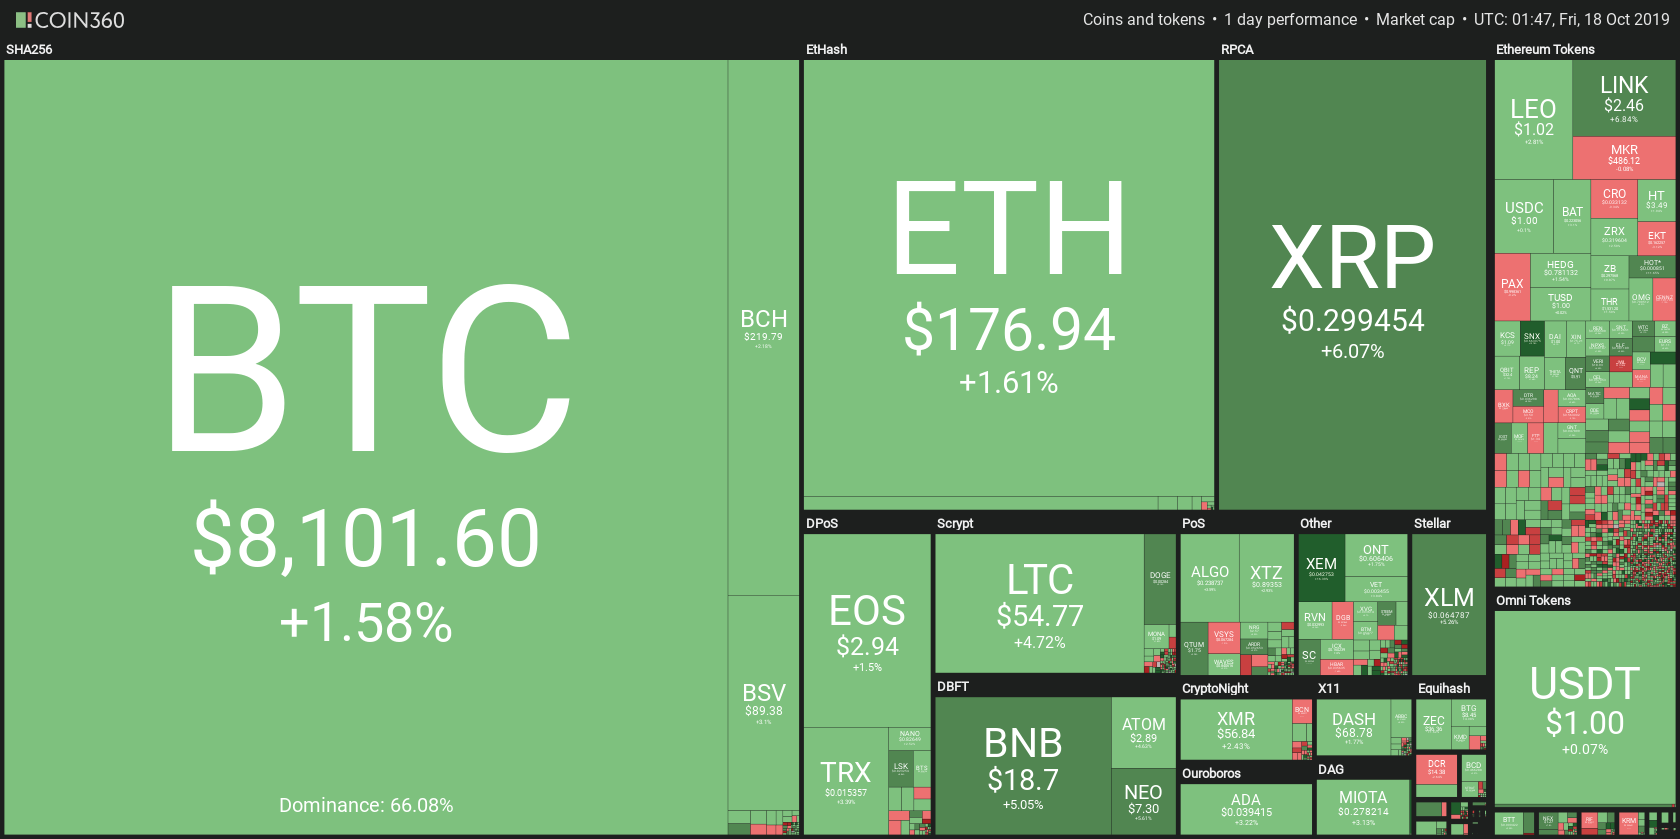
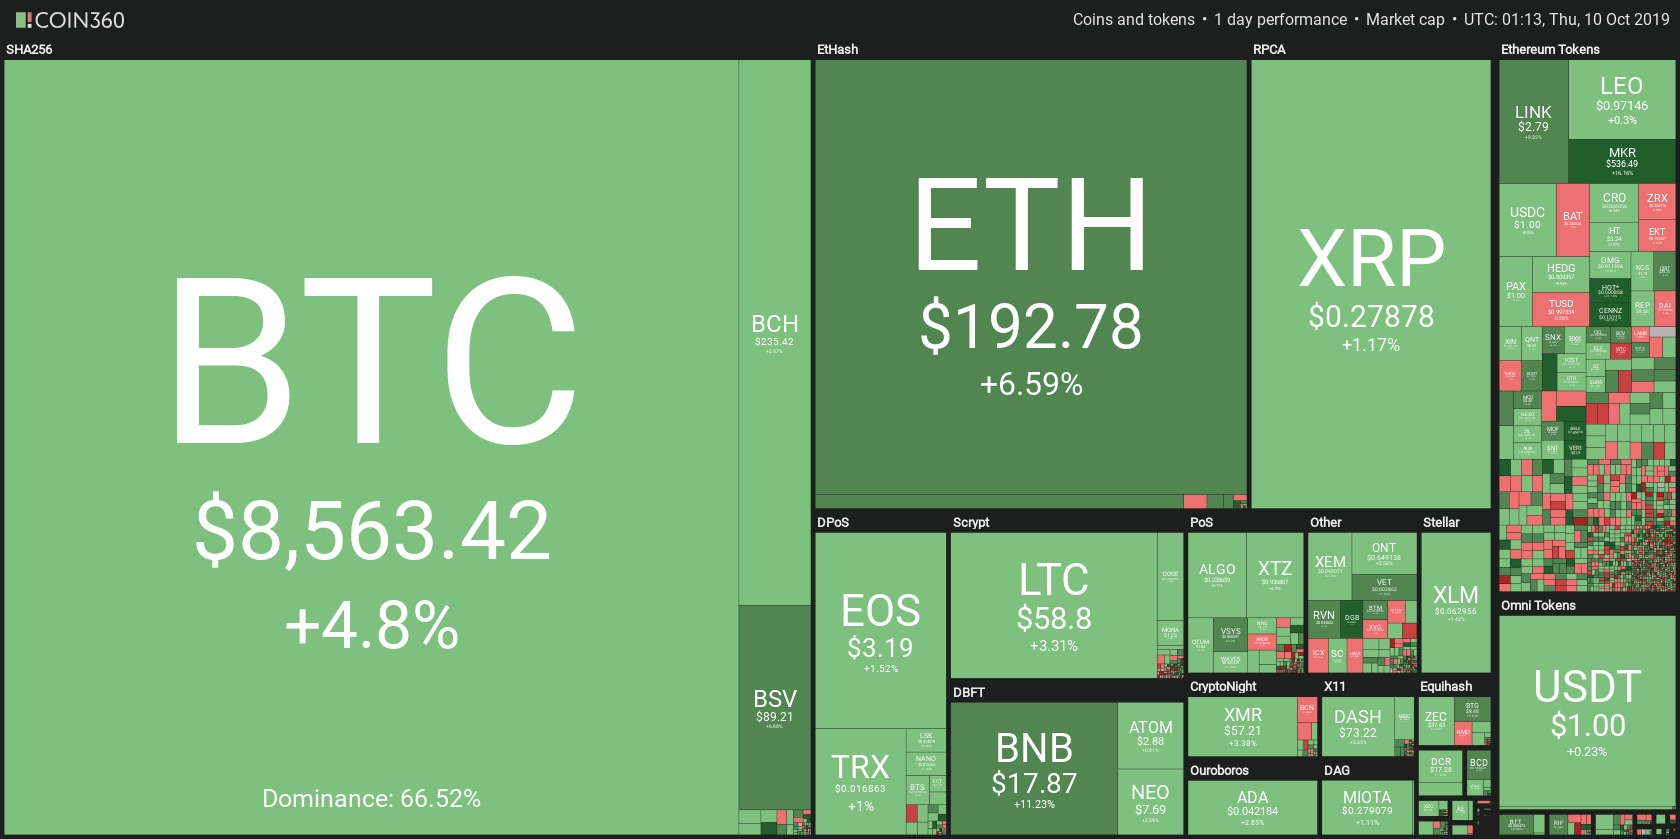
The crypto market has had quite a solid weekend. Most cryptocurrencies ended up in the green both in the past 24 hours as well as over the weekend. If we look at the past 24 hours, Bitcoin’s price went up 0.82% and is now trading at the price of $7,534. Meanwhile, Ethereum gained 0.45%, while XRP went up 1.72%.
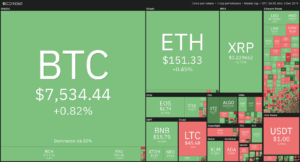
The biggest gainer from the top100 cryptocurrencies by market cap for today is Energi, with gains of 23.15% on the day. The biggest loser of the day was EDUCare, which lost 8.15% of its value.
Bitcoin’s dominance stayed at the same value when compared to where it was at on Friday. Its dominance is currently 66.53%, which represents an increase of 0.09% from Friday’s value.
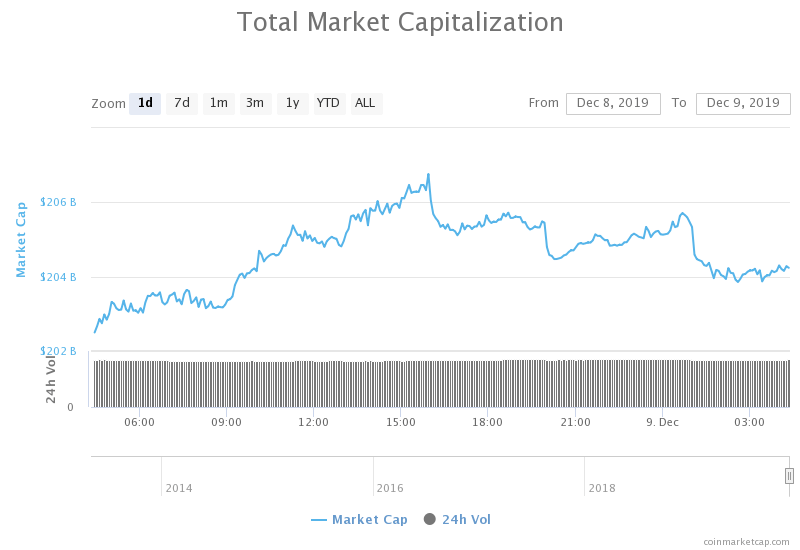
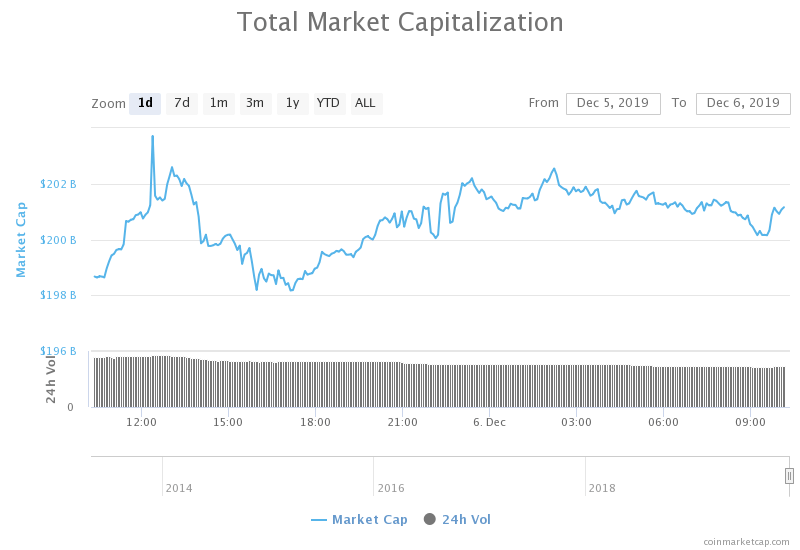
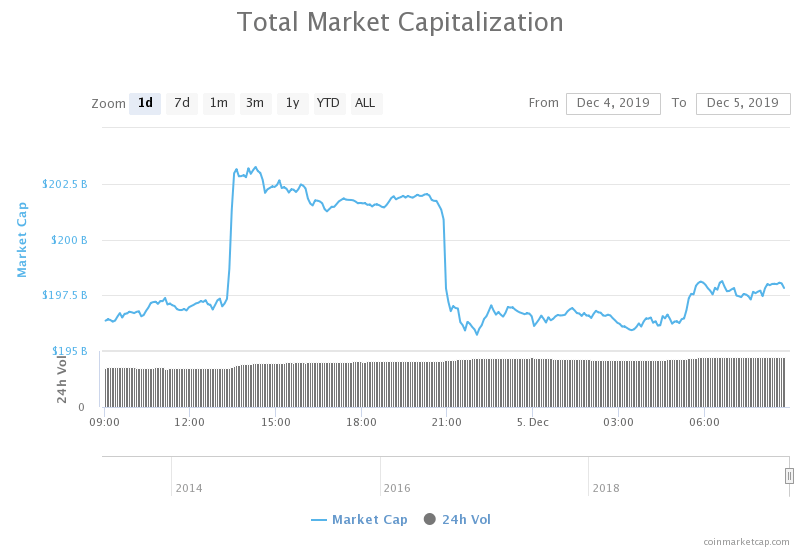
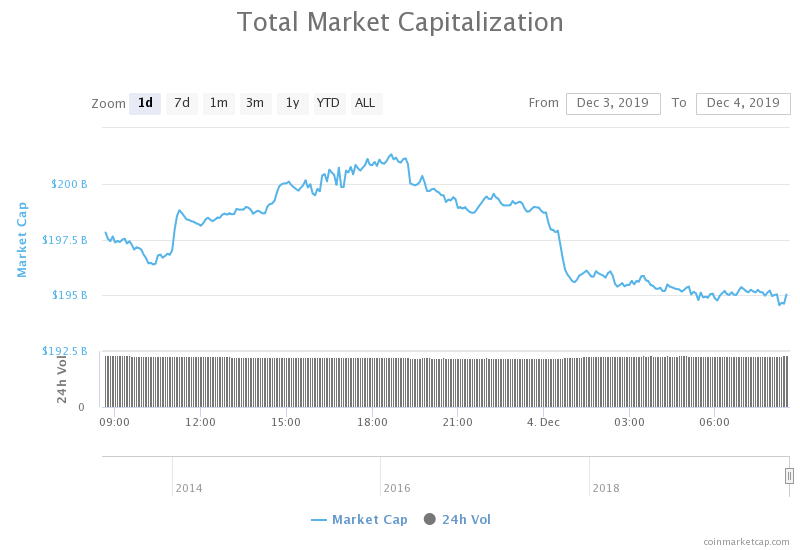
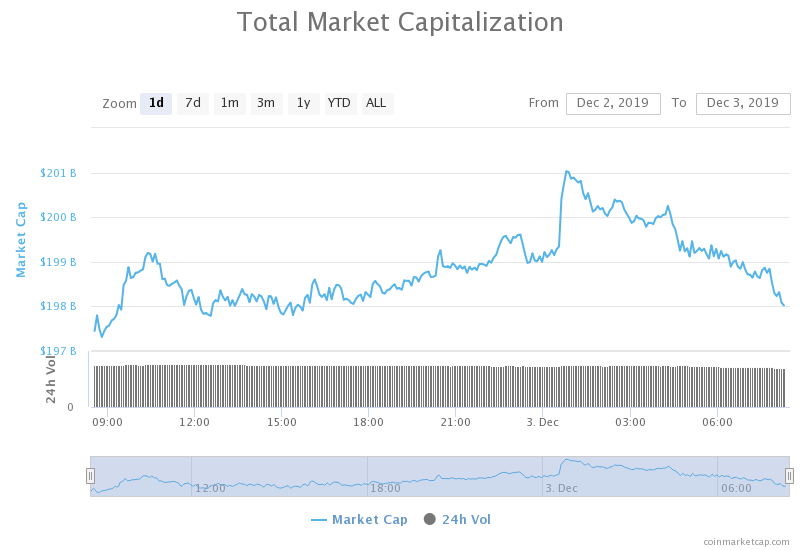
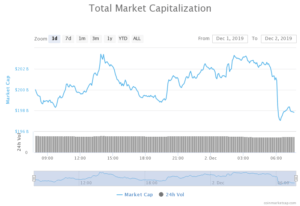
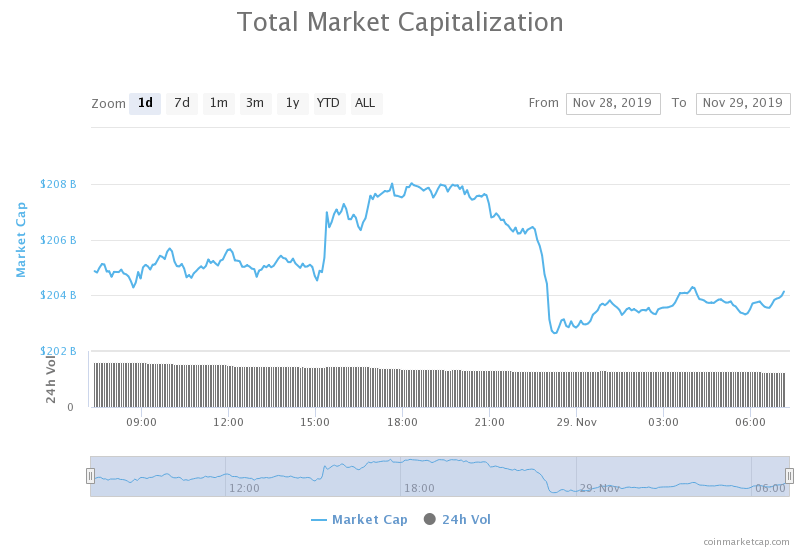
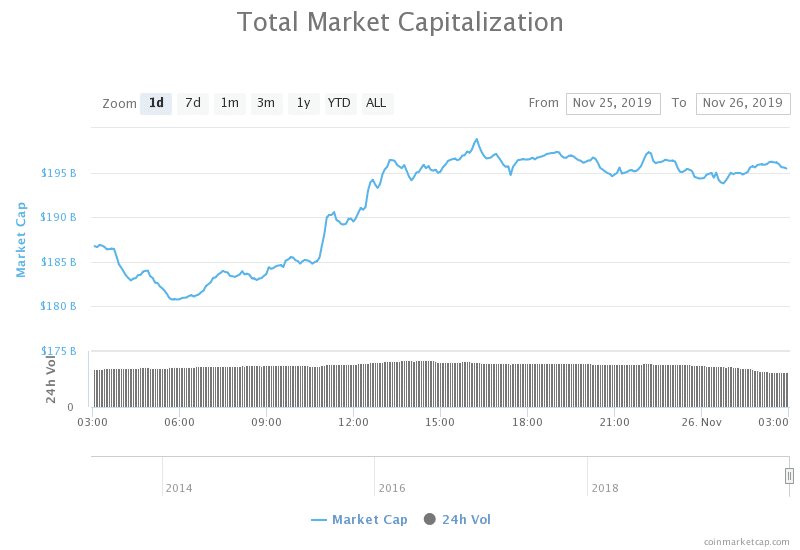
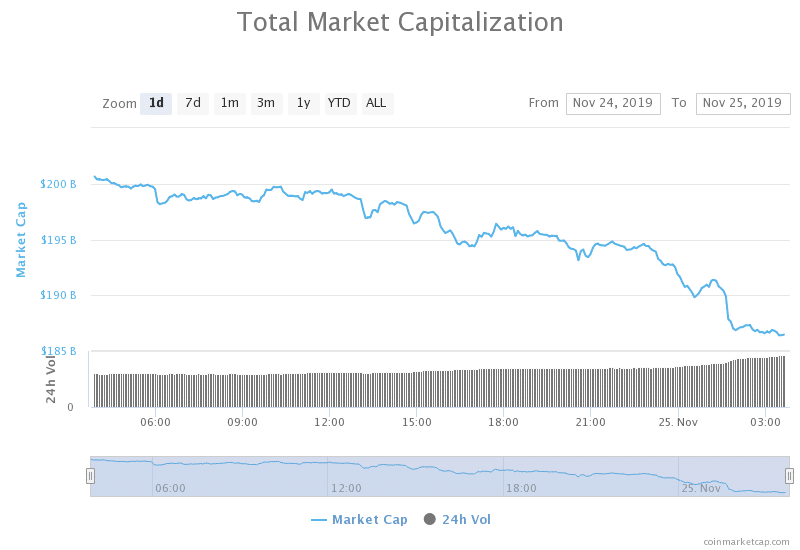
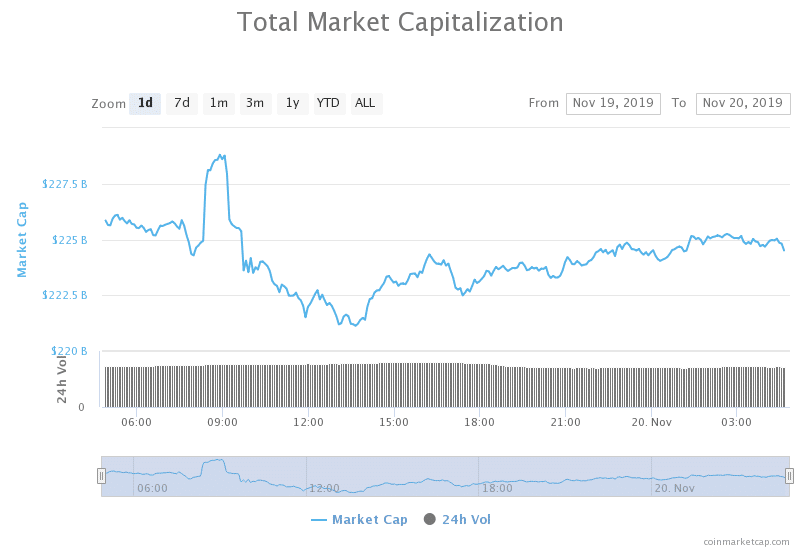
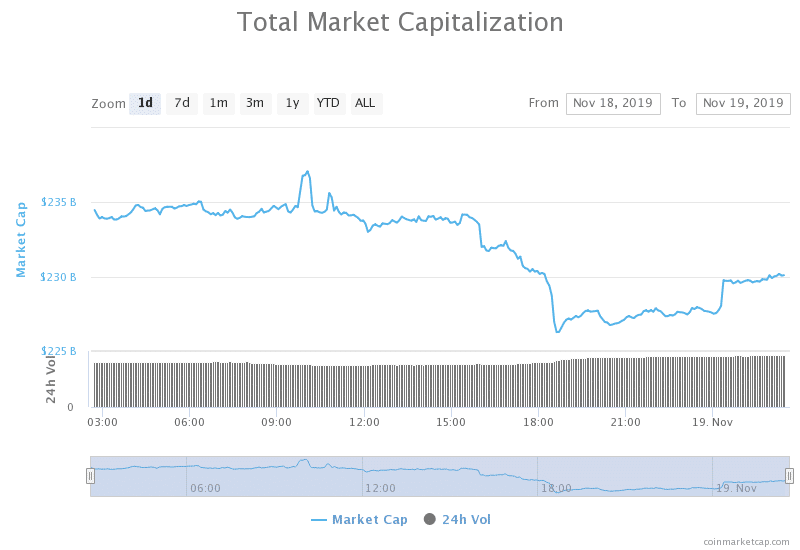
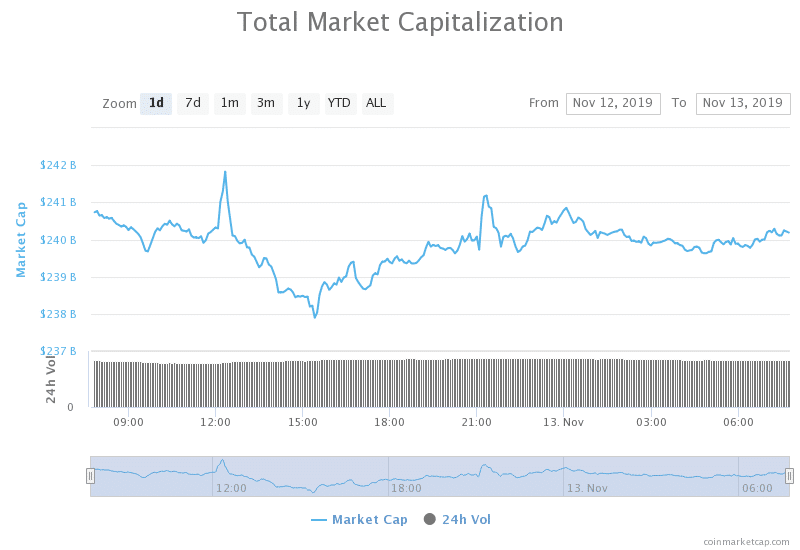
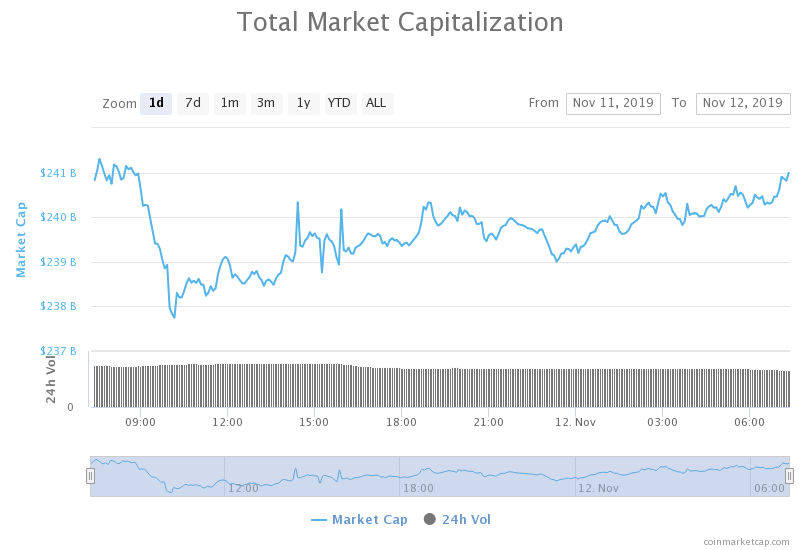
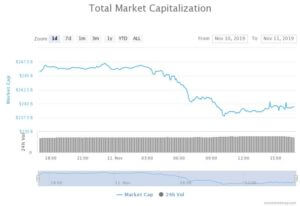
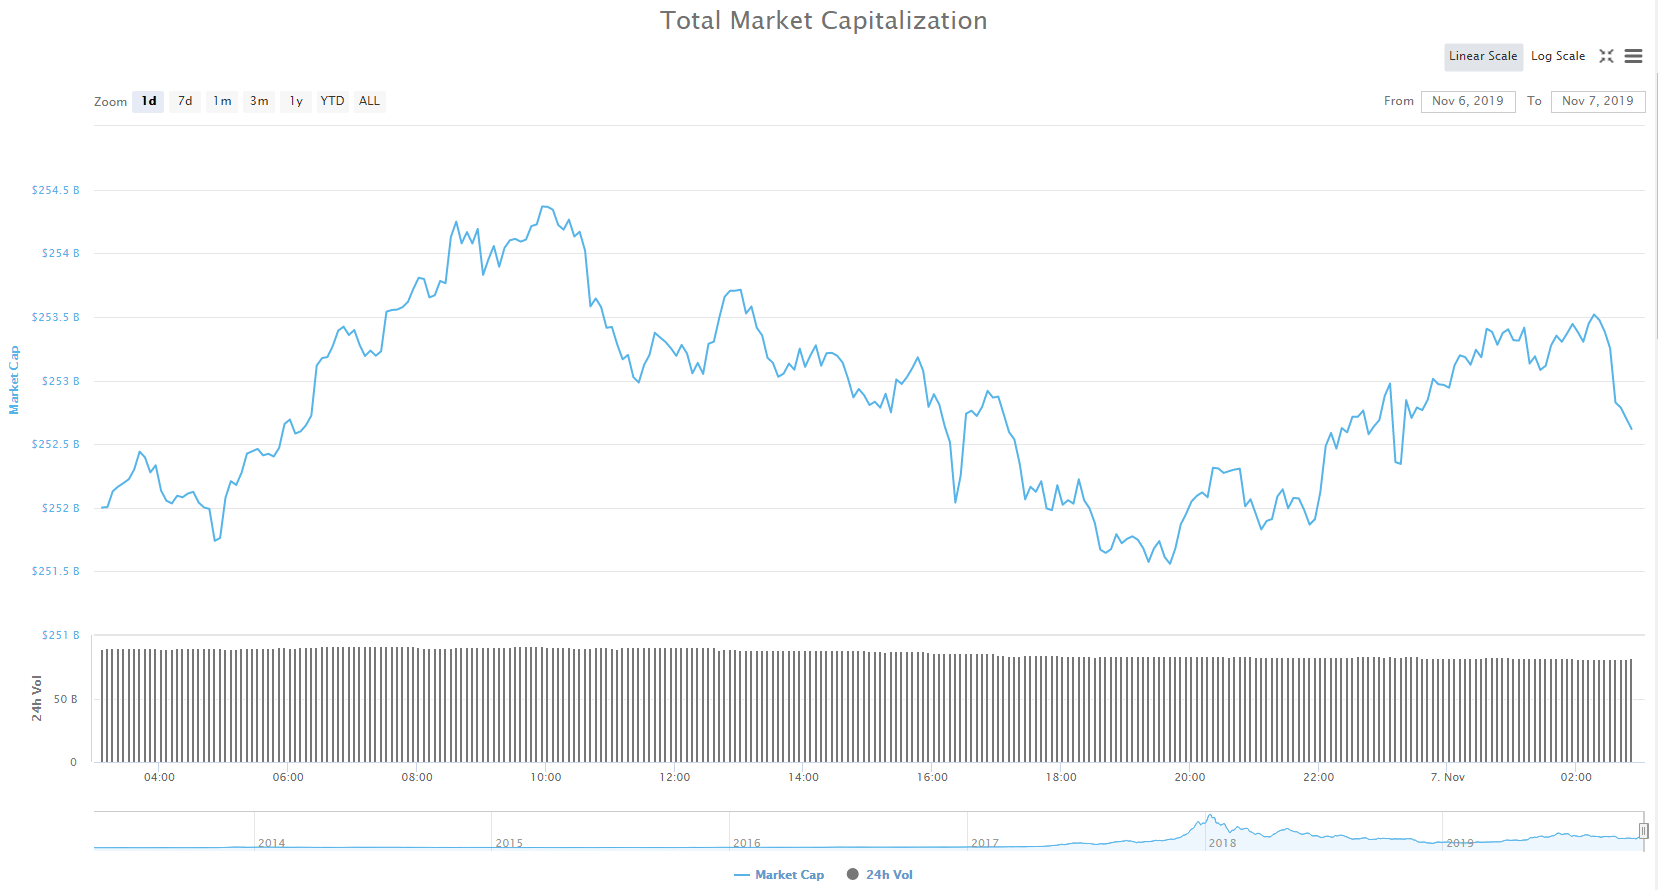
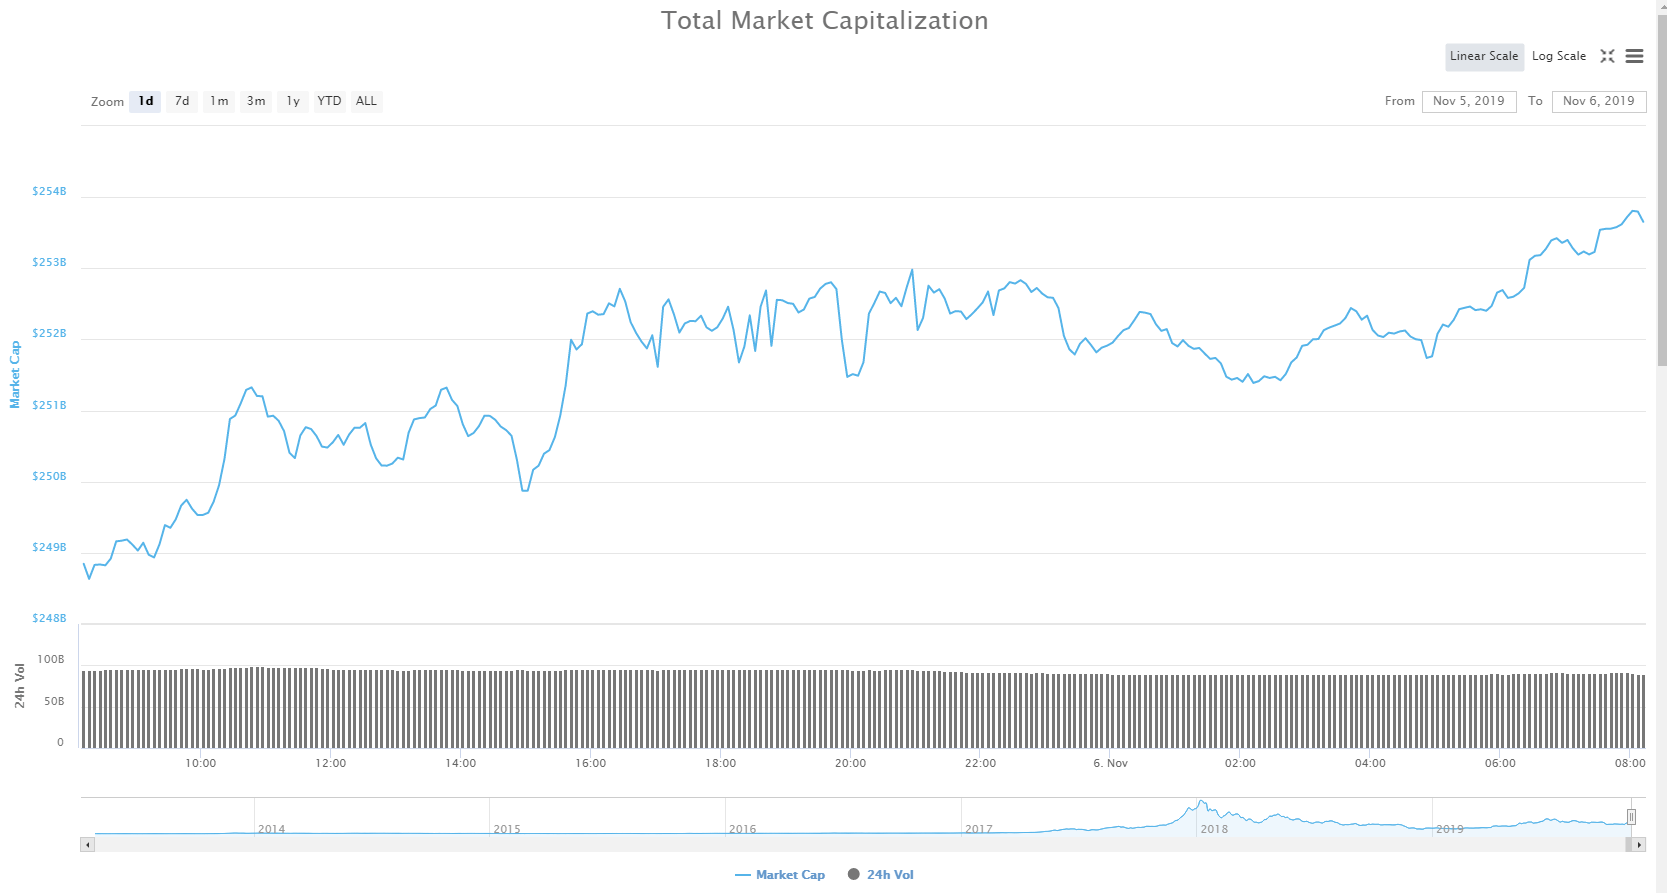
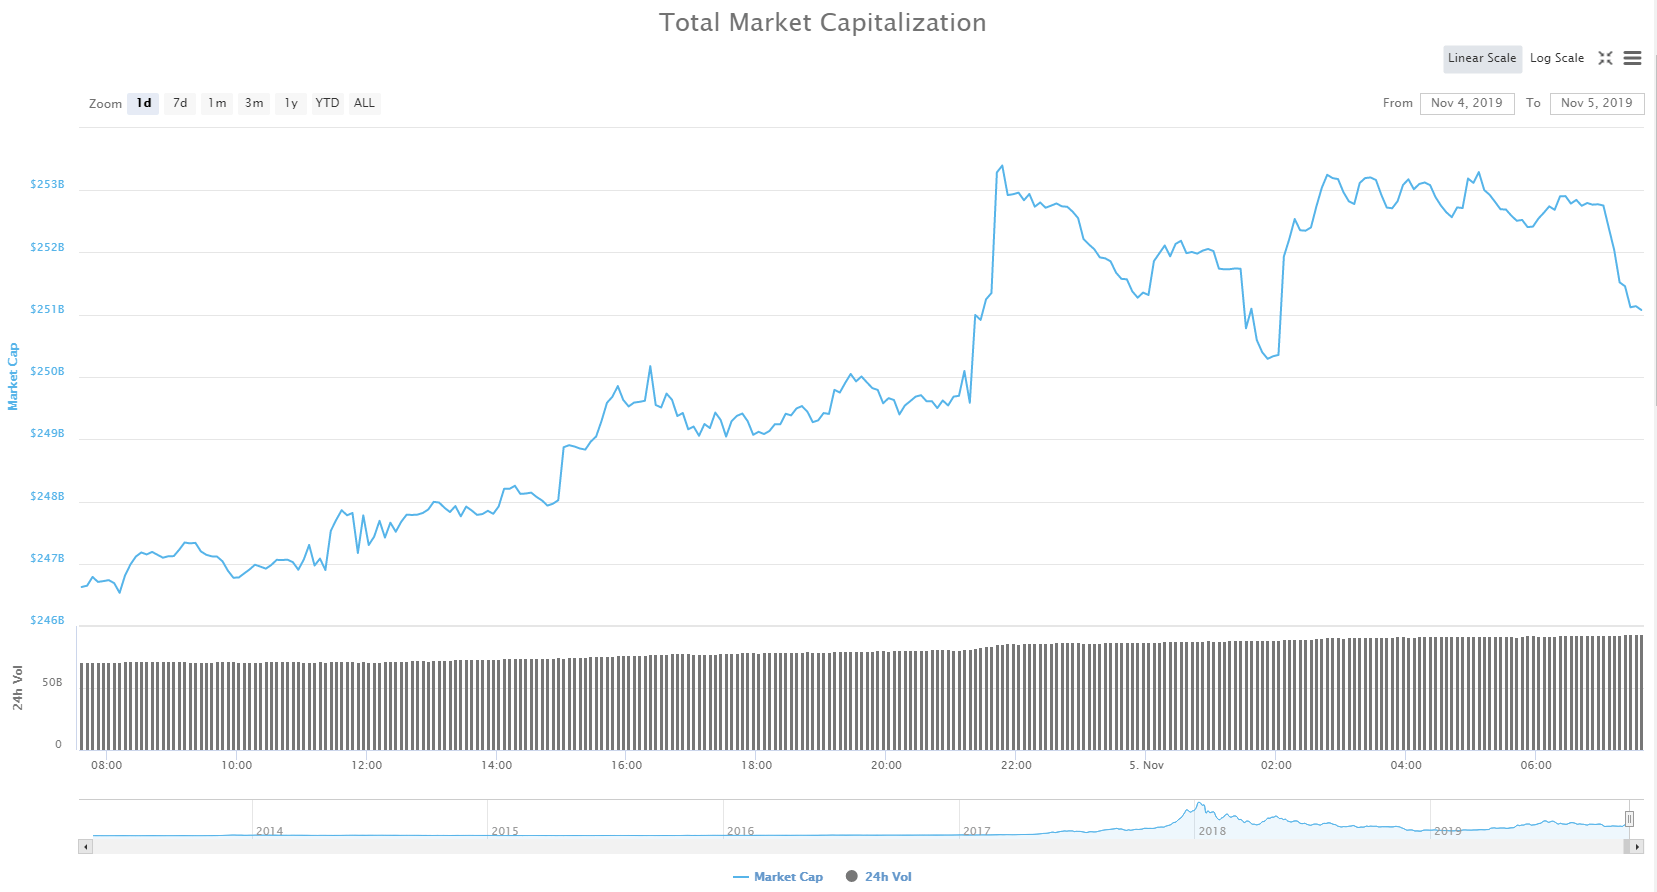
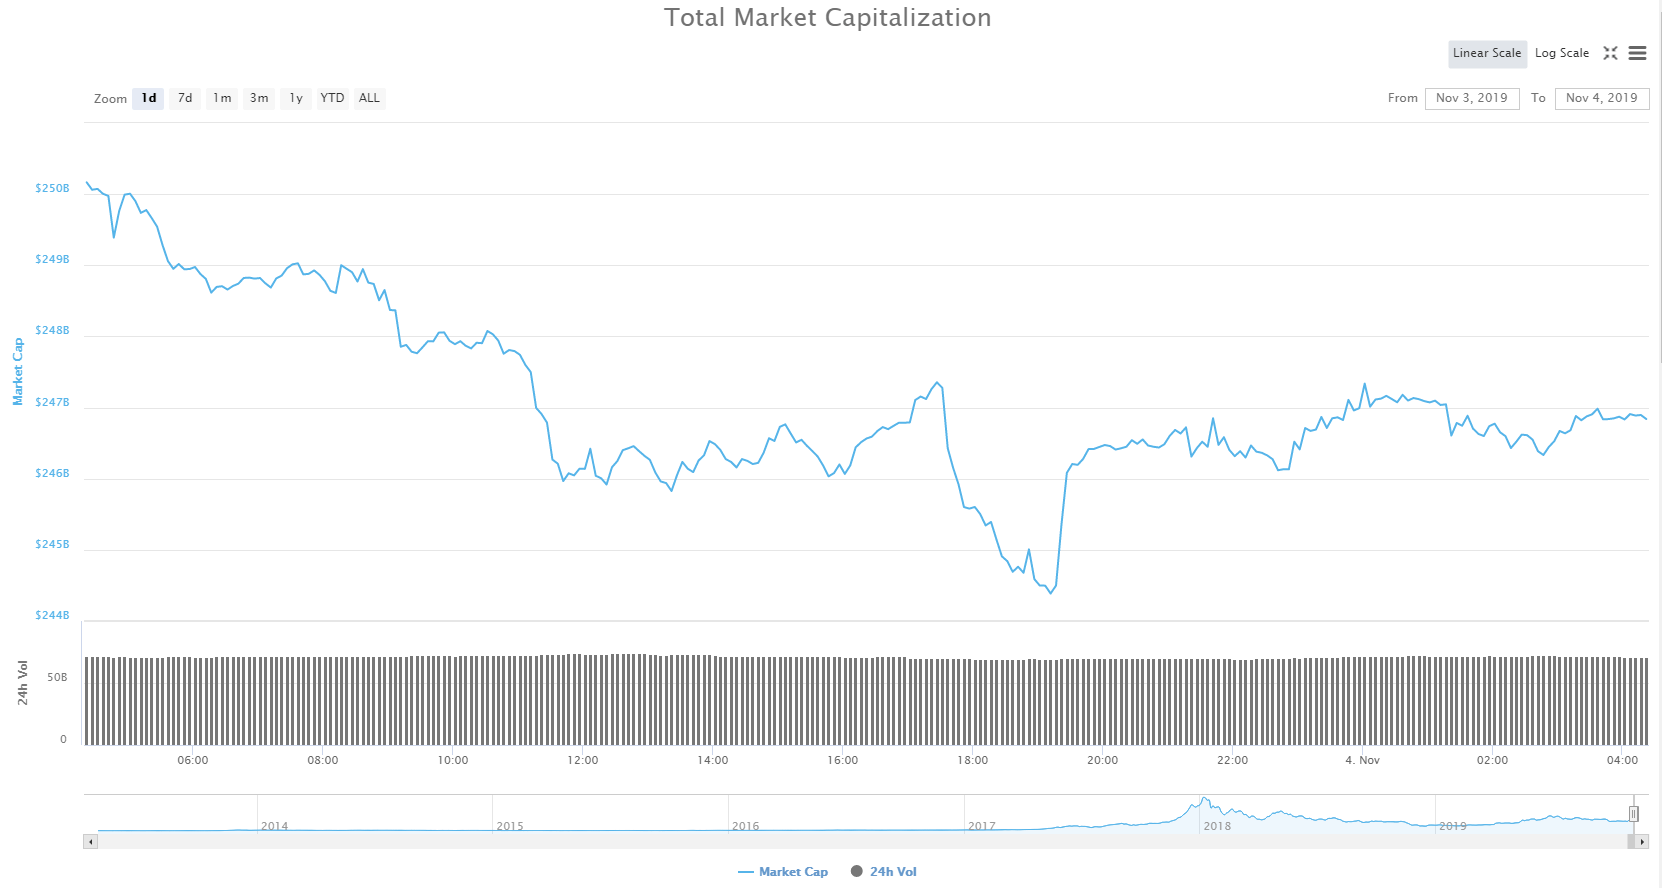
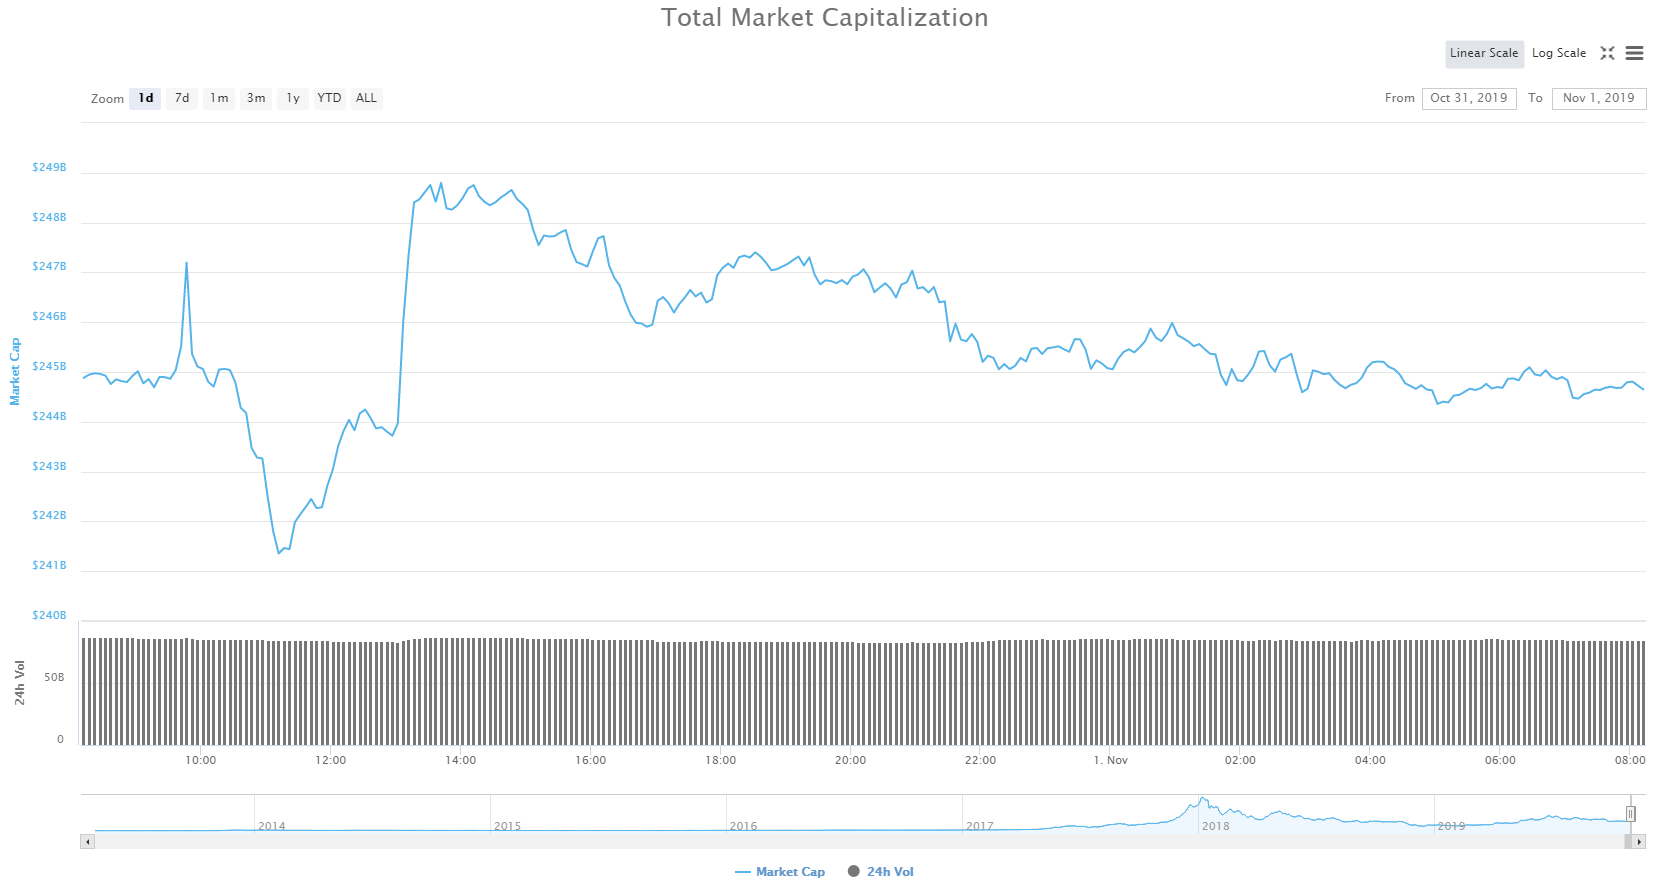
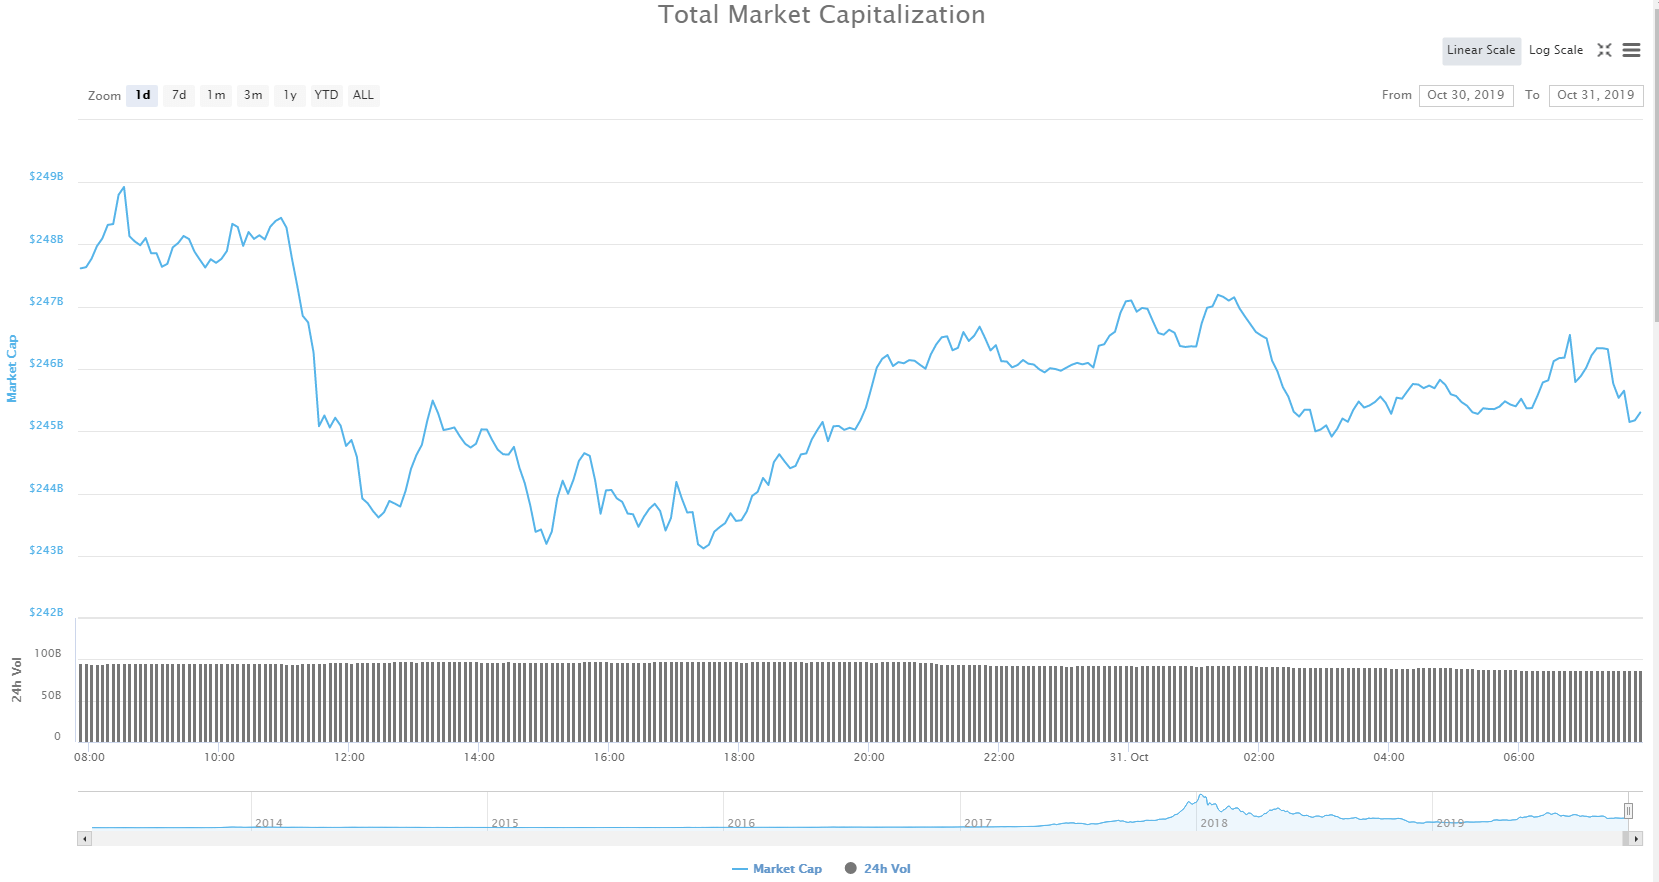
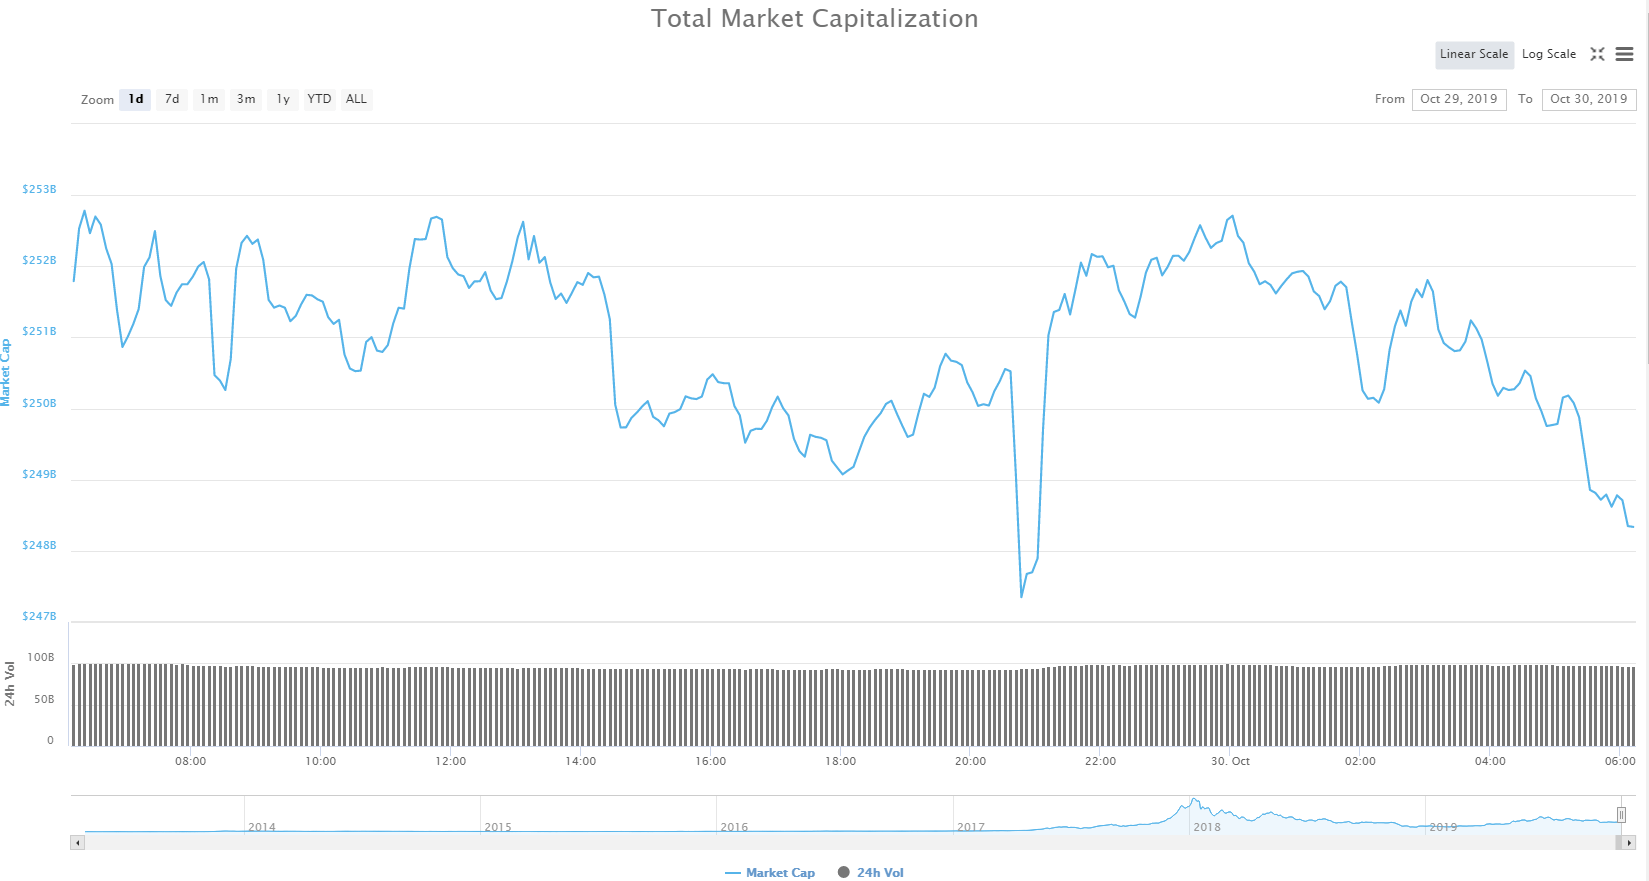
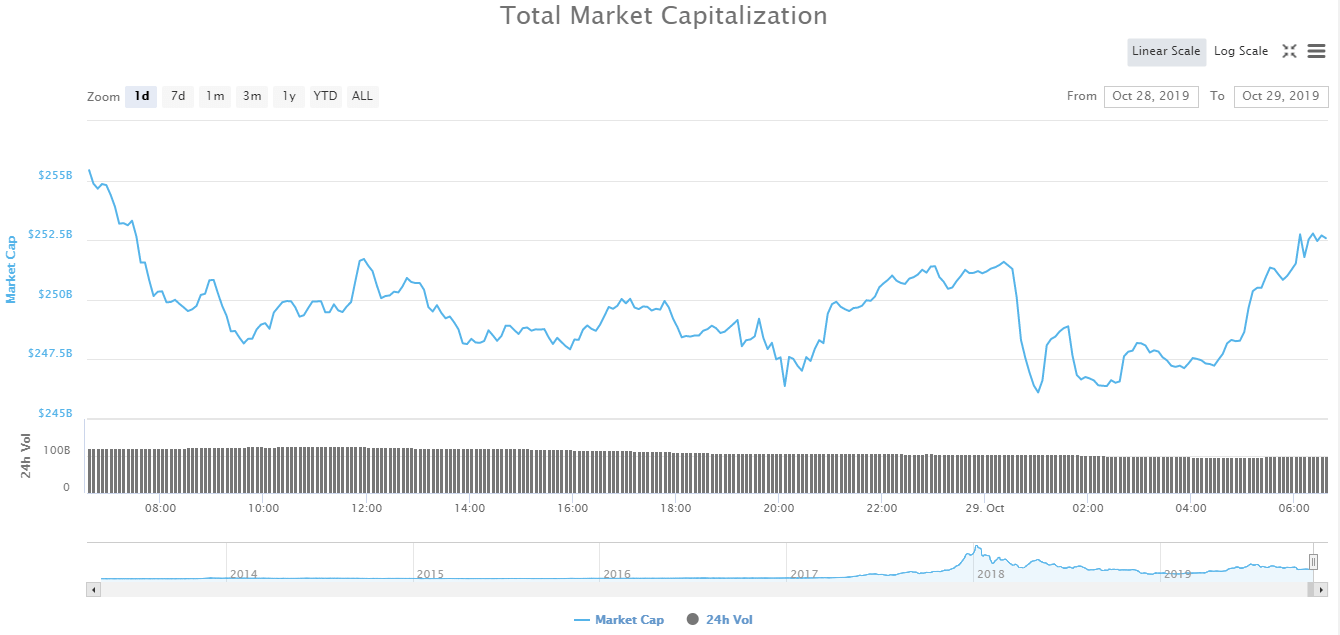
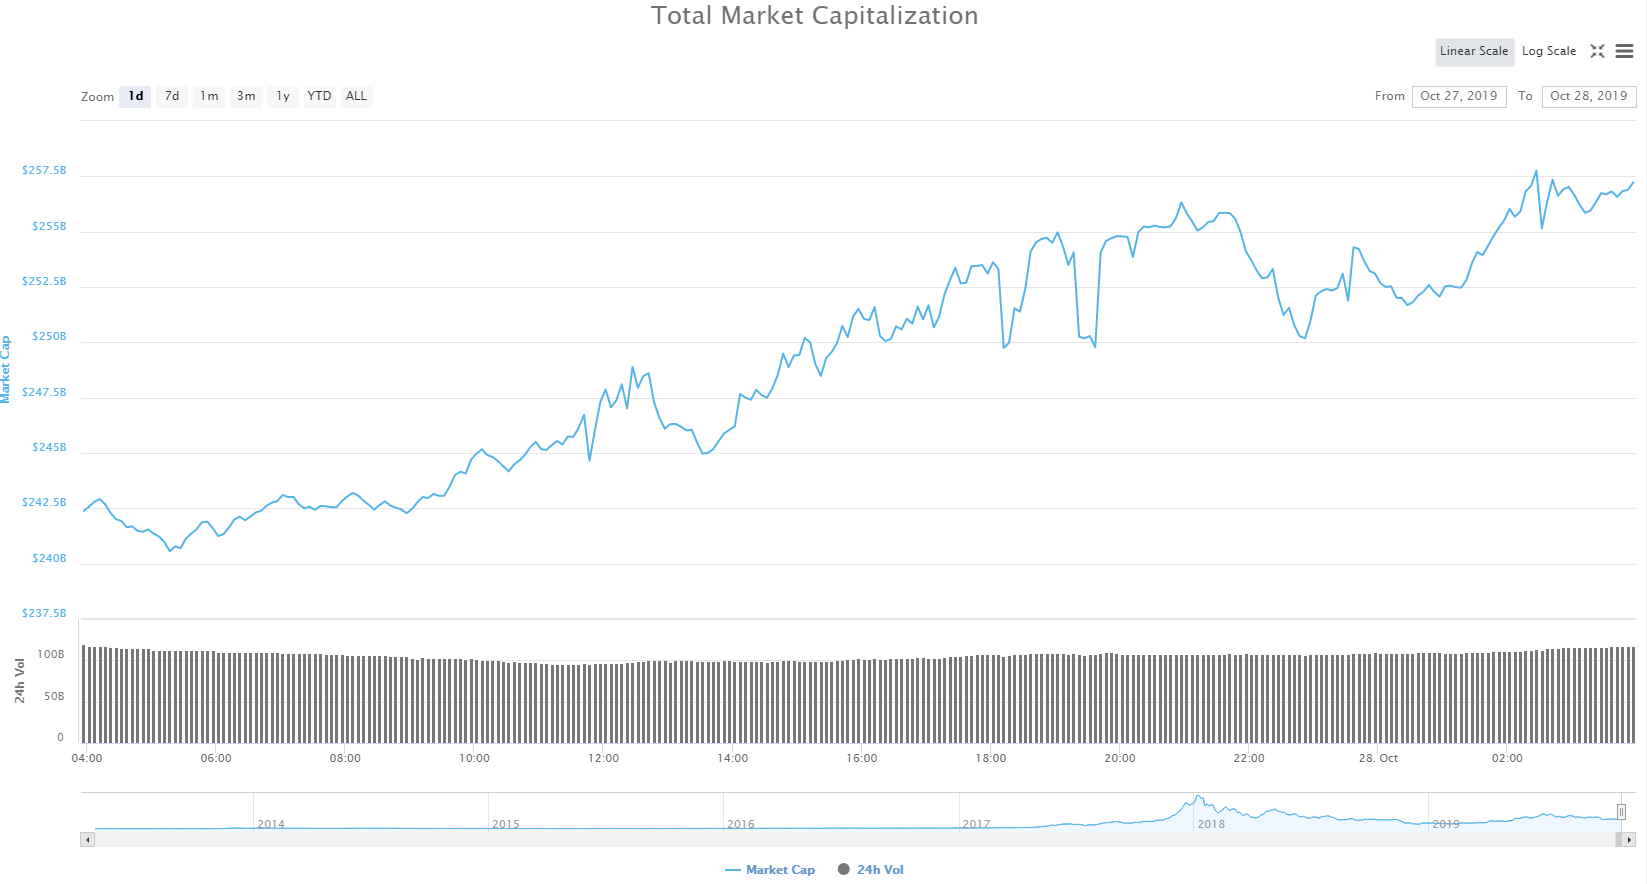
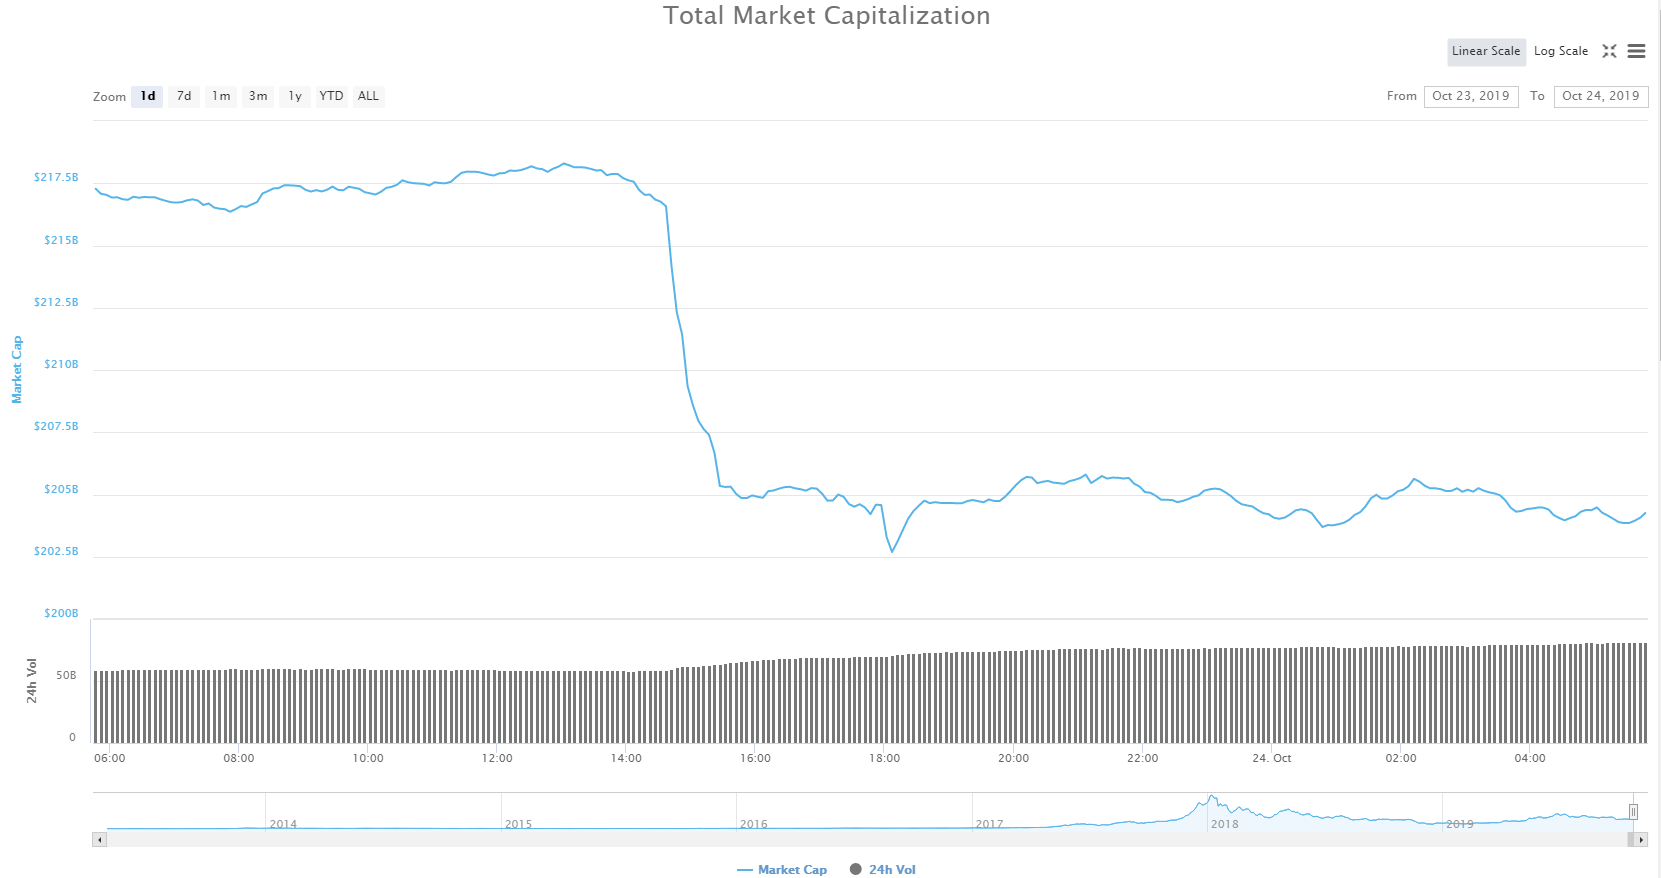
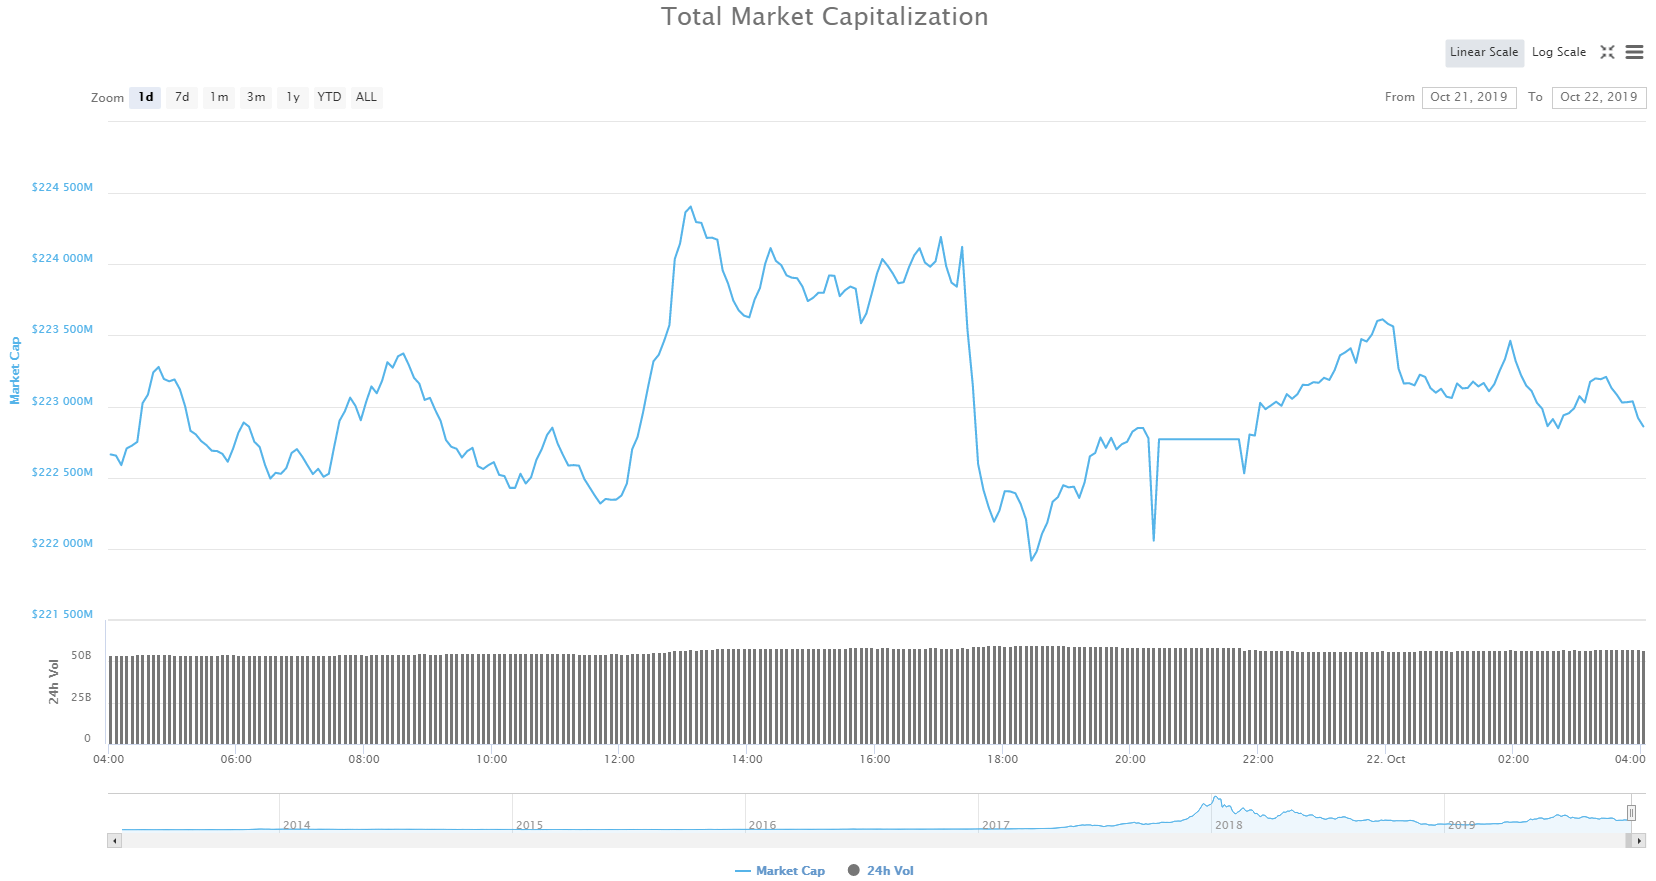
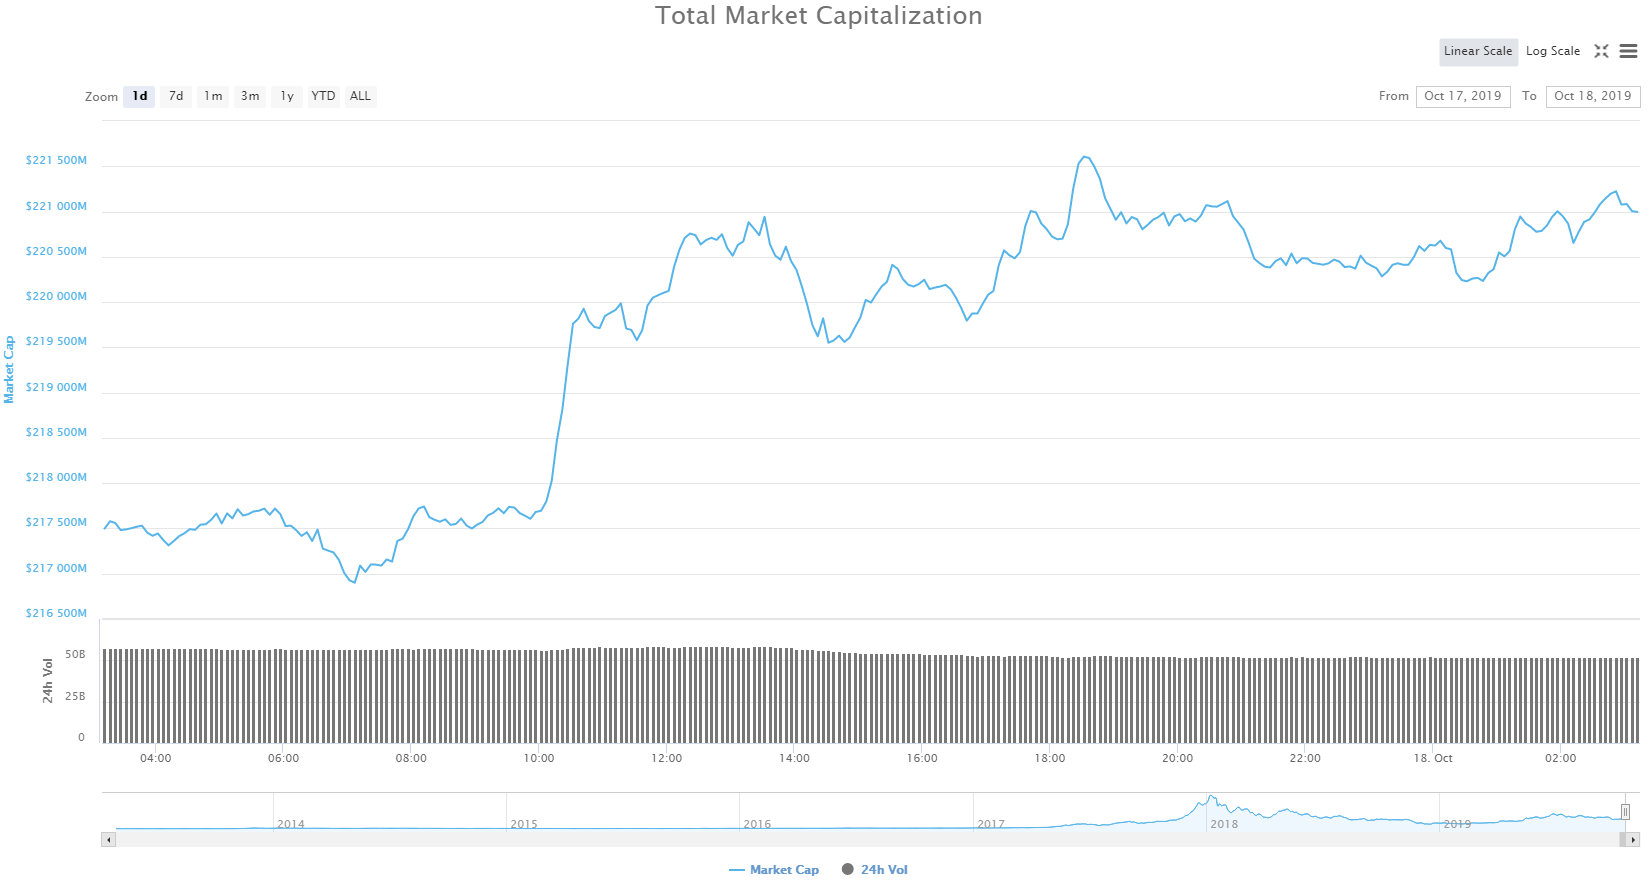
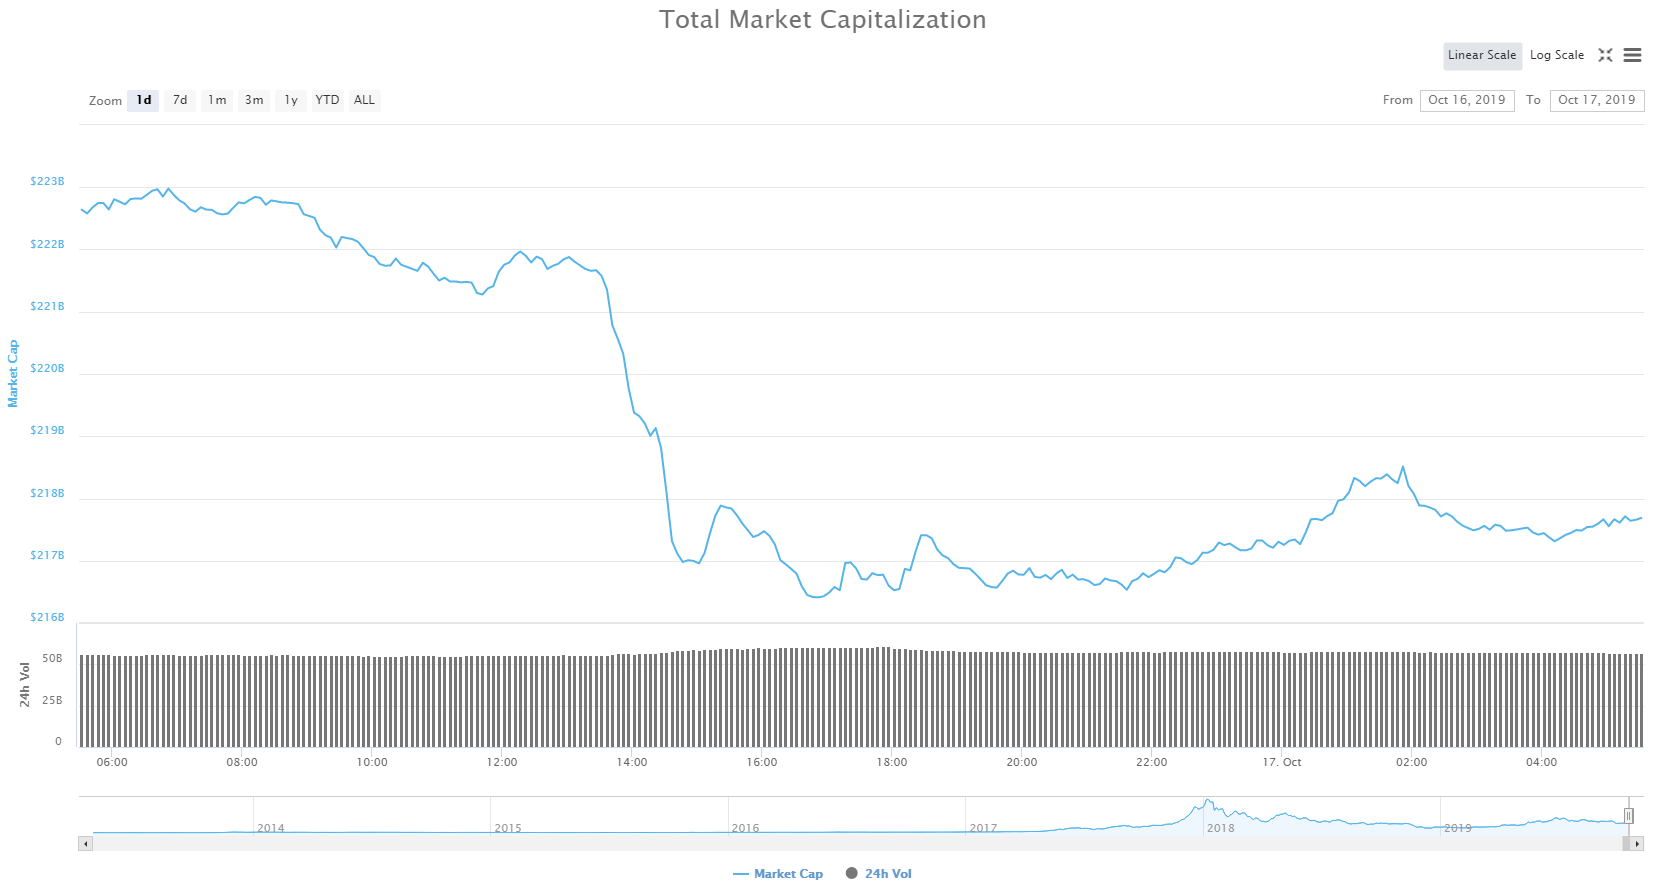
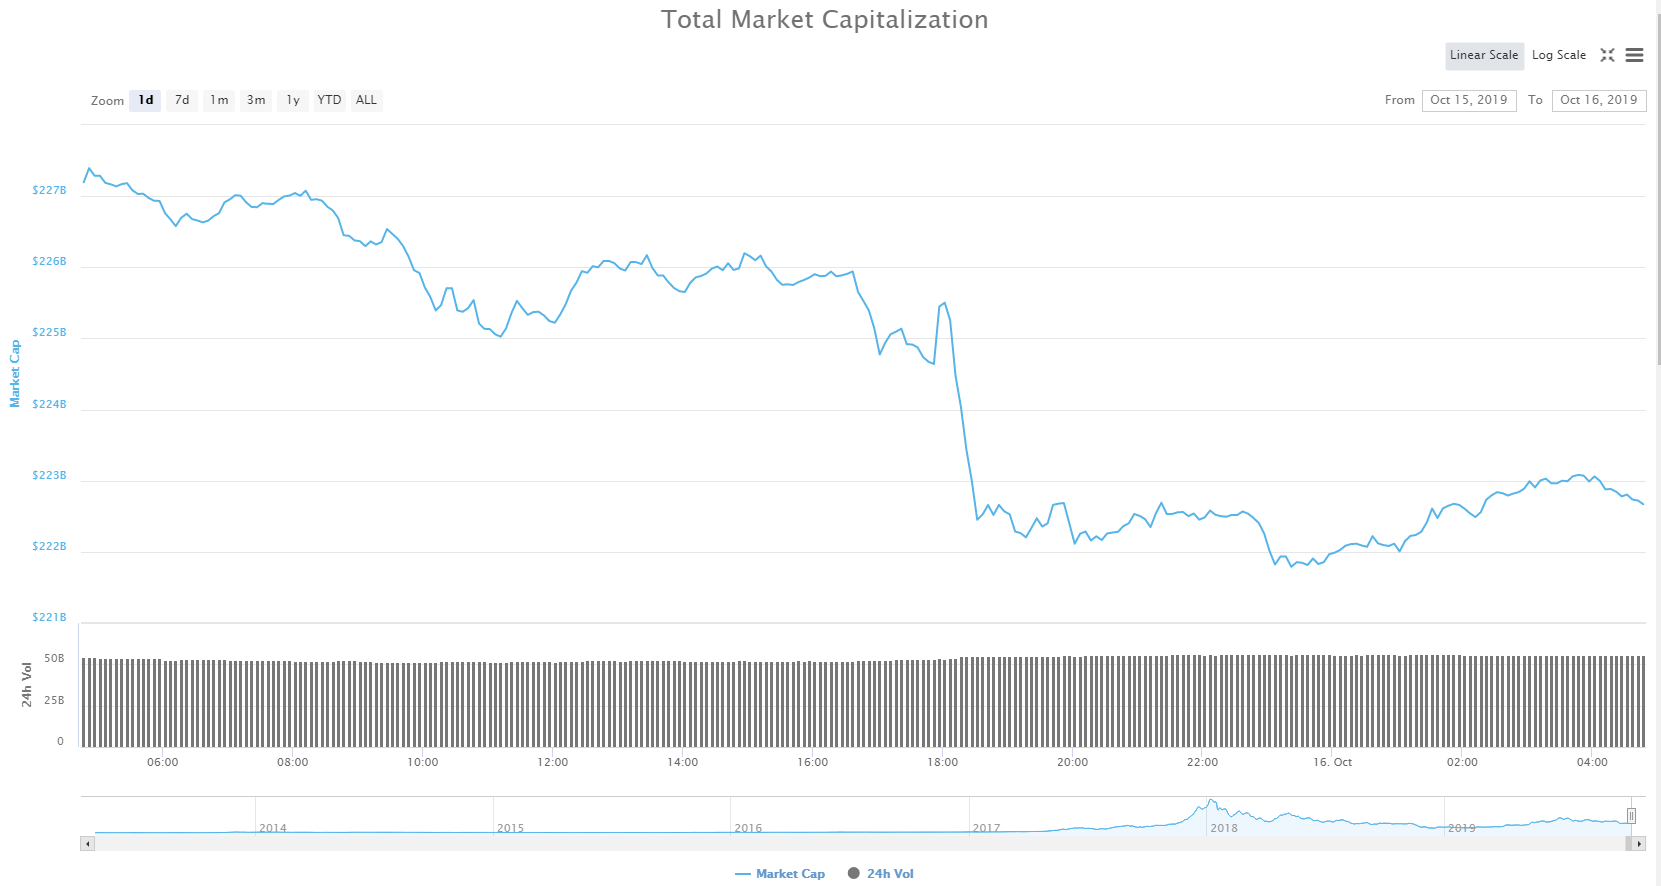
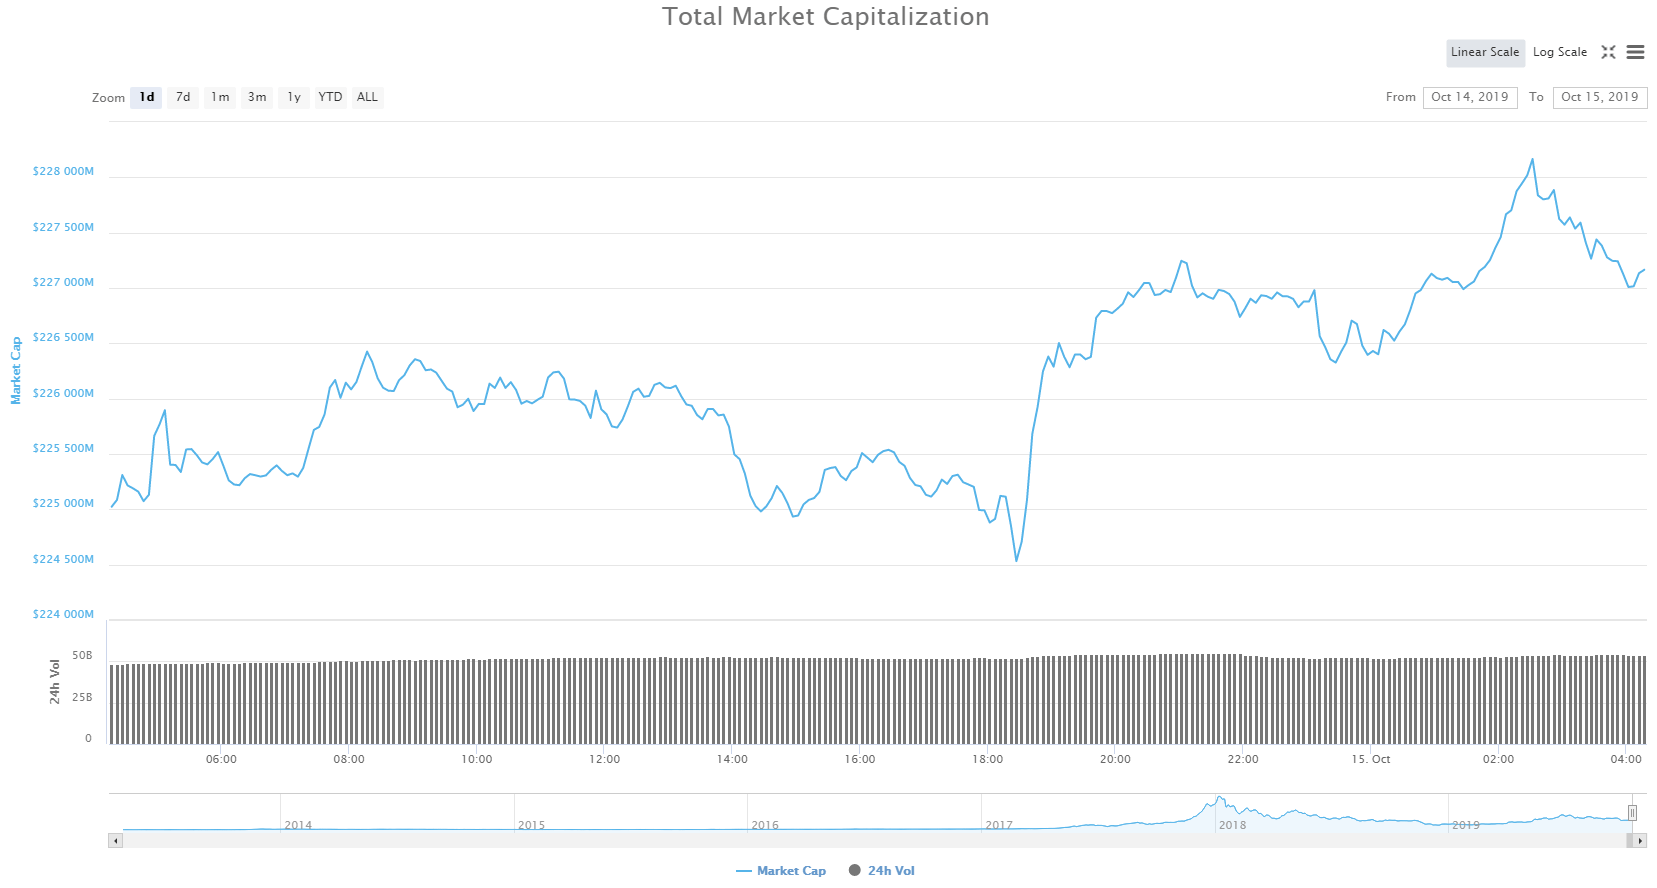
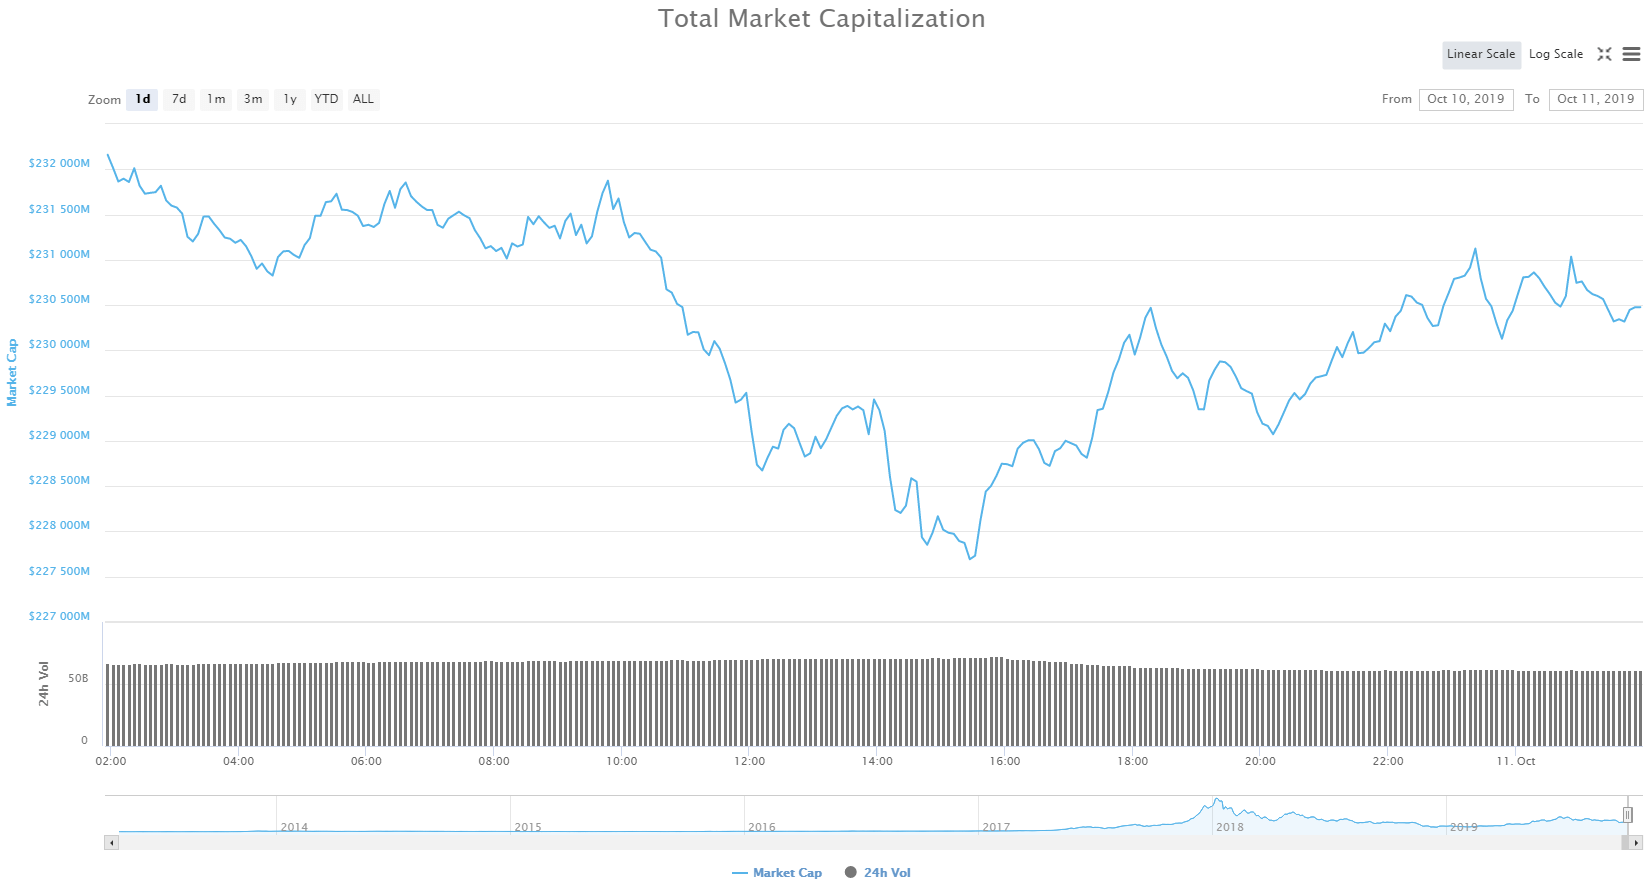
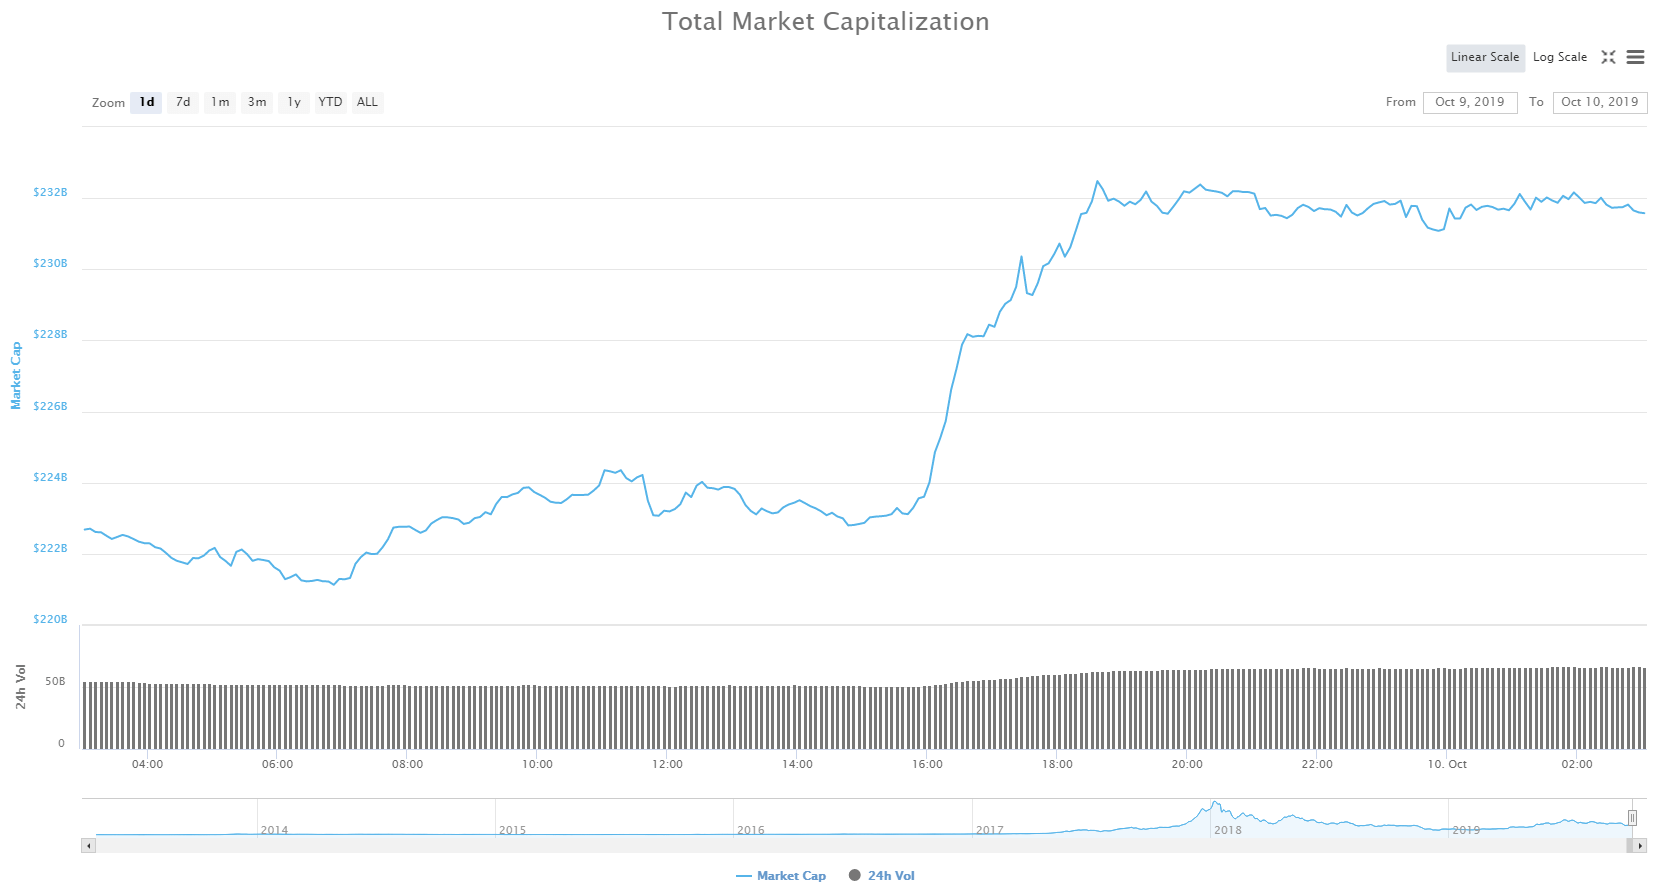
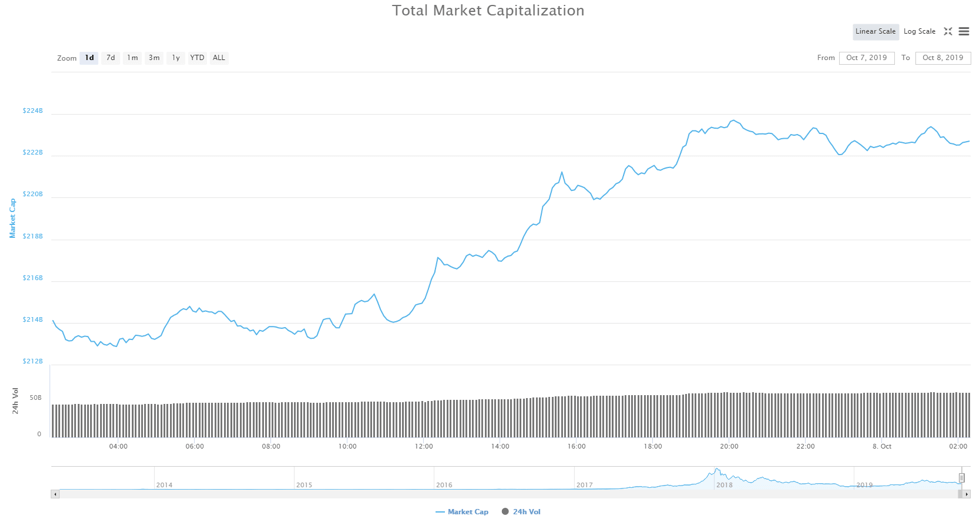
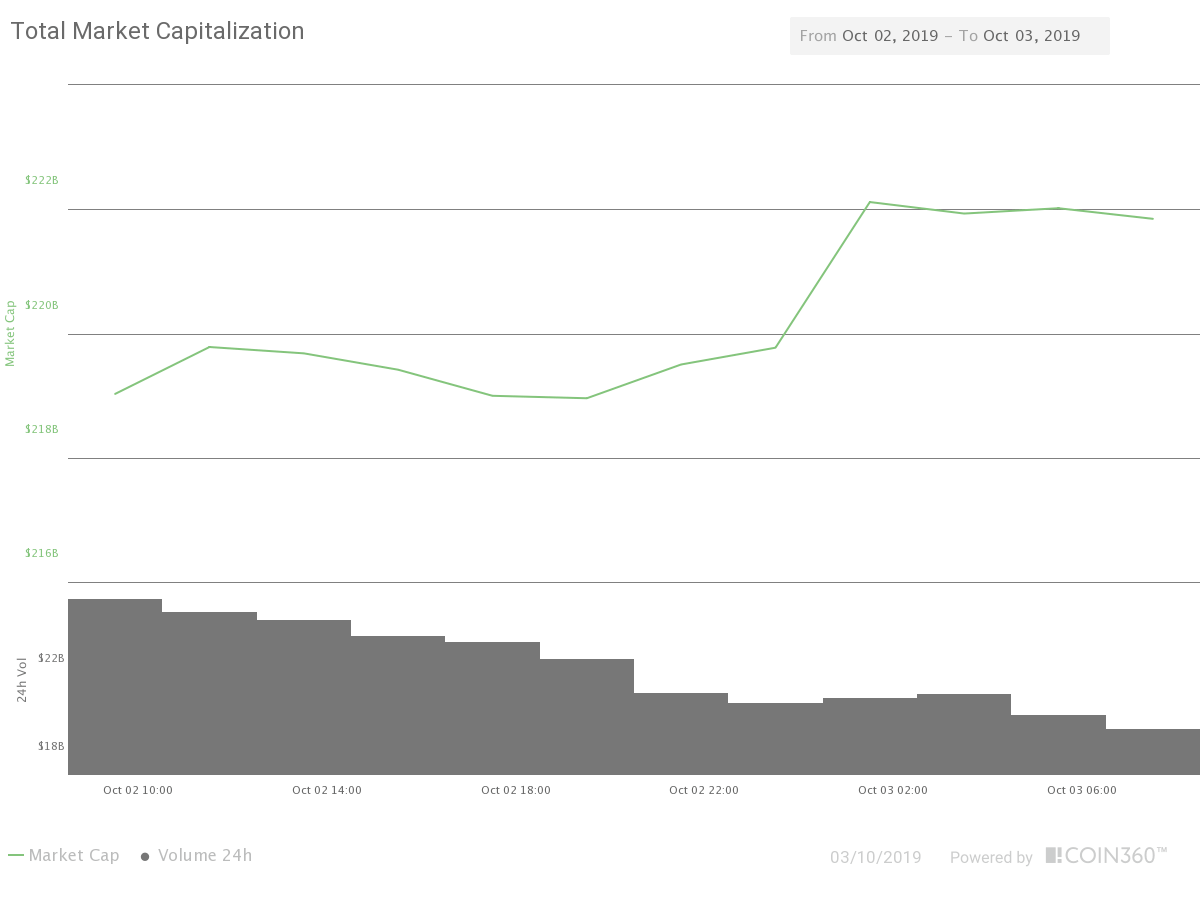
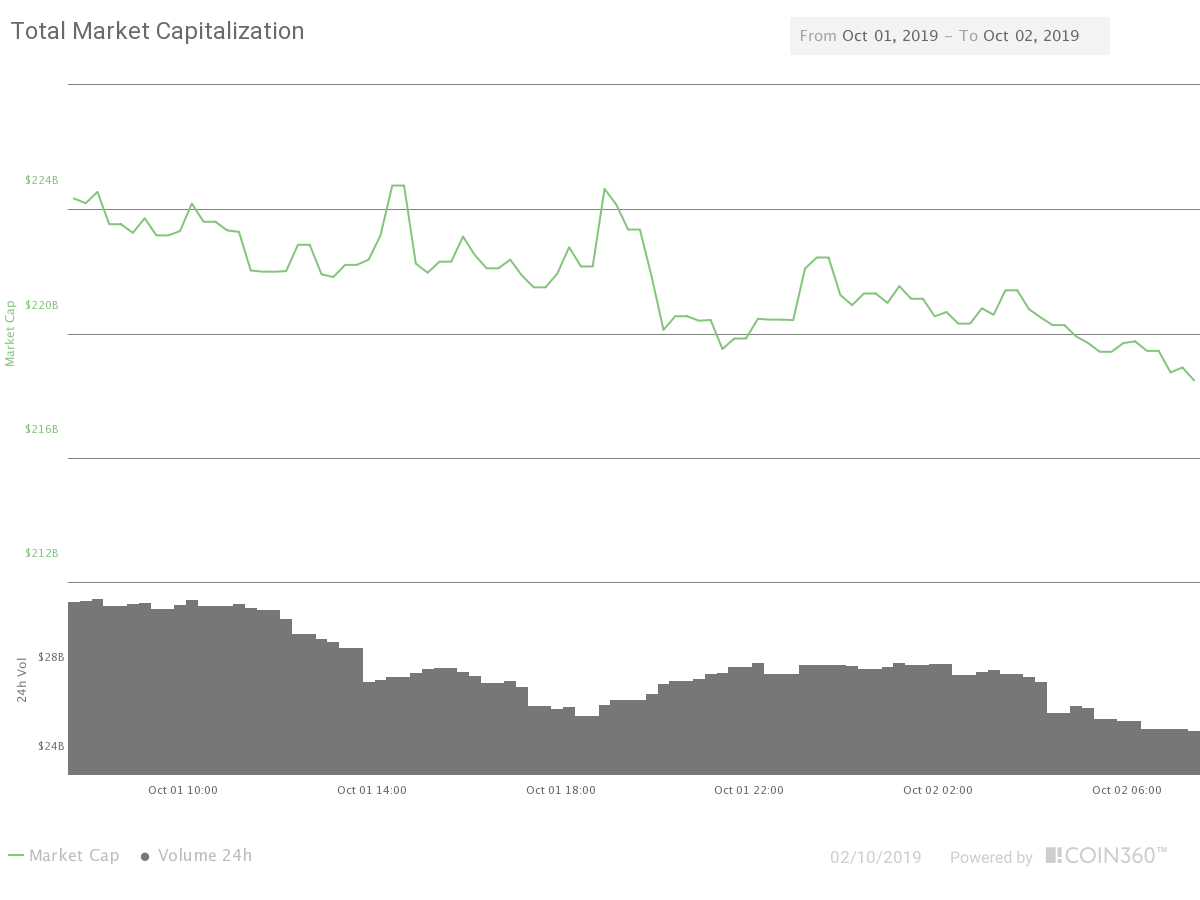
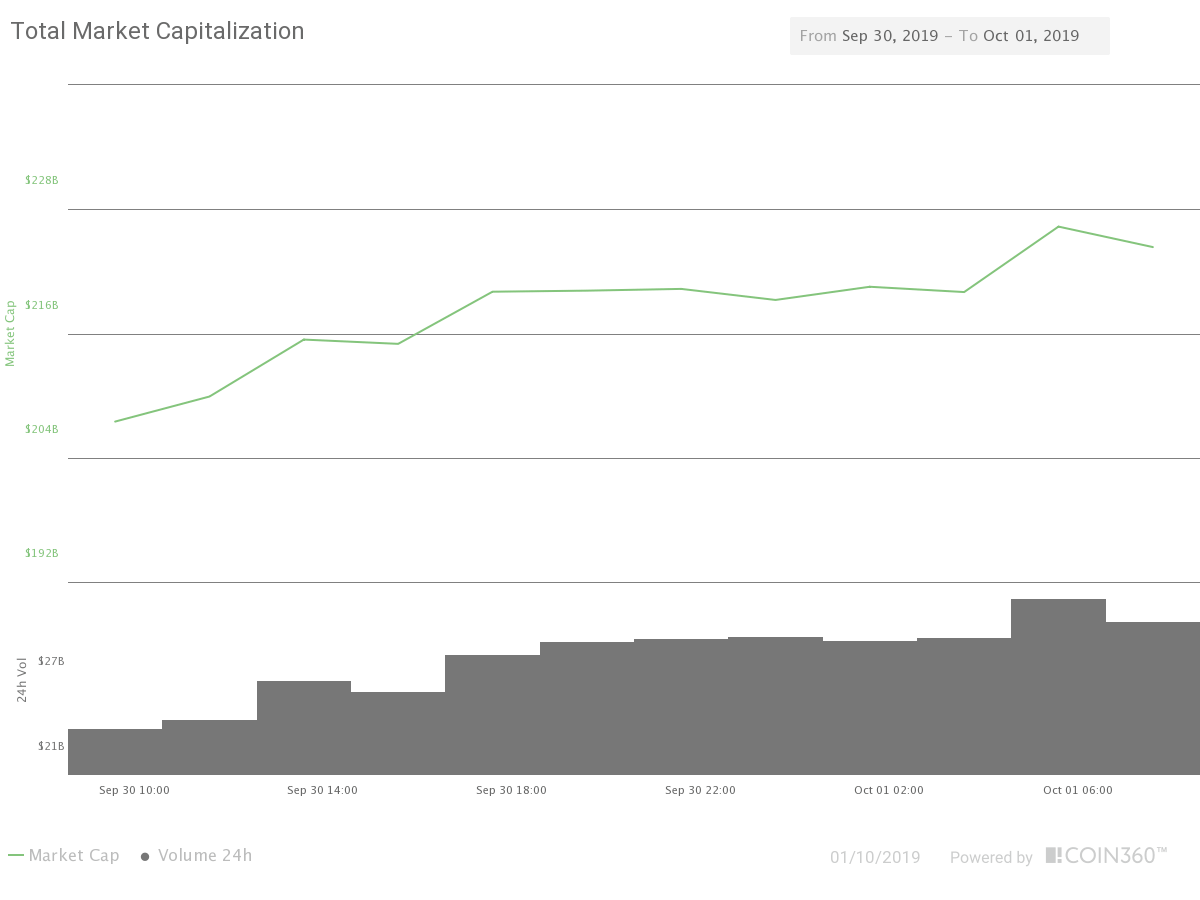
The cryptocurrency market increased its total market capitalization over the weekend. The market cap is currently sitting at $204.19 billion. This value represents an increase of $3.11 billion against the value it had on Friday.
What happened in the past 24 hours
Microsoft Azure, Microsoft’s blockchain-based cloud service, posted an announcement of their new tokenization and blockchain data management services.
This news were posted on the official Microsoft Azure. Microsoft Azure also announced their non-fungible blockchain tokens called “Azure Heroes”, which are aimed at rewarding its developer community.
_______________________________________________________________________
Technical analysis
_______________________________________________________________________
Bitcoin
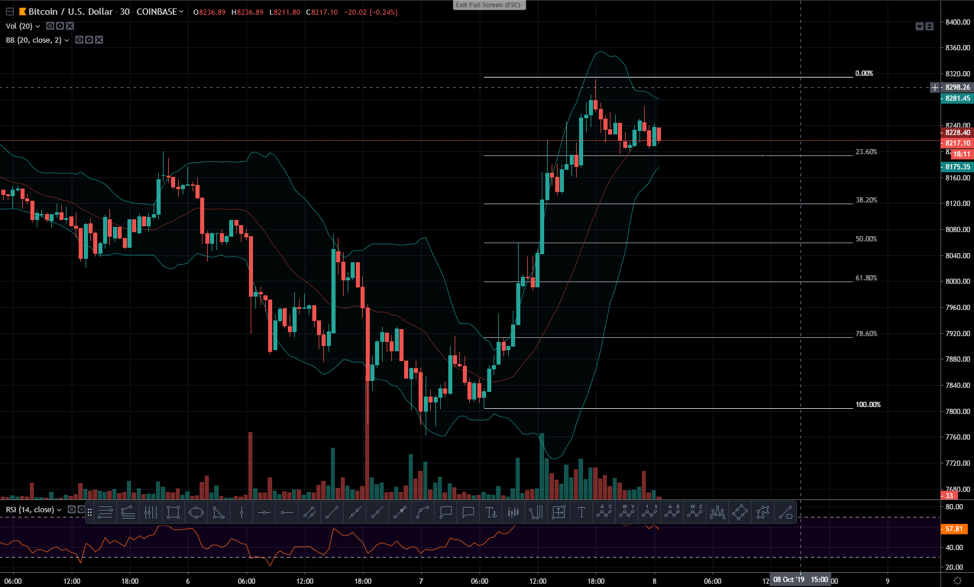
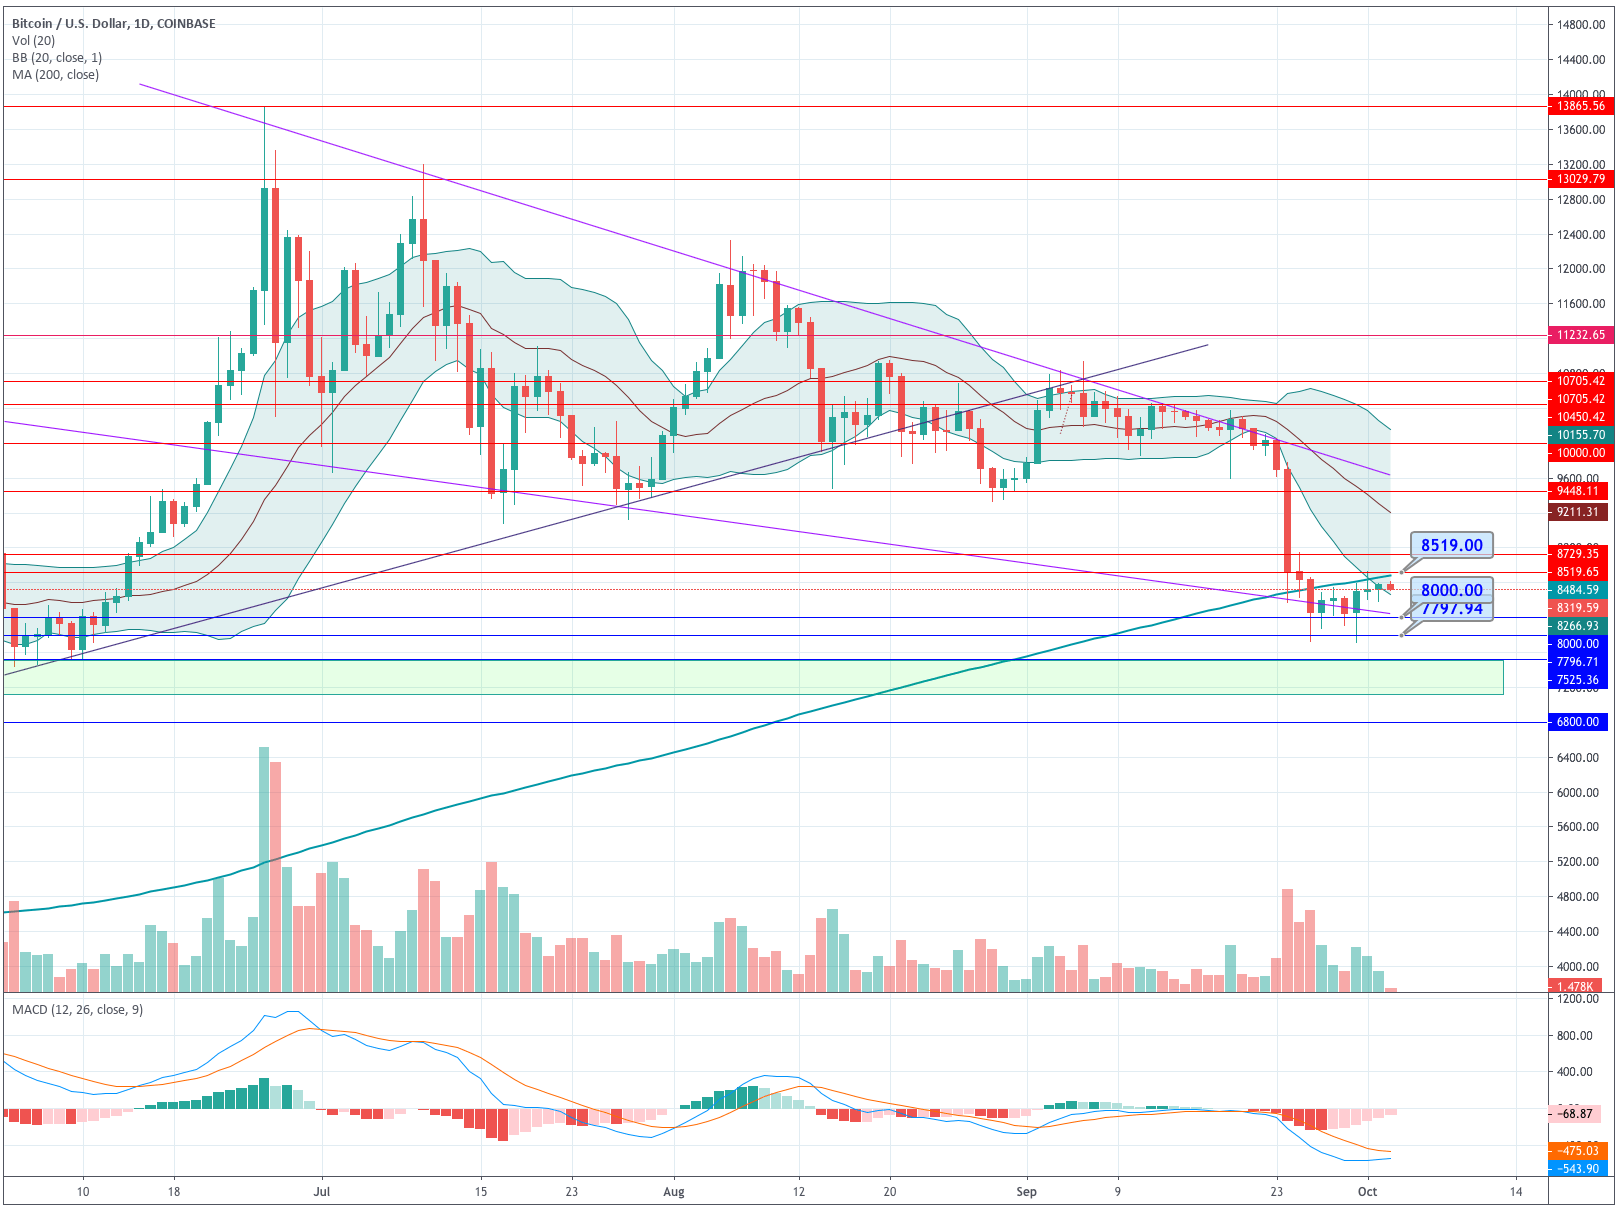
Bitcoin has had an amazing weekend if we look at it from a price perspective. The biggest cryptocurrency managed to rally its bulls and break its $7,415 resistance to the upside. The price got retested on Sunday, but the now-turned resistance level held up and managed to keep Bitcoin’s price above.
Bitcoin is currently decreasing in volume, with its RSI levels dangerously close to the overbought territory. However, the short-term outlook is still slightly bullish.
Key levels to the upside Key levels to the downside
1: $7,565 1: $7,415
2: $7,828 2: $7,240
3: $8,000 3: $7,120
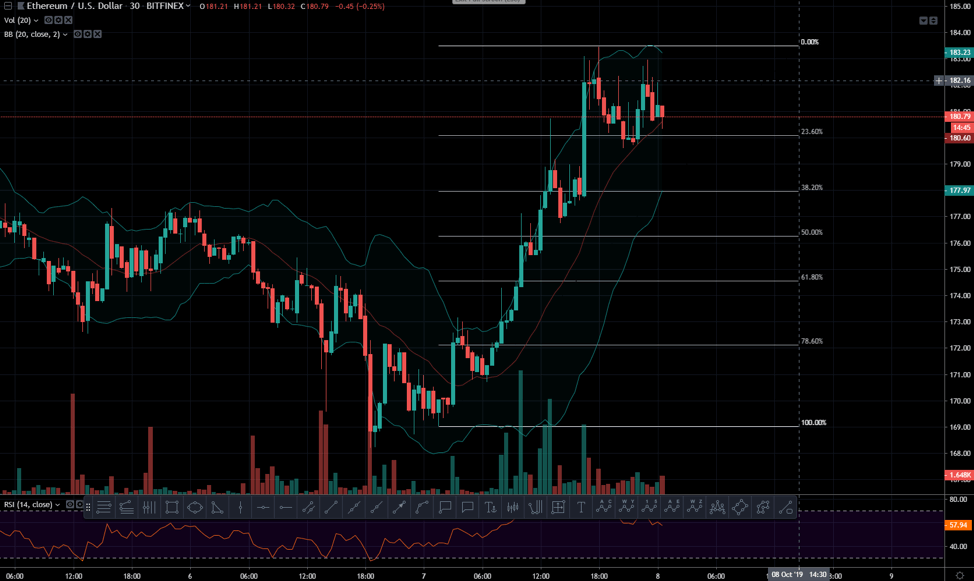
Ethereum
Ethereum has followed Bitcoin’s bull rally and gained value yet again. After a long struggle and indecisiveness of whether ETH will go up above $150.5 or below $144, bulls stepped in and brought the price above the resistance. Ethereum had a small level retesting, which the resistance held up. However, the real test of the newly formed resistance might be ahead.
Ethereum is, just like Bitcoin, slowly dropping in volume while its RSI is approaching overbought levels.
Key levels to the upside Key levels to the downside
1: $155.8 1: $150.5
2: $161.1 2: $144.1
3: $163.4 3: $133.5
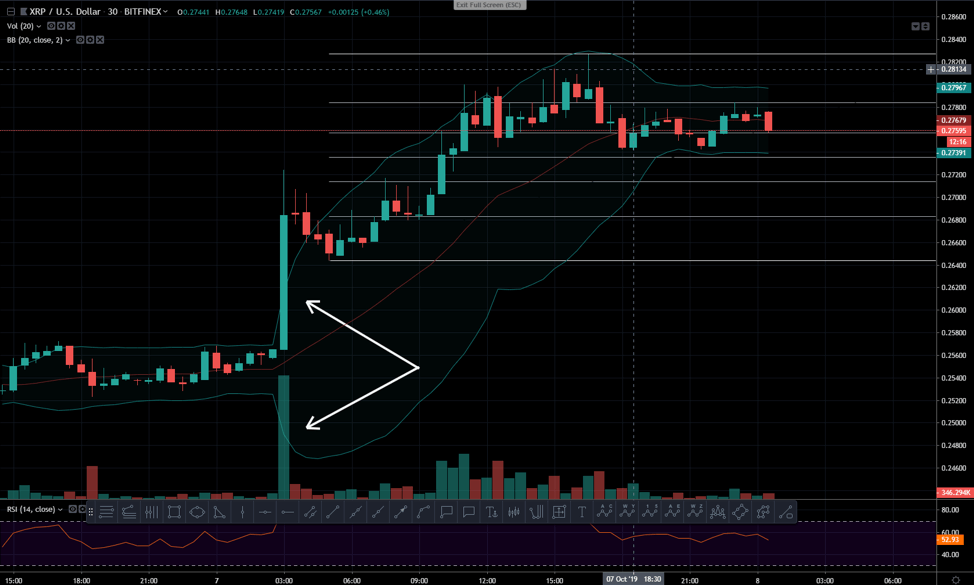
Ripple
XRP is on a short-term bull run. It was the best performing cryptocurrency out of the top 3 cryptos for a solid week. XRP had a great weekend as well, managing to pass several resistance levels. After passing above the $0.222 level, its price continued upwards and passed the $0.2267 level as well. It even attempted to get above the $0.234 price level, but this is where it got stopped. Its price is currently on a small downturn, which may indicate a retest of $0.2267 level to determine its strength as a resistance level.
XRP’s volume is much higher when compared to its value before the weekend. It is, however, dropping just like the rest of the top3 cryptocurrencies. Its RSI almost touched the overbought territory, but bounced back and is now in a small downtrend.
Key levels to the upside Key levels to the downside
1: $0.234 1: $0.2267
2: $0.2351 2: $0.222
3: $0.242 3: $0.2185


 The current market sentiment for Bitcoin is positive, meaning 70% out of 85 mentions in total are positive.
 Pivot points:
 The current market sentiment for Ethereum is positive, meaning 78% out of total 97 mentions are positive.


 The current market sentiment for Ripple is slightly positive, meaning 69% of 42 mentions in total are positive.
 Pivot points:


