Categories
Forex Market Analysis

Daily F.X. Analysis, September 02 – Top Trade Setups In Forex – Eyes on ADP Non-Farm Employment! 

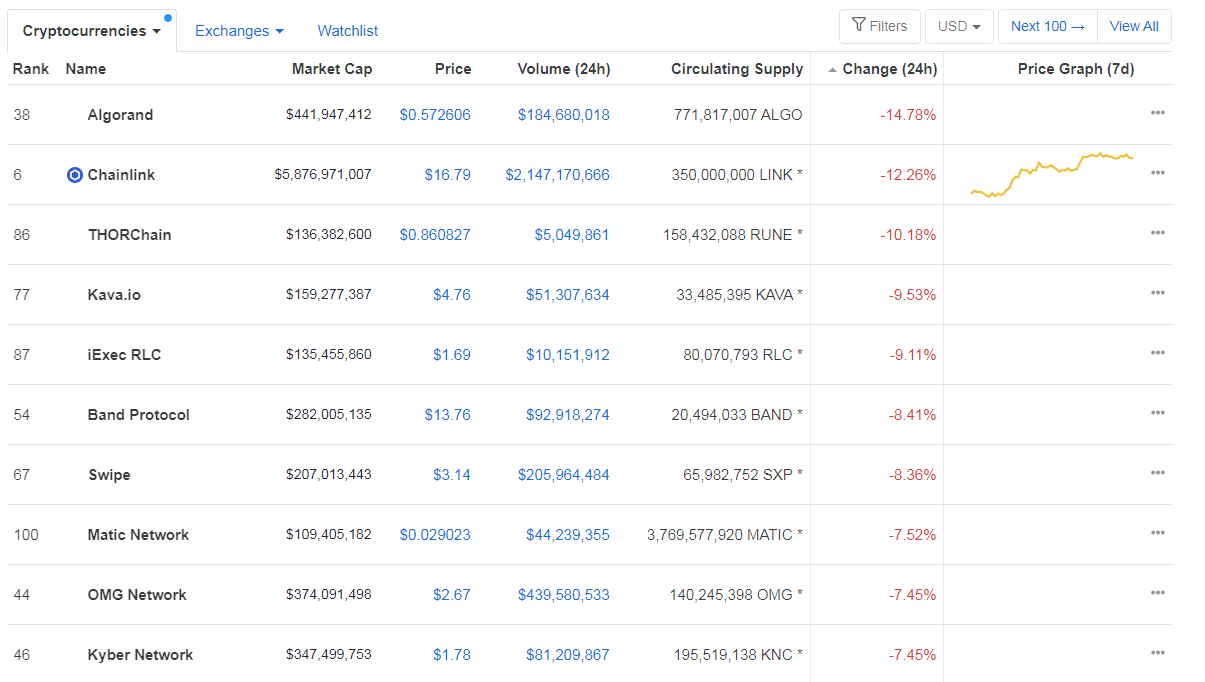
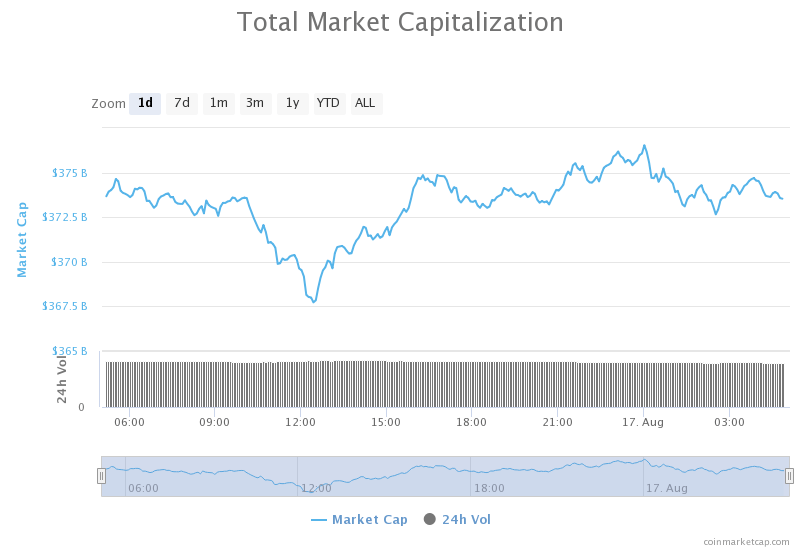
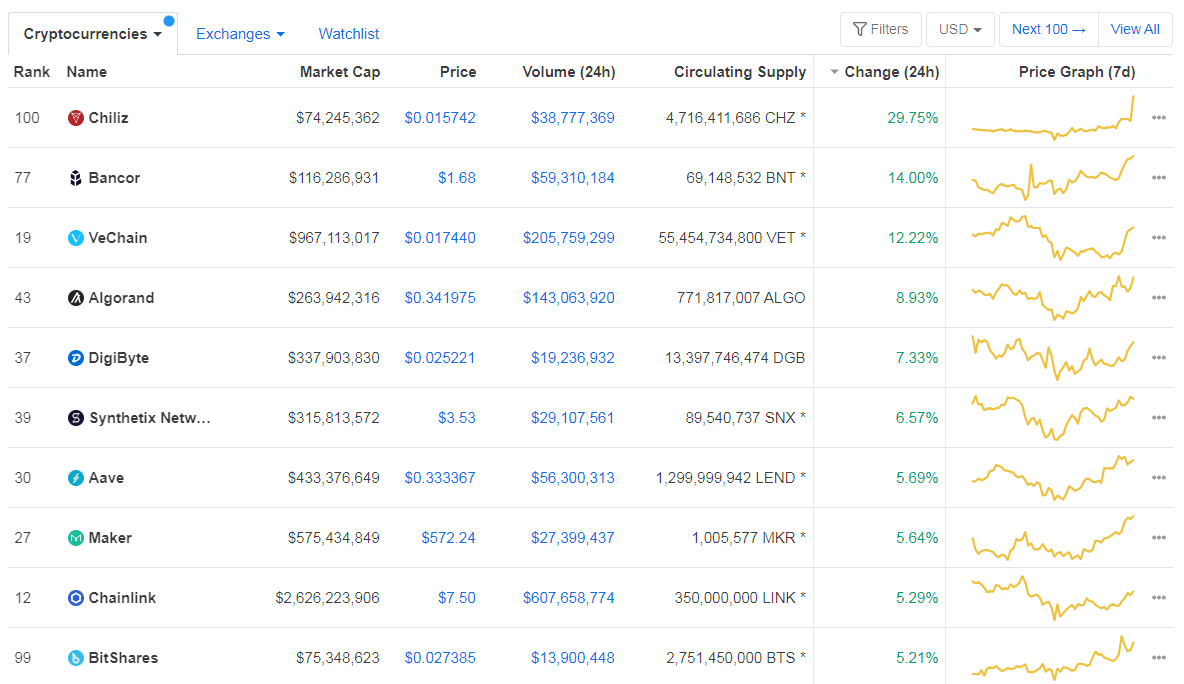
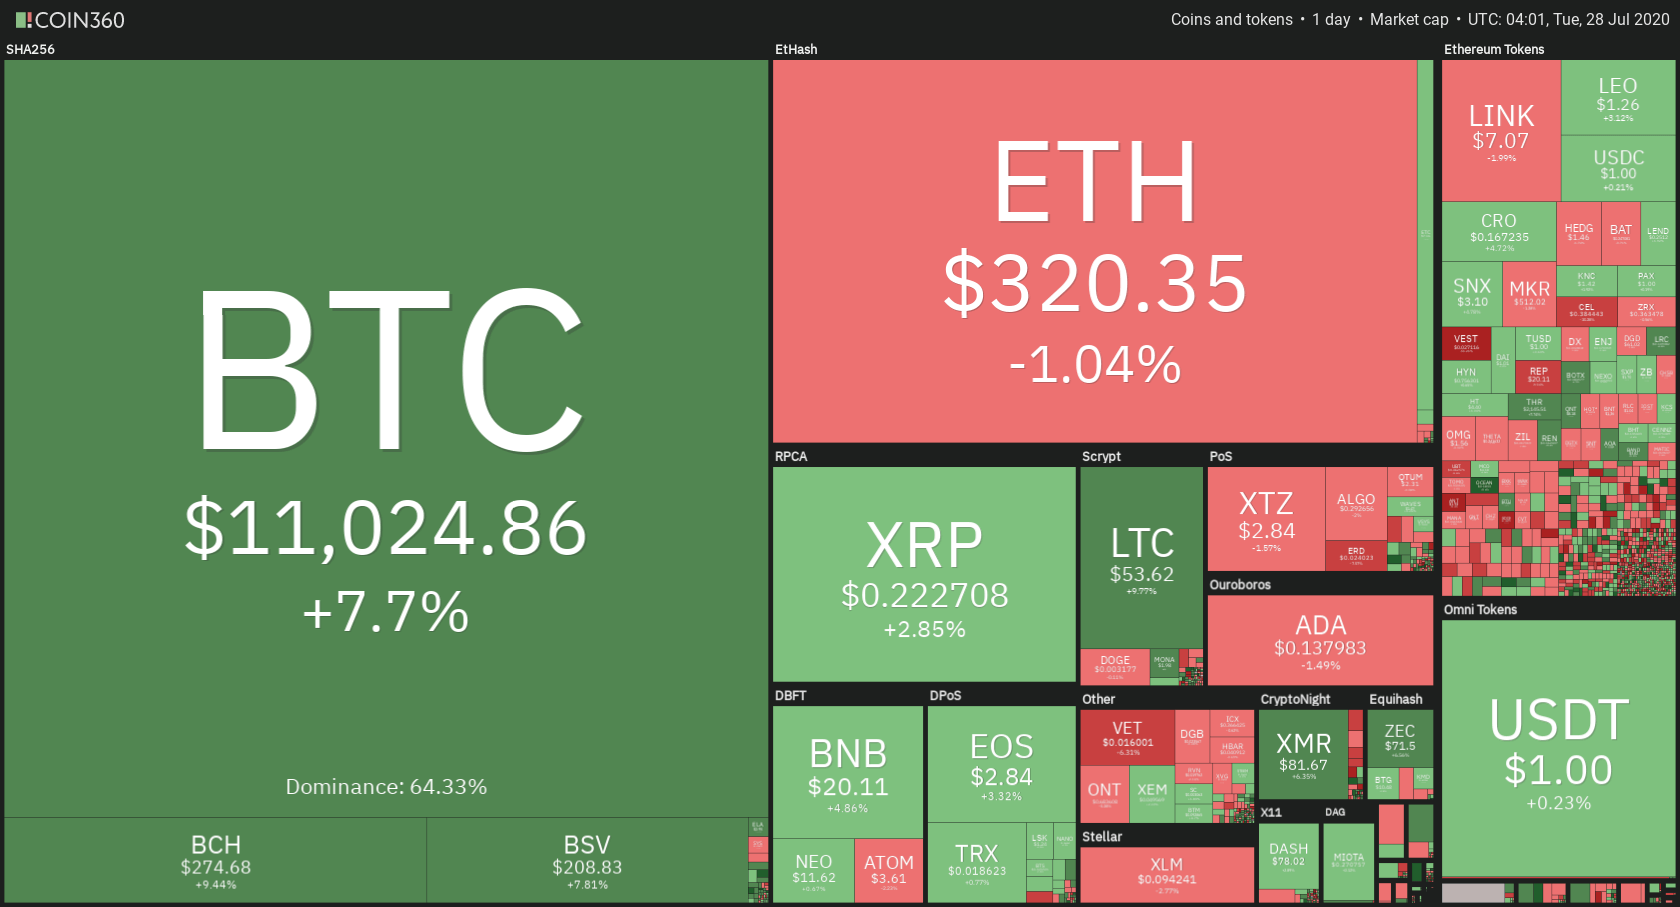
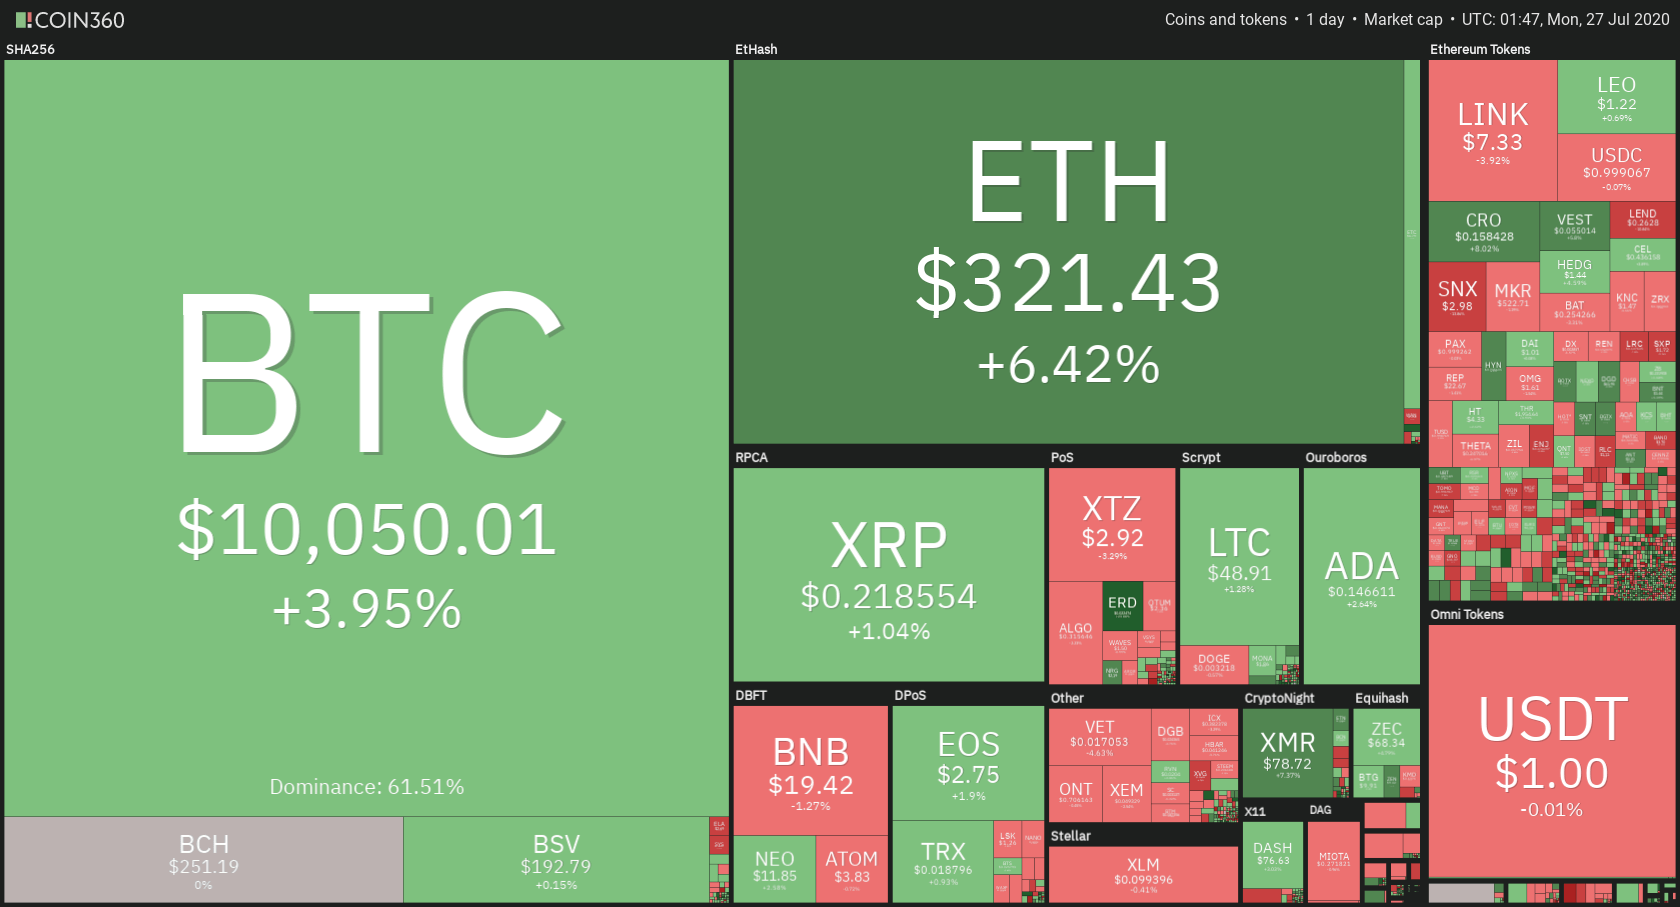
On the news front, the eyes will be on the U.S. ADP Non-farm payroll figures, which may drive price action during the New York session today. Besides, the U.S. Crude Oil Inventories will remain in highlights as economists expect a slight draw in U.S. oil stocks that may drive buying in WTI crude oil.

Economic Events to Watch Today  


EUR/USD – Daily Analysis

The EUR/USD pair was closed at 1.19117 after placing a high of 1.20113 and a low of 1.19010. On Tuesday, the EUR/USD pair rose above 1.2000 level in earlier trading session but failed to keep the level and dropped in the late session to post losses. The gains in the first half of the day were associated with the broad-based U.S. dollar weakness; however, in the late session, the losses were associated with the dollar strength triggered by better than expected ISM Manufacturing PMI.

The upward momentum that took the pair above 1.200 level on Tuesday was derived from the broad-based U.S. dollar weakness followed by the new policy shift from Federal Reserve. The improved risk sentiment due to vaccine hopes also helped the pair reach its highest since May 2018. However, the gains were limited as the pair started to fell in the second half of the day.

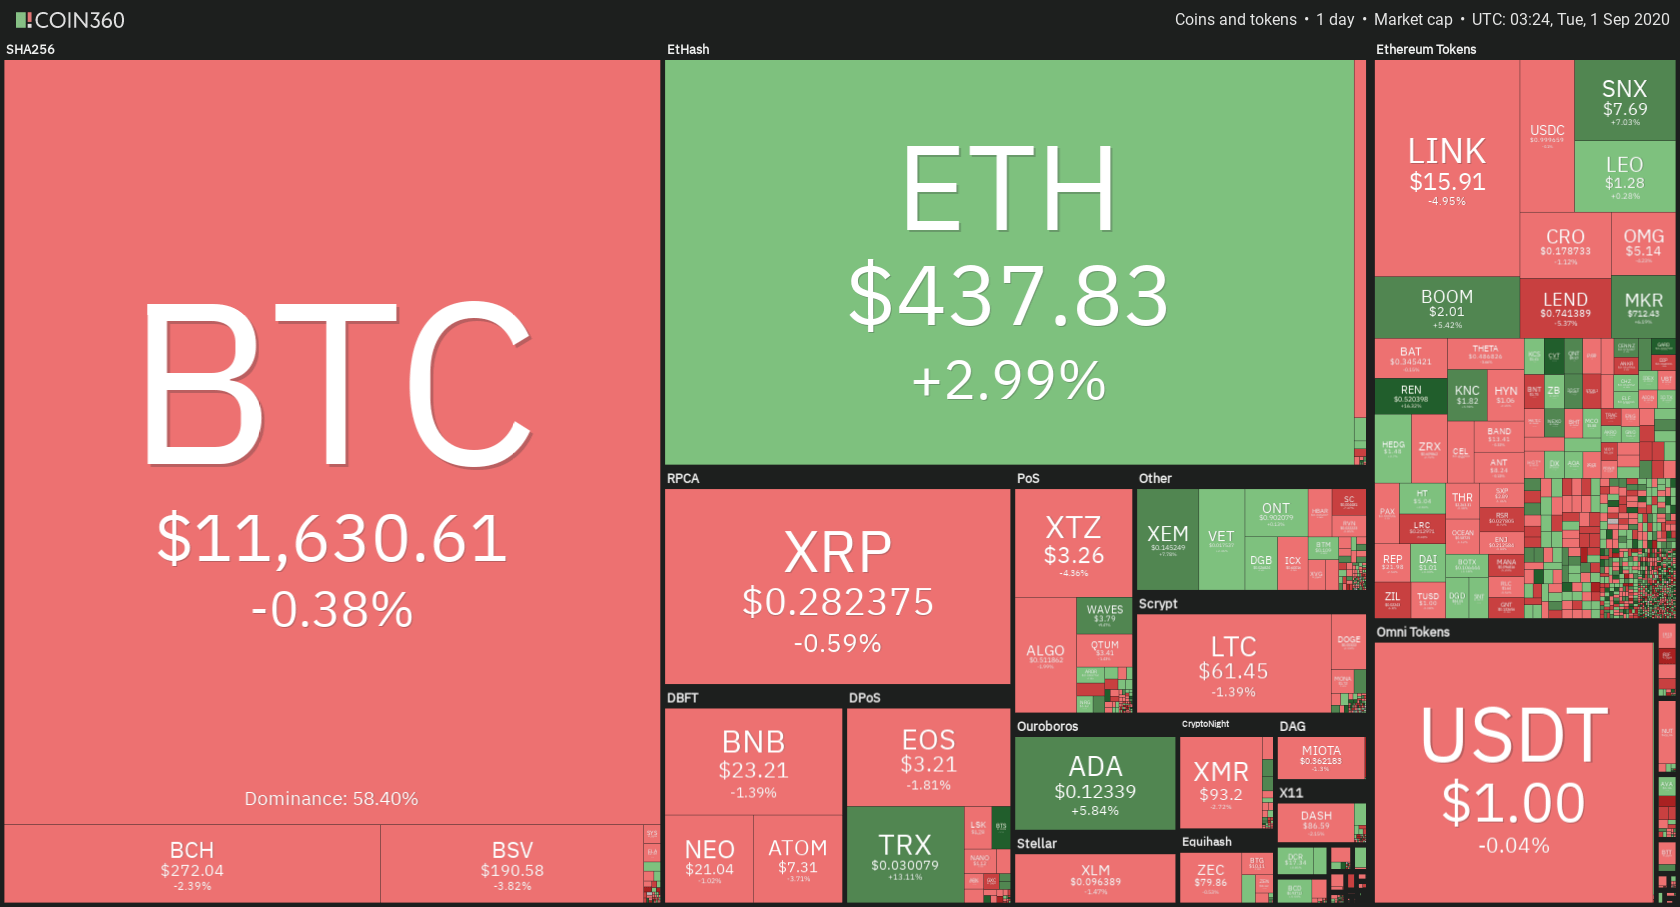
The losses in the EUR/USD pair were also encouraged by the fading market risk sentiment due to increased coronavirus cases worldwide. On Wednesday, the number of cases reached 6 million in the U.S., while India reported the biggest single-day jump of 78,761 in coronavirus cases over the weekend, whereas the daily case count reached 8000 in Spain. Meanwhile, after the U.S., Brazil, and India, now Russia also became the fourth country to exceed 1 million cases of COVID-19.

Furthermore, to prevent the second wave of coronavirus, the Scottish government announced new restrictions on travelers from Greece to Scotland; quarantine restrictions will be imposed on people traveling from Greece to Scotland due to emerging coronavirus cases. These tensions weighed on market risk sentiment and added in the further losses of EUR/USD on Tuesday.

Daily Technical Levels

Support Pivot Resistance
1.1870 1.1941 1.1981
1.1829 1.2053
1.1758 1.2093

EUR/USD– Trading Tip

The EUR/USD pair fell to trade at 1.1901 level, having immediate support at 1.1891 level, which is extended by double bottom level. Violation of 1.1891 level may extend selling until 1.1845 support. On the higher side, the resistance stays at 1.1935 and 1.1978 level for EUR/USD. Price action will highly depend upon the U.S. Advance NFP figures today.


GBP/USD – Daily Analysis

The GBP/USD pair was closed at 1.33830 after placing a high of 1.34820 and a low of 1.33561. Overall the movement of GBP/USD remained flat yet bullish throughout the day. In the first half of the day, the pair rose and extended its gains to reach its highest since December 2019, near 1.3500 level on the back of selling bias surrounding the U.S. dollar. However, most of its early gains were lost in the second half of the day after the release of ISM Manufacturing PMI data on Tuesday.

In the early trading session, the equity markets moved in a higher direction after releasing China’s manufacturing PMI data from Caixin that showed an expansion in the industry by 53.1 against the estimated 52.6. It showed that the world’s second-largest economy was improving and raised the chances for quick economic recovery.

The improvement in China’s economy when the U.S. is suffering against the coronavirus pandemic increased the risk sentiment and weighed on the U.S. dollar that pushed the risk-sensitive currency pair GBP/USD higher on board. However, USD and risk appetite’s selling bias did not remain in the market for long and started to fade in the late session as the macroeconomic data from both the U.K. & U.S. came in against GBP/USD pair on Tuesday.

At 13:30 GMT, the Final Manufacturing PMI from the U.K. in August dropped to 55.2 from the forecasted 55.3 and weighed on GBP. The M4 Money Supply in July from Britain also dropped to 0.9% from the expected 1.2% and weighed on the Sterling. The Mortgage Approvals, however, rose to 66K against the estimated 55K and supported GBP. The Net Lending to Individuals remained flat with the expectations of 3.9B. Most data from Great Britain was against British Pound, and hence, the GBP/USD pair suffered and lost some of its gains on the day.

On the other hand, from the U.S. side, the highly awaited ISM Manufacturing PMI was released at 19:00 GMT, which exceeded the expectations of 54.6 and came in as 56.0 and supported the U.S. dollar. The strong U.S. dollar added weight on the GBP/USD pair that lost most of its daily gains but still ended its day with a slightly bullish trend.

Apart from macroeconomic data, the progress towards Brexit deal also drove the GBP/USD pair on Tuesday when PM Boris Johnson’s spokesman said that Britain wanted to agree simpler parts of the future relationship with the E.U. first to create momentum in the negotiations. While the E.U. has been insisting on reaching a consensus on difficult areas in talks such as E.U. state aid before any other negotiation area, even legal texts.

However, the next round of talks is scheduled for next week, but before that, another meeting was scheduled for Tuesday ahead of formal negotiation resumption next Monday. Michel Barnier went to London for informal talks with his U.K. counterpart, David Frost, as the transition period is near to end. It is yet to see how the informal talks went between both parties and discussed in the next round of formal meetings. Traders are cautiously waiting for some direction towards Brexit-deal.

 Daily Technical Levels

Support Pivot Resistance
105.6400 105.9000 106.2100
105.3300 106.4700
105.0700 106.7800

 GBP/USD– Trading Tip

The GBP/USD pair is trading bearish at 1.3358 level, set to test the support level of 1.3358 level. The Cable has already violated an upward trendline at 1.3375 level, which is already violated. On the lower side, the GBP/USD pair may drop further below 1.3358 until the 1.3263 level. The MACD is also supporting selling bias; therefore, we will be looking for selling trades below the 1.3355 level. Lets brace for ADP NFP figures for better price action. 


USD/JPY – Daily Analysis

The USD/JPY pair was closed at 105.955 after placing a high of 106.150 and a low of 105.589. The USD/JPY pair moved sideways on Tuesday but ended its day with posting gains as the selling pressure against the U.S. dollar was faded away after the release of ISM Manufacturing data and some fresh comments from Fed Governor. 

However, the fading risk sentiment kept the gains in the USD/JPY pair checked after the coronavirus cases started to rise globally. The worldwide toll of cases reached 25 million with the United States on top with 6 million cases on Wednesday. India reported its biggest single-day surge in coronavirus cases of 78,761 on the weekend, while Spain reported a daily toll of more than 8000. After the U.S., Brazil, and India, now Russia has also entered the country with more than 1 million coronavirus cases. Besides, the Scottish government announced restrictions on people traveling from Greece to Scotland due to developing coronavirus cases.

The increasing number of COVID-19 cases decreased the risk appetite and helped safe-haven Japanese Yen to gain traction that weighed on the USD/JPY pair and limit the additional gains in the USD/JPY pair on Tuesday. Moreover, the renewed US-China tensions after Beijing’s new law to impose restrictions on tech export. China forced a ban on the export of tech companies that will require government approval, which will take 30 days approx. The move came in against the order of Donald Trump in which he gave 90 days to the TikTok app for sale or transfer of its rights to the U.S. The tensions also supported the Japanese Yen and capped further upside in the USD/JPY pair on Tuesday.

Daily Technical Levels

Support Pivot Resistance
1.3330 1.3407 1.3459
1.3279 1.3535
1.3202 1.3587

USD/JPY – Trading Tips

The USD/JPY currency pair is trading at 106.077with an immediate resistance level of 106.085 level. Bullish crossover of 106.085 level may drive further buying until the next resistance level of 106.570. On the lower side, the USD/JPY pair may find support at 105.800 and 105.500 levels. Let’s consider buying over 106.100 level as the MACD and RSI also suggest the same. Good luck! 

Categories
Forex Market Analysis

Daily F.X. Analysis, September 01 – Top Trade Setups In Forex – Dollar Weakens Amid NFP Forecast! 

On the news front, the eyes will be on the series of economic events like Manufacturing PMI data from Europe, the U.K., and the U.S. Economy. Overall, almost all of the events are expected to report neutral results. Therefore, any surprisingly bad or good data may drive some price action in the market today.

Economic Events to Watch Today  


EUR/USD – Daily Analysis

The EUR/USD closed at 1.19359 after placing a high of 1.19659 and a low of 1.18841. The EUR/USD pair continued its bullish trend for the second day and rose to its highest since August 18 on Monday amid broad-based U.S. dollar weakness. Every month, the currency pair EUR/USD rose for the 4th consecutive month in August. The improved risk sentiment followed the positive momentum in the EUR/USD pair in the market amid a rise in the U.S. stock futures.

 On Monday, the U.S. stock futures opened the day with modest gains as the market was on track to rack up their best August in more than 30 years. The upward momentum in stocks came after the S&P 500 and NASDAQ closed at an all-time high on Friday, with the former looking set to record its most robust August performance in 34 years.

The rally in the stock market was backed by the improved risk sentiment powered by massive monetary and fiscal stimulus in recent months that offset the concerns over the outlook of economic recovery from the coronavirus pandemic. Besides, the optimism around the vaccine development and treatments for COVID-19 and the robust demand for tech stocks also boosted the risk sentiment.

During the previous week, the Federal Reserve Chairman Jerome Powell shifted the policy to average inflation targeting that allowed inflation to surpass the 2% target. This shift raised concerns that interest rates were locked near-zero for as much as five years and weighed heavily on the U.S. dollar. The weak U.S. dollar helped EUR/USD to post gains on Monday.

Meanwhile, the German Prelim CPI in August dropped to -0.1% from the anticipated 0.0% and weighed on Euro on the data front. The Spanish Flash CPI fell in August to -0.5% from the July’s -0.6%. The Italian Prelim CPI in August came in line with the expectations of 0.3%. Most data from the European side came against Euro and limited the additional gains in EUR/USD pair on Monday.

While from the U.S. side, the Fed Vice Chair, Richard Clarida said on Monday that Federal Reserve would turn to discuss the next possible steps in the U.S. central bank’s fight against coronavirus induced economic fallout as a new policy framework has been set in place. The possible steps include linking interest rates directly with a return to full employment and possible expansion in monthly asset purchases to aid the economy through the COVID-19 crisis further.

Furthermore, the risk sentiment was also boosted by the news that the highly awaited Oxford vaccine will begin its phase-3 trials in the United States on Tuesday. This also helped EUR/USD pair to post gains on Monday.

Whereas, the World Health Organization pointed out encouraging signs that countries in Europe could deal with the coronavirus outbreak, despite the increase in cases since lockdown measures were lifted. According to a Senior Advisor to the Director-General at WHO, Bruce Aylward said that Europe has learned how to identify, isolate, and quarantine. It also helped raise the local currency Euro and added further in EUR/USD pair gains.

Daily Technical Levels

Support Pivot Resistance
1.1891 1.1929 1.1975
1.1846 1.2012
1.1808 1.2058

 EUR/USD– Trading Tip

The EUR/USD is trading sharply bullish amid the weaker dollar, leading EUR/USD pair towards 1.1993 level. The EUR/USD pair has violated the resistance level of 1.1960 level, which is now working as a support for Eur. On the upper side, the pair may find resistance at 1.2025 and 1.2065 levels today. The bullish bias remains dominant.


GBP/USD – Daily Analysis

The GBP/USD closed at 1.33651 after placing a high of 1.33956 and a low of 1.3309. Overall the movement of the GBP/USD pair remained bullish throughout the day. The GBP/USD pair extended its previous day’s bullish streak on Monday and posted gains for the third consecutive month on August amid broad-based U.S. dollar weakness and improved risk-on market sentiment.

The risk-sensitive British Pound gained on Monday due to many factors, including the dovish policy shift from the U.S. Federal Reserve, development in vaccine & treatments of COVID-19. At the same time, some lingering tensions in US-China kept the pair’s gains limited.

On Friday, the U.S. Federal Reserve shifted to a dovish policy that allowed inflation to pass over the 2% target, which means continued low-interest rates for almost five years. This weighed on the U.S. dollar and helped GBP/USD to post gains on Monday.

Meanwhile, the market sentiment was also powered by the positive headlines from the vaccine front as a possible virus vaccine made by Oxford has announced to start its phase-3 trials from Tuesday. Moreover, the US-listed Chinese tech companies were heading to Hong Kong exchange from New York Exchange amid increased US-China dispute. This weighed on market sentiment and kept a check on additional gains in GBP/USD pair.

Whereas, on the Brexit front, the U.K. Government has said that the European Union was making Brexit talks unnecessarily difficult after France accused the U.K. of deliberately stalling in negotiations.

In last week, U.K. and E.U. ended their latest round of negotiation with very little progress due to warnings of no-deal Brexit if issues did not settle within a few weeks. Only four months have left until the transition period ends, and both sides have failed to resolve their issues and are still stuck on various points, including fisheries and state aid policy.

Recently French Foreign Minister Jean-Yves Le Drian has blamed the U.K. for the deadlock and said that the failure in progress in talks was because of the United Kingdom’s intransigent and unrealistic attitude. Whereas, the U.K. has said that it has been clear from the outset about the U.K. approach’s principles. A spokeswoman said that the U.K. seeks a relationship that respects their sovereignty and has a free trade agreement the E.U. has with like-minded countries.

E.U. still insists not only that the U.K. must accept continuity with E.U. state aid and fisheries policy but also that the U.K. must agree before any further work can be done un any other area of negotiation. This also includes the legal texts that make in unnecessarily difficult to make progress. Next week, another round of talks will occur, and investors are looking forward to it for fresh clues.

 Daily Technical Levels

Support Pivot Resistance
1.3314 1.3355 1.3409
1.3260 1.3450
1.3219 1.3504

 GBP/USD– Trading Tip

The GBP/USD is trading with a neutral bias below an immediate resistance level of 1.3425 level. Closing of candles below 1.3420 level is likely to drive selling until the 38.2% Fibonacci support level of 1.3350 and 61.8% Fibonacci support level of 1.3305 level. The MACD has also crossed below 0, supporting selling bias in the GBP/USD pair. On the higher side, a bullish breakout of 1.3420 level can lead the Cable towards 1.3511 level. Let’s consider taking buying trades over 1.3350 level today.  


USD/JPY – Daily Analysis

The USD/JPY pair was closed at 105.901 after placing a high of 106.094 and a low of 105.208. The USD/JPY pair moved in an upward direction on Monday despite the broad-based U.S. dollar weakness. The pair, which posted a loss of more than100 pips on Friday amid the resignation of Japanese Prime Minister Shinzo Abe, recovered about half of the previous losses on Monday.

The risk-on market sentiment made it difficult for the safe-haven Japanese Yen to find demand on Monday and helped pair USD/JPY moved higher on board. The heightened optimism for an effective coronavirus treatment and the U.S. Food & Drug Administration’s decision to fast-track vaccine approval added in the risk-sentiment. Besides, the news that the Oxford vaccine will also start its phase-3 trials on the next day also powered the risk sentiment and weighed on JPY that pushed the USD/JPY pair even higher at the start of the week. 

However, with the lingering tensions between the U.S. & China, the US-listed Chinese tech companies were preferring the Hong Kong Exchange with Alibaba affiliate Ant Group, one of the most highly predicted initial public offerings ready for a dual listing in Shanghai and Hong Kong. This kept the additional gains in USD/JPY limited on Monday.

The U.S. dollar was under heavy selling pressure on Monday amid U.S. Dollar Index slumped to more than two years, the lowest level at 91.99.

The pressure surrounding the greenback was increased in the absence of any significant fundamentals on Monday, and the market kept following the strategy of a policy shift from the Federal Reserve on Friday.

Meanwhile, on Monday, Vice Chairman Richard Clarida explained that as Federal Reserve has shifted from its previous policy and has set a new policy framework, the central bank’s focus will now shift towards the next promises made by it to fight against the coronavirus induced economic slump.

Fed made promises to link interest rates to the direct return of full employment and increase the monthly assets purchases to boost the economy through the economic crisis followed by the coronavirus pandemic.

On the other hand, at 04:50 GMT, the Prelim Industrial Production in July increased to 8.0% from the expected 5.0% and supported the Japanese Yen. The Retail Sales for the year from Japan dropped to -2.8% from the forecasted -1.7% and weighed on the Japanese Yen that pushed the pair USD/JPY even higher on board.

At 10:00 GMT, the Consumer Confidence from Japan in August increased to 29.3 against the expected 28.7 and supported the Japanese Yen. At 10:02 GMT, the Housing Starts came in as -11.4% against the anticipated -12.0% and supported the Japanese Yen but failed to reverse the USD/JPY pair’s bullish movement.

Daily Technical Levels

Support Pivot Resistance
105.4200 105.7600 106.2300
104.9500 106.5700
104.6200 107.0300

USD/JPY – Trading Tips

The USD/JPY is trading within a sideways range of 105.866 to 105.200 range. The pair entered into the oversold zone previously, but now it has completed 23.6% Fibonacci retracement, and above this, the next target is likely to be found around 105.870. The MACD has crossed over 0 and has entered into the buying zone. Bullish bias seems dominant in the market today. Therefore, we may see USD/JPY prices soaring towards 38.2% Fibo levels of 105.870. Buying can be seen at over 105.200 level today. Good luck! 

Categories
Crypto Market Analysis

Daily Crypto Review, Sept 1 – Binance Crypto Card Expanding To The US; YFI Token Up 1,000,000% Since July

While the top cryptocurrencies had quite a slow day, the DeFi market kept going up. Bitcoin is currently trading for $11,630, which represents a decrease of 0.38% on the day. Meanwhile, Ethereum gained 2.99% on the day, while XRP lost 0.59%.

 Daily Crypto Sector Heat Map

When taking a look at top100 cryptocurrencies, Sushi gained 110.98% on the day, making it the most prominent daily gainer. BitShares (72.48%) and Kusama (35.57%) also did great. On the other hand, DFI.Money lost 18.67%, making it the most prominent daily loser. It is followed by bZx Protocol’s loss of 13.96% and NXM’s drop of 9.34%.

Top 10 24-hour Performers (Click to enlarge)

Bottom 10 24-hour Performers (Click to enlarge)

Bitcoin’s dominance level has gone down slightly, with its value is currently at 58.40%, represents a 0.84% difference to the downside when compared to our last report.

Daily Crypto Market Cap Chart

The crypto market cap has increased significantly over the course of the day. Its current value is $375.72 billion, which represents an increase of $3 billion when compared to our previous report.

_______________________________________________________________________

What happened in the past 24 hours?

_______________________________________________________________________

_______________________________________________________________________

Technical analysis

_______________________________________________________________________

Bitcoin

After a weekend of steady gains, Bitcoin spent the day trying to establish its presence above the newly-conquered $11,630 level. While the fight is still in progress, it seems that the largest cryptocurrency by market cap will stay above the level, thus turning it into support.

Traders should take a look at how Bitcoin handles its next resistance, which is at around $11,820.

BTC/USD 4-hour Chart

Technical factors:
  • Price is above its 50-period EMA and 21-period EMA
  • Price is above its middle band
  • RSI is neutral but leaning towards overbought (57.26)
  • Volume is low
Key levels to the upside          Key levels to the downside

1: $11,630                                1: $11,460

2: $12,015                                2: $11,090

3: $12,330                                 3: $10,855

Ethereum

Unlike Bitcoin, Ethereum has had a great day. The second-largest cryptocurrency by market cap continued its rush towards the upside, fueled by the expansion of DeFi. The move towards the upside rekindled after ETH confirming its position above $415 and stopped (for now) at its next resistance level, which is sitting at $445. While Ethereum has a chance of breaking this level as well, it is unlikely that it will stay above it as the volume seems to be fading, while its RSI is in the overbought territory.

Ethereum traders should look for ETH’s pullback after the bullish move ends.

ETH/USD 4-hour Chart

Technical Factors:
  • Price is currently above its 21-period and 50-period EMA
  • Price is just below the upper band
  • RSI is in the overbought territory (74.23)
  • Volume is descending
Key levels to the upside          Key levels to the downside

1: $445                                     1: $415

2: $496                                     2: $400

                                                 3: $360

Ripple

XRP’s move towards the upside ended abruptly as the third-largest cryptocurrency by market cap failed to break the $0.285 resistance level. While it is still very close to it, XRP shows no signs of breaking the resistance any time soon, unless it gets external help in the form of BTC pushing the price of the whole crypto market.

On the other hand, XRP doesn’t show any signs of going down anytime soon, so we can expect some range-bound trading in the near future.

Traders should look for an opportunity within the range XRP is currently in.

XRP/USD 4-hour Chart

Technical factors:
  • The price is above its 21-period and 50-period EMA
  • Price is slightly above its middle band
  • RSI is stable and neutral (58.98)
  • Volume is low and relatively stable
Key levels to the upside          Key levels to the downside

1: $0.285                                   1: $0.266 

2: $0.31                                     2: $0.2454

3: $0.32                                    3:$0.235


Categories
Crypto Market Analysis

Daily Crypto Review, August 31 – Cryptos Making Steady Gains Over the Weekend; ETC Hit By Third 51% Attack

The crypto market had a good weekend, with almost every single top cryptocurrency ending up in a net gain. Bitcoin is currently trading for $11,664, which represents an increase of 0.66% on the day. Meanwhile, Ethereum gained 4.42% on the day, while XRP gained 2.19%.

 Daily Crypto Sector Heat Map

When taking a look at top100 cryptocurrencies, UMA gained 48.99% on the day, making it the most prominent daily gainer. Flexacoin (27.54%) and bZx Protocol (26.08%) also did great. On the other hand, DFI.Money lost 17.06%, making it the most prominent daily loser. It is followed by Golem’s loss of 10.16% and NEM’s drop of 7.06%.

Top 10 24-hour Performers (Click to enlarge)

Bottom 10 24-hour Performers (Click to enlarge)

Bitcoin’s dominance level has gone down quite a bit over the weekend and dropped below the 60% mark. Its value is currently at 59.24%, represents a 1.82% difference to the downside when compared to our last report.

Daily Crypto Market Cap Chart

The crypto market cap has increased significantly over the course of the weekend. Its current value is $372.72 billion, which represents an increase of $19.24 billion when compared to our previous report.

_______________________________________________________________________

What happened in the past 24 hours?

_______________________________________________________________________

_______________________________________________________________________

Technical analysis

_______________________________________________________________________

Bitcoin

Bitcoin spent the weekend slowly rising in price on low volume. The largest cryptocurrency by market cap rose above $11,460 and $11,630 resistance levels, turning them into support. The $11,630 level is currently being retested, but it looks like Bitcoin will stay above it unless a large spike of sellers suddenly comes to the market.

Traders should take a look at Bitcoin’s confirmation of the $11,630 level. If BTC stays above it, traders can consider Bitcoin to be moving in within a range, bound by $11,630 and $12,000.

BTC/USD 4-hour Chart

Technical factors:
  • Price is above its 50-period EMA and 21-period EMA
  • Price is slightly above its middle band
  • RSI is neutral but leaning towards overbought (57.95)
  • Volume is low
Key levels to the upside          Key levels to the downside

1: $11,630                                1: $11,460

2: $12,015                                2: $11,090

3: $12,330                                 3: $10,855

Ethereum

After passing the descending trend and moving above it, Ethereum had a couple of days of steady gains. The second-largest cryptocurrency by market cap slowly gained ground and passed the $400 as well as $415 resistance levels along the way. The move stopped just above $430, before starting to retrace. There is a big possibility that the $415 level will be tested as a support level.

Ethereum traders should look for ETH’s reaction when the price reaches $415 again.

ETH/USD 4-hour Chart

Technical Factors:
  • Price is currently above its 21-period and 50-period EMA
  • Price is slightly below the upper band
  • RSI is severely overbought (67.64)
  • Volume is average
Key levels to the upside          Key levels to the downside

1: $415                                     1: $400

2: $445                                     2: $360

3: $496                                      3: $340

Ripple

XRP also had a great weekend, with its price consistently moving towards the upside after briefly breaking the $0.266 support level to the downside, which is where the bullish move on Aug 27 started. While it made some progress towards the upside, XRP did not reach past any significant resistance levels. In fact, it got stopped by the $0.285 level, which it most likely won’t pass.

Due to its RSI being close to overbought, low volume, and price rejection around the $0.285 level, XRP will most likely start a move towards the downside now.

XRP traders should trade it on its way down towards $0.266 or possibly look for a bounce off of the support XRP will find on its way down.

XRP/USD 4-hour Chart

Technical factors:
  • The price is above its 21-period and 50-period EMA
  • Price is slightly below its upper band
  • RSI is nearly overbought but is moving towards neutral (58.17)
  • Volume is low and relatively stable
Key levels to the upside          Key levels to the downside

1: $0.285                                   1: $0.266 

2: $0.31                                     2: $0.2454

3: $0.32                                    3:$0.235


Categories
Forex Market Analysis

Daily F.X. Analysis, August 28 – Top Trade Setups In Forex – U.S. Fed Chair Powell Speaks! 

On the news front, the economic calendar is due to a report series of CPI and GDP figures from the European economy. These events are expected to be overshadowed by the U.S. Personal Pending, Chicago PMI, and Revised UoM Consumer Sentiment, which are expected to slightly worse than beforehand. This may add further bearish bias for the U.S. dollar today.

Economic Events to Watch Today  


EUR/USD – Daily Analysis

During the Thursday’s Asian trading hours, the EUR/USD currency pair managed to extend its previous session gaining streak and still flashing green while taking round near 1.1830/40 level mainly due to the broad-based U.S. dollar selling bias, in the wake of cautious sentiment around the market ahead of the U.S. Federal Reserve (Fed) Chair Jerome Powell’s speech. On the contrary, the buying interest around the shared currency is declining on the day amid the intensifying virus fugues in Europe, which eventually becomes the key factor that has been capped further upside in the currency pair. 

At the moment, the EUR/USD currency pair is currently trading at 1.1835 and consolidating in the range between the 1.1817 – 1.1850. However, the traders are cautious about placing any strong position ahead of week’s Jackson Hole conferences where Federal Reserve’s (Fed) President Jerome Powell will speak about the central bank’s long-awaited monetary policy framework review, which will focus on inflation. 

Despite the upbeat U.S. and China data, the equity market has been declining since the day started amid the renewed concerns over the US-China relation. At the US-China front, the Trump administration sanctioned those companies who are helping China to mark its existence in the South China Sea. In contrast, China fired missiles in a military drill near the South China Sea. 

At the USD front, the broad-based U.S. dollar failed to gain any positive traction on the day. However, the losses could be associated with the doubts about the U.S. economic recovery ahead of Fed Chairman Jerome Powell’s speech at Thursday’s Jackson Hole symposium themed. However, the losses in the U.S. dollar became the key factor that kept the currency pair’s higher. Whereas, the U.S. Dollar Index that tracks the greenback against a basket of other currencies dropped by 0.12% to 92.882 by 11:59 PM ET (4:59 AM GMT).

At the coronavirus front, the coronavirus cases grew to 236,429, with a total of 9,280 deaths toll, according to the German disease and epidemic control center, Robert Koch Institute (RKI) report. In the meantime, the cases rose by 1,576 in Germany yesterday against Monday’s +1278. Whereas the death toll also grew by 3. It is worth mentioning that Germany recorded its highest number of new COVID-19 cases during the weekend in almost 4-months. As a result, they undermined the bullish sentiment around shared currency and held the currency pair between the thin range.

Daily Technical Levels

Support Pivot Resistance
1.1754 1.1828 1.1894
1.1689 1.1967
1.1615 1.2033

 EUR/USD– Trading Tip

The EUR/USD is trading slightly bullish at 1.1851, crossing over the resistance level of 1.1849 level. On the lower side, the EUR/USD may find support at 1.1830, while a bearish breakout of 1.1830 level can trigger selling until 1.1800 level. In case of a bullish breakout, the EUR/USD pair may begin further buying trends until 1.1880 and 1.1945 levels.


GBP/USD – Daily Analysis

The GBP/USD stimulates the daily high to 1.3242, up 0.29%, while directing into the European session open. Like major pairs, the Cable restored the yearly high on Thursday ere dipping to 1.3161, which caught the two-day winning streak. After remarks from Fed Chair, the broad U.S. dollar rally pulled the quote descending the prior day. 

The greenback’s latest drops support the pair bulls before BOE Governor Andrew Bailey’s address at the Jackson Hole Symposium. While running the third bullish day in the previous four, the GBP/USD prices also spend tiny heed to the Brexit distress indicated by The Times.

The final scheduled round of post-Brexit trade negotiations between the E.U. and the U.K. have already been abandoned, but ministers are expected to appear next week. Additionally, Germany’s expulsion of Brexit discussions as agenda from next week’s critical talks amongst the E.U. representatives.

Subsequently, the uproar girdling insect repellent ingredient defending against the coronavirus (COVID-19) and 21-day immunity plan represented a mild enthusiasm at home. The sentiment overlooks the biggest daily COVID-19 problems while producing 1,522 numbers for Thursday.

On the other hand, U.S. President Donald Trump addressed to end dependence on China “once and for all.” Besides, the mystic concepts of Fed Chair Powell, involving Average Inflation Targeting (AIT), appear to decrease the allure as markets start reading between the words and spot economic worries.

 Daily Technical Levels

Support Pivot Resistance
1.3145 1.3215 1.3268
1.3092 1.3338
1.3022 1.3391

 GBP/USD– Trading Tip

The GBP/USD has distributed the trading range of 1.3240 – 1.3180, and a bullish breakout of Cable is anticipated to lead it higher unto 1.3275 mark. On the higher side, the GBP/USD faces the next resistance at 1.3275 mark and over this level, the pair may find 1.3323 resistance. Speaking about the technical side of the market, 50 periods of EMA, RSI, and MACD suggest bullish bias in the GBP/USD pair. Today, let’s look for buying trades above 1.3275 level.


USD/JPY – Daily Analysis

During Thursday’s early European trading session, the USD/JPY currency pair managed to stop its early-day losing streak and took modest bids near above 106.00 level mainly after the (BOJ) board member Hitoshi Suzuki expressing his take on the monetary policy outlook, which eventually undermined the Japanese yen and extended some support to the currency pair. 

 Meanwhile, the risk-off market sentiment, driven by the renewed US-China tussle and intensifying virus cases in Europe and Asia, tends to underpin the safe-haven Japanese yen and kept the currency pair sidelined. At this moment, the USD/JPY currency pair is currently trading at 106.02 and consolidating in the range between 105.81 – 106.08.

It is worth reporting that the Bank of Japan (BOJ) board member Hitoshi Suzuki expressed his part on the monetary policy outlook while saying that “Will ease monetary policy further without hesitation with an eye on the pandemic impact on the economy. “He also added that “If BOJ were to ease more, it could use a special program for combating pandemic, cut short-, long-term interest rates or ramp up risky asset buying.” However, these statements recently weakened the Japanese yen and provided little support to the currency pair. 

Apart from this, the Takatoshi Ito, a famous economist who was once a preferred nominee to become Bank of Japan (BOJ) governor, stated that the Japanese economy could see a quicker recovery by 2022 if a vaccine becomes available. However, the currency pair failed to give any major attention to the above headlines, as it remains flat around 106.00 due to the cautious risk tone and weaker greenback ahead of the Fed Chair Powell’s Jackson Hole speech.

Across the pond, the failure of the American lawmakers to offer any hint on the big coronavirus (COVID-19) relief package or the highest COVID-19 new cases in Italy since May, not to forget the fresh US-China tussle over the South China Sea, all factors are weighing on the market trading sentiment, which could be considered as the main factors for the currency pair limited moves. 

At the US-China front, the Trump administration plans sanctions on those companies who are helping China to mark its existence in the South China Sea. At the same time, China fired missiles in a military drill near the South China Sea. The U.S. Secretary of State Michael Pompeo criticized China for “coercive bullying tactics against our friends in the United Kingdom.” This also exerted a burden on the market trading sentiment. This, in turn, underpinned the safe-haven Japanese yen demand and capped upside momentum in the pair.

Despite the risk-off market sentiment, the broad-based U.S. dollar failed to gain any positive traction on the day, as well as the losses could be associated with the doubts about the U.S. economic recovery ahead of Fed Chairman Jerome Powell’s speech at Thursday’s Jackson Hole symposium themed. However, the losses in the U.S. dollar became the key factor that kept the currency pair’s gain limited. Whereas, the U.S. Dollar Index that tracks the greenback against a basket of other currencies dropped by 0.12% to 92.882 by 11:59 PM ET (4:59 AM GMT).

Looking forward, the market traders await the Federal Reserve Chairman Jerome Powell’s speech in the Jackson Hole Symposium. As well as, America’s preliminary readings of the second quarter (Q2) GDP, which is expected -32.5% versus -32.9% will be key to watch. In the meantime, the updates surrounding the fresh Sino-US tussle, this time over the South China Sea, as well as the coronavirus (COVID-19) updates, could not lose their significance.


Daily Technical Levels

Support Pivot Resistance
105.8700 106.2900 106.9700
105.1800 107.4000
104.7600 108.0800

USD/JPY – Trading Tips

The USD/JPY is trading bearish at 106.082 level, holding above a support level of 106, which is extended by upward channel. On the higher side, the USD/JPY expected to gain an immediate resistance around 106.566 and 107.078. Looking at the 2-hour timeframe, the 50 periods EMA is extending resistance at 106.350. Likewise, the MACD and RSI are staying in a bearish zone, beneath 50 and 0, sequentially. The USD/JPY may trade bearish below 106.350 to target 106 and 105.800. Good luck! 


Categories
Crypto Market Analysis

Daily Crypto Review, August 28 – Bitcoin Bearish as XRP Plummets

The crypto market was mostly bearish over the course of the day, with XRP losing the most out of the top cryptocurrencies. Bitcoin is currently trading for $11,341, which represents a decrease of 0.5% on the day. Meanwhile, Ethereum lost 0.44% on the day, while XRP lost 5%.

 Daily Crypto Sector Heat Map

When taking a look at top100 cryptocurrencies, Numeraire gained 29.44% on the day, making it the most prominent daily gainer. Serum (23.05%) and Uma (21.68%) also did great. On the other hand, Aragon lost 17.67%, making it the most prominent daily loser. It is followed by Kusama’s loss of 12.20% and Qtum’s drop of 11.12%.


Top 10 24-hour Performers (Click to enlarge)

Bottom 10 24-hour Performers (Click to enlarge)

Bitcoin’s dominance level has gone up quite a bit from when our previous report, with its value currently at 61.06%. This value represents a 0.71% difference to the upside when compared to our last report.

Daily Crypto Market Cap Chart

The cryptocurrency market cap has decreased slightly over the course of the day. Its current value is $353.48 billion, which represents a decrease of $6.8 billion when compared to our previous report.

_______________________________________________________________________

What happened in the past 24 hours?

_______________________________________________________________________

_______________________________________________________________________

Technical analysis

_______________________________________________________________________

Bitcoin

Bitcoin was extremely volatile in the past 24 hours, with its price ranging from $11,110 to $11,600. The largest cryptocurrency by market capitalization is still below the $11,460 resistance level and seems like its preparing a move (most likely to the downside).

The price of Bitcoin has declined by more than 6% in the last three days and that along with the fact that $700 million Bitcoin futures expiry is approaching, traders are nervous and have a bearish scenario in mind. Many technical analysts believe that Bitcoin has two paths ahead at the moment: $16,000 or $9,600.

Traders should take a look at Bitcoin’s movement around $11,460 before trading.

BTC/USD 4-hour Chart

Technical factors:
  • Price is below its 50-period EMA and 21-period EMA
  • Price is below its middle band
  • RSI is neutral but leaning towards oversold (41.82)
  • Volume is average (one-candle spike)
Key levels to the upside          Key levels to the downside

1: $11,460                                1: $11,090

2: $11,630                                2: $10,855

3: $12,015                                 3: $10,500

Ethereum

The second-largest cryptocurrency by market capitalization continued its path above the descending trend line. While being above this line is a positive thing, Ethereum is still losing value as it’s gripping the line and following it down. If ETH decides to test the upside, it will encounter some turbulence way before its major resistance at $415.

If, however, Ethereum pushes towards the downside, it will fall back into the trend and possibly rush towards the bottom trend line.

Ethereum traders should look for Ethereum’s volume spike and push towards the upside.

ETH/USD 4-hour Chart

Technical Factors:
  • Price is currently below its 21-period and 50-period EMA
  • Price is slightly below the middle band
  • RSI is neutral (45.39)
  • Volume is very low (With volume spike when the trend line was retested)
Key levels to the upside          Key levels to the downside

1: $415                                     1: $400

2: $445                                     2: $360

3: $496                                      3: $340

Ripple

XRP had an incredibly bad day, as bears took over the market and pushed its price down. The third-largest cryptocurrency by market cap dropped under the $0.266 support, and then immediately tried to head back up (without any success). While the price is still near the $0.266 level, it is unlikely that XRP will confidently move above it unless Bitcoin pulls the whole crypto market up by a sudden move to the upside.

XRP traders should look for how the cryptocurrency reacts to the $0.266 level and trade-off of that info.

XRP/USD 4-hour Chart

Technical factors:
  • The price is below its 21-period and 50-period EMA
  • Price is slightly above its lower band
  • RSI is at the oversold line (30.19)
  • Volume is unstable and cycling between average (low) and extremely high volume candles
Key levels to the upside          Key levels to the downside

1: $0.285                                   1: $0.266 

2: $0.31                                     2: $0.2454

3: $0.32                                    3:$0.235


Categories
Crypto Market Analysis

Daily Crypto Review, August 27 – $700 Million of Bitcoin Options Expiring on Friday: Prepare for Volatility

The crypto market was split between cryptos that ended up in the green and in the red, with a bit more cryptocurrencies ending up gaining in the past 24 hours. Bitcoin is currently trading for $11,374, which represents an increase of 0.14% on the day. Meanwhile, Ethereum gained 0.77% on the day, while XRP lost 0.36%.

 Daily Crypto Sector Heat Map

When taking a look at top100 cryptocurrencies, Celo gained 56.49% on the day, making it the most prominent daily gainer. Aragon (36.44%) and Siacoin (17.45%) also did great. On the other hand, The Midas Touch lost 20.75%, making it the most prominent daily loser. It is followed by Kusama’s loss of 8.81% and Reserve Rights’ drop of 8.72%.

Top 10 24-hour Performers (Click to enlarge)

Bottom 10 24-hour Performers (Click to enlarge)

Bitcoin’s dominance level has stayed at the same place as we reported yesterday, with its value currently at 60.35%. This value represents a 0.01% difference to the upside when compared to our last report.

Daily Crypto Market Cap Chart

The cryptocurrency market cap has increased significantly over the course of the day. Its current value is $360.28 billion, which represents an increase of $24.61 billion when compared to our previous report.

_______________________________________________________________________

What happened in the past 24 hours?

_______________________________________________________________________

_______________________________________________________________________

Technical analysis

_______________________________________________________________________

Bitcoin

Bitcoin has had somewhat a slow day after bottoming out near $11,090. The largest cryptocurrency by market cap tried to break the $11,460 resistance level at one point, but it ended up unsuccessfully. Bitcoin will need to gather quite a strong bullish presence if it wants to reach $12,000 anytime soon, as the upside is guarded by way too many smaller and bigger resistance levels.

With $700 million of Bitcoin options expiring on Friday, we may see a nice spike in volume and volatility. Various analysts predict that the price at its current position would be a good buying opportunity for futures traders, while a price near $12,000 would be a good sell opportunity.

Traders should take a look at Bitcoin’s movement around $11,460.

BTC/USD 4-hour Chart

Technical factors:
  • Price is below its 50-period EMA and 21-period EMA
  • Price is between its lower and middle band
  • RSI is neutral but leaning towards oversold (41.02)
  • Volume is average
Key levels to the upside          Key levels to the downside

1: $11,460                                1: $11,090

2: $11,630                                2: $10,855

3: $12,015                                 3: $10,500

Ethereum

While it did not do much better than Bitcoin in terms of daily gains, Ethereum had a decent day. The second-largest cryptocurrency by market cap gathered a small bullish force to push through the descending trend. Not only did Ethereum push past it, but it also confirmed its position above it. With that being said, Ethereum needs a significant volume spike if it wants to reach past $400, or go any higher than that.

However, with DeFi booming and gathering interest from traders (and even creating new ones), Ethereum might be on the right track to show its true bullish nature in the mid-term.

Ethereum traders should look for Ethereum’s volume spikes and trade-off of that.

ETH/USD 4-hour Chart

Technical Factors:
  • Price is currently below its 21-period and 50-period EMA
  • Price is between its lower and middle band
  • RSI is neutral (44.63)
  • Volume is very low
Key levels to the upside          Key levels to the downside

1: $415                                     1: $400

2: $445                                     2: $360

3: $496                                      3: $340

Ripple

XRP was the only cryptocurrency in the red in the past 24 hours out of the top3 cryptocurrencies by market cap. After bottoming out near $0.266 and recovering to around $0.28, XRP started dropping slightly again, reaching the current price of $0.275. The low volume and candles with small bodies and small wicks show almost no volatility in trading.

XRP traders should look for a volume spike before even considering a trade.

XRP/USD 4-hour Chart

Technical factors:
  • Price is below its 21-period and 50-period EMA
  • Price is between its lower and middle band
  • RSI stable and leaning towards the oversold area (38.69)
  • Volume is below average and stable
Key levels to the upside          Key levels to the downside

1: $0.285                                   1: $0.266 

2: $0.31                                     2: $0.2454

3: $0.32                                    3:$0.235


Categories
Crypto Market Analysis

Daily Crypto Review, August 26 – Bitcoin in a Downtrend; Altcoins Following Bitcoin

Almost every single cryptocurrency in the top100 ended up in the red today, as Bitcoin fell below $11,630. Bitcoin is currently trading for $11,334, which represents a decrease of 2.34% on the day. Meanwhile, Ethereum lost 3.84% on the day, while XRP lost 2.57%.

 Daily Crypto Sector Heat Map

When taking a look at top100 cryptocurrencies, Kusama gained 35.49% on the day, making it the most prominent daily gainer. Aragon (18.33%) and The Reserve Rights (14.61%) also did great. On the other hand, Flexacoin lost 12.17%, making it the most prominent daily loser. It is followed by Ocean Protocol’s loss of 10.15% and Verge’s drop of 9.60%.

Top 10 24-hour Performers (Click to enlarge)

Bottom 10 24-hour Performers (Click to enlarge)

Bitcoin’s dominance level has increased slightly, with its value currently at 60.34%. This value represents a 0.3% difference to the upside when compared to our last report.

Daily Crypto Market Cap Chart

The cryptocurrency market cap decreased significantly over the course of the day. Its current value is $335.82 billion, which represents a decrease of $33.15 billion when compared to our previous report.

_______________________________________________________________________

What happened in the past 24 hours?

_______________________________________________________________________

_______________________________________________________________________

Technical analysis

_______________________________________________________________________

Bitcoin

Bitcoin has experienced yet another price drop in the past 24 hours. As we mentioned in our previous article, the largest cryptocurrency by market cap was preparing a move to either side and that the direction of the move will decide BTC’s faith in the short-term. As we can see, Bitcoin decided to go towards the downside and quickly dropped below its $11,630 and $11,460 support levels. It got stopped, however, by both the $11,090 and the descending trend line, which Bitcoin created ten days ago.

Traders should take a look at how Bitcoin resolves its current position and trade after they get more info.

BTC/USD 4-hour Chart

Technical factors:
  • Price is below its 50-period EMA and its 21-period EMA
  • Price is at its lower band
  • RSI bounced off of the oversold line (32.84)
  • Volume has increased
Key levels to the upside          Key levels to the downside

1: $11,460                                1: $11,090

2: $11,630                                2: $10,855

3: $12,015                                 3: $10,505

Ethereum

Ethereum also had a bad day, with bears dominating its price movements. The second-largest cryptocurrency by market cap has, over the course of the day, dropped back into the descending trend it just briefly escaped the day before. Ethereum’s position within the descending trend was confirmed after a small price spike couldn’t get past the trend’s upper level.

Ethereum traders should look for how ETH handles being in the level, and how it exits it.

ETH/USD 4-hour Chart

Technical Factors:
  • Price is currently below its 21-period and its 50-period EMA
  • Price is at its lower band
  • RSI is leaning towards oversold (37.87)
  • Volume is normal (but the past 24h saw a surge in volume at one point)
Key levels to the upside          Key levels to the downside

1: $415                                     1: $400

2: $445                                     2: $361

3: $496                                      3: $340

Ripple

XRP suffered from the same fate as BTC and ETH, with bears taking over the market and its price dropping in the past 24 hours. The third-largest cryptocurrency by market cap fell below $0.285 after not being able to properly confirm its position above it, and almost reached the $0.266 support in the process. XRP is now stabilizing at around $0.275 with low volume and volatility.

XRP traders should look for how the cryptocurrency reacts when it reaches its immediate support/resistance levels.

XRP/USD 4-hour Chart

Technical factors:
  • Price is below its 21-period and its 50-period EMA
  • Price is slightly above its lower band
  • RSI stable, but leaning towards the oversold area (38.10)
  • Volume is below average and stable (except a two-candle spike during the price drop)
Key levels to the upside          Key levels to the downside

1: $0.285                                   1: $0.266 

2: $0.31                                     2: $0.2454

3: $0.32                                    3:$0.235


Categories
Forex Market Analysis

Daily F.X. Analysis, August 25 – Top Trade Setups In Forex – Consumer Confidence in Focus! 

On the news front, the economic calendar is a bit busy today, and it may offer a medium impact on economic events from the U.S. and Eurozone. During the European session, the focus will remain on the German Final GDP q/q and German Ifo Business Climate data, while the U.S. C.B. Consumer Confidence and New Home Sales from the U.S. will be released during the New York session today. The dollar can gain straighten on positive forecasts.

Economic Events to Watch Today  


EUR/USD – Daily Analysis

The EUR/USD closed at 1.17953 after placing a high of 1.18828 and a low of 1.17539. Overall the movement of EUR/USD remained bearish throughout the day. The EUR/USD pair dropped on Friday and bottomed at 1.1753; it’s lowest since August 12. A stronger U.S. dollar and the poor economic data from Europe weighed on EUR/USD pair.

At 12:15 GMT, the French Flash Services PMI for August fell to 51.9 from the expected 56.3, and the previous 57.3, weighed on Euro. The French Flash Manufacturing PMI also declined to 49.0 against the estimated 53.0 and previous 52.4 and added pressure on single currency Euro.

At 12:30 GMT, the German Flash Manufacturing PMI rose to 53.0 from the anticipated 52.2 and supported Euro; however, the German Flash Services PMI came in as 50.8 against the expected 55.3 and weighed on Euro on Friday.

At 13:00, the Flash Manufacturing PMI for the whole Eurozone declined to 51.7 in August from the projected 52.7 and previous 51.8. The Flash Services PMI for the whole bloc also fell to 50.1 against the forecasted 54.6 and added pressure on EUR.

Apart from German Manufacturing PMI, all the PMI from the whole bloc, including biggest economies, came in against EUR, and hence, EUR/USD pair suffered. The data showed that only German manufacturing activity was expanded in August. At the same time, other countries, along with whole euro bloc’s manufacturing & services activities, were contracted in August. Meanwhile, the greenback was the top performer on Friday with DXY up by 0.5% on 93.5 level, the highest since Monday. The U.S. Dollar was already supported by the release of Fed Meeting minutes on Wednesday, and on Friday, the support was extended after the release of positive PMI and Home Sales data.

At 18:45 GMT, the Flash Manufacturing PMI and the Flash Services PMI were released from the U.S. The Manufacturing PMI surged to 53.6 against the expected 51.9, and the Services PMI was surged to 54.u from the 50.9 forecasted. The expansion in the Manufacturing & Services sector of the U.S. gave strength to the U.S. dollar. At 19:00 GMT, the Existing Home Sales in July exceeded the expectations of 5.40M and came in as 5.86Mand supported the U.S. dollar.

The strong U.S. dollar exerted more pressure on EUR.USD prices and dragged them down at the ending day of the week. Meanwhile, the Euro currency was also under pressure because of the resurgence of coronavirus cases in Europe. In recent days France, Germany, and Italy have experienced their highest daily case counts since the spring, and Spain has found itself amid a major outbreak.

Over the past two weeks, Spain has seen Europe’s fastest rising caseload with 142 positive cases per 100,000 people. The number had risen more than 3,000 by the time the state of emergency ended on June 21.

The EUR/USD pair was also under pressure on Friday because of the possible entry of a new phase of the pandemic in Europe. 

Daily Technical Levels

Support Pivot Resistance
1.1787 1.1797 1.1807
1.1777 1.1817
1.1767 1.1827

 EUR/USD– Trading Tip

The EUR/USD pair fell sharply from 1.1954 level to 1.1790 level. For now, the pair is likely to find an immediate resistance at 1.1806 level, and a bullish breakout of 1.1806 level can lead EUR/USD prices towards 1.1886 level. On the lower side, the violation of the 1.1751 level can extend the selling trend until 1.1706.


GBP/USD – Daily Analysis

 The GBP/USD pair was closed at 1.30627 after placing a high of 1.31488 and a low of 1.30534. Overall, the movement of the GBP/USD pair remained bearish throughout the day. The GBP/USD pair extended its previous day losses and fell further on Monday to a low of 1.3053 level. In the absence of significant macroeconomic data from the U.K. or U.S., the greenback’s market valuation remained the sole driver of GBP/USD pair on the day.

The U.S. Dollar Index dropped below 93 levels during the first half of the day because of upbeat market sentiment. The risk sentiment was fueled after the U.S. Food and Drug Administration (FDA) announced on Sunday that it had approved the blood-plasma treatment for coronavirus patients in case of emergency.

The blood plasma from the recovered patients of the virus could increase the health and decrease the morality, and it was approved to use for severe or emergency cases of coronavirus in America. This method has been used in many countries, and the USA has approved it now. U.S. President Donald Trump urged the recovered patients of coronavirus to donate their blood plasma so that fight against coronavirus pandemic could take its pace and recovery chances could increase.

The risk perceived GBP/USD pair gained from this news and rose in the early session on Monday; however, in late American sessions, the rising U.S. Treasury bond yields helped the U.S. dollar to gain traction and lifted the U.S. dollar Index. The DXY moved to a high of 93.30 and was up by 0.06% whereas, the U.S. 10-year Treasury bond yield was up by more than 2% on Monday.

The strong U.S. dollar in late session exerted pressure on GBP/USD pair that pulled its prices towards the downward track and hence paired posted losses.

Meanwhile, an internal British government document was leaked on the U.K. tabloid “The Sun” that allegedly outlined the country’s plans in a reasonable worst-case scenario. The second wave of coronavirus, along with the severe flooding and the flu with a no-deal Brexit, could cause a systematic economic crisis. According to that document, the major impact will be on unemployment, disposable incomes, business activity, international trade, and market stability.

The document said that social distancing & mask-wearing would be continued until 2021. The government document also revealed that the navy would be deployed to prevent illegal European fishing boats from clashing with British vessels. The document was dated as of July 2020, and also said that if the U.K. and E.U. failed to reach a post-Brexit trade deal, then hard borders and tariffs will come into effect on January 1, 2021.

Trade talks between both parties have stalled with no breakthrough in sight and the chief Brexit negotiator of European Union, Micheal Barnier has said that the talks were going even backward instead of moving forward. At the same time, the U.K. negotiator, David Frost, said that a little progress had been made. Both sides provide mixed views and raise the confusion amongst investors that have been weighing on GBP/USD pair.

Daily Technical Levels

Support Pivot Resistance
1.3082 1.3092 1.3103
1.3071 1.3113
1.3062 1.3124

 GBP/USD– Trading Tip

The GBP/USD pair is trading sideways above a strong support level if 1.3072. The support here is extended by 1.3074 level, where the bearish breakout of 1.3074 level can extend selling unto 1.3007 level. On the higher side, the next resistance is likely to be found around 1.3155 level. The 50 EMA and the technical indicators such as RSI, MACD, and 50 periods of EMA suggest a selling bias in the Cable. Let’s consider taking selling trades below 1.3075 level, while buying can be seen if the GBP/USD pair continues to close candles over 1.3075 level. 


USD/JPY – Daily Analysis

The USD/JPY pair was closed at 105.979 after placing a high of 105.995 and a low of 105.687. Overall the movement of the USD/JPY pair remained bullish throughout the day. The USD/JPY pair posted small gains on Monday amid the risk-on market sentiment after the FDA approved of coronavirus treatment. However, the lingering US-China tensions and the fact that the U.S. Congress was far from giving any news about the next stimulus kept the market risk sentiment limited.

The U.S. Dollar Index was up on Monday to 93.2 level, and the USD/JPY pair also rose because of improved demand for the U.S. dollar.

However, the main reason for the upward trend was a possible coronavirus treatment that was already being used in different countries. The U.S. Food and Drug Administration has approved the use of blood plasma from recovered patients to treat severely ill coronavirus patients.

The FDA approved this treatment only in case of an emergency and to recover the most severe cases. Whereas, President Donald Trump appealed to the Americans who have recovered from viruses to donate plasma.

This raised the market risk sentiment and weighed on safe-haven Japanese Yen that ultimately pushed the USD/JPY pair on high.

Japanese Yen remained on the back foot on Monday with global equity indexes posting gains at the start of the week. The Dow Jones Industrial Average was up by 0.8%, and the S&P 500 was up by 0.7% on Monday amid improved risk appetite.

Meanwhile, the next stimulus package was still not announced by the U.S. Congress as both Republicans & Democrats were having differences in the size of the package. On the US-China front, the United States and China have already signed the phase one trade deal earlier this year, and China has trouble living up to it. Beijing is supposed to increase the purchase of U.S. exports by 200 Billion U.S. dollars by the end of 2021 in exchange for tariff cuts on Chinese goods by the U.S.

Last week, both parties were scheduled to hold a video conference meeting to discuss the implementations of the phase-one trade deal and issue a review of its progress. But the meeting was canceled by the U.S. President Donald Trump in anger over Beijing for the pandemic outbreak.

The Trump administration has also denied rescheduling the meeting, and it is expected that the review will not be issued. This also raised the uncertainty and kept the risk sentiment under pressure that limited the gains in the USD/JPY pair.

Daily Technical Levels

Support Pivot Resistance
105.7700 105.8500 105.9500
105.6700 106.0300
105.6000 106.1300


USD/JPY – Trading Tips

On Tuesday, the USD/JPY is trading sideways in a broad trading range of 106.300 to 105.240. At the movement, the USD/JPY is tossing above and below 50 periods EMA, while the RSI and MACD are in support of a neutral trend. The recent series of Doji and Shooting start candles are suggesting indecision among traders. Sooner or later, we may see USD/JPY prices break out of the range. Once it happens, the USD/JPY may trade bullish over 106.300 to target 107.084. On the lower side, violation of 105.240 level can drive selling unto 104.300. Good luck! 

Categories
Crypto Market Analysis

Daily Crypto Review, August 25 – Bitcoin Whales List Reaches All-Time High; DeFi Projects Still Booming

Cryptocurrencies had a steady day, with most of them being in the slight green. Bitcoin is currently trading for $11,768, which represents an increase of 1.22% on the day. Meanwhile, Ethereum gained 4.32% on the day, while XRP gained 1.85%.

 Daily Crypto Sector Heat Map

When taking a look at top100 cryptocurrencies, Aave gained 33.55% on the day, making it the most prominent daily gainer. Kusama (26.13%) and The JUST (17.30%) also did great. On the other hand, Nervos Network lost 7.95%, making it the most prominent daily loser. It is followed by OMG Network’s loss of 7.59% and Siacoin’s drop of 7.53%.

Top 10 24-hour Performers (Click to enlarge)

Bottom 10 24-hour Performers (Click to enlarge)

Bitcoin’s dominance level has decreased slightly, with its value currently at 60.04%. This value represents a 0.16% difference to the downside when compared to our last report.

Daily Crypto Market Cap Chart

The cryptocurrency market cap increased in value over the course of the day. Its current value is $368.97 billion, which represents an increase of $6.26 billion when compared to our previous report.

_______________________________________________________________________

What happened in the past 24 hours?

_______________________________________________________________________

_______________________________________________________________________

Technical analysis

_______________________________________________________________________

Bitcoin

Bitcoin is at an important crossroad that will decide its short-term future. While it is currently stuck between $11,630 and $12,000, the largest cryptocurrency by market cap will soon have to decide on its direction. Even though a retest of the $11,630 support seems much more plausible, that does not mean that BTC will make a sharp move towards the downside. If the level holds, Bitcoin might have a good chance of bouncing towards $12,000 yet again.

The low volume also shows that a bigger move is on the horizon.

Traders should look for what BTC will do after it hits one of its support/resistance levels before making a trade.

BTC/USD 4-hour Chart

Technical factors:
  • Price is below its 50-period EMA and below its 21-period EMA
  • Price is slightly above its middle band
  • RSI is neutral (50.15)
  • Volume is below average and stagnant
Key levels to the upside          Key levels to the downside

1: $12,015                                1: $11,630

2: $12,300                                2: $11,460

3: $12,900                                 3: $11,090

Ethereum

Unlike Bitcoin that’s preparing for a move and trading with reduced volume and volatility, Ethereum had a great day and ended up making good gains. The second-largest cryptocurrency by market cap had a small volume spike, which was significant enough to push the price up and past the descending trend it was in for a couple of days.

Ethereum is now stabilizing at around $400, while its volume is decreasing.

Ethereum traders should look for Bitcoin’s next move, which ETH will most likely follow.

ETH/USD 4-hour Chart

Technical Factors:
  • Price is currently above its 21-period and its 50-period EMA
  • Price is at its upper band
  • RSI is neutral (52.30)
  • Volume is slightly increased from the previous days
Key levels to the upside          Key levels to the downside

1: $415                                     1: $400

2: $445                                     2: $361

3: $496                                      3: $340

Ripple

XRP spent the day consolidating above $0.285 level, which is regained the previous day. The third-largest cryptocurrency by market cap focused on stabilizing above $0.285, but without much success. While it is still technically above it, XRP would need a small move towards the upside (or some other sort of a decisive move) to confirm its position.

XRP traders should be careful around the $.285 level and pick their trade carefully based on where XRP will go.

XRP/USD 4-hour Chart

Technical factors:
  • Price is above its 21-period and below its 50-period EMA
  • Price is slightly above the middle band
  • RSI is neutral (48.63)
  • Volume is below average and stable
Key levels to the upside          Key levels to the downside

1: $0.31                                     1: $0.285 

2: $0.32                                     2: $0.266

3: $0.332                                  3:$0.2454


Categories
Crypto Market Analysis

Daily Crypto Review, August 24 – YFI The Youngest DeFi Billionaire; IOTA Going Bankrupt

Cryptocurrencies spent most of the weekend recovering from the bearish move, which occurred late Friday and early Saturday. Bitcoin is currently trading for $11,731, which represents an increase of 1.11% on the day. Meanwhile, Ethereum gained 0.8% on the day, while XRP gained 1.71%.

 Daily Crypto Sector Heat Map

When taking a look at top100 cryptocurrencies, Cosmos gained 29.48% on the day, making it the most prominent daily gainer. IRISnet (21.33%) and The Midas Touch (18.49%) also did great. On the other hand, yearn.finance lost 8.32%, making it the most prominent daily loser. It is followed by Ren’s loss of 7.36% and Komodo’s drop of 6.67%.

Top 10 24-hour Performers (Click to enlarge)

Bottom 10 24-hour Performers (Click to enlarge)

Bitcoin’s dominance level has increased slightly and passed the 60% mark to the upside, with its value currently at 60.20%. This value represents a 0.46% difference to the upside when compared to our last report.

Daily Crypto Market Cap Chart

The cryptocurrency market cap experienced a decrease in value over the course of the weekend. Its current value is $362.71 billion, which represents a decrease of $10.46 billion when compared to our previous report.

_______________________________________________________________________

What happened in the past 24 hours?

_______________________________________________________________________

_______________________________________________________________________

Technical analysis

_______________________________________________________________________

Bitcoin

After a failed breakout of the ascending triangle, Bitcoin’s price started moving down until it reached $11,460 on Saturday. After reaching that level and not being able to pass it to the downside, Bitcoin bounced and started moving up slowly. The whole weekend was rather slow in terms of volatility, but extremely important in terms of where Bitcoin will end up. The fight for $11,630 was successful, and BTC is now above it, with the potential of going further up. However, the move to the upside will not go far with this volume, as it is way too low for any significant movement.

BTC traders should look for a trade near the $11,900 level, which might act as resistance.

BTC/USD 4-hour Chart

Technical factors:
  • Price is above its 50-period EMA as well as its 21-period EMA
  • Price is slightly above its middle band
  • RSI is neutral (54.45)
  • Volume is below average
Key levels to the upside          Key levels to the downside

1: $12,015                                1: $11,630

2: $12,300                                2: $11,460

3: $12,900                                 3: $11,090

Ethereum

Ethereum’s weekend was also spent in recovering from the bearish moves that occurred in the previous week. The second-largest cryptocurrency by market cap managed to stabilize at below-$400 levels, which it is now trying to pass to the upside. However, the moves which occurred in the past week created a downward-facing trend, which is creating resistance towards the upside, which Ethereum is struggling to pass with low volume, which it now has.

Ethereum traders can look for a trade after Ethereum breaks the trend (to any side).

ETH/USD 4-hour Chart

Technical Factors:
  • Price is currently above its 21-period and below its 50-period EMA
  • Price is at its middle band
  • RSI is neutral (49.72)
  • Volume is below average
Key levels to the upside          Key levels to the downside

1: $415                                     1: $400

2: $445                                     2: $361

3: $496                                      3: $340

Ripple

XRP’s chart looks no different than Bitcoin’s and Ethereum’s chart. The third-largest cryptocurrency by market cap spent the weekend recovering from what was lost during the bearish moves that occurred throughout the week. XRP stabilized at $0.28 and then gathered the strength to push past it. While the price is currently above the $0.285 level, it is not certain that it will stay that way. XRP would need a confirmation move in order to turn $0.285 into true support.

XRP traders can look for after XRP confirms its position, or after it drops below $0.285.

XRP/USD 4-hour Chart

Technical factors:
  • Price is currently above the 21-period and below the 50-period EMA
  • Price is slightly above the middle band
  • RSI is neutral (51.50)
  • Volume is stable and below average
Key levels to the upside          Key levels to the downside

1: $0.31                                     1: $0.285 

2: $0.32                                     2: $0.266

3: $0.332                                  3:$0.2454


Categories
Forex Market Analysis

Daily F.X. Analysis, August 24 – Top Trade Setups In Forex – Choppy Sessions In Play! 

On the news front, the market isn’t expected to offer any major economic event today; therefore, most of the market movement is likely to be based upon technical levels. Choppy sessions are expected today.

Economic Events to Watch Today  


EUR/USD – Daily Analysis

The EUR/USD closed at 1.17953 after placing a high of 1.18828 and a low of 1.17539. Overall the movement of EUR/USD remained bearish throughout the day. The EUR/USD pair dropped on Friday and bottomed at 1.1753; it’s lowest since August 12. A stronger U.S. dollar and the poor economic data from Europe weighed on EUR/USD pair.

At 12:15 GMT, the French Flash Services PMI for August fell to 51.9 from the expected 56.3, and the previous 57.3, weighed on Euro. The French Flash Manufacturing PMI also declined to 49.0 against the estimated 53.0 and previous 52.4 and added pressure on single currency Euro.

At 12:30 GMT, the German Flash Manufacturing PMI rose to 53.0 from the anticipated 52.2 and supported Euro; however, the German Flash Services PMI came in as 50.8 against the expected 55.3 and weighed on Euro on Friday.

At 13:00, the Flash Manufacturing PMI for the whole Eurozone declined to 51.7 in August from the projected 52.7 and previous 51.8. The Flash Services PMI for the whole bloc also fell to 50.1 against the forecasted 54.6 and added pressure on EUR.

Apart from German Manufacturing PMI, all the PMI from the whole bloc, including biggest economies, came in against EUR, and hence, EUR/USD pair suffered. The data showed that only German manufacturing activity was expanded in August. At the same time, other countries, along with whole euro bloc’s manufacturing & services activities, were contracted in August. Meanwhile, the greenback was the top performer on Friday with DXY up by 0.5% on 93.5 level, the highest since Monday.

The U.S. Dollar was already supported by the release of Fed Meeting minutes on Wednesday, and on Friday, the support was extended after the release of positive PMI and Home Sales data.

At 18:45 GMT, the Flash Manufacturing PMI and the Flash Services PMI were released from the U.S. The Manufacturing PMI surged to 53.6 against the expected 51.9, and the Services PMI was surged to 54.u from the 50.9 forecasted. The expansion in the Manufacturing & Services sector of the U.S. gave strength to the U.S. dollar. At 19:00 GMT, the Existing Home Sales in July exceeded the expectations of 5.40M and came in as 5.86Mand supported the U.S. dollar.

The strong U.S. dollar exerted more pressure on EUR.USD prices and dragged them down at the ending day of the week. Meanwhile, the Euro currency was also under pressure because of the resurgence of coronavirus cases in Europe. In recent days France, Germany, and Italy have experienced their highest daily case counts since the spring, and Spain has found itself amid a major outbreak.

Over the past two weeks, Spain has seen Europe’s fastest rising caseload with 142 positive cases per 100,000 people. The number had risen more than 3,000 by the time the state of emergency ended on June 21.

The EUR/USD pair was also under pressure on Friday because of the possible entry of a new phase of the pandemic in Europe. 

Daily Technical Levels

Support Pivot Resistance
1.1787 1.1797 1.1807
1.1777 1.1817
1.1767 1.1827

 EUR/USD– Trading Tip

The EUR/USD pair fell sharply from 1.1954 level to 1.1790 level. For now, the pair is likely to find an immediate resistance at 1.1806 level, and a bullish breakout of 1.1806 level can lead EUR/USD prices towards 1.1886 level. On the lower side, the violation of the 1.1751 level can extend the selling trend until 1.1706.


GBP/USD – Daily Analysis

 The GBP/USD pair was closed at 1.30884 after placing a high of 1.32550 and a low of 1.30588. Overall the movement of GBP/USD pair remained bearish throughout the day. At 04:01 GMT, the GfK Consumer Confidence in August declined to -27 against the forecasted -25 and weighed on British Pound and added in the losses of GBP/USD pair. At 11:00 GMT, the Public Sector Net Borrowing increased to 25.9B from the expected 28.3B and supported British Pound. The Retail Sales for July also increased to 3.6% from the forecasted 2.0% and supported British Pound.

At 13:30 GMT, the Flash Manufacturing MI from Britain exceeded the expectations of 54.0 and came in as 55.3 and supported GBP. The Flash Services PMI also rose to 60.1 against the estimated 57.0 and supported GBP. At 15:00 GMT, the CBI Industrial Order Expectation in August was declined to -44 from the anticipated -34 and weighed on GBP/USD pair and added in its losses on Friday.

On the other hand, at 18:45 GTM, the Flash Manufacturing PMI from the U.S. surged to 53.6 from the anticipated 51.9 and supported the U.S. dollar that weighed on currency pair. The Flash Services PMI also surged to 54.8 against the anticipated 50.9 and supported the U.S. dollar. The Existing Home Sales exceeded the estimate of 5.40M and came in as 5.86M and supported the U.S. dollar that ultimately weighed on GBP/USD pair.

Meanwhile, on Brexit front, On Friday, the British and European Union negotiator made slight progress towards the post-Brexit trade deal in talks this week. Both sides were concerned that time to reach an agreement was running out before an end-year deadline.

The E.U. Chief negotiator, Micheal Barnier, said that those who were hoping for negotiations to move swiftly forward this week would be disappointed. However, his British counterpart, David Frost, said that a deal on post-Brexit relations was still possible and was still London’s goal, but it would not be easy to achieve.

Frost said that several significant areas remain to be resolved, and even when there was a broad understanding between negotiators, there was still much work to do as a time for both sides was short.

Britain shifted to be the leading country to ever leave the European Union on January 31 after 46 years of membership. Both sides are now negotiating a new partnership to be effective from 2021 on everything from trade and transport to energy and security. If both sides failed to reach an agreement, Britain would follow the World Trade Organization’s rules.

The attest round of talks between the U.K. & E.U. was also not fruitful, and it has decreased hopes for a post-Brexit deal. It means the hopes about the no-Brexit deal returned in the market and weighed on GBP/USD pair that caused a sudden fall in its prices on Friday.

The U.K. economy is also under pressure as the furlough scheme that has protected millions of jobs is scheduled to end in October. This would hit the labor market and increase unemployment, making it difficult to recover from the record 20% slump in the second quarter of this year.

These fears have also weighed on single currency Pound and kept the pair GBP/USD under pressure.

Daily Technical Levels

Support Pivot Resistance
1.3082 1.3092 1.3103
1.3071 1.3113
1.3062 1.3124

 GBP/USD– Trading Tip

On Monday, the GBP/USD pair is trading sideways above a strong support level if 1.3072. The support here is extended by 1.3074 level, where the bearish breakout of 1.3074 level can extend selling unto 1.3007 level. On the higher side, the next resistance is likely to be found around 1.3155 level. The 50 EMA and the technical indicators such as RSI, MACD, and 50 periods of EMA suggest a selling bias in the Cable. Let’s consider taking selling trades below 1.3075 level, while buying can be seen if the GBP/USD pair continues to close candles over 1.3075 level. 


USD/JPY – Daily Analysis

The USD/JPY pair was closed at 105.789 after placing a high of 106.070 and a low of 105.439. Overall the movement of USD/JPY remained almost flat yet slightly bullish. On Friday, the USD/JPY pair dropped in the first half of the day after the release of Japanese Manufacturing PMI and the persisting uncertainty due to ongoing geopolitical tensions. However, in the second half of the day, the USD/JPY pair recovered its early daily losses and rose to post slight gains amid better than expected U.S. economic data.

AT 04:30 GMT, the National Core CPI for the year declined to 0.0% from the estimated 0.1% and weighed on Japanese Yen. At 05:30 GMT, the Flash Manufacturing PMI from Japan in August rose to 46.6 against the estimated 45.0 and came in favor of Japanese Yen. The improvement in the manufacturing sector in Japan gave a push to Japanese Yen and dragged the pair USD/JPY to the lower level near 105.400.

However, after the release of positive macroeconomic data from the U.S., the USD/JPY pair started to rise and converted its daily losses in gains. At 18:45 GMT, the Flash Manufacturing PMI in August rose to 53.6 against the projected 51.9, and the Flash Services PMI rose to 54.8 against the anticipated 50.9.

The expansion in the U.S. manufacturing and services sector gave strength to the U.S. dollar that was more supported by the release of U.S. Existing Home Sales data. The Existing Home Sales in the U.S. for July rose to 5.86M from the anticipated 5.40M and gave a push to the U.S. dollar that added strength in USD/JPY pair.

The U.S. Dollar Index (DXY) that measures the value of the U.S. dollar against the basket of six major currencies rose by0.5% on Friday towards 93.5 level. It also helped USD/JPY pair to recover some of its daily losses on Friday.

Meanwhile, the ongoing geopolitical tensions between U.S. & China, along with the U.S. & Iran tensions, also kept the pair USD/JPY under pressure at the ending day of the week. On the US-China front, the US Trump administration denied acknowledging the plans to meet China over the discussion of implementations of the phase-one trade deal. The U.S. Commerce ministry spokesman Gao Feng said that in the coming days, the U.S. & China would hold meetings to discuss phase one trade deal.

However, the denial of any such meeting by Trump Administration added uncertainty in the market and kept the pair USD/JPY under pressure.

N the other hand, the U.S. called all U.N. sanctions to be restored on Iran after a violation of the 2015 nuclear deal. However, 13 out of 15 U.N. council members wrote against the U.S.’s request to impose sanctions on Iran as in 2018; the U.S. ended its legal terms with the 2015 nuclear deal by calling it the worst deal ever.

Meanwhile, the Chairman of China Banking and Insurance Regulatory Commission, Guo Shuqing said that the U.S. had placed domestic laws above international laws, which will affect the Chinese people and affect the whole world people including Americans. Shuqing also mentions that these sanctions by the U.S. on Hong Kong lacked legality and violated the market economy’s principles. The ongoing geopolitical tensions increased the uncertainty, which supported the Japanese Yen safe0haven status and contributed to the flat movement of the USD/JPY pair on Friday.

Daily Technical Levels

Support Pivot Resistance
105.7700 105.8500 105.9500
105.6700 106.0300
105.6000 106.1300


USD/JPY – Trading Tips

The USD/JPY is trading sideways in a broad trading range of 106.300 to 105.240. At the movement, the USD/JPY is tossing above and below 50 periods EMA, while the RSI and MACD are in support of a neutral trend. The recent series of Doji and Shooting start candles are suggesting indecision among traders. Sooner or later, we may see USD/JPY prices break out of the range. Once it happens, the USD/JPY may trade bullish over 106.300 to target 107.084. On the lower side, violation of 105.240 level can drive selling unto 104.300. Good luck! 

Categories
Forex Market Analysis

Daily F.X. Analysis, August 21 – Top Trade Setups In Forex – Eyes in PMI Figures! 

On the news front, eyes will remain on the Manufacturing PMI and Services PMI figures from the Eurozone, U.K., and the United States. Almost all economic figures are expected to perform better than previous months, perhaps due to the lift of lockdown. Price action will depend upon any surprise changes in the PMI figures.

Economic Events to Watch Today  


EUR/USD – Daily Analysis

Today in the Asian trading hours, the EUR/USD currency pair has succeeded in stopping its Thursday’s losing streak and continues to gain positive traction just closer to 1.1900 level, mainly due to the broad-based U.S. dollar weakness, triggered by the dismal U.S. Jobless Claims data. The upbeat market sentiment and on-going uncertainty surrounding the much-awaited U.S. fiscal stimulus also weighed on the safe-haven U.S. dollar and contributed to the currency pair gains. 

Across the pond, the shared currency continues to gaining bullish traction as most of the investors believe that the European Union (E.U.) will reach an agreement on a coronavirus recovery package for its members in late July. This, in turn, the currency pair has been flashing green since the week start. On the contrary, the rising coronavirus cases in Germany and France turned out to be a major factor that kept the lid on any further gains in the currency pair. 

As of writing, the EUR/USD currency pair is currently trading at 1.1882 and consolidates in the range between the 1.1856 – 1.1883. However, traders are cautious about placing any strong position ahead of German PMI. Moving on, the currency pair will likely put further bids if the preliminary German and Eurozone Markit manufacturing, services and composite PMI data for August blow past expectations on the day, this, in turn, bolstering hopes for faster economic recovery. On the contrary, the said, EUR/USD’ currency pair may face losses and revisit Thursday’s low of 1.18 if the German and Eurozone data prints below estimates. 

However, this data is scheduled to release at 07:30 GMT, and it is anticipated that German Manufacturing PMI increased to 52.5 from July’s 51. But, the progress pace in the activity is expected to have increased in August. Likewise, the Eurozone Manufacturing PMI is anticipated to increase to 52.9 from 51.8. Thus, the above-forecast data will fuel recovery hopes and decrease the case for further monetary stimulus from the European Central Bank. 

On the flip side, the data published by the U.S. showed that 1.106 million Americans declared unemployment benefits during the previous week, exceeding the anticipated 925,000 claims and last Thursday’s 971,000 figure. As a result, the U.S. dollar failed to maintain its previous Fed-gains and edged lower. 

In the meantime, the U.S. House Speaker Nancy Pelosi stated, This time seems not right for a smaller coronavirus relief bill.” The Democrat earlier showed a willingness to cut the aid package amount demand in half to renew hopes of America’s much-awaited stimulus. But as of now, the uncertainty remains on the cards amid the policymaker’s differences.

As in result, the broad-based U.S. dollar reported losses on the day as the possibility of the U.S. Congress agreeing to a fiscal stimulus bill this month has weakened amid political differences, which eventually destroyed hopes for a quick U.S. economic recovery. As well as, the doubts over the U.S. economy recover further fueled after the dismal US Jobs data. However, the losses in the U.S. dollar helped the currency pair to stay higher. Whereas, the U.S. Dollar Index that tracks the USD against a bucket of other currencies was down, inching down 0.09% to 92.692 by 10:13 PM ET (3:13 AM GMT).

At the coronavirus front, the figures of coronavirus cases increasing day by day. Whereas, the total number of cases crossed more than 231,284 figures so far, as per the report of German disease and epidemic control center, Robert Koch Institute (RKI). Although, these fears have been playing a negative role to cap further gains in the currency pair.

The market traders will keep their eyes on the German and Eurozone Markit manufacturing, services, and composite PMI Data. As well as, the headlines concerning the US COVID-19 aid package, virus figures, and Sino-American trade can also impact the pair’s movement.

Daily Technical Levels

Support Pivot Resistance
1.1817 1.1843 1.1884
1.1775 1.1911
1.1749 1.1952

 EUR/USD– Trading Tip

The EUR/USD pair has violated the sideways range of 1.1853 to 1.1830, and now it’s heading higher towards the next technical resistance level of 1.1915 level. On the lower side, the EUR/USD is likely to gain support at the 1.1860 level. Below 1.1860, the next support is likely to be found around the 1.1832 level. The bullish bias remains dominant today.


GBP/USD – Daily Analysis

The GBP/USD pair was closed at 1.32135 after placing a high of 1.32246 and a low of 1.30642. Overall the movement of GBP/USD pair remained bullish throughout the day. The Pound continued its strength against the U.S. dollar on Thursday amid increased hopes that the U.K. and E.U. will find a breakthrough in the latest round of post-Brexit talks that will conclude on Friday.

Few investors were betting that both sides will be able to find common ground on the key sticking issues, including access to British fishing waters and the level playing field rules, as the latest round of talks is set to end on Friday. The level playing field rules consist of a set of standard rules to ensure firms in the U.K. and E.U. compete on an equal footing, and Britain has been arguing against it.

The rise in GBP/USD pair on Thursday was followed by the increased optimism around the Brexit talks and the broad-based U.S. dollar weakness amid poor than expected U.S. jobless claims.

Investor’s focus has now shifted more towards the final round of Brexit talks in September, to see whether a deal could be reached. E.U. Brexit negotiator Michel Barnier has said that an agreement should be agreed by October to allow the E.U. to ratify the deal.

It has already clear that if no deal was agreed between U.K. and E.U., then U.K. will follow the WTO terms, which will be harsh than the current trade agreement that will lapse at the end of Brexit transition period on December 31.

However, earlier Prime Minister Boris Johnson decided against extending the transition period beyond the end of 2020 and signaled optimism that a deal could be reached by the fall, it triggered bullish momentum in the GBP/USD pair.

On the U.S. front, the Philly Fed Manufacturing Index declined to 17.2 from the expected 21.0 and weighed on the U.S. dollar. The Unemployment Claims from last week also rose to 1106K from the expected 930K and weighed on the U.S. dollar. The weak U.S. dollar added gains in the GBP/USD pair and closed the day with a strong bullish candle.

On Friday, the Retail Sales and Public Net Borrowings from Britain, along with the Consumer Confidence and Manufacturing & Services PMI data, will release that will impact on GBP/USD pair. The more important release will be the result of the latest Brexit talks with E.U. that will strongly impact the GBP/USD pair. From the U.S. side, the Flash manufacturing & Services PMI data will remain under focus by investors.

 Daily Technical Levels

Support Pivot Resistance
1.3108 1.3167 1.3271
1.3005 1.3329
1.2946 1.3433

 GBP/USD– Trading Tip

On Friday, the GBP/USD pair is trading at 1.3250 level, and the pair was trading in between an ascending triangle pattern that has now been violated. The triangle pattern was extending resistance at 1.3125 level, and above this, the next resistance is likely to be found around 1.3267 level. At the same time, the support stays at 1.3186 and 1.3137 level. Bullish bias seems dominant today.


USD/JPY – Daily Analysis

The USD/JPY pair was closed at 106.111 after placing a high of 106.150 and 105.101. Overall the movement of the USD/JPY pair remained bullish throughout the day. After falling for three consecutive days, the USD/JPY pair rose sharply and reached above 106.00 level on Wednesday amid broad-based U.S. dollar strength. 

The FOMC minutes of the July meeting revealed that policymakers supported cap bond yields and made it unlikely for the Fed to introduce yield curve control in September. In response to Fed minutes, the U.S. Dollar Index rose above 93 levels, and the U.S. 10-year Treasury yields rose about 0.9% and supported the U.S. dollar that ultimately gave strength to USD/JPY pair on Wednesday.

The sharp rally in USD/JPY was also supported by the comments of a senior Trump administration official who said that a new stimulus relief bill of small amount than $1 trillion or $3 trillion could be agreed upon and provide strength to the economy. He proposed a new bill of $500 billion as the previously expected stimulus bills proposed by Republicans & Democrats was failed to reach a consensus. This new bill also raised hopes and supported the U.S. dollar that pushed USD/JPY prices further on the upside.

On the data front, at 04:50 GMT, the Core Machinery Orders in June from Japan declined to -7.6% from the previous 1.7% and fell short of the expected 2.1% and weighed on Japanese Yen that added strength to the advancing USDJPY pair. Whereas, the Trade Balance from Japan showed a deficit of -0.03T against the forecasted -0.44T and the previous -0.41T and supported Japanese Yen.

On the other hand, the US-China relations were further dented after Donald Trump revealed the main reason behind the delay in review meetings between U.S. & Chinese officials on August 15 on Wednesday. According to Trump, he was furious over Beijing’s handling of coronavirus situations and disturbing the global economy, and that was the reason he canceled the review meeting. He said that he did not want to meet China for now.

The negative statement a day after blacklisting the Chinese telecom Huawei group in America escalated the tensions further and weighed on risk sentiment. This helped the U.S. dollar gain strength against its safe-haven status and raised the USD/JPY pair in the market.

Mark Meadows, the White House Chief of Staff, informed on Wednesday that no new high-level talks were rescheduled between the U.S. & China as two sides were already in touch regarding the implementation of the phase-one trade deal. This raised the risk sentiment and weighed on Japanese Yen that ultimately added gains in USD/JPY pair.

Daily Technical Levels

Support Pivot Resistance
105.6200 105.9200 106.1000
105.4300 106.4100
105.1300 106.5900


USD/JPY – Trading Tips

The USD/JPY has violated the upward trendline support level of 106.345, as it fell sharply in the wake of increased safe-haven appeal in the market. At the movement, the USD/JPY pair is holding below 50 periods EMA, while the RSI and MACD are in support of bearish trend. The recent candle is closing above 105.344 level, suggesting strong odds of bullish correction until 106. However, the violation of 106 can lead to USD/JPY prices towards the 104.600 support level. Good luck! 

Categories
Crypto Market Analysis

Daily Crypto Review, August 21 – OMG Network Token Up Over 100% Today; Tether Moving 1 Billion USDT From Tron to Ethereum Blockchain

While most of the top cryptocurrencies took the day to consolidate or advance slightly, Ethereum tokens were the most volatile and moved up or down with much more intensity. Bitcoin is currently trading for $11,835, which represents an increase of 0.56% on the day. Meanwhile, Ethereum gained 1.39% on the day, while XRP gained 1.01%.

 Daily Crypto Sector Heat Map

When taking a look at top100 cryptocurrencies, OMG Network gained 106.88% on the day, making it the most prominent daily gainer. 0x (48.58%) and Flexacoin (42.15%) also did great. On the other hand, Ren lost 14.05%, making it the most prominent daily loser. It is followed by Reserve Rights’ loss of 7.07% and Waves’ drop of 6.93%.

Top 10 24-hour Performers (Click to enlarge)

Bottom 10 24-hour Performers (Click to enlarge)

Bitcoin’s dominance level has decreased slightly and went under the 60% mark yet again, with its value currently at 59.74%. This value represents a 0.7% difference to the downside when compared to our last report.

Daily Crypto Market Cap Chart

The cryptocurrency market cap experienced a sharp increase in value over the course of the day. Its current value is $373.17 billion, which represents an increase of $9.41 billion when compared to our previous report.

_______________________________________________________________________

What happened in the past 24 hours?

_______________________________________________________________________

_______________________________________________________________________

Technical analysis

_______________________________________________________________________

Bitcoin

After a failed breakout of the ascending triangle, Bitcoin’s price started moving down sharply towards $11,630. The move, as we noted in our previous articles, stopped there. Bitcoin spent the past 24 hours mostly consolidating after a brief moment of bullish presence, which brought its price above $11,800 levels.

This move towards the upside, no matter how small it is, shows that Bitcoin is in a great spot at the moment, and it would take a lot to shake it out of this extremely bearish mid-term position.

BTC traders should be looking for a trade above $12,000, or after the push towards it fails.

BTC/USD 4-hour Chart

Technical factors:
  • Price is at its 50-period EMA and below its 21-period EMA
  • Price slightly below its middle band
  • RSI is neutral (48.45)
  • Volume is average (descending)
Key levels to the upside          Key levels to the downside

1: $12,015                                1: $11,630

2: $12,300                                2: $11,460

3: $12,900                                 3: $11,090

Ethereum

Ethereum spent the day struggling at the $415 level, as the fight for whether it will end up above or below the level is still continuing. The second-largest crypto by market cap recovered from its drop to $395 after hitting a semi-descending line, which acted as support/resistance since Aug 5.

This fight for $415 clearly shows the fight between two mindsets: bulls who are extremely bullish when it comes to DeFi and everything related, and bears which are scared of the skyrocketing ETH transaction fees as well as of the ICO scenario that happened around 2017.

Ethereum traders should wait for ETH to establish itself above or below $415 before trading.

ETH/USD 4-hour Chart

Technical Factors:
  • Price is currently at its 21-period and its 50-period EMA
  • Price is at its middle band
  • RSI is neutral (47.15)
  • Volume is slightly below average
Key levels to the upside          Key levels to the downside

1: $415                                     1: $400

2: $445                                     2: $361

3: $496                                      3: $340

Ripple

XRP’s chart looks a lot like BTC’s chart in the past couple of days. The third-largest cryptocurrency by market cap stopped moving towards the downside after hitting $0.285, which held up quite nicely. XRP then got a small boost towards the $0.29, where it is now consolidating.

With both 21-period and 50-period moving averages right above the price, XRP would require a strong bullish initiative in order to move towards $0.31, which (at the moment) seems unlikely.

Traders can look for an entry within the range between $0.285 and $0.31.

XRP/USD 4-hour Chart

Technical factors:
  • Price is currently below the 21-period and 50-period EMA
  • Price is slightly below the middle band
  • RSI is neutral (46.15)
  • Volume is descending (approaching average)
Key levels to the upside          Key levels to the downside

1: $0.31                                     1: $0.285 

2: $0.32                                     2: $0.266

3: $0.332                                  3:$0.2454


Categories
Forex Market Analysis

Daily F.X. Analysis, August 20 – Top Trade Setups In Forex – Jobless Claims In Focus! 

The news site of the market is likely to offer high impact events from the U.S. while the major focus will remain on the Philly Fed Manufacturing Index and Unemployment Claims. U.S. dollar may exhibit mixed bias until the release of these events as Philly fed manufacturing is expected to perform badly, and the Jobless claims are likely to perform well.

Economic Events to Watch Today  


EUR/USD – Daily Analysis

The EUR/USD currency pair has stopped its previous day bearish streak and recovered from the 27-month lows amid speculative interests and strong bond auction. However, the recent declines in the currency pair from near two-year highs of 1.1956 were mainly directed by a broad-based U.S. dollar recovery. As of now, the broad-based Us dollar has erased some of its gains but still hovering on the bullish track. This, in turn, the currency pair became able to put some modest bids and stop its previous losing streak. 

On the EUR side, the ongoing rise in new coronavirus cases in Spain, Germany, France, and Italy has been fueling the fears over the second-wave of the virus across Europe, which might put the shared currency under pressure and become the key factor that will cap any upside in the currency pair. At the moment, the EUR/USD currency pair is currently trading at 1.1843 and consolidating in the range between the 1.1831 – 1.1857. Moving on, the traders seem cautious to place any strong bids ahead of U.S. Jobless Claims and ECB minutes.

The broad-based U.S. dollar has many things to cheer on the day. Be it the weaker pace of surge in the COVID-19 cases from New York and Florida or hopes of the U.S. stimulus package, not to forget the latest Federal Open Market Committee (FOMC) minutes, which showed that the officials lacked support for the yield curve control, as one of the policy options. However, the broad-based U.S. dollar was being supported by all these things.

However, the ongoing worries about the growing coronavirus case in most places and worsened US-China relations also helped the U.S. dollar put the safe-haven bids. Despite the ongoing coronavirus (COVID-19) and Sino-American tensions, the U.S. President Donald Trump gave the latest warning during the daily press conference that the U.S. is going to announce punitive measures Iran. As per the keywords, “U.S. intends to restore nearly all U.N. sanctions on Iran.” In the meantime, the American Secretary of State Mike Pompeo also warned the Dragon Nation and Russia not to interfere in this matter to save Tehran as they did in the recent past. However, these lingering tension kept the market trading sentiment under pressure and provided support to the U.S. dollar as safe-haven status.

It is worth mentioning that the minutes from the July Fed meeting released Yesterday pushed back against additional measures like the yield curve control, under which the central bank targets a specific yield level at the short or long end of the curve. Meanwhile, the Federal Reserve indicated that it would think about changing its monetary policy to stick to dynamic monetary policy for far extended than previously expected. 

Across the pond, the intensifying coronavirus virus cases in Germany and France fueled the fears of fresh lockdowns in Europe’s biggest economies, which might weigh on the shared currency. As per the latest report, the reported coronavirus cases increased to 226,914, with a total of 9,243 deaths on Wednesday. Whereas, the cases raised by 1,510 in Germany on Wednesday against Tuesday +1,390. The death toll rose by 7, as per the German disease and epidemic control center report, Robert Koch Institute (RKI).

Looking forward, the market traders will keep their eyes on the U.S. Jobless Claims, Philly Fed Manufacturing Survey, and the European Central Bank (ECB) policy meeting minutes, which is scheduled to release later today. The headlines concerning the US COVID-19 aid package, virus figures, and Sino-American trade will not lose its importance.

Daily Technical Levels

Support Pivot Resistance
1.1792 1.1873 1.1916
1.1749 1.1997
1.1668 1.2041

 EUR/USD– Trading Tip

The EUR/USD pair is trading in a sideways range of 1.1853 to 1.1830, and violation of this range can determine further trends in the market. On the higher side, the EUR/USD can trade bullish until 1.1885 level on the breakout of 1.1850. On the lower side, a breakout of the 1.1830 level can lead EUR/USD until the 1.1792 level.


GBP/USD – Daily Analysis

The GBP/USD pair was closed at 1.30986 after placing a high of 1.32670 and a low of 1.30934. Overall the movement of GBP/USD pair remained bearish throughout the day. The GBP/USD pair lost all of its previous day gins and declined on Wednesday amid the broad-based U.S. dollar strength after the FOMC meeting minutes were released.

In the early daily session, the GBP/USD pair rose to its highest since last week of December 2019 on the back of better than expected macroeconomic data from the United Kingdom but failed to maintain gains and dropped below 1.310 level. The decline was backed by the sudden strength in the U.S. dollar after the Trump administration proposed another stimulus relief bill.

In the early trading session, the Consumer Price Index from Great Britain was released at 11:00 GMT that rose to 1% from the expected 0.6% and supported GBP. The year’s Core CPI also rose to 1.8% against the estimated 1.3% and the previous 1.4% and supported GBP. The Sterling was again supported after the release of PPI Input for July that surged to 1.8% from the forecasted 1.1%. In July, the PPI Output also rose from the expected 0.2% but remained flat with the previous 0.3%. The Raw-Material Price Index for the year from the U.K. increased to 1.6% from the previous 1.1% and exceeded the expectations of 1.2%. AT 13:30 GMT, the Housing Price Index for the year came in as 2.6%.

The positive and better than expected macroeconomic data from the U.K. gave strength to Pound that took the currency pair GBP/USD to its 8th month highest level at 1.32670. However, in the late trading session after the release of FOMC meeting minutes, the GBP/USD pair started to decline and lost all of its gains from Tuesday.

The minutes revealed that the FOMC was worried about the economic recovery, while some members of the committee suggested that to promote the economic recovery and achieve the 2% inflation target, additional accommodation was necessary.

Furthermore, as opposed to the $1 trillion or $3 trillion stimulus package, a new stimulus relief bill was proposed by the Trump administration on Wednesday of worth $500 Billion. It came in as the consensus on previously recommended bills by Democrats and Republicans has not been achieved yet. This raised hopes and U.S. dollar bars in the market and added additional losses in the GBP/USD currency pair.

Meanwhile, the Brexit talks have been resumed, and outlook of talks still suggested differences as several media reports suggested that U.K. wanted British truckers to be able to pick up and drop off goods both inside E.U. countries and between them. But Brussels has denied as they consider the proposal fundamentally unbalanced, this also weighed on GBP/USD pair on Wednesday.

 Daily Technical Levels

Support Pivot Resistance
1.3037 1.3153 1.3212
1.2978 1.3328
1.2862 1.3388

 GBP/USD– Trading Tip

On Thursday, the GBP/USD pair is trading at 1.3250 level, and the pair was trading in between an ascending triangle pattern that has now been violated. The triangle pattern was extending resistance at 1.3125 level, and above this, the next resistance is pretty much likely to be found around 1.3267 level. At the same time, the support stays at 1.3186 and 1.3137 level. Bullish bias seems dominant today.


USD/JPY – Daily Analysis

The USD/JPY pair was closed at 106.111 after placing a high of 106.150 and 105.101. Overall the movement of the USD/JPY pair remained bullish throughout the day. After falling for three consecutive days, the USD/JPY pair rose sharply and reached above 106.00 level on Wednesday amid broad-based U.S. dollar strength. 

The FOMC minutes of the July meeting revealed that policymakers supported to cap bond yields and made it unlikely for the Fed to introduce yield curve control in September. In response to Fed minutes, the U.S. Dollar Index rose above 93 levels, and the U.S. 10-year Treasury yields rose about 0.9% and supported the U.S. dollar that ultimately gave strength to USD/JPY pair on Wednesday.

The sharp rally in USD/JPY was also supported by the comments of a senior Trump administration official who said that a new stimulus relief bill of small amount than $1 trillion or $3 trillion could be agreed upon and provide strength to the economy. He proposed a new bill of $500 billion as the previously expected stimulus bills proposed by Republicans & Democrats was failed to reach a consensus. This new bill also raised hopes and supported the U.S. dollar that pushed USD/JPY prices further on the upside.

On the data front, at 04:50 GMT, the Core Machinery Orders in June from Japan declined to -7.6% from the previous 1.7% and fell short of the expected 2.1% and weighed on Japanese Yen that added strength to the advancing USDJPY pair. Whereas, the Trade Balance from Japan showed a deficit of -0.03T against the forecasted -0.44T and the previous -0.41T and supported Japanese Yen.

On the other hand, the US-China relations were further dented after Donald Trump revealed the main reason behind the delay in review meetings between U.S. & Chinese officials on August 15 on Wednesday. According to Trump, he was very angry over Beijing’s handling of coronavirus situations and disturbing the global economy, and that was the reason he canceled the review meeting. He said that he did not want to meet China for now.

The negative statement a day after blacklisting the Chinese telecom Huawei group in America escalated the tensions further and weighed on risk sentiment. This helped the U.S. dollar to gain strength against its safe-haven status and raised the USD/JPY pair in the market.

Mark Meadows, the White House Chief of Staff, informed on Wednesday that no new high-level talks were rescheduled between the U.S. & China as two sides were already in touch regarding the implementation of the phase-one trade deal. This raised the risk sentiment and weighed on Japanese Yen that ultimately added gains in USD/JPY pair.

Daily Technical Levels

Support Pivot Resistance
105.4100 105.7800 106.4600
104.7200 106.8400
104.3500 107.5200


USD/JPY – Trading Tips

The USD/JPY has violated the upward trendline support level of 106.345, as it fell sharply in the wake of increased safe-haven appeal in the market. At the movement, the USD/JPY pair is holding below 50 periods EMA, while the RSI and MACD are in support of bearish trend. The recent candle is closing above 105.344 level, suggesting strong odds of bullish correction until 106. However, the violation of 106 can lead to USD/JPY prices towards the 104.600 support level. Good luck! 

Categories
Crypto Market Analysis

Daily Crypto Review, August 20 – ETH Plummets Due To Skyrocketing Transaction Fees; $12,000 Level Too Strong For Bitcoin

While most of the top cryptos had a slightly red day, Ethereum tokens mostly did great. Bitcoin is currently trading for $11,732, which represents a decrease of 0.25% on the day. Meanwhile, Ethereum lost 1.26% on the day, while XRP lost 1.24%.

 Daily Crypto Sector Heat Map

When taking a look at top100 cryptocurrencies, OMG Network gained 26.67% on the day, making it the most prominent daily gainer. yearn.finance (20.13%) and Qtum (10.04%) also did great. On the other hand, Balancer lost 19.84%, making it the most prominent daily loser. It is followed by Compound’s loss of 9.50% and Waves’ drop of 8,97%.

Top 10 24-hour Performers (Click to enlarge)

Bottom 10 24-hour Performers (Click to enlarge)

Bitcoin’s dominance level has increased slightly and passed the 60% mark, with its value currently at 60.44%. This value represents a 0.77% difference to the upside when compared to our last report.

Daily Crypto Market Cap Chart

The cryptocurrency market cap experienced a slight increase in value over the course of the day. Its current value is $364.76 billion, which represents an increase of $0.56 billion when compared to our previous report.

_______________________________________________________________________

What happened in the past 24 hours?

_______________________________________________________________________

_______________________________________________________________________

Technical analysis

_______________________________________________________________________

Bitcoin

After a brief break of the $12,000 level, Bitcoin fell down and is controlled by BTC bears for the second day in a row. The largest cryptocurrency by market cap has moved towards the $11,630 support level (as we said in our previous article) and tried to test its strength. The level held up, and Bitcoin is now consolidating right above it.

This bear push was caused by several factors, but mostly because of the immense resistance at around $12,000 and the challenges Ethereum faces with its incredibly high transaction fees (Bitcoin acts as a “representative” to all the cryptos, so it affects others, but is also affected by others).

BTC traders should be looking for a trade when Bitcoin breaks $11,630 to the downside or pushes towards $12,000 again.

BTC/USD 4-hour Chart

Technical factors:
  • Price is below its 50-period EMA and its 21-period EMA
  • Price is between its lower and middle band
  • RSI is slightly tilted towards the oversold area (41.97)
  • Volume is average
Key levels to the upside          Key levels to the downside

1: $12,015                                1: $11,630

2: $12,300                                2: $11,460

3: $12,900                                 3: $11,090

Ethereum

Even though Ethereum’s social sentiment is still extremely high due to the craze over DeFi, it is a fact that ETH’s transaction fees have been skyrocketing as the demand for DeFi increased. This fact, along with Bitcoin not being able to break the $12,000 mark, caused the second-largest cryptocurrency by market cap to drop below its $415 support level (now resistance). The drop stopped around $400 and changed direction, trying to retake its previous highs. However, the $415 resistance level confirmed its strength, leaving ETH below it.

Ethereum traders should look for a trade when ETH breaks $415 to the upside.

ETH/USD 4-hour Chart

Technical Factors:
  • Price is currently below its 21-period and its 50-period EMA
  • Price is slightly above its lower band
  • RSI is descending (39.54) and approaching oversold levels
  • Volume is average
Key levels to the upside          Key levels to the downside

1: $415                                     1: $400

2: $445                                     2: $361

3: $496                                      3: $340

Ripple

XRP has had quite a bad day, as it essentially nullified any previous moves towards the upside. The third-largest cryptocurrency by market cap dropped to $0.285 levels (and even below it at one point). While the level held up and secured XRP’s position above it, for the time being, XRP does not look like it will make another move towards the upside soon.

Traders can look for a trade when XRP breaks $0.285 to the downside.

XRP/USD 4-hour Chart

Technical factors:
  • Price is currently below the 21-period and 50-period EMA
  • Price is slightly above the lower band
  • RSI is neutral (40.49)
  • Volume is descending (though it is slightly elevated)
Key levels to the upside          Key levels to the downside

1: $0.31                                     1: $0.285 

2: $0.32                                     2: $0.266

3: $0.332                                  3:$0.2454


Categories
Forex Market Analysis

Daily F.X. Analysis, August 19 – Top Trade Setups In Forex – Eyes on FOMC Meeting Minutes! 

On the news front, the eyes will remain on the FOMC Meeting Minutes, which are not expected to show a rate change but will help us understand U.S. economic situation and policymakers’ stance on it. Besides, the Inflation reports from the U.K. and Eurozone are also likely to drive some price action during the European session today.

Economic Events to Watch Today  


EUR/USD – Daily Analysis

The EUR/USD pair was closed at 1.19308 after placing a high of 1.19654 and a low of 1.1863. Overall the movement of the EUR/USD pair remained bullish throughout the day. The EUR/USD pair rose and extended its gains for the 6th consecutive day on Tuesday amid heavy selling pressure surrounding the greenback. The pair EUR/USD surged to its highest level since May 2018 amid broad-based U.S. dollar weakness as it followed the U.S. Treasury bond yields.

The U.S. Treasury bond yield on 10-year note lost more than 4% on the day, and the U.S. Dollar Index fell to its lowest daily close in more than two years at $92.30. Other than the persistent sell-off in the U.S. dollar, the single currency Euro found extra sustain in the solid appetite for riskier assets on the back of strong hopes over a moderate economic recovery in the region. It was increased by the news that a coronavirus vaccine could be out sooner than expected.

The risk sentiment was also supported by the investors’ confidence about the strength of the U.S. economic recovery, helped by strong earnings from retail giants Home Depot and Walmart.

The stocks were up on Tuesday as S&P 500 futures rose by 0.2%, the Dow futures contract rose by 0.4%, and while Nasdaq 100 futures moved up by 0.3%. According to a fund manager survey from Bank of America on Tuesday, showed that investors were at their most bullish trend on financial markets since February. The rise in the equity market helped increase risk appetite and EUR that is a riskier asset gained from such activity in the market.

On the data front, there was no macroeconomic data to be released from the Europe side; however, from the U.S. side, at 17:30 GMT, the Building Permits exceeded the expectations of 1.33M and came in as 1.50M in July in comparison of 1.26M of June and supported U.S. dollar. The Housing Starts also rose to 1.50M and exceeded the forecast of 1.23M and supported the U.S. dollar. Positive data from the U.S. side supported the dollar and limited the additional gains in EUR/USD pair on Tuesday.

On Wednesday, the Eurostat will release the inflation report for the Euro area. Markets expect the Core Consumer Price Inflation that excludes the volatile food and energy prices to remain flat at 1.2% on a yearly basis.

From the U.S. side, the FOMC meeting minutes will also be released to provide fresh clues about the movement of the EUR/USD pair.

Daily Technical Levels

Support Pivot Resistance
1.1873 1.1920 1.1975
1.1818 1.2022
1.1772 1.2077

 EUR/USD– Trading Tip

The EUR/USD pair has already violated the resistance level of 1.1912 level, which is now working as a support. On the 4 hour timeframe, the pair is supported by an upward channel at 1.1915, while the resistance stays at 1.1962 level. Bullish bias seems dominant, and it may lead the EUR/USD prices towards the 1.1998 level today. The RSI, MACD, and 50 EMA are all in support of buying trends. 


GBP/USD – Daily Analysis

The GBP/USD pair was closed at 1.32373 after placing a high of 1.32496 and a low of 1.30924. Overall the movement of GBP/USD pair remained strongly bullish. The GBP/USD pair continued to extend gains and rose for 4th consecutive day on Tuesday on the back of a combination of factors. The uncertainty over the next round of U.S. stimulus aid to support the U.S. economic recovery from the coronavirus pandemic has depressed the U.S. dollar. The falling U.S. Treasury bond yields further weighed on the already declining greenback and added gains in the GBP/USD pair.

The Sterling hit 8-months high on Tuesday as a new round of Brexit talks began, and the U.K. still believes that it can agree on a post-Brexit trade deal with the E.U. next month. On Tuesday ahead of the Brexit talks, a European Commission spokesman said that a deal would need to be agreed on by October. On the other hand, Mr. Barnier said that this date required an agreement to be ratified before the U.K.’s current post-Brexit transition period ends in December.

After the last round of negotiations in London, Barnier accused the U.K. of not showing willingness to break the deadlock over difficult issues. In response, David Frost replied that the E.U. had offered to break the deadlock but failed to honor the fundamental principles that the U.K. had repeatedly made clear.

On the data side, at 17:30 GMT, the Building Permits from the United States was increased to 1.50M from the forecasted 1.33M in July, and the Housing Starts also rose to 1.50 M from the expected 1.23M and supported U.S. dollar. The economic figures from the U.S. were mostly ignored by the investors as the focus was all shifted towards the new round of Brexit talks.

However, the U.S. dollar was weak across the board on Tuesday as the U.S. Dollar Index collapsed to its lowest level in more than two years at 92.28 and was having a tough time recovering. This added pressure on the greenback and added gains in the GBP/USD pair on Tuesday.

However, the losses in the U.S. dollar helped the currency pair to take bids on the day. 

 Daily Technical Levels

Support Pivot Resistance
1.3136 1.3193 1.3291
1.3037 1.3349
1.2980 1.3447

 GBP/USD– Trading Tip

The GBP/USD pair is trading at 1.3250 level, and the pair was trading in between an ascending triangle pattern that has now been violated. The triangle pattern was extending resistance at 1.3125 level, and above this, the next resistance is pretty much likely to be found around 1.3267 level. At the same time, the support stays at 1.3186 and 1.3137 level. Bullish bias seems dominant today.


USD/JPY – Daily Analysis

The USD/JPY pair was closed at 105.407 after placing a high of 106.050 and a low of 105.281. Overall the movement of the USD/JPY pair remained bearish throughout the day. The USD/JPY pair moved to a fresh 2-week lowest level around 105.20 regions after the U.S. dollar selling pressure picked up pace during the late session.

The currency pair witnessed some strong follow-through selling for the third consecutive session and extended its bearish slide from 107.00 level. The downfall in USD/JPY pair was exclusively sponsored by the broad-based U.S. dollar weakness under pressure due to impasse over the next round of U.S. fiscal stimulus measures.

The additional pressure on the U.S. dollar was exerted by the declining U.S. Treasury bond yields that undermined the already weak sentiment across the greenback. The U.S. Treasury bond yield on the 10-year note fell by 2.8% on Tuesday that weighed on the U.S. dollar.

Apart from the U.S. Treasury, the escalating tensions between the U.S. & China, drove some safe-haven flows towards the Japanese Yen that further added in the downward momentum of USD/JPY pair on Tuesday.

Meanwhile, the positive opening in the U.S. equity markets failed to impress the bullish traders, and the pair USD/JPY continued moving in the downward direction and closed its day near the monthly low that was set on August 6.

On the data front, at 01:00 GMT, the TIC Long-Term Purchases for June exceeded the forecast of 108.0B and came in as 113.0B and supported the U.S. dollar. At 17:30 GMT, the Building Permits from the U.S. rose to 1.50M against the projected 1.33Mand the Housing starts rose to 1.50M from the projected 1.23Mand supported U.S. dollar that helped limit the additional losses in pair.

There was no news regarding the date of the review of the phase-one trade deal between both nations on the US-China front. It is expected that the review will be published after the targets of U.S. purchases by China will be met.

As per the deal, China has to increase its purchases of U.S. farm and manufactured products, energy, and services by $200 billion over the next two years. So far, China has made imports of products from the U.S. worth about $40.2 billion that is less than 50%. China still has far to go to meet the requirement as it was affected by the pandemic induced lockdowns; however, ever since the lockdown has been eased, China’s imports have increased. U.S. officials have said that they were satisfied with the trade deal progress so far.

On the negative side, the blacklisting of Huawei’s telecom group on Yesterday raised concerns regarding the escalated tensions between China & the U.S. and supported the bearish trend in the USD/JPY pair.

Daily Technical Levels

Support Pivot Resistance
105.1100 105.5900 105.9000
104.8000 106.3800
104.3100 106.6900


USD/JPY – Trading Tips

The USD/JPY has violated the upward trendline support level of 106.345, as it fell sharply in the wake of increased safe-haven appeal in the market. At the movement, the USD/JPY pair is holding below 50 periods EMA, while the RSI and MACD are in support of bearish trend. The recent candle is closing above 105.344 level, suggesting strong odds of bullish correction until 106. However, the violation of 106 can lead to USD/JPY prices towards the 104.600 support level. Good luck! 

Categories
Crypto Market Analysis

Daily Crypto Review, August 19 – Cryptos Heavily in the Red, YFI Token Breaks $11,000 and Approaches BTC’s Price Level

Almost every single cryptocurrency in the top100 was in the red today after Bitcoin broke $12,000 to the downside. Bitcoin is currently trading for $11,685, which represents a decrease of 4.7% on the day. Meanwhile, Ethereum lost 5.56% on the day, while XRP lost 9.4%.

 Daily Crypto Sector Heat Map

When talking about top100 cryptocurrencies, yearn.finance gained 19.51% on the day, making it the most prominent daily gainer. THETA (17.62%) and Swipe (17.28%) also did great. On the other hand, Numeraire lost 10.95%, making it the most prominent daily loser. It is followed by BitTorrent’s loss of 10.14% and Fetch.ai’s drop of 9.94%.

Top 10 24-hour Performers (Click to enlarge)

Bottom 10 24-hour Performers (Click to enlarge)

Bitcoin’s dominance level has increased slightly (even though it is still under the 60% mark), with its value currently at 59.77%. This value represents a 0.13% difference to the upside when compared to our last report.

Daily Crypto Market Cap Chart

The cryptocurrency market cap experienced a decrease in value over the course of the day. Its current value is $364.20 billion, which represents a decrease of $20 billion when compared to our previous report.

_______________________________________________________________________

What happened in the past 24 hours?

_______________________________________________________________________

_______________________________________________________________________

Technical analysis

_______________________________________________________________________

Bitcoin

After finally breaking $12,000 with confidence, Bitcoin is now falling hard below it (click on the arrow of the image). The largest cryptocurrency by market cap is dropping below $11,700 at the moment on bearish momentum. If the cryptocurrency manages to break below the 11,600 level, the next target will be 11,087. Right now, it is heavily oversold, so we can also expect a bounce back to near $12,000.

BTC traders should look for a trade after the cryptocurrency decides on whether it will end up above or below $11,600, as this is a strong support level.

BTC/USD 4-hour Chart

Technical factors:
  • Price is below its 50-period EMA and below its 21-period EMA
  • Price is below its lower band.
  • RSI is dropping (34) and approaching the oversold area
  • Volume is above average
Key levels to the upside          Key levels to the downside

1: $12,015                                1: $11,630

2: $12,300                                2: $11,460

3: $12,900                                 3: $11,090

Ethereum

Ethereum’s social sentiment is still on the rise with the increased interest in DeFi. Even though the second-largest cryptocurrency by market cap is losing heavily in the past 24 hours, the $400 support level should hold, and ETH is (for the time being) safe above it. The next move Ethereum makes will most likely be caused by Bitcoin’s move, as the largest cryptocurrency by market cap is preparing an explosive move towards (most likely) the upside. That, though, should wait a bit, since cryptos are still under selling pressure.

Traders should look for a trade when ETH regains a higher and steady volume.

ETH/USD 4-hour Chart

Technical Factors:
  • Price is currently below its 21-period and its 50-period EMA
  • Price is below its lower B.B.
  • RSI is descending (36) approaching oversold levels
  • Volume is average
Key levels to the upside          Key levels to the downside

1: $445                                      1: $415

2: $496                                     2: $400

                                                  3: $361

Ripple

XRP’s bold move towards the upside, which came after announcing that its company (Ripple) will focus its business model on the XRP token rather than using it as a side solution, got nullified. The third-largest cryptocurrency by market cap dropped below the $0.31 level and as low as $0.29 (which is where it is at now).

Traders can look for a trade after XRP moves above or below its immediate support/resistance levels, or within the current trading level.

XRP/USD 4-hour Chart

Technical factors:
  • Price is currently below the 21-period and 50-period EMA
  • Price is below the lower B.B.
  • RSI is dropping (38.6)
  • Volume increased in the last hours
Key levels to the upside          Key levels to the downside

1: $0.32                                     1: $0.31  

2: $0.332                                   2: $0.285

                                                3:$0.266


Categories
Forex Market Analysis

Daily F.X. Analysis, August 18 – Top Trade Setups In Forex – Boosted Safe-Haven Plays! 

On the news front, the market isn’t expected to offer any major or high impact economic event until Wednesday. Therefore, the eyes will remain on the COVID19 cases and U.S. FOMC meeting minutes, which are coming out tomorrow to drive further price action in the market.

Economic Events to Watch Today  


EUR/USD – Daily Analysis

The EUR/USD has managed to maintain its previous day winning streak and taking further bids just below the 1.1900 level while representing 25% gains on the day mainly due to the broad-based U.S. dollar weakness, triggered by the on-going uncertainty surrounding the much-awaited U.S. fiscal stimulus. 

On the other hand, the US-EU trade concerns turned bitter as the U.S. keeps increasing the hardships for the E.U. goods, which eventually becomes the key factor that capped further upside momentum for the currency pair. In the meantime, the rising coronavirus cases in Germany also turned out to be a major factor that kept the traders cautious. As of writing, the EUR/USD currency pair is currently trading at 1.1893 and consolidates in the range between the 1.1865 – 1.1898. 

The U.S. dollar losses were further bolstered by the uncertainty over the next round of the U.S. fiscal stimulus measures, as the U.S. Congress members failed again from signaling any talks on the much-awaited stimulus amid political differences, which continued to fuel doubts over the U.S. economic recovery.

As we all know, the online meeting between the world’s top two nations I,e the U.S. & China, has been postponed without giving any future dates that were initially scheduled for Saturday. Despite this, the conflicting tone remains on the card as the Trump administration keeps increasing the hardships of companies from China. The U.S. diplomats recently announced punitive measures for Huawei in their latest attack for China. However, these gloomy headlines tend t cap further gains in the equity market, which might help the U.S. dollar put the safe-haven bids ahead.

Across the pond, the US-EU trade concerns still not showing any sign of slowing down as the U.S. decided to maintain its 25% tariffs on a range of E.U. goods. This happens after the White House realized that the E.U. is not doing enough to obey with the WTO’s ruling over state aid to Airbus. However, these updates could halt the upward momentum in the currency pair.

At the coronavirus front, the actual coronavirus cases increased to 225,404, with a total of 9,236 deaths. Whereas, the cases raised by 1,390 in Germany on the day against the previous day +738. The death toll rose by 4, as per the German disease and epidemic control center report, Robert Koch Institute (RKI).

At the USD front, the broad-based U.S. dollar reported losses on the day as the possibility of the U.S. Congress agreeing to a fiscal stimulus bill this month has weakened amid political differences, which eventually destroyed hopes for a quick U.S. economic recovery. In the absence of significant data/events on the day, the market traders will keep their eyes on the headlines concerning the US COVID-19 aid package, virus figures, and Sino-American trade.

Daily Technical Levels

Support Pivot Resistance
1.1838 1.1860 1.1891
1.1807 1.1913
1.1785 1.1945

 EUR/USD– Trading Tip

The EUR/USD pair has already violated the resistance level of 1.1862, which is now working as a support. On the 4 hour timeframe, the pair is supported by an upward trendline at 1.1880, while the double top resistance stays at 1.1916 level. Bullish bias seems dominant, and it may lead the EUR/USD prices towards the 1.1916 level today.


GBP/USD – Daily Analysis

Today in the Asian trading session, the GBP/USD currency pair remains on the bullish track and registered 4th day of winning streak while taking rounds near the 1.3120 and 1.3137 range mainly due to the broad-based U.S. dollar selling bias. That was triggered by the uncertainty surrounding the much-awaited coronavirus (COVID-19) relief package from America. The upbeat market mood also undermined the safe-haven U.S. dollar and contributed to the currency pair gains. 

The upbeat market sentiment backed by multiple factors helped overshadowed the U.K.’s current economic slowdown and distracted from anxieties that the country is likely heading into an unemployment crisis. This, in turn, underpinned the local currency and gave further support to the major. At a particular time, the GBP/USD currency pair is currently trading at 1.3139 and consolidating in the range between 1.3095 – 1.3141. However, the pair’s traders seem cautious to place any strong bids ahead of the key 7th-round of EU-UK talks concerning Brexit.

It is worth mentioning that the cable pair has many more to cheer on the day. Be it broad-based U.S. dollar weakness or upbeat market trading sentiment, not to forget the Brexit talks, these all factors are supporting the currency pair for the time being, at least.

At the Brexit front, the hopes of the trade deal next week got further fueled by the UK PM Boris Johnson’s previous comments that the United Kingdom will not accept aligning to rules of the E.U. at the coming round of post-Brexit discussions. Even though the trade deal is agreed between the U.K. and E.U., as per the U.K. Express report, the E.U. fishermen could clash with U.K. fishermen.

The coming round of talk becomes the last scheduled meet; policymakers earlier showed a willingness to extend the talks till September if needed. According to the BBC report, the E.U. chief negotiator Michel Barnier said that the agreement would be needed by October to ratify before the current post-Brexit transition period ends in December. However, the policymaker from both sides keeps alleging each other while citing failures to agree over the key issues like fisheries, level playing field, and jurisdiction rules, to name a few.

Across the pond, the UK Chancellor Rishi Sunak shows a willingness to extend the furlough scheme after rising unemployment rate and hence reopened support scheme for self-employed. However, the improving market mood helped overshadowed the U.K.’s current economic recession fears and concerns that the country is expected to heading into an unemployment crisis. 

The currency pair gains were also supported by the positive report that Imperial College London’s coronavirus (COVID-19) vaccine candidate is set for the next phase represents the Tory government’s efforts to control the pandemic.

On the other hand, the U.S. and China continue to struggle over one issue or the other. The Trump administration keeps increasing the hardships of companies from China by adding 38 Huawei facilities to the U.S.’ economic blacklist while also arresting a Chinese spy.

Whereas, the uncertainty over the next round of the U.S. fiscal stimulus measures remain on the cards, as the U.S. Congress members failed again from signaling any talks on the much-awaited stimulus amid political differences, which continued to fuel doubts over the U.S. economic recovery.

As in result, the broad-based U.S. dollar failed to gain any positive traction and extended its previous long bearish bias as doubts over the U.S. economic recovery remain amid coronavirus stimulus package. However, the losses in the U.S. dollar helped the currency pair to take bids on the day. 


Daily Technical Levels

Support Pivot Resistance
1.3075 1.3099 1.3124
1.3050 1.3148
1.3027 1.3173

 GBP/USD– Trading Tip

The GBP/USD pair is trading at 1.3137 level, and the pair was trading in between an ascending triangle pattern that has now been violated. The triangle pattern was extending resistance at 1.3125 level, and above this, the next resistance is pretty much likely to be found around 1.3189 level. At the same time, the support stays at 1.3125 and 1.3085 level. Bullish bias seems dominant today.


USD/JPY – Daily Analysis

The USD/JPY currency pair extended its previous session losing streak and dropped further below 106.50 marks mainly due to the broad-based U.S. dollar four-day consecutive weakness, buoyed by the impasse over the next round of the U.S. fiscal stimulus measures. On the other hand, the upbeat market sentiment, backed by the optimism over a potential vaccine for the highly infectious coronavirus, undermined the safe-haven Japanese yen and helped currency pair to limit its deeper losses. In the meantime, the downbeat preliminary readings of Japan’s second quarter (Q2) Gross Domestic Product (GDP) also undermined the safe-haven Japanese yen currency and became one of the major factors that capped further downside for the currency pair. Currently, the USD/JPY currency pair is currently trading at 106.36 and consolidating in the range between 106.31 – 106.67.

Despite concerns about the ever-increasing coronavirus cases across the world and worsening US-China relations, the investors continued to cheer the optimism over a potential vaccine for the highly contagious coronavirus disease. Also, supporting factors could be the suspension of the US-China online meeting regarding the trade deal. 

On the contrary, the fears of growing COVID-19 cases in the U.S., Australia, Japan, and some of the notable Asian nations like India continually fueling doubts over the economic recovery. As per the latest report, France recorded more than 3,000 new cases for the second day while Australia’s state Victoria marked the highest death loss, which resulted in an extended state of emergency until September 13. Singapore also reported 86 cases on the weekend. At the same time, New Zealand imposed fresh lockdowns after recording increased cases of Covid-19. However, these gloomy updates kept challenging the market risk-on tone, which might weaken the safe-haven JPY and help limit losses for the major.

Apart from the virus woes, the long-lasting tussle between the world’s two largest economies remained on the cards as China’s ambassador to the U.S. recently gave warning against the U.S. move to send ships to the South China Sea, which could raise further tensions between both nations and harm the trade deal. Whereas, President Trump announced yesterday that TikTok should give its U.S. operations to another company within one-month, or it will be banned in the U.S. due to significant security threats. In return, China’s Foreign Ministry recently said on the day that it would firmly oppose to U.S. actions.

As we mentioned, the downbeat preliminary readings of Japan’s second quarter (Q2) Gross Domestic Product (GDP) also gave some support to the currency pair. The world’s 3rd-largest economy declined by a 27.8% annualized pace during the second quarter of 2020. However, this marked the biggest economic fall on record and was led by the coronavirus-induced lockdown.

Daily Technical Levels

Support Pivot Resistance
105.7300 106.2000 106.4600
105.4800 106.9200
105.0100 107.1800


USD/JPY – Trading Tips

The USD/JPY has violated the upward trendline support level of 106.345, as it fell sharply in the wake of increased safe-haven appeal in the market. At the movement, the USD/JPY pair is holding below 50 periods EMA, while the RSI and MACD are in support of bearish trend. The recent candle is closing above 105.344 level, suggesting strong odds of bullish correction until 106. However, the violation of 106 can lead USD/JPY prices towards the 104.600 support level. Good luck! 

Categories
Crypto Market Analysis

Daily Crypto Review, August 18 – Crypto Fundamentals Booming: Bitcoin Above $12,000; XRP Skyrocketing to $0.315

The cryptocurrency market made gains over the course of the day as Bitcoin broke the $12,000 mark. Bitcoin is currently trading for $12,247, which represents an increase of 3.61% on the day. Meanwhile, Ethereum gained 1.12% on the day, while XRP gained 5.14%.

 Daily Crypto Sector Heat Map

When talking about top100 cryptocurrencies, Flexacoin gained 27.98% on the day, making it the most prominent daily gainer. yearn.finance (26.80%) and Fetch.ai (25.97%) also did great. On the other hand, Algorand lost 14.78%, making it the most prominent daily loser. It is followed by Chainlink’s loss of 12.26% and THORChain’s drop of 10.18%.

Top 10 24-hour Performers (Click to enlarge)

Bottom 10 24-hour Performers (Click to enlarge)

Bitcoin’s dominance level has increased slightly (though it is still under the 60% mark), with its value currently at 59.64%. This value represents a 0.47% difference to the upside when compared to our last report.

Daily Crypto Market Cap Chart

The cryptocurrency market cap experienced a solid increase in value over the course of the day. Its current value is $384.43 billion, which represents an increase of $11.03 billion when compared to our previous report.

_______________________________________________________________________

What happened in the past 24 hours?

_______________________________________________________________________

_______________________________________________________________________

Technical analysis

_______________________________________________________________________

Bitcoin

Bitcoin finally broke $12,000 with confidence, after a couple of days slowly preparing for this move. The largest cryptocurrency by market cap broke out from a large ascending triangle formation and pushed up to $12,470 before falling back down slightly. However, for now, Bitcoin is safe above $12,000 even though it is moving towards the downside. It will most likely test the closest support level in the short term.

This (relatively) sudden break above $12,000 came as a result of many things, but mostly increased interest in DeFi which is making people enter the crypto space (which they do through Bitcoin) and because of institutional investors such as Pantera capital (which just recently announced raising $165 million)

BTC traders should look for a trade after Bitcoin retests its support level.

BTC/USD 4-hour Chart

Technical factors:
  • Price is above its 50-period EMA and its 21-period EMA
  • Price is slightly below its top B.B.
  • RSI is elevated (63.83)
  • Volume is decreasing (one-candle spike)
Key levels to the upside          Key levels to the downside

1: $12,000                                1: $11,630

2: $12,300                                2: $11,460

                                                 3: $11,090

Ethereum

Ethereum’s social sentiment was booming as more and more people started investing in DeFi tokens. As this happened, more and more institutional investors grabbed ETH. This made the second-largest cryptocurrency by market cap establish its place above $415 with no signs of going below it in the short future.

When talking about the past 24 hours, Ethereum made a push towards $450 (accompanied by skyrocketing volume), which it did not have the strength to complete. The move died down, and Ethereum is now consolidating at the $430 level.

Traders should look for a trade when ETH regains steady volume.

ETH/USD 4-hour Chart

Technical Factors:
  • Price is currently above its 21-period and its 50-period EMA
  • Price is at its middle B.B.
  • RSI is neutral (52.68)
  • Volume is average (one-candle spike)
Key levels to the upside          Key levels to the downside

1: $445                                      1: $415

2: $496                                     2: $400

                                                  3: $361

Ripple

XRP made a bold move towards the upside after announcing that its company (Ripple) will focus its business model on the XRP token. As more emphasis was put on developing XRP as the main solution rather than a side solution, more investors flocked and bought XRP.

The third-largest cryptocurrency by market cap pushed past $0.31 and even $0.32, ultimately reaching $0.3275 as the top of the move. As it could not sustain itself above the $0.32 level, XRP fell below it and started a consolidation/confirmation period right between $0.31 and $0.32.

Traders can look for a trade after XRP moves towards $0.32 to break it or towards $0.31 to test the support level.

XRP/USD 4-hour Chart

Technical factors:
  • Price is currently above the 21-period and 50-period EMA
  • Price is slightly below the top B.B.
  • RSI is elevated (63.26)
  • Average volume (two-candle spike)
Key levels to the upside          Key levels to the downside

1: $0.32                                     1: $0.31  

2: $0.332                                   2: $0.285

                                                3:$0.266


Categories
Forex Market Analysis

Daily F.X. Analysis, August 17 – Top Trade Setups In Forex – Eyes Technical Levels! 

On the news front, the market isn’t offering any high impact on market-moving fundamentals. Therefore, we have to focus on the market’s technical side to drive further movements in the market.

Economic Events to Watch Today   


EUR/USD – Daily Analysis

The EUR/USD pair closed at 1.18409 after placing a high of 1.18503 and a low of 1.17815. Overall the movement of the EUR/USD pair remained bullish throughout the day. The EUR/USD pair on Friday remained in a tight range in European trading hours after the release of GDP figure from the Eurozone, and in American trading session, it started to post gains and ended its day on a positive note.

At 11:45 GMT, the French Final CPI in July remained flat with the expectations of 0.4%. At 14:00 GMT, the Flash Employment Change in the second quarter was recorded as -2.8%, and the Flash GDP in the second quarter fell as expected -12.1%. The Trade Balance from Europe in June declined to 17.1B from the forecasted 18.0 B and weighed on single currency Euro.

The GDP data confirmed the fears and dropped by 12.1% showed the biggest contraction since the quarterly GDP calculation began in 1970 for Germany. It was even more pronounced than during the financial market and economic crisis. The macroeconomic data from Europe weighed on EUR and dragged the pair EUR/USD with itself.

The U.S. Dollar held steady against its rival currency as positive risk sentiment continues to weigh on the safe-haven greenback. The Core Retail Sales in July increased to 1.9% from the forecasted 1.3% and supported the U.S. dollar. At the same time, the Retail Sales data declined to 1.2% against the expected 2.0% and weighed on the U.S. dollar.

In August, the Prelim UoM Consumer Sentiment increased to 72.8 against the forecasted 72.0 and supported the U.S. dollar. The data failed to provide any significant trend to the pair, however as the consumer sentiment improved, the U.S. dollar started to pick up its pace against its rival currencies.

Meanwhile, the delay in the release of the next U.S. Stimulus aid package was getting longer day by day. It raised concerns as President Donald Trump accused that U.S. Congressional Democrats had refused to negotiate on the next bill. The pair was also higher on Friday as the risk sentiment improved ahead of the US-China trade deal review meeting scheduled for August 15.

Furthermore, the U.S. Dollar was higher on the ground as the 10-year U.S. Treasury rose continuously from past days. At the same time, the Euro was under pressure because of the massive selling bias in Turkish lira from recent weeks. The Euro underperformed during the lira crisis in 2018, and downside risks suggest that Euro might face sell-off if history was repeated.

The upcoming week will bring the minutes from both the U.S. Federal Reserve and the European Central Bank. Meanwhile, the pair will continue to follow the global risk sentiment; any progress in trade-deal will be beneficial for EUR/USD pair; however, if any tension arises and the US-China issue continues to escalate, the greenback could rise against its counterpart as a safe-haven asset.

Daily Technical Levels

Support Pivot Resistance
1.1745 1.1805 1.1900
1.1650 1.1960
1.1591 1.2054

EUR/USD– Trading Tip

The EUR/USD is facing resistance at 1.1865 level, which is extended by a double top level. Below this, the EUR/USD can extend selling bias until 1.1820 and 1.1782 level. However, the bullish breakout of the 1.1865 level can continue selling until 1.1908. On the hourly timeframe, the EUR/USD has formed an ascending triangle pattern, which may extend resistance at 1.1866 level. The closing of candles beneath this level is expected to drive selling bias until the 1.1819 level. Let’s keep an eye on 1.1866 level to stay bullish above and bearish below this level today. 


GBP/USD – Daily Analysis

The GBP/USD closed at 1.30824 after placing a high of 1.31426 and a low of 1.30452. Overall the movement of GBP/USD pair remained bullish throughout the day. The GBP/USD pair struggled to hold gains as both the U.S. dollar and Sterling has gloomy outlook. Both the U.S. & U.K. economies have suffered from the coronavirus pandemic, and the outlook of GBP/USD pair suggests that it was dominated by the pandemic induced gloomy economic condition.

This week, the GBP/USD pair has jumped between highs of 1.32123 and lows of 1.3007. The high was not too far from the previous week’s high of 1.3176, that was the best level for the GBP/USD pair in six months.

We can say that the GBP/USD pair has managed to sustain the impressive July gains; however, further gains seem unlikely. As the negotiations between the U.K. and Japan came to a halt this week. This came in after U.K. pretended to have better trade conditions than those it had as part of the E.U. Another factor weighed on U.K. currency this week was the biggest contraction in the U.K.’s economy in the second quarter by 20.4%.

The contraction was derived as a terrible consequence of the coronavirus induced lockdown measures. The U.K. government is still struggling with the reopening schedule, and PM Boris Johnson has pledged to open schools from next month.

As worries of the second loop of coronavirus worsened across the globe, the concerns raised over the question of how the government would react. There are speculations that if Britain’s coronavirus situation does not improve, the whole nation could see continuous lockdown.

On Brexit front, although both countries E.U. and the U.K. remain far apart on several crucial issues, Britain’s chief negotiator David Frost said on Thursday that a Brexit deal could be reached in September.

The next round of the talks between both countries will take place on August 18, and comments from both sides suggested that they remain committed to reaching a deal. This has been supportive of Sterling, and hence GBP/USD raised.

Meanwhile, on the data front, there was no data to be released from Great Britain, and as for the U.S., the Retail Sales dropped to 1.2% from the expected 2.0% in July and weighed on the U.S. dollar.

The Core Retail Sales, however, improved to 1.9% in July against the anticipated 1.3% and supported the U.S. dollar. The Prelim UoM Consumer Sentiment also raised to 72.8 points against the expected 72 and supported the U.S. dollar that kept the gains in GBP/USD pair limited on Friday. The risk sentiment also supported the GBP/USD pair on Friday as the traders were cautious ahead of the US-China trade deal review meeting scheduled to be released on August 15.

Daily Technical Levels

Support Pivot Resistance
1.3010 1.3077 1.3150
1.2938 1.3216
1.2871 1.3289

GBP/USD– Trading Tip

The GBP/USD is trading at 1.3106 level, holding above the 50 periods EMA support level 1.3080. The bearish breakout of the 1.3080 support level can extend selling unto 1.3019 level. The upward channel also supports the GBPUSD at 1.3080, which provides resistance at 1.3134 level. The GBP/USD should confer a bearish crossover of 1.3082 level confirm a strong selling bias in the Cable until then; we should wait and watch. On the higher side, Sterling may find resistance at 1.3175 and 1.3224. Let’s consider selling below 1.3080 and buying over the same with minor stop loss. 


USD/JPY – Daily Analysis

The USD/JPY pair was closed at 106.573 after placing a high of 107.036 and a low of 106.433. Overall the movement of the USD/JPY pair remained bearish throughout the day. The U.S. Congress has failed to boost the economy and health care system, and it caused the U.S. President Donald Trump on Friday to stress for a coronavirus aid package. Trump pushed for state and local government aid and assistance regarding rental payments, more direct payments, and small business loans.

On the US-China front, both countries have delayed a review of their phase-1 trade deal that was initially scheduled for August 15. U.S. granted this time to China to increase the purchases of U.S. exports. The meeting was scheduled to take place on Saturday at the six-month anniversary of the phase one trade deal. The deal took its effect from February 15 as the global spread of coronavirus pandemic started.

On Friday, US President Donald Trump told us that the trade deal was intact and doing very well, but he did not mention anything about the delay in the review meeting. According to some sources familiar with the plans, the U.S. wanted to give more time to China to increase the purchases of the U.S. farm products that were part of the agreed deal. America’s favor given to China was provided to increase the review’s political optics as the U.S. Presidential elections were near.

On the negative side, there was news that Trump has said in a news conference that he was looking at banning other China-owned companies like Alibaba. This raised the fears of renewed conflicts and weighed on the market sentiment that dragged the USD/JPY pair on the downside.

Meanwhile, the Chinese Vice Foreign Minister Zheng Zeguang said that the relationship between the U.S. and China was at a critical juncture, and efforts should be made from both sides to maintain and stabilize the bilateral ties between both nations.

On the data front, at 09:30 GMT, the Tertiary Industry Activity in June from Japan rose to 7.9% from the forecasted 6.4% and supported the Japanese Yen that contributed to USD/JPY pair’s losses of the day.

At 17:30 GMT, the Core Retail Sales in July from the U.S. rose to 1.9% from the forecasted 1.3% and supported the U.S. dollar. At the same time, the Retail Sales in July dropped to 1.2% from the anticipated 2.0% and weighed on the U.S. dollar.

The core retail sales data exclude automobile sales that include about 20% of the retail sales data. The positive core retail sales and negative retail sales indicated that the automobile sector had suffered more than other sectors. The Prelim Nonfarm Productivity for the second quarter raised to 7.3% from the anticipated 1.5% and weighed on the U.S. dollar. The Prelim Unit Labor Cost for the second quarter rose to 12.2% against the forecasted 6.5% and supported the U.S. dollar.

At 18:15 GMT, the Capacity Utilization Rate also increased to 70.6% from the expected 70.3% and supported the U.S. dollar. The Industrial Production in July dropped to 3.0% from the anticipated 3.1% and weighed on the U.S. dollar. At 19:00 GMT, the Prelim UoM Consumer Sentiment in August rose to 72.8 from the anticipated 72.0 and supported the U.S. dollar. However, the Business Inventories in June came in as expected -1.1%. The Prelim UoM Inflation Expectations in August also remained flat at 3.0%.

After the release of U.S. economic data on Friday, the U.S. Dollar Index that rose to 93.40 earlier in the day, lost its traction and fell by 0.15% to 93.10 level. This weighed on USD/JPY pair, and the pair started to post losses on the day.

Daily Technical Levels

Support Pivot Resistance
105.8400 106.4500 107.1900
105.1000 107.8000
104.4900 108.5500

USD/JPY – Trading Tips

The USD/JPY consolidates in a sideways range, holding over resistance to become a support level of 106.428 level. Over this level, the USD/JPY is opening further room for buying until 107.450 level, but below this, the USD/JPY pair can trigger sharp selling until 105.752. The RSI and MACD are also supporting bearish bias in the pair. The current market price (CMP) of USDJPY is holding above 50 EMA, which extends support at 106.484 and may push the pair higher. Let’s consider buying above 106.480 level and selling below the same today. Good luck! 

Categories
Crypto Market Analysis

Daily Crypto Review, August 17 – DeFi Craze Continues: More BTC Tokenized Than Mined

The cryptocurrency market spent most of its weekend consolidating, with only a couple of cryptocurrencies moving significantly. Bitcoin is currently trading for $11,817, which represents a decrease of 0.64% on the day. Meanwhile, Ethereum lost 1.27% on the day, while XRP lost 0.47%.

 Daily Crypto Sector Heat Map

When talking about top100 cryptocurrencies, OMG Network gained 50.69% on the day, making it the most prominent daily gainer. Waves (26.69%) and Ren (24.74%) also did great. On the other hand, Quant lost 6.55%, making it the most prominent daily loser. It is followed by Divi’s loss of 5.80% and Ampleforth’s drop of 5.08%.

Top 10 24-hour Performers (Click to enlarge)

Bottom 10 24-hour Performers (Click to enlarge)

Bitcoin’s dominance level has decreased slightly and dropped under the 60% mark, with its value currently at 59.17%. This value represents a 0.91% difference to the downside when compared to our last report.

Daily Crypto Market Cap Chart

The cryptocurrency market cap experienced a slight increase in value over the weekend. Its current value is $373.40 billion, which represents an increase of $5.33 billion when compared to our previous report.

_______________________________________________________________________

What happened in the past 24 hours?

_______________________________________________________________________

_______________________________________________________________________

Technical analysis

_______________________________________________________________________

Bitcoin

Bitcoin was on a slightly upward slope over the course of the weekend, trying to reach $12,000 before attempting a strong push. The largest cryptocurrency by market cap saw good support in the 21-period moving average, which kept it on its path. The descending RSI and incredibly low volume indicate that the cryptocurrency will move very soon. Meanwhile, Bitcoin’s hashrate reached its new all-time high of 129 EH/s.

BTC traders should look for a trade when a volume spike happens.

BTC/USD 4-hour Chart

Technical factors:
  • Price is above its 50-period EMA and its 21-period EMA
  • Price is at its middle B.B
  • RSI is neutral (52.88)
  • Volume is decreasing (Low)
Key levels to the upside          Key levels to the downside

1: $12,000                                1: $11,630

2: $12,300                                2: $11,460

                                                 3: $11,090

Ethereum

Unlike Bitcoin, Ethereum was not moving slow throughout the weekend. After breaking the $415 mark, Ethereum needed to consolidate above it and show strength, which it did. The second-largest cryptocurrency by market cap retested its support (successfully) and is now safely at the $425 mark.

Traders should look for a trade when ETH regains volume.

ETH/USD 4-hour Chart

Technical Factors:
  • Price is currently above its 21-period and its 50-period EMA
  • Price is above its top B.B.
  • RSI is neutral (52.85)
  • Volume is below average
Key levels to the upside          Key levels to the downside

1: $445                                      1: $415

2: $496                                     2: $400

                                                  3: $361

Ripple

XRP spent its weekend consolidating between the $0.285 and $0.31 support and resistance levels. Low volatility, as well as volume, made XRP virtually untradeable over the course of the weekend. However, as much as XRP doesn’t seem like it doesn’t have the strength to push through $0.31 by itself (without Bitcoin moving first), the state it is currently in is still more bullish than bearish.

Traders can look for a trade after XRP increases its volume and heads towards $0.31.

XRP/USD 4-hour Chart

Technical factors:
  • Price is currently above the 21-period and 50-period EMA
  • Price is between its middle and top B.B.
  • RSI is neutral (55.30)
  • Low volume
Key levels to the upside          Key levels to the downside

1: $0.31                                     1: $0.285  

2: $0.32                                     2: $0.266

3: $0.245


Categories
Forex Market Analysis

Daily F.X. Analysis, August 14 – Top Trade Setups In Forex – Eyes U.S. Retail Sales!

On the news side, the eyes will remain on the U.S. retail sales data and the Prelim UoM Consumer Sentiment from the United States. Both of the events are expected to drop from their previous figures. Typically such kind of data drives bearish movement in the U.S. dollar. Therefore, the market can trade a weaker dollar sentiment today.

Economic Events to Watch Today   


EUR/USD – Daily Analysis

The EUR/USD currency pair succeeded to extended its previous session bullish rally and hit the fresh intra-day highs towards 1.1800 level. However, the reason for the gains in currency pair could also be attributed to the broad-based U.S. dollar bearish bias, backed by fears that U.S. economic recovery from COVID-19 continuing to diminish. The on-going U.S. Congress’ failure to reach an agreement for the country’s latest COVID-19 stimulus package also added a burden to the greenback and contributed to the currency pair gains. 

On the contrary, the growing cases of coronavirus in Germany became the key factor that kept the lid on any additional gains in the currency pair. At the moment, the EUR/USD currency pair is currently trading at 1.1831 and consolidating in the range between 1.1781 – 1.1838.

The on-going uncertainty surrounding the much-awaited U.S. fiscal stimulus or the second wave of coronavirus (COVID-19), not to forget the latest tension between America and China over TikTok, weighed on the broad-based U.S. dollar and contributed to the currency pair gains. It should be noted that the Democrats and Republicans are still struggling to approve an additional stimulus package as authorities hinted that additional stimulus is needed to control the negative impact of the recent wave of the coronavirus.

At the coronavirus front, the number of reported coronavirus cases increased to 219,964, with a total of 9,211 deaths tolls, as per the German disease and epidemic control center, Robert Koch Institute (RKI), on Thursday. Meanwhile, the Cases rose by 1,445 in Germany on Thursday against Wednesday’s +1,226. Whereas the death toll increased by 4, the tally showed. Despite this, the shared currency did not give any major attention to it and remains unperturbed by the renewed virus concerns.

The market players will keep their eyes on the Retail Sales m/m, Core Retail Sales m/m, and Prelim UoM Consumer Sentiment, which is scheduled to be released during the New York session. 

Daily Technical Levels

Support Pivot Resistance
1.1773 1.1819 1.1857
1.1735 1.1903
1.1689 1.1942

EUR/USD– Trading Tip

The EUR/USD is trading neutral on Friday, as traders seem to wait for major economic data to help drive a breakout. The bullish sentiment seems dominant as the EUR/USD pair trades at 1.1818 level, holding right below an immediate resistance level of 1.1820. Below this, the pair is likely to trade bearish until 1.1783 and 1.1745 level. Conversely, the bullish breakout of the 1.1820 level can lead the pair to be further higher until 1.1860 and the 1.1890 levels.


GBP/USD – Daily Analysis

The GBP/USD currency pair succeeded in stopping its previous-day losing streak and rose closer to 1.3100 level, mainly due to the broad-based U.S. dollar weakness. That was triggered by the coronavirus crisis in the U.S., which continued to fuel worries that the second wave of COVID-19 cases could undermine the U.S. economy.

The repeated inability over the much-awaited stimulus also adds pressure on the U.S. dollar and further pushed the currency pair. On the other hand, the fresh optimism over the UK-US relations also added strength around the Pound currency and contributed to the currency pair gains. On the other hand, the on-going pessimism of coronavirus (COVID-19) second wave in the U.K., and the UK-Japan lingering trade talks became the major factors that kept the lid on any further gains in the currency pair. Currently, the GBP/USD currency pair is currently trading at 1.3084 and consolidating in the range between 1.3031 – 1.3093.

The U.K. Trade Secretary Liz Truss declared that she is very satisfied as the United States has not implemented additional tariffs, which gave some support to the local currency and extended further upside momentum in the pair.

The U.K. formally started to face recession the previous day, with over 20% of GDP drop across the pond. In turn, the British business leaders and trade unions urged the extension of furlough scheme beyond October expiry; Chancellor Rishi Sunak sees promising signs off-late.

At the Brexit front, the Brexit jitters remain on the card as the fisheries and level-playing field being the tardiest obstacle. However, the policymakers from both sides are set to resume the sixth round in the next week. Apart from this, the U.S. criticized the European Union (E.U.) due to its lack of action regarding the airbus case. Elsewhere, the U.S. added some French and German goods to the tariff list while removing a few from the U.K. and Greece.

On the other hand, the rising COVID-19 cases, especially in the U.S., Australia, Japan, and some of the notable Asian nations like India, fueled concerns that the economic recovery could halt once again, which ultimately drags the broad-based U.S. dollar under pressure. The on-going uncertainty surrounding the much-awaited U.S. fiscal stimulus and the latest tension between America and China over TikTok also weighed on the broad-based U.S. dollar and contributed to the currency pair gains.

As a result, the broad-based U.S. dollar reporting losses on the day amid the failure of the U.S. stimulus package, as well as the United States still facing virus woes, ultimately crushed hopes for a quick economic recovery. Nevertheless, the losses in the U.S. dollar helped the currency pair to stay higher.  


Daily Technical Levels

Support Pivot Resistance
1.3021 1.3073 1.3116
1.2977 1.3169
1.2925 1.3212

GBP/USD– Trading Tip

The GBP/USD consolidates at 1.3070 level, holding right above the 50 periods EMA support area of 1.3040 level while the bearish breakout of 1.3040 level can extend selling unto 1.2918 level. Recently as we can see in the chart above that the GBPUSD pair has violated its upward trendline that supported the pair around 1.3130 level, and now below this, we can expect GBP/USD to continue trading bearish. The GBP/USD should show a bearish crossover to confirm a strong selling bias in the Cable. On the higher side, Sterling may find resistance at 1.3105 and 1.3175. Let’s consider selling below 1.3045 level today. 


USD/JPY – Daily Analysis

The USD/JPY currency pair failed to extend its previous 4-day bullish bias and dropped just above the mid-106.00 level, mainly due to the broad-based U.S. dollar weakness triggered by the worries that the second wave of COVID-19 cases in the United States could ruin the recovery in the world’s biggest economy. The on-going doubts over the U.S. Stimulus Package also weighed on the American currency and contributed to the pair losses. On the other hand, the concerns about intensifying US-China relations and U.S. Trade Representative Robert Lighthizer’s verbal attack on Europe extended some additional support to the safe-haven Japanese yen, which exerted an additional burden on the currency pair. Apart from this, the upbeat performance of Japanese PPI also underpinned the Japanese yen and pushed currency pair further lower. At this particular time, the USD/JPY currency pair is currently trading at 106.91 and consolidating between 106.57 – 106.94.

Despite the reduction in coronavirus cases, the fears about the U.S. economic recovery still hover all over the market and keep the U.S. dollar bulls defensive. As per the latest report, the figures have crossed almost 5.2 million cases in the U.S. alone as of August 13, as per the Johns Hopkins University and millions unemployed.

Meanwhile, the risk-off market sentiment was further bolstered by the long-lasting disappointment over the lack of progress in the much-awaited fiscal package. U.S. President Donald Trump accused Democrats that they are not willing to negotiate over the package.

As in result, the broad-based U.S. dollar failed to gain any positive traction on the day and reported losses as the United States crisis of virus could break hopes for a quick economic recovery, which kept the investors careful. However, the losses in the U.S. dollar kept the currency pair bearish. 

Also weighing on the market trading sentiment could be the U.S. Central Command’s statement suggesting the Iranian Navy overtaking a ship called “Wila.” Besides, the U.S. Trade Representative Robert Lighthizer’s verbal attack on Europe also adds a burden to the market trading sentiment.

Across the Pound, the losses in the currency pair could also be associated with Japanese PPI’s upbeat performance, which eventually underpinned Japanese yen and contributed to the currency pair declines. At the data front, Japan’s July month Producer Price Index (PPI) grew past-0.3% forecast on MoM to 0.6%. Further, the yearly figures slipped less than -1.1% expected level to -0.9%.

Daily Technical Levels

Support Pivot Resistance
106.6400 106.8500 107.1400
106.3500 107.3500
106.1400 107.6400

USD/JPY – Trading Tips

The USD/JPY trades sideways over resistance become a support level of 106.628 level. Above this, the USD/JPY pair is opening further room for buying until 107.450 level. The RSI and MACD are also supporting bullish bias in the pair. A recent bullish breakout of 106.450 level can extend the buying trend until 107.390. The current market price of USDJPY is staying over 50 EMA, which extends support at 105.950 and may push the pair higher. Let’s consider buying above 106.480 level today. Good luck! 

Categories
Crypto Market Analysis

Daily Crypto Review, August 14 – ETH Price Skyrocketing; BitMEX Implementing KYC Procedures

The cryptocurrency market had mad a slight rally in the past 24 hours, with Ethereum leading the way with a price gain of almost 8%. Bitcoin is currently trading for $11,723, which represents an increase of 1.33% on the day. Meanwhile, Ethereum gained 7.61% on the day, while XRP gained 4.96%.

 Daily Crypto Sector Heat Map

When talking about top100 cryptocurrencies, Waves gained 36.29% on the day, making it the most prominent daily gainer. Algorand (34.02%) and Reserve Rights (25.27%) also did great. On the other hand, Ampleforth lost 14.74%, making it the most prominent daily loser. It is followed by Aragon’s loss of 12.46% and yearn.finance’s drop of 11.04%.

Top 10 24-hour Performers (Click to enlarge)

Bottom 10 24-hour Performers (Click to enlarge)

Bitcoin’s dominance level has decreased slightly since we last reported, with its value currently at 60.08%. This value represents a 0.76% difference to the downside when compared to yesterday’s value.

Daily Crypto Market Cap Chart

The cryptocurrency market cap experienced an increase in value since we last reported. Its current value is $368.07 billion, which represents an increase of $9.15 billion when compared to yesterday’s value.

_______________________________________________________________________

What happened in the past 24 hours?

_______________________________________________________________________

_______________________________________________________________________

Technical analysis

_______________________________________________________________________

Bitcoin

Bitcoin spent the day trying to get back near $12,000 after a day of consolidation. Its price made a sharp move towards the upside and broke the $11,630 resistance level, but stopped at $11,850 and then started to retrace. This retracement is most likely a test of the newly-passed resistance (now support). If Bitcoin’s price holds up above it, there is a good chance that we can see another move towards the $12,000 mark in the near term.

BTC traders should look for an opportunity when BTC spikes after the confirmation of its position.

BTC/USD 4-hour Chart

Technical factors:
  • Price is currently above its 50-period EMA and its 21-period EMA
  • Price is above its middle B.B
  • RSI is neutral (54.81)
  • Volume is decreasing
Key levels to the upside          Key levels to the downside

1: $12,000                                1: $11,630

2: $12,300                                2: $11,460

                                                 3: $11,090

Ethereum

Ethereum is the star of the day, as its price has skyrocketed over the course of the last 24 hours. The second-largest cryptocurrency by market cap saw a massive increase in volume while its price went from below-$400 levels all the way up to $432. Ethereum is now consolidating at around $420 and trying to test the $415 support level.

Traders should look for a trade when Ethereum confirms its position above $415 (or fails to do so).

ETH/USD 4-hour Chart

Technical Factors:
  • Price is above its 21-period and its 50-period EMA
  • Price is above its top B.B.
  • RSI is overbought (71.94)
  • Volume is average (one-candle spike)
Key levels to the upside          Key levels to the downside

1: $415                                     1: $$400

2: $496                                     2: $361

                                                  3: $340

Ripple

XRP had a great day and outperformed Bitcoin as well. The third-largest cryptocurrency by market cap ended up gaining almost 5% on the day after breaking above the $0.285 resistance level. As we noted in our previous report, breaking this level is key to pushing further towards the upside, and XRP’s future moves towards $0.31 are a bit more realistic now. However, for the time being, the current progress got stopped by the top B.B. at $0.3, and XRP started consolidating and (possibly) testing $0.285 as support.

Traders can look for an opportunity right after XRP increases in volume and heads towards $0.31.

XRP/USD 4-hour Chart

Technical factors:
  • Price is above the 21-period and 50-period EMA
  • Price is between its middle and top B.B.
  • RSI is neutral (57.75)
  • Low volume
Key levels to the upside          Key levels to the downside

1: $0.31                                     1: $0.285  

2: $0.32                                     2: $0.266

3: $0.245


Categories
Crypto Market Analysis

Daily Crypto Review, August 13 – Crypto Loans Entering the Market; Bitcoin Temporarily Stuck at $11,600

The cryptocurrency market had a day where almost no cryptocurrencies ended up in the red. Even though the gains were mostly small, only five cryptocurrencies lost in the past 24 hours. Bitcoin is currently trading for $11,582, which represents an increase of 1.88% on the day. Meanwhile, Ethereum gained 4.37% on the day, while XRP gained 1.11%.

 Daily Crypto Sector Heat Map

When talking about top100 cryptocurrencies, Numeraire gained 161.01% on the day, making it the most prominent daily gainer. Aragon (90.43%) and BitShares (41.67%) also did great. On the other hand, Divi lost 4.38%, making it the most prominent daily loser. It is followed by Compound’s loss of 2.5% and Aave’s loss of 1.85%.

Top 10 24-hour Performers (Click to enlarge)

Bottom 10 24-hour Performers (Click to enlarge)

Bitcoin’s dominance level has decreased slightly since we last reported, with its value currently at 60.84%. This value represents a 0.53% difference to the downside when compared to yesterday’s value.

Daily Crypto Market Cap Chart

The cryptocurrency market cap experienced a major increase in value since we last reported. Its current value is $358.92 billion, which represents an increase of $13.32 billion when compared to yesterday’s value.

_______________________________________________________________________

What happened in the past 24 hours?

_______________________________________________________________________

_______________________________________________________________________

Technical analysis

_______________________________________________________________________

Bitcoin

After a day of sharp decline, Bitcoin spent the day trying to restore the lost value. However, while the largest cryptocurrency by market cap did gain a few percent and rose to $11,600 levels, the $11,630 resistance seems to be holding the price in place quite well. Bitcoin will need to pass this level confidently (and soon), or BTC bears will consider this the start of a bear move.

BTC traders should look for an opportunity when BTC crosses $11,630.

BTC/USD 4-hour Chart

Technical factors:
  • Price is currently below its 50-period EMA but above its 21-period EMA
  • Price is slightly above its middle B.B
  • RSI is neutral (48.49)
  • Volume is decreasing
Key levels to the upside          Key levels to the downside

1: $11,630                                 1: $11,460

2: $12,000                                 2: $11,090

3: $12,300                                  3: $10,850

Ethereum

Ethereum had a slightly better day than its rival Bitcoin in terms of gains, as it returned to the level it was on the night before the selloff. However, the $400 level seems like it has great resistance, and it is yet unknown whether ETH will be able to break it. The move that will break $400 needs to be extremely strong, and it will most likely be caused by BTC’s move to the upside.

Traders should look for an opportunity when Ethereum breaks $400 or collapses after failing to do so.

ETH/USD 4-hour Chart

Technical Factors:
  • Price is above its 21-period EMA and its 50-period EMA
  • Price is between its middle and top B.B.
  • RSI is elevated (58.91)
  • Volume is average
Key levels to the upside          Key levels to the downside

1: $400                                     1: $361

2: $415                                     2: $340

3: $496                                      3: $302

Ripple

Unlike Bitcoin and Ethereum, XRP did not have such a good day today. The third-largest cryptocurrency by market cap did end up in the green on the day, but it failed to break the $0.285 level. Breaking this level is key to pushing further towards the upside, but the 21-period and 50-period moving average are also above the price and very near $0.285, making it incredibly difficult for XRP to move towards the upside.

Traders can look for an opportunity right after XRP breaks $0.285.

XRP/USD 4-hour Chart

Technical factors:
  • Price is below its 21-period and 50-period EMA
  • Price is slightly below its B.B.
  • RSI is neutral (42.19)
  • Low volume
Key levels to the upside          Key levels to the downside

1: $0.285                                    1: $0.266  

2: $0.31                                     2: $0.245

3: $0.32                                    3: $0.235


Categories
Forex Market Analysis

Daily F.X. Analysis, August 12 – Top Trade Setups In Forex – Stronger Dollar Continues to Play! 

On the news side, the eyes will remain on the UK GDP and U.S. CPI figures. U.S. inflation is expected to drop, and it can impact the U.S. dollar negatively. Conversely, the UK GDP figures are anticipated to have improved, but the prelim GPD seems to perform badly. A mixed response can be seen in news releases.

Economic Events to Watch Today  


EUR/USD – Daily Analysis

The EUR/USD pair was closed at 1.17393 after placing a high of 1.18078 and a low of 1.17217. Overall the movement of the EUR/USD pair remained flat throughout the day. 

In the first session of Tuesday, EUR/USD pair took bids and surged above 1.18050 level, but after the release of U.S. economic data, the EUR/USD pair started to decline and posted losses. The pair ended its day on the same level it started its day with and hence, gave a smooth movement throughout the day.

The fresh risk appetite droved the rise in the EUR/USD pair amid the registration of the first coronavirus vaccine from Russia. Russia became the first country to register its vaccine for coronavirus, and this news gave a push to heavy risk appetite in the market.

The stock markets rushed to their higher level on this news, and the riskier currency Euro also gained from it in the early trading session. The gains continued after the release of macroeconomic data from the European side.

At 14:00 GMT, the ZEW Economic Sentiment for Eurozone in August surged to 64.0 against the expected 55.3 and supported the single currency. The ZEW Economic Sentiment for Germany surged to 71.5 from the anticipated 57.0 and supported Euro. The better than expected economic sentiment for the month gave strength to a single currency and pushed EUR/USD pair above 1.18050 level.

However, the gains could not last for long as the U.S. President Donald Trump announced that he was very seriously considering a capital gains tax cut to help job creation. If Trump gave another executive order on capital taxation, it would likely face legal challenges as it would push the boundaries of the President’s executive orders.

Daily Technical Levels

Support Pivot Resistance
1.1704 1.1756 1.1790
1.1670 1.1842
1.1618 1.1876

EUR/USD– Trading Tip

The EUR/USD pair is trading at 1.1720 level, testing the triple bottom support level of 1.1714 level. Closing of candles below 1.1710 level can drive more selling in the pair until 1.1639 level. On the higher side, the EUR/USD pair may find resistance at 1.1793 level. Three black crows on the 4-hour timeframe are suggesting odds of selling trend continuation in the EUR/USD.


GBP/USD – Daily Analysis

The GBP/USD pair was closed at 1.30470 after placing a high of 1.31318 and a low of 1.30413. Overall the movement of GBP/USD pair remained bearish throughout the day. The GBP/USD pair dropped on Tuesday and posted losses as the unemployment benefits claims surged in the local country and also because of the strength of the U.S. dollar onboard.

At 04: 01 GMT, the BRC Retail Sales Monitor from Great Britain surged to 4.3% from the expected 2.5% and supported British Pound. At 11:00 GMT, the Claimant Count Change for July rose to 94.4K from the expected 9.7K and weighed heavily on British Pound. The Unemployment Rate from the U.K. came in as 3.9% in June and fell short of expectations of 4.2% and supported GBP.

The most important data on Tuesday was the clamant count change from the U.K. that showed that more people applied for unemployment benefits in July. According to the Office of National Statistics, around 730,000 people have become unemployed since March this year, and since June, further 114,000 people have lost their jobs.

However, the jobless rate remained flat at 3.9% in June; this reflected that the number of people who had given up looking for work increased.

The ONS Deputy national statistician, Jonathan Athow, said that the labor market had continued its recent fall in employment and significantly reduced work hours because many people were furloughed.

The people without a job and those who were not even looking for a job but wanted to work increased as the demand for workers was depressed.

It is also believed that the full extent of Britain’s’s job problems has been hidden under the Government’s furlough scheme, which promised to cover 80% of the salaries of workers who could not work due to lockdown.

Daily Technical Levels

Support Pivot Resistance
1.3016 1.3074 1.3107
1.2983 1.3165
1.2925 1.3197

GBP/USD– Trading Tip

On Tuesday, the GBP/USD consolidates at 1.3067 level, holding right above the 50 periods EMA support area of 1.3040 level while the bearish breakout of 1.3040 level can extend selling unto 1.2918 level. Recently as we can see in the chart above that the GBPUSD pair has violated its upward trendline that supported the pair around 1.3130 level, and now below this, we can expect GBP/USD to continue trading bearish. The GBP/USD should show a bearish crossover to confirm a strong selling bias in the Cable. On the higher side, Sterling may find resistance at 1.3105 and 1.3175. Let’s consider selling below 1.3045 level today. 


USD/JPY – Daily Analysis

The USD/JPY pair was closed at 106.491 after placing a high of 106.682 and a low of 105.870. Overall the movement of the USD/JPY pair remained bullish throughout the day. The USD/JPY pair extended its previous day gains and rose for the 3rd consecutive day on Tuesday amid increased risk appetite in the market. The Russian vaccine, U.S. Stimulus package, Trump’s executive orders, and the rise of the equity market drove Tuesday’s move of USD/JPY pair.

In the early session of Tuesday, the President of Russia, Vladimir V. Putin, announced that the Russian government had approved the world’s first coronavirus vaccine. Putin said that his daughter had taken the vaccine in a cabinet meeting, and it has worked adequately enough to declare it safe.

However, global health authorities have said that the vaccine has to complete the last stage of clinical trials to be approved. Despite this, Mr. Putin thanked the scientists in a congratulatory note to the nation who developed the vaccine. He also said that it was “the first” very important step for Russia and generally for the whole world.

Scientists in Russia and other countries said that rushing to offer the vaccine before final-stage testing could backfire. Tens of thousands of people are included in the final stage of trials, and it could take months to prove its effectiveness.

However, investors cheered the news of the vaccine as it was long-awaited, and as in result, the risk appetite of the market rose. The equity markets surged that weighed on the safe-haven Japanese Yen, which ultimately pushed the USD/JPY pair higher, which keeps challenges the upbeat market tone. In the meantime, the White House National Security Adviser Robert O’Brien blamed China while saying that the “Chinese hackers have been targeting U.S. election infrastructure ahead of the 2020 presidential election.” These gloomy updates capped further upside in the currency pair by giving support to the safe-haven Japanese yen.

As a result of the upbeat U.S. data, the broad-based U.S. dollar succeeded in gaining some positive traction on the day. Still, the bullish bias in the U.S. dollar is expected to be short-lived as doubts remain about the U.S. economic recovery amid on-going coronavirus cases. However, the gains in the U.S. dollar became the key factor that kept the currency pair higher.

Daily Technical Levels

Support Pivot Resistance
106.0400 106.3700 106.8200
105.5900 107.1500
105.2600 107.6000

USD/JPY – Trading Tips

The USD/JPY trades sharply bullish to break out of the sideways trading range of 106.480 – 105.440. Bullish crossover of 106.480 level is opening further room for buying until 107.450 level. The RSI and MACD are also supporting bullish bias in the pair. A recent bullish breakout of 106.450 level can extend the buying trend until 107.390. The current market price of USDJPY is staying over 50 EMA, which extends support at 105.950 and may push the pair higher. Let’s consider buying above 106.480 level today. Good luck! 

Categories
Crypto Market Analysis

Daily Crypto Review, August 12 – Crypto Selloff Brings Bitcoin to $11,000 Mark; What’s Next?

The cryptocurrency market was in the red in the past 24 hours, with most altcoins’ prices falling down over 5%. Bitcoin is currently trading for $11,375, which represents a decrease of 4.05% on the day. Meanwhile, Ethereum lost 4.84% on the day, while XRP lost 7.59%.

 Daily Crypto Sector Heat Map

When talking about top100 cryptocurrencies, Compound gained 31.08% on the day, making it the most prominent daily gainer. Swipe (16.13%) and Maker (12.37%) also did great. On the other hand, Band Protocol lost 16.42%, making it the most prominent daily loser. It is followed by yearn.finance’s loss of 14.86% and Nervos Network’s loss of 14.41%.

Top 10 24-hour Performers (Click to enlarge)

Bottom 10 24-hour Performers (Click to enlarge)

Bitcoin’s dominance level has increased slightly since we last reported, with its value currently at 61.39%. This value represents a 0.17% difference to the upside when compared to yesterday’s value.

Daily Crypto Market Cap Chart

The cryptocurrency market cap experienced a major decrease in value since we last reported. Its current value is $345.60 billion, which represents an increase of $7.98 billion when compared to yesterday’s value.

_______________________________________________________________________

What happened in the past 24 hours?

_______________________________________________________________________

_______________________________________________________________________

Technical analysis

_______________________________________________________________________

Bitcoin

Bitcoin experienced a large selloff as a result of bulls failing to successfully break the $12,000 mark. The largest cryptocurrency by market cap fell to $11,090 support level before rallying slightly to $11,400 levels. However, Bitcoin might have another bullish move as the RSI is dangerously close to the oversold territory while the volume is high, and since the $11,090 support level held up nicely, Bitcoin confirmed it almost certainly will not go below.

BTC traders should look for an opportunity when BTC makes another move towards the upside and breaks $11,460.

BTC/USD 4-hour Chart

Technical factors:
  • Price is currently below its 50-period EMA, as well as its 21-period EMA
  • Price is above its lower B.B
  • RSI is near the oversold territory (35.52)
  • Volume is decreasing from above-average levels
Key levels to the upside          Key levels to the downside

1: $11,460                                 1: $11,090

2: $11,630                                 2: $10,850

3: $12,000                                  3: $10,500

Ethereum

Ethereum also experienced a selloff, partly because of not being able to go past $400 and partly because of Bitcoin’s move towards the downside. The price broke the triangle formation to the downside (as we said in the previous article) as there was not enough pressure for it to get past the $415 mark. The second-largest cryptocurrency by market cap tested the $361 support, which held up nicely and did not let ETH fall below. Ethereum is now at the $375 mark and is showing no signs of dropping further below.

Traders should look for a trade opportunity when Ethereum makes a bounce towards the upside or falls below $361.

ETH/USD 4-hour Chart

Technical Factors:
  • Price is below its 21-period EMA and its 50-period EMA
  • Price is at its bottom B.B.
  • RSI is near the oversold territory (33.99)
  • Volume is average
Key levels to the upside          Key levels to the downside

1: $400                                     1: $361

2: $415                                     2: $340

3: $496                                      3: $302

Ripple

XRP was no different than Bitcoin and Ethereum in terms of the direction of its movement throughout the day, but it did differ in terms of intensity of the move. The third-largest cryptocurrency by market cap lost over 8% of its value at one point, as bears took over the market when XRP couldn’t break $0.31. The price fell to as low as $0.266 but quickly recovered to its current position ($0.278).

Traders can look for an opportunity to trade after XRP breaks $0.285.

XRP/USD 4-hour Chart

Technical factors:
  • Price is below its 21-period and 50-period EMA
  • Price is slightly above its bottom B.B.
  • RSI is near the oversold territory (35.64)
  • Low volume (slightly increased)
Key levels to the upside          Key levels to the downside

1: $0.285                                    1: $0.266  

2: $0.31                                     2: $0.245

3: $0.32                                    3: $0.235


Categories
Forex Market Analysis

Daily F.X. Analysis, August 11 – Top Trade Setups In Forex – Stronger Dollar In Play! 

On the news front, the economic calendar is a bit light and may not be offering any major economic release. Therefore, we need to trade based upon stronger dollar sentiment, as traders are likely to price better than expected NFP data from last week.

Economic Events to Watch Today  


EUR/USD – Daily Analysis

The EUR/USD pair was closed at 1.17363after placing a high of 1.18005 and a low of 1.17358. Overall the movement of the EUR/USD pair remained bearish throughout the day. The EUR/USD pair extended its previous day’s losses on Monday amid the strong U.S. dollar and increasing US-China tensions. The main driver of the EUR/USD pair on Monday was the U.S. dollar.

The U.S. Dollar was strong across the board with the U.S. Dollar Index at 93.5 level, with investors taking comfort from President Donald Trump’s move to boost the economy in the wake of coronavirus pandemic.

Over the weekend, U.S. President Trump signed a series of executive orders aimed at enhancing the economic condition. The orders included an extension of expanded jobless benefits at a lower rate of $400 a week. It was down from the previous $600 a week. The State government will pay 1/4th of the bill, which was also included in Trump’s order.

However, it is not clear that the executive orders can withstand court scrutiny as the power relies on Congress. Nevertheless, the President’s orders were an attempt to play his part in breaking the impasse. Though the talks between Republicans & Democrats on August 7 broke some of the differences, they still did not show any consensus. The new round of talk is expected to resume at some point, but the date is not yet confirmed.

The chances for a $3 trillion stimulus package have been compromised to $2 trillion by Democrats, but that is still a trillion more than the framework that the ruling party aimed for. Additionally, the JOLTS Job Openings data from the U.S. on Monday came in as 5.89 M in June in comparison to 5.30M of forecasts and supported the U.S. dollar that weighed on EUR/USD pair.

From the Europe side, the Sentix Investor Confidence for August dropped to -13.4 from the anticipated -16.0 and the previous -18.2 and supported Euro that kept the losses of EUR/USD pair limited on Monday.

Meanwhile, early on Monday, the Defence Ministry of Taiwan said that a Chinese jet fighter crossed the median of the Taiwan Strait line, possibly in response to the U.S. Health Secretary Alex Azar’s visit to Taipei.

Any form of American recognition of the island nation Taiwan that China claimed its own make Beijing angry, and hence, it responded. The tensions in Taiwan have grown since the Hong Kong clash between the U.S. & China.

Besides this, the world’s biggest nations are also clashing over the technological front; recently, the U.S. banned American firms from dealing with TikTok and WeChat app. However, the most important matter between both countries lies with the fulfillment of the phase-one trade deal. Negotiators from both sides are scheduled to meet this week to analyze the achievements of the deal. The risk-off market sentiment was picking its pace after the escalation of US-China tensions, and it has weighed on the riskier pair EUR/USD.

Daily Technical Levels

Support Pivot Resistance
1.1713 1.1758 1.1780
1.1691 1.1825
1.1646 1.1848

EUR/USD– Trading Tip

The single currency Euro slipped against the U.S. dollar amid increased USD demand as traders started to price in stronger than expected NFP data released on Friday. The EUR/USD is now bouncing off the support level of the 1.1728 level. It may head higher towards 23.6% Fibonacci retracement level of 1.1768, and above this, the next resistance can stay at 1.1765 level, which marks 38.2% Fibonacci retracement level.


GBP/USD – Daily Analysis

The GBP/USD pair was closed at 1.30730 after placing a high of 1.31032 and a low of 1.30188. Overall the movement of GBP/USD pair remained bullish throughout the day. The GBP/USD pair rose on Monday ahead of key data due later this week, despite the U.S. dollar’s strength. The risk sentiment favored some of the factors, and investors believe that further upside could be on the horizon.

The latest higher move in the Pound was because of the key economic data, including the update of the labor market and second-quarter GDP scheduled to be released later this week. Moreover, the GBP/USD pair was also supported by the improving risk sentiment in the market after the hopes about the US-China phase-one trade deal became optimistic.

The U.S. trade representative and U.S. Treasury Secretary will meet the Chinese Vice Premier later this week to evaluate the implementation of the phase-one trade deal by China. China has assured that it will fulfill its promises made under the agreement that include the increased U.S. farm purchases and the better protection of Intellectual property rights.

This faded some of the risk-off market sentiment and caused GBP/USD to surge.

The risk sentiment was backed by the comments of WHO Chief Scientist Dr. Soumya Swaminathan, who praised the global efforts in the development of the COVID-19 vaccine. She reported that almost 200 vaccines were being developed globally and were in the stage of clinical or pre-clinical trials. According to her, 24 vaccines had entered the clinical trials in human beings.

The unprecedented global efforts to develop the coronavirus vaccine triggered the risk-on market sentiment as various potential paths to the end of coronavirus gave hope to the investors. The improved risk appetite gave a push to GBP/USD pair on Monday.

On Brexit front, the U.K. media has suggested that David Frost remain the U.K.’s chief Brexit negotiator and will stay on committed to securing an agreement with the European Union even if a deal is not secured by the end of September.

The U.K. formally left the E.U. in January after voting to leave in 2016, and negotiations to reach post-Brexit trade deal are currently deadlocked because both sides have failed to reach a consensus on various matters.

As the end of the transition periods is getting closer day by day, Prime Minister Boris Johnson has vowed to end the year with or without a deal, outside Europe. David Frost is set to take up a new position as National Security Advisor (NSA) in September. However, his position as Chief Brexit Negotiator will remain in place.

Meanwhile, the U.K. government pledged a further 20 Million Pounds in aid to Lebanon following Tuesday’s deadly explosion in Beirut. The U.K.’s support will directly go to the injured and people displaced by the explosion. It will also provide food, medicine, and urgent supplies to the needy in Lebanon affected by the explosion.

The U.K. government has already given 5 Million Pound to the emergency relief effort and said that it would stand by the Lebanese people in the hour of need. This also helped GBP in recovering its position and pushed GBP/USD pair higher on Monday.

Daily Technical Levels

Support Pivot Resistance
1.3024 1.3064 1.3110
1.2978 1.3150
1.2938 1.3196

GBP/USD– Trading Tip

On Tuesday, the GBP/USD consolidates at 1.3067 level, holding right above the 50 periods EMA support area of 1.3040 level while the bearish breakout of 1.3040 level can extend selling unto 1.2918 level. Recently as we can see in the chart above that the GBPUSD pair has violated its upward trendline that supported the pair around 1.3130 level, and now below this, we can expect GBP/USD to continue trading bearish. The GBP/USD should show a bearish crossover to confirm a strong selling bias in the Cable. On the higher side, Sterling may find resistance at 1.3105 and 1.3175. Let’s consider selling below 1.3045 level today. 


USD/JPY – Daily Analysis

The USD/JPY currency pair succeeded to break its previous session thin trading range and rose above 106.00 marks mainly due to the broad-based U.S. dollar fresh strength, buoyed by the Friday’s better-than-expected employment report, which eventually helped the U.S. dollar to put the bids. 

On the other hand, the upbeat market sentiment, backed by the optimism that the U.S. policymakers are showing signs to resume talks about the stimulus package, undermined the safe-haven Japanese yen and contributed to the pair’s gains. In the meantime, the risk-on market sentiment was further bolstered by the upbeat key U.S. and China data, which tends to urge buyers to invest in riskier assets instead of safe-have assets. Currently, the USD/JPY currency pair is currently trading at 106.00 and consolidating in the range between 105.72 – 106.06.

Despite concerns about the ever-increasing coronavirus cases across the world and worsening US-China relations, the investors continued to cheer the hopes of the U.S. fiscal stimulus package triggered by the signs that White House officials and congressional Democrats showed a willingness to compromise on another stimulus package to bolster the stalled economy. 

On the other hand, U.S. President Donald Trump fulfilled his promise to take executive action as the U.S. Congress failed to offer any outcome over the country’s latest stimulus measures. As a result, U.S. President Trump’s signed four executive orders to release unemployment claim benefits, help with student loans, and aid those living in a rented house, which also exerted a positive impact on the market trading sentiment and contributed to the currency pair losses.

Moreover, the upbeat market sentiment was being supported by Friday’s better-than-expected employment report. Details suggested Non-farm payrolls increased by 1.763 million in July month, vs. the estimated 1.6 million increase. The unemployment rate also declined to 10.2% in July, compared to June’s reading of 10.5%.

Despite the positive data, the doubts remain about the U.S. economic recovery amid the on-going surge in the coronavirus cases. As per the latest report, the U.S. crossed the five million COVID-19 cases as of August 10, according to Johns Hopkins University. Whereas Australia’s 2nd-most populous state, the epicenter of the pandemic, Victoria, reported the biggest single-day rise in deaths. As per the latest figures, Australia’s coronavirus death losses crossed 314 as Victoria announces a daily record of 19 deaths and 322 new cases in the past 24 hours. 

Apart from the virus woes, the long-lasting struggle between the world’s two largest economies remained on the cards as U.S. President Donald Trump turned off the business tap for China’s TikTok and WeChat. As well as, the U.S. imposed sanctions on the Hong Kong Leader Carry Liam, which keeps challenges the upbeat market tone. In the meantime, the White House National Security Adviser Robert O’Brien blamed China while saying that the “Chinese hackers have been targeting U.S. election infrastructure ahead of the 2020 presidential election.” These gloomy updates capped further upside in the currency pair by giving support to the safe-haven Japanese yen.

As a result of the upbeat U.S. data, the broad-based U.S. dollar succeeded in gaining some positive traction on the day. Still, the bullish bias in the U.S. dollar is expected to be short-lived as doubts remain about the U.S. economic recovery amid on-going coronavirus cases. However, the gains in the U.S. dollar became the key factor that kept the currency pair higher.

Daily Technical Levels

Support Pivot Resistance
105.6900 105.9500 106.1900
105.4500 106.4500
105.1900 106.7000

USD/JPY – Trading Tips

The USD/JPY has made a slight bullish recovery from 105.780 to 106.150 area, especially after examining the 38.2% Fibonacci support level of 105.650. A bullish breakout of 106.467 resistance level can drive more buying until the next resistance area f 107.198. On the lower side, the USD/JPY may find support at 105.600 and 105.078, extended by the 38.2% and 61.8% Fibonacci retracement level. The current market price of USDJPY is staying over 50 EMA, which extends support and may push the pair higher. Let’s consider buying above 105.750 level today. Good luck! 

Categories
Crypto Market Analysis

Daily Crypto Review, August 11 – yEarn Finance Token Explodes After Binance Listing; BTC Hashrate Unaffected by the Price Upswing

The cryptocurrency market tried to catch up to Bitcoin after it pushed up yesterday. Bitcoin is currently trading for $11,938, which represents an increase of 1.26% on the day. Meanwhile, Ethereum gained 1.27% on the day, while XRP lost 4.73%.

 Daily Crypto Sector Heat Map

When talking about top100 cryptocurrencies, yearn.finance gained 50.03% on the day, making it the most prominent daily gainer. JUST (39.71%) and Terra (28.27%) also did great. On the other hand, Balancer lost 13.90%, making it the most prominent daily loser. It is followed by Band Protocol’s loss of 9.52% and iExec RLC’s loss of 6.35%.

Top 10 24-hour Performers (Click to enlarge)

Bottom 10 24-hour Performers (Click to enlarge)

Bitcoin’s dominance level has decreased slightly since we last reported, with its value currently at 61.22%. This value represents a 0.56% difference to the downside when compared to yesterday’s value.

Daily Crypto Market Cap Chart

The cryptocurrency market cap has increased since we last reported. Its current value is $363.58 billion, which represents an increase of $0.89 billion when compared to yesterday’s value.

_______________________________________________________________________

What happened in the past 24 hours?

_______________________________________________________________________

_______________________________________________________________________

Technical analysis

_______________________________________________________________________

Bitcoin

Bitcoin has spent the day trying to regain what’s been lost after the failed attempt to break the $12,000 mark. However, the price doesn’t seem like it will be able to push past this level unless a surge in volume and bull pressure happens. Meanwhile, Bitcoin is locked between $11,630 and $12,000. When it comes to moves towards the downside, Bitcoin is well protected by the 21-period and 50-period moving averages.

BTC traders should look for an opportunity when BTC makes another push and breaks $12,000.

BTC/USD 4-hour Chart

Technical factors:
  • Price is currently above its 50-period EMA, as well as its 21-period EMA
  • Price between its middle B.B (20-period SMA) and its top B.B.
  • RSI is neutral (56.12)
  • Volume is decreasing
Key levels to the upside          Key levels to the downside

1: $12,000                                 1: $11,630

2: $12,330                                 2: $11,460

3: $13180                                   3: $11,090

Ethereum

Ethereum was quite stable in the past 24 hours, making small gains in an attempt to catch up to Bitcoin’s gains that happened yesterday. However, if we take a look at this month’s price movement, we can interpret the moves as a triangle formation, which will make a breakout very soon. It is more likely that the second-largest cryptocurrency by market cap will break the triangle formation towards the downside unless Bitcoin’s move pushes it up.

Traders should look for a trade opportunity when Ethereum breaks the formation.

ETH/USD 4-hour Chart

Technical Factors:
  • Price is above its 21-period EMA and its 50-period EMA
  • Price is slightly below its top B.B.
  • RSI is neutral (56.42)
  • Volume decreasing
Key levels to the upside          Key levels to the downside

1: $400                                     1: $361

2: $415                                     2: $340

3: $496                                      3: $302

Ripple

XRP is the cryptocurrency that gained the most in the past 24 hours (when compared to Bitcoin and Ethereum) as its price increased close to 5% on the day. The third-largest cryptocurrency by market cap made another push towards the $0.31 resistance level, but the move failed to even reach the level, let alone break it.

Traders can look for an opportunity to trade XRP within the range it is currently in.

XRP/USD 4-hour Chart

Technical factors:
  • Price is above its 21-period and 50-period EMA
  • Price is above its top B.B.
  • RSI is slightly elevated (58.52)
  • Low volume (slightly increased)
Key levels to the upside          Key levels to the downside

1: $0.31                                     1: $0.285  

2: $0.32                                     2: $0.266

3: $0.3328                                3: $0.245


Categories
Crypto Market Analysis

Daily Crypto Review, August 10 – Chainlink Surpasses LTC’s Market Cap Despite Major Bearish Signals

The cryptocurrency market had an interesting weekend, with Bitcoin pushing towards 12,000 and actually passing it at the time of writing. Bitcoin is currently trading for $12,003, which represents an increase of 2.24% on the day. Meanwhile, Ethereum gained 0.18% on the day, while XRP lost 0.11%.

 Daily Crypto Sector Heat Map

When talking about top100 cryptocurrencies, Balancer gained 45.17% on the day, making it the most prominent daily gainer. Band Protocol (32.27%) and Nervos Network(26.64%) also did great. On the other hand, Flexacoin lost 16.27%, making it the most prominent daily loser. It is followed by Decentraland’s loss of 9.91% and Elrond’s loss of 6.81%.

Top 10 24-hour Performers (Click to enlarge)

Bottom 10 24-hour Performers (Click to enlarge)

Bitcoin’s dominance level has increased slightly since we last reported, with its value currently at 61.78%. This value represents a 0.28% difference to the upside when compared to Friday’s value.

Daily Crypto Market Cap Chart

The cryptocurrency market capitalization has increased since we last reported. Its current value is $362.67 billion, which represents an increase of $3.77 billion when compared to Friday’s value.

_______________________________________________________________________

What happened in the past 24 hours?

_______________________________________________________________________

_______________________________________________________________________

Technical analysis

_______________________________________________________________________

Bitcoin

Bitcoin has spent the weekend pushing towards $12,000 and finally passing it in a major push just a couple of hours ago. However, the price didn’t fully (or at all) establish itself above the major mark. Bitcoin will need to confirm its position above $12,000 (and confidently) before being considered as officially above it. For now, this level is still a resistance level.

BTC traders should look for an opportunity to make a trade when BTC confirms its position above or below $12,000.

BTC/USD 4-hour Chart

Technical factors:
  • Price is currently above its 50-period EMA, as well as its 21-period EMA
  • Price above its top B.B.
  • RSI is elevated (65.89)
  • Volume elevated (on the increase)
Key levels to the upside          Key levels to the downside

1: $12,000                                 1: $11,630

2: $12,330                                 2: $11,460

3: $13180                                   3: $11,090

Ethereum

Unlike Bitcoin, Ethereum spent the weekend without much movement towards the upside. However, the second-largest cryptocurrency by market cap did fall back to the $361 level and tested its support, which held up quite nicely. Once the price bounced back to its previous highs, it continued slowly moving towards the upside, but without any real strength. Ethereum still has a way to go before it reaches past $400.

Traders should look for a trade opportunity when Ethereum increases its volume.

ETH/USD 4-hour Chart

Technical Factors:
  • Price is above its 21-period EMA and its 50-period EMA
  • Price is slightly below its top B.B.
  • RSI is elevated (58.51)
  • Volume increasing slightly
Key levels to the upside          Key levels to the downside

1: $400                                     1: $361

2: $415                                     2: $340

3: $496                                      3: $302

Ripple

XRP had quite a turbulent weekend, with its price failing to stay above the previously broken triangle formation levels. This happened as, even though XRP managed to break the triangle formation to the upside, it did not reach past the $0.31 resistance level. Instead, bears stepped into the market and brought the price down to below $0.285 levels (at one point). However, the $0.285 level held up and XRP has confirmed its position above this support.

Traders can look for an opportunity to trade when XRP reaches the $0.31 mark and decides if it will reach above it or fall below once again.

XRP/USD 4-hour Chart

Technical factors:
  • Price is above its 21-period and 50-period EMA
  • Price is slightly above its middle B.B. (20-period SMA)
  • RSI is neutral (51.45)
  • Low volume
Key levels to the upside          Key levels to the downside

1: $0.31                                     1: $0.285  

2: $0.32                                     2: $0.266

3: $0.3328                                3: $0.245


Categories
Forex Market Analysis

Daily F.X. Analysis, August 07 – Top Trade Setups In Forex – Big Day, NFP is Here! 

The Non-farm payrolls will extend clarity over the damage in the labor market last month, and traders will keenly await its release. Overall, economists expect a slight improvement in the U.S. unemployment rate from 11.1% to 10.5%, while the Average Hourly Earnings are expected to improve from -1.2% to -0.5%%. The NFP itself is expected to report 1530K (negative for a dollar) vs. 4800K figures beforehand.

Economic Events to Watch Today  


EUR/USD – Daily Analysis

The EUR/USD closed at 1.18640 after placing a high of 1.19048 and a low of 1.17927. The EUR/USD once again saw a bullish movement after a brief U.S. dollar recovery attempt earlier this week. Despite worsened coronavirus cases in some Eurozone nations, the bloc’s outlook remained much more optimistic than the U.S. outlook.

While the advances in the Euro have slowed, the EUR/USD pair has continued to trend higher over the past week. EUR/USD pair climbed slightly from 1.1656 to 1.1778 last week. After U.S. Dollar attempted to recover, the pair EUR/USD saw a brief dip at the beginning of this week. However, the EUR/USD pair is eventually rising again as the U.S. dollar’s weakness persists. Whereas, the potential for advances in the currency pair was limited as coronavirus concerns rose on Sunday. The Euro remained broadly appealing overall. Throughout the coronavirus pandemic, the E.U. and the European Central Bank have handled the crisis well compared to other major economies like the U.K. & U.S.

As a result, Euro’s losses in response to a rebounding U.S. dollar have been limited. The Euro and U.S. dollar has a negative correlation, and the Euro often gains from the U.S. dollar weakness. It means that the rally of the EUR/USD pair is set to continue even a rise in worsening coronavirus cases’ concerns.

The Euro appeal was also down after Spain saw a surge in coronavirus cases, and speculations arose that the Eurozone could face fresh lockdowns in Spain to support the Eurozone economy. On the U.S. dollar front, the greenback attempted recovery earlier this week; however, the gloomy outlook persisted and kept investors from mounting much of a recovery rally in the currency.

The number of coronavirus cases in the United States has increased to its highest, and the U.S. government and Federal Reserve have only taken mixed action to limit the virus spread and protect the U.S. economy. Attempts to push further stimulus have been stuck in U.S. Congress, and Federal Reserve may become more dovish.

On the data front, at 12:15 GMT, the Spanish Services PMI fell short of expectations of 52.3 and came in as 51.9. The Italian Services PMI for July came in as 51.6 against the expectations of 51.6 and supported Euro.

At 12:50 GMT, the French Final Services PMI for July dropped to 57.3 against the expected 57.8 and weighed on Euro. At 12: 55 GMT, the German Final Services PMI dropped to 55.6 against the forecasted 56.7. The Final Services PMI for the whole bloc fell to 54.7against the forecasted 55.1and weighed on EURO.

Later today, eyes will remain on the Non-farm payrolls will extend clarity over the damage in the job market last month, and traders will eagerly await its release. Overall, economists expect a slight improvement in the U.S. unemployment rate from 11.1% to 10.5%, while the Average Hourly Earnings are expected to improve from -1.2% to -0.5%%. The NFP itself is expected to report 1530K (negative for a dollar) vs. 4800K figures beforehand.

Daily Technical Levels

Support Pivot Resistance
1.1802 1.1854 1.1915
1.1740 1.1968
1.1688 1.2029

EUR/USD– Trading Tip

The EUR/USD pair retraced lower to complete 38.2% Fibonacci retracement at 1.1817 level. On the higher side, the EUR/USD pair may find resistance at 1.1909 level, and the closing of candles below this level can keep bearish pressure on EUR/USD. A bullish breakout of this level can extend the buying trend until 1.2050. Today, the EUR/USD is likely to find support at 1.1800 level. Let’s keep an eye on NFP as it may drive sharp price action in the EUR/USD pair.


GBP/USD – Daily Analysis

The GBP/USD closed at 1.31133 after placing a high of 1.31614 and a low of 1.30528. The pound rose on Wednesday to remain on course for a third-straight weekly gain against the U.S. dollar and ignored weaker than expected economic data ahead of the Bank of England meeting on Thursday. Previously, the Final Services PMI in July came in as expected 56.5 points and indicated expansion in the services sector in the U.K.

This Thursday, the focus will be on the Bank of England’s monetary policy decision and Andrew bailey’s speech. England’s central bank is anticipated to keep interest rates unchanged but will roll out its forecasts on a range of economic measures, including Inflation, GDP, and unemployment. In recent weeks, debates have been under discussion about the BoE’s cutting of rates below zero, but Thursday’s meeting is unlikely to offer detailed insight.

The NIRP (Negative Interest Rate Policy) has been under active review at the Bank of England, but it seems like a little too early for the central bank to make any decisive move. Some analysts expect that the Bank of England will prefer to use a negative interest rate until the EU-UK relationship for 2021 gets cleared.

On the U.S. front, the ADP Non-Farm Employment Change dropped to 167K from the expected 1200K in July. It means that the U.S. government introduced 167K jobs only while that weighed on the U.S. dollar and added strength to the GBP/USD pair gains.

However, in July, the Final Services PMI rose to 50.0 from expected 49.6, and the ISM Non-Manufacturing PMI rose to 58.1 from expected 55.0. This showed an expansion in America’s services sector in July and supported the U.S. dollar that weighted on additional gains in GBP/USD pair.

Another reason for the rise in GBP/USD pair was the weakness of the U.S. dollar. The ever increasing numbers of coronavirus cases dampened the prospects for a swift economic recovery in the U.S. and forced investors to continue dumping the greenback. This, coupled with the delay in the U.S. fiscal stimulus package’s announcement and further pressurized the U.S. dollar.

The U.S. dollar was so under pressure that even the goodish rebound in the U.S. Treasury bond yields failed to support the U.S. dollar.

Apart from this, the rising number of coronavirus cases in the U.K. and the renewed fears of no-deal Brexit, as both sides were lagging in securing a deal, held investors to place any aggressive bullish position in the GBP/USD pair ahead of BoE monetary policy.

Daily Technical Levels

Support Pivot Resistance
1.3060 1.3111 1.3166
1.3005 1.3217
1.2954 1.3271

GBP/USD– Trading Tip

The GBP/USD consolidates at 1.3127 level, holding right above the double bottom support area of 1.3103 level while the bearish breakout of 1.3105 level can extend selling unto 1.3058 level. Recently as we can see in the chart above, the GBPUSD pair has violated the upward trendline, which supported the pair around 1.3130 level. At the same level, the 50 EMA was extending support, but the GBP/USD showed a bearish crossover, suggesting further odds of selling in the Cable. On the higher side, Sterling may find resistance at 1.3176. Let’s consider selling below 1.3105 level today. 

USD/JPY – Daily Analysis

A day before, the USD/JPY closed at 105.592 after placing a high of 105.871 and a low of 105.318. Overall the movement of the USD/JPY pair remained bearish throughout the day. The USD/JPY pair extended the decay on the back of the weaker U.S. dollar across the board and bank of Japan governor Kuroda’s speech telling that Japan’s economy will improve in the second half of the year.

The Bank of Japan Governor Haruhiko Kuroda warned that in order to contain the spread of public health measures were re-introduced, then the economic activity could be significantly constrained. He also affirmed that Japan was not slipping into deflation and that the central bank would continue with its efforts to achieve the inflation target of 2%. Kuroda again assured that the Bank of Japan would be ready to ramp up the monetary stimulus without hesitation if needed to aid the economy through the pandemic crisis.

Kuroda also said that Japan’s financial system was quite safe and stable and countered the fears that the banking sector would fall out from COVID-19. He also warned that there would be risks to Japan’s financial stability if pandemic prolonged longer than expected.

He said that Japanese and overseas economies would gradually improve from the second half of this year despite extremely high uncertainties. However, the pace of growth is expected to be moderate as the preventive measures to control the virus spread has its effects on economic activity.

On the other hand, the greenback was the worst performer in the currency market. It was so under pressure that it could not benefit from the latest round of economic data that showed an improvement in the Service Sector of the U.S. The rebound in the U.S. Treasury yield also could not support the U.S. dollar. The U.S. Dollar Index (DXY) was testing the 92.60 level lowest since last week.

On the data front, the ADP Non-Farm Employment Change showed that the U.S. created 167,000 jobs in July against the estimated 1200K. This weighed on the U.S. dollar and added further in the losses of the USD/JPY pair.

The Trade Balance from the U.S. fell in line with the expectations of -50.7B. The Final Services PMI rose to 50.0 points in July than the expectations of 49.6 and supported the U.S. dollar. At the same time, the ISM Non-Manufacturing PMI also rose to 58.1 points from the forecasted 55.0 and came in favor of the U.S. dollar.

However, USD bulls did not cheer the positive data, and the U.S. dollar remained under stress to post losses on the day. On the US-China front, China’s ambassador to Washington said that China did not want to see a Cold War break out between China and the U.S. He suggested that both countries need to work to repair their relations that were under extraordinary stress.

Daily Technical Levels

Support Pivot Resistance
105.3100 105.6000 105.8800
105.0300 106.1700
104.7400 106.4500

USD/JPY – Trading Tips

Technically, the USD/JPY hasn’t changed much as USD/JPY continues to consolidate at 105.680 with bearish sentiment, especially after violating the 38.2% Fibonacci support level of 105.650. On the lower side, the USD/JPY may find support at 105.078 level, which is extended by the 61.8% Fibonacci retracement level. A bearish breakout of 61.8% level can drive more selling until the next support area f 104.200. The current market price of USDJPY is staying below 50 EMA, which extends resistance at 105.650 level. Let’s consider selling below 105.650 level today. Good luck! 

Categories
Crypto Market Analysis

Daily Crypto Review, August 7 – Goldman Sachs Launching its Own Stablecoin; DeFi Platforms Traffic Surging

The cryptocurrency market ended up mostly in the green, with Bitcoin continuing its path towards $12,000. Bitcoin is currently trading for $11,831, which represents an increase of 1.34% on the day. Meanwhile, Ethereum lost 0.18% on the day, while XRP gained 1.4%.


 Daily Crypto Sector Heat Map

When talking about top100 cryptocurrencies, Balancer gained 23.90% on the day, making it the most prominent daily gainer. Aave (20.29%) and Decentraland (15.99%) also did great. On the other hand, Aurora lost 12.10%, making it the most prominent daily loser. It is followed by Ampleforth’s loss of 7.98% and The Midas Touch’s loss of 5.50%.

Top 10 24-hour Performers (Click to enlarge)

Bottom 10 24-hour Performers (Click to enlarge)

Bitcoin’s dominance level has increased slightly since we last reported, with its value currently at 61.50%. This value represents a 0.02% difference to the upside when compared to yesterday’s value.

Daily Crypto Market Cap Chart

The cryptocurrency market capitalization has increased since we last reported. Its current value is $358.90 billion, which represents an increase of $5.42 billion when compared to the value it had yesterday.

_______________________________________________________________________

What happened in the past 24 hours?

_______________________________________________________________________

_______________________________________________________________________

Technical analysis

_______________________________________________________________________

Bitcoin

The largest cryptocurrency by market capitalization kept increasing in price slowly throughout the day as sentiment turned even more bullish. However, the path towards $12,000 will not be easy, as the sell wall at the resistance is not small. On the other hand, if Bitcoin fails to break $12,000, it will create a double top and most likely fall down towards $11,630 and then $11,460 as well.

BTC traders should look for an opportunity to make a trade when BTC breaks $12,000 or fails to break it.

BTC/USD 4-hour Chart

Technical factors:
  • Price is currently above its 50-period EMA, as well as its 21-period EMA
  • Price is near its top B.B.
  • RSI is elevated (65.50)
  • Volume elevated (stable)
Key levels to the upside          Key levels to the downside

1: $11,630                                 1: $11,460

2: $12,000                                 2: $11,090

                                                  3: $10,855

Ethereum

Ethereum spent the day flattening out its movement and mostly trading sideways. The second-largest cryptocurrency by market capitalization stayed below the $400 mark and couldn’t get past it. However, with volume dying down and such low volatility, we may expect an attempt to break the $400 (and then $415) level soon.

Traders should look for a trade opportunity when Ethereum increases its volume.

ETH/USD 4-hour Chart

Technical Factors:
  • Price is above its 21-period EMA and its 50-period EMA
  • Price is slightly above its middle B.B. (20-period SMA)
  • RSI is elevated (58.42)
  • Descending volume
Key levels to the upside          Key levels to the downside

1: $400                                     1: $362

2: $415                                     2: $340

3: $496                                      3: $302

Ripple

XRP broke out from its triangle formation to the upside, but couldn’t reach past $0.31 mark. However, the pullback from a failed move didn’t discredit XRP’s break from the triangle formation, as the cryptocurrency managed to stay above the triangle. With the confirmed break, traders can expect XRP to either stay near $0.31 or push above it in the short-term unless some other catalyst sparks a movement to the downside.

Traders can look for an opportunity to trade when XRP breaks $0.31.

XRP/USD 4-hour Chart

Technical factors:
  • Price is above its 21-period and 50-period EMA
  • Price is below its middle B.B. (20-period SMA)
  • RSI is neutral (55.99)
  • Low volume
Key levels to the upside          Key levels to the downside

1: $0.31                                     1: $0.285  

2: $0.32                                     2: $0.266

3: $0.3328                                3: $0.245


Categories
Crypto Market Analysis

Daily Crypto Review, August 6 – ‘Ethereum Is a Ponzi Scheme’ – Adam Back; ETC Suffers Yet Another 51% Attack

The cryptocurrency market ended up mostly in the green, with (of course) a few exceptions. Bitcoin is currently trading for $11,665, which represents an increase of 3,46% on the day. Meanwhile, Ethereum gained 1.6% on the day, while XRP gained 1.41%.

 Daily Crypto Sector Heat Map

When talking about top100 cryptocurrencies, Band Protocol gained 36.21% on the day, making it the most prominent daily gainer. Travala.com (24%) and Bancor (22.19%) also did great. On the other hand, Nexohas lost 21.32%, making it the most prominent daily loser. It is followed by The Midas Touch’s loss of 8.47% and THORChain’s loss of 7.70%.

Top 10 24-hour Performers (Click to enlarge)

Bottom 10 24-hour Performers (Click to enlarge)

Bitcoin’s dominance level has increased since we last reported, with its value currently at 61.48%. This value represents a 0.31% difference to the upside when compared to yesterday’s value.

Daily Crypto Market Cap Chart

The cryptocurrency market capitalization has increased since we last reported. Its current value is $353.48 billion, which represents an increase of $12.09 billion when compared to the value it had yesterday.

_______________________________________________________________________

What happened in the past 24 hours?

_______________________________________________________________________

_______________________________________________________________________

Technical analysis

_______________________________________________________________________

Bitcoin

The largest cryptocurrency by market capitalization continued its move towards the upside after a few days of indecisiveness and consolidation. Bitcoin saw a slight increase in volume, which brought the price above the $11,460 resistance level and up to $11,820. However, the move stopped there (for now), and Bitcoin is currently consolidating above the $11,460 level, testing it as support.

BTC traders should look for an opportunity to make a trade when BTC confirms or fails to confirm its position with $11,460.

BTC/USD 4-hour Chart

Technical factors:
  • Price is currently above its 50-period EMA, as well as its 21-period EMA
  • Price is near its top B.B
  • RSI is elevated (62.37)
  • Volume is increasing
Key levels to the upside          Key levels to the downside

1: $11,460                                 1: $11,090

2: $11,630                                 2: $10,855

 3: $12,000                                 3: $10,505

Ethereum

Ethereum seems to be back on its steady upwards path, which began on July 21. The second-largest cryptocurrency by market cap rose steadily throughout the day, trying to reach past the $415 resistance. While the price did not yet reach this mark, it did increase slightly, supported by the 21 and 50-period moving averages.

Traders should look for a trade opportunity within the range ETH is currently in.

ETH/USD 4-hour Chart

Technical Factors:
  • Price is above its 21-period EMA and its 50-period EMA
  • Price is slightly above its middle B.B. (20-period SMA)
  • RSI is elevated (60.26)
  • Descending volume
Key levels to the upside          Key levels to the downside

1: $415                                     1: $362

2: $496                                     2: $340

                                                  3: $302

Ripple

XRP experienced sideways movement on low volume throughout the day. The third-largest cryptocurrency by market capitalization was trading near the top of its triangle formation, unable to break it yet. However, the decreasing volume, as well as the price approaching the 80% mark of the formation, indicate a move which will take XRP out of the triangle formation. While it is too early to speculate, XRP seems to have a better chance of breaking to the upside.

Traders can look for an opportunity to trade when XRP breaks its triangle formation.

XRP/USD 4-hour Chart

Technical factors:
  • Price is above its 21-period and 50-period EMA
  • Price is below the middle B.B. (20-period SMA)
  • RSI is neutral (55.62)
  • Low volume
Key levels to the upside          Key levels to the downside

1: $0.32                                    1: $0.285  

2: $0.3328                                2: $0.266

                                               3: $0.245


Categories
Forex Market Analysis

Daily F.X. Analysis, August 06 – Top Trade Setups In Forex – A Day Before NFP! 

It’s going to be a busy day from a news perspective, especially for the GBP pairs. The Bank of England is scheduled to publish its Monetary policy with bank rates. Although economists are not expecting BOE to change interest rates, the MPC Asset Purchase Facility Votes is expected to change. Nine out of nine members have voted to increase the asset purchase program to accommodate the economy.

Economic Events to Watch Today  


EUR/USD – Daily Analysis

The EUR/USD closed at 1.18640 after placing a high of 1.19048 and a low of 1.17927. The EUR/USD once again saw a bullish movement after a brief U.S. dollar recovery attempt earlier this week. Despite worsened coronavirus cases in some Eurozone nations, the bloc’s outlook remained much more optimistic than the U.S. outlook.

While the advances in the Euro have slowed, the EUR/USD pair has continued to trend higher over the past week. EUR/USD pair climbed slightly from 1.1656 to 1.1778 last week. After U.S. Dollar attempted to recover, the pair EUR/USD saw a brief dip at the beginning of this week. However, the EUR/USD pair is eventually rising again as the U.S. dollar’s weakness persists. Whereas, the potential for advances in the currency pair was limited as coronavirus concerns rose on Sunday.

The Euro remained broadly appealing overall. Throughout the coronavirus pandemic, the E.U. and the European Central Bank have handled the crisis well compared to other major economies like the U.K. & U.S.

As a result, Euro’s losses in response to a rebounding U.S. dollar have been limited. The Euro and U.S. dollar has a negative correlation, and the Euro often gains from the U.S. dollar weakness. It means that the rally of the EUR/USD pair is set to continue even a rise in worsening coronavirus cases’ concerns.

The Euro appeal was also down after Spain saw a surge in coronavirus cases, and speculations arose that the Eurozone could face fresh lockdowns in Spain to support the Eurozone economy. On the U.S. dollar front, the greenback attempted recovery earlier this week; however, the gloomy outlook persisted and kept investors from mounting much of a recovery rally in the currency.

The number of coronavirus cases in the United States has increased to its highest, and the U.S. government and Federal Reserve have only taken mixed action to limit the virus spread and protect the U.S. economy. Attempts to push further stimulus have been stuck in U.S. Congress, and Federal Reserve may become more dovish.

On the data front, at 12:15 GMT, the Spanish Services PMI fell short of expectations of 52.3 and came in as 51.9. The Italian Services PMI for July came in as 51.6 against the expectations of 51.6 and supported Euro.

At 12:50 GMT, the French Final Services PMI for July dropped to 57.3 against the expected 57.8 and weighed on Euro. At 12: 55 GMT, the German Final Services PMI dropped to 55.6 against the forecasted 56.7. The Final Services PMI for the whole bloc fell to 54.7against the forecasted 55.1and weighed on EURO.

From US Side, the ISM Non-Manufacturing PMI rose in July to 58.1 from the expected 55.0 and supported the U.S. dollar. Though the data was against the movement of EUR/USD pair, however, pair still moved in the upward direction.

Daily Technical Levels

Support Pivot Resistance
1.1802 1.1854 1.1915
1.1740 1.1968
1.1688 1.2029

EUR/USD– Trading Tip

The technical side of the EUR/USD remains mostly the same as it’s trading with a bullish bias around 1.1880 level. On the higher side, the EUR/USD pair may find resistance at 1.1909 level, and the closing of candles below this level can keep bearish pressure on EUR/USD. A bullish breakout of this level can extend the buying trend until 1.2050. Today, the EUR/USD is likely to find support at 1.1800 level.


GBP/USD – Daily Analysis

The GBP/USD closed at 1.31133 after placing a high of 1.31614 and a low of 1.30528. The pound rose on Wednesday to remain on course for a third-straight weekly gain against the U.S. dollar and ignored weaker than expected economic data ahead of the Bank of England meeting on Thursday. On Wednesday, the Final Services PMI in July came in as expected 56.5 points and indicated expansion in the services sector in the U.K.

This Thursday, the focus will be on the Bank of England’s monetary policy decision and Andrew bailey’s speech. The central bank of England is anticipated to keep interest rates unchanged but will roll out its forecasts on a range of economic measures, including Inflation, GDP, and unemployment. In recent weeks, debates have been under discussion about the BoE’s cutting of rates below zero, but Thursday’s meeting is unlikely to offer detailed insight.

The NIRP (Negative Interest Rate Policy) has been under active review at the Bank of England, but it seems like a little too early for the central bank to make any decisive move. Some analysts expect that the Bank of England will prefer to hold off on using a negative interest rate until the EU-UK relationship for 2021 gets cleared.

On the U.S. front, the ADP Non-Farm Employment Change dropped to 167K from the expected 1200K in July. It means that the U.S. government introduced 167K jobs only while that weighed on the U.S. dollar and added strength to the GBP/USD pair gains.

However, in July, the Final Services PMI rose to 50.0 from expected 49.6, and the ISM Non-Manufacturing PMI rose to 58.1 from expected 55.0. This showed an expansion in America’s services sector in July and gave support to the U.S. dollar that weighted on additional gains in GBP/USD pair.

Another reason for the rise in GBP/USD pair was the weakness of the U.S. dollar. The ever increasing numbers of coronavirus cases dampened the prospects for a swift economic recovery in the U.S. and forced investors to continue dumping the greenback. This, coupled with the delay in the U.S. fiscal stimulus package’s announcement and further pressurized the U.S. dollar.

The U.S. dollar was so under pressure that even the goodish rebound in the U.S. Treasury bond yields failed to support the U.S. dollar.

Apart from this, the rising number of coronavirus cases in the U.K. and the renewed fears of no-deal Brexit as both sides were lagging in the progress of securing a deal, held investors to place any aggressive bullish position in the GBP/USD pair ahead of BoE monetary policy.

Daily Technical Levels

Support Pivot Resistance
1.3060 1.3111 1.3166
1.3005 1.3217
1.2954 1.3271

GBP/USD– Trading Tip

The GBP/USD is trading at 1.3085 level, holding right below the triple top resistance area of 1.3101 level while the bullish breakout of 1.3105 can drive more buying in the GBP/USD pair. On the higher side, the GBP/USD may find resistance at 1.3175, while support can be found around 1.3056 and 1.3022 level. Let’s keep an eye on 1.3125 to extract a bearish bias in the GBP/USD pair today. A bearish breakout of 1.3050 can drive more selling until 1.3005.


USD/JPY – Daily Analysis

The USD/JPY pair was closed at 105.592 after placing a high of 105.871 and a low of 105.318. Overall the movement of the USD/JPY pair remained bearish throughout the day. The USD/JPY pair extended the decline on the back of the weaker U.S. dollar across the board and bank of Japan governor Kuroda’s speech telling that Japan’s economy will improve in the second half of the year.

The Bank of Japan Governor Haruhiko Kuroda warned that in order to contain the spread of public health measures were re-introduced, then the economic activity could be significantly constrained. He also affirmed that Japan was not slipping into deflation and that the central bank would continue with its efforts to achieve the inflation target of 2%. Kuroda again assured that the Bank of Japan will be ready to ramp up the monetary stimulus without hesitation if needed to aid the economy through the pandemic crisis.

Kuroda also said that Japan’s financial system was quite safe and stable and countered the fears that the banking sector would fall out from COVID-19. He also warned that if pandemic prolonged longer than expected, there will be risks to Japan’s financial stability.

He said that Japanese and overseas economies would gradually improve from the second half of this year despite extremely high uncertainties. But the pace of improvement is likely to be moderate as the preventive measures to control the virus spread has its effects on economic activity.

On the other hand, the greenback was the worst performer in the currency market on Wednesday. It was so under pressure that it could not benefit from the latest round of economic data that showed an improvement in the Service Sector of the U.S. The rebound in the U.S. Treasury yield also could not support the U.S. dollar. The U.S. Dollar Index (DXY) was testing the 92.60 level lowest since last week.

On the data front, the ADP Non-Farm Employment Change showed that the U.S. created 167,000 jobs in July against the estimated 1200K. This weighed on the U.S. dollar and added further in the losses of the USD/JPY pair.

On Wednesday, U.S. President Donald Trump said that big jobs were coming on Friday. However, private payroll data by ADP reported on Wednesday that just 167,000 jobs were created in July.

 The Trade Balance from the U.S. fell in line with the expectations of -50.7B. The Final Services PMI rose to 50.0 points in July than the expectations of 49.6 and supported the U.S. dollar. At the same time, the ISM Non-Manufacturing PMI also rose to 58.1 points from the forecasted 55.0 and came in favor of the U.S. dollar.

However, USD bulls did not cheer the positive data, and the U.S. dollar remained under stress on Wednesday to post losses on the day.

On the US-China front, China’s ambassador to Washington said that China did not want to see a Cold War break out between China and the U.S. He suggested that both countries need to work to repair their relations that were under extraordinary stress.

Daily Technical Levels

Support Pivot Resistance
105.3100 105.6000 105.8800
105.0300 106.1700
104.7400 106.4500

USD/JPY – Trading Tips

The USD/JPY is trading with the bearish sentiment, especially after violating the 38.2% Fibonacci support level of 105.650. On the lower side, the USD/JPY may find support at 105.078 level, which is extended by the 61.8% Fibonacci retracement level. A bearish breakout of 61.8% level can drive more selling until the next support area f 104.200. The current market price of USDJPY is staying below 50 EMA, which extends resistance at 105.650 level. Let’s consider selling below 105.650 level today. Good luck! 

Categories
Forex Market Analysis

Daily F.X. Analysis, August 05 – Top Trade Setups In Forex – Advanced NFP In Focus! 

We have a series of low and medium impact events coming ahead, and the focus will be on the Eurozone’s Services PMI, U.S. Advance NFP, and U.S. ISM non-manufacturing events. The U.S. events are forecasted to be negative but positive data may drive selling trend in gold; let’s brace for it.

Economic Events to Watch Today  


EUR/USD – Daily Analysis

The EUR/USD pair was closed at 1.18024 after placing a high of 1.18057and a low of 1.17211. Overall the movement of the EUR/USD pair remained bullish throughout the day. The EUR/USD pair climbed to 1.1800 level from 1.17200 level on Tuesday after the U.S. Dollar Index fell by 0.1% to 93.45 level. However, the U.S. dollar index spent most of the day in positive territory but failed to keep its gains. The U.S. Treasury yields were lower on Tuesday, and the equity prices were high that weighed on the U.S. dollar. The 10-year U.S. Treasury bond yield was down to 0.513% level, the lowest level since March.

The weakness in the U.S. dollar was the main driver of the EUR/USD pair on Tuesday. On the data front, the IBD/TIPP Economic Optimism rose to 46.8 from the expected 45.3 and supported the U.S. dollar. The Factory Orders from June were also increased to 6.2% from the forecasted 5.1% and supported the U.S. dollar.

From the European side, the French Government Budget Balance showed a deficit of 124.9 B in June as compared to the deficit of 117.9 B in May. At 12:00 GMT, the Spanish Unemployment Change came in as -89.8K against the forecasted 19.5K and supported EUR. At 14:00 GMT, the Producer Price Index for June surged to 0.7% against the expected 0.6% and supported EUR.

The European side’s macroeconomic data came in favor of the EUR/USD pair and took its prices above the 1.1800 level. Meanwhile, on Tuesday, the U.S. Congress Senate Democratic leader Chuck Schumer said that talks with the White House were finally moving in the right direction. However, they still were far apart on some issues. The gap between the two parties was about priorities and scale. Even though the difference was also mentioned, investors cheered the news that the talks were heading in the right direction and boosted their mood.

The equity prices rose, and the U.S. dollar suffered as the issuance of new stimulus weighed on the U.S. dollar. The weakness of the U.S. dollar ad rise in equity prices gave a push to EUR/USD pair. This Wednesday, the market will release the final versions of its July Services PMI for most major economies that are mostly expected to suffer upward revisions from preliminary estimates. E.U. will also reveal Retail Sales data for June. While the U.S. will release the ADP survey on private employment for July and the Non-ISM Manufacturing PMI. Traders will keep a close watch on both releases.

Daily Technical Levels

Support Pivot Resistance
1.1707 1.1752 1.1808
1.1651 1.1853
1.1605 1.1909

EUR/USD– Trading Tip

The EUR/USD shows another round of buying to trade at 1.1810 level. A recent breakout of the 1.1800 level is likely to lead EUR/USD prices further higher until 1.1849 and 1.1910 level. However, the support may be found around 1.1795 and 1.1760 area. Bullish bias will be stronger over the 1.1820 breakouts. The RSI and MACD are holding in the bullish zone while the 50 periods EMA is also suggesting potential for a bullish trend continuation today.


GBP/USD – Daily Analysis

The GBP/USD pair was closed at 1.30701 after placing a high of 1.31079 and a low of 1.29810. Overall the movement of GBP/USD pair remained flat throughout the day. The pair GBP/USD reached a lower level of 1.2980, but it recovered from that level to settle once again around 1.3070 level in the late session. The decline and the later recovery was once again about the U.S. dollar as investors continued to ignore U.K. news and focused on USD news.

The U.S.’s macroeconomic data about factory orders in June rose to 6.2% from the anticipated 5.1% and supported the U.S. dollar that kept the GBP/USD pair under pressure.

However, the U.S. Senate Democratic leader’s latest statement that both Republicans & Democrats were moving in the right direction regarding the U.S. stimulus package weighed on the U.S. dollar. The U.S. Dollar Index dropped to 93.4 level, and the U.S. Treasury yield for a 10-year bond also dropped. Whereas, the equity prices rose that weighed further on the U.S. dollar.

On the other hand, the lack of progress in trade talks between the E.U. & the U.K. has shifted the attention to other economies. As the kingdom has started talks with the United States, that has shown little progress.

Furthermore, Toshimitsu said on Tuesday that Japan’s foreign minister would visit the U.K. this week to meet his counterpart to wrap up talks over a free-trade agreement between both countries.

However, earlier on the day, UK PM Boris Johnson announced another round of stimulus focused on the home construction and infrastructure to boost the economy. The suggested investment of around 900 million pounds out of 360 million pounds will be allocated towards delivering 26,000 new homes on brownfield land.

The demand for Sterling was also cooled down after the latest lockdown was imposed in the London area amid the resurgent coronavirus cases.

Meanwhile, considering the possible delay at the customs union’s border after leaving the E.U.’s single market, the U.K. government issued a letter in writing to pharmaceutical companies urging them to stockpile medicine for next year.

The health department advised firms to stockpile six weeks’ worth of supplies for the end of the Brexit transition period. However, the pharmaceutical industry has already warned earlier this year that COVID-19 had used up entirely some supplies.

Besides, the Boris Johnson’s government was resurrecting a plan to turn a 15 mile stretch of motorway into a contraflow system to be prepared for delays at Britain’s border with the European Union in early next year.

Moreover, China’s ambassador to the United Kingdom said that China wanted the UK to be a friend, but if the U.K. wants to make China a hostile country, then it will have to bear the consequences. This statement was followed by the move from PM Boris Johnson in which he announced plans to ban equipment purchases from the Chinese telecommunication group Huawei on espionage concerns. There was no reason for a directional move in the GBP/USD pair, and that is why the currency pair remained flat throughout the day on Tuesday.

Daily Technical Levels

Support Pivot Resistance
1.2863 1.2908 1.2978
1.2792 1.3024
1.2747 1.3094

GBP/USD– Trading Tip

The GBP/USD is trading at 1.3085 level, holding right below the triple top resistance area of 1.3101 level while the bullish breakout of 1.3105 can drive more buying in the GBP/USD pair. On the higher side, the GBP/USD may find resistance at 1.3175, while support can be found around 1.3056 and 1.3022 level. Let’s keep an eye on 1.3125 to extract a bearish bias in the GBP/USD pair today. A bearish breakout of 1.3050 can drive more selling until 1.3005.


USD/JPY – Daily Analysis

The USD/JPY pair was closed at 105.716 after placing a high of 106.193 and a low of 105.635. Overall the movement of the USD/JPY pair remained bearish throughout the day. 

The pair USD/JPY dropped on Tuesday amid the progress in a new stimulus package from the U.S. Congress. The U.S. Dollar Index was down by 0.20% on Tuesday at 93.4 level, and the U.S. treasury yield was also down to its multi-month low of 0.51%.

The U.S. Senate Democratic leader Chuck Schumer said that negotiations with the White House were finally moving in the right direction, but they still were far apart on some issues. He said that the difference between the two parties on the U.S. Stimulus package was about priorities and scale.

Investors ignored the differences part of the statement and focused more on the progress in talks part, and hence, the U.S. dollar suffered. The USD/JPY dropped below 106 level as the cost of supporting the U.S. economy through its struggles to contain the pandemic was under discussion.

At the beginning of the day, Japan published Tokyo Inflation data for July, which rose to 0.4% from the estimated 0.2% and supported the Japanese Yen. The Monetary Base from japan also rose to 9.8% from the forecasted 7.1% and supported the Japanese Yen. Japan’s stronger than expected data weighed on the USD/JPY pair and dragged it below 106 level on Tuesday.

On the US-China front, to assess China’s efforts to fulfill the promises made in the bilateral trade agreement signed in January, the U.S. & China have agreed to conduct high-level talks on August 15. The relations between the U.S. 7 China have been deteriorated because of many issues, including the coronavirus outbreak, Hong Kong, and human rights abuses in western China. The only matter for mutual concern between both countries seems to be like the trade deal and assessed in mid-August.

Moreover, Satya Nadella, the Chief Executive of Microsoft Corp., has signed an agreement to take over the U.S. operations of the TikTok app. The Microsoft Corp. and the Chinese parent company of TikTok, named ByteDance Ltd., had a deal on Tuesday that would allow Microsoft to run TikTok operations in Canada, US, Australia, and New Zealand. This agreement satisfied both companies & their shareholders and the two governments that are under bitter competition for technological clout.

On the other hand, this Wednesday, Japan will release the final July Bank Services PMI, and the Bank of Japan’s Governor Kuroda will give a speech about central banking in the coronavirus era. From the U.S., the ADP Non-Farm Employment Change and ISM Non-Manufacturing PMI will be key to watch.

Daily Technical Levels

Support Pivot Resistance
104.80 105.25 105.55
104.50 106.00
104.05 106.30

USD/JPY – Trading Tips

The USD/JPY trades with a bullish sentiment around 105.950 level, having completed 61.8% Fibonacci retracement at 106.063. The pair is forming a bearish engulfing candle below 106.406 level, the level that worked as a support for USD/JPY in now it’s working as a resistance. On the higher side, next USD/JPY may find resistance at 106.650, while support stays at 105.250. The MACD and RSI both are suggesting bullish bias in USD/JPY pair today. Let’s consider staying bullish over 105.550 level today. Good luck! 

Categories
Crypto Market Analysis

Daily Crypto Review, August 5 – XRP Drops by 6% Despite Fundamentals Booming

The cryptocurrency market had a day without much movement. Bitcoin is currently trading for $11,166, which represents a decrease of 1.52% on the day. Meanwhile, Ethereum lost 2.66% on the day, while XRP lost 6%.

 Daily Crypto Sector Heat Map

When talking about top100 cryptocurrencies, Band Protocol gained 15.33% on the day, making it the most prominent daily gainer. The Midas Touch (13.97%) and Kava.io (12.79%) also did great. On the other hand, Quant has lost 15.75%, making it the most prominent daily loser. It is followed by Ampleforth’s loss of 14.84% and MCO’s loss of 11.32%.

Top 10 24-hour Performers (Click to enlarge)

Bottom 10 24-hour Performers (Click to enlarge)

Bitcoin’s dominance level has increased since we last reported, with its value currently at 61.17%. This value represents a 0.37% difference to the upside when compared to yesterday’s value.

Daily Crypto Market Cap Chart

The cryptocurrency market capitalization has decreased slightly since we last reported. Its current value is $341.39 billion, which represents a decrease of $6.78 billion when compared to the value it had yesterday.

_______________________________________________________________________

What happened in the past 24 hours?

_______________________________________________________________________

_______________________________________________________________________

Technical analysis

_______________________________________________________________________

Bitcoin

The largest cryptocurrency by market cap had a slow day, with its price being locked in a range bound by The $11,460 resistance and $11,090 support. Bitcoin continuously retested its immediate support, but the lack of volume and pressure towards the downside brought nothing to the BTC bears. Bitcoin’s downside is also guarded by the 50-period moving average, which is sitting right under $11,090.

BTC traders should look for an opportunity to make a trade when BTC breaks $11,460 or falls below $11,090.

BTC/USD 4-hour Chart

Technical factors:
  • Price is currently above its 50-period EMA, but below its 21-period EMA
  • Price is near its middle B.B (20-period SMA)
  • RSI is neutral (47.67)
  • Volume decreasing
Key levels to the upside          Key levels to the downside

1: $11,460                                 1: $11,090

2: $11,630                                 2: $10,855

 3: $12,000                                 3: $10,505

Ethereum

Ethereum has a slow day as well, with its volume normalizing and volatility fading. The second-largest cryptocurrency by market capitalization oscillated between $401 and $380 over the course of the day. The cryptocurrency seems like it will be trading within the range bound by $415 and $362 for some time now.

Traders should look for a trade opportunity within the range ETH is currently in.

ETH/USD 4-hour Chart

Technical Factors:
  • Price is above its 21-period EMA and its 50-period EMA
  • Price is currently at its middle B.B. (20-period SMA)
  • RSI is elevated (57.69)
  • Descending volume
Key levels to the upside          Key levels to the downside

1: $415                                     1: $362

2: $496                                     2: $340

                                                  3: $302

Ripple

XRP experience a day with a bit more volatility than Bitcoin and Ethereum, with its price dropping down to below $0.3 levels. While the move to the downside seems to be stopped by the 21-period moving average for now, XRP will certainly move somewhere (more likely to the downside. On top of that, XRP has formed a triangle formation, which gives us a possible time estimate of its next move.

Traders can look for an opportunity to trade when XRP breaks the triangle formation.

XRP/USD 4-hour Chart

Technical factors:
  • Price above 21-period and the 50-period EMA
  • Price is below the middle B.B. (20-period SMA)
  • RSI is neutral (54.18)
  • Average volume
Key levels to the upside          Key levels to the downside

1: $0.32                                    1: $0.285  

2: $0.3328                                2: $0.266

                                               3: $0.245


Categories
Forex Market Analysis

Daily F.X. Analysis, August 04 – Top Trade Setups In Forex – Profit Taking In USD Continues! 

The fundamental side of the market continues to be muted due to a lack of economic events. Therefore, we still need to keep an eye on COVID19 updates, U.S. China trade war issues, and today’s technical levels.

Economic Events to Watch Today  


EUR/USD – Daily Analysis

The EUR/USD pair was closed at 1.17626 after placing a high of 1.17966 and a low of 1.16956. Overall the movement of the EUR/USD pair remained flat yet bearish throughout the day. The EUR/USD exchange rate fell by -0.2% on Monday as Euro failed to gain against the U.S. dollar despite stronger than expected Eurozone Manufacturing PMI for July but did not remain there and reverted to the same level it started its day with. Investors have become more hopeful that the Eurozone’s economy could be on the road to recovery as Manufacturing PMI showed an expansion in the industry throughout Europe.

The Eurozone economy showed a positive start to the third quarter, with production growing at the fastest rate for over two years fueled by an encouraging surge in demand. The growth of new orders outperformed the production and hinted that August would see further output gains. The business confidence has also been restored due to the improvement in the order book. However, Euro traders were cautious on Monday as the number of coronavirus cases continues to grow throughout Europe. Consequently, markets became cautious that the second wave of the virus could severely compromise the bloc’s economy.

On the data front, at 12:15 GMT, the Spanish Manufacturing PMI for July exceeded the expectations of 52.6 and came in as 53.5 to support single currency Euro. At 12:45 GMT, the Italian Manufacturing PMI for July rose to 51.9 from the expected 51.3 and supported Euro. At 12:55 GMT, The French Final Manufacturing PMI also exceeded the expectations of 52.0 and rose to 52.4 and supported Euro. At 12:55 GMT, the German Final Manufacturing PMI for July was expected to release as 50.0 but came in as 51.0 and supported Euro. At 13:00 GMT, the Final Manufacturing PMI from the whole bloc also rose to 51.8 points against the forecasted 51.1 and supported single currency Euro.

All data related to PMI from main European countries came in favor of EUR/USD and pushed it to the high near 1.1770 but failed to reverse the pair’s direction as the market sentiment was against EUR/USD pair.

On the other hand, from the U.S. side, the final Manufacturing PMI came in short of expectations of 51.3 as 50.9 and weighed on the U.S. dollar. It indicated that manufacturing activity in the U.S. in July was not very impressive as it was expected.

However, at 19:00 GMT, the ISM Manufacturing PMI came in favor of the U.S. dollar when it exceeded the expectations of 53.6 and came in as 54.2. It showed that manufacturing activity in the U.S. was expanded in July. As the ISM Manufacturing PMI was the highlighted data of the day, and as it came in favor of the U.S. dollar, the U.S. dollar gained traction and caused a decline in the prices of EUR/USD pair. 

Daily Technical Levels

Support Pivot Resistance
1.1686 1.1730 1.1762
1.1654 1.1806
1.1610 1.1837

EUR/USD– Trading Tip

The EUR/USD has bounced off the previously suggested support level of 1.1708 level, and now it’s trading at 1.1765 area. On the hourly timeframe, the EUR/USD continues to form bullish candles, which suggest a slight bullish bias among investors despite profit-taking in the U.S. dollar. Now strong support stays at 1.1705. On the higher side, the EUR/USD may find support at 1.1796 level.


GBP/USD – Daily Analysis

The GBP/USD pair was closed at 1.30756 after placing a high of 1.31125 and a low of 1.30044. Overall the movement of GBP/USD pair remained flat yet slightly bearish throughout the day. The pair GBP/USD pair was dropped in the earlier session on Monday on the back of profit-taking in the U.S. dollar, but the pair reverted back to its same level in the late closing session.

On Monday, the European Union showed a willingness to compromise to rescue troubled Brexit talks by softening its demand that Britain heeds E.U. rules on state aid. Brussels said that it could go for a compromise entailing a dispute-settling mechanism on any state aid granted by the U.K. to its companies. It means Brussels will no longer oblige London to follow bloc’s own rules from the outset.

The E.U. countries have long demanded so-called “Level Playing Field” guarantees from the U.K. if it requires the free selling of goods in the bloc’s lucrative single market of 450 million people after Brexit’s transition period ends. However, PM Boris Johnson and his government have refused to be bound by E.U. state aid rules, labor laws, or environmental standards as Brexit’s essence was to let Britain decide alone on its regulations.

The other significant sticking point of the negotiations was fishing rights in sea channels between the E.U. and Britain. The bloc has previously signaled that it was willing to compromise in that field if London shifted as well from its demands. Though the negotiations have not proven fruitful yet they have brought the sides closer in some other aspects and have made the E.U. cautiously optimistic about chances for an overall deal.

Meanwhile, the U.K. Prime Minister Boris Johnson said that the trade negotiations were in good progress with Japan. However, tensions with the bloc remain the same. The fishing industry urged the government to guide as the Brexit transition period was near to end without the sector’s definitions.

On the data front, at 13:30 GMT, the Final Manufacturing PMI for July came in line with the expectations of 53.3 and showed an expansion in the manufacturing sector of the U.K. At 18: 45 GMT, the Final Manufacturing PMI for July dropped to 50.9 points from the forecasted 51.3 and weighed on the U.S. dollar. At 19:00 GMT, the ISM Manufacturing PMI in July advanced to 54.2 from the forecasted 53.6 and supported the U.S. dollar. In June, the Construction Spending also dropped by -0.7% from the projected 1.0% and weighed on the U.S. dollar. The ISM Manufacturing Prices in July rose to 53.2 against the anticipated 52.2 and supported the U.S. dollar.

The primary highlighted data ISM Manufacturing PMI came in favor of the U.S. dollar and weighed heavily on the GBP/USD pair that it started posting losses. The Pound traders will look forward to releasing the monetary policy decision by the Bank of England this week on Thursday. The bank’s statement about the negative interest rate decision and plans to help the economy through the pandemic will be observed to find fresh clues of the GBP/USD pair’s movement.

Meanwhile, the pair will follow the U.S. dollar and related events, including the ISM Non-Manufacturing PMI, that is scheduled to release on Wednesday. Apart from that, any progress in Brexit trade deal talks would also benefit/weigh the GBP/USD pair this week.

Daily Technical Levels

Support Pivot Resistance
1.2863 1.2908 1.2978
1.2792 1.3024
1.2747 1.3094

GBP/USD– Trading Tip

The GBP/USD is trading at 1.3065 level, having completed the 50% Fibonacci retracement at 1.3060 level. On the higher side, the Sterling can find resistance at 1.3105. In the daily timeframe, the Cable has formed a Doji pattern, which is followed by a solid bullish trend at 1.3100 level, and it has the potential to drive bearish bias in the pair. Let’s keep an eye on 1.3125 to extract a bearish bias in the GBP/USD pair today. A bearish breakout of 1.3050 can drive more selling until 1.3005.

USD/JPY – Daily Analysis

The USD/JPY pair was closed at 105.947 after placing a high of 106.470 and a low of 105.578. Overall the movement of the USD/JPY pair remained bullish throughout the day. The USD/JPY pair rose to its highest level since July 24 at 106.47 Monday, but it started to decline afterward and presented a hammer-like candle.

The broad-based U.S. dollar strength at the starting day of the week provided a boost to USD/JPY pair. The rising U.S. Treasury bond yields helped the greenback continue to outperform its rivals, and the U.S. Dollar Index advanced to 94.00. The U.S. Treasury bond yield gained almost 5% on the day.

On the data front, at 4:50 GMT, the Prelim GDP for the second quarter from Japan came in as -0.6% against the expected -0.7% and supported Japanese Yen. At 4:55 GMT, the Prelim GDP Price Index for the year remained flat with the expectations of 0.9%. At 5:30 GMT, the Final Manufacturing PMI from Japan rose to 45.2 points against the forecasted 42.6. Better than expected macroeconomic data from Japan gave strength to the Japanese Yen that ultimately weighed on the USD/JPY pair in the earlier session.

From the U.S. side, the ISM data at 19:00 GMT showed that the economic activity in the U.S. manufacturing sector expanded at a stronger pace than expected in July. The ISM Manufacturing PMI rose from 52.6 to 54.2 and surpassed the forecast of 53.6.

The ISM Manufacturing Prices for July also increased to 53.2 against the forecasted 52.2 and the previous 51.3 and supported the U.S. dollar. The Wards Total Vehicle Sales from the U.S. surged to 14.5M in July from the previous 13.1M and the expected 14.0M. It also supported the U.S. dollar that ultimately pushed the USD/JPY pair on the upside.

On the other hand, the U.S. lawmakers are finding it difficult to reach a consensus for the U.S. coronavirus aid package. The Republicans are in favor of $ 1 trillion, while Democrats want to offer a package worth $3 trillion. This difference of opinion has caused a delay in the announcement of the U.S. recovery package. The delayed package announcement has made investors cautious, and they are keenly waiting for it to place bets on it.

However, on coronavirus front, the worldwide cases reached 18 million so far with major cities on renewed lockdown restrictions to control the spread. It raised the safe-haven appeal that pushed the Japanese Yen and kept checking on additional gains of the pair USD/JPY.

The coronavirus expert in White House said that the U.S. was in a new phase of the outbreak with infections extraordinarily widespread in both rural & urban areas. On the vaccine front, a mass vaccination campaign from the Russian health authorities was under preparation stage against the virus, and it will start in October. The media of Russia has quoted that doctors and teachers will be the first to receive the vaccine.

In response to this, the U.S. Dr. Anthony Fauci gave critic comments and said that he hoped that Russia and China were testing the vaccine before directing them to anyone. He said that the U.S. should have a safe and effective vaccine by the end of the year. He added that there would be no vaccine so far ahead of the U.S. that the U.S. will have to depend on other countries to get the vaccine. On the US-China front, President Trump threatened to ban the TikTok app in the United States that raised the fears for a halt of a phase-one trade deal and kept the market sentiment soar.

Daily Technical Levels

Support Pivot Resistance
104.80 105.25 105.55
104.50 106.00
104.05 106.30

USD/JPY – Trading Tips

The USD/JPY trades with a bullish sentiment around 105.950 level, having completed 61.8% Fibonacci retracement at 106.063. The pair is forming a bearish engulfing candle below 106.406 level, the level that worked as a support for USD/JPY in now it’s working as a resistance. On the higher side, next USD/JPY may find resistance at 106.650, while support stays at 105.250. The MACD and RSI both are suggesting bullish bias in USD/JPY pair today. Let’s consider staying bullish over 105.550 level today. Good luck! 

Categories
Crypto Market Analysis

Daily Crypto Review, August 4 – BTC Establishes Itself Above $11,000; Altcoins Taking Over The Market

The cryptocurrency market ended up in the green today, with Bitcoin establishing its place above $11,000 and most altcoins gaining substantial value. Bitcoin is currently trading for $11,350, which represents an increase of 1.86% on the day. Meanwhile, Ethereum gained 4.8% on the day, while XRP gained 6.87%.

 Daily Crypto Sector Heat Map

When talking about top100 cryptocurrencies, MCO gained 41.91% on the day, making it the most prominent daily gainer. Ocean Protocol (28.92%) and Energy Web Token (22.88%) also did great. On the other hand, Ampleforth has lost 12.73%, making it the most prominent daily loser. It is followed by Aave’s loss of 6.32% and Celsius’ loss of 3.80%.

Top 10 24-hour Performers (Click to enlarge)

Bottom 10 24-hour Performers (Click to enlarge)

Bitcoin’s dominance level has decreased since we last reported, with its value currently at 60.80%. This value represents a 0.82% difference to the downside when compared to Friday’s value.

Daily Crypto Market Cap Chart

The cryptocurrency market capitalization has increased since we last reported. Its current value is $347.17 billion, which represents an increase of $9.74 billion when compared to the value it had yesterday.

_______________________________________________________________________

What happened in the past 24 hours?

_______________________________________________________________________

_______________________________________________________________________

Technical analysis

_______________________________________________________________________

Bitcoin

The largest cryptocurrency by market capitalization confirmed its position above $11,000 in the past 24 hours (at least in the short term) Its price kept slowly going up until it hit a (possibly) new resistance level of $11,460. The price then took a small dive but returned to sideways movements. Bitcoin is in a good spot to create a move that will lead it towards (or above) $12,000 in the near future.

BTC traders should look for an opportunity to make a trade when BTC breaks $11,460 or falls below $11,090.

BTC/USD 4-hour Chart

Technical factors:
  • Price is currently above its 50-period EMA, but below its 21-period EMA
  • Price is between its bottom B.B. and its middle B.B (20-period SMA)
  • RSI is neutral (51.35)
  • Volume increased
Key levels to the upside          Key levels to the downside

1: $11,630                                1: $11,090

2: $12,000                                2: $10,855

                                                 3: $10,505

Ethereum

Ethereum continued pushing towards the upside, pretty much unaffected by the “flash crash” that brought its price down from $415 to $320. The second-largest cryptocurrency by market capitalization is moving upwards and having the 21-period and 50-period moving averages as support. The price is currently just below $400.

Ethereum traders should look for an opportunity in a pullback, which will most likely happen after the current move towards the upside.

ETH/USD 4-hour Chart

Technical Factors:
  • Price is above its 21-period EMA and its 50-period EMA
  • Price is currently between its top B.B. and its middle B.B. (20-period SMA)
  • RSI is elevated (63.95)
  • Above-average volume
Key levels to the upside          Key levels to the downside

1: $340                                    1: $302

2: $362                                    2: $289

                                                 3: $278

Ripple

XRP was also one of the altcoins that made significant progress towards the upside in the past 24 hours. The third-largest cryptocurrency by market cap recovered from the “flash crash” quickly and hurled upwards, reaching past the $0.31 resistance level (now support) once again.

XRP traders can look for an opportunity in the range between $0.31 and $0.32.

XRP/USD 4-hour Chart

Technical factors:
  • Price above 21-period and the 50-period EMA
  • Price is between the top B.B. and the middle B.B. (20-period SMA)
  • RSI is elevated (66.85)
  • Elevated volume
Key levels to the upside          Key levels to the downside

1: $0.32                                    1: $0.285  

2: $0.3328                                2: $0.266

                                               3: $0.245


Categories
Forex Market Analysis

Daily F.X. Analysis, August 03 – Top Trade Setups In Forex – Manufacturing PMI In Highlights

On the news front, the eyes will be on the series of low impact economic events from Europe and the U.S., but they are hardly likely to drive any major price action today. We should be focusing on the technical side of the market.

Economic Events to Watch Today  


EUR/USD – Daily Analysis

The EUR/USD pair closed at 1.17756 after placing a high of 1.19085 and a low of 1.17613. Overall the movement of the EUR/USD pair remained bearish throughout the day. The EUR/USD pair rose above 1.1900 level on Friday, highest since September 2018, after progress in a new European stimulus package. However, the upward rally was reversed after the oversold condition, and profit-taking helped the U.S. dollar recover some ground.

The Euro has enjoyed 11% jump against the U.S. dollar since ay benefiting from the U.S. currency’s weakness and Europe’s decisive joint stimulus package to combat the coronavirus. EUR/USD pair ended July with its best monthly performance in a decade.

Euro hit 1.1900 level on Friday, and on May 18, the day just before the game-changing E.U. Stimulus plan was proposed, it was traded at 1.0800 level. The gains were also because of the more successful pandemic response by the European Union than the United States.

However, on Friday’s data front, the French Consumer Spending for June increased to 9.0% from the expected 6.9% and supported the Euro. At 11:45 GMT, the French Prelim CPI for July raised to 0.4% from the projected -0.1% and supported Euro. At 12:00 GMT, the Spanish Flash GDP for the quarter came in as -18.5% against the expected -16.0%. At 13:00 GMT, The Italian Prelim GDP for the quarter came in as -12.4% against the expected -15.0%.

The CPI Flash Estimate for the year was raised to 0.4% from the expected 0.3% and supported Euro. For July, the Italian Prelim CPI dropped to -0.1% from the expected 0.1% and weighed on Euro. The Prelim Flash GDP for the whole bloc in the second quarter was dropped to -12.1%from the expected -12.0%. The Italian Retail Sales for the whole bloc rose to 12.1% against the expected 0.8% in June. Most data from the European side favored local currency, which is why the EUR/USD pair crossed the 1.1900 level. However, the pair could not remain there for long as investors started to take profits off their positions, and the pair began to decline.

On the other hand, the U.S. dollar was a little strong because its oversold condition was priced at the month-end, and traders took profits out of it. On the data front, the U.S.’s economic docket remained depressive and mixed that made traders confused.

The Personal Spending for June raised to 5.6% from the expected 5.3%, and the Chicago PMI in July also raised to 51.9 from the expected 44.0 and gave a boost to the U.S. dollar. However, the Personal Income in July dropped to -1.1% against the expected -0.8%and weighed on the U.S. dollar.

The improved confidence in the bloc’s prospects due to its handling of pandemic and issuance of the massive E.U. stimulus package has limited the negative effects of euro strength. Some analysts believe that the Euro will attract “significant” safe-haven flows in the coming months. The Euro has become a stronger currency recently due to fundamental improvement in the structure of Europe. Politically and financially. However, the fall in EUR/USD pair on Friday was all because of profit-taking and correction.

Daily Technical Levels

Support Pivot Resistance
1.1768 1.1782 1.1795
1.1755 1.1809
1.1740 1.1822

EUR/USD– Trading Tip

The EUR/USD fell sharply from 1.1908 level to test the double bottom support level of 1.1745 level. On the hourly timeframe, the EUR/USD extends to form neutral candles, which suggests indecision among investors despite a strong support level of 1.1745. On the higher side, the EUR.USD may find support at 1.1796 level. 


GBP/USD – Daily Analysis

The GBP/USD pair closed at 1.30847 after placing a high of 1.31701 and a low of 1.30702. The movement of the GBP/USD pair remained flat but slightly bearish throughout the day.

After posting gains for ten consecutive days, the GBP/USD pair declined for the first time in 10 days on Friday. The pair rose above 1.31700 level, the highest since March 2020, at the ending day of the month. However, the pair GBP/USD did not stay there for long and dropped to post losses on the day after technical buying in the U.S. dollar started.

The surge in GBP/USD in the earlier session was due to the worries that the ever-increasing number of coronavirus cases could undermine the U.S. economic recovery. The concerns were escalated after the advanced US GDP report on Thursday that showed that the U.S. economy was collapsed by 32.9% during the second quarter.

This made greenback weak, and the more dovish statement further pressurized it on Wednesday from FOMC. Besides, the difference of opinion of Republicans & Democrats to reach a deal ahead of the expiry of some earlier provision on Friday weighed on the U.S. dollar.

In an earlier trading session on Friday, the U.S. dollar’s weakness gave a push to the GBP/USD pair above 1.31700 level; however, the oversold condition of the U.S. dollar and the profit taking by investors in late session dragged down the pair and turned gains into losses.

On the data front, the Nationwide House Price Index from Great Britain for July rose to1.7% from the expected -0.2% and supported the GBP/USD pair. On the U.S. front, the Core PCE Price Index for June came in line with the expectations of 0.2%. Personal Spending in June rose by 5.6% from 5.3% of expectations and supported the U.S. dollar. The Chicago PMI also rose to 51.9 from the expected 44.0 and supported the U.S. dollar. The better than expected PMI and Personal Spending data from the U.S. gave strength to the U.S. dollar that dragged the GBP/USD pair on the lower side.

On coronavirus front, the COVID-19 situation in the U.K. remained under control as the increasing number of cases made the government impose restrictions on around 4.3M people in northern England. On Brexit front, On Friday, Britain and E.U. have planned more trade negotiations until October 02, less than a fortnight before a summit where the E.U. hopes to approve Britain’s agreement.

It’s been more than four years since Britain voted to leave E.U., and after torturous divorce talks, both sides are negotiating all aspects of their future relations, from trade to security to transport from 2021 onwards.

On the Sino-UK front, both countries’ relation has not improved after the U.K. canceled the extradition treaty with Hong Kong.

Next week’s main event will be the Super Thursday as the Bank of England is set to release its monetary policy statement and leave the interest rates on hold at 0.1% and the quantitative easing program at 745 billion pounds. The focus will be on the statement released by the bank and any unexpected announcement that will make it “Super.”

The Governor of Bank of England, Andrew Bailey, will give a press conference speech ad provide details on the current economic situation and growth prospects. Any BOE help to the government in lowering the borrowing cost and support the recovery will be beneficial for GBP/USD pair. Furthermore, the views about the concept of negative interest rates by Bank of England will also hold importance in investors on the coming Thursday.

Daily Technical Levels

Support Pivot Resistance
1.3078 1.3092 1.3114
1.3056 1.3128
1.3042 1.3149

GBP/USD– Trading Tip

The GBP/USD is trading at 1.3088 level, having completed the 50% Fibonacci retracement at 1.3060 level. On the higher side, the Sterling can find resistance at 1.3105. In the daily timeframe, the Cable has formed a Doji pattern, which is followed by a solid bullish trend at 1.3100 level, and it has the potential to drive bearish bias in the pair. Let’s keep an eye on 1.3125 to extract a bearish bias in the GBP/USD pair today. A bearish breakout of 1.3050 can drive more selling until 1.3005.


USD/JPY – Daily Analysis

The USD/JPY pair was closed at 105.876 after placing a high of 106.053 and a low of 104.184. Overall the movement of the USD/JPY pair remained bullish throughout the day. After falling for six consecutive days, the USD/JPY pair dropped on Friday and broke its 6-days bearish streak amid mixed U.S. data.

In an earlier trading session on Friday, the USD/JPY pair dropped to its lowest since March 2020 near 104.00 level amid the better than expected Japanese macroeconomic data.

At 4:30 GMT, the Unemployment Rate from Japan for June dropped to 2.8%from the expected 3.0% and supported the Japanese Yen. At 4:50 GMT, the Prelim Industrial Production for June increased to 2.7% from the anticipated 0.9% and gave strength to Japanese Yen.

At 10:00 GMT, the Consumer Confidence from Japan came in line with the expectations of 29.5 for the month of July. The Housing Starts for the year in June dropped as expected to -12.8%. The strong Japanese Yen weighed on the USD/JPY pair and dragged the pair near the 104.00 level. However, the USD/JPY pair’s losses faded away after the release of U.S. economic data.

The macroeconomic data released by the U.S. on Friday was although mixed, but traders cheered the positive data and gave strength to the U.S. dollar. Another reason behind the U.S. dollar surge was profit-taking and correctness as the U.S. dollar was oversold in the market from the previous ten days.

At 17:30 GMT, the Core PCE Price Index for June from the U.S. came as projected by 0.2%. In June, personal spending exceeded the expectations of 5.3% and came in as 5.6% and supported the U.S. dollar. The Employment Cost Index for the quarter dropped to 0.5% from the forecasted 0.6%. The Personal Income for June also dropped to -1.1% from the forecasted -0.8%.

At 18:45 GMT, the Chicago PMI rose to 51.9from the anticipated 44.0 and gave strength to the U.S. dollar. However, at 19:00 GMT, the Revised UoM Consumer Sentiment remained flat with expectations of 72.5, and the UoM Revised Inflation Expectations dropped in July to 3.0% from May’s 3.1%.

Investors followed the U.S.’s positive data and gave a push to the U.S. dollar on Friday that leads to the upward trend of the USD/JPY pair.

The U.S. Dollar Index stretched higher with the initial reaction to the mixed U.S. data and helped the pair to move further on the upside. The DXY posted small gains near 92.97 levels on Friday. The U.S. Treasury bond yield for ten years was down by 1% on the day.

On the US-China front, the United States strengthened its economic pressure on China’s Xinjiang province on Friday, after imposing sanctions on a powerful Chinese company, and two officials for human rights abuses against Uighurs/ Muslims and other ethnic minorities.

U.S. Secretary of State Mike Pompeo called the said human rights abuses by the Chinese Communist Party in Xinjiang province, China, against Muslim minorities as the stain of the century.

This move came in a week after U.S. President Donald Trump shut the Chinese consulate in Houston on the back of allegations that it was a spy hub. In response, the U.S. consulate in the south-western city of Chengdu in China was also closed in revenge on similar grounds of the fast spread of the virus in the U.S. Early on Thursday, Japan will publish Retail Trade data that is expected to fell by 6.5% compared to the earlier year. The U.S. investors will look forward to GDP data for the second quarter.

Daily Technical Levels

Support Pivot Resistance
104.80 105.85 105.55
104.50 106.00
104.05 106.00

USD/JPY – Trading Tips

The USD/JPY trades with a bullish sentiment around 105.950 level, having completed 61.8% Fibonacci retracement at 106.063. The pair is forming a bearish engulfing candle below 106.406 level, the level that worked as a support for USD/JPY in now it’s working as a resistance. On the higher side, next USD/JPY may find resistance at 106.650, while support stays at 105.250. The MACD and RSI both are suggesting bullish bias in USD/JPY pair today. Let’s consider staying bullish over 105.550 level today. Good luck! 

Categories
Crypto Market Analysis

Daily Crypto Review, August 3 – More than $1 Billion Positions Liquidated; Crypto Market Booming Despite the “Flash-Crash”

The cryptocurrency market had quite a weird weekend in terms of price performance. The market and most of its cryptocurrencies had a “flash crash,” but quickly recovered to a price slightly below the previous highs. Bitcoin is currently trading for $11,160, which represents a decrease of 6.59% on the day. Meanwhile, Ethereum lost 4.04% on the day, while XRP gained 1.03%.

 Daily Crypto Sector Heat Map

When talking about top100 cryptocurrencies, Loopring gained 17.24% on the day, making it the most prominent daily gainer. Terra (14.69%) and Synthetix Network (13.73%) also did great. On the other hand, Ampleforth has lost 20.21%, making it the most prominent daily loser. It is followed by The Midas Touch’s loss of 18.78% and Quant’s loss of 15.89%.

Top 10 24-hour Performers (Click to enlarge)

Bottom 10 24-hour Performers (Click to enlarge)

Bitcoin’s dominance level decreased since we last reported, with its value currently at 61.62%. This value represents a 1.29% difference to the downside when compared to Friday’s value.

Daily Crypto Market Cap Chart

The cryptocurrency market capitalization increased since we last reported. Its current value is $337.43 billion, which represents an increase of $9.65 billion when compared to the value it had on Friday.

_______________________________________________________________________

What happened in the past 24 hours?

_______________________________________________________________________

_______________________________________________________________________

Technical analysis

_______________________________________________________________________

Bitcoin

The largest cryptocurrency by market capitalization spent the weekend crashing down to $10,555 and then recovering from the drop. After the price going up all the way up to $12,000, Bitcoin suddenly dropped to $10,555, which liquidated $1 billion of positions. However, the price quickly recovered and went over $11,000. It is still unsure if the price will end up being above this support level, but it is more likely that BTC will remain above, rather than fall below it.

BTC traders should look for a trade opportunity when BTC bounces from $11,000 or falls below it.

BTC/USD 4-hour Chart

Technical factors:

  • Price is currently below its 50-period EMA and its 21-period EMA
  • Price is between its bottom B.B. and its middle B.B (20-period SMA)
  • RSI is neutral (47.02)
  • Volume increased (descending)

Key levels to the upside          Key levels to the downside

1: $11,630                                1: $11,090

2: $12,000                                2: $10,855

                                                 3: $10,505

Ethereum

Ethereum acted pretty much the same as Bitcoin over the weekend, with its price reaching a major high of $415, and then plummeting down to $320 before recovering to $380 levels. While the current price is considerably lower than the $415 high, but Ethereum made insane gains over the course of the week and month.

Ethereum traders should look for a trade opportunity after the cryptocurrency decides its price direction.

ETH/USD 4-hour Chart

Technical Factors:

  • Price is above the 50-period EMA and the 21-period EMA
  • Price is between its top B.B. and its middle B.B (20-period SMA)
  • RSI is elevated (61.44)
  • Above-average volume (descending)

Key levels to the upside          Key levels to the downside

1: $340                                    1: $302

2: $362                                    2: $289

                                                 3: $278

Ripple

XRP spent the weekend reaching the resistance level of $0.32, which it could not pass over, and then dropping towards the downside. The third-largest cryptocurrency reached a low of $0.241 before bouncing back to above $0.285 level, where it currently is consolidating (and rising slowly).

XRP traders can look for an opportunity in the range between $0.285 and $0.31.

XRP/USD 4-hour Chart

Technical factors:

  • Price above 21-period and the 50-period EMA
  • Price is between the top B.B. and the middle B.B. (20-period SMA)
  • RSI is elevated (63.79)
  • Elevated volume (descending)

Key levels to the upside          Key levels to the downside

1: $0.32                                    1: $0.285  

2: $0.3328                                2: $0.266

                                               3: $0.245


Categories
Crypto Market Analysis

Daily Crypto Review, July 31 – Binance Debit Cards Now in Europe; XRP Whales Started Buying?

The cryptocurrency market mostly traded sideways as Bitcoin still continues its fight for $11,000. Bitcoin is currently trading for $11,065, which represents a decrease of 0.43% on the day. Meanwhile, Ethereum gained 4.76% on the day, while XRP gained 2.04%.

 Daily Crypto Sector Heat Map

When talking about top100 cryptocurrencies, Chilliz gained 29.75% on the day, making it the most prominent daily gainer. Bancor (14%) and VeChain (12.22%) also did great. On the other hand, Ampleforth has lost 45.57%, making it the most prominent daily loser. It is followed by Flexacoin’s loss of 8.58% and Quant’s loss of 8.06%.

Top 10 24-hour Performers (Click to enlarge)

Bottom 10 24-hour Performers (Click to enlarge)

Bitcoin’s dominance level decreased slightly since we last reported, with its value currently at 62.91%. This value represents a 0.75% difference to the downside when compared to yesterday’s value.

Daily Crypto Market Cap Chart

The cryptocurrency market capitalization increased slightly since we last reported. Its current value is $328.13 billion, which represents an increase of $3.04 billion when compared to the value it had yesterday.

_______________________________________________________________________

What happened in the past 24 hours?

_______________________________________________________________________

_______________________________________________________________________

Technical analysis

_______________________________________________________________________

Bitcoin

The largest cryptocurrency by market capitalization spent the day fighting for $11,000 yet again. The sideways movement ranged from the support of $10,855 to a little above $11,090 resistance level. While it is still unsure of whether Bitcoin will end up above or below $11,000, the rally from the $9,000 levels has been extremely successful. As for the short-term future of Bitcoin, it is still unsure, as some analysts call for an immediate correction while others predict a price increase to $11,500 levels.

BTC traders should look for a trade opportunity when BTC bounces off of $10,855 or falls below it.

BTC/USD 4-hour Chart

Technical factors:

  • Price is currently above its 50-period EMA and its 21-period EMA
  • Price is between its top B.B. and its middle B.B (20-period SMA)
  • RSI is elevated (60.82)
  • Volume increased (descending)

Key levels to the upside          Key levels to the downside

1: $11,090                                1: $10,855

2: $11,630                                2: $10,505

                                                 3: $10,015

Ethereum

Ethereum broke off from its period of stagnation and moved towards the upside. The second-largest cryptocurrency by market cap moved to $340 before being stopped. ETH is now consolidating just above the previous consolidation phase.

Ethereum traders should look for a trade opportunity after the cryptocurrency moves back below $324 or if it makes another move towards the upside.

ETH/USD 4-hour Chart

Technical Factors:

  • Price is above the 50-period EMA and the 21-period EMA
  • Price is at the top B.B.
  • RSI is elevated (66.5)
  • Above-average volume (descending)

Key levels to the upside          Key levels to the downside

1: $340                                    1: $302

2: $362                                    2: $289

                                                 3: $278

Ripple

XRP spent its day mostly trading sideways, but also gaining in value slightly. The third-largest cryptocurrency by market cap failed (so far) to break the $0.2454 level completely, but it has approached that event considerably. If, however, XRP doesn’t break the resistance level soon, it might fall back and retest the support level of $0.235.

XRP traders can look for an opportunity when the cryptocurrency breaks its ranging moves to either side.

XRP/USD 4-hour Chart

Technical factors:

  • XRP in a mid-term descending trend (though it broke the trend in the short-term)
  • Price above 21-period and the 50-period EMA
  • Price is between the top B.B. and the middle B.B. (20-period SMA)
  • RSI is elevated (61.84)
  • Elevated volume (descending)

Key levels to the upside          Key levels to the downside

1: $0.245                                  1: $0.235  

                                                2: $0.227

                                               3: $0.214


Categories
Forex Market Analysis

Daily F.X. Analysis, July 30 – Top Trade Setups In Forex – GDP Figures In Focus 

Later today, the focus will remain on the German Prelim GDP and Advance GDP figures from the U.S. both of the events are expected to perform worse than before as the data represents the lock-down period’s economic activity. So most of it is already priced in. However, the U.S. Jobless claims will remain in the highlights. Jobless Claims figures are expected to rise again, perhaps due to the second wave of COVID19 in the U.S.

Economic Events to Watch Today  


EUR/USD – Daily Analysis

TheEUR/USD pair was closed at 1.17897 after placing a high of 1.18061 and a low of 1.17124. Overall the movement of the EUR/USD pair remained bullish throughout the day. EUR/USD pair rose above the 1.180 level on Wednesday amid the Federal Reserve’s decision to keep the rates unchanged at 0.0%-0.25%.

The concerning picture painted by the Federal Reserve about the resurgence of COVID-19 that was already hurting consumption and jobs weighed more on the U.S. dollar. According to Fed Chair Jerome Powell, Fed showed full commitment to use all of its powers and tools to support the economy. He also said that economic development was highly dependent on the coronavirus, and the rates will remain near zero until the economy improves towards recovery.

The Fed’s decision and a statement from Fed’s Chair Powell further weighed on the U.S. dollar that was already under pressure from the past few days. The U.S. Dollar Index fell 0.44% to 93.17, the lowest level since June 2018. The fall of the U.S. dollar below two years lowest level helped the EUR/USD pair to post gains.

The greenback has suffered on expectations that the Fed will continue its ultra-loose monetary policy for years to come and speculate that it will allow inflation to run higher than it has previously indicated before raising interest rates. This all came as the U.S. was facing a continuous rise in coronavirus cases as U.S. deaths from virus surpassed 150,000 on Wednesday, a number higher than all countries and nearly a quarter of the world’s total numbers.

The pair EUR/USD rose above 1.180 level amid the fresh weakness of the U.S. dollar. However, the European side’s macroeconomic data also helped the EUR/USD pair in sustaining its gains.

At 11:00 GMT, the German Import Prices for June rose to 0.6% against the expected 0.5% and supported Euro that added in the upward trend of currency pair.

Furthermore, the Executive of the European Union said on Wednesday that it had agreed to buy a limited supply of the COVID-19 medicine redeliver from the U.S. drugmaker Gilead to address Europe’s short-term needs patients. They also hoped to be able to order more later.

The E.U. Commission agreed to pay about 63 million euros to buy enough doses to treat about 30,000 patients. The anti-viral is the only drug so far authorized in the E.U. to treat patients with the virus’s severe symptoms. However, nearly all available supplies have already been bought by the U.S.

Daily Technical Levels

Support Pivot Resistance
1.17 1.18 1.18
1.17 1.19
1.16 1.19


EUR/USD– Trading Tip

The technical side of the EUR/USD remains mostly the same as it’s trading at 1.1770 level, holding above resistance become support level of 1.1755. On the hourly timeframe, the EUR/USD continues to form higher high and higher low pattern suggestings odds of bullish trend continuation. A bearish breakout of 1.1755 can drive more selling until 1.1702 level. On the higher side, the resistance can stay at 1.1788 and 1.1880.


GBP/USD – Daily Analysis

The GBP/USD pair was closed at 1.29953 after placing a high of 1.30132 and a low of 1.29118. Overall the movement of GBP/USD pair remained bullish throughout the day. The GBP/USD pair rose for the 9th consecutive day and maintained its bullish streak and crossed the 1.30 level. The currency pair rose to its multi-months’ highest level since the first week of March amid the broad-based U.S. dollar weakness.

The U.S. dollar struggled against the six major currencies and dropped to 2 year’s lowest level at 93.17 on Wednesday after the announcement of an interest rate decision by Federal Reserve. Fed kept its rates unchanged near zero and vowed to keep them at the same level until the economy shows improvement.

 Furthermore, the Fed Chair Jerome Powell said that the current economic downturn was severe, and continued fiscal and monetary support will be necessary for recovery. He added that the Fed would remain committed to using its full range of tools to support the economy.

The rising number of coronavirus cases in the U.S. has weighed on America’s economy and the U.S. dollar. Traders have become more concerned that the world’s top economy could be headed for a severe contraction this year.

The death toll in the U.S. reached 150,000 on Wednesday, and it raised the concerns that the economy will take a long time to recover that weighed further on the U.S. dollar. The weak U.S. dollar gave a push to GBP/SUSD pair’s prices above 1.200 level.

On the British Pound front, the Pound rose today after U.K. Mortgage Approvals & Net Lending to Individuals. At 13:30 GMT, the M4 Money Supply by the U.K. for June dropped to 1.0% from the expected 2.2%. The Mortgage Approvals improved to 40K from the projected 35K in June, and the Net Lending to Individuals in June also rose to 1.8B from the expected -0.4B and supported Sterling.

Better than expected macroeconomic data from the U.K. gave strength to British Pound and helped GBP/USD pair to post gains on Wednesday.

Meanwhile, Brexit has remained in focus this week after the London School of Economics warned that both Brexit and the Covid-19 pandemic could severely compromise the U.K. economy.

The U.K. was close to securing a continuity trade deal with Japan that will mirror that of the E.U. pact that Britain will no longer be a part of next January. Both sides are seeking to secure a continuous trade deal once Brexit implemented on January 1.

On Thursday, U.S. dollar investors will be looking ahead for the US GDP figure for the second quarter that is expected to fall by -34.1%; any figure closer to it will be good for the U.S. dollar. The investors will also await the release of the latest U.S. Initial Jobless Claims for July.

However, most people will likely prefer not to invest in the U.S. dollar because of increased external and domestic pressure on American’s economy.

Daily Technical Levels

Support Pivot Resistance
1.2863 1.2908 1.2978
1.2792 1.3024
1.2747 1.3094

GBP/USD– Trading Tip

The GBP/USD is also forming a higher high and higher low pattern, which suggests odds of a bullish trend in the GBP/USD pair. The Cable is likely to find support at 1.2970, which is extended by the upward trendline on the hourly timeframe. Above this, the next resistance can be found around 1.30095, along with support at 1.2970 and 1.2945.


USD/JPY – Daily Analysis

The USD/JPY pair was closed at 104.920 after placing a high of 105.241 and a low of 104.771. Overall the movement of the USD/JPY pair remained bearish throughout the day. On Wednesday, USD/JPY pair continued its bearish streak for the 5th day and fell below 105.00 level amid Fed’s decision to keep interest rates near zero.

Federal Reserve Chairman Jerome Powell warned the U.S. faced the most severe economic downturn and said that the economy’s path was extraordinarily uncertain. He said that the increased number of virus cases and the renewed measures to control it have started to weigh on recent weeks’ economic activity. Powell also said that recovery would need help from both fiscal and monetary policy.

The Federal Reserve vowed to keep the rates unchanged as the pandemic still persists and poses considerable economic outlook risks. The rates will remain near zero until the economy was on track to achieve its maximum employment and price stability goals. The U.S. dollar came under renewed pressure after releasing the monetary policy statement and interest rate decision and caused the USD/JPY pair to drop below 105.00 level.

Despite better than expected U.S. macro-economic data, the U.S. dollar remained under pressure and continues to post losses on the day.

At 17:30 GMT, the Goods Trade Balance for June showed a deficit of 70.6B against the expected deficit of 75.5B and supported the U.S. dollar. The Prelim Wholesale Inventories came in as -2.0% against the expected -0.4% and supported the U.S. dollar. At 19:00 GMT, the Pending Home Sales for June increased to 16.6% against the expected 15.6%and supported the U.S. dollar. The U.S. Dollar index fell to its two years lowest level on 93.17, and the U.S. Treasury yields were little changed with a 10-year note holding below 0.60%.

Meanwhile, President Trump said on Wednesday that his administration was allowing for banning the Chinese-owned social media giant TikTok on the back of fears that it could be weaponized to spy Americans.

The U.S. Treasury Secretary Steven Mnuchin also backed this comment and said that Committee on Foreign Investment in the U.S. was also studying the app’s national security risk. He added that TikTok was under serious evaluation, and by this week, a recommendation will be made to the president regarding the app.

On coronavirus front, the U.S. coronavirus fatalities exceeded 150,000 as seven states, including California and Florida, broke new daily death records. Fears for the potential growth of the infections increased in the Midwest area, including Indiana, Colorado, Ohio, and Wisconsin, because of the fast spread of the virus in the U.S.

Early on Thursday, Japan will publish Retail Trade data that is expected to fell by 6.5% compared to the earlier year. The U.S. investors will look forward to GDP data for the second quarter.

Daily Technical Levels

Support Pivot Resistance
104.80 105.25 105.55
104.50 106.00
104.05 106.30

USD/JPY – Trading Tips

The USD/JPY trades with a selling bias around 105.526 level, trading within a downward channel that immediately generates resistance at 106.120. On the lower side, the USD/JPY may find support at 105.375 level, and closing of candles below 105.375 can open further selling bias until 104.850. Overall the pair is forming lowers low and lowers high pattern, which signifies selling sentiment among traders. The RSI and MACD suggest selling signals; for instance, the RSI is holding below 50, and the MACD is staying below 0. Today, let’s look for buying trade above 105.200. Good luck! 

Categories
Crypto Market Analysis

Daily Crypto Review, July 30 – Bitcoin Confirmed as Better Hedge than Gold? BTC fighting for $11,000

The cryptocurrency market mostly traded sideways as Bitcoin was fighting to regain $11,000. Bitcoin is currently trading for $11,065, which represents an increase of 1.2% on the day. Meanwhile, Ethereum gained 0.33% on the day, while XRP gained 0.45%.

 Daily Crypto Sector Heat Map

When talking about top100 cryptocurrencies, Travala.com gained 21.78% on the day, making it the most prominent daily gainer. Digitex Futures (16.68%) and Aave (11.94%) also did great. On the other hand, Ampleforth has lost 35.64%, making it the most prominent daily loser. It is followed by Aurora’s loss of 10% and iExec RLC’s loss of 8.31%.

Top 10 24-hour Performers (Click to enlarge)

Bottom 10 24-hour Performers (Click to enlarge)

Bitcoin’s dominance level increased slightly since we last reported, with its value currently at 63.66%. This value represents a 0.35% difference to the upside when compared to yesterday’s value.

Daily Crypto Market Cap Chart

The cryptocurrency market capitalization increased since we last reported. Its current value is $325.17 billion, which represents an increase of $4.246 billion when compared to the value it had yesterday.

_______________________________________________________________________

What happened in the past 24 hours?

_______________________________________________________________________

_______________________________________________________________________

Technical analysis

_______________________________________________________________________

Bitcoin

The largest cryptocurrency by market capitalization had another slow day, where it tried to pass $11,000 and consolidate above it. However, while it has passed the threshold, BTC hasn’t confirmed its position above it, making the $11,000 mark uncertain. The $10,855 support level is, on the other hand, a strong support that has been confirmed.

BTC traders should look for a trade opportunity when BTC bounces off of $10,855 or falls below it.

BTC/USD 4-hour Chart

Technical factors:

  • Price is currently above its 50-period EMA and its 21-period EMA
  • Price is between its top B.B. and its middle B.B (20-period SMA)
  • RSI is elevated (62.24)
  • Volume increased (descending)

Key levels to the upside          Key levels to the downside

1: $10,855                               1: $10,505

2: $11,090                               2: $10,015

3: $11,630                                3: $9,870

Ethereum

Ethereum spent its day consolidating above the $315 level, finding support at the 21-period moving average. The second-largest cryptocurrency by market cap ensured its position above $302 (at least in the short-term). Its future movement will most likely be determined by Bitcoin’s next move.

Ethereum traders should look for a trade opportunity after the cryptocurrency breaks its consolidation phase.

ETH/USD 4-hour Chart

Technical Factors:

  • Price is above the 50-period EMA and the 21-period EMA
  • Price is under the middle B.B. (20-period SMA)
  • RSI has normalized (56.41)
  • Above-average volume (descending)

Key levels to the upside          Key levels to the downside

1: $340                                    1: $302

2: $362                                    2: $289

                                                 3: $278

Ripple

Unlike Bitcoin and Ethereum, the third-largest cryptocurrency by market cap maintained high volume and tried to make a move that would break its current ranging position. XRP first moved to the upside, trying to break $0.2454, but failed to do so, which triggered a reaction from XRP bears. The cryptocurrency then made an attempt to break $0.235 to the downside but failed in doing that as well, therefore “locking” XRP in a range between the two resistances.

XRP traders can look for an opportunity when the cryptocurrency breaks its ranging moves to either side.

XRP/USD 4-hour Chart

Technical factors:

  • XRP in a mid-term descending trend (though it broke the trend in the short-term)
  • Price above 21-period and the 50-period EMA
  • Price is between the top B.B. and the middle B.B. (20-period SMA)
  • RSI is elevated (65.63)
  • Elevated volume

Key levels to the upside          Key levels to the downside

1: $0.235                                  1: $0.227 

2: $0.245                                  2: $0.214

                                               3: $0.205


Categories
Forex Market Analysis

Daily F.X. Analysis, July 29 – Top Trade Setups In Forex – FOMC in Focus! 

On the news front, the focus will be on the FOMC and Fed policy decision which is expected to be 0.25%. Since no change in rate is expected, there’s is likely to be a neutral sentiment in the market. Besides, the investors will also focus on the Pending Home Sales from the U.S. which is expected to have dropped sharply. The dollar can stay weaker on this news.

Economic Events to Watch Today  


EUR/USD – Daily Analysis

The EUR/USD pair was closed at 1.17166 after placing a high of 1.17734 and a low of 1.16984. Overall the movement of the EUR/USD pair remained bearish throughout the day.

After rising for eight consecutive days, the EUR/USD pair dropped on Tuesday and posted losses for the day as the U.S. dollar rose marginally across the board but remained under pressure ahead of the Fed meeting.

The U.S. Dollar Index was also up on Tuesday and posted a high of 94.0. The recovery in the greenback could be because of correction after losing ground significantly over a few days. Or the recovery could also be because of the rising hopes of the U.S. stimulus package and the economic recovery hopes associated with it.

The Republicans made a proposal on Monday for a stimulus package worth about $1 trillion. The Senate Republicans plan to issue another round of stimulus checks of $1200 while it also cut the emergency unemployment benefit from $600 to $200 per week.

More than 100 billion dollars were allocated to reopen schools in the presented proposal of coronavirus relief fund by Republicans. The proposal is yet to be approved by the Democrats. On the data front, the Spanish Unemployment Rate was decreased to 15.3% from the expected 16.6% and supported Euro. From the American side, at 18:00 GMT, the S&P/CS Composite-20 Housing Price Index for the year was also dropped to 3.7% from the expectations of 4.1%. At 19:00 GMT, the C.B. Consumer Confidence from America dropped to 92.6 in July from 94.0and weighed on the U.S. dollar.

However, the EUR traders ignored the macroeconomic data on Tuesday, and the pair EUR/USD continued to follow the improved U.S. dollar movements.

A two-day Federal Reserve meeting started on Tuesday, during which investors expected reaffirmation on the outlook. Though no monetary policy changes were expected, traders were speculating about a change in emphasis in the Fed’s forward guidance at the meeting.

On the other hand, the bearish correction in EUR/USD pair on Tuesday was due to the rise in its prices for eight consecutive days. The trend in the EUR/USD pair was still positive, and even a sharper slide could have been normal.

On the previous day, the pair EUR/USD posted the highest daily close since June 2018 near 1.1780 level, confirmed that both single currencies had a solid momentum. And despite falling and posting losses on Tuesday, the pair EUR/USD continued to hold just below 1.18 level, which shows that it has a key multi-year trend resistance.

Daily Technical Levels

Support Pivot Resistance
1.1686 1.1730 1.1762
1.1654 1.1806
1.1610 1.1837

EUR/USD– Trading Tip

The EUR/USD is trading at 1.1728 level, holding above resistance to become a support level of 1.1715. On the hourly timeframe, the EUR/USD was previously forming highers high and highers low pattern, but now the recent cycle seems to change the trend. A bearish breakout of 1.1715 can drive more sales until the 1.1683 level. On the higher side, the resistance can stay at 1.1780.

GBP/USD – Daily Analysis

The GBP/USD pair was closed at 1.29316 after placing a high of1.29526 and a low of 1.28379. Overall the movement of GBP/USD pair remained bullish throughout the day. The GBP/USD pair extended its previous day’s gains and maintained its bullish streak for the 8th consecutive day on Tuesday amid improved market mood on vaccine hopes. The U.S. Dollar struggled on Tuesday after hopes of a COVID-19 vaccine boosted the risk sentiment. As in result, the greenback suffered as markets inclined towards riskier assets. The positive news about vaccine development supported the risk sentiment.

The pharma firms worldwide are working on treatment and vaccine development that provides multiple routes to success. Companies like Moderna, Pfizer, and AstraZeneca were all pushing to get their vaccines across the line.

Meanwhile, the U.S. Dollar was also supported ahead of the 2-days Federal Reserve meeting that started on Tuesday. Though no change in interest rate is expected, the traders were cautious to know about the statement of meeting to find more clues about the U.S. economy.

However, the release of S&P/Case-Shiller Home Price Indices for May fell below the forecast of 3.9% to 3.7%. It is because investors have become concerned about America’s economic recovery from the coronavirus pandemic.

The Richmond Manufacturing Index was released at 18:59 GMT as 10 for July against the expectations of 5 and supported the U.S. dollar. However, the C.B. Consumer Confidence also dropped to 92.6 from the forecasted 94.0 and weighed on the U.S. dollar that eventually added in the currency pair gains.

From the GBP side, the Pound was benefited from a stronger than expected CBI Distributive Trades Survey that rose to 4% from the expected -37% and gave hopes to investors that the British economy could be on the road to recovery.

Meanwhile, the Sterling traders were cautious after Prime Minister Boris Johnson warned of the possible signs of the pandemic’s second wave in parts of Europe. This raised concerns that the U.K. could also suffer from a second wave of coronavirus in the month ahead. The London School of Economics has also reported that Brexit could prove a double-shock to the economy. As a result, GBP traders remained cautious as UK-EU post-Brexit trade talks continue despite a lack of progress.

The GBP/USD pair traders will look forward to the Fed’s interest rate decision and the statement of the meeting. If fed in notably downbeat in s monetary policy statement, the GBP/USD pair would edge higher as concerns about the global economy grow.

The Brexit developments will also drive the GBP/USD pair in the coming days of the week as there will be a lack of macroeconomic data until next week. If the talks between the E.U. & U.K. show any progress, then Sterling would rise.


Daily Technical Levels

Support Pivot Resistance
1.2863 1.2908 1.2978
1.2792 1.3024
1.2747 1.3094

GBP/USD– Trading Tip

On the 4 hour chart, the GBP/USD has completed 23.6% retracement at 1.2927 level, and closing below this level has the potential to lead GBP/USD prices towards 1.2910, which marks 38.2% Fibonacci retracement level. On the lower side, the GBP/USD pair can find support at 1.2810 and 1.2765 level. Conversely, the resistance stays at 1.2975. Let’s consider taking buying trade over 1.2760 until 1.2860 level today.  

USD/JPY – Daily Analysis

The USD/JPY pair was closed at 105.073 after placing a high of 105.684 and a low of 104.954. Overall the movement of the USD/JPY pair remained bearish throughout the day. The USD/JPY pair extended its bearish trend and losses on Tuesday amid U.S. dollar weakness and struggled with 105 level. The haven was on the bid, which supported the Japanese Yen and caused a decline in the USD/JPY pair.

The rising numbers off coronavirus cases in the U.S. and the Federal Reserve Interest Rate decision event were the market’s dominating sentiment. Meanwhile, the U.S. stimulus negotiations and mixed earnings reports sent the investors to the sidelines.

The greenback managed to correct some of its oversold conditions during the past sessions; however, the USD/JPY pair remained still on the bearish path on Tuesday. The reason behind it was that background picture containing the concerns about the spread of coronavirus, and the ongoing US-China tensions did not change.

The U.S. Senate Republicans revealed the new coronavirus aid proposal that will need Democrats’ support. The package would include another round of $1200 in direct payments to individuals and a reduction in federal unemployment benefits from $600 to $200 per week and also more than $100 billion for reopening schools.

In remarks, Nancy Pelosi, a white house speaker, criticized it and called it a “pathetic” offer that was not enough to support the country.

On the data front, Japan published the June Corporate Service Price Index, which improved to 0.8% from 0.5% in May. On the U.S. side, the Richmond Manufacturing Index raised to 10 from the expected five and supported the U.S. dollar. The S&P/CS Composite-20 HPI dropped to 3.7% from the expected 4% and weighed on the U.S. dollar. The C.B. Consumer Confidence also dropped to 92.6 from the expected 94.0 and weighed on the U.S. dollar.

The poor than expected Consumer Confidence and HPI data added further losses in the USD/JPY pair on Tuesday. Furthermore, despite the prospects of a prolonged U.S. recession, the U.S. dollar will favor any breakdown in the market confidence due to its dominance in the global payment system. On JPY front, the currency is sensitive to geopolitical news in the Asian region, and with the ongoing conflict between U.S. & China, JPY is set to remain firm for the time being. JPY was the third worst-performing currency this month after the USD and Canadian Dollar.


Daily Technical Levels

Support Pivot Resistance
104.80 105.25 105.55
104.50 106.00
104.05 106.30


USD/JPY – Trading Tips

The USD/JPY trades with a selling bias around 105.526 level, trading within a downward channel that provides an immediate resistance at 106.120. On the lower side, the USD/JPY may find support at 105.375 level, and closing of candles below 105.375 can open further selling bias until 104.850. Overall the pair is forming lowers low and lowers high pattern, which signifies selling sentiment among traders. The RSI and MACD suggest selling signals; for instance, the RSI is holding below 50, and the MACD is staying below 0. Today, let’s look for buying trade above 105.200. Good luck! 

Categories
Crypto Market Analysis

Daily Crypto Review, July 29 – BTC consolidating under $11,000; XRP Skyrocketing

The cryptocurrency market mostly traded sideways after major breakthroughs in the past ten days. Bitcoin is currently trading for $10,880, which represents a decrease of 2.76% on the day. Meanwhile, Ethereum lost 3.38% on the day, while XRP gained 2.42%.

 Daily Crypto Sector Heat Map

When talking about top100 cryptocurrencies, Aave gained 20.59% on the day, making it the most prominent daily gainer. iExec RLC (20.52%) and THORChain (19.48%) also did great. On the other hand, Ampleforth has lost 16.44%, making it the most prominent daily loser. It is followed by Digitex Futures’ loss of 12.01% and HedgeTrade’s loss of 11.28%.

Top 10 24-hour Performers (Click to enlarge)

Bottom 10 24-hour Performers (Click to enlarge)

Bitcoin’s dominance level decreased since we last reported, with its value currently at 63.31%. This value represents a 1.02% difference to the downside when compared to yesterday’s value.

Daily Crypto Market Cap Chart

The cryptocurrency market capitalization skyrocketed and now confirmed its position above the $300 billion mark. Its current value is $320.93 billion, which represents a decrease of $0.06 billion when compared to the value it had yesterday.

_______________________________________________________________________

What happened in the past 24 hours?

_______________________________________________________________________

_______________________________________________________________________

Technical analysis

_______________________________________________________________________

Bitcoin

The largest cryptocurrency by market capitalization had a rather slow day, unlike the past days, which passed in BTC making significant gains. The volume is slowly fading away while the price is trying to find resistance. Bitcoin fell under $11,000 and is currently consolidating above the $10,855 support level. However, it is still unsure if Bitcoin will stay above it or fall under.

BTC traders should look for a trade opportunity when BTC breaks $10,855 to the downside or $11,090 to the upside.

BTC/USD 4-hour Chart

Technical factors:

  • Price is currently above its 50-period EMA and its 21-period EMA
  • Price is between its top B.B. and its middle B.B (20-period SMA)
  • RSI is elevated (69.73
  • Volume greatly increased (descending)

Key levels to the upside          Key levels to the downside

1: $10,855                               1: $10,505

2: $11,090                               2: $10,015

3: $11,630                                3: $9,870

Ethereum

Ethereum also had a slow day, while its price drop reflected Bitcoin’s drop (percentage-wise). The second-largest cryptocurrency by market capitalization is trying to consolidate around the $315 mark, while its volume is fading. Ethereum has strong support at $302, which might get challenged shortly.

Ethereum traders should look for a trade opportunity after the cryptocurrency is done with consolidating.

ETH/USD 4-hour Chart

Technical Factors:

  • Price is above the 50-period EMA and the 21-period EMA
  • Price is at the middle B.B. (20-period SMA)
  • RSI is elevated (58.66)
  • Extremely high volume (descending)

Key levels to the upside          Key levels to the downside

1: $340                                    1: $302

2: $362                                    2: $289

                                                 3: $278

Ripple

Unlike Bitcoin and Ethereum, the third-largest cryptocurrency by market cap had quite a good day, which brought its price above $0.227 and $0.235 resistance levels. XRP made a move, which was sparked by an influx of buyers. The move is still not over, and XRP is fighting to stay above $0.235, though that is unlikely unless the cryptocurrency pushes its price towards the $0.245 level.

XRP traders can look for an opportunity in pullbacks after the bullish move.

XRP/USD 4-hour Chart

Technical factors:

  • XRP in a mid-term descending trend (though it broke the trend in the short-term)
  • Price above 21-period and the 50-period EMA
  • Price is above the top B.B.
  • RSI is in the overbought territory (73.69)
  • Elevated volume

Key levels to the upside          Key levels to the downside

1: $0.235                                  1: $0.227 

2: $0.245                                  2: $0.214

                                               3: $0.205


Categories
Forex Market Analysis

Daily F.X. Analysis, July 28 – Top Trade Setups In Forex – U.S. C.B. Consumer Confidence In Focus! 

On the news front, the U.S. will be releasing C.B. Consumer Confidence during the New York session. C.B. Consumer Confidence is expected to drop from 98 to 94, and it can weigh dollar prices. Simultaneously, the Spanish Unemployment Rate will be in focus during the European session to determine price action in the Euro pairs today.

Economic Events to Watch Today  


EUR/USD – Daily Analysis

The EUR/USD pair was closed at 1.17511 after placing a high of 1.17812 and a low of 1.17447. Overall the movement of the EUR/USD pair remained bullish throughout the day. The EUR/USD pair extended its gains and raised for the 7th consecutive session on Monday to reach 22 months’ top level. The EUR/USD [air even crossed the 1.1700 marks and touched the high of 1.17812 on Monday, the highest since September 2018.

The move was attributed to the U.S. dollar’s weakness as a combination of the sentiment in the risk complex plus the persistent selling of the U.S. dollar in favor of other safe have assets kept the greenback under heavy pressure.

The U.S. Dollar Index fell to 2 years low near 93.60 level and weighed heavily on greenback that ultimately helped EUR/USD pair to grow on the chart for the 7th consecutive session.

On data front at 13:00 GMT, the M3 Money Supply for the year dropped in June to 9.2% from the expected 9.5% and weighed on Euro. The Private Loans for the year also fell in June to 3.0% from the anticipated 3.2% and weighed on Euro. The German Ifo Business Climate, however, was improved to 90.5 points from the expected 89.2 points in July.

In July, the improvement in German Ifo Business Climate could be attributed to the new stimulus package by E.U. commission that was agreed by all E.U. states in 4 days E.U. Summit with some alterations. This improvement in Business Climate for the largest economy of Europe gave strength to local currency and added in the EUR/USD currency pair’s gains.

The sharp surge in EUR/USD pair towards levels last seen in September 2018 above 1.1700 level, confirmed that both single currencies had a solid momentum. USD has a negative momentum triggered by the strong selling bias after the fears of U.S. economic recovery and mounting coronavirus cases. At the same time, EUR has a positive momentum after the E.U. states agreed on a Europe Recovery Fund worth 750 Billion euros. On Wednesday, the Federal Reserve will announce its decision about the monetary policy. Though no change is expected, the comments about the growing concerns on U.S. economic recovery would be key.

Daily Technical Levels

Support Resistance

1.1684     1.1816

1.1601     1.1865

1.1552     1.1948

Pivot Point: 1.1733

EUR/USD– Trading Tip

The EUR/USD is trading at 1.1728 level, holding above resistance to become a support level of 1.1715. On the hourly timeframe, the EUR/USD was previously forming highers high and highers low pattern, but now the recent cycle seems to change the trend. A bearish breakout of 1.1715 can drive more sales until the 1.1683 level. On the higher side, the resistance can stay at 1.1780.


GBP/USD – Daily Analysis

The GBP/USD pair was closed at 1.28793 after placing a high of 1.29025 and a low of 1.27755. Overall the movement of GBP/USD remained bullish throughout the day. The GBP/USD pair extended its gains and maintained its bullish streak for the 7th day amid broad-based U.S. dollar selling bias.

The pound surged to nearly five months high level against the U.S. dollar and reached above 1.2900 marks on Monday, but the signs that Brexit negotiations have delayed could prompt bearish bias to rise further.

The decline in the U.S. dollar continuously supported the rally in the GBP/USD pair. The greenback continued to decline that started last week. It was unable to find support because of worries about the economic recovery in the U.S. and rising expectations about more stimulus from the Federal Reserve.

Furthermore, the macroeconomic data on Monday from the U.S. showed that Core Durable Goods Orders in June dropped to 3.3% from the 3.5% of expectations and weighed on the U.S. dollar. However, the Durable Goods Orders for June raised to 7.3% against the expected 7.0% and supported the U.S. dollar.

On Brexit front, the E.U. and U.K. wrapped up their last round of negotiations in London last Thursday but failed to find a solution on key sticking points, including access of E.U. vessels to fish British waters that have so far muted the progress. The E.U. chief negotiator Michel Barnier has emphasized that talks between E.U. & U.K. needed to be completed by October to ratify a potential deal would be lengthy.

On Monday, the strength in Sterling was largely driven by a sharp fall in the dollar as investors bet that an average inflation targeting mechanism will be introduced by the Federal Reserve in its next meeting this week, and that would likely keep interest rate lower for longer.

The Federal Open market Committee will kick off its 2-day meeting on Tuesday. The interest rates are expected to remain the same within the range of 0% t0 0.25%. However, the comments from FOMC members will be key to watch to take fresh clues about the economic condition of the U.S.

Daily Technical Levels

Support Resistance

1.2807     1.2930

1.2732     1.2978

1.2684     1.3053

Pivot Point: 1.2855

GBP/USD– Trading Tip

On the 4 hour chart, the GBP/USD has closed with a bearish engulfing candle, which suggests odds of more selling the in Cable. On the lower side, GBP/USD can find support at 1.2810 and 1.2765 level. Conversely, the resistance stays at 1.2900 and 1.2975. Let’s consider taking buying trade over 1.2760 until 1.2860 level today.  


USD/JPY – Daily Analysis

The USD/JPY pair was closed at 105.378 after placing a high of 106.105 and a low of 105.114. Overall the movement of the USD/JPY pair remained bearish throughout the day. On Monday, the USD/JPY pair fell sharply and reached 105 level as the JPY capitalized on the risk-off flows at the start of the week. The broad-based U.S. dollar weakness and Japanese Yen’s strength as safe-haven currency caused the pair to decline for the 3rd consecutive session.

The U.S. Dollar Index was down 0.83% on Monday at 93.56 level, which, combined with the decreased Core Durable Goods Orders in June data, weighed on the U.S. dollar. As in result, greenback suffered further and pushed USD/JPY currency pair towards fresh multi-month low.

At 17:30 GMT, the Core Durable Goods Orders were declined to3.3% from the 3.5% of expectations and weighed on the U.S. dollar that ultimately pulled the USD/JPY pair towards the lowest level. At 17:30 GMT, the Durable Goods Orders for June increased to 7.3% against the expected 7.0%

On Monday, the Bank of Japan released the summary of opinions at a July rate review. BOJ’s policymakers debated how the COVID-19 pandemic could reshape monetary policy and its impact on the economy. Many in the nine-member board warned any domestic recovery from the pandemic’s disturbing economic impact would be uncertain and could be delayed depending on how long it takes to contain the outbreak.

Several board members cautioned that any further economic stress would require policymakers to pay close attention to Japan’s banking system and its long-term expectations of inflation. One member suggested that further action was needed with close cooperation with the government and other central banks.

At the July rate review, the Bank of Japan kept the monetary policy steady and gradually maintained its view that the economy would gradually recover from the crisis. In short, the Bank of Japan’s July meeting summary of opinion suggested that the nation’s economy is likely to improve in the latter half of this year, but the impact of a pandemic on inflation and growth expectations must be watched.

On the other hand, US-China tensions escalated after China took over the U.S. consulate locations in the southwest city of Chengdu on Monday. The move came in after the facility was ordered to be vacated in revenge for the closure of China’s consulate in Houston last week.

U.S. Secretary of State Mike Pompeo said that Washington and its allies must use “more creative and assertive ways” to press the Chinese Communist party to change its ways.

The increased tensions between both nations kept the Japanese Yen stronger due to its safe-haven status. The strong Japanese Yen then pushed the USD/JPY pair lower towards multi month’s low level.

Daily Technical Levels

Support Resistance

104.91     106.01

104.47     106.65

103.82     107.10

Pivot Point: 105.56

USD/JPY – Trading Tips

The USD/JPY trades with a selling bias around 105.526 level, trading within a downward channel that provides an immediate resistance at 106.120. On the lower side, the USD/JPY may find support at 105.375 level, and closing of candles below 105.375 can open further selling bias until 104.850. Overall the pair is forming lowers low and lowers high pattern, which signifies selling sentiment among traders. The RSI and MACD suggest selling signals; for instance, the RSI is holding below 50, and the MACD is staying below 0. Today, let’s look for buying trade above 105.200. Good luck! 

Categories
Crypto Market Analysis

Daily Crypto Review, July 28 – Bitcoin Spikes to $11,000; Over $300 Million Liquidated

The cryptocurrency market spent made yet another boom as Bitcoin passed the $11,000 benchmark. Bitcoin is currently trading for $11,024, which represents an increase of 7.7% on the day. Meanwhile, Ethereum lost 1.04% on the day, while XRP gained 2.85%.

 Daily Crypto Sector Heat Map

When talking about top100 cryptocurrencies, Kava.io gained 14.29% on the day, making it the most prominent daily gainer. Divi (13.17%) and Band Protocol (12.84%) also did great. On the other hand, Ampleforth has lost 23.81%, making it the most prominent daily loser. It is followed by Flexacoin’s loss of 17.11% and Augur’s loss of 11.43%.

Top 10 24-hour Performers (Click to enlarge)

Bottom 10 24-hour Performers (Click to enlarge)

Bitcoin’s dominance level increased since we last reported, with its value currently at 64.33 %. This value represents a 2.78% difference to the upside when compared to yesterday’s value.

Daily Crypto Market Cap Chart

The cryptocurrency market capitalization skyrocketed and now confirmed its position above the $300 billion mark. Its current value is $320.99 billion, which represents an increase of $20.52 billion when compared to the value it had yesterday.

_______________________________________________________________________

What happened in the past 24 hours?

_______________________________________________________________________

_______________________________________________________________________

Technical analysis

_______________________________________________________________________

Bitcoin

It’s safe to say that the largest cryptocurrency by market capitalization had another amazing day as it broke a major benchmark of $11,000 and reaching a final price of $11,394 before cooling down. The moment Bitcoin broke $10,000, on-chain activity registered a great increase in exchange inflow, which ultimately led to this fast price increase. During the process, Bitcoin managed to liquidate over $300 million in sell orders.

BTC traders should look for a trade opportunity either with another move up (aggressive) or when the price cools down slightly and makes a top (safer).

BTC/USD 4-hour Chart

Technical factors:

  • Price is currently above its 50-period EMA and its 21-period EMA
  • Price is slightly below its top B.B.
  • RSI is in severely overbought territory (84.33)
  • Volume greatly increased

Key levels to the upside          Key levels to the downside

1: $10,855                               1: $10,505

2: $11,090                               2: $10,015

3: $11,630                                3: $9,870

Ethereum

Ethereum looks like it has found its top at $330 after rising in price for the past 6 days. The final move brought the second-largest cryptocurrency by market cap to the highs of $333 before cooling off a bit. Ethereum now seems like it will (if nothing major happens to Bitcoin) possibly head towards the nearest support level to test it.

Ethereum traders should look for a trade opportunity in Ethereum’s pullbacks and confirmations.

ETH/USD 4-hour Chart

Technical Factors:

  • Price is above the 50-period EMA and the 21-period EMA
  • Price is below the top B.B.
  • RSI elevated (64.32)
  • Extremely high volume

Key levels to the upside          Key levels to the downside

1: $340                                    1: $302

2: $362                                    2: $289

                                                 3: $278

Ripple

The third-largest cryptocurrency by market cap had quite a stable day as it confirmed its path above $0.214. XRP then bounced up and tried to make a break above the $0.227. However, the move was unsuccessful due to the wall of sellers present. XRP will most likely continue to trade within a range, bound by $0.214 to the downside and $0.227 to the upside.

XRP traders can look for an opportunity within the range XRP is currently trading in.

XRP/USD 4-hour Chart

Technical factors:

  • XRP in a mid-term descending trend (though it broke the trend in the short-term)
  • Price above 21-period and the 50-period EMA
  • Price is below the top B.B.
  • RSI is elevated (61.27)
  • Average/slightly higher than average volume

Key levels to the upside          Key levels to the downside

1: $0.227                                  1: $0.214

2: $0.235                                  2: $0.205

3: $0.245                                 3: $0.2


Categories
Forex Market Analysis

Daily F.X. Analysis, July 27 – Top Trade Setups In Forex – U.S. Durable Goods In Hightlights! 

On the news side, eyes will remain on the German Business Climate, and the U.S. durable good as these have the potential to drive movement in the market gold and US-related pairs. Check out the trading plans below.

Economic Events to Watch Today  


EUR/USD – Daily Analysis

The EUR/USD pair was closed at 1.16543 after placing a high of 1.16579 and a low of 1.15810. The EUR/USD pair extended its 6th-day bullish rally and rose above 1.16500 level on Friday amid the broad-based U.S. dollar weakness. The declines in greenback boosted the currency pair EUR/USD as the marginal gains in the U.S. dollar failed to retain their position.

The U.S. Dollar Index raised to 94.80 level but turned to the downside after dropping to 94.40 level, the lowest since September 2018. The U.S. dollar currency was unable to stabilize as its weakness remained in place.

The main driver behind Friday’s rally in the EUR/USD pair was the U.S. dollar’s weakness. However, the economic data also supported this upside movement in currency pair.

At, 12:15 GMT, the French Flash Services PMI for July rose to 57.8 against the expectations of 52.3 and supported EUR. The French Flash Manufacturing PMI for July dropped to 52.0 from the projected 53.1. At12:30 GM, the German Flash Manufacturing PMI raised to 50.0 from the 48.0 of expectations, and Flash Services PMI also raised to 56.7 from the anticipated 50.4.

At 13:00 GMT, the Flash Manufacturing PMI for whole bloc also rose to 51.1 from the anticipated 50.0, and the Flash Services PMI for whole bloc reached 55.1 in July from the expected 51.0. At 17:55 GMT, the Belgian NBB Business Climate dropped by 13.9 points against the expected drop by 14.3 points, and it also supported Euro as the business climate showed improvement.

On the flip side, the Flash Manufacturing PMI from the U.S. was released at 18:45 GMT. The figure dropped to 51.3 from the anticipated 52.0. The Flash Services PMI from the U.S. also declined to 49.6 from the expected 51.0 in July. The better than expected PMI data from Europe indicated that manufacturing and services activities were improved in Europe, giving strength to EUR. Whereas, the poor than expected data from the U.S. weakened the U.S. dollar when its PMI dropped in July.

The better economic condition and business climate of the European Union could be attributed to the latest approval of a massive stimulus package by the European Union. And the U.S.’s poor economic condition indicated that the U.S. was still suffering and struggling against coronavirus.

The U.S. marked the second day with 70,000 plus new cases of coronavirus and deaths more than 1000 in 24 hours on Saturday. The total number of infections in the U.S. reached 4.1 M, and the fatalities reached 145,324.

The mounting numbers in infected people will likely weigh on the U.S. economy and its currency for a longer period, and the weakness in gold is likely to remain persistent. So, another rally in EUR/USD on Monday is expected unless news suggested otherwise.

Daily Technical Levels

Support Resistance

1.1640     1.1659

1.1629     1.1667

1.1621     1.1678

Pivot point: 1.1648

EUR/USD– Trading Tip

The EUR/USD traded sharply bullish amid weaker dollar to trade at 1.1704 level, and closing below 1.1730 resistance level can trigger selling until 1.1685 level today. On the lower side, the pair may gain support at 1.1686 level. A bullish breakout of the 1.1730 level can extend the buying trend until the 1.1788 level. While the violation of 1.1685 can lead to EURUSD prices towards 1.1589 level. 


GBP/USD – Daily Analysis

The GBP/USD closed at 1.27945 after placing a high of 1.28034 and a low of1.27168. Besides, the trading of the GBP/USD pair remained bullish throughout the day. The GBP/USD pair gained on Friday and extended its bullish streak of the 6th consecutive day on Friday amid better than expected U.K. data and broad-based U.S. dollar weakness.

Despite U.K. data coming in favor of local currency, the other factor involved in the rally of GBP/USD pair was the U.S. dollar’s weakness. The greenback has failed to recover as U.S. yields were low and looking for support. Since March, the U.S. Dollar Index fell and posted the fifth weekly decline in a row with the worst performance. The index dropped below 94.5 level that is lowest since September 2018.

Sterling was high on the board as the macroeconomic data related to PMI for July from the U.K. rose from expectations. AT 13:30 GMT, the Flash manufacturing PMI for July rose to 53.6 against the expectations of 52.0 and supported GBP. The Flash Services PMI for July also raised to 56.6 from the expected 51.4 and supported GBP. At 11:00 GMT, the Retail Sales from the U.K. was raised by 13.9% from the expected 8.3% and supported GBP. The better than expected PMI and Retail Sales data from Great Britain helped GBP/USD to post gains and trade higher.

The U.S. Manufacturing PMI dropped to 51.3 from the expected 52.0, and the Flash Services PMI from the U.S. also dropped to 49.6 from the expected 51.0 in July. This added in the U.S. dollar weakness on board and supported the gains in GBP/USD pair on Friday.

Meanwhile, the U.S. dollar weakness was further bolstered by the rising coronavirus cases across the states. The U.S. marked the second day with 70,000 plus new instances of coronavirus and deaths more than 1000 in 24 hours on Saturday. The total number of infections in the U.S. touched 4.1 M, and the death toll reached 145,324.

The hopes that the U.S. economy will take a long period to recover from the coronavirus crisis as it hit hardest the U.S. States kept weighing on the U.S. dollar. The U.S. Dollar drops across the board pushed the pair above the 1.2800 level, and analysts believe that if the dollar’s weakness remained still, the GBP/USD pair could reach the 1.3000 level.

The British Pound was also backed by the decreasing number of coronavirus cases in the U.K. It means that restrictions will be gradually removed, and these hopes supported Pound.

On Brexit front, the latest round of negotiations ended on Thursday without significant progress on the post-Brexit trade deal. Britain’s chief Brexit negotiator David Frost said that they would not reach a preliminary agreement by the UK PM Boris Johnson’s July deadline. However, although the expectations for striking a deal are very less, it could not lose attention. Next week, the Brexit talks, U.S. stimulus package, and the infection cases in the U.S. will be key to watch.

Daily Technical Levels

Support Resistance

1.2782      1.2803

1.2771      1.2813

1.2762      1.2824

Pivot point:1.2792

GBP/USD– Trading Tip

The GBPUSD is also trading in an overbought region, and now it can drop until 1.2825 level, which marks 23.6% Fibonacci retracement below this the next support will be found around 1.2770. At the same time, resistance stays at 1.2860 and 1.2930. The RSI and MACD are in the bullish region, but they are forming smaller histograms that suggest odds of selling bias. Let’s consider taking buying trade over 1.2760 until 1.2860 level today.  


USD/JPY – Daily Analysis

The USD/JPY was closed at 106.124 after placing a high of 106.902 and a low of 105.679. The USD/JPY pair extended its bearish streak for the second day towards the lowest of 2 years amid broad-based U.S. dollar weakness. The strong bearish pressure on the day came in after the souring market sentiment that helped JPY gather strength as a safe haven. The currency pair dropped below 106 level and extended its slide and reached its lowest since mid-March at 105.67.

The risk-averse market sentiment was boosted by the escalating tensions between the U.S. & China. Last week the U.S. sent a short notice to China to halt its consulate in Houston. In retaliation, China closed the U.S. consulate in Chengdu, and the tensions between the U.S. & China escalated. Besides, U.S. Secretary of State Michael Pompeo asked for an end of “engagement,” a policy that has defined US-China relations for nearly five decades. The policy is considered as the most important foreign policy achievement by China in recent history.

The safe-haven Japanese yen gained traction due to its safe-haven status, causing the USD/JPY pair to move in a downward direction. The U.S. Dollar Index dropped by 0.36% to its lowest level since September 2018 at 94.41 level and made the greenback weak across the board. The weak U.S. dollar weighed on the USD/JPY pair and pushed the pair to its two years lowest level.

Furthermore, the macroeconomic data released on Friday also weighed on the USD/JPY pair when Flash Manufacturing PMI from the U.S. dropped to 51.3 level from the anticipated 52.0 in July. The Flash Services PMI also fell to 49.6 level from the projected 51.0 and weighed on the U.S. dollar. At 19:00 GMT, the New Home Sales in June from the U.S. increased to 776K from the expected 700K.

The decreased PMI data from the U.S. could be attributed to the increased number of coronavirus cases from across the U.S. On Saturday, the U.S. marked the second day with 70,000 plus new instances of coronavirus and deaths more than 1000 in 24 hours. The total number of infections in the U.S. rose to 4.1 M, and the death number reached 145,324.

Next week, the FOMC meeting will remain dovish, and the scope for U.S. Dollars will remain on the downside. This will make investors to short USD positions that will cause further decline in the USD/JPY pair.

Daily Technical Levels

Support Resistance

105.85     106.19

105.70     106.36

105.52     106.52

Pivot Point: 106.03

 USD/JPY – Trading Tips

The USD/JPY trades with a selling bias around 105.526 level, trading within a downward channel that provides an immediate resistance at 106.120. On the lower side, the USD/JPY may find support at 105.375 level, and closing of candles below 105.375 can open further selling bias until 104.850. Overall the pair is forming lowers low and lowers high pattern, which signifies selling sentiment among traders. The RSI and MACD suggest selling signals; for instance, the RSI is holding below 50, and the MACD is staying below 104.866. Today, let’s look for sell trade below 105.800. Good luck! 

Categories
Crypto Market Analysis

Daily Crypto Review, July 24 – Bitcoin Above $10,000; Ethereum Passing $300

The cryptocurrency market spent had quite a bullish weekend. Out of the major cryptocurrencies, Ethereum and Bitcoin broke the strongest barriers. Bitcoin is currently trading for $10,050, which represents an increase of 3.95% on the day. Meanwhile, Ethereum gained 6.42% on the day, while XRP gained 1.04%.

 Daily Crypto Sector Heat Map

When talking about top100 cryptocurrencies, Elrond gained 22.75% on the day, making it the most prominent daily gainer. Status (10.69%) and Terra (9.44%) also did great. On the other hand, Synthetix Network has lost 10.39%, making it the most prominent daily loser. It is followed by Band Protocol’s loss of 6.95% and Aave’s loss of 6.76%.

Top 10 24-hour Performers (Click to enlarge)

Bottom 10 24-hour Performers (Click to enlarge)

Bitcoin’s dominance level decreased slightly since we last reported, with its value currently at 61.51%. This value represents a 0.78% difference to the downside when compared to Friday’s value.

Daily Crypto Market Cap Chart

The cryptocurrency market capitalization skyrocketed and broke the $300 billion mark. Its current value is $300.47 billion, which represents an increase of $13.24 billion when compared to the value it had on Friday.

_______________________________________________________________________

What happened in the past 24 hours?

_______________________________________________________________________

_______________________________________________________________________

Technical analysis

_______________________________________________________________________

Bitcoin

The largest cryptocurrency by market capitalization had an amazing weekend, which ended with it breaking the $10,000 mark. Bitcoin experienced a steady increase in price for six days now, slowly breaking each obstacle in its path. The final move, which broke $10,000, was a bit hectic as the wall of sellers kept the price down for quite a bit. Bitcoin is now held from going up by the ascending resistance level. However, the “battle” for $10,000 is not over yet, as Bitcoin did not make a strong confirmation move.

BTC traders should look for a trade opportunity after BTC decides whether it will move above or below $10,000.

BTC/USD 4-hour Chart

Technical factors:

  • Price is currently above its 50-period EMA and its 21-period EMA
  • Price is above its top B.B.
  • RSI is in the overbought territory (76.57)
  • Volume Increased

Key levels to the upside          Key levels to the downside

1: $10,015                               1: $9,870

2: $10,505                               2: $9,735

3: $10,855                                3: $9,580

Ethereum

Ethereum, just like Bitcoin, made some amazing gains as well as broke major resistance levels over the course of the weekend. The second-largest cryptocurrency by market cap spent the past five days rising sharply towards the upside due to its booming fundamentals. The weekend ended with Ethereum moving past $300 and pushing to $325, with the move still continuing. With the RSI being heavily overbought and volume slowly declining, traders can expect the move to end soon.

Ethereum traders should look for a trade opportunity in Ethereum’s pullbacks from the big move towards the upside.

ETH/USD 4-hour Chart

Technical Factors:

  • Price is above the 50-period EMA and the 21-period EMA
  • Price is above the top B.B.
  • RSI severely overbought (82.86)
  • Extremely high volume

Key levels to the upside          Key levels to the downside

1: $340                                    1: $302

2: $362                                    2: $289

                                                 3: $278

Ripple

The third-largest cryptocurrency by market cap had a good weekend, though not quite as good as Bitcoin and Ethereum. XRP established its position above $0.214, which is a great mid-term indicator. While the initial bullish move got stopped by the $0.227 and XRP started moving towards the downside, the current position XRP is in is quite good.

XRP traders can look for an opportunity within the range XRP is currently trading in.

XRP/USD 4-hour Chart

Technical factors:

  • XRP in a mid-term descending trend (though it broke the trend in the short-term)
  • Price above 21-period and the 50-period EMA
  • Price is below the top B.B.
  • RSI is elevated (64.47)
  • Average/slightly higher than average volume

Key levels to the upside          Key levels to the downside

1: $0.227                                  1: $0.214

2: $0.235                                  2: $0.205

3: $0.245                                 3: $0.2


Categories
Forex Market Analysis

Daily F.X. Analysis, July 24 – Top Trade Setups In Forex – PMI Figures In Highlights!  

The eyes will remain on the PMI figures from Eurozone, the United Kingdom, and the United States on the news. All of the indicators are expected to perform better than before; therefore, buying can be seen in EUR, GBP during European session and selling during the U.S. session.

Economic Events to Watch Today  


EUR/USD – Daily Analysis

The EUR/USD pair was closed at 1.15969 after placing a high of 1.16267 and a low of 1.15401. Overall the movement of the EUR/USD pair remained bullish throughout the day. The EUR/USD pair continued its bullish streak for the 5th consecutive day on Thursday. They rose above 1.1600 level amid E.U. Summit’s success & broad-based U.S. dollar weakness, in the wake of increasing coronavirus cases in the U.S.. However, the gains were limited because of rising safe-haven appeal after the tensions between the U.S. & China escalated over consulate issues.

The Euro continued to benefit from the E.U.’s agreement on a recovery fund worth 750 euro billion. Investors were stocking into Italian bonds as the Eurozone’s third-largest economy was set to benefit from the funds. The safe-haven German bonds also cheered inflows despite potential competition from the upcoming issuance of the European Commission’s mutual debt.

Besides this, the U.S. dollar struggled to gain traction and failed to receive risk-averse inflows. U.S. jobless claims from last week came in as disappointed with an increase to above 1.4M. The hopes for quick U.S. economic recovery vanished and weighed on the U.S. dollar that ultimately raised EUR/USD prices.

The U.S. Dollar Index that measures the U.S. dollar value against the basket of six currencies was down 0.1% near 94.934 after hitting its lowest since March 9. This situarion also helped in the upward trend of the EUR/USD pair on Thursday. However, the positive news related to coronavirus vaccine countered with the headlines of mounting cases and coronavirus-related deaths in America. The U.S. coronavirus cases reached 4 million on Thursday with over 2600 new cases average, the world’s highest rate. The news about vaccine development from all over the world was raising optimism around the market. As earlier this week, Russia claimed that its first vaccine against the coronavirus was ready as two groups of volunteers completed clinical trials with results showing that all of them build up immunity.

On the other hand, Oxford University’s vaccine and China military vaccine also remained under highlights this week. All the vaccine news in the market, though, helped EUR/USD pair but were also overshadowed by the rising number of coronavirus globally.

Meanwhile, the tensions between the U.S. & China escalated after the U.S. ordered to close its consulate in Houston, Texas, on stealing intellectual property. The tensions between the world’s two largest economies escalated and hopes for a halt of the US-China phase one trade deal emerged.

This raised the safe-haven demand and limited the additional gains in EUR/USD pair on Thursday. Meanwhile, the German Gfk Consumer Climate was released on the data front at 11:00 GMT, which came in as -0.3 against the expectations of -4.6 in July and supported Euro, which ultimately added in the EUR/USD pair.

Daily Technical Levels

Support Resistance

1.1548      1.1637

1.1500     1.1676

1.1460     1.1725

Pivot point: 1.1588

EUR/USD– Trading Tip

The EUR/USD has been trading in a bullish channel, which is providing resistance at 1.1629 level. At the moment, the EUR/USD pair is trading at 1.1609 level, and the continuation of a bullish trend can lead to its prices towards 1.1625 level. Further extension of a bullish trend can lead EUR/USD towards 1.1690 level upon the bullish breakout of 1.1625. The pair is holding above 50 EMA that supports a bullish bias. Today we should consider taking buying trades over 1.1565 level.


GBP/USD – Daily Analysis

The GBP/USD pair was closed at 1.27402 after placing a high of 1.27599 and a low of 1.26727. Overall the movement of GBP/USD pair remained flat yet slightly bullish throughout the day. The GBP/USD pair maintained its bullish streak for the 5th consecutive session on Thursday, supported by the weaker U.S. dollar across the board and negative Brexit hopes. However, the pair dropped heavily before posting gains on Thursday, and that fallout was because of the downbeat comments from the MPC member of Bank of England.

The U.S. Dollar Index fell below 95 levels and reached 94.6 level on Thursday, its lowest since March. The greenback’s massive sell-off was further supported by the poor than expected jobless claims data on Thursday. At 17:30 GMT, the Unemployment Claims form the U.S. increased to 1.416M against the projected 1.3M and weighed on the U.S. dollar. The rise in the number of jobless claims resulted from the increasing number of virus cases from the U.S.

The U.S. coronavirus cases extended to 4 million on Thursday with over 2600 new cases average, the highest rate in the world while the death toll in the U.S. reached 143,000. The weak U.S. dollar gave a push to GBP/USD pair prices on Thursday towards higher levels.

On Brexit front, the latest Brexit talks failed to provide any progress in negotiating and provided negative results instead as the U.K. press reported that the U.K. could be willing to leave the E.U. without a deal.

Supporting the statement, E.U.’s top negotiator Michel Barnier also said that a Brexit deal by the end of 2020 was highly unlikely. These statements weighed on the Cable and its pairs like GBP/USD pair that showed a sudden fall in Thursday prices.

Meanwhile, the local nation’s pandemic situation was also alarming as the U.K. government allowed to open Gyms and swimming pools and set the masks mandatory while getting service from takeaway restaurants. This made traders confused as gyms and pools could be more dangerous in spreading the virus.

Lastly, the interest rate setter of Bank of England, Jonathan Haskel, said that he was worried that Britain’s economic recovery from the coronavirus crisis could be slow. He added that the recovery would depend heavily on whether people felt confident to go out.

Haskel, who backed the BoE’s latest 100 billion pound expansion of asset purchases last month, also warned that unemployment could be worse than in the 2008-09 financial crisis. Haskel’s downbeat comments weighed on the Cable and caused the earlier losses of GBP/USD pair. However, the pair GBP/USD managed to end its day with a bullish candle as the dollar was also struggling.

Daily Technical Levels

Support Resistance

1.2689     1.2778

1.2636     1.2814

1.2600     1.2866

Pivot Point: 1.2725

GBP/USD– Trading Tip

The GBPUSD is also holding in an overbought zone, and now it can drop until 1.2685 level, which marks 23.6% Fibonacci retracement below this the next support will be found around 1.2670 level. At the same time, resistance stays at 1.2730 and 1.2760. The RSI and MACD are in the bullish zone, but they form smaller histograms that suggest odds of selling bias in the market. Let’s consider taking buying trade over 1.2740 until 1.2795 level today.


USD/JPY – Daily Analysis

The USD/JPY pair was closed at 106.847 after placing a high of107.228 and a low of 106.709. Overall the movement of the USD/JPY pair remained bearish throughout the day. The U.S. dollar was weakened on Thursday with recovery gains in Europe despite heightened tensions between the U.S. and China.

The U.S. Dollar Index slipped at 94.6 level, which is the lowest level since March. The drop in the U.S. dollar was caused by the fears of slow economic recovery after a resurgence of infected cases in the U.S. and the improved risk sentiment of the market.

The risk-sentiment on Thursday was supported by the improved German Gfk consumer confidence, which suggested that Europe’s largest economy was on the way of its recovery. The confidence was improved after the 27 member states of the E.U. showed consensus on the E.U. stimulus package that will help the region rebuild from the pandemic’s damage.

The improved risk sentiment in the market pushed the EUR/USD pair prices on Thursday. However, risks sentiment remained under stress due to the escalated tensions between U.S. & China amid intellectual property theft. On Thursday, the U.S. ordered China to close its consulate in Houston and accused it of spying. Beijing called this move by the U.S. as “political provocation.”

Mike Pompeo, the U.S. Secretary of State, told that the decision was taken because China was stealing its intellectual property. China’s foreign ministry denounced the move and said that its embassy in Washington was receiving death threats.

The Chinese foreign ministry spokesman said that the reasons given by the U.S. for closing the consulate were unbelievably ridiculous. She urged the U.S. to reverse its erroneous decision, or china would react with firm countermeasures.

In response to China’s anger, the U.S. President Donald Trump provided hints for the closure of more Chinese consulates and fired the heat more. The rising fears of a dispute between the U.S. & China raised a safe-haven appeal. As in result, Japanese Yen gained strength, and the USD/JPY pair dropped.

On the data front, the Japan market was off due to holiday, and the U.S. released its jobless claims for the last week at 17:30 GMT. The data exceeded the anticipation of 1.3M and came in as 1.416 M; the rise in data means that the U.S. economy has a long way to go before starting to recover. This weighed heavily on the U.S. dollar, and hence, the USD/JPY pair declined further.

Daily Technical Levels

Support Resistance

106.64     107.17

106.41     107.47

106.11     107.71

Pivot point: 106.94

 USD/JPY – Trading Tips

The forex market shows some serious selling trend in the USD/JPY as the pair fell to 106.200 while writing this update. The USD/JPY may find support around 106.850 level, which marks the double bottom support on 4 hours timeframe. Boosted safe-haven demand can also trigger more selling until 105.950 and 105.130 level. The RSI and MACD are also supporting selling bias while the resistance will stay at 106.600 level. Let’s consider selling below 106.450 level today. Good luck!