On the news front, we need to keep an eye on Manufacturing and Services PMI figures, which are expected to drive movement in the EUR/USD and EUR/CHF pairs. Besides, the U.S. Flash Manufacturing PMI will be in focus for the precious metal gold.
Economic Events to Watch Today
EUR/USD – Daily Analysis
The EUR/USD prices were closed at 1.12612 after placing a high of 1.12697 and a low of 1.11684. Overall the movement of EUR/USD remained bullish throughout the day. The EUR/USD pair rose on Monday and broke the bearish streak of the previous four days on the back of U.S. dollar broad-based weakness.
The U.S. 10-year Treasury yield fell to 0.676%, its lowest since June 15, this exerted a negative impact on the U.S. dollar and rose EUR/USD pair on Monday. The Wall Street Journal’s main indexes, Dow Jones rose by 0.45%, and Nasdaq rose by 0.80% on increased risk appetite, which eventually weakened the greenback.
The safe-haven demand rose after an increased number of reported infection cases throughout the world, failed to hit EUR/USD pair. The safe-haven rallies were too short-lived that it failed to raise the U.S. dollar; hence, the EUR/USD pair followed its direction.
The EUR/USD gained traction on Monday on the back of E.U. coronavirus measures because Eurozone has been perceived as a region that handled the coronavirus pandemic relatively well than the U.K. and the U.S. as the methods to control the economy from falling by the U.K. and the U.S. have been criticized. Despite the delayed decision on the distribution of the latest fiscal policy of the Eurozone, the pair EUR/USD managed to find its demand based on the fact that the policy will be agreed on by member states eventually.
On the data front, from Eurozone, the Consumer Confidence over the Eurozone economy remained flat with the expectations at -15 for June. From America, the Existing Home Sales in May dropped to 3.91M from the expected 4.15M and weighed on the U.S. dollar. The weak U.S. dollar against the Euro also helped the pair EUR/USD to post gains. The dollar was stronger last week, but due to concerns over the impact of coronavirus over the U.S. economy, the U.S. dollar struggled to hold its ground.
The optimism over the Eurozone handling of the coronavirus pandemic kept the pair EUR/USD pair higher. This also means that if Eurozone outlook became gloomy, then the pair EUR/USD could lose its traction.
On Tuesday, the PMI projections from Eurozone will be released, giving a better idea to investors how well the Eurozone economy was performing in the given pandemic circumstances. If data came disappointing, then the pair EUR/USD would suffer on the back of the Eurozone’s weak outlook, which would eventually raise the appeal for the U.S. dollar as well.
Daily Support and Resistance
- R3 1.1224
- R2 1.1211
- R1 1.1193
Pivot Point 1.1181
- S1 1.1163
- S2 1.1151
- S3 1.1133
EUR/USD– Trading Tip
The EUR/USD is trading in a sideways range of 1.1278 – 1.1250 level. On the higher side, a bullish breakout of 1.1278 can lead EUR/USD prices towards 1.1300 and 1.1325 level. While the bearish breakout of 1.12500 can lead EUR/USD prices towards 1.1230 and 1.1205. Besides, the leading indicators are mixed; for example, the RSI is suggesting a selling bias, while the MACD is indicating a bullish bias. Let us look for buying trades over the 1.1245 level today.
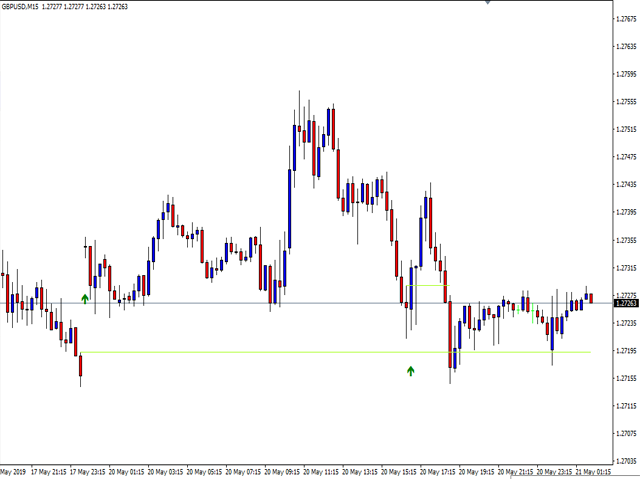
GBP/USD – Daily Analysis
The GBP/USD closed at 1.24699 after placing a high of 1.24768 and a low of 1.23346. Overall the movement of GBP/USD pair remained bullish throughout the day. After posting losses for four consecutive days, GBP/USD pair rose on Monday and recovered all of its previous day’s losses amid U.S. dollar weakness and Brexit hopes.
The latest meeting of PM Boris Johnson with French PM Emmanuel Macron and E.C. President Ursula von der Leyen last week gave some hope to Brexit when the E.U. agreed that the U.K. would not extend the transition period. Both sides reported that the UK-EU trade deal was possible as they pledged to prioritize the Brexit-trade deal.
The optimism after that meeting concerning Brexit has eased the selling pressure on the British Pound. Furthermore, the U.K. government has planned to ease the restrictions concerning COVID-19 included social distancing; it will allow the restaurants and puns to reopen and increase their capacities.
This report also helped the British pound gain traction as reopening restaurants will help the economy get back on track. On the data front, at 15:00 GMT, the CBI Industrial Order Expectations for June came in as -58 against the expected -50 and weighed on British Pound, which eventually exerted pressure on GBP/USD.
On the other hand, at 19:00 GMT, the Existing Home Sales in May were reported as 3.91M against the forecasted 4.15M and weighed on the U.S. dollar, which gave a push to GBP/USD prices on Monday. U.S. dollar opened this week with a softer tone due to decreased hopes of quick U.S. economic recovery after the renewed cases of coronavirus. The market has shifted its viewpoint from the fears of the second wave of coronavirus to the concerns about economic recovery, and this made the U.S. dollar weaker on Monday.
Meanwhile, Japan gave the U.K. just six weeks to strike a post-Brexit deal, if accomplished, it would be one of the fastest trade negotiations in history, along with Britain’s first trade deal in more than 40 years.
Daily Support and Resistance
- R3 1.2378
- R2 1.2369
- R1 1.2357
Pivot Point 1.2348
- S1 1.2337
- S2 1.2327
- S3 1.2316
GBP/USD– Trading Tip
The GBP/USD is trading bullish at a level of 1.2479, holding right above 50 periods of EMA, which is likely to extend support at a level of 1.2445. On the downside, the GBP/USD may find support around the value of around 1.2440, and the continuation of a selling trade can lead Sterling prices to be further lower until 1.2378 level. The MACD and RSI are holding around in a buying zone right now, and the recent formation of a bullish engulfing candle can lead to GBP/USD prices further higher until 1.2511 level.
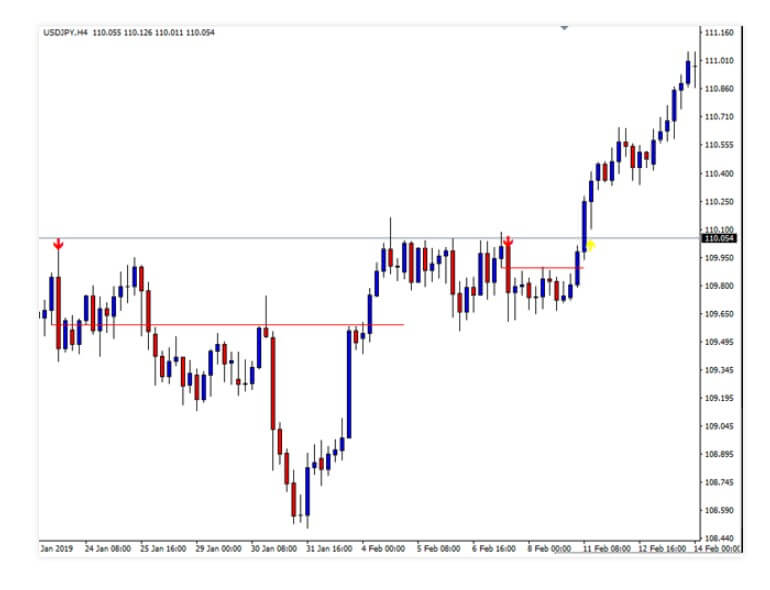
USD/JPY – Daily Analysis
The USD/JPY was closed at 106.899 after placing a high of 107.009 and a low of 106.728. Overall the movement of USD/JPY remained bullish throughout the day. After falling for three consecutive days, USD/JPY pair surged on Monday and posted gains on the back of decreased U.S. dollar strength against Japanese Yen.
The safe-haven currency Japanese Yen was stable due to the rising fears of coronavirus second wave and renewed restrictions in some countries to prevent the virus from spread again. World Health Organization said that 183,000 new cases of coronavirus were reported on Sunday, which indicated the renewed spread of the virus throughout the world. The organization said that the virus was deadly, and there were no signs of virus losing its potency.
This statement gave a surge to safe-haven demand amid rising fears of the second wave of coronavirus, and hence, Japanese Yen gained traction and weighed on USD/JPY pair, and the pair lost some of its daily gains. A large number of increased cases were reported by North & South America, which exerted negative pressure over the outlook of the U.S. economy, and hence, the U.S. dollar remained consolidated on the day. The Federal Reserve officials had already warned that if a pandemic was not brought under control, then the jobless rate could rise again.
However, despite the U.S. dollar weakness and Japanese Yen’s strength, USD/JPY barely moved and remained consolidated mostly in the day. The U.S. Dollar Index, which measures the value of the U.S. Dollar against the basket of six currencies, fell by 0.1% on the day.
On the other hand, E.U. leaders were aiming to reach an agreement before summer break on the attest stimulus package distribution, which they were failed to reach in the last virtual meeting. This time hopefully, they will conduct a physical meeting in July or early August.
The latest stimulus package from E.U. commission in aid to fight against coronavirus pandemic crisis to E.U. members has already given strength to Euro, the rival of the U.S. dollar. It has also weighed on the U.S. dollar a bit, which is why the agreeability of E.U. member states on this package holds importance over the U.S. dollar movement.
However, given the fundamentals & news, everything was against the U.S. dollar, and despite this, USD/JPY pair moved in an upward direction, which indicated that investors took profit from their positions, which caused a surge in USD/JPY prices.
Moreover, some good news from China that it wanted to comply with phase one deal requirements and showed a willingness to buy more U.S. farm products also helped the U.S. dollar to gain its strength back.
Adding to the optimism and USD/JPY gains was the news that Donald Trump held the sanctions on Chinese officials over Uighurs only to pursue a trade deal. He said that a great deal means that he could not impose further sanctions on China as he wanted the phase one deal to complete.
Daily Support and Resistance
- R3 107.13
- R2 107.05
- R1 106.94
Pivot Point 106.85
- S1 106.74
- S2 106.65
- S3 106.54
USD/JPY – Trading Tips
The USD/JPY is trading with a bullish bias at 107.220 level, but the overall trading range of 107.620 – 106.630 remains intact. It failed to break above an immediate resistance level of 107.580. This level is working as resistance for USD/JPY, and the 50 periods EMA is also prolonging strong resistance at 107.200 zones while immediate support lingers nearby 106.600. The USDJPY bearish trend can trigger a sell-off unto the next support level of the 106.017 level today. Let’s wait for the USD/JPY to test the 107.650 level before entering a sell in the USD/JPY.
Good luck!

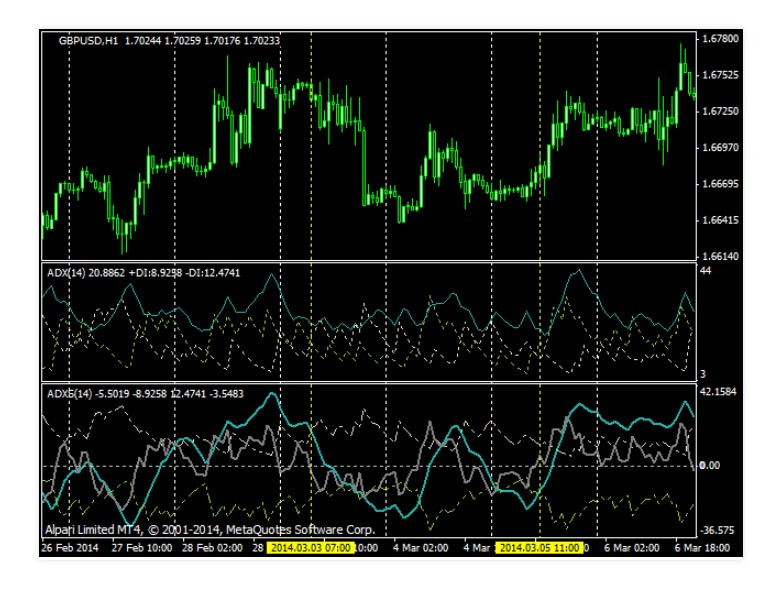
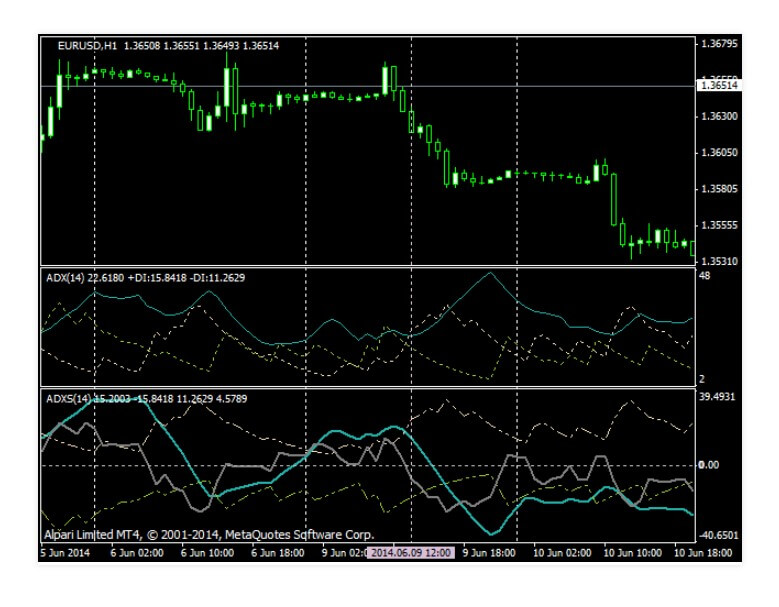
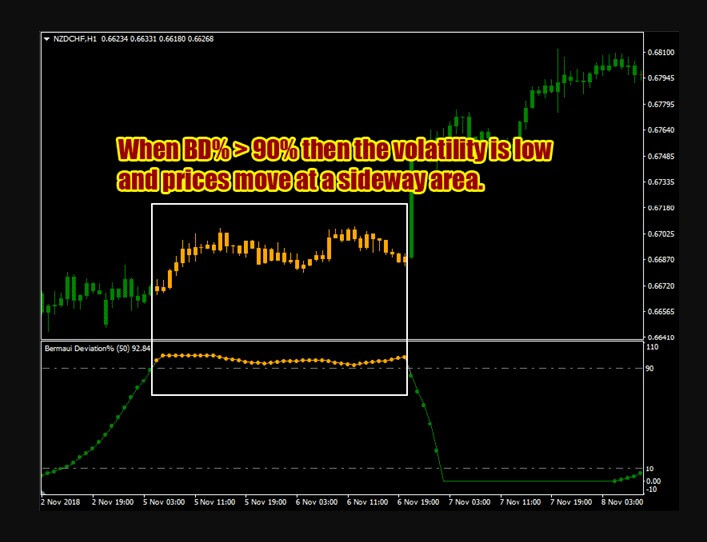
 alculation is based on a moving average of the expansion of an asset’s price range over a given period of time. It is usually used as a calculation period of 14 days. The ADX can be used on any product that is traded on a financial market as shares or currency pairs. The ADX is represented as a line whose values range from 0 to 100. The higher the ADX value, the stronger the price trend. Similarly, low values indicate weak trends or even no trend. The following table represents the commonly used reference values when utilizing this indicator: