Categories
Forex Market Analysis

Daily Review: Gold, EUR/USD, GBP/USD Technical & Fundamental Outlook!

EUR/USD – ECB Strengthens the Single Currency

The ECB persists constructive. Today, it left monetary policy stable, proving its expectation that net asset purchases will stop in December and policy rates will persist at their prevailing levels at least through the summer of 2019. The ECB also broadly affirmed its forecast for GDP and CPI as well as the risks to an extension, with the latter still seen as widely balanced amid rebounding domestic demand. The only concession to the doves was the acknowledgment that uncertainty relating to protectionism, emerging markets and financial market volatility “gained more prominence recently”.

EUR/USD rose 0.45% to $1.1678 following the European Central Bank’s widely expected unchanged rate decision and signs the central bank is committed to ending its bond-buying program. The EUR/USD has come out of the sideways channel and can head to 1.1718. While the support prevails at 1.1665.

GBP/USD Soars On Hawkish BOE

GBP/USD rose 0.50% to $1.3107 $1.3108 as the Bank of England held rates steady but expressed optimism over the U.K. economy, citing both stronger-than-expected second-quarter economic and wage growth. The GBP/USD is facing a strong resistance near 1.3135 and support at 1.3080. The ascending triangle patterns usually violate on the bullish side and that’s exactly what we can expect from the Cable today. The bullish breakout can lead the pair towards 1.3165


Gold Jumps on Weaker Dollar

Gold prices slid on Thursday as investors purchased riskier assets instead of seeking a safe haven in gold, amid hopes for a new round of U.S.-China trade talks. The dollar index declined against a basket of major currencies after data showed U.S. consumer prices increased less than expected in August, paring traders’ outlook that domestic inflation is accelerating.

On the hourly chart, gold has crossed above the significant resistance level of 1198. The immediate resistance can be found at 1209 levels. The leading indicators like RSI crossed above 50, signifying the bullish sentiment of traders. At the moment, 1197 is likely to work as a support.

Categories
Forex Market Analysis

EUR extending higher after Draghi’s speech

NZD/USD


As we already highlighted yesterday, with this kind of clear ending diagonal on the last 5th wave and daily Doji candle confirmation, retrace up was very likely. This is still a highly attractive trade from the risk-reward ratio perspective. This reversal should draw at least 3 legs up. We are staying strong bullish here, with the target at the beginning of the ED.

CHF/JPY


Leading diagonal at the wave 1, nice zig-zag ABC pullback pattern for the wave 2, and we are currently tracking the wave 3, which by the Elliott rules should test our highlighted area on the chart (yellow rectangle) 1,61% of the first wave at least. The alternative scenario is that the wave 3 is already finished and that we are tracking now the wave 5.

AUD/USD


After the ECB meeting, Mario Draghi’s speech, and lower CPI numbers, similarly as EUR/USD, the Aussie bounce up from the support level. We do expect this pullback to extend higher in the next few days, before final downtrend resume.

DXY

&

CPI number at 0,2% today, withdraw the Dollar index down, but we do believe from the EW perspective that we are going to see DXY extending higher above the previous high for the wave B, before final wave C comes out. The alternative scenario is that DXY is already finished with the wave B and that we are tracking now the final leg C. We will wait for confirmation, with the highly required patience.

Categories
Forex Market Analysis

BoE & ECB hold their rates, US CPI to fall off expectations

BoE

The Bank of England kept interest rates on hold on Thursday and highlighted greater financial market concerns about Brexit, a month after raising borrowing costs for only the second time in more than a decade.

“Since the Committee’s previous meeting, there have been indications, most prominently in financial markets, of greater uncertainty about future developments in the (European Union) withdrawal process,” the central bank said.

BoE staff raised their forecast for third-quarter growth to 0.5 percent from 0.4 percent, partly due to stronger consumer spending over an unusually warm summer.

Earlier on Thursday, Governor Mark Carney – whose own term was extended this week until January 2020 to help smooth the post-Brexit transition – briefed May and senior ministers on preparations for a ‘no deal’ Brexit.

Carney warned legislators last week that if Britain left the EU without a trade deal, economic difficulties could squeeze British households’ incomes for years to come.

The central bank said on Thursday that risks to global growth had risen, especially if the United States and China implemented protectionist trade measures.


ECB

The European Central Bank left interest rates on hold Thursday, in a widely anticipated decision, and reiterated that rates will remain unchanged at least through the summer of 2019.

The ECB also repeated that it expects its asset purchase program to end in December after halving it to €15 billion per month starting in October, from €30 billion at present.

The euro zone monetary authority had announced plans to wind up its massive bond purchasing stimulus program at its June meeting.

Here’s the ECB’s growth & inflation forecasts of 2018,2019,2020

ECB growth forecasts:
ECB Sees 2018 Economic Growth at 2% vs. 2.1% in June
ECB Sees 2019 Economic Growth at 1.8% vs. 1.9% in June
ECB Sees 2020 Economic Growth at 1.7% vs. 1.7% in June


ECB inflation forecasts:
ECB Sees 2018 Inflation at 1.7% vs. 1.7% in June
ECB Sees 2019 Inflation at 1.7% vs. 1.7% in June
ECB Sees 2020 Inflation at 1.7% vs. 1.7% in June


US CPI

US consumer price index came steady such as the previous reading at 0.2% but less than expected 0.3% which may put some pressure on the Federal Reserve to gradually raise interest rates.

The U.S. central bank is widely expected to hike interest rates two more times this year, with the next move higher coming at its September 25-26 meeting. but odds for another move in December have decreased with this soft data.

Categories
Forex Market Analysis

Daily: busy day of ECB, BoE, and US CPI


NEWS COMMENTARY


It’s a busy day with two central banks meetings along with the US consumer price index

But as always, starting with the trade war the major issue that moves the markets, China accepted an invitation by the United States to hold a new round of trade talks, raising hopes for a deal easing the tariff war between the world’s two biggest economies.

Chinese Foreign Ministry spokesman Geng Shuang said earlier that Beijing had received the invitation and welcomed it, adding that the two countries were in discussion about the details.

The Trump administration had invited Chinese officials to restart trade negotiations

This comes after President Donald Trump warned last week that there could more trade tariffs against Beijing totaling $267 billion, on top the already $200 billion in tariffs previously announced.


US consumer price is expected to have risen 0.3% last month and 2.8% over the prior year, according to estimates.

The U.S. central bank is widely expected to raise interest rates at its September meeting, but odds for another move in December have decreased in recent days.


The European Central Bank is all but certain to keep interest rates at their current record low levels, making only nuanced changes to its guidance to stay on course to end bond purchases this year and raise interest rates next autumn.

With Thursday’s decision, the ECB’s deposit rate, currently its primary interest rate tool, will remain at -0.40% while the main refinancing rate, which determines the cost of credit in the economy, will remain at 0.0%.


The Bank of England is also expected to hold fire after raising interest rates last month. If all goes as expected, the British central bank will keep rates at 0.75%

Investors will look closely at the breakdown of votes on the nine-member Monetary Policy Committee for further indications on the timing of the next rate increase.

Comments regarding the ongoing Brexit negotiations will also be in focus.

Expectations of another BoE rate hike are only seen in the second half of next year, given Britain’s plans to leave the European Union in March.


Positive data came from the Australian employment change which hiked up to 44.0K higher than expected 16.5K


CHART ANALYSIS


DAX

On the daily chart, we can see that the price had a bearish rally for the past six weeks until it reached the key support zone of 11900.8-11742.4

It’s also the lower side of the descending channel along with 88.6% Fibonacci

The price is technically expected to have its way up back again to the key resistance level 12582.46 which is the top of descending channel and the broken ascending trend


OIL

On the daily chart, the price is moving sideways between the support area 66.2-64.15 and the resistance area 74.45-72.45

After breaking the ascending trend, the price turned back to this support zone with bounce from an ascending trend as shown

The price now is retesting this zone with price action “pin bar”, to have a bullish movement again

So, it’s expected to go up to the resistance zone of 72.45-74.45


NZDJPY

On the daily chart, the pair is facing a punch of support levels

Firstly the key support zone 72.65-72.35, secondly the down side of the descending channel, third the AB=CD harmonic pattern, forth the double bottom reversal pattern, and finally the divergence on RSI

So, the price is supposed to get back up again to the resistance 74.01


CADCHF

On the daily chart, the pair is facing a punch of support levels

Firstly the key support level of 0.732, secondly the ascending trend from the low of 2016, third the Gartley harmonic pattern, forth the wedge reversal pattern, and finally the oversold on RSI

So, the price is supposed to get back up again to the resistance 0.762


Categories
Forex Market Analysis

Daily Review: Gold, EUR/USD, GBP/USD In Focus!

EUR/USD


Fundamental Analysis

The EUR/USD has trimmed lower in the London session and the pair is trading at 1.1576, down 0.20% on the day. Speaking about fundamentals, the Eurozone industrial production faded 0.8%, dropping the estimate of -0.5%. What’s next?


Well, we got the PPI and Core PPI figures from the United States. Both are anticipated to grow to 0.2%  and can support the dollar today. Let’s see how the actual outcome impacts the market.

Technical Analysis

The EUR/USD is trading in a sideways channel which is providing it a nice support at 1.1570 and resistance at 1.1605. The EUR/USD is likely to target 1.1645 upon the bullish breakout, while, the bearish breakout is likely to open further room for selling until 1.1530.


GBP/USD


Fundamental Analysis

The GBP/USD pair fought for a firm course but remained stuck in between tepid gains/minor losses, within a broader trading range through the early European session.  While the pair is relatively range bound as the investors seem to save their shots ahead of the Bank of England’s rate decisions. In today’s market, the intra-day lows hit by the pair could be seen as the impact of investors interests over global trade tensions which supported the safe-haven appeal for the greenback.


Technical Analysis

The GBP/USD has formed an ascending triangle pattern which is providing it a strong resistance near 1.3035 and support at 1.2980. The ascending triangle patterns usually violate on the bullish side and that’s exactly what we can expect from the Cable today. The bullish breakout can lead the pair towards 1.3075.

Gold – XAU/USD


Fundamental Analysis

Earlier today, the gold remained stuck in a narrow trading range as investors worry about a heated trade war between the United States and China. The trade dispute between Washington and Beijing has urged investors to buy the U.S. dollar in the hope that the United States has fewer to lose from the conflict. Overall, the Gold has been stabbed in a $20 price limit over the prior two weeks, with traders seeing for technical breakouts for evidence on further movements.

Technical Analysis

On the hourly chart, gold has crossed above the significant resistance level of 1198. The immediate resistance can be found at 1203 and 1206 levels. The leading indicators like RSI and CMF have crossed above 50, signifying the bullish sentiment of traders. For now, 1197 is likely to work as a support. The U.S. inflation will be in focus tomorrow for further clues on gold’s movement.


Categories
Forex Market Analysis

NZD/USD long – attractive risk-reward ratio potential.

NZD/USD


The bigger picture on NZD/USD is very clear from the Elliott wave perspective. We see nice unfold of 5 waves down, starting from February 2018. The final move could be labelled as an ending diagonal pattern, which showing us a squeezing of the price action, and bear forces weakening, which should be followed by the strong sharp move up or pullback in at least 3 legs up, usually a zig-zag A-B-C pattern. Also, this trade could give us a very attractive risk-reward ratio potential.


DXY


As you can see on the chart, currently we are tracking the A-B-C zig-zag pullback pattern. We have two option, depending on how patient we are. The first one is to buy here with the target above the previous high 95.75 or to wait for this b wave of the A-B-C pattern to be finished in the 50-61% Fibo retracement area, and then to sell DXY with higher profit potential.


USD/CAD


As we expected the pair retraced and currently testing the previous resistance, now support level, which stands around 50% Fibonacci retracement. This is our sweet spot to start buying and building gradually our long position. Sooner or later we will see some sharp moves higher above the previous higher high 1,3226. because this leg should be labeled as a wave 3, which is usually the longest and the strongest.


AUD/USD


The bigger picture on Aussie is clear, the current price action is labelled as a wave 5, the final Elliott wave. On a smaller picture, the situation is a bit tricky, since we do not have yet any confirmation of when and where the pullback will start. So, for now, we should stay in a wait and see mode. We know for sure that the wave 5 must overcome the wave 4, so on a bigger picture we do expect Aussie weakening, but current market does not give us yet the good risk-reward trading opportunity.

Categories
Forex Market Analysis

Consolidation Time

USD/CAD


Recently we have seen a strong and impulsive break above the previous resistance of the channel and now it can become our new support. Currently, we see that the market is ranging, and soon bear forces will come to an end. We are clearly in a pullback, which can represent the second Elliott wave, which ideally should test previous resistance, now support level. The pair can retrace in the area anywhere between 61,8 to 38,2% Fibo retracements, as it is shown on the chart. It’s not about being right; it’s about trading in the direction of the market moves and here we do expect resume of an uptrend above the previous high after this pullback is finished.

Our current suggestion is to buy on a pullback.


DXY


Current price action suggests that we are tracking retrace on Dollar index after 5 waves leg one. We do expect a break above the previous high or the previous wave a, above 95,73. This pullback ideally should finish in the Fibonacci resistance area. Something similar you can see also on a Gold chart. In a longer term we do expect Dollar strengthening, and at the same time, EUR/USD weakening. In the meantime, traders, observe don’t absorb.


AUD/USD


From the Elliott wave theory aspect it is inevitable that we are going to see the breaking of the previous third wave lower low at 0,6850, but of course, any price action is not the only one-way price action, and any moves down is followed by the retrace up. At this point on AUD/USD is better to stay patient, and stay out until we do not see some decent pullback higher, where we could short it for the target of at least a few hundred pips.

Categories
Forex Market Analysis

Daily Review-

USD CAD


Categories
Forex Market Analysis

Daily Review -US-EU Negotiations, Brexit Deal, UK Wages Hike, NAFTA Discussions


NEWS COMMENTARY


Markets stalled on Tuesday as uncertainty over a trade dispute between Washington and Beijing kept investors on edge.

U.S. President Donald Trump wants to impose tariffs on almost all imported Chinese goods .China’s foreign ministry said on Monday that it would respond to any new steps on trade.

.


US Trade Representative Robert Lighthizer just finished a meeting with European Trade Commissioner Cecilia Malmstrom in Brussels yesterday. Malmstrom said in a tweet that “Lighthizer discussed how the EU-US achieves concrete results in the short to medium term towards a free trade agreement.” And they’ll meet again at the end of September.

Lighthizer’s office described the talks as constructive. Also, work would be done in October to identify tariff and non-tariff barriers that could be cut. And trade chiefs of EU and US will follow up in November to finalize certain results.

However, a deal is not likely to be reached as soon as the White House administration would like


The euro rose on Tuesday as easing concerns about Italian debt boosted the single currency for a second day,

The euro was strengthened by a fall in Italian government borrowing costs this week after Economy Minister Giovanni Tria on Monday predicted yields would drop as the government lays out its much-anticipated budget for 2019


More upbeat talk from the EU negotiator sent sterling higher


Barnier said in a forum in Slovenia that “if we are realistic we are able to reach an agreement on the first stage of the negotiation, which is the Brexit treaty, within 6 or 8 weeks.” And, “taking into account the time necessary for the ratification process, the House of Commons on one side, the European Parliament and the Council on the other side … we must reach an agreement before the beginning of November. I think it is possible.”

What enhances the pound further that wages came strong at 2.6% higher than expected 2.4%, so it would be a confidence builder for pound longs


Canada and the US will restart high-level trade talks in Washington today. Whether it’s still NAFTA or not, the two sides reached a deadlock in three key issues, Canadian dairy market access, cultural exemption for Canada and Chapter 19 dispute resolution mechanism. Not much news is released regarding the discussions as both sides agreed not to negotiate in public.

Canadian Prime Minister Justin Trudeau just reiterated yesterday that “we continue to work hard and we are positively optimistic that we can get a win-win-win for all three countries.” Foreign Minister Chrystia Freeland, who’ll be in Washington today, said last week that the negotiation has entered into a “very intense phase” and the officials have been working 24-7.


CHART ANALYSIS


DAX

On the daily chart, we can see that the price had a bearish rally for the past six weeks until it reached the key support zone of 11900.8-11742.4

It’s also the lower side of the descending channel along with 88.6% Fibonacci

The price is technically expected to have its way up back again to the key resistance level 12582.46 which is the top of descending channel and the broken ascending trend


OIL

On the daily chart, the price is moving sideways between the support area 66.2-64.15 and the resistance area 74.45-72.45

After breaking the ascending trend, the price turned back to this support zone with bounce from an ascending trend as shown

The price now is retesting this zone with price action “pin bar”, to have a bullish movement again

So, it’s expected to go up to the resistance zone of 72.45-74.45


CADCHF

On the daily chart, the pair is facing a punch of support levels

Firstly the key support level of 0.732, secondly the ascending trend from the low of 2016, third the Gartley harmonic pattern, forth the wedge reversal pattern, and finally the oversold on RSI

So, the price is supposed to get back up again to the resistance 0.762


CADJPY

On the daily chart, the pair was moving bearish on the last two weeks, down from a strong resistance zone

Until it reached the key support of 83.75, followed by the ascending trend line from the low of 2018

After forming pin bar followed by bullish candle, the price is expected to hike again to the zone 86.15-86.9


Categories
Forex Market Analysis

Daily: Trade Tensions Continue, Non-Farm Payrolls, UK Growth


NEWS COMMENTARY


The U.S. dollar was lower against other currencies on Monday, as trade tensions put expectations for a Federal Reserve rate hike in September under pressure.

trade tensions with China continued, as U.S. President Donald Trump warned he would impose tariffs on $267 billion worth of Chinese imports, on top of an earlier promise of tariffs on $200 billion worth of Chinese goods.

China’s foreign ministry said on Monday that it would “respond to any news steps on trade”.

“If the U.S. side obstinately clings to its course and takes any new tariff measures against China, then the Chinese side will inevitably take countermeasures to resolutely protect our legitimate rights,” Foreign Ministry spokesman Geng Shuang said.

The US index was down despite Friday’s upbeat jobs report increasing expectations of a fed rate hike in at its next meeting September 25-26.

US non farm payrolls were close to expectations but the market is entirely focused on wages and the report showed hourly wages up 0.4% higher than 0.2% expected.

It was a different story in Canada where employment fell  to 51.6K jobs compared to +5.0K expected. Hourly wages there also fell to 2.6% compared to 3.0% previously and 3.5% two months ago

The British economy posted the fastest expansion in nearly a year as the services sector remained powerful  in the three months through July. Growth beat economist estimates to come at 0.6 & with construction output and retail also providing an enhancement. Separate figures showed the trade deficit in goods narrowed to a five-month low of 9.97 billion pounds ($13 billion) in July.


chart analysis


DAX

On the daily chart, we can see that the price had a bearish rally for the past six weeks until it reached the key support zone of 11900.8-11742.4

It’s also the lower side of the descending channel along with 88.6% Fibonacci

The price is technically expected to have its way up back again to the key resistance level 12582.46 which is the top of descending channel and the broken ascending trend


OIL

On the daily chart, the price is moving sideways between the support area 66.2-64.15 and the resistance area 74.45-72.45

After breaking the ascending trend, the price turned back to this support zone with bounce from an ascending trend as shown

The price now is retesting this zone with price action “pin bar”, to have a bullish movement again

So, it’s expected to go up to the resistance zone of 72.45-74.45


CHFJPY

On the daily chart, the pair is facing a punch of resistance levels

Firstly the key resistance 116, secondly the weekly descending line from the high of 2015, third the up side of the ascending channel which is considered as a flag, and finally the overbought on RSI

So, the piece is expected to turn back down to the support 112.8


NZDJPY

On the daily chart, the pair is facing a punch of support levels

Firstly the key support zone 72.65-72.35, secondly the down side of the descending channel, third the AB=CD harmonic pattern, forth the double bottom reversal pattern, and finally the divergence on RSI

So, the price is supposed to get back up again to the resistance 74.01


Categories
Forex Market Analysis

Forex.Academy 2018-2019 Outlook

DXY – One more climb is pending.

During the first half of 2018, Dollar Index found support at 88.25, from where the price made a first bullish impulsive move surpassing the previous high at 90.57; after this movement, DXY made a simple corrective structure as an A-B-C pattern, carrying to a new bullish impulsive move as a “three of three” pattern. For the second half of 2018 and the first half of 2019, we expect the development of a complex corrective structure which could fall between 92.35 to 93.33, from where the Greenback could start to bounce starting a new rally completing an upper degree bullish cycle. The target of the last bullish move is between 96.24 to 97.43. From this area, DXY could start to fall developing a bearish extension of the downward move started on January 2017.


EURUSD – Expecting for a new rally.

Probably the common currency will be the trade for the next year. Since 2017, the pair made a first impulsive wave in upper degree; in the first half of 2018, the euro has been moving bearish correcting as an “A” wave, and now is consolidating as a “B” wave which could find resistance in the area between 1.1859 and 1.1965. For the rest of the 2018 and 2019, we foresee for the EURUSD pair, the completion of the A-B-C pattern, which could end in the zone between 1.1147 and 1.0893. From this area the price could give way to the start of a new bullish wave, or said in other words; we expect a wave three of upper degree, which could drive to the euro to see the 1.40 area.


Categories
Forex Market Analysis

Forex and Indices – Daily Update – 06.08.18


Fundamental Overview


The U.S. Dollar leads the market sentiment.

Monday’s trading session starts with the US Dollar Index gaining 0.21 per cent against the main currencies. The Aussie Dollar dips 0.19 per cent expecting for the Reserve Bank of Australia (RBA) interest rate decision which will take place in the overnight session. The analysts’ consensus does not expect changes in the monetary policy decision which should remain at 1.5 per cent, this despite the inflation (YoY) reached the 2.1 per cent, beating the 2 per cent RBA’s target.

source: tradingeconomics.com


Technical Analysis


EURUSD


The EURUSD pair in the 1-hour chart is moving bearish, below the first daily support located at 1.1547 and the second daily support at 1.1528. For long positions, the price should close above the breakdown candle at 1.1566, with a potential profit target in the first daily resistance at 1.1597. In the short position case, the second daily support breakdown could drive to the confluence between the third daily support and the first weekly support at  1.15015. Consider that this level could act as a potential reversal level.


GBPUSD

The Cable is moving bearish and is the worst performer of the session falling more than 0.5 per cent. The GBPUSD pair is testing the first weekly support at 1.2924. The bearish movement continuation could send the price to the third daily support at 1.28999, consider this level as a potential reversal zone. For bullish positions, the price should break above the breakdown candle at 1.2968 level, with a potential profit target in the daily pivot level at 1.30055.


USDCHF


The Swiss currency, from the past week, has moved bullish in five clear moves, currently is testing the confluence zone between the first weekly resistance and the second daily resistance on the 0.9986 area. A breakout of this level could carry to the price to reach the third daily resistance located at 1.0007 level. In the opposite case, the reversal move from the current zone could drive to fall to the weekly pivot level situated at 0.99238.


EURCAD

After the Friday 03 breakdown candle, the EURCAD cross consolidates between the daily pivot at 1.50490 and near to the first daily support at 1.50113. A breakdown below 1.50113 as a bearish continuation, could pull the price to touch the second daily support located at 1.4967 level. For the contrary, the breakout and close above 1.50490, could lead to the EURCAD to re-test the previous high at 1.51009 level.


EURNZD

EURNZD cross is running slightly bullish inside of an upper degree sideways structure. The price is testing the zone between the weekly pivot and the daily pivot on the range between 1.7166 and 1.7170. For long positions, the price should break and close above 1.7170, with a potential target in the first weekly support at 1.7210. For short positions, the breakdown and close below 1.7133 should drag the price to the second weekly support at 1.70546 level.


FTSE 100

FTSE 100 in the first trading session of the week, is moving in a limited range between 7,635 and 7,679 pts., which could be characterised by the stational August lower volatility. For long positions the price should break above 7,679 pts., and could push to the British index to the HHL level at 7,740 pts. For the contrarian, the selling side should be valued if the price breaks under 7,635 pts., with a potential target in the first daily support located at 7,601 pts.


DAX 30

In the last four hours, DAX 30 is moving below the weekly pivot level, in a range between the 12,541 and 12,615 pts. After the DAX made the “V-Turn” in the first hours of the Monday session, testing the low of the Tuesday 02 session at 12,706 pts., we foresee that this level will be relevant short-term so we need to stalk it. Long positions should be considered as long as the price breaks and close above 12,615, with a potential target on the first weekly resistance at 12,653 pts. For short positions, the German index should breaks under the low of the day at 12,541, with a potential target on the first weekly support at 12,452 pts.


Categories
Forex Market Analysis

Weekly Trading Strategy

Trading Set-Up for the Week

DAX


Without taking a clear direction DAX is still going sideways. Regarding tehcnicals, it is approching the end of the recent weekly triangle it has formed. It should at least approach the top of it, where we may close the position. In terms of fundamentals they should support an upward movement as the corporate results and macroeconomic indicators remain solid.

US Dollar Index


US Dollar Index continues bouncing back and forth. Hence, for now we remain bullish after retesting the monthly bearish trend.

EURUSD


EURUSD continues its clears downtrend and just broke small weeklt support which even confirms strongly the strength of this bearish trend. So that, we remain bearish anbd still hold the short the position.

GBPUSD


GBPUSD drops and we hold the short. Continuies its clear downtrend without any relevant support in the horizon which confirms the long path of this short. For now we keep holding and waiting for the perfect moment to cash out.

USDJPY


After breaking a key monthly bearish down trend USDJPY and then retesting it, it has formed a clear breakout pattern which is taking time to take off. For now, we remain patient and wait for the continuation of the bull trend.

Crude Oil


The huge increase of concerns about inflation has mainly been due to Trump’s proteccionism and high oil prices. As tarde wars lower so has to do oil prices in order to lower concerns about inflation. From the technical side it remaind as clear breakout formation after the retest of the monthly bull trend.


Categories
Forex Market Analysis

Liam Fox gambling on a Brexit No Deal

Liam Fox MP of the Conservative Party and Secretary of State for International Trade says he believes that the odds on a Brexit ‘No Deal’ is now 60/40.

Cable failed to push above 1.30 handle in early European trading and is now down at 1.2964.


Categories
Forex Market Analysis

Let’s Focus on the Real Deal

Weekly Update (August 6th – 10th)

Macroeconomic Outlook

Last week was intense with multiple central banks meetings, corporate results and many macroeconomic indicators. Anyway, the final outcome for the markets was mixed.

  • Good in the USA
  • Regular in Europe
  • Bad in China

Overall, after what has been happening in the last weeks, there will three key factors that will influence in the future.

  1. Protectionism from the USA and its relationship with China

Even though the comments from central banks were hawkish and the corporate results were solid along with the macroeconomic indicators, the protectionism concerns have increased with the last comments on tariffs influencing in a negative way the markets.

Trump commented how they were considering raising the tariffs from an initial 10% to 25% on Chinese goods which are worth around $200B.

–          This was what concerned the markets

–          This kind of news is impossible to anticipate

o   The key is that the tone of the conversation does not get worst

o   If this happens, markets will redirect their attention to the fundamentals will put on the side the trade concerns

  1. The second factor is the technology

There were some concerns regarding the drop from Twitter and Facebook. However regarding the reports from Amazon and Apple too, leads to thinking that what is happening is that the markets are turning more demanding and it is not worried about the valuation models.

  1. The last factor is corporate results

Not only from technology companies but from banks too, which they are turning out to be really positive.

–          Within Europe, UniCredit, Commerzbank, Adidas… will report results this week

And is it is as forecasted, it is expected that markets put aside their concerns about the USA-China relationship and focus more on the current expansive economic cycle and the strong results reported from the companies, retaking the bullish inertias.

Categories
Forex Market Analysis

Forex and Indices – Daily Update – 03.08.18


Fundamental Overview


The U.S. unemployment rate declined to 3.9 per cent in July.

During the Friday trading session, the US Labor Department issued the employment data for July. Non-farm payrolls reached 157,000 new jobs, being lesser than the 190,000 expected by analysts, and was worst than the 248,000 jobs created in June. The unemployment rate for its part fell to 3.9% in July from 4% reported in June by the Labor Department. Despite these data, it is still not possible to reach the level reached in May, which reached 3.8%. Finally, Average Hourly Earnings increased to 0.3% in July from the 0.1% registered in June. The following question is how much will impact the increase in average earnings in the consumer confidence and inflation rate?

source: tradingeconomics.com


Technical Analysis


EURUSD

EURUSD in the 1-hour chart is consolidating between the daily pivot level and the first daily support. For long positions, we need to wait for the close above 1.16, with a profit target in the first daily resistance at 1.1640. Short positions should be valued if the price breaks and close below 1.1580 with a potential profit target in the second weekly support at 1.1544.


GBPUSD

GBPUSD is testing as the support the lower HHL at 1.30103, a consolidation below this level could be a signal for more weakness. For short positions, the price should break and close below 1.30 level with a potential profit target in the lower low of July 19 at 1.2957. For long positions, the price must to break and consolidate above 1.3038 with a potential target in the weekly pivot level at 1.3130.


USDCHF

The USDCHF pair has moved bullish following the triangle pattern as a continuation structure. Currently, the pair is running between the first daily resistance and the daily pivot level. Long positions could be valued if the price breaks above 0.9960, with a potential profit target in the first weekly resistance at 0.9976. For short positions, the price must close under the daily pivot level at 0.9941, with a potential profit target in the confluence between the second daily support and the first weekly support at 0.99.


EURAUD


EURAUD is moving sideways between 1.5724 and 1.5782. Currently, the cross is testing the lower base of the range. A breakdown could drive to the EURAUD drop to the first weekly support at 1.5673. In the bullish scenario, the price could reach the second daily resistance at 1.5818.


GBPAUD

GBPAUD is moving sideways testing the base of the lateral channel in the same way that EURAUD. The breakdown could trigger more falls with a potential target in the second weekly support at 1.7572. For the bullish case, the breakout above 1.7690 could lead the price to the potential profit in the daily pivot level at 1.7720.


FTSE 100

The British index FTSE 100 is consolidating in the confluence zone between the second daily support and second weekly support. For short positions, the price should break below 7,551 pts., with a potential profit target in the third weekly support at 7,516 pts. For the reversal case, long positions should be valued if the price breaks above 7,590 pts, with a potential target in the next swing zone at 7,661 pts.


DAX 30

The DAX 30 is consolidating below the third daily support. In this case, it is highly probable that the price makes a reversal move, at least, to the first daily support located at 12,684 pts. For short positions, the price should close below 12,485 pts, with a potential target in the second weekly support at 12,348 pts.


Categories
Forex Market Analysis

Forex and Indices – Daily Update 02.08.18


Fundamental Overview


In today’s session, market sentiment is led by the preference of risk protection assets facing the expectation for the US employment data, which will be announced on the Friday 03rd session. The US Dollar and Japanese Yen, which advanced 0.30% and 0.30% respectively. Within the commodity currencies group, the oceanic currencies are the hardest hit; the New Zealand Dollar is the worst performer which falls 0.49%, followed by the Australian dollar that drops 0.45% in the trading session.

Source: Forex Academy Collection


Technical Analysis


EURUSD

EURUSD in the 1-hour chart is moving bearish, below the weekly pivot level. For short positions, the price should break under the 1.1657 level with a profit target in the confluence zone between the first weekly support and the Lower HHL at 1.16061 level. For long positions (reversal case), the price should break above the breakdown candle at 1.1691, with a profit target between the confluence zone between the first weekly resistance and the Upper HHL at 1.1729.


GBPUSD

The pair GBPUSD is moving slightly bearish below the weekly pivot consolidating between 1.3090 and 1.3140. A breakdown below 1.309 could drive to the pound to the first weekly support at 1.3050. The bullish case, if the price breaks above 1.3140, the potential target is the first weekly resistance located at 1.3189.


USDCHF

USDCHF in the hourly chart is consolidating as a triangle pattern; this chart pattern suggests more upsides. For long positions, is essential that the price breaks above the weekly pivot level at 0.9937, with a profit target at the third daily resistance at 0.9974. Short positions should be valued if the price breaks under 0.9917, the potential target is the HHL at 0.9880.


EURGBP

The EURGBP cross is running bearish and is consolidating as a flag pattern. For bearish continuation, the price could drop to the confluence zone between the second daily support and the first weekly support at 0.8860. For long positions, the price should break above the weekly pivot level at 0.8897 with a potential move to the HHL at 0.8928.


GBPNZD

The GBPNZD cross is running sideways with a bullish bias in the last sequence which started from the first weekly support at 1.76318. For long positions, the price should break above the first daily resistance with a mid-term target placed on the confluence between the second weekly resistance and the third daily resistance at 1.7864. Short positions should be valued if the price closes below the daily pivot level at 1.77059, and the potential target is at the first weekly support at 1.76318.


DAX 30

DAX 30 is moving slightly neutral in the weekly pivot level at 12,746 pts. For short positions, the price should break below 12,707 with a potential target in the first weekly support at 12,604 pts. Long positions should be regarded if the German index closes above 12,800 pts, with a potential profit target at 12,920 pts.


FTSE 100

The FTSE 100 index shows bearish signals closing below the weekly pivot level at 7,687.9 pts. Continuation of the previous bearish move should be valued if the price breaks under the first weekly pivot at 7,635.2 pts., with a profit target in the confluence zone between the HHL and the third weekly support at 7,521 pts. Long positions could be valued if the price breaks above the weekly pivot level, with a potential target in the first weekly resistance at 7,754 pts. Additionally, note that if the price plunges to the third weekly support, it could be an interesting reversal level.


Categories
Forex Market Analysis

Technical Setup

DAX


DAX is reacging the end of the monthly triangle. As it tops the upper resistance we’ll close the position, which we expect to happen in the upcoming weeks. After that, we’ll watch closely in which direction the breakout happens and wether we take a long or short position. For now we hold.

US Dollar Index


After breaking the bearish trendline, US Dollar Index has rebounced twice from it. Withou clear direction it has been going sidelines fo weeks. For now we hold unless something extradiordinary happens.

EURUSD


After movig sideways for weeks it has formed a short-term trinagle that is due to create a breakout movement. For no we hold awating for a string movement to be formed. In case it goes above we close the posiiton with small profits. In the other case of breaking below it we would hold the position.

GBPUSD


After GBPUSD broke a strong monthly support it continues to have a clear path for more downwards movements to come. For now has paused and we keep holding with expectations of a continuation of the bearish trend.

USDJPY 


First USDJPY did a bullish breakout after breaking the monthly resistance. Now, it has gone down until it retested it which just confirmed the upcoming bullish movement. It is still a good time to open a new position and increase exposure to this trade. For now we hold both positions until next notice.

Crude Oil


USOIL broke the bullish trend and right after that, it has just confirmed the upcoming bearish trend through the recent retest. This movement gives more security and confidence to this trade that we’ll leave open for now.

Categories
Forex Market Analysis

FOMC statement, Canadian growth, New Zealand data


news commentary


The meeting of the Federal Reserve’s will be the least surprising. They just raised interest rates in June; we know that the Fed probably won’t make any changes this month. However, the Fed will announce further tightening which is required because the labour market is healthy and economic activity is expanding at a solid rate. Inflation is on the rise, manufacturing and service-sector activity is accelerating so there’s no reason to postpone their plan to tighten again.

The weaker-than-expected Japan economic data are giving the bond prices a push higher. That movement has been triggered by the Bank of Japan decision to hold interest rate policy unchanged. While adding forward guidance that would maintain low-interest rates for an extended period. They also cut its inflation forecast.


Sources said that the White House was about to set higher tariffs on $200 billion in Chinese imports, maybe igniting a new round of trade conflicts.

Reports claim that President Donald Trump is thinking of putting tariffs of 25%, instead of 10%, in a statement that may come early on Wednesday.


Stronger-than-expected Canadian GDP growth led the Canadian dollar higher for the third day in a row. Besides Canada’s economy grew 0.5% in May


The New Zealand dollar failed to have a little breath because business confidence weakened, which followed by a decline in Q2 employment report.


chart analysis


US INDEX

On the daily chart, the price has bounced from the red resistance zone for the third time to shape the reversal triple top.

Price has recently formed another reversal pattern to assure the bearish bias with the wedge.

Followed by a break beneath an ascending trend on RSI, the index is settled down at the ascending trend line, if it’s broken, the price will have its way back to the support zone 93.2-92.6


AUD/USD

On the daily chart, the pair reached back the green support zone again to shape a double top pattern

Followed by divergence on RSI, our bullish view is still the same: if the price manages to still above the support area and the key level 0.7455, it will be heading towards the combination of levels of descending trend, ascending channel and resistance zone at 0.7655-0.774.


NZD/USD

On the daily chart, the price retested the green support zone 0.675-0.6695, followed by divergence in RSI.

An AB=CD harmonic pattern has been shaped to reinforce the bounce.

If the price could break above the key level at 0.6845, the price will be supposed to head back to the top of the descending channel with the resistance zone at 0.697-0.703 only if it manages to hold above the green zone


USD/CAD

On the daily chart,  the price has broken main support areas, as it closed beneath the key support 1.309, and beneath the ascending trend line

A wedge has been shaped and successfully confirmed after breaking it, besides a GARTLEY harmonic pattern to assure the bearish momentum

Followed by divergence on RSI, the price is expected to reach the next support 1.289


USD/JPY

On the daily chart, the price is located at a good long-buy position according to the support of 111.3, the retest of the broken descending trend, 23.6% Fibonacci level and the ascending channel.

Followed by engulfing candle, the price is expected to go further  back to the level 113.15


Categories
Forex Market Analysis

CHF/JPY reaches main support levels

Main scenario:

The pair had reversed from the key resistance at 113.05 which was the top of the ascending channel & 50% Fibonacci level

The price successfully went down to reach the support 111.3, along with the upper side of the ascending channel

The resistance 111.9 is crucial level, if the price closes above it, we may see the price hiking to 113.05 again


Alternative scenario:

If the price couldn’t break through that resistance and closes beneath the support 111.3, a possible bearish momentum would take place to the next support at 110.3


Entry:

The price is about to form an engulfing candle, but we will have to wait for a break above the 111.3 level to secure the entry


Stop loss:

As long as the 111.3 level was a stable support, it will be the appropriate stop loss.


Take profit:

The red resistance zone of 112.55-113.05 was the last area that stopped the price, so we can make them our first and second targets


Trade duration:

It’s considered as a swing trade, so patience and consistency are needed.


Warning level:

If the support & ascending channel are broken, I would consider closing the trade as it may have more bearish momentum then.


Categories
Forex Market Analysis

More Results to Come, More Growth for the Markets

Weekly Macroeconomic Outlook (30th July – 3th August)

Last week was a really positive week for the markets.

  • Firstly, because of the Junker – Trump meeting
  • Strong quarterly results and macroeconomics inidcators
    • Mostly the American GDP which reached the 4.1% growth
  • Also, there was the ECB meeting where it was confirmed what it was previously stated in the previous meeting
    • No modifications
      • However, it gave a soft message and reiterated the importance of an accommodative monetary policy

This week, probably we’ll have again a positive tone in the markets.

  • As trade wars concerns have reduced
  • Furthermore it is a really intense week in terms of:
    • Quarterly results
    • Macroeconomic Indicators
    • Central Banks Meetings
  • Regarding corporate results, there are still a lot of companies left to publish
    • Apple, Tesla, BNP Paribas…
    • So far, in United States, 245 companies have already published
      • The average growth in EPS has been around 23% and 86% of the companies have break expectations
    • Moving to Central Banks, this week is going to be really intense too
      • 1st reference will be the FED with no modifications expected
        • Around mid-July Powell stated that two more rises in interest rates are expected in September and December in 2018 and three more in 2019
      • 2nd reference is the RBI (Reserve Bank of India) which, in this case, could really rise interest rates to 6.5%
        • It would be the second rise this year
      • 3rd reference is the BOE which is forecasted to rise the interest rates to 0.75%
        • Important to bear in mind that inflation has peaked to 2.4% and labour costs have also increased
      • 4rd reference is the Central Bank of Japan which is expected to continue with the same monetary policy however it can give a  harder message in terms of future expectations
    • Finally, it is also a very intense week in macroeconomic indicators
      • Forecasted results are rather positive

Wrapping all these factors up, it is expected a bullish week in the markets, especially indexes. Markets look good after a reduction in concerns on trade wars and protectionism plus solid quarterly results and macroeconomic indicators.


Categories
Forex Elliott Wave Forex Market Analysis

Divergence between Gasoline and Crude Oil

A divergence between Gasoline and Crude Oil

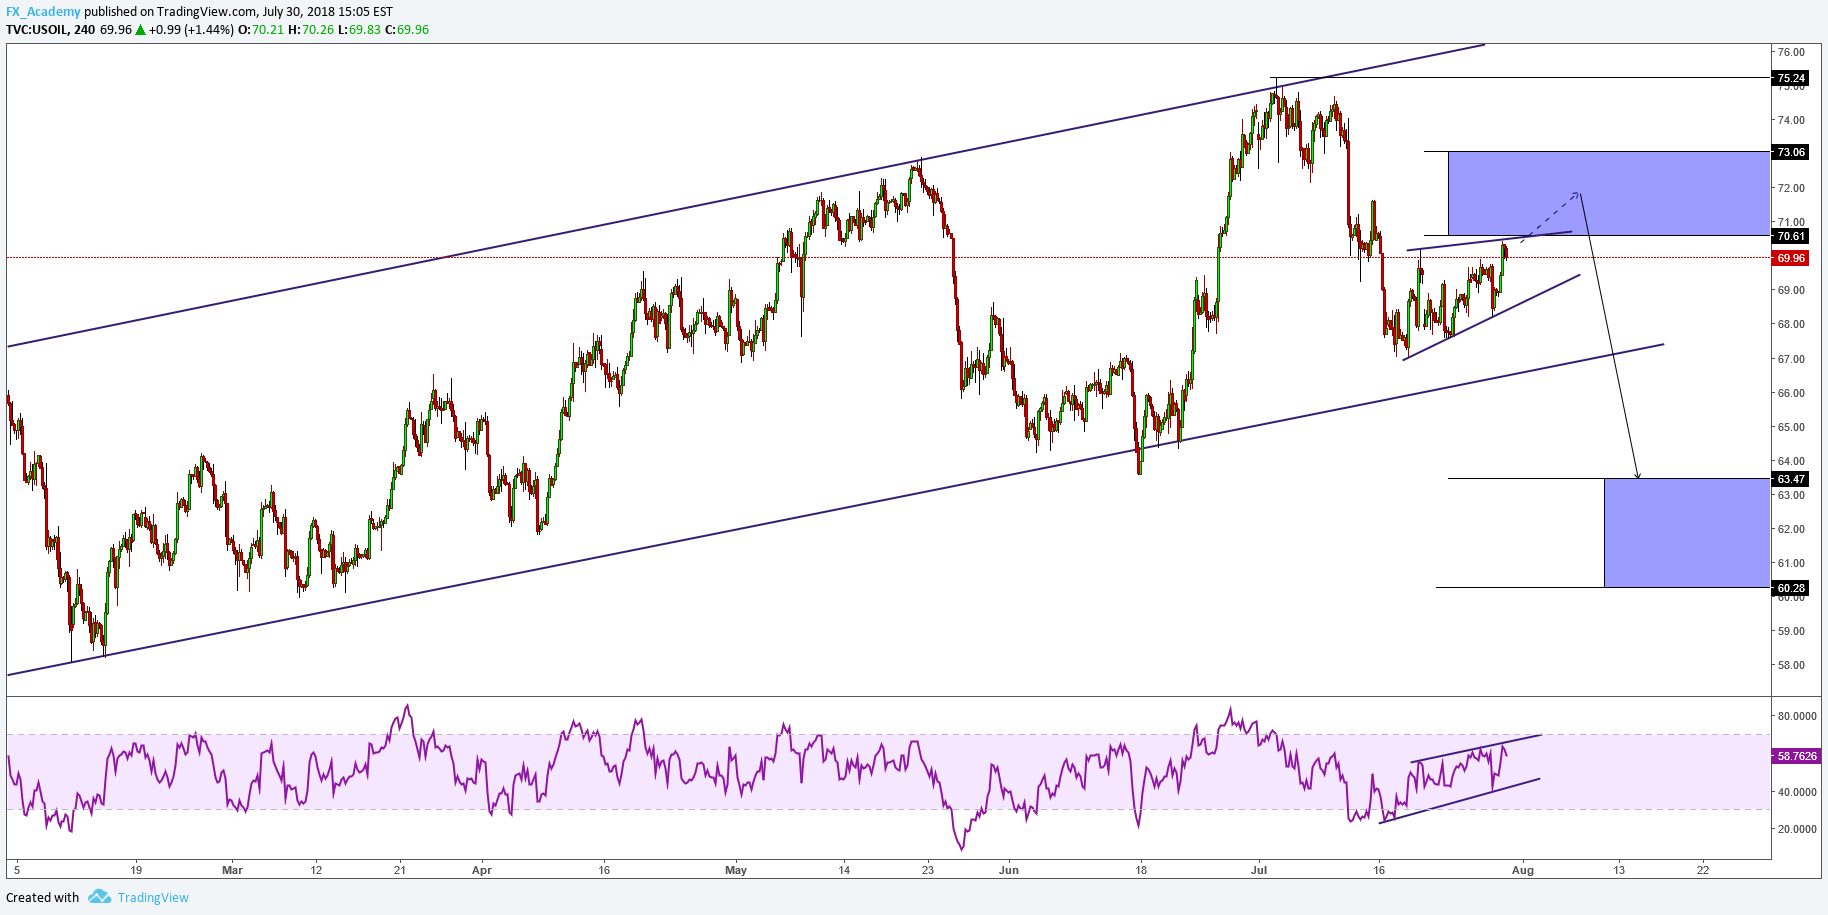
Gasoline and Crude Oil are two energy commodities highly correlated. In the current session, Gasoline is moving bearish, but Crude Oil is moving bullish. We expect that Crude Oil would make a new lower high and continue inside the area between $70.61 to $73.06 to, then, develop a new bearish leg, with a target the zone between $63.47 to $60.28. Invalidation level is $75.24.


Forex Academy

Categories
Forex Market Analysis

Central Banks meetings, China conditions to negotiate


news commentary


At the beginning of the week, investors have something of the calm before the storm as they brace for monetary events risk.

The Bank of Japan is expected to hold rates unchanged on Tuesday, the BoJ may carry the most influence when it announces its latest monetary policy decision. This is because several reports have indicated that the central bank is considering a decrease in its stimulus program.  a shift in this policy will not only lead to a spike in Japanese bond yields but it will also have a global effect that will lead to further tightening in credit conditions. However, the latest inflation report indicates that the BoJ might not make any significant changes on this front and will instead try to calm markets.

The Federal Reserve is also likely to leave rates unmoved when it announces its decision on Wednesday, with economists saying that recent comments from President Donald Trump will have no impact on policy and the Fed will continue sending the message that more rate hikes are on the way.

On Thursday, the Bank of England is expected to raise rates for the first time since November, But according to the recent fall in inflation and continued Brexit uncertainty, they might deliver a hike and hint that it’s the only one expected for 2018.


On another hand, Chinese Foreign Minister Wang Yi said his country would be willing to resume trade negotiations with the U.S. if the Trump administration “took a less combative” approach to talks.

President Trump said on Twitter yesterday that he would be willing to ‘shut down’ the government if Democrats do not support funding plans for his wall along the border with Mexico. The tweet came after a meeting last week in the White House between Trump, House Speaker Paul Ryan and Senate Majority Leader Mitch McConnell to discuss how to avoid an Oct. 1 shutdown, a month before elections that will determine control of Congress.


chart analysis


US INDEX

On the daily chart, the price has bounced from the red resistance zone for the third time to shape the reversal triple top.

Price has recently formed another reversal pattern to assure the bearish bias with the wedge.

Followed by a break beneath an ascending trend on RSI, the index is settled down at the ascending trend line, if it’s broken, the price will have its way back to the support zone 93.2-92.6


AUD/USD

On the daily chart, the pair reached back the green support zone again to shape a double top pattern

Followed by divergence on RSI, our bullish view is still the same: if the price manages to still above the support area and the key level 0.7455, it will be heading towards the combination of levels of descending trend, ascending channel and resistance zone at 0.7655-0.774.


NZD/USD

On the daily chart, the price retested the green support zone 0.675-0.6695, followed by divergence in RSI.

An AB=CD harmonic pattern has been shaped to reinforce the bounce.

If the price could break above the key level at 0.6845, the price will be supposed to head back to the top of the descending channel with the resistance zone at 0.697-0.703 only if it manages to hold above the green zone


USD/CAD

On the daily chart,  the price has broken main support areas, as it closed beneath the key support 1.309, and beneath the ascending trend line

A wedge has been shaped and successfully confirmed after breaking it, besides a GARTLEY harmonic pattern to assure the bearish momentum

Followed by divergence on RSI, the price is expected to reach the next support 1.289


USD/JPY

On the daily chart, the price is located at a good long-buy position according to the support of 111.3, the retest of the broken descending trend, 23.6% Fibonacci level and the ascending channel.

All these factors may boost the price further to go back to the level 113.15 and more if the price witnesses a suitable price action from these levels.


Categories
Forex Market Analysis

Where for the US Dollar this week?

Where for the US Dollar this week?

We have a possible interest rate hike for the Pound later this week and so we can expect GBPUSD to take a bid tone. There are talks and expectations that NAFTA talks will get ramped up with the Mexican government hinting of an early conclusion, in which case we can expect to see a bid tone in the Peso and Canadian Dollar. The Japanese Yen was firming against the Dollar at the time of writing due to a good June number in Retail Sales.

With the Australian and New Zealand Dollar looking to continue their upward move against the USD from Friday and with the above in mind we should expect a softer US Dollar at least until late in the day BST on Thursday


Categories
Forex Market Analysis

Forex and Indices – Daily Update 26.07.18


Fundamental Overview


Forex News: The market sentiment of the session was led by the US Dollar (DXY), which advanced against the main currencies group climbing 0.68 per cent. The Dollar boost was aided on the one hand, by the labour market data, in the Thursday session the Initial Jobless Claims data rose 217,000, which despite the increase of 9,000 from the previous week’s revised level, continue showing optimistic levels for the American economy. On the other hand, the ECB interest rate decision continues without changes for the common currency, contributing to the strength in the USD appreciation. The worst performer currency of the session was in the “commodities currencies group”; the Aussie (AUD) fell 1.04 per cent dragged by the dive in Copper price which retraced 1.59 per cent.

Forex News – Daily Performance

Forex News - Daily PerformanceSource: Forex.Academy Collection.


Technical Analysis


EURUSD

EURUSD made a false breakout which could not reach the first daily resistance, turning to the daily pivot and even falling below the weekly pivot point changing the market sentiment from bullish to bearish. For long positions, we need to see the breakout above the bearish breakdown candle at 1.1710, with a first potential profit target placed at the first daily resistance at 1.1756, the second potential target is the confluence level between the second daily resistance and the first weekly resistance at 1.1785. Short positions should be valued as a continuation of the breakdown, with a profit potential target at 1.1615. Pay attention to this area because the confluence with the third daily resistance at 1.16077 could be a potential buy zone.


GBPUSD

The GBPUSD pair in the 30-minutes chart tested the first daily resistance of the intraday trading session at 1.3214, After this, the price made a re-test, from where the pound started to fall and found support in the weekly pivot point at 1.31257. For long positions, the price should break over the daily pivot level at 1.31739 with a potential profit target at 1.3215 (first intraday resistance). Short positions should be valued as the continuation of the previous movement when the price breaks under the weekly pivot level (1.31257) with a potential target in second daily support at 1.31065.


USDCHF

The Swiss currency in the 30-minutes chart continues moving sideways between the first daily support (0.99007) and below the first daily resistance (0.9942). For long positions, the USDCHF should break above the first daily resistance at 0.9942 level with a short-term target at 0.9960 (weekly pivot level); for bearish positions, we need to see that the price to close below the intraday range at 0.9910 with a potential profit target in 0.9877 (first weekly support.)


EURCAD

The EURCAD cross in the 30-minutes chart is moving bearish, testing the second weekly support located at 1.52488. For bullish positions, the price should break and consolidate above 1.5278 with a potential target is at the first weekly support at 1.5325. For bearish positions, as a continuation of the trend, the price could drop to the third weekly support at 1.51778.


GBPCAD

The GBPAUD cross is moving bearish nearly above the first weekly support at 1.71211. For long positions, the price should breakdown candle at 1.7185 with a potential target on the daily pivot level at 1.7232. If we are looking bearish continuation, the price could see the bottom at the 1.70067 level (confluence zone between the third daily support and second weekly support.)


FTSE 100

FTSE 100 in the 30-minutes chart is moving in a narrow range below the daily pivot level (7,669.8 pts) and above the weekly pivot level (7,649 pts.) For bullish positions, the price should break above 7,686 pts, with a potential target on the first weekly resistance at 7,735 pts, which is the convergence zone with the second daily resistance. Bearish positions should be considered if FTSE 100 index breaks below the weekly pivot level at 7,649 with a potential profit target at the first weekly support (7,593 pts.), the second profit target is the HHL at 7,521 pts.


DAX 30

The DAX index 30 in the 30-minutes chart soared to the third daily resistance (12,827 pts), from this zone we have two options. Long positions could extend to the second weekly resistance at 12,912 pts, only if the price breaks above the 12,827 pts. The second option is for short trades; it could be considered if the price breaks below 12,715 pts with a profit target located at 12,604 pts.


Categories
Forex Market Analysis

Forex and Indices – Daily Update – 25.07.18


Fundamental Overview


President Trump will meet with Juncker.

US President Donald Trump will meet with the president of the European Commission, Jean-Claude Juncker, in an attempt to overcome the difficulties in bilateral relations between the United States and the European Union, specifically facing the application of additional tariffs to European cars exported to the United States which Trump seeks to increase.

The European Union applies additional 10 per cent tariffs to automobiles imported from the United States, while the United States applies only 2.5 per cent to European cars. Finally, President Trump commented on his Twitter account that both the United States and the European Union should eliminate all tariffs, barriers and subsidies, making trade between them both more just.


Technical Analysis


Forex Trading Indicators

EURUSD

Forex Trading Indicators: EURUSD continue moving sideways but with an intraday bullish bias. The price continues bouncing from the daily pivot at 1.1684. For intraday positions, long positions should be considered if the price breaks above 1.1710, with a potential profit target placed at the second resistance at 1.1747 and the second potential target in the area between the third daily resistance (1.1777) and the first weekly resistance (1.1785). Short positions should be valued if the pair breaks down the weekly pivot level at 1.1680 with a profit potential target at 1.1615.


GBPUSD

Forex Trading Indicators: The GBPUSD pair, as seen on a 30-minutes chart, broke up and consolidated above the first daily resistance on Tuesday 24th’s trading session. In the current session, the price can not strike above the first intraday resistance (1.3178.) For long positions, the price should break over 1.3175 with a potential profit target at 1.3212 (second intraday resistance). Short positions could be valued when the price breaks under 1.3140 with a potential target in first daily support at 1.3090.


USDCHF

Forex Trading Indicators: The USDCHF pair in the 30-minutes chart is moving sideways between the daily pivot (0.9937) and slightly below the first intraday support (0.9915). For long positions, the Swiss currency should break above the daily pivot level with a short-term target at 0.9960 (weekly pivot level); for bearish continuation, we need to see a price close below the intraday range at 0.9914, the potential profit target is at 0.9887 (third daily support).


EURAUD

Forex Trading Indicators: The EURAUD cross in the 30-minutes chart is testing the confluence between the daily and weekly pivot point at 1.5778. For bullish positions, the price should break above 1.58, and the potential target is at the first intraday resistance (1.5829). Bearish positions should be considered if the cross breaks under 1.5717 with a profit target in the confluence zone between the first weekly support (1.56735) and the second daily support (1.56612).


GBPAUD

Forex Trading Indicators: The GBPAUD cross is running sideways between 1.7680 and 1.7794. For long positions, the price should break above 1.7778, and its potential target is slightly above the first weekly resistance at 1.7858. In the case of short positions, the price should break down 1.7680, with a potential target at 1.7589 level.


FTSE 100

Forex Trading Indicators: The FTSE 100 in the 30-minutes chart turned bearish moving from the daily pivot at 7,699 to the weekly pivot level (7,649.9). For bullish positions, the price should break above 7,700 pts, with a potential target at 7,791 pts, which is the convergence zone between the second weekly resistance level and the second daily resistance. Bearish positions should be valued if the British index breaks under the weekly pivot level at 7,649 with a potential profit at the first weekly support (7,593 pts.), the second profit target is the HHL at 7,521 pts.


DAX 30

Forex Trading Indicators: DAX 30 in the 30 minutes chart. After failing the test to the first weekly resistance (12,737.1 pts.), the German index moves bearish below the daily and weekly pivot level turning to bearish the market sentiment. For long positions, we need to see the breakout above 12,600 pts with a potential target in the re-test of the first weekly resistance at 12,737 pts. A short position is considered if the price breaks down 12,537, and its potential target is the second weekly support at 12,293 pts with extension in the HHL at 12,143 pts.


Categories
Forex Market Analysis

Daily market update: Trump to meet with European Commission President, NAFTA negotiations, Australian CPI


news commentary


Investors are somehow cautious ahead of a meeting between U.S. President Donald Trump and European Commission President Jean-Claude Juncker at the White House this afternoon.

The meeting comes after strict trade tensions between the European Union and the United States.

Trump has already slapped tariffs before on steel and aluminum imports from the EU and has threatened to extend those decisions to the European auto sector.

“The European Union is coming to Washington tomorrow to negotiate a deal on Trade. I have an idea for them. Both the U.S. and the E.U. drop all Tariffs, Barriers and Subsidies! That would finally be called Free Market and Fair Trade! Hope they do it, we are ready – but they won’t”. Trump tweeted


On the other hand, negotiations for a new North America Free Trade Agreement (NAFTA) will be restarted after stalling ahead of Mexico’s presidential election on July 1. Canadian Foreign Affairs Minister Chrystia Freeland will discuss progress in Mexico today with both the incoming and outgoing administrations, while Mexican Economy Minister Ildefonso Guajardo will be in Washington tomorrow to meet with U.S. Trade Representative Robert Lighthizer. Gaping differences are expected to be resolved, including car-trade rules and a sunset clause that would kill the deal after five years.


Earlier, the Australian CPI came as expected with 0.4% along with the trimmed mean CPI with 0.5%; investors were expecting any rise in inflation to get any clue of when the RBA may raise the rates


chart analysis


US INDEX

On the daily chart, the price has bounced from the red resistance zone for the third time to shape the reversal triple top.

Price has recently formed another reversal pattern to assure the bearish bias with the wedge.

Followed by a break beneath an ascending trend on RSI, the index is settled down at the ascending trend line, if it’s broken, the price will have its way back to the support zone 93.2-92.6


AUD/USD

On the daily chart, the pair reached back the green support zone again to shape a double top pattern

Followed by divergence on RSI, our bullish view is still the same: if the price manages to still above the support area and the key level 0.7455, it will be heading towards the combination of levels of descending trend, ascending channel and resistance zone at 0.7655-0.774.


NZD/USD

On the daily chart, the price retested the green support zone 0.675-0.6695, followed by divergence in RSI.

An AB=CD harmonic pattern has been shaped to reinforce the bounce.

If the price could break above the key level at 0.6845, the price will be supposed to head back to the top of the descending channel with the resistance zone at 0.697-0.703 only if it manages to hold above the green zone


AUD/JPY

On the daily chart, as we expected, the price has bounced from the red resistance zone at 83.9-85.95 with engulfing bar

The price is expected to continue its reverse to keep going in its sideways movement to the support zone 81.2-80.5


Categories
Forex Market Analysis

Daily Market Update: EU Data Remains Stable, PBoC Efforts to Support Yuan


 News Commentary


European data was still steady even after sentiment remained cautious with flash services PMI data easing slightly with 54.4, less than expected of 55.0. Meanwhile flash manufacturing PMI came positive with 55.1, more than expected of 54.7.


The Japanese yen cut most of its gains frustrating expectations about the Bank of Japan starting a fresh round of stimulus at its scheduled policy meeting next week.

Japan’s central bank is discussing changes to its interest-rate targets and stock-buying techniques, sending bond yields and the yen rocketing higher on Monday.


Risk appetite was mostly stable across markets after Beijing vowed to pursue a more ‘vigorous’ financial policy, stepping up efforts to support growth among growing economic struggle conditions.


 Chart Analysis


US INDEX

On the daily chart, the price has bounced from the red resistance zone for the third time to shape the reversal triple top.

Price has recently formed another reversal pattern to assure the bearish bias with the wedge.

Followed by a break beneath an ascending trend on RSI, the index is settled down at the ascending trend line, if it’s broken, the price will move its way back to the support zone 93.2-92.6.


USD/JPY

The pair had broken before the key level at 111.3 along with a descending trend line from the high of 2015, to reach the resistance of 113.15 to then bounce from there as a retracement.

Now, the price is located at a good long-buy position according to;- the support of 111.3, the retest of the broken descending trend, 23.6% Fibonacci level and the ascending channel.

All these factors may boost the price further to go back to the level 113.15 and more if the price witnesses a suitable price action from these levels.


AUD/USD

On the daily chart, the pair reached back the green support zone again to shape a double top pattern.

Followed by divergence on RSI, our bullish view is still the same: if the price manages to stay above the support area and the key level 0.7455, it will be heading towards the combination of levels of descending trend, ascending channel and resistance zone at 0.7655-0.774.


NZD/USD

On the daily chart, the price retested the green support zone 0.675-0.6695, followed by divergence in RSI.

An AB=CD harmonic pattern has been shaped to reinforce the bounce.

If the price could break above the key level at 0.6845, the price will be supposed to head back to the top of the descending channel with the resistance zone at 0.697-0.703 only if it manages to hold above the green zone.


AUD/JPY

On the daily chart, as we expected, the price has bounced from the red resistance zone at 83.9-85.95 with an engulfing bar.

The price is expected to continue its reversal to keep going in its sideways movement to the support zone 81.2-80.5.


CHF/JPY

On the daily chart, as we expected, the price has bounced according to the key levels that the price has recently reached the resistance zone at 112.85-113.05, reversal wedge, moving average 200 and 50% Fibonacci.

Followed by AB=CD harmonic pattern, if the price could break beneath the key level 111.9, the price is expected to go down to 111.9 then 110.3.


Categories
Forex Market Analysis

Forex and Indices – Daily Update – 24.07.18


Fundamental Overview


Mixed data of preliminary PMI in the Eurozone.

The Flash Purchase Managers Index (PMI) data in July show signs that this third quarter for the eurozone has begun to lose the buoyant momentum that registered during the first half of the year. Manufacturing PMI modestly reached 55.1 points, slightly higher than the 54.9 points reached in June. In the opposite side, Services PMI index fell to 54.4 points from the 55.2 points reported in June. The slowdown in growth momentum suggests that similar levels could be seen in August.


source: tradingeconomics.com

The main cause of this deceleration could be attributed to the fuels price increase of oil as well as the increase in tariffs on steel and aluminium.


source: tradingeconomics.com


Forex and Indices Technical Analysis


EURUSD

The EURUSD in 30-minutes chart continues consolidating. The price is moving above the weekly pivot suggesting a bullish pressure for the pair. Long positions should be considered if the price breaks above 1.1710, with a potential profit target placed at 1.1775. Short positions should be valued if the pair breaks down 1.1667 with a profit target at 1.1615


GBPUSD

The GBPUSD in the 30-minutes chart is consolidating the Friday 20th rally. For long positions, the price must break above 1.3137 with a potential profit target at 1.3208. Short positions should be considered if the price breaks under 1.3085 with a potential target at 1.3022.


USDCHF

The pair USDCHF in the 30-minutes chart is developing a bullish retrace of the previous sell-off. For bullish positions, the next resistance is 0.996; for bearish continuation, the critical support to break down is 0.9922, and the potential profit target is at 0.9887.


EURCHF

The EURCHF cross in the 30-minutes chart is testing resistance with the 200-period moving average which is converging with the first daily resistance. For long positions, we need to see the breakout of the 1.1629 level with a potential target at 1.165 (Weekly Pivot Zone). In the bearish side, the price should break under 1.1603 level, with a potential profit target at 1.1582.


GBPCHF

The GBPCHF cross is turning bullish after the 1.3049 level breakout. Long positions have the potential target at 1.3117, coinciding with the third daily resistance. On the short side, the price should break down 1.3001 level, with a potential target at 1.2965 level.


FTSE 100

FTSE 100 in the 30-minutes chart shows that the price is moving above 24 and 200 moving average. Also, the British index has bounced from the weekly pivot level, the next resistance es at 7,728. For bullish continuation, the next target is 7,786 pts, which is the convergence between the second weekly resistance level and the third daily resistance.


DAX 30

DAX 30 in the 30 minutes chart shows that the price has surpassed the third daily resistance without to make a reversal move to the daily pivot level, it suggests that the German index should continue with the bullish bias with a target placed at 12,855 pts (previous resistances confluence area.)


Check out Forex and Indices technical analysis for July 16, 2018.

Categories
Forex Market Analysis

Daily market update: Trump politics affect the dollar, BoJ may change its policy


news commentary


The dollar continued lower today after US President Trump made comments on Friday about critical of Federal Reserve monetary policy. US presidents traditionally do not comment on moves by the Fed, but that did not prevent Trump from tweeting on Thursday that “tightening now hurts all that we have done.”

This made investors hold their long positions for the dollar as it’s also followed by Trump attack to the EU and China for manipulating their currencies and holding interest rates lower. This has raised concerns that the current global trade war could be followed by a currency war.

Concerns about geopolitics returned again after U.S. President warned Iranian President Hassan Rouhani in a late Sunday evening post on Twitter to “never ever threaten” the U.S. again or else “suffer consequences”.

The tweet came hours after Rouhani told Trump that hostile policies toward Tehran could lead to “the mother of all wars.”


On the other hand, there’re reports claim that the bank of Japan was weighing moves to scale back its large monetary stimulus ignited a short rally in the Japanese currency.

The Bank of Japan facing very low inflation, is in active discussions with changes to its interest-rate targets and stock-buying techniques. Expectations the central bank may uncover some measures at its next monetary policy meeting on July 30 and 31 sent bond yields and the yen rallying


chart analysis


US INDEX

On the daily chart, the price has bounced from the red resistance zone for the third time to shape the reversal triple top.

Price has recently formed another reversal pattern to assure the bearish bias with the wedge.

Followed by a break beneath an ascending trend on RSI, the index is settled down at the ascending trend line,  it’s broken, the price will have its way back to the support zone 93.2-92.6


AUD/USD

On the daily chart, the pair reached back the green support zone again to shape a double top pattern

Followed by divergence on RSI, our bullish view is still the same: if the price manages to still above the support area and the key level 0.7455, it will be heading towards the combination of levels of descending trend, ascending channel and resistance zone at 0.7655-0.774.


NZD/USD

On the daily chart, the price retested the green support zone 0.675-0.6695, followed by divergence in RSI.

An AB=CD harmonic pattern has been shaped to reinforce the bounce.

If the price could break above the key level at 0.6845, the price will be supposed to head back to the top of the descending channel with the resistance zone at 0.697-0.703 only if it manages to hold above the green zone


AUD/JPY

On the daily chart, as we expected, the price has bounced from the red resistance zone at 83.9-85.95 with engulfing bar

The price is expected to continue its reverse to keep going in its sideways movement to the support zone 81.2-80.5


CHF/JPY

On the daily chart, as we expected, the price has bounced according to the key levels that the price has recently reached the resistance zone at 112.85-113.05, reversal wedge, moving average 200 and 50% Fibonacci.

Followed by AB=CD harmonic pattern, if the price could break beneath the key level 111.9, the price will be expected to go down to 111.9 then 110.3


Categories
Forex Market Analysis

European Union and Japan Sign a Trade Deal – Forex and Indices – Daily Update – 17.07.18


Fundamental Overview


European Union and Japan sign a trade deal

Financial Market Updates: Japan and the European Union signed a trade deal amid uncertainty generated by the protectionist policy led by the Trump Administration. The trade deal creates the largest open economic area. The agreement promises to eliminate 99 per cent of tariffs.


Technical Analysis


EURUSD

Today the EURUSD pair failed the bullish continuation, remaining in the consolidation range, it suggests that the pair should continue with the previous bearish cycle. In consequence, we update our bias from a bullish to a bearish move. The potential sell zone (PSZ) is between 1.1760 and 1.1807 with a bearish target placed at 1.1293. Invalidation level is 1.1852.


GBPUSD

As noticed in previous Daily Updates, the GBPUSD pair in a 2-hour chart is moving sideways, the short-term pivot level at 1.3275 has failed, in consequence, GBPUSD should make a new lower low. The Pound could fall to the area between 1.3024 and 1.2885, completing a major degree bearish cycle. Invalidation level is at 1.3472.


USDCHF

The complex corrective structure that is developing the USDCHF pair in the 2-hour chart shows a signal more for a bullish continuation than a downward reversal move. In the last session, the Swiss currency tested and bounced from the potential buy zone. We foresee USDCHF making a new higher high with the target placed in the area between 1.0112 and 1.0141. Invalidation level is at 0.9857.


EURJPY

The EURJPY cross in the 2-hour chart is moving bullish in an ascending wedge; the price tested the exhaustion zone between 132.01 and 133.05, from where we expect a bearish reversal move as a bull trap. We foresee drops to the area between 129.87 to 129.28. Consider that if the price makes a bull trap after this, it is highly likely that the price will make a bullish failure pattern.


GBPJPY

The GBPJPY cross in the 2-hour chart is making a consolidation pattern after a bullish impulsive move, which could make fresh highs to the area between 150 and 150.70. Our vision for the cross is that the price could make a limited low to the 146.2 level before it continues its previous bullish trend. Invalidation level is 143.799.


FTSE 100

As commented in previous Daily Update, FTSE 100 in the 2-hour chart continues consolidating between 7,720 pts and 7,550 pts. We maintain our bias as neutral in FTSE 100 index.


DAX 30

DAX 30 in the 2-hour chart soared above the 12,600 pts and is near to reaching the exhaustion zone at 12,695 pts. The next control level is 12,807 pts which could drive to 13,020 pts, completing an internal bullish cycle. Invalidation level of the bullish cycle is 12,104 pts.


Categories
Forex Market Analysis

Strong Results, Markets Up

Macroeconomic Update – Weekly Outlook (July 23 – 27)

It is expected from the markets to follow the results from the quarterly reports.

–          This week, one-third of the companies from the S&P500 is expected to report results.

Some assumptions should be considered:

  1. Results should be strong
  • led by the energy sector with a 20% growth with sales representing 8%
  • Oil companies, due to increase in oil prices, add almost 3 points of inter-annual growth
  • Industrials and technology should be solid too, with an estimated growth of over 20% and 30% respectively
  1. Even though results themselves are strong, the impact of the tax reform will prolong this strength two quarters more until next year, when results will start to normalize.
  2. Even at a global level, it will not be as high, in Europe, results will grow by 7.5% and in Emerging Markets by 15%.
  • In Europe, even though results were downgraded by 2%, the effect of a strong US Dollar can generate some surprise.

Thus, hopefully this will put trade wars in the background. Although, it is hard with what measure Tump will come up it is forecasted to reach an agreement before November.

  • Also, the measure taken by Trump to start using the oil reserves will lower oil prices that will reduce inflation concerns, creating a positive impact

Hence, recommendation for the week and summer period, with the Eurostoxx trading in a range of 400 points it will be key to pay attention during the next weeks in case the index approached the bottom of this range when it will create some investing opportunity.

Categories
Forex Market Analysis

Macro & Fundamentals 1st, Trade Deals 2nd

Macroeconomic Update – Weekly Outlook (July 23 – 27)

Markets closed with positive returns since they had a positive start due to the strong quarterly results reported by companies along with the optimistic tine by Powell, president of the Fed.

  • However, it started losing momentum as Trump stated he was considering in implementing new tariffs to Chinese goods increasing the concerns on trade wars and protectionism

o   This also led to the Yuan to depreciate to new low levels

So, this contrast between a solid earnings report from companies and the tension between commercial policies will guide the markets next week.

  • Starting with the macroeconomic indicators, they are forecasted to have a positive tone this week.

o    Among the main indicators in Europe, PMI & IFO are expected to be lower than the previous months but will hold in good levels

  • On Thursday, it will be the meeting of the ECB which is expected just be transition meeting confirming the end of the conventional program of asset purchases at the end of 2018
  • Regarding the United States

o   On Friday, GDP of the second quarter will be released which is expected to reach 4%

  • Hence, this acceleration will confirm the expansive cycle
  • Another fact that should support the markets is the quarterly results making this week possibly the year

o   180 companies are reporting earnings this week, and the outlook is positive

  • So far, regarding the ones that already have reported, have averaged a earnings growth of 20,8%, slightly above expectations

Due to these strong fundamentals both from the macro perspective and from the earnings report, trade tensions could be placed in the background.

  • Nevertheless, on Wednesday Yunker and Trump are meeting.

o   Yunker will meet with some proposals regarding the trade deals and tariffs on automobiles

o    It will provide some hints on what is the outlook regarding the trade deals of United States with the rest

Hence, it is a week to be patient and hold the long positions in the markets since the macro and fundamentals remain strong and positive.

Categories
Forex Market Analysis

Deep in Technicals

Weekly Technical Outlook

US Dollar Index


After retesting the bearish trend line it broke previously, US Dollar Index just confirmed upward trend. Hence, for now we leave our long position open in order to capture it.

DAX


DAX, as the rest of Europe, has been moving sideways recently. However, fundamentals and macroeconomic indicators remain solid and the end of the triangle it has been involved in is approaching. For now, we leave the position open looking forward to capture the movement within the triangle. After the breakout and a revision of the fundamentals another position will be taken.

GBPUSD


GBPUSD remains with the same outlook as previous weeks so for now remain bearish looking forward to capturing the rest of the downward trend.

EURUSD


Without a clear path EURUSD has been recently hanging within the same range. Patience is the key in this trade and there is nothing to but wait to for the bearish trend to continue.

USDJPY


After breaking a strong monthly bearish trend, it has recently reversed creating a correction. For now we remain bullish and waiting for the resets which, in that case, will confirm the breakout and the continuation of the bullish trend.

US Oil


After the breakout and retest of the support trend line along with Trump increasing its use of American oil reserves lead to the opening of a short position on Crude Oil. We’ll remain focus on this trade and updated with all the macro news.


Categories
Forex Market Analysis

Daily Market Update: Trump Comments on Rate Hikes, Japan & Canada CPI


News Commentary


The dollar reversed against the currency basket on Thursday after U.S. President Trump said he was “not happy” about the Federal Reserve rate hikes but the downside was limited amid optimism over the U.S. economy.

“I’m not happy about it,” President Donald Trump said about interest-rate increases during an interview with CNBC Thursday, claiming that “higher rates put the United States at a disadvantage.” Trump insisted, but, he also sees that “Fed do what they feel is best.”

However, Powell earlier this week said gradual interest rate hikes would be “the best way forward” for the economy, citing stronger labour markets, and inflation that had met the Fed’s 2% objective.


The US and China are continuing a full-blown trade war. The People’s Bank of China (PBOC) is increasingly favouring a weaker Yuan after setting the Yuan reference rate at 6.7671 versus previous day’s fix of 6.7066.


The Japanese Yen started Friday’s trading session slightly affected by the release of local inflation data. June’s national CPI was 0.7%, lower than forecasts of 0.8% and in line with May’s result. However, the Yen may rise as trade war tensions may increase risk aversion.


All eyes will be on Canadian CPI at 12:30 GMT with a forecast of 0.1% such as with June’s reading. Traders will follow the result to get any conclusion about soon rates hike.


 Chart Analysis


US INDEX

On the daily chart, the price has bounced from the red resistance zone for the third time to shape the reversal triple top.

The price has recently formed another reversal pattern to assure the bearish bias with the wedge.

Followed by a break beneath an ascending trend on RSI, the index is supposed to move its way back to the support zone of 93.2-92.6.


AUD/USD

On the daily chart, the pair went back to the green support zone again to shape a double top pattern.

Followed by divergence in RSI, our bullish view is still the same: if the price manages to still be above the support area, it will be heading towards the combination of levels of the descending trend, ascending channel and resistance zone at 0.7655-0.774.


NZD/USD

On the daily chart, the price retested the green support zone 0.675-0.6695, followed by divergence in RSI.

An AB=CD harmonic pattern has been shaped to reinforce the bounce.

The price is supposed to head back to the top of the descending channel with the resistance zone at 0.697-0.703, but only if it manages to hold above the green zone.


AUD/JPY

On the daily chart, as we expected, the price has bounced from the red resistance zone at 83.9-85.95 with engulfing bar.

The price is expected to continue its reverse to keep going in its sideways movement to the support zone 81.2-80.5.


CHF/JPY

On the daily chart, it’s obvious to recognise by the key levels that the price has recently reached the resistance zone at 112.85-113.05, reversal wedge, moving average 200 and 50% Fibonacci.

Followed by AB=CD harmonic pattern, the price is expected to go down to 111.9 then 110.3


Categories
Forex Market Analysis

Daily Market Update: Upbeat Data From Australia, UK CPI, Powell Set To Be Hawkish Again


 News Commentary


Fed Chairman Jerome Powell supported the Dollar by bullish comments, which affirmed expectations about the central bank’s possible interest rate moves this year.

In Congressional testimony on Tuesday and Wednesday, Powell said he believed the United States was in steady growth for years, and carefully played down the risks to the U.S. economy of an escalating trade conflict.

U.S. President Donald Trump’s top economic advisor, Larry Kudlow, said that he believed Chinese President Xi Jinping has blocked any progress on a deal to end the duelling in U.S. and Chinese tariffs.

“China could end U.S. tariffs by providing a more satisfactory approach” and “taking steps that other countries are also calling for”, Kudlow said.


The U.K. was pulled down yesterday on weak inflation data, with the CPI reading 2.4%, less than the expectation of 2.6%, causing market expectations for a BoE August rate hike to ease slightly from 77% to 68%


Earlier, the Australian economy added 50.9K jobs in June, better than the estimated forecast of 16.7K
More importantly, the full-time jobs rose by 41.2 K following a 20.6K drop registered in May. Meanwhile, the jobless rate came in at a seasonally adjusted rate of 5.4% as expected.


 Chart Analysis


US INDEX

On the daily chart, the price has returned to the red resistance zone with shaping before the reversal double top.

The price has formed another reversal pattern to assure the bearish bias with the wedge.

Followed by a break beneath an ascending trend on RSI, the index is supposed to make its way back to the support zone 93.2-92.6


AUD/USD

On the daily chart, the pair bounced back from the resistance 0.7455 to retest the green support zone again.

Followed by divergence on RSI, our bullish view is still the same: Heading towards the combination of levels of descending trend, ascending channel and resistance zone at 0.7655-0.774.


NZD/USD

On the daily chart, the price retested the green support zone 0.682-0.6775, followed by divergence in RSI.

An AB=CD harmonic pattern has been shaped to reinforce the bounce.

The price is supposed to head back to the top of the descending channel with the resistance zone at 0.697-0.703.


USD/CAD

On the daily chart, the price reached the support of 1.3085 with the ascending trend line from the low of April.

On the other hand, the price has shaped a GARTLEY harmonic pattern with a reversal wedge, bouncing from the 78.6% Fibonacci level, followed by a divergence in RSI.

So, If the price breaks above the resistance 1.3225, it would head back to 1.34.

If it breaks beneath the wedge and the support of 1.3085, it would head back to 1.289.


AUD/JPY

On the daily chart, as we expected before, the price has reached the red resistance zone at 83.9-85.95.

It’s a crucial area that if the price bounces back from, it will continue its sideways movement to the support zone 81.2-80.5.

If the price breaks above it, it will head new levels to the next resistance zone 85.5-85.95.


Categories
Forex Market Analysis

Daily Market Update: Fed Chair Powel To Testify, New Zealand CPI


 News Commentary


The dollar eased on Tuesday due to congressional testimony by Federal Reserve Chairman Jerome Powell which traders will examine for clues on the pace of U.S. interest rate rises and risks emanating from trade conflicts.

Powell will testify on the economy and monetary policy before the U.S. Senate Banking Committee at 14:00 GMT

He is expected to deliver an optimistic message on the outlook for growth and reassure the FED’s gradual monetary tightening policy but could face tough questions on how the FED would deal with an escalation in the global trade war.

Powell is supposed to begin two days of testimony on the economy and monetary policy later Tuesday when he appears before the U.S. Senate Banking Committee in Washington.


The NZ Q2 CPI data arrived at 0.4%, slightly lower than the 0.5% expected. The year on year data arrived as 1.5 % vs the expected 1.6%

Also, the UK average earning index came in as expected at 2.5%, the unemployment rate was stable with previous reading at 4.2%


 Chart Analysis


US INDEX

On the daily chart, the price has returned to the red resistance zone with shaping before the reversal double top.

The price has formed another reversal pattern to assure the bearish bias with the wedge.

Followed by a break beneath an ascending trend on RSI, the index is supposed to have its way back to the support zone 93.2-92.6.


AUD/USD

On the daily chart, the pair bounced back from the resistance 0.7455, to retest the green support zone again.

Followed by divergence on RSI, our bullish view is still the same: Heading towards the combination of levels of descending trend, ascending channel and resistance zone at 0.7655-0.774.


NZD/USD

On the daily chart, the price retested the green support zone 0.682-0.6775, followed by divergence in RSI.

An AB=CD harmonic pattern has been shaped to reinforce the bounce.

The price is supposed to head back to the top of the descending channel with the resistance zone at 0.697-0.703.


AUD/JPY

On the daily chart, as we expected before, the price has reached the red resistance zone at 83.9-85.95.

It’s a crucial area that if the price bounces back from, it will continue its sideways movement to the support zone 81.2-80.5.

If the price breaks above it, it will head new levels to the next resistance zone 85.5-85.95.


Categories
Forex Market Analysis

Forex and Indices Daily Update – 16.07.18


Forex Fundamental Analysis


New Zealand CPI (YoY) increase 1.5 per cent in June.

The yearly inflation change in New Zealand increased by 1.5 per cent, below the 1.6 per cent foreseen by analysts and advance from the 1.1 per cent reported in April. Housing and household utilities advanced 3.1 per cent, followed by rentals which were up 2.5. The climb in oil prices, almost 10 per cent, boosted the transport sector to increase the CPI (YoY) 2.0 per cent.


source: tradingeconomics.com


 Technical Market Analysis


EURUSD

In the last session, EURUSD surpassed the Short-term Pivot Level at 1.1690. Now we expect a consolidation structure as a flag pattern before it continues increasing the bullish momentum to the target area at 1.19067. Invalidation level is 1.15080.


GBPUSD

The GBPUSD pair is still moving sideways in the 2-hour chart, testing the Short-term Pivot Level at 1.3275. The breakout of this level should activate the bullish continuation with a target placed in the 1.3475 zone. Invalidation level of the new bullish cycle is 1.30494.


USDCHF

The bearish move after the bull trap looks like a first bearish impulse. From now we should expect a retrace in three waves, probably to the 1.0009 area before it continues with another decline. In the long term, the USDCHF is bullish, in consequence, we will maintain neutral for this pair expecting opportunities to go long with the main trend.


EURNZD

The EURNZD cross in the 2-hour chart has broken down the ascending short-term trendline at 1.7248 with a bearish high momentum candle. We expect more drops with a target placed at the psychological level of 1.70. Invalidation level is at 1.73782.


GBPNZD

The GBPNZD cross in the 2-hour chart has broken down the ascending trendline as the same way that the EURNZD has. This suggests that we should see more strength in the NZD group against the other currencies. The first target is at 1.92393 from where we could see an exhaustion of the bearish cycle. Invalidation level is at 1.95802.


FTSE 100

The FTSE 100 in the 2-hour chart continues to consolidate, developing a complex corrective structure. In terms of the traditional Technical Analysis, the structure could be a Diamond Pattern, if this is correct, we should see declines to the 7,400 area, if the falls extend, the next bearish target area could be 7,100 pts zone. We prefer to maintain neutral expecting for long positions.


DAX 30

DAX 30 in the 2-hour chart still is moving below the 12,600 pivot level. We can consider two scenarios: the first one is after the 12,600 level breakout to expect more climbs to the area between 12,695 to 12,742. The second one is if the price breaks down, the bearish target could be 12,040 pts. In the same way that in the FTSE, our position changes from bullish to neutral expecting long positions.


Categories
Forex Market Analysis

Weekly Technical Overview

US Dollar Index


US Dollar Index is resuming its bullish trend. Nevertheless, even though it has left behind many resistances now it is facing a horizontal resistance that will decide whether it creates a double top or breaks it and continues its run. For now, we wait to see its reaction the following week.


EURUSD


EURUSD has been moving sideways recently, mostly due to the uncertainty of the trade war between China and USA. However, in the upcoming days it should resume its bearish trend without any support ahead in the near term.


DAX


After weeks of moving sideways and without a clear direction, both fundamentals and technicals give positive reasons to be bullish at the indexes. Not only that the macroeconomic figures are forecasted to be strong but so are the quarterly results from both European and American corporations. Hence, we reopen a bullish position looking to profit the upcoming bull market.


GBPUSD 


GBPUSD is beginning the bearish trend we were waiting for. However, there is still a long way to go until it reaches the profit target. It can either resume the bearish trend or start moving sideways due to uncertainty. The next few weeks will be key to watch what happens both fundamentally and technically. For now, we remain bearish.


USDJPY


After weeks of waiting for the breakout, it is finally confirmed. Open positions have been opened waiting for the continuation of the bullish trend. It can either continue or do a retest which will eventually lead to a stronger confirmation of the breakout and the beginning of a bull run.


US Oil


Between resistances and supports there is not a clear path for oil prices apart from the many fundamental variables surrounding it. For now remain neutral awaiting a clear signal.


Categories
Forex Market Analysis

Bring the Quarterly Results In

Weekly Update (July 16th – 20th)

Macroeconomic Outlook

Among all the uncertain variables that have been defining the markets, which are protectionism, oil and politics, I would like to focus on oil.

  • In the last days, oil prices have fallen 5%
    • This has had really good repercussions, both in the micro and macroeconomy
      • From the macro view
        • The July CIP will not be under pressure that much and we will see whether it approaches the 2% target by Central banks
      • From the micro view
        • Lower energy costs will represent an increase in the profit per share
      • Therefore, these three variables have lost intensity and the immediate conclusion is that it is positive for the markets. In the short term

In the short term, two new variables surge,

  • On one hand, quarterly results
    • Throughout this week more quarterly results of 72 companies will be released in the USA and corporate results are expected to increase by 21%
    • At the same time, in 2019 and 2020, the growth figures are around 10%
      • In the end, indexes replicate the increase of corporate results
    • Regarding Europe, growth will be more modest
      • 2018 – 9%
      • 2019 / 2019 – 8%
        • In general, corporate results will sustain growth
      • On the other hand, employment volume is expected to decrease a little until the 15th of August
        • After that date, the bullish path will be resumed
      • As a conclusion, these two variables will influence the markets in a positive way

Moving to this week, there are no relevant macroeconomic indicators that will influence the markets too much. Nevertheless, even though they are forecasted to be weak, they are still better than the previous ones.

Categories
Forex Market Analysis

Forex and Indices – Daily Update – 13.07.18


Fundamental Forex Trading Overview


BoE’s Deputy Governor Cunliffe suggests a delay in a rate hike.

The Bank of England’s (BoE) Deputy Governor, Sir Jonathan Cunliffe, said on Friday that we should be cautious in an interest rate increase and that there are still arguments for a “stodginess” policy. Cunliffe suggests a delay in a rate hike due, despite the economic growth, to the wage rate is not increasing to the 3 per cent that the BoE had initially forecasted.

The BoE’s next Monetary Policy Committee meeting will be on August 2, for this meeting most economists polled expect the rate to increase.


Technical Analysis


 EURUSD

The EURUSD in the 2-hour chart is bouncing from the Potential Buy Zone as expected in our previous Daily Update on Thursday 12th when we commented that EURUSD was making higher highs and higher lows. Now when the pair is testing support in the green box, we expect new upsides to 1.19067 (orange box – maturity area) completing a major degree connector. Invalidation level is 1.15080.


GBPUSD

The GBPUSD in this 2-hour chart is completing a new bearish leg in the Potential Buy Zone. We foresee a breakout of the short-term trendline and the continuation of the previous bullish cycle with a target placed in the 1.3475 area. Also, the exhaustion area is the target area of the inverted head and shoulders pattern which will be active once time the short-term pivot level was surpassed. Invalidation level of the new bullish cycle is 1.30494.


USDCHF

As noticed in our last Forex and Indices daily update, the Swiss currency is being the weakest currency. The USDCHF in the 2-hour chart soars to the highest level since May 2017. Using the correlations in the US Dollar group with DXY, EURUSD and GBPUSD, we could suspect that this is a false breakout.


EURCAD

The EURCAD cross in the 2-hour chart has broken down the short-term pivot level at 1.53684 and made a pullback to the same level turning the support into resistance. We expect more falls with a target placed in the area between 1.5144 to 1.5061. Invalidation level is 1.55225.


GBPCAD

The GBPCAD cross in the 2-hour chart is consolidating testing the 1.73 psychological support level. It is likely that the price moves bullish making a false breakout before to continue the previous bearish impulse. Invalidation level is at 1.76907.


FTSE 100

The FTSE 100 in the 2-hour chart continues to consolidate, developing a complex corrective structure and testing around the 7,700 level. We foresee a limited upside for the British index to 7,792 pts. Invalidation level is 7,508.


DAX 30

The DAX 30 in the 2-hour chart is moving bullish, testing the 12,600 pivot level. We expect more climbs to the area between 12,695 to 12,742. The critical level to watch is the 12,807 pts, from where if the price surpasses it, DAX could rise to 13,020 pts. Invalidation level is 12,104.


Categories
Forex Market Analysis

U.S. Inflation Grows Firmly In June – Forex and Daily Update – 12.07.18


Fundamental Overview


U.S. inflation grows firmly in June.

Forex Trading Signals: The Consumer Price Index (YoY) in the United States in June reached the highest level in 6 years, climbing to 2.9% from the 2.8% reported in May. According to what was stated by the U.S. Bureau of Labor Statistics, the CPI in June increased driven by the food index, which advanced 0.2 per cent; and the gasoline index, which grew by 0.5 per cent. Despite this increase, the energy index decreased 0.3 per cent, mainly due to the Energy Services index, which fell 1.5 per cent in June.

Forex trading signals Source: Forex Trading Signals – Forex.Academy Collection


Technical Overview


EURUSD

The EURUSD 2-hour chart is showing bullish signals due to the price making higher highs and higher lows. Currently, the common currency is making a retrace to the green box, from where we expect new upsides to the 1.19067 area, completing a major degree connector. Invalidation level is 1.15080.


GBPUSD

The GBPUSD 2-hour chart is making a new bearish leg after the upward sequence in 5 moves started on June 28th. We expect a continuation of the previous bullish cycle from the zone between 1.3181 to 1.3099 with a target placed on 1.3475 area from where the pound should decide the next moves. Invalidation level of the bullish cycle is at 1.30494.


USDCHF

The USDCHF 2-hour chart is making a breakout of the consolidation range which is developing from the first half of June. The RSI oscillator shows that price has a bullish bias. In the short-term, we expect a limited retrace to incorporate to the bullish long-term trend. The invalidation area is 0.98579.


EURCHF

The EURCHF cross in the 2-hour chart is moving bullish after the breakout above 1.1565 level. We expect more upsides which could drive the cross to the targets at 1.1768 in the short-term, and 1.19475 in the long-term. Invalidation level is 1.14799.


GBPCHF

The GBPCHF cross has broken up the psychological 1.32 resistance. We expect a retrace to the area between 1.319 until 1.31057, from where the price should continue rising to 1.3312 level in the short-term and the 1.3442 level in the mid-term. Invalidation level is 1.3023.


FTSE 100

FTSE 100 in the 2-hour chart continues moving sideways in a complex corrective structure, but the main trend is bullish. We expect a limited upside to 7,792 level, from where we should wait for a new connector completion. Invalidation level is 7,508.


DAX 30

The DAX 30 is bouncing from the Potential Buy Zone (green box), from where we expect an upward movement to the area between 12,695 to 12,742. If DAX climbs above 12,807 pts, the German index could reach and test the 13,020 level resistance. Invalidation level is 12,104.


Categories
Forex Market Analysis

U.S CPI, NATO Meeting


News Commentary


Markets rose as investors pushed back trade concerns and looked ahead to earnings results.

Unemployment claims fell to a nine-week low of 214,000, while While U.S. consumer prices advanced less than expected in June among falling utility prices and a record drop in hotel costs, the gauge excluding food and energy costs rose 0.2%.

But the annual consumer inflation rate rose to 2.9% in June. To support the argument for a faster pace of monetary tightening by the Federal Reserve.

President Donald Trump claimed a personal victory at the NATO summit on Thursday after telling European allies to increase spending or lose Washington’s support, which forced leaders huddle in a crisis session with the U.S. president.

Trump declared his commitment to a Western alliance built on U.S. military might that has stood up to Moscow since World War Two.


Chart Analysis


US INDEX

On the daily chart, the price has returned to the red resistance zone with shaping before the reversal double top.

Price has formed another reversal pattern to assure the bearish bias with the wedge.

Followed by a break beneath an ascending trend on RSI, the index is supposed to have its way back to the support zone 93.2-92.6.


AUD/USD

On the daily chart, the pair bounced back from the resistance 0.7455, to retest the green support zone again.

Followed by divergence on RSI, our bullish view is still the same: Heading towards the combination of levels of descending trend, ascending channel and resistance zone at 0.7655-0.774.


CAD/JPY

On 4-hour chart, as we expected before, the price broke the resistance and the neckline of the head & shoulders pattern at 84.35, to assure the bullish momentum also powered by wedge & Gartley harmonic patterns.

The price is expected to target the resistance 87.


NZD/USD

On the daily chart, the price retested the green support zone 0.682-0.6775, followed by divergence in RSI.

An AB=CD harmonic pattern has been shaped to reinforce the bounce.

The price is supposed to head back to the top of the descending channel with the resistance zone at 0.697-0.703.


Categories
Forex Market Analysis

Daily Market Update: NFP Report, Brexit View


News Commentary


The dollar was heading up three-week lows against a currency basket after the latest U.S. jobs report on Friday showed wages grew less than expectation in June with 0.2% (forecast was 0.3%), even as the economy created more jobs than expected with 213K (forecast was 195K).

The average hourly earnings pointed to sustain inflation pressures that hold expectations back for a fourth rate hike by the Federal Reserve this year.


Brexit secretary David Davis resigned unexpectedly last night, to send a blow to Prime Minister Theresa May, as she struggles to end conflicts among her ministers who felt her plan to press for the closest possible trading ties with the European Union had betrayed their desire for a clean break with the bloc.

The pound had fallen responding to the following the reports, before having another turnaround amid indications that May would not face major trouble against her Brexit policy and hopes that a softer Brexit may be on the cards moving forward.


The Euro was boosted after data showing that German exports rose by more than imports in May, indicating that the euro area’s largest economy remains solid despite global trade tensions.


Chart Analysis


USD INDEX

As we expected on the daily chart, the price had bounced from the key resistance at 95.5, powered by divergence on RSI and a break beneath an ascending trend line.

The price also had shaped a reversal double top pattern.

So, the index is supposed to get back down to the support zone again of 93.2-92.6.


USD/JPY

On the daily chart, the pair retested the key resistance of 111.1 again and the descending trend from the high of 2017 to shape a double top reversal pattern.
So, the price is expected to assure the next bearish move that leads the price to the support zone of 108.65-108.15.


AUD/USD

On the daily chart, as we expected, the price has reversed from the support zone of 0.7325-0.7365.

The pair is supposed to go on in its bullish momentum powered by divergence on RSI to reach the key resistance of 0.758, where the descending trend from the high of February is located.


AUD/JPY

As we expected before, the price has reached and bounced from the support zone 81.2-80.5 as the price is moving sideways.

So, the price is expected to retest the head of the pattern to again reach the levels of 84-84.4.


CAD/JPY

On the 4 hour chart, we can see a break above the descending wedge along with shaping a head & shoulders pattern.

A GARTLEY harmonic pattern has enhanced the bullish bias before 84.35.

Watch the neckline of the H&S which is located at the mentioned resistance (84.35) with moving average 200 too.

A break above these levels would take the price up to the key resistance 87.


Categories
Forex Market Analysis

Markets’ Attention On Summer


Weekly Update (July 9th – 13th)


Macroeconomic Outlook

Summer is in focus now, and with it, the attention on the multiple factors that will condition whether it will be a good summer for the markets or a bad one.

Nevertheless, all these factors that unnerve investors are reaching a final outcome.

  • Last week, the markets performed better as the matters that block them improved slightly.
    • European policy and German politics have reached an outcome.
    • Then oil, which is still a problem.
    • And protectionism which is something more bilateral between China and USA rather than global.
      • When the market realises that, it will care less about it.

We were expecting a hard summer, however, the markets are starting to react in a positive way sooner than expected.

This week has three main references:

  • On Tuesday, the German ZEW Economic Sentiment which is expected to be negative again for the fourth month in a row.
    • It is relevant enough to watch out for but nothing especially important as the overall German economy has been increasing recently at 2.5% in the last trimester, which is really good.
  • On Thursday, there is US Core CPI which is forecasted to rebound from 2,2 to 2,3. This issue depends mostly on oil prices.
    • Over-inflated data may hurt bonds, nevertheless structurally it will not be a real matter which could be solved in 2 or 3 months.
  • And the third reference is American corporate results which start, among the big ones, on Tuesday with Pepsi Co.
    • And on Friday, three big banks publish results
      • Citi / +23%
      • JP Morgan / +30%
      • Wells Fargo / +11% and with some legal problems
    • They are expected to be really solid which will support markets.

Hence, this week looks like where a more positive sentiment towards markets can be consolidated.

  • German political turmoil looks clearer than before.
    • Even though it will come back in October with the elections.
  • Regarding oil, American pressures regarding an increase in production are graspable which will lead to Saudi Arabia producing more, and reducing oil prices.
    • This will reduce inflation related concerns.
  • Then, there is the protectionism which is mostly between the USA and China, being something more local rather than something global.
    • So that, when the market realises that along with strong corporate results, a good economic growth and a lot of liquidity, it will lead to an overall favourable economic cycle which will support the markets.
Categories
Forex Market Analysis

Daily Market Update: Trade Tariffs Begin, FOMC Meeting, NFP Data


News Commentary


The trade conflict between the US and China has just been put into action today when U.S. tariffs on $34 billion worth of Chinese goods went into effect at 04:00 GMT. An additional tariffs on another $16 billion is expected to take place in the upcoming two weeks. Meanwhile U.S. President Donald Trump has given instructions to identify a further $300 billion on possible Chinese goods.

China has also vowed to reply with tariffs on $34 billion of American goods. Beijing had previously said it would impose tariffs on U.S. agricultural products, crude imports, and vehicle products.


Yesterday, Federal Reserve policymakers enhanced the view of further increases in interest rates as the U.S. economic growth continued “above trend”.

“Participants generally expected that further gradual increases in the target range for the federal funds rate would be consistent with the solid expansion of economic activity, strong labour market conditions, and inflation near the Committee’s symmetric 2 per cent objective over the medium term,” the Fed said in the minutes.

The Fed’s statement to continue tightening monetary policy was boosted by a continued rally in inflation and a solid labour market, despite concerns about the impact of rising trade tensions on spending and business sentiment.


Today’s big data will be at 12:30 GMT with NFP. The expectation goes for 195K, less than the previous reading 223K

Also keep an eye on average hourly earnings, which is expected to remain the same as the last reading with 0.3%


 Chart Analysis


USD INDEX

As we expected on the daily chart, the price had reached the key resistance at 95.5 and bounced back from it, powered by divergence on RSI.

The price also had shaped a reversal double top pattern.

So, the index is supposed to get back down to the support zone of 93.2-92.6 again, then start its journey to the C wave.


USD/JPY

On the daily chart, the pair retested the key resistance of 111.1 again and the descending trend from the high of 2017 to shape a double top reversal pattern.
So, the price is expected to assure the next bearish move that leads the price to the support zone of 108.65-108.15.


AUD/USD

On the daily chart, the price has reached the support zone of 0.7325-0.7365.

The pair is supposed to find some breath powered by divergence on RSI to reach the key resistance of 0.7515, where the descending trend from the high of February is located.


AUD/JPY

As we expected before, the price has reached the support zone 81.2-80.5 as the price is moving sideways.

So, the price is expected to retest the head of the pattern to reach the levels of 84-84.4 again.


CAD/JPY

On the 4 hour chart, we can see a break above the descending wedge along with shaping head & shoulders pattern.

A GARTLEY harmonic pattern has enhanced the bullish bias before 84.35.

Watch the neckline of the H&S which is located at the mentioned resistance (84.35) with moving average 200 too.

A break above these levels would take the price up to the key resistance 87.


Categories
Forex Market Analysis

Global Markets Update

Markets continue to focus their attention on the same factors that have been the focus of attention for weeks. This has led to a continuous sideways move in most of the indexes during the last weeks. Hence, these factors such as the trade worries continue to influence negatively on the markets.

  • On one side, there is the commercial dispute between the US and China along with the EU.
  • On the other side, the evolution of energy prices and their potential impact on inflation figures.

This weekend, if everything goes as expected, Trump will impose tariffs which are worth over $35bn on Chinese goods.

  • A little bit more from the initial $50bn announced.

It is thought to be a measure to pressure the counterparty and gain a more favourable position in the trade deal.

  • The main problem with this is that it is a large procedure and one which does not look to end in the near future, and further to not finish before the mid-term elections in November.

These factors, along with the higher rate of interests in the USA and a stronger dollar, are hurting emerging markets.

  • Also bearing in mind that the Latin markets are being influenced by the political elections.
    • Recent elections in Mexico
    • Brazilian elections after summer

Thus, Chinese markets are suffering from all these. However more interesting is the 5% appreciation of the Yuan against the US Dollar in just one month.

  • This, on one side, indicates a lower growth expectation. However, it signals the way to free the trade war, through competitive devaluations.

On the other hand, the overall market is ignoring some positive figures like the ISM Manufacturing Index which was published last Monday and reached 60.2 points.

  • This indicates expansion and growth apart from reflecting on how the level of interest of investors is at February levels.
Categories
Forex Market Analysis

Daily Market Update: FOMC Meeting, Friday Deadline Of Tariffs, German Industrial Bounces


News Commentary


US President Trump has restated his call for OPEC to bring down the price of gasoline. He recently asked Saudi Arabia to increase production after he imposed Iran with sanctions reducing Iran’s production by up to 1.1M barrels per day. An Iranian Republican Guard Commander has said that Iran would block the Strait of Hormuz if the US stops Iranian oil sales.

Investors are still cautious ahead of Friday’s deadline for the U.S. to impose a 25% tariff on $34 billion worth of Chinese imports, which Beijing has pledged to match with a levy on U.S. products.


The Fed will release minutes of its June meeting today, with investors looking for clues on whether it is still on track to raise interest rates twice more this year

Most economists expect that the FED will persist in raising the rates at its own pace.

“Every FED official but one projects the central bank will get rates above 3% by 2020”, said Michael Hanson, head of global macro strategy at TD Securities.

Seth Carpenter, chief U.S. economist at UBS, agreed. He said it would take “a major surprise” to keep the FED from pushing interest rates up at a steady pace.


On other hand, some ECB members seemed to be troubled about the slow pace of rates hikes, saying that a Sept/Oct 2019 hike is too late. In response, the probability of a September rate hike has risen from 69% to 80%.

German industrial orders bounced back in May with higher than expected results after four consecutive monthly drops, as demand from domestic customers and the rest of the Eurozone picked up.


 Chart Analysis


USD INDEX

As we expected on the daily chart, the price had reached the key resistance at 95.5 and bounced back from it, powered by divergence on RSI.

The price also had shaped a reversal double top pattern.

So, the index is supposed to get back down to the support zone of 93.2-92.6 again, then start its journey to the C wave.


USD/JPY

On the daily chart, the pair retested the key resistance of 111.1 again and the descending trend from the high of 2017 to shape a double top reversal pattern.
So, the price is expected to assure the next bearish move that leads it to the support zone of 108.65-108.15.


AUD/USD

On the daily chart, the price has reached the support zone of 0.7325-0.7365.

The pair is supposed to find some breath powered by divergence on RSI to reach the key resistance of 0.7515, where the descending trend from the high of February is located.


AUD/JPY

As we expected before, the price has reached the support zone 81.2-80.5 as the price is moving sideways.

So, the price is expected to retest the head of the pattern to again reach the levels of 84-84.4.


Categories
Forex Market Analysis

Daily Market Update: PBOC To Hold Rates, Positive Data For AUD & GBP


News Commentary


The Dollar fell against the rest of the currency basket on Wednesday as trade slowed ahead of the U.S. Independence Day holiday, as concerns over trade tensions remain the top issue.

Investors remained worried ahead of Friday’s deadline for the U.S. to impose a 25% tariff on Chinese imports, which Beijing has declared to match with a another response on U.S. products.

U.S. President Donald Trump is insisting on plans to harm major trading partners, including the European Union, Mexico and Canada as part of his ‘America First’ policy that many investors fear will hit global growth.


On the other hand, China’s central bank has warranted to keep the exchange rate “basically stable,” in an attempt to calm markets which have been on fire by fears over the escalating trade hassle between Washington and Beijing.


The Australian dollar was boosted overnight after data showing that retail sales rose by a higher than expected 0.4% in May, beating forecasts for the second straight month.


Great Britain services PMI grew to 55.1 to exceed expectations and the last reading which was at 54.0.

Services PMI is considered a substantial factor to Sterling as it represents 80% of the total Gross Domestic Product (GDP), which has risen to 0.2% with a hike in manufacturing & construction, 54.4 & 53.1 respectively.

This data enhances the hawkish outlook for the BoE to raise the rate in August.


 Chart Analysis


USD INDEX

As we expected on the daily chart, the price had reached the key resistance at 95.5 and bounced back from it, powered by divergence on RSI.

The price had also shaped a reversal double top pattern.

So, the index is supposed to get back down to the support zone of 93.2-92.6 again, then start its journey to the C wave.


USD/JPY

On the daily chart, the pair retested the key resistance of 111.1 again and the descending trend from the high of 2017 to shape a double top reversal pattern.
So, the price is expected to assure the next bearish move that leads the price to the support zone of 108.65-108.15.


AUD/USD

On the daily chart, the price has reached the support zone of 0.7325-0.7365.

The pair is supposed to find some breath powered by divergence on RSI to reach the key resistance of 0.7515, where the descending trend from the high of February is located.


AUD/JPY

As we expected before, the price has reached the support zone 81.2-80.5 as the price is moving sideways.

So, the price is expected to retest the head of the pattern to reach the levels of 84-84.4 again.


Categories
Forex Market Analysis

Daily Market Update: RBA Remains Rates On Hold, German Politics Eased


News Commentary


Trade tensions remain on fire as the U.S. government has blocked China Mobile from offering services to the U.S. telecommunications market, recommending its application be declined.

“We urge the relevant side in the United States to abandon Cold War thinking and zero-sum games.” Said the Chinese foreign ministry spokesman Lu Kang

That move by U.S. President Donald Trump’s administration comes amid growing trade tensions between the two countries. The U.S. is probably set to impose tariffs on $34 billion worth of goods from China on Friday, which Beijing is expected to respond to with tariffs of its own, to remain in a tit for tat circle.


The euro has been supported as political risk in Germany calmed, after Chancellor Angela Merkel reached a deal on immigration policy with coalition partners, resolving a row that had put into doubt the future of the government.


The Reserve Bank of Australia left interest rates steady at 1.5%. The statement had come to a rather neutral to dovish tone as it declared inflation is likely to remain slow for some time, wage growth also remained slow and household consumption remains a source of uncertainty.

The statement came similar to the June statement with main data remaining the same as well as the tone.


Trading is expected to be thin ahead of the U.S. independence day holiday, with markets closing early at 17:00 GMT.


Chart Analysis


USD INDEX

As we expected on the daily chart, the price had reached the key resistance at 95.5 and bounced back from it, powered by divergence on RSI.

The price also had shaped a reversal double top pattern.

So, the index is supposed to get back down to the support zone of 93.2-92.6 again, then start its journey to the C wave.


USD/JPY

On the daily chart, the pair retested the key resistance 111.1 again and the descending trend from the high of 2017.

So, any bounce here will lead the price to the first support of 108.15.


AUD/USD

On the daily chart, the price has reached the support zone of 0.7325-0.7365

The pair is supposed to find some breath powered by divergence on RSI to reach the key resistance of 0.7515, where the descending trend from the high of February is located.


AUD/JPY

As we expected before, the price has reached the support zone 81.2-80.5 as the price is moving sideways.

So, the price is expected to retest the head of the pattern to again reach the levels of 84-84.4.


CAD/JPY

On the daily chart, as we expected, the price has risen from the support of 81.15, near the green support zone.

The pair bounces with two engulfing bars from the 78.6% Fibonacci level.

A Gartley harmonic pattern has been shaped at these same levels, with an oversold area on RSI.

All these factors enhance the continuation of bullish movement to reach firstly the resistance at 85.5, then the retest at 86.95