Categories
Forex Service Review

Real-Time Currency Valuation Indicator Review

Igor Korepin is the creator of this indicator, created in June 2015, although with several later updates. The developer presents this indicator thought in monetary indices, and it can also analyze and control the market situation widely.

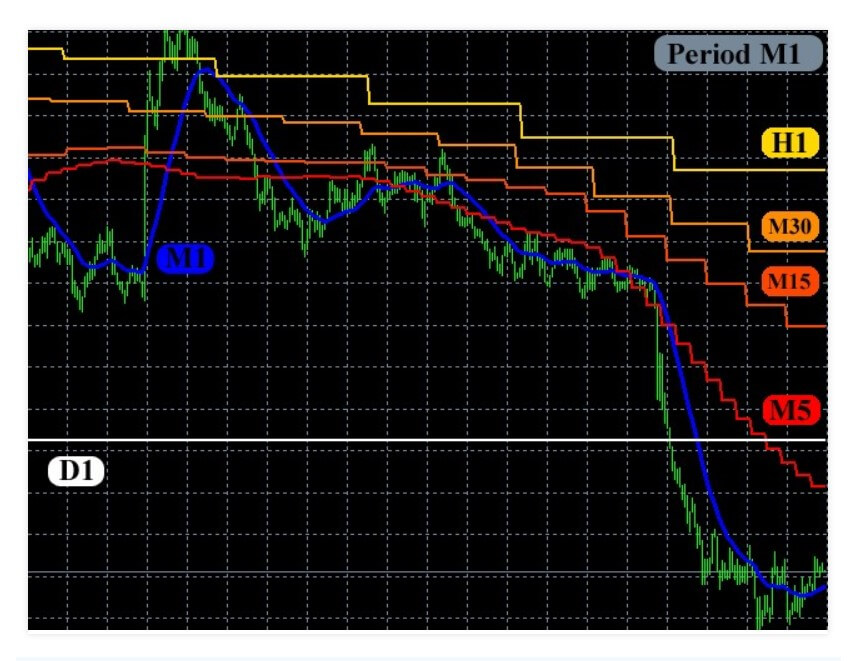
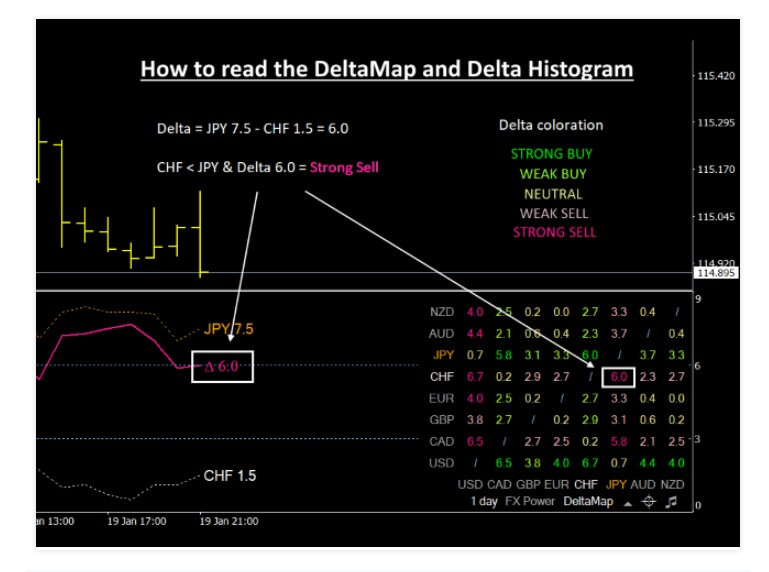
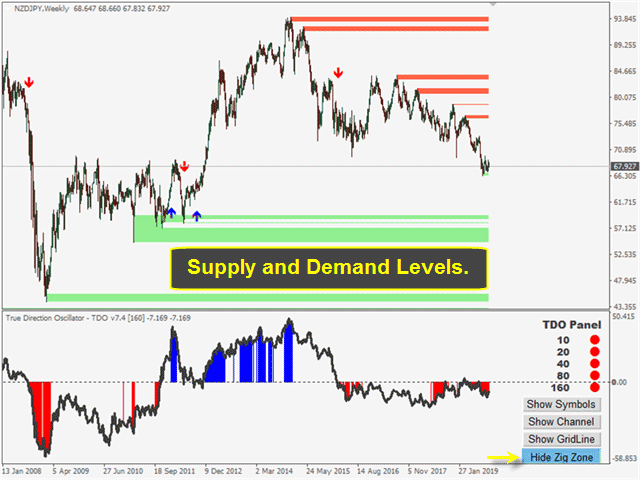
The indicator displays indices of eight major currencies and can also calculate indices of any other currency, metal, CFD, etc. You won’t need to study dozens of charts to determine strong and weak currencies, as well as their current dynamics. The picture of the entire currency market during any period can be seen in a single indicator window.

Main Features

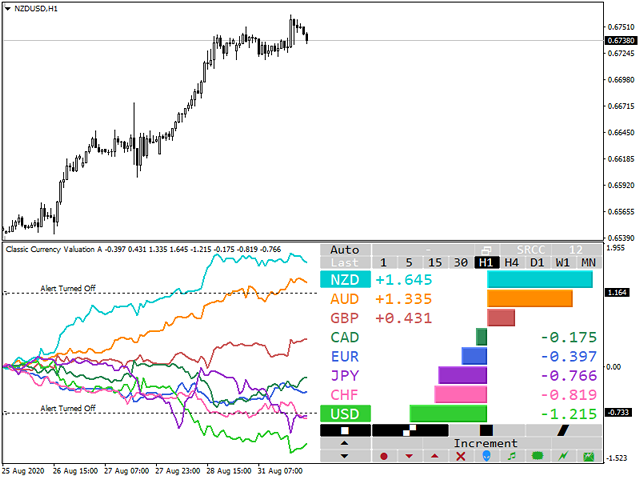
It forms indices of eight major currencies, automatically determining the indices of the current instrument, as well as the best indices available at the moment. You can display only the required indexes in option and one of the indexes not included in the main group.

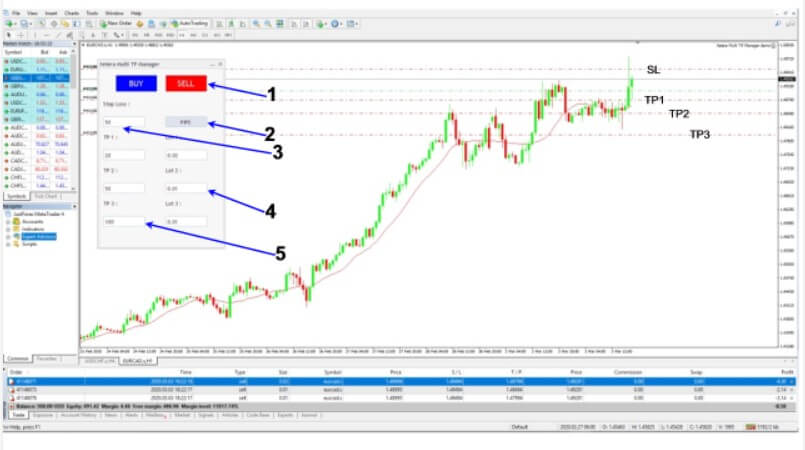
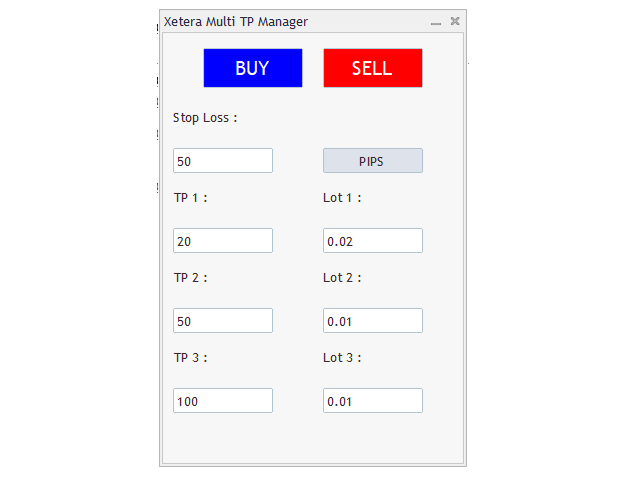
It allows you to quickly switch to any currency pair or open a chart of the desired instrument directly from the control panel. The indicator works both in standard mode with historical data and in real-time mode with tick data.

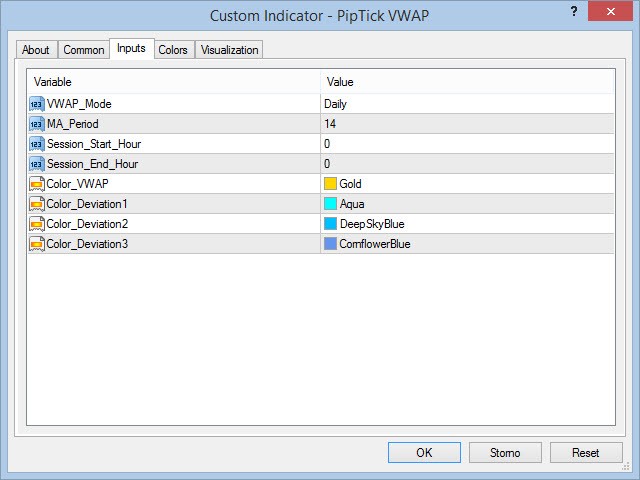
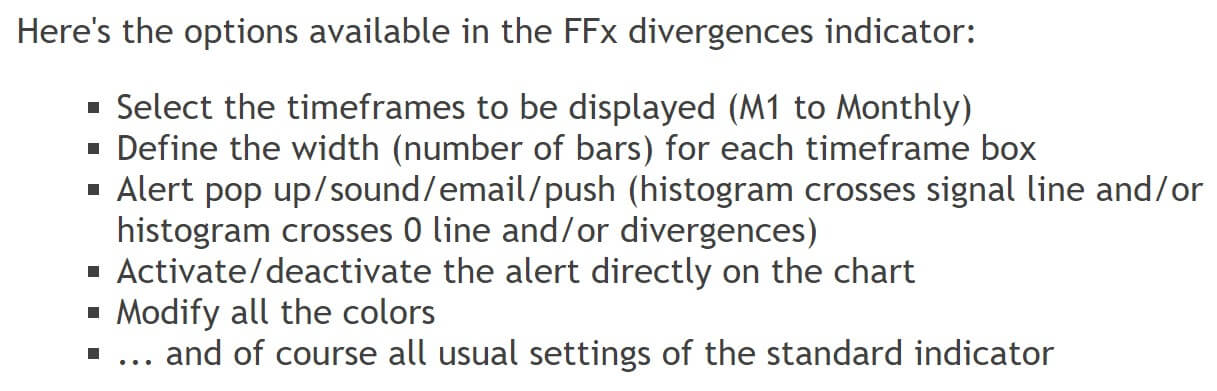
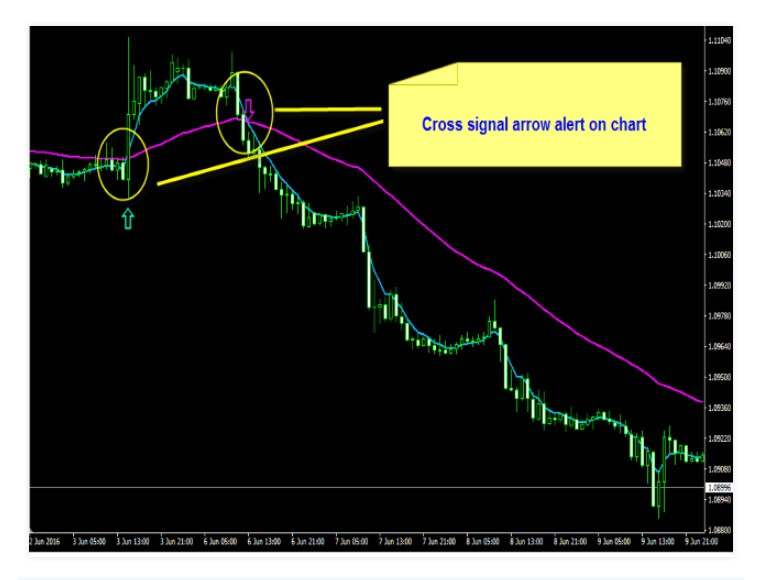
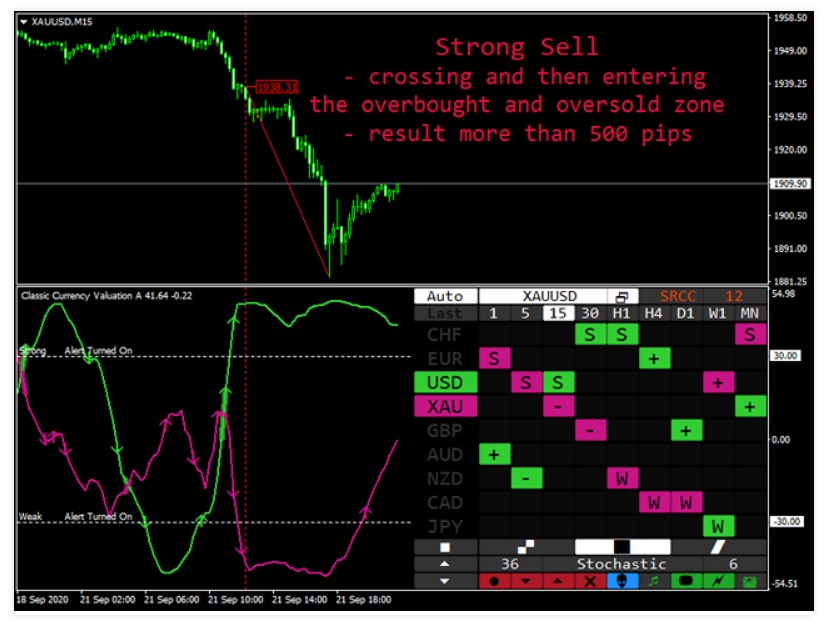
The reference point and the drawing depth are established using a vertical line available for movement. It has an integrated set of classic technical indicators – MA, MACD, CCI, RSI, Stochastic. The market situation is monitored through an integrated system of notifications.

The prefixes and postfixes of a symbol are determined automatically. It is possible to select a currency, whose index will be used as primary in the calculations. Graph of the correlation dependence between currencies in one click.

Advantages

-It is very easy to use – you do not need to prepare for the first use.

-Quick navigation – choosing the required currency pair or opening a new chart is easy.

-Exotic instruments – analyze the movements of metals, oil, and other raw materials.

-Real-Time Mode – The tick chart of all coins shows the best times to enter.

-The situation is under control – allow the notification system and never miss a strong movement in the market.

-Only seven currency pairs for calculations – the indicator is useful and easy to use.

In summary, we are looking at a handy indicator and suitable for every beginner trader. Please, ease of use and a very friendly interface. Users who have tried this indicator have been, for the most part, very satisfied with it, so we think it is an indicator to consider in our list of favorite indicators.

We have only found one thing against, it is not for sale, it is only available for rent at a price of 35 USD for a period of 3 months. You also have a demo version for your free trial.

Categories
Forex Service Review

Scalper DSS (Dual Smoothed Stochastics) Indicator Review

Dual Smoothed Stochastics – indicator (DSS Bressert) is a modified indicator with an alert. You can use it in any time frame. Graphs M1 and M5 are recommended to make use of this indicator, while higher deadlines can be used for day trading.

The settings that come by default give a very good result, but the parameters can be modified by the user according to his personal preferences. It is essential that you identify the trend before negotiation, and open a trade in the direction of the correct trend only.

Stochastic Double Smoothing – DSS Bressert is an oscillator, this tool was presented by William Blau and Walter Bressert in two versions with some nuances between them. The calculation of the values of DSS Bressert is similar to the stochastic indicator, the difference is in the use of exponential double smoothing. The advantage over classic stochastic oscillators is the speed in responding to price changes in a still very uniform flow pattern.

In addition, extreme areas at the other end of the scale are achieved even in a strong trend quite often resulting in many signs of conformity with trends. In the double Stochastic smoothed – DSS Bressert, the values are the same as for Stochastic, where the values above 80 indicate the overbought state of the market, and the values below 20 indicate that the state of the market is in overbooking.

DSS Scalper is a Forex system for scalping traders. That is, short-term traders, where:

TF = M1 and M5 time frame

Takeprofit and Stoploss = 5 to 20 pips.

DSS Scalper trading in intraday:

  1. The interval of today’s days must not exceed the interval of 1 to 30 days.
  2. Green candles every day.
  3. MA histogram is BLUE.
  4. Price touch or go near the bottom red band.
  5. DSS points below 20 level and red turns.
  6. Buy Trade when DSS becomes blue and the bar is closed.

DSS Scalper Sales Rules:

  1. The interval of today’s days must not exceed the range of 1 to 30 days.
  2. Daily red candle.
  3. MA histogram is red.
  4. Price touch or go near the top band BLUE.
  5. DSS points above 80.
  6. Sell Trade when DSS becomes RED and the bar is closed.

DSS scalper output rules

  1. Departure when the price touches the opposite side of the band.
  2. Exit about 5-20pips.

In summary, Scalper DSS is an indicator that will provide us with signals of purchase or sale in very low temporary spaces, M1 or M5, with the aim of having little profit per trade, but doing several trades during the day. If we do not want this short-term operation, increased time frames can be traded intraday, doing fewer trades but with more profit in each.

In short, it is an indicator that adapts to the needs of each trader and is suitable for any type of trader, whether novice or professional. You can find this indicator in the Mql market, in the indicators section, and you can buy it for 35 USD, or 15 USD if you prefer to rent it for a month. Additionally, you have a free trial version so you can evaluate it before spending the money.

Categories
Forex Service Review

MACD Scanner with Embedded Trend Filter Review

This tool is tracking the entire market for commercial opportunities for all symbols and time frames. You don’t have to look at all the charts, for all the symbols, and for all the time frames. This scanner will let you know on your computer, or on your mobile when a business opportunity has been found. This tool is designed to scan all Forex currency pairs, for all time frames, to find a crossing of the main MACD and signal line.

The MACD is used to track trends. The MACD is calculated as follows: 12 EMA periods and 26 EMA periods (default values). A MACD signal is the EMA-9 of the MACD line. The most decisive signal of the MACD is when the indicator crosses the signal line up or down. This gives us a sign that a trend may be changing direction.

Note: This indicator will not display information on the chart. It is a scanner and will provide only MACD trading alerts.

MACD Strategy for Trading

MACD’s strategy is trading when there is a cross of the MACD and the signal line. However, you may not want to act at every sign. You will have more profitability when you trade in favor of the trend.

This tool implements various filters to provide the most efficient MACD signals:

Signals will be filtered when not following the MACD trend. E.g. If the indicator line is at the bottom (below zero), no bullish signals will be reported.

The scanner has a built-in trend filter, to provide only trending signals.

Will select signals if the MACD is low. If the value of MACD is low, it means that the 12-period EMA and the 26-period EMA are close to each other. This time, there is no powerful trend, and it is not advisable to trade in this condition.

Recommendations for Trading

As for each indicator, longer lead times are more reliable than shorter lead times. For this reason, the proposal is to use the scanner only for high time intervals (H1 or higher).

It is advisable not to trade when there is important news expected that same day. Critical news can lead to unexpected movements in the market, which cannot be identified by any indicator. Do not enter the market when the price is close to an important support or resistance area.

Characteristics of this Indicator

Scan all the symbols visible in your Market Watch window, or all the symbols available to your broker at the same time.

The indicator just has to be installed on a graph to scan the entire market.

The trader specifies which timeframe you want to monitor. Each timeframe can be selected in the settings.

The panel will display the latest alerts provided by this scanner. When you click on an alert, a new chart will open for the applicable symbol and time frame. The new table will highlight the alert with a vertical line.

Alerts will be received at the MT4 terminal for each business opportunity found.

You can get alerts on your mobile phone, so you never miss a business opportunity.

Low CPU usage. Alerts for MACD Main/ Signal crosses, with a trend filter.

Alerts when MACD line 0 is crossed.

This indicator was created by Victor Christiaan in April 2019 and has a lot of positive reviews and feedback from users. MACD has always been a widely used tool for all types of traders, so we can advise this indicator for you to add to your trading. The purchase price is 30 USD and you can also rent it for 10 USD per month. A free trial version is also available.

Categories
Forex Service Review

Double Top Bottom Scanner with RSI Filter Review

This indicator was created in March 2018 by Jan Flodin. We speak of an indicator that identifies superior/ inferior double or triple formations or a next neckline (confirmed top/ bottom). It has RSI, pin bar, and MACD or RSI divergence filter options that allow filtering only the most robust configurations.

The prompt writes the signals to a text file that can also be used by an Expert Advisor (EA) for automatic trading. For example, Information in the text file: [symbol], [term], [price of first top], [price of neckline], [purchase or sale (0=purchase, 1=sale)], [time of first end], [time of neckline], [time of second end] + 3 additional parameters that are used only by this EA.

Double Top Bottom Scanner Features

This indicator can monitor all the symbols visible in your Market Watch window at the same time. You can apply the indicator in a single graph and instantly monitor the entire market.

You can monitor each time frame, from M1 to MN, and it will send you a real-time alert when identifying the top or bottom or neckline break.

You can use RSI as a trend and/or divergence filter to properly identify potential investments.

The indicator includes an interactive panel. Clicking on an element will open a new chart with the symbol and time frame in question.

Simply place the indicator on a chart, and you will receive an alert of any symbol and any time frame of your choice.

Input Parameters & General Settings

Panel Width: For example, if you are using a non-standard font size in windows, you can set a higher value for all text to be visible.

Template Name: The template selected here will be attached to the chart that will open when you click on one of the signals in the panel. The name has to include the file extension .tpl. The goal of this parameter is to make it easier for the quick decision to make a trade or not. Or if you wait for confirmation of the actual investment. Normally you would use your own template which, for example, could contain a support/resistance indicator.

Wait for the candle to close for warning (neckline only): If set to ‘false’ then the warning will come as soon as the conditions are met, without waiting for the candle to close. When set to False, this option is only used for cleavage breaks.

Note that because of the multifunctionality neither buy and sell tips nor lines and arrows are drawn on the indicator chart. A line between the ends as well as the neckline is drawn on the chart that can be opened from the panel.

The developer’s recommendation is to put the indicator on an M5 chart and on the EURUSD, preferably a clean chart without any other indicators or Expert Advisor on it.

A priori it seems that we are dealing with a rather useful indicator, as demonstrated by the positive criticisms of its users. Another point in favor is the service that the developer gives to the buyers of the indicator, he is always willing to answer your questions. This indicator is available on the MQL market at a price of 39 USD, or for rent at 12 USD per month. Additionally has a demo version to test it out for free.

Categories
Forex Service Review

Triplex Expert Advisor Review

Triplex is an auxiliary tool for manual Forex trading. This Expert Advisor has two operating modes with separate settings, the Community mode, and the Scalping mode. Read on to learn more about how this EA performs, what it costs, and what we truly feel about this service. 

The COMMUNITY Mode

When EA is in this mode, EA monitors purchase order lots and sales orders. If several orders are present, the balancing level is calculated automatically, taking into account all possible commissions. This level is identified with a dotted line in the graph (green to buy, red to sell). If there are purchase and sale orders with different lots on the market, then there will be an additional line for the break-even point, common to all orders, drawn (white by default). In this case, the values of Take Profit and Stop Loss are calculated on the basis of the sum of the equilibrium values of purchases and sales.

This mode is perfect for automation of strategies with an average, and also for pyramid and partial position blocking strategies.

The SCALPING Mode

Being in this mode, when a position is opened manually, a stop command is placed in the opposite direction at a certain distance, with the batch increase specified in the settings. During movement to the open position, the stop order is dragged with the step, specified in the settings. Once the final stop level has been reached, the order is withdrawn. Take the gain levels and stop-loss are placed for the open order at the distance of the final stop. During an unfavorable movement and the opening of a placed stop command, the next stop order is placed in the opposite direction.

The maximum allowed number of position commands is also specified in the settings. In case the order limit is reached, or in case of insufficient free margin to open the next order, a stop command is placed, accompanied by a final stop and a profit take, for the net open position. It should be noted that during the manual closing of one of the series commands, the entire position will be forcibly closed.

The TEST Mode

In test mode with the “Test mode enabled” function, the EA opens commands by a signal of the intersection of two moving averages, whose periods can be changed in the settings. This function does not work in a real market and is intended solely for familiarization with different modes of operation.

We have not found any comments or criticism of this robot, so we can not convey the opinions of the users. Although this tool was created in 2015, after 5 years, it seems that there have been hardly any activations of the robot, so it has gone very unnoticed among the MQL user community. We would not risk acquiring a robot with so much ignorance of the same, existing hundreds of alternatives much more contrasted in the market.

If you still want to purchase this tool, its price is 19 USD in the market MQL, having a free demo version.

Categories
Forex Service Review

Royal Wave Pro MT4 Review

Royal Wave is a Trend-Power tool based on a price adjustment algorithm that performs statistical analysis of price movement to predict and locate low-risk entry and exit areas. This alert system generates well-timed trading signals that give the trader enough time to make the most appropriate trading decisions.

Features of the Royal Wave Pro:
  • Algorithm of trend power.
  • Low-Risk Entry and Exit Zones.
  • Predictions for areas where the asset is overused and oversold.
  • Rich Alerting System (these are sound alerts, SMS notifications, Zone Flasher, etc.)
  • The oscillation range from 0 to 100 facilitates the understanding of the signal.
  • Analysis of various terms and currencies.
Areas of Entry:

Once the value of the oscillator is almost zero it means that there will be a significant movement in the price shortly because traders in most installments agree on the current price and have come together to move the price of a big step in one direction. Therefore, this indicator predicts entry areas with a low risk where the price only seems to move in one direction until the moment the oscillator reaches the exit zone. The entry zones are always going to be the beginning close enough to a big move in price.

Zones de Salida (Exit Zones):

When the oscillator reaches the output area in the 100 environments, it is predicting an overbuy when the color is yellow, or an excess when the color is blue. This zone can be used to exit an operation or update a stop loss level due to the high probability of reversals in these areas.

The exit points of the zones are potential candidates to be points of reversal in a trend. By using the real-wave signal array, some of these areas can be identified as low-risk to enter a reversal trade.

Trend and power supply:

The oscillator value represents the current power of the trend ranging from 0 to 100. When energy is rising, a yellow color indicates a steady upward trend, and blue color indicates a strong downward trend. A decreasing power shows consolidation, which means that there is no trend in price, and the trader must wait for the entry zone.

Signal Matrix:

Gives an informative view of various symbols against all time frames in a matrix. Each cell in this matrix is a brief representation of the price behavior of a symbol from a single time frame.

Transversal Window:

View and compare data from an arbitrary symbol and time frame within a graph with a different symbol and time frame. This tool can be used to develop multiplayer and multi-timeframe strategies.

In short, we are talking about a reasonably comprehensive indicator. Created in May 2019, it has already had some updates from its developer Ehsan Tarakemeh. At the moment, you don’t have any comments from users, but personally, we think it is an indicator that can be very useful in our trade, and we would put this indicator on the waiting list so that it can be added over time.

It would be advisable to use the free trial version to get to know it better. Its selling price on the MQL market is 129 USD, or 69 USD if you prefer to rent it for 3 months.

Categories
Forex Service Review

CloneIt4 Trade Copier Review

In this review we will talk about a replicator of operations, it is not the first that we have analyzed in this section. Clonelt4 Trade Copier can transfer the power MT5 has to your MT4 account.

The Cloneit4 trade copier will copy the large trades you perform on your Metatrader 5 account to your Metatrader 4 account. Cloneit4 is a simple Expert Advisor (EA) that is attached to a chart on Metatrader 4. When a trade is started, modified, or closed in MT5, Cloneit5 sends real-time data to Cloneit4 in its MT4 account to copy the same trade for the same symbol. The user must have the current version of Cloneit5 running on your Metatrader 5 and on the same computer. Cloneit5 is also available on the MQL market.

In your MT4 account, copy Cloneit4 to the chart and symbol you want to trade. Enter the MT5 account code in the Clone Link Input section. The volume of each trade can be scaled with the volume indicator multiplier at the source.

Cloneit4 will perform all processes and customize batch sizes, take the gain levels, and stop the Cloneit5 loss levels. Any transaction you make at Metatrader 5 will be reflected in your Metatrader 4 account. You can try the free demo versions of these tools.

Descriptions of the entries:

System name – you can name the system as you like if you wish.

Clone Link (MT5 Account Number) – this is the MT5 account number where Cloneit5 EA is running.

Source volume multiplier – Value can be reported in order to multiply the volume of the position sent by Cloneit5. For example, if you want Metatrader 4 volume to be half of Metatrader 5 volume, enter 0.5.

Delay time between closing and opening (in seconds) – There may be a delay time between different brokers for MT4 and MT5. This entry in seconds will be delayed between the last closing and the next opening.

Update rate (in seconds) 0= Each Tick – specify how often to check. Enter 0 to check only the incoming ticks.

Limitations

Cloneit4 is not a trading robot. It only receives information about transactions that you or another EA has made on your Metatrader 5 account.

Cloneit4 does not set outstanding order details, only opens, closes, and modifies position information.

Cloneit4 only trades with the symbol of the card to which it is attached.

Cloneit5 and Cloneit4 must be installed on the same computer.

In short, it is a very simple copying program. We have seen copiers with more possibilities in the market and much more complete. In this copy we detect several limitations; the most important is that you have to install 2 Eas and on the same computer.

Although the cost of this copier is very cheap, 10 USD, we do not recommend it because there are better options in the MQL market. Anyway, if you want to try it for free, there is a demo version so you can try it out and see if it fits your needs.

Categories
Forex Service Review

The Beauty and the Beast EA Review

This EA uses a robust AI algorithm that attempts to simulate the behavior of a human trader. For more than 24 months, all trading transactions made by a human trader have been included in the algorithm, in order to identify repetitive patterns, whether it is a trading establishment or risk management of an existing trade.

After thousands of trades, the algorithm has been able to identify patterns and configurations that were repeated and have managed to trade on their own with very profitable success rates.

The advisor uses a grid (average money management) to manage trades, as the AI algorithm found it very useful and with a high success rate. In the tests, the consultant survived a very demanding test with 1000 ms of sliding, 8 USD of commission and variable differential, costs SWAP,… and all this from 2003 to 2019.

The EA will not negotiate every day, will enter into a trade only if it found that the success rate is over 85%, can be checked in the tests that have been performed, and there are days without trades.

Requirements of the EA:

-Working currency pairs: EURUSD, USDJPY and USDCAD.

-Working time: Time frames of 60 Min (H1)

-Required Minimum Capital: 1500 USD. If the user wants the EA to work on other pairs, he must have an additional 750 USD at least per pair in order to have sufficient buffer.

-Risk of use (MM): Low risk (0.01% – 0.5%, expected DD ~17%). Medium risk (0.51% – 1%, expected DD ~35%). High risk (1.01% and above, expected DD ~55% and above).

-High leverage recommended, 1:500

-VPS to maintain an Internet connection and not lose control of trades.

The Spread is playing a big role in determining whether there are big events (news), because brokers usually increase the spread before major events, so it is better to keep the Max Spread parameter low (like the average daily spread).

Broker times must be GMT +2 only, so for example, if your broker is GMT +0 in the Gmt offset parameter, you must enter -2, if your broker is GMT +2 you must enter 0 in the GMT offset and so on.

We are apparently dealing with a robot that works quite well according to the comments of the users, who for the most part highly value the functioning of this EA. The Beauty and the Beast is available on the MQL market at a price of USD 299, but can also be rented for one month for USD 45. A free demo version is also available to test this robot for backtesting.

Categories
Forex Service Review

Esparta Expert Advisor Review

The Sparta robot promises results with high profitability in a short space of time. Likewise, the installation is very fast and easy to run, and its interface is attractive and very intuitive.

In stock markets, in general, it is often said that the Martingale, averaging the price, and all types of progressive monetary management, do not usually work well. There are estimates that say more than 90% of the signs of success, with high returns, and long-term, use this type of monetary management. And a very similar situation occurs with accounts called PAMM.

The Sparta robot is an expert consultant that can be used with different types of currencies and that is fully automated. This robot uses a position management method called “Decreasing Waves”. This method, used by the Sparta robot, is specially developed to work with stock charts, and its operation in the Forex market is excellent. The essence of this method is to know that the price waves will not always be falling and when the price wave becomes upward the losses of the transactions made previously are eliminated. This is how this robot manages the position size.

The Esparta robot has two modes of negotiation:

Automatic: The automatic mode is ideal for use by beginner traders or inexperienced traders. It uses a single chart and is able to work with 7 currency pairs simultaneously. It also does not require any advanced settings for use.

Manual: In this mode, any type of financial asset can be used. There are unlimited options for configuring robot parameters according to our convenience, and transactions are done in a single graph. In this option, it is necessary to configure the parameters manually, so it is convenient to have prior knowledge of the trade. This mode is more suitable for more advanced traders.

The robot developers claim to be planning to expand the list of trading modes. Also for all traders who have created their own parameters for a specific group of financial assets, the creators of Sparta undertake to create an automated system with the proper configuration for its operation.

The robots created by the Sparta developers are subject to the corresponding tests in real accounts. This is the best way to check for users whether a robot is reliable or not.

To start the EA SPARTA, it is sufficient to set the expert advisor on a graph H1 for example with the EUR/USD, and using the default configuration by default. This step would be sufficient to be able to trade with all currency pairs.

The main features of the Robot EA Sparta are:

Accounts: Coverage of risks.

Currency pairs with which you can work in automatic mode: EURUSD, GBPUSD, AUDUSD, NZDUSD, USDCHF, USDCAD, USDJPY.

It works on time bars and works quite well with internet connections that are not too fast.

The robot can operate in an “open price only” mode when the strategy is being tested.

It does not use operations with small temporary spaces (Scalping, Pipsing).

Use batch augmentation in the following series offers.

We are dealing with a robot that seems to work well and with which attractive profitability can be achieved. A minimum deposit of USD 100 is required to start the activity with the Sparta robot. It is available on the MQL market and is currently priced at 305 USD. 

Categories
Forex Service Review

Virtual Killer Trade EA Review

Virtual Killer Trade is an EA created in September 2019 by Antonis Michos, a very active developer in the MQL market channels. Recently this EA has been updated, and the developer claims it is a very good tool because it guides you when opening each trade.

After opening the trade, a smart system begins to manage that trade and you don’t have to worry when to close it or when you should open a second or a third trade. Like any EA, you connect, you wait for the signal, you open the trade and then you can forget about trading, the robot will do it for you.

For more experienced traders, you no longer have to wait for a signal, you can open a trade manually and then let the EA work the position.

Recommendations

Trading with a one-minute time frame is the recommendation made by the creator of EA. The EA can open operations on each TF, but will manage it differently. Any currency pair can be traded by this EA. Initial capital of USD 1000 is recommended. You can start with less capital but you need experience in the markets to have a balance of less than 1000 USD in your account.

Tickets

Drawdown: By increasing it from 1 to higher the mechanism of overlapping closing positions will be activated when each open trade has more than 1 USD of loss.

Minutes period: Set the minutes of the time frame used by EA (M1).

Seqbaselots: The initial lot of the trade MANUAL (one to sell one to buy).

Initiates: The lot size that opens the EA after the trade manual, (One to sell and buy)

Multiplyonloss: The lot size multiplier that opens the EA after making a manual trade, (One to sell and buy).

Volumeupperlimit: The maximum lot size of the EA position is allowed to open. (e. g up to 0.15 lot position.

Important: You must change the “period of minutes” of input depending on the TF you want. e. g 5 for 5 min, 60 for 1H, etc.

Conclusion

In short, we are talking about an EA that seems to be producing good results, since it has only been in the market for a short time, and the ratings of its users are very positive. It also has a point in favor since, for a commercial EA, its price is not very high. The selling price on the MQL market is 120 USD, you can also rent it for 50 USD per month, and test the tool with the free trial version available.

We would have liked the developer to provide users with the operation of the EA in an audited real account, but at the moment, this information is not provided.

Categories
Forex Service Review

Xetera Multi TP Manager EA Review

Xetera Multi TP Manager EA is a robot that was created in March 2020 by developer Ghanaian Oteng Micheal. Oteng Micheal is a developer who has previously created other automated trading systems that are available on the MQL market.

Xetera Multi TP Manager for FX is an Expert Advisor specially designed for Forex on the MetaTrader 4 platform to manage operations even while you are out or asleep. Many Forex signal services use multiple socket gain levels like TP1, TP2, and TP3.

Signal services give you multiple target levels to increase your profit, but the problem is that you always need a person to monitor your operations and move the Stop Loss, behind.

Therefore, this problem has been solved by developing this EA that can help you manage your operations and secure your benefits by moving the stop loss to the right place at the right time.

Xetera Multi TP Manager Ea opens 3 positions from 1 trading (each position points to different levels of TP). Therefore, it is necessary to divide the size of your lot to 3 parts. We recommend that you use half the batch size of TP1 for TP2 and TP3. If using 0.10 for TP1, use 0.05 for TP2 and TP3.

The EA moves the Stop Loss as follows, (EA never forgets to move SL to ensure its benefit)

It’s as simple as 1-2-3:

Default settings

SL @ 50 , TP1 @ 20, TP2 @ 50, TP3 @ 100, Behind @ 5, Lot1 @ 0.10, Lot2 @ 0.05, and Lot3 @ 0.05

– If the first operation (lot 0.10) reaches the TP1, then EA moves the SL to +5 PIPS from the entry point.

– If the second operation (lot 0.05) reaches the TP2, then EA moves the SL to more than +5 PIPS of the TP1.

– Ultimately, the third target is TP3. This wonderful EA does everything for you.

All figures in levels are configurable in EA settings, making it ideal to be used for all types of currencies, metals, or indices on the MT4 platform.

Understanding the panel multi tp manager of Xetera Multi TP Manager EA:

We have created a simple panel for the Multi TP Manager where you can enter figures like SL, TP1, TP2 and TP3, Lot1, Lot2 and Lot3

  1. Buy/Sell button (For instant execution Purchase or sale by market)
  2. Switching between PIP or PRICE mode

– If you select PIP mode, you must enter the exact values provided by your signal service or provider

– If you select PIP mode, you can use the previous values or enter the values provided by your signal service or provider. Note that in PIP mode, TP and SL levels will be calculated from the market execution price.

  1. Stop the loss

– Set Stop Loss by Price or Pips by Active Mode

  1. Size of batch

– Put in your batch sizes in each box, Lot1, Lot2 and Lot3 (eg. Lot1 = 0.10, Lot2 = 0.05, Lot3 = 0.05)

  1. To obtain benefits

– Put in your TP levels. You have up to 3 levels

In short, we are talking about an EA that works position based on dynamic TP and SL levels. We always recommend that using an EA you have a dedicated virtual server (VPS), to ensure that the transactions that the EA performs are replicated on our computer, even if it is turned off. If we do not have this tool we will have to leave the computer on 24/7.

Another tip is to have an ECN account at a trusted broker that has low latency so that our transactions run as fast as possible, as well as for the broker to collect low spreads and commissions. Because this tool has been on the market for a very short time, we lack user opinions that can tell us what experience they have had using EA.

Xetera Multi TP Manager EA is for sale, available on the MQL market, at a price of 280 USD, is also available for rent at a price of 30 USD for 1 month, 60 USD for 3 months, and 180 USD for 1 year of use. A free demo version is also available and we recommend that you download it in order to test the EA and get to know better its performance and its profitability potential.

Categories
Forex Service Review

Econ Power Trader Review

Econ Power Trader was created by independent trader Leo Castle. You probably haven’t heard his name before, although he has worked for several banks and funds on Wall Street for the last 12 years. 

Overview

Econ Power Trader is a fully automated Expert Advisor that uses adaptive technology to trade the news and reacts to big spikes in the market that are caused by world events. The system uses technology that is advertised to help skip losing trades with minimal risk and low drawdown, while allowing traders to profit from news events with 20%, 50%, or more in profits. Here are a few more facts about the software:

  • Beginner-friendly with easy installation 
  • Uses Adaptive News Trading Technology (AINTT) for higher accuracy
  • Uses a tight stop-loss no higher than 15 to 20 pips on every trade to reduce risk along with double trailing stop protection
  • Trades on most major pairs
  • Does not use risky grid or martingale strategies
  • “Strategically identifies high impact news for any given day, then utilizes pending orders above and below the current price action”

The website spends a lot of time talking about the 70%, 1700%, and 1469% profits that the robot has brought in for the developer without ever requiring them to place a single trade themselves. One of the primary marketing points for the system is a high reward to risk ratio.  

Service Cost

The product’s website doesn’t actually provide the minimum deposit requirement, which leaves us a bit on the fence considering that this could be anything from around $50 into the thousands. The good news is that the website mentions that it is possible to start with a small account with little to no experience, so we expect the asking amount to be on the smaller side. A money-back guarantee is advertised for the first 30 days after purchase. There are two price options for acquiring the product:

  • Pay $297 per year (equating to roughly $24 per month)
  • Purchase a lifetime license for $497

The lifetime purchase is the most economically savvy option in the long run, while the yearly price is cheaper in the short-term. You’ll need to decide which option is the best based on what you’re willing to pay and how long you plan on using the robot. 

Conclusion

Econ Power Trader was designed to be a speedy and efficient system that profits by trading the news using AINTT technology. It was created by professional trader Leo Castle, who has spent a lot of time working for banks on Wall Street. The system was designed to trade the news with a high reward ratio versus risk, meaning that traders should either profit pretty significantly or only lose enough money to put a small scratch on their account per trade, according to the developer.

The system also employs several features to help limit losses, such as avoiding historically dangerous strategies and using a stop loss and double trailing stop protection on every trade. User reviews are not provided on the product’s actual website, but those that are looking for feedback can find several other product reviews online. We were left feeling a little disappointed that these results were posted by other websites and that there weren’t more honest user reviews out there, but the safety, promises, and 30-day money-back guarantee offered by this trading robot seem promising, nonetheless. 

Categories
Forex Service Review

KeltnerPRO Automated Trading Robot Review

KeltnerPRO is a fully automated trading robot that operates based on ideas published in the “How to Make Money in Commodities” book, which was published by Chester Keltner. It works with the MT4 platform. 

Strategy

The KeltnerPRO system is based on the popular Keltner Channels tool, which identifies reversals with channel breakouts and direction and/or identifying overbought or oversold levels in the market. The robot is fully automatic and uses a dynamic stop loss and take profit that can change in different situations. Typically, the stop loss is half of the take profit level, meaning that each win should be larger than any loss. On average, the robot makes about one trade per day for a grand total of about 30 trades per month, although the system could make several trades in a day depending on conditions. It works with the currency pairs EURUSD, GBPUSD, AUDUSD, NZDUSD, and USDCHF. 

Service Cost

The system costs $499 and can run on any account size with a $200 minimum account balance recommendation. VPS is recommended, but not mandatory. This product comes with a 60-day money-back guarantee, updates for life, a 1-year profit warranty, and 24/7 support. 

Conclusion

KeltnerPRO is based on popular ideas and has proven good results during testing for several different users. While the price is rather high and might be too much for some traders, the developer does seem to stand by his product by offering the 60-day money-back guarantee and the 1-year profit warranty. While several users have claimed that the product worked for them, a few people did claim that the developer isn’t as prone to giving out refunds as he claims even during the 60-day period. We would recommend testing this product first before paying the steep price tag or arguing over a refund. You also might want to consider making a larger deposit than the $200 recommendation so that the system can make enough profits to pay for itself in a shorter amount of time.

Categories
Forex Service Review

REV Trader Pro FX Trading System Review

REV Trader Pro is an automated trading robot that was created by money manager and trading system developer Doug Price. The product works with the MetaTrader 4 trading platform.

Overview

REV Trader Pro is an automated system that uses trend reversal technology while avoiding false trading signals. It detects potential market reversals with high accuracy, according to the developer. Loss-prevention settings reduce losses from broker commission, spread, and slippage. The bot comes with default settings that have been adjusted to offer superior performance, although traders can change several settings if they prefer to. Traders can also set a certain percentage for the risk factor they would like to take on each trade. The system works with any type of broker (STP, NDD, etc.) on the H1 timeframe with the major pairs AUDUSD, GBPUSD, EURUSD, and NZDUSD. Alert popups and email notifications can be enabled for important updates as well.

Service Cost

This trading system was previously offered to wealthy clients and has supposedly experienced a price drop. Unfortunately, the developer does not list the exact price on the website, however, online reviews mention that traders have paid around $650 to $750 for the system. This does come with a lifetime license, a 60-day money-back guarantee, free updates and strategy improvements, and 24-hour access to Skype and/or email support with the developer.

Conclusion

Rev Trader Pro is marketed in the $650+ range, meaning that the software is only acquirable for traders that have a good amount to invest. Of course, traders will need to know that the product will turn a profit and eventually pay for itself. The website claims that the software is used by wealthy clients with more than $10 million dollars, but it is important to look at user reviews as well. Here is one helpful review we found online:

“Doug helped me with all the questions I had on this robot within 24 hours, so I consider his customer service as excellent. When I told him the REV trader PRO was not made for me, he refunded my money without any delay and hassle.”

While this review was written by an individual that speaks about the developer’s positive customer service, most of the product information is posted on other review websites. REV Trader Pro has earned a rating of around 3 to 4 stars in general– however, many have recommended avoiding the product because of the $700 price tag and “horrible” performance. With everything in mind, we would recommend trying out the free trial before making the purchase. Do keep in mind that there are some helpful risk management settings, but traders should purchase this EA with caution. Otherwise, you’ll lose a steep amount with this iffy investment.

REV Trader Pro can be found at the following web address: https://www.revtraderpro.com

Categories
Forex Service Review

RoFX Forex Trading Robot Review

RoFX was created by a team of software developers and traders in 2009 before being made available to the public one year later. The system is fully automated and seems to be targeted towards beginners without much experience, along with more advanced traders that don’t have the time to trade consistently.

Overview

RoFX was created to place trades automatically on one’s account, which makes it a good choice for any investor that is just starting out. The website points out that experience is not needed to use this system and that human emotions won’t negatively affect trades, which makes the robot more efficient than a human trader. Of course, these points could be made for any other fully automatic trading software. Here are a few of the system’s features:

  • Ability to see your account transactions from the “history menu”, including your profit and any performance fees that have been applied
  • Account statistics and analysis is offered
  • Works with the MetaTrader 4 platform
  • Losing trades are protected by AutoTrader and each trade uses a stop loss
  • Does not use leverage; only trades with your actual funds and those of the company
  • 24/7 customer support

Developers don’t spend a lot of time explaining how the robot trades or what contributes to its decisions, however, traders are given control with the “history menu” where they can review all of their trading results. Still, it would be nice to know more about the algorithms that are being used.

Service Cost

Traders can choose from several different packages, each of which requires a different deposit minimum, trade for a different amount of time, offer a different share in the profit, and charge a different performance fee. Here are a handful of options from the website:

The TRIAL package requires a $1K – $5K deposit, trades for 30 days, provides a 40% share in your trading profits, and charges a 60% performance fee.

The MONEYMAKER package requires a $10K – $50K deposit, trades for 270 days, provides a 65% share in your trading profits and charges a 35% performance fee.

The VIP package requires a $100K+ deposit, trades for 270 days, provides an 85% share in your trading profits, and charges a 15% performance fee.

A few other packages are available, including advanced compound and no lock versions. According to the website, the developers of RoFX actually guarantee coverage of any losses that are incurred on behalf of the robot thanks to their “reserve fund”. Also, note that withdrawals are free, and traders are compensated for any charges that do apply.

Conclusion

RoFX was created to provide an automated trading solution to common trading problems, such as lack of experience and the downfalls of human emotions when it comes to trading decisions. The system uses a stop loss feature on every trade, along with promising to cover any losses through a special fund that has been set aside. There are several different packages to choose from, which can honestly become a little confusing if you aren’t used to dealing with this sort of thing.

On the bright side, the robot takes its profit from a predetermined percentage of your trading profits, rather than requiring a large fee upfront. You can even purchase the TRIAL package to test it out for 30 days if you’re on the fence about making a larger purchase. We were a little disappointed that developers didn’t spend more time talking about this robot’s strategy, however, user reviews seem to point to this being a legitimate system that is profitable, so it is seemingly worth investing in, even if you decide to start with a smaller package.

RoFX can be found at the following web address: https://rofx.net

Categories
Forex Service Review

Sniper Suite EA Review

Sniper Suite is an Expert Advisor that trades for its clients automatically, promising to be 100% stable and profitable since testing began back in 2001. Versions V1.5 and Ultimate Version X were recently released in June of 2020.

Overview

Like many other Expert Advisors, Sniper Suite was created to bring in profits for its users without requiring any effort from their side, aside from downloading and purchasing the software. This robot uses advanced price action and ATR indicators to make informed trading decisions while implementing a stop loss and cut-switch system to help cover any losses. Here are some of its most notable features:

  • Works on the MetaTrader 4 and 5 platforms with any type of trading account
  • Uses a stop loss on every trade
  • Cut-switch system covers any losses that are incurred
  • Developers recommend using the system on 3-5 pairs per account
  • Works with all currency pairs and timeframes

In addition to being versatile, the robot seems to be a good choice for beginners that might not be able to earn the same amount of profits as more experienced investors; however, the system’s price is a bit high, making it more difficult for beginners to purchase.

Service Cost

Sniper Suite offers three separate packages to choose from:

Basic Plan: Basic EA system, works with 1 live account and 1 demo account for $1,599
Ultimate Plan: Ultimate EA system, works with 1 live account and 1 demo account for $5,525

Combo Plan: Basic & Ultimate EA system, 5 live account licenses and works with unlimited demo accounts for $7,000

The recommended minimum deposit is at least $1,000 on a regular trading account.

Conclusion

Sniper Suite is a versatile product because it works with both MT4 and MT5, where many other EAs only support the earlier MT4 version. It also works with all currency pairs and timeframes and can be used with any type of trading account. Certain features also help to cover losses, including the cut-switch feature and the fact that a stop loss is used on every trade. While everything looks good so far, the cost of this EA system is likely to be a dealbreaker for many traders. With $1,599 being the cost for the Basic version with just one live and demo license, it’s safe to say this the system is very pricey. Our best advice is only to purchase this system if you can make a large investment so that the robot will be able to earn back your profits more quickly, as it does cost right at $8K for the Combo plan.

Categories
Forex Service Review

Vader Forex Robot Review

The Vader Forex Robot was brought to us by the same team that created the Odin trading bot. This automatic system offers several features that support truly hands-off trading with a 100% advertised profit rate.

Overview

Vader is an automated forex robot that combines Fibonacci sequencing with grid trading. Fibonacci levels are typically used to find levels of price support and resistance on forex charts; however, Vader turns these into unique entry and exit thresholds. The program also claims to keep brokers that are trading against you in the dark by hiding its TP and SL levels internally to avoid stop hunts. Here are a few more features that come with the system:

  • Easy installation
  • Designed to run unattended; fully equipped to handle every aspect of trading
  • Overbought/oversold reentries
  • Used by more than 1,000 traders on a daily basis
  • Works with more than 20 pairs
  • Easy drag and drop installation
  • Uses automatic stop loss and take profit levels based on a unique algorithm
  • Supports mini, micro, and full lots and automatically calculates the best size to use based on the account’s equity

Service Cost

When we checked out Vader Forex Robot’s website, a countdown timer informed us that the “lowest price ever” for the product was being offered for the next 17 hours. This is likely a marketing ploy to make traders hurry up and buy the robot, but there’s good news. The initial price seems to be $199, but the markdown price is only $99, so you shouldn’t have to pay more than $200 for this system depending on any special discounts. Do note that a $5,000 deposit is required for your trading account.

Conclusion

The Vader Forex Robot offers a unique, hands-off experience that can benefit entry-level traders, alongside more professional traders that just don’t have the time to sit in front of their computer analyzing charts and trading continuously. We see some interesting features built-into this program, like internally hidden TP and SL levels, a unique algorithm for calculating TP and SL levels, automatic calculation of the best lot size to use, and so on. The initial price of the robot is fairly low for this type of product, especially considering that it can run fully unattended, but you will need a $5K minimum deposit for the robot to work. Otherwise, this is a great system for beginners that seems to back up some of its claims of being profitable and convenient.

Categories
Forex Service Review

Customizable Support and Resistance Indicator Review

Customizable Support and Resistance is an indicator that was published in the mql5 marketplace at the end of April 2017. The indicator was created by Emir Revolledo, a developer with 7 products in total who is a self-described trader and programmer. The indicator was last updated to version 1.2 in August of 2017.

Overview

This indicator was designed to work either by itself or in combination with other indicators to provide better trading accuracy. The indicator works on the most popular trading platform MT4 and offers a special level of customization. Traders can choose support and resistance levels from Period 1 to Period infinity with any timeframe that is available. Traders can also manage the alert settings by turning the alarm on or off, or placing time limitations between alerts and setting a number of pips to be alerted at when the price is near the Support or Resistance line.

Service Cost

The indicator is priced on the lower side and the developer offers three pricing options. Traders can buy the indicator with 20 activations for $30 USD, or rent it at a rate of $14.99 for 3 months or $24.99 for one year. Many other indicators are priced around $100, but the developer has managed to keep this one in an affordable range for buying or renting. A free demo is available for testing and it has been downloaded more than 300 times since 2017.

Conclusion

This indicator was designed by an experienced developer with the goal of making trades more accurate. This is especially true when the indicator is combined with other indicators or EAs. We see a good level of customization options but it hasn’t received much feedback from users that have tested it so far. The fact that this indicator has only received six comments (some of which are from the developer) and has been around since 2017 shows us that it buying it may be a bit of a gamble, but overall it seems to be a simple indicator that could work well.

Categories
Forex Service Review

Mr Top Bottom Non-Repainting Indicator Review

Mr Top Bottom is an indicator that was created in March 2019 by developer Mostafa Fouladi. Mr Top Bottom is a powerful no-paint indicator that draws arrows on Tops and Bottoms. It has too complicated calculations but is very simple to use. Each arrow has a specific impact value of 1 to 10. If the impact is greater it means that the signal is probably more reliable, because it is calculated on the basis of a larger oscillation.

Overview

Main features of Mr Top Bottom:

  • He doesn’t paint again.
  • Identify the best tops and bottoms.
  • Useful for Trend Trading and Swing Trading.
  • Works well in Up Trend Market, Down Trend and Non Trend Market.
  • It works on any symbol and in any time frame.
  • Gives tickets with the lowest risk.
  • Very simple and easy to use.
  • Send alerts, emails and Push notifications.

The indicator has a sensitivity parameter that helps the operator to make it compatible with its own type of trading. It also provides access to an ATR and power panel of currency.

Parameters of Mr Top Bottom:

-Maximum bars: Maximum candles for drawing arrows. This parameter will not change the results of the calculations. Simply reduce the calculation time.
Sensitivity: You can set the Sensitivity from A to F. A means the lowest Sensitivity and F means the highest. The best sensitivity will be represented by E.

-Signal type: If you put it in “Current bar”, it shows you the current signs of the candle and if you put it in “Confirmed bar” it shows the arrows after the candle closes.

Information panel and configuration:

-Show candle time: If true, the candle clock countdown timer will be displayed.

-Candle Time Color: To set the candle time text color.

-Display panel: If true, the panel will be displayed. Including the ATR panel and Currency Power.

-Display panel in Tester: If you want to test the indicator in Strategy Tester, set this parameter to false to increase the test speed.

-Moving panel on X-axis: Moving panel on X-axis of graph.

-Move the panel on the y-axis: Move the panel on the y-axis of the chart.

-Unique identification for drawing objects: If you want to attach the indicator more than once in a chart, you must change this parameter to a new character symbol such as $, $!, %, etc.

Service Cost

This robot cannot be bought, it is only available for rent on the MQL market, at a price of 40 USD for a month, or 160 USD for a year. The free demo version is also available, so you can test it and check if this tool can be useful in your trading.

Conclusion

In short, we are talking about a robot that tries to take advantage of trends, locating tops and bottoms. Apparently the EA gets good results, since there are several users who have highly valued this robot, there are no negative criticisms. Mr Top Bottom is a robot suitable for all types of traders, its operation is very simple and its fundamentals are easy to understand.

This Forex service can be found at the following web address: https://www.mql5.com/en/market/product/36398

Categories
Forex Service Review

New Stable Profit EA Review

New Stable Profit is a robot that works in real accounts since August 2017. 100% of the trades in this system are based on algorithmic trading. The negotiation is based on trend correction movements, positions are opened depending on the strength of the trend and the volumes of negotiation according to a formula that the developer has not revealed.

Overview

The sets of positions have a common benefit, which is based on the corrective movement statistics of this trading instrument. The developer comments that when important economic news is published, it is recommended to disconnect the advisor, provided that there are no open transactions so that the performance is higher. Commercial recommendations set forth that for every $500 deposit, the user opens a 0.01 lot position.

This version of the New Stable Profit robot is adapted for EURUSD trading and is traded within a time frame of 1H. It is in this time frame that the EA gets its best results. Two things we like about this robot are, it doesn’t use Martingale, and it doesn’t use coverings in its operation either. Leverage of 1:100 is recommended for optimal operation. This robot is one of the best we have analyzed, as we have mentioned, it works continuously since August 2017. It has real statistics that can be consulted in MQL5, and the returns are staggering.

The yield of this EA is of 607% since its beginning, having obtained the following annual returns:

  • 2017 (August. December): 78.32%.
  • 2018: 128.39%
  • 2019: 55.82%
  • 2020: (January – March): 11.69%

It is fantastic that since its inception, every year it has achieved positive returns, but the most fantastic thing is that no month has ended with negative returns. (The month that has won the least has been November 2019 with 1.38%).

Service Cost

Obviously, it is an excellent robot, and as such its price is not cheap. In the MQL marketplace, you find it for $1,250 USD, although we have found third-party pages that offer it for just under $1,000 USD.

Conclusion

There are several user reviews of this robot and all are positive, so we are looking at a highly recommended robot whenever you are willing to make the initial investment of its cost. It also has a free trial version to test it before possible purchase.

This Forex service can be found at the following web address: https://www.mql5.com/en/market/product/40388

Categories
Forex Service Review

MultyTrend PA Indicator Review

Multytrend PA is an indicator that was created in April 2019 by developer Mikhail Nazarenko. This indicator combines the principles of Price Action and a unique filtering algorithm with feedback for three moving averages. This allows you to know what are the pivot points and current trends in any time frame with a high probability of success in the trades you are pointing out. Multytrend PA is an update of the classic Trend PA indicator and can be used with the principle of the three Elder screens, but everything that is needed is shown in the same chart, which is easier for the user.

Overview

Line 1 is in fast motion, while line 2 is in the main action, and line 3 is a slow movement to determine the direction in opening orders. The coincidence of the trend in the three movements is indicated by the arrows of the indicator and reports an incipient trend in the indicated direction.

Characteristics of this indicator:

  • It has no delay and gives a notable advantage over the Moving Average standard.
  • Simple and intuitive graphical interface, the configuration is minimal.
  • Configuration for each customizable MA for your trading style.
  • Alerts are activated when trends coincide on all three lines.
  • Optimized code and minimal load on your computer processor.

Settings:

  • Line 1 filtering bars (0 – line 1) – the period to calculate line 1 in bars.
  • Line 2 filtering bars (0 – line 2) – the period to calculate line 2 in bars.
  • Line 3 filtering bars (0 – line 3) – the calculation period of line 3 in bars.
  • Filtering mode (false – high/low, true – close)

Pantalla:

  • Line 1 width – line thickness 1
  • Line 2 width – line thickness 2
  • Line 3 width – line thickness 3
  • Draw in history bars – draw the indicator in the specified number of bars in the chart

Trend alert options include:

-Alert – activate alert when trends coincide in 3 Movings Averages.

-Send mail – send an email if trends in 3 lines are the same.

-Send push notification – send a push message to your mobile when trends in 3 moving averages are the same

Conclusion

In summary, we are talking about an indicator that combines the action of price with a trend prediction based on the crosses of 3 moving averages. It seems to be a reasonably comprehensive indicator and may be engaging in its concept. Due to the fact that it has not been on the market for a long time, there are not many comments from users to verify the usefulness of this indicator, but the few comments that exist are positive.
If you want to buy this indicator, it is available on the MQL market at a price of 55 USD. You can also rent it annually for 34 USD, and try out its demo version to make a purchase decision once you have analyzed it and understood its operation well.

This Forex service can be found at the following web address: https://www.mql5.com/en/market/product/37831

Categories
Forex Service Review

Renaissance Android EA Review

Renaissance Android EA is a robot created in March 2020 by German developer Jaye Ricci Ademola Puncha. The author says that this sophisticated EA is based on his years of experience with statistical, technical, and quantitative analysis and is awarded with modular tools and options that will be well appreciated by any real professional trader. It specializes in EURUSD 4H, but in principle works on most high volume FX pairs.

Overview

This intelligent algorithm monitors the movement of prices, timing, open and close sail ratios, as well as other indicators that will be hidden within the secure confines of a database. Compare this information with historical data in order to determine the probabilities of future events. Based on these probabilities, it dynamically modifies the trend direction and trade volume always within the modular parameters.

What makes this EA better than others is the fusion of total automation and the simultaneous possibility of absolute human control. So, it looks more like an android, hence the name. With financial markets constantly changing, the interface provides the opportunity to derive benefits from anomalies by modifying selected parameters continuously. This is possible because the principles applied have been universal for decades, yes decades. The results of the tests coincide with the live results and this strategy has been very good for the author over many years.

Key advantages of Renaissance Android EA:

  • No martingale or grid.
  • Stop loss will always be used for capital protection.
  • Protection of intelligent reduction.
  • It’s easy to use.
  • It is highly adaptable due to variable settings.
  • Integrated mechanisms inspired by real trade.
  • Very good risk/reward ratio.
  • It works on most brokers.

Renaissance Android EA Requirements:

-Brokers with commissions and spreads as low as possible, as well as a good server ping, low latency so that orders are executed as fast as possible.

-Brokers with a GMT+2/ GMT+3 server time (saving days). This prevents inaccuracies and trading errors.

-For EA I always recommend VPS hosting services. This allows for 24/7 trading.

-Diversification of instruments, markets, and strategies.

Adjust risk accordingly when trading during:

– Major events (FOM, NFP, etc.)
– Extraordinary crises (COVID-19, natural disasters, wars, etc.)
– Weekend

The author will only sell 5 licenses. Once sold, this EA will disappear forever. This helps to stop the alpha decomposition of this strategy. Obviously, this EA license comes with email support, free periodic updates, and other materials, such as a brochure and configuration files for additional FX pairs and time frames on request.

Conclusion

We are talking about a very professional EA and within the reach of very few. It is a tool designed for professional traders or capital managers. The few comments there are from users who have tried the demo version are very good, but the price of the robot makes it only accessible to very few. The sale price of this EA on the MQL market is 30,000 euros, and it is not available for rent, only the demo version and the contact of the author is available for any doubts or questions you want to ask before purchasing it.

This Forex service can be found at the following web address: https://www.mql5.com/en/market/product/47307

Categories
Forex Service Review

PZ Wedges Forex Indicator Review

PZ Wedges is an indicator created in September 2017 by Arturo López Pérez. Arturo López Pérez is a private investor and speculator, software engineer, and founder of Point Zero Trading Solutions.

Overview

The basis of this indicator is that it finds wedges, which are continuation patterns identified by converging trends around a period of price consolidation. It signals the trades using a donchian break along with the break-up of the wedge formation. This is a very user-friendly indicator. With customizable colors and sizes. It implements breakout signals and implements alerts of all kinds. For optimal use and to be able to see wedges of all sizes, which can even overlap, you will have to load the indicator several times in the table with different sizes, for example, 6, 12, 18, and 24.

Input parameters of this indicator:

  • Size: Refers to the size of the wedge patterns that are found.
  • Break up period: Donchian period to mark trade.
  • Max. History bars: Amount of bars passed to examine in the chart.
  • Color of bullish patterns: This parameter is self-explanatory.
  • Color of the bearish patterns: This parameter is self-explanatory.
  • Uninterrupted pattern color: This parameter is self-explanatory.
  • Line width: Size of pattern lines.
  • Color of bullish shoots: This is the color of the arrows to buy.
  • Color of bearish shoots: This is the color of the arrows to sell.
  • Arrow Size: This is the size of the arrows shown in the chart.
  • Custom Alert Name: Custom title for alerts raised in this chart.
  • Show alerts: Enable or disable screen alerts.
  • Email alerts: Enable or disable email alerts.
  • Push Alerts: Activate or disable push alerts.
  • Sound alerts: Enable or disable sound alerts.
  • Sound file: Sound file to play when a screen alert is activated.

Service Cost

If you want to try this indicator to get to know it better, a demo version is available in the MQL market indicators section. If you finally want to buy it, its selling price is 49 USD.

Conclusion

In summary, we talk about an indicator that is based on the search for a specific trend continuation pattern (wedges), and that warns us of its formation and alerts us for the decision to buy or sell a certain financial asset. We think it may be an interesting indicator to have as a complement to other indicators, for example, a trend indicator. Suitable for all types of traders, be it a beginner or someone who is more advanced. We haven’t found many comments from users who have already tried this indicator, and the few criticisms that exist are disparate, with both positive and negative feedback.

This Forex service can be found at the following web address: https://www.mql5.com/en/market/product/25264

Categories
Forex Service Review

Renko Trade Alarm Indicator Review

Renko Trade Alarm is an indicator that is designed to work on the graph with Renko and Mean Renko candles. This tool generates buying and selling signals on the chart and sends notifications to the user.

Overview

For proper operation, an offline table is required in which Renko Media candles are generated. In order to receive the “Scalp” signal, it is feasible to include more filters in the form of oscillators “Stochastic” and “MACD”.

Display of the signals:

-Swing – 123 Formations.

-Pattern – Double Bottom, Triple Bottom, Double Top, Triple Top, Formations 123 Reverse.

-Scalping – Periodic change in price direction, plus additional filters in the form of stochastic oscillators and MACD.

-Ichi – Signals that have passed the Ichimoku indicator filter.

One of the most common problems we have when having multiple Renko charts with different box sizes is that a trader could end up getting confused in the size of the Renko card box they are looking at. There are not many indicators that seem to want to consider this issue, which is where the Renko Business Assistant Indicator can be of great help. By adding this Renko Trading Assistant indicator to your Renko offline or Renko Median tables, you can show in real-time the size of the Renko card box as well as key investment points.

The Renko Trade Alarm indicator helps you especially if you have multiple Renko or Renko charts open. It might seem a little tedious to navigate between Renko’s different charts, as you will need to look at the Open/Close prices of the previous boxes to determine the size of the box you are using. With the Renko Trade Alarm indicator, with a quick look, the indicator will show you what Renko graphic is seeing.

Service Cost

The selling price of this tool is 30 USD, or you can also rent it for 10 USD per month.

Conclusion

In short, we are talking about a Renko indicator that can be confusing for beginner traders. For this reason, we recommend studying first what constitutes a universal Renko indicator to understand this tool better. There is a free trial version that we must try to know this indicator and the possibilities it has to enrich our trading or not. You can find it in the MQL market in the indicators section.

This Forex service can be found at the following web address: https://www.mql5.com/en/market/product/37572

Categories
Forex Service Review

Supertrend EA (Trend Trading EA) Review

Supertrend EA, a fully MT4 compatible robot, is an expert consultant developed for automated trading. Expert advisers are also called trade robots because they are responsible for managing operations on a fully automatic basis. If you’re using the trading robot, no human supervision will be required. However, the Expert Advisor you are going to use must be well tested in the market, in real-time, and the indicators must be optimized.

Overview

Supertrend EA is a trend robot that executes a trade when the trend changes, when a break occurs, when a correction occurs, and when pullback occurs.
The expert consultant alone won’t show anything on your chart. If you want the visual shape of your robot, you must attach an indicator that facilitates the company in a download file.

The parameters in which this expert advisor executes trades operations are basically two and are as follows:

-Change in the trend: If positions are opened, they will all be closed when the market trend changes.

-Stop Loss: This expert consultant uses the Supertrend indicator as a stop loss level.

Before you start trading in the live account with this expert advisor, it is advisable to use a demo account first. At first, it is advisable to learn to operate manually. When you feel confident about your trading strategy then only you should code that trading strategy in order to turn it into a robot. Generally, not all traders have the advantage of knowing how to code a system, and for that, there are robots like Supertrend EA. This expert advisor can be used in any period to trade any currency pair. It is not advisable to use this robot to trade other assets such as commodities, indices, or precious metals, as the EA is designed to be used in Forex.

The following features are included in the Basic version:

  • Reverse strategy
  • Max Open Operations
  • Directorate of Commerce
  • Order Comment
  • Filter of propagation
  • Administration of Money
  • Closing in the trend change
  • The pending order expires
  • Supertrend used as Stop loss

The following functions will only be available in the Pro version:

  • Trailing Stop
  • Break-Even
  • Candle Trail
  • ATR Trail
  • Time/day filter
  • Conclusion

Service Cost

This is one of the many tendential robots that exist. It can come to work well, and best of all, it has a basic free version. The Pro version that has the functions mentioned above has a price of 39.90 Swiss francs, which we consider a reasonable price.

Conclusion

We’ve checked third-party websites and found no negative reviews about this robot. So if you want to start in automated trading systems with a simple robot, this can be an excellent option.

This Forex service can be found at the following web address: https://quivofx.com/expert-advisor/supertrend-ea

Categories
Forex Service Review

Stable EX EUR/USD Expert Advisor Review

Stable Ex EA is a Forex trading robot that was created in March 2020 by German developer Vitalii Zakharuk. Vitalii Zakharuk is a prolific creator of automated trading tools and has many of them available on the MQL market.

Overview

Once the Stable Ex expert system is introduced, it works with the EURUSD currency pair and only with it. This system implemented the principle of five commands – that is, a maximum of five commands can be placed in one direction, after which the total position of the series must be closed by stops, either real or virtual. The trading system is designed to work separately with a series of purchase orders and separately with a series of sales orders, which makes the trading system sufficiently versatile. The expert passes all types of tests throughout history for the specified currency pair. In addition, the expert system is tested with several delay values and operates in a fully automatic mode. No adjustments are needed, use only the default settings.

The equilibrium point concept is used for a series of orders (total position), two independent systems to buy and sell. Including a built-in scalper technique with quick sails, it works like a scalper with sharp price movements. The integrated module for processing self-tuning indicators is trained specifically for EURUSD.

To test the trading system, first set all tester parameters as shown below. The test model can be either opening prices, and checkpoints or all ticks, or using real ticks. The trial period in the EURUSD pair and the H1 time frame is not limited, and you can test in the entire history of this pair.

Primary Benefits of Stable EX:

-Maximum 5 orders in one direction.

-Optimal indicators are selected.

-Adaptive risk management system and deposit protection system.

-The stops and also the final stops I work for a common position and not for a separate order, regardless of buying and selling.

Tips for Usage:

-Advisor Settings: Use the default settings.

-Symbol: EUR/USD.

-Term: H1.

-Brokers: Any brokers, spread and commission of up to 20 pips, leverage 1: 100, to be of low latency so that the transactions are executed as quickly as possible.

-Minimum deposit: 1000 USD nominal, the closer the nominal deposit the more the withdrawal will be declared.

The main parameters of the expert system:

  • Volume – the size of the initial batch, if we work safely.
  • At-risk – used to allow automatic batch determination depending on the tank.
  • Risk Percentage – the percentage of risk, relative to which the initial deposit.
  • MM risk – money management options.
  • Stop Loss – point loss (in points).
  • Take Profit – Take Profit (in points).
  • Grid passage – minimum grid passage (in points).
  • Additional parameters of the expert system:
  • Type of filling – the type of execution of the order by balance.
  • Lot decimal – batch accuracy (rounding to how many digits).
  • Parameters of the expert system constraints:
  • Min Stops Level – mandatory minimum distance level for stops (points).
  • Max Spread – the maximum extension to which a command can be opened.
  • Commission – The committee is listed in points (points).

Service Cost

Stable Ex EA is for sale on the MQL market at a price of 99 USD, and there is no option for rental versions.

Conclusion

In short, we find a robot of which the author speaks very well of him, but gives no information about the basis of his operation. So we recommend downloading the free demo version to try to figure out how it works and whether it is cost-effective or not. It is highly recommended to use a dedicated virtual server to avoid losing transactions that the robot does, otherwise, we should have the computer turned on 24/7. Because this tool has been on the market for a concise time, there are no opinions or criticisms from users who have been able to test the product and share their experience in the MQL community.

This Forex service can be found at the following web address: https://www.mql5.com/en/market/product/47022

Categories
Forex Service Review

Stochastic Ichimoku Cloud Indicator Review

This indicator indicates the stochastic crossing in the direction of the trend that is determined by the relative price position in the characteristic Ichimoku cloud.

Overview

The main features of Stochastic Ichimoku are as follows: 

-Flexible adjustments. Signals are filtered by bullish or bassist bars (parameter “BUY – only on bullish bar; parameter SELL – only on bear bar”).

-Stochastic crossing configuration levels (parameters “BUY-signal if Stochastic under this level” and “BUY-signal if Stochastic under this level”).

-Ability to use the Ichimoku cloud for higher time frames (parameter “Time frame of Ichimoku Cloud”).

Label in the top right corner will show you the direction of the trend:

-Up arrow indicates that the price is above the Ichimoku cloud;

-Down arrow indicates that the price is below the Ichimoku cloud;

-The price is in the cloud (plane: in this circumstance, the signal will not be generated).

The signal is activated not only when the bar is closed (signal formed), but also in the current bar that is not closed yet (signal likely). It has enough time to analyze the reality of the market and allows you to take time to make a decision and calculate trading parameters.

The indicator can generate an early exit signal from trade when the stochastic lines intersect inversely (against the trend). You can activate (ON) and deactivate (OFF) this option using a button in the bottom right corner of the chart (adjustable parameter). Activate this button only if you are in the market and want to close a trade according to the inverse crossing of stochastic. You can disable this chart button if this option is not required (“ON-OFF – Reverse signal button”=false).

In general, good results are obtained with the default parameters if an Ichimoku cloud time frame is set a level higher than the current one. For example, attach the indicator to a graph with М1, and set the cloud time frame (parameter “Timeframe of Ichimoku Cloud”) to М5. If a graph has a М30 time frame, set H1 as the cloud time frame, etc.

Parameters:

  • Period K – period to calculate the Stochastic %K line.
  • D Period – average period for calculating line %D.
  • Deceleration – value of slowdown.
  • BUY – Buy signal appears if Stochastic is below this level.
  • SELL – Sell signal appears if Stochastic is above this level.
  • BUY – A bullish bar only.
  • SELL – The bearish bar only.

Conclusion

In short, we are talking about a well-known indicator (Ichimoku) that generally gives good results. If you want one of the multiple indicators of Ichimoku that exist in the market, this can be an option to consider, since its price ($30 USD) is affordable, and the indicator accumulates good comments from its users. The indicator can be found in the MQL market, and you also have a free demo version.

This Forex service can be found at the following web address: https://www.mql5.com/en/market/product/9925

Categories
Forex Service Review

Stochastic Oscillator EA Review

The Stochastic Oscillator Indicator was created in the late 1950s by Dr. George Lane. The term stochastic means the point at which a current price is related to its price range over a period of time. The stochastic oscillator shows two lines (Main and Signal Line) and its support and resistance level. This indicator is included in Metatrader 4 and 5, and the default settings are K% 5, D% 3 Slow 3.

The stochastic indicator is a great tool to identify overbought and oversold conditions over a specific period. The stochastic oscillator is the preferred indicator for many traders when the price is trading in a range because the price itself is oscillating, leading to more reliable signals from the stochastic indicator.

Overview

The stochastic oscillator is a handy indicator when it comes to evaluating the moment or the trend force. The stochastic oscillator, and oscillators in general, are presented in an easy-to-understand manner with transparent buying and selling signals. However, it is likely that excess in these signals, without a deeper understanding of stochastic oscillators, will end in many doubts and frustration for the trader.

To avoid such frustration, new traders will need to have a solid understanding of the underlying mechanics of the stochastic oscillator seen concerning current market conditions.

A stochastic oscillator EA is a timing system that automatically calculates whether the price of a security is over-bought or over-priced over a specified period of time. The EA weighs the most recent price level substantially as a percentage of the (higher, lower) range over a defined period.

The stochastic oscillator EA has two moving lines that oscillate between two horizontal lines. The black line called %K and determined by a specific formula, at the same time as another red dotted line is also a three-period moving average of the %K line..It is concluded that the price is overbought when the two moving lines break above the upper horizontal line and are exceeded when broken below the lower horizontal line.

The oversold line represents price levels that fit the top 80% of the recent price range, over a defined period. Also, the oversold line represents price levels that fall within the bottom 20% of the current price range.

Also, the stochastic EA indicator provides excellent insight when programming inputs. When both lines are above the oversupply line ‘D’ (80), and the %K line crosses below the dotted line %D, a possible short input signal is considered and vice versa when the %K line crosses above the %D line (20).

Traders should not trade blindly based solely on over-purchase/oversold conditions. Traders should understand well the operation of this indicated then to know how the dynamics of the EA is.

FORMULA FOR THE STOCHASTIC OSCILLATOR 

The following calculation is presented for a stochastic indicator of 14 periods, but ultimately can be adapted to any desired time frame.

Calculation of %K:

%K = [(C = L14) / H14 -L14)] x 100

Where:

C = last closing price

L14 = Low minimum during period

H14 = Highest during the period

Calculation of %D:

%D = simple moving average of %K (the simple moving average of 3 periods is the most common)

Conclusion

Traders should understand where the stochastic oscillator stands out and where its defects lie to get the most out of the advisor. This is an ideal EA to combine with another trend EA. Like all Eas sold by Quivofx, these have reasonable prices in addition to a free basic version. The Advanced and Pro versions are priced at 29.90 and 39.90 Swiss francs, respectively.

PROS:

Clear input/output signals

Signals appear frequently (depending on time settings selected)

If trading against the trend, prices may remain over-bought/oversold for long periods

Available in most graphics packages

Conceptually easy to understand

CONS:

May cause false signals when used incorrectly

If trading against the trend, prices may remain over-bought/oversold for long periods

This Forex service can be found at the following web address: https://quivofx.com/expert-advisor/stochastic-oscillator-ea

Categories
Forex Service Review

TPA True Price Action MT4 Indicator Review

This indicator coded for the MetaTrader 4 and 5 platform belongs to the paid category and has a specific way of giving signals and trading use. The first version is published on the 3rd of July 2019, it is not a very old indicator but has received some attention. The developer is Janusz Trojca from Poland now under the team name of InvestSoft. This team has a total of 10 products with good ratings, some of them complement the TPA indicator for a complete trading system. As the name describes the indicator is based on the Price Action strategies known for the use of support and resistance lines. The authors developed a blog website investsoft.eu/ with several articles about the TPA indicator and how to use it in conjunction with others.

Overview

The page presenting the indicator on the MQL5 may look too complicated and probably will turn away customers looking for a simpler solution or just do not want to invest time learning how to interpret the signals given by the TPA indicator. The developer first wants to point out that TPA is not repainting and gives signals once the candle is closed. It can be used as the confirmation indicator but also as an exit. There are multiple ways a trader can use the signals. TPA is versatile when it comes to where it is used and on what timeframe. This means it is universal.

TPA is presented as a tool that is not the mainstream, thus avoiding the common techniques used unsuccessfully by the 90% of traders. These are characterized as misleading, most of the traders do not make a significant success if any, just because they are using the tools market makers know about and predict. However, the page does not say anything about the indicator’s exact strategy and formulas. The latest update is version 2.1 from November 2019 giving the indicator a cleaner code, the TAP line, and performance optimizations.

TPA indicator developers made a Telegram group chat for owners of the indicator where trading and other support are delivered to those that need it. Since the indicator is intended for those that know a bit about trading or for those that are willing to learn, it has the guide that is not short and could be harder to follow for some users. The demo is available and mentioned that even it could be tested in the Strategy Tester module of the MT4, the results do not count for the other factors traders implement when trading. Therefore, it is not just a plain signal following, the results in the simulation may not be valid.

In the blog article manual for the TPA indicator, we can see the scope of usage. It is essentially a trend following strategy using higher timeframe filters, price levels, risk management, and other measures outside the indicator function. The TAP line is added as the filter to counter small corrections that do not change the bigger underlying trend, it is a noise that should be filtered. The main idea is to follow the market makers and big trends they produce. 10 questions are designed for you to follow the logic of trading and using the TPA indicator.

According to them, the TPA line slope determines if the market is ranging and if there is a trend to follow. The higher timeframe is also important to analyze. Other steps are required too and involve subjective analysis of other signals, such as Fibonacci levels. The manual is also written in a hard to read English and not everyone can understand what is required. Therefore, this indicator is not for beginners. Many will be in doubt with the subjective interpretation of inconclusive TPA signals. There are some pictures as examples to see how the TPA line on 50 period acts as a rebound level, considered to be used by many market makers.

Service Cost

The indicator price is $198 for 5 activations or to rent for one month for $40. The developer states that the demo may not show the valid results in the Tester module but it does not mean trader cannot use and try the Demo without the Strategy Tester.

Conclusion

As the indicator is not explained very well and it requires some trading knowledge, it does not receive the popularity as some other indicators. The higher price is also a barrier for more indicator users. For those that understand and have used for this one after the demo trial, it is not a high price to pay. As for the rating, the TPA indicator has 4.5 stars out of 38 reviews. The review sample is high enough to have a representative image of user satisfaction. We have found only 2 users with a 1-star rating but did not disclose why the TPA is bad. The rest of user reviews that are not perfect state that TPA does not show the exit points. In our opinion, TPA has potential but requires a good amount of forward-testing and your own set of rules on how to interpret the signals. The support Telegram channel is a very good starting point if you decide to use this one, just do not expect to understand it very quickly if you are new to the scene.

This Forex service can be found at the following web address: https://www.mql5.com/en/market/product/39932

Categories
Forex Service Review

Scalping Max EA Review

Scalper Max is an Expert Advisor for the MetaTrader 4 platform designed to conduct scalping trading on major currency pairs. As per the developer’s words, it is not limited to one scalping method but more of them. It is fully automated and incorporates AI that has been updated. The latest version is 2.0 from 17th September 2019. The initial version is just 3 days older meaning the EA has not received updates except one. The developer of Scalper Max EA is Xuan Nguyen Thanh from Vietnam.

Overview

Scalper Max does not have a great introduction story, the MQL5 page describing this EA does not have a lot of content, especially not for the price. The intro states an AI that can learn and adapt to market conditions consisting of many algorithms. It can be used on many broker accounts with the commission or no commission and higher spreads. As usual, since scalper EAs require very good execution times and no slippage, the setup has to be with brokers able to deliver great conditions. Scalper Max does not use discouraged methods such as Martingale, Arbitrage, or Grid. Trades have to Take Profit and Stop Loss levels set and optimized by the EA.

It is not disclosed how the EA works and what the AI is exactly doing when calculating these levels. It is recommended to use the EA on GBP/USD, GBP/JPY, GBP/AUD, EUR/JPY, EUR/USD, USDJPY, USD/CHF, EUR/CHF, EUR/AUD, and NZD/USD on M1, M5 and M15 timeframes. There are two default optimized settings the developer has published in the comments section. They are optimized for commission or no-commission accounts. Brokers tested are Tickmill, ICMarkets, and NordFx.

Settings for Scalper Max are simple and in our opinion does not feature a lot. What you can change is set the Autolot management – risk-based trade size allocation set the minimum allowed spreads or slippage, maximum lot size per trade, and some cosmetic and appearance customization. Relative to the price of this EA, these features are not attractive. You cannot have a glimpse of what indicators are used, what logic, or what scalping method based on these settings.

The performance charts of Scalper Max are impressive, although we are used to seeing extreme results. Now the author did not use a real account for chart presentations, but on the Tickmill demo account. Based on the image, the EA produced a nice, steady-growing chart with a 483% gain. By looking at the winning percentage, it Is very close to coinflipping, 51% of trades won. The logical conclusion would be that this EA is great with Money Management but we do not know how the EA trades. The maximum drawdown is 8.1%.

On the MT4 Strategy Tester module, the EA showed different results. GBP/JPY pair was used and the winning percentage is 63.95%, much better than 51%. Maximal drawdown is an impressive 1.63%. Profit trades are at least double the size of losing trades meaning the EA cuts short trades that do not come in the right direction, not using the extreme Stop Loss levels as with some EAs and therefore also limiting the drawdown to just 1.63%. GBP/USD pair backtesting on M5 using the 99% precision modeling also shows similar results.

The maximal drawdown is even lower, 1.17%, 63% of winning trades, and the same good Money Management. Interestingly, GBP/AUD testing on M% timeframe shows just 51% winning trades but with similar gains as other pairs. The average consecutive wins number is the same as the average losses – 2. On the EUR/JPY, the success rate rises to 68.09% and this does not change the fact Scalper Max has a very good Money Management and manages to show only charts with consistent gains and no drops.

Service Cost

Now, the price of the Scalper Max is no less than $2500 to buy (6 activations) and $1800 to rent for a year. This extreme price has no presented arguments of the tech incorporated in this EA and no proven work behind it. The charts and what little content about the EA are showing are simply not enough. One could think this EA is fake but a demo is available so you can test it in various ways. Of course, price this high reflects on the EA popularity.

Conclusion

Scalper Max received bad ratings, based on 7 user reviews on the MQL5 Experts repository. The users complain about very different results than what is presented on the developer signal page and in the EA Overview. The main concern is the poor performance, some have changed brokers and tried different things just to see the same bad results. Some of the reviews are:

“Refund, this is a liar, this EA will not make you profit, only loss, he has no signal of real account number, every time you ask him, he will only hide”, or “For the month of using the adviser – only loss, wasted money, Alpari broker account ECN.Pro. I would like to return the money …”

There are also two perfect score reviews claiming good results.

In our opinion, this Scalper Max can be tested to confirm these results. Still, it should be noted that you could probably buy 10 automated software products for the price of this one, that has better ratings, testing, and performance. Given the fact that the developer also has one other product selling for $30,000, we can confirm this is not a serious proposition.

Categories
Forex Service Review

PipTick VWAP MT4 Indicator Review

PipTick VWAP for the MT4 platform is a special form of the Volume-Weighted Average Price indicator. One of the most used Moving Averages apart from the EMA or Exponential Moving Average is VWAP for its adaptability to recent market changes. Michael Jurnik from the Czech Republic is the developer of this tool, partner at PipTick. They have published 59 products, many of them not having much popularity or ratings.

Overview

The initial version of PipTick VWAP MT4 was released on 25th February 2015. It is an old indicator that has received just one review for that time. The latest update was on the 12th of May 2016 to version 1.3 where calculation accuracy has been improved and added some parameters for visuals. This indicator is also available for the MetaTrader 5 platform, both are in the paid category on the MQL5 market.

There are many ways you can use the VWAP and is a part of many trends following systems when combined with other tools. The specifics of this version is that it works in five modes. Moving mode sets the indicator to calculate as the Moving Average, while in Daily mode the VWAP is calculated from day start to the end, thus giving the traders daily range often used in trading. Weekly and Monthly do this for the selected periods and Session Time gives the ability to set a custom period for this calculation.

VWAP will be displayed as a band on the chart and thus it could be used as Bollinger Bands for reversals. Still, the best way to use the tool is for trend following and setting the Risk Management levels such as Take Profit and Stop Loss. There are 3 bands, each of them represents Standard Deviation on different sensitivity. If you combine other Moving Averages you may have a great trade exit system where the cross with the deviation line will signal precise trend exhaustion. The author suggests using the indicator with Price Action or Candle patterns.

The main features of PipTick VWAP are several calculation modes, first, second, and third standard deviation levels, customizable visuals, EA friendly, and is described as fast and reliable. There is also a demo video showing the indicator in action although not much can be concluded from it, it will just plug the lines and the channel and the rest can be used and combined in so many ways.

The settings panel will give you the ability to adjust the input and output parameters. Input parameters are Volume Method (to use real or tick Volume), VWAP mode, MA Period, colors for the lines, and visibility of all the lines for deviations, etc. Output parameters allow you to set the VWAP value, and bottom and top values for the first, second, and third standard deviations. These settings give enough freedom to test and adapt the indicator to the trader’s system and also opens the creativity.

Service Cost

The price of PipTick VWAP is $57 to buy and have 50 activations. Renting starts at $17 for one month and $37 for 3 months. A demo is available and it has been downloaded 959 times at the moment of this review. This shows some popularity but as the reviews and comments go, it Is very low.

Conclusion

PipTick VWAP for MT4 has received only one rating and it is not positive:

“This project seems to be stoped. It hasn’t been updated since 2016 and the developer doesn’t answer questions since 2018.”

The indicator consumes a large amount of CPU if the [Max bars in the chart] in the Options menu has a large value. I’ve proposed a simple solution, but it doesn’t respond, so I can’t use it and I’ve had to uninstall it.” Based on the comments section we have noted the developer did not notice user complains but plans to update the performance issues in version 1.4 soon. In our opinion, the price tag for this simple indicator is too high, not much is done here and this kind of indicator could be found on the internet for free, probably even on the MQL5 marketplace.

This Forex service can be found at the following web address: https://www.mql5.com/en/market/product/8187

Categories
Forex Service Review

MA Multi Moving Average Standard Indicator Review

MA Multi stands for Moving Average Multi Timeframe indicator that is useful in many ways and for many strategies. The developer of this indicator is Dmitriy Susloparov from Russia having 16 products offered on the MQL5 marketplace. None of them have received much attention and only MA Multi and one more indicator have ratings. Most of the indicators published are similar, they are basic indicators made multi-timeframe on a single chart. MA Multi also exists for the MetaTrader 5 platform. The first appearance on the MQL5 market is on the 3rd of May 2017 and updated on 31st, a few days later on request by one user. The developer responded quickly and made the additional option to turn off redrawing on closing each candle, updating the indicator to version 1.1.

Overview

MA Multi will work with any combination of timeframes on a chart, thus plotting several lines for each timeframe you turn on. As the Moving average has a multitude of uses, having a combination of default MT4 indicators, and this one can result in having a completely new indicator generating unique signals. It can even mean a whole new trading system. As you add channels, ATR, and other indicators on the same chart, technical analysis, and interpretation open a plethora of possible signals. Therefore, this indicator does a simple job, this is basic coding, and that are many free versions of such indicators, but, having this one customized to your liking is a nice gesture. MA Multi will be displayed as a Step MA for higher timeframes as this is how it looks like when you switch. Each line has its color, width, or whatever visuals you like.

In the settings you can set the Period, Method for calculation of the MA, the new Redraw option, and a list of timeframes to show or disable on the chart. The developer has uploaded a video showing a practical example of how the indicator can be used in trend following strategies, still, as we have mentioned, the possibilities on how you can use this are endless. The video is in Russian but it is not necessary to understand the use of multi-timeframe MA.

Service Cost

The price of this simple indicator is $10 to buy and having 5 activations. There is no possibility to rent this one but a demo is offered.

Conclusion

The developer is very open to additional updates. It seems, so if you have a special request to adapt the tool, you can send a message in the Comments section. Unfortunately, the price of $10 is low, but the indicator is very popular and has wide availability on the internet and forums for free, from other coders. It that sense, purchasing this one may be a good idea if you plan to ask the developer about updating with your needed features.

This Forex service can be found at the following web address: https://www.mql5.com/en/market/product/22642

Categories
Forex Service Review

Infinity TrendLine Indicator Review

Infinity Trendline is a trend following indicator with integrated solutions for Taking Profit and Stop Loss management. It is developed for the MetaTrader 4 and 5. It was a top free indicator once it showed up in November 2018 on the MQL5 market and since it has received many updates. New things are mostly about adding features and updating the code, enriching the indicator with new goodies. The latest update sets the version to 52.0 and is updated recently, in March 2020. Evgenii Aksenov is the author of this popular indicator/ trading system consisting of few indicators. Main takeaways are the easy-to-use trading signal system, good support, and the fact this is a free indicator that is usable even though the PRO version has more features.

Overview

Infinity TrendLine mainline may look like a kind of Step Moving Average. The author is not very clear on the inner workings on this main trend confirmation indicator but based on the settings we believe it is the ATR or Average True Range, a classic one for measuring volatility. In the Overview page, this is just explained by analysis of the average range of bulls and bears. The indicator will show you a trend signal with an arrow and it will automatically calculate 3 Take Profit levels and a Stop Loss. There is a panel on the side that shows you the probability of the price reaching the first, second, and third Take Profit. Based on this you can trade signals with the highest probability. Note that the free version will not give you the Take Profit 2 and 3, the result based on historic trades will not be shown, and many of the customization options are turned off.

Consequently, the free version feels like a marketing tool, and judging by the Overview page full of marketing cannons, the developers are heavily oriented to sales. This is not always a bad sign, the free version still has some usability. You will have a quick symbol selection pane once you click the “Free” button with the timeframes and the success percentages on each, giving you the ability to scan for the best opportunities. This rounds up on how to use the indicator, each signal optionally has a higher timeframe filter for better noise signals reduction.

These functions are available in this free version. Unfortunately, a good portion is left out, such as calculation type option, amplitude settings, Take Profit and Stop Loss settings, and adding custom symbols for the probabilities scanner. In the early days, the indicator had Amplitude, Period, and other settings for the Zig Zag indicator were available, but it seems the free version is updated in favor of the PRO, therefore becoming the sales channel. Even the screenshots on the Overview page are using the PRO version, and the feature list presents only what is in the PRO. Furthermore, if you buy the PRO version you are offered with other accompanying indicators from this developer for free, such as the HTF_Histogram indicator which seems to be necessary to determine the Higher Time Frame trend. More bundling sales techniques are evident. The developer will offer another indicator for free with the purchase of two of their products.

Conclusion

Infinity TrendLine with all these feature downgradings after each update still is useful as a trend baseline. Take Profit and Stop Loss levels can be used to a limited degree, but the true value of this line may be in its step-like plotting and a precise price crossing once the major trend is changing or losing momentum. As for the ratings, this one received 4.8 stars based on 60 reviews. 435 comments are signaling this indicator is still popular, giving traders a solid solution for trend trading. Although, most of the experienced traders will avoid such products providing automatic Take Profit or Stop Loss levels and the probabilities. These features are not transparent enough for them. Infinity TrendLine, even the PRO version is more for those that do not know to manage these key Risk Management levels and want a ready-made solution. As with all “All in One” products, they excel at nothing and are mediocre in everything. A notable hard to find average review is from Simone Gargano stating:

“The indicator is good, very easy to use and clear BUT as you may know before considering an indicator as good you would have tested it at least 6 months. I’ve loaded this indicator to my Koder Killer EA (used to test the indicators) and is not showing good results over the last 4 months like the indicator’s success rate shows (65%+ on average). I rate it 3 stars for this reason at the moment.”

All other positive reviews are a reason enough to test this indicator and if you need more options, consider the paid PRO version.

This Forex service can be found at the following web address: https://www.mql5.com/en/market/product/33083

Categories
Forex Service Review

Hamster Scalping Automated Expert Advisor Review

20This is a MetaTrader 4 Expert Advisor that uses the popular “hamster” name commonly attributed to scapers working during night sessions or in very low volatility periods. The latest version is Version 9.0 updated on 9th June 2019, the first version was published in late 2017. Also, there is the MT5 version. Since then the EA received a few upgrades including the ATR filtering. The Author is a Russian named Ramil Minniakhmetov, he is the developer of 22 other products and 2 signals such as Rebate Robot, Brazil System, EA Black Star, or “TheFirst” signal service. Most of his work has above 4-star reviews on the MQL5 repository. His website is www.orangeforex.ru.

Overview

Hamster Scalping EA is fully automated and does not use the martingale strategy. Martingale is a known method of investment for many years and is allowed in casinos and other gambling institutions since it always ends with a loss. This type of EAs which use night time scalping is probably the most dominant on the market. Hamster Scalping is using two indicators, the RSI and the ATR. RSI is used to provide a signal on the 5M timeframe to which the EA is designed to and on the EUR/USD currency pair GMT+2. ATR is used to filter the signal if the volatility is too high. Since this kind of scalping is very sensitive and any bigger movements can throw off the indicators, ATR is one of the better indicators used for this purpose.

The development of this EA took almost 4 years, much longer than the typical night scalper. Hamster Scalping’s performance is variable but according to the author’s readings, it is highly profitable but with a high drawdown of more than 50%. This is typical for EAs that allow relatively high Stop Loss tolerance to close the trade in small profit after a rebound if it happens at all. It is not unusual to see two Stop Loss triggers to counter several weeks of profit trades.

General recommendations are $100 minimum deposit with an ECN broker with fast execution times and low spreads, up to 5 points. If you are using VPS, the latency must not be higher than 3ms. Brokers with 4 or 5 digit price quoting will work, settings value entry should be in points regardless. The EA allows for enough customization although tempering even in small amounts may result in a very different performance.

Hamster Scalping allows changing the periods for both ATR and RSI, signal levels, Autolot size calculation, Take Profit and Stop Loss levels, Virtual Stop Loss or Take Profit (it is not relayed to the broker server, it is internally set instead thus invisible for the broker), and almost every function of the EA is configurable. The EA also features the newsreader, that can be adjusted to filter trading for high, mid, and even low impact news. The news feed comes from the ec.forexprostools.com, so it is not the most popular news feed media. Some additional tweaking is required to set this in the EA settings. You can set to avoid Wednesday triple swaps, although some brokers have this on Fridays.

Hamster Scalping is a relatively simple EA with a good amount of testing behind it and is not abandoned by the devs in favor of new products. Most of the developers and companies decide to focus efforts on more complex EA after initial success and often leave some good EAs outdated and unreliable to new market conditions. It is a good sign to see this simple EA recently updated.

Service Cost

Hamster Scalping price is $99 to buy and $45 per month if you rent it. For this, you will have 5 activations. The demo is available. This price is not high but compared to other night time scalpers it is in the mid-range. Still, since it has a good amount of testing and is being updated, it is well worth the money, especially if the demo works for you.

Conclusion

The attention this EA has received is high. There are over 20,000 comments on it and over 500 user reviews. On average the score is 4.4 at the moment of this review which is very good, there is a good number of reviews so the rating is based on a large sample, confirming a solid user satisfaction. Although, on the side, some of the reviews could be based on short term EA usage, where bad trades did not yet happen. Some of the notable negative reviews are mentioning the high Stop Loss tolerance, for example:

“Too risky!! BIG STOP LOSS…small profits..no loss position management…It’s a lottery!”

Or a 4-star review from Dhruv Patel:

“A lot of people with 1 star review are correct with their experiences with this EA. However, this EA has a lot of potential. I have made modifications to the set and put external measures in place to avoid those disastrous trades that gave this EA 1 star and backtested for 9 years. It works like a charm! Money management is crucial with this EA. This EA does not manage the big losses well, thus human intervention is required.”

Our recommendation is to try the default settings on the demo account, both backtest and forward test. The price of $99 is probably low enough for this EA to repay itself a few times over.

This Forex service can be found at the following web address: https://www.mql5.com/en/market/product/25853

Categories
Forex Service Review

FXCharger Trading Robot Review

FXCharger is an Expert Advisor (EA) for the MetaTrader 4 platform. It is on the scene since 2016 and is updated in 2019 to look more professionally. According to external sources, the company behind FXCharger also has other domains and products such as FXMower.com, ForexBringer.com, ForexSeven.com, and so on. Some of these brands are out of business. FXChrger has performance charts uploaded on myfxbook.com and some of them are verified. Note that this EA still does not have wide popularity and according to the charts has good performance.

Overview

FXCharger is a martingale EA at its base but includes adaptive Stop Loss and Take Profit levels according to market conditions. We believe this is based on volatility but it could be some other indicator values. There are two versions, FXCharger Basic and FXCharger Max. They are essentially the same EAs except the Max version is also applicable for the AUD/USD and EUR/GBP currency pairs, not only for the EUR/USD as the Basic version.

According to the developer, the EA is designed to have frequent trades, trades every day. This means the EA is also for the less patient, young traders that like to see results right away. The EA does not hold positions for long, it should end a trade in 1 to 4 days max. The EA setting allows the user to ser the maximum possible risk amount so every position has its limit to how much drawdown per position EA can tolerate. This function is more or less common with many EAs, although, for promotional reasons, the devs decided to state it as a special feature. Even if the EA is not connected to the market anymore for any reason, the Stop loss should be executed. This means the Stop Loss or Take Profit is set onto the broker server thus it is not invisible and acts like a normal Stop Loss set from the MT4.

Now, this setting could be crucial for martingale EAs. As with other martingales EAs, FXCharger has the same sudden drop patterns in the chart followed by gradual and smooth gains until the next drop and so on. Setting the low-risk tolerance could mean the trades will be closed before they can rebound to positives and Take Profit levels. As such, if this setting is not optimal, or better to say not by developer defaults, the EA performance could be very different.

On the website, there are 3 points where it is described (1) you will trade in profit thanks to smart Take Profit levels, (2) save deposit with smart Stop Loss, and (3) use reliable setting to get a stable profit. We cannot agree that even the best Take Profit leveling can make you profits but we agree that optimal Stop Loss protection can at least save you from complete account busting in a short time. FXCharger settings should not be tickled with is seems, as the devs have a refund policy in 30 days only if the EA is working by default settings.

Myfxbook performance charts show high levels or return. The EUR/USD pair shows gains of 1528.63% since Merch 2016. Three dips are evident, showing the Stop Loss in effect and according to our estimates, even after FXCharger made about 1400% gain, in May it dropped to 1100% from one Stop Loss trigger, 4 Stop Loss triggers in that month would almost bring the account to breakeven. Drawdown is increased to 29.46% in 2020 since the EA performed poorly in January and February piling the losses up to -15% per month. FXCharger average trade length is 5 days, a bit longer than advertised, won 60% of trades, winning 55.59 pips on average, and losing -79.86 pips. The Sharpe ratio is very low with this EA, a mere 0.01, meaning the returns do not compensate for the risk taken. The year 2016 and 217 were much better for this EA, none of the months ended negative and in 2018 19 and especially the beginning of 2020 is disappointing. Still, the EA has a total positive gain. The broker used for the testing is FXOpen.

The AUD/USD testing gained 580% since min 2018 and 14% on average per month. In contrary to the EUR/USD, the 2018 and 2019 year are all positive for FXCharger but seems to be off since July 2019. The trade success rate is 60%, the same as with the EUR/USD with a bit better Sharpe ratio of 0.04. The average win per trade is 54.57 pips and the average loss is -62.08 pips. The exposure is set to private. The drawdown presented on the website is an extreme 54.72%. The EUR/GBP pair performance chart and analysis is not published.

Service Cost

The FXCharger website will not disclose what indicators are used and the major content will be the statistics section. You will see multiple charts for the backtesting results for the EUR/USD, AUD/USD, and the EUR/GBP pair. FXCharger works on the 1-hour timeframe and has the normal and High Profitability modes.

The cost for the Basic version that works only on the EUR/USD is $385, which puts this EA in the mid to higher price range. For this price, you will get one license for any account, unlimited account online changes, and lifetime 24/7 support. A 30-day refund policy is valid if settings are not modified. FXCharger Max version is $495 which is regarded as expensive. The Max version has the same benefits but works with the other currency pairs mentioned. No demo is available.

Conclusion

In our opinion, this website does not give out enough information about this EA given the price range and does not mention the martingale strategy that is applied. Users report mixed results from major benchmark sites. Some of them state the refund policy is just a fake promotion:

“Fraud, a liar company. 5 days ago I bought it on the forexstore.com. Thither are written that 30 day warranty for the EA, I wrote that the robot did margin call on the demo account , he’s wrote this is not enough for a refund. I question what the warranty applies to??? If i could not give an asterisk. Nobody take the https://forexstore.com page for anything. Company fraud and criminals.”

Another seemingly unhappy reviewer wrote:

“Other reviewer is right that this company and other sites own by this EA developer are luring people in by fake 30 day money back guarantee. Run away.”

Others, however, say the support is responsive and that they have solid results. The final rating is mixed but not enough for anyone at this price for a martingale EA, especially concerning the extreme drawdowns and inconsistent results in 2020. Another concern is the undisclosed exposure and no performance since 2019 on the AUD/USD pair. Finally, we can only see backtesting results and no live results for the EUR/GBP. The website does not set strong selling points and even the 30-day return policy validity is arguable.

This Forex service can be found at the following web address: https://fxcharger.com/

Categories
Forex Service Review

TickUnit Scalper Currency Strength28 Pro Review

TickUnit Scalper Currency Strength28 PRO is a new indicator type on the scene popular with the scalper trading strategies. It is designed for the MetaTrader 4 and published on 5th July 2019. Since then it has received frequent updates with very good additions such as to save tick data for faster recovery. The developer of this combo indicator is Bernhard Schweigert from Morroco and he has 12 products offered on the MQL5 repository, most of them are popular and have very high ratings from the users. He made a currency correlation/strength indicator using Tick-Units data on 28 currency pairs, or all of the major currency combinations. It belongs to the paid category and could be regarded as a complete trading system.

Overview

TickUnit Scalper Currency Strength28 PRO is a combination of Advanced Currency Strength 28 and Advanced Currency IMPULSE with ALERT, both of them, of course, is the developer’s separate product. Currency Strenght can be used on 11 different tick units, 1, 2, 3, 4, 5, 6, 10, 12, 15, 20, and 30 seconds. You will have the convenience to have a single chart for all 28 pairs trading under the subwindow. Now, since the indicator is used on the lower than M1 timeframe, up to 30 seconds, it is not the standard MT4 indicator. Advanced Currency Strength28 Indicator is used for the standard MT4 timeframes and is a separate product. Tick Unit Scalper Currency Strength28 is presented as the first tick unit indicator on lower timeframes than M1. As such, fas broker conditions are a must, also the spreads must be raw. A user manual is made and linked in the ‘Overview’ page. It is detailed with gif visuals, although not very clear, traders that have a bit of trading and MT4 knowledge will understand how to use this special indicator.

The feature list is interesting but now everyone will see the value-added just by reading the description. One would need to try the indicator first. Sensitivity modes will adapt to the trading style, be it super frequent or slow and steady. Alerts are possible for extreme values in the Currency Strenght meter so you will know when a very good opportunity arises. Each currency has special dynamics, so the indicator already has pre-set parameters for each, thus making optimal signals. Dynamic Fibonacci levels are used for the Price Action zones as part of the proprietary code for this indicator, and according to the signal is generated. The zones represent areas of Resistance and Supply and are recommended to add on, it Is another indicator.

A signal is very easy to follow, it will be shown in the window and with one click a chart will open the currency pair. Even though the pictures show the Take Profit levels, it is not very clear if they are calculated by the indicator or if they are just fixed values. Trades should know when to trade, the momentum will show when the market is flat and no currency stands out as the weak or strong. Also, the traders should avoid main fundamental analysis events or factors that could affect the market. This is common for most scalper strategies. This said testing is valid only if manually done.

The settings are very detailed, you can change the Alert parameters, set the sensitivity and timeframe, visuals change, and more. Bernhard Schweigert also packed the templates and profiles for the MT4 and also has a blog with many useful updates, news, and tips.

Service Cost

TickUnit Scalper Currency Strength28 PRO is not available to buy, only to rent for 3 months or 1 year. 3-month rent has a price tag of $98 and 1 year $148. A demo is available. The reason for this kind of charging is probably because of good ratings and sustainability for the developer in the long term. Scalping is very popular and this indicator is unique and not hard to use. The logic behind the strategy is sound but may use some popular techniques such as Fibonacci levels.

Conclusion

There are only 5 reviews for this indicator and sums up a rating of 3.8 stars. This is not enough to have a verdict. Some of the useful user reviews are:

“Very good indicator and signals, but one has to still do some more analysis to filter good and bad signals.”

“THIS INDICATOR WORKS AND I RECOMMEND IT. IT HAS MADE ME MONEY. AS I ALREADY SEEN ITS PERFORMANCE ON THE MOST POPULAR CURRENCY PAIRS…As with the other of Bernhardt’s indicators, this is a good one!”

Traders that have seen the indicator in cation with the demo can easily learn to use it and test it. Since the author has already made the templates and profiles, you should have a ready-made best settings for each currency. The rent price is small to pay if this indicator matches your fast-paced scalping trading philosophy, as it is specialized for these traders only. Whatsmore, using faster than the M1 trading period will require very high focus and stress that most beginners will have difficulty handling.

This Forex service can be found at the following web address: https://www.mql5.com/en/market/product/39366

Categories
Forex Service Review

Scalp Tools Support and Resistance Levels Indicator Review

Scalp Tools Support and Resistance Levels is designed to do one thing, to identify the Support and Resistance levels. Usually, indicators that are specialized to do one thing are the ones that do this very well. Most successful trading systems are composed of a few specialized indicators for every aspect of the system. Even though the indicator name has the Scalp word, it is not limited just for scalper systems, most Price Action systems will rely on the Support and Resistance levels. This word is probably included in the name of the indicator for SEO purposes.

Nevertheless, the indicator has a perfect rating, has been developed long ago, on 9th September 2014. The latest iteration is version 2.7 updated on 5th December 2017. Scalp Tools Support and Resistance Levels is, therefore, a relatively old indicator that belongs to the paid category on the MQL5 market. Martin Fischer from Germany, the developer of this indicator has 23 products total with mixed ratings and a good part of them is free.

Overview

The tool offered is advanced, with a few very interesting features. The calculation for the important market levels is calculated automatically on several timeframes regardless of the trading instrument. Therefore, the indicator is universal. The usage is self-explanatory and the publisher has a youtube video presenting the indicator in just 1 and a half minutes. What we can see is that the design of the tool is in the form of a window with a menu. Support and Resistance lines are one of the few other options.

Timeframes available are from M1 to Monthly, the same as the MetaTrader 4 platform for which the tool is made. Here you can set the High Low distance in bars, or a range for which the tool will calculate the levels. The minimal difference in pips is also a definition parameter and the history used in the automatic analysis is defined by the bars or candles number. Interestingly, the analysis has the option to calculate levels at the cursor, as you move it. This is a unique feature that requires some coding and creativity. All parameters have the + and – buttons for ease of use. Such design does not make the tool eligible for testing in the MT4 tester module, although the tool such as this works at the moment of inserting, there is no point in testing the Support and Resistance levels through the simulation.

You will see the levels based on the settings and the evident levels based on the Price Action. Since the tool can differentiate the levels on multiple and simultaneous timeframes (traders can set H1 and Daily Support/Resistance levels on one chart), it increases the versatility. This indicator also uses round price levels as important Support/Resistance points.

https://youtu.be/_0jZ2bTS1Ag

Settings available for the tool (additional ones) are visual and the autosave function. Visuals are of course about the line width, color, type, about fond size, and so on. The autosave has the option to save periods and the symbols or to save only periods. This is quite handy, a trader will have the previously set parameters for each trading instrument.

Service Cost

Scalp Tools Support and Resistance Levels price is $30 to buy and $10 to rent for 3 months. You will have 5 activations per purchase and the demo is available. Note that the demo works only on the separate link provided by the developer. The Free Demo button will not give you the version that works offline.

Conclusion

Scalp Tools Support and Resistance Levels has only 5 reviews, but all have perfect ratings. It seems the tool did not receive much attention and popularity despite the advanced design. The most useful review is by Hailey stating:

”This is the handiest indicator and I wish all indicators were built on this principle. Click on it to see sup/res lines, click on it to remove. The support/resistance lines are right on the money. I put it on virtually every one of my templates! I don’t know the developer and I’m not getting a kickback on a $10 indicator. Just telling what I see. Great indicator.”

From our perspective, the tool is very handy but does only one thing and one that many traders can do without the need for an indicator. Therefore, the price of $30 could be a bit steep for a beginner and unnecessary for an expert (who probably already has his Support/Resistance indicator). However, in case your trading Price Action system does not have such an indicator, and you would benefit from one, Scalp Tools Support and Resistance Levels is a good choice.

This Forex service can be found at the following web address: https://www.mql5.com/en/market/product/5965

Categories
Forex Service Review

Pattern 1-2-3 Indicator Review

This pattern is popular among the Pirce Action strategy traders, or more precisely, the 1-2-3 Pattern is a reversal signal distinguished by a zig-zag move at the end of a trend. This indicator automatically plots this pattern on the MetaTrader 4 chart (also available for MT5). Initially published on 28th September 2016 on the MQL5 market, the developer Pavel Zamoshnikov from Russia released a few updates at the request of users. It was updated with new functionalities and bug fixes finishing with version 3.5 from April 2019. Since the pattern is commonly sought-after, the tool received some popularity. The author has a large pool of released products consisting of 45 indicators, EAs, and signals.

Overview

The indicator is very specialized in what it does, but since the drawing of a pattern is subjective, this task is not easy to code and to give the right levels for drawing points 2 and 3. The base of the formula comes from the Zig Zag indicator that is adjusted through several conditional measures, some of which can be altered in the “Method for pattern triggering” parameter. The Overview page is clear, showing all that the indicator can handle. 1-2-3 pattern is drawn in real-time, and once it is completely formed an alert will be triggered, without any redrawing. A video presenting how the indicator work is great and short. These patterns can show on any trading instrument, be it in forex, equities, or crypto, while the indicator does not require manual setting adjustment for each.

If traders want to adjust the actual 1-2-3 numbers display, it can be easily done in the settings. Fibonacci levels are used in conjunction with the adjusted, non-repainting Zig Zag indicator, so the points are pinned to one of up to 5 Fibbonaci levels scanned by the indicator. These levels are also used to Stop Loss and Take Profit automatic placement and can be displayed with description if set so. A full alert component is used to signal the trader by email, push, or to a mobile device. If traders want a complete automatic solution, a new published Exper Advisor is containing the 1-2-3 pattern recognition from this indicator.

According to the author, the recommended timeframe is from M5 to monthly, although the greater the number of candles drawing the pattern the better and longer the trends are. However, it seems there are some limitations to useability. Intraday traders would need to focus on the EU and US trading sessions as the patterns are not reliable on other markets.

In the settings panel, you can adjust the number of candles for calculation, Zig Zag indicator depth, the method for pattern triggering (breakout from the 3rd point line or just touching), show Take Profit and Stop Loss levels and how they are calculated, some visual settings and how or when the alert will be triggered.

Service Cost

The Pattern 1 2 3 indicator can be bought for $30 with 10 activations without the option to rent it. A demo is offered in the separate link on the ‘Overview’ page. This price is relatively low comparing to other indicators doing the same or similar function but we have found some free versions elsewhere, just not exclusively made for the 1-2-3 pattern.

Conclusion

A total of 19 users gave this indicator a good rating of 4.6 stars and commenting often, showing high interest. This descriptive 3-star review shows not all are happy:

“After purchasing the indicator, I found a lot of problems. From a formal point of view, this is a good indicator. However, when used in practice, there will be too much noise, which is not practical. The formation of the trend is mainly after the completion of the 123 mode, that is, after breaking the 2 points horizontal line. If only 2 points of the horizontal line are needed. After the breakthrough, the market signal is stable and other signals are redundant. Any other signal warnings are noise. There are no such separate alert message reminder options set in the metrics. Your indication is that multiple message reminders appear with a switch and the sound is the same. This is not a very good difference, it is trouble…”

Just note there are only two reviews with a rating lower than 5 stars.

This Forex service can be found at the following web address: https://www.mql5.com/en/market/product/18523

Categories
Forex Service Review

FFx MACD Divergences Indicator Review

The MetaTrader 4 and 5 platforms come with one of the most popular indicators known to traders – MACD. FFx MACD Divergences build upon the already integrated indicator in the MT4 platform, extending the functionality especially useful for divergence strategy traders. This paid indicator is published on 4th July 2014 on the MQL5 repository and since then has no received much attention. The latest version has not changed since the initial placement and remains at 1.0. The author of this extension tool is Eric Venturi-Bloxs from Thailand. This author has no less than 52 products on the mql5.com, a good portion of that is free.

Overview

This extension indicator is simple. It adds hidden and classic divergences on the MACD averages and displays it in a single window for multiple timeframes. This way, traders that rely on trade filters based on higher timeframe divergences can have a glance if there is one. The display will show as many timeframes you set in the settings in multiple small subwindows. The addon on the tool is very simple but original and useful for the followers of the divergence strategies.

The settings available allows traders to set timeframes from M1 to Monthly, set the number of bars for each timeframe window, set alerts on various conditions, change colors, and so on.

Service Cost

The price of this simple and useful indicator is $10 for 5 activations and there is also a demo. The price is not high given the rarity of such tools.

Conclusion

User ratings are 5 starts but based on only 3 reviews since 2014. Still, it should be understood that this tool targets specific traders. One of the reviews perfectly describes how FFx MACD Divergences can be used:

“Woooooow!! love it! I trade low TF signals based on H4+Daily Divergence. Now when my indicator gives me a buy signal on e.g. M15 then I immediately see if there is higher TF divergence or not on the same chart. Trade Yes or No? Decision takes one second now. Thank you for this great tool and the cheap price Eric!”

The author developed similar small useful gadgets for other trading styles.

This Forex service can be found at the following web address: https://www.mql5.com/en/market/product/4900

Categories
Forex Service Review

Currency Strength Matrix Indicator Review

Currency Strength Matrix is a paid indicator published on the MQL5 marketplace designed for the MetaTrader 4 platform. It belongs to the trend confirmation category although it is used in conjunction with other indicators. It tries to differentiate by offering better information for Price Action, Reversal, and Momentum trading strategies, according to the developer’s words. The initial version was published on 5th July 2017 by Raymond Gilmour from the United Kingdom, author of just one more indicator called Cycle Finder Pro.

All are with positive ratings although the developer made these to use them as a sales funnel to his website, it seems. Nevertheless, the indicator is not overpriced, the last update was on the 2nd of April 2019. Most of the updates optimized the code for better performance, some of the early updates added functionalities such as better identify cycles, automatic reading price action for oversized bars, and some visual upgrades.

Overview

The MQL5 Overview page has good content and clearly shows how to operate the indicator. Yet the inner workings are not disclosed. What is presented are three modules, each with its representation and performance. The Trend Matrix module is a table that shows which currency pair is in the trend by plotting a 1 in the corresponding matrix cell. This way could be confusing at the start but once you understand that the left table side currencies are terms, you can know if the trend is up or down. However, the second module shows the strength of each major currency (8 of them). This table measures the score for each currency from -6 to 6 where 6 is the most extreme case of a strong currency.

The score is calculated using the relevance of other currencies plus the 1 or 0 from the Trend table. Comparing the scores traders will know which currency is the weakest and the strongest and thus have a better perspective when entering trades. The last part of the Currency Strength Matrix combo is the Momentum chart. Basically, this is the Strength table represented in a chart moving in real-time. By looking at it traders can see the momentum or where the trend is progressing to. Additionally, the chart will show the lines for each currency, the line crossing can be the trade entry signal confirmation.

Currency Strength Matrix can be used and in our opinion, must be used along with other indicators. It is a first step in the decision process since it shows the most probable currency pair having a strong trend, or are not strong enough for any trade entry. The user guide describes 3 types of trading. The confirmed trend is when all 3 modules show a clear signal on one currency pair. Pairs should be consisting of a strong currency with a score of at least +5 and a weak one with at least -5. For “early trends” traders can use the 0 level line crossing on the Momentum chart that will signal the currency gaining or losing strength.

One should also be careful to select currencies only gaining momentum from the extreme scores, such as -5 or +5. “Begging trend” trading is done by looking at what currencies are at extremes and entering a trade once they start moving out of the extreme zone. This method carries the biggest risk but traders may have entered perfectly into an early and long trend.

In the settings panel, traders can adjust the ATR multiplier used for oversized candles detection. A lower multiplier will detect more candles but smaller. Calculation frequency can be adjusted so the indicators will use more time until they update. The rest of the settings are more cosmetic, turning the panels on or off, changing the font size and color, and so on.

Service Cost

The price for the Currency Strength Matrix is $98 for 10 activations. To rent it for 1 month will cost $39 and for 3 months $59. A demo is available. Notably, the author is promoting a free indicator that comes along with this one called Easy Draw for easy market switching.

Conclusion

As for the ratings, currently, 16 reviews are giving an average score of 4.5 stars and 136 comments. This shows that the indicator has some popularity although it does not reach the level most authors would like. The quality of the code seems to produce issues to some traders, most of the updates are about optimization. Certain users complain about this:

“Not good for me and bad. I do not recommend it at all. The owner of the indicator is asleep. There is no support or update for this indicator. Which I did not benefit from.”

Overall, currency strength meter indicators are popular among traders and therefore many versions are doing the same thing as this one. Some of them are free and can be found online.

This Forex service can be found at the following web address: https://www.mql5.com/en/market/product/23149

Categories
Forex Service Review

Density Scalper Forex EA Review

Density Scalper is a very interesting scalping strategy Expert Advisor developed for the MetaTrader 4 platform and published on the MQL5 website. The scalping is defined by the Mean Reversion strategy, meaning the trades are made on the assumption the price of an asset is high or low enough for a reversal to happen. Therefore this is a reversal scalper EA that avoids “unnatural” market events during the day and relies on the simple laws of demand and supply to find the most accurate signals. The developer is Roman Lengert from Germany who initially published the EA on 10th October 2019 on the MQL5 market.

Overview

The latest version is 2.4 updated recently, on the 10th of March 2020 during the latest COVID-19 world market event. The base code and idea of this EA are not new from the author, the previous product called NY Close Scalper is using the same principles except Density Scalper is optimized for better slippage management. Therefore the release date does not mean the EA does not have enough forward testing done.

In the Overview page of Density Scalper, there are a few disclaimers first. Aside from the general, that the past and backtesting performance does not guarantee future performance, there is a note stating any flash movements may ruin the strategy implemented and therefore the EA works only during the calm market environment and used the Stop Loss level. The execution of the Stop Loss may be delayed depending on the broker during the flash crash or other major events.

Every position made by this EA has the Stop Loss set. Mertinglage, Grid, or other unsustainable methods are not used. Density Scalper works on the M5 timeframe on the following assets: EUR/USD, GBP/USD, EUR/CHF, USD/CHF, USD/CAD, EUR/CAD, and EUR/AUD. Other experimental currency pairs are AUD/USD, AUD/NZD, AUD/CAD, EUR/NZD, CHF/JPY, GBP/CAD, GBP/AUD. Interestingly, the author showcases the maximal drawdown in $ value per lot or $35-50 per 0.01 lots for 16 years. In percentage terms, we have noticed 3.8% up to 4.97% in a different condition and a bit shorter-term (since 2009). Still, this Drawdown level is very attractive considering very good performance.

Quant Analyzer is used to showcase the performance. Some notable backtesting facts are 84.02% winning rate, 3.8% maximal drawdown using fixed lot allocation (0.1), $4.9 average trade value, 146.85% average yearly gain (portfolio on multiple pairs tested from 2003 using $5 commission and 150ms execution delay). Backtesting from 2011 till the end of 2019 shows a 4.98% drawdown on complete portfolio trading, 78.5% winning rate, 58.37% average yearly gain, and 9864 trades for this time.

Roman Lengert puts some effort to leave a rounded up quality supports and leaves a link for users to have good settings and have live monitoring charts. The links are provided on how to set up all of his EAs too in a separate blog post. The content is very organized and of high quality, leaving the impression of a dedicated developer that also has great knowledge about trading. Since the EA is a scalper on the M5 timeframe, it is imperative to have a good broker with low spreads and slippage and fast executions. A VPS is also needed for constant running as the EA collects historical data for trading. In the event of market disruptors such as elections, BREXIT, etc, the EA should be off. Note that the EA is using the Breaking News Filter in the results, to filter news impact on the market. The link is provided and recommended to use in conjunction.

As for the settings, there are just a few related to Money Management and certain trading conditions. Lot type can be set to “fixed” or “increasing”, while the maximum spread tolerance can also be set to avoid trading in times of high dynamic spreads. There are also other uninteresting settings related to server time and so on.

Service Cost

The price of Density Scalper EA is extreme, $2000 to buy having 5 activations, $125 to rent for 1 month, $300 for two, $500 for 6, and $900 for 1 year. To some, the price is well worth the trouble. The developer is very supportive and posted that for users that rented the EA lately causing disappointing results, he will discount the price for future rents. The demo is available so you could test this EA. According to the quality work and dedication, the price may be worth it if you have good results.

Conclusion

The final rating of all Roman Lengert’s work is above 4 and for the Density Scalper, a perfect 5 star based on 8 user reviews on MQL5. This sample may not enough get a complete picture of user satisfaction although there is a good probability this EA is a great addition to the trading community. Some of the user praises are:

“I have never seen a better EA, Roman is a very good Developer and his support is great. Five Stars!!”

Or the latest one from March 2020 describes the service very well in detail:

“Best Scalper and developer out there on MT4. Roman is brilliant in providing full transparency on all his EA’s, backed up with live results across multiple brokers. I have been running it now for 6 months and all my results across all his EA’s mirrors his signals perfectly, unlike other scalping programs out there at the moment. Roman has taken care of building in loads of safety checks and balances on slippage and account protection in case of a market crash. He is also very active in its on-going development and always responds very quickly to any questions. 10/10.”

On the MQL5 analysis page using the AxiTrade live account, Density Scalper shows ongoing trading since the 23rd of March 2019, a total of 211 trading days. The average holding time is 49 minutes meaning the EA is not the classic scalper. The chart shows a growth of 40.9% for this time, 37.39% for 2019, and 2.55% for the part of 2020. The developer stopped trading since the COVID-19 volatility spike on the forex market. The reason lies in the EA’s unsuitability to run in this environment as there is no calm nighttime. In March, Density Scalper suffered a loss of 1.43% with a spike in Drawdown like in the crisis 2008/09.

This Forex service can be found at the following web address: https://www.mql5.com/en/market/product/40941

Categories
Forex Service Review

Forex Robotron FX Robot Review

Forex Robotron is an Expert Advisor developed by the Forex Robotron team. The team behind the development of this robot exists since 2013 but has perfected the EA until 2016 with a stable backtesting performance. No information is available about the developers. The latest version is 27 released in October 2019.

This MetaTrader 4 EA is based on the scalper strategy, executing a trade or two daily, during the calm, session end times around 9-11 pm GMT. The performance backtesting is stated to be based on real tick data, which means the testing precision is maximum. This EA is specialized for EUR/AUD, EUR/CAD, EUR/CHF, EUR/GBP, EUR/USD, and USD/CAD pairs on the 5-minute timeframe as with many scalping EAs.

Overview

The performance of each pair is presented on myfxbook.com but including the older versions. Although, we have noticed that the robot is also run on USD/JPY, AUD/NZD, and other currency pairs on myfxbook.com stats summary. Forex Robotron webpage presents the results right away after their calculator that calculates how much you would gain with a specified deposit. The accounts presented on the website do not match the myfxbook account names. These are accounts before the 25 version of the EA. The current accounts are provided by external users and match the 25 version and have very good results but with a few warnings.

Namely, the testing and performance are done on Pepperstone, FXOpen, and KnitFX brokers. The presenting period does not account for the 2018 year where a huge drawdown is noted. A 57.21% drawdown is not attractive to most mid to long term traders and is one of the most important criteria for gauging how the EA manages risk. Even though the Forex Robotron features a fixed Stop Loss setting (20 pips) the balance drawdown is extreme. Daily gain is 0.32%, monthly 4.78% and total gain of 202.36% since 24 July 2018. The trades are open for a10 minutes or going longer to 4 hours, most of them being longs.

Trades that run longer than 2 hours proved to be mostly heavy losers. The Pepperstone account is used for these figures and according to the users, this EA is sensitive and will not show the same results with various brokers. Account number 3477293 shows the 2018 history but 3477294 and 3477295 show selective results from 2019 only where very good figures are presented. Yet, when we expand the analysis from the beginning, on 18th September 2018, we can see a 51% balance drawdown. We are no sure if this was done with an unperfected version of the EA. It is not known how this EA performs under FIFO broker restrictions.

Forex Robotron website is not well structured, performance charts create a very long page and at the bottom, the devs published a list of email feedback from users. All of them are positive which reduces the value of reading them. The FAQ page contains good answers on some critical points such as about the Spot Loss but in the majority is meant for Forex beginners. The developers do not disclose how the EA works, on what indicators are it based, and do not show an expert knowledge level about trading, at least not based on the website content.

Service Cost

At this point, the EA starts at $299 offering unlimited demo account licenses, 1 real account license, support, and updates. The standard package is $399 and offers 2 real licenses without any other benefits. Gold package is $499 with 3 real licenses and if you want an unlimited number of real account licenses the cost is $999. This sets Forex Robotron in the higher price range, especially since there is no demo EA available.

Conclusion

According to the other reviews and user reports, Forex Robotron does not show consistent results, is only optimal with brokers with very narrow spreads, no slippage, and fast execution times. The performance is inconclusive, unfortunately, the Forex Robotron team does not provide a demo so there is no way to test it for free.

This Forex service can be found at the following web address: https://forexrobotron.com

Categories
Forex Service Review

CentoBot FX Trading Robots Review

CentoBot is a platform that offers trading robots exclusively for their platform and brokers. The website is basic without much information about the robots provided and total obscurity about the company behind this service if there is one. CentoBot website looks like more as a landing page for the three brokers the robots service is connected to than any real automated software provider. The presentation will show how to register, how to set up a robot, and an account on their platform.

Whatsmore, there are 3 awards about offering “the best binary options robot” in 2016, the “Top quality” award, and “100% Confident”. These awards look like leftovers from website development page templates that serve just to fill in space, they are completely made up in a very uncreative way. All of the links on the page lead to registration, a marketing tactic used to lead visitors to registration without spending too much time reading.

Overview

CentoBot presents several of its top robots on its single-page website, including:

Cryptobot v2.0 is based on MACD and RSI indicators and works with popular cryptocurrencies. MACD and RSI are one of the most popular indicators although many newer iterations based on these are regarded as better. CentoBot dares to say that this robot generates 300% gains a month, a figure too high to be considered seriously.

Bitcoin Algo v2.1 uses past data on main cryptocurrencies to enter trades. The algorithm probably uses Price Action levels but there is no more information about this one.

Ethereum Rise v1.1 is specialized for Ethereum and uses the “CCU” (probably CCI) and Stochastic indicators. Note that both of these indicators are not designed to be used for crypto, both are developed decades ago before cryptocurrencies.

Crypto Majors v1.1 is literally described in the same way as the Cryptobot v2.0. Using the same MACD and RSI combination for major cryptocurrencies.
Altcoins Combo is specialized for altcoins. It is described as to use diversification as the primary feature.

The final option is to create your custom robot with indicators and strategies.

We went on and registered to try the demo that is offered. The registration will ask you to select 3 brokers, Binarycent, VideForex, and RaceOption. These brokers are all offshore, unregulated, and do not have positive user feedback on benchmark sites. Whatsmore, all of them are blacklisted in some jurisdictions. Once you register you can see some more robots on the list and the gains they produce. The gains are all positive and, according to the CentoBot representative, all are during a 2 to 4 weeks period. The worst top 10 robot gained 103% and the best is called xCryptoProfit with 253% gains.

You will have the option to “Unlock the robot” and “Robot Demo”. The Robot demo is false. What is presented is some slider movements on various crypto assets like the robot is in action and a chart with the balance and time axis. Of course, the demo will be over in a few seconds and an always positive report will show, usually the same gain numbers.

On top, there is a country and name initials where allegedly latest client results are shown. Interestingly, the US flag is there even though it is stated that CentoBOt does not accept US citizens. After the demo, you will be asked to deposit with the selected broker during the registration. The minimum deposit is $250 with the RaceOption, but the other 2 brokers have the same minimum deposit requirement.

Service Cost

We’re going to assume that each robot carries a different cost, but are unable to confirm this because costs are not shown until after an account is registered. Requiring an upfront registration is a common marketing tactic, but nonetheless, is problematic and could be viewed as rather sketchy.

Conclusion

It is evident that CentoBot, unfortunately, is just a funnel page for these brokers that probably belong to the same group. They have similar bonuses, offers, and marketing. The robot’s performance could not be measured and the gains presented are also most likely fake. CentoBot website does not try too hard to present a good cover and even beginners will see through the obvious manipulation.

This Forex service can be found at the following web address: https://www.centobot.com

Categories
Forex Service Review

Do It Multi-Currency Trading System Review

Do IT is an Expert Advisor developed for the MetaTrader 4 platform and is published on the MQL5.com by Ildar Kabirov from Russia. The EA is also available for the MT5. The latest version is 7.77 updated in March 2020. Ratings received are generally positive and there is a high activity in the comments section. Do IT is designed to be fully automated and specialized for Forex, and indices on the 1H timeframe.

Overview

The exact markets described for the EA are EUR/USD, GBP/USD, DAX30, USD/JPY, Gold, and SPX 500. The developer has a very good description page where the settings for the latest version and links for proper testing are published. To contact Ildar Kabirov he also posted a Telegram channel. This EA does not use Martingale, Grid or Averaging trading methods as they are often criticized by traders, for a reason. If your broker uses FIFO execution Do IT should still work fine.

The main features of the EA are the use of only pending orders on the broker’s server, high slippage and spread filter, weekend closure, trades are time-limited with a fixed Stop Loss and search algorithm for signals. There is a detailed instruction guide for settings parameters. Users can set how tolerable the filter for slippage and spreads will be, how much exposure (risk) will be per trade, set the virtual or real Stop Loss fixed amount, Take Profit and Trailing Stop set up, set working hours, and so on. A newsreader or filter is also available but you will have to set it up using the webpage containing the Investing.com news raw list. This list is easier to include in the EA reading that is displayed on the MT4 chart.

The most interesting part is the settings about the deviation. Do IT seems to be entering trades based on the price deviation during a certain period. Whatsmore, the channel deviation is used as a step signal for entering new trades. The ATR indicator is also used for trades entry in combination with the Parabolic SAR. SO based on the demonstration video, Do IT seems to be waiting for the low period of volatility to set pending orders on the channel, with the set Take Profit and Stop Loss levels. When the volatility spike occurs, pending orders get triggered in one way and the EA is then waiting for the Take Profit to close the trade or for the timeout. Based on this, the EA can be categorized as a trend and as long term scalper.

https://youtu.be/gSU1jIISKB8

As for the performance charts, the developer has published some very good results. The EUR/USD pair on the H1 timeframe showed 97% winning trade and 9% Drawdown for the whole year. For 10-year period testing, using the 99.90% precision modeling, showed 3.7 M profit from initial 1000 deposit, 10.28% Drawdown, and 89.7% winning rate in the money. For the USD/JPY pair, Do IT performed similarly. 93.7% profit trades with just 1 consecutive loss. Drawdown is a bit higher than with the EUR/USD to 13%.

On the DAX 30, the performance is still above 90% winning trades, but note that for the whole year the number of trades is 66, unlike USD/JPY with 286 total trades or EUR/USD with 275. Gold/USD has even more impressive results with 95% winning trades although we have noticed 3 losses that resulted in a noticeable dip in the balance. A large number of small profits contribute to this high percentage although when a loss is incurred, it is several times larger than a winning trade.

Service Cost

Do IT EA belongs to the higher price range. For $990 you will have 5 activations. It can also be rent for $490 per year. The demo is available so you will have a chance to test it before buying. The EA is best used on brokers with small slippage and spreads even though it is optimized for the H1 timeframe. In recent developments on the Indes and Equities market, the EA has shown poor results given the increased slippage, spreads, and volatility caused by global events like the COVID-19.

For this reason, the developer introduces additional protection modules (recovery mode) such as average profit trailing in recovery mode, protective fixed breakeven for recovery mode, and graphical visuals. The latest developments are extreme, as such every EA is finding difficulties to cope with extreme values. It is great to see the developer working on implementing additional safety in a very short time. Owners of Do IT can expect great support and an official channel on Telegram.

Conclusion

Do IT has a very good rating of 4.6 stars based on the MQL5 repository and 45 user reviews. The comments are fresh and generally, the EA is popular. Note that there are some Russian language commentary and reviews but they are positive. From the negative reviews, we could see traders complaining mostly about the big losses once they occur:

“The order quantity is too small. Loss is too big.”

“Backtesting before 2010 will tell. Will not be usable for a long time. If the market conditions change slightly, EAs that fall during non-optimized periods will fail. Fortunately, the author seems to be always optimizing for now, so he’ll be fine as long as he keeps doing it. Small profit, big loss.”

In our opinion, this EA price is just too high to be sold on a larger scale. There are more affordable EAs that have been on the market for many years showing consistent results and updates. Also, once the abnormal market events occur, the whole year of profit trades may be countered with just a few losing trades. Still, for the ones that can afford it, the strategy used on this EA is used by trend traders, has good logic behind it, the ratings are also very good and the support is there.

This Forex service can be found at the following web address: https://www.mql5.com/en/market/product/43883

Categories
Forex Service Review

FX Power Currency Strength Meter Review

FX Power for the MetaTrader 5 (MT4 also available) is an indicator presented as “the first currency strength meter with a complete history across all timeframes”. Essentially it can be used standalone or as one of there indicators that compose the author’s Simple Trading System. The FX Power indicator developers are the Stein Investments team from Germany. The latest version is 3.76 updated in March 2020 and the first version is published in 2016.

Overview

Using this indicator requires some basic knowledge about the values of the currency relation measurements or the Delta. Although the logic is simple, the use of this indicator requires you to follow a certain strategy, and by this we mean it is not intended for scalpers on the 1 or 5M timeframe. The author has composed a very nice page about the indicator and a youtube video describing all the features of his indicator. The main purpose is to measure movement power or currency strength against others, although it has other purposes that could be used, such as quick chart switching from a single window.

The main features of FX Power are:

  • The non-repainting, real-time display for all brokers
  • Multiple timeframe selection that is not by default
  • The movable panel display suitable for higher resolutions
  • Automatic configuration
  • Alerts
  • EA friendly

The author presents some usage tactics but in our experience, if the indicator is used standalone and not as part of the Simple Trading System, it is completely irrelevant as the indicator should be in-line with the trader’s custom system. Also, the indicator does not represent all in one trading solution. However, Stein Investments presents 3 possible scenarios:

  1. Tradeline crosses. Each line represents a currency.
  2. Use the combination of two time periods to confirm a cross.
  3. Use currency combinations, if two currencies are getting stronger than one, the signal is more probable.

The indicator has a great and intuitive way of changing analysis timeframes from a control panel list box. The panel alone is very nicely coded, has very useful tools. The currency strength has several modes of display in this panel, as a HeatMap, DeltaMap, Symbol, Compact, and Equalizer. The Equalizer will display currency power similarly as music tone equalizer power meters, Compact will shink the panel to show only major single currencies with their Delta value, Symbol view that will show only the currently active chart currency pair, and the most interesting DeltaMap that will show an 8×8 matrix using the 8 majors and the pair combinations with the respective Delta value – excellent for searching trade opportunities on both directions.

Clicking the crosshair located on the panel will show all 8 currencies on the indicator chart if you want to see the relation to others. According to the author, the Delta peaks, or values above 6 or below 3, are considered as good exit indication, similarly to the RSI oversold and overbought levels. The Delta panel is moveable across the MT5 and can be placed anywhere you like with the drag and drop.

Settings for FX Power are very nicely categorized and have a plethora of options for each. Starting with the analysis period, you can select many non-default ones such as 8H, 10 minutes, 3 days, or 2 years. Customizing the panel and indicators looks is easy offering the line style, color for each currency, and similar. Alerts customization is also great with a good understanding of the trader’s needs. In this light, you can set up your alerts on line cross, certain level (Delta or currency) trigger alert be it low or higher threshold. Mobile, email, or sound notification alerts are optional.

Service Cost

The price tag for the FX Power meter indicator is $49, the same is for the MT4 version. Renting it is possible, $29 for 3 months or $39 for the whole year. There are 10 activations offered after purchase. A demo is available. The price is right at the point, the indicator is high quality and useable. Of course, there are similar ones for free if you are picky, but probably not the same quality or options.

Conclusion

The indicator received great reviews. The MT5 version has only 3 user reviews from the MQL5 repository but the more popular MT4 has an almost perfect 4.9 ratings from 70 reviews. The ones that left 1 star were hard to find and totally irrelevant, like this one:

“VERY DANGEROUS discretionary trading approach you can burn all your deposit if you don’t be skilled enough. You need a plan a money management strategy and an exact entry signal approach. BE WARNING WITH THE DISCRETIONARY TRADING SYSTEM THEY CAN BE CATASTROPHIC ESPECIALLY IF YOU DON’T BE SKILLED”.

It can be said that this indicator does exactly the job it is intended to the point of perfection. The combination with other trading systems is great, it can serve also as a filter for entries, as an exit indicator or as trade entry. Our recommendation is to use as an opportunity scanner on multiple timeframes, just be sure to use the right one for your trading.

This Forex service can be found at the following web address: https://www.mql5.com/en/market/product/16252

Categories
Forex Service Review

EMA Cross Alert Signal Indicator Review

EMA Cross alert is a simple but paid category indicator created by Suriya Thammalungka from Thailand. The EMA means Exponential Moving Average, an indicator used very frequently in many combinations but mostly as a two-line crossing for trend following. The indicator is simple and is never updated since the initial version in June 2016 for MetaTrader 4. It is interesting to see this indicator in the paid category as it is too simple to belong here and the indicators used are basic.

Overview

Traders mostly use the 50, 21, and 100 period EMA for as the support line and in combination with a faster EMA for a signal. This is what the indicator’s main purpose is, to alert on the faster EAM crossing the slower. By default, you can insert as many EMAs as you want onto your chart in MT4.

Service Cost

To purchase EMA Cross Alert you will have to pay $19 for 5 activations, or $12 to rent for 3 months. A demo is available. The response to this release is absent. There are no reviews and no comments. The reason for this is the indicator simplicity, EMA already exists in the standard MT4 installation and the only this the author did is add the alert on the cross with an arrow. Other indicators like this exist and they are free. Therefore, there is no reason to spend $19 on this version. There are other simple products by this author (10), interestingly, none of them have received any rating or popularity.

Conclusion

There is nothing worth mentioning with this indicator except that is has the alert system on line cross. The alert can be turned off in the settings but there are no special notifications. Essentially, there are 3 settings, period for the first and second EMA, and the alert on/off setting. Based on the settings, the EMA will leave a visual arrow on the chart on the candle close on any timeframe. You can customize the periods giving you different uses. The author published a video with all the settings demonstration. Of course, it is nonsense to measure the performance of such a simple indicator.

This Forex service can be found at the following web address: https://www.mql5.com/en/market/product/16974

Categories
Forex Service Review

DAX Robot CFD Trading System Review

DaxRobot is an automated trading product associated with the Daxbase.com broker. It is intended to work with CFDs offered by this broker. The features or the inner workings of the DaxRobot is completely obscured. There is no useful info about this robot and all signs points to be another sale funnel page similar to the Centobot we have already reviewed.

Overview

The DaxRobot website could be described as a 15-minute project without any new, non-template content except for the fake rewards and 3 step guide to registration (the same as with Centobot). Since the lack of information is even more pronounced than with Centobot, it is possible the visitors to this page already come from a marketing email or link with some unethical form of marketing. No one would invest is DaxRobot with just reading these 3 steps unless receiving some prior information.

If you register you will see the classic registration form and you will be able to open accounts in USD, EUR, Bitcoin and Litecoin. DaxBase broker will offer a 5% bonus if you choose the cryptocurrency, probably since there is no way of charging back them once they are sent, unlike with the Visa or MasterCard using fiat currency. There are 10 top robots list that you can select. The most successful one called CryptoADX 2.0 shows a profit of 364% gain. According to the support chat representative (the same one as with the Centobot) the timeframe for this measurement is 2 weeks. Of course, the gains this high could only be possible with extremely reckless money management and very catching several extreme market movements.

The lowest-performing one is the RVI and MA with a 96% gain. There are no details about any of them except for a few lines about how they operate. So for example, Crypto ADX 2.0 is based on the ADX indicator, probably for filtering, and RSI and Stochastic indicators. The minimum deposit requirement for this robot is $500. The number 4 on the list with allegedly 226% gain is the Ichimoku Crypto v2. This one is designed for BTC/USD, LTC/USD, and the rest of the major crypto. The trading is guided by 4 indicators, including the Ichimoku, and based on the trend breakout strategy.

All of the robots have the robot demo mode. This demo mode is fake and is just another manipulation step. Once the demo is run, the animation will show some sliders on various currency pairs to move, and below a balance, the chart will show how the robot is opening and closing trades in profit. The demo animation will last for a few seconds and always show some profit. The chat representative confirmed with us that this is just an animation, which was unexpected. You will also have an option to create your custom robot based on the MACD, RSI, Stochastic, RSI, ADX, and Aroon indicator. All of the indicators have timeframe settings of 5, 15, and 30 minutes. You can select which ones are used and on which trading asset. There is the option to save this robot although all this is probably just a gimmick like the rest of the website.

Service Cost

Interestingly, the authors described the Ichimoku indicator as “created in Japan and has been under-estimated by traders in the West due to the lack of guidance on how to actually use it”. Of course, this is a manipulation line targeted at beginners that could be scared away by the somewhat complex Ichimoku indicator looks. The minimum deposit requirement for this robot is $250. The rest of the robots have interesting strategies. The number 5 on the list, HP cycles robot is described to work on the momentum strategy using the Hodrick and Prescott cycles.

Conclusion

A few words about the DaxBase broker you will be registered with, in case you really want to open an account with this robot service. This is an unregulated, offshore CFD broker owned by Finance Group Corp. (FCG). This group is known for many scam reports and is blacklisted by many state official bodies such as the French AMF, FMA of New Zealand, etc. Whatsmore, the group owns many more binary options and CFD brokerage brands that serve as the sales network for the same shady company. DaxRobot is just another sales funnel that uses automated trading popularity to lure beginner traders.

This Forex service can be found at the following web address: https://www.daxrobot.com

Categories
Forex Service Review

Candlestick Patterns All Pairs Indicator Review

Candlestick Patterns All Pair is an indicator developed for automatic pattern recognition and plotting them on the MetaTrader 4 chart. The tool belongs to the paid category on the MQL5 market and is developed by Denis Luchinkin from Russia. He has over 20 published products but without notable popularity or ratings. This tool is published on the 23rd of March 2017 and has not been updated since. The candle patterns are used as predictive signals and could be reversal, trend, and sometimes scalp strategy elements.

Overview

This tool has a single purpose and this is the automatic plotting so you do not have to search for the pattern. 29 patterns are included in the database for recognition applicable to all forex currency pairs and timeframes. Notable features are the 5 additional settings for instruments, plots an arrow so you will know if the pattern is bearish or bullish, each pattern can be disabled if you consider it unreliable and has a handy table which shows the last patterns on all 28 major currency pairs and timeframes. This way the table will show traders what are the latest opportunities and possible Price Action movements. If you want to hide the table it is done with a click of a button.

The tool is simple and does the job well, the patterns are correct and precise. If you want to search more history you can set the candle values in the settings. Timeframes can also be turned off or on so you can have only 1H and 4H timeframes available, for example. Some visual settings are also optional like the text size, color, and so on. The patterns included are mostly common and considered as reliable although some may be missing such as Double through, still, some of them may be visible only on higher timeframes. The database contains Advance Bloc, Belt Hold Line, Counterattack Lines, and others that are not that used, then the Dark Cloud Cover, Doji, Engulfing, Evening Star, Gap, hanging Man, and Hammer which are commonly used.

Others patterns are Gravestone Doji, Harami, Inverted Hammer, Long Legged Doji, Mat Hold Pattern, Morning Star, NeckLine, Piercing, Separating Lines, Shooting Star, Side By Side, Stalled Pattern, Tasuki Gap, Three Crows, Three Line Strike, Three Methods, Three White Soldiers, Tweezer, and Upside Gap Two Crows. Once you pull in the indicator you will see the pattern and the name with the accompanying arrow depending if the pattern is bullish or bearish. The “Ago” column in the table shows how many candles have passed since the pattern appeared.

Service Cost

The price for the Candlestick Patterns All Pair tool is $25 to buy for 100 activations or $10 for a 3-month rental. A demo is available as the MT4 automatic install if you are registered in the MQL5 market.

Conclusion

The ratings are absent and a few comments are suggesting this tool is not popular. In the comments we have noted several users asking for alerts and other updates but the official update has not been released since. So, the developer may have abandoned this tool. If you are a fan of patterns, you could find other indicators such as this one for automatic plotting for free, although the price of $25 is not too much. Since the demo is offered, you will know if Candlestick Patterns All Pair works.

This Forex service can be found at the following web address: https://www.mql5.com/en/market/product/21853

Categories
Forex Service Review

BlueDigitsFx Spike And Strike Reversal Review

BlueDigitsFx Spike And Strike Reversal is a composite indicator for the MetaTrader 4 platform developed by Ziggy Janssen. This MQL5 repository developer is the owner of 6 published products with solid ratings and popularity. The indicator, as the name suggests, is a reversal strategy signal provider in the paid category. It is also aimed to filter fake reversal signals from the market using another module integrated. The overall quality is great and could be a good addition for traders relying on reversals, provided they have some additional tools. BlueDigitsFx Spike And Strike Reversal was published on 12th November 2019 and has not been updated ever since. Still, it does not mean it does not have the support, it is just a few months old but already has received some attention.

Overview

Two modules are integrated into this indicator. One has multiple indicators, aggregating the reversal confirmation signal. Essentially, it is a prediction indicator, not to be confused with confirmation indicators that lag. The second is the oscillator based on which the arrows are made for trade entries. One important fact about this indicator, it is repainting and this issue has been reported by some users. The repainting issue is not always a bad thing, to some traders’ philosophy, the market conditions can change and thus the signal also changed, the indicator has changed its “mind” as a real person would.

However, the problem lies that you will not have valid measurements when backtesting as that historical false signal before the indicator changed is not recorded on the chart. Repainting may mean the indicator never misses and is always positive on the outcome. Some additional indicators that lag and confirm the signal are essential for repainting indicators, and such case is also with the BlueDigitsFx Spike And Strike Reversal. Bollinger Bands are also used judged by the settings, although just for the channeling.

The main features of this reversal indicators are easy to follow signals, you will basically have arrows for sell and buy, cannot get more simple than that. It has the filtering ability, although we are unable to confirm if this feature is transparent or just integrated, thus decreasing the value of the indicator in conjunction with the trader’s system. Signals are generated on bar close only, works for all symbols and timeframes, has the full alert module with all the features, and is compatible with EA development. The features are not packed with redundant content, which signals the author is authentic with the approach, not a salesman. Similarly, clear content is about the usage guide. The trade entry signal revolves around the -6 and +6 value of the swing. Take Profit level is also determined with the swing low and swing high.

The trade exit is naturally evident with another arrow in the opposite direction. All this makes this indicator well rounded up although, note that is should be used as an addition to a system, as the developer also suggests. For best results, other system products by Ziggy Janssen is suggested, but it could be any reversal system. The product is called 1,2,3 system and is published on the MQL5 repository. The timeframe suggested is H1 and above although lower can also be used with less precision, meaning the indicator is not ready-made for scalpers and we are unsure if any setting change can make it so.

Settings are simple, traders will not have much to change here so optimization should be easier although it also limits the optimization scale. Nevertheless, you can change the calculation period, the filter period, the signal method, and the Bolliger Band parameters on the period and deviation.

Service Price

The price of BlueDigitsFx Spike And Strike Reversal is now high, $30 to buy, and $15 to rent for one month. If the MQL5 market is correct, 68 activations are available once you buy, more than enough even if you change your computer every year. A demo is available too.

Conclusion

Based on the reviews, this indicator only received 2 low ratings form users that did not like the repainting fact. Others are very satisfied. One review describes well how the indicator contributed to his trading:

“I don’t usually leave reviews and I’m not a big fan of most indicators, but THIS ONE… Ziggy knocked it out of the park! Don’t use it as a stand-alone indicator, but with price action and weekly pivots, it’s incredible for me. Having alerts to give me a heads up for price reversals, which is how I trade, is a dream come true. Ziggy makes himself exceptionally available and cares about your experience with his indicators…This indicator is exactly what I wanted to keep my charts clean but effective. I’d would give more stars if they were available! Thanks, Ziggy!!”

In our opinion, the indicator should be first understood and tested for repaints yourself. Even if it does, forward demo testing is needed. First of all, it should be assessed if this indicator is synergetic with your system. On the side note, the BlueDigitsFx Easy 1 2 3 System received a perfect rating out of 33 reviews, which is not easy to achieve, it should be considered as a possible system that works with this indicator.

This Forex service can be found at the following web address: https://www.mql5.com/en/market/product/43438

Categories
Forex Service Review

True Direction Oscillator Review

True Direction Oscillator or TDO is a trend gauging oscillator type indicator using a simple but effective formula. The developer is very open and transparent on how the indicator works and the Overview page has professionally made content. TDO has been initially published on the MQL5 market on 23rd November 2015 and since has received many updates. The latest version is v9.1, freshly updated in February this year. The author of this very interesting and popular indicator is Muhammad Al Bermaui from Egypt, showing great dedication to support his work.

Overview

The latest updates include optimization of the code and buffers, making the indicator require fewer computer resources and some additional ease of use and visual enhancements. The number of reviews and comments is great, making this indicator one of the most popular on the MQL5 market. It belongs to the paid category although the price is not high, especially for a quality indicator.

TDO is an enhanced momentum indicator based on the Price Rate of Change (ROC) except the formula is improved to work equally on bullish and bearish momentum. Therefore, the formula is disclosed as:

  • Center = (A + B) / 2
  • TDO = 100 x (A – B) / Center, where A and B are price levels

For trend traders, TDO is a great addition. Based on the presentation, the indicator is universal, using the formula on every trading instrument is valid. The timeframe is also universal, thus it can also be used in certain scalping strategies and has a good way of having an exit signal, not just rend confirmation. TDO will draw an arrow on the chart once the trend is confirmed, and does this based on 5 different TDO periods alignment in the same direction, bullish or bearish. This is done to prevent false zero-cross signals as per developer words. Additionally, TDO is confirmed to be non-repainting.

To facilitate with Take Profit and Stop Loss management, TDO features a panel with buttons to turn on the Linear Regression channel or Standard Deviation channel, giving the traders precise levels for this purpose using one of the best mathematical methods for measuring volatility highs and downs. Also, you can add Grid levels (rounded up price) and the automatic Support and Resistance plotting on the chart. A well rounded up solution for those using the Price Action strategies.

The developer has a very neat “table of contents” providing the readers a link to the TDO demo, User Manual, FAQ, Video library, and an EA development guide on the TDO indicator. All of the guides are clear and well written. TDO is simple to trade, an arrow will point and confirm the trend, the arrow in another direction could also mean the exit and the appearance of a new trend. Scaling in, or adding a position to already open trade in the same direction, is suggested once the TDO panel lights are aligned.

Of course, you can set alerts when this happens and also on additional parameters so traders will not miss the opportunity. The video provided shows that the indicator has a histogram that draws only once all of the TDO signals are aligned, showing the “True” trend. Using this histogram can also be a good exit or continuation strategy.

Four color palettes are offered in the settings listing and you can also have a quick symbol changer on the chart, allowing traders to have easy switching for all major 28 currency pairs on a single chart window. If 28 currency symbols are not enough, you can add more in the settings using the “;” separator. If you have too many symbols, you can arrange them in custom formation like 3 rows with 10 symbol buttons or similar. Timeframes switching is also designed similarly, right below the symbol buttons with the option to show up to 9 timeframes.

The mentioned channels are also customizable in the settings where you can change values for the calculation period, and also to set the channel as a ray, extending well beyond the last price level for prediction purposes. Grid settings are optional and the same is for the Support and Resistance automatic plotting.

Service Cost

TDO is priced $50 to buy with 1000 activations. Therefore, traders purchasing this indicator will never run out of licenses. Renting is possible for 1 month for $10 and 3 months for $30. A demo is provided but works only on the EUR/SUD pair with full functionalities, a separate link for it is provided. The price for a great trend indicator is never an issue, especially when we see support form the author and extremely good rating.

Conclusion

TDO has a rating of 4.9 out of 388 reviews and has 552 comments to this date. This is hard to achieve, we had to search a while to find bad reviews, we have found one that signals that TDO might be lagging for some:

“These signals are mostly wrong. Not sure what everyone is talking about. The panel constantly changes and the arrows are mostly wrong.”

Out of the good reviews, to the point is the one from bubienok:

“True Direction Oscillator and Bermaui Deviation Percent are perfect for intraday and also trend trading. Excellent work Muhammad.”

TDO is probably one to go for trend or swing traders, it goes very well with other indicators from this developer, but it can also be a great addition to any system.

This Forex service can be found at the following web address: https://www.mql5.com/en/market/product/12914