Categories
Crypto Videos

Miami To Become The First Crypto-Centric City? Winklevoss Twins Backing The Mayor!


Will Miami Become the First Crypto-Centric City in the US?

Miami mayor Francis Suarez has joined the Bitcoin advocates “club” as he offered more evidence that mainstream adoption is accepting the largest cryptocurrency.  

In a tweet that came out on Dec 24, Suarez stated that Bitcoin is a “stable investment during an incredibly unstable year,” then adding that he has just started learning about the best-known digital asset through figures like the Winklevoss brothers and Anthony Pompliano.

Cameron Winklevoss, left, and his twin brother Tyler leave a federal appeals court in San Francisco, California, U.S., on Tuesday, Jan. 11, 2011. Facebook Inc.’s settlement of claims that its founder Mark Zuckerberg stole the idea for what became the world’s largest social-networking website should be undone, former college classmates of Zuckerberg told an appeals court. Photographer: Noah Berger/Bloomberg via Getty Images

Tyler Winklevoss and Pompliano responded to Suarez’s tweet, with Tyler saying he and his brother Cameron will bring the mayor of Miami a “signed copy of Bitcoin Billionaires,” a book written about the aforementioned twins, while Pompliano called Miami a future Bitcoin city.

Suarez also indicated that his administration is currently exploring the idea of Miami truly becoming the first crypto-centric government in the US. However, he provided no further details on the topic.

Francis Suarez was elected the mayor of Miami in Nov 2017 after running his campaign as a nonpartisan candidate. Before entering politics, he founded a real estate title company, but also worked as an attorney.

Miami has often been described as one of the US cities with the biggest potential of becoming crypto-centric by some news outlets, mostly due to its lax state oversight and a large influx of foreign capital. The North American Bitcoin Conference, which featured figures like Charles Hoskinson, Riccardo Sagni, and Roger Ver, was held in Miami at the start of 2020.

Bitcoin’s explosive rally and bull trend, which it is currently in, is certainly driving new conversations about the digital asset to the table. This is especially true as this rally, unlike the one in 2017, was fueled mostly by corporate and institutional adoption, rather than the retail sector. Bitcoin adoption is increasingly viewed not as a speculation, but as a competitive advantage in an economy riddled with financial instability, record central-bank intervention, and significant asset-price inflation. 

Categories
Crypto Market Analysis

Daily Crypto Review, Dec 31 – Bitcoin Hits a New All-Time High as it Pushes Past $29K

The cryptocurrency sector is stabilizing vastly in the green as Bitcoin pushed above $29,000, creating a new all-time high. Bitcoin is currently trading for $29,001, representing an increase of 4.40% compared to yesterday’s value. Meanwhile, Ethereum’s price has increased by 2.40% on the day, while XRP gained 6.74% of its value.

Daily Crypto Sector Heat Map

Yearn Finance Passive Income gained 759.27% in the past 24 hours, making it the most prominent daily crypto gainer by far. It is followed by DragonVein’s 268.8% and Gala’s 146.76% gain. On the other hand, BitBall lost 63.32%, making it the most prominent daily loser. It is followed by MITH Cash’s loss of 63.25% and Blue Whale Exchange’s loss of 53.96%.

Top 10 24-hour Performers (Click to enlarge)

Bottom 10 24-hour Performers (Click to enlarge)

Bitcoin’s market dominance has moved up half a percent since our last report, with its value currently being 70.6%. This value represents a 0.5% difference to the upside than the value it had when we last reported.

Daily Crypto Market Cap Chart

The cryptocurrency sector capitalization has increased since we last reported, with its current value being $762.78 billion. This represents a $25.47 billion increase when compared to our previous report.

_______________________________________________________________________

What happened in the past 24 hours?

_______________________________________________________________________

_______________________________________________________________________

Technical analysis

_______________________________________________________________________

Bitcoin

Bitcoin has continued its move up on slightly higher volume, breaking its $28,600 resistance level and entering unexplored territory. The push ended with bull exhaustion at the $29,300 mark, creating a new all-time high.

Bitcoin’s price has hit this level twice in a short span of time, creating a double top and propelling BTC slightly backward. Its price is currently trading below $29,000, in a range bound by $28,600 to the downside and $29,300 to the upside.

Even though a move towards $30,000 is quite possible, many analysts have pointed to enormous sell walls at and around this level, making it extremely hard to breakthrough.

 BTC/USD 1-hour chart

Bitcoin’s technicals are showing a strong tilt towards the buy-side. However, its oscillators are tilting towards bearishness due to the overextended move to the upside.

BTC/USD 1-day Technicals

Technical factors (4-hour Chart):

  • Price is above its 50-period EMA and at its 21-period EMA
  • Price is near its middle Bollinger band
  • RSI is neutral (56.57)
  • Volume is slightly above average

Key levels to the upside          Key levels to the downside

1: $28,600                                 1: $28,391

2: $29,000                                 2: $25,512

3: $30,000                                 3: $24,696

Ethereum

Ethereum has sparked by Bitcoin’s push up, tried to break its most immediate resistance level of $747. While the second-largest cryptocurrency by market cap did manage to push through and reach $759 at one point, the bulls were not able to hold this level, which triggered a pullback below $747.

Ethereum is currently trading right below $747, with the 50-hour and 21-period 4-hour moving averages providing it support.

Ethereum is most likely in for a short-term correction as its volume is descending quickly after a failed attempt to tackle the upside.

 ETH/USD 1-hour Chart

Ethereum’s technicals look very much like Bitcoin’s, with the overall tilt being towards the buy-side, with oscillators tilting towards bearishness.

ETH/USD 1-day Technicals

Technical Factors (4-hour Chart):

  • Price is above its 50-period and at its 21-period EMA
  • Price is near its middle Bollinger band
  • RSI is neutral (50.10)
  • Volume is descending from above-average levels

Key levels to the upside          Key levels to the downside

1: $747                                     1: $675

2: $800                                     2: $653

3: $900                                      3: $632

Ripple

XRP gained over 5% on the day due to Bitcoin’s upwards-facing move pulling the market as a whole up. When looking at it from a technical standpoint, XRP managed to win the fight for $0.214, which is certainly a positive thing.

However, more bad news came out to the public, with even more exchanges suspending trading for XRP. Even though many analysts say that XRP is not a security, the sheer pressure that the SEC lawsuit exerts on the project caused almost every exchange and fund to distance themselves from Ripple and XRP, causing its price to crash.

 XRP/USD 1-hour Chart

XRP’s technicals on all time-frames are tilted towards the sell-side, with only the daily overview being completely bearish.

XRP/USD 1-day Technicals

Technical factors (4-hour Chart):

  • Its price is currently at its 50-period EMA and below its 21-period EMA
  • Price is at its middle Bollinger band
  • RSI is in the oversold territory (50.22)
  • Volume is currently on below-average levels

Key levels to the upside          Key levels to the downside

1: $0.25                                    1: $0.214

2: $0.30                                     2: $0.14

3: $0.358


Categories
Crypto Market Analysis

Daily Crypto Review, Dec 30 – Bitcoin Creates a New All-Time High; XRP Recovers Slightly

The cryptocurrency sector is stabilizing after Bitcoin’s failed push towards the upside, which in fact created a new all-time high, but just for a moment. Bitcoin is currently trading for $27,848, representing an increase of 3.41% compared to yesterday’s value. Meanwhile, Ethereum’s price has decreased by 1.22% on the day, while XRP gained 5.71% of its value.

 Daily Crypto Sector Heat Map

EveryCoin gained 371.17% in the past 24 hours, making it the most prominent daily crypto gainer by far. It is followed by Wownero’s 223.09% and Gala’s 167.69% gain. On the other hand, PENTA lost 98.72%, making it the most prominent daily loser. It is followed by AS Roma Fan Token’s loss of 64.83% and Reef’s loss of 64.46%.

Top 10 24-hour Performers (Click to enlarge)

Bottom 10 24-hour Performers (Click to enlarge)

Bitcoin’s market dominance has moved up almost a whole percent since our last report, with its value currently being 70.1%. This value represents a 0.9% difference to the upside than the value it had when we last reported.

Daily Crypto Market Cap Chart

The cryptocurrency sector capitalization has increased since we last reported, with its current value being $737.31billion. This represents an $24.83 billion increase when compared to our previous report.

_______________________________________________________________________

What happened in the past 24 hours?

_______________________________________________________________________

_______________________________________________________________________


Technical analysis

_______________________________________________________________________


Bitcoin

Bitcoin has broken its slight descending consolidation phase by bouncing off of the $26,000 level and pushing towards its all-time high level. While the level got barely broken and Bitcoin set a new all-time high, the bulls were not able to push past the resistance zone with confidence due to the lack of volume and buying pressure.

As a consequence of this, Bitcoin dipped to $27,600 levels, where it is consolidating at the moment. Traders should pay attention to volume movements, as these are the best indication of whether the move will actually break a support/resistance level at the moment.

If Bitcoin fails to break the all-time high level in the short future, we can expect a retracement that could reach the $23,000 zone.


BTC/USD 1-hour chart

Bitcoin’s technicals on the 4-hour and weekly time-frames are completely bullish, while the daily and monthly ones still contain some form of neutrality or bearishness.

BTC/USD 1-day Technicals

Technical factors (4-hour Chart):

  • Price is above its 50-period EMA and at its 21-period EMA
  • Price is near its top Bollinger band
  • RSI is neutral (61.24)
  • Volume is slightly above average

Key levels to the upside          Key levels to the downside

1: $28,391                                 1: $25,512

2: $29,000                                 2: $24,696

3: $30,000                                  3: $24,315

Ethereum

Ethereum has spent the whole day trading right below its immediate resistance level of $747. The second-largest cryptocurrency by market cap tried to break above it twice, but failed both times. Ether is currently descending in price as a consequence of the failed bull attempts which created a double top.

Ethereum traders have to pay attention to Bitcoin’s movements, as its movement (either up or down) will most likely cause Ether’s next move.

ETH/USD 1-hour Chart

Ethereum’s technicals on every time-frame are tilted towards the bull-side. However, they all contain slight neutrality or bearishness alongside the overall tilt towards the buy-side.

ETH/USD 1-day Technicals

Technical Factors (4-hour Chart):

  • Price is above both its 50-period and its 21-period EMA
  • Price is near its middle Bollinger band
  • RSI is neutral (58.07)
  • Volume is trading on above-average levels

Key levels to the upside          Key levels to the downside

1: $747                                     1: $675

2: $800                                     2: $653

3: $900                                      3: $632

Ripple

XRP has spent the day trying to stabilize its price after days of constant price dips. The fourth-largest cryptocurrency by market cap bounced off of the $0.173 level, and propelled itself towards the next zone, sitting at $0.214.

XRP is currently fighting for the $0.214 level, and if no new news (positive or negative) pop out, its short-term price will most likely depend on whether it manages to stay above the $0.214 level or fall below it.

XRP/USD 1-hour Chart

XRP’s technicals on all time-frames are tilted towards the sell-side, with only the 4-hour and monthly overviews showing some form of neutrality.

XRP/USD 1-day Technicals

Technical factors (4-hour Chart):

  • Its price is currently far below both its 50-period EMA and its 21-period EMA
  • Price is between its bottom and middle Bollinger band
  • RSI is in the oversold territory (37.52)
  • Volume has spiked to above-average levels

Key levels to the upside          Key levels to the downside

1: $0.25                                    1: $0.214

2: $0.30                                     2: $0.14

3: $0.358


Categories
Cryptocurrencies

Who Is the True Creator of Bitcoin?

Satoshi Nakamoto is the known and recognized creator of Bitcoin. And even if we don’t know who Satoshi Nakamoto is or was, we do know what he has done. He or she (or they) invented the bitcoin protocol and published it in a scientific paper through the Cryptography Mailing List in October 2008.

No one knows his or her identity, which makes this all the more mysterious. We will refer to Satoshi as “he” going forward in this article. Satoshi’s identity is a topic that always arouses curiosity. It is for this reason that we publish this article echoing the information that exists to date. In 2009 he published the first version of the bitcoin client and participated with others in the project until his presence began to dilute towards the end of 2010.

He worked with others at first although he took great care not to make personal information visible and the last one he knew of him/her was in the spring of 2011 when he said that “he was to other things”.

But it’s Japanese, isn’t it?

“Satoshi” means “clear, witty, wise thinking”.

“Naka” can mean “mean, relationship”.

“Moto” can mean “origin or creation”.

We can’t know for sure if he was Japanese or not, not even his gender, age, or any other data. We might even be talking about a group of people, instead of a single individual.

Does anyone know who Nakamoto is?

No, but the conclusions people draw when they start to investigate can lead to even more intriguing information. Joshua Davis of the New Yorker believes that Satoshi Nakamoto is Michael Clear, a cryptography student at Trinity College in Dublin.

He drew this conclusion after analyzing 80,000 words from Nakamoto’s writings and looking for grammatical coincidences. He also suspected Finnish sociologist, economist, and video game developer Vili Lehdonvirta. Both have denied being the creators of bitcoin, making it public to Michael Clear at the 2013 Web Summit.

Fast Company’s Adam Penenberg contradicted that information by claiming that Nakamoto was three people:

“Neal King, Vladimir Oksman and Charles Bry”.

He came to this conclusion by writing loose phrases from Nakamoto’s scientific article on Google to see if they were used anywhere else. One of them, “computationally impractical to reverse”, turned out to be part of a patent application filed by these three people, regarding a system to update and distribute encryption keys.

“… the outputs of which are fixed-size strings that are computationally 

impractical to reverse-map. In this manner, the shared secret …”

The bitcoin.org domain originally used to publish the scientific paper created by Satoshi had been registered three days before the patent request.

It was registered in Finland and one of the patent authors had traveled there six months before the domain was registered.

All of those “involved” deny it.

In any case, when the bitcoin.org domain was registered on August 18, 2008, he/she who registered it used a Japanese anonymous registration service and the hosting used a Japanese ISP. The registration of the site was then transferred to Finland on 18 May 2011.

It is curious that the domain with extension “.com” (usually the most desired, bitcoin.com) was registered on January 4, 2008… Maybe it’s just chance. Currently, Bitcoin.com is owned by Roger Ver.

Others think it was Martii Malmi, a developer from Finland who has been involved in bitcoin development from the start, creating its user interface.

In May 2013, internet pioneer Ted Nelson added more fuel to the fire by stating that Satoshi could be Japanese mathematician Shinichi Mochizuki, although he admits that the evidence is circumstantial at best.

In February 2014, Leah McGrath Goodman of Newsweek claimed to have found the real Satoshi Nakamoto. Dorian S Nakamoto has since denied knowing anything about Bitcoin, coming to hire a lawyer and making an official statement.

Hal Finney, Michael Weber, Wei Dai, and other developers are among the names that occasionally come to light in media reports and discussions in online forums as potential “Satoshis”.

A group of forensic linguists from Aston University believes that the real creator is retired law professor Nick Szabo, based on the analysis of the scientific article on bitcoin.

Dominic Frisby, a comedian, and writer also suggests that Szabo is the strongest candidate to be Satoshi in his book “Bitcoin: The Future of Money”.

His detailed analysis takes into account the linguistic factors of what Satoshi wrote as well as his knowledge of C++ and his likely birthday date.

To a large extent, all of these potential Satoshi candidates have insisted that they are not the creators of bitcoin.

Michael Weber hasn’t answered yet.

Some even think that Bitcoin has been the creation of 4 leading technology companies. This is because the name of Satoshi Nakamoto carries within it clues to them: SAmsung, TOSHIba, NAKAmichi, and MOTOrola.

Jed McCaleb, a lover of Japanese culture living there who created Mt. Gox and co-founded Ripple and later Stellar, has also been targeted.

Another theory suggests that scientists Donal O’Mahony and Michael Peirce are Satoshi Nakamoto, based on a scientific paper of which they are authors and which deals with virtual payments together with Hitesh Tewari, based on a book they published together. O’Mahony and Tewari also worked at Trinity College, that is, at the same site as Michael Clear.

Israelis Dorit Ron and Adi Shamir of the Weizmann Institute recanted allegations made in an article suggesting a link between Satoshi and Silk Road, the black market dismantled by the FBI in October 2013. They suggested a link between an address that supposedly belonged to Satoshi and the site.

Security investigator Dustin D. Trammel owned the address and was said to be Satoshi. Either way, others think he wasn’t even Japanese. His English, in the texts he wrote, shows typical idiomatic nuances of a native English.

What do we know about him?

One thing we know, based on interviews with people who have worked with him/her in the early stages of bitcoin development is that their system is very well thought out. His coding skills were unconventional, according to developer Jeff Garzik, as he did not apply the same tests on the code you would expect from a classic computer engineer.

How many bitcoins could he have?

In an analysis made by Sergio Lerner, an authority in the world of Bitcoin and cryptography, it was suggested that Satoshi mined most of the first blocks of the network and that he could have a fortune of about a million bitcoins.

What is he doing now?

No one knows what Satoshi is currently involved in. But in one of the last emails he sent to a developer, dated April 23, 2011, he said, “I’ve moved on to other things. He’s in good hands with Gavin and the rest.”

Does he work for the government?

Although there are rumors that Satoshi may work for one of the “three-letter” intelligence agencies (CIA, FBI, etc.), or maybe even some shadow organization looking for a common currency to dominate the planet, developer Jeff Garzik makes it clear:

“Satoshi published an open-source system so that no one needed to know who he was or what knowledge he had. Open-source software makes it impossible to hide secrets. Source code speaks for itself.”

In fact, he was smart to use a pseudonym. This, then, forces people to focus on the technology itself rather than the person behind it.

Today, Bitcoin is much bigger than the figure of Satoshi Nakamoto. It doesn’t matter who it is for many anymore. Its initial code has been improved thanks to the effort of some of the best brains on the planet working collaboratively. The work has been done in a totally altruistic way daily making this technology better and better.

Categories
Crypto Market Analysis

Daily Crypto Review, Dec 29 – XRP Trading Suspended by Coinbase and OKEx, Causing a 22% Price Dip

The cryptocurrency sector had is currently in a consolidation phase as Bitcoin fell below $27,000. Bitcoin is currently trading for $26,624, representing a decrease of 1.13% compared to yesterday’s value. Meanwhile, Ethereum’s price has decreased by 2.56% on the day, while XRP had another major dip, losing 19.42% of its value.

 Daily Crypto Sector Heat Map

Ethereum Lightning gained 1097.36% in the past 24 hours, making it the most prominent daily crypto gainer by far. It is followed by N3RD Finance’s 94.18% and Matrix AI Network’s 86.08% gain. On the other hand, COVER Protocol lost 97.97%, making it the most prominent daily loser. It is followed by Encryptgen’s loss of 91.18% and Mining Core Coin’s loss of 69.41%.

Top 10 24-hour Performers (Click to enlarge)

Bottom 10 24-hour Performers (Click to enlarge)

Bitcoin’s market dominance has moved up slightly since our last report, with its value currently being 69.2%. This value represents a 0.1% difference to the upside than the value it had when we last reported.

Daily Crypto Market Cap Chart

The cryptocurrency sector capitalization has decreased slightly since we last reported, with its current value being $712.73 billion. This represents an $8.45 billion decrease when compared to our previous report.

_______________________________________________________________________

What happened in the past 24 hours?

_______________________________________________________________________

_______________________________________________________________________

Technical analysis

_______________________________________________________________________

Bitcoin

Ever since it hit the $28,391 all-time high, Bitcoin has been trading in a sideways manner. Its price is currently within a large channel, bound by $25,512 to the downside and the aforementioned all-time high to the upside.

The descending volume alongside sideways trading was never a long-term occurrence with Bitcoin, but rather good indicators of a new explosive move ahead.

Bitcoin traders should be mindful of any volume spikes when trading, and should look for smaller time-frame Fib retracements if they want to be more precise with setting their support and resistance levels.

BTC/USD 1-hour chart

Bitcoin’s technicals on both short-term and long-term time-frames are completely bullish and show close to no signs of neutrality or bearishness.

BTC/USD 1-day Technicals

Technical factors (4-hour Chart):
  • Price is above its 50-period EMA and at its 21-period EMA
  • Price is at its middle Bollinger band
  • RSI is neutral (55.72)
  • Volume is slightly above average, but descending
Key levels to the upside          Key levels to the downside

1: $28,391                                 1: $25,512

2: $29,000                                 2: $24,696

3: $30,000                                  3: $24,315

Ethereum

Ethereum’s move towards the upside ended at $747, prompting a pullback. However, while many analysts believed that Ether would not keep its price above $700, that’s exactly what happened.

Ethereum’s signature trading move has occurred once again, with that move being: pushing up, then pulling back, and breaking the 21-hour moving average to the downside, only to find support at the 50-hour moving average and push back up. Knowing how Ethereum moves alongside watching Bitcoin’s moves is one of the safest ways to trade cryptocurrencies at the moment, as the moves have pre-determined stop-losses and targets.


ETH/USD 1-hour Chart

Ethereum’s shorter time-frames are completely bullish and show no signs of neutrality or bearishness, while its longer-time frames have some neutrality present alongside the overall bullishness.

ETH/USD 1-day Technicals

Technical Factors (4-hour Chart):
  • Price is above both its 50-period and its 21-period EMA
  • Price is above its middle Bollinger band
  • RSI is neutral (59.39)
  • Volume is trading on above-average levels
Key levels to the upside          Key levels to the downside

1: $747                                     1: $675

2: $800                                     2: $653 

3: $900                                      3: $632

Ripple

XRP has experienced another extremely bad day, as its price dropped more than 22% on the day. The move came as a result of two major exchanges, OKEx and Coinbase, dropping support for XRP due to the pending lawsuit against its company, Ripple, as well as Ripple’s executives.

Trading XRP is extremely risky at the moment due to price fluctuations that are a result of news rather than technical formations.

XRP/USD 1-hour Chart

XRP’s technicals on all time-frames are tilted towards the sell-side, with all of them showing slight signs of neutrality.

XRP/USD 1-day Technicals

Technical factors (4-hour Chart):
  • Its price is currently far below both its 50-period EMA and its 21-period EMA
  • Price is at its bottom Bollinger band
  • RSI is in the oversold territory (28.88)
  • Volume has spiked to above-average levels
Key levels to the upside          Key levels to the downside

1: $0.25                                    1: $0.214

2: $0.30                                     2: $0.14

3: $0.358 

Categories
Crypto Market Analysis

Daily Crypto Review, Dec 28 – Ethereum Breaks $700; Bitcoin at $30k?

The cryptocurrency sector had an incredible weekend as Bitcoin skyrocketed towards $28,000. Bitcoin is currently trading for $27,031, representing a decrease of 2.91% compared to yesterday’s value, but a massive increase compared to its value on Friday. Meanwhile, Ethereum’s price has increased by 12.79% on the day, while XRP managed to lose 4.05%.

 Daily Crypto Sector Heat Map

EncrypGen gained 2787.56% in the past 24 hours, making it the most prominent daily crypto gainer by far. It is followed by Bankacoin’s 212.44% and Trabzonspor Fan Token’s 178.8% gain. On the other hand, CEZO lost 89.89%, making it the most prominent daily loser. It is followed by JD Coin’s loss of 64.79% and Triumph X’s loss of 57.74%.

Top 10 24-hour Performers (Click to enlarge)

Bottom 10 24-hour Performers (Click to enlarge)

Bitcoin’s market dominance has moved down slightly since our last report, with its value currently being 69.1%. This value represents a 0.25% difference to the downside than the value it had when we last reported.

Daily Crypto Market Cap Chart

The cryptocurrency sector capitalization has increased over $100 billion since we last reported, with its current value being $721.10 billion. This represents a $101.89 billion increase when compared to our previous report.

_______________________________________________________________________

What happened in the past 24 hours?

_______________________________________________________________________

_______________________________________________________________________

Technical analysis

_______________________________________________________________________

Bitcoin

Bitcoin did not sleep this weekend as it took its time to push towards new all-time highs. The best-known cryptocurrency pushed towards the upside, reaching as high as $28,391 at one point. It is now consolidating around the $27,000 level and preparing for the next move.

Our Fib extensions drawn on Friday worked exactly as expected, with Bitcoin respecting every single one of them. With all of them still being a valid choice, traders should either look for a bounce off the immediate support levels or increased volume followed by a sharp increase in price. Trading Bitcoin’s pullbacks is not exactly the best option at the moment.

BTC/USD 4-hour chart

While Bitcoin’s 4-hour and weekly technicals show a full tilt towards the buy-side, its daily and monthly technicals show some neutrality signs.

BTC/USD 1-day Technicals

Technical factors (4-hour Chart):
  • Price is above its 50-period EMA and slightly above its 21-period EMA
  • Price is slightly above its middle Bollinger band
  • RSI is neutral (62.10)
  • Volume is slightly above average
Key levels to the upside          Key levels to the downside

1: $28,391                                 1: $25,512

2: $29,000                                 2: $24,696

3: $30,000                                  3: $24,315

Ethereum

While Ethereum did manage to score some gains over the weekend, its upside got overshadowed by Bitcoin’s growth. However, the second-largest cryptocurrency by market cap has decided to make that up by suddenly pushing from $624 all the way up to $738. While the move seemingly ended here, it is not yet certain whether the price will break the level or go even higher, or start its consolidation at slightly lower levels.

Traders should utilize the volume indicator, order books, and well-established support/resistance levels to its fullest to catch these explosive trades while remaining safe.

ETH/USD 4-hour Chart

Ethereum’s shorter time-frames are completely bullish, while its longer-time frames show slight neutrality signs.

ETH/USD 1-day Technicals

Technical Factors (4-hour Chart):
  • Price is far above both its 50-period and its 21-period EMA
  • Price is at its top Bollinger band
  • RSI has stepped into the overbought territory (71.68)
  • Volume is trading on above-average levels
Key levels to the upside          Key levels to the downside

1: $738                                     1: $675

2: $800                                     2: $632 

3: $900                                      3: $600

Ripple

XRP has been trading on low volume and slowly descending after a brief rally to $0.385. The fourth-largest cryptocurrency keeps getting crushed by various companies dropping support or liquidating their XRP positions after Ripple and its executives got sued by the SEC.

XRP traders should (more than anything) pay attention to the news. However, there are many other cryptocurrencies with much safer and potentially more profitable trading setups at the moment.

XRP/USD 4-hour Chart

XRP’s technicals on all time-frames slightly tilted towards the sell-side, but they all show some signs of uncertainty.

XRP/USD 1-day Technicals

Technical factors (4-hour Chart):
  • Its price is currently far below its 50-period EMA and slightly below its 21-period EMA
  • Price slightly below its middle Bollinger band
  • RSI has left the oversold territory (37.46)
  • Volume is returning to average levels
Key levels to the upside          Key levels to the downside

1: $0.30                                    1: $0.25

2: $0.358                                   2: $0.214

3: $0.475 

Categories
Crypto Market Analysis

Daily Crypto Review, Dec 24 – XRP Downturn Pulls the Crypto Sector in the Red

The cryptocurrency sector reacted to XRP getting crushed by the market and ended up mostly in the red. Bitcoin is currently trading for $23,112, representing a decrease of 1.97% when compared to yesterday’s value. Meanwhile, Ethereum’s price has decreased by 6.27% on the day, while XRP managed to lose a whopping 30.85%.

 Daily Crypto Sector Heat Map

Folgory Coin gained 5571.49% in the past 24 hours, making it the most prominent daily crypto gainer by far. It is followed by MINDOL’s 1224.26% and DACC’s 1070.44% gain. On the other hand, 3x Long XRP Token lost 77.00%, making it the most prominent daily loser. It is followed by B21 Invest’s loss of 74.30% and YFPRO Finance’s loss of 70.96%.

Top 10 24-hour Performers (Click to enlarge)

Bottom 10 24-hour Performers (Click to enlarge)

Bitcoin’s market dominance has moved up over one percent since our last report, with its value currently being 69.3%. This value represents a 1.5% difference to the upside than the value it had when we last reported.

Daily Crypto Market Cap Chart

The cryptocurrency sector capitalization has decreased significantly since we last reported, with its current value being $619.31 billion. This represents a $22.90 billion decrease when compared to our previous report.

_______________________________________________________________________

What happened in the past 24 hours?

_______________________________________________________________________

_______________________________________________________________________

Technical analysis

_______________________________________________________________________

Bitcoin

Bitcoin was one of the few cryptocurrencies not affected by the major downturn of XRP after the SEC announced a lawsuit against Ripple and its executives. The largest cryptocurrency by market cap stayed within its wide range and continued trading sideways after bouncing back from the $24,000 level.

Traders currently have the option to catch a couple of safe trades within the trading range Bitcoin is in, or wait for it to spike in volume and break the range (either to the downside or upside).

BTC/USD 4-hour chart

While Bitcoin’s daily and weekly technicals are slightly tilted towards the bull side, its 4-hour and monthly technicals show some hints of neutrality alongside the bullishness.

BTC/USD 1-day Technicals

Technical factors (4-hour Chart):
  • Price is above its 50-period EMA and at its 21-period EMA
  • Price at its middle Bollinger band
  • RSI is neutral (53.57)
  • Volume is slightly above average
Key levels to the upside          Key levels to the downside

1: $24,315                                 1: $22,054

2: $24,700                                 2: $21,350

3: $25,511                                  3: $19,918

Ethereum

Unlike Bitcoin, Ethereum got affected by XRP’s downturn, which pulled it back over 5% on the day. The second-largest cryptocurrency fell below its $600 support level, and caused a quick panic-sell which brought its price as low as $550 (though just for a moment). Ether is now fighting to stay above the $581 level, which it will most likely succeed.

Many analysts are calling for a double bottom and are expecting an upswing from Ethereum. Traders should pay close attention to Ether’s volume and (possibly) order books.

ETH/USD 4-hour Chart

Ethereum’s weekly and monthly technicals are completely bullish, while its 4-hour and daily overview are mainly tilted towards the sell-side, but show some signs of uncertainty.

ETH/USD 1-day Technicals

Technical Factors (4-hour Chart):
  • Price is below both its 50-period and its 21-period EMA
  • Price is close to its bottom Bollinger band
  • RSI is neutral (37.44)
  • Volume is on slightly above-average levels
Key levels to the upside          Key levels to the downside

1: $600                                     1: $581

2: $632                                     2: $564 

3: $675                                      3: $545

Ripple

XRP got crushed as more bad news came. The fourth-largest cryptocurrency by market cap got dropped by various exchanges, as well as its positions fully liquidated by major funds such as Bitwise. Its price dipped over 65% in just 5 days. However, XRP seems to have found support in (first) the $0.214 and (later) $0.25 levels.

XRP will most likely try to either hold its price level or push slightly towards the upside. While its further downside potential is not very high (unless more bad news comes out), buying or longing XRP is extremely risky.

XRP/USD 4-hour Chart

XRP’s technicals on all time-frames are completely tilted towards the sell-side.

XRP/USD 1-day Technicals

Technical factors (4-hour Chart):
  • Its price is currently far below both its 50-period EMA and its 21-period EMA
  • Price slightly above its bottom Bollinger band
  • RSI is in the oversold territory (19.40)
  • Volume is on extremely high levels
Key levels to the upside          Key levels to the downside

1: $0.30                                    1: $0.25

2: $0.358                                   2: $0.214

3: $0.475 

Categories
Crypto Market Analysis

Daily Crypto Review, Dec 23 – Is This the End of XRP? SEC Officially Files Lawsuit Against Ripple and its Executives

The cryptocurrency sector was mostly neutral as Bitcoin gained even more market dominance. Bitcoin is currently trading for $23.498, representing an increase of 3.53% when compared to yesterday’s value. Meanwhile, Ethereum’s price has increased by 1.28% on the day, while XRP managed to lose a whopping 23.99%.

 Daily Crypto Sector Heat Map

SYNC Network gained 97.23% in the past 24 hours, making it the most prominent daily crypto gainer by far. It is followed by 3x Short XRP Token’s 84.56% and Basis Share’s 77.1% gain. On the other hand, DMme lost 85.99%, making it the most prominent daily loser. It is followed by 3x Long XRP Token’s loss of 66.89% and S4FE’s loss of 60.04%.

Top 10 24-hour Performers (Click to enlarge)

Bottom 10 24-hour Performers (Click to enlarge)

Bitcoin’s market dominance has moved up over one percent since our last report, with its value currently being 67.8%. This value represents a 1.2% difference to the downside than the value it had when we last reported.

Daily Crypto Market Cap Chart

The cryptocurrency sector capitalization has increased since we last reported, with its current value being $642.21 billion. This represents a $9.69 billion increase when compared to our previous report.

_______________________________________________________________________

What happened in the past 24 hours?

_______________________________________________________________________

_______________________________________________________________________

Technical analysis

_______________________________________________________________________

Bitcoin

Bitcoin continued trading within a decently large range, bound by $22,054 to the downside and $24,315 to the upside. The largest cryptocurrency by market cap managed to gain a couple of percent on its price today, as most of the market consolidated. Therefore, Bitcoin market dominance has risen once again, almost reaching 70%.

Bitcoin’s descending volume and sideways trading were always a sign of a new move in the making. However, as the current trading range is quite wide, the sharp move to either side might not be so imminent.

BTC/USD 4-hour chart

While Bitcoin’s daily and weekly technicals are tilted towards the bull side, its 4-hour and monthly overviews are slightly bullish, but show some hints of neutrality.

BTC/USD 1-day Technicals

Technical factors (4-hour Chart):
  • Price is above its 50-period EMA and slightly above its 21-period EMA
  • Price near its middle Bollinger band
  • RSI is neutral (56.31)
  • Volume is slightly above average
Key levels to the upside          Key levels to the downside

1: $24,315                                 1: $22,054

2: $24,700                                 2: $21,350

3: $25,511                                  3: $19,918

Ethereum

Ethereum has followed Bitcoin to the upside and gained just enough traction to attempt a $632 level break, but not enough to actually break it. This triggered a small correction, which brought it to the middle of the range, bound by $600-$602 to the downside and $632 to the upside.

Ethereum’s price movements are (in the past couple of days) either an exact copy of Bitcoin’s moves, or an exaggerated move in the same direction. Traders could possibly use this to trade Ether’s exaggerated moves by watching Bitcoin’s movement.

ETH/USD 4-hour Chart

Ethereum’s daily, weekly, and monthly technicals are completely bullish, while its 4-hour overview is tilted towards the sell-side.

ETH/USD 1-day Technicals

Technical Factors (4-hour Chart):
  • Price is slightly below both its 50-period and its 21-period EMA
  • Price is close to its middle Bollinger band
  • RSI is neutral (44.94)
  • Volume is on slightly above-average levels
Key levels to the upside          Key levels to the downside

1: $632                                     1: $600

2: $675                                     2: $581 

3: $738.5                                   3: $564

Ripple

XRP got crushed today on horrible news of SEC officially filing a lawsuit against its company Ripple as well as against its cofounders. While MoneyGram took a lenient position and didn’t want to make any negative comments, most crypto exchanges are planning on delisting XRP due to concerns regarding regulation.

While some may think that short-selling XRP is a good idea, watch out for slippage and insufficient demand.

XRP/USD 4-hour Chart

XRP’s short-term technicals show a heavy tilt towards the sell-side, while its long-term technicals (weekly and monthly) remain bullish.

XRP/USD 1-day Technicals

Technical factors (4-hour Chart):
  • Its price is currently far below both its 50-period EMA and its 21-period EMA
  • Price slightly below its bottom Bollinger band
  • RSI is in the oversold territory (18.53)
  • Volume is on extremely high levels
Key levels to the upside          Key levels to the downside

1: $0.40                                    1: $0.33

2: $0.475                                   2: $0.297

3: $0.481 

Categories
Crypto Market Analysis

Daily Crypto Review, Dec 22 – XRP Plummets on News of SEC Suing Ripple; Crypto Sector in the Red

The cryptocurrency sector bounced back from its recent highs as the news of a new COVID-19 strain came out. Bitcoin is currently trading for $22,716, representing a decrease of 5.01% when compared to yesterday’s value. Meanwhile, Ethereum’s price has decreased by 5.41% on the day, while XRP managed to lose a whopping 16.97%.

 Daily Crypto Sector Heat Map

P2P gained 185.24% in the past 24 hours, making it the most prominent daily crypto gainer by far. It is followed by DMme’s 123.95% and Actinium’s 96.18% gain. On the other hand, Wownero lost 54.05%, making it the most prominent daily loser. It is followed by Tap’s loss of 47.05% and Super Bitcoin’s loss of 46.31%.

Top 10 24-hour Performers (Click to enlarge)

Bottom 10 24-hour Performers (Click to enlarge)

Bitcoin’s market dominance has moved up over one percent since our last report, with its value currently being 66.6%. This value represents a 1.4% difference to the downside than the value it had when we last reported.

Daily Crypto Market Cap Chart

The cryptocurrency sector capitalization has decreased significantly since we last reported, with its current value being $632.90 billion. This represents a $36.72 billion decrease when compared to our previous report.

_______________________________________________________________________

What happened in the past 24 hours?

_______________________________________________________________________

_______________________________________________________________________

Technical analysis

_______________________________________________________________________

Bitcoin

Bitcoin experienced a 5% pullback after the news of a new strain of COVID-19 came out. Of course, Bitcoin was not the only one hit, as all traditional asset classes dipped in the past 24 hours as well. The downturn got stopped at the $22,054 level, and quickly sprung up to the current levels.

As mentioned in our previous daily crypto review, Bitcoin would experience an increase in volume as it exits consolidation below the recent highs, which happened today.

BTC/USD 4-hour chart

While Bitcoin’s daily technicals are tilted towards the bull side, its 4-hour overview is completely neutral. On the other hand, its weekly and monthly overviews are tilted towards the buy-side, but show hints of neutrality.

BTC/USD 1-day Technicals

Technical factors (4-hour Chart):
  • Price is above its 50-period EMA and below its 21-period EMA
  • Price between its bottom and middle Bollinger band
  • RSI is neutral (48.91)
  • Volume is slightly above average
Key levels to the upside          Key levels to the downside

1: $24,315                                 1: $22,054

2: $24,700                                 2: $21,350

3: $25,511                                  3: $19,918

Ethereum

Ethereum has followed Bitcoin to the downside, and lost just over 5% on the day. The second-largest cryptocurrency by market cap fell below the $632 level and attempted to break the $600-$602 support line. However, ETH bulls stopped the downturn, and the cryptocurrency is now consolidating right above this level.

Ethereum’s price movements are pretty tame so far, and traders should pay close attention to Bitcoin and its movement in the near future as Ether seems to follow it almost to the tee.

ETH/USD 4-hour Chart

Ethereum’s daily, weekly and monthly technicals show a strong bullish tilt, while its 4-hour overview is tilted towards the sell-side.

ETH/USD 1-day Technicals

Technical Factors (4-hour Chart):
  • Price is below both its 50-period and its 21-period EMA
  • Price is close to its bottom Bollinger band
  • RSI is heading towards being oversold (37.52)
  • Volume is on slightly above-average levels
Key levels to the upside          Key levels to the downside

1: $632                                     1: $600

2: $675                                     2: $581 

3: $738.5                                   3: $564

Ripple

XRP had a horrible 24 hour trading session as its price crashed on Ripple’s announcement that they will most likely get sued by the SEC. This news brought its price down almost 20%, with it currently trading right above the $0.457 level, which stopped XRP from going down further.

XRP traders should pay attention to further updates on the lawsuit news as well as to any volume increase the cryptocurrency experiences.

XRP/USD 4-hour Chart

XRP’s long-term technicals (weekly and monthly) show a slight tilt towards the buy-side, while its short-term technicals (4-hour and daily) are completely bearish.

XRP/USD 1-day Technicals

Technical factors (4-hour Chart):
  • Its price is currently far below both its 50-period EMA and its 21-period EMA
  • Price slightly below its bottom Bollinger band
  • RSI is in the oversold territory (25.83)
  • Volume has returned to average levels
Key levels to the upside          Key levels to the downside

1: $0.5                                      1: $0.475

2: $0.543                                   2: $457

3: $0.57                                    3: $45

Categories
Crypto Market Analysis

Daily Crypto Review, Dec 21 – Bitcoin Dangerously Close to Making a Sharp Move

The cryptocurrency sector is split between gainers and losers as Bitcoin consolidates right below its all-time high level. Bitcoin is currently trading for $23,825, representing an increase of 1.03% when compared to yesterday’s value. Meanwhile, Ethereum’s price has decreased by 1.42% on the day, while XRP managed to lose 3.20%.

 Daily Crypto Sector Heat Map

Axion gained 3402.38% in the past 24 hours, making it the most prominent daily crypto gainer by far. It is followed by MahaDAO’s 199.69% and Elxis’ 186.79% gain. On the other hand, Golden Ratio Per Liquidity lost 59.64%, making it the most prominent daily loser. It is followed by ALL BEST ICO’s loss of 50.84% and Quras’s loss of 49.42%.

Top 10 24-hour Performers (Click to enlarge)

Bottom 10 24-hour Performers (Click to enlarge)

Bitcoin’s market dominance has moved down almost half a percent since our last report, with its value currently being 65.1%. This value represents a 0.4% difference to the downside than the value it had when we last reported.

Daily Crypto Market Cap Chart

The cryptocurrency sector capitalization has increased since we last reported, with its current value being $669.26 billion. This represents an $18.25billion increase when compared to our previous report.

_______________________________________________________________________

What happened in the past 24 hours?

_______________________________________________________________________

_______________________________________________________________________

Technical analysis

_______________________________________________________________________

Bitcoin

Bitcoin has spent its weekend slowly rising towards the resistance level of its trading channel, which is bound by $22,055 to the downside and $24,315 to the upside. However, The two attempts to break the resistance level and enter the price discovery phase failed, leaving Bitcoin just below $24,315. With volume descending ever since Dec 17, we might expect this consolidation to end with a volume boom and a very sharp move.

While it is yet unknown whether this sharp move will be to the upside or downside, the increase in volume and a strong push towards one side will make it quite clear. Traders can use this momentum to catch a very safe trade.


BTC/USD 2-hour chart

While Bitcoin’s technicals are overall bullish, they either show signs of neutrality or even hints of bearishness. Its daily and monthly overviews have some indications of sellers being present, while its 4-hour and weekly overviews are bullish-neutral.

BTC/USD 1-day Technicals

Technical factors (4-hour Chart):
  • Price is far above both its 50-period and its 21-period EMA
  • Price slightly below its top Bollinger band
  • RSI is close to being overbought (65.90)
  • Volume is decreasing, and trading below the average level
Key levels to the upside          Key levels to the downside

1: $24,315                                 1: $22,054

2: $24,700                                 2: $21,350

3: $25,511                                  3: $19,918

Ethereum

Ethereum has, unlike Bitcoin, descended slowly within its trading range, which is bound by $675 to the upside and $632. The second-largest cryptocurrency by market cap had one strong push towards the downside, which brought its price all the way down to $620 on Dec 20. However, the bulls prevailed, and Ether is now trading above $632 safely.

Ethereum’s price movements seem pretty tame, meaning that its next move will be of larger magnitude. Traders should pay close attention to Bitcoin and its moves in the near future before trading any other cryptocurrency, including Ether.

ETH/USD 2-hour Chart

Ethereum’s technicals are very bullish on all time-frames, with only its weekly overview showing slight neutrality.

ETH/USD 1-day Technicals

Technical Factors (4-hour Chart):
  • Price is far above its 50-period and at its 21-period EMA
  • Price is slightly below its bottom Bollinger band
  • RSI is neutral (52.43)
  • Volume is on slightly above-average levels
Key levels to the upside          Key levels to the downside

1: $675                                     1: $632

2: $738.5                                  2: $600 

3: $817.5                                   3: $581

Ripple

With XRP’s strong push towards the upside ending on Dec 17, the fourth-largest cryptocurrency by market cap has entered another descending channel. The price was slowly dwindling down over the weekend, breaking the $0.57 support level, and then confirming its position below it. The price even went below the $0.543 support at one point, but quickly recovered.

XRP’s volume is currently almost non-existent, and traders should pay attention to any volume spikes if they intend on trading XRP.

XRP/USD 2-hour Chart

XRP’s technicals are quite mixed, but overall tilted slightly towards the buy-side. It’s 4-hour and daily overviews are bullish-neutral, while its weekly overview shows some hints of bearishness. Its monthly overview, however, is completely bullish.

XRP/USD 1-day Technicals

Technical factors (4-hour Chart):
  • Its price is currently between its 50-period EMA and its 21-period EMA
  • Price slightly above its bottom Bollinger band
  • RSI is neutral (48.77)
  • Volume has descended to average levels
Key levels to the upside          Key levels to the downside

1: $0.57                                    1: $0.543

2: $0.597                                   2: $0.5

3: $0.63                                    3: $0.475

Categories
Crypto Videos

It’s Not To Late To Buy Bitcoin – Follow The money!


Smartest People in the Room are Buying Bitcoin – Winklevoss Brothers Speak Up

Throughout 2020, over a handful of traditional financial giants have picked up stacks of Bitcoin, including the likes of billionaire investor Paul Tudor Jones and business intelligence company MicroStrategy. These investments are a part of a flow of big money that has recently entered BTC, Gemini crypto-exchange co-founders Tyler and Cameron Winklevoss recently stated.

“These are the most sophisticated investors, the smartest people in the room, buying up Bitcoin quietly, so it’s not a fear of missing out thing,” Tyler Winklevoss said in a CNBC interview, published on Dec 11. Major institutions are here now for this bull run, as opposed to Bitcoin’s retail-led bull run of 2017, Tyler explained.

Over the course of 2020, in addition to Tudor Jones and MicroStrategy, ack Dorsey’s Square, Stanley Druckenmiller, J MassMutual, and Guggenheim Partners have all invested substantial amounts of money in Bitcoin. Their crypto plays come as a response to the unstable global economic atmosphere.

Bitcoin is often compared to gold as a store of value as well as an inflation hedge. Both Druckenmiller and Tudor Jones align themselves with this narrative. Tyler Winklevoss added:

“You have publicly-traded companies such as Square and MicroStrategy putting their cash into Bitcoin because they’re worried about the oncoming inflation that would come with all the money printing and the COVID pandemic stimulus packages.”

When asked about Bitcoin’s volatility as an asset used for transactions, the brothers called Bitcoin with its current system a “buy and hold” strategy comparative to gold. “We see Bitcoin as an emergent store of value that will disrupt gold,” Tyler said. “So it actually doesn’t even have to be used as a currency, meaning that the volatility doesn’t matter if it’s actually a store of value.” The billionaire also expects dwindling volatility for the asset as time passes.

Categories
Crypto Market Analysis

BTC/USD Weekly Chart Analysis + Possible Outcomes

In this week’s BTC/USD analysis, we will be taking an in-depth look at the most recent technical formations, as well as look for the possible price outcomes in the following days.

Overview

The crypto sector was nothing short of explosive as Bitcoin pushed past its old all-time highs and reached almost as high as $24,000. The largest cryptocurrency by market cap went into skyrocket mode without facing much resistance until it hit a wall near $23,800. As it failed to break this level twice, it started a consolidation phase.

While Bitcoin’s sentiment is extremely bullish, many analysts call for a pullback and say that the most recent push to the upside is still much overextended. However, Bitcoin is consolidating sideways rather than pulling back. One thing is certain, Bitcoin is preparing for its next move.

Technical factors


Bitcoin is currently in consolidation mode after it hit a wall twice near the $23,800 price level. The price range is getting narrower and narrower as time passes, indicating a strong breakout move out of the current boundaries inevitable. On top of that, Bitcoin’s volume has been steadily declining after the final attempt above $23,777. When it comes to support, Bitcoin’s downside is protected by the 21-period moving average as well as the $22,320 Fib retracement line.

While a move to the downside should be considered healthy, the current price bouncing off of its support levels might be just good enough for BTC to push towards the upside once again.

Likely Outcomes

We can expect three main outcomes for Bitcoin, with the ones starting with an upswing being just slightly more plausible.

  1. Bitcoin’s price can easily shoot up past $23,777 and enter price discovery mode yet again. Not much to say about the target levels there, except that the possible resistance zones might be Fib extensions from the current Fib retracement levels.
  2. Bitcoin’s price is most likely to push towards the upside, hit the all-time high level, and fail to break it, therefore prompting a pullback. In this case, the price will most likely fall below $22,320 and head straight for the $21,420 or even lower (some analysts are calling for a drop below $20,000 and a CME Futures gap fill).
  3. Bitcoin’s price might head straight down and break the $22,320 level, in which case the market will steadily test every single support level that has worked until now.

In any case, a significant increase in volume will be required, and traders should certainly pay attention to it.

Categories
Crypto Market Analysis

Daily Crypto Review, Dec 18 – Bitcoin at $23,000; Crypto Sector Preparing for the Next Move

The majority of the cryptocurrencies ended up in the green as the cryptocurrency sector tried to consolidate after Bitcoin’s price discovery in the all-time high territory. Bitcoin is currently trading for $22.912, representing an increase of 3.96% compared to yesterday’s value. Meanwhile, Ethereum’s price has increased by 0.16% on the day, while XRP managed to gain 3.79%.

 Daily Crypto Sector Heat Map

MobileGo gained 94.96% in the past 24 hours, making it the most prominent daily crypto gainer by far. It is followed by Puriever’s 85.99% and Tokes’ 85.09% gain. On the other hand, Basis Share lost 49.6%, making it the most prominent daily loser. It is followed by 3x Short Litecoin Token’s loss of 46.73% and Force For Fast’s loss of 42.92%.

Top 10 24-hour Performers (Click to enlarge)

Bottom 10 24-hour Performers (Click to enlarge)

Bitcoin’s market dominance has moved up half a percent since our last report, with its value currently being 65.5%. This value represents a 0.5% difference to the upside than the value it had when we last reported.

Daily Crypto Market Cap Chart

The cryptocurrency sector capitalization has increased since we last reported, with its current value being $651.01 billion. This represents a $17.07 billion increase when compared to our previous report.

_______________________________________________________________________

What happened in the past 24 hours?

_______________________________________________________________________

_______________________________________________________________________

Technical analysis

_______________________________________________________________________

Bitcoin

Bitcoin has stopped its price discovery phase as it bounced off the $24,000 level and began consolidating. The largest cryptocurrency by market cap is currently fighting for the $23,000 level, a minor pivot point within a larger range bound by $24,000 to the upside and $22,050 to the downside.

At the moment, the Fib extension sitting at $22,055 is the most likely strong support level, while Bitcoin’s upside is open to new highs if the cryptocurrency passes $24,000, $23,315, and $24,500.

BTC/USD 2-hour chart

Bitcoin’s 4-hour and weekly overview are fully bullish, while its daily and monthly time-frames show slight neutrality on top of the overall bullishness.

BTC/USD 1-day Technicals

Technical factors (4-hour Chart):
  • Price is far above both its 50-period and its 21-period EMA
  • Price slightly below its top Bollinger band
  • RSI is heavily overbought (80.71)
  • Volume is far higher than its average levels
Key levels to the upside          Key levels to the downside

1: $24,315                                 1: $22,054

2: $24,700                                 2: $21,350

3: $25,511                                  3: $19,918

Ethereum

Ethereum has, just like Bitcoin, hit a wall in its price ascension, triggering a pullback from the highs of $675. The second-largest cryptocurrency by market cap quickly fell to its immediate support level, which sits at $632. This level held up nicely, and Ethereum is now on a slow rise after confirming the support level.

An important thing to note is that Ethereum is very far from reaching its all-time high. It might be a good value investment simply because of its potential to increase its price faster than Bitcoin.

ETH/USD 2-hour Chart

Ethereum’s 4-hour and monthly overview are fully bullish, while its daily and weekly time-frames show slight neutrality on top of the overall bullishness.

ETH/USD 1-day Technicals

Technical Factors (4-hour Chart):
  • Price is far above both its 50-period and its 21-period EMAs
  • Price is between its middle and top Bollinger band
  • RSI has barely left the overbought territory (67.29)
  • Volume is much higher than its weekly average but is descending
Key levels to the upside          Key levels to the downside

1: $675                                     1: $632

2: $738.5                                  2: $600 

3: $817.5                                   3: $581

Ripple

XRP was the cryptocurrency that experienced the largest gains out of the three cryptocurrencies we cover daily. The fourth-largest cryptocurrency by market cap couldn’t break a high of $0.597 with conviction (though the price briefly went as high as $0.656), which triggered a correction to its $0.57 support level. After confirming this level as strong support, XRP continued its path towards the upside and slowly started increasing in price. It is currently contesting the $0.597 level once again.


XRP/USD 2-hour Chart

XRP’s 4-hour and monthly overview are fully bullish, while its daily and weekly time-frames show slight neutrality on top of the overall bullishness.

XRP/USD 1-day Technicals

Technical factors (4-hour Chart):
  • Its price is currently above both its 50-period EMA and its 21-period EMA
  • Price slightly below its top Bollinger band
  • RSI is nearing the overbought territory (63.71)
  • Volume is well above its average level, thought descending
Key levels to the upside          Key levels to the downside

1: $0.597                                    1: $0.57

2: $0.63                                    2: $0.543

3: $0.66                                     3: $0.5

Categories
Crypto Market Analysis

Daily Crypto Review, Dec 17 – BTC Reaches a New ATH at $22k; XRP Skyrockets as it Breaks its Descending Channel

The cryptocurrency sector experienced an overall major gain as Bitcoin reached its new all-time high. Bitcoin is currently trading for $22.095, representing an increase of 13.82% compared to yesterday’s value. Meanwhile, Ethereum’s price has increased by 9.69% on the day, while XRP managed to gain a whopping 23.35%.

 Daily Crypto Sector Heat Map

Puriever gained 238.59% in the past 24 hours, making it the most prominent daily crypto gainer by far. It is followed by Combine.finance’s 159.58% and Amun Bitcoin 3x Daily Shorts’ 146.94% gain. On the other hand, BigGame lost 82.62%, making it the most prominent daily loser. It is followed by GNY’s loss of 75,95% and Hush’s loss of 61.30%.

Top 10 24-hour Performers (Click to enlarge)

Bottom 10 24-hour Performers (Click to enlarge)

Bitcoin’s market dominance has moved up over a whole percent since our last report, with its value currently being 65%. This value represents a 1.1% difference to the upside than the value it had when we last reported.

Daily Crypto Market Cap Chart

The cryptocurrency sector capitalization has increased drastically since we last reported, with its current value being $634.94 billion. This represents a whopping $70.94 billion increase when compared to our previous report.

_______________________________________________________________________

What happened in the past 24 hours?

_______________________________________________________________________

_______________________________________________________________________

Technical analysis

_______________________________________________________________________

Bitcoin

Bitcoin has had quite an amazing day, as its price skyrocketed to new all-time highs. The largest cryptocurrency by market cap reached price discovery mode as its price topped at $22,400. While there are no set resistance levels at the moment, we can use Fib retracement extensions to determine where they could form.

At the moment, the Fib extensions sitting at $21,350 and $22,055 are the best contenders to act as support levels to Bitcoin’s eventual downturn.


BTC/USD 4-hour chart

Bitcoin’s daily and weekly overview are fully bullish, while its 4-hour and monthly time-frames show slight neutrality on top of the overall bullishness.

BTC/USD 1-day Technicals

Technical factors (4-hour Chart):
  • Price is far above both its 50-period and its 21-period EMA
  • Price slightly above its top Bollinger band
  • RSI is heavily overbought (86.76)
  • Volume is far higher than its average levels
Key levels to the upside          Key levels to the downside

1: $24,315                                 1: $22,054

2: $24,700                                 2: $21,350

3: $25,511                                  3: $19,918

Ethereum

Ethereum followed the extremely bullish sentiment caused by Bitcoin’s push, reaching a price of $625 before hitting a sell wall. The second-largest cryptocurrency by market cap has held these levels, and is currently consolidating above the $632 level.

An important thing to note is that, while Bitcoin has reached its ATH, Ethereum is very far from it. Ethereum might be a good value investment simply due to its potential to possibly reach towards higher levels on account of pushing towards its ATH.

ETH/USD 4-hour Chart

While Ethereum shows overall bullish sentiment on all time-frames, every time-frame except the monthly time-frame shows slight neutrality.

ETH/USD 1-day Technicals

Technical Factors (4-hour Chart):
  • Price is far above both its 50-period and its 21-period EMAs
  • Price is at its top Bollinger band
  • RSI is heavily overbought (78.20)
  • Volume is much higher than its weekly average
Key levels to the upside          Key levels to the downside

1: $675                                     1: $636.5

2: $738.5                                  2: $632 

3: $817.5                                   3: $600

Ripple

Unlike most days where XRP is having larger moves to the downside and smaller moves to the upside compared to BTC and ETH, the roles are reversed this time. The fourth-largest cryptocurrency by market cap has gained almost 25% on the day as its price bounced off of the lower line of the descending channel, and pushed towards the upside, reaching as high as $0.583 before starting its consolidation.

XRP is now trading within a range, bound by the $0.57 resistance and $0.543 support levels.


XRP/USD 4-hour Chart

XRP has changed its sentiment to overall bullishness, with its monthly time-frame showing full tilt towards the buy-side, and the rest of the time-frames showing some neutrality or hints of bearishness remaining.

XRP/USD 1-day Technicals

Technical factors (4-hour Chart):
  • Its price is currently above both its 50-period EMA and its 21-period EMA
  • Price slightly below its top Bollinger band
  • RSI is nearing the overbought territory (61.30)
  • Volume is well above its average level
Key levels to the upside          Key levels to the downside

1: $0.57                                     1: $0.543

2: $0.597                                    2: $0.5

3: $0.63                                     3: $0.475

Categories
Cryptocurrencies

Ready to Trade Cryptocurrencies? Read This First…

In 2013 I started investing in cryptocurrencies, to be more exact on Bitcoin. It all started when one of the people I followed on Twitter posted an image of a USB with the logo of a Bitcoin. On Twitter, he commented that he had started mining his first Bitcoins. The subject in question caught my attention as on the one hand I had not the remotest idea that it was a Bitcoin, and on the other hand, the word «mine» created confusion when trying to relate it to a device with a USB connection.

I made some searches and discovered that Bitcoin was a cryptocurrency or digital currency, open-source, decentralized, whose creator was unknown and that from its origin in 2009 had gone from worth cents to about $280, only to collapse later. I found the story very interesting so I kept looking for information on the web and especially on the Bitcointalk forum which was one of the few sites where you could find valuable things. At the end of that same summer, I bought my first Bitcoins so that I could better understand firsthand everything I was learning.

That was briefly my beginning in the world of cryptocurrencies. Since then everything has evolved a lot and I have had the opportunity to go through several bullish and bass cycles in which I have made countless successes and mistakes. In this post, I will comment on which are in my opinion the most important things if you want to start investing in cryptocurrencies.

Learn Before Investing

If you want to be successful by investing or trading you need to be trained and prepared for it. If we talk about cryptocurrencies we must add some additional difficulties compared to other traditional financial assets. First, it requires a learning process to understand its technology and peculiarities as well as having great volatility and less liquidity than other types of investment. Therefore, investing without any preparation can lead us to lose all our money so as a starting point I would recommend:

Acquire general knowledge about blockchain and cryptocurrencies: their basic operation, as a transaction occurs, where cryptocurrencies are stored and in general understand the entire ecosystem related to the blockchain.

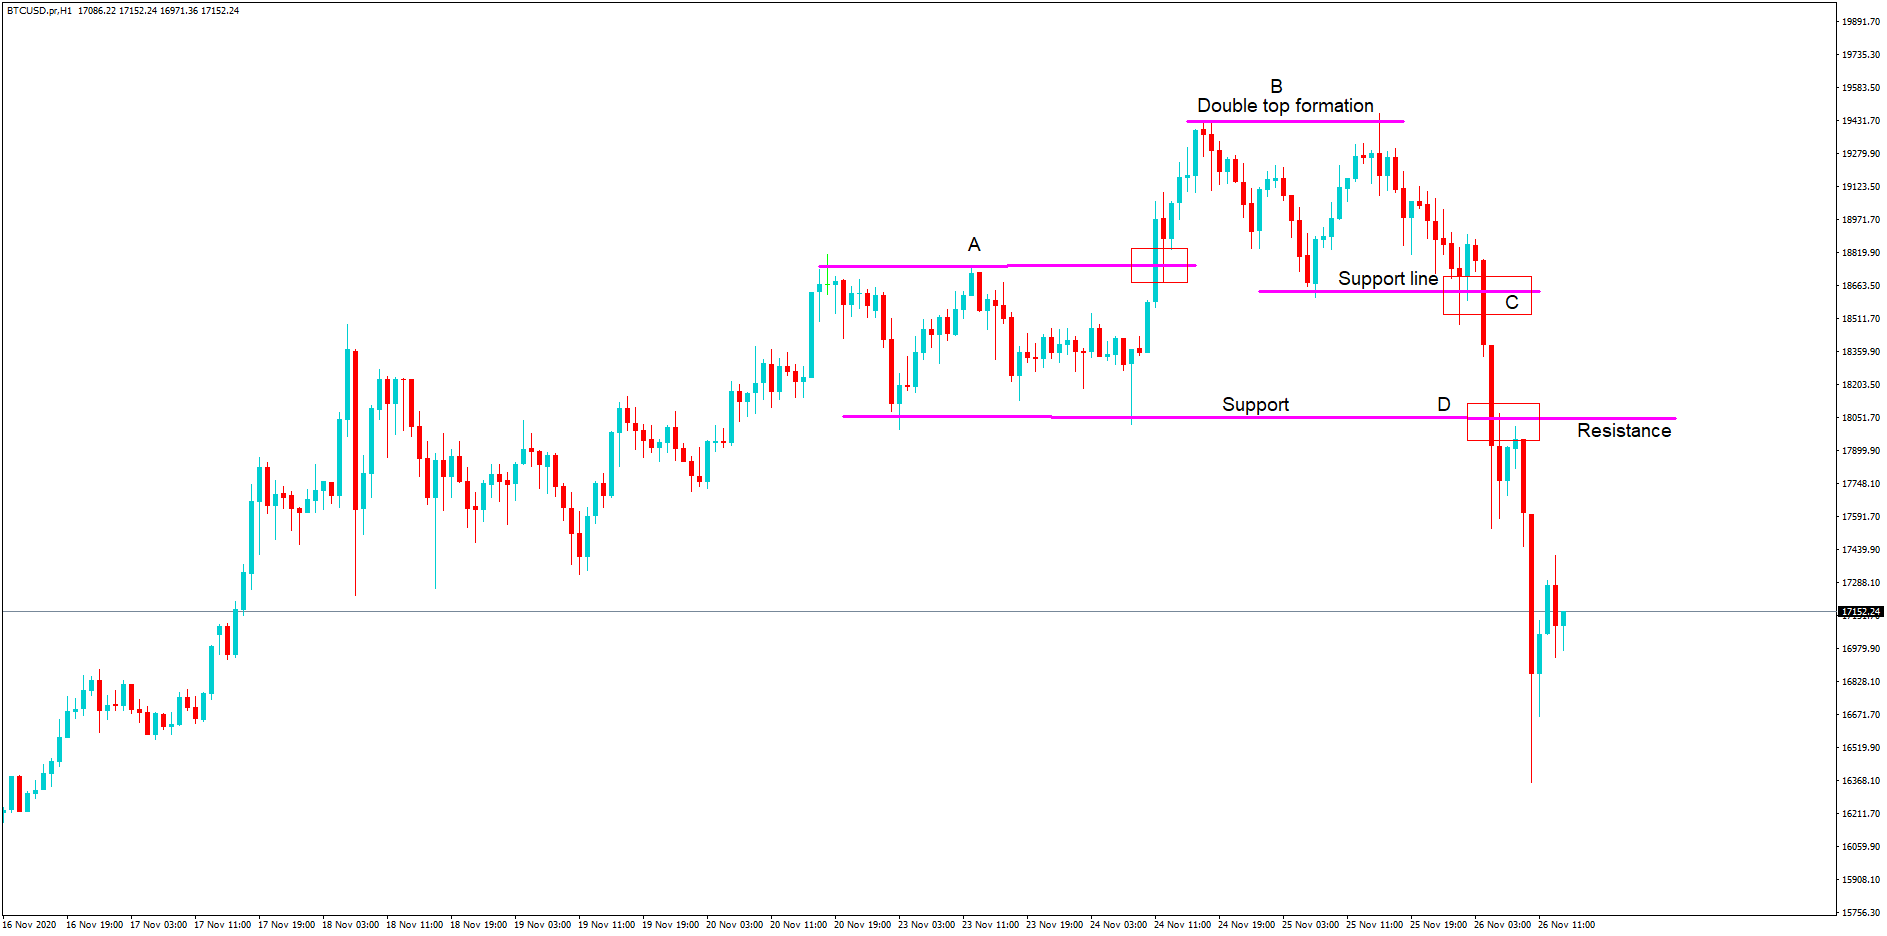
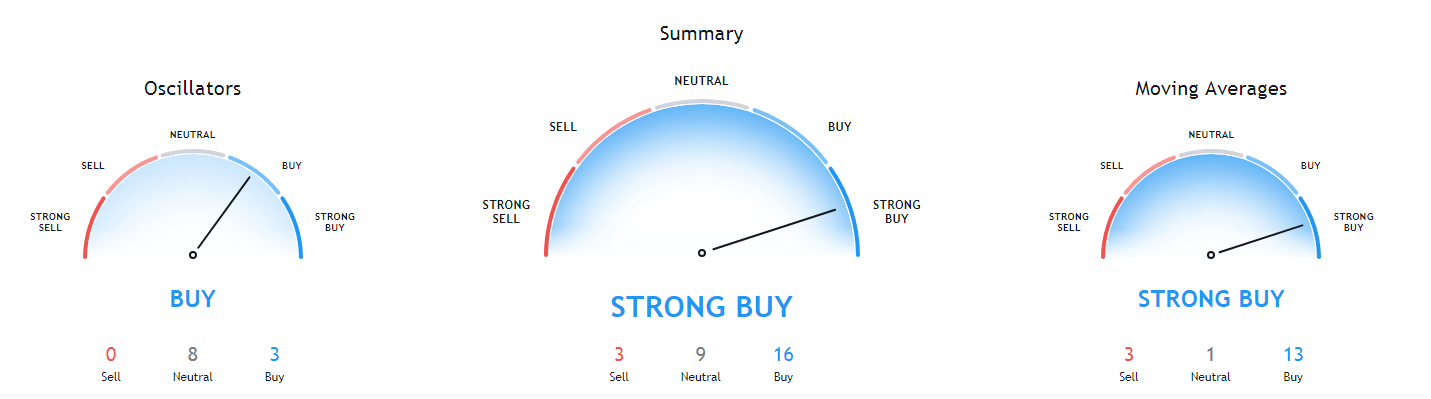
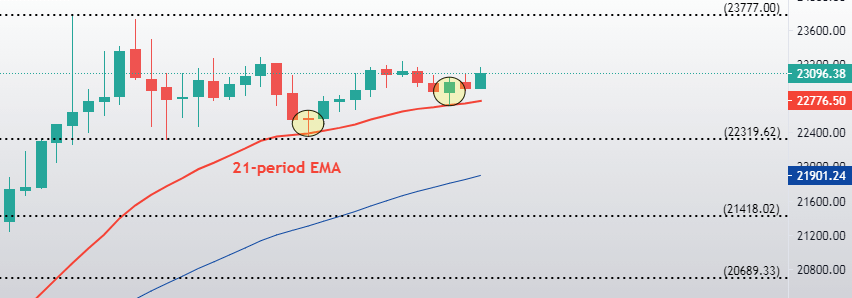
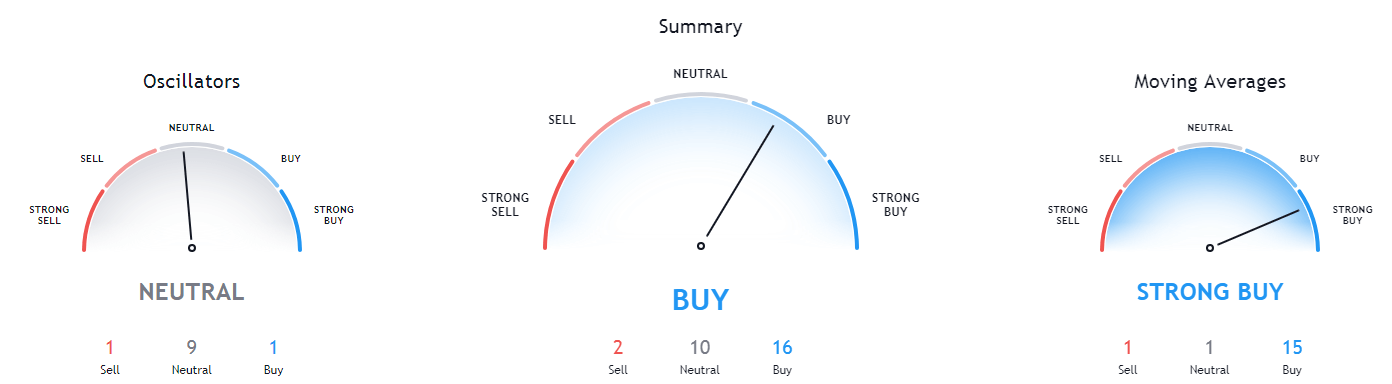
Technical Analysis: it will allow you to analyze a chart, know in which phase of the market we are, and look for points of entry as precise as possible.

Fundamental Analysis: when we want to invest in a listed company we analyze its strengths, weaknesses, business model, certain ratios, etc. To invest in cryptocurrencies we have to do something similar so we have to familiarize ourselves with certain ratios, metrics, and factors to analyze in any project in which we are interested.

Be informed about the latest news, both those directly related to cryptocurrencies and others at the macro level that can also influence the price.

Focus on Long-Term Investment

A mistake I made for quite some time was to be too attentive to the short term and not to have a broader view of the market. With few exceptions, I think we should forget about short-term trading or intraday trading and it is better to focus on the medium and long term. The idea is to try to make profits in the big phases of climbs and to get away in periods of great noise and uncertainty. We must try to follow much of the trend when a new upward cycle begins.

In addition, focusing on longer timeframes reduces emotional and irrational reactions to the short term that most people are victims of when investing in any market. To sum up the ideas a bit, it is not necessary to open operations with cryptocurrencies every day or week, as it would almost certainly lead to losses. You will probably make 80-90% of your earnings during bullish cycles so for the rest of the time a good idea is to focus on preserving capital.

Worry About Safety

Most of you may have heard stories about stolen bitcoins, hacked exchanges, lost private keys, … etc. When all there is money on the table is important to take all possible security measures. It is often claimed that we are our own bank when we use Bitcoin and cryptocurrencies, this tells us that we are the only ones responsible for protecting our capital.

Some of the things you can do to keep your investments safe are:

Activate the dual authentication factor: Enabling 2FA (dual authentication factor) is the first thing to do immediately after opening an account in an online exchange or purse where your cryptocurrencies are. All exchanges have this option and this way you make sure that if your login and passwords are compromised, theoretically no person has the possibility to enter your account unless they also enter the 6-digit code that only you have the power to access on your phone. Also, enable it in your email accounts.

If possible, avoid 2FA via SMS and use a single-use password application such as Google Authenticator that supports a multitude of exchanges and applications such as Gmail, Dropbox, Coinbase, Bitstamp, Binance, etc.

Protect your passwords: Use long, as secure as possible and different passwords on each of the pages or apps you sign up for. As it can be a bit cumbersome every time you want to access them, use a password manager. These programs allow you to store a lot of passwords in an encrypted database, so you only have to memorize one key to access all the others. Some recommended password managers are LastPass or KeePass.

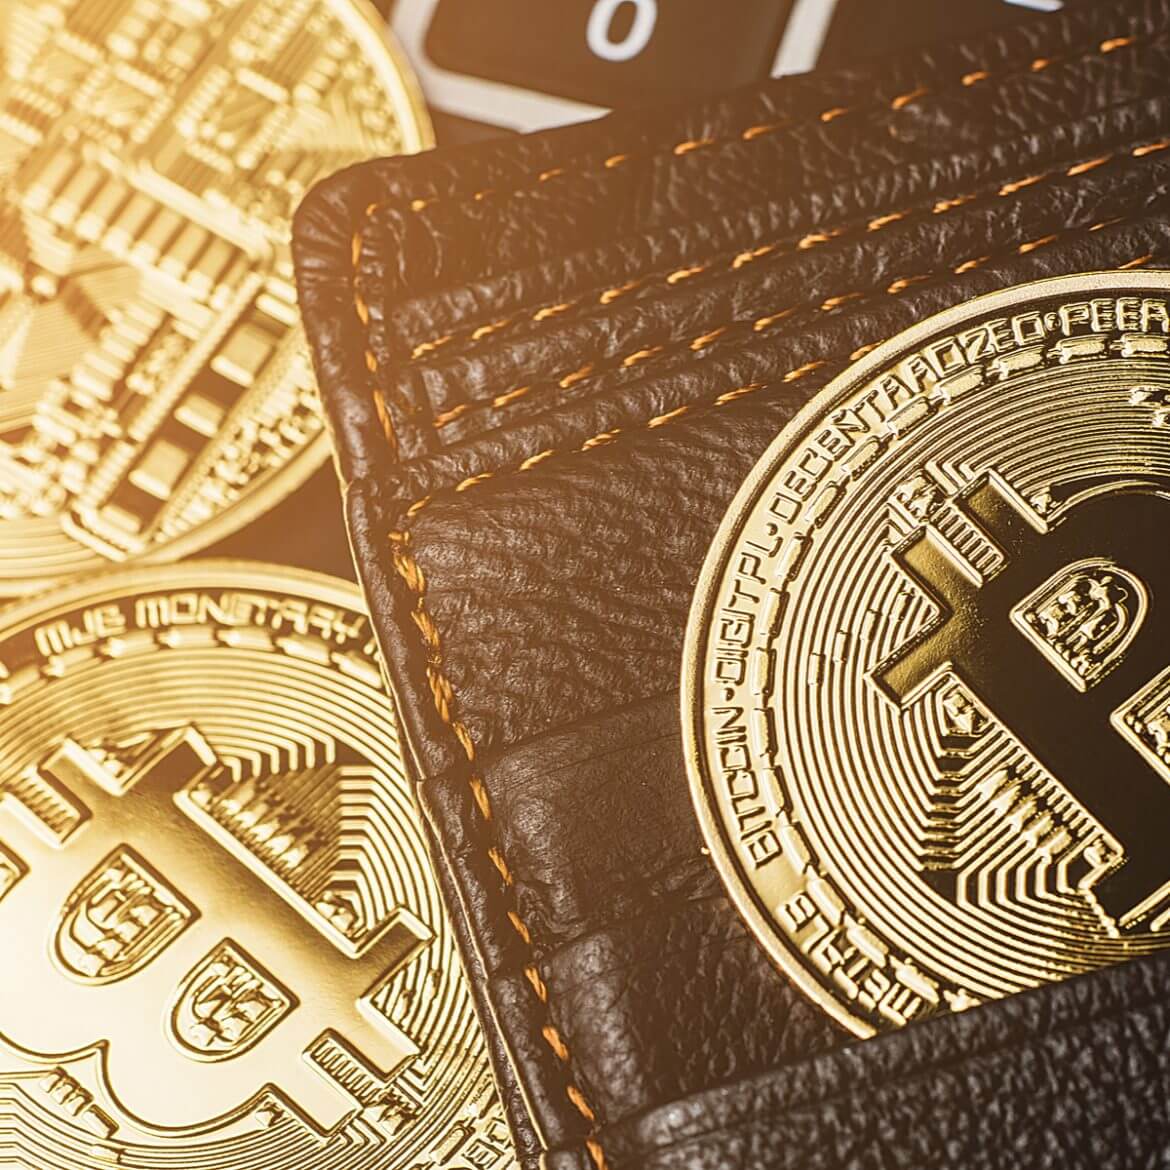
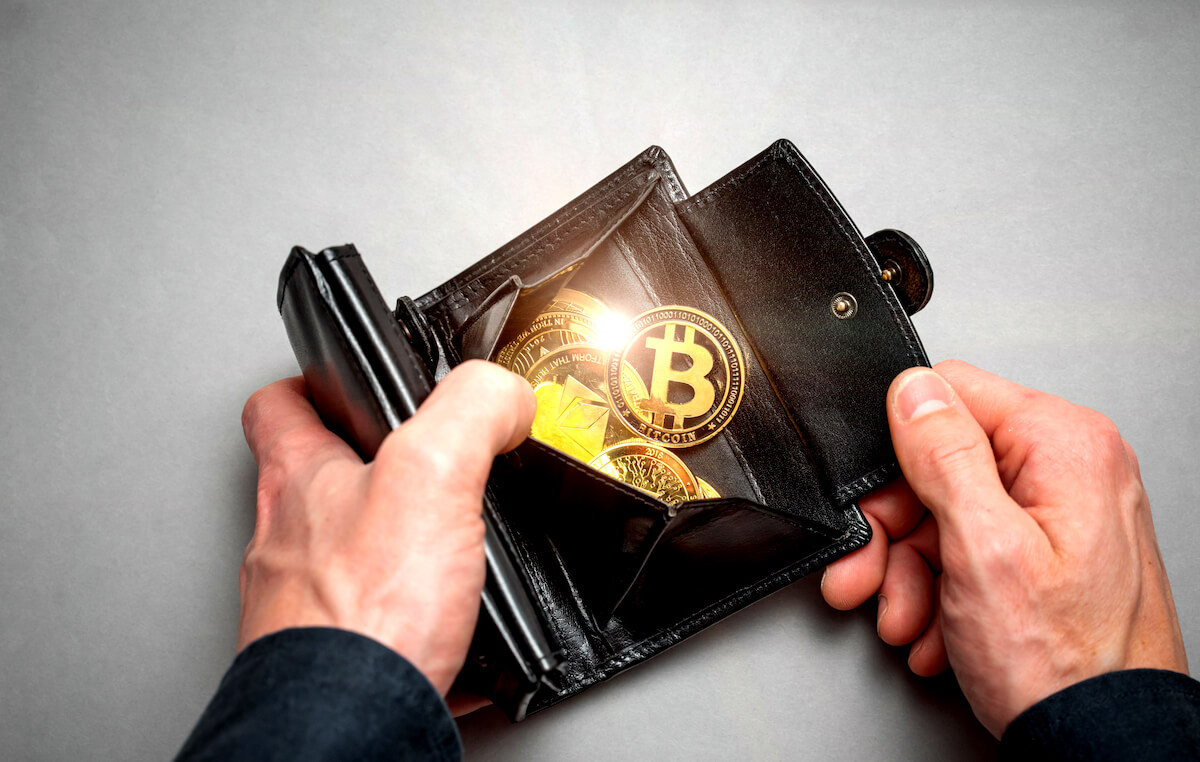
Use purses or wallets for cryptocurrencies: This point and the previous one are related but are of such importance that I prefer to dedicate a single paragraph to it. A wallet (also called a wallet) is the place where we keep our cryptocurrencies and allow us to send and receive them. Although blockchain technology is very secure, exchanges or exchange houses are a very weak link within the ecosystem and the number of hacks that have occurred since the birth of Bitcoin has been countless.

Among some of the most important, we can highlight the hack of the exchange platform MT.Gox in February 2014 in which a total of approximately 744,408 BTC were stolen or the Cryptopia exchange hack in January 2019 in which approximately $16 million was stolen.

For all the above, avoid keeping your cryptocurrencies in exchanges and keep them as safe as possible using purses to keep your investments safe.

Don’t Invest Money You’re Not Willing to Lose

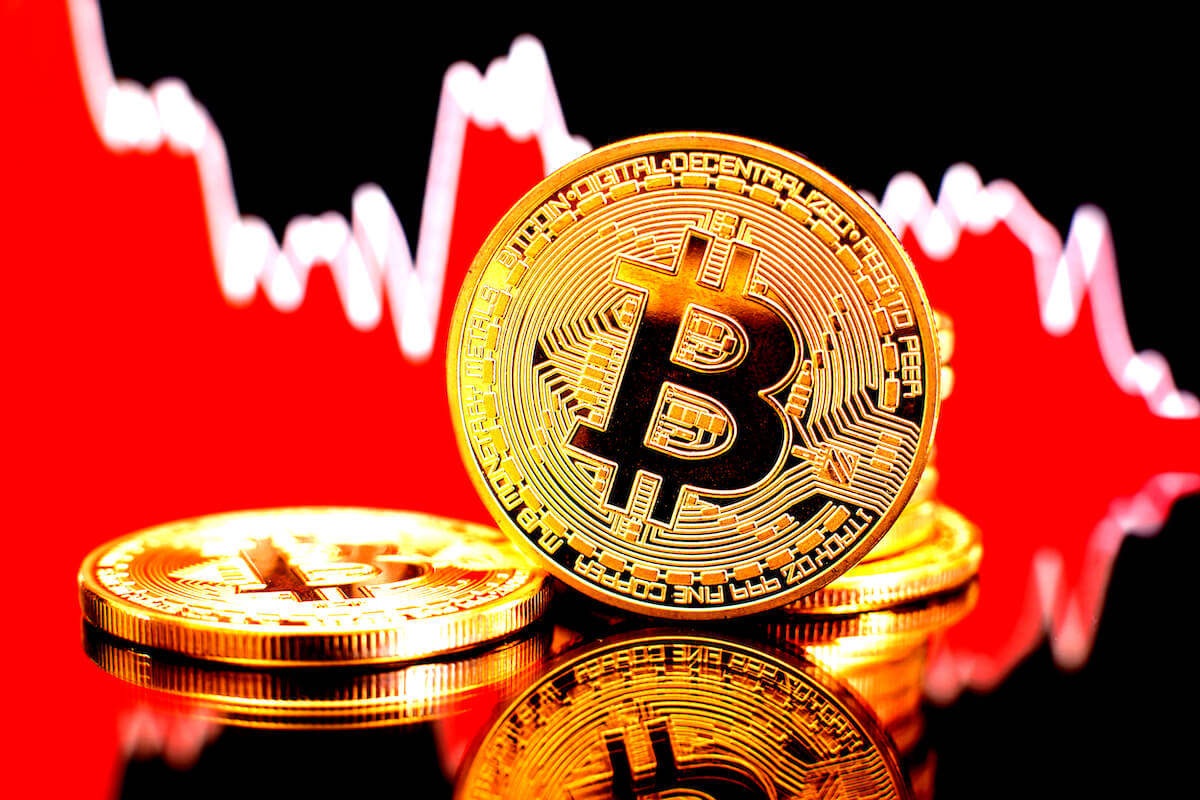
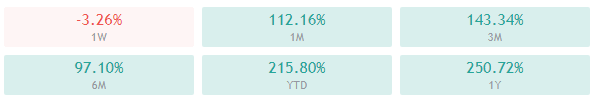
It’s a super-repeated phrase in the investment world, but it’s still a common mistake. During the last bearish cycle, Bitcoin lost approximately 84% of its value. Many other cryptocurrencies suffered much greater losses, not counting those that have disappeared along the way losing many people all the money invested.

Even if you have an investment plan, adequate risk management and you are able to manage your positions correctly, there are still other risks inherent to the investment in cryptocurrencies, such as those discussed in previous sections related to security, make you lose all your capital.

Therefore, as a starting point when investing in Bitcoin, Ethereum, Ripple, Litecoin or any other crypto is that you’re only willing to invest the capital you are willing to lose. It must be money you don’t need in your day to day so that if you lose it doesn’t affect your life.

Develop a Critical Vision

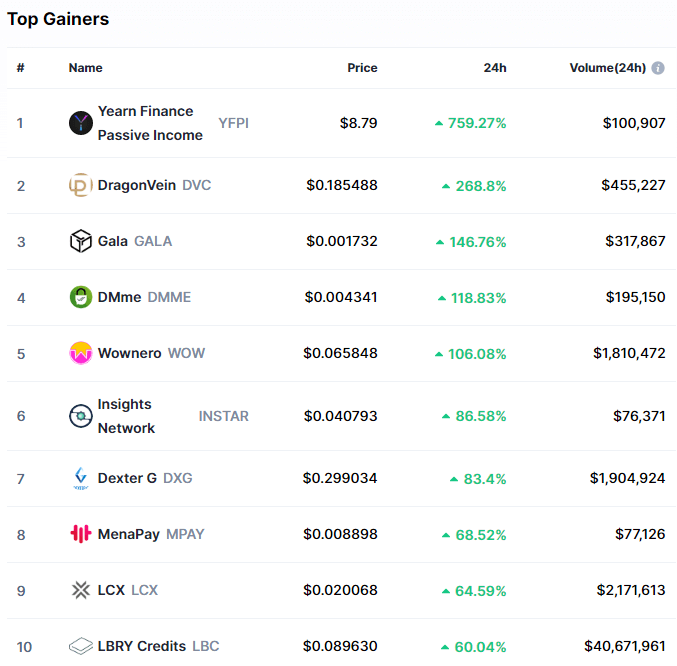
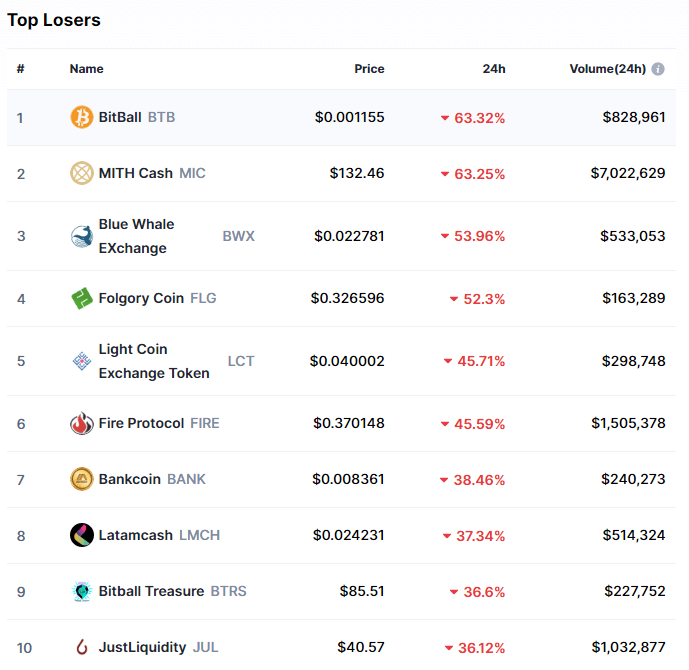
One of the most widely used abbreviations in the crypto world is DYOR, which comes from the English «Do your own research» which means that you must do your own research before investing in a project. On the date I write this article, there are more than 2,000 cryptocurrencies and tokens on the market. Some are projects with great growth potential while others are destined to disappear or are simply scams. You may also find several hundred opinions on projects or predictions about the price of Bitcoin in the future on social networks.

For all the above my recommendations are:

-Be skeptical of information you may find in media such as blogs, RRSSs, or newspapers.

-Don’t invest your money based on other people’s opinions.

-Make your own analyses that support your investment decisions. So you will be solely responsible for your successes and mistakes and will be a good starting point to improve your strategies and make better decisions in the future.

-To analyze in depth a token or cryptocurrency and form your own opinion, some of the sources you can use are:

-Web page for project information, development roadmap, work team, etc.

-Read his whitepaper.

-Telegram groups/Discord.

-Social media, blog, and other communication channels

-Perform Google searches where you will find analysis and reviews.

All this information, together with the knowledge you acquire through learning, will lead you to ideas and thoughts of your own.
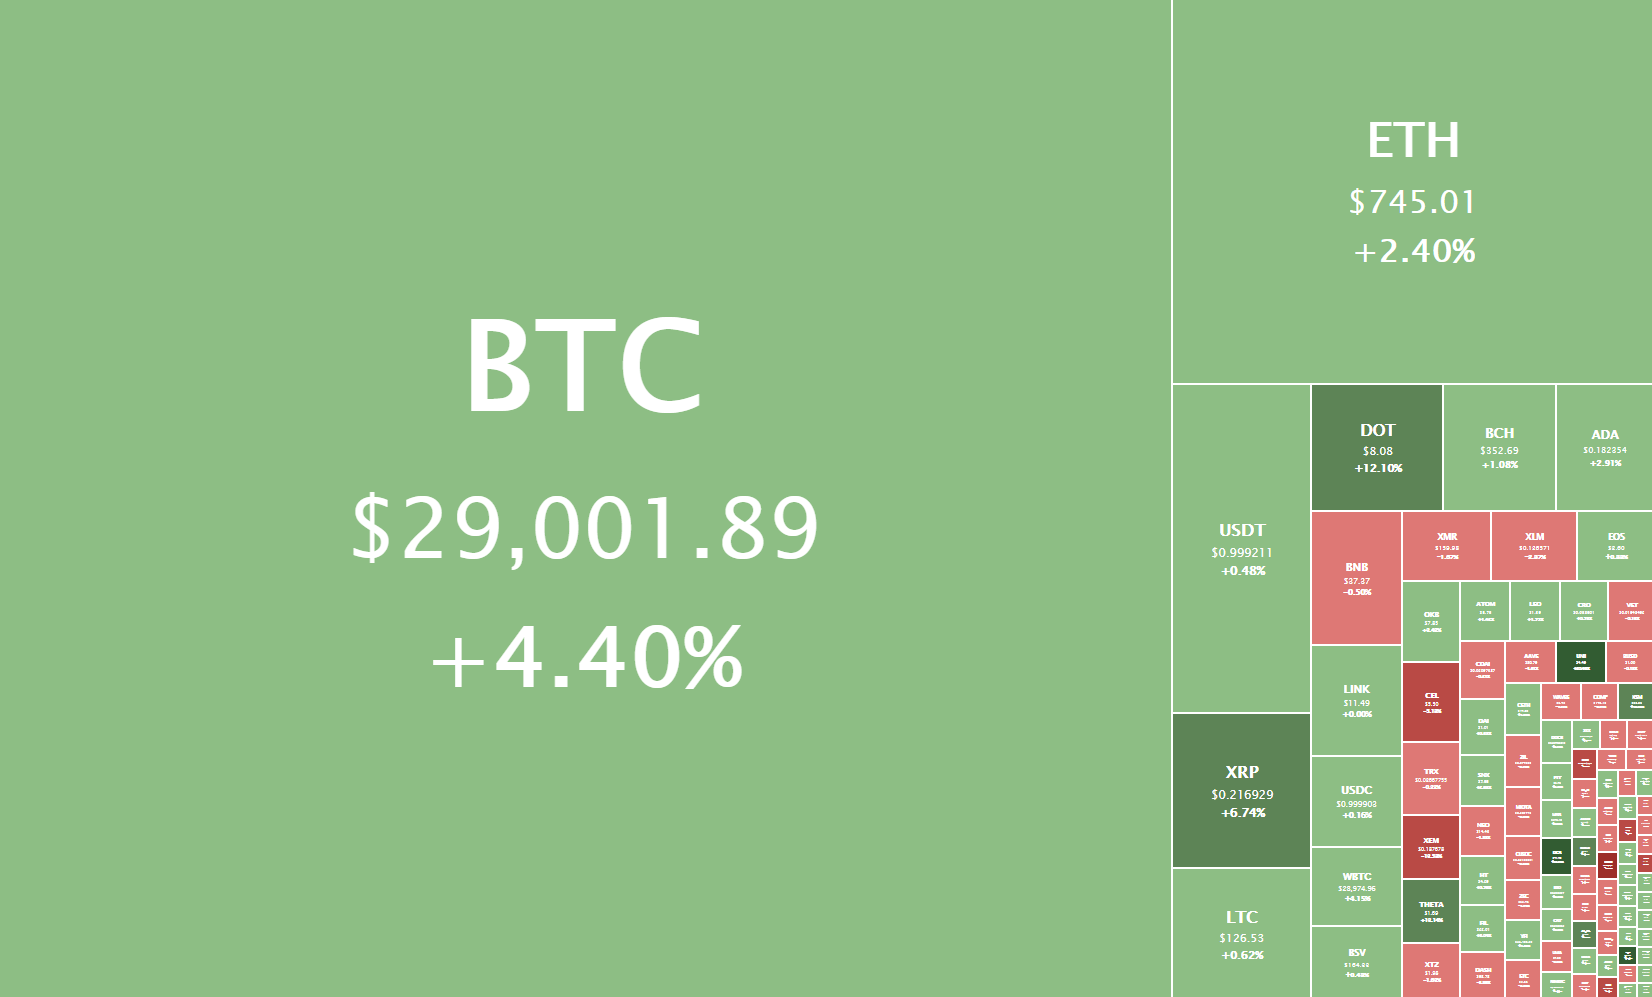
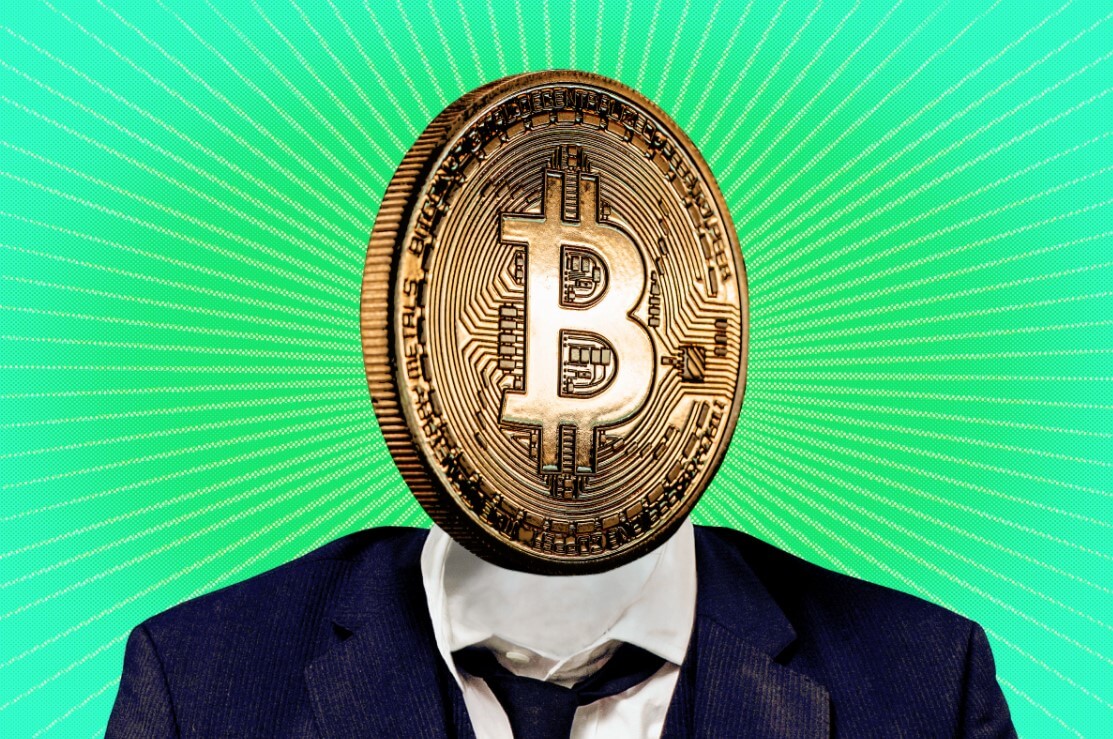
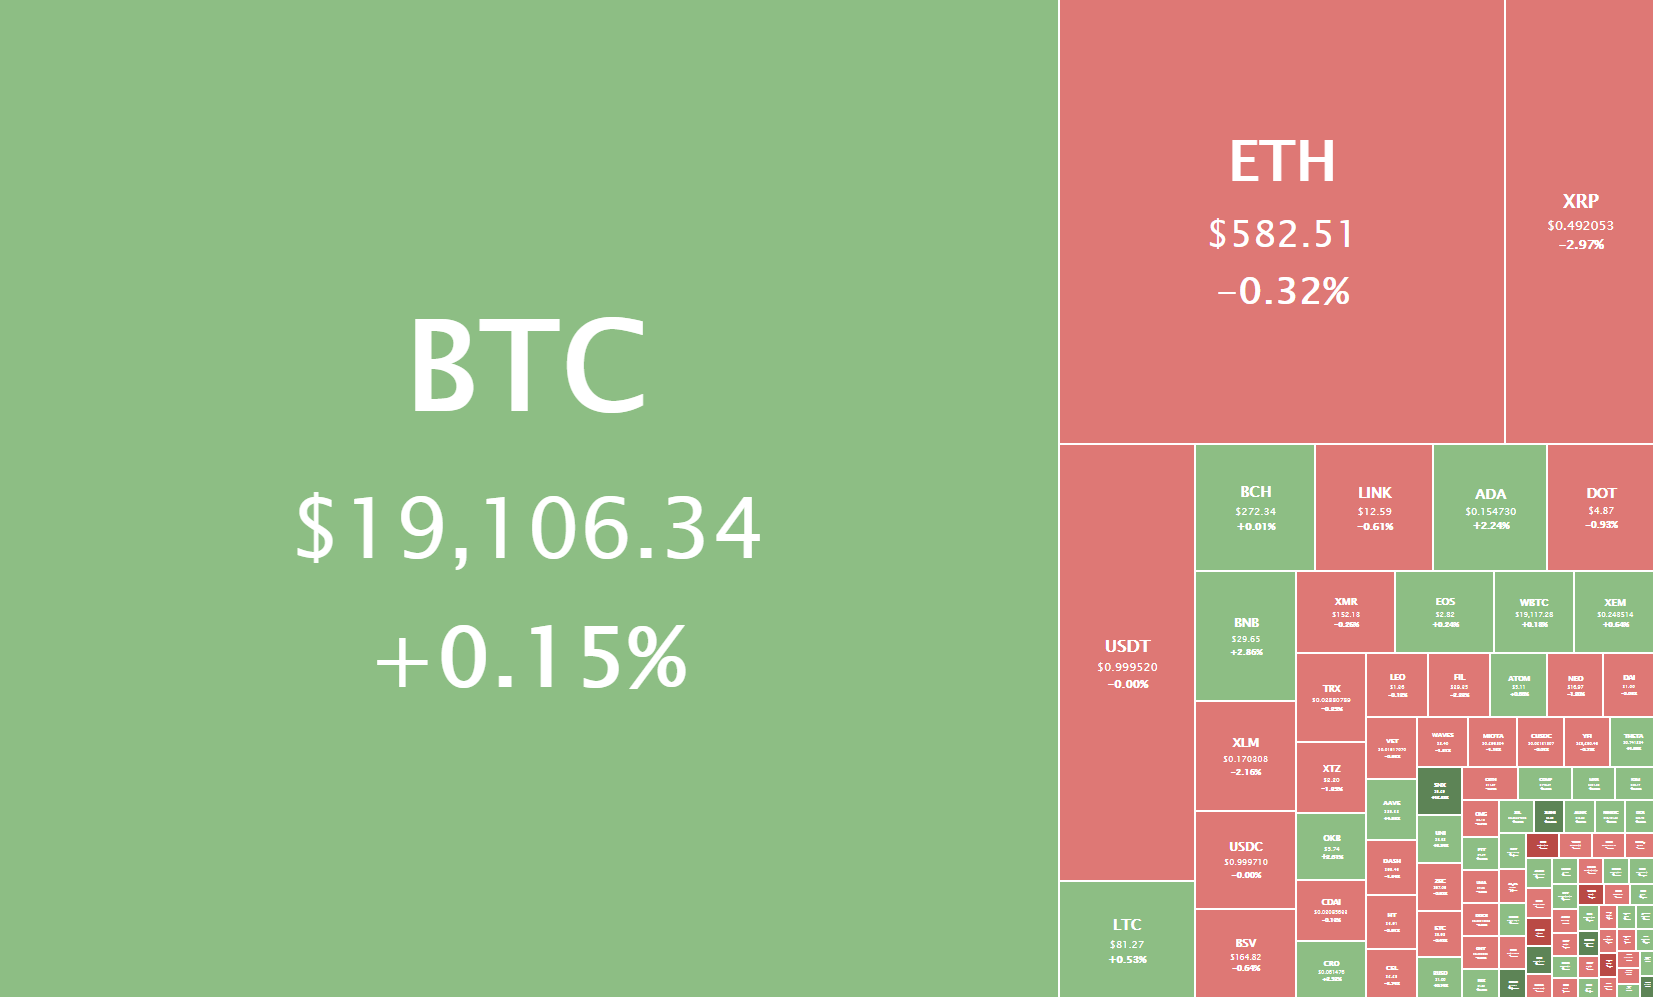
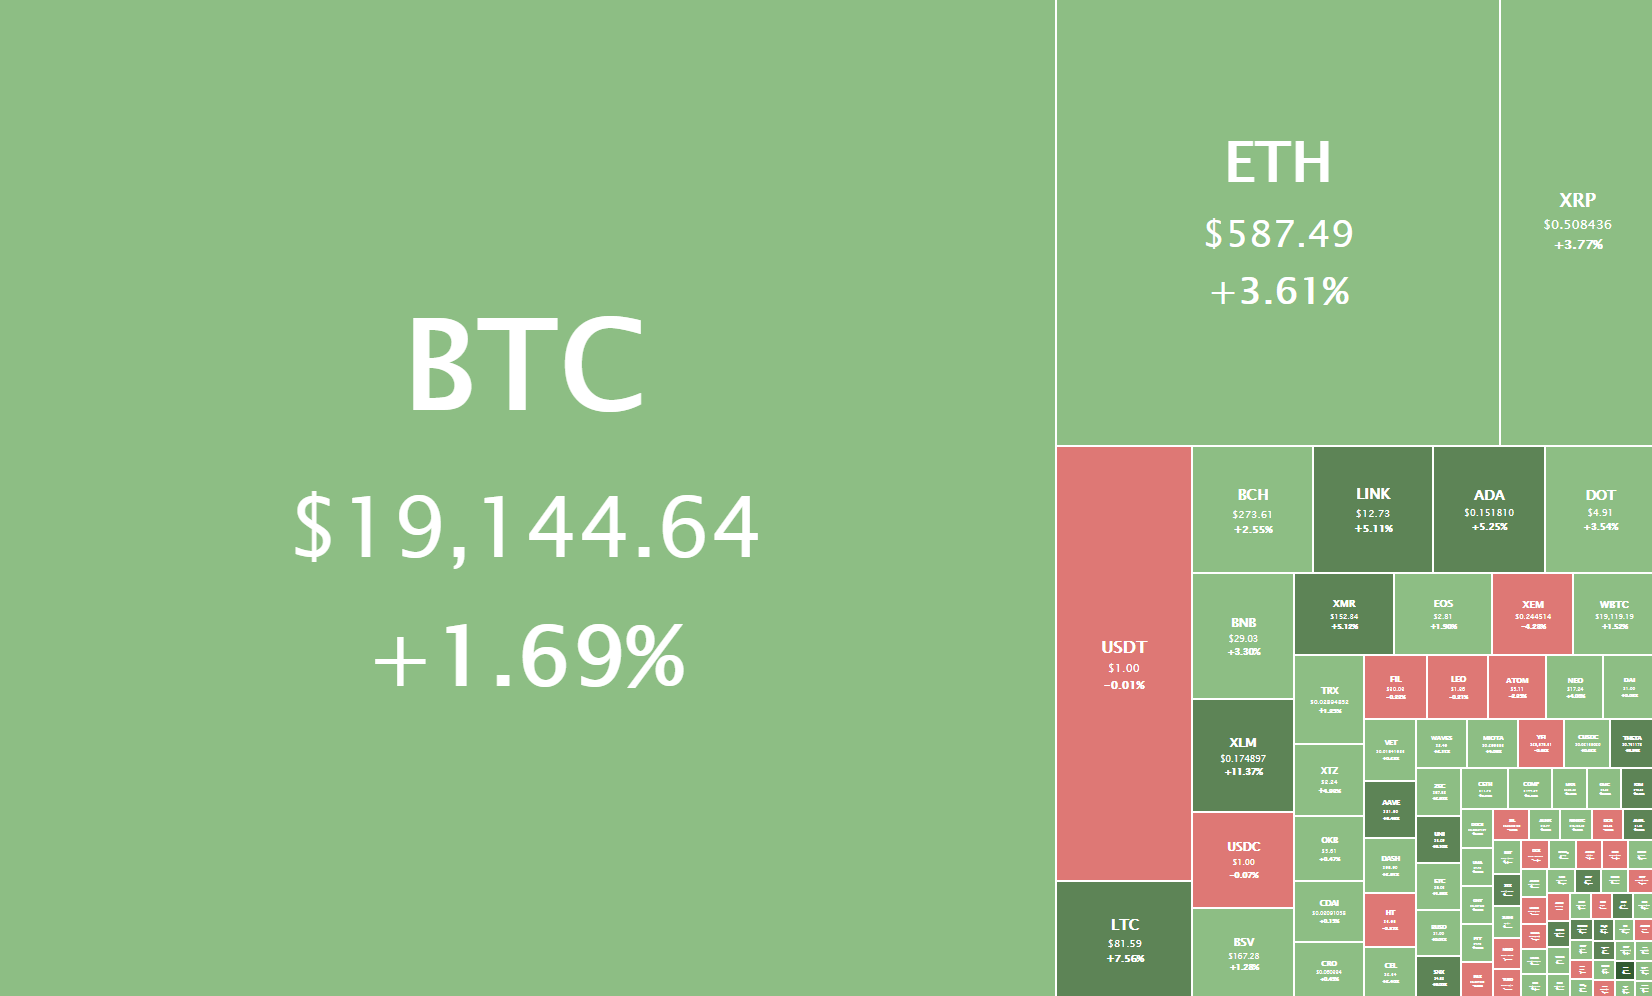
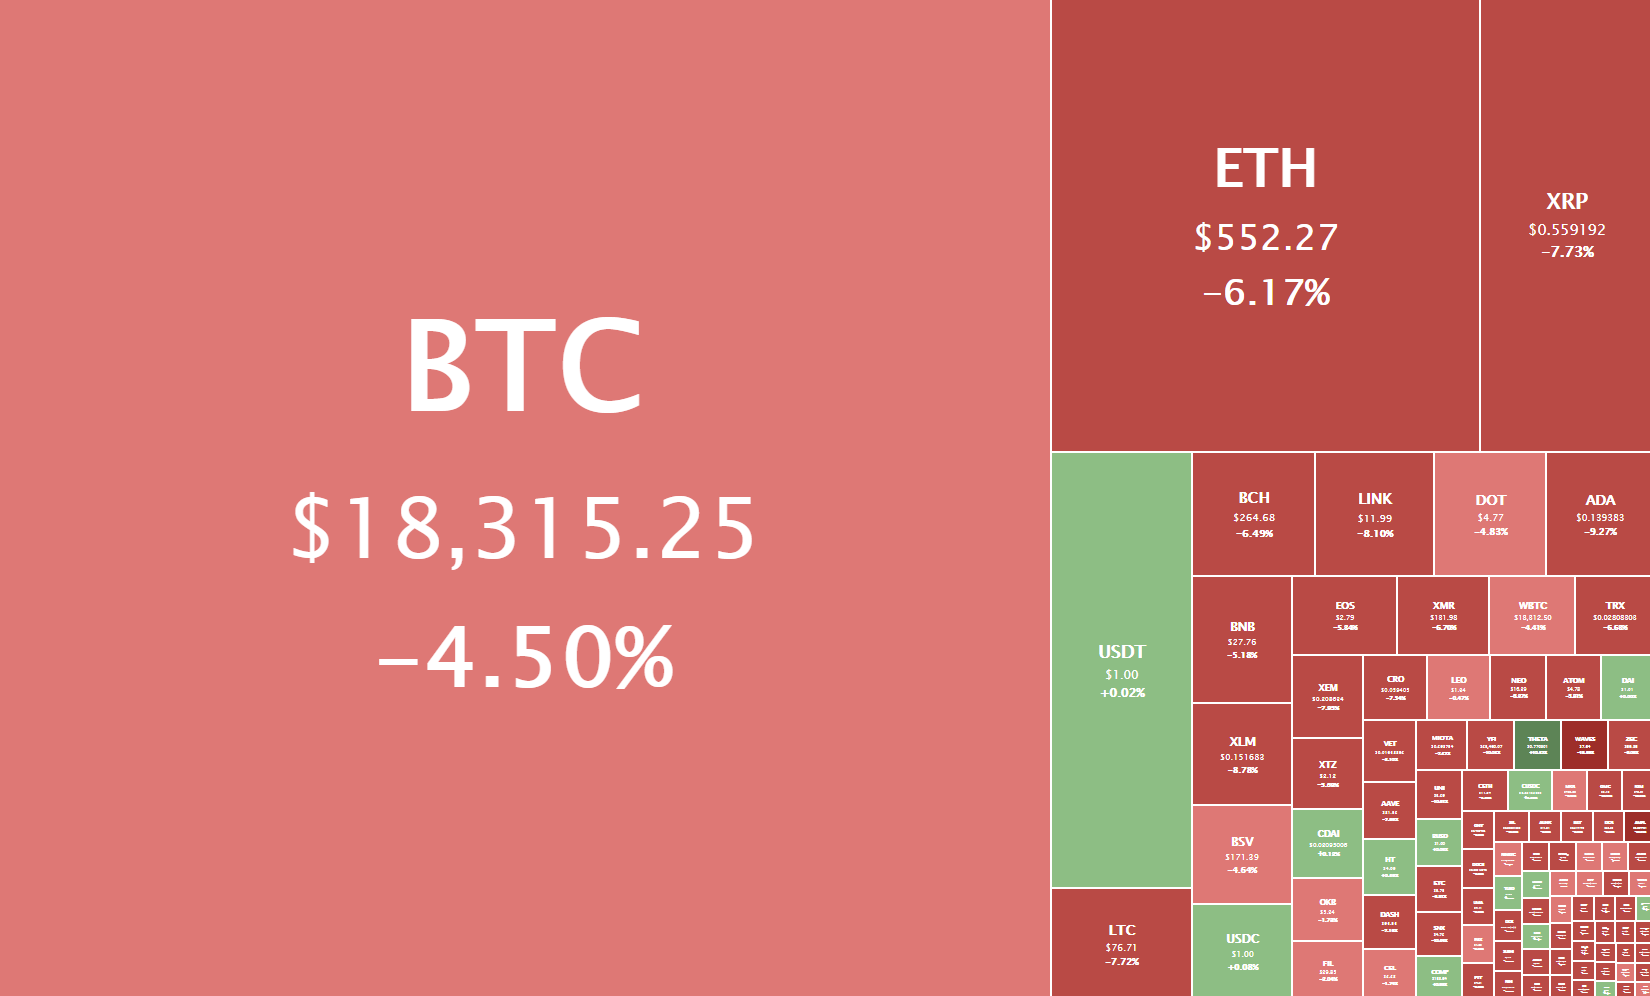
Bitcoin Is Tops

Although many competitors have emerged, Bitcoin remains the most important cryptocurrency due to:

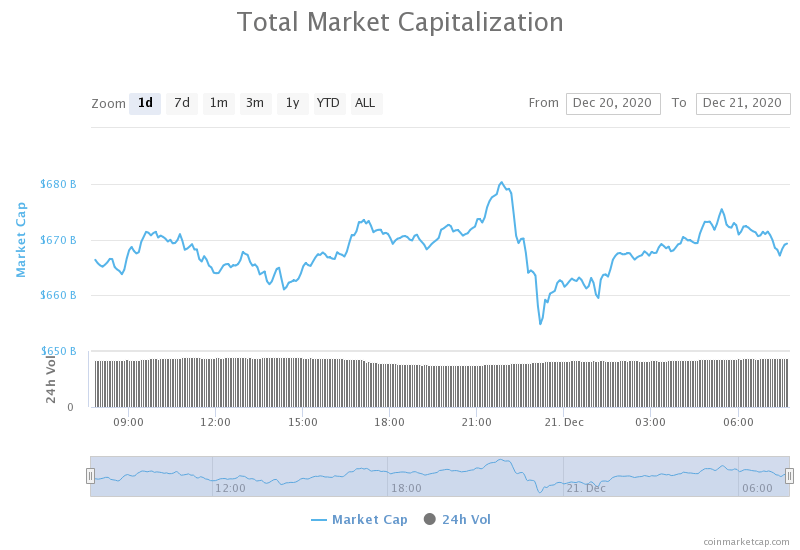
  • Increased market capitalization
  • Increased number of users
  • Increased security of the network

Greater liquidity: when investing, Bitcoin has more volume of trading in exchanges than the rest of cryptocurrencies and is also the first trading in the regulated futures market. In addition, it continues to await the approval of an ETF that would allow a large number of investors to invest in Bitcoin without having to worry about the purchase and storage process as we do now.

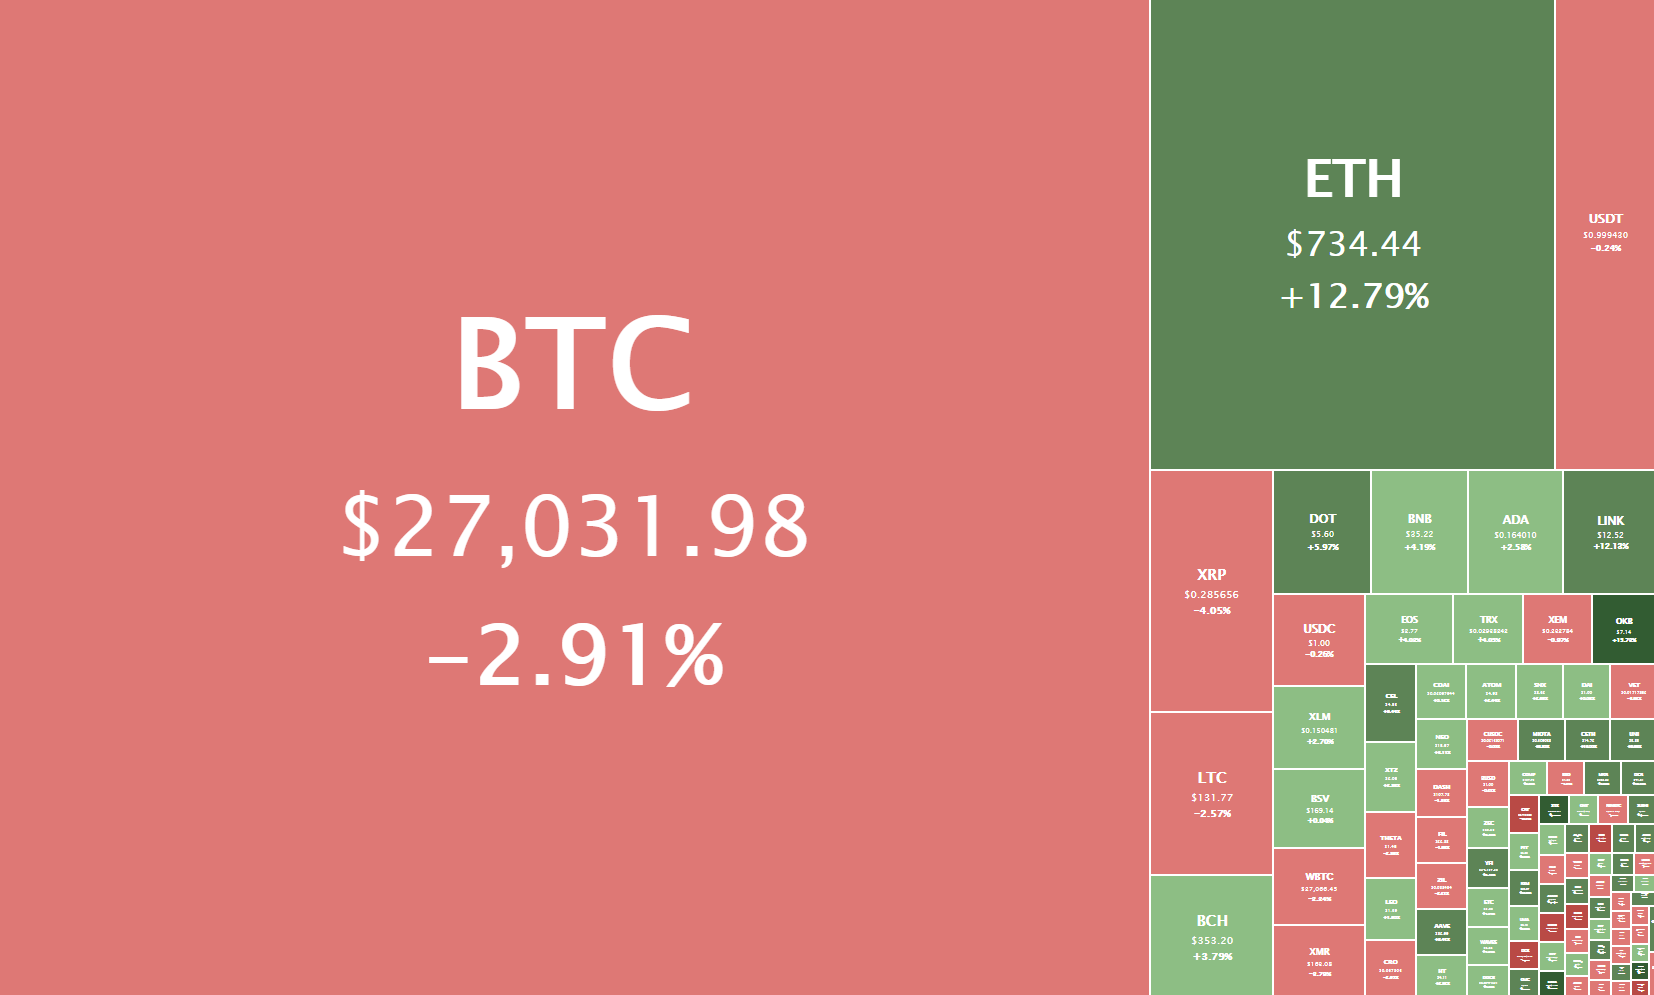
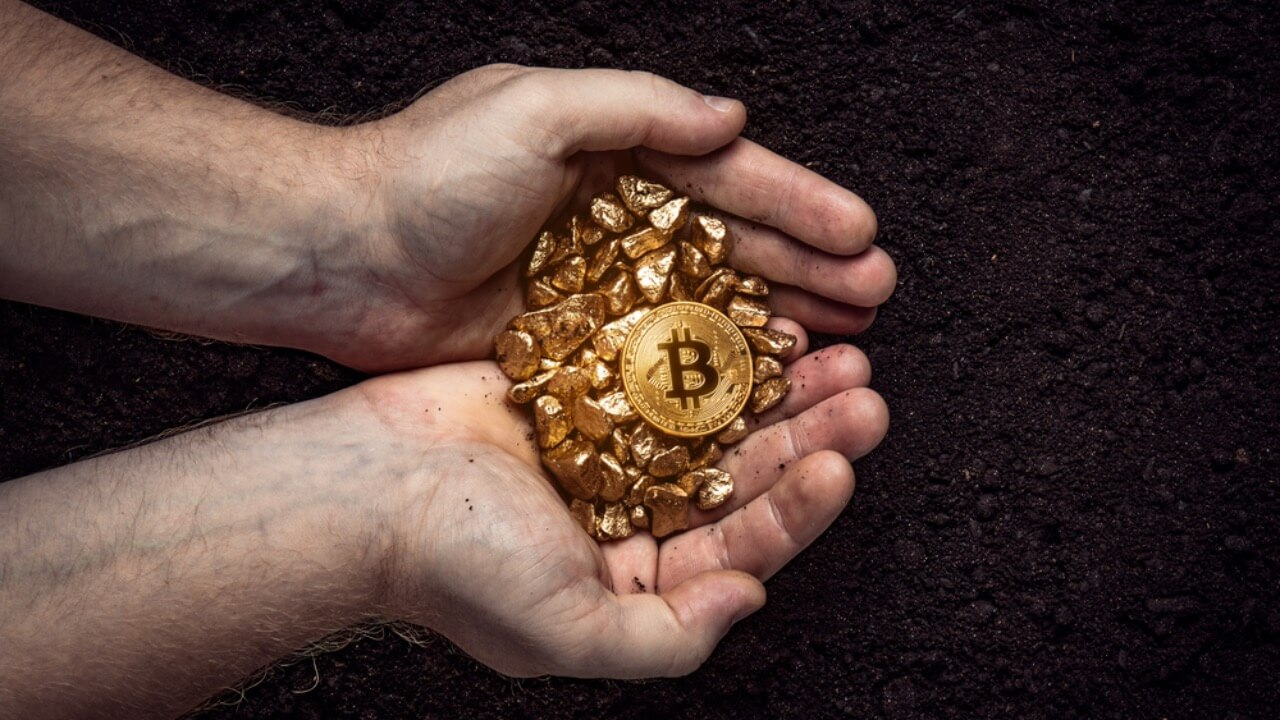
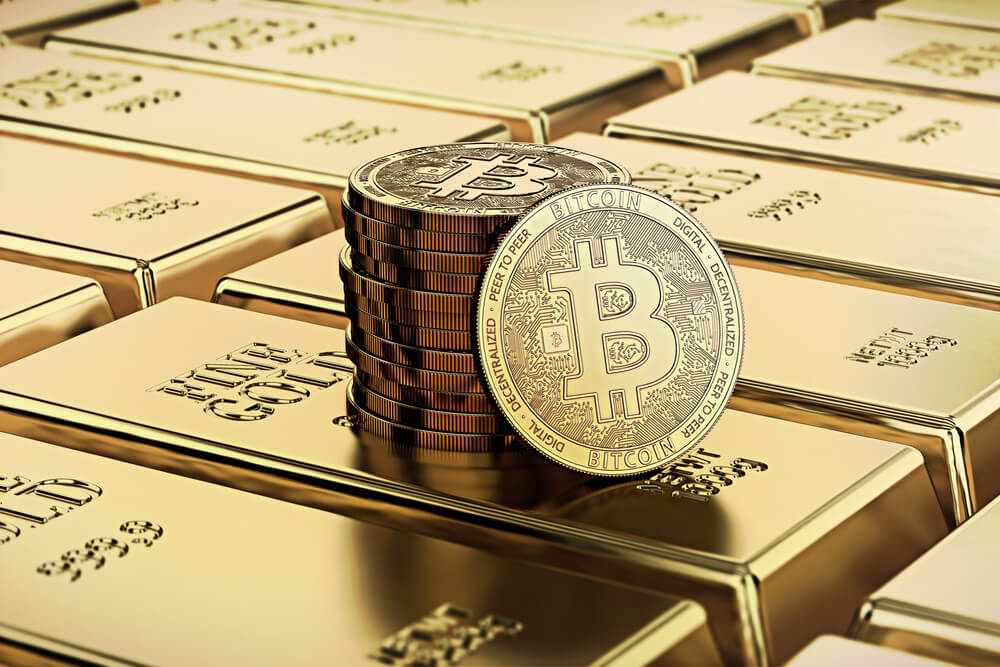
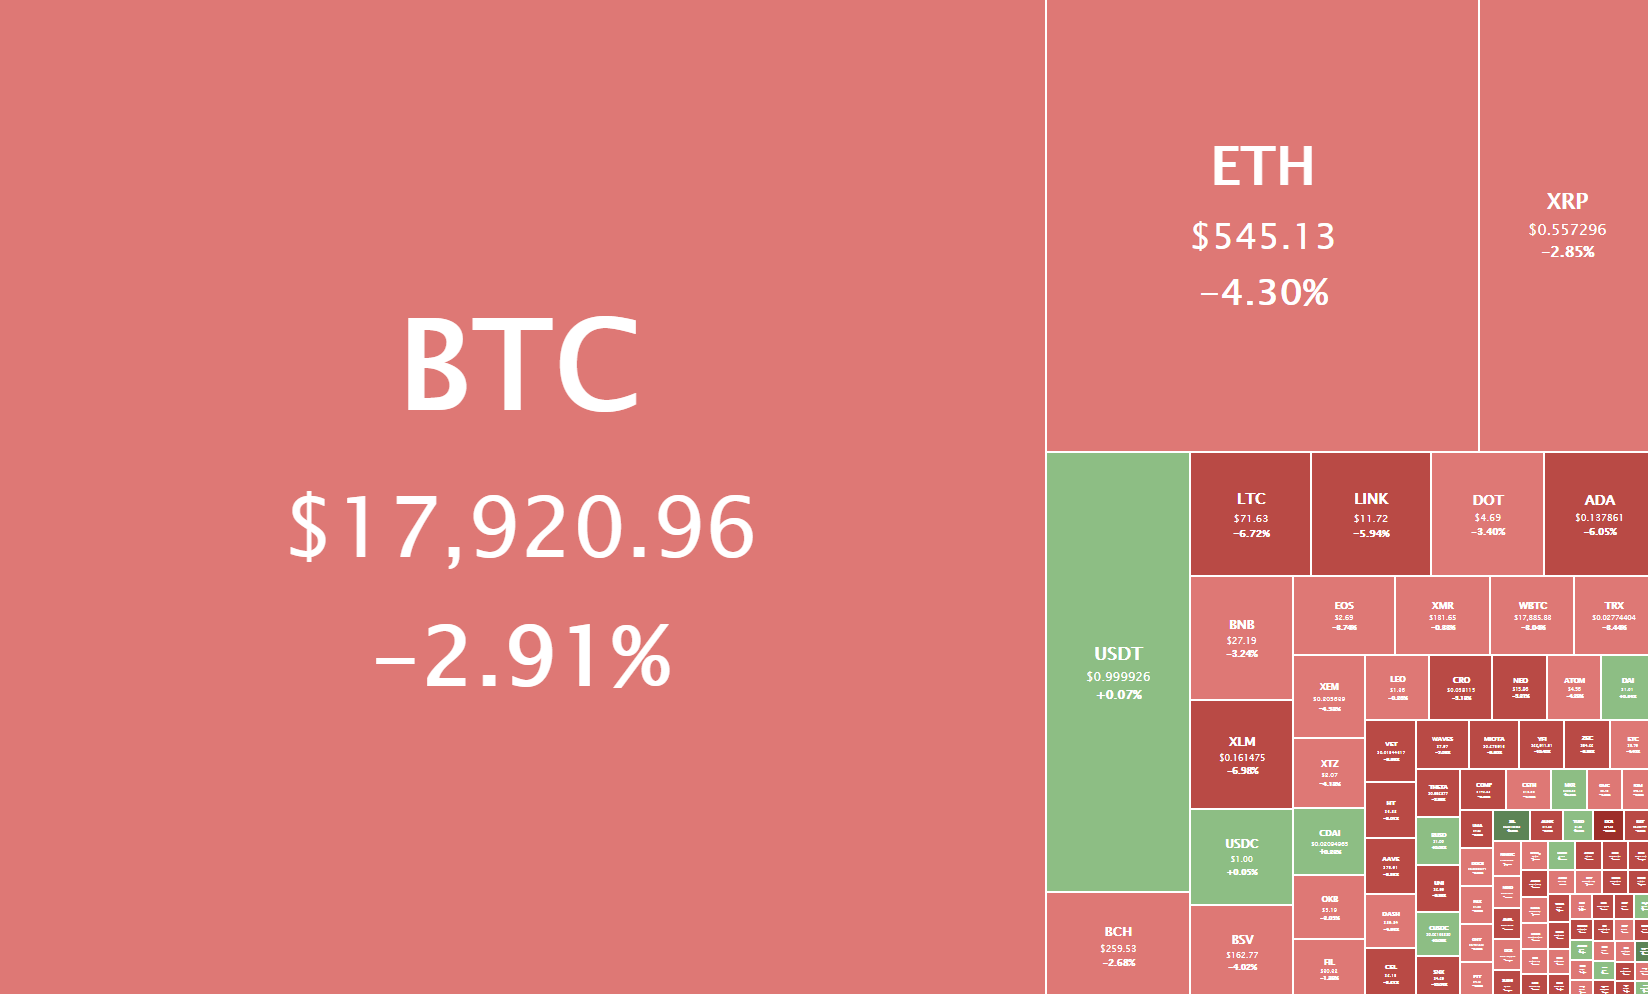
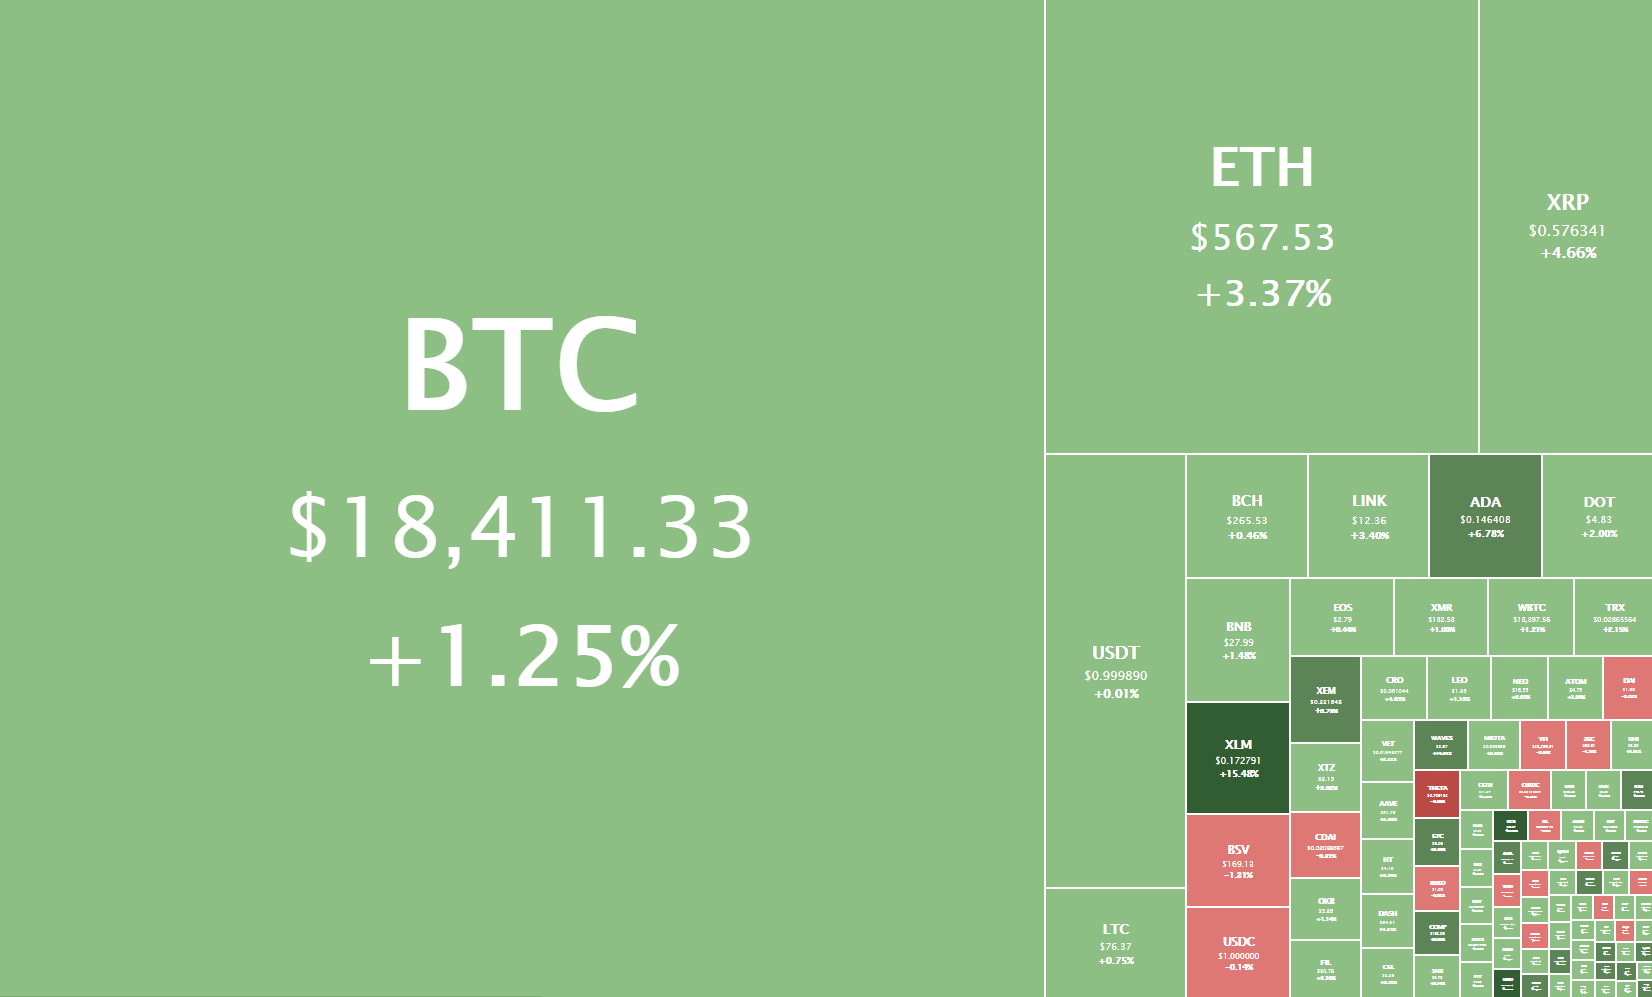
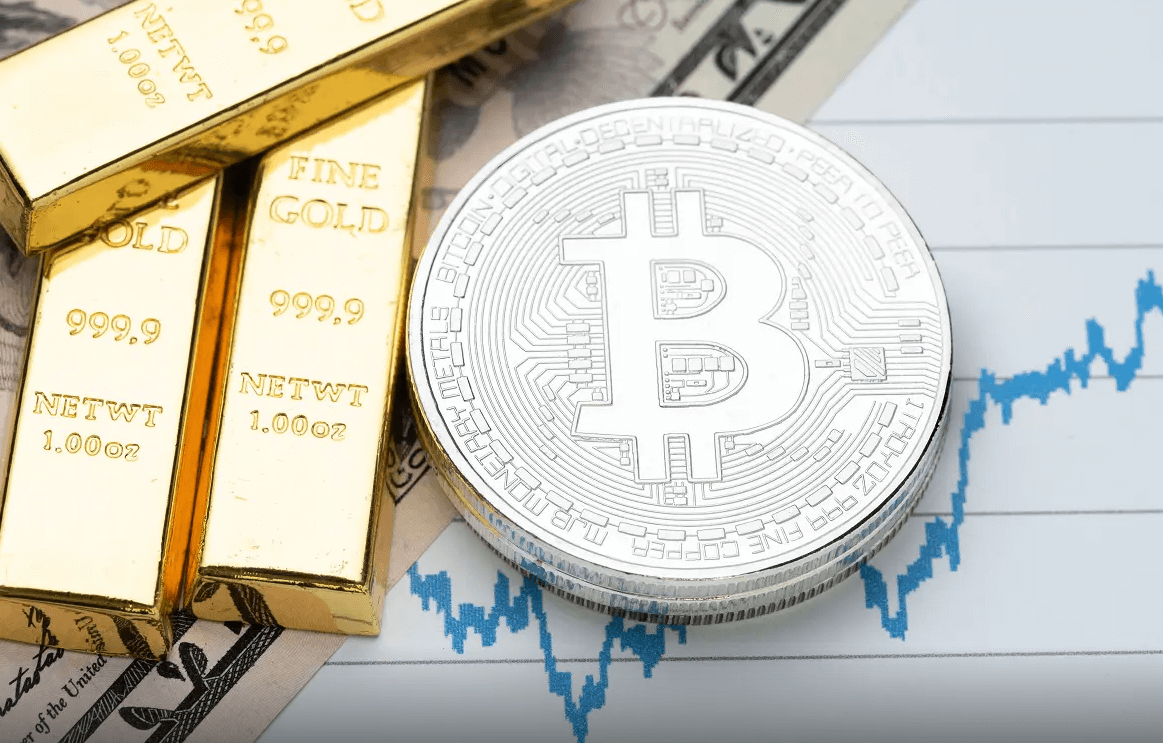
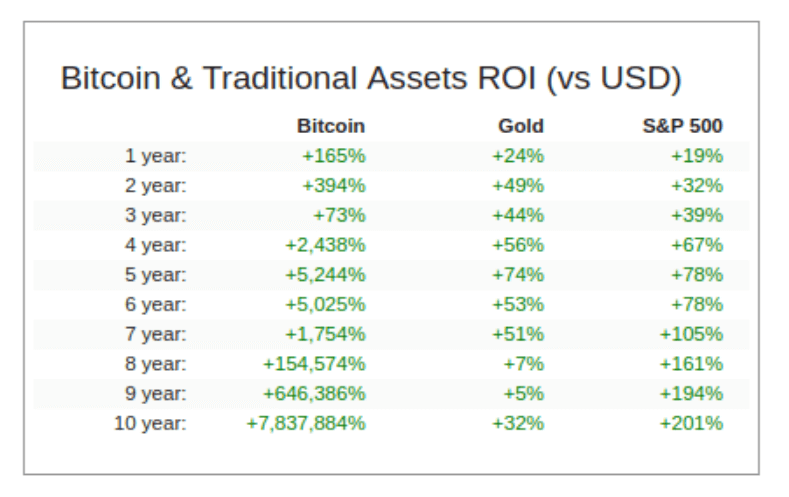
Bitcoin as a reserve of value: some characteristics such as its scarcity or that it has no correlation with any other financial asset makes it gradually start to be considered as a possible reserve of value such as GOLD. According to the words of Jerome Powell, President of the Federal Reserve of the United States on July 11 «Bitcoin is a speculative reserve of value just like Gold». Considering from whom this statement comes must be taken into account. For all these reasons, and also for others, I consider Bitcoin the cryptocurrency with the greatest projection for the future.

For this reason:

-I always have bitcoin as a reference point when analyzing the market and planning the strategy to follow.

-When I invest in cryptocurrencies, I always maintain a high percentage in BTC as it usually has a good performance even though at certain times some altcoins may have higher returns.

FOMO: Watch Your Emotions

Some technologies may be new, but people’s behavior is old. Markets from the beginning are largely driven by emotions and the strongest are fear and greed. The expression «FOMO» (fear of missing out) whose translation is something like fear of missing something, refers to the emotions mentioned above and that lead us to make wrong decisions.

Very often, when a cryptocurrency in which we want to invest begins to increase its price quickly, we are tempted to enter for fear of staying outside and not making money. You have to avoid buying by chasing the price in this way as many times at the time of buying, the price will start to correct and we will get caught in losses.

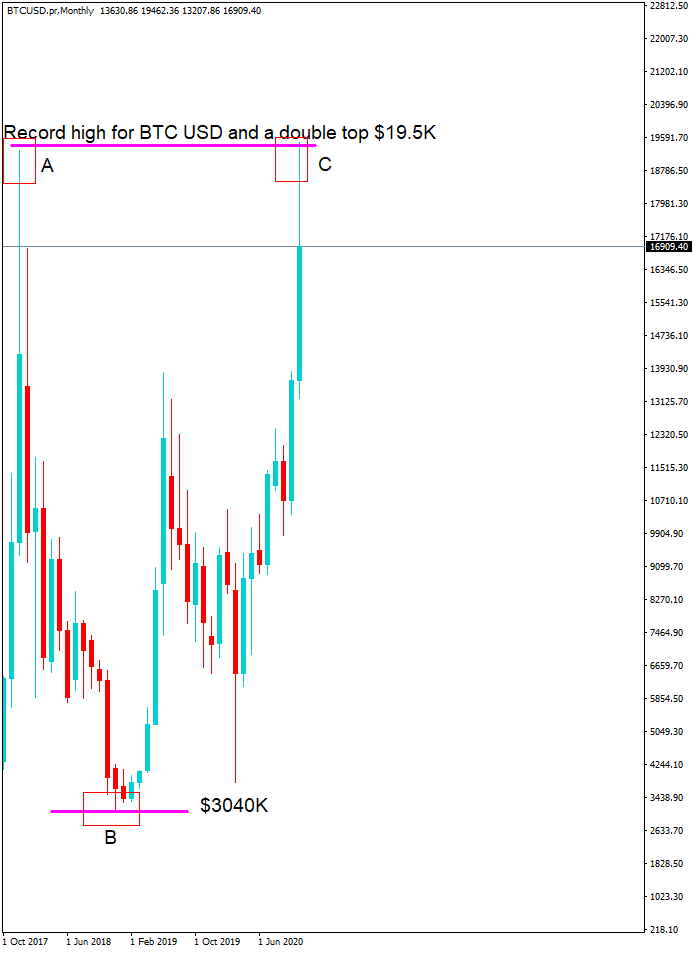
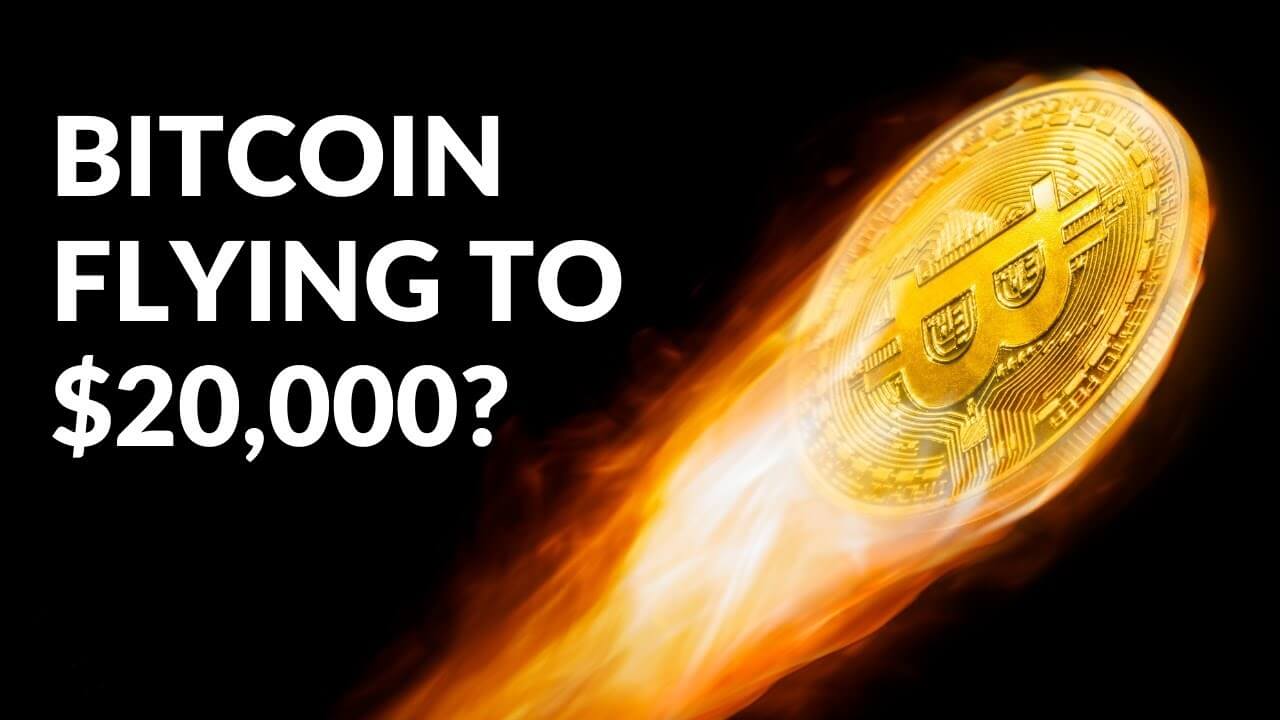
As a significant example, we can think of many people in December 2017 entering into Bitcoin highs around $20,000 guided by FOMO. What does this lead to? On the other hand, the big investors were selling the Bitcoins that they bought at lower prices, which later led to the price drop and the beginning of the bearish cycle in which many people were trapped.

The way to avoid being dragged by emotions is to create an investment plan and follow it. Let us not enter when the market is widespread when we should have done so earlier according to our investment plan.

The cryptocurrency market is very unpredictable and volatile, so to start we can start with strategies such as DCA (Dollar Cost Averaging), in which we make purchases spaced in time. We will not capture the soils of the market, but we will get acceptable yields. On the other hand, being aware of our emotions and detecting in this case the feeling of thinking that we are going to stay out is a first step to correct it.

Conclusion

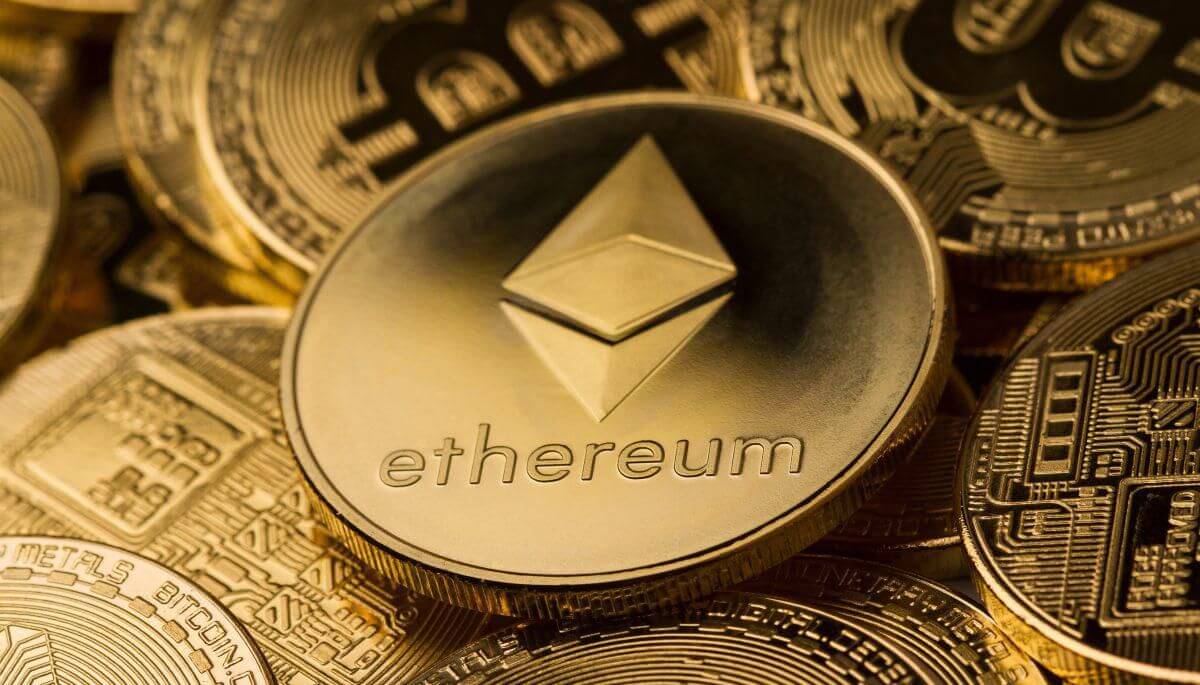
These have been the things that I consider most important when starting to invest in Bitcoin, Ethereum, Ripple, EOS, BNB, or any other cryptocurrency that you are interested in.

Categories
Crypto Market Analysis

Daily Crypto Review, Dec 16 – XRP Getting Crushed; BTC and ETH Stuck within a Range

The cryptocurrency sector was mostly stable today as Bitcoin kept within its trading range. Bitcoin is currently trading for $19,393, representing an increase of 1.13% compared to yesterday’s value. Meanwhile, Ethereum’s price has increased by 0.10% on the day, while XRP managed to lose a whopping 8.56%.

 Daily Crypto Sector Heat Map

XcelToken Plus gained 263.82% in the past 24 hours, making it the most prominent daily crypto gainer by far. It is followed by Amun Bitcoin 3x Daily Long’s 161.53% and rbase.finance’s 129.84% gain. On the other hand, Maximine Coin lost 99.42%, making it the most prominent daily loser. It is followed by STEM CELL COIN’s loss of 97.69% and Patron’s loss of 89.45%.

Top 10 24-hour Performers (Click to enlarge)

Bottom 10 24-hour Performers (Click to enlarge)

Bitcoin’s market dominance has moved up since our last report, with its value currently being 63.9%. This value represents a 0.4% difference to the upside than the value it had when we last reported.

Daily Crypto Market Cap Chart

The cryptocurrency sector capitalization has decreased slightly since we last reported, with its current value being $564.0 billion. This represents a $4.20 billion decrease when compared to our previous report.

_______________________________________________________________________

What happened in the past 24 hours?

_______________________________________________________________________

_______________________________________________________________________

Technical analysis

_______________________________________________________________________

Bitcoin

Bitcoin has continued trading within a range between $19,100 and $19,570, possibly hitting a wall of profit-taking institutional traders. Despite the overall bullishness of the market, the largest cryptocurrency by market cap failed to break the $19,666 level or even reach it. This is because of the increasing number of BTC Whales (holders of 10,000 to 100,000 Bitcoin) leaving the market and taking profit as the price approaches the $20,000 mark.

The sheer amount of resistance hovering above $19,500 will make it quite hard for Bitcoin bulls to push towards the all-time highs. In case the aforementioned push doesn’t happen, we can expect a possible dip towards $18,000.

BTC/USD 4-hour chart

Bitcoin’s overview on all time-frames is bullish, with its weekly time-frame being the only one completely bullish. The rest of the time-frames are slightly tilted to the neutral side.

BTC/USD 1-day Technicals

Technical factors (4-hour Chart):
  • Price is above its 50-period and slightly above its 21-period EMA
  • Price is between its middle and top Bollinger band
  • RSI is neutral (60.06)
  • Volume is average
Key levels to the upside          Key levels to the downside

1: $19,100                                 1: $18,600

2: $19,666                                 2: $18,190

3: $20,000                                  3: $17,800

Ethereum

Ethereum has hit a sell wall as well, stopping its upward price movement just below $600 for the third time in 3 days. The second-largest cryptocurrency by market cap is stuck between $581 to the downside and $600 to the upside, which is a very narrow range for long-term trading.

Ethereum will most likely experience a sharp break out of the current range, creating a potential safe trade with set parameters.

ETH/USD 4-hour Chart

Ethereum’s overview on all time-frames is bullish, with its daily time-frame being the only one completely bullish. The rest of the time-frames are slightly tilted to the neutral side.

ETH/USD 1-day Technicals

Technical Factors (4-hour Chart):
  • Price is slightly above its 50-period and at its 21-period EMAs
  • Price is at its middle Bollinger band
  • RSI is neutral (54.03)
  • Volume is slightly below average when compared to the previous week
Key levels to the upside          Key levels to the downside

1: $600                                     1: $581

2: $632                                     2: $565 

3: $636.5                                   3: $545

Ripple

XRP has continued its downturn, this time breaking the crucial $0.475 level. Its price has steadily decreased ever since Dec 1, when it could not break $0.683. This steady descent has created a downtrend, which many analysts think is the death of XRP’s price.

However, there is still hope for XRP. Some analysts believe that this is the 4th of 5 waves in a pattern that XRP started creating on Aug 20 and that the next wave will start an uptrend that will propel its price above $1.

XRP/USD 4-hour Chart

XRP’s longer-term technicals are tilted towards the buy-side, while its short-term technicals are tilted towards the sell-side. While its 4-hour time-frame is completely bearish, its daily overview is slightly more neutral.

XRP/USD 1-day Technicals

Technical factors (4-hour Chart):
  • Its price is currently well below both its 50-period EMA and its 21-period EMA
  • Price is at its bottom Bollinger band
  • RSI is close to the oversold territory (31.25)
  • Volume is well below its average level
Key levels to the upside          Key levels to the downside

1: $0.5                                      1: $0.475

2: $0.543                                   2: $0.45

3: $0.57                                    3: $0.425

Categories
Crypto Videos

Crypto!The 3 Best Key Indicators To Watch When Trading Bitcoin! No

3 Key Indicators to Watch When Trading Bitcoin


For the past week, Bitcoin’s price has been dancing around the $20,000 mark, which has led many traders to lose their patience. In the eyes of those traders, the current lack of bullish momentum is problematic, especially when considering that Bitcoin tested the $16,200 level roughly two weeks ago.

Experienced traders tend to look at several key indicators that serve as telling signs of a major trend reversal. These key indicators are:

  • The futures premium
  • Volumes, and
  • Top traders’ positions at major exchanges


While a handful of negative indicators do not precede every dip, there are some signs of weakness that show a trend reversal more often than not. 

Monitoring the futures contracts premium

The open interest of perpetual contract buyers and sellers is matched at all times in any futures contract. Simply put, there is no way an imbalance of any form can happen, as every trade requires both a buyer and a seller.

Funding rates ensure that there are no exchange risk imbalances. When sellers are the ones demanding more leverage, the funding rate goes negative. Therefore, the traders who want to be on the short side will be the ones paying the fees. The opposite is true, as well.

Sudden shifts to the negative funding rates indicate a strong interest in keeping short positions open. Ideally, investors would monitor a couple of exchanges at the same time to avoid eventual anomalies, no matter how rare they are.

By measuring how much more expensive futures contracts are versus the regular spot market, traders can gauge the bullishness level of the market.

The fixed-calendar futures usually trade with a 0.5% or higher premium when compared to regular spot exchanges. Whenever this premium decreases or turns negative, traders can consider this a red flag. Such a situation, also called backwardation, indicates strong bearishness.

Monitoring volume

In addition to constantly checking futures contracts, good traders also track the spot market volumes. Breaking important resistance levels while simultaneously showing low volumes is somehow intriguing. Typically, low volumes show a lack of confidence. Therefore, any significant price change should be accompanied by an increase in trading volume.

Top traders long-to-short ratio 

Another key metric that can be used is the top traders’ long-to-short ratio. This metric can be found at many leading crypto exchanges.

Traders should pay attention to changes in this metric rather than absolute figures as there are often discrepancies between exchanges’ methodologies.

As an example, a sudden move below the 1.00 long-to-short ratio should be a troubling signal. This is because the historical 30-day data, as well as the current 1.23 figure, favor longs.

As we mentioned before, the ratio can differ significantly between exchanges, but traders should watch changes in ratios rather than the absolute numbers themselves.

Unlike our previous example from Binance, it is common for OKEx top traders to hold levels below 1.00, all while not necessarily indicating bearishness. According to the 30-day data on this exchange, numbers below 0.75 should be cause for worry.

Conclusion

No set rule or method could predict every single spike or dip, but certainly, there are ways to improve your chances of improving your profitability when trading.

Monitoring the funding rate, spot volumes, as well as the top traders’ long-to-short ratio provides a much clearer view of the Bitcoin market as a whole, rather than simply reading candlestick patterns and monitoring general oscillators like the RSI and MACD.

This is mostly because the aforementioned metrics provide a direct gauge of professional traders’ sentiment, rather than just retail sector sentiment, and it is crucial to take them into account as Bitcoin tries to break $20,000.

Categories
Crypto Market Analysis

Daily Crypto Review, Dec 15 – Bitcoin Whales Stopping the Push Towards $20k; XRP on the Downturn

The majority of the cryptocurrency sector ended up being in the slight green since we last reported, with Bitcoin trying to reach the all-time highs (though so-far unsuccessfully). Bitcoin is currently trading for $19,106, representing an increase of 0.15% compared to yesterday’s value. Meanwhile, Ethereum’s price has decreased by 0.32% on the day, while XRP managed to lose 2.97%.

 Daily Crypto Sector Heat Map

Mandi Token gained 175.35% in the past 24 hours, making it the most prominent daily crypto gainer by far. It is followed by yTSLA Finance’s 169.53% and DefHold’s 129.84% gain. On the other hand, DistX lost 98.32%, making it the most prominent daily loser. It is followed by AC Index’s loss of 94.05% and YXO’s loss of 43.16%.

Top 10 24-hour Performers (Click to enlarge)

Bottom 10 24-hour Performers (Click to enlarge)

Bitcoin’s market dominance has moved up very slightly since our last report, with its value currently being 63.5%. This value represents a 0.2% difference to the upside compared to the value it had when we last reported.

Daily Crypto Market Cap Chart

The cryptocurrency sector capitalization has increased since we last reported, with its current value being $569.80 billion. This represents a $9.01 billion increase when compared to our previous report.

_______________________________________________________________________

What happened in the past 24 hours?

_______________________________________________________________________

_______________________________________________________________________

Technical analysis

_______________________________________________________________________

Bitcoin

Bitcoin had quite an interesting day as it (at one point) tried to push towards the all-time highs, or at least towards its next resistance level (sitting at $19,666). However, the sheer resistance near the $20k level was immense, and the largest cryptocurrency by market cap dipped to its immediate support level ($19,100), which is where it’s at right now.

The data provided by various sources point to Bitcoin whales blocking the way towards and past $20k, despite all the bullish sentiment currently surrounding the cryptocurrency.


BTC/USD 4-hour chart

Bitcoin’s overview on all time-frames is fully bullish, with its monthly time-frame being slightly more tilted to the neutral side than the rest.

BTC/USD 1-day Technicals

Technical factors (4-hour Chart):
  • Price is above its 50-period and slightly above its 21-period EMA
  • Price is near its middle Bollinger band
  • RSI is neutral (55.33)
  • Volume is average when compared to the past week
Key levels to the upside          Key levels to the downside

1: $19,100                                 1: $18,600

2: $19,666                                 2: $18,190

3: $20,000                                  3: $17,800

Ethereum

Ethereum was in the same boat as Bitcoin for the past couple of days, with its price movement mirroring Bitcoin’s. Ether tried to move towards the $600 mark, but got stopped out just below it, triggering a pullback to its immediate support level ($581). However, its downside is well-guarded, both by the $581 support level and the 4-hour 21-period moving average.

Ethereum will most likely continue mirroring Bitcoin’s moves in the short future, meaning that traders should either focus on trading Bitcoin or pay close attention to its movements while trading Ether.

ETH/USD 4-hour Chart

Ethereum’s overview on all time-frames is fully bullish, with its weekly time-frame being slightly more tilted to the neutral side than the rest.

ETH/USD 1-day Technicals

Technical Factors (4-hour Chart):
  • Price is slightly above both its 50-period and 21-period EMAs
  • Price is near its middle Bollinger band
  • RSI is neutral (53.74)
  • Volume is slightly below average when compared to the previous week
Key levels to the upside          Key levels to the downside

1: $600                                     1: $581

2: $632                                     2: $565 

3: $636.5                                   3: $545

Ripple

XRP is one of the cryptocurrencies that rarely mirrors Bitcoin’s movements, and that was the case in the past 24 hours as well. However, the fact that its price doesn’t mirror the largest cryptocurrency was bad news lately. XRP’s price continued its slow descent, this time breaking the $0.5 mark to the downside. At one point, there was an attempt to regain this level, which got shut down pretty quickly.

While the overall crypto sector is surrounded by bullish sentiment, XRP is looking quite bearish in the short-term. Shorting the fourth-largest cryptocurrency by market cap can be a valid trading strategy, simply due to its consistency going down in recent days.

XRP/USD 4-hour Chart

XRP’s longer-term technicals are completely bullish, while its daily overview is slightly more tilted towards neutrality. Its 4-hour time-frame, however, is slightly tilted towards the sell-side.

XRP/USD 1-day Technicals

Technical factors (4-hour Chart):
  • Its price is currently below its 50-period EMA and slightly below its 21-period EMA
  • Price is between its middle and bottom Bollinger band
  • RSI is neutral (37.98)
  • Volume is well below its average level
Key levels to the upside          Key levels to the downside

1: $0.5                                      1: $0.475

2: $0.543                                   2: $0.45

3: $0.57                                    3: $0.425

Categories
Crypto Market Analysis

Daily Crypto Review, Dec 14 – BTC and ETH Consolidating After A Bull Rally; XRP Left in the Dust

The majority of the cryptocurrency sector ended up in the green as Bitcoin spent the weekend regaining the value it lost after failing to break its all-time high with confidence. Bitcoin is currently trading for $19,144, representing an increase of 1.69% compared to yesterday’s value. Meanwhile, Ethereum’s price has increased by 3.61% on the day, while XRP managed to gain 3.77%.

 Daily Crypto Sector Heat Map

BDCC Bitica COIN gained 229.29% in the past 24 hours, making it the most prominent daily crypto gainer by far. It is followed by Ethereum Lightning’s 223.18% and Nuggets’ 190.36% gain. On the other hand, rbase.finance lost 72.18%, making it the most prominent daily loser. It is followed by COIL’s loss of 48.85% and SBank’s loss of 40.65%.

Top 10 24-hour Performers (Click to enlarge)

Bottom 10 24-hour Performers (Click to enlarge)

Bitcoin’s market dominance has moved up half a percent since we last reported, with its value currently being 63.3%. This value represents a 0.5% difference to the upside compared to the value it had when we last reported.

Daily Crypto Market Cap Chart

The cryptocurrency sector capitalization has increased significantly over the weekend, with its current value being $560.79 billion. This represents a $31.22 billion increase when compared to our previous report.

_______________________________________________________________________

What happened in the past 24 hours?

_______________________________________________________________________

_______________________________________________________________________

Technical analysis

_______________________________________________________________________

Bitcoin

Bitcoin has been on fire this weekend, with its price skyrocketing from its recent lows. The uptrend that started on Dec 11 brought its price from $17,600 all the way up to $19,400 before starting to consolidate. The steep ascending trend it created was unsustainable in the long run, so Bitcoin left it and continued trading sideways just above $19,100. The largest cryptocurrency by market cap is currently fighting for this level, with the previous five 4-hour candles holding above the support.

BTC/USD 4-hour chart

Bitcoin’s daily and monthly technicals show slight signs of neutrality on top of its overall bullishness. On the other hand, its 4-hour and weekly technicals are completely bullish.

BTC/USD 1-day Technicals

Technical factors (4-hour Chart):
  • Price is above both its 50-period and 21-period EMAs
  • Price is between its middle and top Bollinger band
  • RSI is neutral (59.17)
  • Volume is slightly below the average level
Key levels to the upside          Key levels to the downside

1: $19,100                                 1: $18,600

2: $19,666                                 2: $18,190

3: $20,000                                  3: $17,800

Ethereum

Ethereum has followed Bitcoin’s footsteps and created its own ascending channel, in which it moved from Dec 11 until Dec 13. The second-largest cryptocurrency by market cap has left this channel and started its own consolidation phase right above the $581 support level.

Ethereum’s moves seem like a mirror to Bitcoin’s moves, with slightly more or less intensity. Traders should be extremely careful of sudden moves Bitcoin can make that could disrupt their Ethereum trades.

ETH/USD 4-hour Chart

Ethereum’s 4-hour, daily, and weekly technicals overall bullish but show signs of neutrality or even some bearish indicators. On the other hand, its monthly technicals are completely tilted towards the buy-side.

ETH/USD 1-day Technicals

Technical Factors (4-hour Chart):
  • Price is above both its 50-period and 21-period EMAs
  • Price is between its middle and top Bollinger band
  • RSI is starting to descend after being close to overbought (58.72)
  • Volume is average when compared to the previous week
Key levels to the upside          Key levels to the downside

1: $600                                     1: $581

2: $632                                     2: $565 

3: $636.5                                   3: $545

Ripple

XRP performed much worse than Bitcoin and Ethereum over the weekend, with its short-term outlook being quite bearish. The fourth-largest cryptocurrency by market cap ended up losing $13.11% of its value week-over-week, with its price currently sitting at the $0.5 level.

XRP is currently fighting to stay above the $0.5 level, with its past four 4-hour candles managing to do this. Traders may be able to catch a trade in either direction when XRP confirms its position above/below $0.5 on increased volume.

XRP/USD 4-hour Chart

XRP’s 4-hour and daily overviews are heavily tilted towards the sell-side but still show some neutral indicators. Its longer-term technicals, though, are completely bullish.

XRP/USD 1-day Technicals

Technical factors (4-hour Chart):
  • Its price is currently below both its 50-period EMA and its 21-period EMA
  • Price is between its middle and bottom Bollinger band
  • RSI is neutral (37.98)
  • Volume is slightly below the average level
Key levels to the upside          Key levels to the downside

1: $0.5435                                 1: $0.5

2: $0.57                                     2: $0.475

3: $0.6                                      3: $0.45

Categories
Crypto Market Analysis

BTC/USD Weekly Chart Analysis + Possible Outcomes

In this week’s BTC/USD analysis, we will be taking an in-depth look at the most recent technical formations, as well as look for the possible short-term price outcomes.

Overview

Bitcoin has had quite a volatile week experienced yet another steep decrease in price as a continuation of the bear retracement after the cryptocurrency couldn’t post new all-time highs with confidence. However, the largest cryptocurrency by market cap has recovered from the decline in a matter of days, with its price over $19,000 once again.

While Bitcoin’s fundamentals only grew stronger as more and more institutional investors acknowledge it as a competitor to gold. This trend of large public companies investing in the best-known cryptocurrency has been seen throughout 2020, and many say that this is the sole reason for the current Bitcoin’s run.

Technical factors


Bitcoin is currently in a steep upwards-facing trend, which brought its price from $17,600 all the way to $19,000. While the channel is way too steep to be considered a long-term option, Bitcoin has the option to follow it for a little bit more, possibly riding the way up to the $19,666 major resistance (and a previous all-time high on Bistamp). This will most likely be the pivot point for Bitcoin, which will decide if it will try to tackle the levels above $20,000 or stay below it and seek support near $19,100.

Likely Outcomes

Bitcoin’s currently sending out very bullish signals, but we included a slightly bearish scenario as well, just to make sure all bases are covered.

1: In case Bitcoin heads further up, its price will most likely stop at the major pivot point, which sits at $19,666. This level is the all-time high from 2017 and is a major resistance level. From here, Bitcoin bulls will have to decide whether they will push towards the upside or remain below this level:

  • In case that the price moves further up, its next possible resistance level (there isn’t much resistance above $20,000, so all possible resistance levels will be extensions of the Fib retracements) is most likely to be sitting at around $20,750.
  • In case the price decides to stay below $19,666, we can expect it to move down and look for support at $19,100 or $18,600 levels.

2: If Bitcoin breaks the ascending channel early and pushes towards the downside, its first strong support level is $19,100 (which it will inevitably break if it pushes down and breaks the channel) and then $18,600.

Entering any short trades could be quite risky at the moment due to the bullish momentum Bitcoin has gathered. However, trading above $20,000 is equally as risky as Bitcoin would be entering a zone with no set resistance and support levels. However, entering long traders is certainly a safer option at the moment.

Categories
Crypto Daily Topic Cryptocurrencies

What Exactly Are Dark Pools? 

The finance world has always been filled with curiosities. Money is a touchy subject, and people often go to extraordinary lengths to protect their positions. Out of this has emerged the concept of ‘dark pools,’ which are financial trading hubs taking place away from the public’s eye. 

What are dark pools? How did they come to be? We’ll be looking at that and more in this article. Importantly, we’ll see the role they’ve played in the crypto space, if any. 

Understanding a Dark Pool

A dark pool is a privately arranged venue/hub/platform where financial instruments’ trading is held. Dark pools are in direct contrast with public exchange markets, which are heavily regulated and have a lot of media visibility. A dark pool has no publicly available order book, nor is its trades publicly visible (or are only visible once executed). 

Dark pools’ liquidity is known as dark pool liquidity. Most dark pool trading is executed in block trades. A block trade is a particularly large volume trade, usually at a predetermined price. 

Dark pools hark back to the 80s when institutional investors used them to exchange huge amounts of securities. Dark pools allow traders to place large orders without letting them known their intentions first. This is important because the public knowing their intentions to buy or sell large volumes of a security could negatively impact the trade before they can get to carry it out. 

Dark pools have become a substantial part of global financial markets, and we’ll be debunking them further in this article, together with their application in cryptocurrency. 

Cryptocurrency dark pools

UK-based crypto exchange Kraken pioneered dark pools crypto in 2016. “Dark pool trading allows for orders to be placed out of sight so that traders can make large buy or sell orders (minimum of 50 bitcoin or 2500 ether) without revealing their sentiment to other traders. Advantages include reduced market impact and better price for large blocks,” said Joseph Powell, CEO. 

A few countries around the world have been friendly to the concept of crypto dark pools. This is saying something when you consider the crime reputation that cryptocurrency has. Bermudan digital asset exchange Omega One’s Dark Pool was awarded the country’s first-ever crypto exchange license: “We are now on-boarding select institutions, liquidity venues, and market makers with a trading volume of $10 million a month.”

Why Use Dark Pools? 

Let’s say an institutional investor, A, believes Bitcoin’s price will soon take a hit. They decide to sell $1 million worth of BTC to ride out the fall in price safely. But two problems are impeding this proposition. First off, selling such a large amount of BTC on any open exchange will impact the market one way or another. They don’t want to cause such a large ripple in the market. 

The other problem is, no buyers are willing to purchase such a huge amount of Bitcoin, at least immediately. So they will have to break down the sale into the more manageable pieces of $50,000 at a time, 20 times. 

This means: 

  • They will incur charges on all the 20 sales. 
  • The sale will affect the market and probably send retail investors offloading as well, causing the price to crash.
  • The sale could end up being more costly – it’s highly likely they will not be able to sell each BTC at the going price, but lower. 

If the institutional investor used a dark pool, they’d save themselves from the above unfortunate scenarios. Selling on an open market would expose them to potential loss and send a negative signal to the market. 

Advantages of using a dark pool

There are several benefits of taking it dark: 

  • Avoid impact on market sentiment: Traders who wish to make large trades can do so in a way that they do not send signals to the market.
  • Better prices: In a dark pool, both seller and buyer get better prices than they would in the open market. The buyer buys low, while the seller sells high.
  • No slippage: The majority of trades in dark pools are usually block-trades set at predetermined prices. Traders know they can execute the trade at the expected price.

Controversies surrounding dark pools 

  • Conflict of interest: Seeing as the order book is not publicly available, a trader has no way of knowing that a trade was completed at the best possible price. If the entity facilitating the trade has a conflict of interest, they can potentially obfuscate the real price.
  • Negative effect on markets: If a large part of trading is happening in dark pools, the real market price may not reflect reality. The finance market relies on the free flow of information, and if a huge part of trading is happening under the radar, the actual market is disadvantaged.
  • Vulnerability to predatory practices: Dark pools are perhaps the best playing ground for predatory practices. In particular, high-frequency traders who may have access to order book data can unfairly exploit unsuspecting traders. 
  • Enabling pinging: Dark pools enable pinging, a questionable practice that involves sending many small orders to obscure a big hidden order. Pinging is used to identify liquidity in order books and can have an unhealthy effect on the market.
  • Decreasing popularity: Dark pools are not growing more popular – quite the opposite. This means institutional investors might be moving away from the practice. When their existence is less compelling, their overall effect on the broader market is harmful.

Decentralized dark pools

Just like dark pools in the traditional finance market, dark cryptocurrency pools are available on some exchanges, as we previously mentioned. Unlike traditional dark pools, decentralized dark pools enjoy better and more secure verification. Such verification is powered by state-of-the-art cryptography. Also, crypto dark pools are run by automatic protocols that help maintain fairness for all participants and less likely to be manipulated by unscrupulous players. Zero-knowledge proofs and other cryptographic technologies ensure a high degree of transparency and integrity. 

If a trade involves more than one blockchain, it can be seen through by cross-chain atomic swaps that are not only cheaper but also remove the bloat associated with third-party intermediaries. Dark pools can also help in illiquid cryptomarkets by enabling traders to conduct high-volume trades without slippage. While a huge order would send a negative signal in an open illiquid market, it wouldn’t have the same effect in a dark pool. 

So far, dark pools haven’t had a major effect on the crypto markets due to the relative lack of institutional traders in the space. Whether this will change in the future is anyone’s guess. 

Closing Thoughts

Courtesy of their secretive nature, dark pools have been a source of controversy throughout their existence. When a part of investing and trading activity occurs underground, it can never be desirable on any market. However, with decentralized dark pools, we could potentially see a shift in not just how they’re perceived but their usefulness to various players. Open source approaches to dark pools could ensure that everyone uses the same rule book, alleviating much of the associated risk. 

Categories
Cryptocurrencies

What’s a Bitcoin Improvement Proposal? 

Bitcoin was the world’s first cryptocurrency. It has completely changed how the world views finance while at the same time rallying an entire industry of cryptocurrencies. Bitcoin holds (and probably will always hold) a very special place in cryptoverse. However, just like any new tech, Bitcoin has its growing pains. For this reason, Bitcoin developers are always coming up with improvement proposals for the network to make it even better. 

However, this is not done in a random fashion. Nine years ago, a man named Amir Taaki wisely came up with what’s known as a Bitcoin Improvement Proposal (BIP) that anyone should follow to suggest changes to the Bitcoin ecosystem. This article looks at what exactly a BIP is and what it entails. 

What’s a Bitcoin Improvement Proposal?

A Bitcoin Improvement Proposal (BIP) is an established standard in which people can suggest changes to the Bitcoin protocol. Such a proposed change can be about any aspect, including soft forks, improved recovery phrase formats, the peer-to-peer layer, and so on. Usually, BIPs are made by crypto developers or generally people with advanced computing skills. 

A BIP is created by individuals who believe that they have an idea that could vastly improve the Bitcoin ecosystem. The first-ever BIP – labeled BIP 0001 was made by a person named Amir Taaki. In essence, BIP 0001 was the groundwork for future BIPs – including how they would work and the expected standards. Not every change to the Bitcoin protocol affects it, and not every change requires a BIP.  

How a BIP is Approved or Rejected

Every BIP is initially a draft submitted by one or more individuals. However, before it is a draft, it has usually undergone rounds of discussions on the Bitcoin development mailing list, Bitcoin social forums, etc. 

When the BIP author receives feedback from the community, they can change or improve it based on that feedback. If it’s a major protocol change, it will first have to be implemented as a trial. If community members reach a consensus on the proposal, it proceeds to implementation. The final stage will involve developers implementing the new BIP code and network participants choosing to download it. 

Types of BIPs

BIPs are usually recognized as belonging to three categories. Let’s take a look at each: 

#1. Standards Track BIPs

These are BIPs that seek to improve the Bitcoin protocol, things such as blocks, scaling solutions, verifying transactions, etc. As you can see, standard track BIPs really get to the core of Bitcoin and its underlying infrastructure. Due to this, if the community accepts these types of BIPs they can have a permanent/major impact on the cryptocurrency. However, thanks to Bitcoin being already solid and ‘mainstream,’ it can be tough for a standard track BIP to be implemented and put into motion. 

#2. Information BIP

These types of BIPs are mainly targeted at issues like the design of the protocol and general guidelines. What this means is that information BIPs do not target the heart of Bitcoin and its underlying tech. However, these BIPs are still important and can be helpful to the Bitcoin ecosystem. 

#3. Process BIPs 

As the name suggests, process BIPs are suggestions to the BIP process. In this way, process BIPs are a lot like Standards Track BIPs, except they apply off-chain. In short, process BIPs apply to issues related to bitcoin but not directly involved in the underlying tech and code of Bitcoin. 

Structure of a BIP

If you’d like to submit a BIP, you’re expected to follow a certain structure to do so. The structure consists of the following: 

#1. Preamble

A preamble is the first section of a BIP. Here, the author includes details such as the BIP number, title, metadata of the BIP, and the author’s contact information and identity (s). Info in this section is important because it makes the BIP organized and easier to be shared or looked up. 

#2. Abstract

This is a description of the BIP, and it’s usually 200 words or less. In the abstract, the author distillates the proposal in simple and brief terms. The essence of the abstract is for people to easily understand what your BIP is about and what the core message is. 

#3. Copyright

In this section, the author includes any relevant copyright info for the proposal. This could be publication licenses, and so on. If the author uses license info, they must detail it here and see to it that all legal parameters are adhered to. 

#4. Specification

In this section, the author talks about any new features or ideas proposing to the Bitcoin protocol. Here, readers should have their questions answered about what your idea is and why they should care. Indeed, the specification section is the flesh of your BIP. As such, the author needs to write this section so that it’s easy to understand and be taken seriously. 

#5. Motivation

This is where an author describes why their idea is an improvement to Bitcoin. Here, you need to talk about why the existing solution is not good enough and how your idea can improve it. This doesn’t mean that the majority of the community will be on board. Still, it’s in this section why you make your case for better for worse. Even before you think about coming up with a VIP, ensure your idea is persuasive enough. Otherwise, your BIP may not go anywhere. 

#6. Rationale

This section is in some ways similar to the above section. But instead of talking about why the idea is important, you explain how you reached the decision to create your own BIP. This could be the decisions you made concerning the design, how you pushed through perceived rejections to the proposal, and so on. In short, the rationale section is where you preemptively respond to your critics way before they get a chance to criticize your idea. 

#7. Backward compatibility

In this section, you inform readers whether your BIP is backward compatible. If it’s not, you should provide details about the incompatibilities, including how severe they are and how you plan to deal with them. 

#8. Reference implementation

In this section, the author should provide an example of the idea that other developers could implement in the future. In other words, this is where you demonstrate your idea and showcase it to the community. If you don’t have a completed example, then your idea won’t cut it. After all, people need to see the idea of working in real life and not have to imagine it. This means it’s good to have a reference implementation before you begin working on your BIP.

The Big Picture 

BIPs can be extremely valuable to the Bitcoin ecosystem, especially as Bitcoin continues to rise in value. If positive changes are made to the protocol, it could make the world’s most popular cryptocurrency even stronger. The reverse is true. 

Much of the BIPs submitted so far have been about scaling Bitcoin. Some of them have led to contentious disagreements within the community, leading to contentious hard forks such as Bitcoin Cash and Bitcoin Gold. Others like SegWit2x have been turned down by a majority of the community. However, others, like SegWit and The Lightning Network, saw the green light of the community. Such updates could prove very key for the Bitcoin scaling issue.

Categories
Crypto Market Analysis

Daily Crypto Review, Dec 11 – Bitcoin Fighting for $18,000; Crypto Market in the Red

The majority of the cryptocurrency sector has ended up being in the red as Bitcoin spent most of the day under the $18,000 level. Bitcoin is currently trading for $17,920, representing a decrease of 2.91% compared to our last report. Meanwhile, Ethereum’s price has decreased by 4.30% on the day, while XRP managed to lost 2.85%.

 Daily Crypto Sector Heat Map

Freedom Reserve gained 950.51% in the past 24 hours, making it the most prominent daily crypto gainer by far. It is followed by LBRY Credits’s 336.6% and Seigniorage Shares’ 117.99% gain. On the other hand, Basis Cash lost 87.95%, making it the most prominent daily loser. It is followed by xBTC’s loss of 55.09% and IterationSyndicate’s loss of 44.55%.

Top 10 24-hour Performers (Click to enlarge)

Bottom 10 24-hour Performers (Click to enlarge)

Bitcoin’s market dominance has moved up less than half a percent since we last reported, with its value currently being 62.8%. This value represents a 0.2% difference to the upside compared to the value it had when we last reported.

Daily Crypto Market Cap Chart

The cryptocurrency sector capitalization has decreased in the past 24 hours, with its current value being $528.97 46.31 billion. This represents a $17.34 billion decrease when compared to our previous report.

_______________________________________________________________________

What happened in the past 24 hours?

_______________________________________________________________________

_______________________________________________________________________

Technical analysis

_______________________________________________________________________

Bitcoin

Bitcoin has spent most of the day in a price descent after it failed to break the $18,600 mark. BTC bulls tried to pick the price back up but failed, which has caused another mini-dip, which brought the price as low as $17,721 on Bitstamp. The $17,780 level has proven itself as great support once again, and Bitcoin is now trading in a range between it and $18,190.

Due to the amount of support and resistance levels in a narrow price range Bitcoin currently has, a push towards either side could be a possible safe trade to catch.

BTC/USD 2-hour chart

Bitcoin’s short-term technicals are tilted towards the sell-side but show slight signs of neutrality. Its long-time technicals, however, are completely bullish.

BTC/USD 1-day Technicals

Technical factors (4-hour Chart):
  • Price is below both its 50-period and 21-period EMAs
  • Price is close to its bottom Bollinger band
  • RSI is dipping towards being oversold (36.77)
  • Volume is slightly above the average level
Key levels to the upside          Key levels to the downside

1: $18,190                                 1: $17,780

2: $18,600                                 2: $17,500

3: $18,790                                  3: $17,200

Ethereum

Ethereum has quickly stopped in its tracks towards $600 after hitting a brick wall at $581. The rebound pulled its price back below $565, as well as $545, which it is now fighting for. The fact that Ethereum is in a short-term bear run is confirmed by higher volume candles during price drops than during price spikes.

Our call from yesterday regarding Ethereum’s dip after dropping below $565 turned out as predicted. Traders should pay attention to Bitcoin’s movements and the ascending (red) trend line when trading Etheruem.

ETH/USD 2-hour Chart

Ethereum’s short-term technicals are tilted towards the sell-side but show slight neutral signs. However, its long-time technicals are bullish, with its weekly overview being slightly neutral than its monthly overview.

ETH/USD 1-day Technicals

Technical Factors (4-hour Chart):
  • Price is below both its 50-period and 21-period EMAs
  • Price is slightly above its bottom Bollinger band
  • RSI is dipping towards oversold territory (36.18)
  • Volume is slightly above the average level
Key levels to the upside          Key levels to the downside

1: $565                                     1: $545

2: $581                                      2: $525 

3: $600                                      3: $510

Ripple

XRP followed the rest of the crypto sector and made a price dip, which brought its price to the $0.543 level, which held up quite nicely. Its price is now recovering and consolidating between $0.543 and $0.57, with no signs of potential movement to either side.

XRP traders should pay attention to Bitcoin’s price movement, as most cryptocurrencies follow the general market direction it sets.

XRP/USD 2-hour Chart

XRP’s 4-hour and daily overviews show confusing signs, with some indicators being bullish and some bearish. Its long-term technicals are, however, completely bullish.

XRP/USD 1-day Technicals

Technical factors (4-hour Chart):
  • The price is currently below both its 50-period EMA and its 21-period EMA
  • Price is slightly below its middle Bollinger band
  • RSI is neutral (41.75)
  • Volume is slightly above the average level
Key levels to the upside          Key levels to the downside

1: $0.57                                   1: $0.5435

2: $0.6                                       2: $0.5

3: $0.63                                    3: $0.475

Categories
Crypto Daily Topic Cryptocurrencies

How to Buy Bitcoin with a Credit/Debit Card

Credit/debit cards have enabled us to make instant, convenient, and hassle-free payments since the founding of the Diners Club in the 1950s, and today, this possibility has been extended to the purchase of Bitcoin. Buying Bitcoin with a credit card is among the easiest ways to get yourself some crypto. 

But where can you buy Bitcoin using a credit card? And is it safe? What about transaction costs? We’ll look at these concerns and more in this article.

How You Can Buy BTC with a Credit Card

When it comes to buying BTC with a credit card, there are two main possibilities. 

i) Direct payment – This is the least confusing option. With direct payments, you go to the exchange’s website, make your purchase and use the Visa/MasterCard/AmericanExpress (or just the cards that are available) option. The checkout process will be similar to buying anything else with your credit card. 

ii) Through a payment gateway/ payment service provider – For reasons such as cost savings, bonuses, and offers, you might want to pay through a payment gateway or money transfer service provider such as PayPal and Skrill. If you’re new to buying BTC, or if you’re buying just a few coins, this long route might not make much sense. However, if you are a high-stake investor, you might want to take advantage of any slight margins, although with increased inconvenience.

To buy Bitcoin with your credit card through a payment gateway, you’ll need to load your payment gateway’s account with funds first. Then, when checking out from your exchange, you choose to pay with Skrill/PayPal or whichever method you’re using. 

Best Places to Buy BTC with a Credit Card

Most likely, you will be buying Bitcoin from a crypto exchange like Coinbase, Kraken, or eToro. There are other methods, such as buying from individuals, but we’ll be focusing on exchanges.

That said, the following are among the best exchanges where you can Bitcoin using your credit card. These exchanges have been selected based on ease of use, buying limit, security, and transaction costs. The exchanges are not ranked in any particular order.

#1. Coinmama

Purchases made with credit cards usually have various limits to mitigate fraud. Coinmana offers among the highest purchase limits. The exchange is also available globally, which makes it a convenient option wherever you are. Additionally, the exchange has a reputation when it comes to reliability and trust among its user community.

When buying BTC on Coinmama, you will need to register/ sign in and create a crypto wallet on the platform. Then, when you get to the step of selecting a payment method, you’ll be required to choose from either Visa or MasterCard. Card payments are instant and attract a 5% processing fee. This cost is a bit high compared to going through a payment provider such as Skrill (Skrill charges 2.5% of the transaction value). Nevertheless, the experience is swift.

#2. Coinbase

Coinbase allows you to buy up to $150 or €150 worth of BTC per week. Debit card payments are accepted in all countries where Coinbase operates. However, you cannot buy BTC with a credit card if you reside in the US, Canada, Australia, and anywhere within Europe. 

If you want to buy BTC on Coinbase using your card, you will need to set up your user profile and link your credit/debit card. Later on, when you are actually buying BTC, you will select your already-added card at checkout. Transactions cost 3.99% regardless of the amount, and settlement is instant. The buying experience on Coinbase is also smooth.

#3. Bitpanda

Bitpanda is another reputable exchange where you can buy BTC using your card. First, you will need a Bitpanda account to buy BTC. Once you log in to the account, you can navigate to the ‘Buy’ tab on the menu. Bitpanda allows you to add the payment method during checkout, so you don’t have to link your card in advance. 

After selecting ‘Buy,’ you will see large buttons with the names of some of the major cryptos and other buttons for payment methods. You will need to make the appropriate selections to proceed. If you pay by card, both credit and debit cards are supported, but it must be Visa/MasterCard. Once you have selected your card, the rest of the process is easy to complete. 

Bitpanda offers one of the most secure card payment options. To make a card payment for crypto purchases on this exchange, your card must have 3-D Secure verification enabled. Note that there’s nothing you can do if your card does not support this protocol (other than look for another exchange).

#4. CEX.io

CEX.io is one of the earliest cryptocurrency exchanges to exist. Even so, it has never moved its operations beyond Europe, some countries in South America, and some states in the US. It is still a great place to buy BTC using your card if you are from any of these regions

CEX.io boasts of unmatched security and trust. The exchange is registered in the US as a Money Services Business. In the UK, it is incorporated as a private limited company. CEX.io is also PCI-DSS compliant. PCI-DSS is the global security standard for card payment providers. Due to the company’s focus on security and compliance, user experience is adversely affected. For instance, transaction verifications can take up to 30 minutes. 

Security/ Safety

The security and safety of your credit/debit card are paramount. Generally, buying crypto using cards is not riskier than using your card for your regular shopping. However, it is important to do the basic checks to ensure that you are dealing with legitimate and reputable exchanges. 

When using your credit card to buy Bitcoin, you will inevitably share your details with your exchange. Thus, it is essential to ensure that you’re dealing with a legitimate exchange, and two, the exchange is reputable. If you leave your card details with a shady exchange, how can you be sure that your card details will not be used for fraudulent purchases?

Final Thoughts

Credit/debit cards are a relatively easy and convenient option for paying for your Bitcoin purchases. This payment option is also supported by most major exchanges like Coinbase, Coinmama, and Bitpanda. Additionally, paying for BTC with your card is safe, as long as you’re dealing with reputable exchanges. On the downside, cards have restrictive transaction limits, which may disadvantage large buyers. Also, some exchanges do not accept credit cards from certain countries. Whichever the case, you can always find an option among the many. 

Categories
Crypto Market Analysis

Daily Crypto Review, Dec 10 – Bitcoin Bulls Back in the Game as Sector Recovers From The Dip

The cryptocurrency sector is mostly green as cryptocurrencies took the day to recover from the sudden drop that occurred on Dec 8. Bitcoin is currently trading for $18,411, representing an increase of 1.25% compared to our last report. Meanwhile, Ethereum’s price has increased by 3.37% on the day, while XRP managed to gain 4.66%.

 Daily Crypto Sector Heat Map

WinCash gained 207.65% in the past 24 hours, making it the most prominent daily crypto gainer by far. It is followed by Nyan V2’s 181.02% and Pamp Network’s 172.94% gain. On the other hand, DMme lost 68.63%, making it the most prominent daily loser. It is followed by ALL BEST ICO’s loss of 64.69% and Moonday Finance’s loss of 54.48%.

Top 10 24-hour Performers (Click to enlarge)

Bottom 10 24-hour Performers (Click to enlarge)

Bitcoin’s market dominance has moved to the downside just under half a percent since we last reported, with its value currently being 62.6%. This value represents a 0.4% difference to the downside compared to the value it had when we last reported.

Daily Crypto Market Cap Chart

The cryptocurrency sector capitalization has increased significantly in the past 24 hours, with its current value being $546.31 billion. This represents a $10.23 billion increase when compared to our previous report.

_______________________________________________________________________

What happened in the past 24 hours?

_______________________________________________________________________

_______________________________________________________________________

Technical analysis

_______________________________________________________________________

Bitcoin

Bitcoin has spent the day slowly moving up after a sharp price descent, which brought it to $18,000. After establishing itself above $18,190, Bitcoin even tried to push further up above $18,600 but failed almost instantly, making its price go back to previous levels.

We want to point out (once again) Micheal van de Poppe’s call of a large CME gap looming between $18,275 and $16,995.

Due to the amount of support/resistance levels Bitcoin currently has, any push towards either the upside or downside could be a possible safe trade in the same direction.

BTC/USD 2-hour chart

Bitcoin’s daily, weekly, and monthly technicals are completely tilted towards the buy-side and show no bearish signs. Its 4-hour overview, however, is completely bearish.

BTC/USD 1-day Technicals

Technical factors (4-hour Chart):
  • Price is below both its 50-period and 21-period EMAs
  • Price is between its middle and bottom Bollinger band
  • RSI is has recovered from being oversold (43.38)
  • Volume is slightly above average
Key levels to the upside          Key levels to the downside

1: $18,600                                 1: $18,190

2: $18,790                                 2: $17,780

3: $19,000                                  3: $17,200

Ethereum

Ethereum has not only recovered from its drop to $530, where it hit the ascending (red) trend line but pushed back towards $600. Even though the price is not yet ready to tackle this resistance level, it has made an attempt to break the $581 level but failed and returned to the $565 one.

Ethereum traders should pay attention to whether the cryptocurrency will end up above or below $565, which may be an indicator of its short-term movement. Traders should also pay attention to Bitcoin’s movement whenever taking a trade with Ethereum.

ETH/USD 2-hour Chart

Ethereum’s daily and monthly technicals are completely tilted towards the buy-side and show no signs of bearishness. However, its 4-hour overview is completely bearish, while its weekly overview is bullish but shows slight neutrality as well.

ETH/USD 1-day Technicals

Technical Factors (4-hour Chart):
  • Price is below both its 50-period and 21-period EMAs
  • Price is slightly below its middle Bollinger band
  • RSI has recovered from being in the oversold territory (42.83)
  • Volume is slightly above average
Key levels to the upside          Key levels to the downside

1: $565                                     1: $550

2: $581                                      2: $525 

3: $600                                      3: $510

Ripple

XRP made a sharp (to the upside) price recovery as well, with its price pushing past $0.5435, as well as its $0.57 resistance (now support) levels. The fourth-largest cryptocurrency by market cap even tried to break $0.6 but got shut down swiftly. Its price is now consolidating slightly above $0.57 and showing no signs of potential dips.

XRP traders (finally) have the option to trade this cryptocurrency after several days of close-to-no volatility. Keeping track of Bitcoin’s movements when trading XRP is a must, as any change in Bitcoin’s price could change the outlook of the market as a whole.

XRP/USD 2-hour Chart

XRP’s daily, weekly, as well as monthly technicals, are completely tilted towards the buy-side and show no signs of neutrality or bearishness. Its 4-hour overview, on the other hand, is bearish with slight signs of neutrality.

XRP/USD 1-day Technicals

Technical factors (4-hour Chart):
  • The price is currently slightly below both its 50-period EMA, as well as its 21-period EMA
  • Price is slightly below its middle Bollinger band
  • RSI is neutral and recovered from being oversold (47.26)
  • Volume is slightly above average
Key levels to the upside          Key levels to the downside

1: $0.57                                   1: $0.5435

2: $0.6                                       2: $0.5

3: $0.63                                    3: $0.475

Categories
Crypto Market Analysis

Daily Crypto Review, Dec 09 – Bitcoin Drops to $18,000; Crypto Market Tumbles

The cryptocurrency sector has dropped significantly as bears took over the market. Bitcoin is currently trading for $18,315, representing a decrease of 4.50% compared to our last report. Meanwhile, Ethereum’s price has decreased by 6.17% on the day, while XRP managed to lose 7.73%.

 Daily Crypto Sector Heat Map

ALL BEST ICO gained 19,990.71% in the past 24 hours, making it the most prominent daily crypto gainer by far. It is followed by COIL’s 151.88% and Amun Bitcoin 3x Daily Short’s 112.92% gain. On the other hand, Monavale lost 54.51%, making it the most prominent daily loser. It is followed by KIMCHI.finance’s loss of 52.82% and Iteration Syndicate’s loss of 51.70%.

Top 10 24-hour Performers (Click to enlarge)

Bottom 10 24-hour Performers (Click to enlarge)

Bitcoin’s market dominance has moved to the upside just under half a percent since we last reported, with its value currently being 63%. This value represents a difference of 0.4% to the upside when compared to yesterday’s value.

Daily Crypto Market Cap Chart

The crypto sector capitalization has decreased significantly in the past 24 hours, with its current value being $536.08 billion. This represents a $32.76 billion decrease when compared to our previous report.

_______________________________________________________________________

What happened in the past 24 hours?

_______________________________________________________________________

_______________________________________________________________________

Technical analysis

_______________________________________________________________________

Bitcoin

After spending the past couple of days in a very narrow range, Bitcoin has finally made a move as bears took over the market. The price went down rapidly and reached as low as $18,000 at one point, but then went slightly above this crucial level.

While Bitcoin is safe from breaking $18,000 to the downside at the moment, Micheal van de Poppe pointed out that a large CME gap is looming. The gap ranges from $18,275 to $16,995.

Lastly, the Hash Ribbons indicator has posted a buy signal, giving long-term investors the green light to invest in Bitcoin. This indicator has proven itself one of the best RoI indicators for Bitcoin when it comes to long-term investing.

BTC/USD 4-hour chart

Bitcoin’s long-term technicals (weekly and monthly) are completely tilted towards the buy-side, while its daily overview is still bullish but showing slight signs of neutrality. On the other hand, its 4-hour overview is completely bearish.

BTC/USD 1-day Technicals

Technical factors (4-hour Chart):
  • Price is currently below both its 50-period EMA and its 21-period EMA
  • Price is at its bottom Bollinger band
  • RSI is close to being oversold (31.73)
  • Volume is average
Key levels to the upside          Key levels to the downside

1: $18,600                                 1: $18,190

2: $18,790                                 2: $17,780

3: $19,000                                  3: $17,200

Ethereum

Ethereum wasn’t immune to the downturn either, with its price dropping from the sub-$600 levels all the way down to just above $550. Unlike Bitcoin, however, there are no CME gaps to worry about, and Ethereum seems quite stable above $550.

The only thing to worry about when anticipating Ether’s next price move is Bitcoin’s movement. At the moment, Bitcoin is dictating all consolidations, as well as large moves in either direction.

ETH/USD 4-hour Chart

Ethereum’s monthly overview shows a full tilt towards the buy-side, while its daily and weekly overviews still show some signs of neutrality. On the other hand, its 4-hour overview is bearish but shows slight signs of neutrality.

ETH/USD 1-day Technicals

Technical Factors (4-hour Chart):
  • The price is currently below both its 50-period EMA and its 21-period EMA
  • Price is at its bottom Bollinger band
  • RSI is in the oversold territory (28.61)
  • Volume is above average
Key levels to the upside          Key levels to the downside

1: $565                                     1: $550

2: $582                                     2: $525 

3: $600                                      3: $510

Ripple

The fourth-largest cryptocurrency by market cap moved to the downside as well, with its $0.545 support level holding up as the last-resort support. XRP is currently stable and trading between $0.545 to the downside and $0.571 to the upside, with its price, seemingly creating a double bottom (today and on Dec 5).

XRP traders might want to (still) refrain from trading XRP simply due to the disbalance of the risk and reward, as well as due to its low volatility.

XRP/USD 4-hour Chart

XRP’s longer weekly and monthly time-frames show complete bullishness, while its 4-hour overview is completely bearish. Its daily overview is still bullish but shows some signs of neutrality or even some bearishness.

XRP/USD 1-day Technicals

Technical factors (4-hour Chart):
  • The price is currently below both its 50-period EMA, as well as its 21-period EMA
  • Price is at its bottom Bollinger band
  • RSI is close to being oversold (34.36)
  • Volume is slightly above average
Key levels to the upside          Key levels to the downside

1: $0.571                                   1: $0.545

2: $0.6                                       2: $0.5

3: $0.63                                    3: $0.475

Categories
Crypto Videos

Asset Mangers Being Left Behind By Not Understanding The Fastest Growing Asset Ever… Bitcoin!


Asset Managers Risk Their Careers by Not Understanding Bitcoin

Shapeshift CEO Erik Voorhees has spoken about the future of financial management in the future, stating that every asset manager should, even now, have an understanding of Bitcoin based on its astonishing rate of return.

Voorhees commented on this topic while retweeting data shared by analytics platform Messari co-founder Dan McArdle that shows Bitcoin dramatically outperforming every other asset over the last decade. 


While gold has made a return of 32% and the S&P 500 has tripled its investors’ money, Bitcoin has posted an astonishing 7,837,884% gain in ten years.

Looking at its 10-year life, Voorhees believes that Bitcoin is “vastly superior to any other investment.” He then stated that:

“One could be forgiven for not understanding Bitcoin eight years ago… but any asset manager today who remains even somewhat ignorant of this phenomenon needs to seriously check what they are doing.”

Voorhees is not the only one talking about the recent embrace of Bitcoin by institutions and the rest of traditional finance that is believed to underpin the most recent rally. Just the past week alone, half a dozen experts in the traditional finance sector made similarly bullish observations. On December 2, crypto trading firm Genesis CEO Michael Moro made a prediction that 250 publicly traded companies will put at least some of their funds in Bitcoin by the end of 2021.

On December 4, former JP Morgan commodity trader Danny Masters told CNBC that it would soon be a “career-risk to not have Bitcoin in your portfolio.”

BlackRock CIO Larry Fink also spoke about Bitcoin and warned that Bitcoin’s success could have a substantial impact on the US dollar and that it will even “take the place of gold to a large extent.” 

Of course, every asset has its bulls and bears, and no matter how many pundits back Bitcoin, or how many institutions put their money into it, gold bug Peter Schiff still remains unmoved, stating that Bitcoin and gold have nothing in common and that Bitcoin will never replace gold.

Categories
Crypto Videos

Michael Saylor Comparing Bitcoin To Lebron James? Institutional Investment Skyrocketing!


Bitcoin is like ‘Lebron James’ – MicroStrategy CEO Michael Saylor


In an interview with economist Marc Friedrich, CEO of MicroStrategy, Michael Saylor said that Bitcoin is just not the same asset it was in 2015 or 2017. As Saylor stated, the arguments against Bitcoin that were relevant two or four years ago are simply no longer applicable.

Bitcoin has grown exponentially since its peak in 2017. The growth happened in terms of infrastructure, fundamentals, as well as adoption. In the past year alone, many institutions have started to increasingly see Bitcoin as a store of value and an inflation hedge rather than as a speculative asset.

In 2017, Bitcoin critics said the cryptocurrency was too volatile and that there was a substantial risk of it dropping to zero. Saylor emphasized that these arguments have close to no relevance now because Bitcoin has evolved significantly in recent years.

Saylor said that Lebron James played basketball from ages 8 to 18, but then matured and evolved into one of the all-time greats. He said that Bitcoin went through a very similar period, stating that he thought that it was important to address the fears and anxieties of the crypto and non-crypto community head-on, but that people that still think that Bitcoin might go to zero are still living in the 2015 and 2017 timeframe. He compared Lebron James’ talent, which was, according to him, erratic and volatile in the early stages of his gameplay. But then he grew up and “destroyed everybody and everything in his way.”


One of the major changes Bitcoin has experienced since 2017 is its market structure. Going back to 2017, retail platforms like BitMEX were the dominant players in the derivatives market. Institutional platforms such as the CME have consistently processed volumes that were similar to leading retail-focused exchanges.

However, as of December 4, the CME Bitcoin futures market has an open interest of $1.14 billion, which is considerably higher than Binance Futures, Bybit, Huobi, as well as BitMEX.

On-chain data also shows a considerable increase in institutional interest. According to data coming from IntoTheBlock, the number of transactions valued at over $100,000 has increased twofold in 2020. This is indicative of the growth in institutional activity, the analysts stated. Furthermore, the total volume transferred in these transactions has experienced an even larger growth with 6x increase over the same period.”

Based on various factors, including the fact that the already-significant institutional involvement in the Bitcoin market is only increasing, investors like Saylor remain confident that Bitcoin is evolving into an established store of value.

Categories
Crypto Daily Topic

Who is Satoshi Nakamoto (Creator of Bitcoin)? 

There’s no bigger mystery in the crypto world than the one of Bitcoin’s creator’s true identity. Satoshi Nakamoto is the pseudonym used by Bitcoin’s creator(s). More than 10 years after Bitcoin, Satoshi’s identity remains shrouded in mystery. 

The Bitcoin community is yet even to know if Satoshi is one person or a group of people. What they know is that in 2008, Satoshi published a paper: “Bitcoin: A Peer-to-Peer Electronic Cash System,” that completely changed finance as we know it. 

Nevertheless, that hasn’t stopped an active search for the mysterious figure. Several Satoshi ‘suspects’ have been unveiled, and not without controversy. Let’s look at some of the people widely theorized to be Satoshi. 

#1. Dorian Nakamoto

Dorian Prentice Satoshi Nakamoto is a Japanese-American engineer suspected of being Satoshi by Newsweek writer Leah McGrath Goodman back in 2014. At the time, McGrath published an ‘expose’: “The Face Behind Bitcoin.” McGrath had established that Nakamoto had previously worked as a systems engineer on classified projects for the US government and a computer engineer for financial services companies. 

McGrath said Nakamoto had let slip that he was the founder of Bitcoin. She alleged that during a face-to-face interview with him, he’d said about the currency: “I am no longer involved in that, and I cannot discuss it,” adding, “It’s been turned over to other people. They are in charge of it now. I no longer have any connection.” 

However, when he’d said he’s no longer involved with that, he’d meant his work with classified military projects years ago. Both in The Associated Press and on a Reddit Ask Me Anything, he said that he’d misinterpreted McGrath’s question as being related to that work. 

The “discovery” of Dorian Nakamoto was particularly mired in controversy. The Bitcoin community was not pleased with the “hit-job” type of piece – complete with a picture of his house – that McGrath wrote about him.  

The community also took notice of a message published for the first time in years on Nakamoto’s P2P Foundation site, saying, “I am not Dorian Nakamoto.” 

#2. Adam Back 

Adam Back is the CEO of blockchain company Blockstream. Some sections of the Bitcoin community suspect he’s Satoshi Nakamoto thanks to a YouTube video called “Unmasking Satoshi Nakamoto” Posted by the channel “Barely Sociable.” The video talks about several clues about why Back may be Satoshi Nakamoto. 

One of those reasons is that he was describing the technology underlying Bitcoin as far back as 1998. He also kind of disappeared from the public when Satoshi was actively involved in the project. Barely Sociable also pointed out that both Back and Satoshi use double spacing in their words, and they use British English spelling. The video also mentioned the possibility that Back can always leverage plausible deniability about the claim. After the video was published, Back engaged in a back and forth with Barely Sociable on Twitter. At the time of writing, the YouTube video has 548,592 views on Twitter. 

#3. Wei Dai 

Wei Dai is a computer engineer and cryptographer. He’s the creator of the b-money currency system and a fixture in the digital currency community ecosystem. On August 23, 2008, Satoshi Nakamoto wrote to Dai acknowledging his contribution to Bitcoin:” I was very interested to read your b-money page. I’m getting ready to release a paper that expands on your ideas into a complete working system.” 

Most of the evidence linking Dai to Bitcoin is substantial, though, and there’s no smoking gun evidence to prove that he really is Satoshi. Such evidence is based on the fact that Dai has the ability to create such a project, as well as his intensely private manner that is akin to Satoshi’s.

Also, if Dai were Satoshi, that means he’d have to have been playing a “double agent” role writing to himself and communicating with himself. This is highly unlikely.

#4. Hal Finney 

Hal Finney is an American cryptography pioneer who died of ALS in 2014. In the same year, Forbes journalist Andy Greenberg wrote an article on Hal Finney, highlighting that he was not only Dorian Nakamoto’s neighbor, but also a pioneer in the cypherpunk and cryptography space. Not only that, Finney had been the first-ever recipient of a BTC transaction from Satoshi. 

Greenberg then worked with writing analysis firm Juola & Associates and asked them to compare Finney’s writing with that of Satoshi. Apparently, they found his writing was closer to Satoshi’s than other candidates submitted to Newsweek, Fast Company, and the New Yorker. But they also found Satoshi’s emails to Finney more closely resembled the style in Bitcoin’s original white paper as compared to Finney’s emails. 

Greenberg theorized that Finney could have been a ghostwriter for Nakamoto or has used his neighbor Dorian Nakamoto as cover. Finney denied being Satoshi. After Greenberg met Finney and saw the email exchanges between them and his and Bitcoin’s wallet history, he concluded that he was telling the truth. 

#5. Craig Wright 

Craig Wright is an Australian computer scientist and techpreneur. On Dec 8, 2015, Wired ran an article by Andy Greenberg and Gwern Branwen describing an Australian academician called Craig Stephen Wright who “either invented bitcoin or is a brilliant hoaxer who very badly wants us to believe he did.” 

The same day, Gizmodo published a story featuring documents allegedly obtained by a hacker who breached or “breached” Wright’s email accounts, claiming that Satoshi Nakamoto was a joint pseudonym for Craig Wright and his longtime friend, Dave Kleiman. Kleiman was a computer forensics expert who died in mysterious circumstances in 2013.

Following the article, Wright quickly disappeared from the web for several months only to resurface on May 2, 2016, and declare that he was Bitcoin’s creator. He also wrote an article apologizing for taking the original private approach and a refusal to provide proof of access to one of Bitcoin’s earliest keys. Several publications have rubbished the claims that Wright is Satoshi. He’s also currently embroiled in litigation with Dave Kleiman’s estate. The lawsuit claims Wright defrauded Kleiman of millions of worth of Bitcoin. 

#6. Nick Szabo 

Nick Szabo is a computer scientist, legal and cryptography scholar who’s widely credited for pioneering the concept of smart contracts in the ’90s. In 2008, he developed a decentralized currency – Bit Gold, which he described as “a protocol whereby unforgeable costly bits could be created online with minimal dependence on trusted third parties.” This is in agreement with Bitcoin, in which bits produced by a distributed network of computers worldwide independently verify transactions.

Writer Dominic Frisby floated the idea that Nick Szabo is Satoshi in his book “Bitcoin: The Future of Money?” Frisby talked to a stylometric analyst who apparently concluded that Szabo’s writing style is similar to Satoshi’s. His other ‘proof’ was that both Szabo and Satoshi reference legendary Austrian economist Carl Menger. Frisby also established Szabo had worked for DigiCash, a cryptographic electric money attempt in the early ’90s. According to Frisby, all these clues alluded to Szabo being Satoshi. 

However, Szabo has repeatedly refuted the idea that he’s Satoshi, saying to Frisby in one of their correspondences: “Thanks for letting me know. I’m afraid you got it wrong doxing me a Satoshi, but I’m used to it.” 

Final Thoughts

The fervor behind Bitcoin’s creator is understandable. After all, the currency is not just digital money – it’s a movement – one that has shaken the very core of finance. Some of the people mentioned in the list are known for their pioneering work that helped lay the foundation of Bitcoin. Others have been active in the currency’s development from the beginning, while others appear to ride on the coin’s popularity for whatever ends. But if you think about it, the mystery surrounding Bitcoin is partly behind its wild success and possibly its ‘untouchable’ status. The Bitcoin community and, indeed, the world should be happy that we have Bitcoin and not be so fixated on its creator. 

Categories
Cryptocurrencies

Buying Bitcoin with Skrill: Don’t Try Before Reading This!

Bitcoin is the world’s most popular currency. So it’s not a surprise that most payment platforms worth their salt support the currency. One of these platforms is Skrill, the London-headquartered money transfer company that’s now one of the most popular globally. 

This article looks at how you can purchase Bitcoin via Skrill. We’ll dive briefly into what Skrill is, whether you should consider using it, and the best places to buy BTC with Skrill. 

What is Skrill?

Skrill is an international payment platform through which users can transfer, send, and receive money from across the globe. It sets itself apart from other money transfer companies such as PayPal through low-cost transactions. You can open a Skrill account in any of the 30+ supported currencies. Once you have an account, you can add other currencies if you’d like to receive payments in different currencies. Skrill is widely accepted by merchants worldwide, including cryptocurrency exchanges, which is why you need to know how you can purchase Bitcoin using Skrill. 

Should You Buy Bitcoin with Skrill?

Wondering whether it’s worth buying Bitcoin from Skrill? Apart from being just another option (the more options you have, the better), Skrill can save you some money. Additionally, you can buy Bitcoin directly from your Skrill account with your local Fiat currency. There are many ways you can fund your Skrill account to facilitate a crypto purchase. Skrill also offers convenience and ease of use through its mobile app. Finally, crypto purchases are instant, and your account is credited with the balance within seconds. 

With that, let’s take a look at where and how you can do it so. 

Best Places to Buy Bitcoin with Skrill

#1. Skrill

Skrill itself is one of the best places where you can buy BTC. Buying Bitcoin from Skrill is incredibly easy and straightforward. If you have an account, you will see the option when you log in. The interface is particularly user-friendly – simple, elegant, and minimally designed. 

To buy BTC from your Skrill account, you will need to fund it first. The quickest way to do so is to use your credit card. Whichever card you’re using, funding your account will cost you around 2.5% of the transaction value. Most of the major cards are accepted. 

Apart from Bitcoin, you can also buy other major cryptos on the platform. This is especially important if you’d like to diversify your crypto investment portfolio. As a bonus, you can also sell crypto from within your Skrill account. So buying BTC on Skrill is not only highly convenient, but it’s also option rich. 

#2. Paxful

Paxful is a peer-to-peer (P2P) Bitcoin marketplace launched in 2015. The platform allows you to buy and sell Bitcoin to other users. Like all other P2P marketplaces, users can browse through different seller profiles and select the one that offers the best rates and accepts Skrill payments.

Whether you have an account or not, Paxful allows you to filter sellers by country, accepted payment methods, and so on. When you select a seller, the platform gives you more details regarding the offer and the seller. You can even see the seller’s rate in comparison to the average market rates and determine whether their offer is fair. If your Skrill account is already funded, buying Bitcoin from Paxful is super easy. You will only need to check out with Skrill and complete the easy steps that follow. 

Best of all, Paxful summarizes many options for you, allowing you to quickly and simply purchase Bitcoin. 

#3. Capital.com

Capital.com is a UK-based crypto broker that allows users to buy and sell most of the major cryptocurrencies. Since it’s a broker, you’ll be either buying or selling directly to the company. If you are conscious of the risks of buying crypto from a P2P exchange, Capital.com is a great go-to option. 

#4. eToro

eToro is one of the biggest crypto exchanges, and it supports buying Bitcoin using Skrill. eToro is a social trading platform, which means it allows you to copy-trade. The platform is designed mostly for experienced traders. Nevertheless, its copy trading feature allows novices to take part.

When it comes to buying Bitcoin, eToro is one of the most sophisticated trading platforms. It presents multiple dashboards offering a preview of the most important BTC indicators, real-time prices included. Setting up an account is a little cumbersome as it requires you to provide numerous details. However, once all is set up, the rest of the purchase process is relatively easy. 

#5. Coingate

Coingate is a cryptocurrency payment gateway that allows businesses across the globe to accept Bitcoin. Crypto traders can also buy and sell their digital assets on the platform without making any deposit. When you choose to buy Bitcoin using Skrill, you’ll be able to make an instant payment without the need for registration or verification, as long as you’re verified on the platform. Coingate’s speed and ease of use make it an ideal option for users who want to buy Bitcoin quickly and without hassle. 

Coingate is sometimes criticized for offering poor rates and unsatisfactory customer service. However, user experience on the platform is generally smooth, and you’re unlikely to face challenges buying Bitcoin or paying with your Skrill account. 

#6. Bitpanda

Bitpanda is a world-famous crypto exchange that allows users to buy and sell various digital assets with the convenience of mobile and desktop options. Bitpanda has made buying/selling Bitcoin as easy as ABC. To buy Bitcoin with Skrill on Bitpanda, you need only follow three steps:

  • Create a Bitpanda account or log in if you have an existing one.
  • Verify your identity and fund your Bitpanda wallet. When depositing funds, you will be directed to select the source of funds, where you’ll choose Skrill.
  • Proceed to buy Bitcoin.

The difference between Bitpanda and Coingate is that with Coingate, you have to fund your Coingate account first. However, the whole buying experience is fast and user-friendly. 

Final Thoughts

Skrill is one of the most recognized global money transfer platforms. The platform attracts users with its low-cost money transfer offerings. When it comes to buying Bitcoin with Skrill, users get various options ranging from Skrill itself to the numerous exchanges that accept Skrill payments. If you’re using Skrill on a different platform, you need to evaluate the platform’s ease of use, transaction fees, and available withdrawal options. As for Skrill itself, Bitcoin purchases are simple and instant, which you should take advantage of.

Categories
Crypto Market Analysis

Daily Crypto Review, Dec 08 – BTC, ETH and XRP Preparing for a Big Move; Crypto Sector in Consolidation Mode

The cryptocurrency sector has spent the past 24, mostly consolidating, as it failed to reach past its resistance levels on Monday. Bitcoin is currently trading for $19,180, representing a decrease of 0.65% compared to our last report. Meanwhile, Ethereum’s price has decreased by 1.14% on the day, while XRP managed to lose 1.65%.

 Daily Crypto Sector Heat Map

Prophet gained 358.97% in the past 24 hours, making it the most prominent daily crypto gainer. It is closely followed by Seigniorage Shares’ 344.54% and xBTC’s 340.23% gain. On the other hand, CryptoBet lost 95.85%, making it the most prominent daily loser. It is followed by Semux’s loss of 90.60% and Bitball Nyan v2’s loss of 51.05%.

Top 10 24-hour Performers (Click to enlarge)

Bottom 10 24-hour Performers (Click to enlarge)

Bitcoin’s market dominance has moved to the upside over half a percent since we last reported, with its value currently being 62.6%. This value represents a difference of 0.6% to the upside when compared to yesterday’s value.

Daily Crypto Market Cap Chart

The crypto sector capitalization has increased in the past 24 hours, with its current value being $568.82 51.68 billion. This represents a $17.24 billion increase when compared to our previous report.

_______________________________________________________________________

What happened in the past 24 hours?

_______________________________________________________________________

_______________________________________________________________________

Technical analysis

_______________________________________________________________________

Bitcoin

Bitcoin has continued with its slow movement as another low volatility day passed. The largest cryptocurrency by market cap oscillated between $18,905 and $19,431. The one time it dropped under the $19,000 mark, it found support in the 50-period moving average, which has proven to be a strong (both support and resistance) level.

Due to the low volatility, traders can’t really do much at the moment. However, they can prepare for the next move Bitcoin makes.

Lastly, the Hash Ribbons (one of the best accumulation indicators) indicator has posted a buy signal, giving long-term investors the green light.

BTC/USD 4-hour chart

Bitcoin’s technicals on both short and long time-frames are bullish, with its weekly time-frame showing full tilt to the buy-side and its 4-hour, daily, and monthly time-frames tilting more towards neutrality.

BTC/USD 1-day Technicals

Technical factors (4-hour Chart):
  • Price is slightly above its 50-period EMA while being at its 21-period EMA
  • Price is at its middle Bollinger band
  • RSI is neutral (51.61)
  • Volume is slightly below average
Key levels to the upside          Key levels to the downside

1: $19,500                                 1: $19,000

2: $19,666                                 2: $18,790

3: $20,000                                  3: $18,600

Ethereum

Ethereum has, just like Bitcoin, had quite a slow day, with its price moving slightly down. At the moment, the second-largest cryptocurrency by market cap doesn’t seem like it will tackle $600, as its volume is too low to pressure this major resistance level. However, if and when a bull run past $600 happens, traders will have a great opportunity to catch a safe trade with a stop-loss slightly below $600 and a possible target of $620 or $630.

ETH/USD 4-hour Chart

Ethereum’s monthly overview shows a full tilt towards the buy-side, while its daily and weekly overviews show some signs of neutrality. On the other hand, its 4-hour overview is completely bearish.

ETH/USD 1-day Technicals

Technical Factors (4-hour Chart):
  • The price is slightly above its 50-period EMA while being slightly below its 21-period EMA
  • Price is at its middle Bollinger band
  • RSI is neutral (48.32)
  • Volume is below average
Key levels to the upside          Key levels to the downside

1: $620                                     1: $600

2: $630                                     2: $530 

3: $735                                      3: $510

Ripple

The fourth-largest cryptocurrency by market cap has close to no volatility, as well as very low volume on most exchanges. With the price movement being non-existent, there is not much to say about the current XRP trading. However, whenever the trading range is getting this narrow, a breakout is on the horizon.

XRP has created a flag formation on the 1-day chart, signaling that an increase in volume could bring a breakout to the upside and a possible spike of up to 60%, which would take the coin’s price above $1,00.


XRP/USD 4-hour Chart

XRP’s longer time-frames (weekly and monthly) show complete bullishness, while its 4-hour and daily overviews show some signs of neutrality or even bearishness.

XRP/USD 1-day Technicals

Technical factors (4-hour Chart):
  • The price is at its 50-period EMA, as well as at its 21-period EMA
  • Price is at its middle Bollinger band
  • RSI is neutral (50.46)
  • Volume is well below average
Key levels to the upside          Key levels to the downside

1: $0.666                                   1: $0.6

2: $0.78                                     2: $0.596

3: $0.79                                   3: $0.535

Categories
Crypto Market Analysis

Daily Crypto Review, Dec 07 – ETHE and GBTC Grayscale Funds Reach All-Time High Average Daily Volumes in November

The cryptocurrency sector has spent the weekend recovering from the price descent on Dec 3 and 4. Bitcoin is currently trading for $19,288, representing an increase of 0.16% compared to our last report. Meanwhile, Ethereum’s price has decreased by 1.49% on the day, while XRP managed to lose 0.74%.

 Daily Crypto Sector Heat Map

Omnitude gained 241.76% in the past 24 hours, making it the most prominent daily crypto gainer. It is closely followed by KIMCHI.finance’s 185% and Badger DAO’s 123.92% gain. On the other hand, DAV Coin lost 71.6%, making it the most prominent daily loser. It is followed by Semux’s loss of 66.12% and Bitball Treasure’s loss of 65.05%.

Top 10 24-hour Performers (Click to enlarge)

Bottom 10 24-hour Performers (Click to enlarge)

Bitcoin’s market dominance has barely moved to the downside since we last reported, with its value currently being 62.1%. This value represents a difference of 0.3% to the downside when compared to Friday’s value.

Daily Crypto Market Cap Chart

The crypto sector capitalization has decreased over the weekend. Its current value is $551.68 billion, representing an $18.83 billion decrease when compared to our previous report.

_______________________________________________________________________

What happened in the past 24 hours?

_______________________________________________________________________

_______________________________________________________________________

Technical analysis

_______________________________________________________________________

Bitcoin

Bitcoin has spent the weekend trying to recover from the downturn it had on Dec 3 and 4. The largest cryptocurrency by market cap has formed a triangle formation that is respected throughout the weekend and then broke it to the upside. While the move was short-lived, the overall short-term bullishness has increased.

Some traders see a bull flag instead of the triangle formation, which makes the possibly future even more bullish. Posting any short trades would most likely be more risky than profitable at the moment.

It is also important to note that the Has Ribbons (one of the best accumulation indicators) indicator has posted a buy signal.

BTC/USD 4-hour chart

Bitcoin’s technicals on all time-frames are bullish, with 4-hour and weekly time-frames showing full tilt to the buy-side and daily and monthly time-frames tilting more towards neutrality.

BTC/USD 1-day Technicals

Technical factors (4-hour Chart):
  • Price is above its 50-period EMA and slightly above its 21-period EMA
  • Price is slightly above its middle Bollinger band
  • RSI is neutral (54.36)
  • Volume is below average
Key levels to the upside          Key levels to the downside

1: $19,500                                 1: $19,000

2: $19,666                                 2: $18,790

3: $20,000                                 3: $18,500

Ethereum

Ethereum has spent the weekend slowly pushing towards the upside, reaching just under $600 and bouncing off the resistance level. Its current failure to break $600 is not a big red flag, as Ethereum’s large moves are (lately) mostly caused by Bitcoin’s movement.

Ethereum traders have a great opportunity to catch a safe trade if ETH/USD breaks $600. A stop-loss slightly below $600 and a possible target of $620 or $630 would make quite a viable trade.

ETH/USD 4-hour Chart

Ethereum’s 4-hour, weekly, and monthly overviews show a full tilt towards the buy-side, while its daily overview shows some signs of neutrality.

ETH/USD 1-day Technicals

Technical Factors (4-hour Chart):
  • The price is slightly above its 50-period and at its 21-period EMA
  • Price is at its middle Bollinger band
  • RSI is neutral (50.51)
  • Volume is slightly below average
Key levels to the upside          Key levels to the downside

1: $620                                     1: $600

2: $630                                     2: $510 

3: $735                                      3: $500

Ripple

The fourth-largest cryptocurrency by market cap experienced slightly more volatility over the weekend than during the previous week, with its price hovering between $0.542 and $0.626. The $0.6 level is currently holding quite well as a support line, and XRP shows no signs of dropping below it unless some external factor surfaces.

Trading XRP is, even with the slight increase in volatility, a near-impossible feat at the moment. Trading other (more volatile) cryptocurrencies could be a much better option.

XRP/USD 4-hour Chart

XRP’s 4-hour, weekly, and monthly overviews show complete bullishness, while its daily overview shows some signs of neutrality.

XRP/USD 1-day Technicals

Technical factors (4-hour Chart):
  • The price is at both its 50-period EMA and its 21-period EMA
  • Price is at its middle Bollinger band
  • RSI is neutral (53.49)
  • Volume is slightly below average
Key levels to the upside          Key levels to the downside

1: $0.666                                   1: $0.6

2: $0.78                                     2: $0.596

3: $0.79                                   3: $0.535

Categories
Crypto Videos

How To Spot Bitcoin Bull & Bear Cycles Beginners Edition!


Bitcoin Bull and Bear cycles – Beginners Edition


Animals Bear Fighting With Bull

Since its launch over a decade ago, Bitcoin has seen a number of bull and bear cycles, with each one of them being greater than the last. However, many have tried to find an answer to the main question: What drives these cycles? Co-founder of Decred Jake Yocom-Piatt has claimed that the answer certainly lies within the human brain.

“Bitcoin’s bull and bear cycles are both functions of generic human psychology, attention spans, as well as its deterministic and diminishing issuance,” Yocom-Piatt stated.

Over the years, numerous parties have tried to find the reason behind and argue different cases for Bitcoin’s cycles, including PlanB’s infamous stock-to-flow model, which projects Bitcoin prices in the future based on its programmed halving events that happen every four years.

One major characteristic that sets Bitcoin apart from every other asset is its deflationary nature. It is programmed to have a finite supply, and that, combined with the ease of movement it provides, allows for borderless value storage better than any asset before.

Then, one might wonder whether the programmed supply that Bitcoin possesses dictates its price cycles on some level. This refers to its mining reward being cut in half every four years, essentially decreasing the amount of new Bitcoin put out on the market each time a block is mined. Its 21 million coins supply cap may also factor into this equation.

“Bitcoin’s rate of supply is constantly shrinking as a percentage of the circulation, with the addition of a massive supply shock every halvening,” explained Yocom-Piatt.

“Bull runs occur when the demand begins to outstrip the supply, driving up the price, which then gets the attention of myopic investors. After some time passes, these myopic investors’ attention span for a bull market fades away, and we revert back to a bear market. With each bull cycle, the overall awareness of Bitcoin grows, further sowing the seeds for the next bull cycle.”

Bitcoin recently approached its 2017 all-time high of $20,000, receiving a big chunk of mainstream media coverage during the time of the push towards the upside.

Categories
Crypto Market Analysis

BTC/USD Weekly Chart Analysis + Possible Outcomes

In this weekly BTC/USD analysis, we will be taking an in-depth look at the most recent technical formations, as well as look for the possible short-term price outcomes.

Overview

Bitcoin has spent the past week recovering levels it lost in a Nov 25 crash and even managed to push to a new all-time high on some exchanges. Still, the end-goal of Bitcoin above $20,000 was not reached.

Bitcoin’s institutional activity is more than booming, with news coming out left and right about companies investing in crypto, financial institutions preparing to embrace Bitcoin as an asset class, as well as regulators allowing Bitcoin to be held in employees’ company-funded 401k plans. On the other hand, Not being able to push past the $20,000 resistance level due to an incredible amount of sell orders near it has brought Bitcoin bears another day of hoping that the price will go lower.

Technical factors


Bitcoin has continued moving up until reaching an all-time high on some exchanges and then creating a doji candle followed by an inverted hammer candle on a weekly time-frame, indicating a possible bearish outlook as Bitcoin has most likely reached its short-term top. Looking at the shorter time-frames, such as the 4-hour one, we can see that Bitcoin has formed either a triangle formation or (if we include the movement from that started on Nov 27) a bull flag, which goes against the previously mentioned bearish outlook. Any break from the channel Bitcoin is trading in at the moment could mean a strong move towards that side.

The hash ribbons indicator flashed a BUY signal, which is an incredibly important update for long-term investors, as this indicator was the most consistent investment tool when it comes to RoI.

Likely Outcomes

Bitcoin’s sending out mixed signals on different time-frames, indicating indecisiveness from the retail sector. On the other hand, companies and institutions show incredibly bullishness as they are buying up Bitcoin over-the-counter. While a move to the downside is quite possible at the moment, the overall current trend is bullish, and short-selling could possibly harm traders’ portfolios more than they can improve it.

1: If Bitcoin fails to establish itself above $19,100 and breaks the range to the downside (slightly less likely), its most likely target will be $18,450. Due to a large number of buy orders in the zone between $18,190 and $18,450, this is the most likely place for reaccumulation and a push towards the upside after a pullback.

2: If Bitcoin manages to push towards the upside, first breaking $19,100 and then the descending black line (top line of the triangle formation), we can expect the price to attempt another push above $20,000, with the possibility of breaking it this time. If Bitcoin proves to be in a bull flag formation rather than a triangle formation, the profit target stays the same ($19,666 with possibly taking some profits along the way).

Entering any trade with having a target of above $20,000 is quite risky, and it would be better to play it safe and end the trade pre-$20,000 and then re-enter it if the price confidently moves up. The same goes for entering a short trade with sub-$18,450 in mind.

Categories
Crypto Daily Topic

What Really Is Selfish Mining: Will Bitcoin Survive This?

Mining is the process through which new Bitcoin blocks are generated. Individual nodes on the Bitcoin network race against time in a series of guesses for the right block. Due to the large size of the network and transaction load, this process is resource-intensive – it requires sophisticated computing equipment and consumes massive amounts of power. 

Selfish mining is when a miner withholds newly generated blocks then releases them to the public ledger when they have formed the longest chain. Other legitimate miners may join the selfish miner on their private network due to the possibility of higher returns. The practice is neither illegal nor disallowed, but selfish mining undermines Satoshi’s vision of decentralized production and distribution of money. 

How Selfish Mining Works

Mining involves solving complex cryptographic puzzles, which are guesses. Depending on the difficulty of the puzzle being solved, and the associated power costs, the reward you can earn from this process can vary greatly. As such, even if miners combine effort, the overall output for each miner is proportional to the individual effort invested. 

This was the case until researchers Ittay Eyal and Emin Gun Sirer discovered that miners could actually cheat the system by hiding the newly-generated blocks from the public blockchain. Transactions will still be verified, and new BTC generated because the newly-generated blocks are made available on the selfish miners’ private networks. By withholding the new blocks from the public blockchain, such miners circumvent the infrastructure restrictions that make mining resource-intensive and speed up the discovery process. 

Whatever makes selfish mining possible is a vulnerability on the Bitcoin network that uses the longest chain rule to indicate which chain to follow. Usually, the correct chain to follow is the one with the highest number of new blocks – in other words, the one with the highest proof of work. Since it is possible to withhold a block and release it after accruing several of them, one can always wait until they have several blocks then release them to the public blockchain. This will result in other miners following that chain and surrendering their earnings to the owner of this chain. 

How It Impacts Bitcoin’s Integrity

Undoubtedly, selfish mining poses a threat to Bitcoin’s integrity. Cryptocurrencies sell on the premise that they are decentralized and tamper-proof. Thus, the idea that a group of people can collude to subvert the system’s mechanics raises concern. 

Of particular concern is how selfish mining increases the possibility of a 51% attack. Over time, selfish miners can create mining pools with an ever-growing hash rate. As more parties join the pools, their chances of acquiring majority power increases. Eventually, this may allow them to block other miners, reverse transactions, exclude transactions, and so on. However, considering how large the Bitcoin network is, there is only a low likelihood that a mining syndicate will gather enough resources to take most of the power. Additionally, Bitcoin enthusiasts believe that the motivation for selfish mining is lower than the rewards. If other parties decide to join selfish miners in their pools, they might eventually be unable to recover the investment they made in their mining operation.

The practice of selfish mining is also wasteful in that miners spend serious resources trying to find a block that another miner is withholding. Thus, it is only economical for all miners to just play by the rules. In short, this is neither a sustainable nor responsible way to generate earnings on the Bitcoin network. 

How Selfish Mining Undermines the Decentralization Philosophy 

Decentralization is at the heart of Bitcoin’s philosophy. Satoshi envisioned that no person or group of people would have the authority to control the production or distribution of coins on the network. 

When a selfish miner generates a new block, their chain will be shorter than the public blockchain. However, if they keep hoarding blocks, their chain might eventually become longer than the one on the public blockchain. Naturally, honest miners will be inclined to join the private chain to earn more because the private network has a better chance to realize new blocks faster. If the selfish miner keeps ‘recruiting’ rational miners to their pool, they could eventually control the majority of the public blockchain. In essence, they will have all the power to generate and distribute Bitcoin. 

Is It Anything New?

Selfish mining is not entirely new, and for that reason, it should be particularly worrying to Bitcoin users. At the moment, two-thirds of all Bitcoin generated is mined in China, which is not a result of selfish mining. It just happens that it is easier to access ASICs in the country, plus electricity is way cheaper there than in other mining locations. As such, concerns have been raised about whether China has had a mining monopoly of sorts. Whatever the case, there is no indication that Chinese miners are working as a single enterprise. 

Are There Consequences?

If only a few miners adopt selfish mining, the overall impact on the blockchain network will be negligible. On the other hand, if all miners, hypothetically, take up selfish mining, their efforts will cancel out. Renowned economists have reiterated that it seems to make sense, while theoretically, the practice is not economically viable. Paul Sztorc, a popular economist, thinks that selfish miners will lose motivation upon realizing they are only backstabbing each other. In conclusion, selfish mining does not have enough economic motivation to become a widespread practice. 

Also, this activity may adversely impact Bitcoin’s reputation, which may cause its price to drop. Consequently, selfish miners will earn more Bitcoins but ones that are devalued. 

What’s the Future of Selfish Mining?

Selfish mining is likely to remain in theory or limited practice due to the reasons we’ve mentioned earlier. As we have seen, the major challenge with this practice is that if it becomes widespread, it will turn into a dirty game as selfish miners will be competing in hoarding new blocks. While this decreases the economic motivation, it might not exactly protect the Bitcoin network from the inefficiencies created. 

So, what would be a better solution? A research paper has proposed a scheme for penalizing nodes that withhold new blocks. The proposal ensures that miners who generate new blocks and fail to publish them on the blockchain have their mining rewards reduced. This would be an ideal penalty for selfish miners, but it appears as if the practice is not a huge threat currently.

Final Thoughts 

Selfish mining can allow mining syndicates to increase their revenue by always creating the longest chain and attracting other miners to their pools. While the threat is realistic, the likelihood of widespread selfish mining is diminished. The practice is wasteful, and if it becomes widespread, all miners lose their rewards. As we wait to see if indeed the threat will ever become substantial, Bitcoin users can rest easy knowing that Satoshi’s vision of decentralized production and distribution of money lives on. 

Categories
Crypto Market Analysis

Daily Crypto Review, Dec 4 – Bitcoin Above $19,000; Ether Fighting for $600

The cryptocurrency sector has spent the day trying to regain its recent highs, with Ethereum breaking $600 and Bitcoin breaking $19,000. Bitcoin is currently trading for $19,314, representing an increase of 1.14% compared to our last report. Meanwhile, Ethereum’s price has increased by 2.15% on the day, while XRP managed to lose 0.52%.

 Daily Crypto Sector Heat Map

The past 24 hours have passed without any major winners or losers in the top100 cryptos. Ren gained 5.23% in the past 24 hours, making it the most prominent daily gainer in the top100. It is closely followed by Band Protocol’s 4.44% and VeChain’s 4.08% gain. On the other hand, Decentraland lost 4.98%, making it the most prominent daily loser. It is followed by Uniswap’s loss of 4.79% and Kyber Network’s loss of 4.49%.

Top 10 24-hour Performers (Click to enlarge)

Bottom 10 24-hour Performers (Click to enlarge)

Bitcoin’s market dominance has barely changed since we last reported, with its value currently being 62.4%. This value represents a difference of 0.1% to the upside when compared to yesterday’s value.

Daily Crypto Market Cap Chart

The crypto sector capitalization has decreased just slightly in the past 24 hours. Its current value is $570.51 billion, representing a $0.54 billion decrease compared to our previous report.

_______________________________________________________________________

What happened in the past 24 hours?

_______________________________________________________________________

_______________________________________________________________________

Technical analysis

_______________________________________________________________________

Bitcoin

Bitcoin has spent the day trying to break its immediate resistance (which is sitting at $19,490). However, all attempts throughout the day have been unsuccessful, which prompted Bitcoin to pull back slightly. However, the largest cryptocurrency by market cap has established its presence above $19,000 with confidence once again.

Bitcoin is quite unpredictable at the moment, making safe trades hard to find. Traders should pay attention to BTC volume and enter trades with a high profit/loss ratio to quickly mitigate the risk of things turning from good to bad.

BTC/USD 1-hour chart

Bitcoin’s technicals on all time-frames are bullish, but they all show some signs of neutrality (or even bearishness) alongside the overall bullishness.

BTC/USD 1-day Technicals

Technical factors (4-hour Chart):
  • Price is currently above its 50-period EMA and slightly above its 21-period EMA
  • Price is at its middle Bollinger band
  • RSI is neutral (56.72)
  • Volume is average
Key levels to the upside          Key levels to the downside

1: $19,500                                 1: $19,000

2: $19,666                                 2: $18,790

3: $20,000                                 3: $18,500

Ethereum

Ethereum has spent the day following Bitcoin’s movement, with its price first pushing towards the upside and then pulling back as it was unable to break a certain level (in this case, $620. On the other hand, the second-largest cryptocurrency by market cap has seemingly established its presence above $600, though not with nearly as much conviction as Bitcoin did.

If Ethereum traders followed our advice from yesterday’s analysis, they would have made quite a good profit by longing Ether after it broke $600, with a stop-loss set slightly below this level. While trading Ethereum is still quite possible, the current high correlation with Bitcoin’s movement makes Bitcoin a (possibly) better option to trade, simply due to fewer variables a trader would have to consider.

ETH/USD 1-hour Chart

Ethereum’s daily and monthly overviews are completely bullish, while its 4-hour and weekly time-frames show some form of neutrality next to the overall bullishness.

ETH/USD 1-day Technicals

Technical Factors (4-hour Chart):
  • The price is currently above its 50-period and slightly above its 21-period EMA
  • Price is at its middle Bollinger band
  • RSI is neutral (57.22)
  • Volume is average
Key levels to the upside          Key levels to the downside

1: $620                                     1: $600

2: $630                                     2: $510 

3: $735                                      3: $500

Ripple

The fourth-largest cryptocurrency by market cap has had another extremely slow day, with its price barely fluctuating at all. The low volume and low volatility are continuing throughout the week, with XRP just barely moving to the downside as a response to the minor pullback caused by Bitcoin’s movement.

Trading XRP is a near-impossible feat at the moment, as the cryptocurrency currently shows no volatility and (therefore) no trade opportunities.

XRP/USD 2-hour Chart

XRP’s daily and monthly overviews are completely bullish, while its weekly time-frames show bullish sentiment with a hint of neutrality. Its 4-hour overview, however, is completely bearish.

XRP/USD 1-day Technicals

Technical factors (4-hour Chart):
  • The price is (at the moment of writing) slightly above its 50-period EMA and slightly below its 21-period EMA
  • Price is slightly below its middle Bollinger band
  • RSI is neutral (48.53)
  • Volume is slightly below average
Key levels to the upside          Key levels to the downside

1: $0.666                                   1: $0.6

2: $0.78                                     2: $0.596

3: $0.79                                   3: $0.535

Categories
Cryptocurrencies

Bitcoin or Ethereum in 2021, Where Should You Invest?

Bitcoin started the year (2020) on a rather low key, fetching only an average of $7,500 until July when things started looking up. Ethereum seemed to play the same tune for the first half of the year. Unsurprisingly, both cryptocurrencies showed steady growth against the dollar from July onwards. This trend can be confusing to investors – should you invest in Bitcoin or Ethereum in the coming year? In this article, we help clear the confusion by addressing each currency’s nature, its performance in 2020, and its prospects in the coming year. 

Are We Comparing Apples to Oranges?

Seasoned investors will be quick to note that Bitcoin versus Ethereum is an odd comparison, and they’d be right. Bitcoin is inherently a currency and not much more. On the other hand, Ethereum has DApps, smart contracts, tracking of digital collectibles, and many other uses. So, on a broader scale, comparing Bitcoin and Ethereum might not make sense. 

However, Ethereum has ETH, which is pretty much tradable like BTC. You can invest in ETH just as you would do with BTC. So, we can go ahead and compare BTC and ETH as investment alternatives.

Bitcoin versus Ethereum Price Trend 

Bitcoin usually sets price trends for all other cryptocurrencies, and any instabilities faced by the network sends ripples across the entire cryptocurrency universe. The performance of both Bitcoin and Ethereum followed a similar trajectory in most of 2020. In the first half of the year, Bitcoin seemed to struggle, and so did Ethereum. Both hit their all-time lows around March, but a keen analysis of the price history reveals that Ethereum was always trailing

This is an advantage if you are planning to invest in Ethereum since you have a better chance of predicting how things might turn out in the short run. If the 2020 Bitcoin-Ethereum price trend spills over to 2021, you can assume that ETH price fluctuations will follow Bitcoin in about 7 days. For instance, if you plan to buy ETH, wait for BTC to drop consistently for about 7 days and then jump in. Of course, do not religiously rely on this trend as other forces might come to play and disrupt the pattern.  

Adoption and Ease of Use

A cryptocurrency’s appeal and ease of adoption can give it some edge when it comes to investment. When there are plans to adopt a cryptocurrency for some industry use, its price usually hikes. For instance, in October, PayPal announced that it would start allowing Bitcoin spending on its network from early 2021. The plan is to incorporate most of the major cryptos ultimately. Still, the company mentioned that it would start with Bitcoin, which was good news for Bitcoin investors more than any other crypto investors. There had been rumors about this announcement from the beginning of October, and Bitcoin’s prices were already going up as the month began. Bitcoin was exchanging at the time of writing at almost $14,000 – the highest in 30 months. 

Visa and MasterCard had already introduced crypto credit and debit cards. They are currently seeking to extend the availability of these cards to Europe and states in the US that have yet to be covered. Cryptocurrencies are increasingly integrating into the mainstream economy, and we are likely to see an increase in such activities in 2021. Given that Bitcoin’s ease of adoption gives it an advantage over other cryptos, it might be a better choice. 

Consider the Impacts of the US Elections

US elections usually seem to shake the global economy. During Trump’s first presidential contest, there was widespread uncertainty over economic and political outcomes. Speculation that he could win led to a weakening of the dollar relative to the four major currency pairs. Bitcoin’s prices rose slightly at the same time – indicating that the two events could have been related. Generally, if there is political uncertainty, the dollar may weaken and cause reduced stock markets’ activity. In such cases, investors may turn to crypto trading.

If the elections sail smoothly, we can expect minimal disturbance to the stock markets. However, if political turmoil follows the elections, there is a chance investors will shy away from the stock markets, and, conversely, activity in the crypto space may increase. Naturally, Bitcoin would take the lead as others follow. 

Bitcoin’s Prospects in 2021

Since the start of Bitcoin’s bear market in 2018, the currency has struggled to surpass the symbolic $10,000 mark, which can be considered its 30-months resistance threshold, only hitting the high twice but briefly. However, since July 2020, Bitcoin seemed to have overcome the resistance, maintaining a minimum of $10K and having peaked at $13,950 in November. Between October 17th and 27th of the same month, Bitcoin leaped a whopping $2,000! All these arguments indicate that the currency is strongly poised for the bull market in the coming months.

Overall, things are looking up for Bitcoin. The upcoming PayPal integration and adoption by Visa and MasterCard are also expected to give it a major boost. Nevertheless, if you’re considering investing in Bitcoin now or in early 2021, bear in mind that a resistance/support flip at $14,000 is conceivable. Therefore, you may want to hold on until you observe downward movement within the $14,000-$12,500 range. 

Ethereum’s Prospects in 2021

Ethereum has exhibited a lot of uncertainty in 2020. For instance, between March 6th and March 12, the currency dropped from $243 to $112 – losing more than half of its value in less than a week. However, it showed steady growth between April and July before making a sudden upward move to $380 in August. Since then, it has appeared to be oscillating between resistance at $380 and support at $320. Of course, there have been sudden but brief spikes and falls in between, but this resistance/support pair gives a general idea of how the currency has been performing in the last quarter of 2020. 

There are numerous Ethereum projects that are currently going on, and others scheduled for early next year. Most of these ventures are decentralized applications (DApp) projects. However, none of them seem to have the potential to disrupt the crypto economy substantially. This could be partly because Ethereum has a rather low rate of adoption. Based on these observations, we are unlikely to see the currency make a bullish run. Even so, slow and steady growth in 2021 is very much conceivable. 

Judging from its performance in the last half of 2020, it would be safe to assume that Ethereum will be a low-risk-low-return investment, at least for the better part of 2021. 

Final Thoughts

Both Bitcoin and Ethereum offer exciting investment opportunities. Each has a unique profile that makes it suitable for different investor needs. Both currencies have also shown relative stability and growth in the last half of 2020. However, the high volume of activity involving Bitcoin indicates a higher likelihood of the currency shooting even higher in 2021. On the other hand, Ethereum seems to be poised for slow but steady growth in the next few months. All in all, it seems like a good time to consider investing in either. Just ensure you set your investment goals and check that they are aligned with the currency’s growth trends. 

Categories
Crypto Market Analysis

Daily Crypto Review, Dec 3 – PayPal and BlackRock Heads Extremely Bullish on Bitcoin; Crypto Sector Consolidating

The cryptocurrency sector has spent the day stabilizing after a sudden drop. Bitcoin is currently trading for $18,997, representing an increase of 0.48% compared to our last report. Meanwhile, Ethereum’s price decreased 0.64% on the day, while XRP managed to lost 0.01%.

 Daily Crypto Sector Heat Map

Decred gained 39.22% in the past 24 hours, making it the most prominent daily gainer in the top100. It is closely followed by Elrond’s 30.56% and Curve DAO Token’s 10.36% gain. On the other hand, Nexo lost 5.60%, making it the most prominent daily loser. It is followed by Status’s loss of 2.72% and Augur’s loss of 1.66%.

Top 10 24-hour Performers (Click to enlarge)

Bottom 10 24-hour Performers (Click to enlarge)

Bitcoin’s market dominance hasn’t changed since we last reported, with its value currently staying at 62.3%. This value represents a 0% difference when compared to yesterday’s value.

Daily Crypto Market Cap Chart

The crypto sector capitalization has increased significantly in the past 24 hours. Its current value is $571.05 billion, representing a $10.27 billion increase compared to our previous report.

_______________________________________________________________________

What happened in the past 24 hours?

_______________________________________________________________________

_______________________________________________________________________

Technical analysis

_______________________________________________________________________

Bitcoin

Bitcoin has spent the day recovering from yesterday’s pullback and trying to regain $19,000. However, this level has proven to be a solid resistance zone, and it is unsure whether Bitcoin will manage to push over it. On the other hand, the overall sentiment around the largest cryptocurrency by market cap is incredibly bullish, mostly due to the massive investments coming from the institutional side.

Bitcoin is very volatile and unpredictable at the moment, making the trades quite hard to pull off. Traders should pay attention to volume and watch smaller time-frames and enter trades with a high profit/loss ratio to mitigate the risk when things go bad.

BTC/USD 4-hour chart

Bitcoin’s short-term technicals are completely bullish, while its weekly and monthly technicals show some signs of neutrality alongside the overall bullishness.

BTC/USD 1-day Technicals

Technical factors (4-hour Chart):
  • Price is above its 50-period EMA and slightly above its 21-period EMA
  • Price is at its middle Bollinger band
  • RSI is neutral (54.55)
  • Volume is average
Key levels to the upside          Key levels to the downside

1: $19,000                                 1: $18,790

2: $19,500                                 2: $18,500

3: $19,666                                  3: $18,240

Ethereum

Ethereum has spent the day mostly flat and hovering right under the $600 mark. The second-largest cryptocurrency by market cap has continuously failed to break the immediate resistance level but did not back down from it.

Ethereum traders have a good chance of catching a safe trade with a stop-loss slightly below $600 if Ether pushes above $600 (either because of its own price movement or as a response to Bitcoin breaking $19,000 with conviction).

ETH/USD 4-hour Chart

Ethereum’s daily and monthly technicals are completely bullish, while its 4-hour and weekly time-frames show some neutrality next to the overall bullishness.

ETH/USD 1-day Technicals

Technical Factors (4-hour Chart):
  • The price is above its 50-period and at its 21-period EMA
  • Price is at its middle Bollinger band
  • RSI is neutral (54.35)
  • Volume is average
Key levels to the upside          Key levels to the downside

1: $600                                     1: $510

2: $630                                     2: $500 

3: $735                                      3: $490

Ripple

The fourth-largest cryptocurrency by market cap has had another slow day, with its price fluctuating between $0.6 and $0.64. The $0.6 support level seems to be holding quite well, while the $0.625 level got ignored several times, which made us remove it from the key levels section.

Trading XRP is almost impossible as the cryptocurrency currently has no volatility and (therefore) no trade opportunities.

XRP/USD 4-hour Chart

XRP’s daily and monthly technicals are completely bullish, while its 4-hour and weekly time-frames’ show bullish sentiment with a hint of neutrality.

XRP/USD 1-day Technicals

Technical factors (4-hour Chart):
  • The price is slightly above its 50-period EMA and at its 21-period EMA
  • Price is at its middle Bollinger band
  • RSI is neutral (51.08)
  • Volume is slightly below average
Key levels to the upside          Key levels to the downside

1: $0.666                                   1: $0.6

2: $0.78                                     2: $0.596

3: $0.79                                   3: $0.535


Categories
Crypto Videos

CRYPTO – Cypherpunk Holdings Becomes 9th largest Public Bitcoin Whale!


Cypherpunk Holdings Becomes 9th-largest Public Bitcoin Whale


Cypherpunk Holdings, a privacy-focused investment company from Canada, has recently upped its stake in Bitcoin while simultaneously dumping Monero and Ethereum. The company disclosed on Nov 26 that it has added 72.979 Bitcoin to its reserves and that the expansion of its Bitcoin portfolio share started on June 30, 2020.

Cypherpunk funded this acquisition by liquidating its holdings of Monero and Ethereum, as well as through partial proceeds that came from a private placement of CA$505,000, or the US $388,000, closed on Aug 27. As an aftermath of the accumulation, the company now has 276.479 Bitcoin in its reserves, making it the ninth-largest public holder of Bitcoin. At current values, Cypherpunk’s stake in Bitcoin is worth just over $4.8 million.

At the moment, at least 14 publicly traded companies held Bitcoin on their books, with Cypherpunk being one of them. Combined, their holdings now amount to 66,896.59 Bitcoin, or $1.2 billion. This number is equivalent to roughly 3.2% of Bitcoin’s current circulating supply.

Cypherpunk Holdings, which currently trades on the Canadian Securities Exchange, has numerous privacy-focused businesses under its name, including Wasabi Wallet as well as Samourai Wallet. The company’s blockchain investments also include Hydro66, a green cloud infrastructure platform, and smart contract protocol Chia Network.

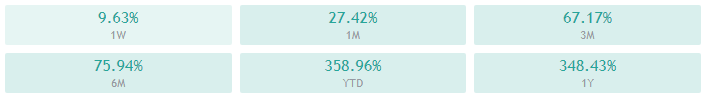
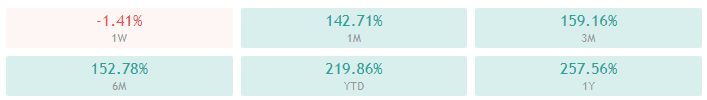
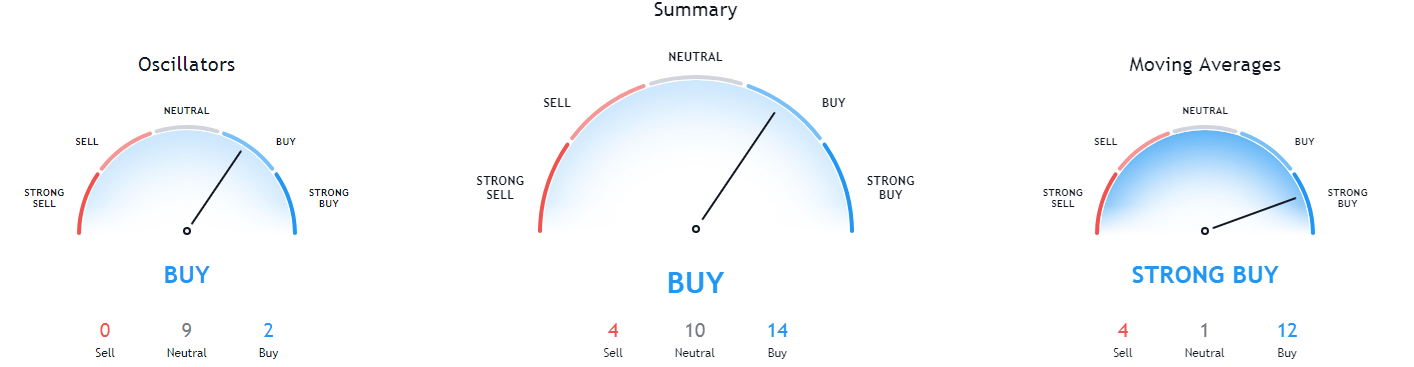
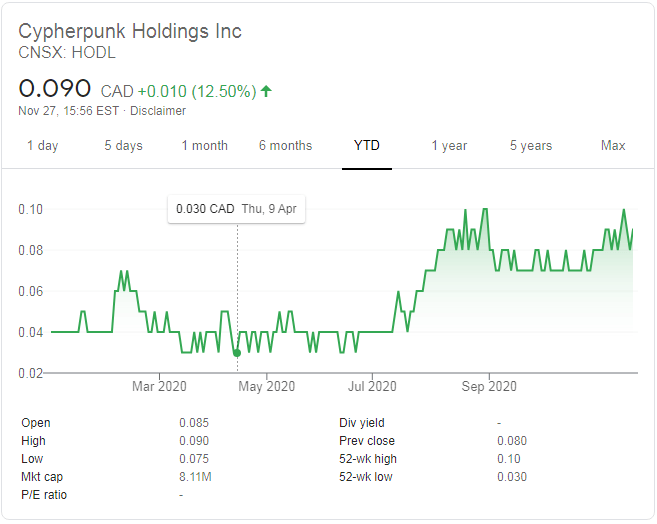
Cypherpunk Holdings is run by Antanas Guoga, also known as Tony G, a Lithuanian businessman, politician, and former professional-level poker player. He currently serves as an elected member of the Seimas, a legislative branch of the Lithuanian government. Prior to this, he served as a member of the European Parliament for Lithuania.

More and more public companies are converting their various holdings into Bitcoin as a more suitable store of value nowadays. MicroStrategy is the most prominent example of this trend, as it has converted most of its cash holdings into Bitcoin. The company now sits on a whopping 38,250 Bitcoin after nearly doubling its holdings this year. Galaxy Digital is the second-largest public Bitcoin holder, sitting at 16,402 Bitcoin, followed by Square holding the third-largest Bitocin holder spot with 4,709 Bitcoin.

Categories
Cryptocurrencies

How To Avoid the Bitcoin FOMO and Double Your Investment

‘The hardest thing to do in a bull market is to sit,’ says Mike Novogratz, a renowned Bitcoin evangelist. This is a feeling most investors can relate to. In a bull market, prices surge, and volumes skyrocket. And with the wave comes an irresistible urge to board the bandwagon – the fear of missing out (FOMO).

Beginning July 2020, Bitcoin has shown steady performance against the dollar and altcoins. However, it’s the currency’s performance in October and November that has left investors scrambling for the 18.5 million or so Bitcoins in existence. The Bitcoin FOMO is officially here, and many investors will make blind decisions. 

This article will look closely at the ongoing frenzy, what it means to investors, and how to approach it. 

Bitcoin in 2020

Bitcoin started 2020 modestly, only managing to fetch about $7K in January. It briefly jumped to $10K before plunging into an abyss, exchanging at less than $5K in March. But that seems to have marked the end of the dramatic falls. From mid-March, the currency started recovering steadily, and towards the end of July, it hit the symbolic $10K figure. Every time Bitcoin climbs to $10K, investors start getting all fidgety, as has been the case several times.

Since Bitcoin reached $10K in July, it has been going up almost consistently. In less than three months, it has gained over 50%, which is more than impressive. It isn’t easy to point out with certainty how things will turn out. However, investor greed and excitement is likely to push the figures even higher, at least in the short run.

What is the Fear and Greed Index Saying?

The crypto Fear and Greed Index is a contrarian scale that expresses investors’ general sentiment with regards to fear and greed. The idea is that when fear is high up there, investors will shy from trading, and that will cause prices to decline. On the converse, if investor greed is high, increased trading, and prices will rise. 

Different crypto fear and greed indices have shown a consistent increase in greed. A higher score represents more greed, while a low score represents more fear. Since these two factors are on opposite sides of the scale, one declines as the other increases. As reported by the fear and greed indices, the trend has closely resembled Bitcoin’s price trends all year long. 

Trading volume can give a clear picture of what is going on in the Bitcoin market. Exchanges everywhere are reporting sky-high volumes. 

An increase in volume usually triggers an increase in prices and hence an increase in market cap. 

What Has Caused the Sudden Interest?

When Bitcoin reached $10K in July, there was news all over the interweb covering this historical moment. Crypto evangelists and analysts, once again, resurfaced giving their expert opinions and predictions on how Bitcoin was going to double its value unless something ‘really wrong’ happens. You could look at it like a self-fulfilling prophecy, where speculators create so much hype that the market inevitably skews to their predictions. We certainly cannot underestimate the power that speculators have on market movements. In this case, there can only be little doubt that positive news about Bitcoin’s prospects contributed to increased interest in the currency. 

News is not the only positive thing that has been going around. In 2020, there has been a particular corporate interest in crypto. Several organizations, some of them high-ranking, have expressed interest in adopting cryptocurrencies. In October, Square – a global financial services provider – bought 4,000 Bitcoins for about $50 million, saying that it believes Bitcoin aligns well with the company’s purpose. Spending such amounts of corporate cash on buying crypto signifies corporate confidence in the future of cryptocurrencies. 

Just recently also, PayPal announced plans to have Bitcoin and other cryptos on its payments platform. This announcement was immediately followed by a surge in BTC prices to reach $12K. Several other top-tier corporations have expressed interest in mainstreaming cryptocurrencies, and this is undoubtedly part of the cause of the sudden surge in interest in crypto. 

What You Should Do

If you had not invested in Bitcoin before it broke the $10K barrier, you might be late to the party. Normally, by the time the buying frenzy kicks in, early-bird investors will be counting profits. Look at it this way, those who bought Bitcoin before July 26, that’s right before it surpassed the $10K high, are already counting a 50% profit less than three months down the line (BTC was at $15K at the time of writing). 

Even so, not all is lost. There are many indications that the Bitcoin market will be on the bull run for some time – how long that is, is a matter of conjecture. Therefore, you can still invest in BTC at this time and make profits. 

If you are determined to take the risk, here are some things to consider:

#1: Set Your Investment Goal – One of the unforgivable mistakes an investor can make is not to set goals. Such blind investments unsurprisingly end in tears. Setting a goal means having a plan for when to buy and when to sell. Just like gambling, you have to know when to hold them and when to walk away. For instance, you can decide to buy and sell when the price hits a certain figure, or you could decide to sell after a fixed term – regardless of whether you have gained or lost.

#2: Do Your Due Diligence – This is usually mandatory. Even if a reputable investor has advised you, you still have to do your due diligence. This may include seeking a second opinion, evaluating your finances, finding out whether you are ready to bear the risk, and so on. Because at the end of the day, it is your money that is at stake. Rushing into buying Bitcoin, especially amid such hype, may be regrettable. 

#3: Consider Altcoins – While all the attention is on Bitcoin, investors are busy ignoring other cryptocurrencies. When the Bitcoin market eventually heads for the bear run, investors might look at other cryptos. If you invest in the right altcoin at this time, you might be where Bitcoin’s early bird investors were before the frenzy began. 

#4: Sit on Your Hands and Lock Your Phone – Well, not literally, but if you can’t resist the temptation even when nothing makes sense, just avoid the markets altogether. This decision might save the little you have from drowning away in a possible market crash. As far as investment is concerned, you can consider that a profit.

Final Thoughts

Bitcoin’s recent performance has generated a lot of interest among investors. People are rushing to buy BTC, as evidenced by the increase in trading volume across exchanges. It would be great if we could all join the bandwagon, but extra caution is necessary for such market movements. Avoiding the hype is key in making a sound investment decision. You can invest in altcoins or simply avoid the markets until such a time when you can be under less pressure to make decisions. 

Categories
Crypto Market Analysis

Daily Crypto Review, Dec 2 – Traders Sell the News on ETH 2.0 Phase 0 Launch; Crypto Market in the Red

The cryptocurrency sector has dipped as the market entered a “selloff” mode the moment Ethereum’s 2.0 Phase 0 launched. The largest cryptocurrency by market cap is currently trading for $18,843, representing a decrease of 3.83% on the day. Meanwhile, Ethereum lost 2.83% on the day, while XRP managed to lost 6.17%.

 Daily Crypto Sector Heat Map

SushiSwap gained 34.83% in the past 24 hours, making it the most prominent daily gainer in the top100. It is closely followed by Kusama’s gain of 10.74% and Ampleforth’s 9.05% gain. On the other hand, HedgeTrade lost 10.21%, making it the most prominent daily loser. It is followed by Horizen’s loss of 9.44% and Ethereum Classic’s loss of 8.77%.

Top 10 24-hour Performers (Click to enlarge)

Bottom 10 24-hour Performers (Click to enlarge)

Bitcoin’s market dominance has decreased slightly since we last reported, with its value currently staying at 62.3%. This value represents a 0.1% difference to the downside when compared to yesterday’s value.

Daily Crypto Market Cap Chart

The crypto sector capitalization has decreased significantly in the past 24 hours. Its current value is $560.78 billion, representing a $17.09 billion increase compared to our previous report.

_______________________________________________________________________

What happened in the past 24 hours?

_______________________________________________________________________

_______________________________________________________________________

Technical analysis

_______________________________________________________________________

Bitcoin

Bitcoin has spent the day pulling back from its all-time highs and towards the $18,500 level. Its price formed a triangle formation on the 30-minute time-frame right after the price dump (which happened at the exact moment ETH 2.0 Phase 0 launched, as people were selling the news) and then broke it to the downside. Its price is now fighting for the $18,790 level (78.6% Fib retracement).

Bitcoin is quite volatile and unpredictable at the moment, but short trades in either direction could be viable. Traders should pay attention to volume and watch smaller time-frames and catch formations to trade off of them.

BTC/USD 30-minute chart

Bitcoin’s technicals on all time-frames are slightly tilted towards the buy-side. However, they show slight neutrality signs, except for the monthly overview, which is completely bullish.

BTC/USD 1-day Technicals

Technical factors (4-hour Chart):
  • Price is far above its 50-period EMA and at its 21-period EMA
  • Price is at its middle Bollinger band
  • RSI is near the overbought territory (52.95)
  • Volume is average
Key levels to the upside          Key levels to the downside

1: $19,000                                 1: $18,790

2: $19,500                                 2: $18,500

3: $19,666                                  3: $18,240

Ethereum

Ethereum has, just like Bitcoin, pulled back as traders sold the news of ETH 2.0 Phase 0 launching. While its move wasn’t as pronounced, the second-largest cryptocurrency by market cap did lose quite a bit of value, as well as most likely confirmed its position below $600. The double top formation was confirmed, which added to the decisiveness of the drop.

Ethereum traders should pay close attention to Bitcoin’s movement, as it currently dictates the market direction regardless of what news moves the market (news on Bitcoin or any other altcoin).

ETH/USD 4-hour Chart

Ethereum’s daily and monthly technicals are completely bullish and show no signs of neutrality. However, its 4-hour and weekly time-frames’ sentiment is bullish but shows some neutrality.

ETH/USD 1-day Technicals

Technical Factors (4-hour Chart):
  • The price is far above its 50-period and at its 21-period EMA
  • Price is at its middle Bollinger band
  • RSI is near being overbought (55.86)
  • Volume is average
Key levels to the upside          Key levels to the downside

1: $600                                     1: $510

2: $630                                     2: $500 

3: $735                                      3: $490

Ripple

The fourth-largest cryptocurrency by market cap had a pretty slow day, with its price hovering slightly above the $0.6 mark. Its price did feel the push towards the downside that the whole crypto sector experienced, but to a much lesser extent. XRP has found support at its 4-hour 50-period moving average, above which it is currently trading.

Trading XRP is almost certainly an inferior option to trading Bitcoin and Ethereum at the moment, as both the volume and volatility are low.

XRP/USD 4-hour Chart

XRP’s daily and monthly technicals are completely bullish and show no signs of neutrality. However, its 4-hour and weekly time-frames’ sentiment is bullish but shows some neutrality.

XRP/USD 1-day Technicals

Technical factors (4-hour Chart):
  • The price is slightly above its 50-period EMA and slightly below its 21-period EMA
  • Price is slightly below its middle Bollinger band
  • RSI is neutral (49.86)
  • Volume is below average
Key levels to the upside          Key levels to the downside

1: $0.666                                   1: $0.625

2: $0.78                                     2: $0.596

3: $0.79                                   3: $0.535


Categories
Cryptocurrencies

Bitcoin is Booming, But Which are the Best Altcoins to Own?

In the midst of the current Bitcoin bull run, it is difficult just to look any other way. After all, it is this pioneer crypto that has been hitting the headlines for weeks now. Both speculators and analysts have said the rally will continue. Also, there’s a likelihood that BTC will surpass the $20,000 mark, judging by recent performance and investor sentiment. In short, all our eyes have been glued to BTC, which has delivered a spectacular show hitherto. But, remember, investors must diversify. 

 Some spectators wonder whether it is still viable to jump in, naysayers are waiting for the crash, and risk-takers are diving deeper into the frenzy and multiplying their investments by the minute. Whichever your case, there are alternatives worth considering. 

Today, we take a look at some of the most promising altcoins, at least the ones you can bet your dollars on in the coming months. 

#1: Monero (XMR)

The rate at which Monero is rising is monumental – well, not price-wise, yet – but in terms of interest. Year-to-date 24-hour trading volume has increased by 20 times. The interest investors, regulators, and other stakeholders expressed in Monero in 2020 confirm that good tidings are in the offing. 

While Monero prices have not grown monumentally, they have still grown anyway. At some point in March, the coin was exchanging at $37. However, on pulling up its socks, it rose steadily beginning April to its current $130, a 400% gain. Let’s just say this is a modest gain given that the crypto has much more potential. 

Also worth mentioning is that Monero also recently reached $139, its 2-year high. Combining this with the fact that the crypto has become the center of attention among regulators, we are likely to see even higher volumes, which will boost speculation and eventually impact prices. 

Of course, things could go wrong and cause the crypto to crash, particularly if the Department of Internal Revenue succeeds in cracking its privacy – something they have been pursuing. Until then, XMR is one altcoin you cannot afford to lose sight of.

#2: Ripple (XRP)

Ripple has had an advantage over other altcoins since its inception, and that is because it was designed for real-time payment settlement. Essentially, Ripple is a platform that financial institutions can use to send money across borders with the following major advantages:

  • Lower costs than the traditional SWIFT system
  • Faster (real-time) settlements, compared to the traditional system that takes several business days.
  • Has all the security mechanisms of blockchain technology 

This background tells us that Ripple is a solid project, and we know solid projects have the growth potential – there’s no guarantee, but there’s hope.

Hope aside, Ripple’s native currency XRP has been performing modestly for the better part of 2020, trading between the $.013 – $0.69 range. If you compare it with Bitcoin’s performance, you’re likely to undermine Ripple’s year-to-date growth. But think again – since the 2017 crypto bubble, XRP has never reached the heights we see now. To be fair, surpassing the 2-year high is a milestone that signifies that this cryptocurrency is rising. 

You can choose to wait and see how things turn out, but it’s best to keep close tabs on XRP. 

#3: Fusion (FSN)

Fusion is one of the most underrated cryptocurrencies. Although investors are yet to see Fusion’s potential, there is an indication that this crypto will grow. 

Fusion’s potential lies in the adoption of DeFi, which is already on the rise. The crypto’s developers are working on several innovations that are set to transform DeFi. One of the most notable is the WeDeFi project that seeks to bring DeFi to the common person.

Fusion provides investors with different and exciting investment options. For instance, the crypto supports passive staking, which is only available in proof-of-stake crypto networks. With this investment option, you delegate your savings for verifying transactions. In proof of work networks, those with more tokens have higher staking power. Leaving aside the intricacies, Fusion can enable investors to earn by basically doing nothing. 

At the moment, the crypto is undervalued. It ranks at around 460 by market capitalization. This valuation will certainly change, especially as DeFi picks up pace. Meanwhile, you can invest in Fusion now while the prices are still low ($0.26) at the time of writing. When daily trading volumes increase as a result of DeFi’s mass adoption, consider this opportunity gone. 

#4: Ethereum (ETH)

Historically, Ethereum has been Bitcoin’s most fierce competitor. Best known as the king of smart contracts and decentralized apps, Ethereum has worked its way up to become the second-largest cryptocurrency by market capitalization. 

Ethereum’s tech and investment potential is its backbone. Developers have used the crypto’s facilities to build a wide range of applications, all of which add value to the network. However, it is the upcoming launch of Ethereum 2.0 that we should set our eyes on. 

On December 1 at noon, Ethereum will change from proof of work to proof of stake (no more mining). First, whenever cryptos undergo significant changes, a frenzy is created, and prices surge as investors scramble to be part of the revolution. Secondly, the staking system will encourage investors to lock their funds in the network to earn returns from verifying transactions. Since a higher stake gives one more power, investors are likely to lock more ETH to the network. The result? An inevitable shortage and a consequent price surge.

Unless something goes wrong, ETH will keep rising further in the coming months. 

#5: Litecoin (LTC)

Litecoin is among the oldest altcoins. It was created shortly after Bitcoin as a lite version of the pioneer crypto. As such, it is very similar to Bitcoin. The main difference between the two is that Litecoin is less resource-intensive, and this trickles down to users as faster and cheaper transactions. 

Like BTC and other major cryptos, Litecoin has shown stable upward growth in 2020, especially from April onwards. In November, it reached $86, its highest in the year. The crypto’s performance seems to be following Bitcoin’s performance, albeit not so closely. Even so, since the trend is upward, it is a sensible alternative at the moment.

There you go, folks! Take some time to monitor each of these from close quarters to find out which one works best for you.

Final Thoughts

While Bitcoin is currently grabbing headlines for its stellar performance, it is not the only cryptocurrency worth investing in. Monero, Ripple, Fusion, Ethereum, and Litecoin are equally savvy alternatives. These altcoins have a good track record, have solid projects behind them, and are currently performing well. Whether you’re looking for short-term or long-term investments, you now know which are the best altcoins to own.

Categories
Crypto Daily Topic Cryptocurrencies

Learn How To Understand Crypto Market Data and Become a Pro

Newcomers in cryptoverse can be easily baffled by the myriad of things to learn and understand. ‘Ethereum has hit the highest 3-week close since the last bull run,’ and other such phrases are common in this industry. Then, there are charts that track the movement of different performance indicators in real-time. To add to the confusion, experts often differ on investment advice and the impact of various events in the industry. 

This article will help to simplify some of the common crypto market issues you will need to understand. It’s by no means a comprehensive guide for trading crypto, but it will give you that head-start you need to get going. 

Crypto Buzzwords

Buzzwords are a common feature of the crypto market and a common source of confusion at that. Normally, a well-written crypto article will not be without a dozen buzzwords. Some writers use crypto jargon purely for flair. But we will agree that these catchphrases have a way of hammering in opinions that would otherwise fly under the radar. 

To understand crypto market data, it is important to familiarize yourself with the industry glossary. There are a couple of basic phrases like bull and bear markets, trading sideways, support and resistance, candles, etc., that you may need to learn. You can always refer to your glossary when analyzing market data, but don’t you think the market data is already complex enough? You can make things easier by learning some market terminology beforehand on web resources such as Coinmarketcap‘s glossary page.

Market Indicators 

What is a crypto market without indicators? Due to the volume of activity on such markets, it’s impossible to track them on individual trades. Therefore, pros use indicators as quick reference guides for reading what the markets are trying to say. There could be a bunch of indicators used in crypto markets, but these are the most useful ones:

  • Price – It shows how much a crypto asset is trading against the dollar or another base currency. By itself, price doesn’t matter. What’s more important is price movement – that is, the change in price over a certain period (typically 24 hours). These changes are usually marked by opening and closing prices.
  • Market capitalization – It shows the total value of assets in a given market. Most investors believe a high market cap is a characteristic of a low-risk-low-return portfolio. 
  • Volume – It shows how active investors are buying and selling assets. High volumes are usually indicative of a ‘hot’ crypto.

Understanding Charts

Charts are an essential part of representing market data. Whether you’re looking at crypto or forex markets, these graphical data representation tools are inevitable. While newcomers may look at charts as beautiful pictures, market pros track these graphics continuously to know how different assets perform against certain indicators. 

Charts are pretty easy to understand. Basically, they show a certain aspect of a crypto is changing over time. There are several important charts that you need to be aware of:

  • Price charts – Price charts are the most common charts you will see when reviewing crypto market data. They provide you with real-time information regarding the price movement of a given crypto. Most price charts are simple X-Y graphs with day/month/year on one side and prices on the other. You can find easy-to-interpret price charts, among other sites, on Yahoo Finance or Tradingview. As a bonus, most charts are interactive – that is, they allow you to adjust the period for which you wish to view, zoom in to a specific day, and so on. It is highly unlikely that you will experience difficulty in interpreting price charts.
  • Fear and greed index – The fear and greed index seeks to represent the general level of fear or greed among investors. Investors like to give off the vibe that they’re purely analytical human beings, but the truth is they’re pretty emotional. And that’s why when fear spreads in the industry, investors pull out of the market. If we were to express fear and greed mathematically, these two emotions would be inversely proportional to each other – as fear rises, investor greed declines, and vice versa. You can find a good fear and greed index chart on CNN Money, where the index was invented. Well, this is the original index, which was customized for capital markets investors. If you want one specific to crypto markets, you could check out the chart on Btctools.com. 
  • Market cap charts – Market capitalization tells you how much worth is a given market, in total. Simply put, multiply the price of a unit of an asset by the total number of assets outstanding, and you get the market cap. You need to understand market cap charts because they give you an idea of how stable that market is. Generally, traders assume that markets with a high market cap (such as Bitcoin) are less conservative and thus less risky in the long run. 
  • Volume charts – A volume chart shows the level of trading activity in a given market. High volumes indicate positive investor sentiment. And just like economic inflation, rising market volumes suggest that things are looking up for that crypto. 
  • Combined charts – These charts put all the indicators (price, volume, market cap) on the same diagram. Each indicator is then marked by a differently-colored line and a key provided. 

Where to Get Reliable Market Data

Getting reliable market data is key to understanding crypto markets and making the right investment decisions. When looking for information, go for reputable sources such as Investopedia, Coinmarketcap, Coindesk, and others. Some data sources may be outdated or just plain incorrect. You know how non-factual data can be misleading. So, when analyzing crypto market data, choose reliable sources. 

Influencer Opinions

Listening to industry influencers is also a great way to understand crypto markets. The opinions of such people have the power of swaying investor sentiment. For instance, if Richard Branson says that he thinks Bitcoin is a ‘get-rich-quick scheme,’ some investors may back off a little. 

Now, you listen to influencers to get pointers on what to look out for. Most of the time, influencers tend to raise controversy, perhaps, just for the sake of it. So, don’t take their word for it – always research wider. 

Final Thoughts

Understanding crypto markets isn’t that hard after all. If you learn a few buzzwords, understand market indicators, know how to read different charts and where to get reliable market information, you could very well soon sound like a pro investor. This was just a basic guide to understanding crypto markets. Always read wide and keep informed. Good luck.

Categories
Crypto Market Analysis

Daily Crypto Review, Dec 1 – Bitcoin’s New Monthly All-Time High; Ethereum 2.0 Phase 0 Launches Today

The cryptocurrency sector has pushed further up as Bitcoin made a new all-time high for a moment. The largest cryptocurrency by market cap is currently trading for $19,443, representing an increase of 5.03% on the day. Meanwhile, Ethereum gained 3.45% on the day, while XRP managed to gain 3.78%.

 Daily Crypto Sector Heat Map

BitTorrent gained 18.25% in the past 24 hours, making it the most prominent daily gainer in the top100. It is closely followed by Litecoin’s gain of 11.22% and Decentraland’s 7.69% gain. On the other hand, Numeraire lost 4.81%, making it the most prominent daily loser. It is followed by Waves’ loss of 5.78 and Zilliqa’s loss of 3.36%.

Top 10 24-hour Performers (Click to enlarge)

Bottom 10 24-hour Performers (Click to enlarge)

Bitcoin’s market dominance has increased slightly since we last reported, with its value currently staying at 62.4%. This value represents a 0.7% difference to the upside compared to the value it had yesterday.

Daily Crypto Market Cap Chart

The crypto sector capitalization has increased significantly in the past 24 hours. Its current value is $577.86 billion, representing a $24.86billion increase compared to our previous report.

_______________________________________________________________________

What happened in the past 24 hours?

_______________________________________________________________________

_______________________________________________________________________

Technical analysis

_______________________________________________________________________

Bitcoin

Bitcoin has spent the day continuing its push towards the upside, even posting a new all-time high (on most exchanges) for a moment as it reached $19,864 on Bitstamp. However, the 20,000 mark and BitMEX’s $20,093 remain untouched. With the buys on exchanges and derivatives markets and institutional investments, a strong all-time high might be posted extremely soon.

Bitcoin trading is quite hard at the moment simply due to how the cryptocurrency moves. Still, traders can squeeze a profit if they trade along with the main trend and long Bitcoin when the volume increases.

BTC/USD 4-hour Chart

Bitcoin’s technicals on all time-frames are tilted towards the buy-side but show slight neutrality signs, or even slight signs of bearishness.

BTC/USD 1-day Technicals

Technical factors (4-hour Chart):
  • Price is far above both its 50-period EMA and its 21-period EMA
  • Price is near its top Bollinger band
  • RSI is near the overbought territory (69.43)
  • Volume is average
Key levels to the upside          Key levels to the downside

1: $19,500                                 1: $19,000

2: $19,666                                 2: $18,790

3: $20,000                                  3: $18,500

Ethereum

Ethereum has, just like Bitcoin, continued its climb up. However, the move has stopped slightly below its most recent highs, topping at $617.87. The second-largest cryptocurrency by market cap now has two scenarios to play out:

  1. It can create a double top and start moving back towards the supporting levels;
  2. It can continue moving up on fundamentals and break the recent high and the recent trading patterns it created.

Ethereum’s current fundamental outlook is extremely bullish due to its Phase 0 of Ethereum 2.0 launching. This, along with Bitcoin moving towards the upside, has made trading any potential pullbacks quite impossible due to the amount of potential risk such trade would carry.

ETH/USD 4-hour Chart

Ethereum’s 4-hour, daily, and monthly technicals are extremely bullish and show no signs of neutrality. On the other hand, its weekly time-frame’s sentiment is bullish but shows some neutrality.

ETH/USD 1-day Technicals

Technical Factors (4-hour Chart):
  • The price is far above both its 50-period and its 21-period EMA
  • Price is near its top Bollinger band
  • RSI is near being overbought (68.63)
  • Volume is average
Key levels to the upside          Key levels to the downside

1: $600                                     1: $510

2: $630                                     2: $500 

3: $735                                      3: $490

Ripple

The fourth-largest cryptocurrency by market cap has tried moving up, as well, but in a much tamer manner. XRP has established its presence above $0.625 and pushed towards $0.666, which stopped the move. XRP will most likely continue trading in a range-bound by $0.666 to the upside and either $0.625 or $0.596 to the downside

Trading XRP is quite difficult at the moment, and trading Bitcoin or Ethereum is potentially more profitable and slightly more straightforward.

XRP/USD 4-hour Chart

XRP’s technicals on the 4-hour and weekly time-frames are bullish but show some signs of neutrality. On the other hand, its daily and monthly overviews are completely bullish.

XRP/USD 1-day Technicals

Technical factors (4-hour Chart):
  • The price is above its 50-period EMA and slightly above its 21-period EMA
  • Price is between its middle and top Bollinger band
  • RSI is neutral (60.95)
  • Volume is average
Key levels to the upside          Key levels to the downside

1: $0.666                                   1: $0.625

2: $0.78                                     2: $0.596

3: $0.79                                   3: $0.535


Categories
Crypto Videos Forex Videos

What Caused The BTC/USD bull run collapse? How To Avoid Major Losses!


Bitcoin – USD bull run collapses, what happened?

Thank you for joining this forex academy educational video.

In this session, we will be looking at the end of the most recent bull run for the BITUSD pair.

This is a daily chart for the pair.  As we see here, the pair has been on a bull run and has been conforming to this upward trend line since April 2020.  The price range found support at the all-important $10K level, which coincided with the support line at position A.  The pair found a bid tone up to position B,  where price action did not revert to the support line,  preferring to fade up to the line of resistance where we see a breach above the $14 k line which coincides with the area of resistance at position B giving the pair one of the largest single-day moves to the upside for several months.

We then see an extended rally up to position C see at $19.450k before a major pullback. So, what caused this?


Firstly, we need to go back in time to 2017, shown here on the monthly chart, where bitcoin to the US dollar hit an all-time high hit around $19.5K, depending on the broker, shown here at position A, before crashing to $3K in the middle of 2018, at position B, and then taking 2 years to reach the $19.5K area as seen at position C.   This is a double top formation, where smart money investors, saw the potential of a reversal in price action, while many traders were hoping for a continuation to $20K and beyond.

Now we need to drill down to the 1-hour chart.  We have a classic area of support and resistance at position A,  where the resistance line is breached to form a push up to $19.5K area,  before a pullback to the support line and a second attempt to move higher, which forms a double top,  and the price does not sustain the move higher and falls back to the support line at position C,  before crashing lower with large candles suggesting extreme volatility through eventually punching through the support line at position D, which becomes an area of resistance, before the pair crashes to a low of $16.3K. 

This move came about due to a series of important factors,  including historic highs,  followed by a crash,  followed by another bull run,  but where cautious traders would be reminded of the previous crash and were prepared to selling bitcoins and bitcoin futures,  as we see on our charts,  because of the nature of bitcoin which has no store value you other than the fact that it is of limited supply, and is predominantly a speculative instrument.

Thrown into the mix was the current bull run topping out just before the US Thanksgiving holiday, where traders will have decided to unwind their trades and take their profits.

Bitcoin proves again that it is a highly dangerous asset to trade. With one story of a $100 million loss in the press today, timing is critical. The main BTCUSD lost 11% in 24 hours and dragged other crypto assets lower in the panic. However, by using simple trend and support and resistance lines and dropping up and down in chart time frames, traders can gain a clear understanding of the risks and potential for turns in price action.


Categories
Crypto Market Analysis

Daily Crypto Review, Nov 30 – Ethereum Soars on Great Fundamentals; Bitcoin Bulls Back in the Game

The cryptocurrency sector has spent the weekend regaining what was lost during the crash on Nov 25. Almost every single cryptocurrency in the top100 ended up being in the green. The largest cryptocurrency by market cap is currently trading for $18,369, representing an increase of 4.43% on the day. Meanwhile, Ethereum gained 9.79% on the day, while XRP managed to gain 6.67%.

 Daily Crypto Sector Heat Map

Kusama gained 19.14% in the past 24 hours, making it the most prominent daily gainer in the top100. It is closely followed by Ampleforth’s gain of 16.24% and Zilliqa’s 13.48% gain. On the other hand, Numeraire Coin lost 5.56%, making it the most prominent daily loser. There were no other cryptocurrencies in the top100 that lost over 1% of its value.

Top 10 24-hour Performers (Click to enlarge)

Bottom 10 24-hour Performers (Click to enlarge)

Bitcoin’s market dominance has decreased slightly since we last reported, with its value currently staying at 61.7%. This value represents a 0.5% difference to the downside compared to the value it had on Friday.

Daily Crypto Market Cap Chart

The crypto sector capitalization has increased significantly over the weekend. Its current value is $553.00 billion, representing a $38.14 billion increase compared to our previous report.

_______________________________________________________________________

What happened in the past 24 hours?

_______________________________________________________________________

_______________________________________________________________________

Technical analysis

_______________________________________________________________________

Bitcoin

Bitcoin has spent the weekend recovering from the Nov 25 crash. The price was slowly going up over the weekend, creeping up to and past $18,000 once again. The largest cryptocurrency by market cap is currently between its 61.8% and 78.6% Fib retracement levels, and a break to either side of this range may determine its short-term fate.

Bitcoin’s short-term future will greatly depend on if it breaks its immediate support or resistance level. In both cases, a strong rally towards that side may form, so traders should be prepared to “catch” the trade quickly.

BTC/USD 1-hour Chart

Bitcoin’s daily, weekly, and monthly technicals are tilted towards the buy-side but show slight neutrality signs. On the other hand, its 4-hour technicals are completely bullish.

BTC/USD 1-day Technicals

Technical factors (4-hour Chart):
  • Price is above both its 50-period EMA and its 21-period EMA
  • Price is near its top Bollinger band
  • RSI is neutral (62.26)
  • Volume is average
Key levels to the upside          Key levels to the downside

1: $18,500                                 1: $17,850

2: $18,790                                 2: $17,450

3: $19,000                                  3: $17,000

Ethereum

Ethereum has, just like Bitcoin, been climbing back and trying to reach its recent highs. The second-largest cryptocurrency by market cap is currently fighting to pass the 78.6% Fib retracement level, sitting at $592.5. If this level gets conquered with conviction, we may expect another run past $600.

Ethereum’s current fundamental outlook is very bullish due to its Phase 0 of Ethereum 2.0 launching. This, combined with Bitcoin moving towards the upside, has made trading any potential pullbacks impossible due to how risky it would be.

ETH/USD 4-hour Chart

Ethereum’s 4-hour, daily, and monthly technicals are completely bullish and show no signs of neutrality. On the other hand, its sentiment seen in the weekly time-frame’s is bullish but shows some neutrality.

ETH/USD 1-day Technicals

Technical Factors (4-hour Chart):
  • The price is far above both its 50-period and its 21-period EMA
  • Price is at its top Bollinger band
  • RSI is near being overbought(68.26)
  • Volume is average
Key levels to the upside          Key levels to the downside

1: $600                                     1: $510

2: $630                                     2: $500 

3: $735                                      3: $490

Ripple

The fourth-largest cryptocurrency by market cap has spent the weekend trying to maintain its level after a small rally that took its price from $0.55 to $0.65. XRP seems to be trading in a range, bound by the 38.2% Fib retracement ($0.582) and 61.8% Fib retracement ($0.657).

Trading XRP may not be optimal as trading Bitcoin, or Ethereum is potentially more profitable and slightly more straightforward.

XRP/USD 2-hour Chart

XRP’s technicals on shorter time-frames (4-hour and daily) are extremely bullish, while its weekly and monthly overviews show some signs of neutrality and bearishness (though they are still bullish).

XRP/USD 1-day Technicals

Technical factors (4-hour Chart):
  • The price is above its 50-period EMA and slightly above its 21-period EMA
  • Price is between its middle and top Bollinger band
  • RSI is neutral (58.86)
  • Volume is average
Key levels to the upside          Key levels to the downside

1: $0.657                                   1: $0.625

2: $0.711                                     2: $0.582

3: $0.79                                  3: $0.535


Categories
Crypto Market Analysis

BTC/USD Weekly Chart Analysis + Possible Outcomes

In this weekly BTC/USD analysis, we will be taking a brief look at the most recent events, current chart technical formations, as well as the possible BTC short-term price outcomes.

Overview

Bitcoin has spent the past week experiencing a long-awaited pullback, after which it started consolidating. The largest cryptocurrency by market cap has dropped significantly and reached as low as $16,200 before bears reached exhaustion after failing to break its all-time high. While some analysts are calling for an end of the pullback, most of the data shows otherwise. First off, the current controversy around China seizing 1% of all Bitcoin is contributing towards the overall bearish sentiment. Second, a poll done on crypto investors says that the majority of investors believe that BTC will end up correcting as much as 40%. All this, plus the fact that Bitcoin couldn’t push past $17,260 for a couple of days now, is a testament to the short-term bearish sentiment.

On the other hand, people shouldn’t mistake this for a long-term bearish trend. In fact, Bitcoin has never been more bullish long-term.

Technical factors


Bitcoin has continued moving up and performed exactly what we called last week (a push towards the all-time high). Once again, as expected, the push didn’t break the all-time high and has triggered a strong pullback. Bears have reached exhaustion at just over $16,000 and Bitcoin has started consolidating in a range, bound by $17,260 (both horizontal resistance and a 100-period moving average) to the upside and $16,420 to the downside.

The hash ribbons indicator still shows a buy/accumulate signal as it points out to miner capitulation.

Likely Outcomes

Bitcoin’s movement is a bit less obvious this week when compared to the past weeks. The cryptocurrency has a couple of scenarios it can play out as it leaves the current range-bound trading.

1: If Bitcoin breaks the range to the downside (slightly less likely), its most likely target will be $15,500. Due to the short-term bearish sentiment surrounding Bitcoin at the moment, a short trade doesn’t have to be considered as “trading against the large trend” and may actually be a good profit-making opportunity.

In this case, a clear stop-loss should be set a little above $16,420.

2: The second (just slightly more likely) scenario happens if Bitcoin manages to break the $17,260 mark. In this case, the cryptocurrency can reach many targets, but will most likely pass the $17,600 immediate resistance and push higher. The next zone of resistance after that is the $18,250-$18,450.

Trading Bitcoin’s sideways action in a current range is not advised as the price could break out of it at any time.

Categories
Crypto Market Analysis

Daily Crypto Review, Nov 27 – Satoshi Nakamoto Emails Discovered; Crypto Market Consolidating

The cryptocurrency sector has started its consolidation period after a bloodbath it experienced yesterday. The largest cryptocurrency by market cap is currently trading for $17,164, representing a decrease of 3.07 % on the day. Meanwhile, Ethereum is gaining 0.01% on the day, while XRP managed to gain 2.47%.

 Daily Crypto Sector Heat Map

SushiSwap gained 31.44% in the past 24 hours, making it the most prominent daily gainer in the top100. It is closely followed by Aave’s gain of 15.05% and Nano’s 14.68% gain. On the other hand, Crypto.com Coin lost 10.20%, making it the most prominent daily loser. NEM lost 9.92% while OMG Network lost 9.43%, making them the 2nd and 3rd most prominent daily losers.

Top 10 24-hour Performers (Click to enlarge)

Bottom 10 24-hour Performers (Click to enlarge)

Bitcoin’s market dominance has stayed at the same place as yesterday, with its value currently staying at 62.2%. This value represents a 0% difference when compared to the value it had yesterday.

Daily Crypto Market Cap Chart

The crypto sector capitalization has decreased significantly over the course of the day. Its current value is $511.86 billion, representing a $48.67 billion decrease compared to our previous report.

_______________________________________________________________________

What happened in the past 24 hours?

_______________________________________________________________________

_______________________________________________________________________

Technical analysis

_______________________________________________________________________

Bitcoin

The largest cryptocurrency by market cap has triggered a rally towards the downside after creating a double top, which brought its price as low as $16,215. While some analysts say that the downturn is not over yet, Bitcoin has recovered slightly and is now consolidating just above the $17,000 mark.

While shorting Bitcoin could be a good profit-making opportunity if the downtrend continues, trading against the long-term trend is very risky. However, thinking about hedging against any downturns should be considered.

BTC/USD 1-hour Chart

Bitcoin’s daily and weekly technicals are tilted towards the buy-side and show no signs of neutrality. On the other hand, its monthly technicals show some signs of neutrality, while its 4-hour technicals are completely bearish.

BTC/USD 1-day Technicals

Technical factors (1-hour Chart):
  • Price is far below its 50-period EMA and at its 21-period EMA
  • Price is at its middle Bollinger band
  • RSI is neutral (44.33)
  • Volume is average
Key levels to the upside          Key levels to the downside

1: $17,450                                 1: $17,000

2: $17,850                                 2: $16,800

3: $18500                                   3: $16,350

Ethereum

Ethereum has experienced the same chain of events Bitcoin did in the past day or so. The downtrend ended up bringing Ethereum’s price back to as low as $480 before recovering. However, Ethereum’s ascending channel (yellow dotted) top line has stayed strong and triggered a mini-rally, which then brought the price above the red ascending line as well. Ethereum is now consolidating at around $515.

Ethereum’s current fundamental outlook is very bullish, but (as we said in our previous articles) any sharp move to the downside triggered by Bitcoin will affect Ethereum in a major way as well. This makes trading up hard, as one needs to constantly check Bitcoin’s price as well.

ETH/USD 1-hour Chart

Ethereum’s daily, weekly, and monthly technicals are completely bullish and show no or just slight neutrality signs. On the other hand, its sentiment seen in the 4-hour time-frame’s is completely bearish.

ETH/USD 1-day Technicals

Technical Factors (4-hour Chart):
  • The price is far below its 50-period and at its 21-period EMA
  • Price is at its middle Bollinger band
  • RSI is neutral (44.53)
  • Volume is average
Key levels to the upside          Key levels to the downside

1: $600                                     1: $510

2: $630                                     2: $500 

3: $735                                      3: $490

Ripple

The fourth-largest cryptocurrency by market cap has posted lower highs three times in a row, with its lows testing the $0.625 support level each time the price went down. However, the third time XRP went towards this level, Bitcoin’s push towards the downside triggered XRP bears, which took over the market. The downturn ended at the $0.475 level, which held up quite nicely. XRP is now trading in the middle of a range, bound by $0.475 to the downside and $0.625 to the upside.

Trading XRP may not be optimal at the moment as trading Bitcoin is both potentially more profitable and a bit more straightforward.

XRP/USD 1-hour Chart

XRP’s technicals on all time-frames are bullish, with its daily time-frame being the only one not showing any signs of neutrality. The other time-frames show either slight neutrality or even slight bearishness.

XRP/USD 1-day Technicals

Technical factors (4-hour Chart):
  • The price is slightly below its 50-period EMA and at its 21-period EMA
  • Price is slightly above its middle Bollinger band
  • RSI is neutral (48.78)
  • Volume is slightly above average
Key levels to the upside          Key levels to the downside

1: $0.625                                   1: $0.475

2: $0.79                                     2: $0.443

3: $0.963                                  3: $0.4


Categories
Crypto Videos

PayPal is the Reason for the Bitcoin shortage!


PayPal is the Reason for the Bitcoin shortage

PayPal’s entry into the cryptocurrency sector could be having a dramatic impact on Bitcoin’s price. In a newly published report posted by crypto investment firm Pantera Capital, the company says that a Bitcoin shortage is the main reason for the current price surge, and that the majority of the newly minted Bitcoin is being scooped up by PayPal. PayPal’s newly announced crypto service is, as Pantera states, “already having a huge impact,” adding that the payment merchant is buying up roughly 70% of all the newly mined Bitcoin.

Citing itBit’s data, Pantera claims that “When PayPal went live, Bitcoin’s volume started exploding. The increase in volume on itBit implies that within just four weeks of going live, PayPal is already buying up almost 70% of the new supply of Bitcoin.” According to Pantera, the data they analyzed suggest that PayPal and Cash App combined are buying up almost all of the newly-issued Bitcoin.


Bitcoin’s monetary policy is programmed in such a way that it is deflationary over time. With the recent widescale adoption, that would lead to higher purchasing power as well as supply scarcity. Pantera claims that it is exactly the supply scarcity that is contributing to Bitcoin’s parabolic surge.


PayPal has launched its crypto trading services in the US earlier this month, allowing its customers to trade up to $20,000 per week. The platform will expand its services out globally in early 2021. The online payment merchant currently has 300 million active users, which makes it dipping its toes into the crypto sector is a major stepping stone for adoption.

Pantera added that it’s a lot easier to purchase Bitcoin now than during the previous bull market in 2017. In addition to PayPal, the retail sector can now step into Bitcoin and other cryptocurrencies by using Cash App and Robinhood.


Wider adoption certainly means that the father of digital currencies is more likely to see higher price levels. Although Bitcoin remains extremely volatile, it showed the market that it could endure an unusually long period of stability by consolidating for over two months before breaking the sideways trading period and pushing towards the upside.


Categories
Crypto Market Analysis

Daily Crypto Review, Nov 26 – Bitcoin’s “Flash Crash” Pulls Price Below $18,000; Blood on the Crypto Streets

The cryptocurrency sector has ended the day in the red as Bitcoin failed to stay above $19,000 and even falling below $18,000 as bears took control of the market. The largest cryptocurrency by market cap is currently trading for $17,000, representing a decrease of 10.67%% on the day. Meanwhile, Ethereum is losing 15.34% on the day, while XRP lost 16.88%.

 Daily Crypto Sector Heat Map

Zilliqa 23.75% in the past 24 hours, making it the most prominent daily gainer in the top100. It is closely followed by Horizen’s gain of 18.71% and Elrond’s 11.54% gain. On the other hand, Verge lost 24.86%, making it the most prominent daily loser. Kusama lost 15.78% while Reserve Rights lost 13.81%, making them the 2nd and 3rd most prominent daily losers.


Top 10 24-hour Performers (Click to enlarge)

Bottom 10 24-hour Performers (Click to enlarge)

Bitcoin’s market dominance has increased over the day, with its value currently staying at 62.2%. This value represents a 0.6% difference to the upside compared to the value it had yesterday.

Daily Crypto Market Cap Chart

The crypto sector capitalization has decreased over the course of the day. Its current value is $560.17 billion, representing an $11.36 billion decrease compared to our previous report.

_______________________________________________________________________

What happened in the past 24 hours?

_______________________________________________________________________

_______________________________________________________________________

Technical analysis

_______________________________________________________________________

Bitcoin

The largest cryptocurrency by market cap has created a double top, which triggered a pullback from the recent highs. Not only has the price retraced to the sub-$19,000 level, but it has also broken the $18,500 support level. The price will most likely end up below the $17,850 level, as the market is calling for a pullback for quite some time. However, if the market recovers, we can expect the price to end up between $17,850 and $18,500.

While shorting Bitcoin might be a good profit-making opportunity at the moment, trading against the long-term trend is extremely risky. However, thinking about hedging versus any downturns might be a good option at the moment.

BTC/USD 1-hour Chart

Bitcoin’s 4-hour, daily, and weekly technicals are heavily tilted towards the buy-side and show no signs of neutrality or bearishness. On the other hand, its monthly technicals are showing some signs of neutrality.

BTC/USD 1-day Technicals

Technical factors (1-hour Chart):
  • Price is far below its 50-period EMA and its 21-period EMA
  • Price slightly below its lower Bollinger band
  • RSI is extremely oversold (23.98)
  • Volume is average (one candle spike)
Key levels to the upside          Key levels to the downside

1: $18500                                  1: $17,850

2: $19000                                  2: $17,450

3: $19500                                   3: $17,000

Ethereum

While Ethereum did follow Bitcoin to the downside, both in price direction and severity of the move, the situation doesn’t look that bad. The second-largest cryptocurrency by market cap has started its pullback after failing to stay above $600, culminating in a full-blown dump from $570 to $505. However, the ascending (red) line held up, and ETH reclaimed previous levels and is currently consolidating around $530.

Ethereum’s current outlook is very bullish, but any sharp move to the downside coming from Bitcoin will affect it in a major way. Traders should pay close attention to Bitcoin’s moves if they want to trade Ether.

ETH/USD 1-hour Chart

Ethereum’s technicals are a bit confusing, as its daily and monthly overviews are completely bullish, while its weekly overview shows slight signs of neutrality. Its 4-hour technicals, however, are pointing towards the sell-side.

ETH/USD 1-day Technicals

Technical Factors (4-hour Chart):
  • The price is below both its 50-period and its 21-period EMA
  • Price is below its bottom Bollinger band
  • RSI is extremely oversold (19.47)
  • Volume is above average
Key levels to the upside          Key levels to the downside

1: $600                                     1: $510

2: $630                                     2: $500 

3: $735                                      3: $490

Ripple

The fourth-largest cryptocurrency by market cap has performed similarly to the aforementioned two cryptocurrencies. XRP has posted lower highs three times in a row while testing the $0.625 support level each time. However, the last time XRP went towards this level, bears took over and pushed the price further down. XRP bears have seemingly reached exhaustion, and the cryptocurrency is now consolidating around the $0.575 level.

Trading XRP is not advised as trading Bitcoin is (at the moment) both potentially more profitable and more straightforward.

XRP/USD 1-hour Chart

XRP’s technicals on all time-frames are tilted towards the buy-side, with its daily overview being the most bullish time-frame. Its other time-frames show signs of neutrality or even slight bearishness.

XRP/USD 1-day Technicals

Technical factors (4-hour Chart):
  • The price is far below both its 50-period EMA and its 21-period EMA
  • Price is slightly below its bottom Bollinger band
  • RSI is close to being oversold (31.85)
  • Volume is above average
Key levels to the upside          Key levels to the downside

1: $0.625                                   1: $0.475

2: $0.79                                     2: $0.443

3: $0.963                                  3: $0.4