Categories
Crypto Market Analysis

Daily Crypto Review, Nov 25 – Bitcoin Above $19,000: What’s Next?

The cryptocurrency sector has spent the day pushing towards the upside as Bitcoin rallied and reached past $19,000. The largest cryptocurrency by market cap is currently trading for $19,093, representing an increase of 4.37% on the day. Meanwhile, Ethereum lost 0.55% on the day, while XRP gained 14.94%.

 Daily Crypto Sector Heat Map

Verge 63.06% in the past 24 hours, making it the most prominent daily gainer in the top100. It is closely followed by Stellar’s gain of 59.30% and Status’s 31.14% gain. On the other hand, Bitcoin Gold lost 16.21%, making it the most prominent daily loser. SushiSwap lost 12.05% while Balancer lost 7.89%, making them the 2nd and 3rd most prominent daily losers.

Top 10 24-hour Performers (Click to enlarge)

Bottom 10 24-hour Performers (Click to enlarge)

Bitcoin’s market dominance has increased over the course of the day, with its value is currently staying at 61.06%. This value represents a 1% difference to the upside compared to the value it had yesterday.

Daily Crypto Market Cap Chart

The crypto sector capitalization has increased slightly over the course of the day. Its current value is $571.53 billion, representing an $8.86 billion increase compared to our previous report.

_______________________________________________________________________

What happened in the past 24 hours?

_______________________________________________________________________

_______________________________________________________________________

Technical analysis

_______________________________________________________________________

Bitcoin

The largest cryptocurrency by market cap has had an exciting day as its price reached past the $18,500 mark and pushed towards its all-time highs. Bitcoin managed to get to $19,450 before the momentum started dying off. It is currently consolidating just at the $19,000 mark, fighting to stay above it. This move was enabled by a booming altcoin situation, which led to a money pour-over into Bitcoin.

Any trading to the downside is completely irresponsible now due to how Bitcoin is moving. On the other hand, its movement towards the upside is very hectic, and traders should pay attention to when they enter and exit trades. If Bitcoin establishes its presence above the $19,000 mark with confidence, another push that might break the $20,000 all-time high level is entirely possible.

BTC/USD 2-hour Chart

Bitcoin’s technicals are tilted to the bull-side slightly, with only the weekly time-frame being completely bullish. In contrast, its other time-frames contain a hint of neutrality or even bearishness.

BTC/USD 1-day Technicals

Technical factors (4-hour Chart):
  • Price is above its 50-period EMA and at its 21-period EMA
  • Price slightly above its middle Bollinger band
  • RSI is neutral (55.57)
  • Volume is average
Key levels to the upside          Key levels to the downside

1: $19000                                  1: $18500

2: $19500                                  2: $17,850

3: $19,666                                  3: $17,450

Ethereum

Ethereum’s parabolic move, which brought its price from $480 to $625, has seemingly ended, and Ethereum has entered a consolidation/retracement phase. While it was uncertain whether the second-largest cryptocurrency by market cap will stay above $600, the fight for the level has ended, and ETH moved back below it.

Ethereum has a very strong zone of resistance above $600 and all the way up to $632. On the other hand, it has a decently strong support zone at $575-$580. We can expect Ethereum to move in that range in the short-term unless a new breakout occurs.


ETH/USD 2-hour Chart

Ethereum’s technicals are tilted to the bull-side slightly, with only the monthly time-frame being completely bullish. In contrast, its other time-frames contain slight neutrality or even bearishness.

ETH/USD 1-day Technicals

Technical Factors (4-hour Chart):
  • The price is above its 50-period and slightly below its 21-period EMA
  • Price is near its bottom Bollinger band
  • RSI is neutral (50.82)
  • Volume is above average
Key levels to the upside          Key levels to the downside

1: $600                                     1: $510

2: $630                                     2: $500 

3: $735                                      3: $490

Ripple

The fourth-largest cryptocurrency by market cap’s controversial parabolic rise has died down and actually kept most of its gains. XRP has moved back from its recent highs of $0.78 (and even $0.9 on some exchanges) to a steadier $0.68, which is its current price. We can also see that XRP made a double top at the $0.735 mark, as well as a double bottom at the $0.625 support level.

Trading XRP is more manageable now as the volatility has died down, and the zones of support/resistance have been established. However, trading crypto overall is extremely risky at the moment, and only moves to the upside (and possibly sideways movement) should be traded.

XRP/USD 2-hour Chart

XRP’s 4-hour and daily overviews are completely bullish and show no signs of neutrality whatsoever, while its weekly and monthly overviews show slight neutrality or even a hint of bearishness.

XRP/USD 1-day Technicals

Technical factors (4-hour Chart):
  • The price is far above its 50-period EMA and slightly above its 21-period EMA
  • Price is slightly above its middle Bollinger band
  • RSI is neutral (59.98)
  • Volume is above average
Key levels to the upside          Key levels to the downside

1: $0.79                                     1: $0.625 

2: $0.963                                   2: $0.475

3: $1.01                                    3: $0.443


Categories
Crypto Market Analysis

Daily Crypto Review, Nov 24 – XRP’s Push to $0.9 Manipulated? Ether Breaks $600 on Amazing News

The cryptocurrency sector has spent been in the green overall, with Bitcoin consolidating and altcoins booming. The largest cryptocurrency by market cap is currently trading for $18,364, representing a decrease of 0.36% on the day. Meanwhile, Ethereum gained 4.23% on the day, while XRP gained a whopping 54.14%.

 Daily Crypto Sector Heat Map

Stellar 61.98% in the past 24 hours, making it the most prominent daily gainer in the top100. It is closely followed by XRP’s gain of 52.19% and Verge’s 37.77% gain. On the other hand, SushiSwap lost 11.14%, making it the most prominent daily loser. Quant lost 9.44% while Nexo lost 8.27%, making them the 2nd and 3rd most prominent daily losers.

Top 10 24-hour Performers (Click to enlarge)

Bottom 10 24-hour Performers (Click to enlarge)

Bitcoin’s market dominance has reduced drastically over the course of the day, with its value is currently staying at 60.06%. This value represents a 2.6% difference to the downside compared to the value it had yesterday.

Daily Crypto Market Cap Chart

The crypto sector capitalization has increased significantly over the course of the day. Its current value is $562.75 billion, representing a $21.04billion increase compared to our previous report.

_______________________________________________________________________

What happened in the past 24 hours?

_______________________________________________________________________

_______________________________________________________________________

Technical analysis

_______________________________________________________________________

Bitcoin

The largest cryptocurrency by market cap has stayed pretty stable today as it couldn’t break the $18,500 mark. The price has been hovering right under the level for the whole day, and even made a couple of attempts to break it but to no avail. On the other hand, this small zone of resistance and support wasn’t broken to the downside either, as a break below $18,270 could spell a retracement.

This is a prime example of uncertainty due to Bitcoin’s current level (some are taking profits while some are investing). However, trading pullbacks in a bull trend is extremely risky and should be avoided.

BTC/USD 4-hour Chart

Bitcoin’s technicals are divided, with its daily and monthly overviews showing a slight hint of bearishness alongside the bullishness that overwhelms it. In contrast, the 4-hour and weekly overviews are completely bullish.

BTC/USD 1-day Technicals

Technical factors (4-hour Chart):
  • Price is above its 50-period EMA and at its 21-period EMA
  • Price is at its middle Bollinger band
  • RSI is neutral (53.88)
  • Volume is average
Key levels to the upside          Key levels to the downside

1: $18500                                  1: $17,850

2: $19000                                  2: $17,450

3: $19500                                   3: $17,130

Ethereum

With Ethereum’s 2.0 version 0 launch approaching, Ethereum has continued to increase in price. Today’s move was a continuation of the uptrend that started on Nov 0, additionally fueled by the announcement that the deposits required for Ethereum’s 2.0 version 0 to launch have passed the threshold. This news is a big sigh of relief for the ETH devs, as they were wondering if the protocol will reach its goal on time for the Dec 1 launch. This extremely bullish news has pushed Ethereum past $600, which it is now testing.

If Ethereum manages to successfully stay above $600, it will have very little resistance to the upside and basically trade only versus profit-taking sellers.

ETH/USD 1-hour Chart

Ethereum’s 4-hour and monthly time-frames are completely bullish, while its daily and weekly time-frames are slightly more tilted towards the neutral position.

ETH/USD 1-day Technicals

Technical Factors (4-hour Chart):
  • The price is far above its 50-period and slightly above its 21-period EMA
  • Price is between its middle and top Bollinger band
  • RSI is coming out of the overbought territory (59.88)
  • Volume is above average
Key levels to the upside          Key levels to the downside

1: $600                                     1: $510

2: $630                                     2: $500 

3: $735                                      3: $490

Ripple

The fourth-largest cryptocurrency by market cap has exploded to the upside and reached over $0.90 on the US cryptocurrency exchange Coinbase only to crash back down by roughly 30% in mere seconds. This was its highest price since May 2018. The rally was apparently driven by the Coinbase users as XRP did not see the same heights on any other exchange. Bitstamp and Binance saw a high of only $0.79.

Analysts believe that this rally is a culmination of an uptrend triggered in late Oct when an anonymous whale sent an astonishing $50 million worth of XRP at the time to Bitstamp. Ever since then, XRP/USD has been seeing a strong uptrend, up by 128.63% in the past week.

Trading XRP is simply impossible at the moment due to the amount of risk associated with this type of volatility.

XRP/USD 1-hour Chart

XRP’s 4-hour and weekly overviews are completely bullish and show no signs of neutrality, while its daily and monthly overviews show slight neutrality or even slight bearishness.

XRP/USD 1-day Technicals

Technical factors (4-hour Chart):
  • The price is above its 50-period EMA and at its 21-period EMA
  • Price is slightly above its middle Bollinger band
  • RSI is neutral (53.65)
  • Volume is above average
Key levels to the upside          Key levels to the downside

1: $0.79                                     1: $0.625 

2: $0.963                                   2: $0.475

3: $1.01                                    3: $0.443


Categories
Crypto Market Analysis

Daily Crypto Review, Nov 23 – Ethereum Exploding as its 2.0 Update Launch Approaches; Crypto Market in the Green

The cryptocurrency sector has spent the weekend being quite volatile as Bitcoin had a flash crash, which brought its price below $18,000, followed by a rally that brought it back above it. The largest cryptocurrency by market cap is currently trading for $18,461, representing an increase of 0.61% on the day. Meanwhile, Ethereum skyrocketed by gaining 8.13% on the day, while XRP gained 0.09%.

 Daily Crypto Sector Heat Map

Waves 38.43% in the past 24 hours, making it the most prominent daily gainer in the top100. It is closely followed by Horizen’s gain of 31.65% and Numeraire’s 21.56% gain. On the other hand, Terra lost 5.45%, making it the most prominent daily loser. HedgeTrade lost 3.22% while Crypto.com Coin lost 1.65%, making them the 2nd and 3rd most prominent daily losers.

Top 10 24-hour Performers (Click to enlarge)

Bottom 10 24-hour Performers (Click to enlarge)

Bitcoin’s market dominance has reduced drastically over the course of the weekend, with its value is currently staying at 63.2%. This value represents a 2.9% difference to the downside compared to the value it had on Friday.

Daily Crypto Market Cap Chart

The crypto sector capitalization has increased significantly over the course of the weekend. Its current value is $541.71 billion, representing a $34.48 billion increase compared to our previous report.

_______________________________________________________________________

What happened in the past 24 hours?

_______________________________________________________________________

_______________________________________________________________________

Technical analysis

_______________________________________________________________________

Bitcoin

The largest cryptocurrency by market cap has spent the weekend with decently high volatility as its price managed to go from above $18,500 to $17,600 and then back above $18,500 in just one day. While this “flash crash” is behind Bitcoin, the bulls seem to be more and more wary of the new highs, and a retracement before another push towards the upside is quite possible.

Due to many people taking profits and shorting Bitcoin to hedge their portfolios, the largest currency has a hard time going up. However, trading pullbacks in a bull trend is equally as risky. Bitcoin traders would have the most chance of succeeding if they traded only long positions.

BTC/USD 2-hour Chart

Bitcoin’s technicals are semi-divided, with its daily and monthly overviews showing a slight bullish tilt with signs of bears still present. In contrast, the 4-hour and weekly overviews show no signs of bearish presence and are completely bullish.

BTC/USD 1-day Technicals

Technical factors (4-hour Chart):
  • Price is above its 50-period EMA and at its 21-period EMA
  • Price is at its middle Bollinger band
  • RSI is neutral (51.42)
  • Volume is average
Key levels to the upside          Key levels to the downside

1: $18500                                  1: $17,850

2: $19000                                  2: $17,450

3: $19500                                   3: $17,130

Ethereum

Ethereum’s 2.0 version 0 launch is approaching, and Ethereum bulls seem to be back in the game. The second-largest cryptocurrency by market cap broke out of the ascending (red) line and pushed towards the upside, eyeing the $600 resistance level. While the rally was strong, Ethereum bulls started showing exhaustion at $580. With that being said, the move is still not considered over, and there is more opportunity to the upside.

We mentioned on Friday that Ethereum’s downside is quite defined, but that its upside isn’t. With ETH entering territory that was explored only a couple of times, the opportunity for volatility (but also slippage) is increasing.

ETH/USD 4-hour Chart

Ethereum’s 4-hour and daily time-frames are completely bullish, while its longer time-frames (weekly and monthly) are slightly more tilted towards the neutral position.

ETH/USD 1-day Technicals

Technical Factors (4-hour Chart):
  • The price is far above both its 50-period and its 21-period EMA
  • Price is at its top Bollinger band
  • RSI is extremely overbought (72.01)
  • Volume is above average
Key levels to the upside          Key levels to the downside

1: $600                                     1: $510

2: $630                                     2: $500 

3: $735                                      3: $490

Ripple

The fourth-largest cryptocurrency by market cap has, just like Ethereum, had quite an amazing weekend. XRP continued its rally to the upside that began on Nov 20 and reached as high as $0.49 before starting to consolidate. While consolidating, it has seemingly created a triangle formation that should keep its price at bay before ~80% of the formation is done.

While it is quite unknown how XRP will act right now, all chances are that it will stay within the triangle formation’s bounds for some time, at least.

XRP/USD 1-hour Chart

XRP’s daily and weekly overviews are completely bullish and show no signs of neutrality, while its 4-hour and monthly overviews show slight neutrality.

XRP/USD 1-day Technicals

Technical factors (4-hour Chart):
  • The price is above its 50-period EMA and at its 21-period EMA
  • Price is slightly above its middle Bollinger band
  • RSI is neutral (53.65)
  • Volume is above average
Key levels to the upside          Key levels to the downside

1: $0.476                                   1: $0.3328 

2: $0.509                                   2: $0.3244

3: $0.792                                  3: $0.31


Categories
Crypto Videos

Galaxy Digital Earnings Skyrocketing!


Galaxy Digital’s Q3 Earnings Skyrocketing

Galaxy Digital, a financial firm specializing in digital assets and blockchain technology, has reported that its over-the-counter trading desk reached record volumes in the third quarter. As they stated, this new report signaling that institutional uptake of cryptocurrencies is on the rise. 

The company’s Q3 earnings report showed an astonishing 75% year-over-year increase in trading volumes, as it reached approximately $1.4 billion. The increase was mostly attributed to an expanding counterparty base, the rollout of Galaxy Digital’s electronic trading platform as well as the continued growth of the company’s crypto derivatives business.

Assets under Galaxy Digital’s management totaled $407.4 million at the end of the third quarter, and the assets included $82.4 million in passive Bitcoin and index funds, as well as $325 million in the Galaxy EOS (read it as one word, eos, rather than spelling it) VC Fund. The latter represents a partnership with Block.one, a blockchain merchant bank and EOS founder.

Galaxy’s Bitcoin funds under management increased by 17.3% in the third quarter. While its large-cap Crypto Index Fund made a 32.3% return, the company still wasn’t able to turn a profit. Its Q3 net loss amounted to $44.6 million for the quarter ending Sept 30.

Galaxy Digital was founded in 2018 by a well-known billionaire and crypto evangelist Mike Novogratz. The company was founded in an effort to bring more institutional investors to cryptocurrencies. Novogratz said in an official press release that Galaxy Digital is in the process of preparing itself for the “incoming wave of institutional adoption ahead of digital assets as well as blockchain solutions by investors, corporates, and governments.”

When comparing the 2017 bull market to the current one, we can clearly see that the earlier bull run was largely driven by retail fear of missing out, while the euphoria surrounding Bitcoin in 2020 is quite different, as it is largely tied to institutional uptake.

All the evidence shows that institutional investors are flocking to Bitcoin in far greater numbers in the fourth quarter. Grayscale’s Bitcoin Trust experienced record inflows at the start of Nov, putting it on track to reach an astonishing 500,000 BTC by the end of 2020. That number would amount to roughly 2.7% of Bitcoin’s current circulating supply.


On top of that, institutional investors such as Paul Tudor Jones and Stanley Druckenmiller also not only own Bitcoin but openly talk about its potential benefits. They have both touted the cryptocurrency’s growth potential in the current environment.

Bitcoin’s price peaked at $16,500 in the past week, while it is currently fighting for $16,000, according to TradingView data. Whether the fight for this psychological level is won or lost, Bitcoin’s long-term potential is extremely bullish.


Categories
Crypto Videos

Ex Goldman Sachs VP Seeking SEC’s Approval to get into Crypto With His Company Skybridge!


Another Mainstream Company Seeking SEC’s Approval to get into Crypto

Investment firm SkyBridge, founded by Anthony Scaramucci, a former Goldman Sachs” vice president, is one of the latest companies trying to step into the world of cryptocurrencies.

The company is trying to put together a hedge fund that would include Bitcoin investment, according to a United States SEC filing from Oct 14. The prospectus states: “The Company may seek to gain exposure to Investment Funds or Investment Managers that may enter into derivative transactions. These can include total return swaps, futures, and options. Investments by the Company may also be made in companies that are providing technologies related to digital assets and cryptocurrencies, or other emerging technologies.”

After more than 10 years of progress, the cryptocurrency sector is starting to gain traction on an institutional level. Several mainstream companies as well as individuals have kicked off a notable trend of entering and promoting cryptocurrencies, and most notably Bitcoin.

Billionaire investor Paul Tudor Jones stepped into Bitcoin heavily earlier this year. He also recently stated how early he feels that the investment opportunity still is.

Despite SkyBridge’s interest in investing in Bitcoin, the company still requires approval from the Securities and Exchange Commission before moving forward with the investment. The prospectus includes: “Neither the Securities and Exchange Commission, Commodity Futures Trading Commission nor any other US federal or state governmental agency or regulatory body has approved or disapproved the merits of investing in these securities.”

The prospectus included a section that described” “digital assets” in which it touched on and explained their uses, risks, as well as other points of consideration. The document stated that “Digital assets have no intrinsic value other than being a method of exchange. They are not based on tangible security, commodity, contractual right, or legal obligation” The values of digital assets shouldn’t be expected to be connected or correlated to other traditional economic or market forces, as the value of the investments in digital assets could decline rapidly, and even reach zero” the prospectus says after pointing out the crypto sector’s “tremendous price volatility” seen since its inception. They also added that this kind of volatility goes against the norms shown in other mainstream investments.

Bitcoin has, on the other hand, risen to significant heights in recent weeks and is currently inches away from its all-time high of $20,000.


Categories
Crypto Market Analysis

BTC/USD Weekly Chart Analysis + Possible Outcomes

In this weekly BTC/USD analysis, we will be taking a brief look at the most recent events, current chart technical formations, as well as the possible BTC short-term price outcomes.

Overview

Bitcoin has spent the week constantly pushing towards the upside, with its price moving from around $16,500 on Monday all the way up to $19,000 at one point on Saturday. This left Bitcoin holders in a dilemma: should they hold or hedge their investments. Most holders are already satisfied with the BTC movement and don’t want to invest at such a high price, while some are hedging or even selling their funds to take a profit. On the other hand, such a large rally has “invited” the retail market to join in, and they are the majority of the buy force, alongside institutional investors that do not care about the current price and just want to invest every time they have funds available.

While many analysts called for a stronger pullback long before the most recent push, all significant bear-related signals were false.

Technical factors


Bitcoin has continued moving up, supported by the 50-period MA, which has proven as great support, as well as by the ascending (pink dotted) line. On top of that, the largest cryptocurrency by market cap has done a great job pushing through its previous highs and making higher highs/higher lows. If we consider the year-to-date Bitcoin balance on exchanges dropping 18% and institutions being more and more involved, we can almost certainly expect a long-term price increase.

The hash ribbons indicator is showing miner capitulation (ever since Oct 29), sending out a major buy/accumulation signal.

Likely Outcomes

Bitcoin has one main scenario, as well as one supporting scenario that is likely to play out.

1: If Bitcoin manages to hold the so-called pivot zone (18,250-$18,450), it is almost certain to bounce and reach the all-time high level, and possibly even pass it. In that case, longing Bitcoin after it confirms its position above the pivot zone is a great trade, as it has defined targets (target 1 = Bitcoin’s ATH; target 2 = ride the bull wave and continuously take profit until volume dies out) as well as a defined stop-loss target (right below the pivot zone).

If the first scenario plays out, it will most likely play out on the Nov 23rd, as this is when the pivot zone is meeting the ascending support line and (most likely) the 50-period moving average.

2: The second (and a bit less likely) scenario happens when Bitcoin fails to hold the pivot zone, in which case we can expect a price drop to $17,260.

A move that will end up below $17,260 is highly unlikely, simply due to the overall sentiment currently surrounding Bitcoin.

Categories
Crypto Market Analysis

Daily Crypto Review, Nov 20 – Bitcoin Conquering $18,000: What’s Next in Store?

The cryptocurrency sector has ended up with the majority of cryptos in the green as Bitcoin continued its rally past $18,000. The largest cryptocurrency by market cap is currently trading for $18,095, representing an increase of 1.31% on the day. Meanwhile, Ethereum gained 1.59% on the day, while XRP gained 2.42%.

 Daily Crypto Sector Heat Map

SushiSwap 31.66% in the past 24 hours, making it the most prominent daily gainer out of the top100 cryptos ranked by market capitalization yet again today. It is closely followed by Waves’ gain of 21.42% and CyberVein’s 17.06% gain. On the other hand, Blockstack lost 8.00%, making it the most prominent daily loser. NEM lost 7.73% while ABBC Coin lost 6.77%, making them the 2nd and 3rd most prominent daily losers.

Top 10 24-hour Performers (Click to enlarge)

Bottom 10 24-hour Performers (Click to enlarge)

Bitcoin’s market dominance has reduced slightly over the course of the day, with its value is currently staying at 66.1%. This value represents a 0.2% difference to the downside when compared to the value it had yesterday.

Daily Crypto Market Cap Chart

The crypto sector capitalization has increased over the course of the day. Its current value is $507.23 billion, representing a $12.16 billion increase compared to our previous report.

_______________________________________________________________________

What happened in the past 24 hours?

_______________________________________________________________________

_______________________________________________________________________

Technical analysis

_______________________________________________________________________

Bitcoin

The largest cryptocurrency by market cap has spent the past 24 hours pushing towards and past the $18,000 level after it has won the fight for $17,850. While the move was quite sudden at one point, it was actually not accompanied by a great increase in volume. This has ultimately caused BTC to end its move slightly above $18,200 and start its consolidation phase.

Due to many people taking profits and shorting to hedge their portfolios, Bitcoin has a hard time going up. However, trading pullbacks is equally as risky. Bitcoin traders would have the most chance of success if they traded only pushes to the upside, accompanied by a decent volume increase.

BTC/USD 1-hour Chart

Bitcoin’s technicals on the 4-hour, daily, and monthly time-frame are all bullish but show some signs of neutral presence. On the other hand, its weekly overview is tilted towards the buy-side and doesn’t show any bearishness.

BTC/USD 1-day Technicals

Technical factors (4-hour Chart):
  • Price is above both its 50-period EMA and its 21-period EMA
  • Price is near its top Bollinger band
  • RSI is neutral (57)
  • Volume is slightly below average
Key levels to the upside          Key levels to the downside

1: $18500                                  1: $17,850

2: $19000                                  2: $17,450

3: $19500                                   3: $17,130

Ethereum

Our yesterday’s call for Ethereum traders was that they should wait for the cryptocurrency to confirm its support level or fall under it, and then trade “with the wave.” Ethereum confirmed its position above the yellow dotted line (top line of the ascending channel) and pushed up instantly. The move brought Ether from $470 all the way to $488 before slowing down and starting to consolidate.

While Ethereum’s downside is quite defined, its upside isn’t. Traders should be wary of Ether’s future pushes to the upside, while they should trade any pullback from the retest of the yellow line.

ETH/USD 1-hour Chart

Ethereum’s 4-hour, daily and monthly time-frames are extremely bullish and show no signs of neutrality or bearishness. On the other hand, its weekly overview is still titled to the bull side but does show significant neutrality.

ETH/USD 1-day Technicals

Technical Factors (4-hour Chart):
  • The price is above both its 50-period and its 21-period EMA
  • Price is near its top Bollinger band
  • RSI is neutral after bouncing from almost being overbought(59.32)
  • Volume is average
Key levels to the upside          Key levels to the downside

1: $490                                     1: $470

2: $500                                     2: $451 

3: $510                                      3: $445

Ripple

The fourth-largest cryptocurrency by market cap has spent the day breaking out of its slow price descent and pushing towards the upside. XRP first changed its price direction at $0.284 and quickly pushed towards the upside, reaching as high as $0.306. However, that price did not hold up, and XRP started trading sideways around the $0.3 mark.

XRP traders should still be safe to trade within the range bound by $0.2855 and $0.31. However, since the range is quite large, traders would be even better if they could spot additional small buy/sell walls in the order books before blindly trading.

XRP/USD 1-hour Chart

XRP’s daily and weekly overviews are completely bullish and show no signs of neutrality, while its 4-hour and monthly overviews show slight neutrality.

XRP/USD 1-day Technicals

Technical factors (4-hour Chart):
  • The price is above its 50-period EMA and at its 21-period EMA
  • Price is near its middle Bollinger band
  • RSI is neutral (53.74)
  • Volume is average
Key levels to the upside          Key levels to the downside

1: $0.31                                     1: $0.28 

2: $0.3244                                 2: $0.27

3: $0.3328                                3: $0.266


Categories
Crypto Market Analysis

Daily Crypto Review, Nov 19 – Ethereum 2.0 Most Likely Not Launching on Time; Crypto Sector Consolidating

The cryptocurrency sector has spent the day trying to consolidate after Bitcoin finished its rally. However, while most cryptocurrencies moved less than 1%, almost every one of them ended up in the red. The largest cryptocurrency by market cap is currently trading for $17,708, representing a decrease of 0.73% on the day. Meanwhile, Ethereum lost 0.49% on the day, while XRP lost 1.53%.

 Daily Crypto Sector Heat Map

OKB gained 17.77% in the past 24 hours, making it the most prominent daily gainer out of the top100 cryptos ranked by market capitalization yet again today. It is closely followed by yearn.finance’s gain of 12.48% and SushiSwap’s 11.73% gain. On the other hand, Band Protocol lost 10.00%, making it the most prominent daily loser. Ampleforth lost 9.81% while Aragon lost 7.26%, making them the 2nd and 3rd most prominent daily losers.

Top 10 24-hour Performers (Click to enlarge)

Bottom 10 24-hour Performers (Click to enlarge)

Bitcoin’s market dominance has stayed at exactly the same place over the course of the day, with its value is currently staying at 66.3%. This value represents no difference when compared to the value it had yesterday.

Daily Crypto Market Cap Chart

The crypto sector capitalization has stayed at the same place over the course of the day. Its current value is $495.07 billion, representing a $3.01 billion decrease compared to our previous report.

_______________________________________________________________________

What happened in the past 24 hours?

_______________________________________________________________________

_______________________________________________________________________

Technical analysis

_______________________________________________________________________

Bitcoin

While it may seem that Bitcoin has had a pretty slow and uneventful day, that is certainly not the case. The largest cryptocurrency by market cap has spent the past 24 hours fighting for the $17,850 level and constantly going over and under it. However, the battle is finished, and BTC remains below $17,850 for the time being.

Many traders and analysts are warning BTC traders of a potential triangle formation forming. They also advise traders to refrain from trading until BTC chooses a clear direction.

BTC/USD 1-hour Chart

Bitcoin’s technicals on the daily, weekly, and monthly time-frame are all bullish but show signs of neutral presence. On the other hand, its 4-hour overview is tilted towards the buy-side and doesn’t show any bearishness.

BTC/USD 1-day Technicals

Technical factors (4-hour Chart):
  • Price is slightly above its 50-period EMA and below its 21-period EMA
  • Price is slightly below its middle Bollinger band
  • RSI is neutral (44.71)
  • Volume is slightly below average
Key levels to the upside          Key levels to the downside

1: $18500                                  1: $17,850

2: $19000                                  2: $17,450

3: $19500                                   3: $17,130

Ethereum

Ethereum has established itself above the top line of the ascending channel (yellow dotted line) and is now trading within a new range, bound by the yellow line as support and a new ascending trend line as resistance. Ethereum’s price seems to be in a correction phase at the moment, so we can expect a retest of the yellow line as well as a possible sharp move afterward.

Ethereum traders should wait for the cryptocurrency to confirm its support level or fall under it, and then trade “with the wave.”

ETH/USD 1-hour Chart

Ethereum’s time-frames are slightly tilted towards the buy-side, with its daily overview showing slight bear presence, while its 4-hour and weekly overviews are showing slight neutrality. On the other hand, its monthly overview is completely bullish.

ETH/USD 1-day Technicals

Technical Factors (4-hour Chart):
  • The price is below both its 50-period and its 21-period EMA
  • Price is between its middle and bottom Bollinger band
  • RSI is neutral (41.77)
  • Volume is slightly below average
Key levels to the upside          Key levels to the downside

1: $490                                     1: $470

2: $500                                     2: $451 

3: $510                                      3: $445

Ripple

The fourth-largest cryptocurrency by market cap had another day of slowly marching towards the downside. However, the extremely low volume may be suggesting that the current price movement is a “calm before the storm,” and that a new big move is coming. Analysts are calling for another push towards the upside. Still, a move down is just as likely with the current state of the sector (the crypto sector is currently in a consolidation/correction phase).

XRP/USD 1-hour Chart

XRP’s daily and weekly overviews are completely bullish and show no signs of neutrality or bearishness. On the other hand, its 4-hour and monthly overviews show slight neutrality.

XRP/USD 1-day Technicals

Technical factors (4-hour Chart):
  • The price is below both its 50-period EMA and its 21-period EMA
  • Price is slightly below its middle Bollinger band
  • RSI is pushing towards being oversold (39.45)
  • Volume is below average
Key levels to the upside          Key levels to the downside

1: $0.31                                     1: $0.28 

2: $0.3244                                 2: $0.27

3: $0.3328                                3: $0.266


Categories
Crypto Videos

JP Morgan – Institutions Ditching Gold ETFs For Bitcoin!

Institutions Ditching Gold ETFs For Bitcoin – JP Morgan Opens Up

The demand for Grayscale’s Bitcoin Trust has increased so much lately that it has surpassed all gold ETFs combined, according to JPMorgan Chase, the largest bank in the US.
JPMorgan noted that Bitcoin is eating away at gold ETFs demand very quickly. The news came out in a report shared by Michael Sonnenshein, who is currently the managing director of Grayscale Investments.

More and more institutional investors, such as family offices, are now viewing the world’s largest cryptocurrency as an alternative to the yellow metal used to be a hedge and the go-to safe-haven.
The Grayscale’s Bitcoin Trust flow trajectory in October became significantly steeper, while all gold ETFs remained basically flat. “The contrast between gold ETFs and Grayscale Bitcoin Trust lends support to the idea that investors that invested in gold ETFs previously, such as family offices, maybe looking into Bitcoin and seeing it as an alternative to gold.”


Bloomberg’s report dating from September showed Grayscale’s Bitcoin Trust is outperforming 97% of all US ETFs. The bullish report regarding Bitcoin’s adoption caps off an amazing week for the crypto asset management firm. Sonnenshein stated that his company had recorded the largest raise across its suite of products, totaling $237 million.
While GBTC remains the most popular investment vehicle for Grayscale, the Ethereum Trust is also gaining a lot more traction lately, with a record-shattering $58 million.

Last month, Grayscale’s Ethereum Trust became an SEC-reporting company, which means that it now has to file quarterly as well as annual disclosures with the US securities regulator. The company had over $1 billion worth of inflows in its third quarter of 2020. Its inflows in 2020 are now nearing a whopping $3 billion. Overall, Grayscale has over $9.1 billion worth of assets under management.

All in all, the trend of crypto surpassing traditional asset classes in terms of performance is becoming a trend, which is certainly bringing more and more investments to the sector. With so many institutions joining the movement lately, cryptocurrency is poised to receive the attention of the broader masses in the short future.

Categories
Crypto Market Analysis

Daily Crypto Review, Nov 18 – Bitcoin Encounters Heavy Resistance at $18,500: What Happens Next?

The cryptocurrency sector has spent the day mostly stable and looking at Bitcoin as it kept pushing towards highs unseen after the bull run of late 2017. The largest cryptocurrency by market cap is currently trading for $17.829, representing an increase of 6.64% on the day. Meanwhile, Ethereum gained 2.00% on the day, while XRP lost 1.90%.

 Daily Crypto Sector Heat Map

Nexo gained 14.37% in the past 24 hours, making it the most prominent daily gainer out of the top100 cryptos ranked by market capitalization yet again today. It is closely followed by Bitcoin Gold’s gain of 10.84% and DigiByte’s 9.52% gain. On the other hand, SushiSwap lost 12.92%, making it the most prominent daily loser. Curve DAO Token lost 10.74% while HedgeTrade lost 10.07%, making them the 2nd and 3rd most prominent daily losers.

Top 10 24-hour Performers (Click to enlarge)

Bottom 10 24-hour Performers (Click to enlarge)

Bitcoin’s market dominance has skyrocketed over the course of the day, with its value is currently staying at 66.3%. This value represents a 1.4% difference to the upside compared to the value it had yesterday.

Daily Crypto Market Cap Chart

The crypto sector capitalization has gone up quite a bit over the course of the day. Its current value is $498.06 billion, representing a $20.84 billion increase compared to our previous report.

_______________________________________________________________________

What happened in the past 24 hours?

_______________________________________________________________________

_______________________________________________________________________

Technical analysis

_______________________________________________________________________

Bitcoin

Bitcoin has had a parabolic run to the upside, reaching as high as $18,500 before dropping down. While the price gain was gradual at first, Bitcoin’s final push from $17,600 to $18,500 and then back to nearly $17,000 happened in just a couple of hours. This volatility came to be because BTC encountered heavy resistance at the now-confirmed $18,500 resistance level. Many traders call this move just a temporary pullback before a new high, while a minority is calling a short-term top.

Trading Bitcoin on a bull trend such as this one should only happen in one direction, and that is WITH the trend. Shorting Bitcoin and attempting to catch pullbacks will be far less lucrative due to the size of the move, as well as much riskier.

BTC/USD 1-hour Chart

Bitcoin’s technicals on the 4-hour, daily, and weekly time-frame are all completely bullish and show no signs of bear or neutral presence. On the other hand, its monthly overview is tilted towards the buy-side just slightly and does show some bearishness.

BTC/USD 1-day Technicals

Technical factors (4-hour Chart):
  • Price is far above its 50-period EMA and above its 21-period EMA
  • Price is between its middle and top Bollinger band
  • RSI is stabilizing after leaving the overbought territory (61.38)
  • Volume is descending
Key levels to the upside          Key levels to the downside

1: $18500                                  1: $17,850

2: $19000                                  2: $17,450

3: $19500                                   3: $17,130

Ethereum

Ethereum had had a turbulent 24 hour period, as its price went from fighting for and hovering over the top line of the ascending channel all the way to $495 and then back to $455 before it stabilized at around $475. This move has clearly shown the market another ascending line (red) formed on the ETH/USD chart, which has been tested a couple of times already. This line is Ethereum’s final resistance towards $500.

Ethereum should, as most cryptos at the moment, be traded only to the upside, as trading its pullbacks during a bull market is simply not worth it.

ETH/USD 2-hour Chart

Ethereum’s weekly time-frame shows some neutrality alongside its overall bullish stance, while the other time-frames show complete bullishness.

ETH/USD 1-day Technicals

Technical Factors (4-hour Chart):
  • The price is above both its 50-period and its 21-period EMA
  • Price is slightly above its middle Bollinger band
  • RSI is neutral (55.77)
  • Volume is above average
Key levels to the upside          Key levels to the downside

1: $490                                     1: $470

2: $500                                     2: $451 

3: $510                                      3: $445

Ripple

The fourth-largest cryptocurrency by market cap started off the day by pushing towards the upside and almost reaching its $0.31 resistance level. However, the bears have stepped in and brought XRP’s price down to $0.28 before consolidating in the middle of the range between the two aforementioned levels.

If Bitcoin doesn’t make another sharp move in the short-term, XRP is (yet again) sideways-action crypto. However, if BTC moves, it’s safest to watch Bitcoin and trade along with the bullish moves while discarding the bearish entries.

XRP/USD 4-hour Chart

XRP’s 4-hour, daily, and weekly technicals are tilted towards the buy-side, and while they aren’t showing signs of neutrality, the bullish sentiment isn’t as strong either. The monthly overview does, on the other hand, show clear signs of neutrality.

XRP/USD 1-day Technicals

Technical factors (4-hour Chart):
  • The price is above its 50-period EMA and at its 21-period EMA
  • Price is at its middle Bollinger band
  • RSI is neutral (54.33)
  • Volume is above average
Key levels to the upside          Key levels to the downside

1: $0.31                                     1: $0.28 

2: $0.3244                                 2: $0.27

3: $0.3328                                3: $0.266


Categories
Crypto Market Analysis

Daily Crypto Review, Nov 17 – Bitcoin Crushes $16,500; XRP Explodes to the Upside

The cryptocurrency sector has spent the day trying to reach past its recent highs as Bitcoin pushed past $16,500. The largest cryptocurrency by market cap is currently trading for $16,718, representing an increase of 2.97% on the day. Meanwhile, Ethereum gained 2.34% on the day, while XRP gained an astonishing 10.46%.

 Daily Crypto Sector Heat Map

Curve DAO Token gained 14.27% in the past 24 hours, making it the most prominent daily gainer out of the top100 cryptos ranked by market capitalization yet again today. It is closely followed by yearn.finance’s gain of 12.92% and Litecoin’s 10.99% gain. On the other hand, THORChain lost 7.28%, making it the most prominent daily loser. The Midas Touch Gold lost 6.16% while Uniswap lost 4.22%, making them the 2nd and 3rd most prominent daily losers.

Top 10 24-hour Performers (Click to enlarge)

Bottom 10 24-hour Performers (Click to enlarge)

Bitcoin’s market dominance has decreased slightly over the course of the day, with its value is currently staying at 64.9%. This value represents a 0.1% difference to the downside compared to the value it had yesterday.

Daily Crypto Market Cap Chart

The crypto sector capitalization has gone up very slightly over the course of the day. Its current value is $477.28 billion, representing a $13.89 billion increase compared to our previous report.

_______________________________________________________________________

What happened in the past 24 hours?

_______________________________________________________________________

_______________________________________________________________________

Technical analysis

_______________________________________________________________________

Bitcoin

After confirming its stance above $16,000 after fighting for it over the weekend, the largest cryptocurrency by market capitalization pushed towards $16,500 and attempted to reach new highs. The push was strong as there was no real sell pressure, so Bitcoin reached past $16,500 (and eventually past $16,700) without any real increase in volume. While the $16,500 position has been successfully tested once, the $16,700 level is still not completely won.

Trading Bitcoin on a bull trend such as this one should only happen in one direction: WITH the trend. Shorting Bitcoin and trying to catch pullbacks will be less lucrative due to the size of the move, as well as riskier due to the market sentiment.

BTC/USD 4-hour Chart

Bitcoin’s technicals are tilted towards the buy-side on all four time-frames (4-hour, daily, weekly, and monthly). However, all of them have some form of neutrality, implying that the bullish sentiment is not absolute.

BTC/USD 1-day Technicals

Technical factors (4-hour Chart):
  • Price is far above its 50-period EMA and its 21-period EMA
  • Price is near its top Bollinger band
  • RSI is approaching the overbought territory (65.02)
  • Volume is average
Key levels to the upside          Key levels to the downside

1: $17,000                                 1: $16,700

2: $18000                                  2: $16,500

3: $18500                                   3: $16,000

Ethereum

Ethereum has spent the past two days slowly moving towards the top line of the ascending channel after pulling back to $440. The move was gradual but saw some resistance when it reached the top line. However, Ethereum bulls endured and ultimately broke the level but got instantly stuck at the $470 resistance, which is another wall they have to jump over to remain above this channel.

If Ethereum’s struggles to break the $470 level continue, we may expect a pullback of some sort. With that being said, due to the overall sentiment towards Ethereum (and its 2.0 implementation) as well as the state of the crypto sector, shorting Ethereum should not be a proper trading strategy, even if ETH does pull back.

ETH/USD 4-hour Chart

Ethereum’s 1-day technicals are slightly bullish but are showing signs of neutrality. On the other hand, its 4-hour, weekly, and monthly overviews are completely tilted towards the buy-side.

ETH/USD 1-day Technicals

Technical Factors (4-hour Chart):
  • The price is above both its 50-period and its 21-period EMA
  • Price is slightly above its middle Bollinger band
  • RSI is neutral (57.54)
  • Volume is average
Key levels to the upside          Key levels to the downside

1: $470                                     1: $451

2: $490                                     2: $445 

3: $500                                      3: $420

Ripple

The fourth-largest cryptocurrency by market cap had yet another incredible day, with its price pushing past the $0.27 and even $0.2855 resistance levels. An incredible bull wave brought XRP’s price to $0.3 before it started to pull back slightly. This move has pushed XRP further up towards being the best-performing asset over a 1-week period compared to BTC and ETH, with gains of 18% this week, compared to BTC’s gains of 2.95 and ETH’s gains of 0.76.

Traders can finally look at XRP as a cryptocurrency that isn’t just used for sideways trading, and look for opportunities near new highs.

XRP/USD 4-hour Chart

XRP’s 4-hour, daily, and monthly technicals are slightly tilted towards the buy-side, and all of them are showing more or less signs of neutrality. The weekly overview is, on the other hand, completely bullish.

XRP/USD 1-day Technicals

Technical factors (4-hour Chart):
  • The price is above its 50-period EMA and its 21-period EMA
  • Price is at its top Bollinger band
  • RSI is heavily overbought (76.99)
  • Volume is above average
Key levels to the upside          Key levels to the downside

1: $0.31                                     1: $0.2855 

2: $0.3244                                 2: $0.27

3: $0.3328                                3: $0.266


Categories
Crypto Market Analysis

Daily Crypto Review, Nov 16 – Bitcoin to be Censored? Blockseer Mining Pool Enters the Game

The cryptocurrency sector has spent the weekend pretty flat as Bitcoin was experiencing a period of low volatility. The largest cryptocurrency by market cap is currently trading for $16,272, representing an increase of 1.37% on the day. Meanwhile, Ethereum lost 1.19% on the day, while XRP lost 0.69%.

 Daily Crypto Sector Heat Map

SushiSwap gained 13.81% in the past 24 hours, making it the most prominent daily gainer out of the top100 cryptos ranked by market capitalization yet again today. It is closely followed by THORChain’s gain of 9.54% and Curve DAO Token’s 4.80% gain. On the other hand, ABBC Coin lost 45.16%, making it the most prominent daily loser. The Midas Touch Gold lost 8.96% while Ampleforth lost 8.88%, making them the 2nd and 3rd most prominent daily losers.

Top 10 24-hour Performers (Click to enlarge)

Bottom 10 24-hour Performers (Click to enlarge)

Bitcoin’s market dominance has decreased slightly over the weekend, with its value is currently staying at 65%. This value represents a 0.3% difference to the downside compared to the value it had on Friday.

Daily Crypto Market Cap Chart

The crypto sector capitalization has gone up very slightly over the course of the weekend. Its current value is $463.37 billion, representing an $0.51 billion increase compared to our previous report.

_______________________________________________________________________

What happened in the past 24 hours?

_______________________________________________________________________

Blockseer, a US-based DMG Blockchain Solutions’ subsidiary, has recently announced a private beta version of a brand new Bitcoin mining pool. This particular mining pool is, however, quite unique and different. The Blockseer Mining Pool will, unlike any other mining pool, censor transactions from wallets that are blacklisted. They also plan on mandating the miners to undergo KYC procedure, according to marketing materials.

Any new blocks generated by the Blockseer pool will include only filtered transactions, and the filters will be based on the Walletscore’s data.

While some agree that this way of transacting might be the future, the vast majority of public figures say that this is pure censorship and that it goes against the basic principles of Bitcoin as a free cryptocurrency, where a transaction is a transaction, no matter where it comes from.

_______________________________________________________________________

Technical analysis

_______________________________________________________________________

Bitcoin

The largest cryptocurrency by market capitalization has spent the weekend experiencing very low volatility while fighting an incredibly important battle. Bitcoin was fighting to stay above the $16,000 mark after the move to the upside has died down at $16,500 on Nov 13, thus triggering a pullback.

An interesting outlook on Bitcoin is that the now won fight for $16,000 has created a higher low, and Bitcoin might push even higher in the following days. Traders should pay attention to volume increases around the $16,400-$16,500 mark.

BTC/USD 4-hour Chart

Bitcoin’s technicals are tilted slightly to the buy-side on the 4-hour, daily and weekly time-frames. However, all of these time-frames show signs of neutrality. On the other hand, its monthly overview is completely bullish.

BTC/USD 1-day Technicals

Technical factors (4-hour Chart):
  • Price is above its 50-period EMA and at its 21-period EMA
  • Price is near its middle Bollinger band
  • RSI is neutral (58.99)
  • Volume is slightly above average
Key levels to the upside          Key levels to the downside

1: $16,500                                 1: $16,000

2: $16,700                                 2: $15,480

3: $17,000                                  3: $14,640

Ethereum

Ethereum has, just like Bitcoin, spent the weekend fighting to stay above its support level. The second-largest cryptocurrency by market cap, however, did not manage to win its fight. Ether has triggered a pullback after bouncing from the $478 level, which caused its price to first hover around the yellow top ascending channel line until it finally broke it to the downside. The move was stopped at $440, and Ethereum has since recovered and is currently trading just below the yellow line.

Our call on Friday for Ethereum dropping below the line was correct, as ETH did exactly as expected. However, the combination of factors at the moment make Ethereum a not-so-good trade, and traders should perhaps look at other options before choosing to trade it.

ETH/USD 4-hour Chart

Ethereum’s technicals are extremely bullish on its weekly and monthly time-frames and very bullish (but not as much as the aforementioned time-frames) on its daily overview. Its 4-hour overview, however, is tilted heavily towards the sell-side.

ETH/USD 1-day Technicals

Technical Factors (4-hour Chart):
  • The price is slightly above its 50-period and slightly below its 21-period EMA
  • Price is slightly below its middle Bollinger band
  • RSI is neutral (47.32)
  • Volume is average
Key levels to the upside          Key levels to the downside

1: $470                                     1: $451

2: $490                                     2: $445 

3: $500                                      3: $420

Ripple

The fourth-largest cryptocurrency by market cap had an incredible day on Friday, as its price pushed above 2 of its major resistance levels. XRP has managed to, in a span of around 12 hours, push past the $0.26 and $0.266 levels and took the weekend to consolidate above them and create a strong foundation. The $0.266 level was tested as support twice already, successfully both times.

Traders can finally look at XRP as a crypto that moves somewhere else than sideways, and look for opportunities in places other than the range between $0.2454 and $0.26.

XRP/USD 4-hour Chart

XRP’s technicals are slightly tilted towards the buy-side on all time-frames, with more or less neutrality signs. The important change from the last report (and many reports before) is XRP’s monthly overview, which has finally turned bullish.

XRP/USD 1-day Technicals

Technical factors (4-hour Chart):
  • The price is above its 50-period EMA and slightly above at its 21-period EMA
  • Price is between its middle and top Bollinger band
  • RSI is neutral (59.63)
  • Volume is average
Key levels to the upside          Key levels to the downside

1: $0.27                                     1: $0.266

2: $0.2855                                 2: $0.26

3: $0.31                                    3: $0.2454


Categories
Crypto Guides

What Should You Know About Bitcoin Miner Capitulation?

Introduction

If you have dealt with cryptocurrencies like Bitcoin, you must know how uncertain they can be. While they can make you a millionaire within a day, they can also snatch away all your money in a short period. People who mine their money in Bitcoin have to keep a close eye on these fluctuations and ensure they take themselves out while there is still time. The same may be happening with Bitcoin.

You may have heard the experts talk about Bitcoin Miner Capitulation. Some of those also try to explain the concept in their own words. However, there is still a major confusion around the term “Miner Capitulation.” If you also want to learn more about the concept, you have come to the right place. We have collected all the crucial information on the topic to understand what exactly is happening with Bitcoin. So let’s begin.

What Is Bitcoin Miner Capitulation?

Bitcoin mining refers to the completion of verified transactions’ blocks that get appended to the blockchain. For these transactions, miners earn a reward in the form of cryptocurrency. If the miner isn’t able to manage to make out their operational costs from the Bitcoin mining process, they sell a significant amount of their mined Bitcoins. This leads to Bitcoin Miner Capitulation.

On the other hand, Miner Capitulation can also result from sudden drops in the Bitcoin market as this makes miners sell their coins. Hence, we can say that Bitcoin Miner Capitulation is when small miners can’t profit from their mining, and they back out. It creates selling stress in the market, leading to further drops in the price and a lack of buyers.

Is This First Bitcoin Miner Capitulation?

Many people dealing with Bitcoin assume this is the first time Bitcoin is experiencing a Miner Capitulation. But the facts state something different. Miner Capitulation has been seen twice in the history of Bitcoin:

  • 2016: When Bitcoin Halving took place this year, it was seen that miners began selling a significant amount of their Bitcoins.
  • 2018: Bitcoin again crashed by 50%, getting a value of $3,000 from $6,000. This led to low profits for small miners, and they again sold their Bitcoins in massive amounts.

Apart from these, the 2013 effect on Bitcoin’s price also brought in some Miner Capitulation. Therefore, this isn’t the first time Bitcoin is experiencing one such situation. It has happened whenever Bitcoin Halving takes place or the price drops down.

Is Bitcoin Miner Capitulation Something To Worry About?

It is usual for a big market like Bitcoin to host thousands or millions of transactions every day. So when some of the miners sell their coins, how does that make any difference? The answer to this question is simple, i.e., the tension of sale in the market.

With these small miners selling their coins, many other people also begin considering selling their coins. This stress rises with more sales. Moreover, it causes a lack of buyers in the market, and Bitcoin’s price falls further.

People are relating Bitcoin Miner Capitulation to more significant problems that may be seen in the upcoming times. That is why you must learn more about the current situation and take action while there is still time to save yourself from any bigger trouble.

Categories
Crypto Market Analysis

BTC/USD Weekly Chart Overview + Possible Outcomes

In this weekly BTC/USD analysis, we will be taking a brief look at the most recent events, the current chart technical formations, as well as the possible BTC price outcomes.

Overview

Bitcoin has spent the week building an ascending channel that took its price from the $14,640 level all the way to $16,500. However, the new levels are mostly unexplored (apart from the late 2017 mini-bubble), and people that already invested in Bitcoin are either holding or taking profits, while new investors are wary of entering due to the price reaching this high. This left Bitcoin with a lot of people holding, a minority taking profit, and even a smaller minority wanting to buy it at $16,500 at the moment, which triggered a pullback. This doesn’t mean that $16,500 is an overestimate of Bitcoin’s worth, but rather that the economic uncertainty around the new US presidency, an unstable stock market as well as regulatory bodies honing in on crypto are all factors in the current minor pullback.

Our previous weekly analysis has predicted the price increase to $16,500 as well as the pullback. This doesn’t mean that the bull season has ended or that bears have taken over for good, but rather that BTC entered a healthy correction phase before establishing a new price target.

Technical factors


Bitcoin has continued moving along the ascending channel started on Nov 7 and gaining in value up until the $16,500 resistance level that we called out. This level has triggered a pullback as BTC could not pass the zone of resistance. While the pullback was mostly sideways and slow, a confirmation of a real pullback happening occurred on Nov 14, when Bitcoin dropped out of the ascending channel as well as below the $16,000 psychological level.

While Bitcoin’s sentiment is extremely bullish overall, its short-term overview points to a pullback that will most likely end at the zone of support near the $15,480 level.

The hash ribbons indicator is still showing miner capitulation (ever since Oct 29), sending out a major buy signal.

Likely Outcomes

Bitcoin has one main scenario that is most likely to play out, which is its price continuing down towards the $15,480 area where it will encounter strong support, which will most likely stop it from going further down. If this happens and Bitcoin does bounce off of the $15,480 area, we may expect another push towards the recently-made highs. In this case, traders should have a clear path towards $16,500 again, and they should pay attention to BTC, possibly making a double top at its most recent high rather than surpassing the level.

A move that will end up below $15,480 is highly unlikely, simply due to the overall sentiment currently surrounding Bitcoin. However, as unlikely as it is, anything is possible, and Bitcoin might fall below the support level. In that case, traders can expect a sharp price decrease and a possible push towards the $14,640.

Categories
Crypto Videos

Bitcoin Over Gold in the Long Run – JP Morgan’s Stance!

Bitcoin Over Gold in the Long Run – JP Morgan’s Market Analysis


Bitcoin’s 2020 surge is poised to continue in the long run as the digital cryptocurrency is a direct competitor to gold, as it can now be classified as an “alternative” currency, JPMorgan stated in a public statement.
Bitcoin has surged more than 90% year-to-date, and the announcement that PayPal would enable its users to buy, sell, hold, and even use cryptocurrencies served as yet another high-level endorsement for the sector.

Earlier this in October, Square purchased $50 million worth of Bitcoin as proof of further commitment to viewing the cryptocurrency as a long-term investment. On top of that, Microstrategy has invested over $250 million in Bitcoin, stating that investing in the largest cryptocurrency by market cap is not a speculation or a hedge, but a deliberate corporate strategy.
However, Bitcoin is still a relatively small asset, and the crypto sector as a whole a small asset class. It has been, up to recently, mostly favored by millennial investors rather than the older generations that predominantly favor gold or other precious metals.

The physical gold market, according to JP Morgan, is currently worth around $2.6 trillion, and that number includes assets held within gold ETFs as well. If Bitcoin wants to catch up to gold in terms of market value, the cryptocurrency would have to increase its market capitalization over ten times from current levels.
“Even a modest branching out of gold as an ‘alternative’ currency and into Bitcoin over the longer term would imply Bitcoin’s price doubling or tripling,” JPMorgan said.
Over time, crypto could be held for reasons other than being a store of value as gold is, according to JPMorgan.

“Cryptocurrencies have intrinsic value and derive it not only because they serve as stores of value but also due to their utility as a means of payment. As the world adopts cryptocurrencies as a means of payment in the future, their utility and value will grow” JPMorgan explained.
Putting it simply, the risk is to the upside for Bitcoin.

The potential upside in the long-term for Bitcoin is considerable as it competes more intensely with gold as an ‘alternative’ currency. JP Morgan came to this conclusion as they see Millenials becoming a more important component of investors’ universe as time passes.
The long-term technicals are also pointing to a surge in Bitcoin.

Categories
Cryptocurrencies

Bitcoin and Blockchain Will Completely Change the World and Here’s Why…

Most large companies are already adapting to the Blockchain, such as IBM or Microsoft, and more and more are accepting Bitcoins as a payment method. Many others join in consortiums to enter this new sector. We are at the beginning of a real revolution.

The Bitcoin is…

Bitcoin has risen a lot since its inception. Is it too late to invest?. This is a fairly recurring question today. My answer would be categorically negative, as the cryptocurrency market is only in its infancy and will continue to grow. And if we compare the capitalization of Bitcoin, 44 trillion dollars, with the capitalization of other financial assets, we realize how small this market still is.

Is a bubble forming in cryptocurrencies?

No. If I walk down the street right now and randomly ask 10 people, “What is Bitcoin?”, only one of them will know what it is, and surely will possess none. And if he then asked “And ethereum?” none of them would know. So, until the day comes when I hear recurring conversations from people who are investing in cryptocurrencies, there won’t be a bubble.

In addition, if we compare it with the dot-com bubble in the year 1999-2000, the market capitalization of American technology companies at its peak, was 1,750 billion dollars, which considering inflation, today equals 3,745 B$. If we compare it with the capitalization of all cryptocurrencies, 87 B$, we realize that the cryptocurrency market is very far from those levels, and especially if we think that in this case, the market is global, not only from the US.

What do I like most about bitcoin?

There are attractive advantages due to the use of Bitcoin against the Euro or other conventional currencies, such as decentralization, speed, immutability, divisibility, privacy (no one has to know my personal data), transparency (everything is registered in the Blockchain without being able to be removed or modified), lower costs, greater security (when there have been robberies of hackers, have been to companies that contained Bitcoins, but have never hacked the Bitcoin protocol or any other Blockchain system)elimination of intermediaries, etc.. The problem of double spending is fundamentally solved. If for example, I send a PDF document or an image, what I really do is send a copy and I can send it to as many people as I want, but until the creation of Bitcoin, There was no way we could send money with a technology that would ensure that the issuer did not keep the money.

However, in my opinion, the biggest problem that is solved is that of the constant fall in the purchasing power of our currencies. Before the Federal Reserve was created (in green color) the purchasing power of the dollar did not diminish, but once there existed a Central Bank capable of “playing” with money by printing new units, and the gold standard was abandoned allowing printing new dollars without limit, the value of the currency has been falling constantly, in the same way as all other conventional currencies. The value of $1 at the beginning of the last century is less than 5 cents today.

This constant loss of value of the coins we have in our pockets occurs because when Central Banks print many new coins the money supply is increased in this way. The creation of money is based on the creation of debt, a system that does not seem sustainable in the long term (global debt today amounts to more than 200 trillion dollars).

What is shocking is that in the wake of the last crisis of 2008, the Central Banks have printed a stratospheric amount of money, which will considerably aggravate this situation in the nearest future. But also, we can observe that the monetary offer of the Bitcoin presents a totally opposite panorama since less and less new Bitcoins are generated until in a few years no more will be created, having reached the limit of 21 million units (the vast majority of other cryptocurrencies follow the same line).

For this reason, I associate bitcoin as a kind of digital gold. If for example today we want to buy a motorcycle for 5,000€, we can also do it using four ounces of gold. In 30 years, for example, it could be that with this €5,000 we only got to buy the wheels, while using the four ounces of gold we will continue to be able to buy the entire bike.

The Blockchain is…

It is the technology that appeared with the creation of Bitcoin, the one behind the other cryptocurrencies, and that allows its decentralization. I see the Blockchain as the new internet and cryptocurrencies as an element within it. In other words, I think that on the assumption that cryptocurrencies would not succeed, the Blockchain would.

The Blockchain also allows, for the first time in life, make transactions without trusting the other party. We can make transactions with people we don’t know without the need for intermediaries such as banks or companies like Visa or Paypal that today act as “referees” generating the confidence to exchange money. Then we can be sure by saying that we are changing from the age of the internet of information to a new phase of the internet of value because the Blockchain allows this transfer of value.

I also think that the Internet of Things (IoT) is another revolution that will be presented in the coming years, since the Internet of Things (IoT) needs a record of things, this record cannot be other than the Blockchain.

But… What is the real problem you solve?

In my view, the power of the Blockchain goes beyond… It solves the big problem in our society today, which is the exponential increase in the gap between rich and poor. Every day the rich get richer and more control over others. I don’t see how sustainable it is that the 62 richest people on the planet already have more money than 3.6 million people (half of the world’s population, the poorest), or that companies like Apple, Facebook, or Google already have a value higher than the GDP of most countries.

While companies have continued to increase their profits and the pace seems to be accelerating, wages have remained flat even falling. And if we look at countries like Spain, in the wake of the 2008 crisis, we would see how this difference is much more noticeable.

So how does the Blockchain solve it? Distributing wealth from its origin in a fair way instead of trying to redistribute it a posteriori with taxes on high incomes, or other measures, which are not really implemented, since the greatest fortunes are those that tax less in percentage.

With the use of the Blockchain, I imagine a future where artists will be able to sell their own music, paintings, etc.. directly without the need for intermediaries to keep most of the revenue. A singer can upload their songs on the Blockchain and with the use of Smart Contracts can define the conditions of use of their music. For each user that plays the song, the author will receive fractions of cents. If radio stations use it or are added to corporate advertising spots, for each broadcast you will automatically receive the money. Then many investors will be able to live on their abilities.

The large technology companies and social networks that earn billions of dollars a year with our personal and private information must pay us for every information they want to know about us (age, nationality, what we like, etc..) and companies that want us to see their ads will also have to pay us to view or listen to them. So what do we do with this money we’re getting? Without thinking, it will be used to consume all kinds of products such as music or reading (for each display of an article your author will receive fractions of euros). In this way, instead of almost all the wealth that is created going into the hands of a few large centralized companies, there will be a decentralization of the system allowing much of this wealth to be distributed fairly among users.

And… why do I like Ethereum better than Bitcoin?

Precisely for this reason, because it is the Blockchain system that using Smart Contracts allows using this new technology in many different cases. Apart from performing the function of currency and value storage without the loss of purchasing power (like Bitcoin), it allows building any kind of decentralized business/projects or other cryptocurrencies.

It is for this reason that Bitcoin associated it as the currency of the future and Ethereum as the commodity of the future. In the same way that many companies need oil, especially since the first industrial revolution, or need the internet since their revolution two decades ago, in the near future I think the Blockchain will be needed for virtually everything imaginable. In this way, if Ethereum is positioned as the leading platform of Blockchain, the demand for its tokens will be huge making ethers worth tens of thousands of euros per unit.

And how to invest in Blockchain?

Unless the project we like creates its own tokens and launches an ICO where we can invest, then it is more difficult. There are very few shares listed on Blockchain, and most of them are listed funds that in my humble opinion do not have too much value.

There are curious cases like GBTC (Bitcoin Investment Trust) that tries to replicate the price of Bitcoin (so no, it does not represent the investment in Blockchain) And if you go to a website and are able to analyse all information on how many Bitcoins each represents their stock in circulation, you realize that currently, their shares are trading almost twice as much as they should. In other words, investors buying this stock are paying double for each Bitcoin.

In my opinion, the best option and the only quoted company focused 100% on Blockchain is BTL (BTL Group Limited), which has created the “interbit” Blockchain platform. One of the sectors in which they are present is energy with BP, Eni, and Wien Energie already testing their platform. And one of the reasons I like to invest is because of the fact that it capitalizes 58 million euros, when the capitalizations that are being achieved by similar Blockchain private companies, are around 1 billion euros.

In conclusion, investing in Blockchain and cryptocurrencies is a very smart idea. The risk is asymmetric because in the medium and long term the probability of prices falling I think is low, and in this case obviously the most we can lose is the capital invested. But if cryptocurrencies and the Blockchain are successful, the capital invested will be multiplied many times, making it statistically worthwhile to be exposed to these markets.

Today there are already more than 900 cryptocurrencies and I think we are going towards a future of “tokenization of everything”, where any company or person can have their own tokens for very different purposes.

Categories
Crypto Market Analysis

Daily Crypto Review, Nov 13 – Bitcoin Above $16,000: What’s Next?

The cryptocurrency sector has spent the day equally divided between cryptos that ended up in the red and the green. The largest cryptocurrency by market cap pushed past its $16,000 mark and is currently trading for $16,291, representing an increase of 3.26% on the day. Meanwhile, Ethereum lost 0.15% on the day, while XRP gained 0.45%.

 Daily Crypto Sector Heat Map

Blockstack gained 33.78% in the past 24 hours, making it the most prominent daily gainer out of the top100 cryptos ranked by market capitalization yet again today. It is closely followed by Dash’s gain of 13.33% and Decred’s 8.98% gain. On the other hand, ABBC Coin lost 12.08%, making it the most prominent daily loser. Ampleforth lost 11.75% while Aragon lost 10.85%, making them the 2nd and 3rd most prominent daily losers.

Top 10 24-hour Performers (Click to enlarge)

Bottom 10 24-hour Performers (Click to enlarge)

Bitcoin’s market dominance has increased since we last reported, with its value is currently staying at 65.3%. This value represents a 0.8% difference to the upside compared to the value it had yesterday.

Daily Crypto Market Cap Chart

The crypto sector capitalization has gone up over the course of the day. Its current value is $462.86 billion, representing an $8.70 billion increase compared to our previous report.

_______________________________________________________________________

What happened in the past 24 hours?

_______________________________________________________________________

_______________________________________________________________________

Technical analysis

_______________________________________________________________________

Bitcoin

The largest cryptocurrency by market capitalization has tested the $16,000 mark for a long time, failing a couple of times as profit-taking chipped away too much bull power. However, BTC has officially broken the $16,000 resistance today, turning it into support. The move that pushed it past this mark has ended right at the $16,500 resistance, which held up quite well. Many say the reason for the move past $16,000 is that banks and firms are moving their funds into BTC due to uncertainties in the traditional markets (major indexes traded slightly in the red yesterday). An engulfing candle that followed the last green candle of the move, as well as RSI bouncing off of the overbought area, show that a correction is the most likely option at the moment.

Slow and steady increases in volume accompanied each of Bitcoin’s moves. Traders can use this info to enter and exit trades safely.

BTC/USD 4-hour Chart

Bitcoin’s technicals are bullish overall but are split between the 4-hour and weekly time-frames, which are more tilted towards the neutral position, and daily and monthly time-frames, which are completely bullish.

BTC/USD 1-day Technicals

Technical factors (4-hour Chart):
  • Price is well above its 50-period EMA and its 21-period EMA
  • Price is near its top Bollinger band
  • RSI is near the overbought territory (64.03)
  • Volume is slightly above average
Key levels to the upside          Key levels to the downside

1: $16,500                                 1: $16,000

2: $16,700                                 2: $15,480

3: $17,000                                  3: $14,640

Ethereum

Ethereum has continued its upward path, supported by its ascending channel top line. The second-largest cryptocurrency by market cap managed to hold itself above this level, effectively slowly increasing in price due to the slope of the support line. However, it is yet to be seen if ETH can stay above this level for long, and a potential drop below the line is quite possible.

Ethereum traders should look for ETH dropping below the top line of the ascending channel and trade off of that.

ETH/USD 4-hour Chart

Ethereum’s technicals are bullish on all time-frames, with its 4-hour time-frame being more tilted towards the neutral position and longer time-frames being completely bullish.

ETH/USD 1-day Technicals

Technical Factors (4-hour Chart):
  • The price is above its 50-period and slightly above its 21-period EMA
  • Price is slightly above its middle Bollinger band
  • RSI is neutral (53.64)
  • Volume is average
Key levels to the upside          Key levels to the downside

1: $470                                     1: $451

2: $490                                     2: $445 

3: $500                                      3: $420

Ripple

The fourth-largest cryptocurrency by market cap has had a slow day of sideways action within the range it is in for almost a week. XRP has moved slightly towards the middle of the range after it failed to break the $0.26 resistance level, entering a period of low volatility.

Traders shouldn’t really be interested in XRP at the moment due to its low volatility. However, those that want to trade XRP can enter trades with targets and stop-losses that correspond to the current support/resistance levels.

XRP/USD 4-hour Chart

XRP’s technicals on the 4-hour and daily time-frame have changed its stance from bullish/neutral to straight bullish, while its weekly time-frame is still almost completely neutral. Its monthly overview shows strong bearish sentiment.

XRP/USD 1-day Technicals

Technical factors (4-hour Chart):
  • The price is above its 50-period EMA and at its 21-period EMA
  • Price is at its middle Bollinger band
  • RSI is neutral (50.34)
  • Volume is slightly below average
Key levels to the upside          Key levels to the downside

1: $0.26                                     1: $0.2454

2: $0.266                                   2: $0.235

3: $0.27                                    3: $0.227


Categories
Crypto Videos

Bitcoin Is Digital Gold & Not Currency: Mike Novagratz!


Bitcoin is Digital Gold, Not a Currency – Mike Novogratz

Billionaire investor Mike Novogratz has recently doubled down on a call that Bitcoin serves as digital gold rather than as currency, at least at the moment.
“I don’t think that Bitcoin is going to be used as a currency anytime in the next five years,” said Novogratz, Galaxy Investment Partners’ founder and chief executive officer, in an interview with Bloomberg TV. He added that Bitcoin is currently being used as a store of value, similar to gold, and that it will most likely remain that way for some time.

Crypto fans have argued that Bitcoin can serve as currency as they raised concerns about central banks worldwide printing money during the pandemic and about the potential for inflation to shoot much higher. They point out that central banks are looking into creating CBDC’s, their own digital assets, while China is at the forefront of development as it is already testing its digital yuan.
“And Bitcoin as a gold-like asset, as digital gold is going to keep going higher and higher,” said Novogratz. “As time passes, more and more people are going to want Bitcoin as some portion of their portfolio very soon, if they don’t want it already.”


Bitcoin has rallied more than 93% in 2020, climbing beyond $13,000 and even reaching past $14,000 at one point, just a week after PayPal Holdings Inc. announced that it would allow its customers to buy, sell, hold, and eventually use cryptocurrencies. Bitcoin is currently preparing for a big move as it has recently failed to break the $13,900 resistance and stay above it with confidence.

Novogratz, as well as many other crypto fans, heralded the PayPal news as game-changing, mostly citing PayPal’s large user base that can be used to gain mass adoption. Customers on the platform will have the option to buy, sell and hold several cryptocurrencies, including Bitcoin, Ethereum, Bitcoin Cash, and Litecoin, as well as use these cryptocurrencies to shop at the 26 million merchants on its network, including its popular payment app Venmo.

Novogratz forecast that companies including Visa, E*Trade Financial, Mastercard, as well as American Express will follow PayPal’s initiative “within a year” and that they will offer platforms where their merchants will have the option to transact in stablecoins as well as non-stable cryptocurrencies.
“It’s no longer a debate of whether crypto is a thing, if Bitcoin is an asset, or if the blockchain is going to be a part of the financial infrastructure,” said Novogratz. “It’s no longer a matter of if, it’s when, and every single company has to have a plan very soon.”

Categories
Cryptocurrencies

Up In Arms About Bitcoin? You’ll Want to Read This…

For the first time in history, there is the possibility of creating a new decentralized monetary system where all of us would benefit greatly. Throughout this article, it will be shown how money is being created from nothing and how Bitcoin solves the problems of the current system.

Jamie Dimon, CEO of JPMorgan, the world’s largest bank, commented that bitcoin was a bubble. In my opinion, this man being one of the only billionaire bankers earning almost 30 million a year, thanks to the current financial and banking system, it is normal that he opposes what competition does to him and can take him out of business, that is, bitcoin. The funny thing is that while Jamie Dimon was making these statements against cryptocurrency, his own bank was buying a lot of bitcoins.

Something similar happens with China, while its Central Bank wants to outlaw investments in ICOs, claiming that this new type of investment is seriously disrupting the financial and economic order, what it is doing is creating its own cryptocurrency. In fact, it is most likely the first country to create its own blockchain, since they have been experimenting for three years and have already commissioned several experts to help them carry it out.

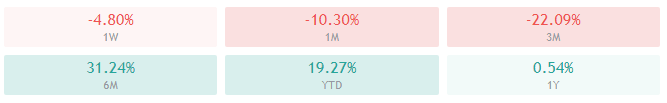
So when this kind of negative news comes out, prices drop sharply. What happened in early September 2017 reminded me a lot of what happened last February 9 of the same year, when bitcoin plummeted by more than 10% when it became known that the Chinese Central Bank forced exchange houses to ban bitcoin withdrawals from their platforms for a month, and warned them that it would shut them down if they violated regulations.

The fact that central banks like China were so nervous about bitcoin, gave me more confidence to invest in this cryptocurrency, as the situation indicated that bitcoin should be much more powerful than most people imagined, to the extent that it could bypass the central banks, which currently have the greatest control over the economies.

A funny investment strategy would be to invest in what China prohibits, since in the past this country has banned Google, Facebook, Twitter, cloud services, Instagram, Snapchat, Pinterest, etc. So wanting to ban bitcoin, Makes me want to buy even more.

I want to point out that it is impossible to ban bitcoin or any other cryptocurrency. What governments can prohibit, is the activities of the exchange houses, that is, that these companies cannot open accounts to the citizens of the country, but they can never have any power over cryptocurrencies. In the event that a country bans these activities, its citizens could continue to have bitcoins, and from their wallets, they could continue to receive and send them. The only thing they couldn’t do is set up an account at the exchange houses.

In this way, I continue to think that prohibitions or negative comments from institutions or important people who are doing business in the traditional sector, do nothing but validate the great value of the cryptocurrency and ICOs market. So even if in the shortest term prices fall when news of this type is published, these facts will have to raise prices in the medium and long term, since this acceptance of value is what matters in the long run.

The Central Banks of other countries also start using blockchain. In the case of Russia, its central bank is also investigating and developing a blockchain. Vladimir Putin met with Vitalik Buterin, one of the founders of Ethereum, as he believes that the digital economy is essential for creating new business models, and sees Ethereum as a great tool to help Russia grow without so much dependence on oil and gas.

In this way, the Central Banks will no longer depend on monthly business surveys or the collection of data from the statistical centres, but in real-time, all the data will be available in a transparent and truthful manner, able to adapt monetary policies to an unprecedented level of precision.

But while I love to see the blockchain increasingly applied, I don’t like the central banks, banks, or governments to do it because they want to have even more control of the economy and that the current closed and centralized system will have even greater power.

How Money is Created

Governments spend more than they earn by creating deficits, and by financing it, they issue bonds, thus increasing the national debt, which we citizens pay through taxes. Banks buy these bonds and sell them to the Central Bank, with profits. To pay for this, the Central Bank, what it does, it creates money. That’s it, out of nowhere! And the banks with the money they get buy more bonds. The curious thing is that the Central Banks are private, that is, they have owners. In the case of the Fed (Banco Central Americano), its owners are also those of the big banks and oil companies. In other words, they themselves “play” with this process.

What is impressive is that more than 90% of the money is created not by the Central Banks, but by the banking system. Let’s take an example: With the money that the government obtains, it pays the salary to a soldier (most countries spend inordinately in wars), this soldier deposits 100€ to the bank. The bank keeps 10€ and 90€ it lends to Antonio. (In this case, the reserve ratio, which is the portion of deposits of a bank that must be kept in liquid reserves, is 10%). Well, from 100€ there are now 190€. Let’s continue: Antonio buys a t-shirt with his 90€, and David, who is the seller, deposits this money to the bank. Automatically, the bank again lends 90%, or 81€, so now there are 271€.

This is repeated, making an initial deposit of €100 can be converted to €1,000. And the truth is that the reserve ratio has typically been around 3% or 4%, causing even more money to be created than described in this example.

All this leads to inflation, because the more money there is in circulation, the higher the prices. In fact, the real definition of inflation should be the increase in circulating money, with rising prices simply being the symptom. So as you can see, people work in exchange for this money, which is printed or simply created by typing into a computer. Truly, each one’s wealth is his time.

To finish the process of creating money that we have just seen, what happens is that a large part of the money that is received goes into taxes. The collection of this money goes to the government to be able to pay the principal and interest of the bonds that they issue, that they possess the Central Bank, that as I have explained, they have bought previously creating the money.

During the process, interest is paid on government bonds issued and also on loans given by banks. This means that there is an intrinsic interest in every euro that exists, being a debt-based system.

To make it clear, let’s look at this example: suppose there is only one euro on the planet, and they lend it to you in exchange for interest (you have to return this euro + another euro of interest), where do you get this other euro to pay the interest? The answer is that you have to borrow this other euro, which obviously will also leave you with interest (owing this to other euro + one euro interest). So now there are 2 euros, but you owe 4.

In other words, there is never enough money to pay off the debt having there is always much more debt in the system than the money there is to pay it. The point is that with the current monetary system, debt cannot be stopped, because otherwise new money would not be created that is needed to pay off debts. In short, the inflation that results from this system is like a hidden tax that we all pay.

Currencies vs Money. Why Bitcoin

So, in view of the above, for me, the euro or any other conventional currency is not money, since one of the properties that I believe should have money is the preservation of value over time because there is a limited amount without it being possible to create new monetary units.

In this way, for me, the euro (and all other conventional currencies) is a currency in which it is better not to have our assets. I want to point out that throughout history and in any region, there have been more than 5,000 FIAT coins (which are not backed by gold or anything). The statistics are overwhelming: 100% of them have ended up worth 0. Yes, all of them!

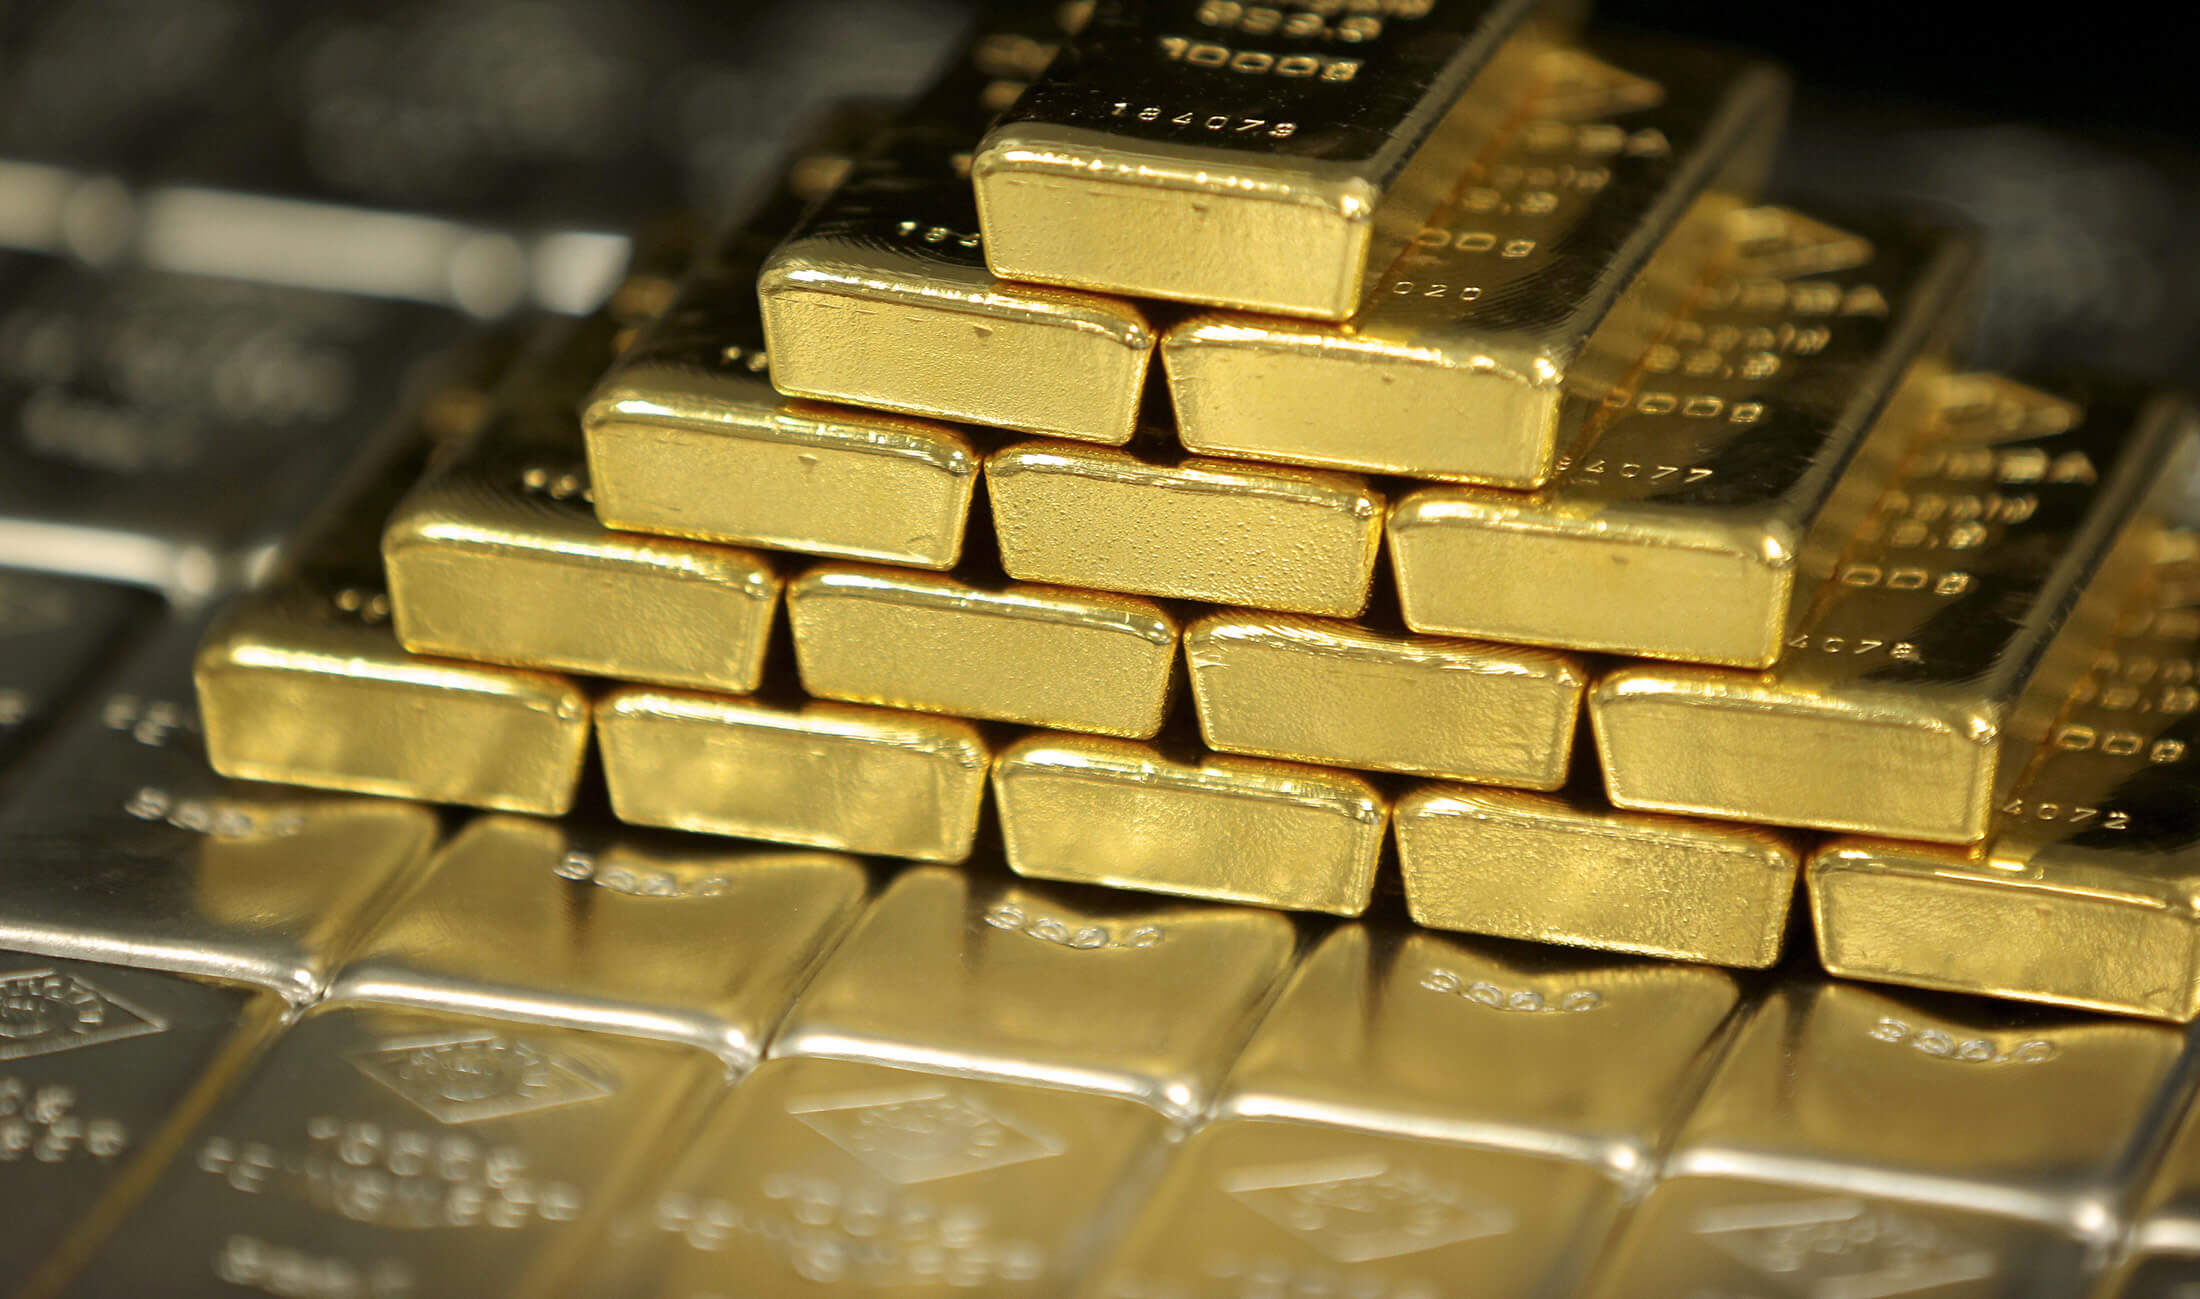
What I do consider money is gold as it meets all the requirements to be considered money. I had always considered this metal as the best form of existing money until recently bitcoin was born. I consider bitcoin to be like digital gold, because looking at it well, I realize that it works even better than gold as money. Let us see according to the characteristics that the money must have:

Generally accepted: In this case, the bitcoin at the moment has nothing to do against gold, but therein lies the great opportunity to invest in bitcoins today, that if it becomes generally accepted by society, its price will have risen dramatically from current levels.

Portability (easily transported): With Bitcoins, I could carry billions of dollars on my mobile, pen, or app.

Indestructibility/durability: Bitcoin has no limitations or physical deterioration, within a million years every bitcoin will be exactly the same.

Homogeneity (All coins of the same quality, same weight, or same value): Undoubtedly, each bitcoin is exactly the same as another.

Divisibility: Bitcoin is divided up to 8 decimal places, with each bitcoin having 100 million units that are exactly the same.

Limited amount: There will never be more than 21 million bitcoins.

Difficult to fake or copy: It is impossible to create fake bitcoins, it is impossible for the blockchain system to accept them.

Given this, it stands to reason that bitcoin can become the money of reference. The problem that has existed recently with gold is that it is heavily manipulated by banks and central banks because it is not in their interest for them to revalue themselves and for the population to prefer to use this type of money instead of the currencies like the euro that they can print unlimited. So, without a doubt, another advantage of bitcoin over gold, is that it cannot be manipulated or controlled by anyone.

Throughout history, all empires have followed the same pattern:

-You start using good money (gold, silver, or gold-backed coins).

-Taxes are imposed and public works are created.

-As the economy grows, politics is increasingly influential, and spending on armies is rising sharply.

-Normally there are wars and expenses are enormous.

To finance the war, they “steal” the wealth of citizens by degrading the value of coins with conventional metals (in our case, today, the euros are made of nickel, steel, copper, aluminum, zinc, and tin. If we melted a 2 euro coin, the value of the material would barely exceed 2 cents). In this way, in every empire, there always comes a time when money can be created unlimitedly. It is usually followed by an economic crisis.

The loss of purchasing power is perceived by the population as prices rise, and confidence in the currency is lost. (We are currently at this point. It is not uncommon to hear on the street “politicians are thieves”, “banks are scammers”… In addition, today, with the internet, I think it will take less time to move to the next phase.)

There is a large movement of money from currencies to precious metals or other tangible assets. The currency falls into nothing, and assets like gold and silver go up a lot in price by hoarding the value that was in the currency. This great transfer of wealth benefits those who have real money, such as gold or bitcoins. And this is the interesting point: whoever owns bitcoins can rest assured that he will maintain his purchasing power and if the day of the great transfer of value comes, then he will benefit greatly.

Changes in the Monetary System – What’s Next?

Let’s see what changes have taken place in the global monetary system in the last century and a half:

  • Gold-Standard (1879-1914): each dollar is backed by the equivalent value in gold (100%)
  • Gold Exchange Standard (1914-1944): the dollar is partially backed by gold. (40%)
  • Bretton Woods System (1944-1971): Virtually every currency in the world is backed by the dollar, with a fixed exchange rate. The dollar also continues to be partially backed by gold.
  • Dollar-pattern (1971-present): the dollar completely abandons the backing of gold (0%). This means that all other currencies, too.

Seeing that the previous monetary systems lasted 35, 30, and 27 years respectively and that now we have already 46 years with the Pattern-Dollar, it is not uncommon to think that it is time for the current system to change and that possibly in the future we will find the point “5)” starting in this decade, to be called something like “Pattern-Decentralized”, representing the new model with bitcoin and other cryptocurrencies.

As for the acceptance of Bitcoin, today there are already many large companies that accept it, such as Microsoft, Tesla, Dell, Paypal, Subway, WordPress, Expedia, Bloomberg, Virgin, Zynga, Lionsgate, Rakuten, Victoria’s Secret, etc.. in fact there are thousands and it grows exponentially. Right here in Spain, the Red Lyra consortium was formed a few months ago, where companies such as Santander, BBVA, B.Sabadell, Bankia, Iberdrola or Endesa are entering this sector. The same applies to other consortia, with companies such as IBM, Samsung, Intel, Cisco, JPMorgan, Accenture, Deloitte, SAP, Airbus, and hundreds more.

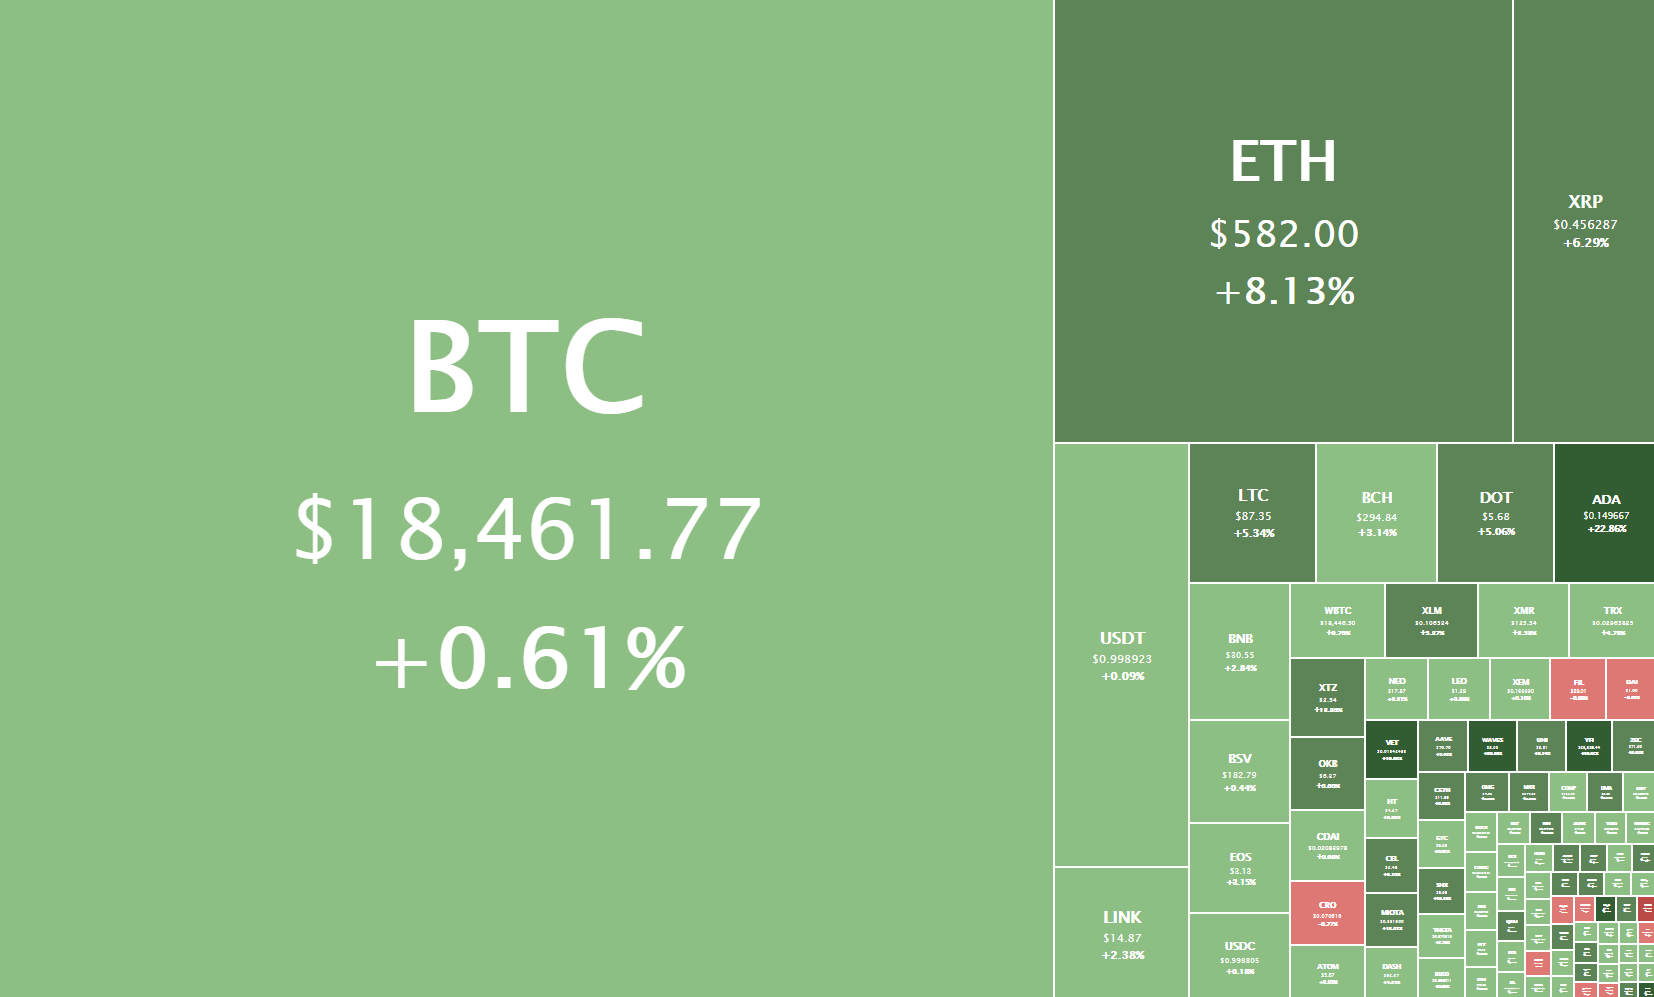
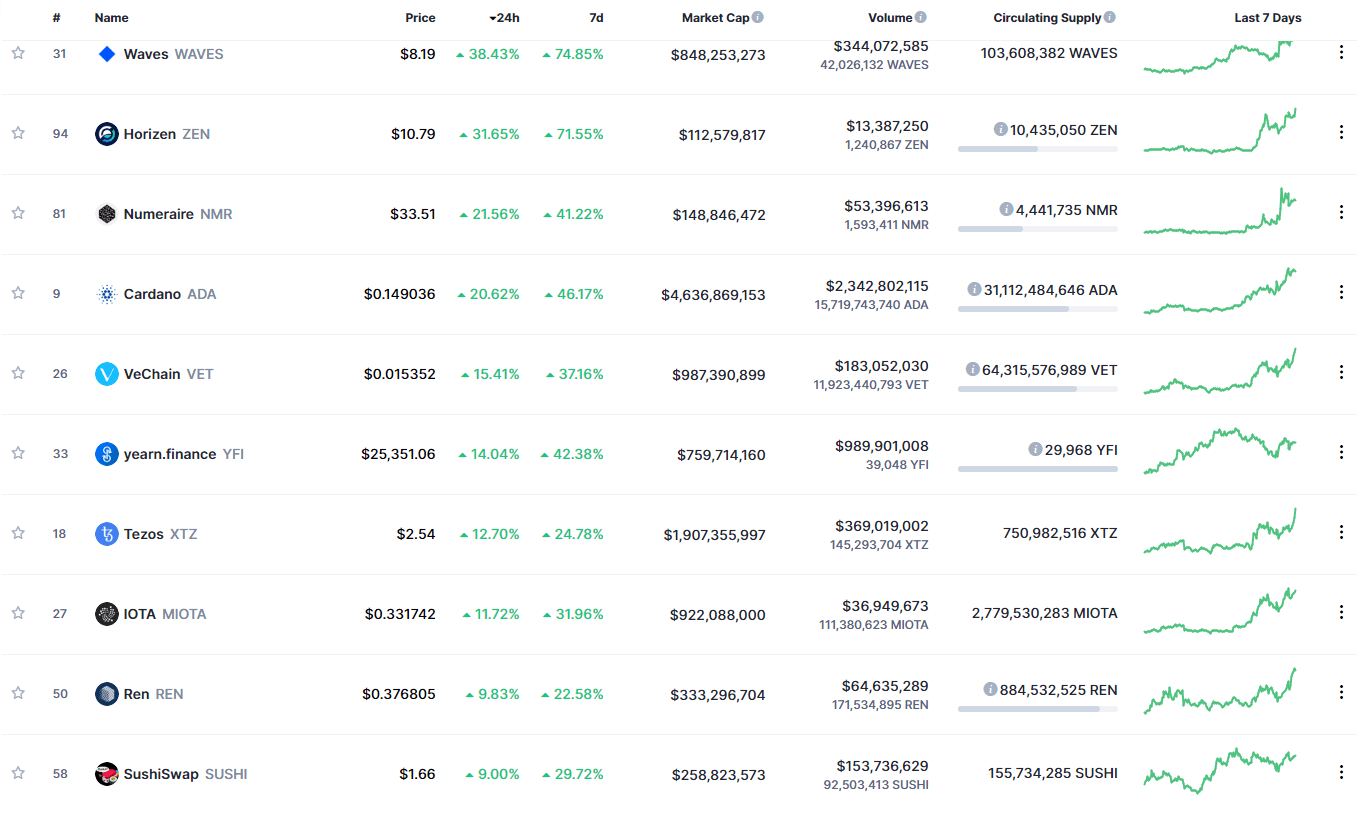
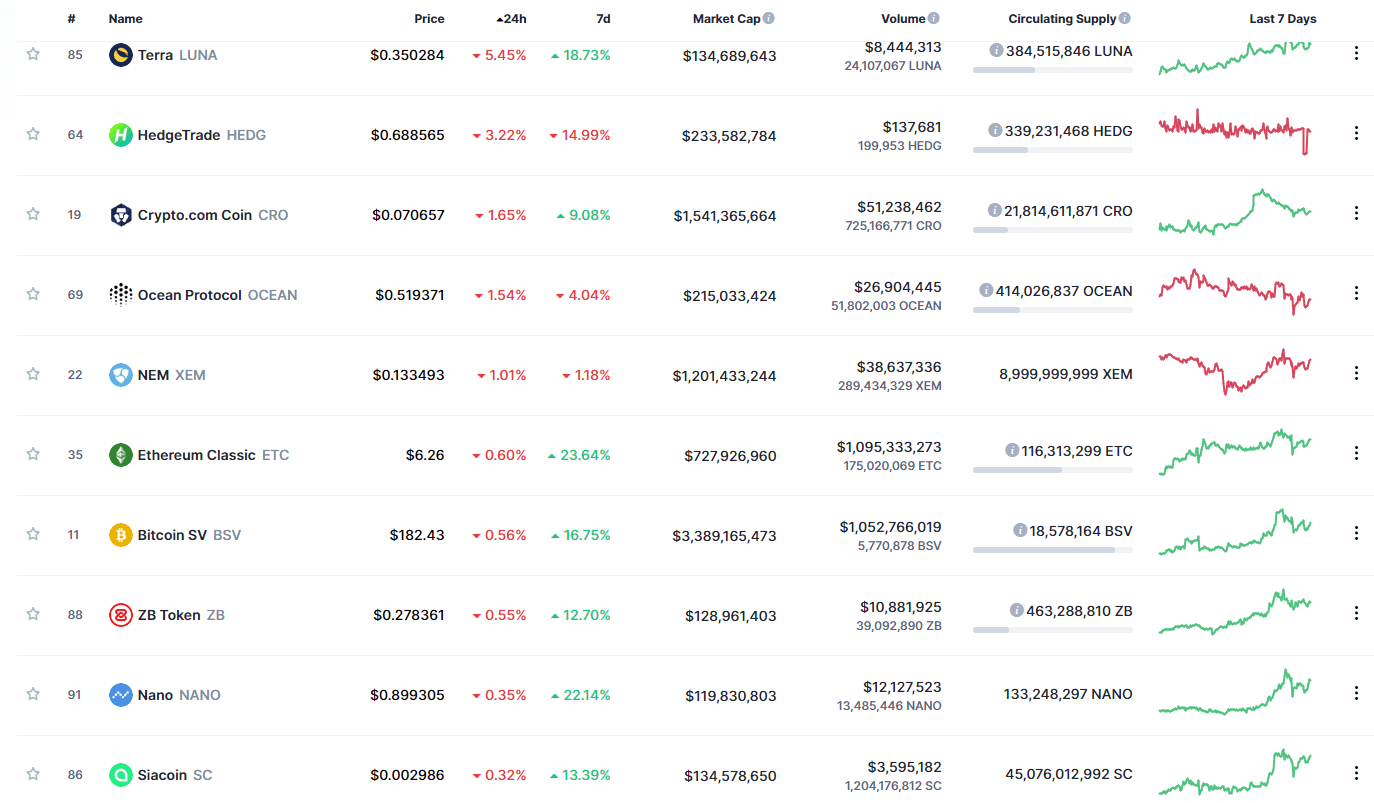
How can we take advantage of all this? Very simple, investing in Bitcoins. The most sensible thing would be to have much of the personal wealth in assets such as real estate or precious metals such as gold. Now, I think a part should be kept in Bitcoins and by the way, some other cryptocurrencies in particular. The cryptocurrency market is full of opportunities.

Categories
Crypto Market Analysis

Daily Crypto Review, Nov 12 – Bitcoin Formed a Triple Top? Ethereum Accidentally Hard Forks

The cryptocurrency sector has spent the day mostly consolidating, with roughly the same amount of cryptocurrencies ending the day in the green and the red. The largest cryptocurrency by market cap is currently trading for $15,802, representing an increase of 2.68% on the day. Meanwhile, Ethereum gained 0.24% on the day, while XRP gained 0.60%.

 Daily Crypto Sector Heat Map

Blockstack gained 17.15% in the past 24 hours, making it the most prominent daily gainer out of the top100 cryptos ranked by market capitalization. It is closely followed by OMG Network’s gain of 12.03% and ICON’s 11.46% gain. On the other hand, yearn.finance lost 10.37%, making it the most prominent daily loser. Loopring lost 9.34% while Synthetix lost 8.90%, making them the 2nd and 3rd most prominent daily losers.

Top 10 24-hour Performers (Click to enlarge)

Bottom 10 24-hour Performers (Click to enlarge)

Bitcoin’s market dominance has increased slightly since we last reported, with its value is currently staying at 64.5%. This value represents a 0.6% difference to the upside compared to the value it had yesterday.

Daily Crypto Market Cap Chart

The crypto sector capitalization has gone up over the course of the day. Its current value is $454.16 billion, representing an $8.04 billion increase compared to our previous report.

_______________________________________________________________________

What happened in the past 24 hours?

_______________________________________________________________________

Ethereum had quite a bad day, as its consensus reached an unexpected hard fork. This issue is considered the one holding the most weight ever since the DAO debacle from 4 years ago. The developers are still looking into the issue, and things will be fully understood at a later date.

Ethereum essentially hard forked right when its developers introduced a new update to the chain, and those who haven’t upgraded yet (including Blockchair, Infura, and other miners) got stuck in a minority chain for around 30 blocks (2 hours).

_______________________________________________________________________

Technical analysis

_______________________________________________________________________

Bitcoin

The largest cryptocurrency by market capitalization has pushed towards the upside, reaching as far as $15,990 but not being able to break the $16,000 mark. This failure to break its immediate resistance level has caused another (third) top to form, marking a possible short-term trend reversal as a possibility if Bitcoin doesn’t move up quickly.

Traders should trade carefully around this level and be prepared to trade the pullback or the spike. While these “, ride the trend” trades are hard to predict in terms of when they start, they are easy to trade once the entry happens.

BTC/USD 4-hour Chart

Bitcoin’s technicals are bullish on all time-frames. However, its 4-hour and monthly time-frames are completely bullish, while its daily and weekly overviews are showing signs of neutrality or even slight bear presence.

BTC/USD 1-day Technicals

Technical factors (4-hour Chart):
  • Price is above its 50-period EMA and slightly above its 21-period EMA
  • Price is slightly above its middle Bollinger band
  • RSI is near the overbought territory (64.15)
  • Volume is slightly above average
Key levels to the upside          Key levels to the downside

1: $16,000                                 1: $15,480

2: $16,400                                 2: $14,640

3: $16,700                                  3: $14,100

Ethereum

Ethereum has stayed above the top line of its ascending channel but could not break the resistance zone above $470. However, its price didn’t react negatively to the news of the algorithm failure and an unplanned mini hard fork, which is quite a bullish outcome of events.

Ethereum traders should watch out for how the second-largest cryptocurrency by market cap navigates the range between the top line of the ascending channel and its $470 resistance level.

ETH/USD 4-hour Chart

Ethereum’s technicals are bullish on all time-frames, with its 4-hour and monthly time-frames being completely bullish and its daily and weekly overviews showing signs of neutrality or even slight bear presence.

ETH/USD 1-day Technicals

Technical Factors (4-hour Chart):
  • The price is above its 50-period and slightly above its 21-period EMA
  • Price is above its middle Bollinger band
  • RSI is neutral (60.34)
  • Volume is average
Key levels to the upside          Key levels to the downside

1: $470                                     1: $451

2: $490                                     2: $445 

3: $500                                      3: $420

Ripple

The fourth-largest cryptocurrency by market cap has suffered a minor pullback after failing to break its immediate resistance level ($0.26). XRP is still trading within a range bound by $0.2454 to the downside and $0.26 to the upside, while its range is even more narrow lately, as its price is hovering only the top portion of the range.

Traders still have the opportunity to trade XRP’s sideways action without much risk. On the other hand, if the volume does increase drastically, a move towards the upside is much more likely, unless Bitcoin’s potential move down brings every other crypto down with it.

XRP/USD 4-hour Chart

XRP’s technicals on the 4-hour, daily, and weekly time-frame are bullish with slight hints of neutrality. On the other hand, its monthly overview is heavily tilted towards the sell-side.

XRP/USD 1-day Technicals

Technical factors (4-hour Chart):
  • The price above its 50-period EMA and slightly above its 21-period EMA
  • Price is slightly above its middle Bollinger band
  • RSI is neutral (55.12)
  • Volume is average
Key levels to the upside          Key levels to the downside

1: $0.26                                     1: $0.2454

2: $0.266                                   2: $0.235

3: $0.27                                    3: $0.227


Categories
Crypto Market Analysis

Daily Crypto Review, Nov 11 – Mempool Cleared! Bitcoin Fees Plummet

The cryptocurrency sector has spent the day consolidating and preparing for the next move and setting up valid technical formations. The largest cryptocurrency by market cap is currently trading for $15,377, representing an increase of 0.01% on the day. Meanwhile, Ethereum gained 2.08% on the day, while XRP gained 1.14%.

 Daily Crypto Sector Heat Map

Loopring gained 30.64% in the past 24 hours, making it the most prominent daily gainer out of the top100 cryptos ranked by market capitalization. It is closely followed by UMA’s gain of 24.45% and yearn.finance’s 17.59% gain. On the other hand, Decentraland lost 13.96%, making it the most prominent daily loser. Decred lost 9.94% while HedgeTrade lost 8.76%, making them the 2nd and 3rd most prominent daily losers.

Top 10 24-hour Performers (Click to enlarge)

Bottom 10 24-hour Performers (Click to enlarge)

Bitcoin’s market dominance has decreased slightly since we last reported, with its value is currently staying at 63.9%. This value represents a 0.3% difference to the downside compared to the value it had yesterday.

Daily Crypto Market Cap Chart

The crypto sector capitalization has gone up slightly over the course of the day. Its current value is $446.12 billion, representing a $4.38 billion increase compared to our previous report.

_______________________________________________________________________

What happened in the past 24 hours?

_______________________________________________________________________

Bitcoin’s transaction fees have plummeted as its mempool got cleared, reaching its smallest size since the middle of Oct. This means that hundreds, if not thousands of unconfirmed transactions, got included in the recent blocks, leaving the blockchain clear and unclogged. The mempool clearing has been attributed to a 42% increase in hash rate, which happened just a couple of days ago as Chinese miners completed their migration from the Sechuan region.

At the moment, the median transaction fee is 3 sat/byte, or roughly $0.11.

_______________________________________________________________________

Technical analysis

_______________________________________________________________________

Bitcoin

The largest cryptocurrency by market capitalization has spent the day trading in a narrow range between $15,100 and $15,500, trying to pass the $15,480 level with confidence. However, as this did not happen, we are seeing a possible lower high forming. The flat RSI and volume dropping signal a “calm before the storm,” which means that traders should prepare for a sharp move soon.

Traders should wait for Bitcoin to choose its short-term direction and trade only if Bitcoin confidently goes above $15,480 or below $15,420 with significant volume.

BTC/USD 4-hour Chart

Bitcoin’s technicals are bullish on all time-frames. However, its shorter time-frames are showing signs of neutrality, or even slight bearish presence, while its monthly overview is completely bullish.

BTC/USD 1-day Technicals

Technical factors (4-hour Chart):
  • Price is above its 50-period EMA and right at its 21-period EMA
  • Price is at its middle Bollinger band
  • RSI is neutral (54.44)
  • Volume is average
Key levels to the upside          Key levels to the downside

1: $15,480                                 1: $15,420

2: $16,400                                 2: $14,640

3: $16,700                                  3: $14,100

Ethereum

Ethereum has, unlike Bitcoin, had a great day as its price propelled past the top line of the ascended channel. The price increase is mainly attributed to great news regarding its 2.0 update adoption, as its deposit contracts top 22.5 million only one week after launch.

However, while the price increase is certainly a great thing, Ethereum is currently entering a strong resistance zone (above $460), which may cause problems for the ETH bulls.

Traders should pay close attention to how (and if) Ethereum pulls back or continues upwards. If Bitcoin doesn’t make any moves, it’s safe to assume that Ethereum will pullback in the short future.

ETH/USD 4-hour Chart

Ethereum’s technicals show “extreme buy” daily, weekly, and monthly time-frames, while its 4-hour overview is slightly more neutral.

ETH/USD 1-day Technicals

Technical Factors (4-hour Chart):
  • The price is above both its 50-period and its 21-period EMA
  • Price is at its top Bollinger band
  • RSI is neutral (60.73)
  • Volume is average
Key levels to the upside          Key levels to the downside

1: $470                                     1: $451

2: $490                                     2: $445 

3: $500                                      3: $420

Ripple

The fourth-largest cryptocurrency by market cap has continued trading within a range, bound by $0.2454 to the downside and $0.26 to the upside. XRP has spent the day slowly increasing its price, but the one attempt it had of pushing past $0.26 got shut down quickly.

Traders are safe to assume that XRP will trade within the same range and that they can trade the sideways action. On the other hand, if the volume increases drastically, a move towards the upside is much more likely than one towards the downside (unless fueled by Bitcoin’s move).

XRP/USD 4-hour Chart

XRP’s technicals on the 4-hour and weekly time-frame are slightly bullish with slight hints of neutrality, while its daily overview is bullish. On the other hand, its monthly overview is tilted towards the sell-side.

XRP/USD 1-day Technicals

Technical factors (4-hour Chart):
  • The price above its 50-period EMA and slightly above its 21-period EMA
  • Price is slightly above its middle Bollinger band
  • RSI is neutral (52.36)
  • Volume is average
Key levels to the upside          Key levels to the downside

1: $0.26                                     1: $0.2454

2: $0.266                                   2: $0.235

3: $0.27                                    3: $0.227


Categories
Crypto Market Analysis

Daily Crypto Review, Nov 10 – Bitcoin Miners Migrated: BTC Hash Rate Up 42%

The cryptocurrency sector has spent the day mostly consolidating and preparing for the next move and setting up technical formations. The largest cryptocurrency by market cap is currently trading for $15,288, representing a decrease of 1.14% on the day. Meanwhile, Ethereum lost 1.70% on the day, while XRP lost 0.8%.

 Daily Crypto Sector Heat Map

Civic gained an astonishing 101.35% in the past 24 hours, making it the most prominent daily gainer out of the top100 cryptos ranked by market capitalization. It is closely followed by Golem’s gain of 29.25% and Decentraland’s 22.26% gain. On the other hand, Loopring lost 9.76%, making it the most prominent daily loser. Synthetix lost 7.39% while Energy Web Token lost 7.35%, making them the 2nd and 3rd most prominent daily losers.

Top 10 24-hour Performers (Click to enlarge)

Bottom 10 24-hour Performers (Click to enlarge)

Bitcoin’s market dominance has decreased slightly since we last reported, with its value is currently staying at 64.2%. This value represents a 0.1% difference to the downside compared to the value it had yesterday.

Daily Crypto Market Cap Chart

The crypto sector capitalization has gone down slightly over the course of the day. Its current value is $441.50 billion, representing a $4.29 billion decrease compared to our previous report.

_______________________________________________________________________

What happened in the past 24 hours?

_______________________________________________________________________

The past 24 hours were characterized by a slow price movement of the crypto sector. However, a lot of important news reached the public’s eye. Bitcoin Miners finished up on Sichuan’s migration, triggering a hash rate spike of 42% in the past 2 days. Ethereum has been performing great, and news of its 2.0 version is all over the place, with the most recent one being that the number of addresses surpassing 32 ETH (the amount required to be a validator) is at an all-time high. On the other hand, Bitcoin SV brought bad news to the sector, as its multi-sig feature got compromised, causing enormous losses for its users.

_______________________________________________________________________

Technical analysis

_______________________________________________________________________

Bitcoin

The largest cryptocurrency by market capitalization is trading in a very uncertain zone at the moment. Its price has most likely created a double top formation, indicating a possible pullback in the short-term. This prediction is even more convincing as we can see that Bitcoin can’t get past the $15,480 resistance after trying for over 12 hours. However, the overall sentiment around the cryptocurrency is extremely bullish, and its downside is protected by the ascending (yellow) line.

With that being said, traders should wait for Bitcoin to choose its direction and trade only if Bitcoin spikes above $15,480 or below $15,420 with significant volume.

BTC/USD 4-hour Chart

Bitcoin’s technicals are bullish on all time-frames. The only difference compared to yesterday was that every single time-frame is completely bullish and with almost no neutrality present (as opposed to yesterday, when neutral sentiment could be seen on some overviews).

BTC/USD 1-day Technicals

Technical factors (4-hour Chart):
  • Price is above its 50-period EMA and right at its 21-period EMA
  • Price is at its middle Bollinger band
  • RSI is neutral (53.60)
  • Volume is average
Key levels to the upside          Key levels to the downside

1: $16,400                                 1: $15,480

2: $16,665                                 2: $14,640

3: $17,260                                  3: $14,100

Ethereum

Ethereum has been playing around the upper line of the ascending channel (yellow dotted line) and constantly going above and under it. At the moment, its price is under the line, and any attempts of getting past it have been extinguished quickly. This most likely means that Ethereum failed to establish itself above the $451 level, which could trigger a correction towards the 50-period moving average, and ultimately the bottom channel line.

Traders should pay close attention to volume, as they will not have a lot of time to join in on the trade towards the downside. Placing a stop-loss right above the ascending channel top line should be a “safe bet.”

ETH/USD 4-hour Chart

Ethereum’s technicals are tilted heavily towards the buy-side on its 4-hour and monthly overview, while the neutral sentiment is heavily present on its daily and weekly charts.

ETH/USD 1-day Technicals

Technical Factors (4-hour Chart):
  • The price is above its 50-period and slightly above its 21-period EMA
  • Price is at its middle Bollinger band
  • RSI is neutral (55.58)
  • Volume is slightly elevated
Key levels to the upside          Key levels to the downside

1: $451                                     1: $445

2: $470                                     2: $420 

3: $490                                      3: $415

Ripple

The fourth-largest cryptocurrency by market cap continued its consolidation phase right above the $0.2454 level, which is considered a major pivot point in XRP’s trading in the recent past. XRP created a double bottom at this level, possibly indicating a push towards the $0.26 in the short term.

Traders should still be safe to assume that XRP will trade within the range and that they can trade the sideways action. However, if the volume increases drastically, a move towards the upside is much more likely (if not fueled by Bitcoin’s move).

XRP/USD 4-hour Chart

XRP’s technicals on the 4-hour, daily, and weekly time-frame are all tilted towards the buy-side. However, neutral sentiment can be seen in all of them. On the other hand, its monthly overview also has the same neutrality amount but is tilted towards the sell-side.

XRP/USD 1-day Technicals

Technical factors (4-hour Chart):
  • The price slightly above its 50-period EMA and at its 21-period EMA
  • Price is slightly below its middle Bollinger band
  • RSI is neutral (49.69)
  • Volume is average
Key levels to the upside          Key levels to the downside

1: $0.26                                     1: $0.2454

2: $0.266                                   2: $0.235

3: $0.27                                    3: $0.227


Categories
Crypto Market Analysis

Daily Crypto Review, Nov 9 – Bitcoin at $15,500; What Will Biden’s Win Bring to the Crypto Sector?

The cryptocurrency sector has spent the weekend trying to recover and regain previous highs after most cryptocurrencies briefly dropped in price due to the election uncertainty. The most recent spike was triggered by the end of the US presidential elections, which caused mass uncertainty in the markets, as well as by now-President Biden hiring pro-crypto Gary Gensler as a member of his team. The largest cryptocurrency by market cap is currently trading for $15,433, representing an increase of 2.73% on the day. Meanwhile, Ethereum gained 2.94% on the day, while XRP gained 0.34%.

 Daily Crypto Sector Heat Map

Aave gained 20.05% in the past 24 hours, making it the most prominent daily gainer out of the top100 cryptos ranked by market capitalization. It is closely followed by THORChain’s gain of 17.75% and NEAR Protocol’s 17.57% gain. On the other hand, Celo lost 7.03%, making it the most prominent daily loser. The rest of the cryptocurrencies barely suffered any losses in the past 24 hours.

Top 10 24-hour Performers (Click to enlarge)

Bottom 10 24-hour Performers (Click to enlarge)

Bitcoin’s market dominance has decreased slightly since we last reported, with its value is currently staying at 64.3%. This value represents a 1% difference to the downside compared to the value it had on Friday.

Daily Crypto Market Cap Chart

The crypto sector capitalization has gone up slightly over the weekend. Its current value is $446.21 billion, representing a $4.85 billion increase compared to our previous report.

_______________________________________________________________________

What happened in the past 24 hours?

_______________________________________________________________________

_______________________________________________________________________

Technical analysis

_______________________________________________________________________

Bitcoin

The largest cryptocurrency by market capitalization has entered a state of uncertainty due to how close the US presidential election process was, and even had a brief drop due to less crypto-friendly Joe Biden winning. However, a new announcement regarding Biden hiring crypto-friendly advisors, as well as general stabilization of the political sphere, has triggered a spike in both stocks and Bitcoin.

Bitcoin has, after a brief drop below the yellow ascending line, come back above it, but only slightly as the move to the upside was stopped by the $15,420-$15,480 level.

Traders should wait for Bitcoin to “decide” whether it will go above $15,480 or below $15,420 and trade off of that.

BTC/USD 4-hour Chart

Bitcoin’s technicals are bullish on all time-frames, with smaller time-frames showing a bit of neutrality and longer time-frames being completely bullish.

BTC/USD 1-day Technicals

Technical factors (4-hour Chart):
  • Price is above both its 50-period EMA and its 21-period EMA
  • Price is at its middle Bollinger band
  • RSI is neutral (60.66)
  • Volume is slightly elevated
Key levels to the upside          Key levels to the downside

1: $15,480                                 1: $14,640

2: $16,665                                 2: $14,100

3: $17,260                                  3: $13,900

Ethereum

Ethereum has had an amazing weekend, with its price skyrocketing past the top line of the ascending channel. While most analysts thought that the second-largest cryptocurrency by market cap couldn’t get back above this line after the Nov 7 drop, Ethereum has proven them wrong and went above $450.

However, the immediate area above $450 is a zone of strong resistance, and Ethereum traders have to watch out how they enter trades here. The safest pick when it comes to trading Ethereum right now would be “riding the wave” towards the upside when ETH decides to spike.


ETH/USD 4-hour Chart

Ethereum’s technicals are almost completely neutral on the 4-hour and daily time-frames, while its longer time-frames are heavily tilted towards the buy-side.

ETH/USD 1-day Technicals

Technical Factors (4-hour Chart):
  • The price is above both its 50-period and its 21-period EMA
  • Price slightly above its middle Bollinger band
  • RSI is neutral (62.07)
  • Volume is elevated
Key levels to the upside          Key levels to the downside

1: $451                                     1: $445

2: $470                                     2: $420 

3: $490                                      3: $415

Ripple

The fourth-largest cryptocurrency by market cap had ended its ascension on Nov 7, when most cryptocurrencies dropped heavily in price. However, while most cryptos managed to get back near its previous highs, XRP failed to do so. It is currently trading in a wide range between $0.2454 and $0.26, after stopping its upward move at the ~$0.256 level.

Traders can consider trading XRP’s sideways movement as the volume is now reduced, and the possibility of a strong move is low. However, if such a move does happen, it could be easily predicted due to XRP’s current position.

XRP/USD 4-hour Chart

XRP’s technicals on the 4-hour, daily, and weekly slightly bullish, with some hints of neutrality. Its monthly overview, however, is still tilted towards the sell-side.

XRP/USD 1-day Technicals

Technical factors (4-hour Chart):
  • The price slightly above its 50-period EMA and at its 21-period EMA
  • Price is slightly below its middle Bollinger band
  • RSI is neutral (53.59)
  • Volume is average
Key levels to the upside          Key levels to the downside

1: $0.26                                     1: $0.2454

2: $0.266                                   2: $0.235

3: $0.27                                    3: $0.227


Categories
Crypto Market Analysis

BTC/USD Chart Overview + Possible Outcomes

In this weekly BTC /USD analysis, we will be taking a look at the most recent events, the current technical formations, as well as discussing possible outcomes.

Overview

Bitcoin has spent the week vigorously pushing towards the upside. The move went parabolic as soon as BTC crossed the $13,900 mark and entered the $14,000 zone. While the surge got stopped just before it hit $16,000, there is a lot of potential upside as there is practically no resistance holding Bitcoin from reaching its all-time high. However, many traders are taking profits and playing it safe out of fear of ending up the same way they did in 2017/2018. This has caused BTC to lose momentum and, most likely, look for a pullback soon.

Technical factors


Bitcoin has conquered the ~15,000 level after a week of constant pressure to the upside. The largest cryptocurrency by market cap is currently consolidating right above the $15,480 support level, which will act as a pivot point and a trading direction decider. The next day or two will be crucial for Bitcoin’s price movement in the short future.

While Bitcoin’s sentiment is extremely bullish at the moment, there is no denying that a pullback is quite possible (and maybe even optimal). As there are no set resistance levels to the upside (because Bitcoin only visited these price levels during the bull run of 2017), we are using Fib retracements as well as small consolidation points from that time to determine possible consolidation/direction change spots.

Another thing to note is that, as of Oct 29, the hash ribbons indicator is showing miner capitulation, sending out a major buy signal.

Likely Outcomes

Bitcoin has two main scenarios it can play out, and both end up with the price pulling back to stabilize and consolidate a bit. The possibility of these plays happening is slightly in favor of the second scenario, but it mainly depends only on where Bitcoin ends up (above or below its pivot point).

  1. If Bitcoin remains above $15,480, we may expect further attempts of conquering the upside. The next target to the upside are the $16,000 psychological resistance, 23.6% Fib retracement level (sitting at $16,570) and $16,665. If Bitcoin pushes towards the upside, we are almost certainly expecting strong resistance at these levels and an almost certain pullback in the short-term.
  2. The other scenario may be slightly more likely, and involves Bitcoin rejecting the current level and falling below its pivot point. In this case, the largest cryptocurrency by market cap will look for a support level, and will most likely find it at the $14,640 level or the 38.2% Fib retracement level (sitting at $14,380).

While moves which include Bitcoin moving straight up or down and ignoring these support/resistance levels are possible, they are far less likely and would have to be caused by some fundamental even rather than just price action and technicals.

Categories
Crypto Market Analysis

Daily Crypto Review, Nov 6 – Bitcoin Zooming Past $15,000: How Far Can it Go Before Pulling Back?

The cryptocurrency sector has exploded to the upside as Bitcoin keeps paving the path towards highs only seen during the bull run of 2017/2018. The largest cryptocurrency by market cap is currently trading for $15.632, representing an increase of 10.1% on the day. Meanwhile, Ethereum gained 7.74% on the day, while XRP gained 4.5%.

 Daily Crypto Sector Heat Map

Uniswap gained 28.39% in the past 24 hours, making it the most prominent daily gainer out of the top100 cryptos ranked by market capitalization. It is closely followed by Aave’s gain of 25.21% and NEAR Protocol’s 23.87% gain. On the other hand, The Midas Touch Gold lost 6.16%, making it the most prominent daily loser. It is followed by Numeraire’s loss of 5.03% and Celo’s loss of 3.94%.

Top 10 24-hour Performers (Click to enlarge)

Bottom 10 24-hour Performers (Click to enlarge)

Bitcoin’s market dominance level has increased slightly since we last reported, with its value is currently staying at 65.3%. This value represents a 0.4% difference to the upside when compared to the value it had yesterday.

Daily Crypto Market Cap Chart

The crypto sector capitalization has skyrocketed in the past 24 hours. Its current value is $440.94 billion, representing a $28.77 billion increase compared to our previous report.

_______________________________________________________________________

What happened in the past 24 hours?

_______________________________________________________________________

_______________________________________________________________________

Technical analysis

_______________________________________________________________________

Bitcoin

The largest cryptocurrency by market capitalization has surged past the $15,000 psychological resistance and entered the zone last seen in Jan 2018, right before the BTC crash. Bitcoin scored double-digit gains on the day and destroyed the $14,640 resistance on the way, turning it into support. While it is currently slowing down as it is approaching $16,000, many analysts call for $17,000 before a pullback.

Traders should wait for Bitcoin to start pulling back if they want a safer trade, or they can ride the wave whenever Bitcoin’s price spikes if they are quick on their feet to enter and leave the trade.

BTC/USD 4-hour Chart

Bitcoin’s technicals are extremely bullish on all time-frames, and no time-frame is showing any signs of bearishness or neutrality.

BTC/USD 1-day Technicals

Technical factors (4-hour Chart):
  • Price is well above both its 50-period EMA and its 21-period EMA
  • Price is at its top Bollinger band
  • RSI is heavily in the overbought zone (79.75)
  • Volume is elevated
Key levels to the upside          Key levels to the downside

1: $15,420                                 1: $14,640

2: $16,665                                 2: $14,100

3: $17,260                                  3: $13,900

Ethereum

Ethereum has, due to Bitcoin pulling it up as well as due to the hype created around its 2.0 version coming out, surged and almost scored a double-digit gain on the day. The second-largest cryptocurrency by market cap has established itself back in the ascending channel after briefly dropping out of it. However, that wasn’t enough for the Ethereum bulls as they tried to push its price above the channel completely.

As the upper channel line held amazingly and stopped Ethereum’s rise, we can conclude that (unless Bitcoin doesn’t have any extreme surges), Ethereum traders can safely trade within a range bound by the ascending channel.


ETH/USD 4-hour Chart

Ethereum’s technicals are somewhat neutral on the 4-hour and daily time-frames, while its longer time-frames show a heavy tilt towards the buy-side.

ETH/USD 1-day Technicals

Technical Factors (4-hour Chart):
  • The price is well above both its 50-period and its 21-period EMA
  • Price is at its top Bollinger band
  • RSI is extremely overbought (78.03)
  • Volume is elevated
Key levels to the upside          Key levels to the downside

1: $445                                     1: $420

2: $451                                     2: $415 

3: $490                                      3: $400

Ripple

As we predicted in our previous article, the fourth-largest cryptocurrency by market cap has broken the triangle formation that was forming from Nov 3. The price has sparked up by Bitcoin’s push towards the upside, moved to the upside as well, reaching past the $0.2454 resistance level and up towards $0.25.

One thing to note is that, while XRP has managed to break $0.2454, it needs to confirm its position above it in order to be safe in the short-term.

XRP/USD 4-hour Chart

XRP’s technicals on the 4-hour, daily, and weekly chart are slightly tilted towards the buy-side but are not completely bullish. Its monthly overview, however, is tilted towards the sell-side.

XRP/USD 1-day Technicals

Technical factors (4-hour Chart):
  • The price is well above its 50-period EMA and its 21-period EMA
  • Price at its top Bollinger band
  • RSI is on the verge of being overbought (68.49)
  • Volume is elevated
Key levels to the upside          Key levels to the downside

1: $0.26                                 1: $0.2454

2: $0.266                                     2: $0.235

3: $0.27                                  3: $0.227


Categories
Crypto Videos

Why Bitcoin Is suddenly Exploding – Investors HODLing Bitcoin For 2021 Bull Run!


Investors HODLing Bitcoin More in Anticipation of 2021 Bull Market

bitcoins upward trend growth chart vector

New data shows that Bitcoin’s current price action shows much higher levels of ‘hodling’  activity than the levels during previous bull cycles.
According to Willy Woo, a well-known on-chain analyst, an indicator called “reflexivity” has been on the rise in recent months. Woo explained that the reflexivity indicator measures Bitcoin investors’ tendency to hold their BTC as its price rises. This is essentially an alternative way to estimate the hodling activity of retail investors.


The next bull run may lead BTC above $20,000
Several reasons caused retail investors to hold onto their Bitcoin even more so than during previous bull cycles.
If Bitcoin manages to rally in 2021, most investors would see the event as a post-halving bull run. Historically, Bitcoin has rallied 12 to 15 months after each halving and managed to record a new all-time high each time. Based on Bitcoin’s tendency to rally after a halving, many retail investors might be holding it to avoid being priced out in case of a strong sustained rally.

Also, Bitcoin has shown a surprising level of resilience throughout several potential black swan events. After its initial recovery from the COVID-19 pandemic-induced crash in March, its price has stayed above $10,000 despite numerous negative events.
Looking at the most recent example, Bitcoin’s price went down slightly after the US CFTC charged the crypto trading platform BitMEX with violating the Bank Secrecy Act.
After CFTC’s announcement, BTC price instantly fell below $10,500 but quickly recovered to the $10,700 support level. According to Willy Woo, this is most likely due to the confluence of the two key factors. He then explained:

“Reflexivity represents the HODLers’ tendency to hold onto their crypto harder as price increases. While I had expected reflexivity to increase during the craze of bull markets, it looks quite constant from the last two cycles… However, this cycle is interesting, as reflexivity increases rather than static compared to the last cycles. Even though we now need more capital invested to get a similar % gain in price, more and more HODLers are holding even tighter than before.”

The US presidential election may push Bitcoin price higher


Industry executives and prominent investors in the crypto space foresee the upcoming US presidential election in November benefiting Bitcoin.
CEO of Three Arrows Capital Su Zhu said a Democratic sweep would almost certainly catalyze Bitcoin due to various macro factors. He also suggested that a Trump’s second term could also benefit Bitcoin. He wrote:
“Biden is extremely bullish for Bitcoin because the democrat blue wave will most likely usher in the unprecedented installation of MMT agenda with the corresponding dollar weakness and deficits. That being said, Trump is also bullish for Bitcoin, though to a lesser extent.”

As it stands now, Bitcoin is less affected by the negative news than by the positive ones, which is one of the main indicators for identifying a bull market. While we are not there yet completely, most analysts believe that 2021 will be a great year for Bitcoin, regardless of what happens around the world.

Categories
Crypto Market Analysis

Daily Crypto Review, Nov 5 – Bitcoin Finally Above $14,000 as the Bull Run Continues; Ethereum 2.0 Contract Release Live

The cryptocurrency sector has explosively pushed towards the upside as Bitcoin broke the $14,316 and entered the territory explored only during the 2017/2018 bull run and last seen in July 2018. The largest cryptocurrency by market cap is currently trading for $14,316, representing an increase of 5.54% on the day. Meanwhile, Ethereum gained 4.78% on the day, while XRP gained 0.67%.

 Daily Crypto Sector Heat Map

HedgeTrade gained 38.24% in the past 24 hours, making it the most prominent daily gainer out of the top100 cryptos ranked by market capitalization. It is closely followed by Celsius’ gain of 9.37% and CyberVain’s 7.78% gain. On the other hand, Uniswap lost 16.95%, making it the most prominent daily loser. It is followed by yearn.finance’s loss of 16.73% and ABBC Coin’s loss of 9.35%.

Top 10 24-hour Performers (Click to enlarge)

Bottom 10 24-hour Performers (Click to enlarge)

Bitcoin’s market dominance level has increased slightly since we last reported, with its value is currently staying at 64.9%. This value represents a 0.6% difference to the upside when compared to the value it had yesterday.

Daily Crypto Market Cap Chart

The crypto sector capitalization has increased over the course of the day. Its current value is $412.17 billion, representing a $7.35 billion increase when compared to our previous report.

_______________________________________________________________________

What happened in the past 24 hours?

_______________________________________________________________________

_______________________________________________________________________

Technical analysis

_______________________________________________________________________

Bitcoin

The largest cryptocurrency by market capitalization had finally broken the $13,900 resistance with confidence and confirmed its position above it. Not only that, but it has entered the price level last seen in July 2018. This means that there will be a lot of uncertainty and unset support and resistance levels, and also a lot of random volatility due to various entities taking profit and new investors FOMOing in.

However, a couple of potential resistance levels have formed, one of them being at $14,640. Traders should pay close attention to this level as well as use Fib retracements to create possible targets when trading.

BTC/USD 1-hour Chart

Bitcoin’s technicals on showing a strong buy at all time-frames. No neutrality is being shown as Bitcoin is currently in an extremely favorable place price-wise.

BTC/USD 1-day Technicals

Technical factors (4-hour Chart):
  • Price is above both its 50-period EMA and its 21-period EMA
  • Price is slightly below its top Bollinger band
  • RSI is coming out of the overbought zone (69.10)
  • Volume is average
Key levels to the upside          Key levels to the downside

1: $14,640                                 1: $14,100

2: $16,665                                 2: $13,900

3: $17,260                                  3: $13,570

Ethereum

Bitcoin’s push towards the upside has fueled Ethereum, and the hype surrounding its version 2.0 launch, managed to surge above the ascending channel bottom line and re-enter the channel once again. The second-largest cryptocurrency by market cap reached as high as $409 before pulling back. It is now consolidating at slightly below $400.

If we don’t see any explosive moves from BTC and ETH in the short term, we can expect Ethereum to pull back slightly more and test the ascending channel’s bottom line as support. Traders can wait for the results of the “test” and trade off of that.

ETH/USD 4-hour Chart

Ethereum’s technicals on all time-frames are tilted towards the buy-side. However, its shorter time-frames (4-hour and daily) are showing hints of neutrality, while its longer time-frames are completely bullish.

ETH/USD 1-day Technicals

Technical Factors (4-hour Chart):
  • The price is above both its 50-period and its 21-period EMA
  • Price is between its middle and top Bollinger band
  • RSI is neutral (57.63)
  • Volume is average
Key levels to the upside          Key levels to the downside

1: $400                                     1: $378

2: $415                                     2: $371

3: $420                                      3: $361

Ripple

The fourth-largest cryptocurrency by market cap hardly even moved in the past 24 hours despite the rest of the crypto market booming. As we mentioned in our previous article, if Bitcoin’s next explosive move doesn’t fuel XRP, it will move within a range bound by $0.235 and $0.2454, exactly what happened.

XRP seems to be creating a triangle formation on its 4-hour chart. If that is the case, it is bound to move above or below it extremely soon. However, the move will most likely be stopped at its immediate support or resistance level.

XRP/USD 4-hour Chart

XRP’s technicals have improved slightly, as they were extremely bearish the last time we reported. While its daily overview is still heavily tilted towards the sell-side, its weekly and monthly overviews are almost neutral (though still slightly tilted towards the bear side), and its 4-hour time-frame is even showing some bullishness.

XRP/USD 1-day Technicals

Technical factors (4-hour Chart):
  • The price is below its 50-period EMA and at its 21-period EMA
  • Price at its middle Bollinger band
  • RSI is neutral (48.73)
  • Volume is average
Key levels to the upside          Key levels to the downside

1: $0.2454                                 1: $0.235

2: $0.26                                     2: $0.227

3: $0.266                                  3: $0.221


Categories
Crypto Videos

Best Free Bitcoin Indicator Ever Gaining Over 5000% Returns! Free Indicator In The Description!


Best Bitcoin Indicator Ever? 5000% Returns

Bitcoin’s mining is adjusted for difficulty every 2016 blocks, which translates to roughly every two weeks.
However, Bitcoin’s effective Hash Rate is being calculated daily and is based on the number of blocks found by the miners each day. Because when the hash rate and mining difficulty are calculated, the difficulty effectively may lag behind the hash rate by a maximum of two weeks. The difficulty is, therefore, a somewhat lagging indicator for miner capitulation.

When looking at how ribbons work, we can notice the green and blue simple moving average lines of the difficulty and hash rate on the ribbon indicator. When they cross each other, miners are considered to be “capitulating.” On top of that, most times, the chart will show that there is roughly a two-week lag from the hash rate identifying miner capitulation to the difficulty identifying capitulation. The simple moving average periods chosen are not that important, and the same effect can be seen regardless of the periods used.
However, miner capitulation periods can last for weeks. As a result, the lag between mining difficulty and hash rates doesn’t have such a huge impact on the Bitcoin investor, but rather just on traders.

The hash ribbon indicator

Because of the effect of negative sentiment as well as price action during bear markets and times where miners reach capitulation, the best time to buy Bitcoin is somewhere in the middle of the “miner capitulation” period. However, this cannot be fully known until after the fact.
A simple 1- and 2-month period simple moving average of Bitcoin’s Hash Rate can be used to, with great accuracy, identify market bottoms, miner capitulation, and even great times to buy Bitcoin. The moment when the 1-month hash rate SMA crosses over the 2-month hash rate SMA, the worst of the miner capitulation is over most of the time, and the recovery has begun. Initiating a buy at these points in time yields incredible results so far.

Of the 9 historic buy signals in the table shown, the average gain to the next market cycle peak, which was historically less than 3 years away, is over a whopping 5000%. Returns are even greater than shown in the table for positions held indefinitely.
What is interesting is the drawdown through all time. The average maximum drawdown for each of these entries is a mere 11%. These results are achieved without considering anything else but this indicator. No indicators, metrics, or intelligence, rather just two simple moving averages on Bitcoin’s hash rate.
We have to note that there is one “bad” purchase, which dates to January 2015, where a maximum drawdown of 42% occurred. However, this is still considerably less than half of Bitcoin’s various 80%+ drawdowns. Nonetheless, the majority of drawdowns can be eliminated by simply adding a price action indicator. This indicator could include the famous Bitcoin 10-day and 20-day SMA cross over, for example.

Purchasing Bitcoin during miner capitulation, as the hash rates are starting to “recover” combined with buying only once price momentum has gone positive, yields insanely good results.
As shown, the maximum drawdown is reduced significantly, while the returns have stayed relatively the same. The difference between the first and second table is made possible with the simple addition of the price momentum indicator and using these two indicators as a signal to purchase Bitcoin.

This brings us to the question of can you use this indicator often. Miner Capitulation doesn’t happen that often: in fact, it happens only once per year on average. However, it has started to occur a bit more often in 2020, which may be a great thing for Bitcoin investors.

This indicator has proven itself a great tool for finding Bitcoin bottoms, while it does need help when it comes to timing the sale of the previously bought coins. Hash ribbons should be one of the key components of every Bitcoin trader’s tool belt, simply due to its amazing track record.

Categories
Crypto Market Analysis

Daily Crypto Review, Nov 4 – Bitcoin Contesting $14,000; Crypto Sector in the Green

The cryptocurrency sector has explosively pushed towards the upside as Bitcoin is contesting the $14,000 level yet again. The largest cryptocurrency by market cap is currently trading for $13,863, representing an increase of 3.81% on the day. Meanwhile, Ethereum gained 2.93% on the day, while XRP gained 3.67%.

 Daily Crypto Sector Heat Map

The Midas Touch Gold gained 13.90% in the past 24 hours, making it the most prominent daily gainer out of the top100 cryptos ranked by market capitalization. It is closely followed by ABBC Coin’s gain of 11.68% and Ampleforth’s 9.31% gain. On the other hand, CyberVain lost 9.64%, making it the most prominent daily loser. It is followed by NEAR Protocol’s loss of 9.57% and VeChain’s loss of 8.87%.

Top 10 24-hour Performers (Click to enlarge)

Bottom 10 24-hour Performers (Click to enlarge)

Bitcoin’s market dominance level has increased slightly since we last reported, with its value is currently staying at 64.3%. This value represents a 0.3% difference to the upside when compared to the value it had yesterday.

Daily Crypto Market Cap Chart

The crypto sector capitalization has increased over the course of the day. Its current value is $399.05 404.52 billion, representing a $10.79million increase when compared to our previous report.

_______________________________________________________________________

What happened in the past 24 hours?

_______________________________________________________________________

_______________________________________________________________________

Technical analysis

_______________________________________________________________________

Bitcoin

The largest cryptocurrency by market capitalization had a great day as its price moved above the $13,900 mark. While the move got stopped out near $14,000, its price is still above the level it just passed.

Due to no strong pullbacks happening at the moment and Bitcoin staying within a very narrow range ($13,000-$14,100), we can expect a strong move to either side very soon. Traders should pay attention to any attempt to break its support/resistance levels Bitcoin makes.

BTC/USD 4-hour Chart

Bitcoin’s technicals on all time-frames are bullish, with the weekly overview being the only one with a considerable amount of neutrality.

BTC/USD 1-day Technicals

Technical factors (4-hour Chart):
  • Price is above both its 50-period EMA and its 21-period EMA
  • Price above its middle Bollinger band
  • RSI is neutral (58.89)
  • Volume is average
Key levels to the upside          Key levels to the downside

1: $13,900                                 1: $13,570

2: $14,000                                 2: $13,180

3: $14,100                                  3: $13,000

Ethereum

Ethereum has bounced off of its $371 support level and started moving back towards its ascending channel. However, the channel bottom line was too strong to pass, and Ethereum ended up consolidating slightly below it. As time passes, the possibility of Ethereum breaking the level will be diminished due to the constant increase in the line’s price position.

Ethereum is now trading in a range between $378 and the ascending channel bottom line, which can be taken advantage of. However, Bitcoin is preparing a move, and Ethereum will most likely respond to it by following its direction and intensity, which can be used by the traders.

ETH/USD 4-hour Chart

Ethereum’s short-term technicals are unclear (4-hour overview being slightly bearish while daily overview is slightly bullish), while its longer-term technicals are heavily tilted towards the buy-side.

ETH/USD 1-day Technicals

Technical Factors (4-hour Chart):
  • The price is below its 50-period and at its 21-period EMA
  • Price is at its middle Bollinger band
  • RSI is neutral (49.02)
  • Volume is average
Key levels to the upside          Key levels to the downside

1: $400                                     1: $378

2: $415                                     2: $371

3: $420                                      3: $361

Ripple

The fourth-largest cryptocurrency by market cap took the day to push back above $0.235 and consolidate above it. This returned XRP back within a range bound by $0.235 to the downside and $0.2454 to the upside.

As we mentioned in our previous articles, if the next Bitcoin’s explosive move does not fuel XRP, traders can comfortably trade sideways action within this range. If, however, Bitcoin’s price moves to either side and XRP follows the direction, traders can use this event to trade alongside the direction XRP is moving in.

XRP/USD 4-hour Chart

XRP’s technicals on all time-frames are heavily tilted towards the sell-side. However, the longer the time-frame, the more neutral the technicals are, with the monthly indicator being very close to being completely neutral.

XRP/USD 1-day Technicals

Technical factors (4-hour Chart):
  • The price below its 50-period EMA and above its 21-period EMA
  • Price is slightly above its middle Bollinger band
  • RSI is close to the oversold territory (50.52)
  • Volume is slightly above average
Key levels to the upside          Key levels to the downside

1: $0.2454                                 1: $0.235

2: $0.26                                     2: $0.227

3: $0.266                                  3: $0.221


Categories
Crypto Daily Topic

Why Bitcoin is Here To Stay

Let’s face it – at some point, we all thought that Bitcoin was going to collapse, but it didn’t. Since its inception in 2009, this cryptocurrency has shown tremendous resilience throughout its lifetime. Bitcoin has had meteoric rises and falls, having gone to the highs of $20,000 at some point and plunged as low as $5,000 within months. PayCoin, SpaceBit, and many other digital currencies have collapsed, and so, the idea of a cryptocurrency failing is not foreign after all. So what makes Bitcoin special? Does this pioneer crypto really have nine lives, or is it a matter of time before it vanishes into the nether world? 

Critics say it shall end in tears; analysts say Bitcoin is here to stay. But let’s settle this debate by looking at the factors that give Bitcoin its resilience and evaluating whether they are solid enough to see it through crypto’s uncertainties. 

This article presents Bitcoin’s history of fluctuations and reasons it is likely to survive the test of time.

The 2018 Bitcoin Crash

If there’s a time Bitcoin’s doomsayers were almost right in their predictions, it must have been 2018. After reaching almost $20,000 in December 2017, Bitcoin crashed to just $5,000 in December 2018. Cryptocurrencies were undergoing a rough time. During this period, a series of events led to widespread speculation about the fate of digital currencies.

  • In January 2018, it was rumored that South Korea was planning to ban cryptocurrencies in the country. As a direct consequence, Bitcoin lost 12 percent of its value.
  • Exactly 2 weeks later, Coincheck, then Japan’s largest crypto exchange, was hacked, and the cyberpunk made away with NEM equivalent to USD 530 million. Crypto enthusiasts across the globe momentarily lost trust in the security of digital currencies. Within a couple of days after this news broke, Bitcoin lost 50% of its value.
  • In March of the same year, someone stole Binance’s API keys and attempted to make fraudulent transfers. Binance detected the unusual activity and immediately suspended withdrawals. Panic had already spread.
  • In the same month, Facebook, Twitter, and Google banned all ICOs and token sales ads. This was the final piece of evidence doomsayers needed to prove their case.

For the remainder of the year, cryptocurrencies struggled to remain afloat. Some exchanges suspended trading, and some currencies collapsed. By November 2018, Bitcoin was exchanging at $5,500.

The Comeback

From the beginning of 2019, Bitcoin started to show signs of recovery. In fits and bursts, the currency rose in both trade volume and price. By June 2019, it had already reached $10,000. Between June 2019 and October 2020, the coin has fluctuated between $14,000 and $5,000. The comeback was not the strongest. However, it brought hope that Bitcoin was permanently poised for recovery and stabilization. 

Why Bitcoin Is Likely to Survive the Test of Time

We have seen Bitcoin’s unpredictable fluctuations over the years. One question we need to answer is what makes it always recover even after an epic fail. Below are some of the reasons.

#1 – It solves real-world problems

This is arguably the main reason Bitcoin has survived for a decade. Bitcoin has real utility – you can use it to pay for goods and services, you can send it to another person, and you can invest in it as if it were an asset. While it was possible to achieve all this even before Bitcoin’s creation, its invention has made these transactions more versatile and cost-effective. 

It has also opened new use cases that were previously impossible. For instance, activists are increasingly relying on Bitcoin to bypass government restrictions and receive donations. Of course, criminals and terrorists are also abusing the network to raise funds for nefarious activities, but that does not negate the fact that Bitcoin comes in handy when an unrestricted movement of funds is desirable. 

#2 – It is (relatively) simple to understand and use

Compared to other cryptocurrencies, Bitcoin is relatively easy to understand and use. For comparison, Ethereum and Ripple, Bitcoin’s closest competitors, include complicated concepts (smart contracts and payment infrastructure, respectively) that confuse neophytes. Bitcoin is simply a currency. Even a person with modest internet skills can begin using it in a short time. 

Bitcoin’s simplicity is on the user front – the mechanisms behind how it works remain as complex as those for other cryptocurrencies. Thus, none of the security, decentralization, and network stability benefits are compromised.

#3 – It is highly consistent with our past payment experiences

Bitcoin’s compatibility means you can easily plug it into traditional financial systems, and it blends seamlessly. It is accessible from mobile apps and other platforms that we are all already used to. Its acquisition and usage are also consistent with our past experiences. For instance, when checking out on an eCommerce site, you can pay for your goods by simply selecting Bitcoin, if it is listed. This is what you’d normally do with your credit card, PayPal, and so on.

So how does compatibility make Bitcoin resilient? Glad you asked. After a crash in volume, Bitcoin users can easily pick up where they left and continue using the currency like it never crashed. For emphasis, just imagine if, after abandoning its usage, you have to re-register, get a new wallet, find another exchange because the other one collapsed, and so on before you start using the currency again. It might not sound like much, but such complexities can impede the recovery of a cryptocurrency.

#4 – The pioneer advantage

Having entered the cryptocurrency market before any other currency, Bitcoin enjoys the pioneer advantage. It has been and will always be the trendsetter for cryptocurrencies. For instance, when Bitcoin activity slows down due to Bitcoin-specific adverse events, the entire crypto world is shaken. But Bitcoin does not necessarily suffer such instabilities when other networks go down. 

The pioneer advantage creates the impression that Bitcoin can be trusted more than any other cryptocurrency. This makes it easier for Bitcoin to bounce back after a slump because crypto enthusiasts will likely continue to trust it even when cryptocurrencies are undergoing tumultuous times. It is a good thing anyway, as the lifeline of cryptocurrencies heavily relies on Bitcoin trends.

#5 – It is globally available 

Bitcoin’s global presence contributes a great deal to its resilience. Each world region is characterized by a different economic and regulatory environment. So, when Bitcoin activity slows down in the Eurozone due to Brexit (if there’s such a cause-effect relationship), it could be pretty much business as usual in the rest of the world. Of course, changes in Bitcoin activity in certain regions have a high likelihood of impacting the rest of the globe. Even so, we must agree that having Bitcoin everywhere spreads and thus mitigates its risk of collapsing.

Final Thoughts

Bitcoin was created over a decade ago, and despite multiple scares that it was collapsing, the cryptocurrency still stands tall. It experienced its worst slump in December 2018, but its resurgence thereafter was a clear demonstration of its resilience. For the critics out there, Bitcoin’s high volatility is not necessarily a symptom of extinction – as it has been shown time and again. Lastly, although Bitcoin has seen countless rises and falls in its lifetime, one thing remains clear: after a fall, it shall rise.

Categories
Crypto Market Analysis

Daily Crypto Review, Nov 3 – Crypto Sector in the Red; Altcoins Plummeting

The cryptocurrency sector experienced an overall price drop as Bitcoin pushed down towards sub-$13,500 levels. Most cryptocurrencies ended in the red as they lost quite a bit more than Bitcoin itself. The largest cryptocurrency by market cap is currently trading for $13,411, representing a decrease of 1.88% on the day. Meanwhile, Ethereum lost 5.68% on the day, while XRP lost 3.96%.

 Daily Crypto Sector Heat Map

The Midas Touch Gold gained 8.44% in the past 24 hours, making it the cryptocurrency to gain the most in a day (out of the top100 cryptos by market capitalization). The rest of the cryptocurrencies experienced close to no gains. On the other hand, Reserve Rights lost 17.14%, making it the most prominent daily loser. It is followed by SushiSwap’s loss of 14.07% and Compound’s loss of 12.86%.

Top 10 24-hour Performers (Click to enlarge)

Bottom 10 24-hour Performers (Click to enlarge)

Bitcoin’s market dominance level has increased since we last reported, with its value is currently staying at 64%. This value represents a 0.9% difference to the upside when compared to the value it had yesterday.

Daily Crypto Market Cap Chart

The crypto sector capitalization has decreased over the course of the day. Its current value is $388.84 404.52 billion, representing a $5.32 million decrease when compared to our previous report.

_______________________________________________________________________

What happened in the past 24 hours?

_______________________________________________________________________

_______________________________________________________________________

Technical analysis

_______________________________________________________________________

Bitcoin

The largest cryptocurrency by market cap has (as said in our previous article) moved away from the sideways trading as it could not stand trading in such a narrow range. Bitcoin pulled back below $13,570 and even went as low as ~13,200 before bouncing back to ~$13,400 (where it is currently consolidating).

The recent days have brought us a lot of support/resistance hopping, which is what we may expect in the near future as well. Traders should focus on capitalizing on these movements as they almost always overextend. The trades can be made both while Bitcoin is creating overextension (riskier but a bigger profit potential) or during the pullback (safer but less profit potential).

BTC/USD 4-hour Chart

Bitcoin’s 4-hour technicals are showing a bear tilt, while its longer time-frames are tilted towards the buy-side (longer time-frames have less neutrality and more of a buy-tilt than the shorter ones).

BTC/USD 1-day Technicals

Technical factors (4-hour Chart):
  • Price is far at its 50-period EMA and below its 21-period EMA
  • Price below its middle Bollinger band
  • RSI is neutral (43.90)
  • Volume is average
Key levels to the upside          Key levels to the downside

1: $13,570                                 1: $13,180

2: $13,900                                 2: $13,000

3: $14,000                                  3: $12,870

Ethereum

Ethereum has plummeted after failing to break the $400 mark, and losing all the most recent gains in the process. The second-largest cryptocurrency by market cap has left the ascending channel since the end of September. Its price drop was stopped at the $371 resistance level, which has held up quite well.

Ethereum is now trading in a narrow range bound by $371 to the downside and $378 to the upside. Traders should look for any breakouts to enter trades, while the ones that want to trade the sideways action should wait and see if Ethereum is likely to stay within this range.

ETH/USD 4-hour Chart

Ethereum’s 4-hour and daily technicals are tilted towards the sell-side, while its weekly and monthly overviews remain bullish.

ETH/USD 1-day Technicals

Technical Factors (4-hour Chart):
  • The price is far below both its 50-period and its 21-period EMA
  • Price is at its bottom Bollinger band
  • RSI is close to being overbought (35.83)
  • Volume is slightly above average
Key levels to the upside          Key levels to the downside

1: $378                                     1: $371

2: $400                                     2: $361

3: $415                                      3: $358

Ripple

The fourth-largest cryptocurrency by market cap has had a red day as well, with its price falling through major support levels. A failed attempt to break the $0.2454 level has triggered a pullback, which pushed XRP’s price below $0.235 and even attempted to break $0.227. However, this support level held up, and XRP is now trading slightly above it.

If not fueled by Bitcoin’s explosive move towards either side, XRP will most likely trade sideways between $0.227 and $0.235. While traders could trade the sideways action without much problem, the lack of intra-range volatility is low, which brings the profit potential way down.

XRP/USD 4-hour Chart

XRP’s daily, weekly, and monthly technicals are all showing a strong tilt towards the sell-side, while its 4-hour overview is slightly bullish with hints of neutrality.

XRP/USD 1-day Technicals

Technical factors (4-hour Chart):
  • The price far below both its 50-period EMA and its 21-period EMA
  • Price is at its bottom Bollinger band
  • RSI is close to the oversold territory (31.89)
  • Volume is slightly above average
Key levels to the upside          Key levels to the downside

1: $0.235                                   1: $0.227

2: $0.2454                                 2: $0.221

3: $0.26                                    3: $0.217


Categories
Crypto Market Analysis

Daily Crypto Review, Nov 2 – Ethereum’s Price Explodes; Bitcoin’s Whitepaper Celebrates its 12th Birthday

The cryptocurrency sector was full of volatility over the weekend as Bitcoin tried to break the $14,000 mark. Bitcoin is currently trading for $13,735, representing a decrease of 0.13% on the day. Meanwhile, Ethereum gained 3.12% on the day, while XRP gained 1.31%.

 Daily Crypto Sector Heat Map

Taking a look at the top 100 cryptocurrencies, Ocean Protocol gained 20.20% in the past 24 hours, making it the crypto to gain the most in a day. Aave (10.97%) and Ox (8.84%) also did great. On the other hand, ABBC Coin lost 10.72%, making it the most prominent daily loser. It is followed by CyberVain’s loss of 7.62% and Ren’s loss of 3.92%.

Top 10 24-hour Performers (Click to enlarge)

Bottom 10 24-hour Performers (Click to enlarge)

Bitcoin’s market dominance level had stayed at the same place since we last reported, with its value is currently 63.1%. This value represents a 0% difference when compared to the value it had on Friday.

Daily Crypto Market Cap Chart

The crypto sector capitalization has increased slightly over the weekend. Its current value is $404.52 billion, representing a $4.91 million increase compared to our previous report.

_______________________________________________________________________

What happened in the past 24 hours?

_______________________________________________________________________

_______________________________________________________________________

Technical analysis

_______________________________________________________________________

Bitcoin

The largest cryptocurrency by market cap had quite a volatile weekend, with its price breaking the $13,900 mark at one point and even reaching as high as $14,100. However, this price didn’t hold up, and Bitcoin fell back below $13,900, where it is consolidating at the moment. Bitcoin is now trading within a tight range, bound by $13,570 to the downside and $13,900 to the upside. History has shown us that BTC doesn’t stay range-bound for long; thus, we may expect a large move soon.

Traders should look for a trade when Bitcoin breaks one of its immediate resistances.

BTC/USD 4-hour Chart

Bitcoin’s overview on all time-frames is slightly bullish, with hints of neutrality. The neutrality is more present on the shorter time-frames as opposed to less neutrality on longer time-frames.

BTC/USD 1-day Technicals

Technical factors (4-hour Chart):
  • Price is far above its 50-period EMA and above its 21-period EMA
  • Price slightly above its middle Bollinger band
  • RSI is neutral (53.43)
  • Volume is slightly above average
Key levels to the upside          Key levels to the downside

1: $13,900                                 1: $13,570

2: $14,000                                 2: $13,180

3: $14,660                                  3: $12,870

Ethereum

Ethereum had spent the weekend slowly following the ascending channel bottom line until Sunday when its price bounced off and pushed past $400. The second-largest cryptocurrency by market cap managed to reach as high as $405 before pulling back and consolidating. The fight for $400 will continue, and it will decide if Ethereum will push towards $415 and $420 in the near future or not.

Traders should look for Ethereum’s break (or the failure to break) the $400 level and trade off of that.

ETH/USD 4-hour Chart

Ethereum’s 4-hour technicals have changed to a strong buy after Ether’s price spike, while its daily, weekly, and monthly time-frames are all slightly bullish with hints of neutrality.

ETH/USD 1-day Technicals

Technical Factors (4-hour Chart):
  • The price is far above both its 50-period and its 21-period EMA
  • Price is at its top Bollinger band
  • RSI is close to being overbought (64.51)
  • Volume is slightly above average
Key levels to the upside          Key levels to the downside

1: $400                                     1: $378

2: $415                                     2: $371

3: $420                                      3: $361

Ripple

The fourth-largest cryptocurrency by market cap spent the weekend consolidating below the $0.2454 level, which it has dropped below just before the weekend started. XRP tested both the $0.235 downside and $0.2454 upside, and both have proven to be strong support/resistance levels, which has left XRP range-bound.

XRP will take a lot of buying power to break above $0.2454 again, which means that the traders should consider trading sideways inside the range XRP is currently in.

XRP/USD 4-hour Chart

XRP’s daily, weekly, and monthly technicals are all showing a strong tilt towards the sell-side, while its 4-hour overview is slightly bullish with hints of neutrality.

XRP/USD 1-day Technicals

Technical factors (4-hour Chart):
  • The price below its 50-period EMA and above its 21-period EMA
  • Price is slightly above its middle Bollinger band
  • RSI is neutral (50.10)
  • Volume is average
Key levels to the upside          Key levels to the downside

1: $0.26                                     1: $0.2454

2: $0.266                                   2: $0.235

3: $0.27                                    3: $0.227


Categories
Crypto Market Analysis

BTC/USD Chart Overview + Possible Outcomes

In this weekly BTC /USD analysis, we will be looking at the most recent events, the current technical formations, as well as discussing possible outcomes.

Overview

Bitcoin has spent another week pushing towards the upside. This time, it has passed the resistance zone at ~13,200 and pushed further towards the 2019 yearly high of $13,900. Breaking this level signifies a crucial move towards reaching all-time highs as the zone between $13,900 and the $20,000 level has close to no volume, meaning that it is “air-filled.” The moves in this zone will include a lot of volatility due to people taking profits as well as FOMO-ing in.

Technical factors


Bitcoin has conquered the ~13,200 zone after a week of trading above it and a couple of retests. However, a new high is in sight, the 2019 yearly high of $13,900.

Bitcoin is booming with bullish indicators, with its downside being guarded by the 21-period moving average, as well as hash ribbons making a crossover into miner capitulation (a huge bullish signal).
Hash Ribbons are great for detecting market bottoms or preparations for another spike, and it is one of the indicators that has provided traders with the most stable and predictable returns (and with low drawdowns).

However, the technicals factors will have no effect on the strength of the move once it happens, and Bitcoin’s short-term direction will remain unclear until it confidently breaks or pulls back from the $13,900 level.

Likely Outcomes

Bitcoin has two main scenarios it can play out, which will depend on how the “fight” for $13,900 ends.
1: If it confirms its position above the level, we can expect the unexpected, as there is close to no sell pressure above. However, many will start taking profits so unexpected downswings might happen. With that being said, the most likely target after breaking $13,900 is $13,640, which is one of the small consolidation points which happened during the 2017/2018 spike.
2: The other scenario is just as likely, and involves Bitcoin rejecting $13,900, thus creating a double top and a short-term pullback. This pullback might end at the $13,200 zone, which historically has a lot of buy and sell pressure, or even further down towards $12,470.

We also have to note that, whichever of these scenarios play out, Bitcoin’s overall sentiment is extremely bullish and that investors that do not like trading should just stick with what they are comfortable with.

Categories
Crypto Market Analysis

Daily Crypto Review, Oct 30 – Bitcoin Bounces Back Above $13,500; XRP Breaks Crucial Support Level

The cryptocurrency sector was full of volatility today but ended the day with close to no gains. Bitcoin is currently trading for $13,561, representing an increase of 2.50% on the day. Meanwhile, Ethereum gained 0.01% on the day, while XRP lost 1.12%.

 Daily Crypto Sector Heat Map

None of the top100 cryptocurrencies gained much over the course of the day. NEM gained 3.57% in the past 24 hours, making it the crypto to gain the most in a day. Celsius (2.68%) and FTX Token (2.63%) also did great. On the other hand, yearn.finance lost 16.68%, making it the most prominent daily loser. It is followed by Ocean Protocol’s loss of 16.06% and Reserve Rights’ loss of 15.74%.

Top 10 24-hour Performers (Click to enlarge)

Bottom 10 24-hour Performers (Click to enlarge)

Bitcoin’s market dominance level had increased since we last reported, with its value is currently 63.1%. This value represents a 0.8% difference to the upside when compared to when we last reported.

Daily Crypto Market Cap Chart

The crypto sector capitalization has increased slightly in the past 24 hours. Its current value is $399.63 billion, representing a $6.58billion increase compared to our previous report.

_______________________________________________________________________

What happened in the past 24 hours?

_______________________________________________________________________

_______________________________________________________________________

Technical analysis

_______________________________________________________________________

Bitcoin

The largest cryptocurrency by market capitalization had quite a volatile day, with its price bouncing back from the $13,180 resistance and pushing up. While the price has reached ~$13,700 level, it has pulled back since, currently contesting the $13,570 resistance.

Traders should look at Bitcoin contesting the $13,570 level and trade in whichever direction the price confirms its move in.

BTC/USD 4-hour Chart

Bitcoin’s 4-hour and weekly overviews are neutral bullish, while its daily and monthly overviews are tilted towards the buy-side with close to no neutrality.

BTC/USD 1-day Technicals

Technical factors (4-hour Chart):
  • Price is far above its 50-period EMA and above its 21-period EMA
  • Price slightly above its middle Bollinger band
  • RSI is ascending towards overbought (59.94)
  • Volume is slightly above average
Key levels to the upside          Key levels to the downside

1: $13,570                                 1: $13,180

2: $13,900                                 2: $12,870

3: $14,000                                  3: $12,500

Ethereum

Ethereum had, just like Bitcoin, quite a volatile day today. Its price first bounced off of the ascending channel bottom line, which prompted a push towards $395 before falling yet again. As things stand now, the leg down is still not over yet, and Ethereum is yet to decide whether it will change its course towards the upside or break the channel down.

Traders should look for Ethereum’s response to the bottom channel line and trade in continuation to where it chooses to go.

ETH/USD 4-hour Chart

Ethereum’s technicals on all time-frames except for the 4-hour one are tilted towards the buy-side, with hints of neutrality. On the other hand, its 4-hour time-frame is tilted towards the sell-side with slight hints of neutrality.

ETH/USD 1-day Technicals

Technical Factors (4-hour Chart):
  • The price is below its 50-period and its 21-period EMA
  • Price is between its middle and bottom Bollinger band
  • RSI is neutral (40.64)
  • Volume is slightly above average
Key levels to the upside          Key levels to the downside

1: $400                                     1: $378

2: $415                                     2: $371

3: $420                                      3: $361

Ripple

The fourth-largest cryptocurrency by market cap had a bad day, as its price dropped below the crucial $0.2454 support level. XRP tried to recover and went above it at one point but failed to keep the price above the level, therefore triggering another push towards $0.24, where it is currently consolidating.

It is hard to say how traders should look at XRP, though the outlook is certainly bearish. Any push towards the upside will almost certainly result from Bitcoin making a large move towards the upside.

XRP/USD 4-hour Chart

XRP’s technicals are uniformed in its bearishness, with the 1-day and monthly overviews showing a bit more neutrality than the others.

XRP/USD 1-day Technicals

Technical factors (4-hour Chart):
  • The price well below both its 50-period EMA and its 21-period EMA
  • Price is slightly above its bottom Bollinger band
  • RSI is near oversold (35.97)
  • Volume is average
Key levels to the upside          Key levels to the downside

1: $0.2454                                 1: $0.235

2: $0.26                                     2: $0.227

3: $0.266                                  3: $0.221


Categories
Crypto Market Analysis

Daily Crypto Review, Oct 29 – Bitcoin Back At $13,000: What’s Next? Trading Ideas and Market Overview

The cryptocurrency sector quite a bad day, as Bitcoin led the rest of the sector down by dropping from $13,900 all the way to below $13,000. Bitcoin is currently trading for $13,240, representing a decrease of 3.70% on the day. Meanwhile, Ethereum lost 3.60% on the day, while XRP lost 2.93%.

 Daily Crypto Sector Heat Map

If we check out the top 100 cryptocurrencies, Ocean Protocol gained 11.69% in the past 24 hours, making it the crypto to gain the most in a day. Nexo (7.86%) and DigiByte (4.49%) also did great. On the other hand, ABBC Coin lost 12.3%, making it the most prominent daily loser. It is followed by Band Protocol’s loss of 11.46% and Quant’s loss of 11.36%.

Top 10 24-hour Performers (Click to enlarge)

Bottom 10 24-hour Performers (Click to enlarge)

Bitcoin’s market dominance level had decreased slightly since we last reported, with its value is currently 62.3%. This value represents a 0.1% difference to the downside when compared to when we last reported.

Daily Crypto Market Cap Chart

The crypto sector capitalization has decreased significantly in the past 24 hours. Its current value is $393.05 billion, representing a $15.07 billion decrease compared to our previous report.

_______________________________________________________________________

What happened in the past 24 hours?

_______________________________________________________________________

_______________________________________________________________________

Technical analysis

_______________________________________________________________________

Bitcoin

The largest cryptocurrency by market capitalization pulled back as its price couldn’t pass the crucial resistance of $13,900. The move was strong and lasted three candles (around 12 hours), over which Bitcoin fell as low as $12,895, where it bounced off of its 50-period moving average. Bitcoin is now consolidating above the $13,180 level.

Traders should look at how Bitcoin trades within the range bound by $13,180 and $13,570 and trade off of that.

BTC/USD 4-hour Chart

Bitcoin’s 4-hour, daily, and monthly technicals are looking almost identical, with all of them being tilted towards the buy-side, with a bit of neutrality sprinkled in. On the other hand, its weekly overview is a bit more bearish, with oscillators leaning towards the sell-side.

BTC/USD 1-day Technicals

Technical factors (4-hour Chart):
  • Price is above its 50-period EMA and at its 21-period EMA
  • Price is at its middle Bollinger band
  • RSI is neutral (52.27)
  • Volume is descending
Key levels to the upside          Key levels to the downside

1: $13,570                                 1: $13,180

2: $13,900                                 2: $12,870

3: $14,000                                  3: $12,500

Ethereum

Ethereum has followed Bitcoin to the downside, ultimately following its own predicted path within an ascending channel and reaching the bottom of $380 (as predicted in our previous articles) before bouncing back. It is currently trading slightly below $400, with a good chance of retesting this level once again.

Traders should watch for how Ethereum looks to retest the $400 resistance level and trade the pullback or the spike after that.

ETH/USD 4-hour Chart

Ethereum’s daily and monthly technicals are tilted towards the buy-side (with slight neutrality next to them). However, its shorter time-frame (the 4-hour overview) looks completely bearishness, while its weekly overview is completely neutral.

ETH/USD 1-day Technicals

Technical Factors (4-hour Chart):
  • The price is below its 50-period and its 21-period EMA
  • Price is slightly below its middle Bollinger band
  • RSI is neutral (42.03)
  • Volume is slightly above average
Key levels to the upside          Key levels to the downside

1: $400                                     1: $378

2: $415                                     2: $371

3: $420                                      3: $361

Ripple

The fourth-largest cryptocurrency by market cap managed to push above the ascending dotted yellow line (as predicted in our previous articles) but quickly failed as Bitcoin was dragging the market down. XRP followed and fell to its $0.2454 support level, which is holding for now. However, XRP is still quite close to the support level, which might break at any moment.

Traders should look for an entry if XRP breaks $0.2454 to the downside. When looking at trades to the upside, traders can look at Bitcoin’s upside pushes and trade off of that.

XRP/USD 4-hour Chart

XRP’s technicals are almost uniformed in how bearish they are, with its 4-hour, daily, and monthly overviews showing a slight tilt towards the sell-side. Its weekly overview, however, is completely neutral.

XRP/USD 1-day Technicals

Technical factors (4-hour Chart):
  • The price far below both its 50-period EMA and its 21-period EMA
  • Price is slightly above its bottom Bollinger band
  • RSI is neutral (38.72)
  • Volume is average
Key levels to the upside          Key levels to the downside

1: $0.26                                     1: $0.2454

2: $0.266                                   2: $0.235

3: $0.2855                                3: $0.227


Categories
Crypto Market Analysis

Daily Crypto Review, Oct 28 – Bitcoin Rushing Towards $14,000; Over 50% of US Investors Interested in Crypto

The cryptocurrency sector had a great day, with most cryptocurrencies ending up in the green due to Bitcoin pushing towards $13,900. Bitcoin is currently trading for $13.720, representing an increase of 4.81% on the day. Meanwhile, Ethereum gained 3.63% on the day, while XRP gained 1.61%.

 Daily Crypto Sector Heat Map

If we check out the top 100 cryptocurrencies, Flexacoin had another amazing day, gaining an astonishing 332.35% in the past 24 hours, making it the crypto to gain the most in a day. Nexo (13.94%) and Compound (13.71%) also did great. On the other hand, ABBC Coin lost 13.58%, making it the most prominent daily loser. It is followed by Reserve CyberVein’s loss of 10.32% and Quant’s loss of 7.90%.

Top 10 24-hour Performers (Click to enlarge)

Bottom 10 24-hour Performers (Click to enlarge)

Bitcoin’s market dominance level had increased quite a bit since we last reported, with its value is currently 62.4%. This value represents a 0.8% difference to the upside when compared to when we last reported.

Daily Crypto Market Cap Chart

The crypto sector capitalization has increased significantly since we last reported. Its current value is $408.12 billion, representing an increase of $13.35 billion compared to our previous report.

_______________________________________________________________________

What happened in the past 24 hours?

_______________________________________________________________________

_______________________________________________________________________

Technical analysis

_______________________________________________________________________

Bitcoin

The largest cryptocurrency by market capitalization surprised the market once again by pushing even further up. Our weekly chart overview has listed a push towards $13,900 as one of the likely scenarios for this week, which is exactly what happened. Bitcoin has pushed past the descending (yellow dotted) line and above the $13,180 resistance level, all the way to $13,800.

Traders should look at how Bitcoin behaves around $13,900 and follow the next push (either a pullback below $13,570 or a break past $13,900).

BTC/USD 4-hour Chart

Bitcoin’s technicals have changed to extremely bullish on all time frames since yesterday, with only the 4-hour chart oscillators showing some signs of a tilt towards the sell-side.

BTC/USD 1-day Technicals

Technical factors (4-hour Chart):
  • Price is far above both its 50-period EMA and its 21-period EMA
  • Price is at its top Bollinger band
  • RSI is overbought (74.76)
  • Volume is above average
Key levels to the upside          Key levels to the downside

1: $13,570                                 1: $13,200

2: $13,900                                 2: $12,870

3: $14,000                                  3: $12,500

Ethereum

Ethereum has spent the day bouncing off of the support level dating back from early September. While Ether had a slightly bigger chance of continuing its path down the projected path towards the bottom of the channel, Bitcoin’s rise sparked up Ether’s bounce. Its price is now hovering slightly above $400, with a solid chance of testing $415 again.

Traders should watch for how Ethereum plays out in the next few days to evaluate if it pushes towards $415-$420 or goes below $400.

ETH/USD 4-hour Chart

Ethereum’s technicals are tilted towards the buy-side on all time-frames, but only the daily time-frame is completely bullish. On the other hand, the 4-hour, weekly, and monthly overviews have signs of neutrality, mostly when it comes to oscillators.

ETH/USD 1-day Technicals

Technical Factors (4-hour Chart):
  • The price is above its 50-period and slightly above its 21-period EMA
  • Price is at its middle Bollinger band
  • RSI is neutral (55.78)
  • Volume is average
Key levels to the upside          Key levels to the downside

1: $415                                     1: $400

2: $420                                     2: $378

3: $435                                      3: $371

Ripple

The fourth-largest cryptocurrency by market cap has stayed at the same place over the course of the past 24 hours, possibly preparing itself for a move towards the yellow ascending line. Even if it keeps following it, XRP will gain a significant boost in price and an opportunity to test $0.26 once again.

Traders should look for a trade when XRP reaches $0.26, as they can enter a trade on either the pullback or the push above.

XRP/USD 4-hour Chart

XRP’s technicals are slightly tilted towards the buy-side, but the 1-day, as well as 4-hour and weekly technicals, show slight neutrality. On the other hand, its monthly overview is still bearish.

XRP/USD 1-day Technicals

Technical factors (4-hour Chart):
  • The price at both its 50-period EMA and its 21-period EMA
  • Price is at its middle Bollinger band
  • RSI is neutral (50.04)
  • Volume is average
Key levels to the upside          Key levels to the downside

1: $0.26                                     1: $0.2454

2: $0.266                                   2: $0.235

3: $0.2855                                3: $0.227


Categories
Crypto Guides

How DeFi Is Solving The Problem That Bitcoin Always Wanted To?

Introduction 

When you hear the word ‘cryptocurrency,’ Bitcoin is the first thing that pops into your mind. For the longest time, bitcoin has been synonymous with cryptocurrency and regarded as the future currency. In the recent past, bitcoin’s monopoly has been diluted by the entrance of thousands of other cryptocurrencies.

The cryptocurrencies’ primary objective was to serve as an alternative, and down the line, a replacement to the global fiat financial system. This objective has failed to take off. This failure can be attributed to the skepticism cryptocurrencies have faced, which has slowed their role as a legitimate alternative to fiat currencies. DeFi has helped address some of these challenges and help make cryptocurrencies mainstream.

What is DeFi?

DeFi is the short form for Decentralised Finance.  At its core, decentralized finance is the provision of conventional financial services on platforms built on the public blockchain. Specifically, DeFi is based on the Ethereum blockchain platform.

DeFi is heralded as the most suitable alternative to the global financial system. This new enthusiasm about the decentralization of finance is owed to the fact that DeFi is seen as being able to solve the problems that bitcoin failed to solve.

Advancements Made by DeFi

Here are some of the advancements made DeFi, which bitcoin failed to achieve.

Creation of issuance and investing platform

These platforms operate like an ordinary stock exchange. DeFi has made it possible so that cryptocurrencies can be issued and traded like conventional financial securities. The platform brings together broker-dealers, legal advisors, and custodians, who will advise issuers through the process. Furthermore, the platform also makes it possible for asset and investment managers’ proliferation for crypto-based financial assets.

Establishment of a decentralized prediction market

A prediction market is one where individuals can bet on any future occurrences. With decentralized prediction markets, there is no form of censorship whatsoever. Therefore, it offers an incredible opportunity to hedge against future risks financially and speculate on all forms of social events globally.

Growth of open lending protocols

Decentralized open lending championed by DeFi involves the following: collateralization of cryptocurrencies; elimination of credit checks among borrowers; lending and borrowing of cryptocurrencies for trading purposes; and real-time settlement of transactions. The financial inclusion resulting from open lending is unparalleled.

Facilitated the issuance of stablecoins

DeFi made it possible for the issuance of stablecoins by facilitating the auditing of crypto reserves and ensuring manageable volatility of such cryptocurrencies. With DeFi, stablecoins can be pegged on another asset. Categories of stable coins that have been spurred by DeFi include crypto-collateralized stablecoins, fiat-collateralized stable coins, and non-collateralized stablecoins whose stability depends on an algorithm controlling the expansion and contraction of its supply.

Bottom Line

DeFi undoubtedly offers a higher potential for financial inclusion, censorship-free transactions, and improved privacy. Although DeFi is offered as an alternative to the centralized financial system, it is almost impossible to envision an economy where the centralized financial system ceases to exist. Thus, it is prudent to co-mingle the two systems to ensure complementarity, which will tone down the inherent risks associated with either system.

Categories
Crypto Market Analysis

Daily Crypto Review, Oct 27 – Bitcoin Preparing For a Retracement; XRP Tumbles on the Daily

The cryptocurrency sector spent the day with cryptocurrencies trying to find consolidation points as preparation for Bitcoin’s next move. Bitcoin is currently trading for $13.049, representing an increase of 0.61% on the day. Meanwhile, Ethereum lost 2.74% on the day, while XRP lost 1.73%.

 Daily Crypto Sector Heat Map

If we check out the top 100 cryptocurrencies, Flexacoin gained an astonishing 144.03% in the past 24 hours, making it the crypto to gain the most in a day. Kusama (28.07%) and Ocean Protocol (20.44%) also did great. On the other hand, Quant lost 13.61%, making it the most prominent daily loser. It is followed by Reserve Rights’ loss of 10.28% and Cybervein’s loss of 8.60%.

Top 10 24-hour Performers (Click to enlarge)

Bottom 10 24-hour Performers (Click to enlarge)

Bitcoin’s market dominance level had increased slightly since we last reported, with its value is currently 61.6%. This value represents a 0.5% difference to the upside when compared to when we last reported.

Daily Crypto Market Cap Chart

The crypto sector capitalization has stayed at the same place since we last reported. Its current value is $394.54 billion, representing an increase of $1.86 billion compared to our previous report.

_______________________________________________________________________

What happened in the past 24 hours?

_______________________________________________________________________

_______________________________________________________________________

Technical analysis

_______________________________________________________________________

Bitcoin


The largest cryptocurrency by market capitalization has spent the past 24 hours slowly gaining value and reaching the $13,180 mark. However, it managed to make (at the moment) the third lower high in a row, creating a short-term bearish indicator. The decaying volume, as well as an increase in sell pressure around the $13,200 level, supports the claim that Bitcoin is more likely to retrace first before moving up.

Traders should pay attention to how BTC approaches $13,180 and if it (more likely) enters a price correction phase, or if it rather (less likely) pushes past $13,180 and towards #13,900.

BTC/USD 4-hour Chart

Bitcoin’s technicals are a bit more bearish than the day before, despite its price being a bit higher. Its 4-hour, daily and weekly overviews all have sell-tilted oscillators and buy-tilted moving averages, while the overall summary is slightly bullish. The monthly overview is still fully bullish.

BTC/USD 1-day Technicals

Technical factors (4-hour Chart):
  • Price is above both its 50-period EMA and its 21-period EMA
  • Price is slightly above its middle Bollinger band
  • RSI is slightly below being overbought (61.54)
  • Volume is descending
Key levels to the upside          Key levels to the downside

1: $13,200                                 1: $12,870

2: $13,900                                 2: $12,500

3: $14,000                                  3: $12,300

Ethereum

Ethereum has spent the day following its ascended trading channel but to the downside. The second-largest cryptocurrency by market cap bounced off of the $420 highs as it couldn’t pass either of the $415 and $420 resistance levels and pushed towards the downside. The move will most likely end somewhere between $400 and $378. However, if Bitcoin pushes towards the upside, Ethereum will most likely abandon its current pattern and trade alongside it.

Traders should watch for how Ethereum retraces and what it does after, as many safe trading patterns may emerge from that.

ETH/USD 4-hour Chart

Ethereum’s technicals are quite confusing, as its 4-hour overview is completely bearish, while its daily overview is completely bullish. Its weekly and monthly overviews are tilted towards the buy-side, but the weekly one is slightly more neutral.

ETH/USD 1-day Technicals

Technical Factors (4-hour Chart):
  • The price is below both its 50-period and its 21-period EMA
  • Price is at its lower Bollinger band
  • RSI is nearly oversold (38.94)
  • Volume is average
Key levels to the upside          Key levels to the downside

1: $415                                     1: $400

2: $420                                     2: $378

3: $435                                      3: $371

Ripple

The fourth-largest cryptocurrency by market cap trying to decide its direction. Its price started to fall down after it failed to break $0.26, but it was expected for the ascending trend line (yellow dotted line) to hold at least for a bit more. However, XRP quickly broke that level to the downside, opening itself towards more possibility of moving down.

On the other hand, some people call the most recent moves a bull flag and are entering long positions. While this is unlikely, all traders must be aware of and respect this stance as well before entering their own trades.

XRP/USD 4-hour Chart

XRP’s technicals split into two sides, with the 4-hour and monthly overviews being tilted towards the sell-side and daily and weekly overviews being tilted towards the bull-side (with a bit of neutrality).

XRP/USD 1-day Technicals

Technical factors (4-hour Chart):
  • The price slightly below both its 50-period EMA and its 21-period EMA
  • Price is between its lower and middle Bollinger band
  • RSI is ascending (42.18)
  • Volume is average
Key levels to the upside          Key levels to the downside

1: $0.26                                     1: $0.2454

2: $0.266                                   2: $0.235

3: $0.2855                                3: $0.227


Categories
Crypto Market Analysis

Daily Crypto Review, Oct 26 – JP Morgan Calls Bitcoin “Currency With A Large Upside Potential”; Crypto Preparing For A Big Move

The cryptocurrency sector spent the weekend hovering around the same spot as Bitcoin was testing its ~$13,000 level. Bitcoin is currently trading for $13.049, representing a decrease of 0.80% on the day. Meanwhile, Ethereum lost 1.52% on the day, while XRP gained 0.18%.

 Daily Crypto Sector Heat Map

If we check out the top 100 cryptocurrencies, Flexacoin gained an astonishing 171.94% in the past 24 hours, making it the crypto to gain the most in a day. Filecoin (56.89%) and Reserve Rights (13.22%) also did great. On the other hand, Energy Web Token lost 7.94%, making it the most prominent daily loser. It is followed by Cosmos’ loss of 5.78% and ABBC Coin’s loss of 5.71%.

Top 10 24-hour Performers (Click to enlarge)

Bottom 10 24-hour Performers (Click to enlarge)

Bitcoin’s market dominance level had increased slightly since when we last reported, with its value is currently 61.1%. This value represents a 0.3% difference to the upside when compared to when we last reported.

Daily Crypto Market Cap Chart

The crypto sector capitalization has stayed at the same place since we last reported. Its current value is $396.38 billion, representing an increase of $1.83 billion compared to our previous report.

_______________________________________________________________________

What happened in the past 24 hours?

_______________________________________________________________________

_______________________________________________________________________

Technical analysis

_______________________________________________________________________

Bitcoin

The largest cryptocurrency by market capitalization has spent the weekend hovering around the $13,000 mark, and even attempted to break through the $13,200 resistance level (but failed to). With the volume is descending ever since Oct 21, most analysts are expecting a big move very soon. However, they are torn when it comes to the direction.

Traders should pay attention to how BTC handles its push towards the resistance level, as there might be good trading opportunities after (more likely) the level holds and a pullback occurs, or after BTC breaks the level and pushes higher (less likely).

BTC/USD 4-hour Chart

Bitcoin’s sentiment is highly bullish, with its shorter time-frames showing a bigger tilt towards neutrality, while its longer time-frames are more titled to the buy-side.

BTC/USD 1-day Technicals

Technical factors (4-hour Chart):
  • Price is far above its 50-period EMA and slightly above its 21-period EMA
  • Price is at its middle Bollinger band
  • RSI is slightly below being overbought (62.22)
  • Volume is descending
Key levels to the upside          Key levels to the downside

1: $12,870                                 1: $12,500

2: $13,200                                 2: $12,300

3: $14,000                                  3: $12,000

Ethereum

Ethereum has continued its descent from the highs it made on Oct 22, with its price moving slowly towards the downside. The smaller time-frame charts are showing that ETH kept creating new lower highs, with one (failed) attempt to break out of the trend. The next couple of hours will be crucial, as Ethereum is about to hit the trend line, break it or continue pushing down towards $400.

Traders should watch for how Ethereum reacts to the descending trend line and trade off of it.

ETH/USD 2-hour Chart

Ethereum’s technicals are tilted towards the buy-side on all time-frames, with its lower time frames being slightly more neutral.

ETH/USD 1-day Technicals

Technical Factors (4-hour Chart):
  • The price is above its 50-period and slightly above its 21-period EMA
  • Price is at its Bollinger band
  • RSI is overbought (52.24)
  • Volume is average
Key levels to the upside          Key levels to the downside

1: $415                                     1: $400

2: $420                                     2: $378

3: $435                                      3: $371

Ripple

The fourth-largest cryptocurrency by market cap spent the weekend testing its ascending support level (the dotted yellow line), which dates back from Oct 16. XRP has slowly descended from its most recent highs and reached the support line at the ~$0.252 level. The line provided good support, and XRP shot up as a result of it. However, it could not break the $0.26 resistance level, which may prove a problem in the long run.

XRP is unlikely to pass $0.26 unless it is fueled by Bitcoin’s push towards the upside. The more likely scenario would be that XRP hovers between the support line and the $0.26 level for some time.

XRP/USD 4-hour Chart

XRP’s technicals are bullish with hints of neutral sentiment on the 4-hour, 1-day, and 1-week time-frames, while its monthly time-frame shows strong bearish sentiment.

XRP/USD 1-day Technicals

Technical factors (4-hour Chart):
  • The price above both its 50-period EMA and its 21-period EMA
  • Price is near its top Bollinger band
  • RSI is ascending (58.25)
  • Volume is elevated
Key levels to the upside          Key levels to the downside

1: $0.26                                     1: $0.2454

2: $0.266                                   2: $0.235

3: $0.2855                                3: $0.227


Categories
Crypto Market Analysis

BTC/USD Chart Overview + Possible Outcomes

In this weekly BTC /USD analysis, where we are looking at the most recent events, the current technical formations, as well as discussing possible outcomes.

Overview

Bitcoin has had another week of explosive gains, mostly due to its fundamentals. This week’s spike can’t go without mentioning PayPal’s announcement that it will enable its users to buy, sell and hold crypto, as well as that it will not be just a gimmick but rather a crucial factor in PayPal’s future business development (PayPal will offer crypto payments to its 26 million merchants, as well as enable the usage of crypto on its payment processing app Venmo). This news, alongside other news of large corporations investing tens of millions in Bitcoin and crypto, sparked the push past $12,000 and up to $13,235.

Technical factors


Bitcoin has abruptly left its triangle formation last week, pushing a little above $11,700 before consolidating and pulling back. After being pressed between $11,300 and $11,500 for some time, the PayPal news broke out, and Bitcoin surged, reaching as far as $13,235 before the move stopped.
Bitcoin is now in a consolidation phase, creating a triangle formation on the smaller time-frames. The formation is accompanied by descending volume, indicating that the move that will follow will be quite strong. Its RSI is overbought on all time-frames above 4 hours, while its moving averages are at play only at the 1-hour chart, where the current price is supported by the 21-period moving average.
Sentiment built around Bitcoin is certainly bullish at the moment, and any serious downturns are very unlikely. However, a slight pullback before the next push is likely.
Another thing to add is that Bitcoin is one step away from moving into the “fresh air” territory (after the 2019 high of $13,900) where there is no technical or historical volume ahead, meaning that this territory will be full of new people entering the market to chase profits as well as smart money taking profits.

Likely Outcomes

Bitcoin currently has two main scenarios it can play out. Both of these scenarios are bullish, where one breaks out above the current 1h time-frame triangle formation to the upside and past the $13,200 area, while the other one involves a pullback before the spike.
1: As shown in the chart, Bitcoin will most likely have to retrace slightly and reset its RSI level. While the bull sentiment is prevailing, the largest cryptocurrency by market cap should establish and confirm its support at the ~$12,500 level (which it breezed through) before going further up.
2: The other scenario is slightly less likely, and involves a simple breakout scenario of the current triangle formation to the upside and a push towards (ultimately) $13,900. This level will certainly be contested as it is the last frontier before the all-time high territory. On top of that, many investors will most likely take profit at this level.

The scenario in which Bitcoin suddenly down sharply and swiftly is incredibly unlikely. While a strong move in this direction is possible only if it’s backed by some bearish news/events, the bull phase Bitcoin is in at the moment is highly resistant to bad news.

Categories
Crypto Videos

Crypto Going Mainstream In 2021 As Paypal Adopts Bitcoin – Go Get Your Lambo!

Crypto Going Mainstream in 2021 – MAJOR Adoption by PayPal and Venmo


PayPal has officially confirmed on Wednesday, October 22, that it is entering the cryptocurrency market. The payments provider giant, with over 346 million active accounts all around the world, has pledged to make cryptocurrency not only an optional feature but rather “a funding source for purchases at its 26 million merchants worldwide.” PayPal also plans to expand this service to its peer-to-peer payment app Venmo in the first half of 2021.

The public already knew that PayPal was planning on moving into crypto in June, but the information came from anonymous sources, and nothing was certain. A month later, the Paxos exchange had been selected to act as support in PayPal’s crypto endeavors.
In a blog post that came out on Wednesday, PayPal said that the current pandemic had made it clear that people need digital payments of all sorts.
Starting in early 2021, PayPal’s customers will be able to instantly convert one of the supported cryptocurrencies to fiat currency, with no added incremental fees, PayPal said. Merchants will have no additional fees or integrations as all transactions will not be settled in crypto but rather in fiat currency at their current PayPal rates.

“Cryptocurrency simply becomes another funding source in the PayPal digital wallet, adding more utility to cryptocurrency holders, while addressing concerns surrounding volatility, cost as well as the speed of cryptocurrency-based transactions,” PayPal announced.
PayPal will initially have a $10,000 weekly buying cap as well as a $50,000 limit per 12-month period. All trades must be executed in US dollars, PayPal stated.

Everything sounds good… But!

As bullish the Bitcoin market has proven to be about this news at the moment, an initial review of the crypto services PayPal offers has a couple of cons. First off, the company will take a go-slow mindset, which is the complete opposite of how the markets reacted to the most recent adoption news. Critical caps limit who the buyers are, how much they can actually buy, and what they can do with their PayPal- sourced crypto. While this is not necessarily bad, crypto enthusiasts should take everything slow and with a grain of salt rather than instantly calling for the moon and ordering their Lambos.

However, there is completely bad news, rather than just a slight setback. PayPal is refusing to hand its customers’ crypto keys over, meaning that you own the cryptocurrency you buy on PayPal. Still, just like on centralized exchanges, you will not be provided with a private key,” PayPal casts this restriction as a loss-prevention tactic.
Another bad thing is that the users will not be allowed to send their crypto around or even withdraw it. PayPal stated that “you can only hold the crypto that you buy on PayPal in your account. The cryptocurrency in your account cannot be sent to other accounts on PayPal or off it.” This brought a lot of questions on whether PayPal’s crypto feature will have “paper Bitcoin” or if it will be covered by real cryptocurrency.


However, PayPal’s partnership with Paxos should be good enough proof that the crypto held on the payment provider will be the real deal. The New York State Department of Financial Services announced that it had granted the “conditional BitLicense” to PayPal, the first of its kind. The BitLicense was granted for a partnership with the Paxos Trust Company, enabling PayPal customers to buy and sell cryptocurrencies. Four DFS-approved digital assets that will be initially available are Bitcoin, Bitcoin Cash, Ether, as well as Litecoin, according to the DFS statement.
The service rollout also faces quite a few real-world restrictions. Out of the 50 US states, only 49 have coverage at launch, as Hawaii is excluded from the list.


Conclusion

Bitcoin and other cryptocurrencies rallied following this announcement, which is just one of several major recent mainstream corporate adoption signs in 2020. The PayPal event happened following Microstrategy’s $425 million Bitcoin investment, as well as a similar but more modest move by Square.

Categories
Crypto Market Analysis

Daily Crypto Review, Oct 23 – PayPal Enabling Crypto Not as Good as it Sounds; Ethereum Pushes Towards $420

The cryptocurrency sector was mostly consolidating after Bitcoin’s surge, with almost every single cryptocurrency in the top100 ending up in the green. Bitcoin is currently trading for $12,961, representing an increase of 1.21% on the day. Meanwhile, Ethereum gained 5.64% on the day, while XRP gained 2.34%.

 Daily Crypto Sector Heat Map

If we check out the top 100 cryptocurrencies, Ampleforth gained 19.04% in the past 24 hours, making it the crypto to gain the most in a day. Energy Web Token (17.44%) and Reserve Rights (12.20%) also did great. On the other hand, Filecoin lost 13.57%, making it the most prominent daily loser. It is followed by HedgeTrade’s loss of 8.57% and ABBC Coin’s loss of 8.49%.

Top 10 24-hour Performers (Click to enlarge)

Bottom 10 24-hour Performers (Click to enlarge)

Bitcoin’s market dominance level had decreased slightly since when we last reported, with its value is currently 60.8%. This value represents a 0.4% difference to the downside when compared to when we last reported.

Daily Crypto Market Cap Chart

The crypto sector capitalization has experienced an increase since we last reported. Its current value is $394.96 billion, representing an increase of $4.72 billion compared to our previous report.

_______________________________________________________________________

What happened in the past 24 hours?

_______________________________________________________________________

While most of the market rejoices Bitcoin’s surge, confirmation of a bull market, and PayPal enabling its users to buy, sell and hold crypto, not everyone is equally happy. Some analysts have pointed out that PayPal will almost certainly bring adoption, but perhaps at a steep price. If the payment processor giant doesn’t get involved in the community and refuses to give private keys to its users, the benefits may not outweigh the setbacks.

With that being said, additional adoption and introduction of Bitcoin to the wider masses is certainly a positive thing.

_______________________________________________________________________

Technical analysis

_______________________________________________________________________

Bitcoin

The largest cryptocurrency by market capitalization stayed strong after yesterday’s push and even gained some more value. The price pushed past $13,000 once again but couldn’t hold the level, which prompted a pullback towards the sub-$13,000 level. However, the $12,870 level has turned to a support level (though it still needs proper confirmation), which is certainly positive.

At the moment, traders should look Bitcoin’s pullback and trade-off of that. However, if Bitcoin manages to push past $13,000 with confidence, traders shouldn’t wait much but rather join in quickly.

BTC/USD 4-hour Chart

Bitcoin’s technical overview has a strong bullish sentiment on longer time-frames (weekly and monthly), while its short-term sentiment is slightly more neutral.

BTC/USD 1-day Technicals

Technical factors (4-hour Chart):
  • Price is far above its 50-period EMA and at its 21-period EMA
  • Price between its middle and top Bollinger band
  • RSI is overbought but descending(73.99)
  • Volume is extremely elevated
Key levels to the upside          Key levels to the downside

1: $12,870                                 1: $12,500

2: $13,200                                 2: $12,300

3: $14,000                                  3: $12,000

Ethereum

Ethereum’s push from yesterday was just a weaker iteration of Bitcoin’s push. However, the second-largest cryptocurrency by market cap has pushed further towards the upside on its own today, testing the $415 and $420 levels. While tests towards both levels failed, Ethereum is still very near $415 and may have the opportunity to strike again, or just consolidate near this level.

Traders should pay attention to Ethereum’s pullback towards $400 or push past $415 and trade off of that.

ETH/USD 4-hour Chart

Ethereum’s technicals are slightly confusing, as its 4-hour overview is completely bullish, while its daily overview is neutral-bullish. However, its long term technicals all tilt towards the buy-side.

ETH/USD 1-day Technicals

Technical Factors (4-hour Chart):
  • The price is far above its 50-period and its 21-period EMA
  • Price is near the top Bollinger band
  • RSI is overbought (75.95)
  • Volume is elevated
Key levels to the upside          Key levels to the downside

1: $415                                     1: $400

2: $420                                     2: $378

3: $435                                      3: $371

Ripple

The fourth-largest cryptocurrency by market cap had a day filled with volatility, ups, and downs. XRP started the day off strong with a push past $0.26 and towards $0.266. However, bulls have reached exhaustion quickly, and bears stepped in, pulling the price back down to $0.257, where XRP is now consolidating.

XRP has a high-resistance zone above $0.26, which we have seen today as well. For this reason, it is much more plausible that XRP will push towards the downside and retest the $0.25 or $0.2454 levels.

XRP/USD 4-hour Chart

XRP’s technicals are extremely bullish on the 4-hour and 1-day chart, while they are tilting towards the sell-side the longer time-frame we choose.

XRP/USD 1-day Technicals

Technical factors (4-hour Chart):
  • The price far above its 50-period EMA and above its 21-period EMA
  • Price is between its middle and top Bollinger band
  • RSI has left the overbought territory (61.12)
  • Volume is elevated
Key levels to the upside          Key levels to the downside

1: $0.26                                     1: $0.2454

2: $0.266                                   2: $0.235

3: $0.2855                                3: $0.227


Categories
Crypto Market Analysis

Daily Crypto Review, Oct 22 – PayPal to Enable its Users to Buy and Sell Crypto; Bitcoin Skyrockets to $13,000 as a Response

The cryptocurrency sector has rallied up and skyrocketed as PayPal announced that it will now support cryptocurrencies. Bitcoin has led the rally with an almost double-digit increase. It is currently trading for $12,886, representing an increase of 7.25% on the day. Meanwhile, Ethereum gained 6.69% on the day, while XRP gained 4.78%.

 Daily Crypto Sector Heat Map

If we check out the top 100 cryptocurrencies, we can see that Reserve Rights gained 45.36% in the past 24 hours, making it the top daily gainer. Litecoin (16.03%) and Ampleforth (14.02%) also did great. On the other hand, ABBC Coin lost 18.97%, making it the most prominent daily loser. It is followed by Filecoin’s loss of 14.56% and The Midas Touch Gold’s loss of 7.03%.

Top 10 24-hour Performers (Click to enlarge)

Bottom 10 24-hour Performers (Click to enlarge)

Bitcoin’s market dominance level had increased slightly since when we last reported, with its value is currently 61.2%. This value represents a 0.7% difference to the upside when compared to when we last reported.

Daily Crypto Market Cap Chart

The crypto sector capitalization has experienced a huge increase since we last reported. Its current value is $390.24 billion, representing an increase of $23.98 billion compared to our previous report.

_______________________________________________________________________

What happened in the past 24 hours?

_______________________________________________________________________

_______________________________________________________________________

Technical analysis

_______________________________________________________________________

Bitcoin

The largest cryptocurrency by market capitalization has had quite an amazing day filled with volatility and extremely high bull presence. Fueled by PayPal’s announcement that it will enable its users to buy,  sell and hold crypto,  Bitcoin skyrocketed and reached as high as $13,235 before pulling back. It’s currently trying to consolidate just under the $12,870 resistance level.

Any skepticism regarding whether the bull market has started has been shattered with Bitcoin’s most recent move. However, while this move was intense, Bitcoin will need a lot of great news, adoption, and ultimately time to reach its all-time highs.

At the moment, traders should look at how Bitcoin handles the pullback and trade-off of that.


BTC/USD 1-day Chart

Bitcoin’s technical overview is very strongly tilted towards the buy-side on longer time-frames (weekly and monthly), while its short-term overviews are slightly more neutral.

BTC/USD 1-day Technicals

Technical factors (4-hour Chart):
  • Price is far above its 50-period EMA and at its 21-period EMA
  • Price above its top Bollinger band
  • RSI is extremely overbought (81.74)
  • Volume is extremely elevated
Key levels to the upside          Key levels to the downside

1: $12,870                                 1: $12,500

2: $13,200                                 2: $12,300

3: $14,000                                  3: $12,000

Ethereum

Ethereum has followed Bitcoin’s lead and pushed towards the upside, though with much less strength. Its price ultimately reached the $400 resistance before pulling back slightly. It is currently trying to consolidate right under the $400 level, which is still a great increase in price since yesterday when Ether was fighting to stay above $378.

Ethereum traders should pay attention to how the second-largest cryptocurrency by market cap handles its immediate resistance level, as well as an eventual further pullback.

ETH/USD 4-hour Chart

Ethereum’s technicals on all time-frames show bullishness, with its 4-hour and long-term technicals being a bit more tilted towards the neutral position, while its 1-day overview is completely bullish.

ETH/USD 1-day Technicals

Technical Factors (4-hour Chart):
  • The price is far above its 50-period and its 21-period EMA
  • Price is at the top Bollinger band
  • RSI is close to overbought (66.91)
  • Volume is elevated
Key levels to the upside          Key levels to the downside

1: $400                                     1: $378

2: $415                                     2: $371

3: $420                                      3: $360

Ripple

The fourth-largest cryptocurrency by market cap has, like yesterday, used the momentum that Bitcoin has provided to push further up. Its price has established itself above the $0.2454 support level and pushed past $0.25. However, the $0.26 resistance level has not fallen, and XRP is now consolidating at the ~$0.255 level.

XRP’s upside is a zone of strong resistance, which this cryptocurrency will hardly surpass without Bitcoin’s push. XRP traders should pay attention to Bitcoin’s moves while focusing on XRP’s moves towards the downside.

XRP/USD 4-hour Chart

XRP’s technicals have changed quite a bit since our last report. Its 4-hour, 1-day, and weekly overviews are strongly tilted towards the buy-side, while its monthly overview is still bearish with a slight hint of neutrality.

XRP/USD 1-day Technicals

Technical factors (4-hour Chart):
  • The price far above its 50-period EMA and above its 21-period EMA
  • Price is at its top Bollinger band
  • RSI is close to overbought (65.61)
  • Volume is below average
Key levels to the upside          Key levels to the downside

1: $0.26                                     1: $0.2454

2: $0.266                                   2: $0.235

3: $0.2855                                3: $0.227


Categories
Crypto Market Analysis

Daily Crypto Review, Oct 21 – Bitcoin Above $12,000; Bull Market in Full Swing

The cryptocurrency sector was mostly in the red until Bitcoin took the day to push past $12,000, after which some cryptos started following it towards the upside. Bitcoin is currently trading for $12.234, representing an increase of 4.21% on the day. Meanwhile, Ethereum gained 0.40% on the day, while XRP lost 0.31%.

 Daily Crypto Sector Heat Map

If we look at the top 100 cryptocurrencies, we can see that Nano gained 6.94% in the past 24 hours, making it the top daily gainer. Aave (5.59%) and OKB (5.41%) also did great. On the other hand, NXM lost 13.92%, making it the most prominent daily loser. It is followed by Reserve Rights’ loss of 13.85% and Arweave’s loss of 12.59%.

Top 10 24-hour Performers (Click to enlarge)

Bottom 10 24-hour Performers (Click to enlarge)

Bitcoin’s market dominance level has increased slightly since when we last reported, with its value is currently 60.5%. This value represents a 1% difference to the upside when compared to when we last reported.

Daily Crypto Market Cap Chart

The crypto sector capitalization has stayed at the same spot since we last reported. Its current value is $366.26 billion, representing an increase of $0.79 billion compared to our previous report.

_______________________________________________________________________

What happened in the past 24 hours?

_______________________________________________________________________

_______________________________________________________________________

Technical analysis

_______________________________________________________________________

Bitcoin

The largest cryptocurrency by market capitalization is pushing past its psychological and actual major resistance of $12,000 right at this moment. The move started slow, with one candle testing the waters above $12,000 before backing out, before bulls went head-on and pushed the move quickly to far above this level. At the moment, Bitcoin has stopped its push at just above $12,250.

Traders should pay attention to hot Bitcoin finishes this move and trade either the pullback or the next wave up.

BTC/USD 1-day Chart

Bitcoin’s technical overview is strongly tilted towards the buy-side, with lower time-frames showing some signs of neutrality, while longer time-frames are completely bullish.

BTC/USD 1-day Technicals

Technical factors (4-hour Chart):
  • Price is far above its 50-period EMA and at its 21-period EMA
  • Price above its top Bollinger band
  • RSI is extremely overbought (80.30)
  • Volume is elevated
Key levels to the upside          Key levels to the downside

1: $12,330                                 1: $12,000

2: $12,500                                 2: $11,850

3: $12,870                                  3: $11,735

Ethereum

Ethereum’s price was pretty much stagnant until Bitcoin broke $12,000, which is when the second-largest cryptocurrency by market cap started pushing up as well. The price has slowly pushed past $371 and then explosively past $378, which is where it is at the moment.

Traders should pay attention to how ETH tries to establish itself above $378, and trade off of it.

ETH/USD 4-hour Chart

Ethereum’s 4-hour technicals are showing a tilt towards the sell-side, while its 1-day overview is still bullish. When taking a look at its longer time-frames, we can see heavy neutrality, but still overall bulishness.

ETH/USD 1-day Technicals

Technical Factors (4-hour Chart):
  • The price is above its 50-period and its 21-period EMA
  • Price is near the top Bollinger band
  • RSI is neutral (56.02)
  • Volume is elevated
Key levels to the upside          Key levels to the downside

1: $400                                     1: $378

2: $415                                     2: $371

3: $420                                      3: $360

Ripple

The fourth-largest cryptocurrency by market cap used the momentum Bitcoin’s move has created to push past its $0.2454 resistance once again after falling below it the day before. While this is a great thing, XRP couldn’t pass its previous resistance level of $0.25, which caused it to retest the support level. If it drops below $0.2454 again, bears may gather in a larger number and XRP might push down towards $0.235

XRP/USD 4-hour Chart

XRP’s technicals are quite mixed up, with its 4-hour and weekly overviews showing signs of bullish sentiment, while its daily and monthly overviews are tilted towards the sell-side.

XRP/USD 1-day Technicals

Technical factors (4-hour Chart):
  • The price is at its 50-period EMA and above its21-period EMA
  • Price is near its top Bollinger band
  • RSI is neutral (53.64)
  • Volume is below average
Key levels to the upside          Key levels to the downside

1: $0.26                                     1: $0.2454

2: $0.266                                   2: $0.235

3: $0.2855                                3: $0.227


Categories
Crypto Market Analysis

Daily Crypto Review, Oct 20 – Bitcoin Above $12,000 by the End of the Month? Bull Market has Already Started

The cryptocurrency sector has pushed towards the upside as Bitcoin reached $11,850. Bitcoin is currently trading for $11,741, representing an increase of 2.22% on the day. Meanwhile, Ethereum gained 0.50% on the day, while XRP gained 1.69%.

 Daily Crypto Sector Heat Map

If we look at the top 100 cryptocurrencies, we can see that Dash gained 11.62% in the past 24 hours, making it the top daily gainer. Stellar (7.37%) and Quant (6.5%) also did great. On the other hand, Aave lost 10.73%, making it the most prominent daily loser. It is followed by Crypto.com Coin’s loss of 10.06% and NEAR Protocol’s loss of 9.3%.

Top 10 24-hour Performers (Click to enlarge)

Bottom 10 24-hour Performers (Click to enlarge)

Bitcoin’s market dominance level has increased slightly since our last report, with its value is currently 59.5%. This value represents a 0.7% difference to the upside when compared to when we last reported.

Daily Crypto Market Cap Chart

The crypto sector capitalization has lost a bit of its value since Friday. Its current value is $365.47 billion, representing a decrease of $4.35 billion compared to our previous report.

_______________________________________________________________________

What happened in the past 24 hours?

_______________________________________________________________________

_______________________________________________________________________

Technical analysis

_______________________________________________________________________

Bitcoin

The largest cryptocurrency by market capitalization has pushed past its major resistance sitting at $11,500. The push was accompanied by a major volume increase, which brought Bitcoin’s price to as high as $11,850 before dropping back down to sub-$11,800.


This new spike has put Bitcoin at above 60% year-to-date gains. On top of that, Bitcoin is on track to challenge (and even pass) $12,000, which is a crucial resistance. With the price ignoring all indicators showing that it would bounce back down and pull away from its highs, it does quite the opposite. This inspired many analysts to call for Bitcoin at over $12,000 even by the end of the month.

BTC/USD 1-day Chart

Bitcoin’s technical overview is heavily tilted towards the buy-side, with every single time-frame showing almost no signs of neutrality.

BTC/USD 1-day Technicals

Technical factors (4-hour Chart):
  • Price is above its 50-period EMA and at its 21-period EMA
  • Price near its top Bollinger band
  • RSI is pushing towards the overbought area (63.99)
  • Volume is descending after a major spike
Key levels to the upside          Key levels to the downside

1: $11,735                                 1: $11,630

2: $11,850                                 2: $11,500

3: $12,000                                  3: $11,300

Ethereum

Ethereum’s price moved towards the downside throughout the past week, but then rebounded after hitting the $361 support level and began a slow push towards the upside. Ethereum bulls were patient and slowly took over first the $371 resistance level and now the $378 level, turning them both into support. In both cases, the push was just enough to bring the price above these levels, but the consolidation phase always ended with Ether’s price above its newly found support.

The fundamentals surrounding Ethereum are (at the moment) looking particularly strong as investors are expecting a successful launch of Ethereum 2.0.


ETH/USD 4-hour Chart

Ethereum’s technicals are showing a tilt towards the buy-side on all time-frames. However, while its lower time-frames are being more positive, its longer time-frames are being a bit more neutral (mostly oscillators).

ETH/USD 1-day Technicals

Technical Factors (4-hour Chart):
  • The price is above its 50-period and its 21-period EMA
  • The price between its middle and top Bollinger band
  • RSI is neutral (57.27)
  • Volume is descending from a spike
Key levels to the upside          Key levels to the downside

1: $400                                     1: $378

2: $415                                     2: $371

3: $420                                      3: $360

Ripple

The fourth-largest cryptocurrency by market cap has unexpectedly pushed towards the upside as XRP whales reemerged and went on a buying spree. The most recent upswing has put XRP above the $0.2454 level, which has proven itself both as strong support and resistance level. At the time of writing, XRP seems like it will stay above the level, even though most of its indicators are showing a strong possibility of price pulling back a bit more.

Traders should pay attention to how XRP handles the $0.2454 support level and trade it as XRP bounces up or breaks below it.


XRP/USD 4-hour Chart

XRP’s technicals are quite mixed up. While its 4-hour overview is neutral-bullish, its 1-day chart is completely bearish. On the other hand, its weekly overview is tilted towards the buy-side, while its monthly overview is quite neutral, but still leaning slightly towards the bear side.

XRP/USD 1-day Technicals

Technical factors (4-hour Chart):
  • The price is at its 50-period EMA and above its21-period EMA
  • Price is near its top Bollinger band
  • RSI is neutral (53.39)
  • Volume is below average
Key levels to the upside          Key levels to the downside

1: $0.26                                     1: $0.2454

2: $0.266                                   2: $0.235

3: $0.2855                                3: $0.227


Categories
Blockchain and DLT Cryptocurrencies

Bitcoin, Blockchain and Its Use in the Financial World

In this post, we will explain a new payment method and also a new way of making transfers that is simpler and safer than the SWIFT that is currently used. We are talking about Bitcoin and the Blockchain that have already been in use for several years, although it has not yet been generalized so that it can change our lives. Specialists say that both can have the effect that had Internet or mobile phones at the time, eventually, we’ll figure out if this prediction is fulfilled or not.

What is Bitcoin?

To know what the Blockchain is, we start with the definition of what Bitcoin is: it is the decentralized virtual currency that is traded through the internet. The key aspect is that issuer and receiver trade directly, without going through a bank or intermediary entity, so costs are reduced. They are currently used to buy any type of daily products; in addition, you can exchange bitcoins for real currencies.

Due to the complexity of the algorithm that uses Bitcoin cannot be falsified. Its founder Satoshi Nakamoto did it in such a way that the more people use it, the more complicated the algorithm is. Therefore, you do not need any competent authority to regulate Bitcoins.

To sum up, you can say that Bitcoin resembles cash, with similar characteristics. It also allows us to maintain control over the funds at all times because it is we who have them, not a bank or fund. And because it is done by digital means, it also highlights the immediacy it offers.

What is the Blockchain?

Also, we have the Blockchain that can resemble a public accounting book, a database, in which each block of information is connected to another block of information. In this kind of book where they write down all the movements that take place with bitcoin being in continuous growth. These annotations are inscribed in what is known as a block and are added in a linear and chronological manner. Therefore, in the blockchain, the information cannot be modified unless all the component parties agree.

The difference with other methods is that the information cannot be changed once recorded and cannot be erased. It is transparent because the transactions are public but at the same time are anonymous since the information contained in each block cannot be associated with any of the parties involved in the operation.

Mining in the Blockchain

As you are commenting above it works by blocks where all operations are packaged and have to be confirmed by mining. Mining is a mechanism with mathematical calculations that confirm all transactions safely. Some users may be miners and receive some remuneration for the work they are doing.

Mining is a mechanism in which a user puts their computer to work to create new blocks and authorize transactions and operations. You would have to run a software that connects to the P2P network of the currency that uses much of the processing power of the miner’s computer, thus obtaining a commission for the service performed.

The Blockchain Today

The appeal is that the transmission of data via the Blockchain is done by cryptography not by real data as SWIFT does. Recall that the latter is the acronym of the Society for World Interbank Financial Telecommunication, a company formed by banks mainly on which it relies on trust for carrying out transactions. The Blockchain is based on cryptography that makes it much safer, plus it is more economical.

As every new financial product has certain disadvantages, with the Blockchain there is some controversy as banks are likely to lose an important role in the financial world and that is to be intermediaries. On the other hand, as it is still in its infancy, usability is still reduced due to the number of users who use Bitcoin on a recurring basis. Security is an important issue as it may be exposed to attacks because it is open-source; there are many users who support its operation but at the same time can misuse the system.

The main global banks, of which Santander, BBVA, JP Morgan, ING, BNP Paribas are part of a group called R3 that develops applications with Blockchain technology. This new technology works like the Blockchain but with a private blockchain.

These financial giants want to transform the current banking structure by speeding up payments and stock market operations. We are working from three of the most powerful spotlights such as Silicon Valley, Wall Street, and the City.

The largest multinationals are adopting these new technologies; Citigroup is creating Citicoin, a digital currency of its own. Goldman Sachs funded a company that uses bitcoins to manage payments, called Circle Internet Financial. PwC states that around 300 startups are dedicated to improving the blockchain so that it can be used effectively and safely in the financial world. Therefore, its use is likely to spread widely in the coming years.

Startups and the Blockchain

Several startups were acquired by the main banks to develop their presence in the online world. BBVA acquired 29% of Atom to be a leader in online banking. The president of the second Spanish bank said that digitalisation is key today and that anyone who is not able to adapt to the current situation will be left behind.

Santander, in turn, created its own venture capital fund by investing $100 million in two years to catch up with competitors. iZettle will allow Santander to improve payments via mobile and táblet; on the other hand, Ripple that develops solutions for the Blockchain.

Currently, there are companies that are dedicated to developing products using Bitcoin. Blockstream develops Bitcoin for companies that use them. One of the novelties is the fact of performing simple operations in bitcoins that can be done more quickly with an even lower cost. Another startup is OpenBazaar that aims to compete with eBay. A decentralized buying and selling platform with lower costs than eBay currently has. A company that carries out the mining of which we have spoken is BitFury; carrying out the necessary mining for the correct functioning of the blockchain.

Categories
Crypto Market Analysis

Daily Crypto Review, Oct 19 – Stablecoin Market Surpasses $20 Billion; Tether Dominating With Market Cap of Almost $16 Billion

The cryptocurrency sector has spent the weekend pushing towards higher highs but ultimately being stopped out at the most recent highs. Bitcoin is currently trading for $11,471, representing an increase of 0.71% on the day. Meanwhile, Ethereum gained 1.63% on the day, while XRP gained 0.35%.

 Daily Crypto Sector Heat Map

If we look at the top 100 cryptocurrencies, we can see that UMA gained 24.3% in the past 24 hours, making it the top daily gainer. Aave (19.42%) and Reserve Rights (14.8%) also did great. On the other hand, Filecoin lost 23.88%, making it the most prominent daily loser. It is followed by Crypto.com Coin’s loss of 8.92% and Waves’ loss of 4.28%.

Top 10 24-hour Performers (Click to enlarge)

Bottom 10 24-hour Performers (Click to enlarge)

Bitcoin’s market dominance level has increased slightly since our last report, with its value is currently 58.9%. This value represents a 0.2% difference to the upside when compared to when we last reported.

Daily Crypto Market Cap Chart

The crypto sector capitalization has lost a bit of its value since Friday. Its current value is $361.12 billion, representing a decrease of $1.44 billion compared to our previous report.

_______________________________________________________________________

What happened in the past 24 hours?

_______________________________________________________________________

_______________________________________________________________________

Technical analysis

_______________________________________________________________________

Bitcoin

The largest cryptocurrency by market capitalization has spent its weekend building up a bull presence and trying to push towards (and past) the $11,500 resistance level. However, the move failed, and Bitcoin is now trading just under the resistance line. With that being said, the volume that followed this move was incredibly low, which implies that a bigger move is ahead, and that traders should pay attention to what happens with the volume in the near future.

Bitcoin will most likely either go up or stay above $11,300, as many analysts say that Bitcoin is done with its sub-$11,000 area. However, we do have to pay attention to the Bitcoin CME Futures Gap.

BTC/USD 1-day Chart

Bitcoin’s technical overview is tilted towards the buy-side on every single time-frame. While its 4-hour and 1-day time-frames are showing neutral bullishness, its weekly and monthly sentiment is extremely positive.

BTC/USD 1-day Technicals

Technical factors (4-hour Chart):
  • Price is above its 50-period EMA and at its 21-period EMA
  • Price near its top Bollinger band
  • RSI is neutral (57.29)
  • Volume is below average and descending
Key levels to the upside          Key levels to the downside

1: $11,500                                 1: $11,300

2: $11,630                                 2: $11,180

3: $12,000                                  3: $11,000

Ethereum

Ethereum’s price movement throughout the weekend looked a lot like Bitcoin’s, but with a twist. The second-largest cryptocurrency by market cap moved towards the downside and (just like Bitcoin) created three lower highs on the way down. However, unlike Bitcoin, Ethereum has broken the downtrend and shot up in recent hours, though only to be stopped by the $378 resistance level. While there is still a chance for Ethereum to break this level, it will most likely be stuck below it (possibly within a range bound by $371 and $378) in the short-term.

ETH/USD 4-hour Chart

Ethereum’s technicals are showing a tilt towards the buy-side on all time-frames, with lower time-frames being more positive, while longer time-frames being more tilted towards the neutral stance (mostly oscillators).

ETH/USD 1-day Technicals

Technical Factors (4-hour Chart):
  • The price is above its 50-period and its 21-period EMA
  • The price at its middle Bollinger band
  • RSI is neutral (54.55)
  • Volume is descending
Key levels to the upside          Key levels to the downside

1: $378                                     1: $371

2: $400                                     2: $360

3: $415                                      3: $334

Ripple

XRP spent the weekend mostly trading sideways or rising a little after a whole week of price drops. The fourth-largest cryptocurrency by market capitalization fell under the $0.2454 and stayed below it over the weekend, and even though it is moving towards it, the current volume would not support a break of such a major resistance level.

Many analysts are calling for even more downward movement from XRP, justifying it by saying that this is a continuation of a trend dating back from 2018. The reduced volatility and range-bound trading seem to be confirming this thesis.

XRP/USD 4-hour Chart

XRP’s technicals are extremely bearish. Its 4-hour and daily sentiment being tilted towards the sell-side fully, while its weekly and monthly overviews are showing some signs of neutrality, though they are also heavily bearish.

XRP/USD 1-day Technicals

Technical factors (4-hour Chart):
  • The price is below both its 50-period EMA and its 21-period EMA
  • Price is at its middle Bollinger band
  • RSI is neutral (42.17)
  • Volume is below average
Key levels to the upside          Key levels to the downside

1: $0.2454                                 1: $0.235

2: $0.26                                     2: $0.227

3: $0.266                                  3: $0.221


Categories
Crypto Market Analysis

BTC/USD Chart Overview + Possible Outcomes

In this BTC /USD 1-day time-frame analysis, we will be looking at the most recent events, the current technical formations, as well as discussing possible outcomes.

Overview

Bitcoin has had a week of explosive gains, mostly due to its fundamentals. The US President Donald Trump announced another set of stimulus packages (while he was completely against it just before the announcement), as well as Jack Dorsey’s Square investing $50 million in Bitcoin sparked bulls’ interest and made the largest cryptocurrency by market cap push above $11,700. Bitcoin established support above its previous heavy resistance level, which is certainly another great sign for the bulls. However, one technical formation says that additional correction is ahead before the next push towards $12,000.

Technical factors

Bitcoin has left its triangle formation abruptly and to the upside, breaking not only the formation but also numerous resistances. The price started consolidating in a range bound by $11,300 to the downside and $11,500 to the upside, which was a great trading opportunity for traders that like sideways trading. Taking a look at smaller time-frames, Bitcoin has built a downwards-sloping channel that calls for a slight pullback (and a possible fill of the Bitcoin CME Futures gap) before pushing further up.

There are two most likely versions of this pullback, and both will be discussed above. However, an unexpected price spike or plummet is always a possibility, no matter how slim.

Likely Outcomes


Bitcoin currently has two main scenarios. It can play out, and both involve a pullback before a push towards $12,000.

  1. As shown on the chart, Bitcoin will most likely follow the channel until it finds strong support; it cannot go below, after which it will break the channel to the upside. After finding confirmation above it, it is free to push towards the upside ($11,730, $11,960, or even $12,000).
  2. The other scenario is a bit tricky, and therefore a bit less likely. The premise for this scenario is the head and shoulders chart pattern that started in late April of this year. The most recent high of this scenario is the top of the right shoulder, while the neckline is the black ascending line shown on the chart. In this scenario, the price would move alongside the dotted line until it hit the neckline, after which it would start to go up. In this case, the pullback and confirmation would most likely happen above $11,300, and only after consolidating above this level could Bitcoin push to the aforementioned targets.
  3. The scenario in which Bitcoin suddenly pushes up or down sharply and swiftly is incredibly unlikely and would have to be backed by some major news.
Categories
Crypto Market Analysis

Daily Crypto Review, Oct 16 – ICO That Raised $257 Million in 60 Minutes Finally Launched; Bitcoin Pushing Towards $11,500

The cryptocurrency sector has spent the day trying to push higher highs but failed as Bitcoin didn’t make it above $11,500. Bitcoin is currently trading for $11,486, representing an increase of 0.65% on the day. Meanwhile, Ethereum lost 0.64% on the day, while XRP lost 1.42%.

 Daily Crypto Sector Heat Map

If we look at the top 100 cryptocurrencies, we can see that Filecoin gained an astonishing 120.78% in the past 24 hours, making it the top daily gainer. ABBC Coin (39.25%) and Blockstack (9.35%) also did great. On the other hand, Aave lost 15.89%, making it the most prominent daily loser. It is followed by Arweave’s loss of 14.13% and Synthetix Network Token’s loss of 8.96%.

Top 10 24-hour Performers (Click to enlarge)

Bottom 10 24-hour Performers (Click to enlarge)

Bitcoin’s market dominance level has stayed at the same level since our last report, with its value currently being 58.7%. This value represents a 0% difference when compared to when we last reported.

Daily Crypto Market Cap Chart

The crypto sector capitalization has gained a bit of its value over the course of the past 24 hours. Its current value is $362.56 billion, representing an increase of $1.46 billion compared to our previous report.

_______________________________________________________________________

What happened in the past 24 hours?

_______________________________________________________________________

_______________________________________________________________________

Technical analysis

_______________________________________________________________________

Bitcoin

The oldest cryptocurrency spent the past 24 hours trying to push past the $11,500 resistance. While the fight for it still continues, there is a strong possibility that Bitcoin will actually stabilize its price above it. If that happens, bulls might come in even stronger and push the price towards $11,630, or even $11,730.

If, however, Bitcoin moves back below $11,500, the sentiment won’t change to a lot more bearish one, as Bitcoin is used to trading above $11,300 as of lately.

BTC/USD 1-day Chart

Bitcoin’s technical overview is extremely bullish on every single time-frame for almost a month now, with longer time-frames showing complete bullish sentiment, while the shorter ones are slightly less tilted towards the buy-side.

BTC/USD 1-day Technicals

Technical factors (4-hour Chart):
  • Price is above its 50-period EMA and at its 21-period EMA
  • Price near its top Bollinger band
  • RSI is neutral (60.70)
  • Volume is average
Key levels to the upside          Key levels to the downside

1: $11,500                                 1: $11,300

2: $11,630                                 2: $11,180

3: $12,000                                  3: $11,000

Ethereum

Unlike Bitcoin that tried to push towards its resistance level, Ethereum spent the day fighting to stay above the $378 level it recently fell under. The second-largest cryptocurrency by market cap tested the $371 support level, which held up quite nicely and attempted a push towards (now) resistance level of $378. While the fight for it still lasts, Ethereum will most likely end up above it if Bitcoin’s price doesn’t drop and pull ETH alongside.

ETH/USD 4-hour Chart

Ethereum’s technicals on all time-frames are a varying degree of bullish. While its 4-hour and monthly overviews are a bit more neutral, its daily and weekly overviews are strongly tilted towards the buy-side.

ETH/USD 1-day Technicals

Technical Factors (4-hour Chart):
  • The price is above its 50-period and right at its 21-period EMA
  • The price at its middle Bollinger band
  • RSI is neutral (54.03)
  • Volume is average
Key levels to the upside          Key levels to the downside

1: $378                                     1: $371

2: $400                                     2: $360

3: $415                                      3: $334

Ripple

XRP has spent the past 24 hours continuing its drop towards the $0.2454 support level. XRP is approaching a quarterly price drop of 20% if the price breaks to the downside. However, so far, the $0.2454 support level is holding up, and XRP bears are not able to break it. If the support level break, we can expect XRP to move towards $0.235.

Traders should either wait for a bounce towards the upside (less likely and riskier) or wait for a possible break below $0.2454 to trade alongside the strong move to the downside.


XRP/USD 4-hour Chart

XRP’s technicals have changed the sentiment to quite bearish in the past couple of days. While its monthly sentiment was bearish for a while, its 4-hour and 1-day overviews have turned completely towards the sell-side. On the other hand, XRP’s weekly overview is still slightly bullish.

XRP/USD 1-day Technicals

Technical factors (4-hour Chart):
  • The price is below both its 50-period EMA and its 21-period EMA
  • Price is slightly above its lower Bollinger band
  • RSI is neutral (40.83)
  • Volume is average (except for a couple of huge volume candle)
Key levels to the upside          Key levels to the downside

1: $0.266                                   1: $0.2454 

2: $0.27                                     2: $0.235

3: $0.273                                  3: $0.227


Categories
Crypto Market Analysis

Daily Crypto Review, Oct 15 – JP Morgan Says Bitcoin is Overvalued; XRP Crashes As it Breaks Major Support

The cryptocurrency sector has spent the day trying to find a point of consolidation. However, most cryptocurrencies did end up in the red. Bitcoin is currently trading for $11,412, representing a decrease of 0.38% on the day. Meanwhile, Ethereum lost 1.28% on the day, while XRP lost 3.36%.

 Daily Crypto Sector Heat Map

If we look at the top 100 cryptocurrencies, we can see that ABBC Coin gained 21.28% in the past 24 hours, making it the top daily gainer. Reserve Rights (19.41%) and Ren (13.61%) also did great. On the other hand, Storj lost 13.98%, making it the most prominent daily loser. It is followed by Uniswap’s loss of 12.63% and Energy Web Token’s loss of 9.94%.

Top 10 24-hour Performers (Click to enlarge)

Bottom 10 24-hour Performers (Click to enlarge)

Bitcoin’s market dominance level has decreased since our last report, with its value currently being 58.7%. This value represents a 2.54% difference to the downside when compared to when we last reported.

Daily Crypto Market Cap Chart

The crypto sector capitalization has lost a bit of its value over the course of the past 24 hours. Its current value is $360.10 billion, representing a decrease of $1.88 billion compared to our previous report.

_______________________________________________________________________

What happened in the past 24 hours?

_______________________________________________________________________

_______________________________________________________________________

Technical analysis

_______________________________________________________________________

Bitcoin

The largest cryptocurrency by market cap spent the past 24 hours stuck within a range bound by the $11,300 support level and $11,500 resistance level. The price entered a state of enormous volatility at one point, where Bitcoin tried to break both to the upside and downside. However, the move to the upside was quickly shut down, while the move towards the downside took a bit more time but failed as well. This left Bitcoin in a narrow range, which it will come out of as soon as the bulls and bears stabilize. Its decreasing RSI and volume are proof of future possible, sideways trading, as well as a big move up ahead.

BTC/USD 1-day Chart

Bitcoin’s technical overview is extremely bullish on every single time-frame, with longer time-frames showing full tilt towards the buy-side, while the shorter ones are slightly tilted towards the buy-side.

BTC/USD 1-day Technicals

Technical factors (4-hour Chart):
  • Price is above its 50-period EMA and at its 21-period EMA
  • Price is at the middle Bollinger band
  • RSI is neutral and descending (53.49)
  • Volume is average
Key levels to the upside          Key levels to the downside

1: $11,500                                 1: $11,300

2: $11,630                                 2: $11,180

3: $12,000                                  3: $11,000

Ethereum

Ethereum (just like Bitcoin) tried to find a consolidation price but failed to do so. The second-largest cryptocurrency by market cap faced an upward-facing trend line which it could not follow anymore that triggered a selloff and a drop below the line as well as the $378 support level. While Ethereum is still fighting for the support (now resistance) level, the price will most likely stay above this line.

ETH/USD 4-hour Chart

Ethereum’s technicals on all time-frames are bullish, with longer time-frames having a stronger bullish sentiment than the shorter ones. However, its monthly overview’s oscillators are showing indecisiveness, as they are neutral.

ETH/USD 1-day Technicals

Technical Factors (4-hour Chart):
  • The price is above its 50-period and at its 21-period EMA
  • The price at its middle Bollinger band
  • RSI is neutral (51.89)
  • Volume is average
Key levels to the upside          Key levels to the downside

1: $378                                     1: $371

2: $400                                     2: $360

3: $415                                      3: $334

Ripple

XRP had the worst day performance-wise out of the three cryptocurrencies we are covering. The third-largest cryptocurrency by market cap has dropped below its ascending support trend line, which extended the push towards the downside. The price reached as low as the $0.2454 support level, which is where the bulls picked up the pace and pushed the price up slightly.

Traders should pay attention to how XRP’s price moves around the ascending (yellow) resistance line, as well as the $0.2454 support level.

XRP/USD 4-hour Chart

XRP’s technicals are quite inconsistent, with its 4-hour and monthly technicals being tilted towards the sell-side. On the other hand, its weekly overview is bullish, while its daily overview is tilted more towards the bull side, with moving averages still having a hint of bearish sentiment.

XRP/USD 1-day Technicals

Technical factors (4-hour Chart):
  • The price is below both its 50-period EMA as well as its 21-period EMA
  • Price is at its lower Bollinger band
  • RSI is pushing towards the oversold area (38.64)
  • Volume is average (with the exception of one huge volume candle)
Key levels to the upside          Key levels to the downside

1: $0.266                                   1: $0.2454 

2: $0.27                                     2: $0.235

3: $0.273                                  3: $0.227