The cryptocurrency sector has experienced a pullback as Bitcoin went under its $11,500 support. Bitcoin is currently trading for $11,425, representing a decrease of 0.31% on the day. Meanwhile, Ethereum gained 0.09% on the day, while XRP lost 0.52%.
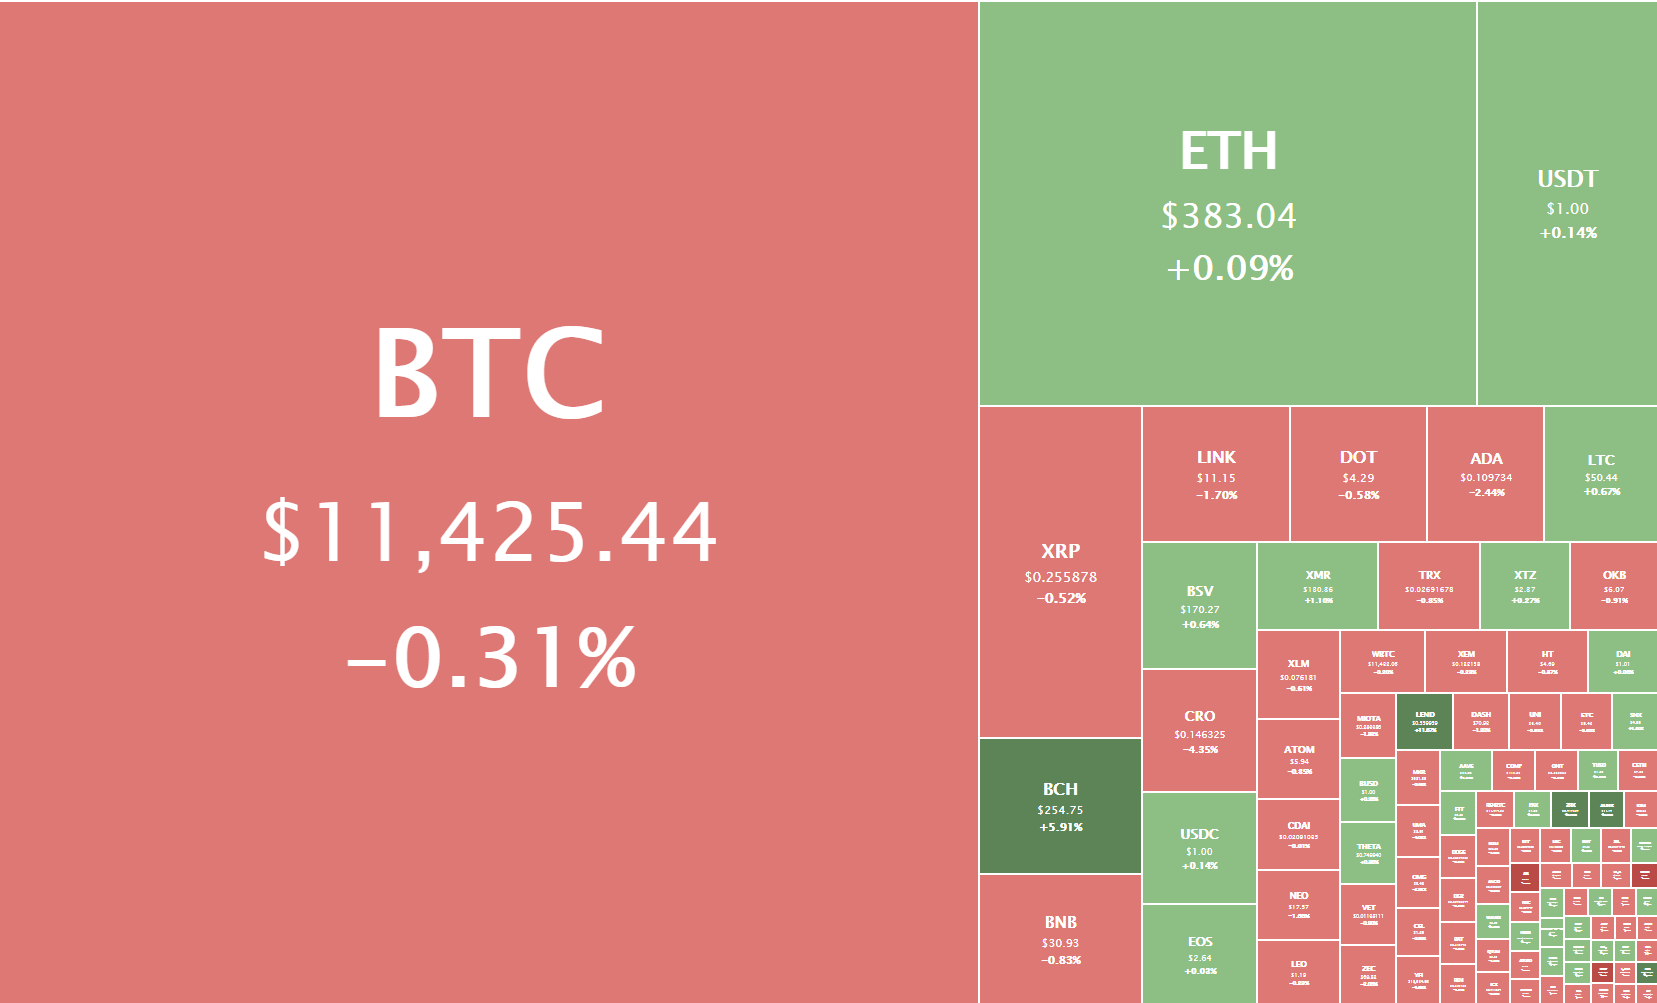
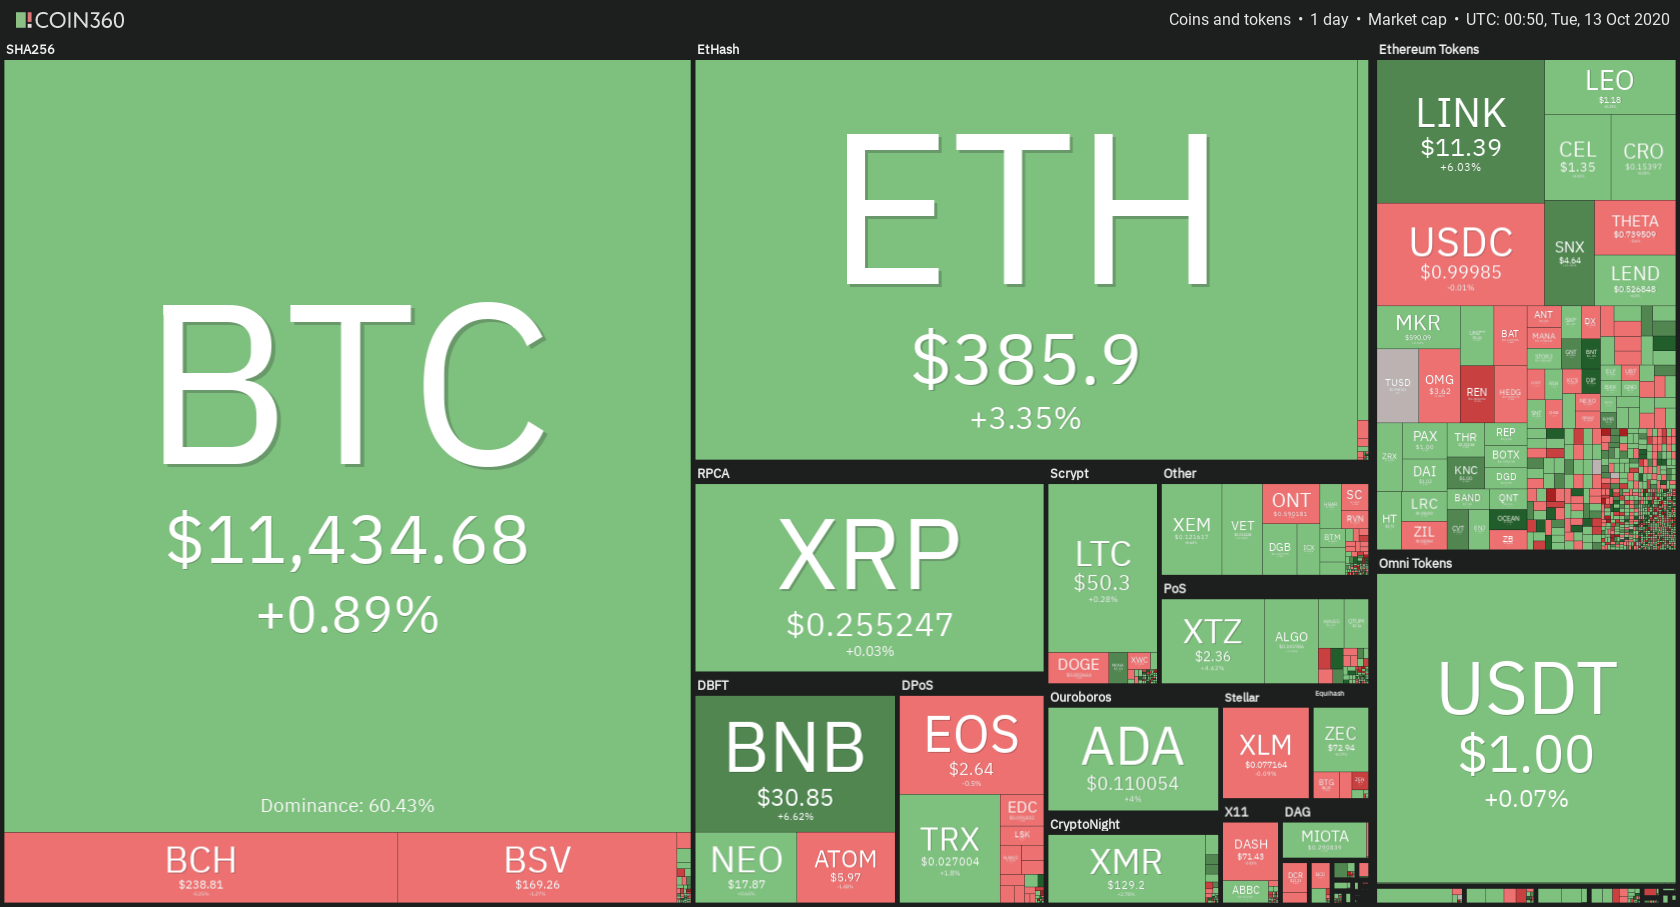
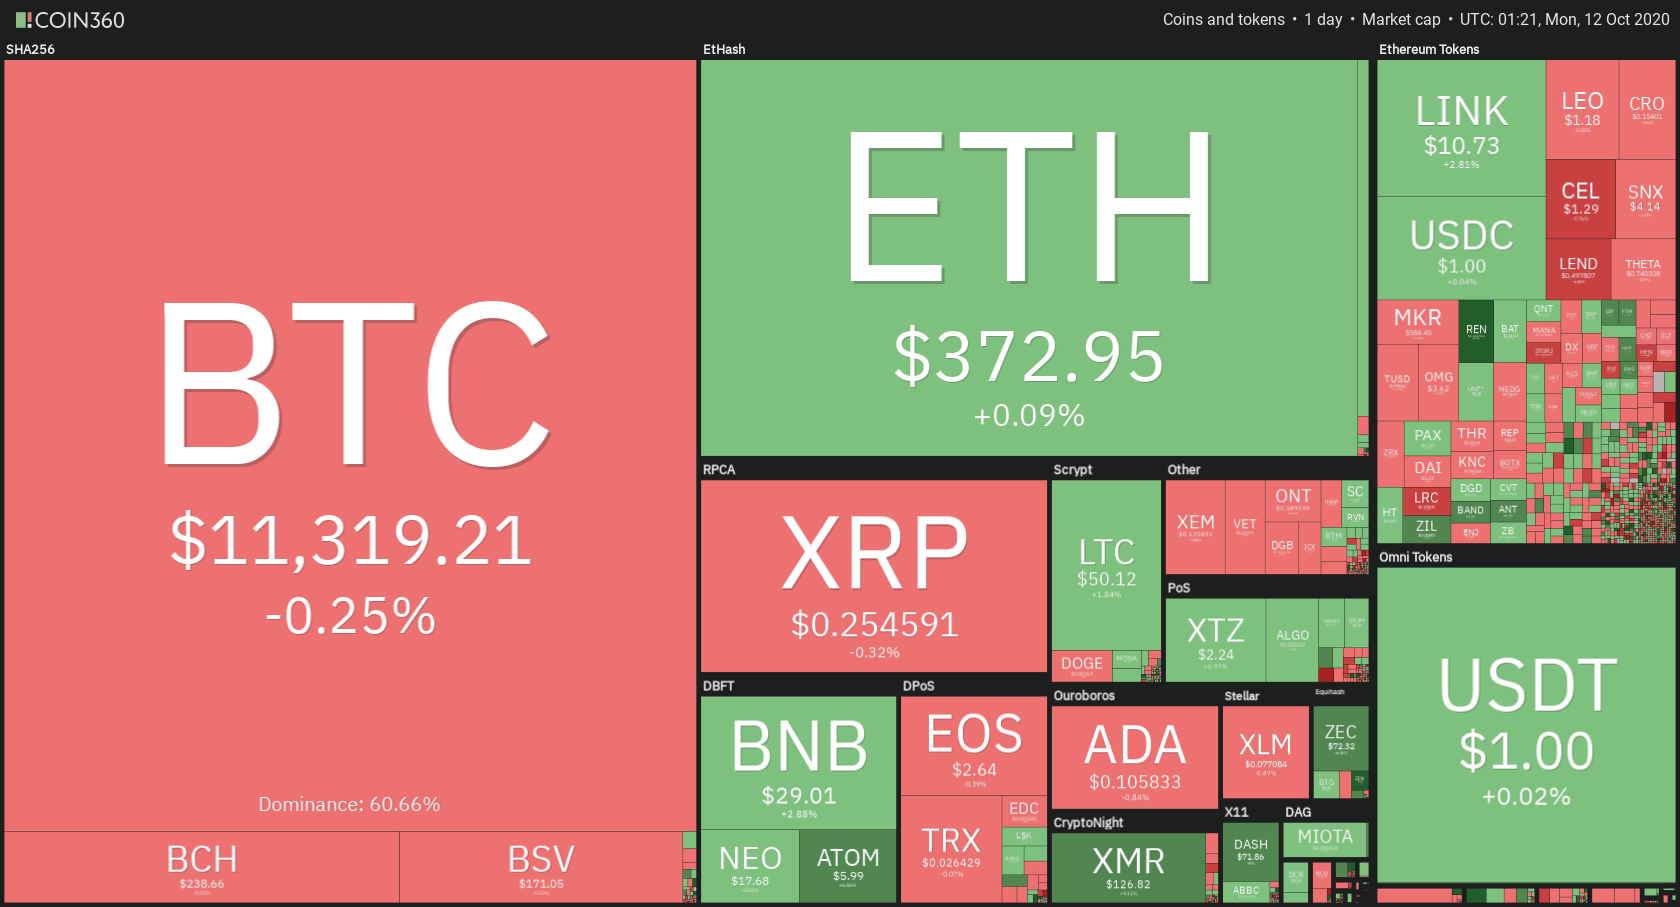
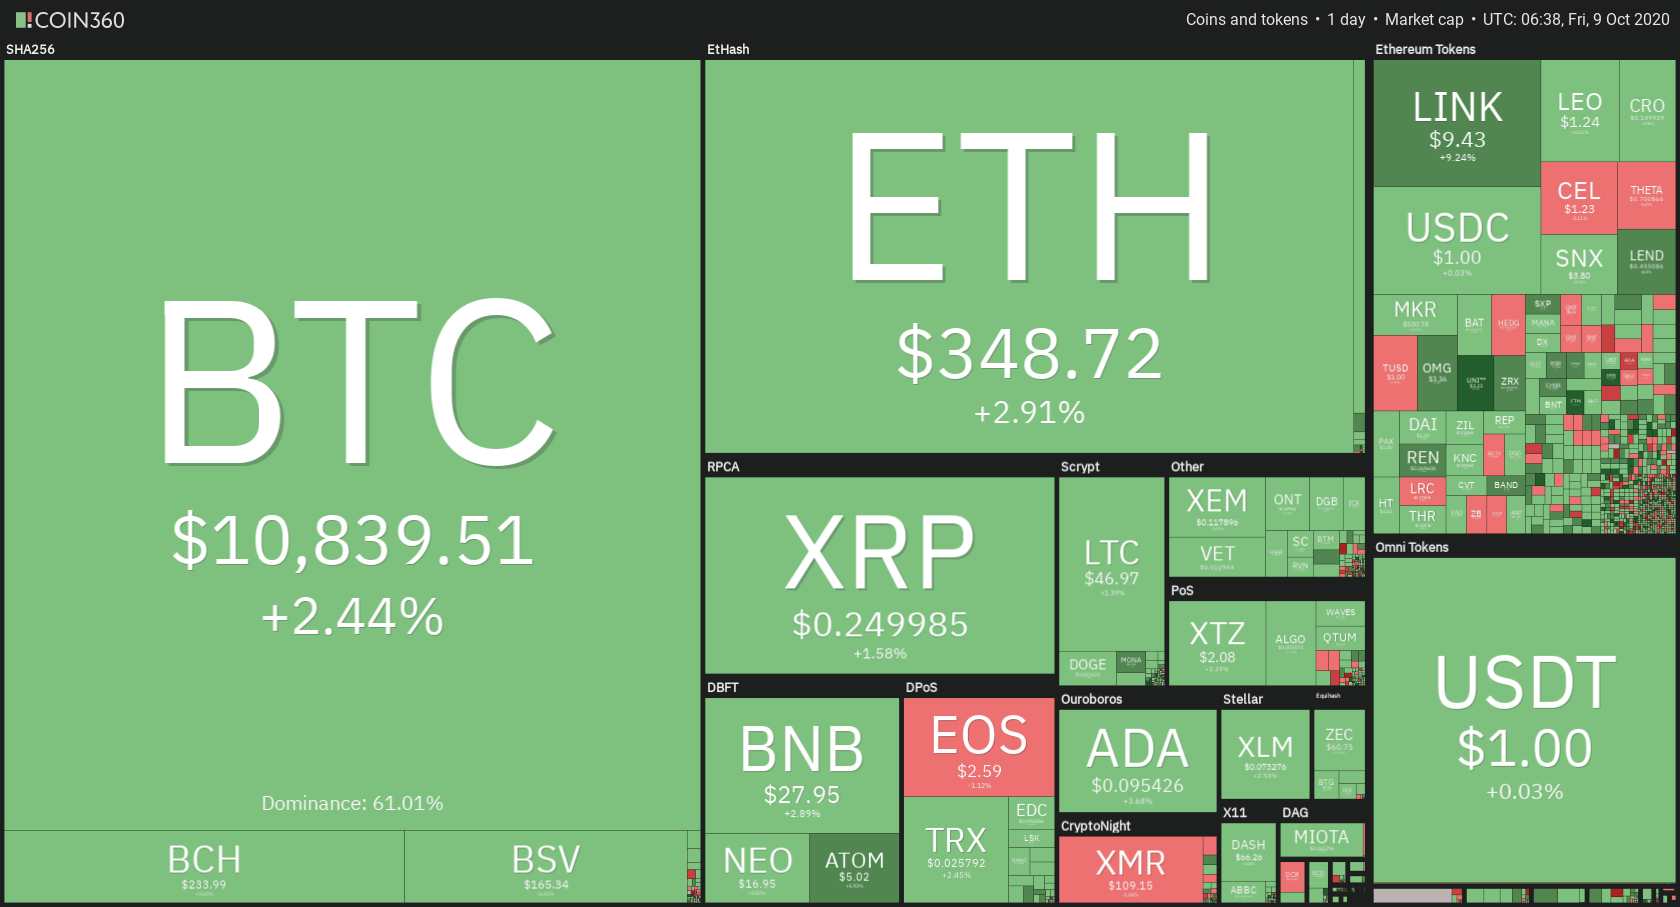
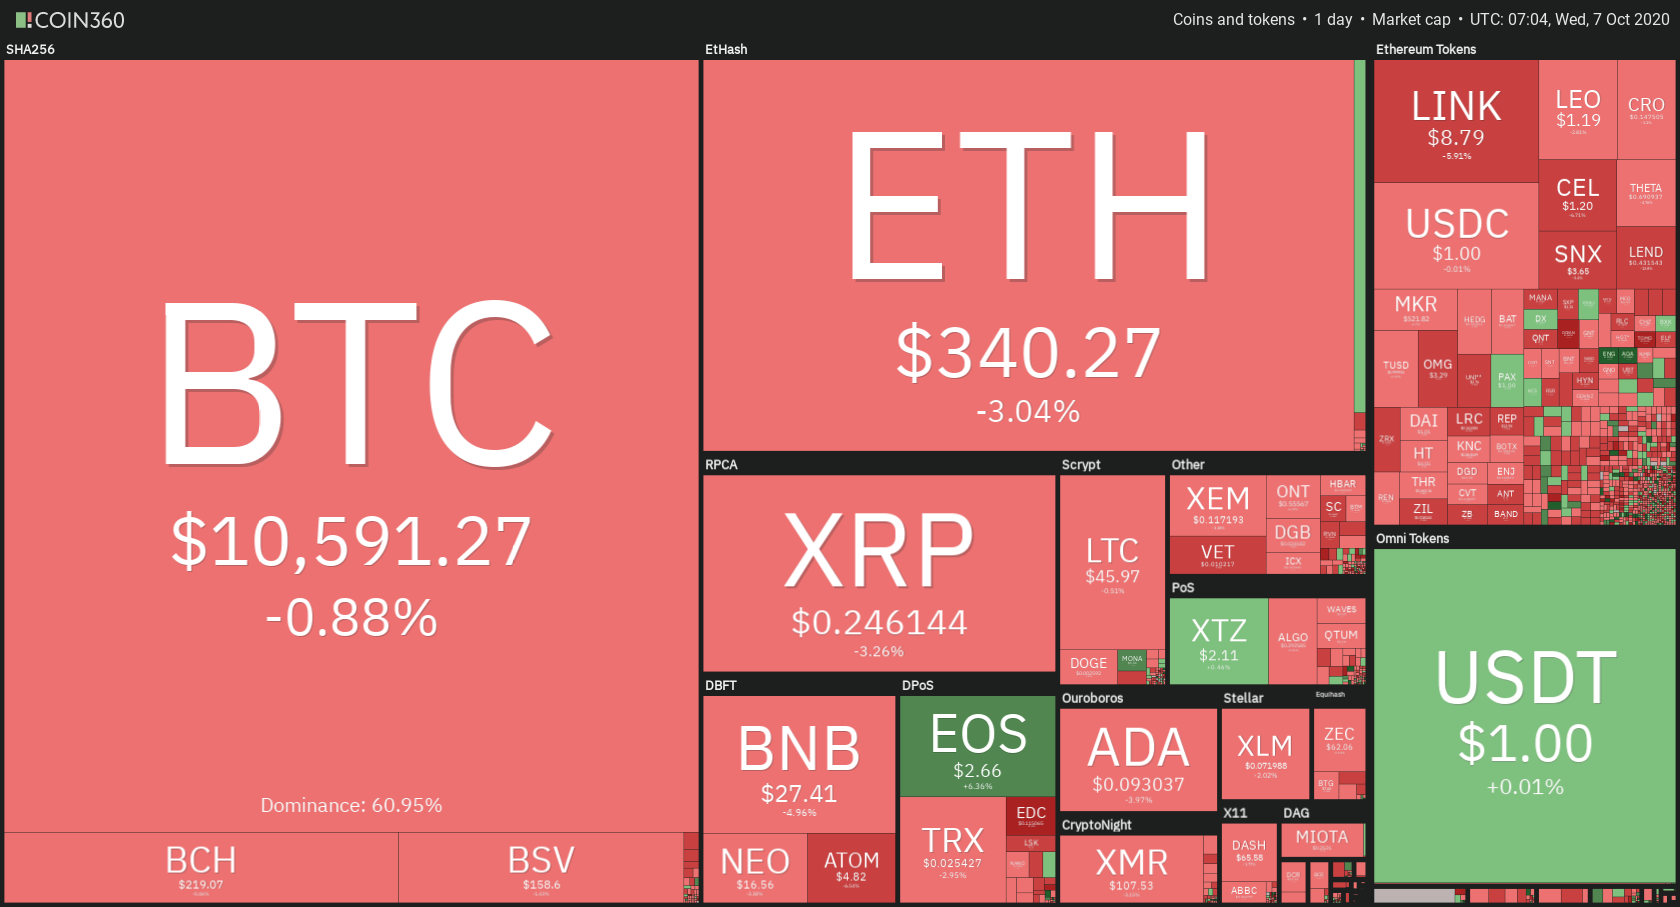
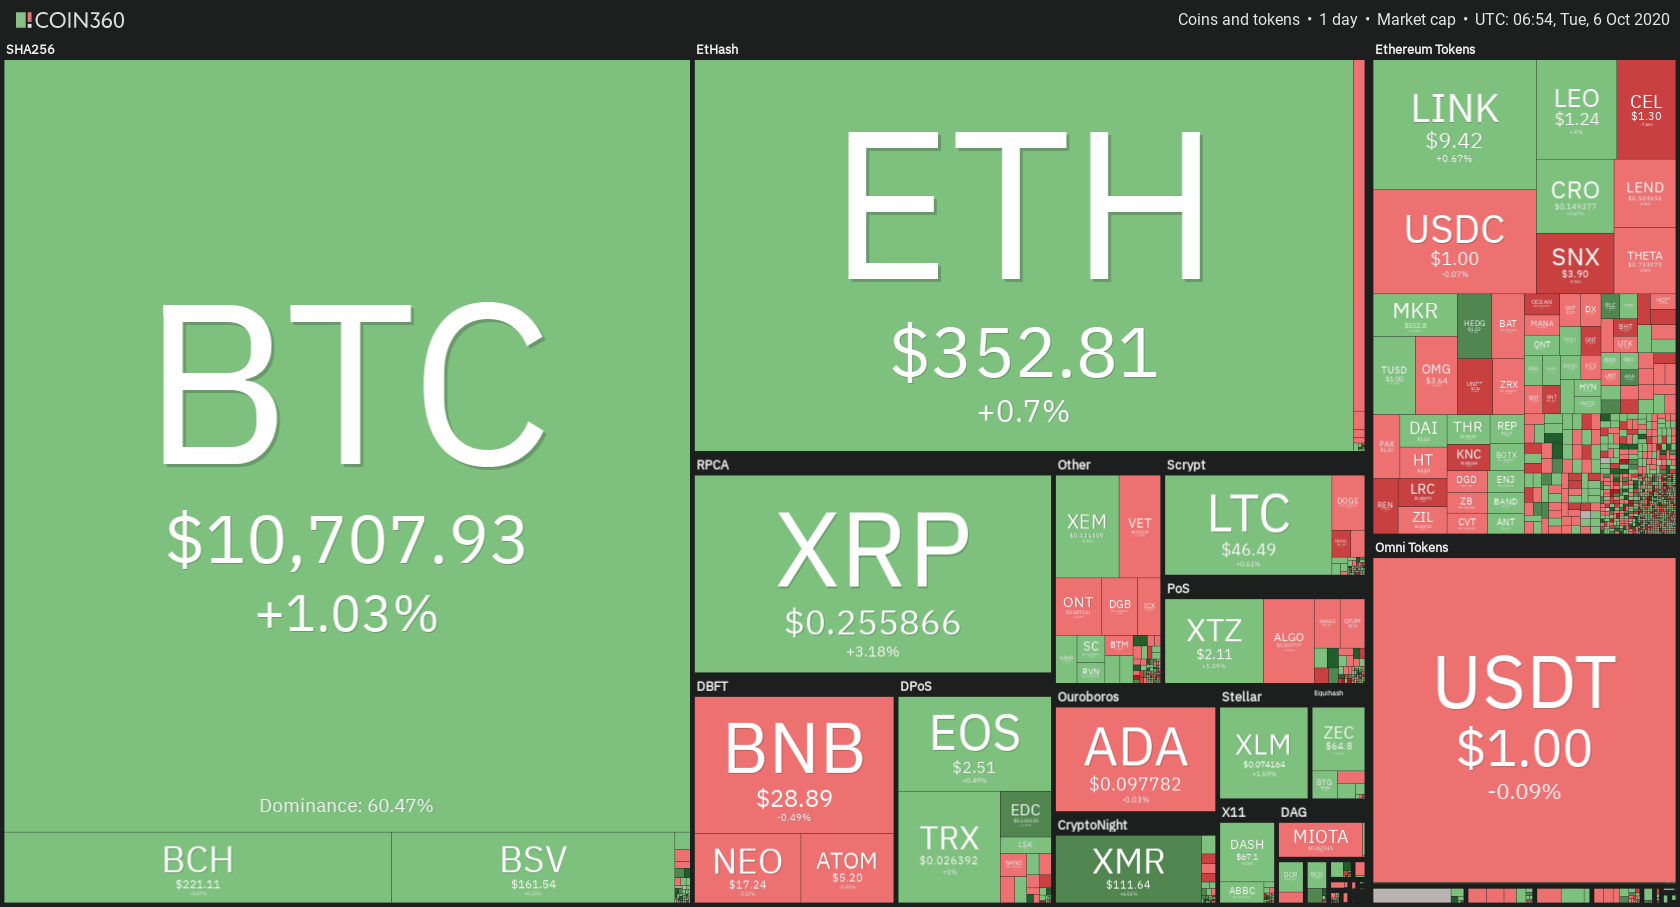
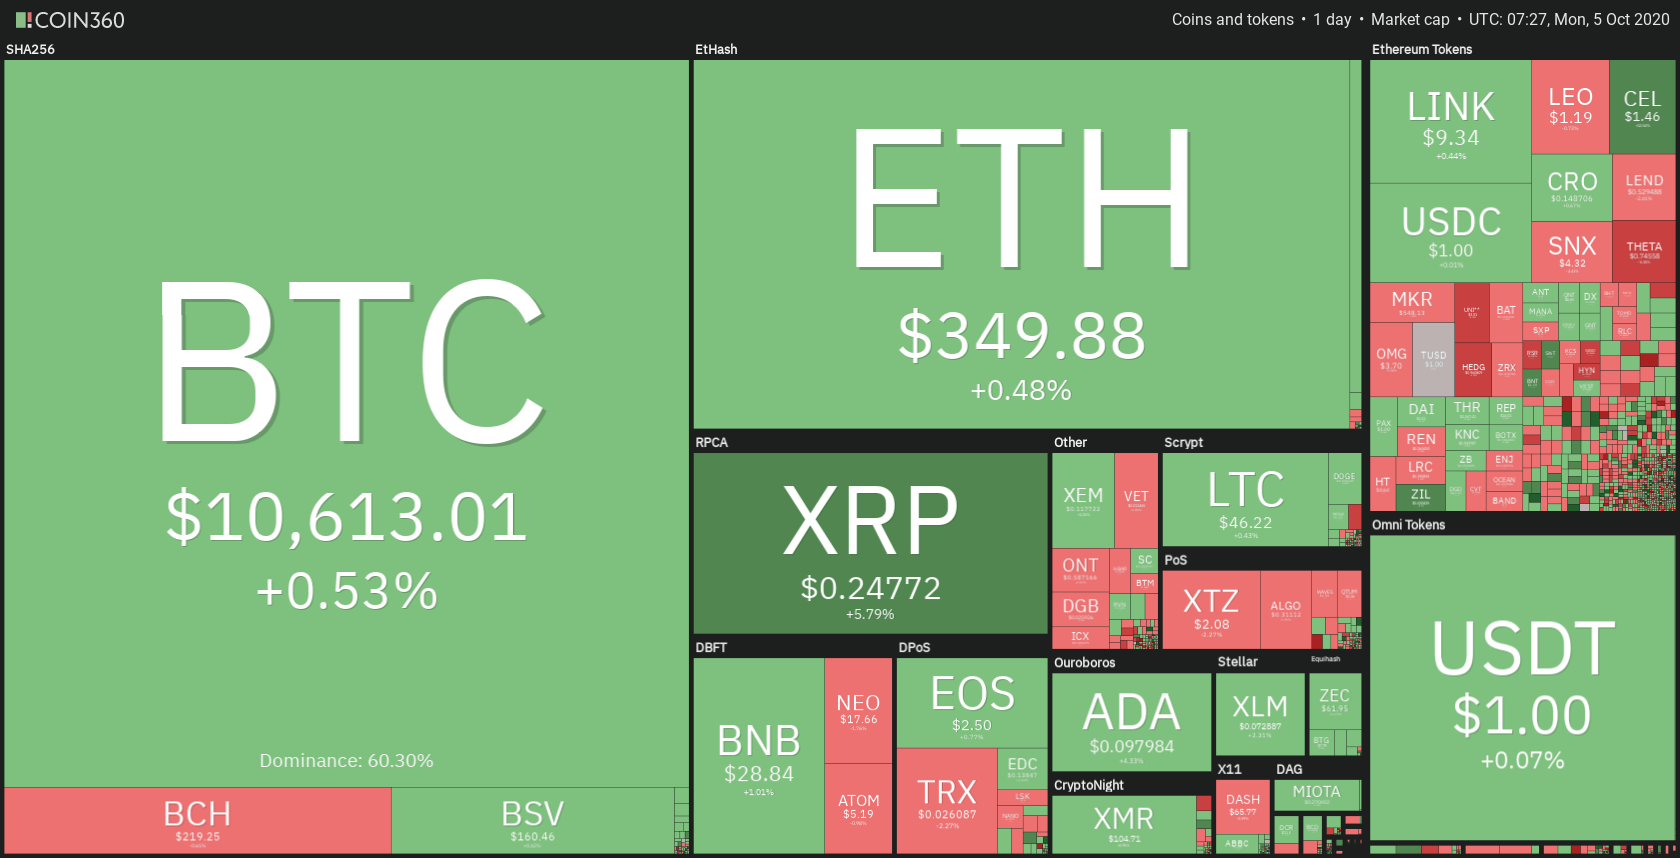
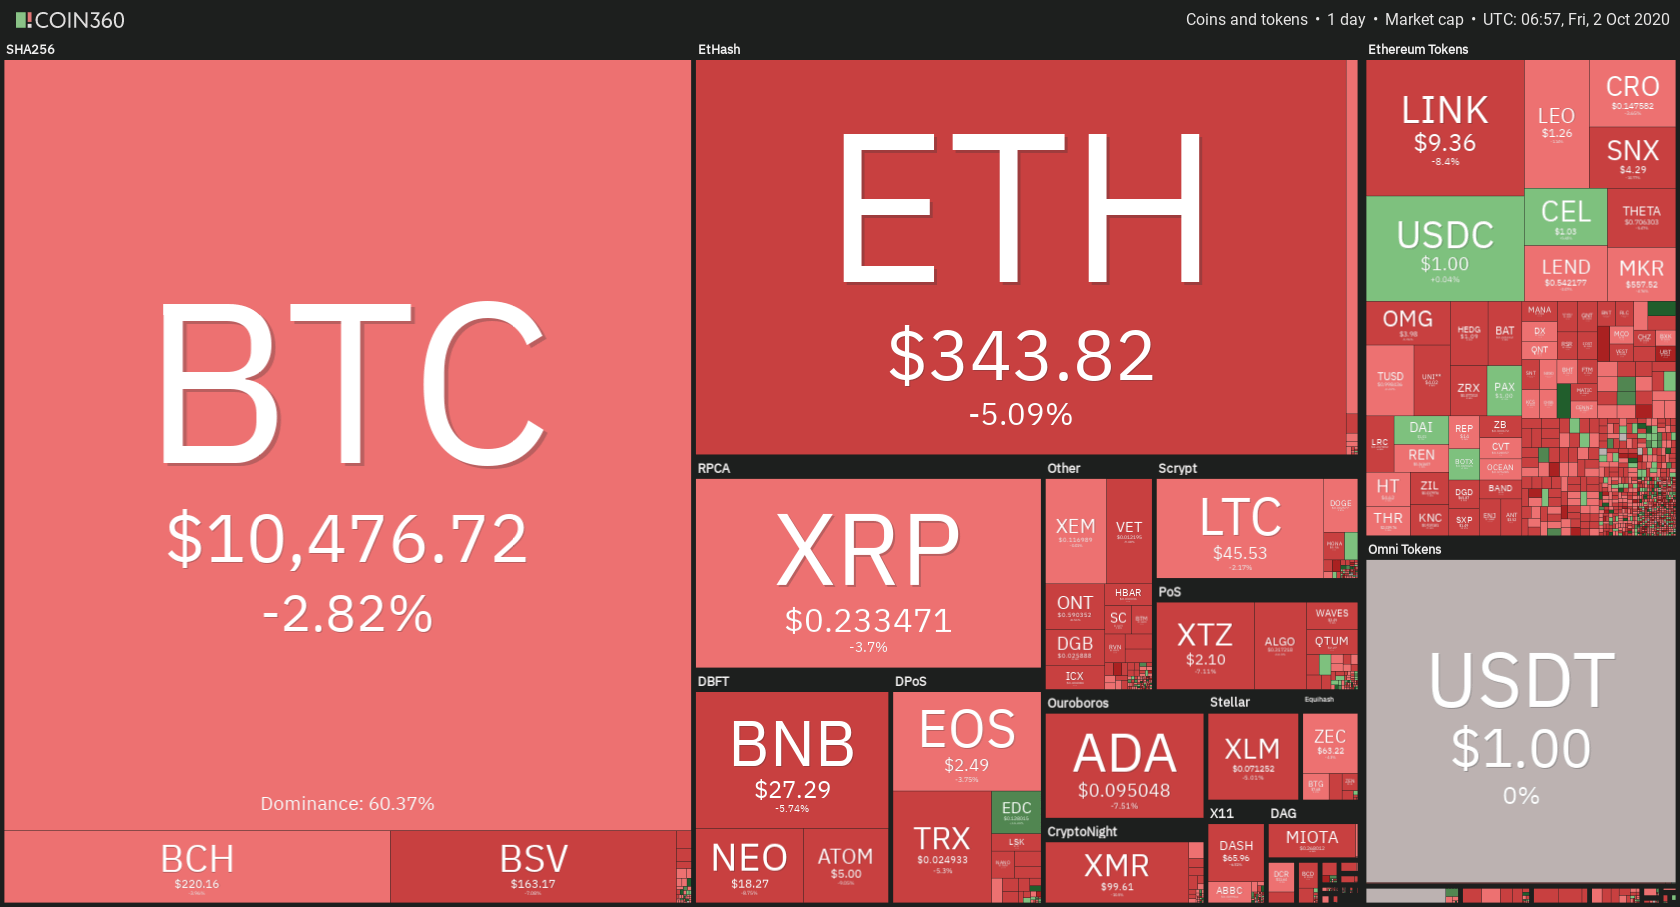
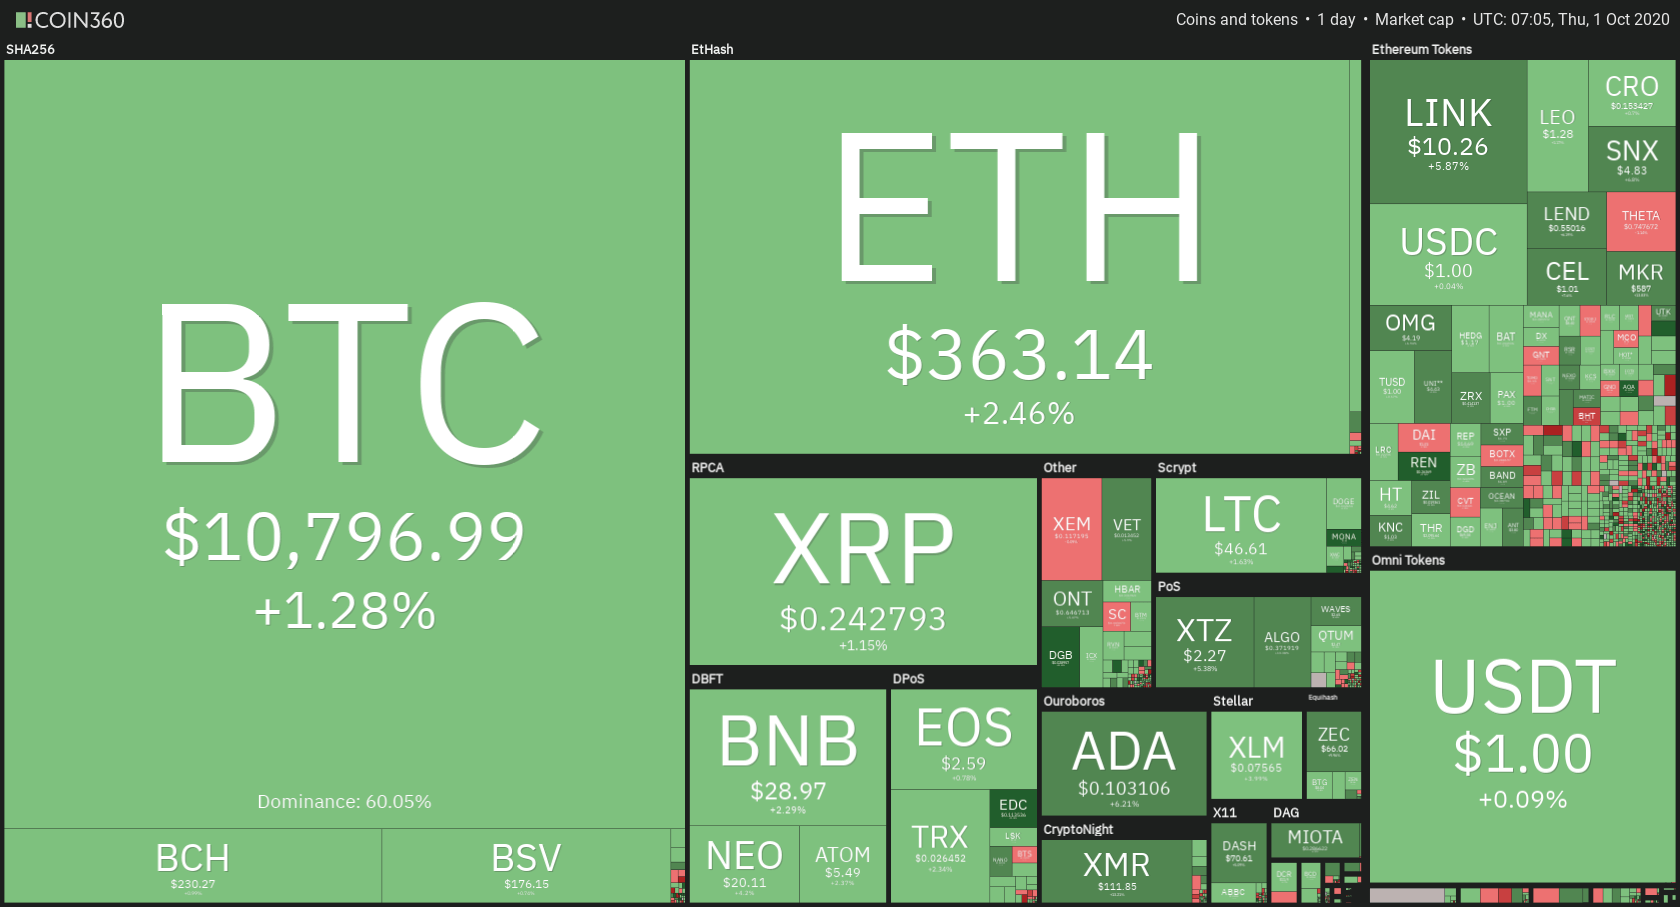
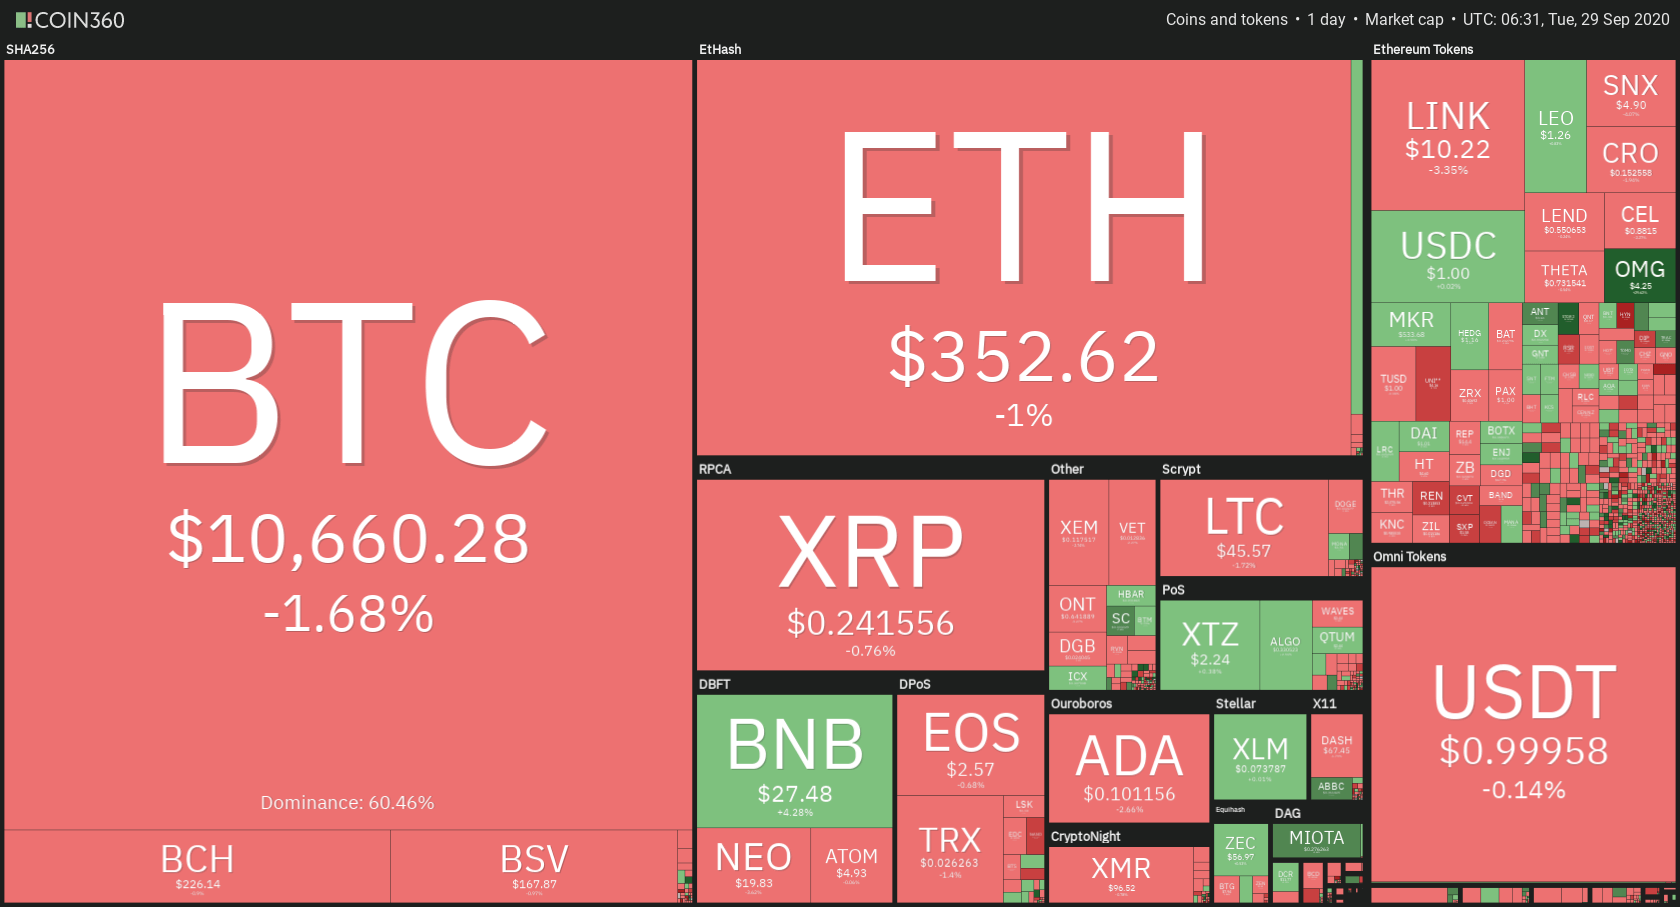
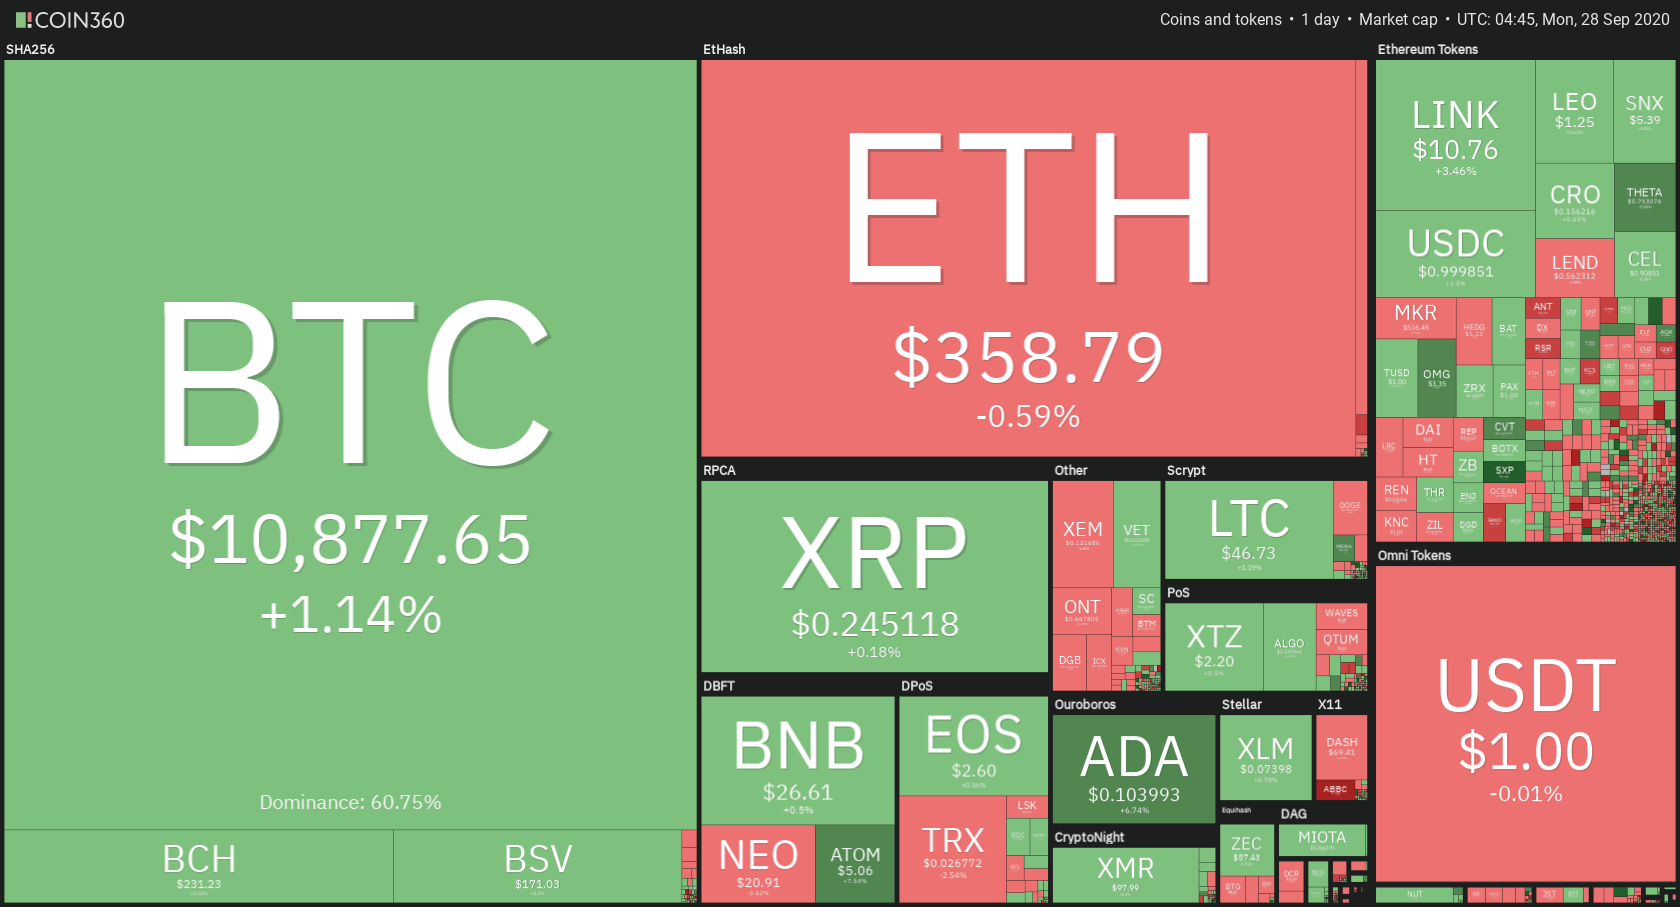
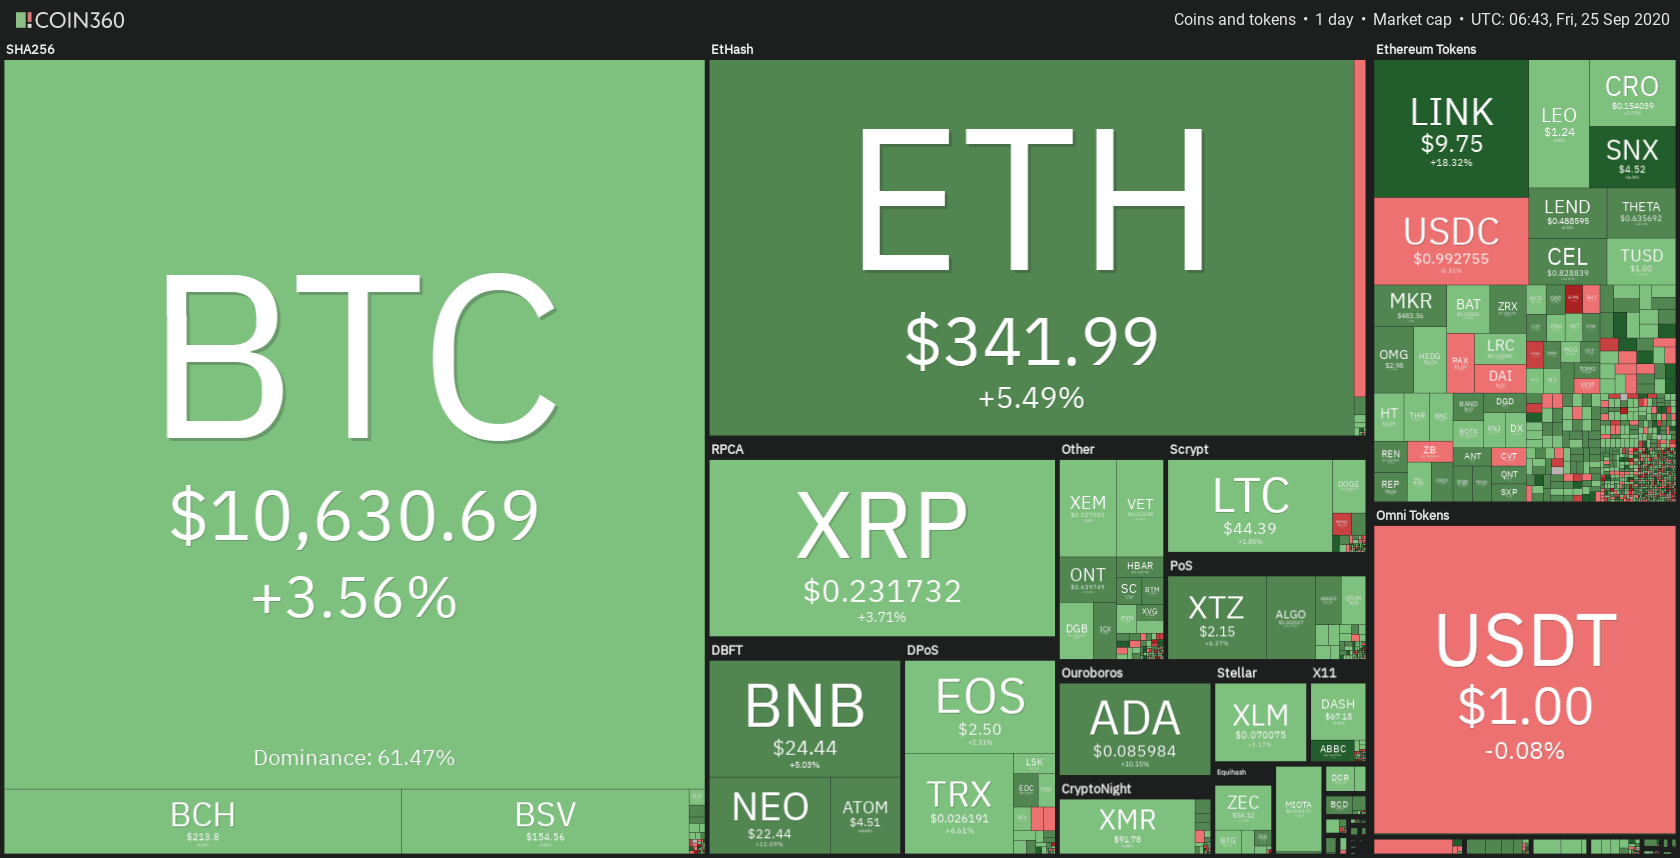
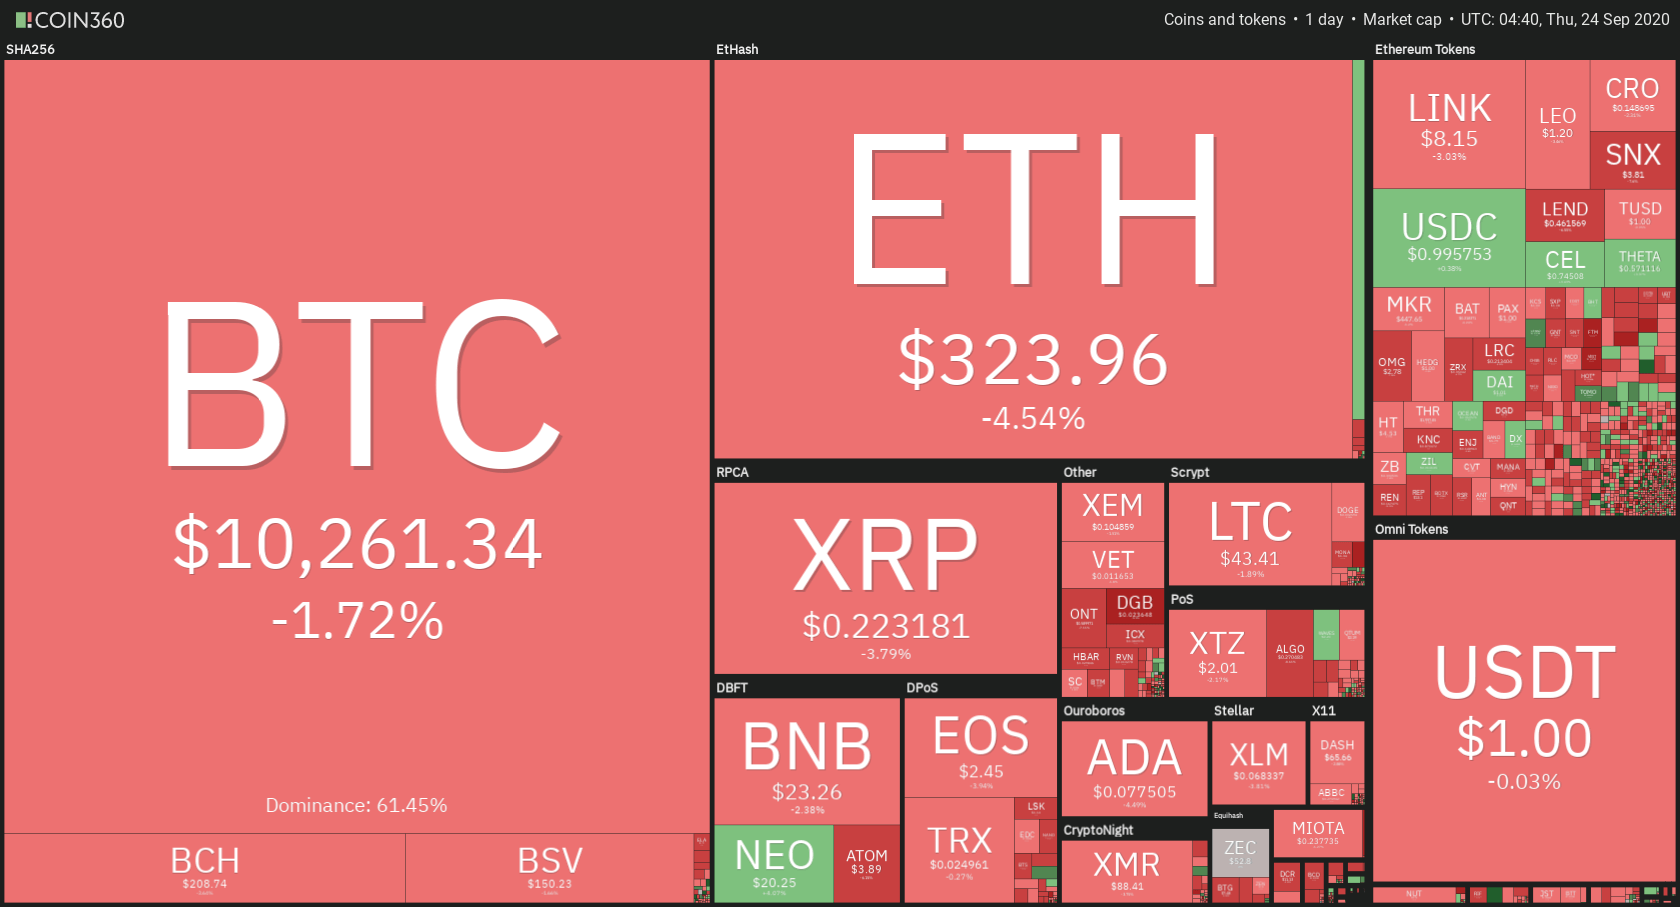
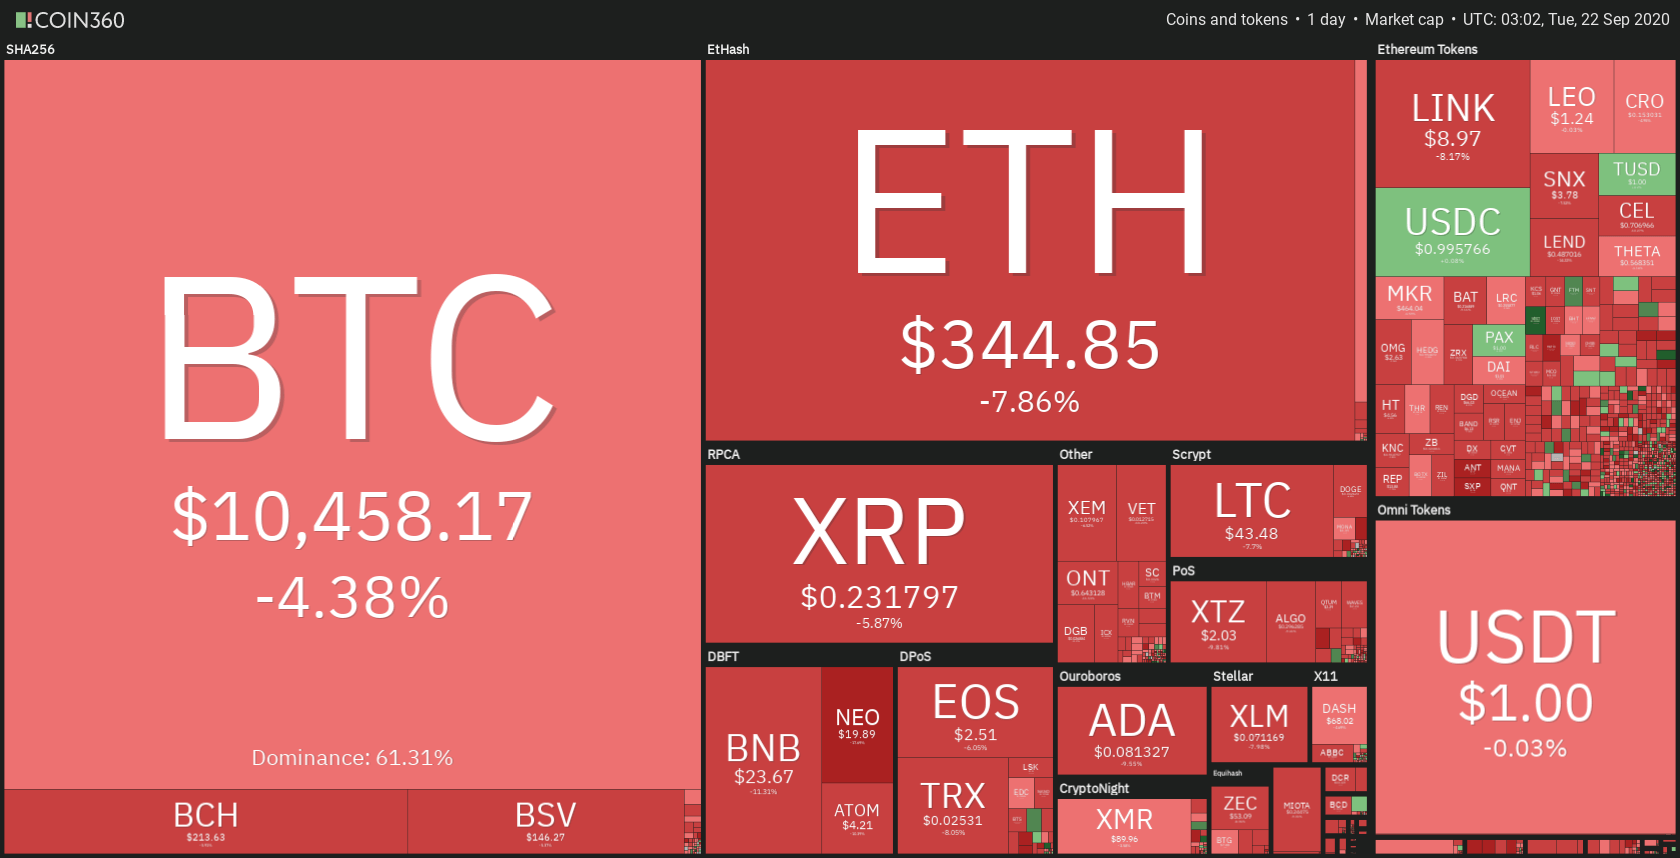
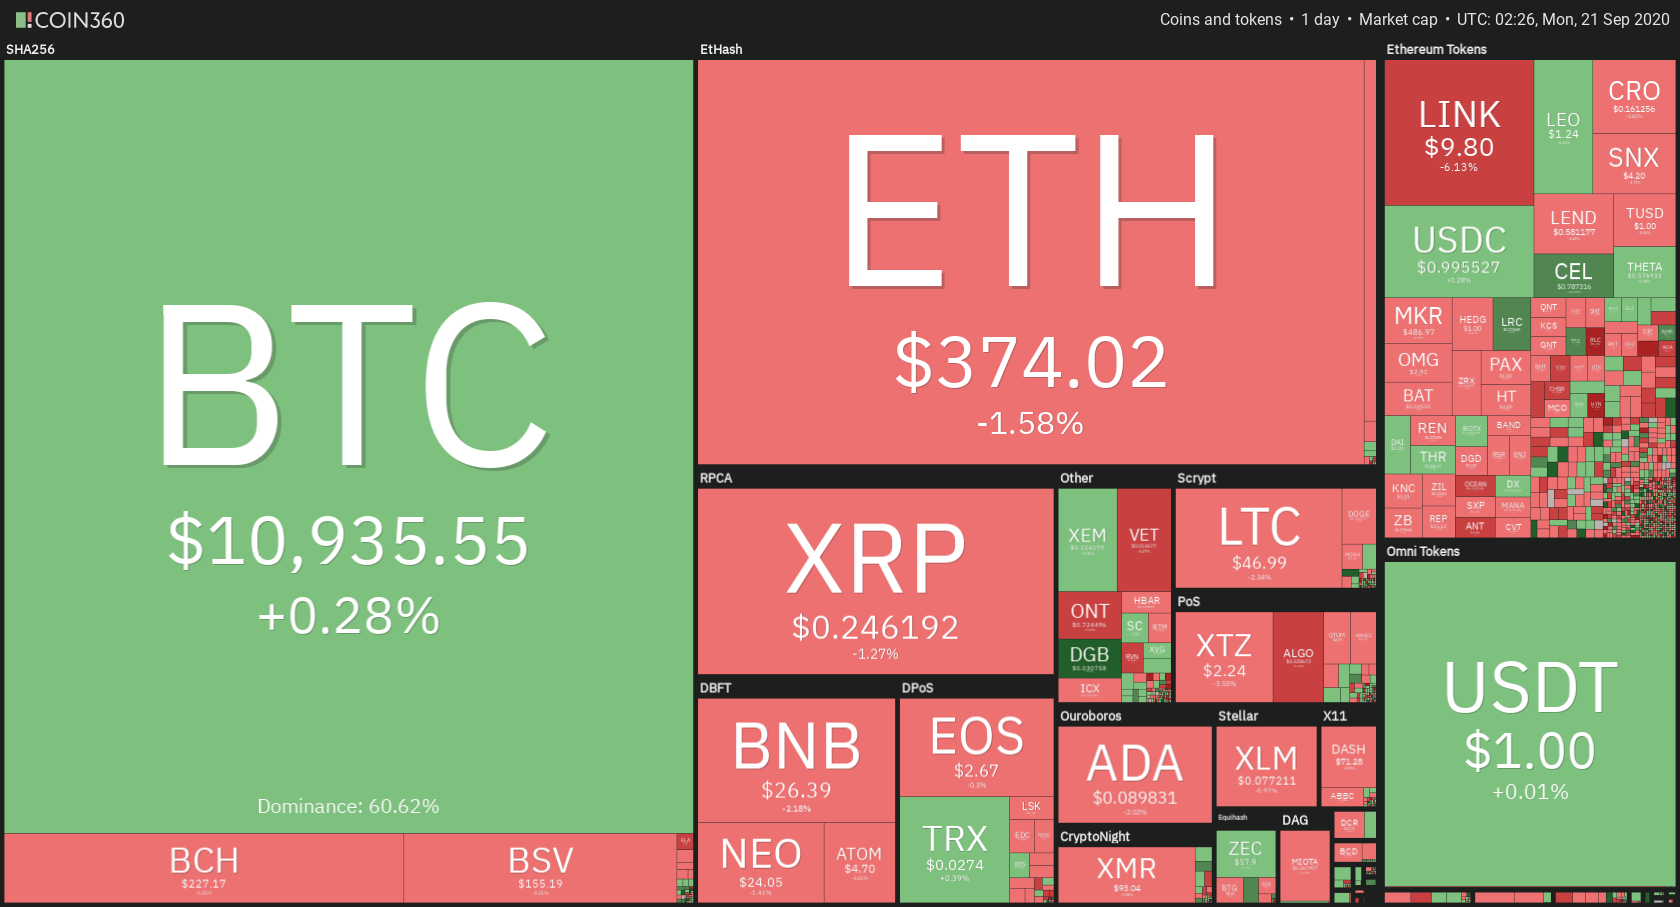
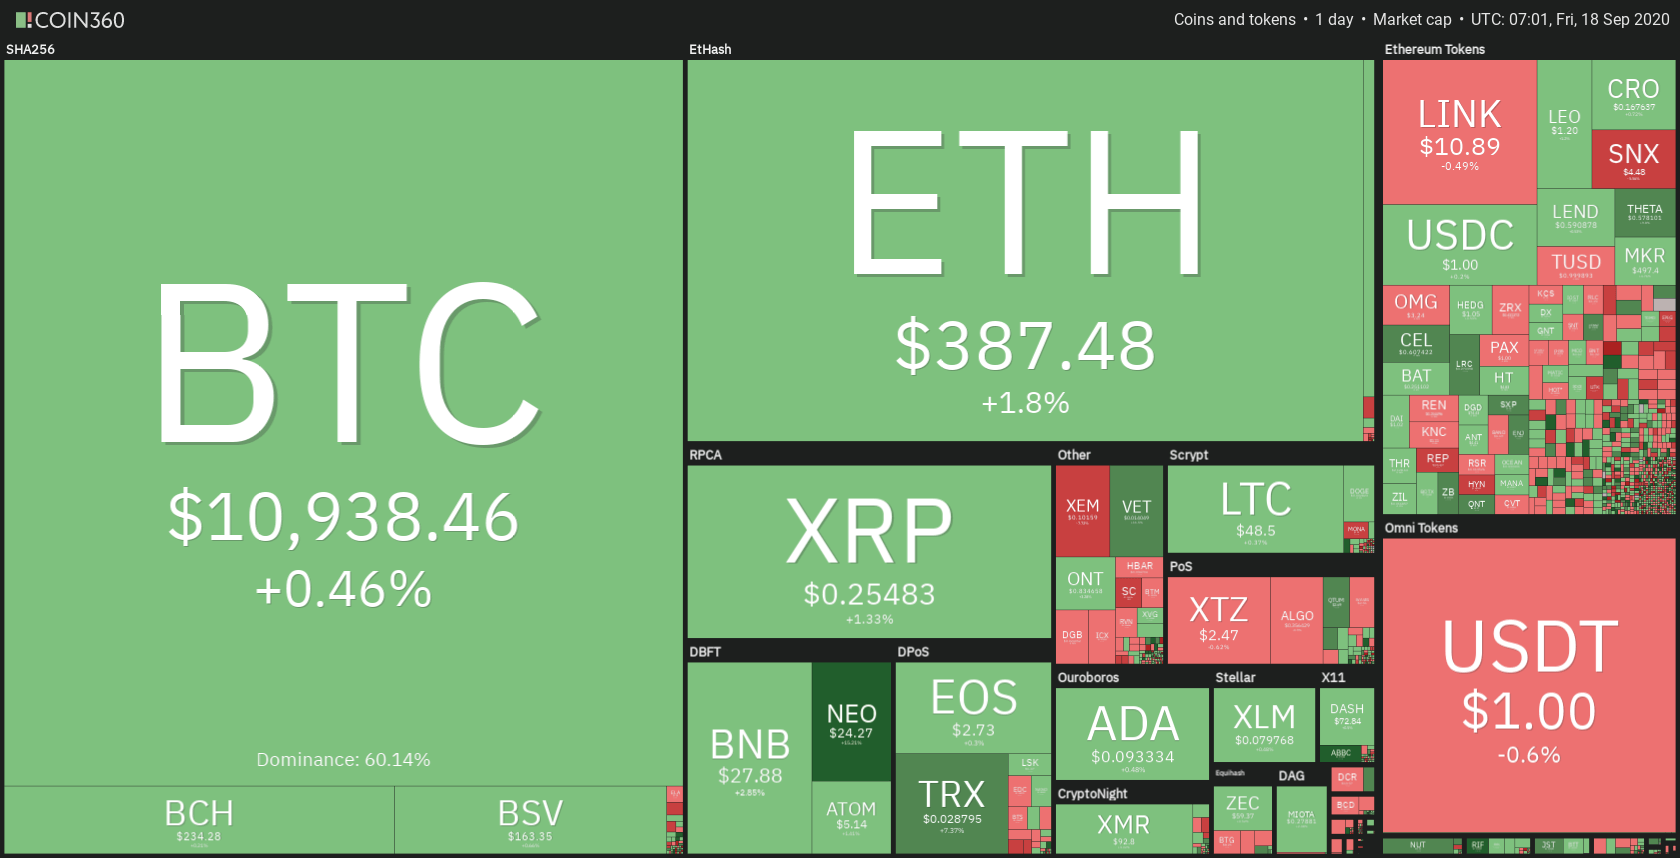
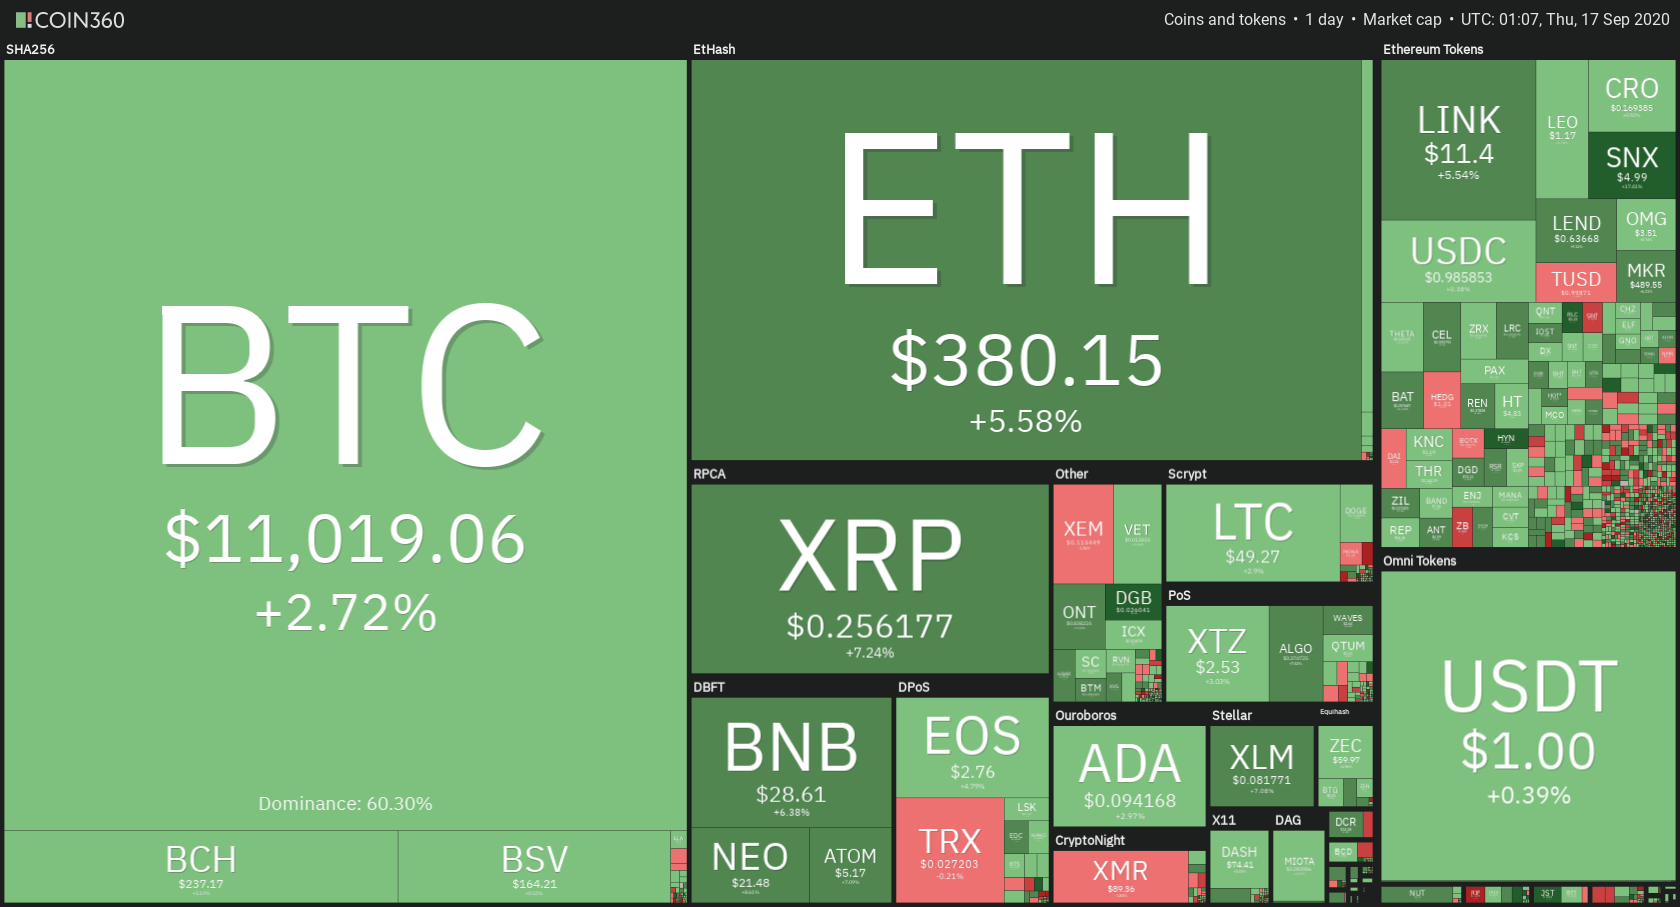
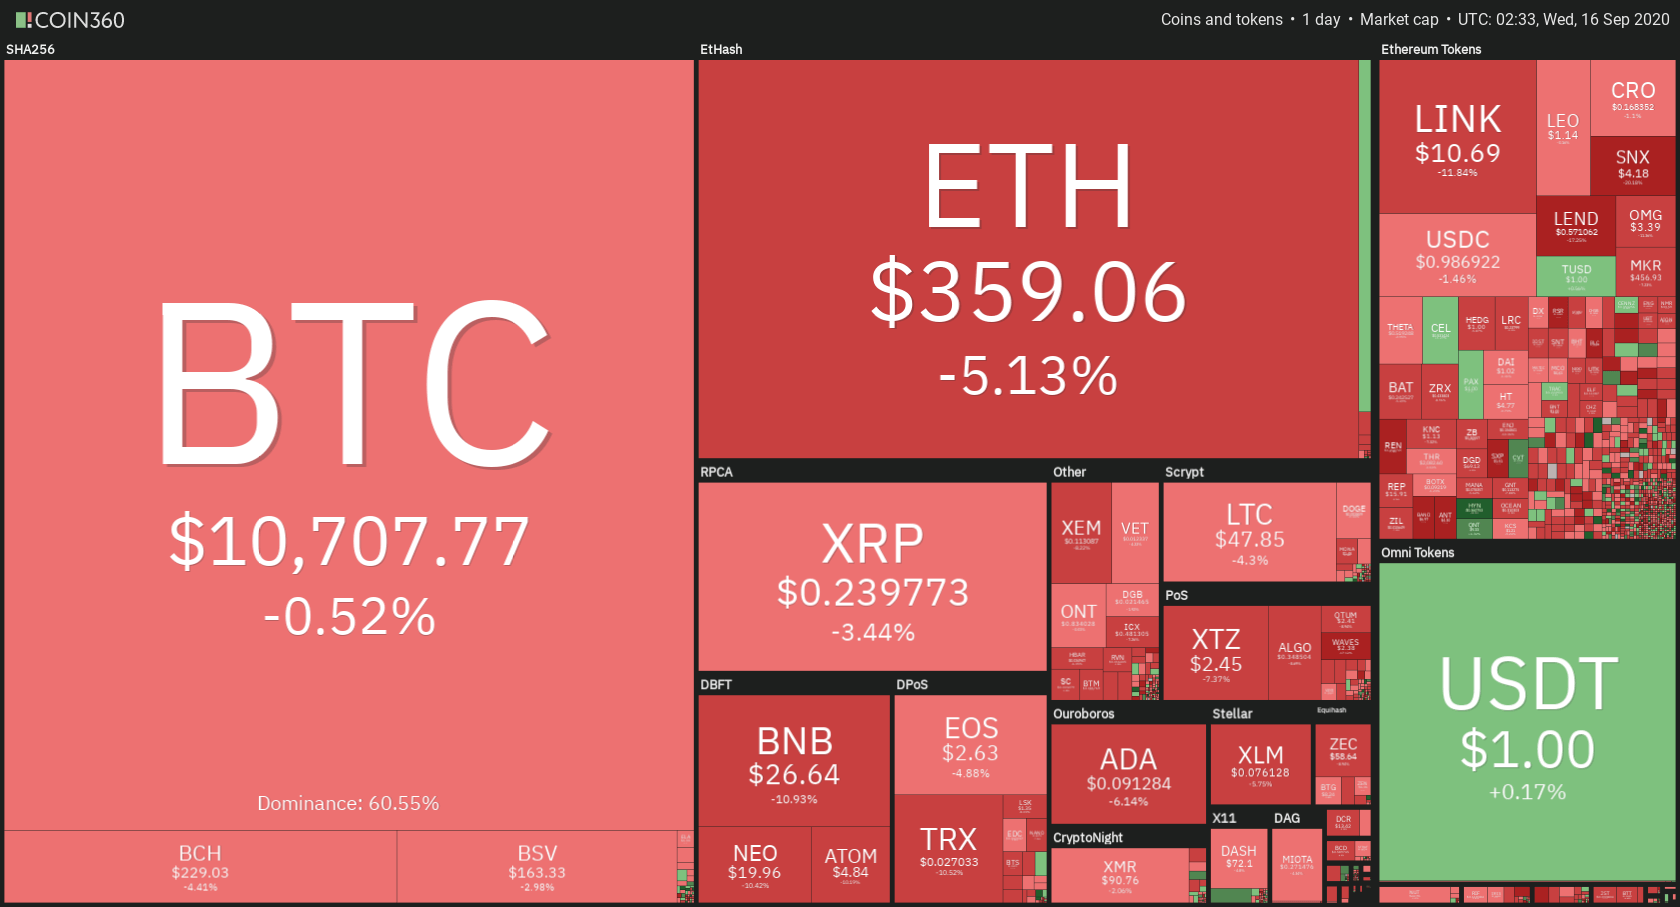
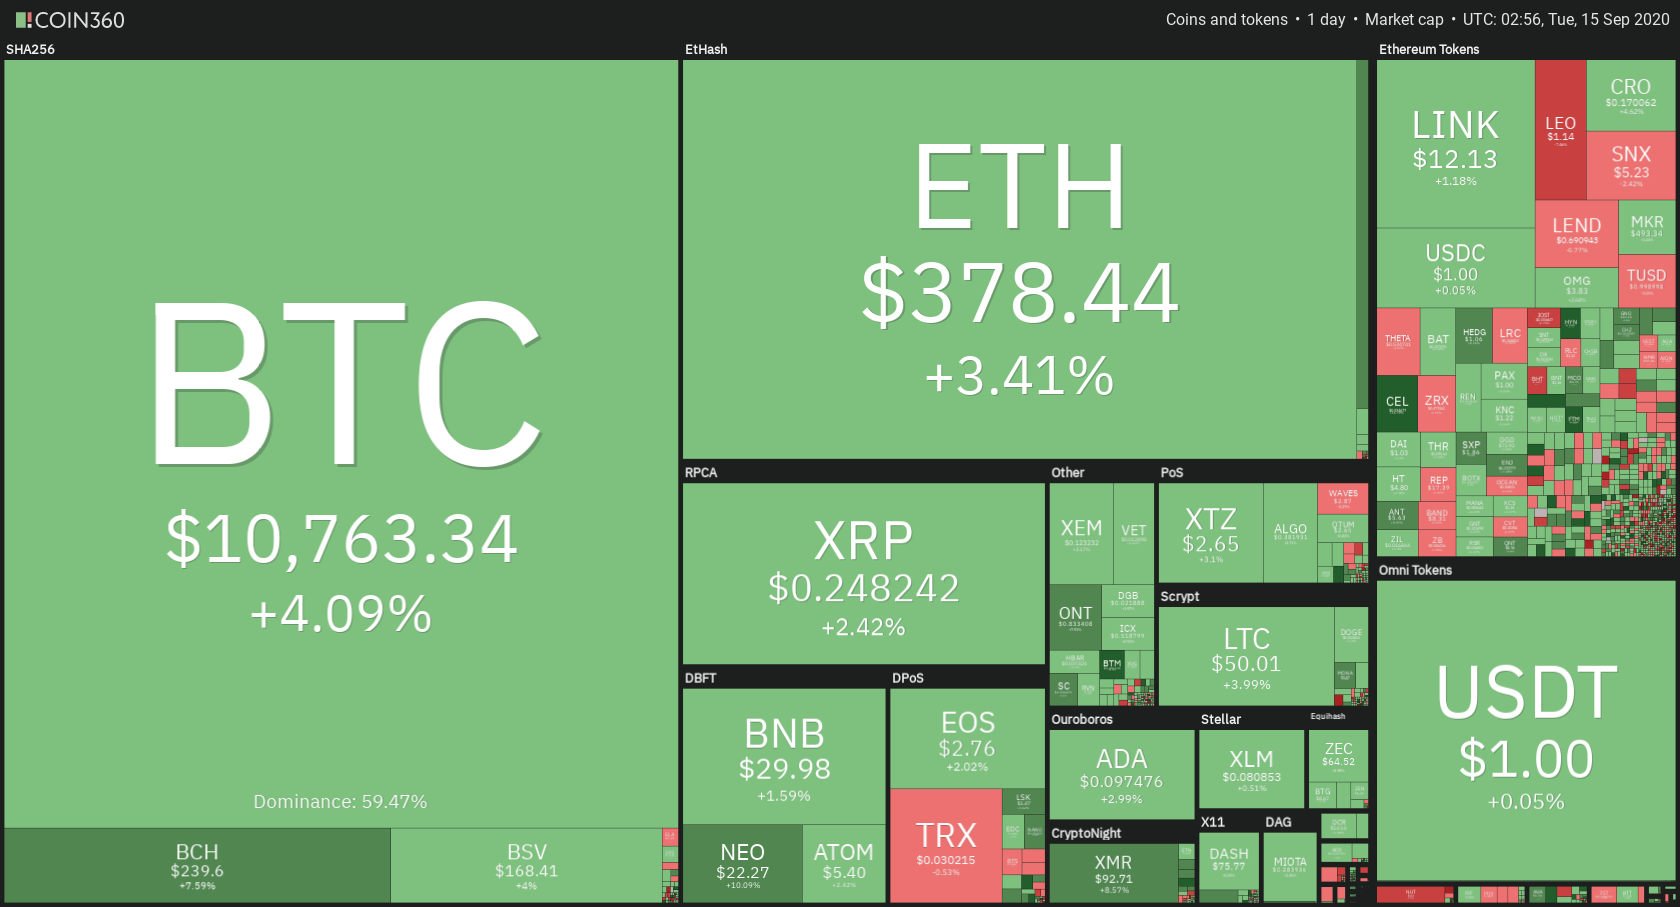
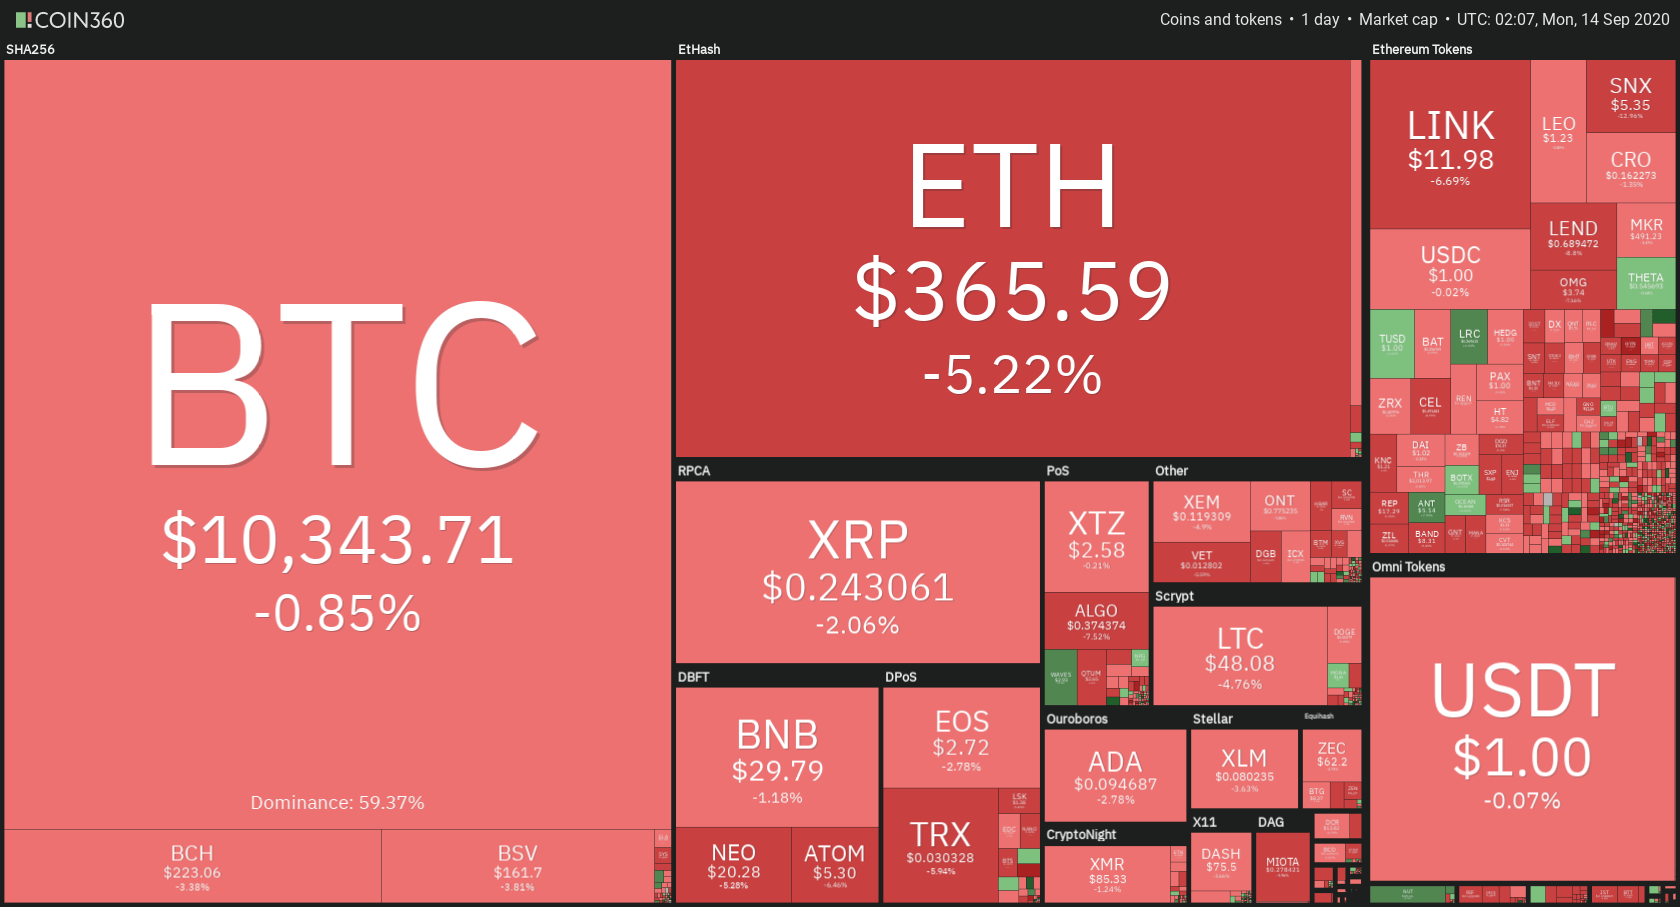
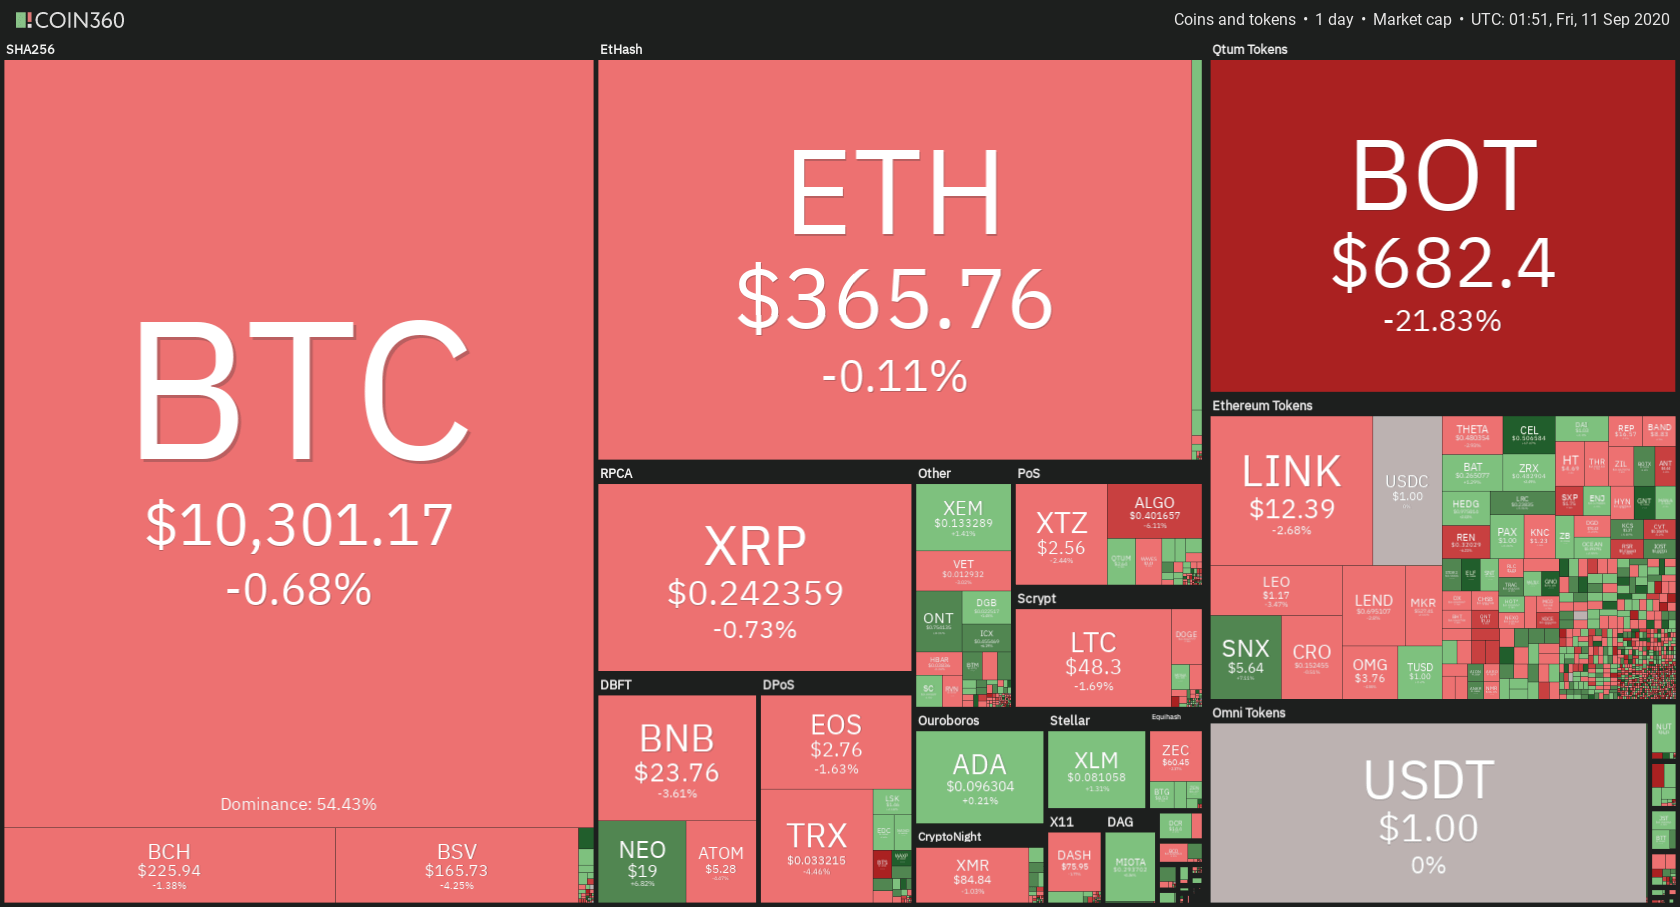
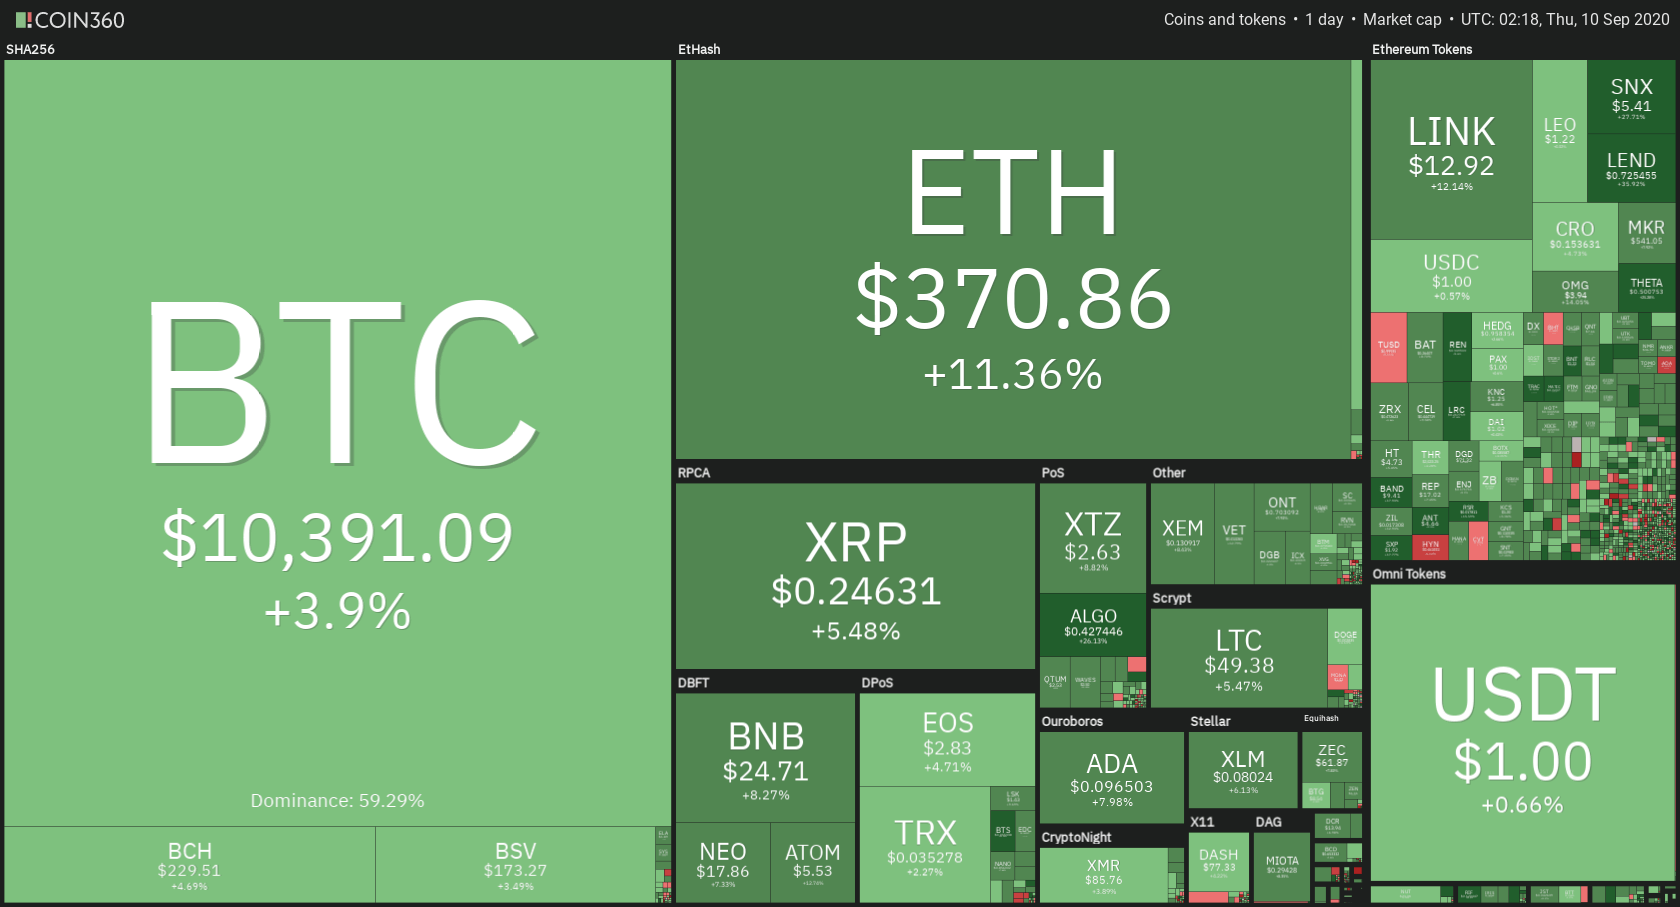
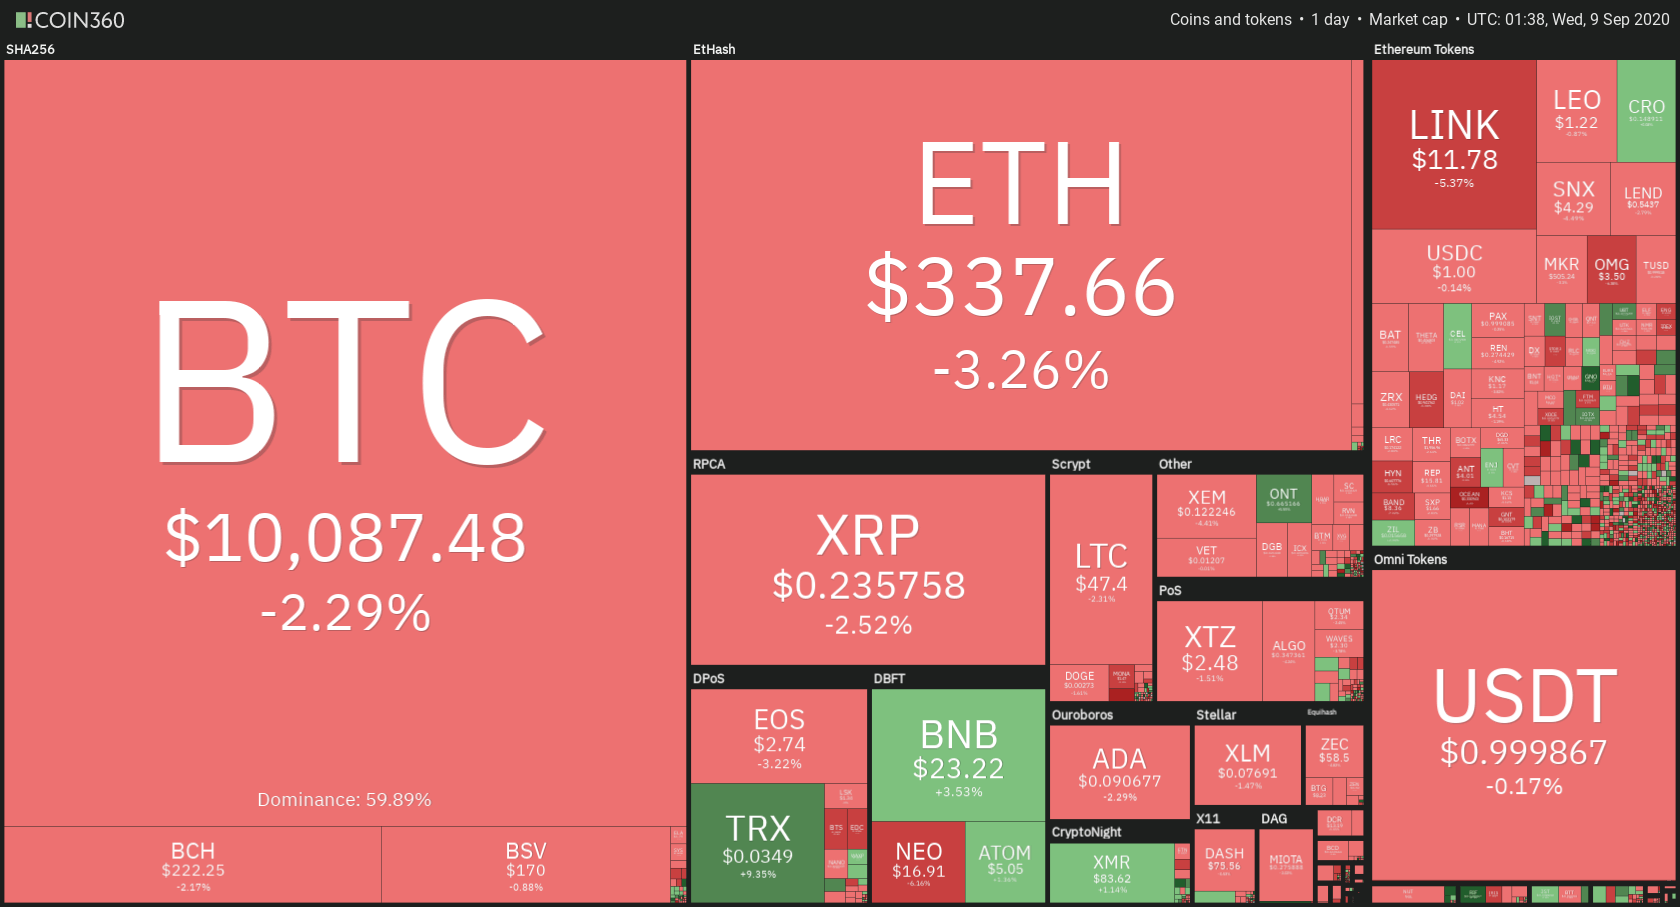
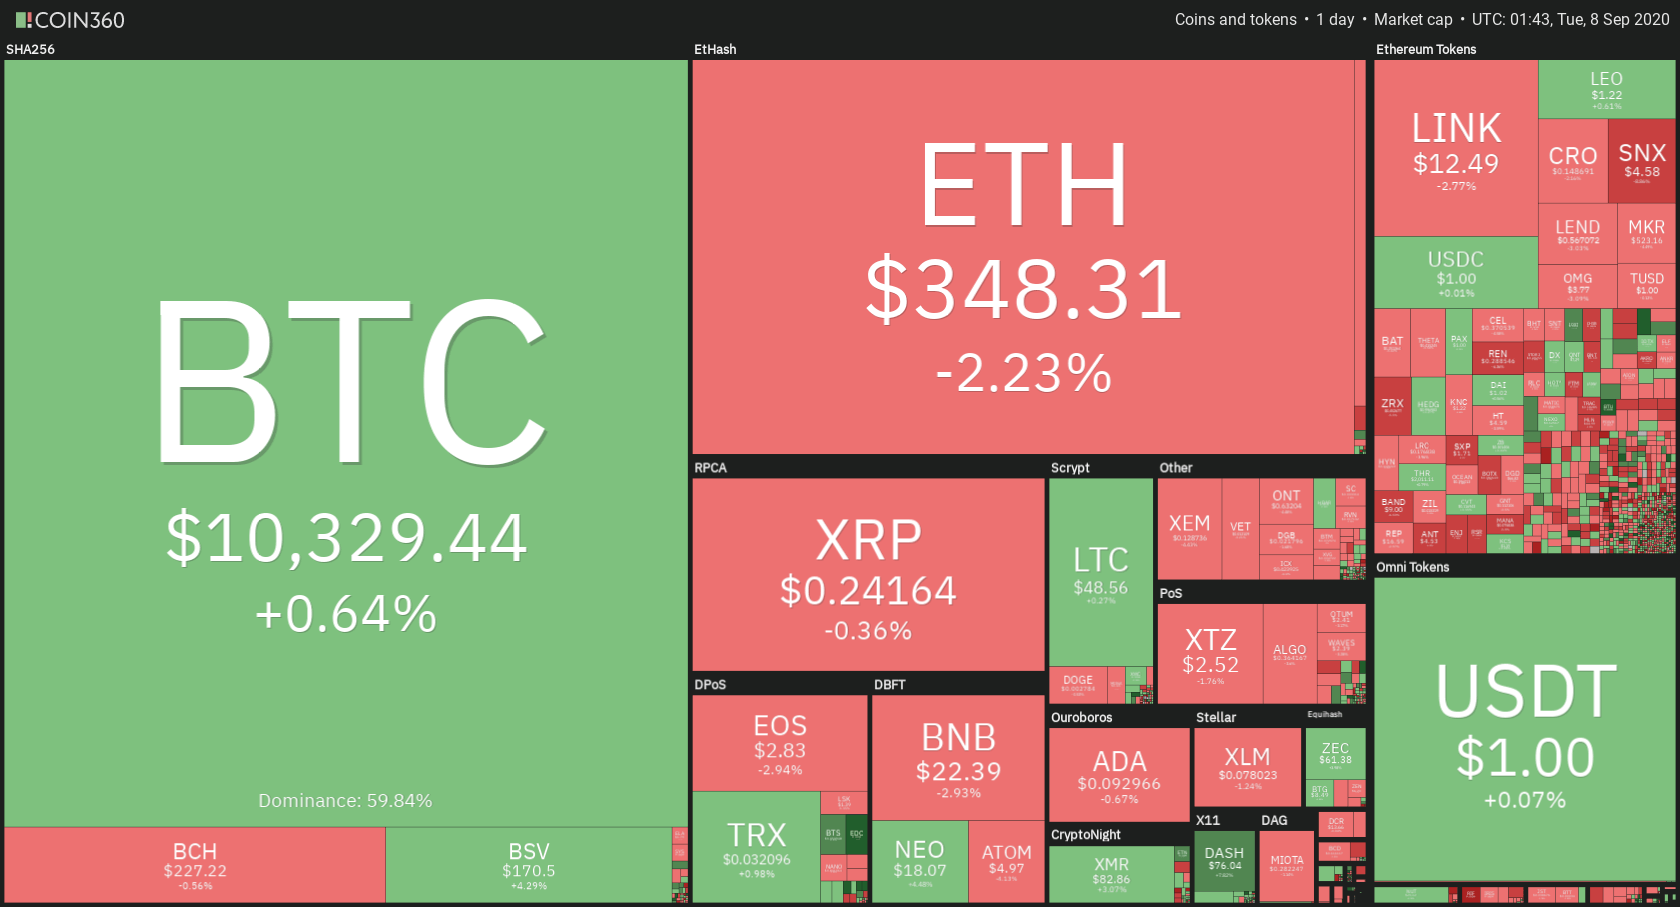
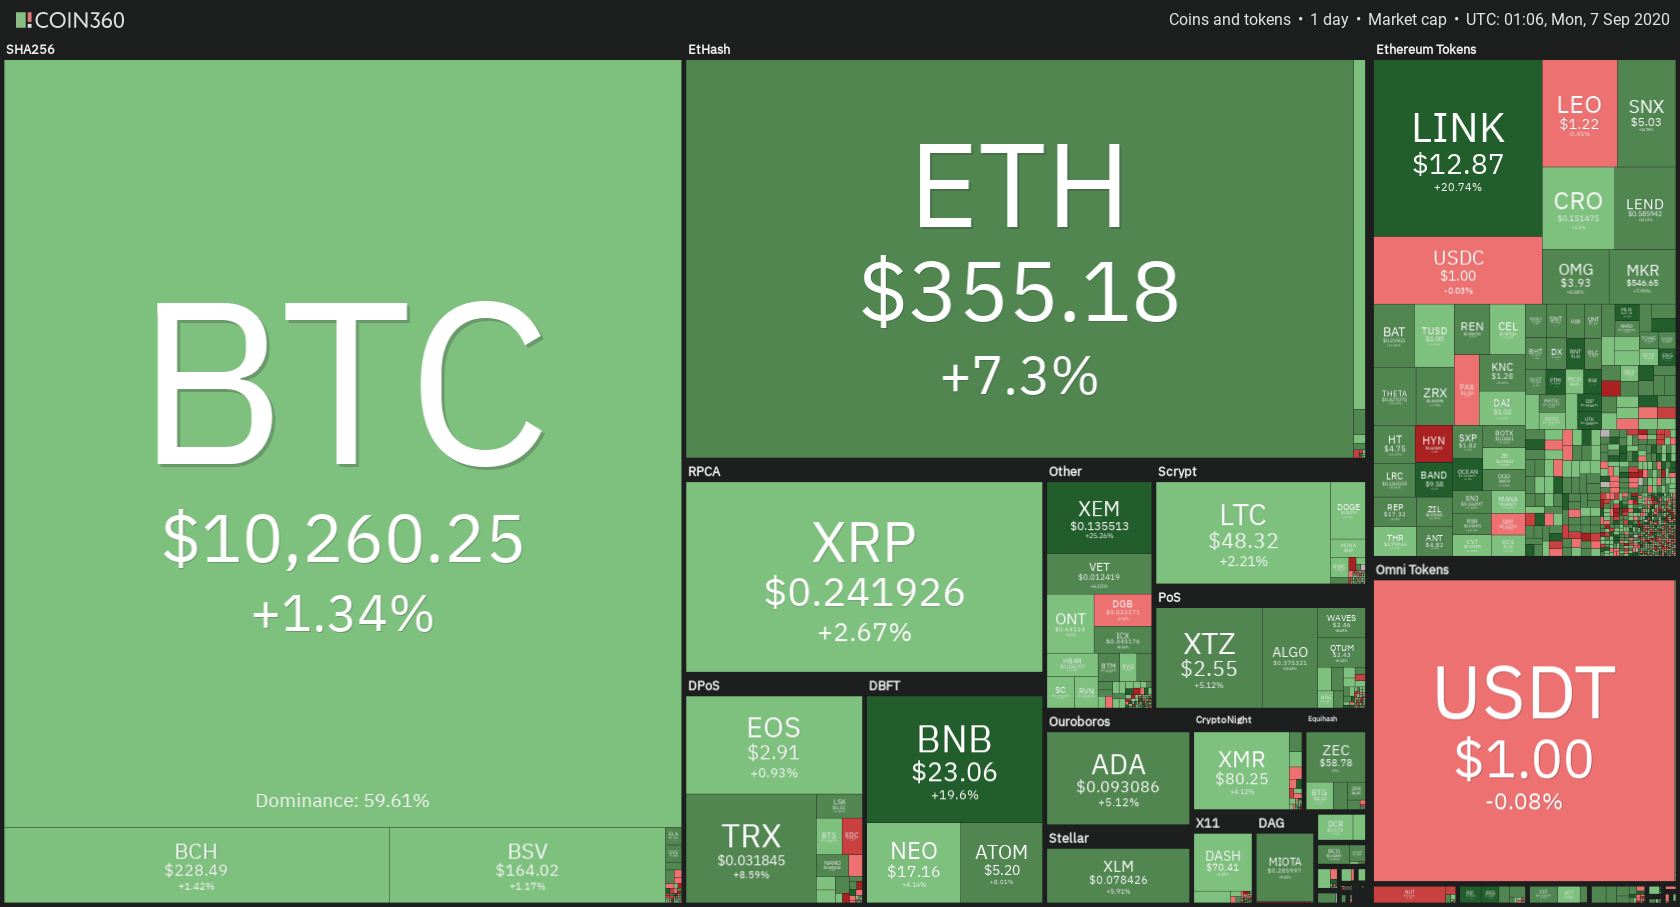
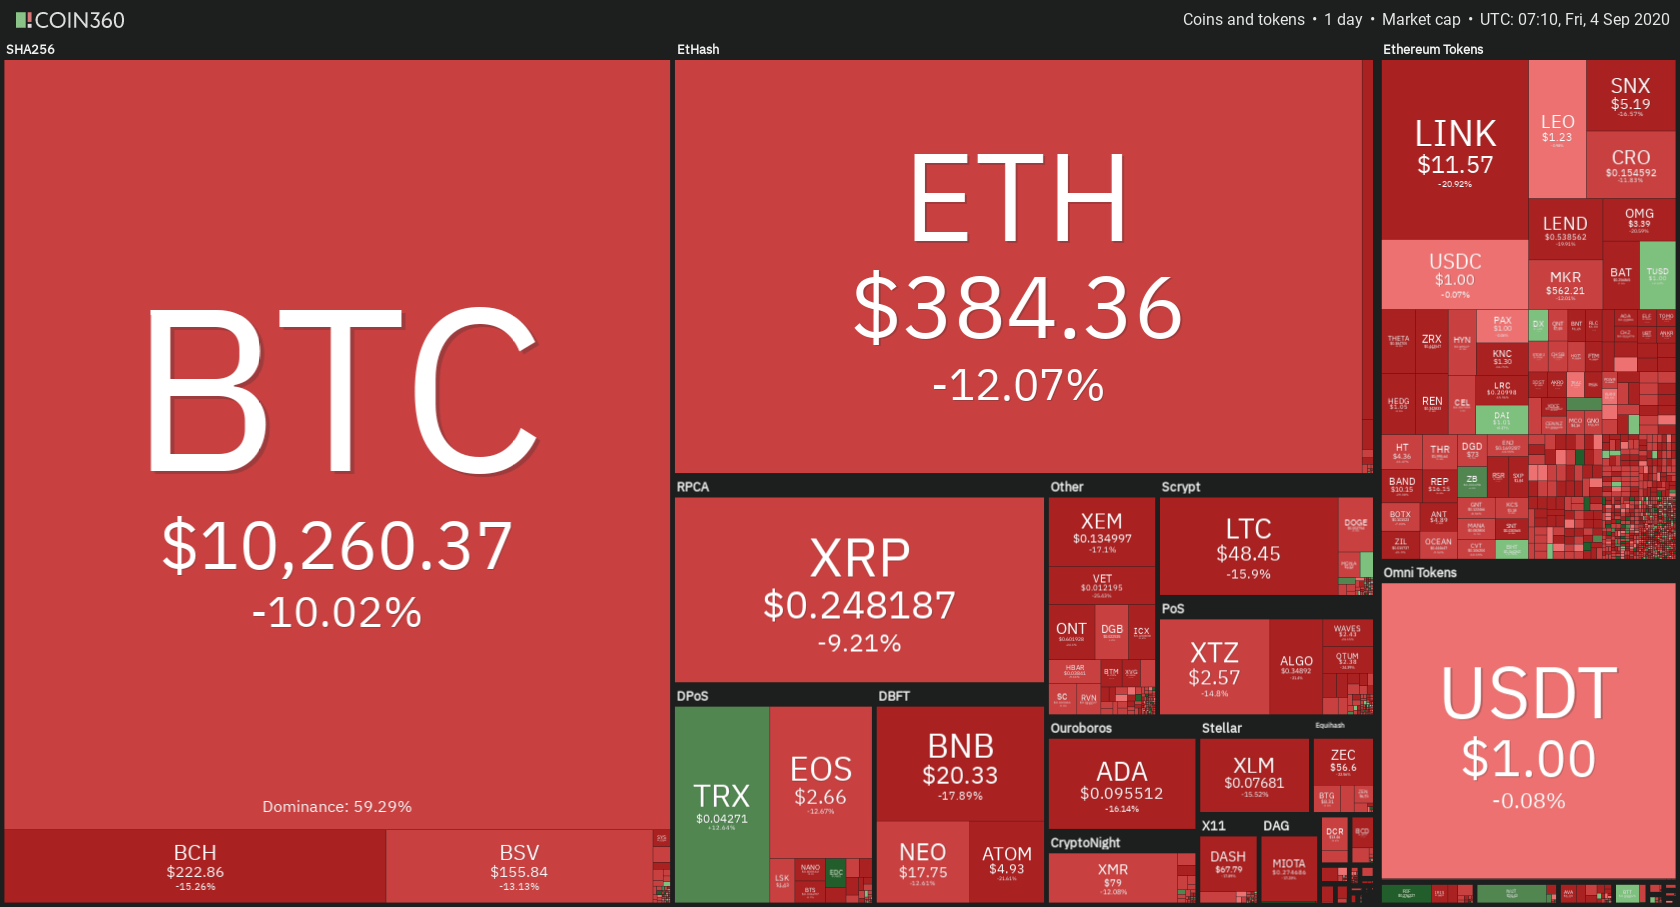
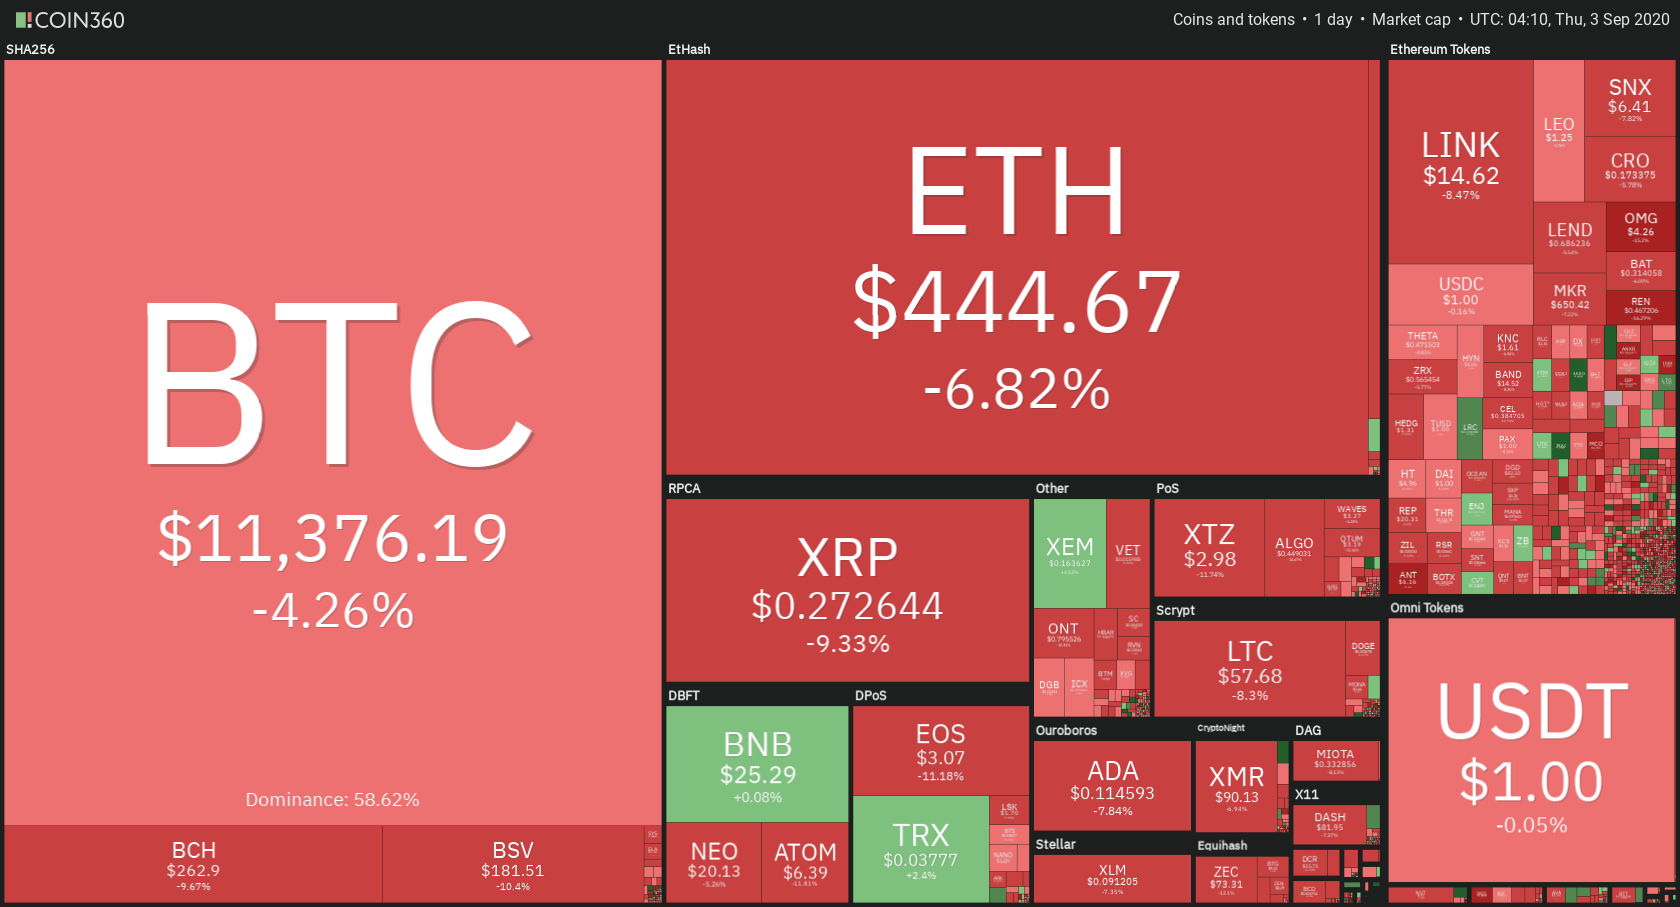
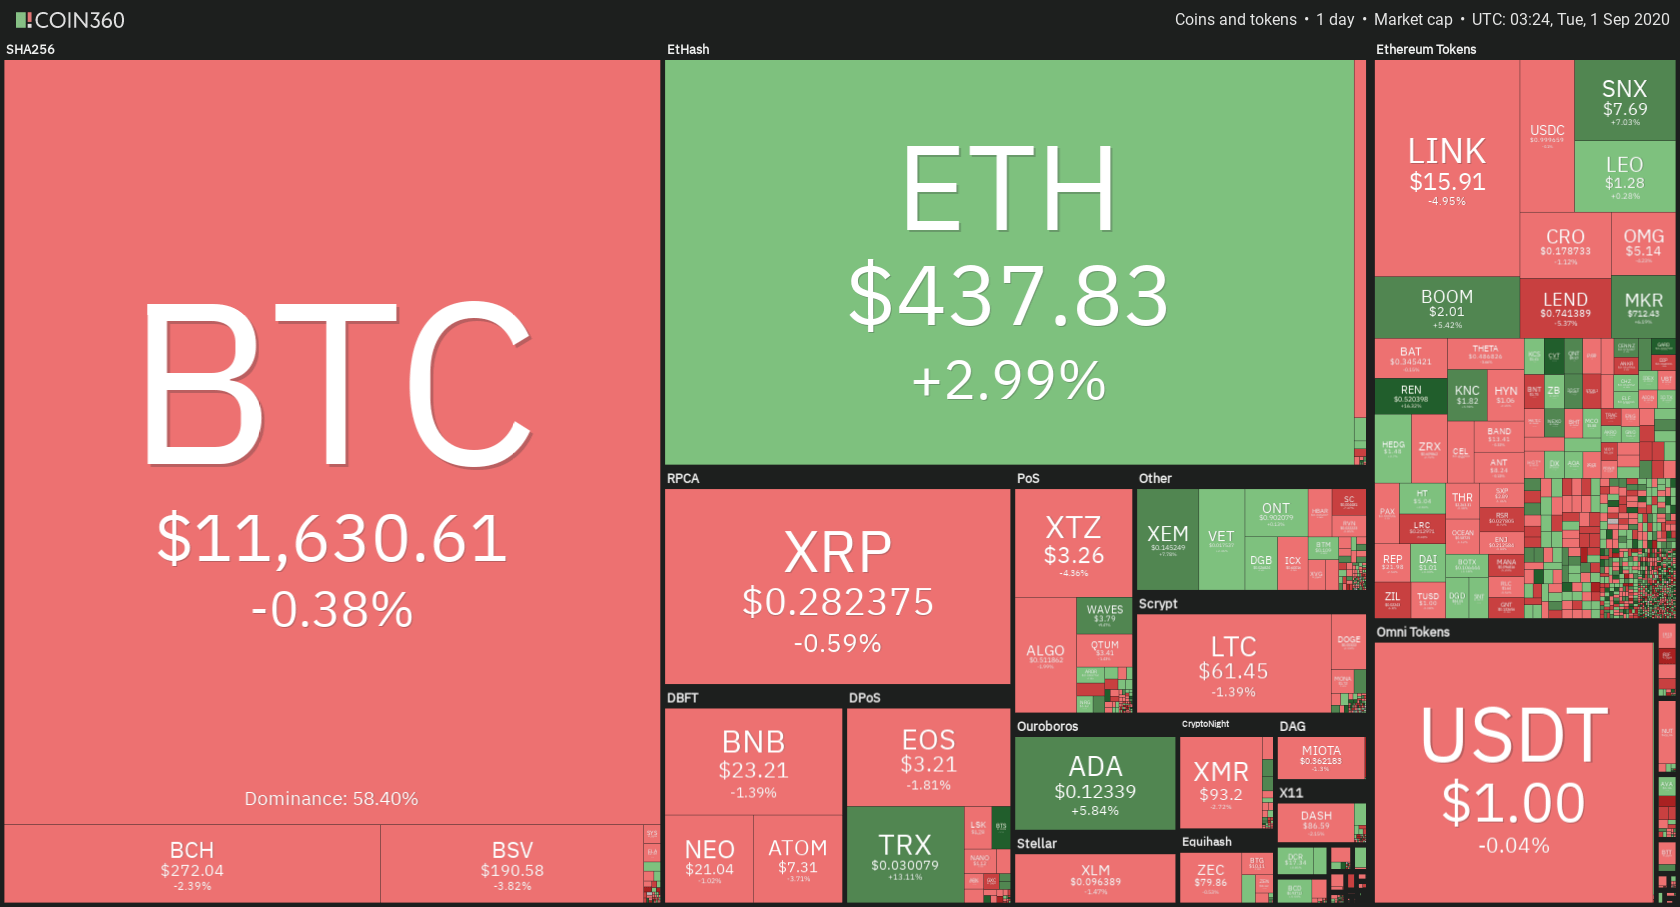
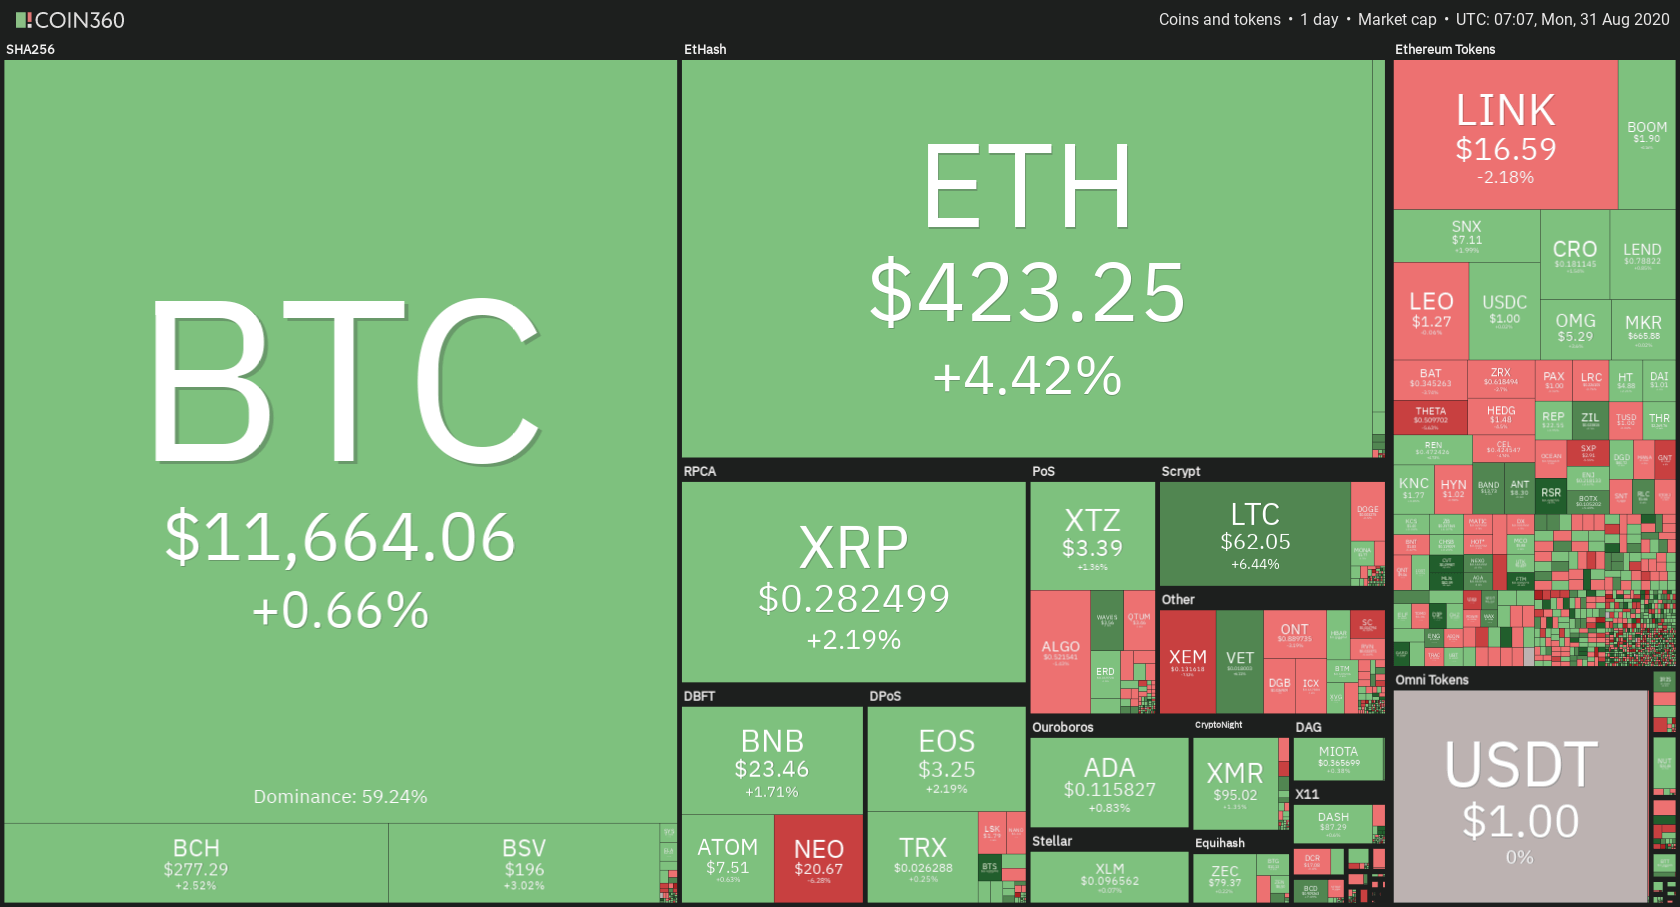
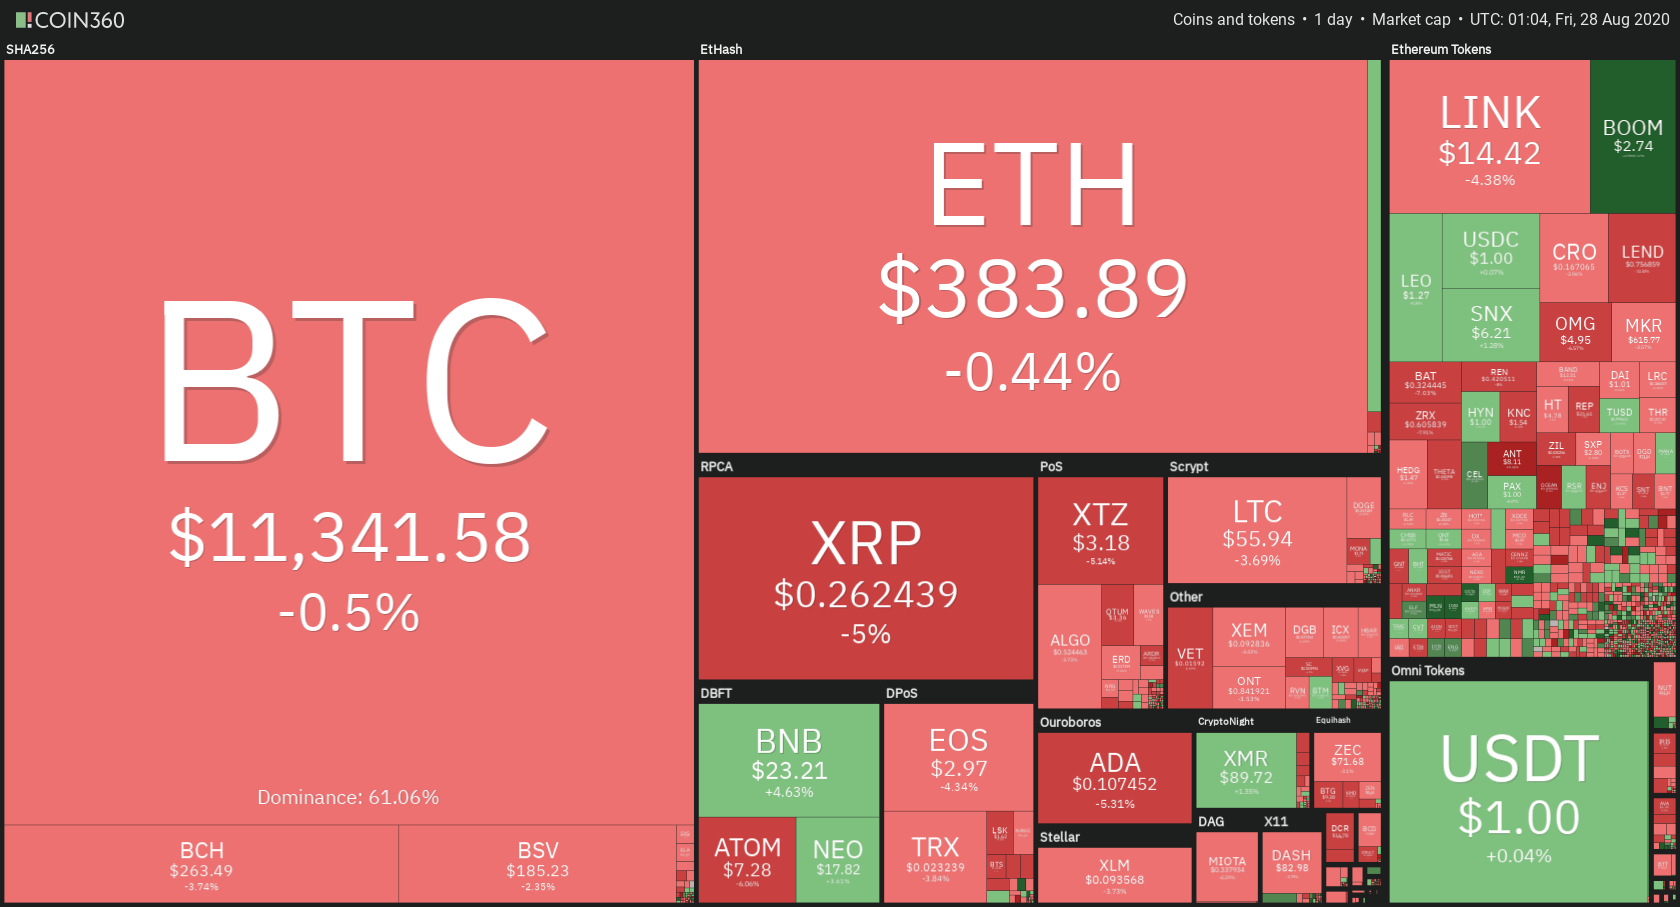
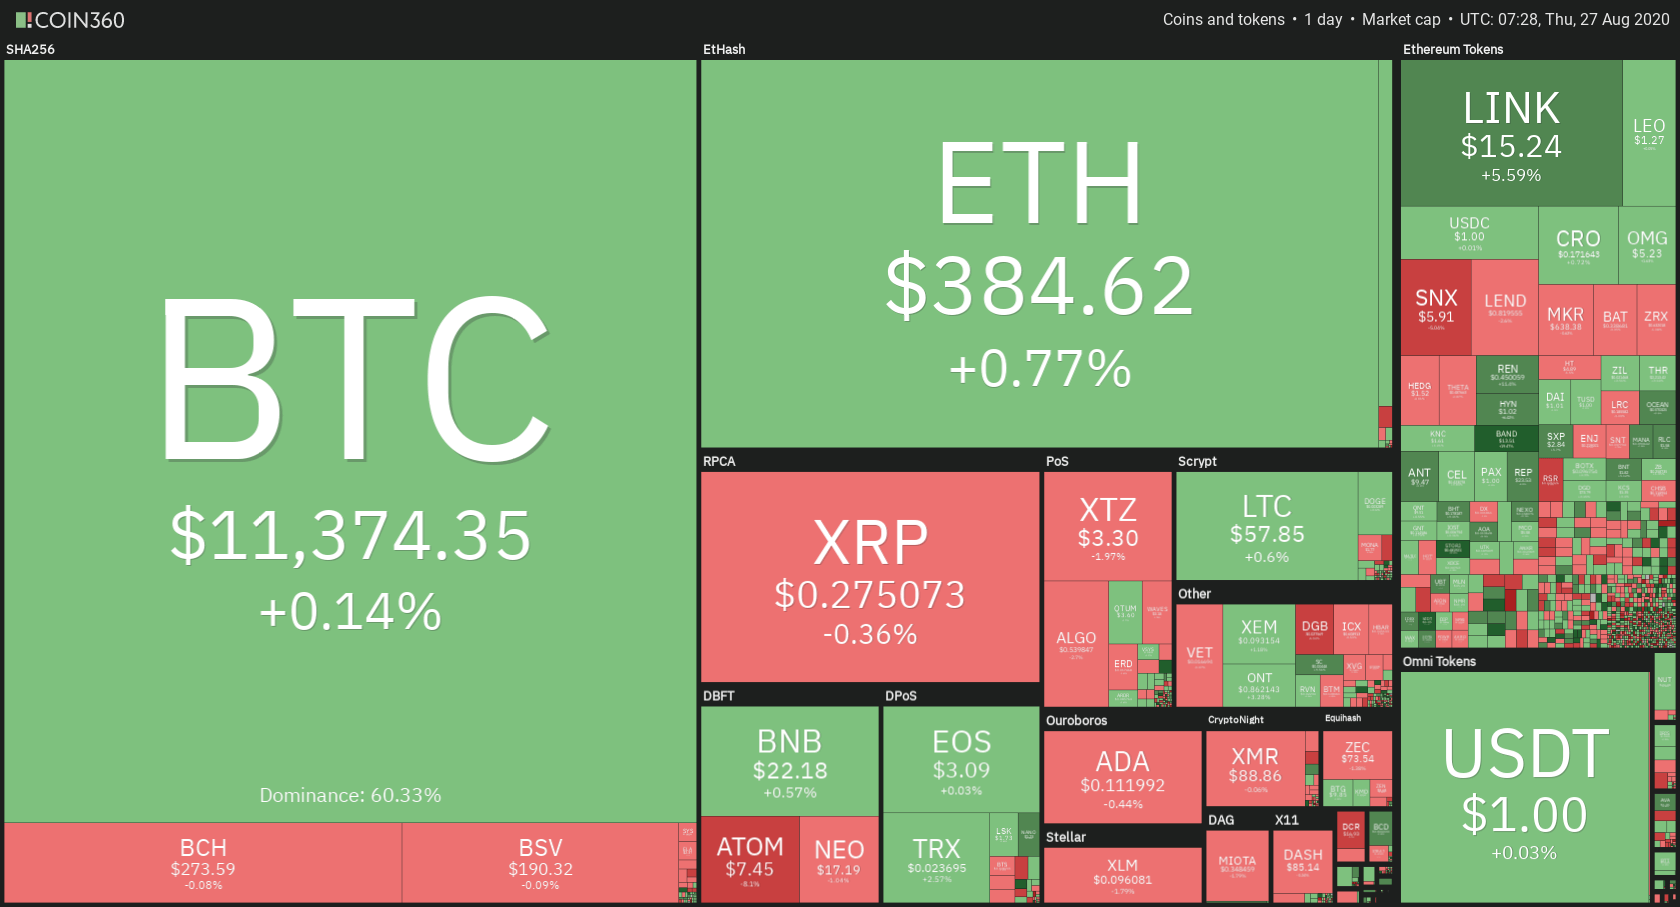
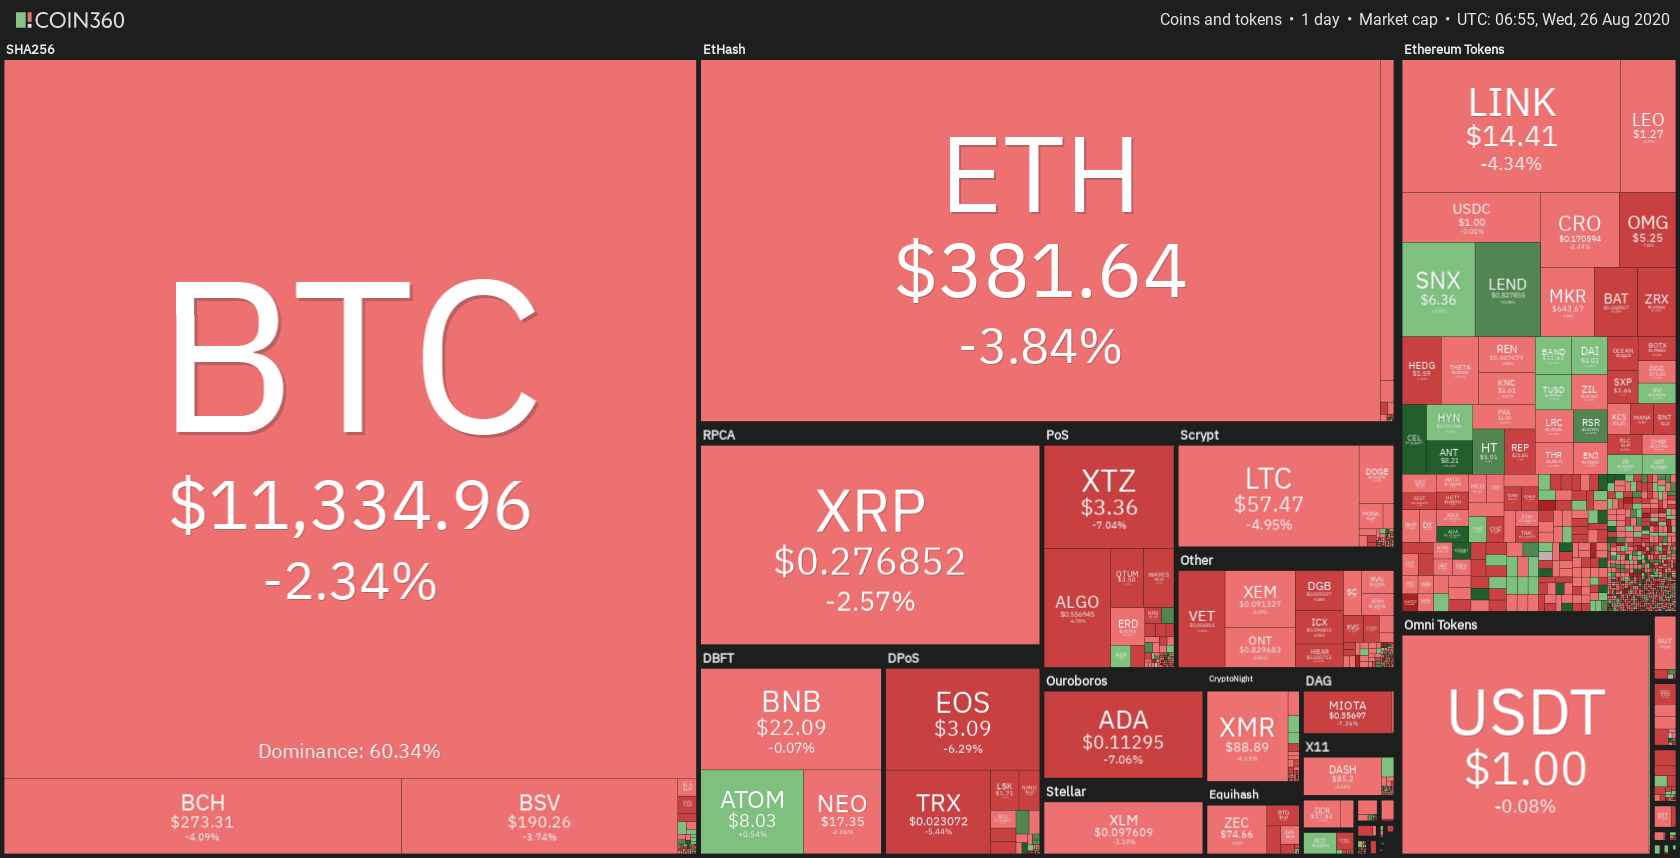
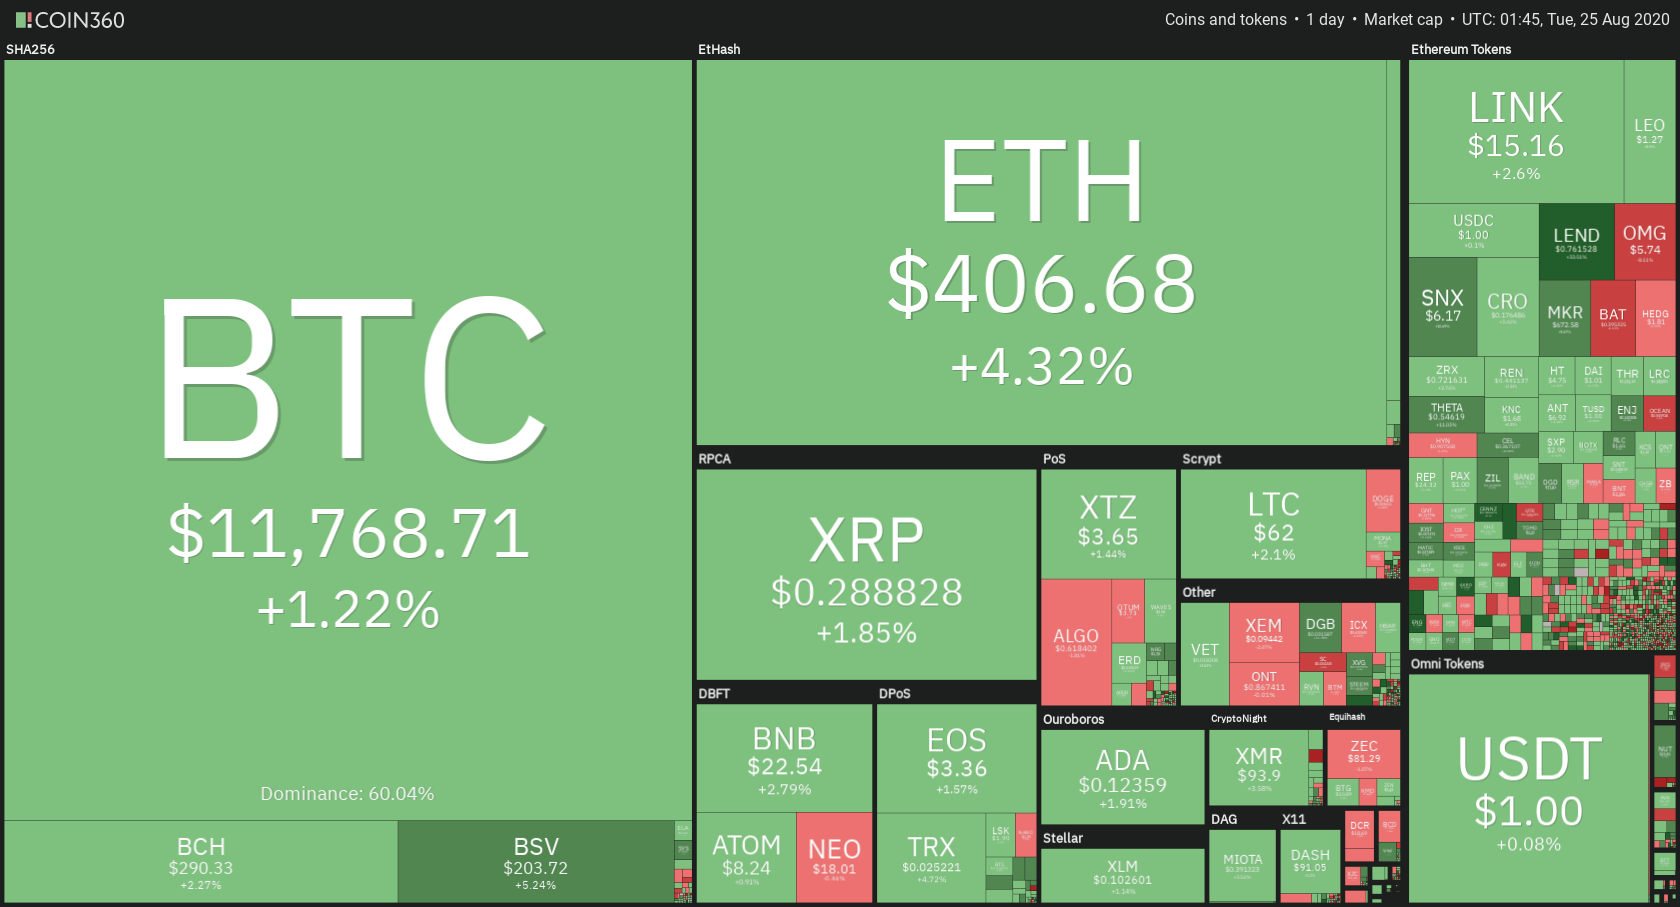
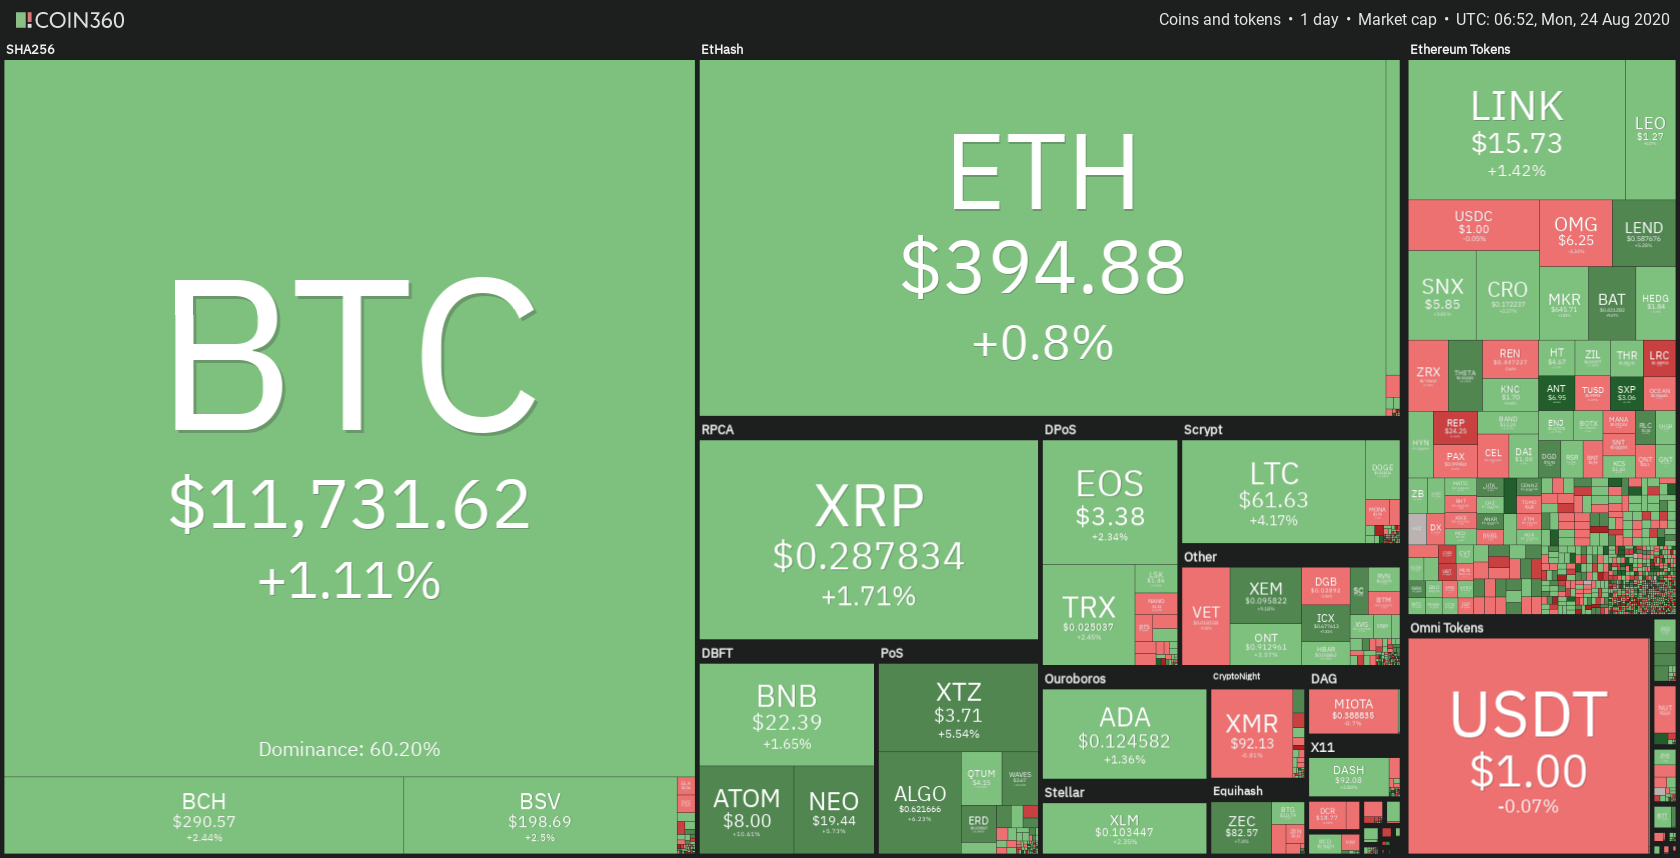
Daily Crypto Sector Heat Map
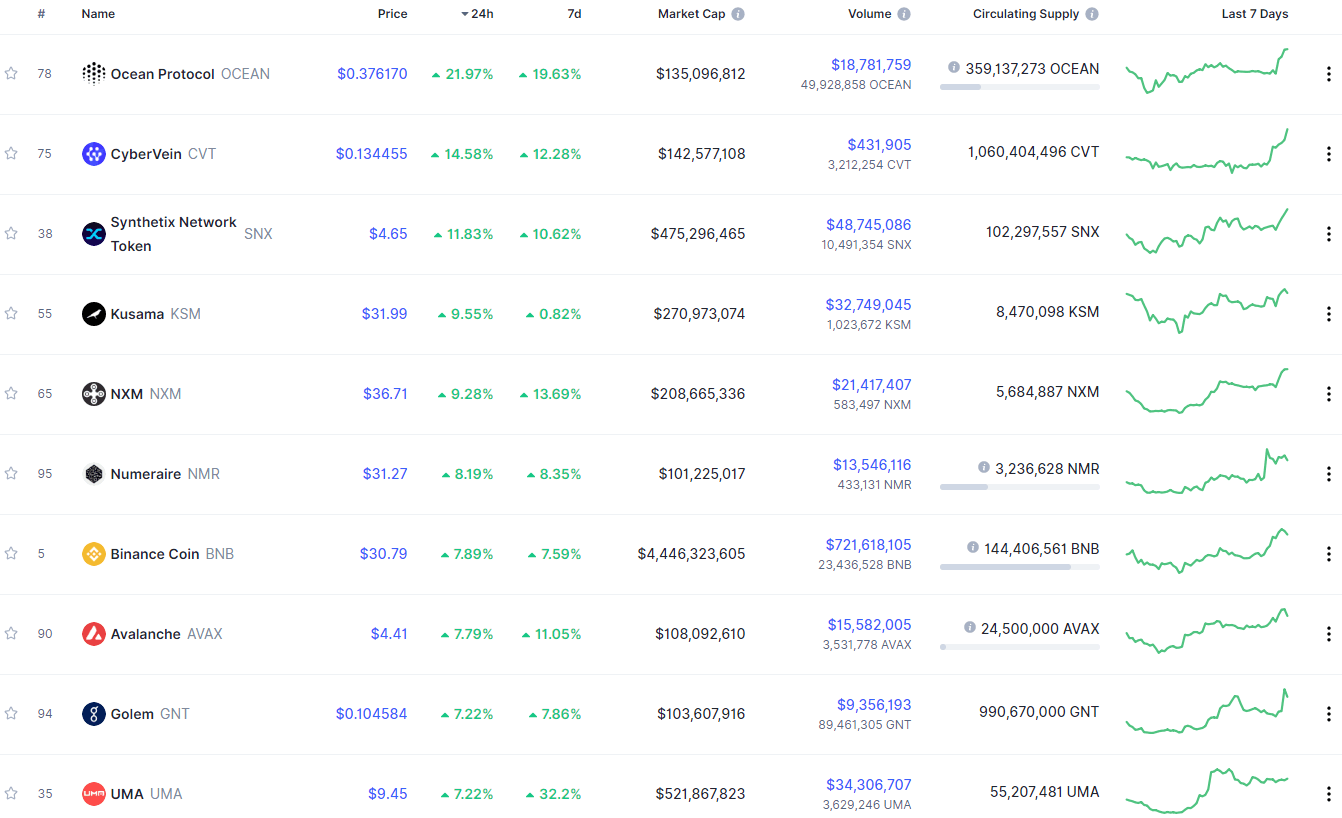
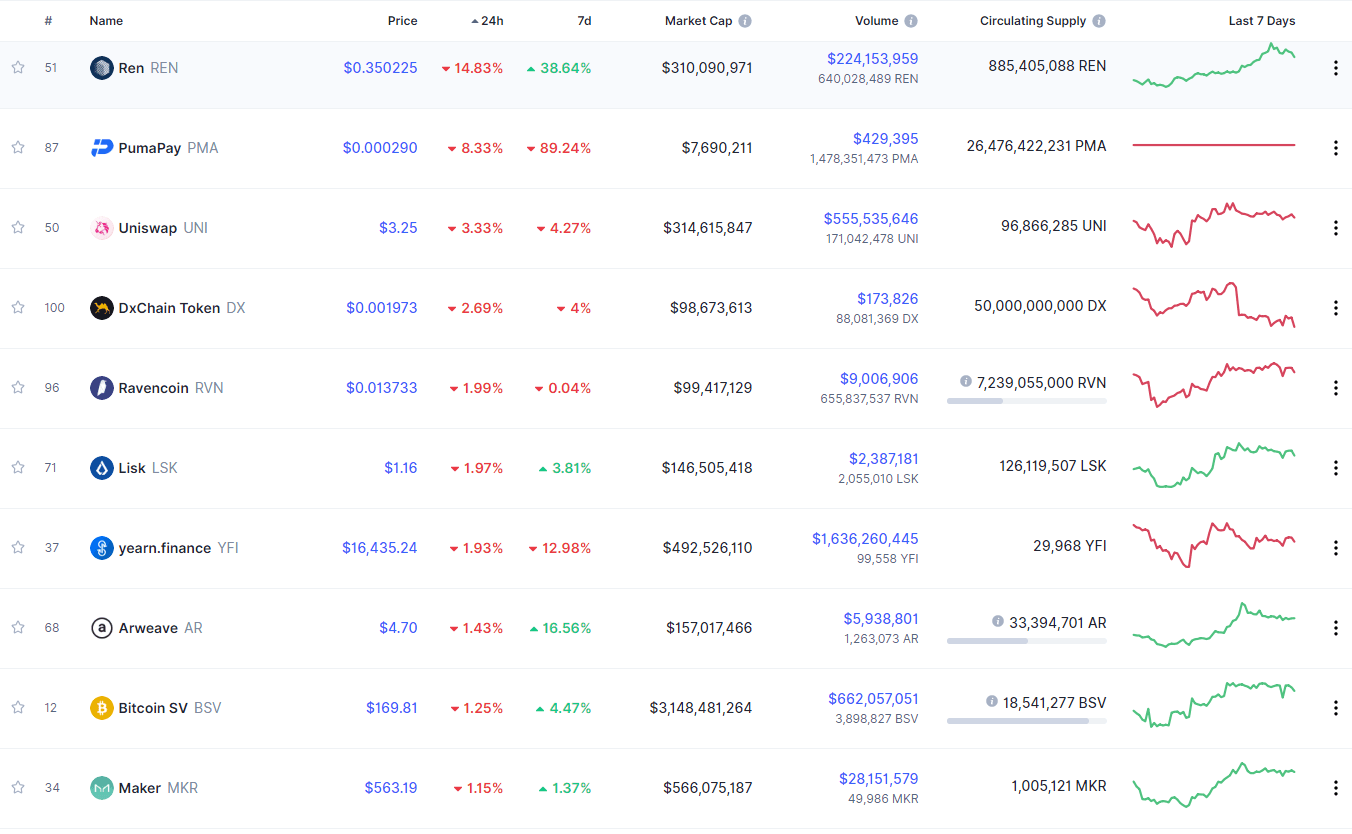
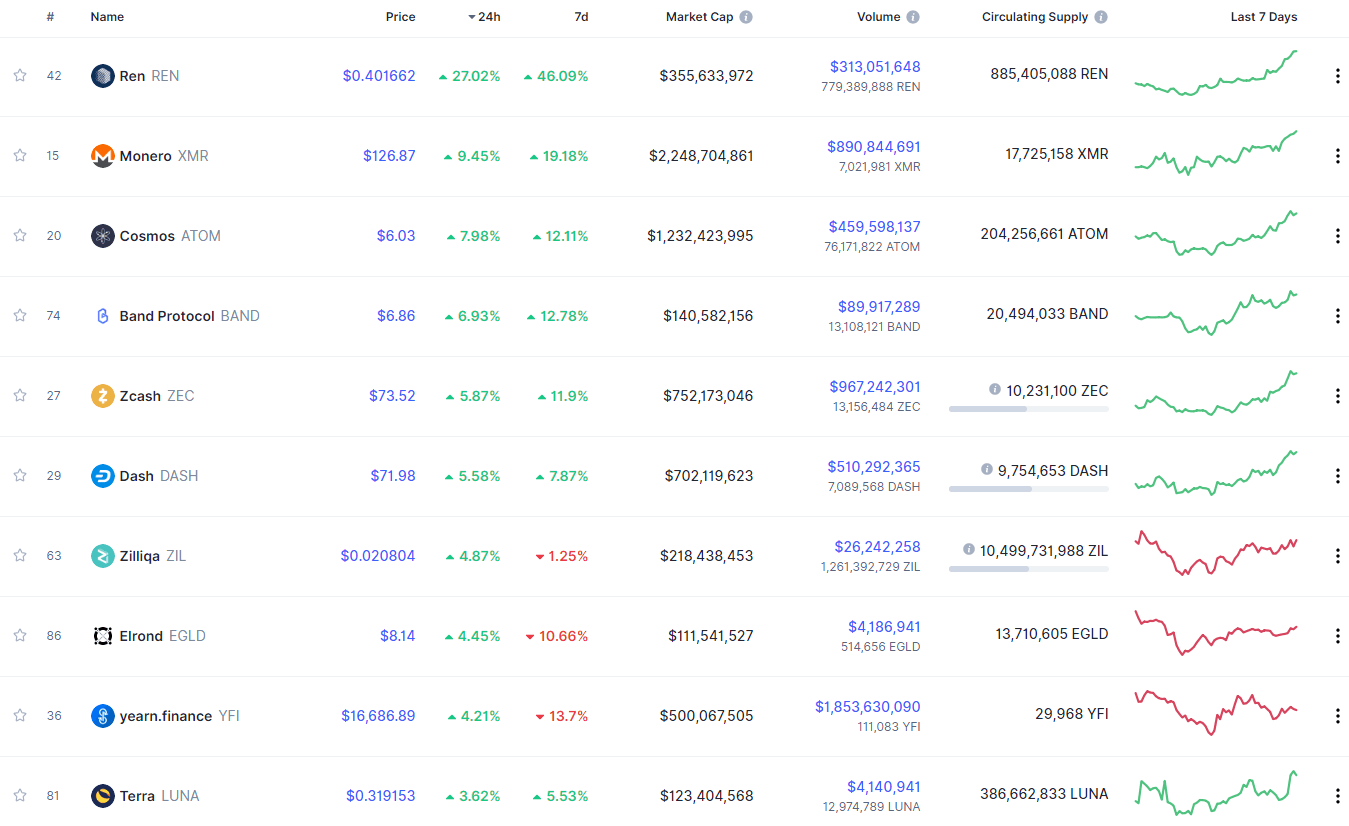
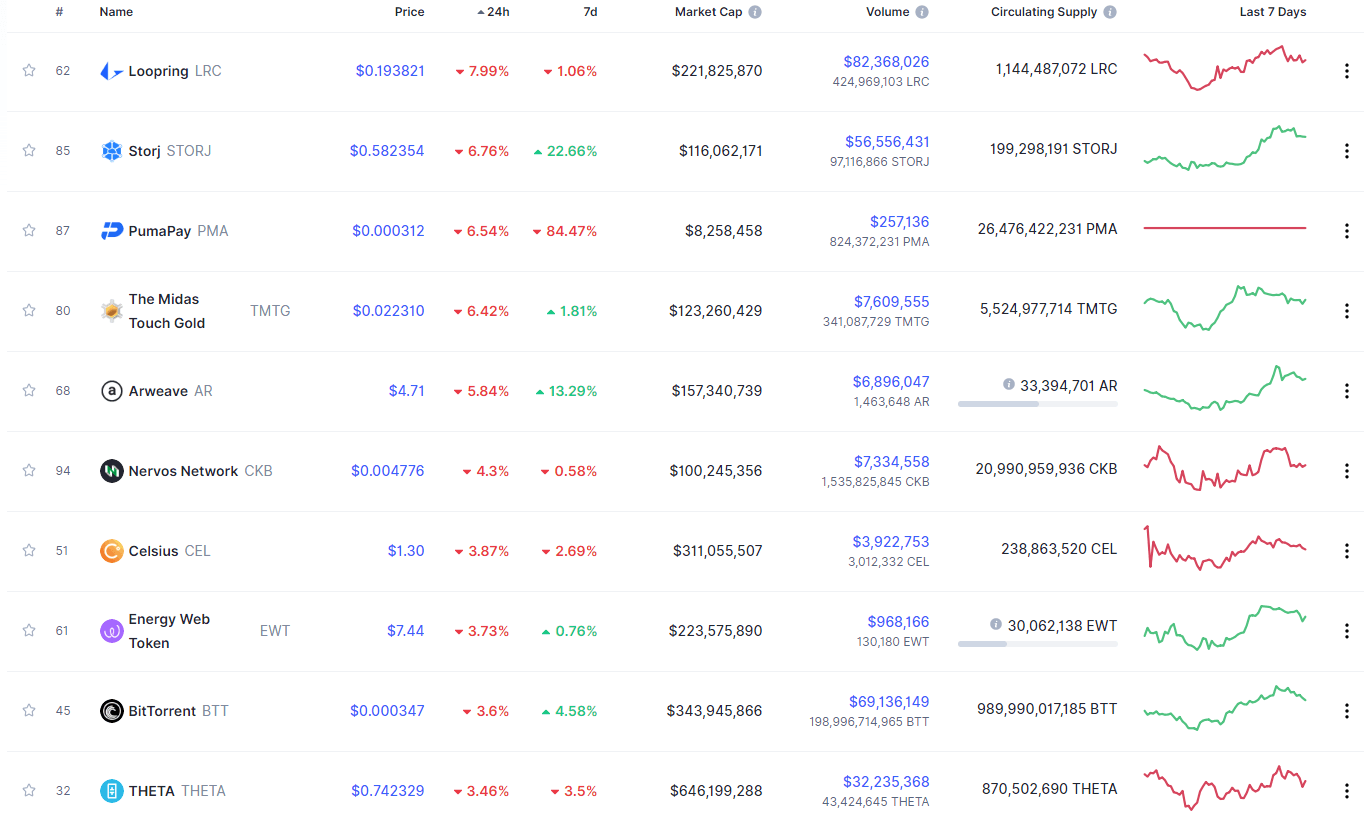
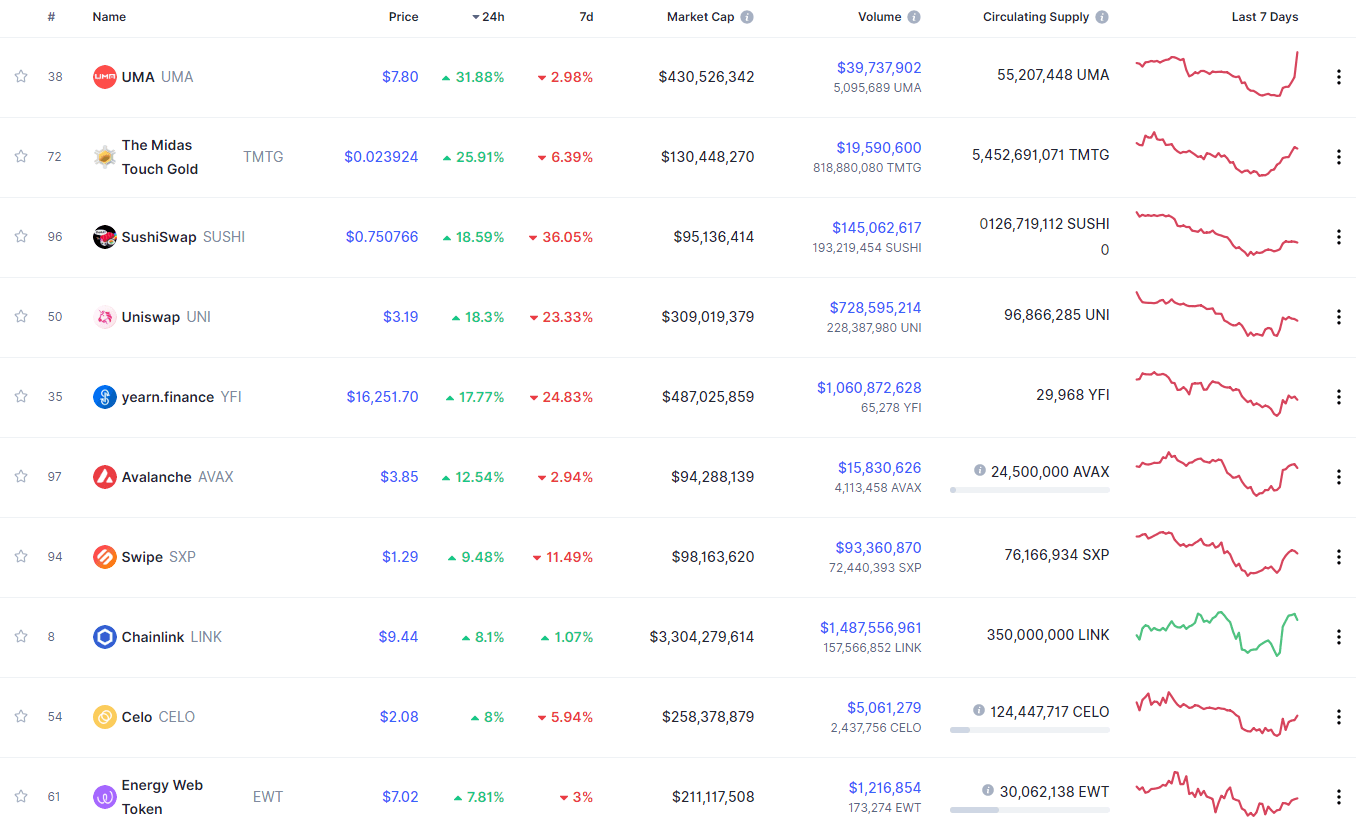
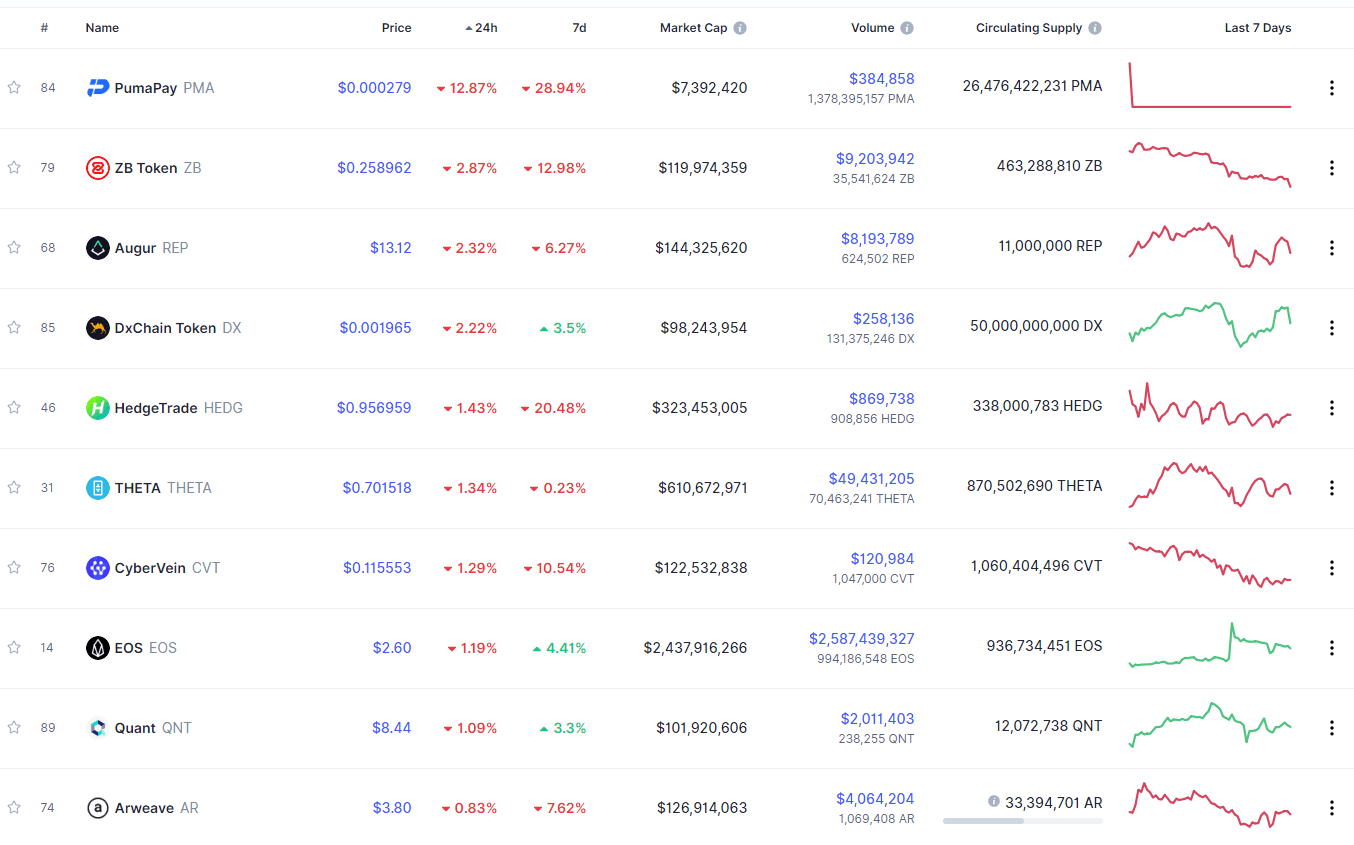
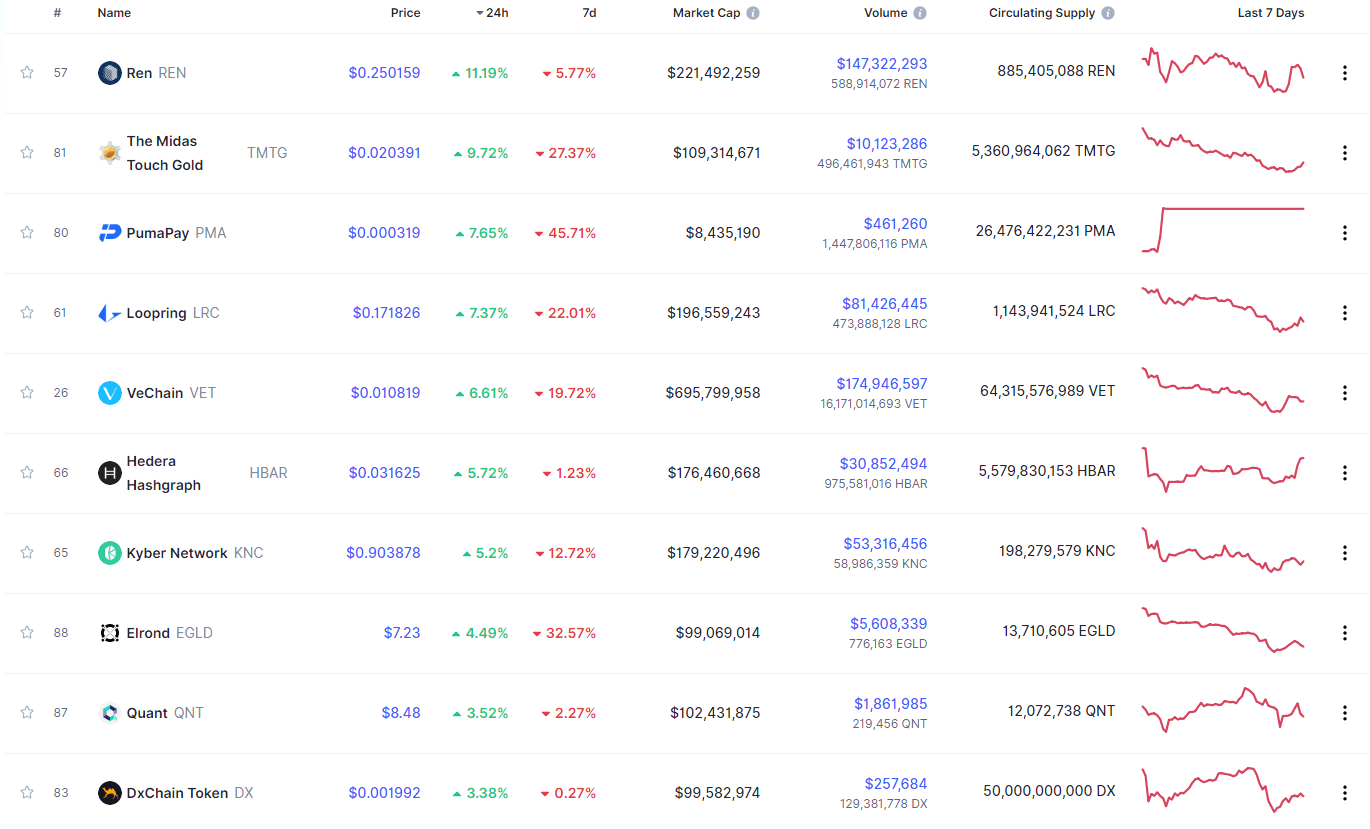
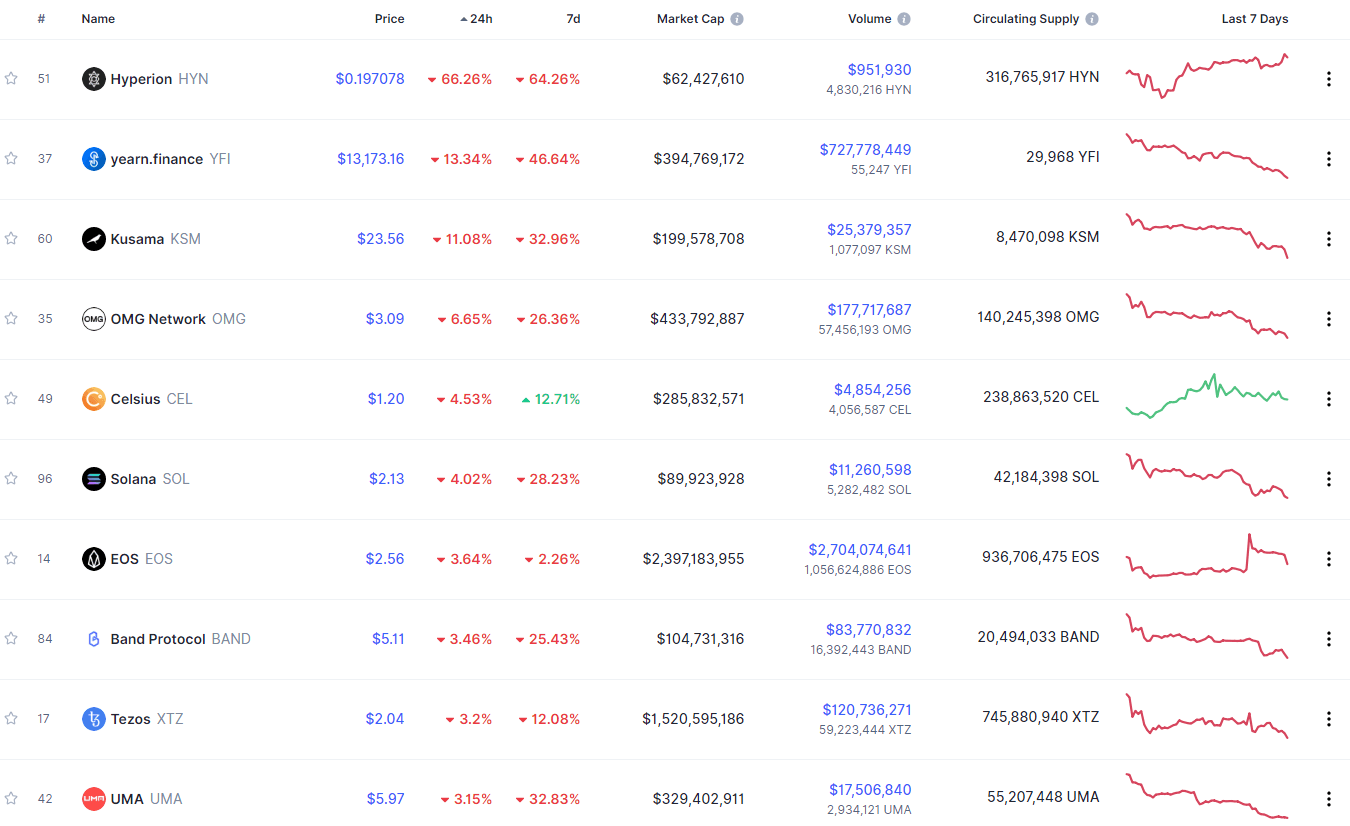
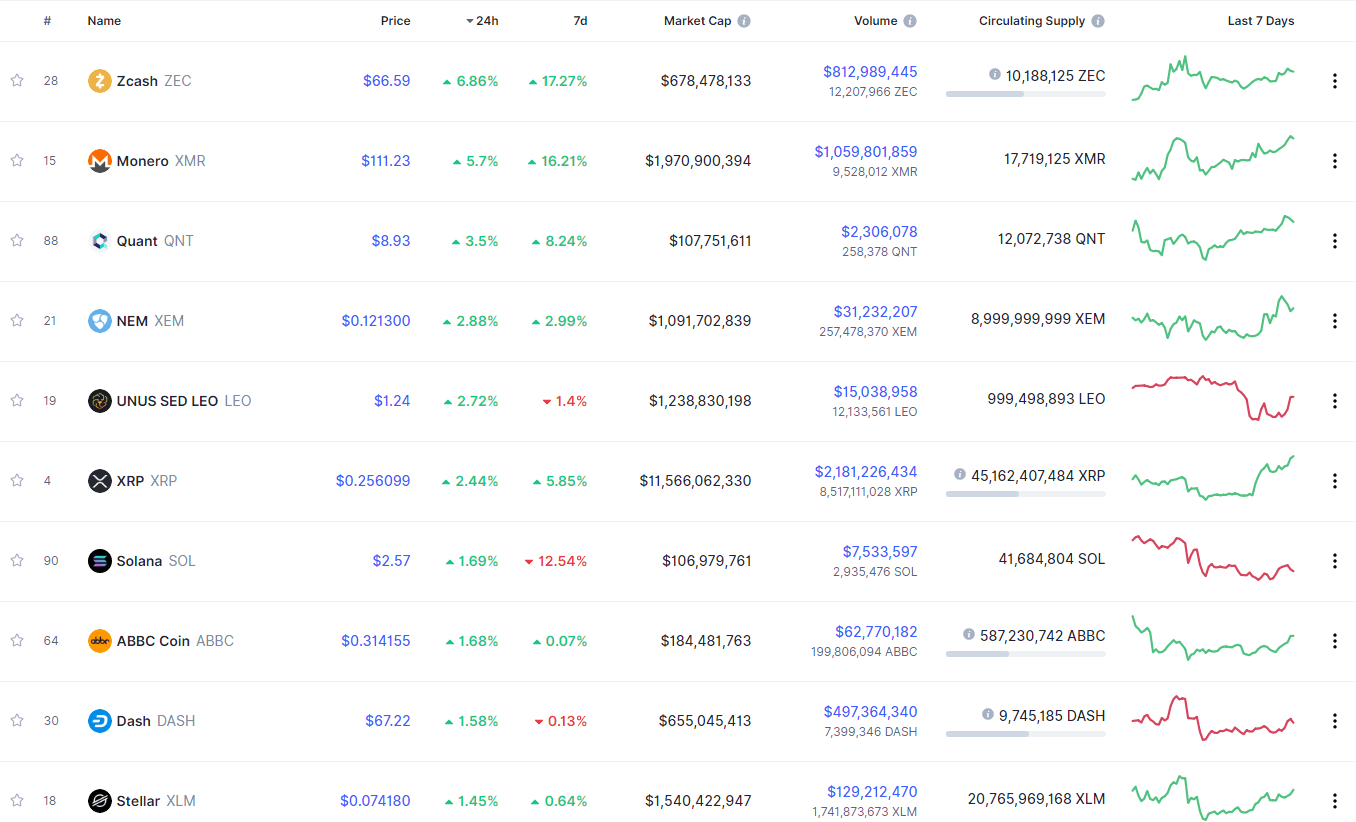
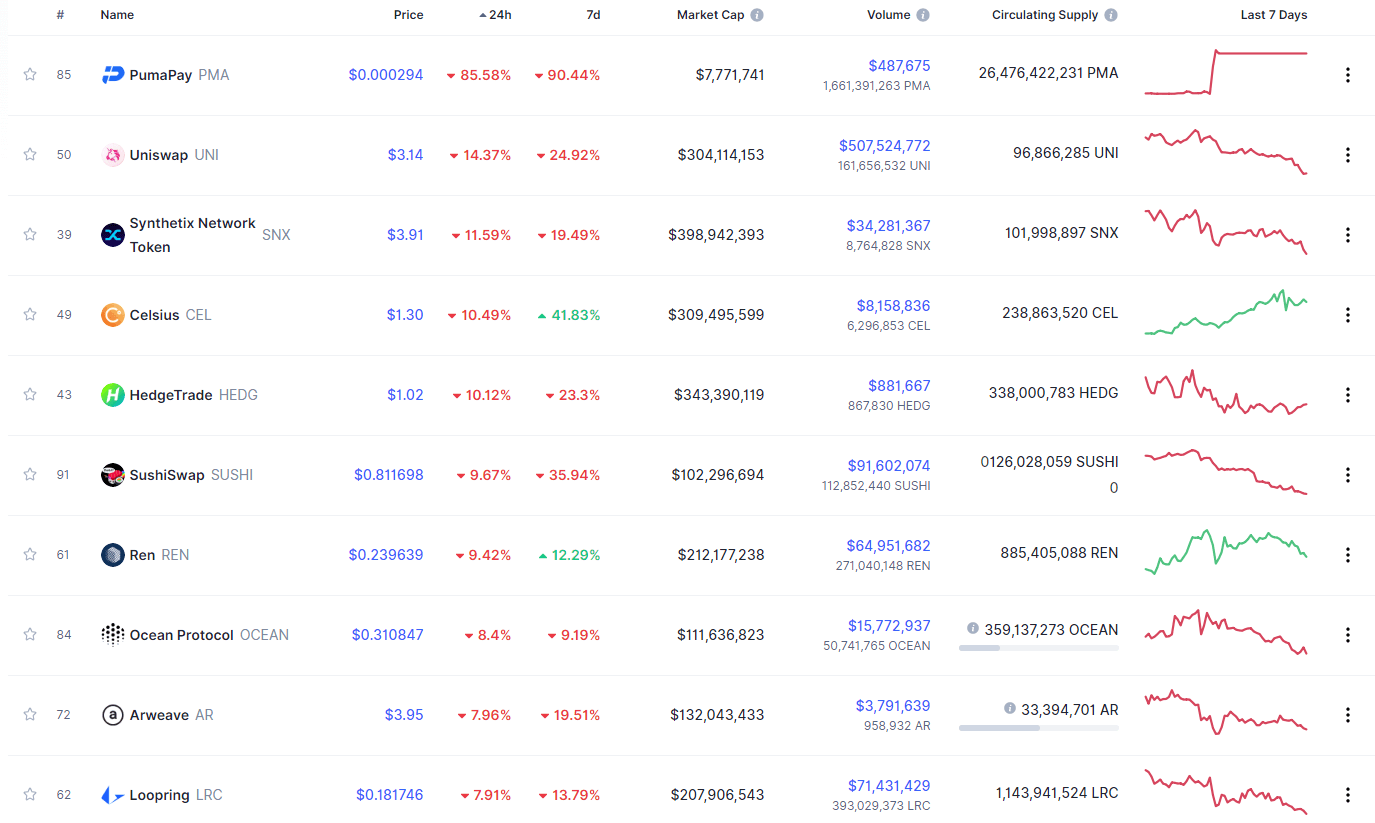
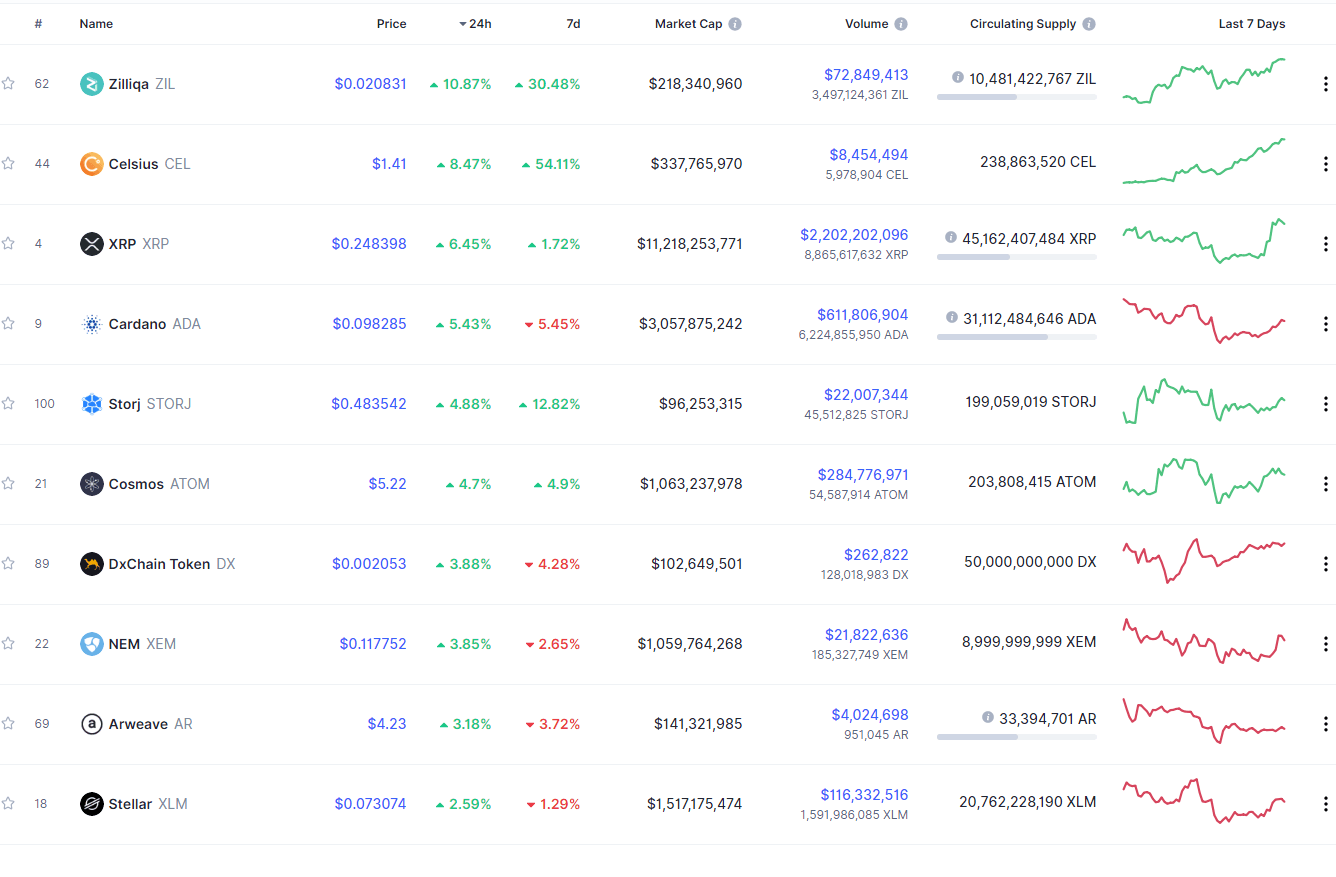
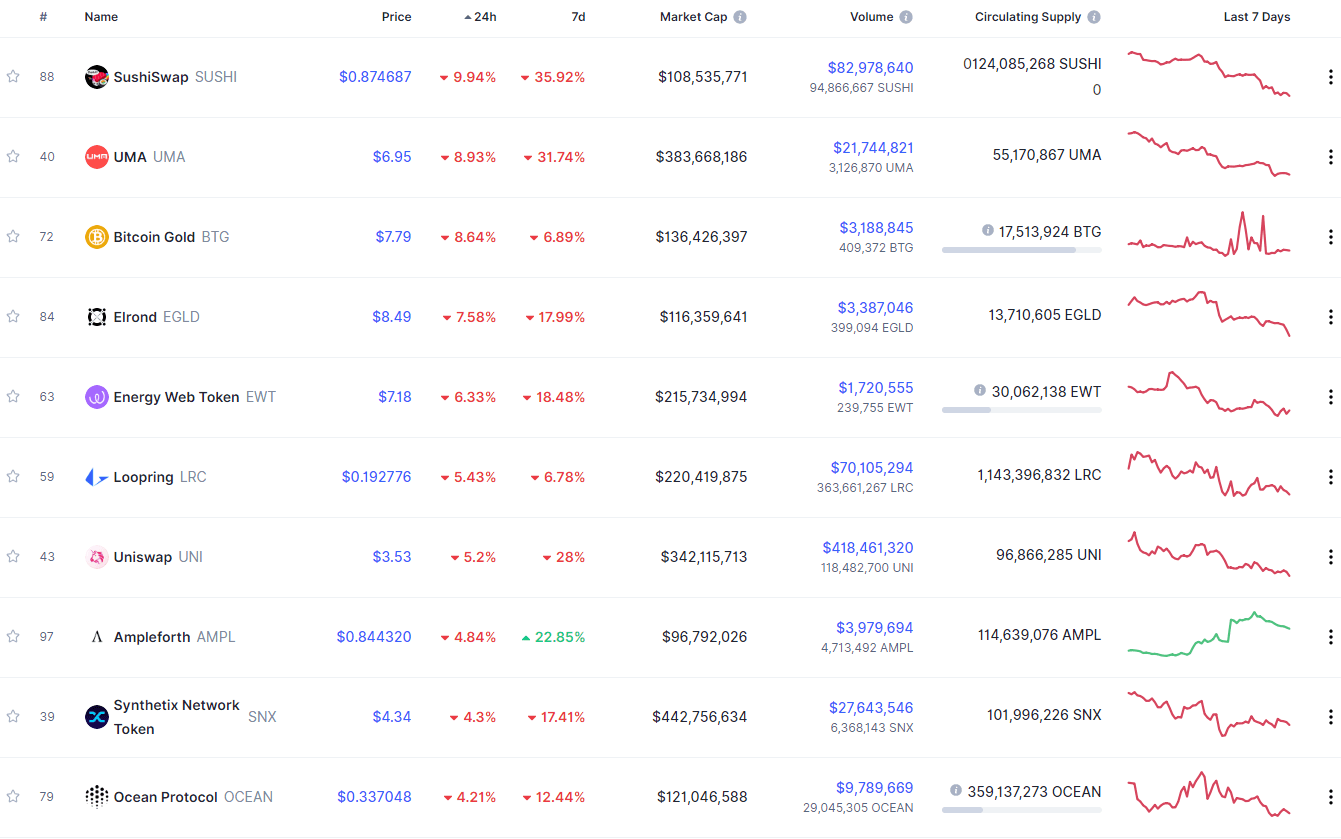
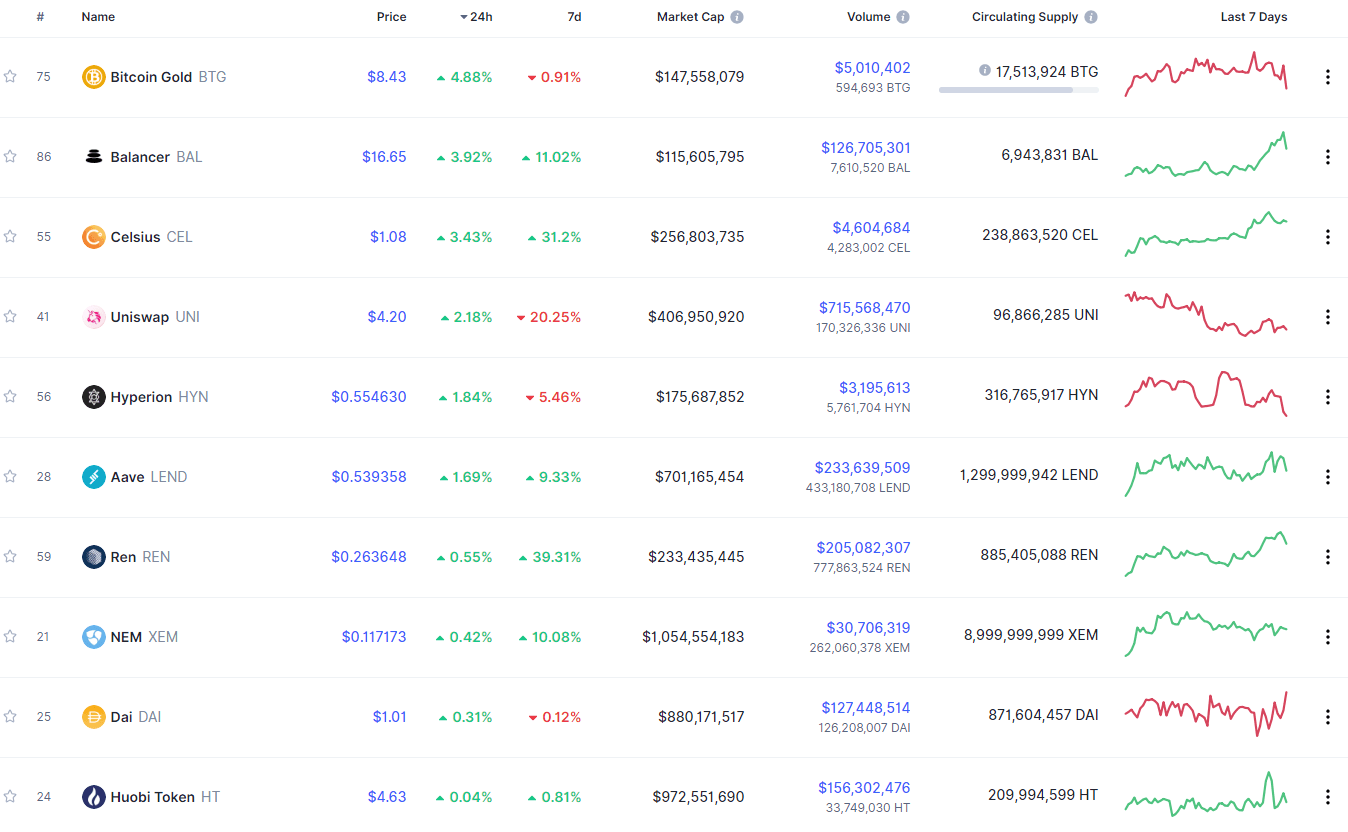
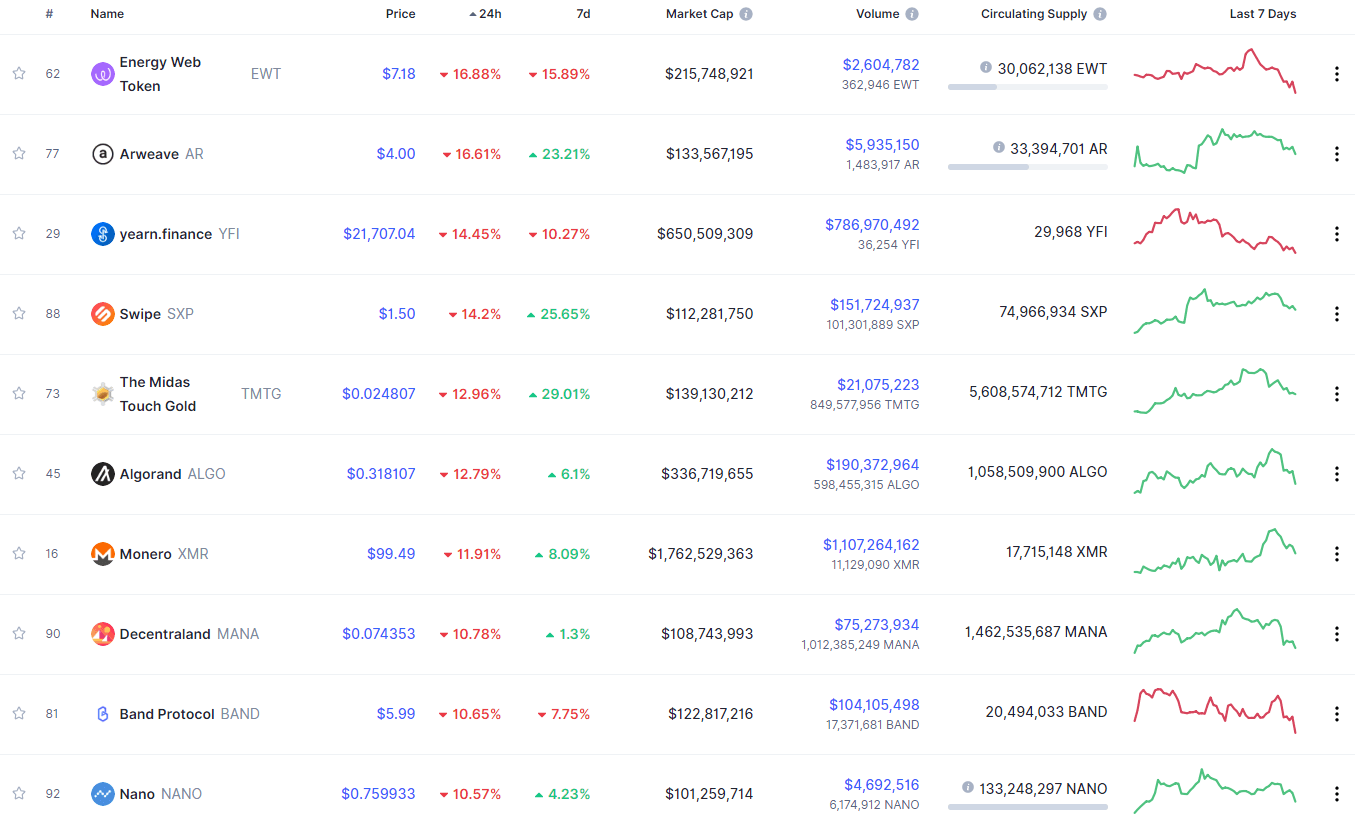
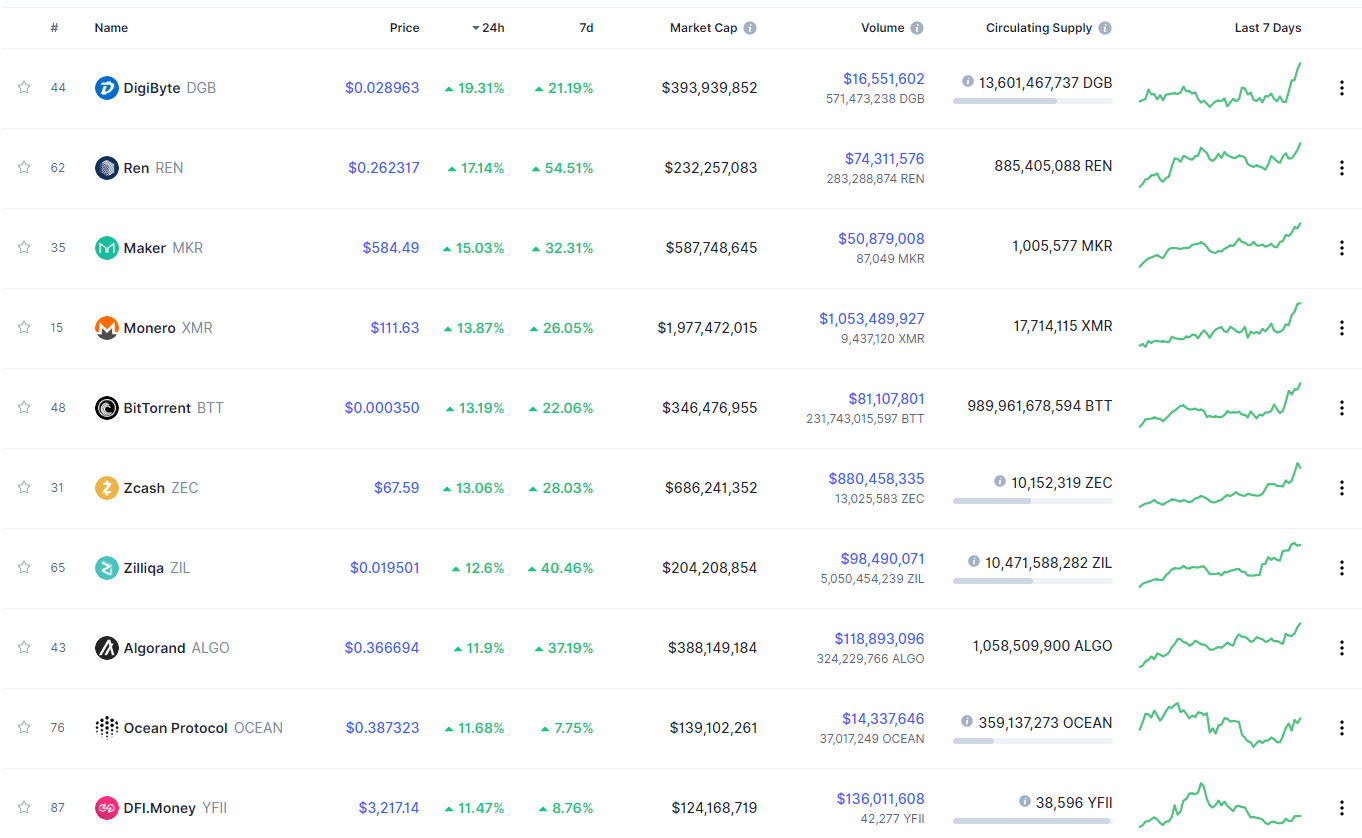
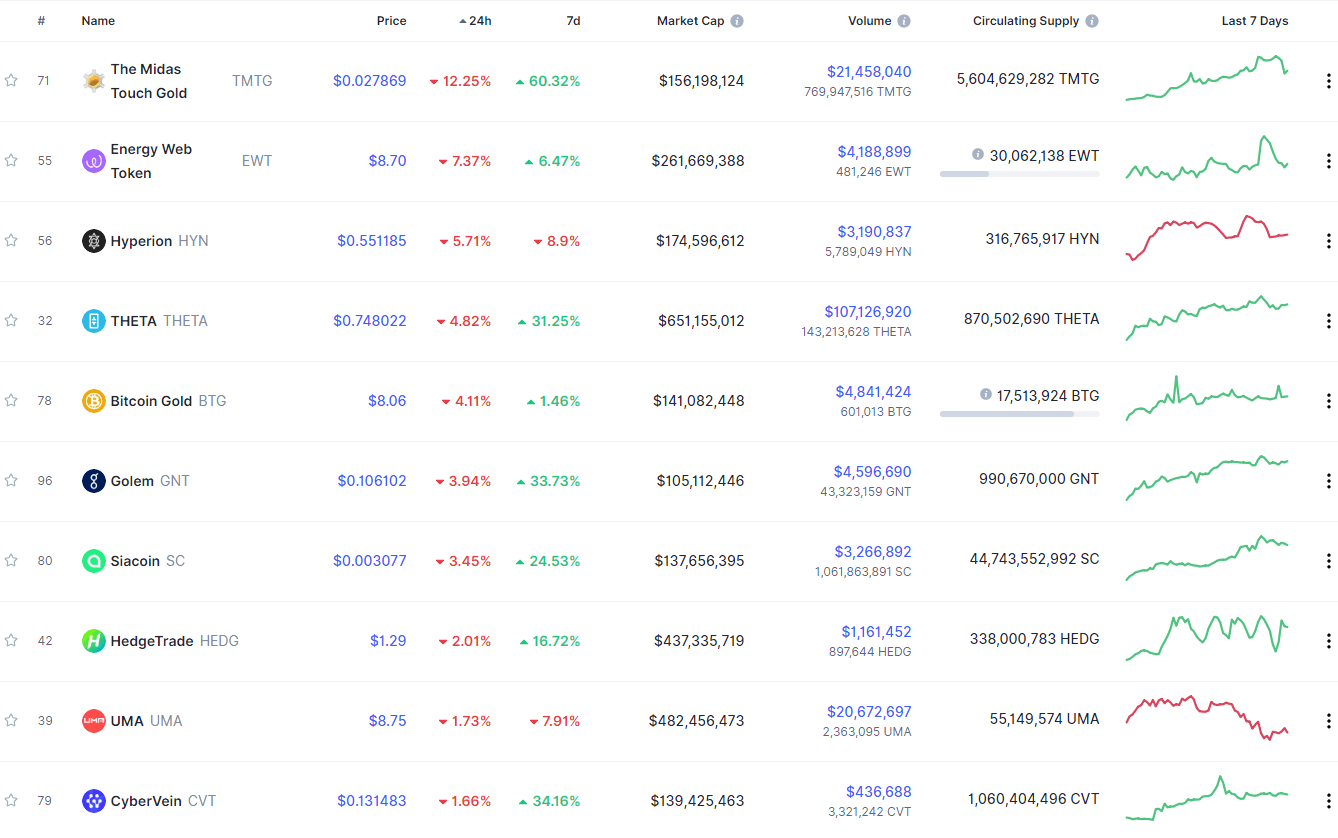
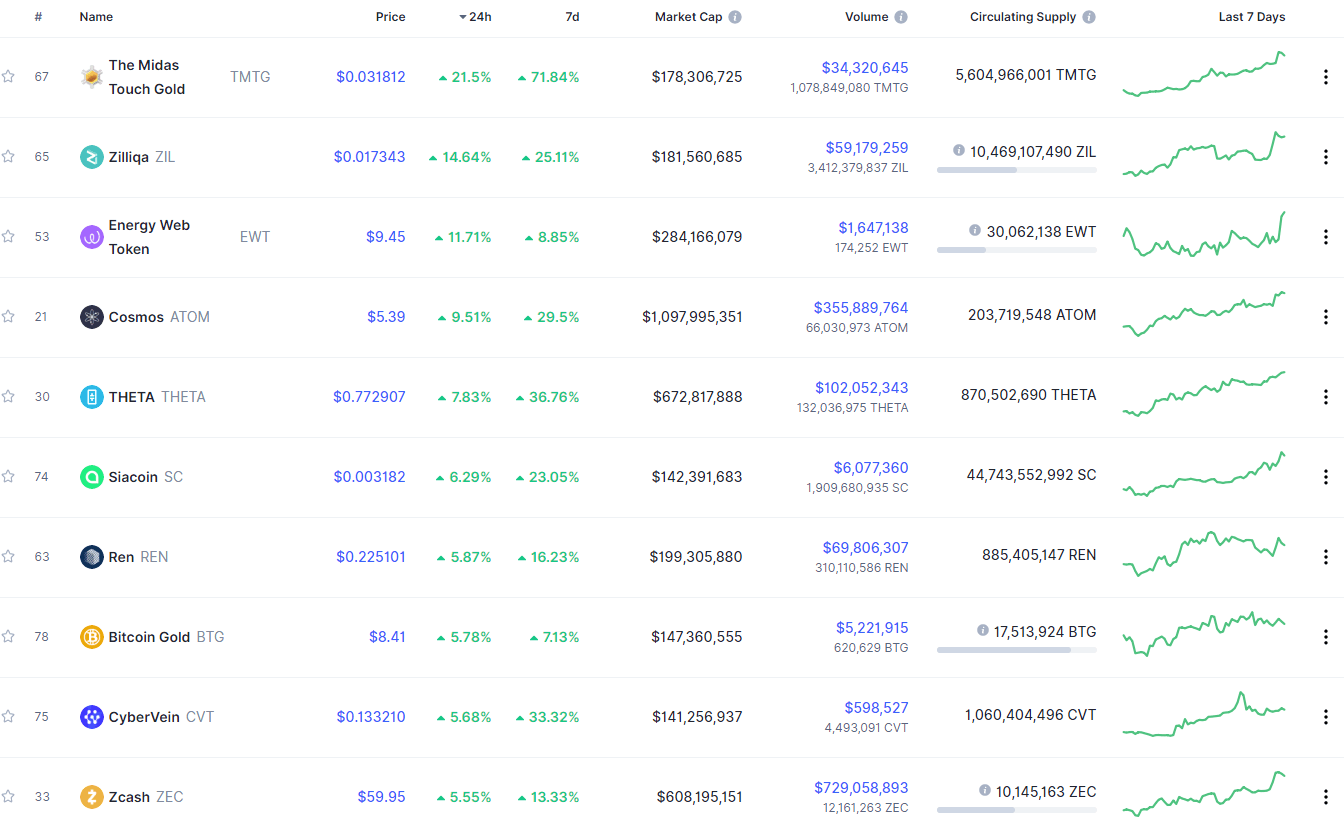
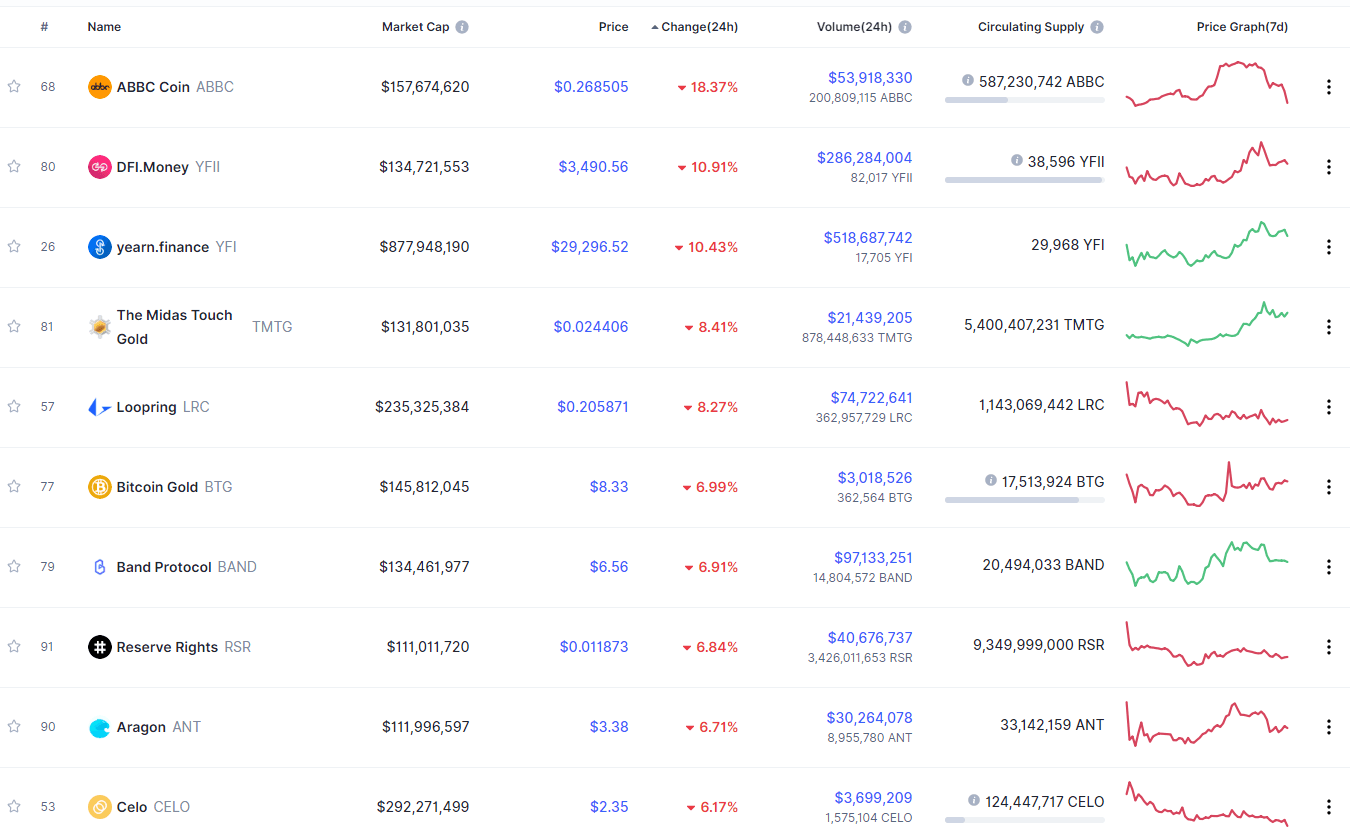
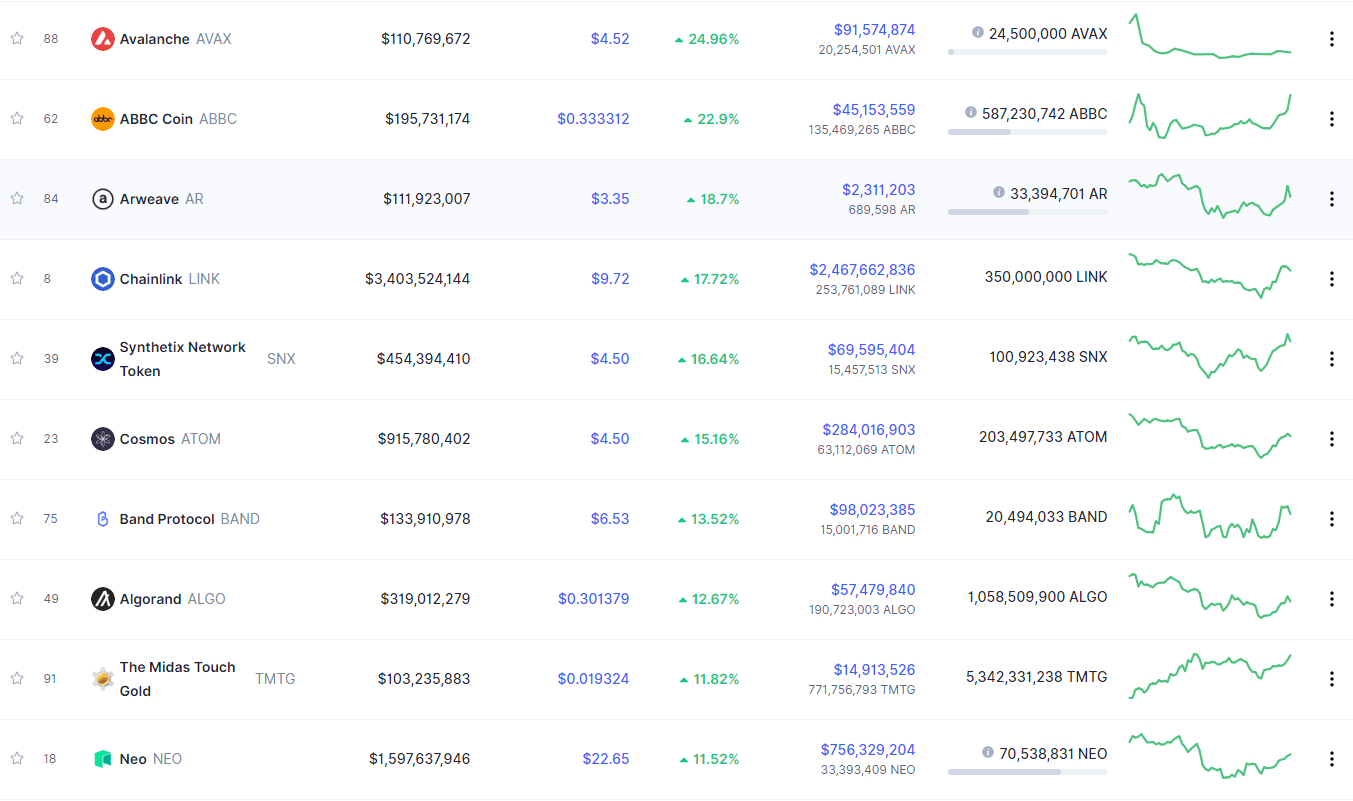
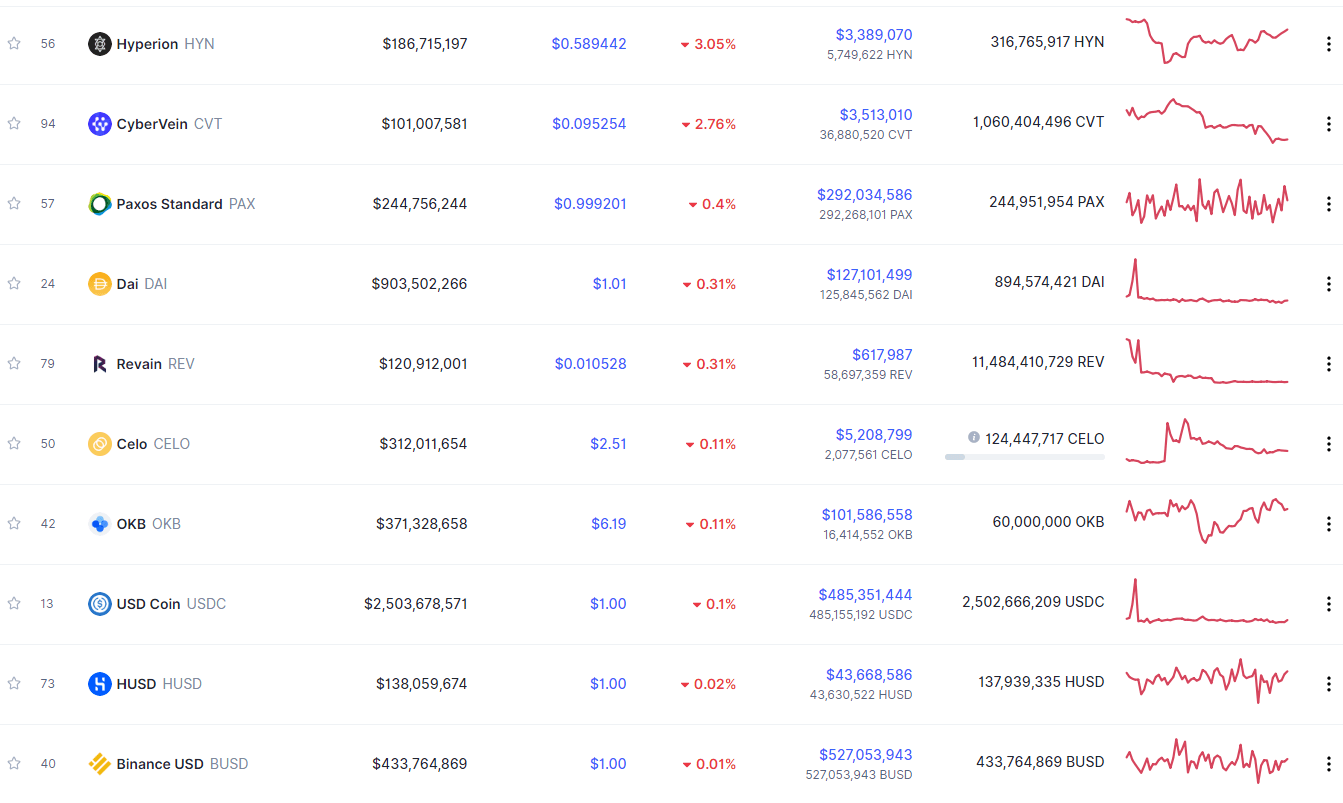
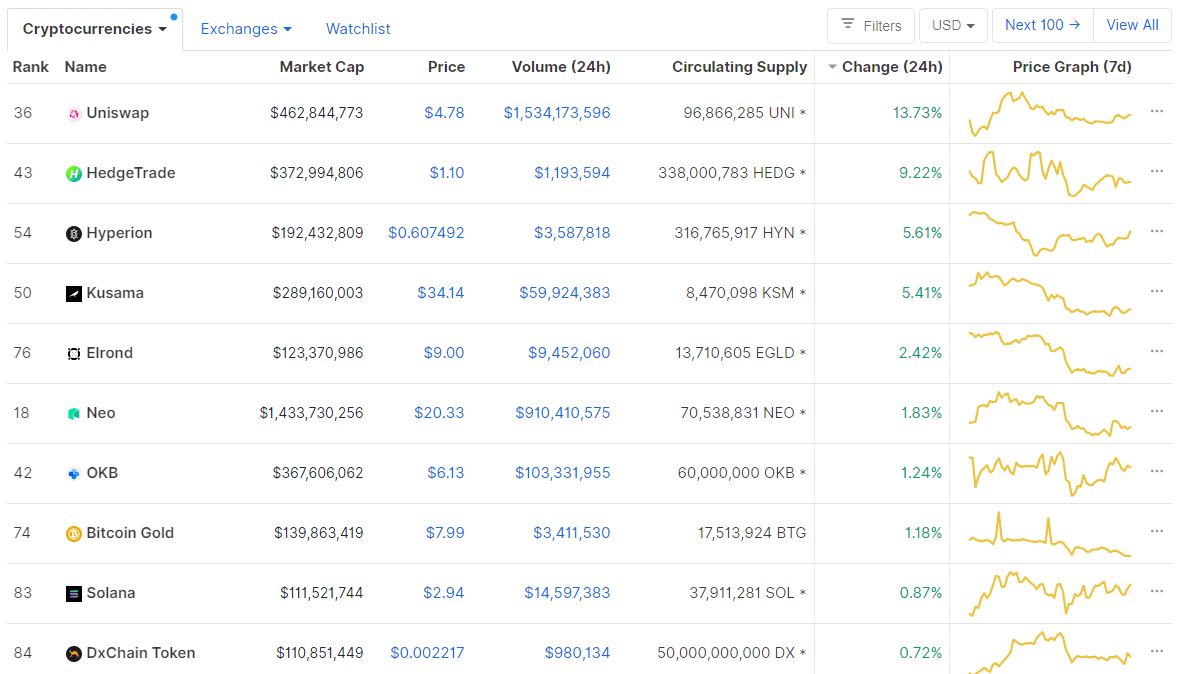
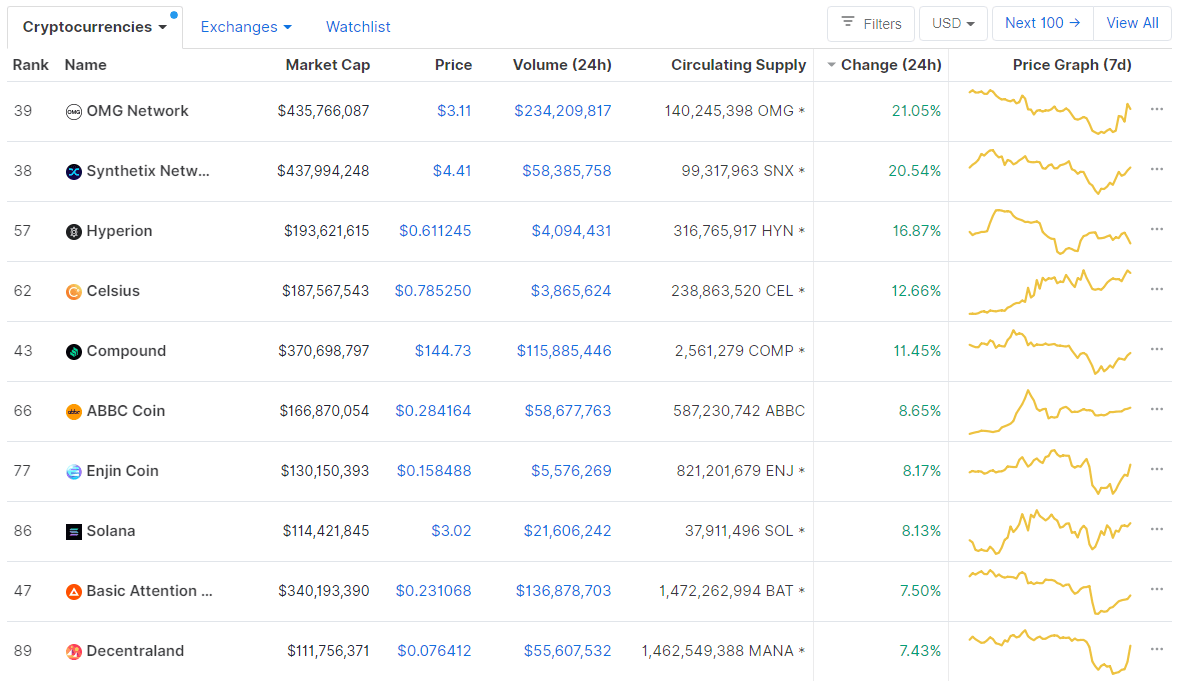
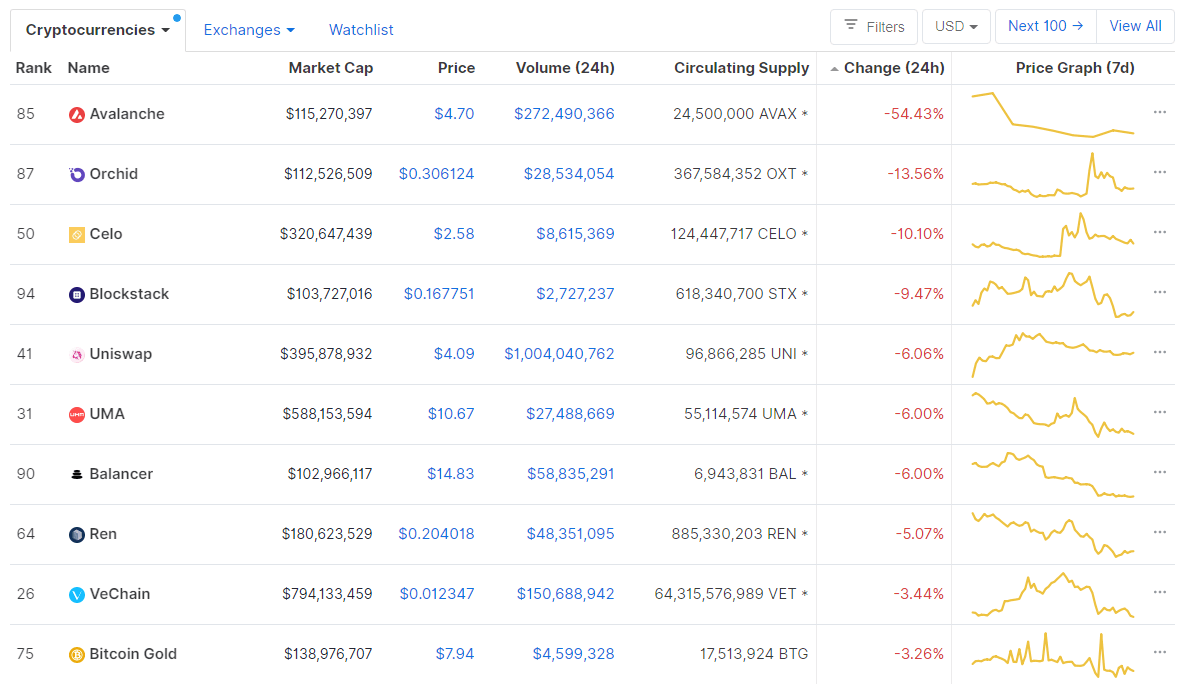
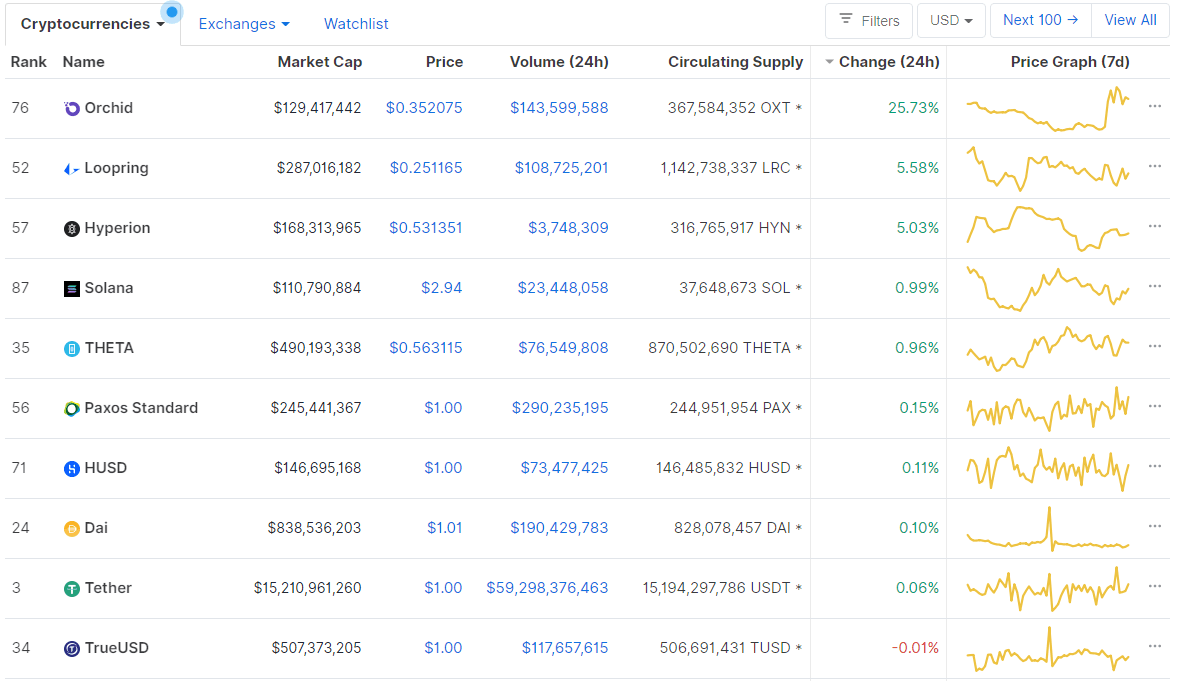
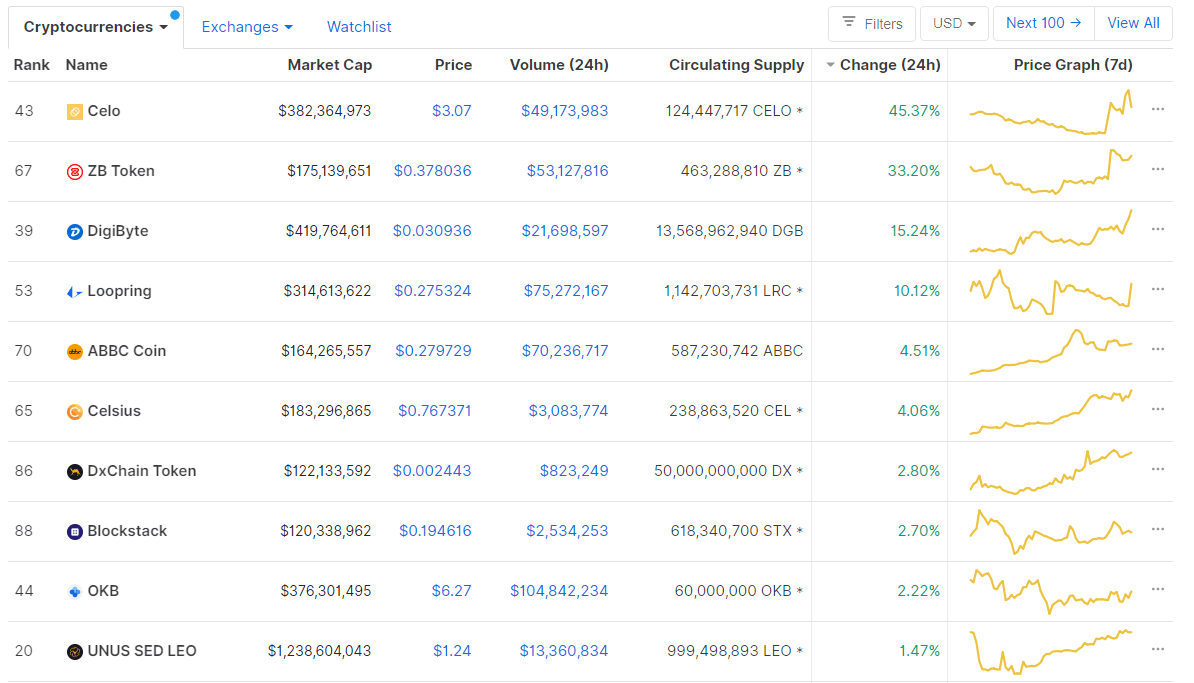
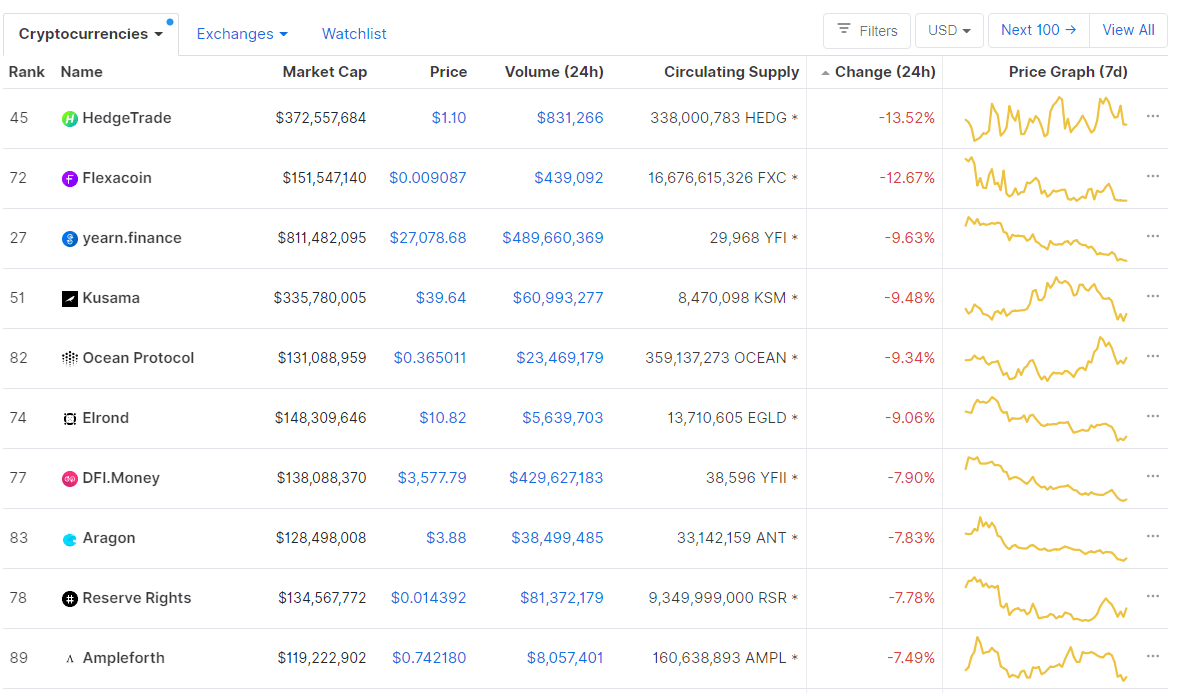
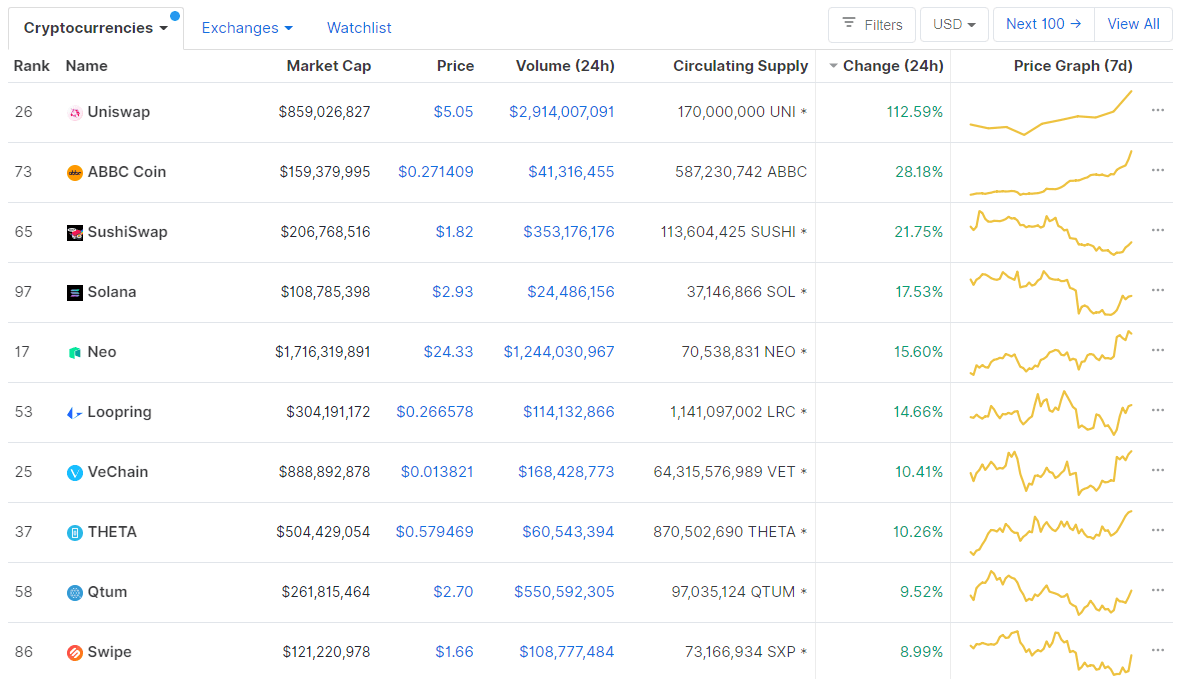
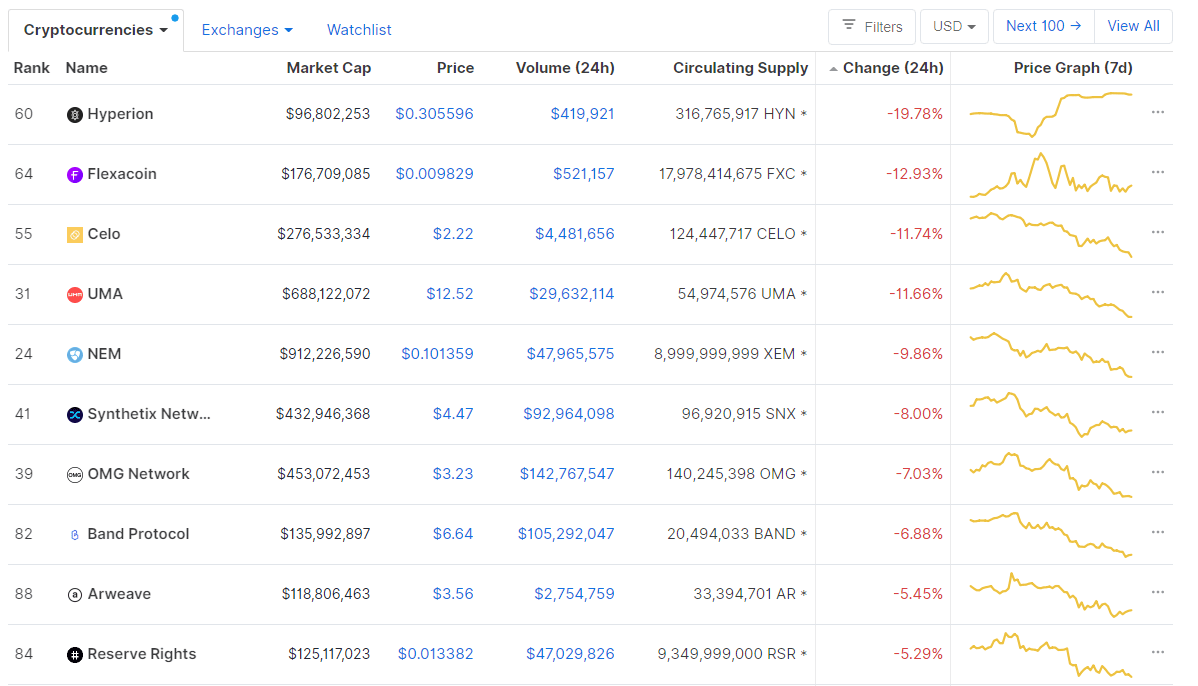
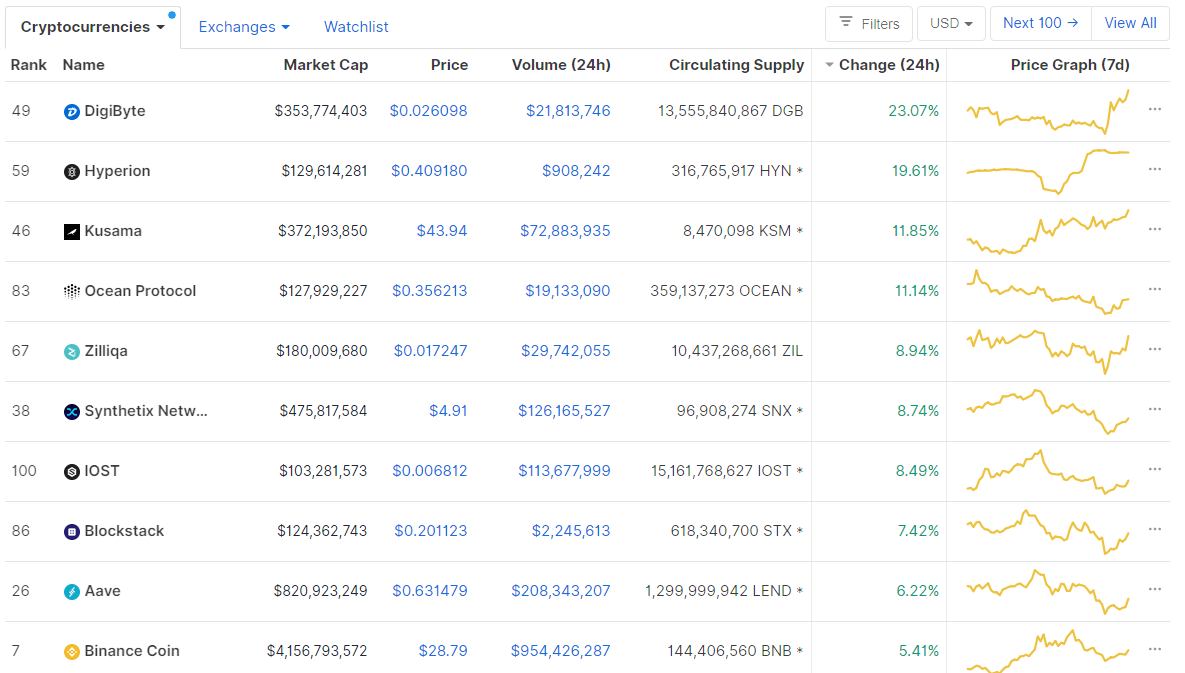
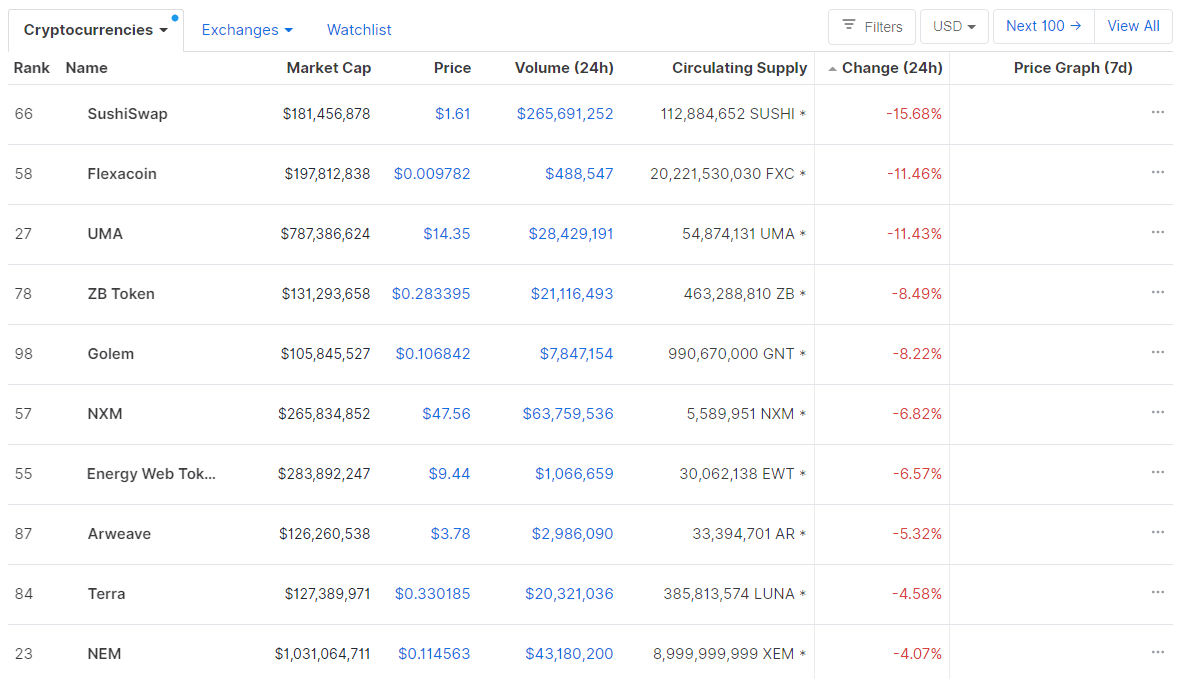
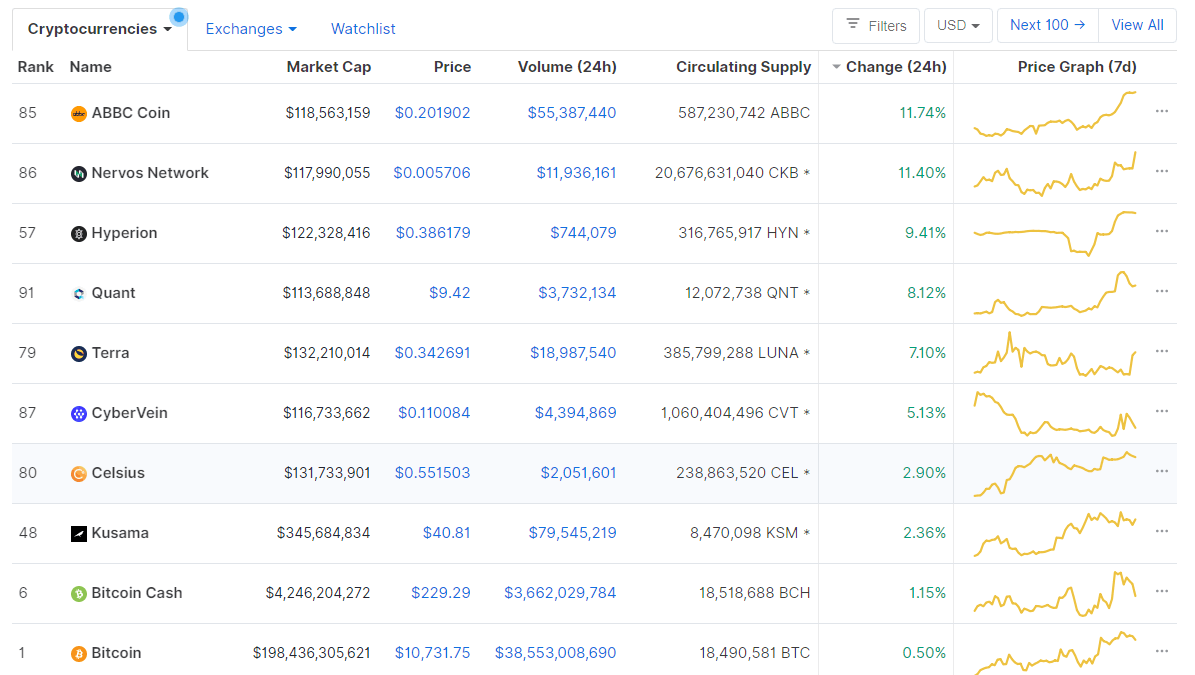
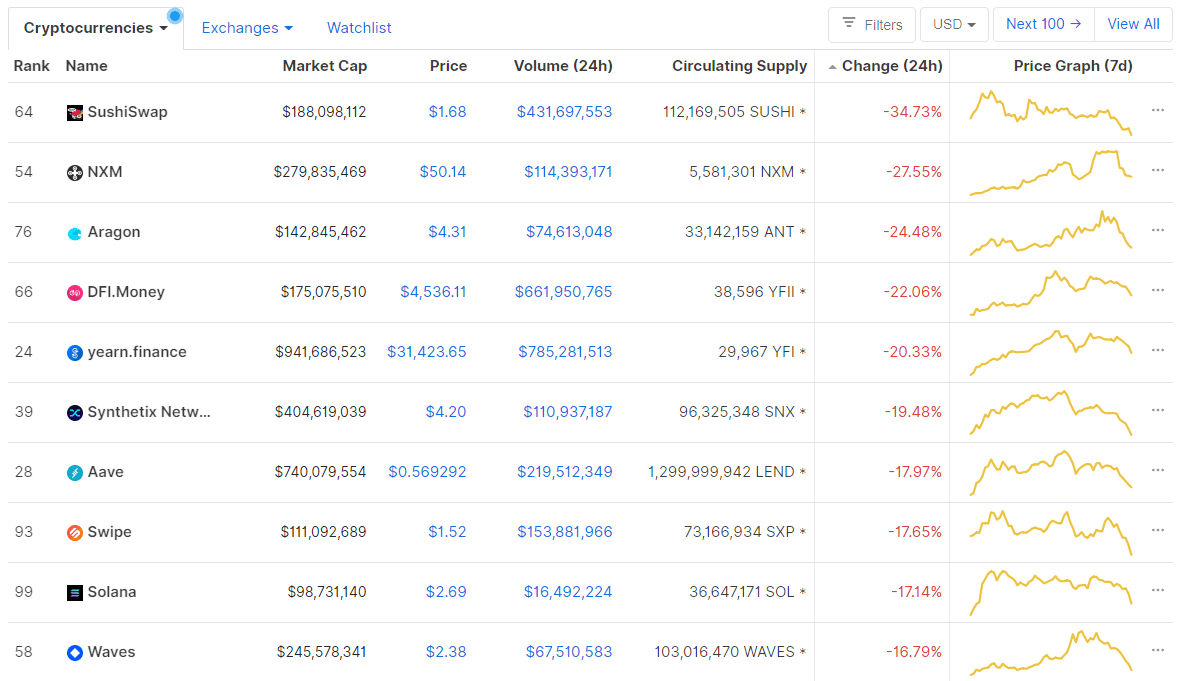
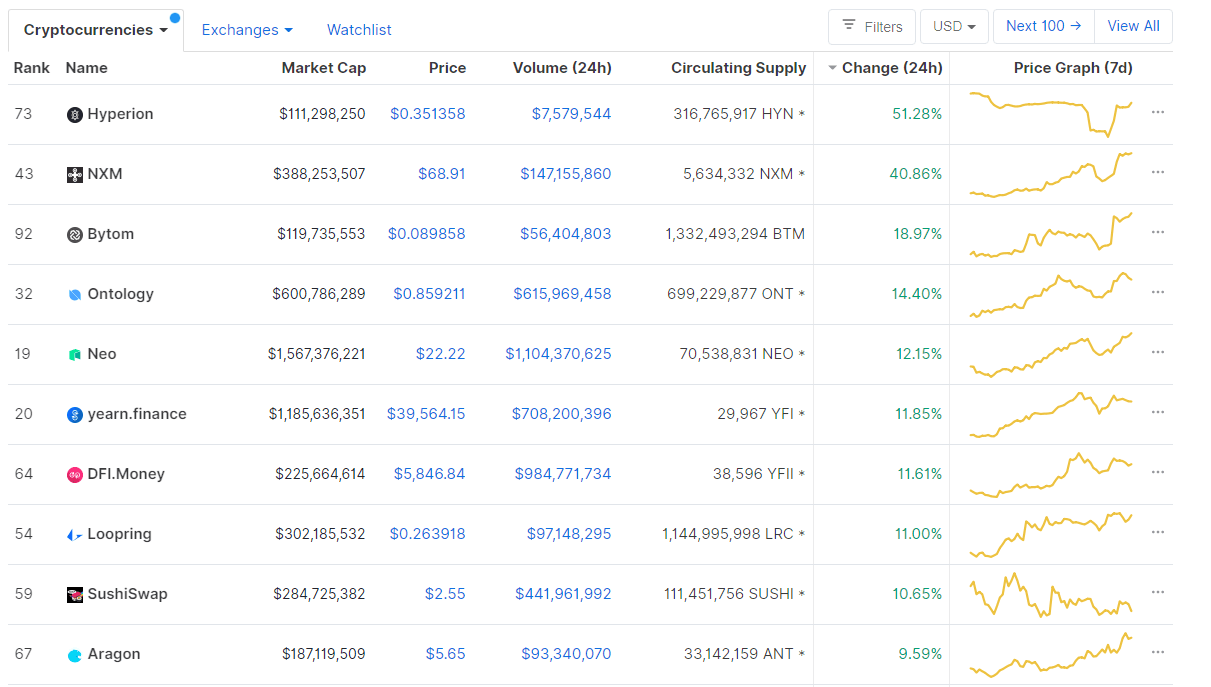
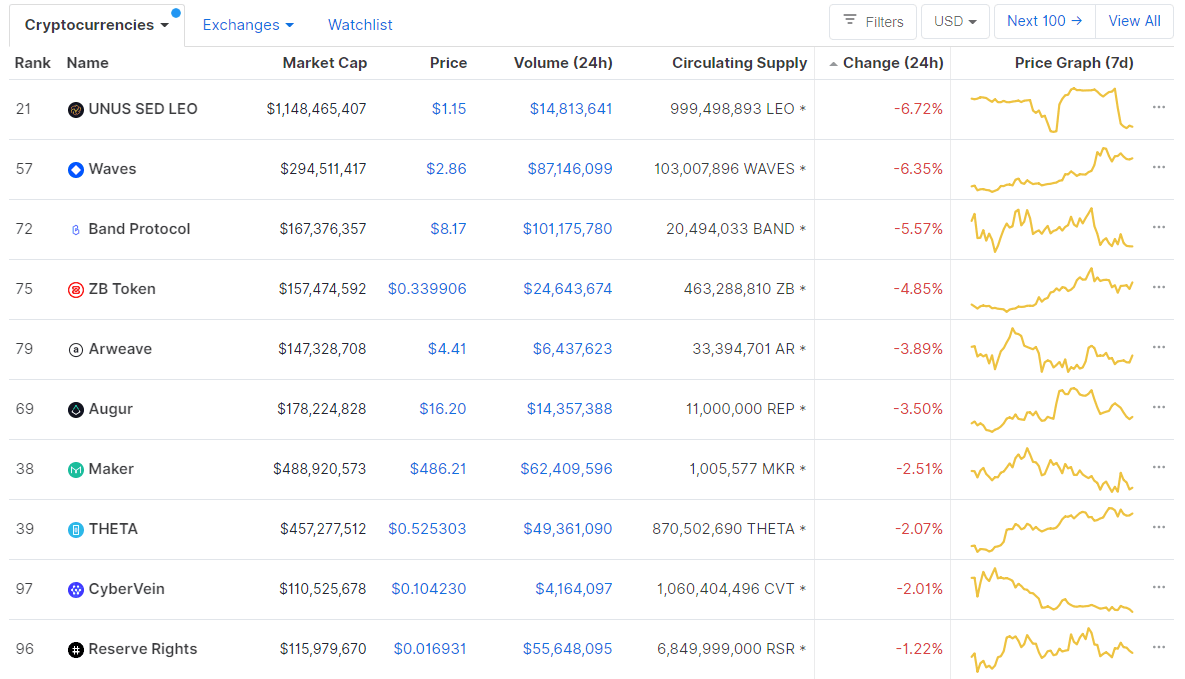
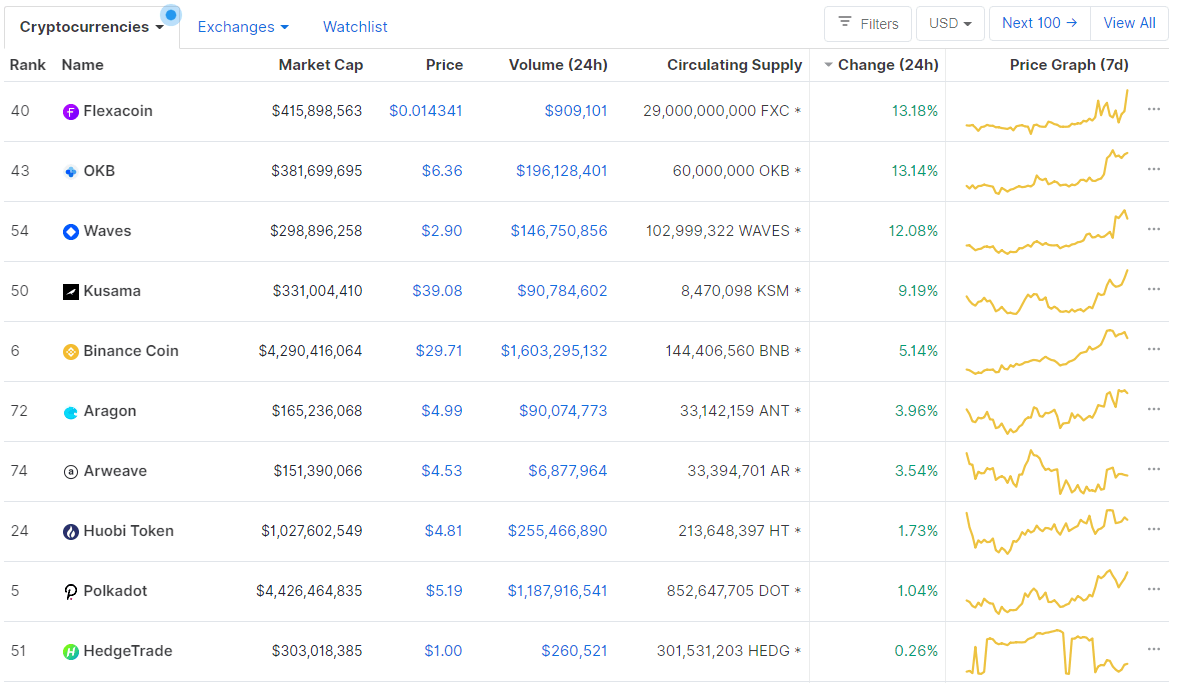
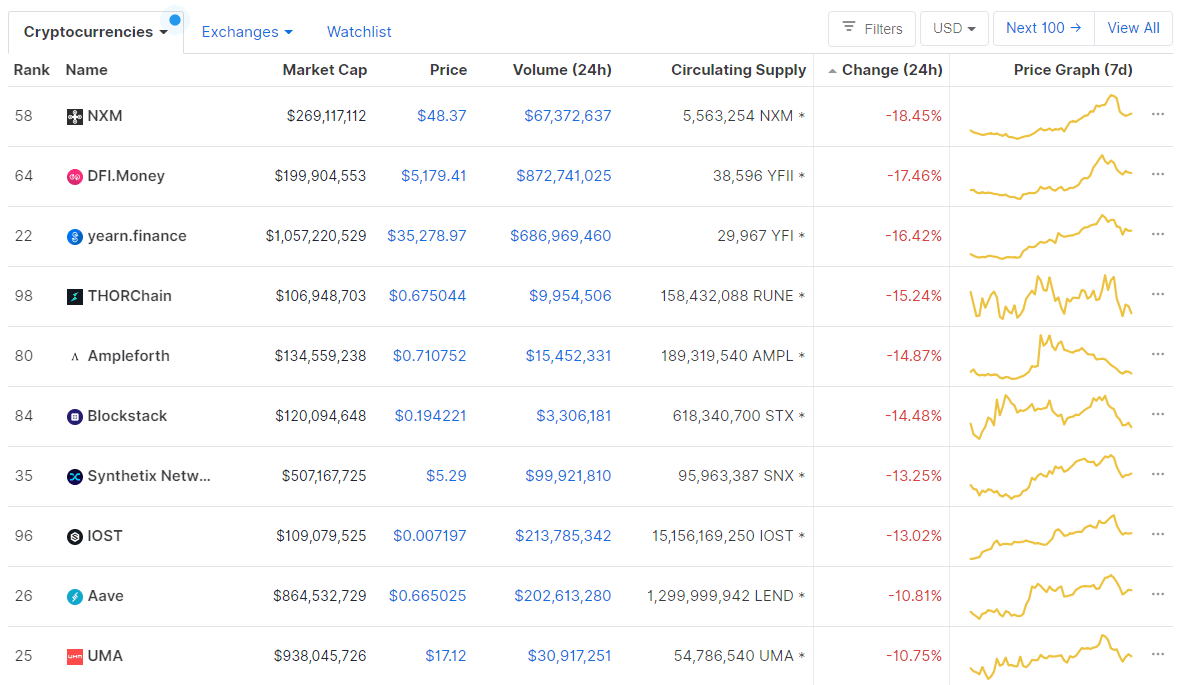
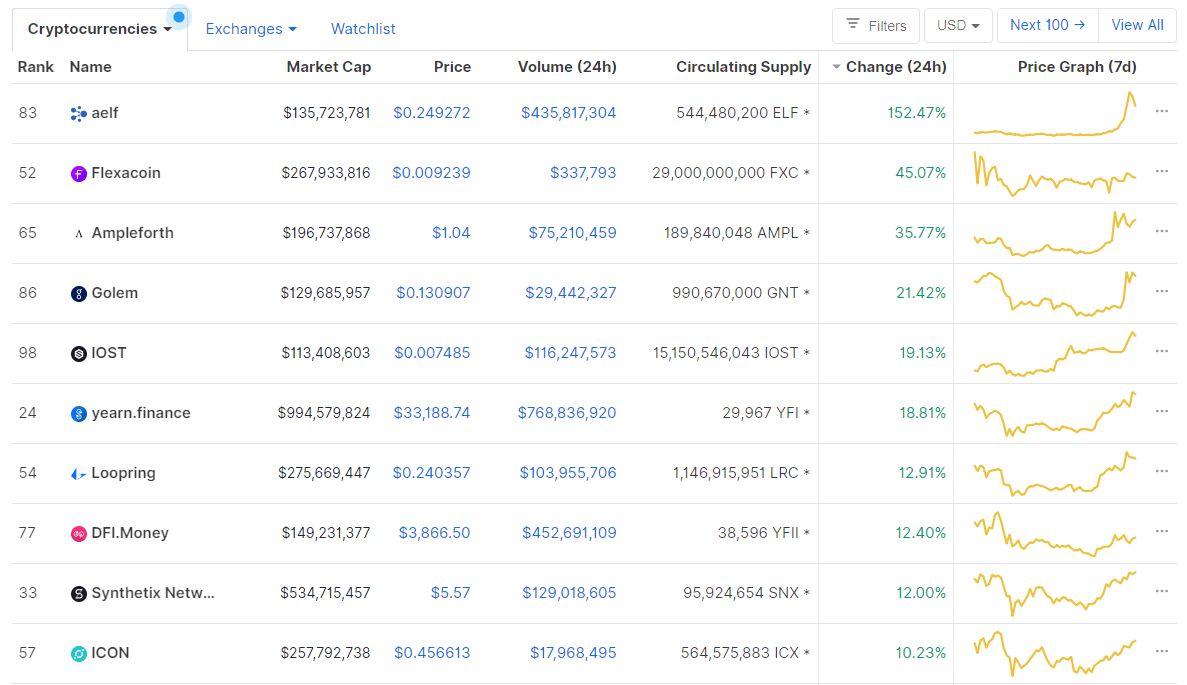
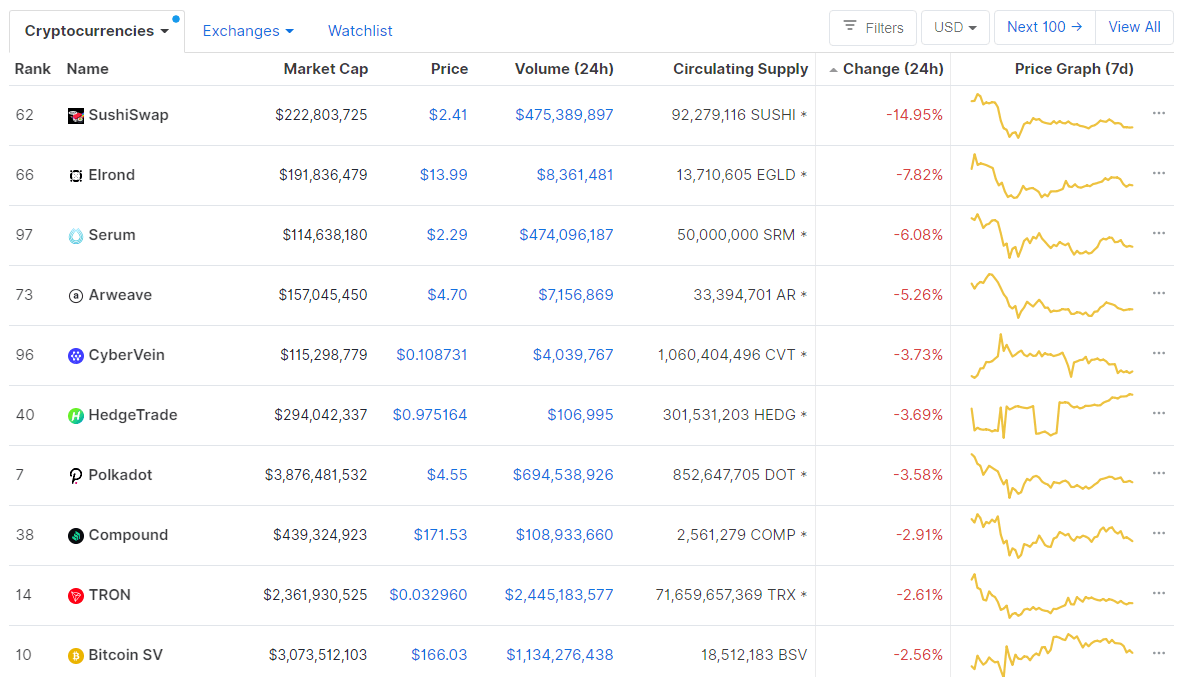
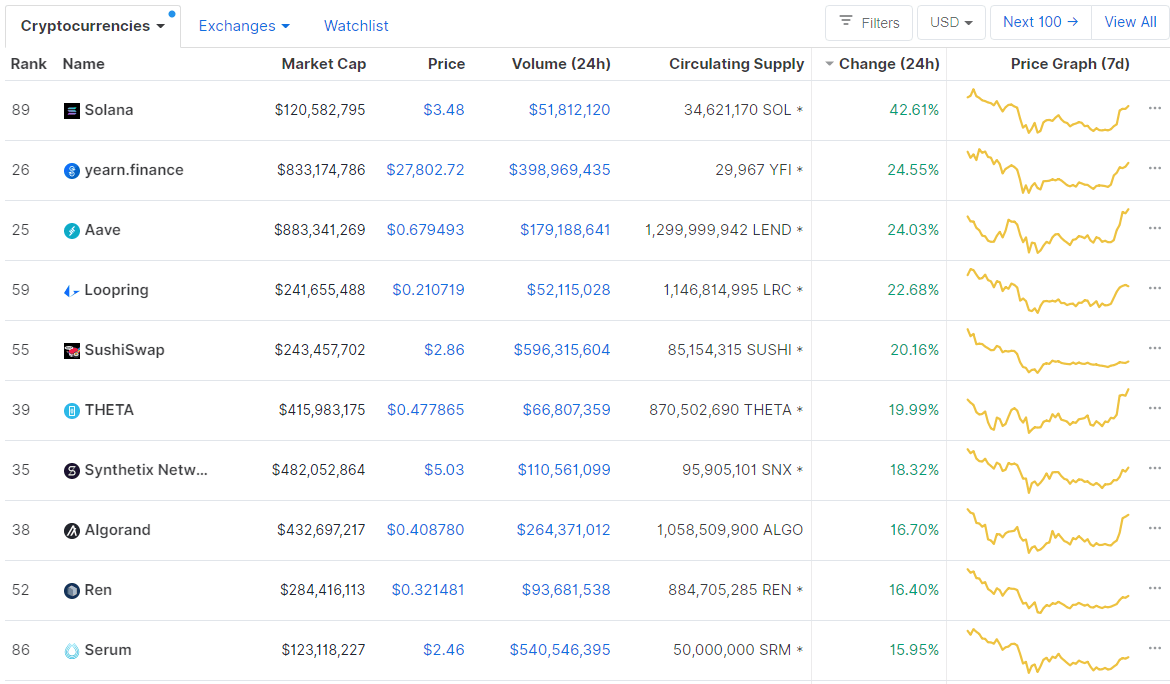
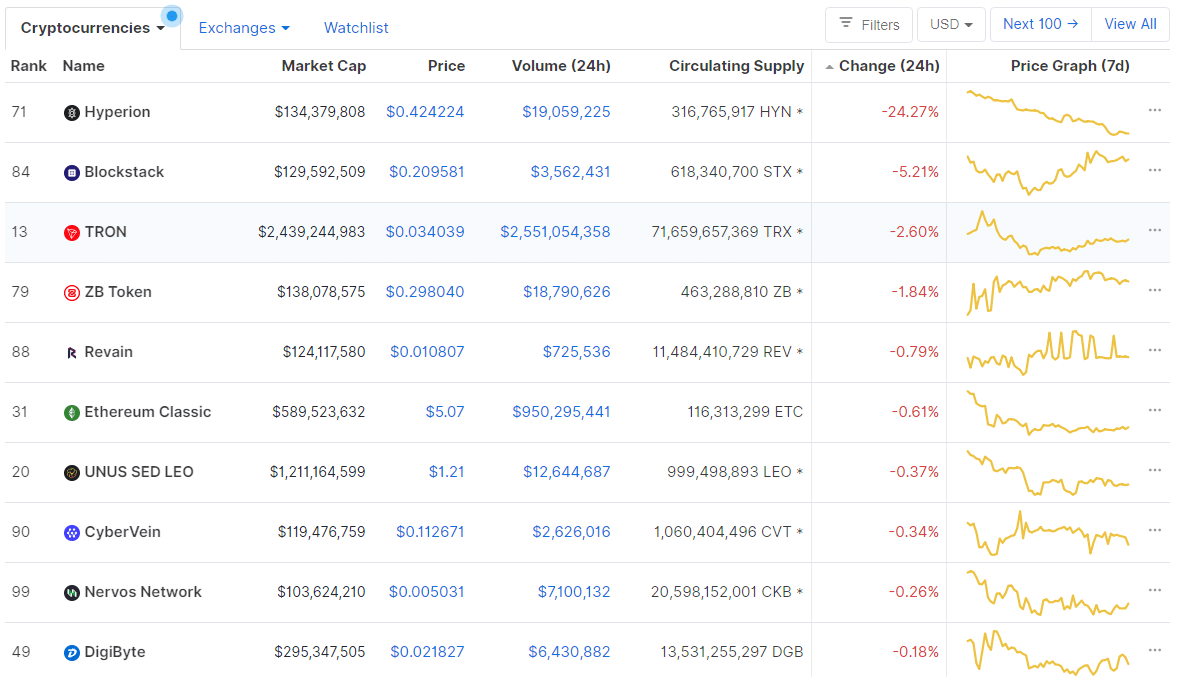
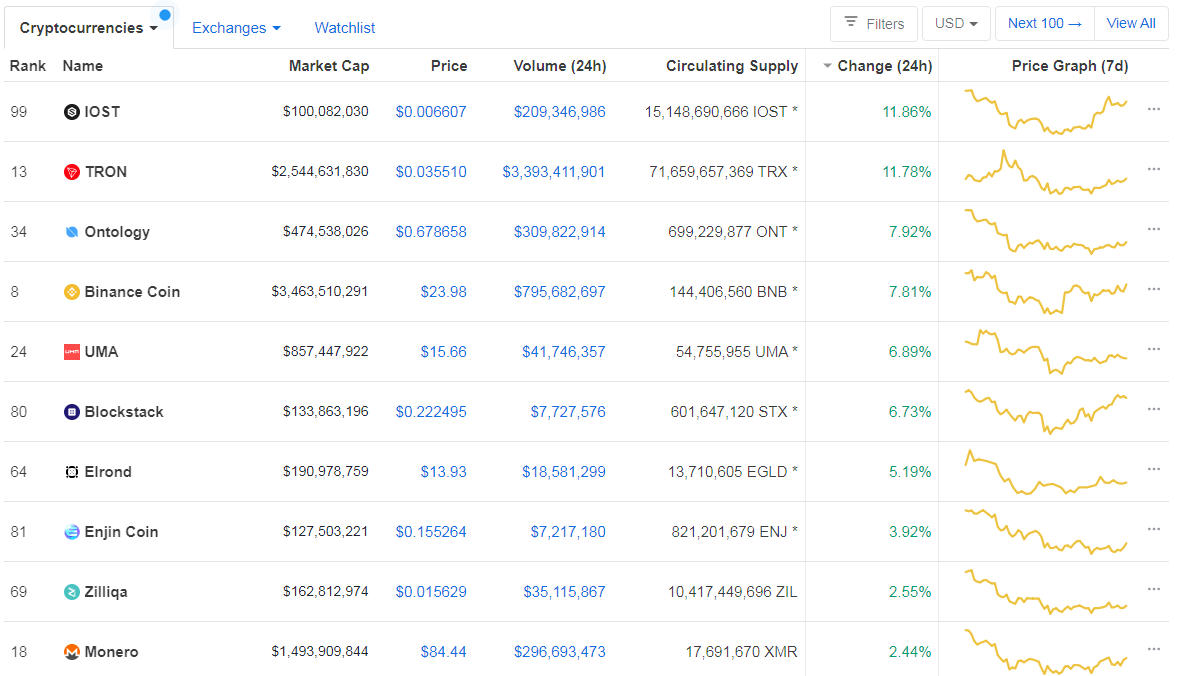
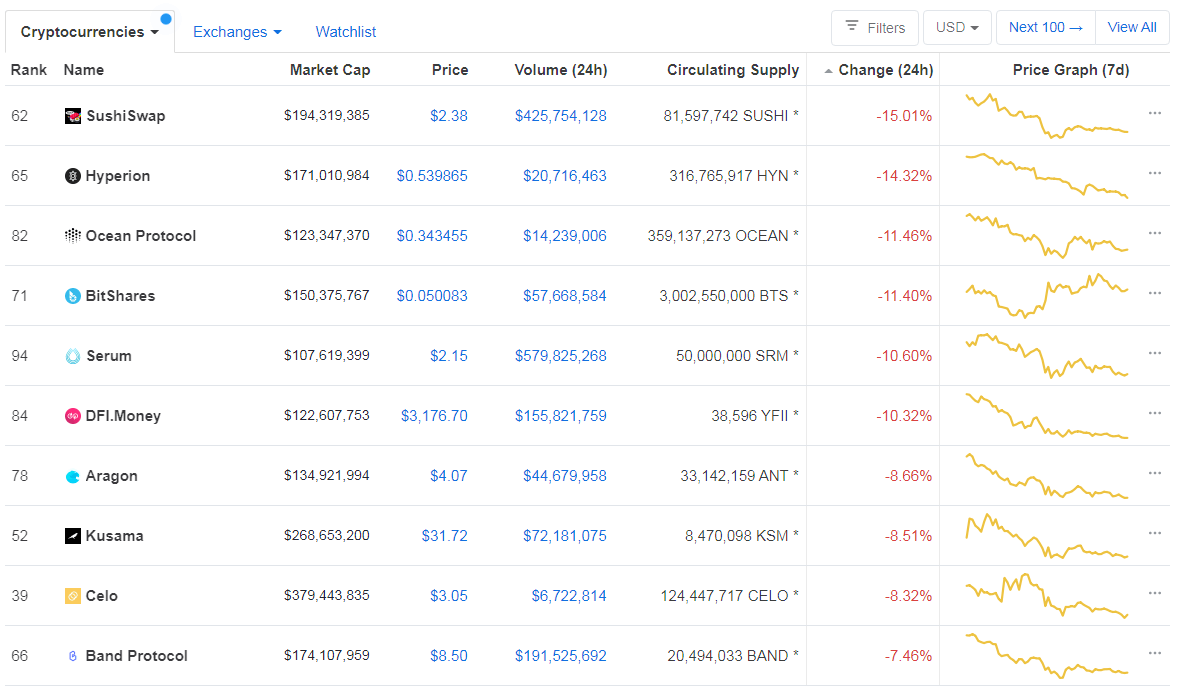
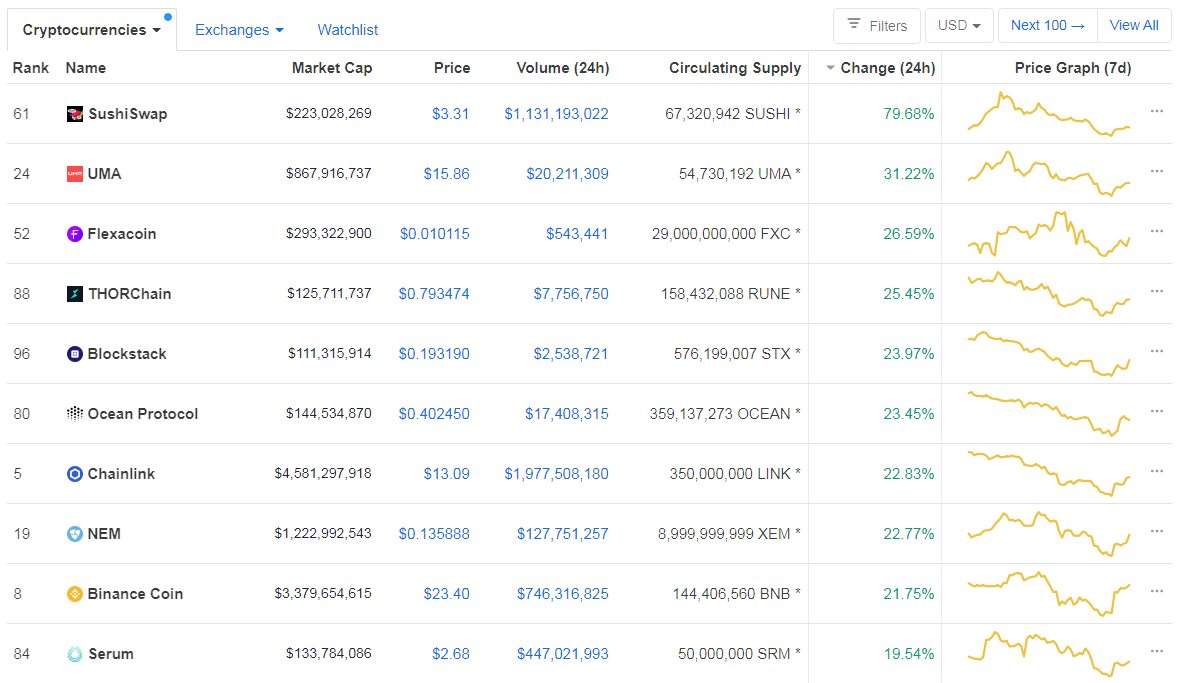
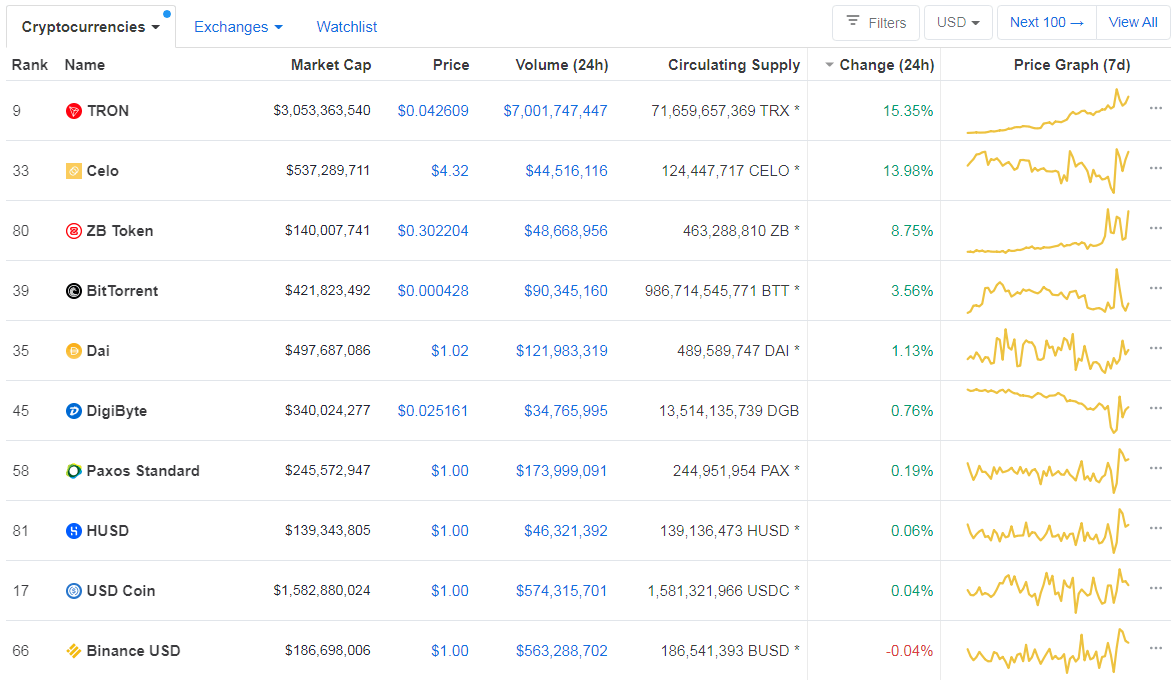
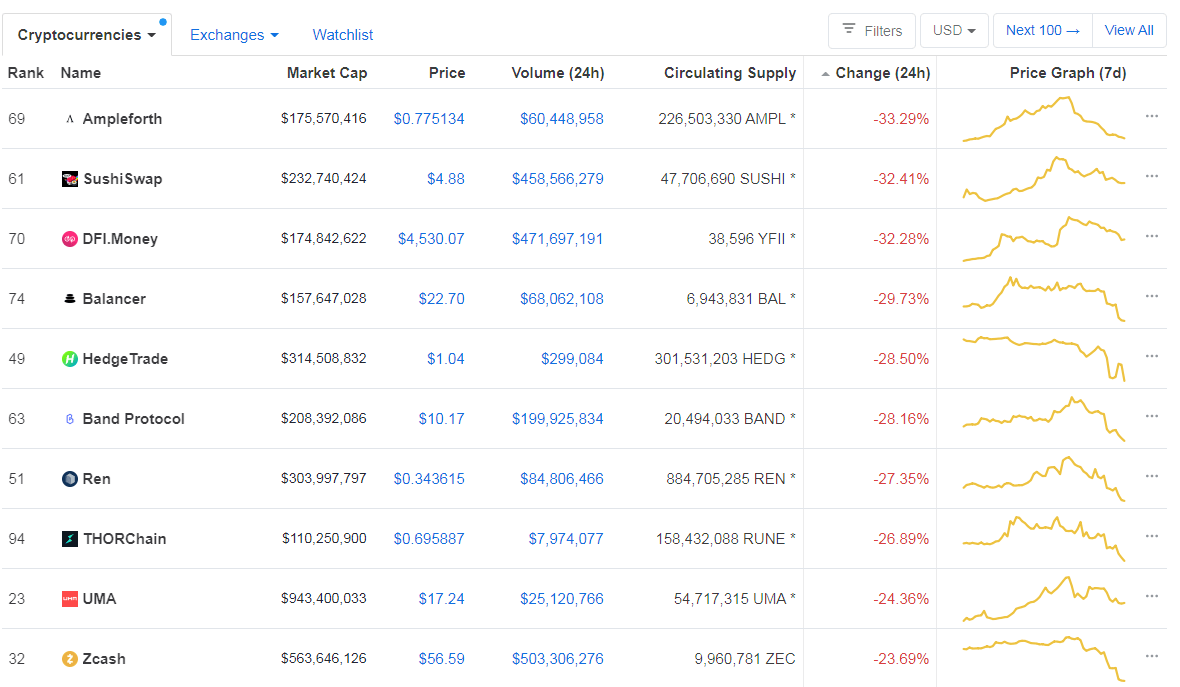
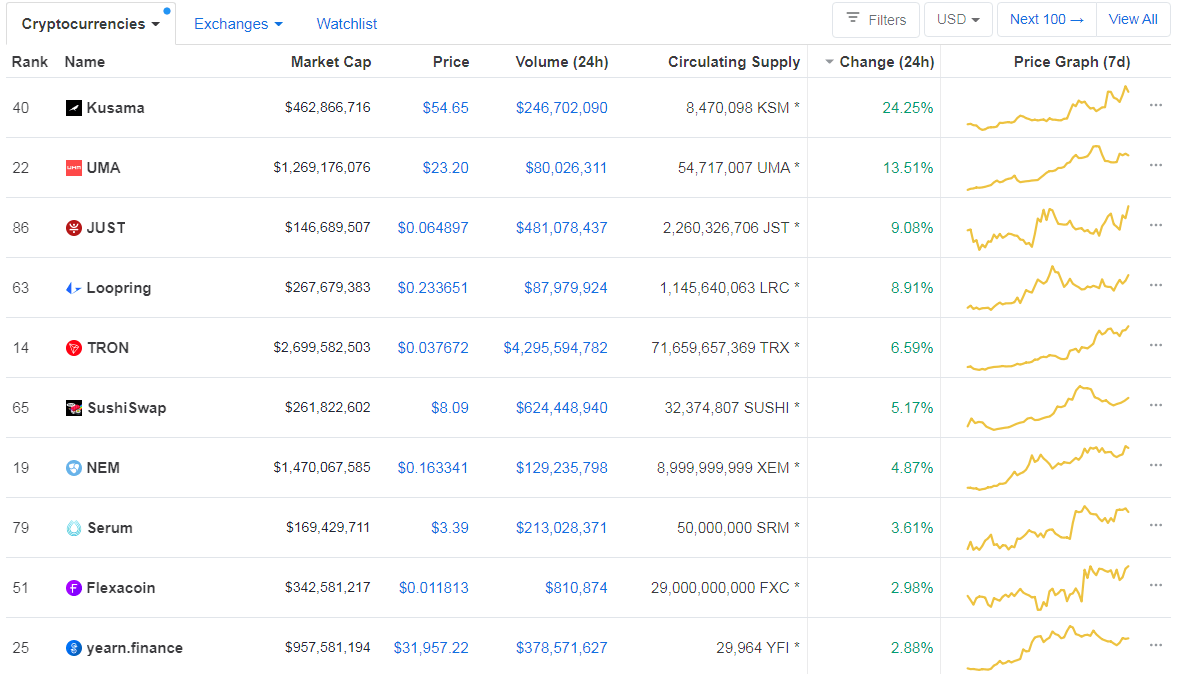
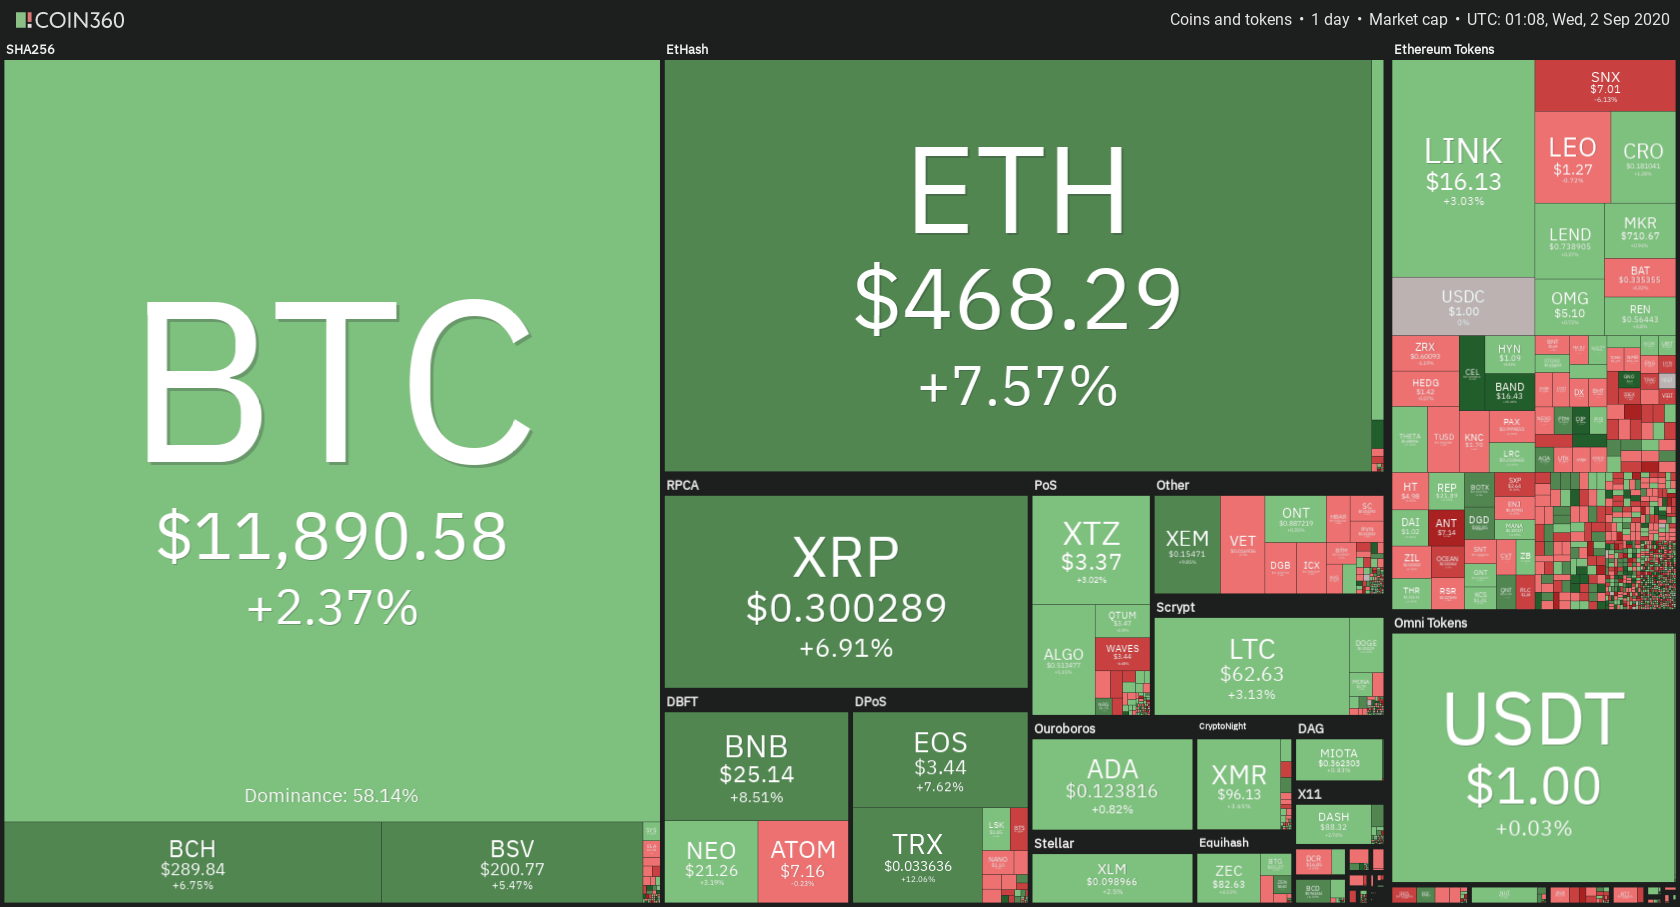
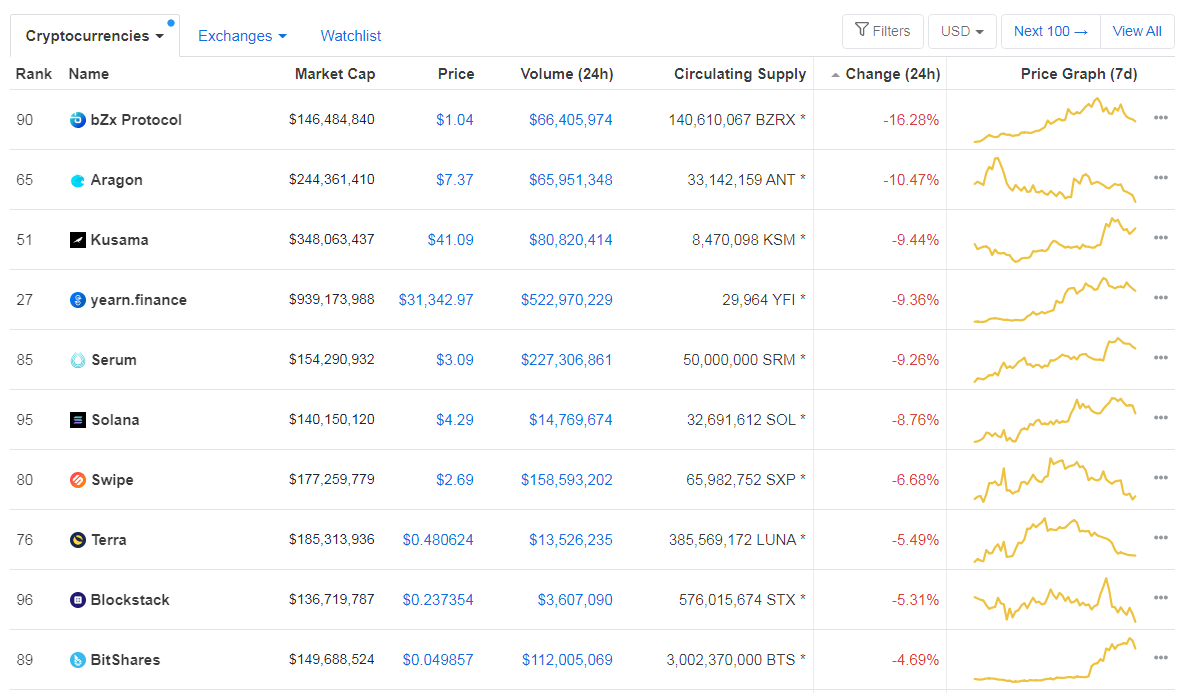
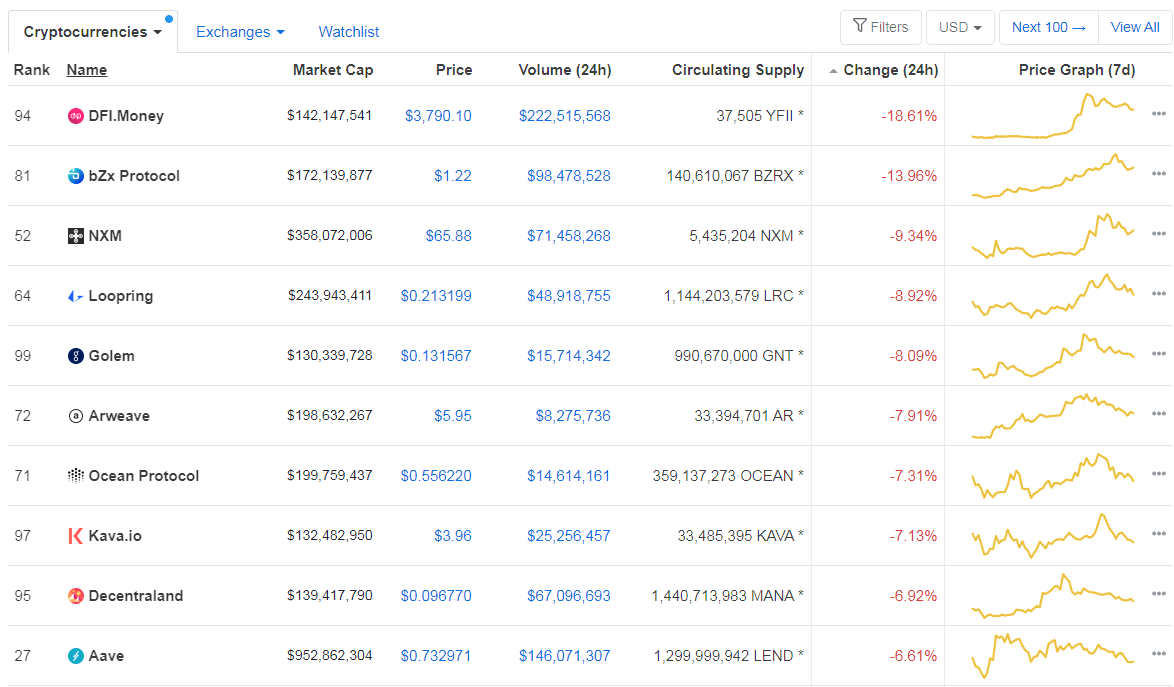
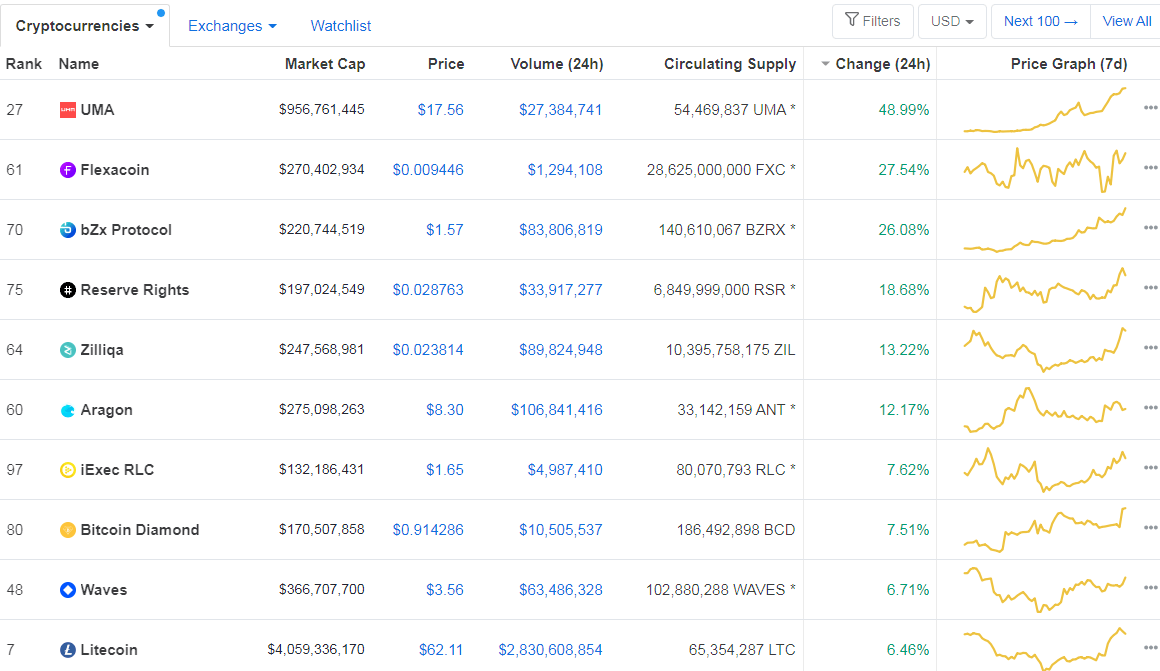
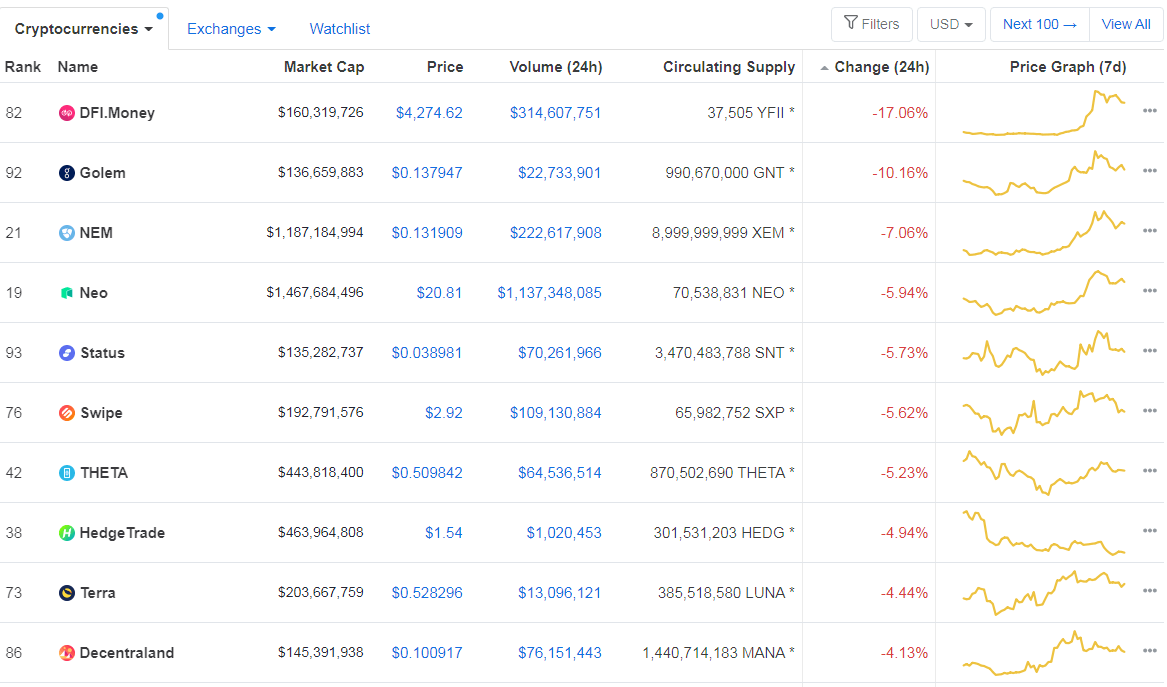
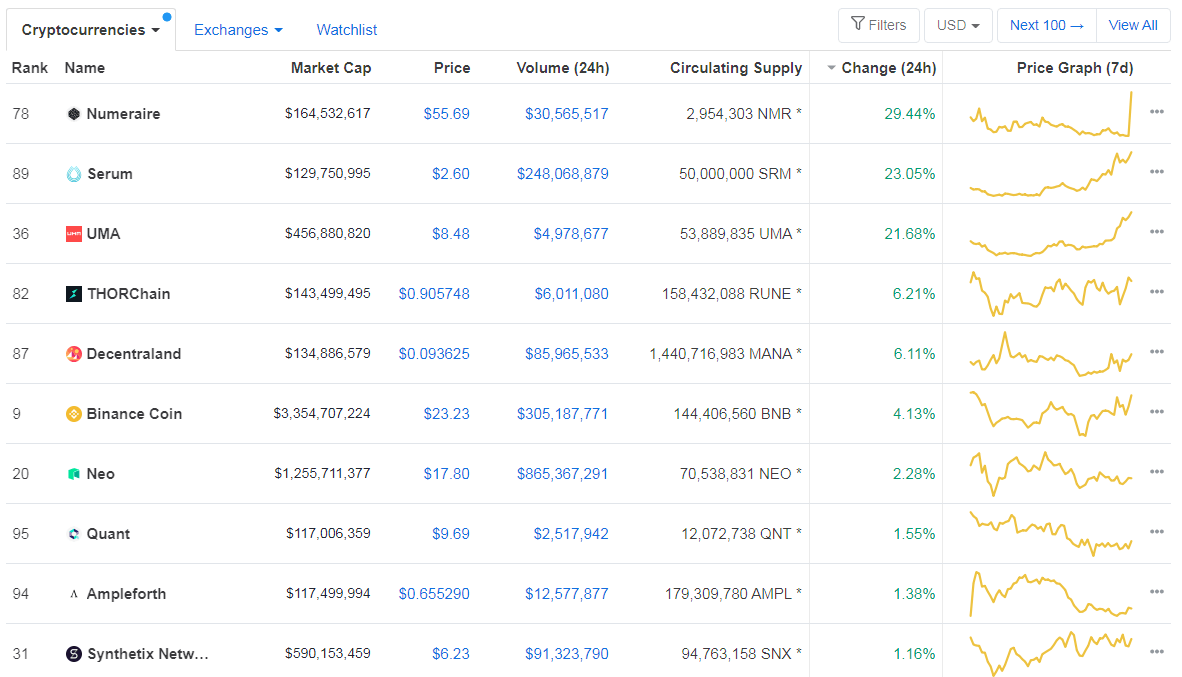
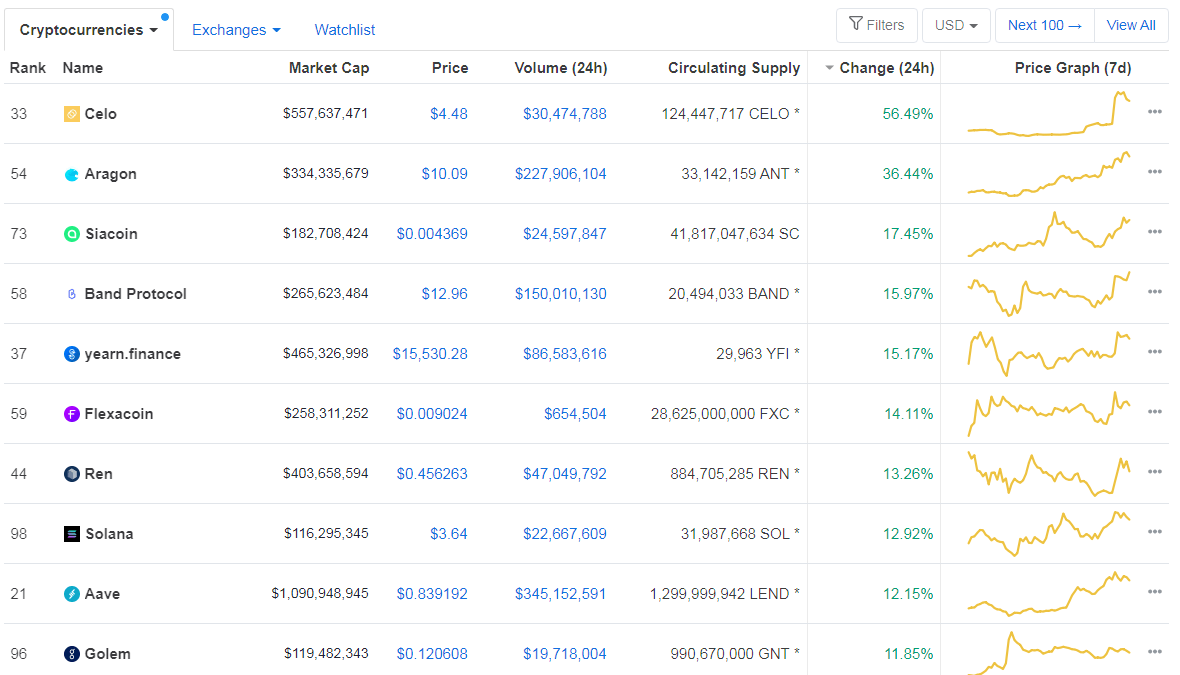
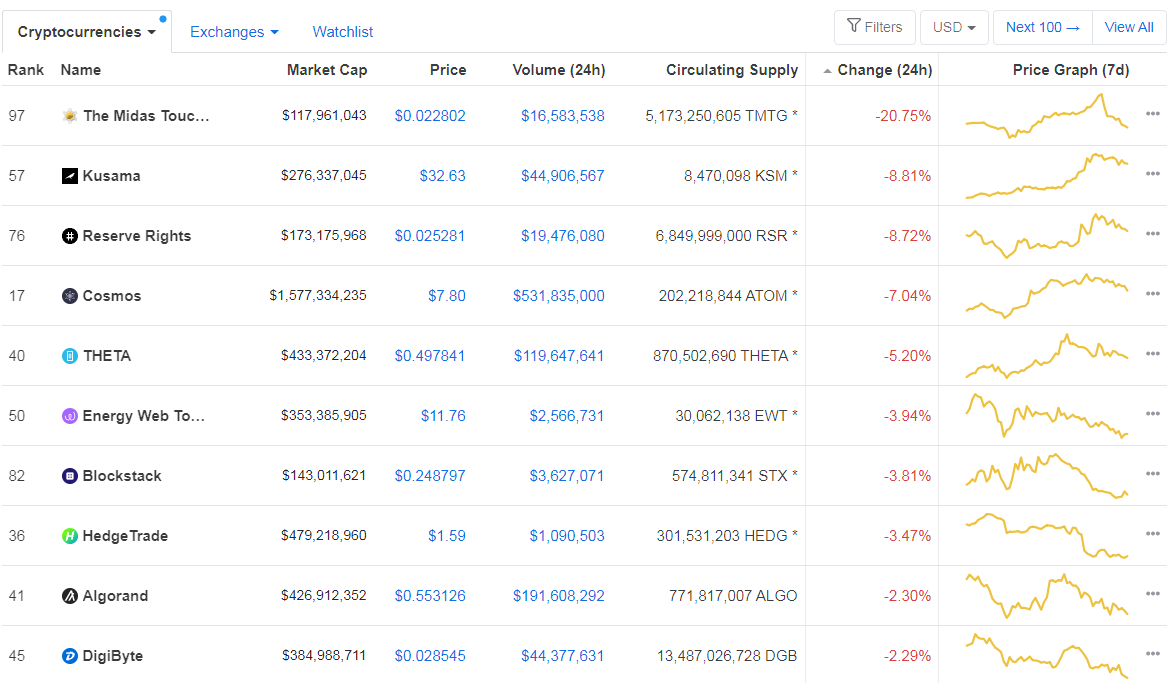
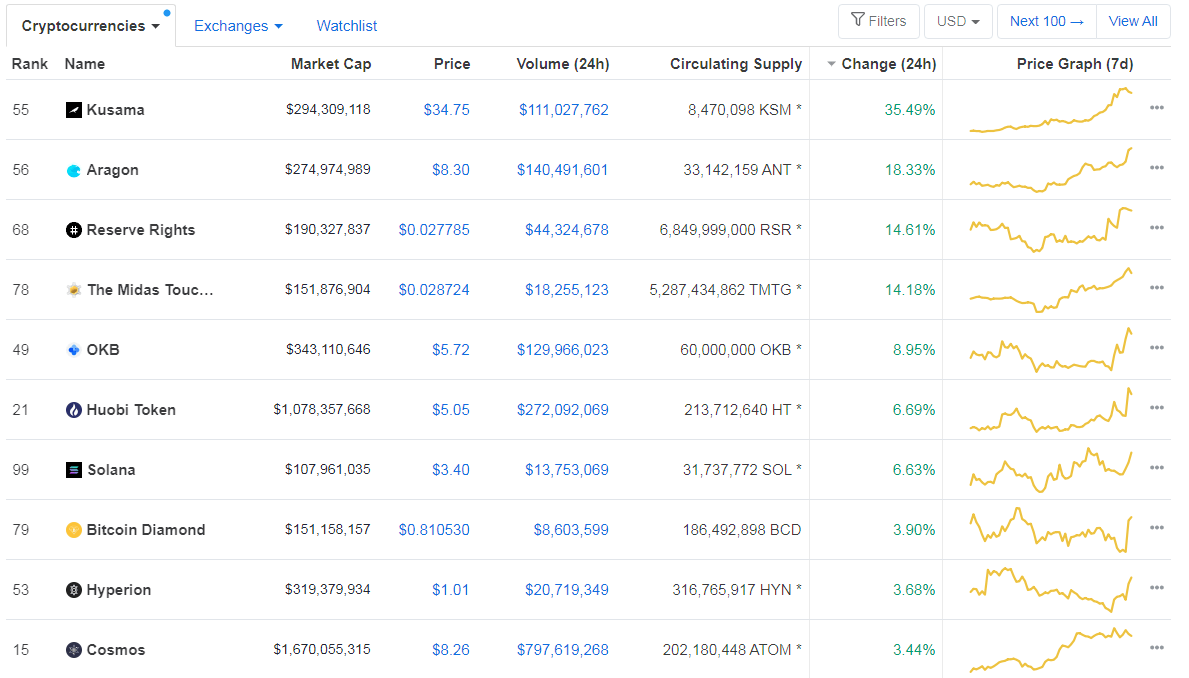
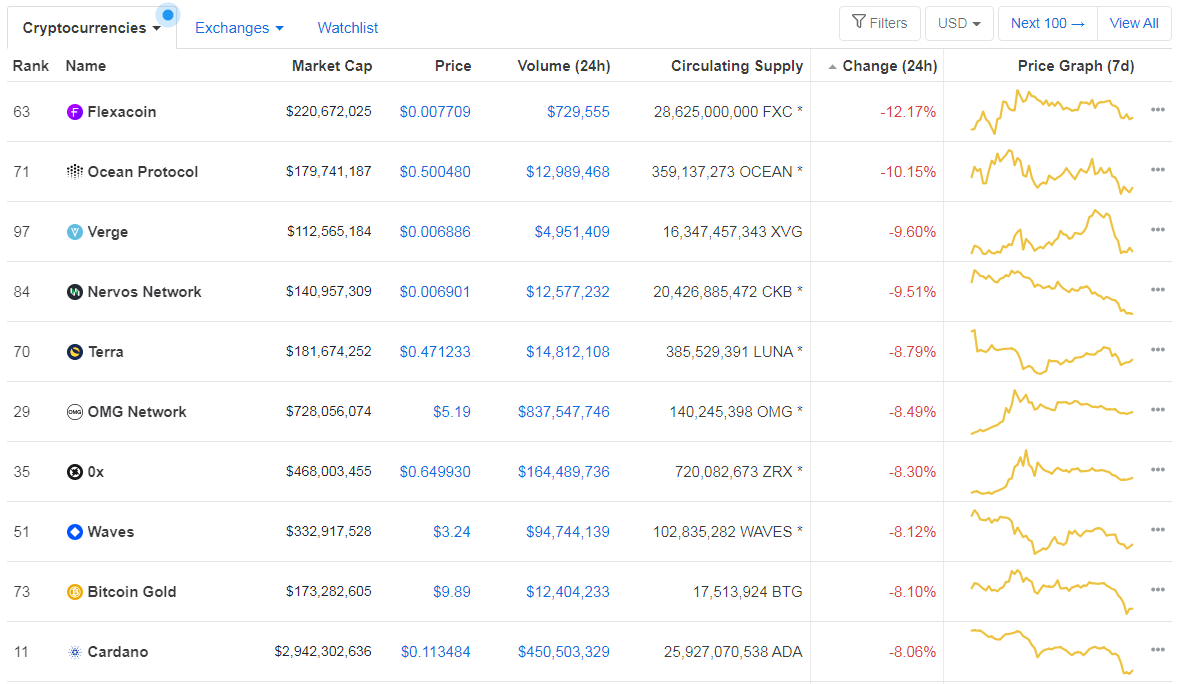
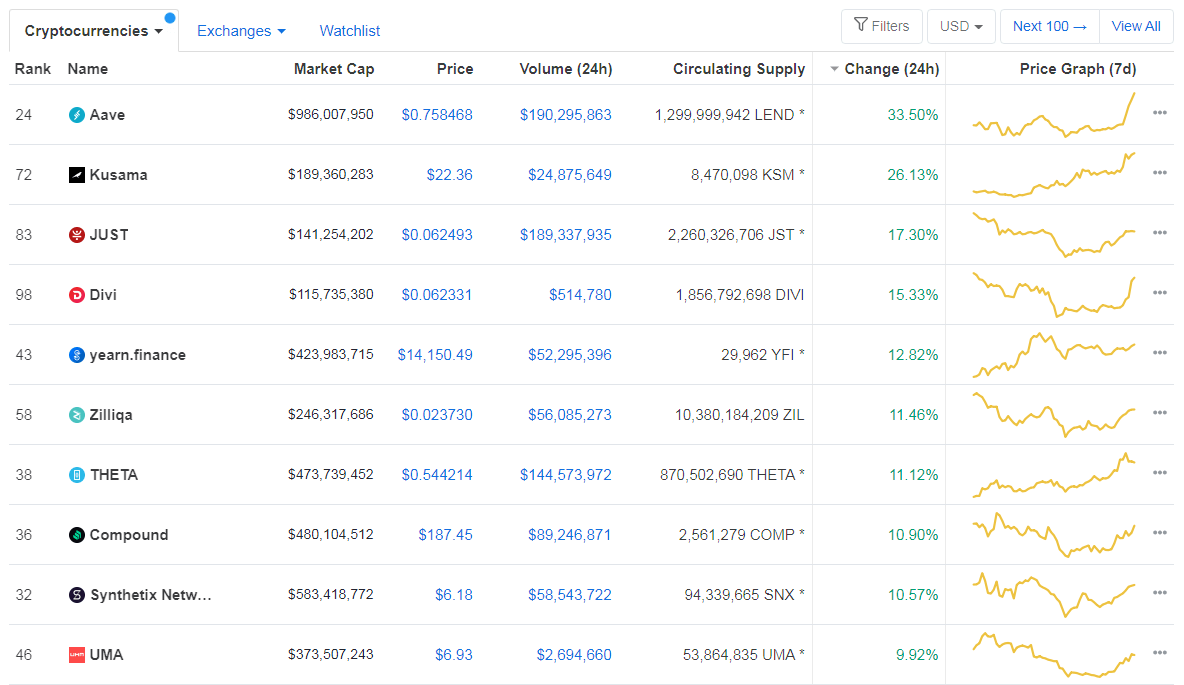
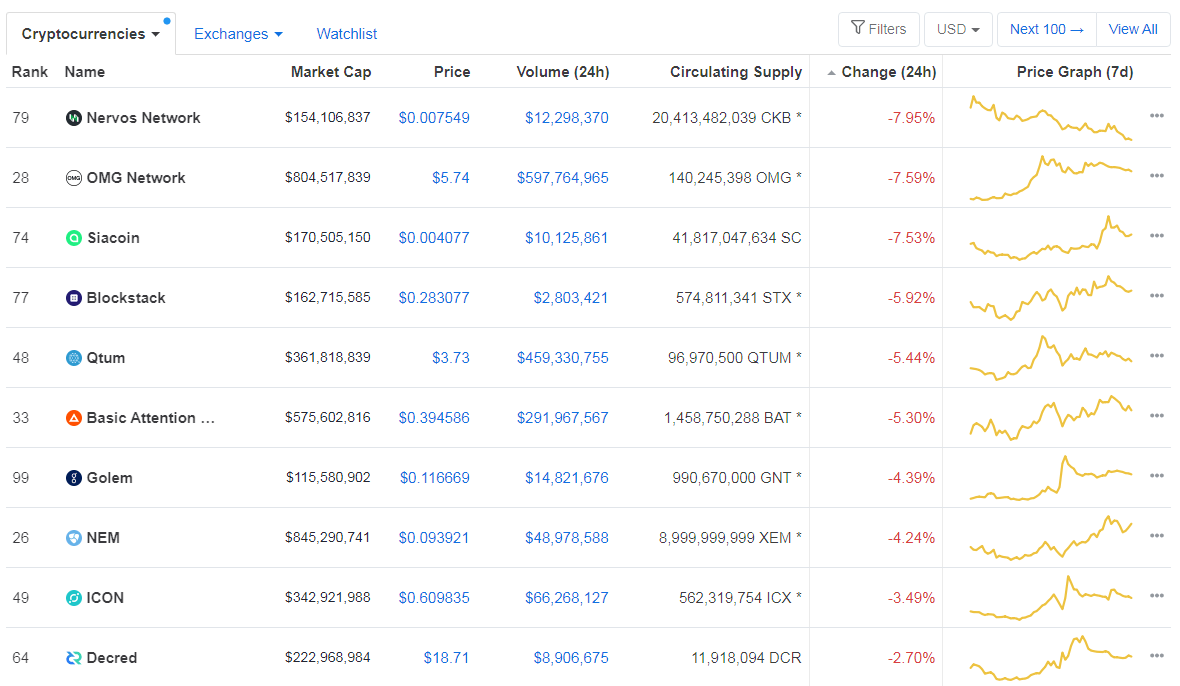
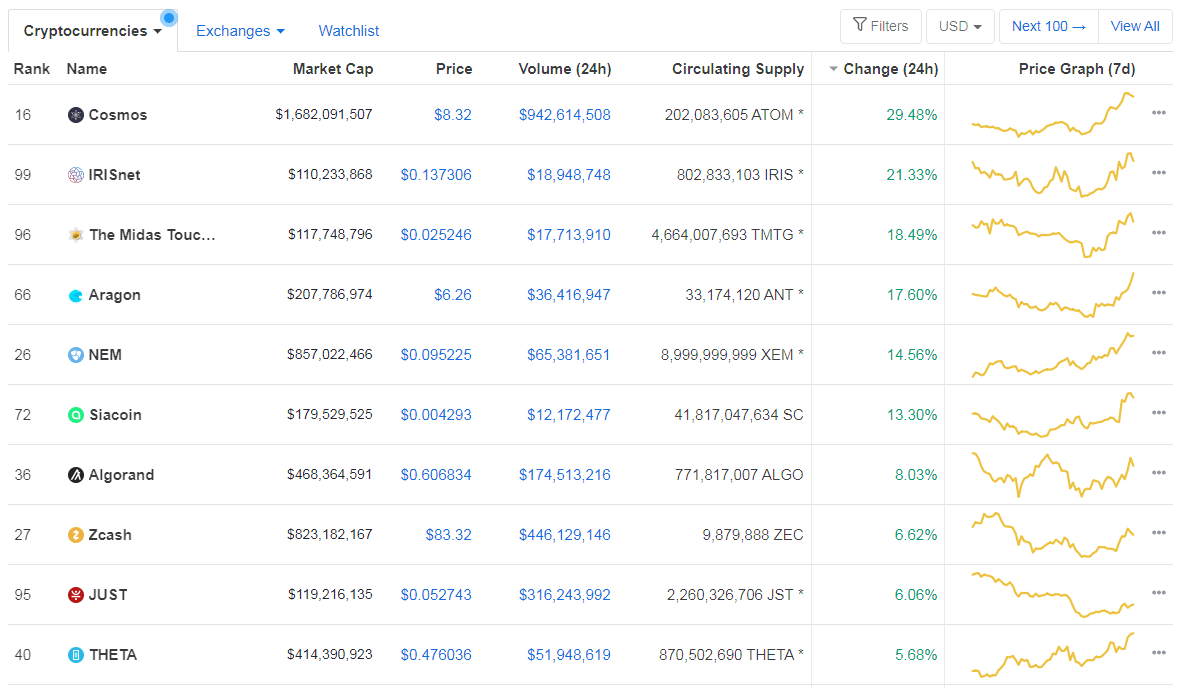
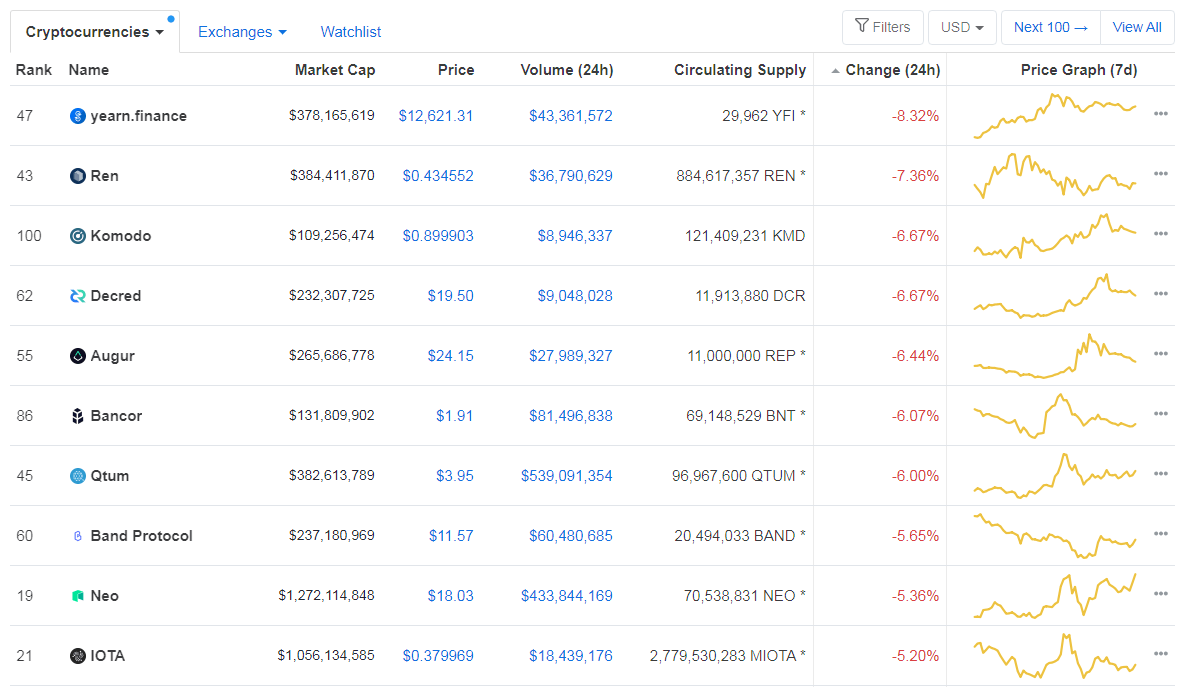
If we look at the top 100 cryptocurrencies, we can see that PumaPay gained 13.55% in the past 24 hours, making it the top daily gainer. ABBC Coin (9.05%) and Uniswap (6.64%) also did great. On the other hand, Solana lost 7.81%, making it the most prominent daily loser. It is followed by Loopring’s loss of 6.9% and Kusama’s loss of 6.77%.
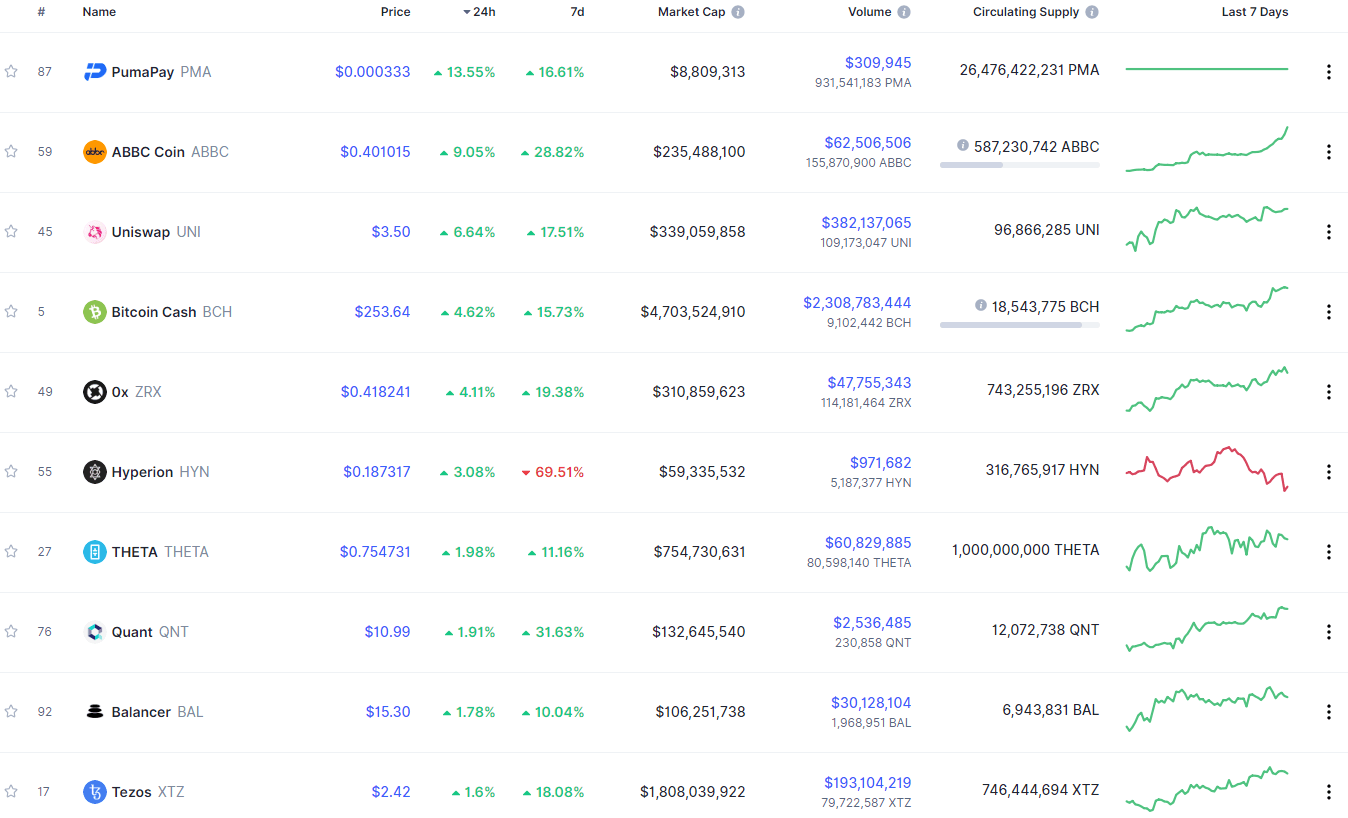
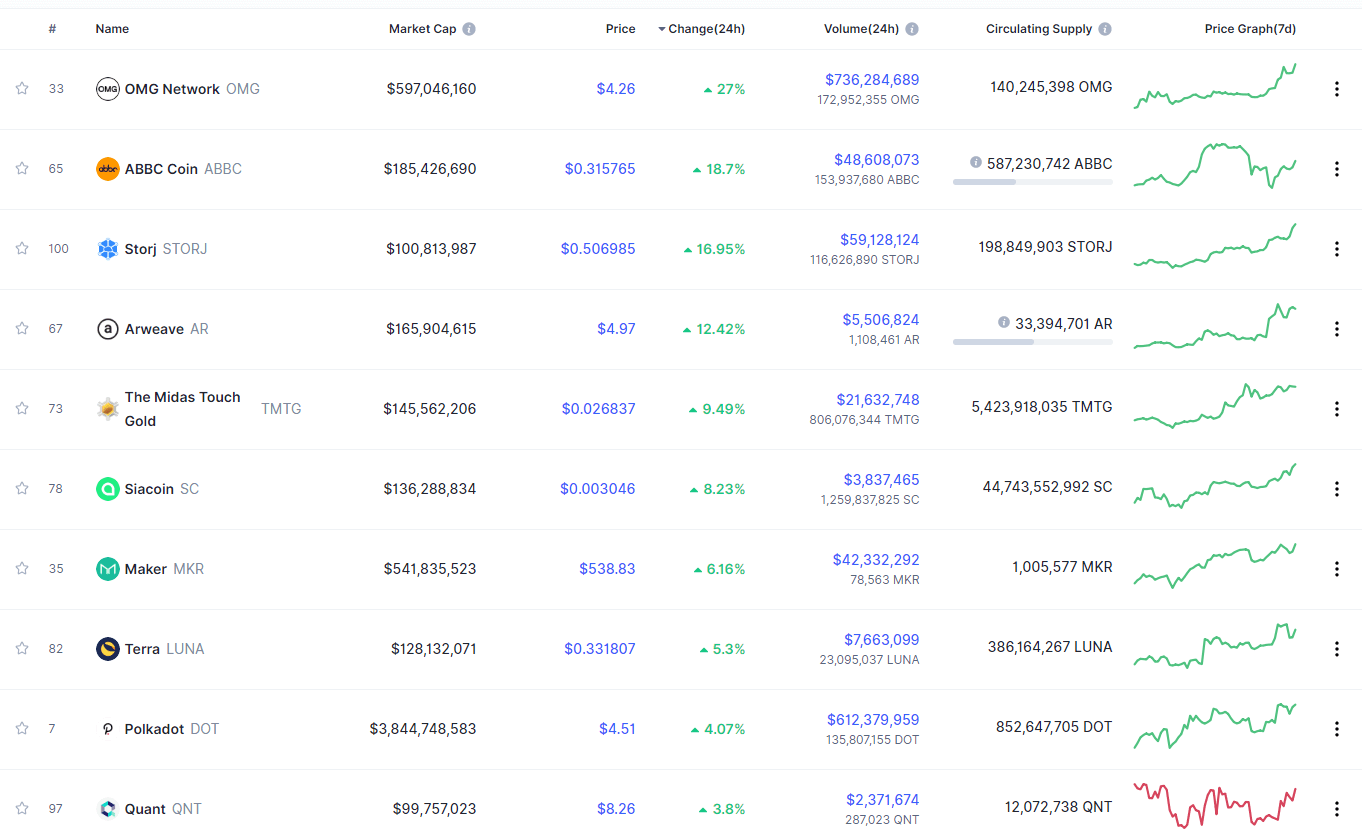
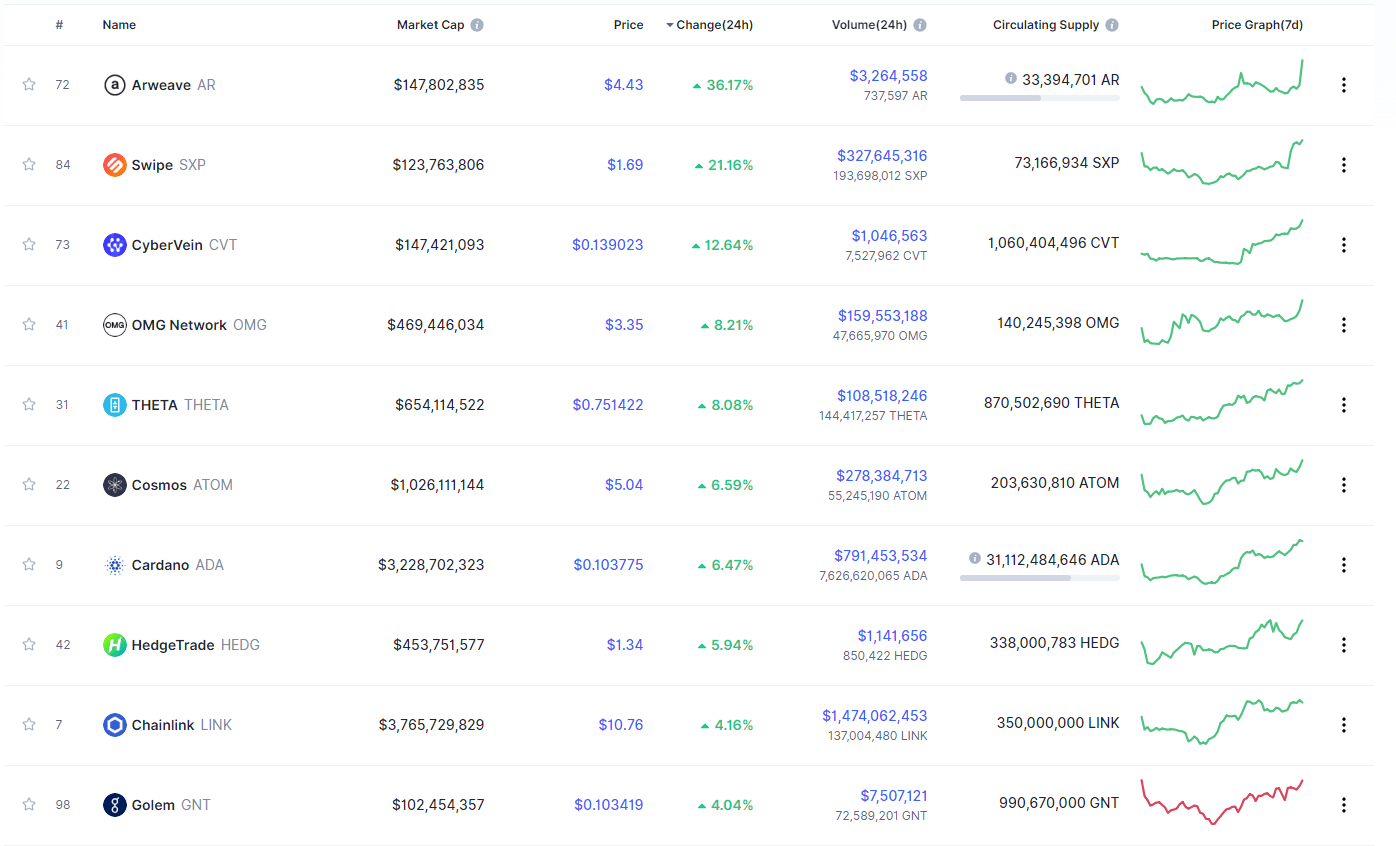
Top 10 24-hour Performers (Click to enlarge)
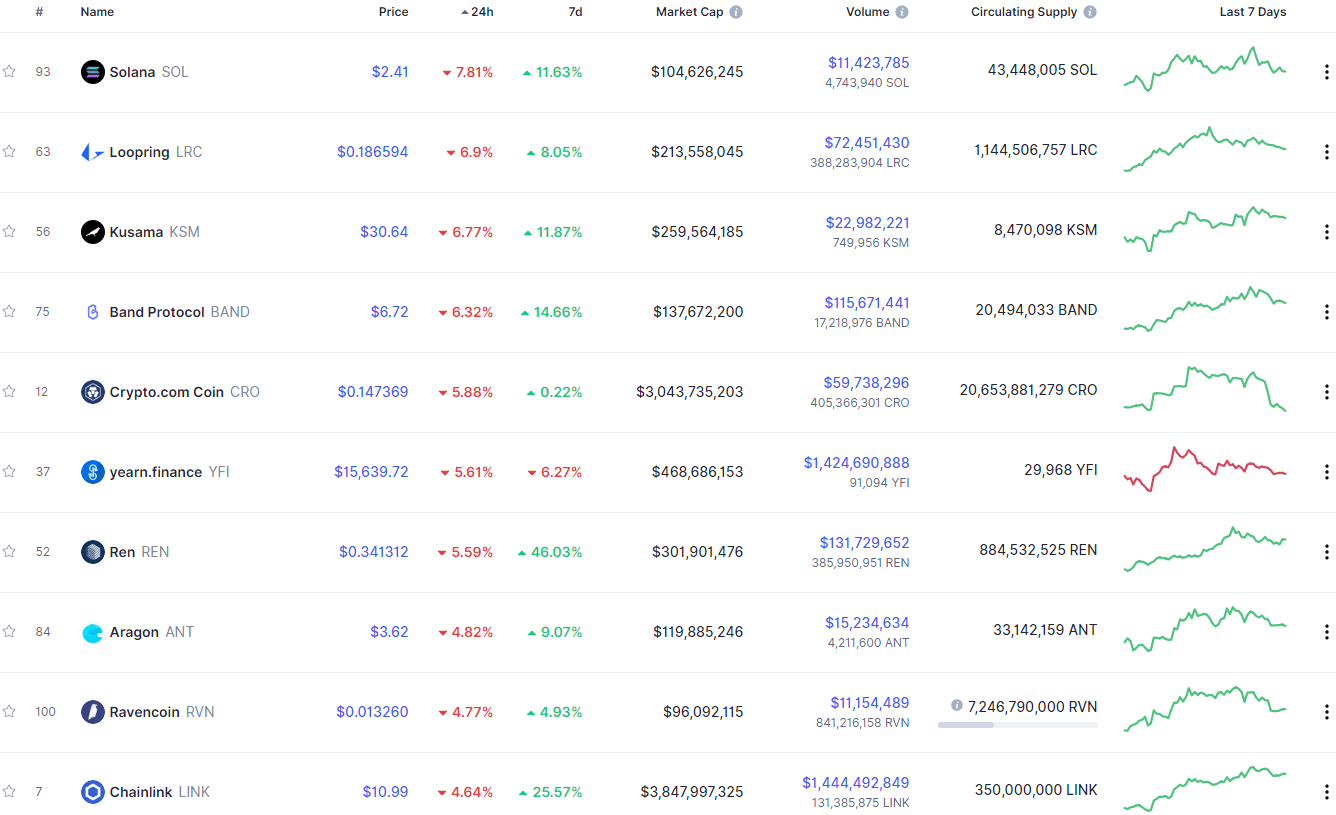
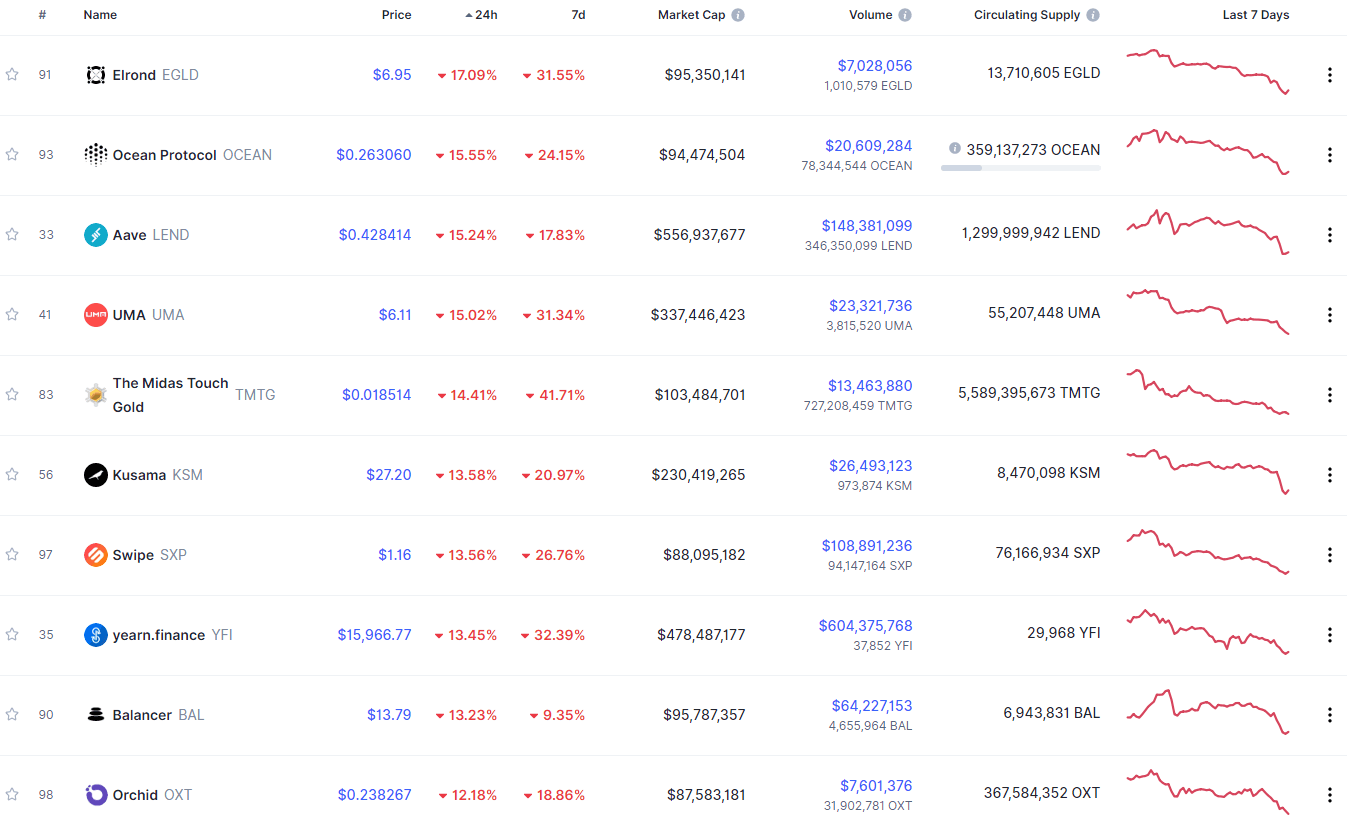
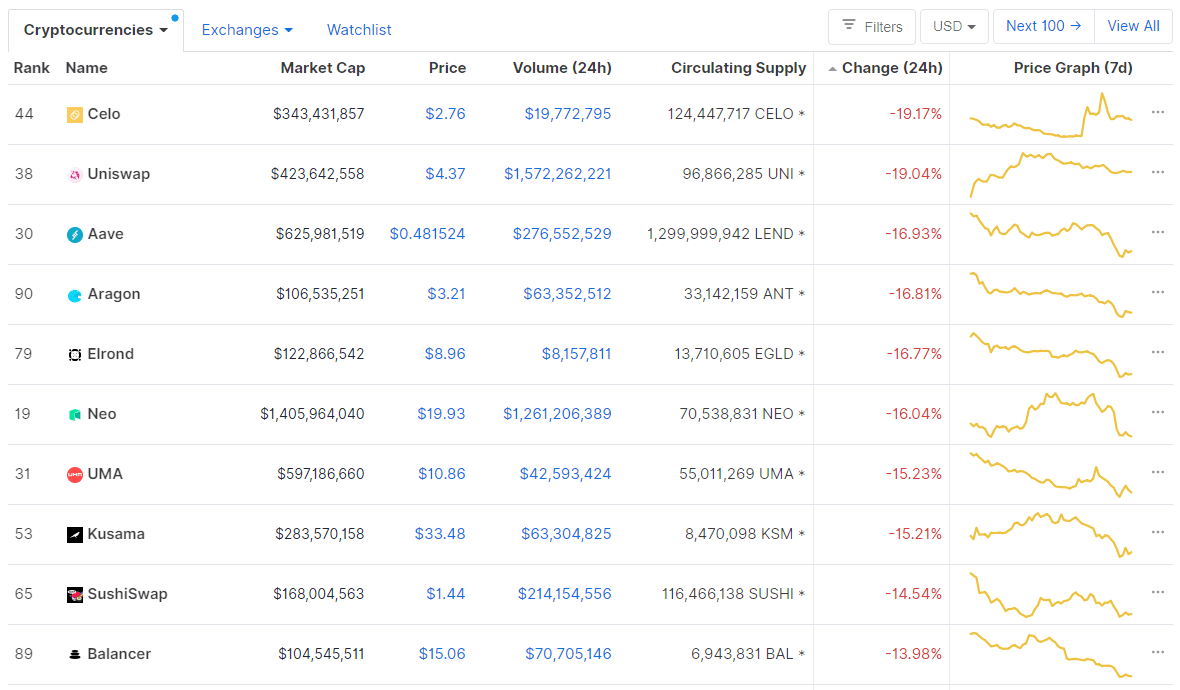
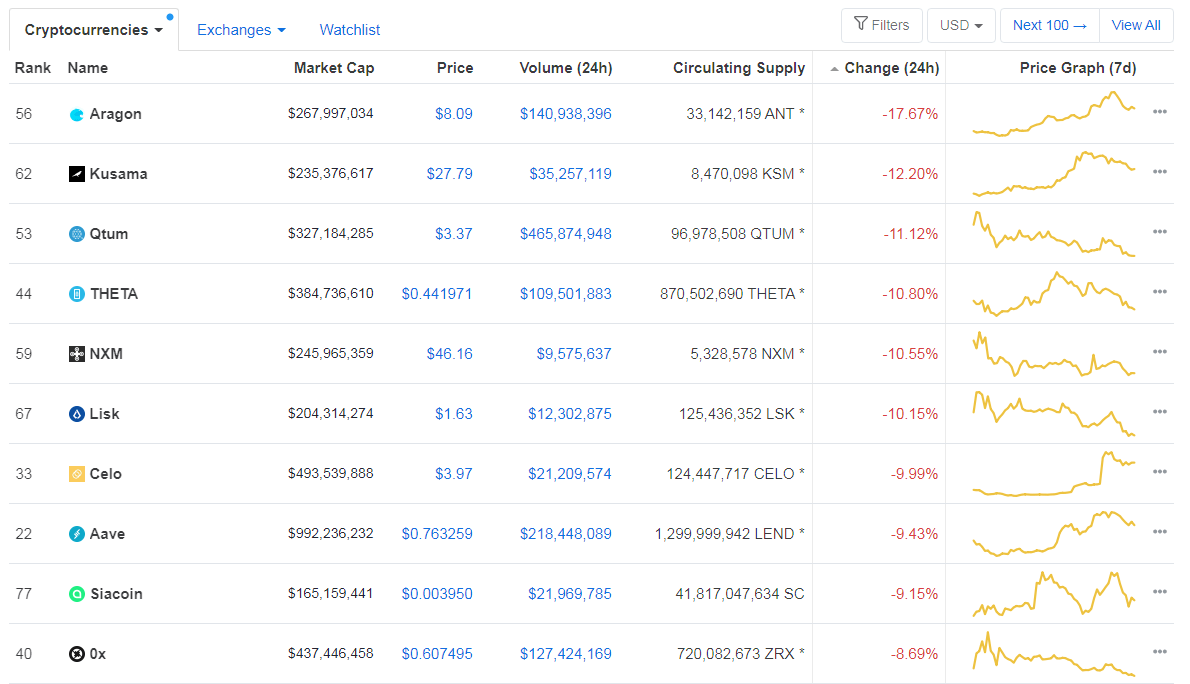
Bottom 10 24-hour Performers (Click to enlarge)
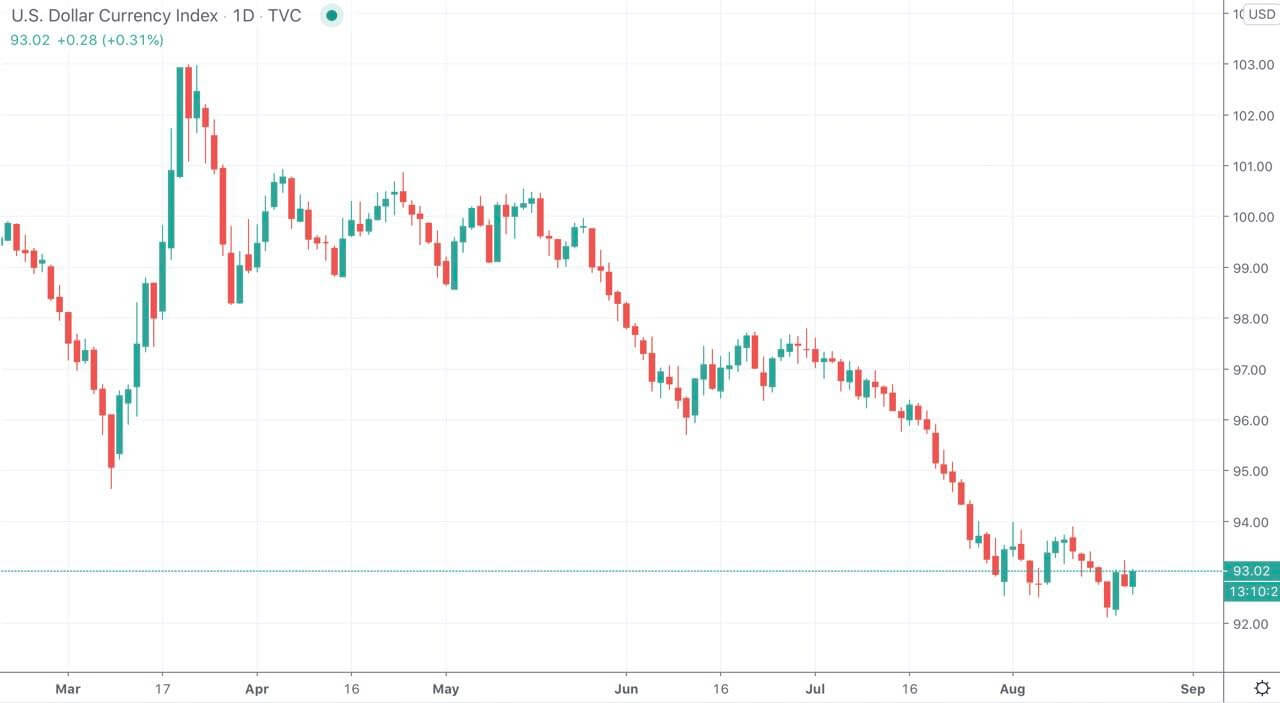
Bitcoin’s market dominance level has decreased slightly since our last report, with its value currently being 60.24%. This value represents a 0.16% difference to the downside when compared to when we last reported.
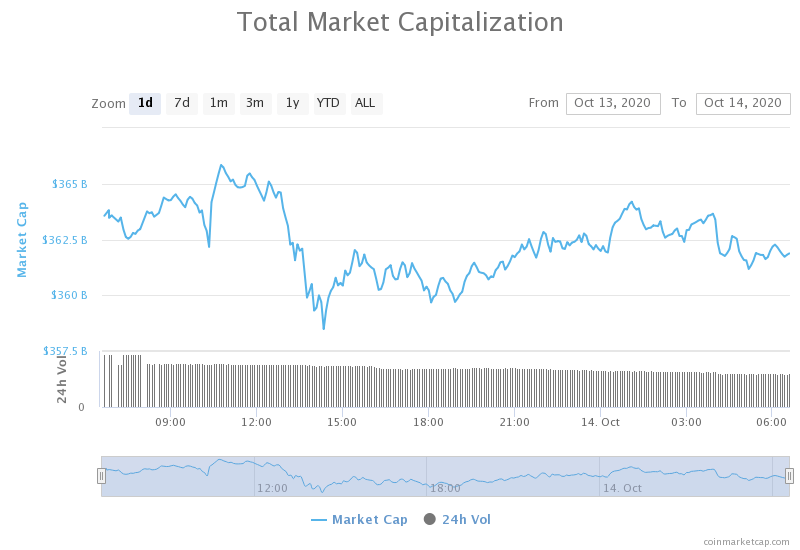
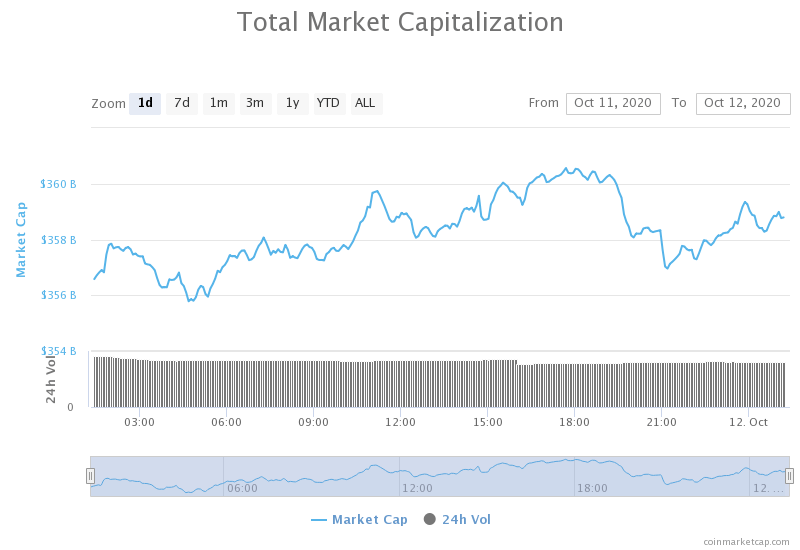
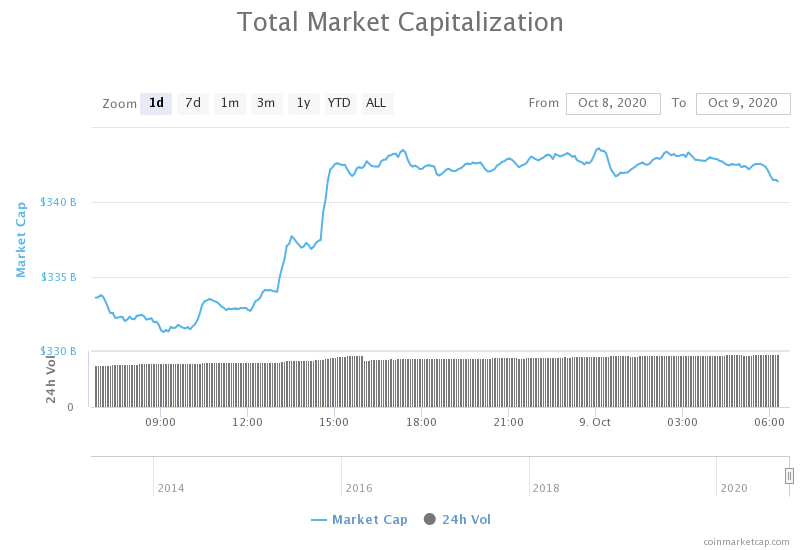
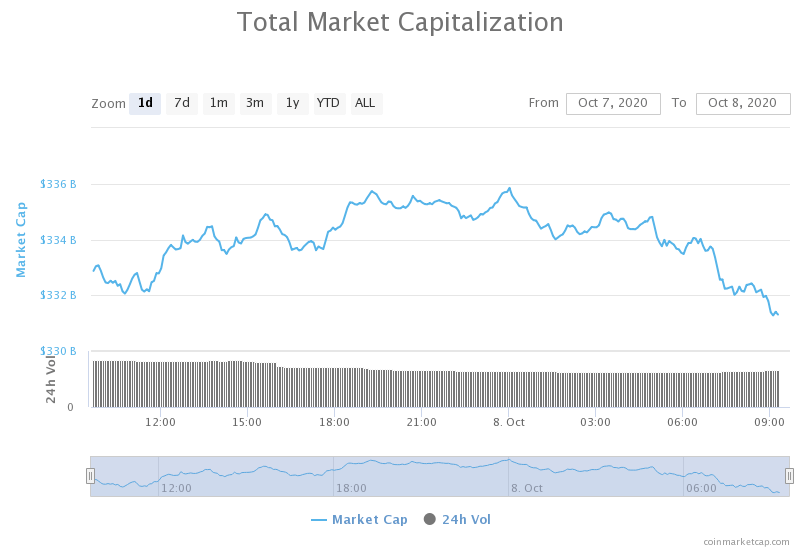
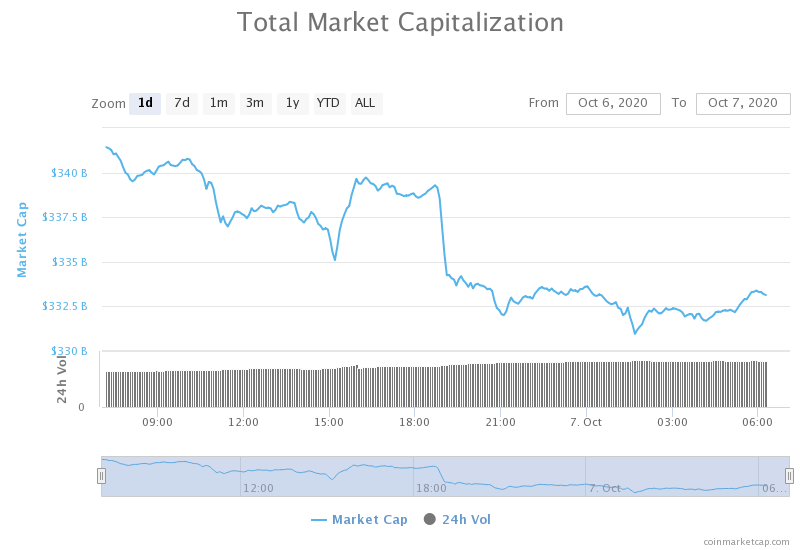
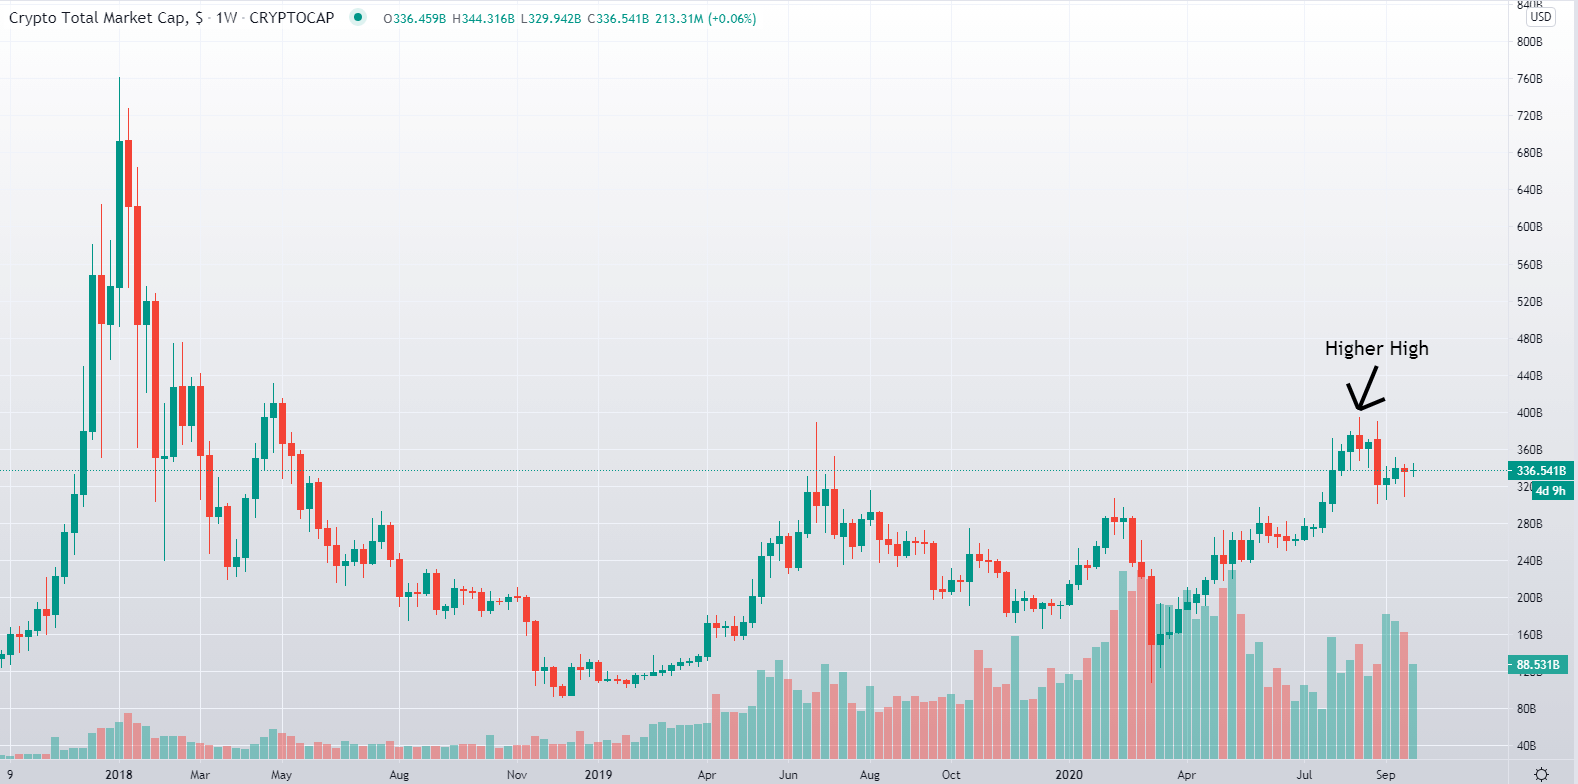
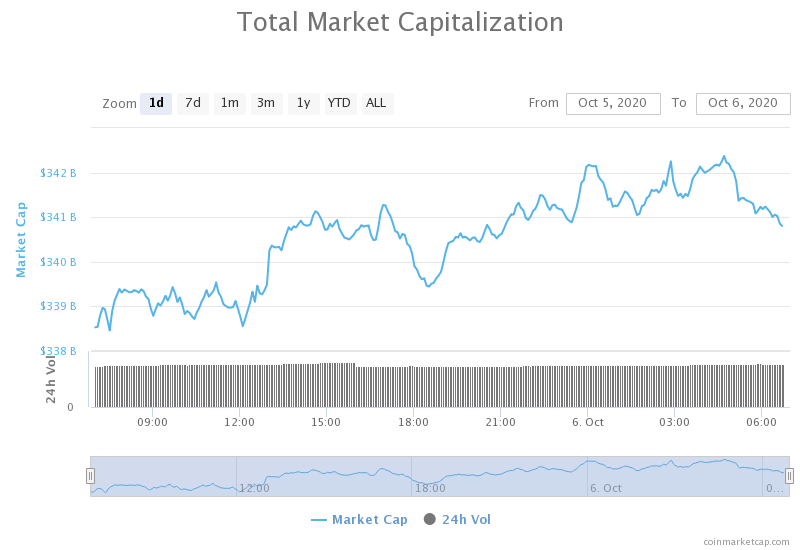
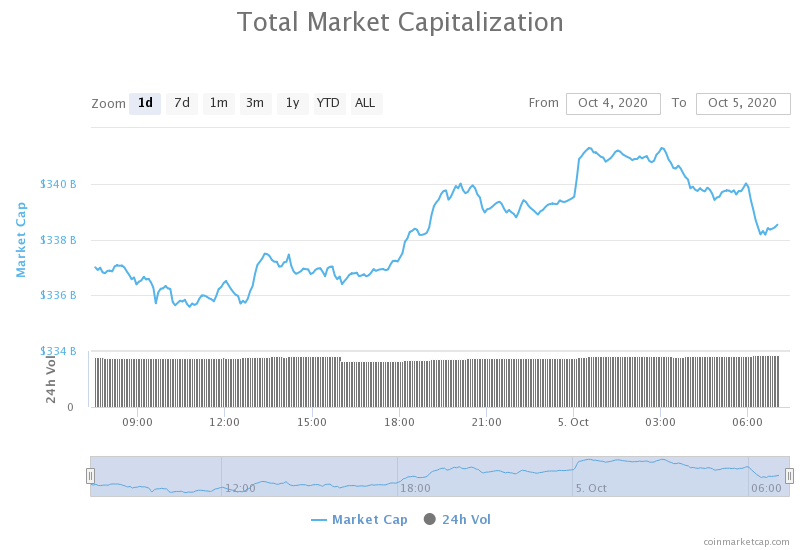
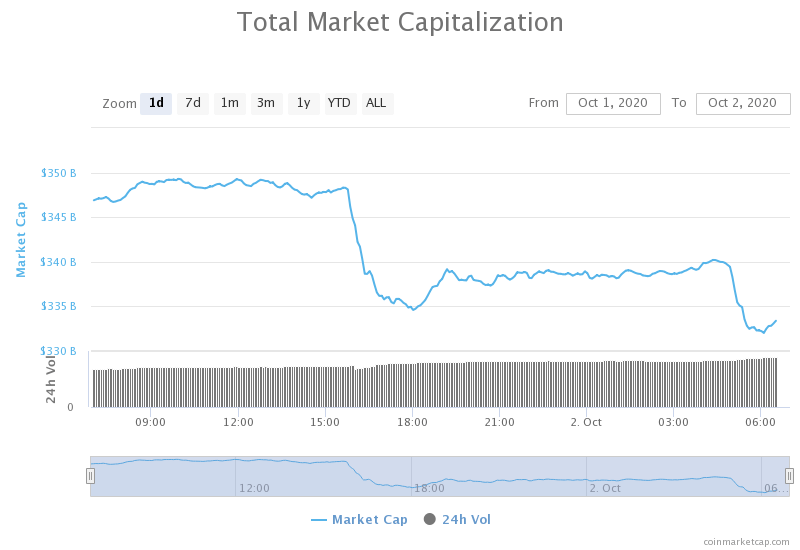
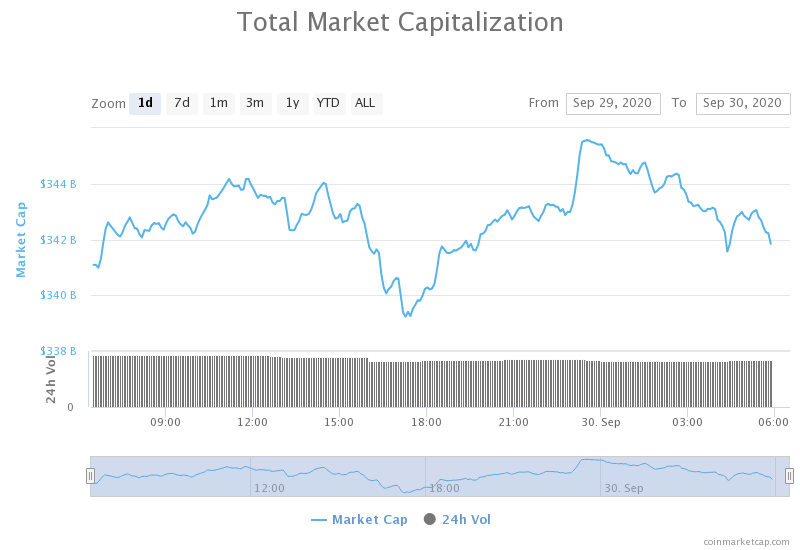
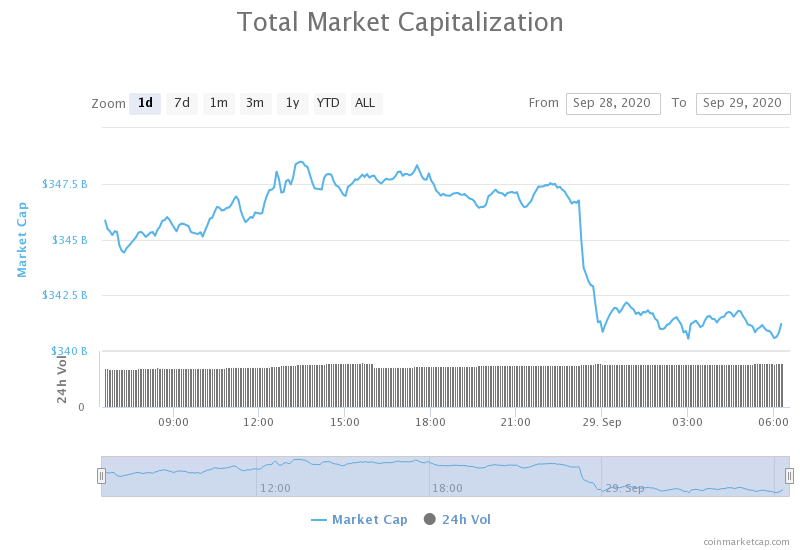
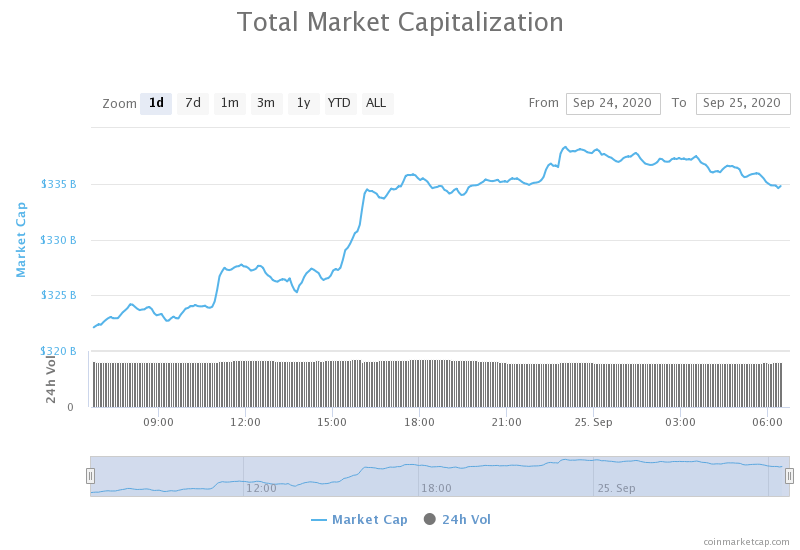
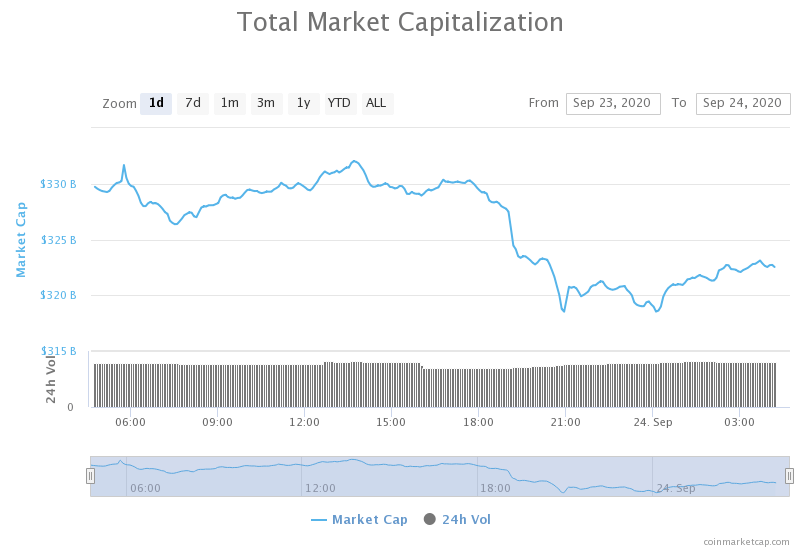
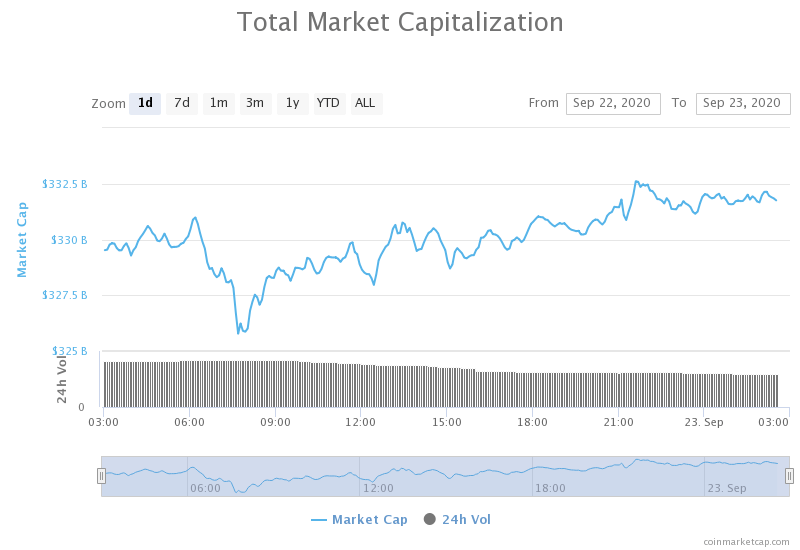
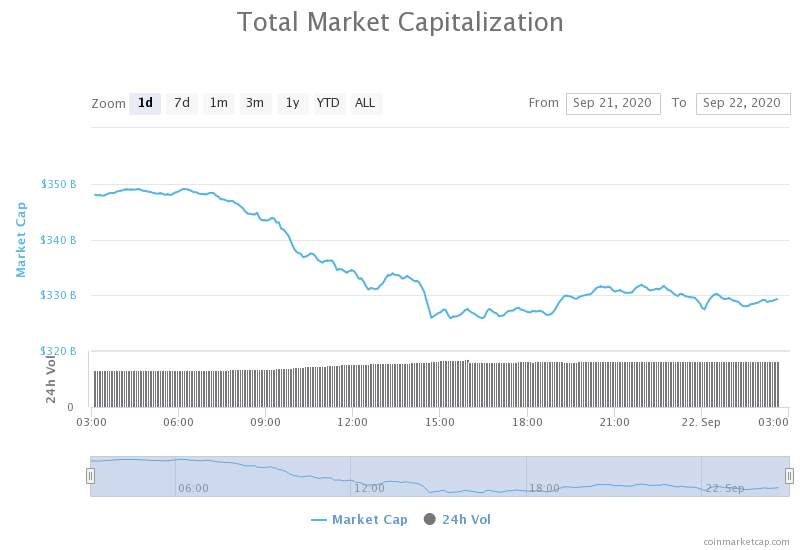
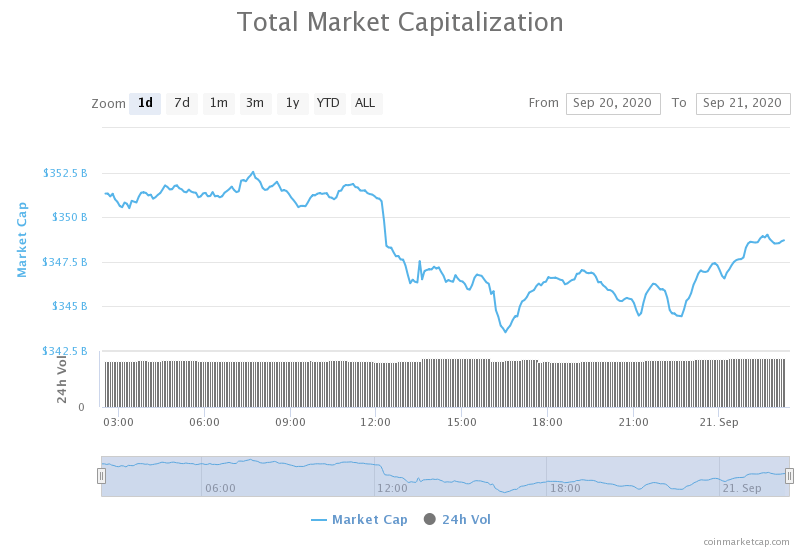
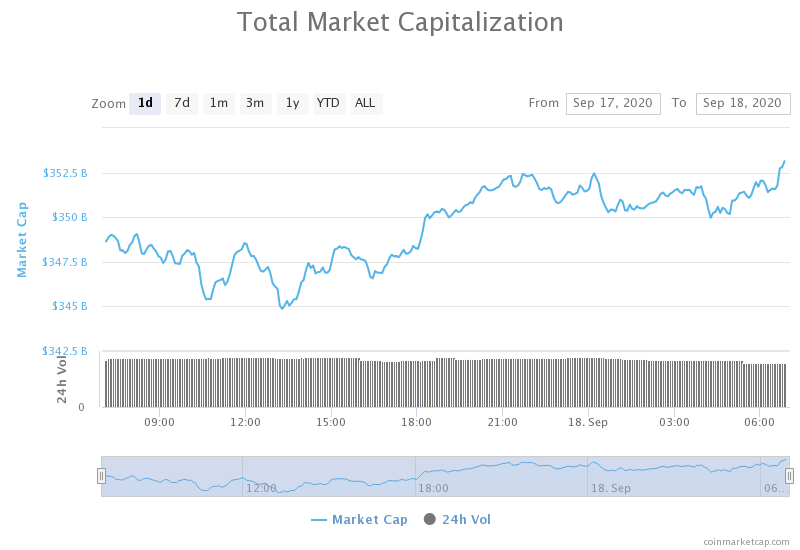
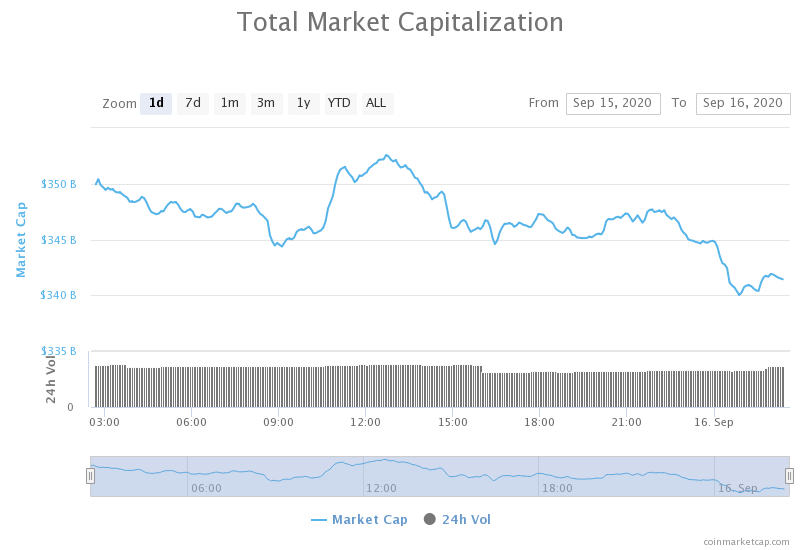
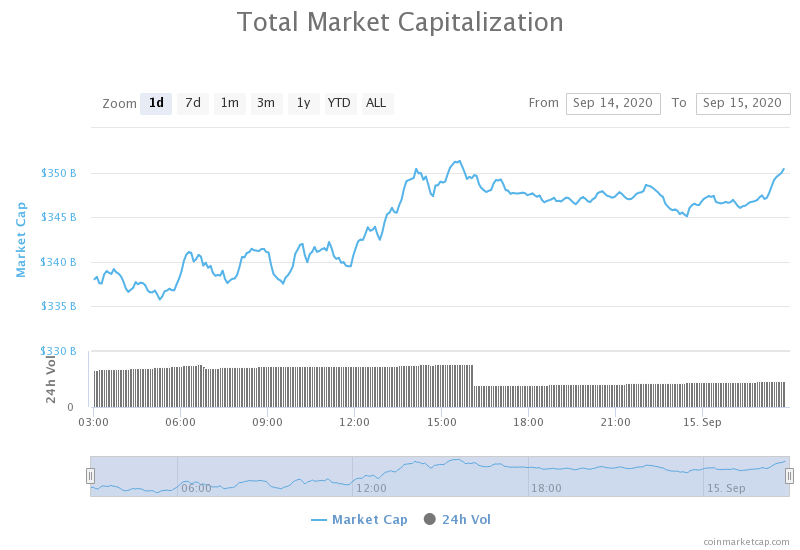
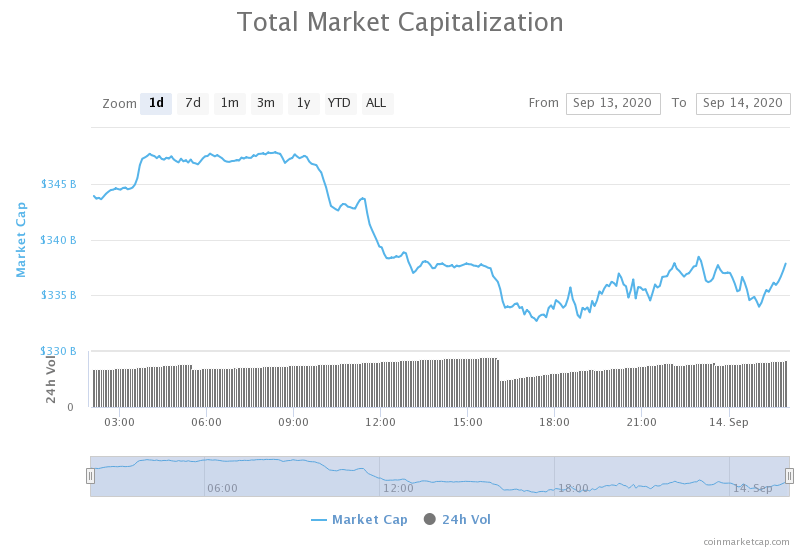
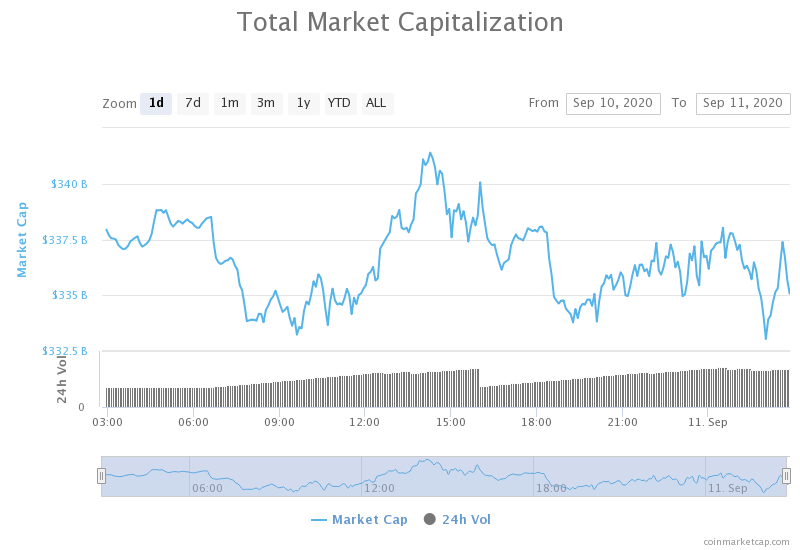
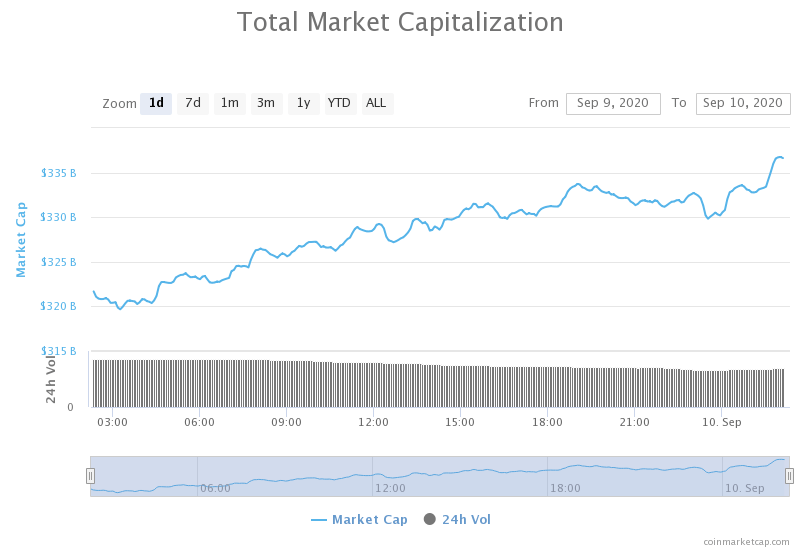
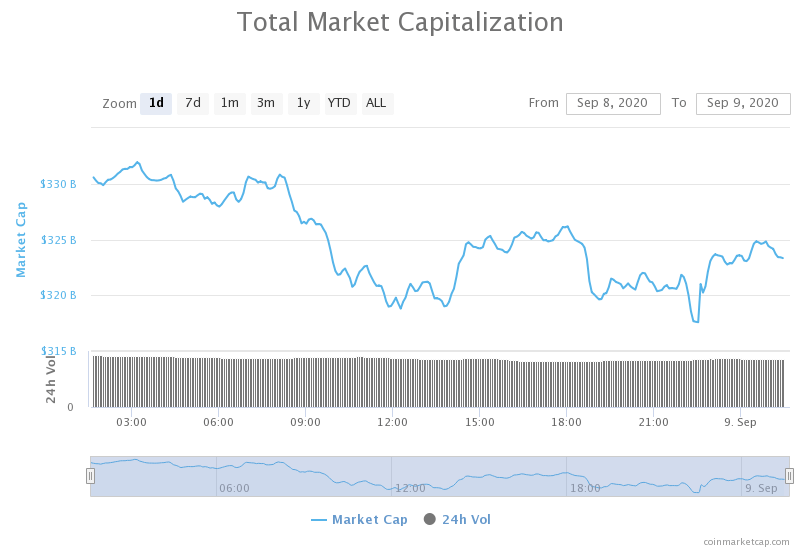
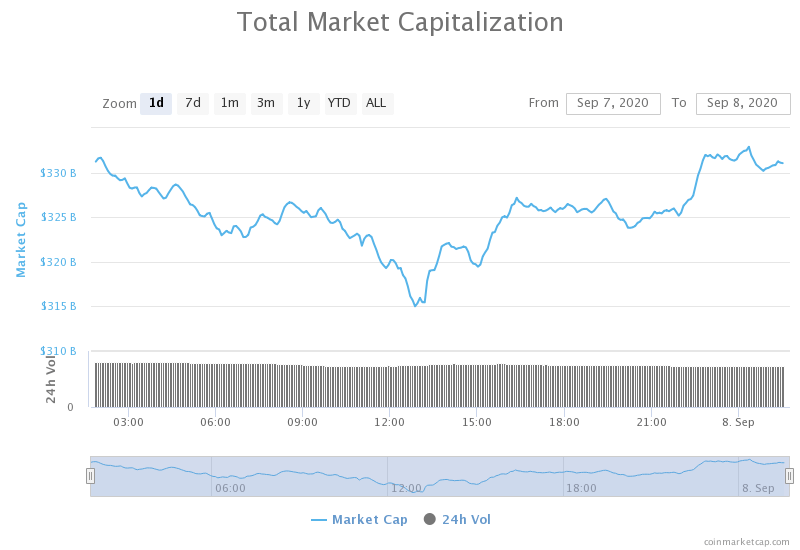
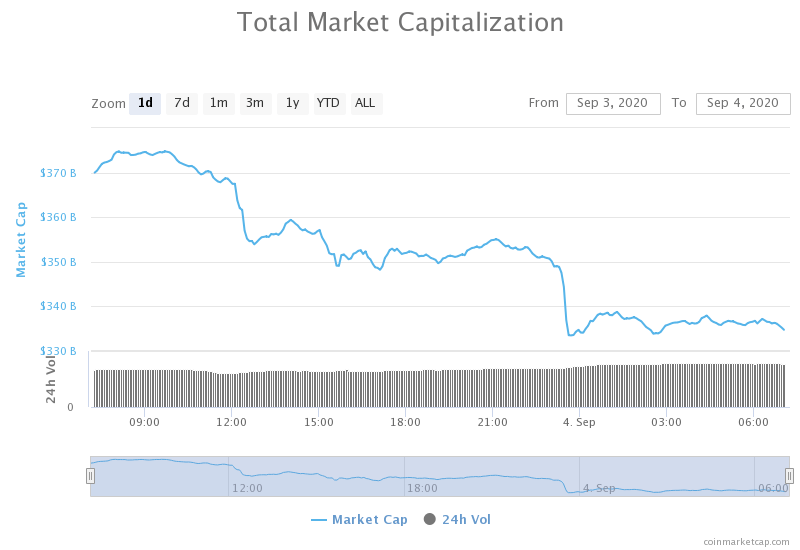
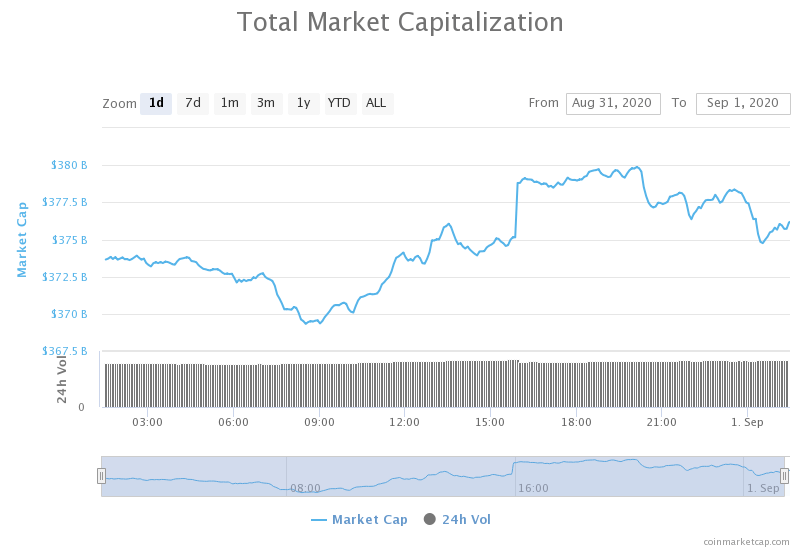
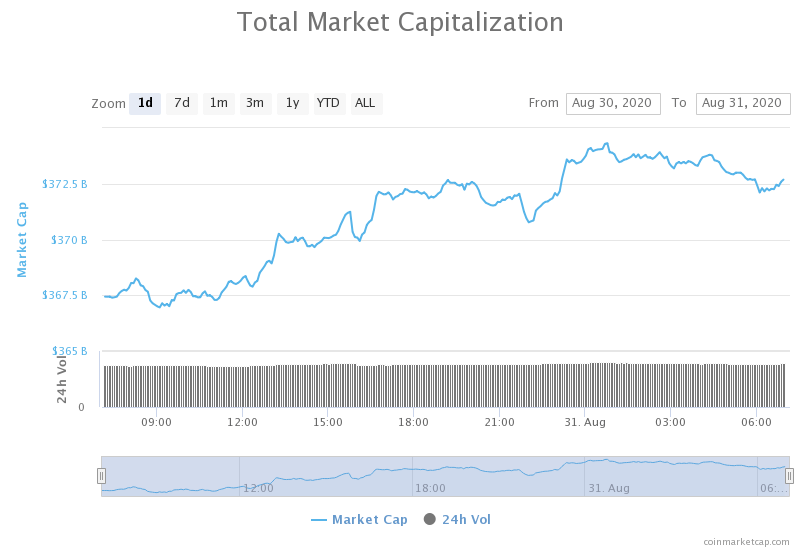
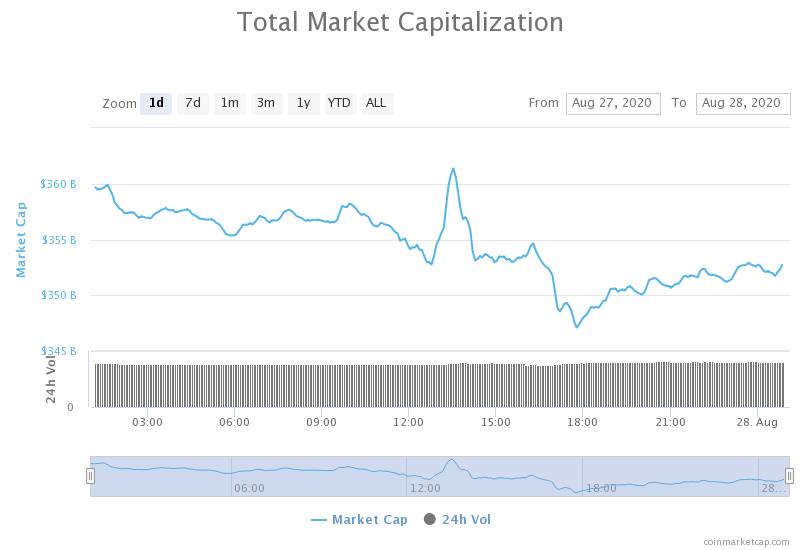
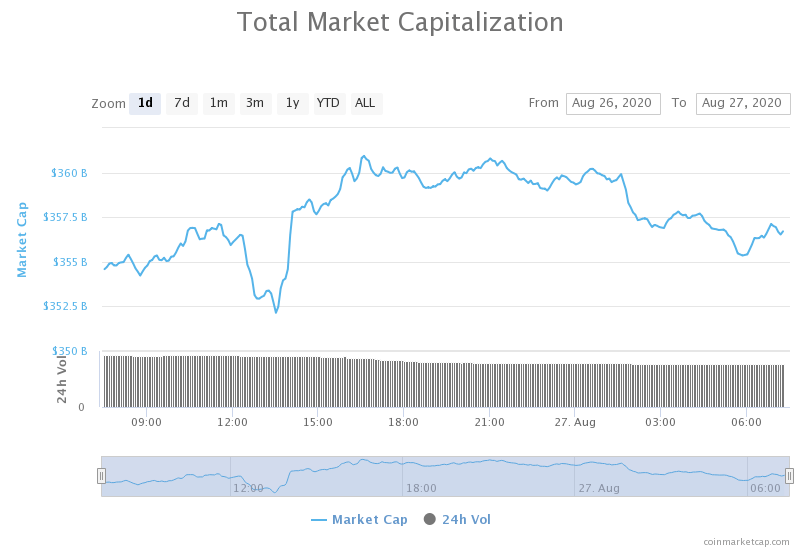
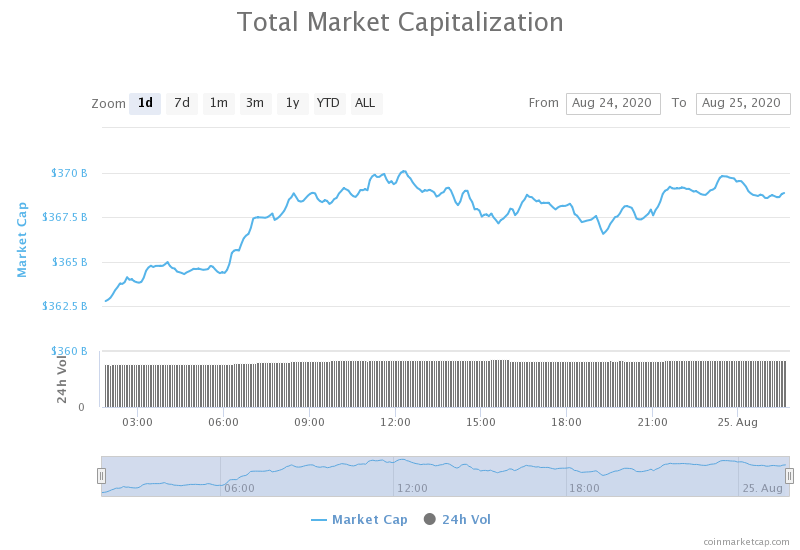
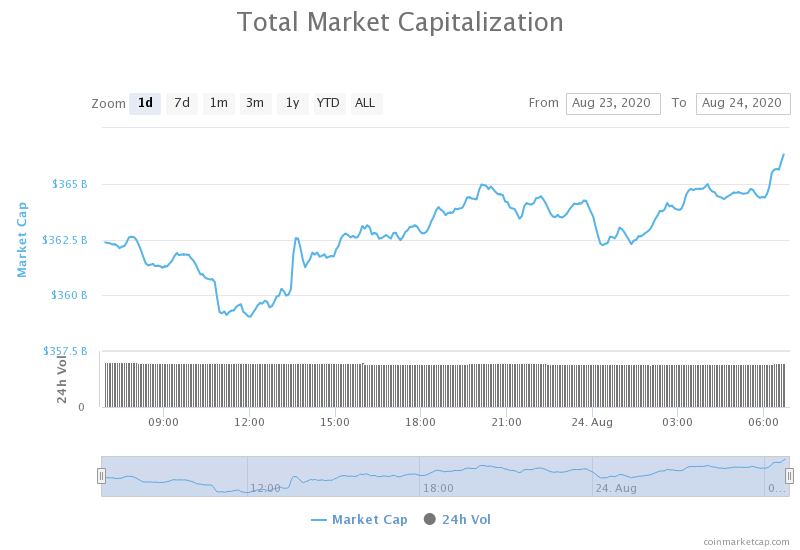
Daily Crypto Market Cap Chart
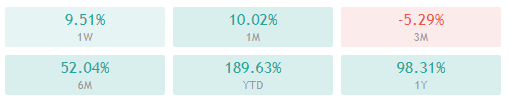
The crypto sector capitalization has lost a bit of its value over the course of the past 24 hours. Its current value is $361.98 billion, representing a decrease of $5.11 billion compared to our previous report.
_______________________________________________________________________
What happened in the past 24 hours?
_______________________________________________________________________
- Government agencies help Chainalysis double its recurring revenue in Q3 (The Block)
- An analysis of Chainlink node operator earnings (The Block)
- Coinbase’s chief compliance officer is set to leave the firm (The Block)
- Fund manager on why DeFi’s Yearn.finance (YFI) dropped 75% from highs (Cryptoslate)
- Ethereum leads with 96% of all DeFi transactions as Tron, EOS, and NEO show promise (Cryptoslate)
- India’s First Bitcoin Exchange Proposes Regulatory Sandbox Over Ban (Cryptobriefing)
- Market Wrap: Bitcoin Slips to $11,300; Ether Locked in DeFi Is Flat (Coindesk)
- Security token trading volume crashed by 60% in September (Cointelegraph)
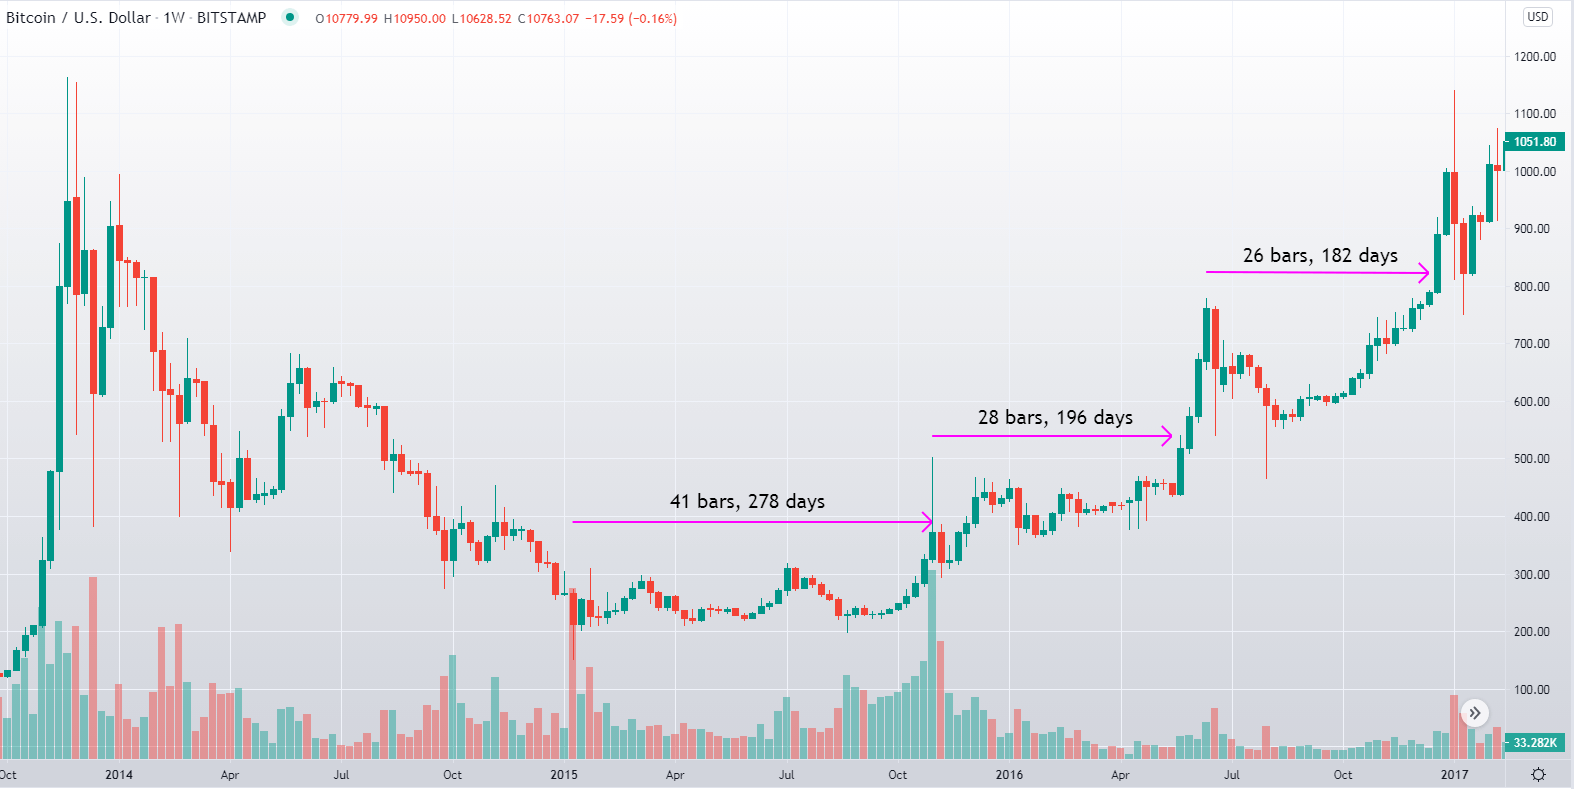
- Move over S2F — Model creator says ‘90% chance’ BTC never dips below $11K again (Cointelegraph)
- Tether’s market cap could overtake Ethereum’s next year — Bloomberg report (Cointelegraph)
_______________________________________________________________________
Technical analysis
_______________________________________________________________________
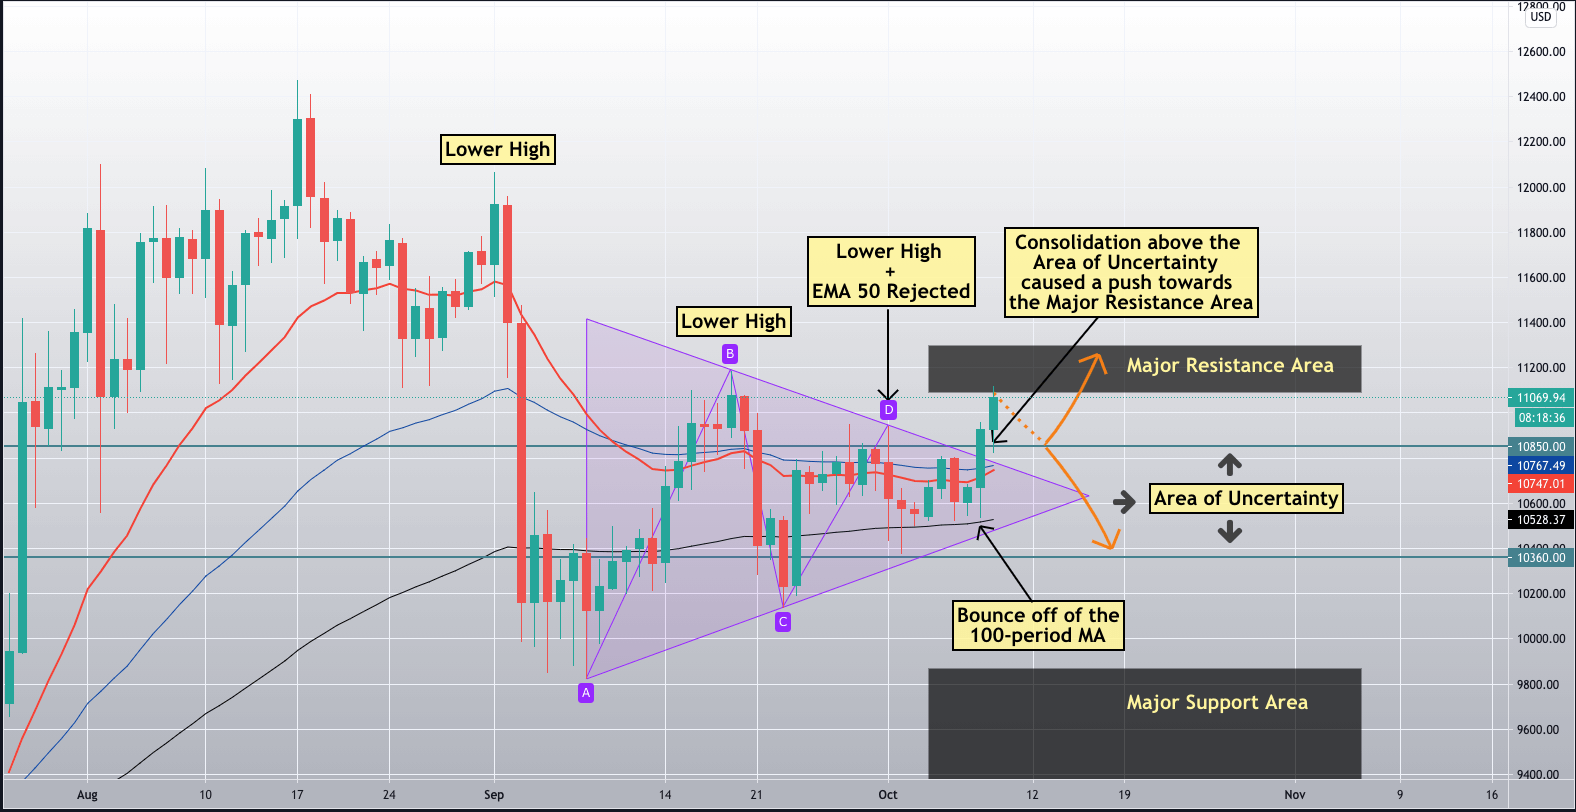
Bitcoin
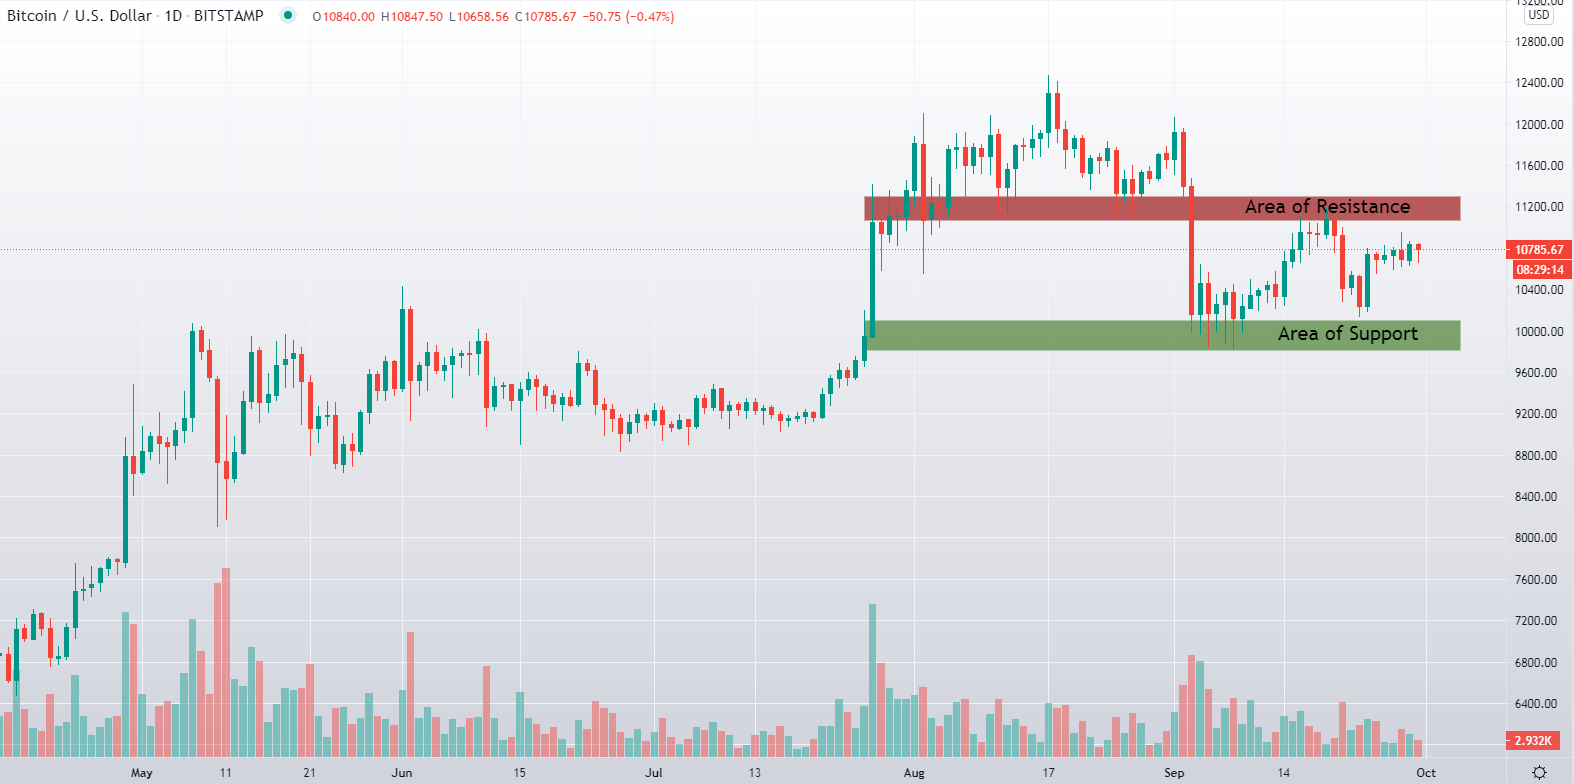
The largest cryptocurrency by market cap went into pullback mode as it couldn’t stay at its daily high of a little over $11,700. Bitcoin’s bull exhaustion triggered a pullback, which then broke the $11,500 support level to the downside, putting the cryptocurrency boxed in between $10,300 support and $10,500 resistance level. With the volume decreasing and RSI dropping down, we may expect sideways trading in the short-term before another attempt of (mostly likely) upwards motion.
Many analysts say that Bitcoin has almost no chance of going under $11,000 and that the most recent break above it has turned Bitcoin’s sentiment into a bullish one. However, if Bitcoin manages to go under $11,000, we may expect that the move will continue downwards quickly.
BTC/USD 4-hour Chart
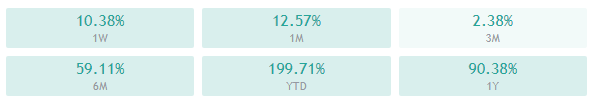
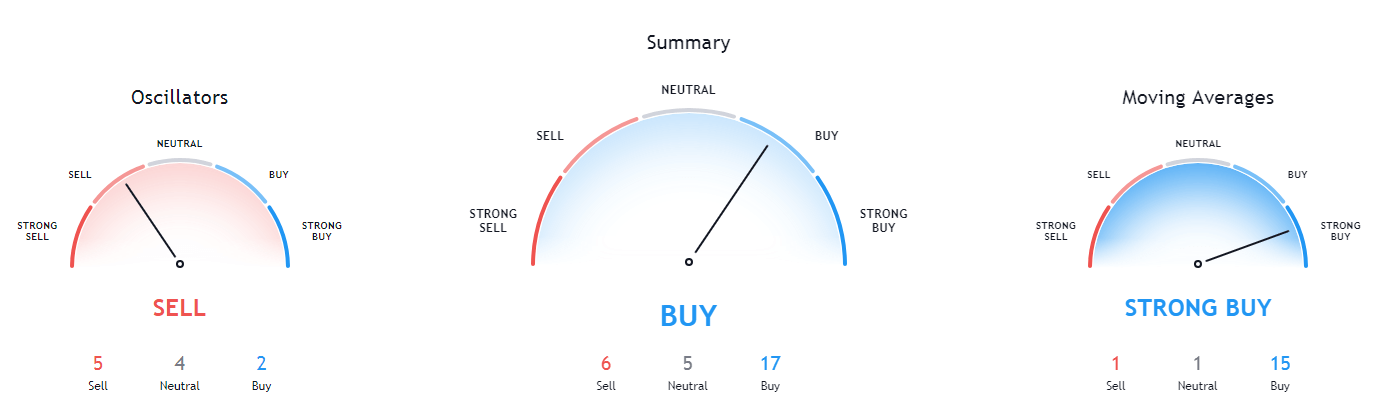
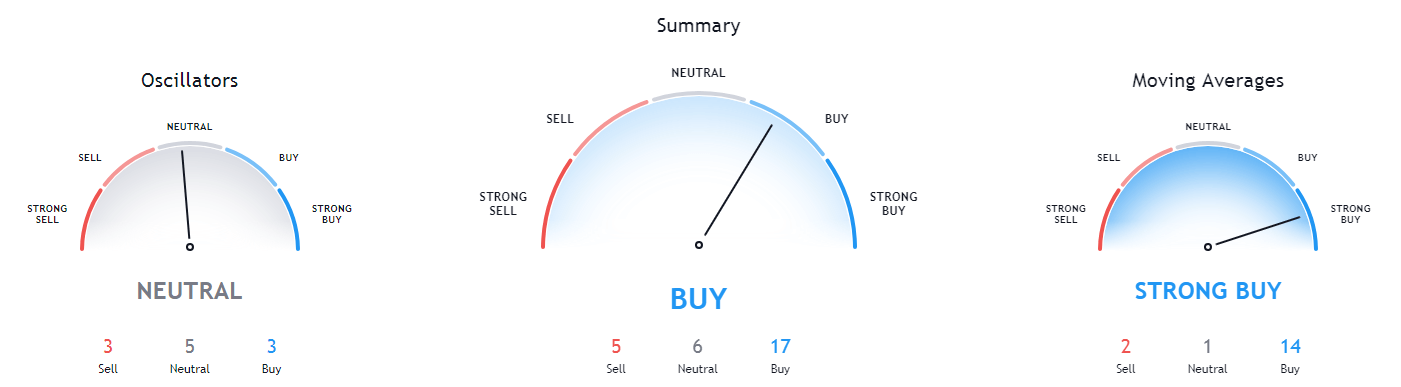
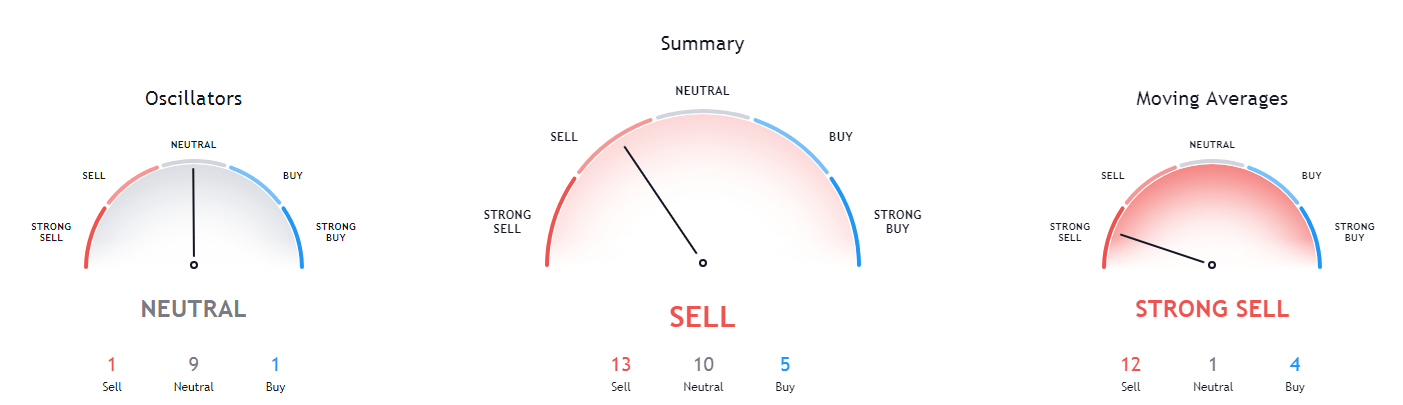
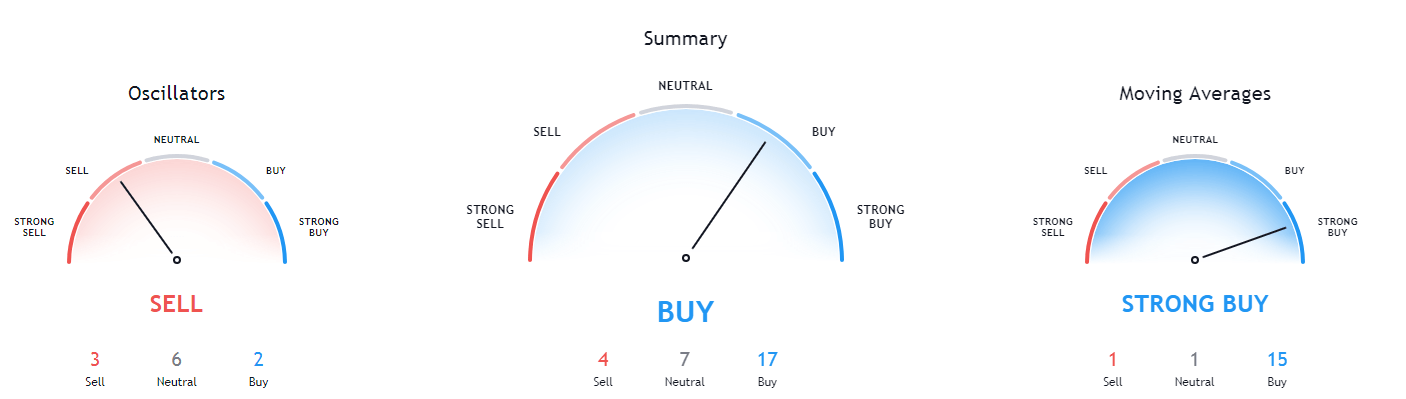
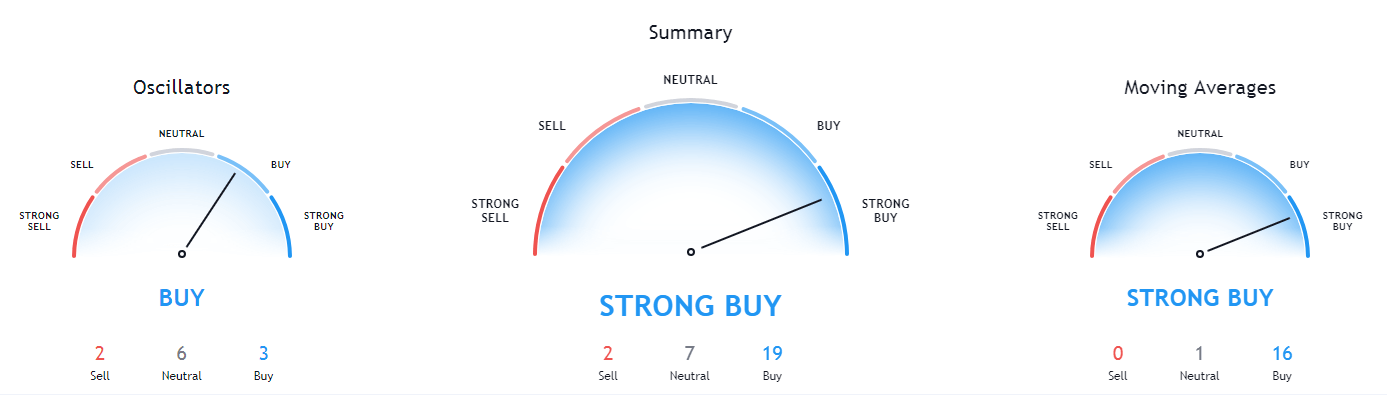
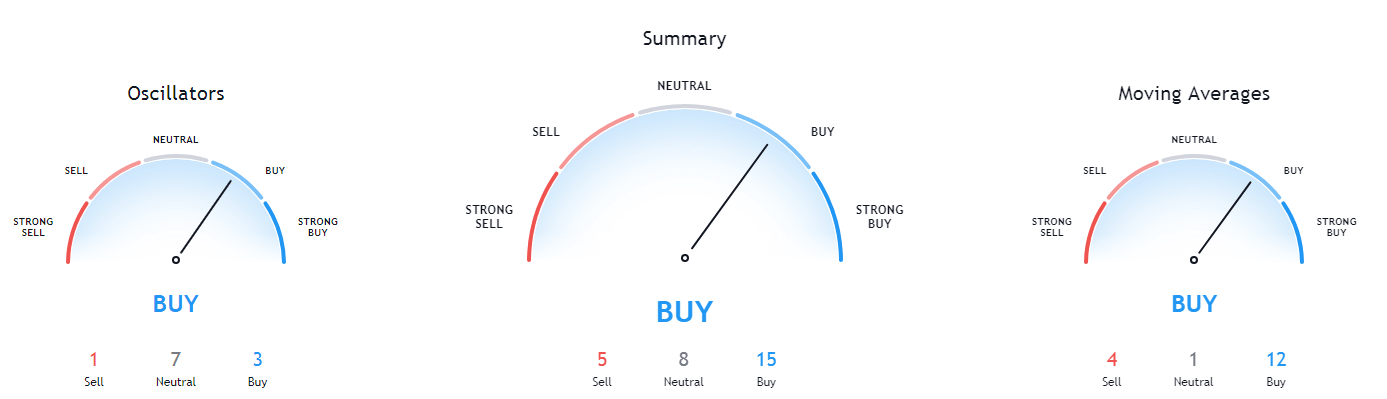
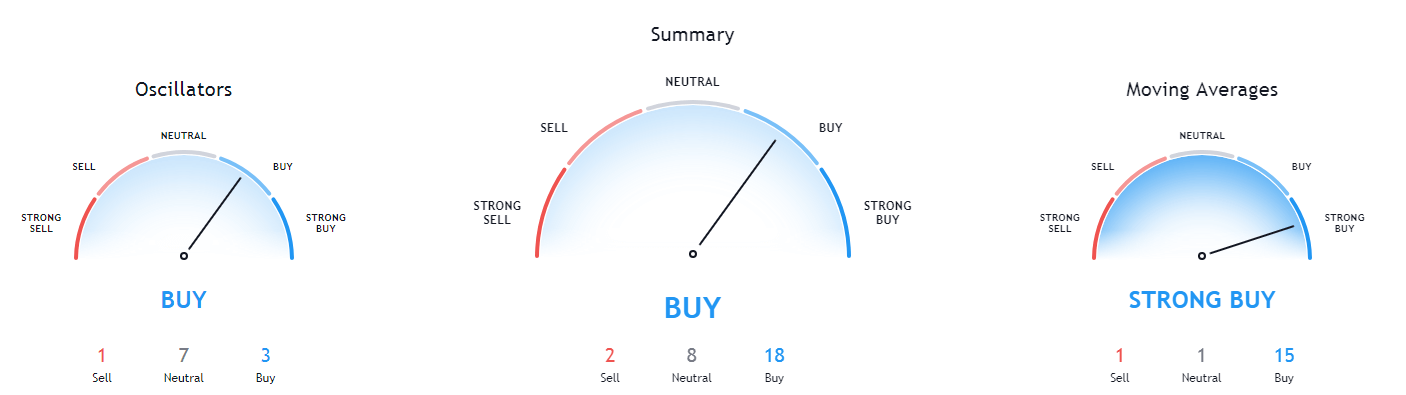
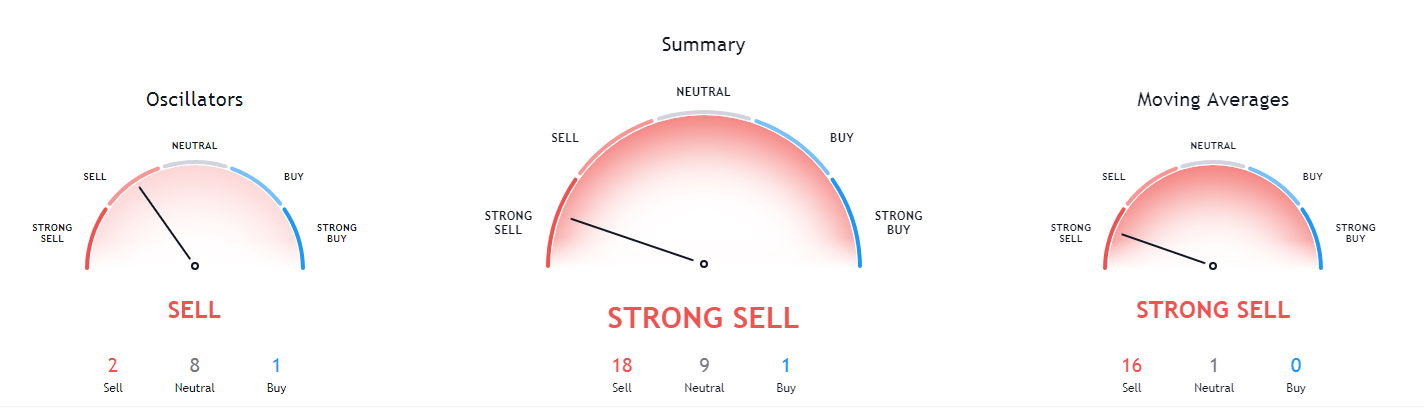
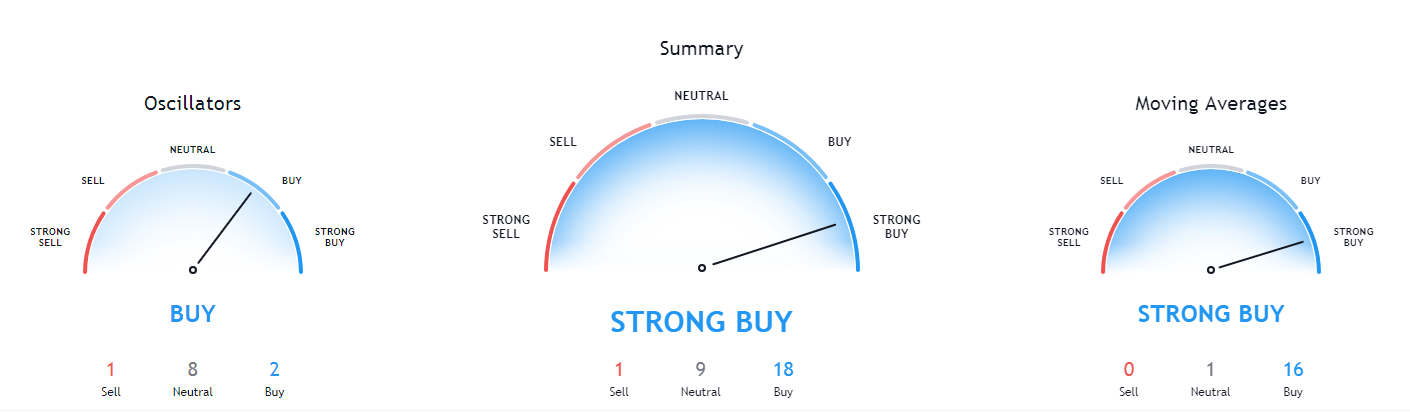
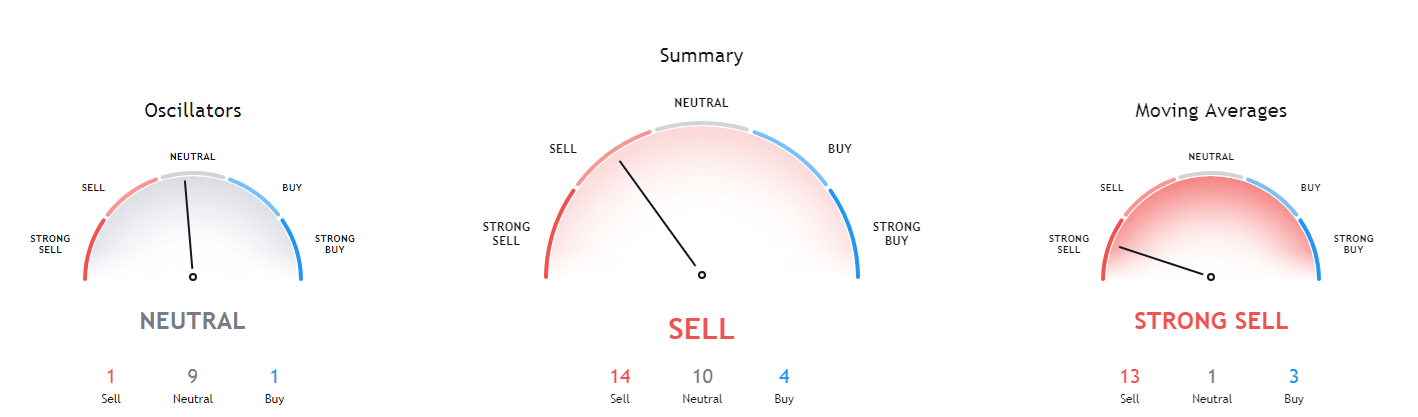
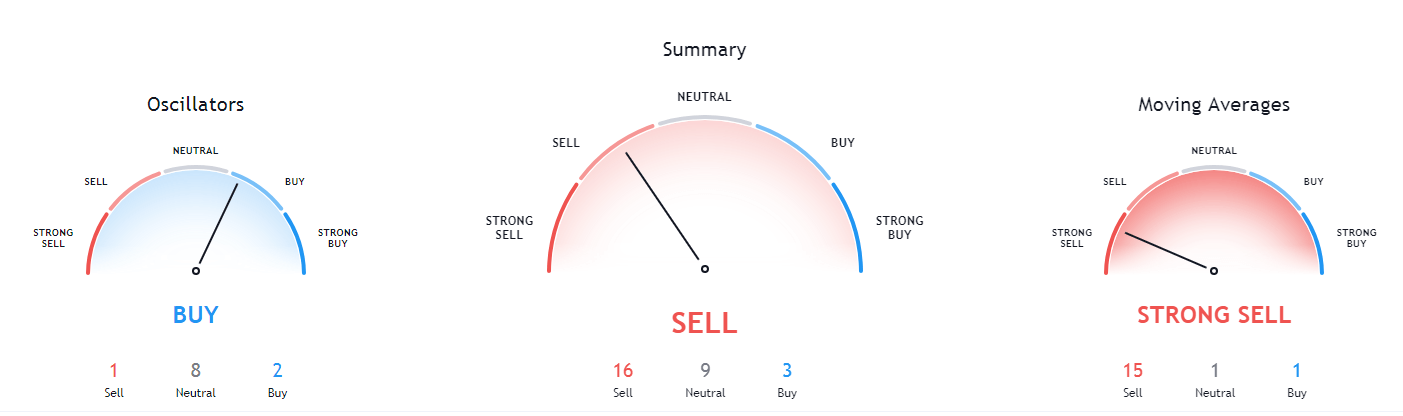
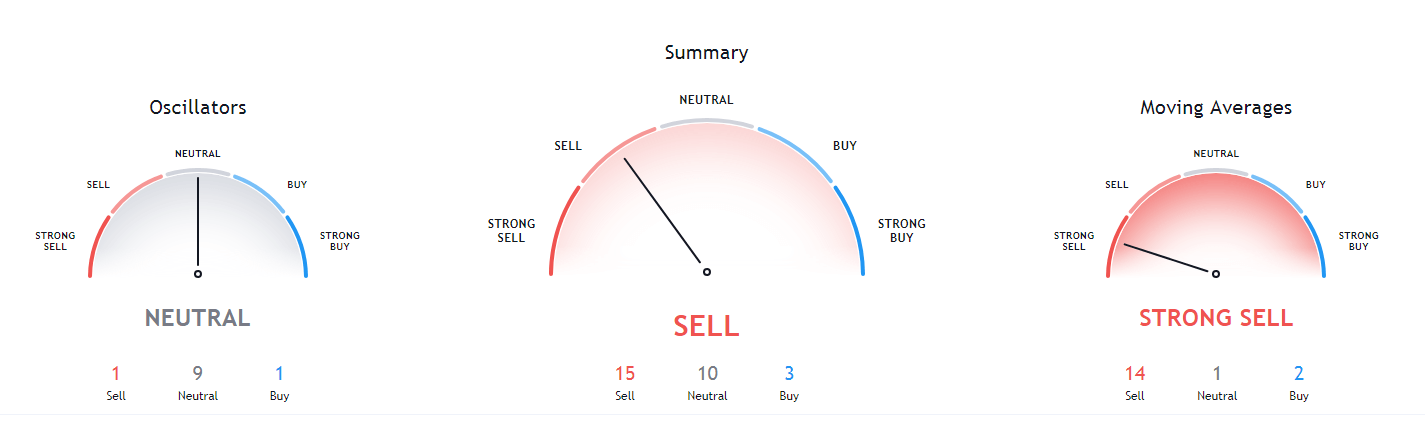
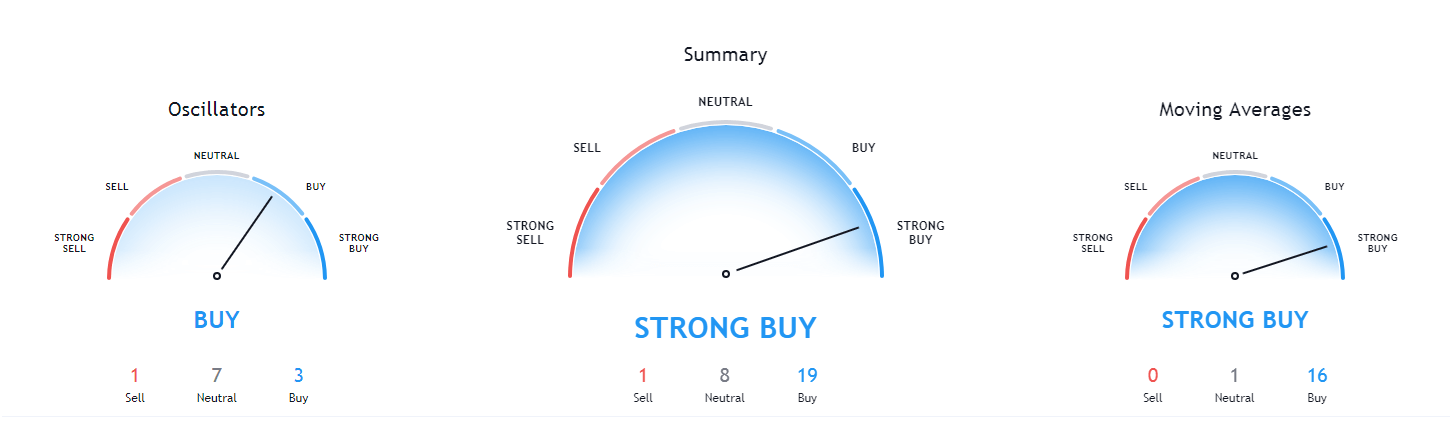
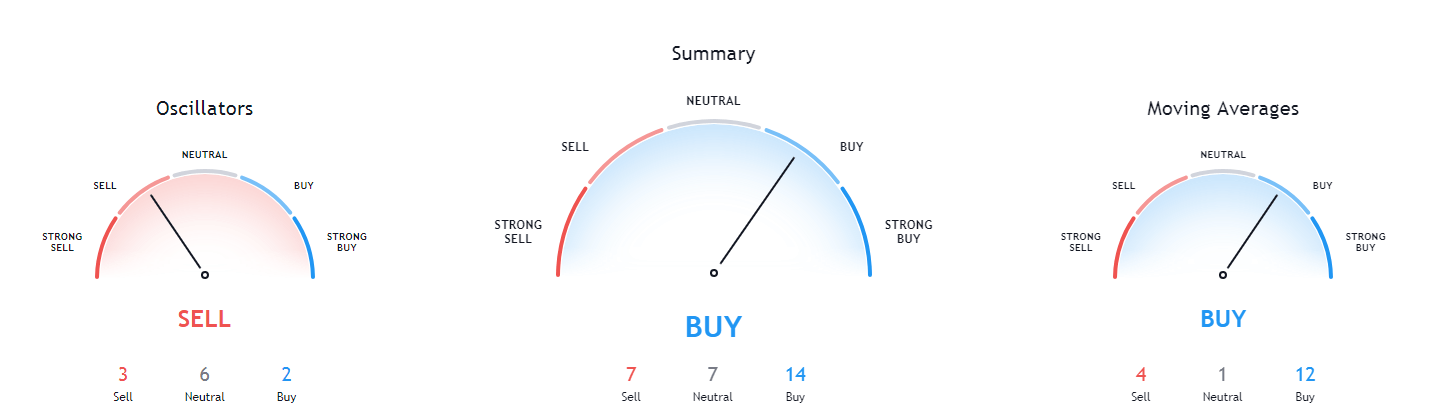
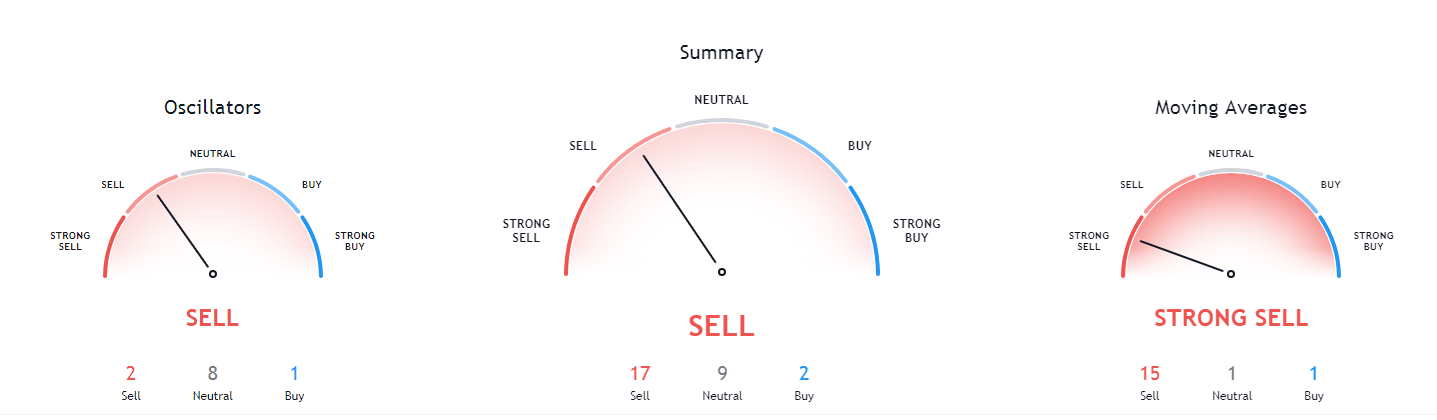
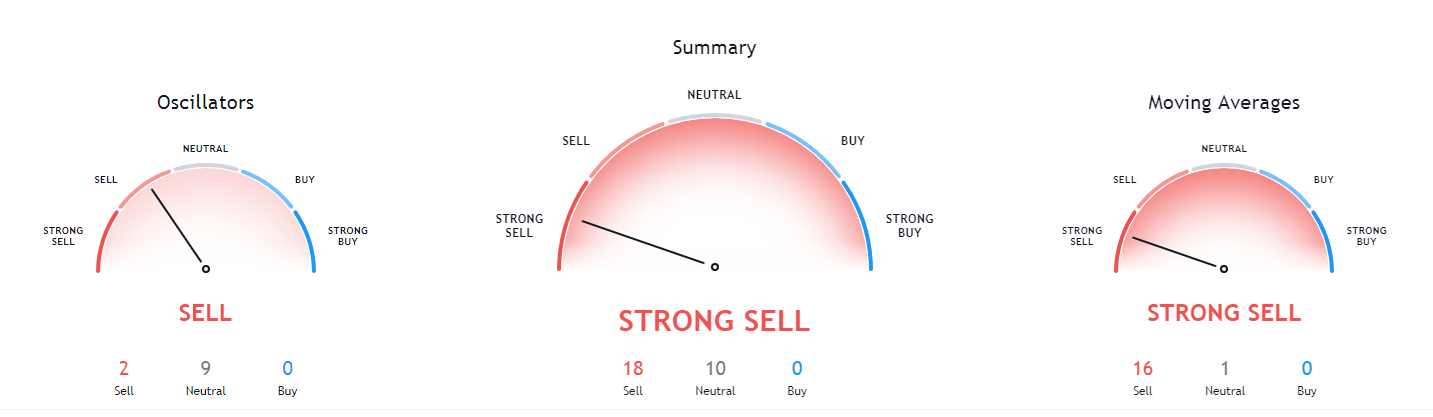
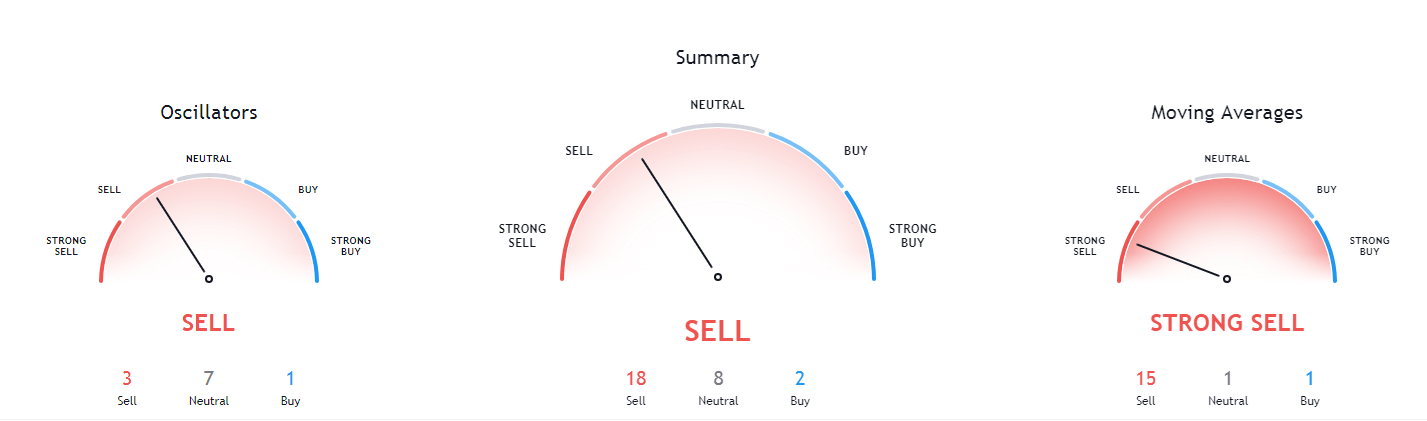
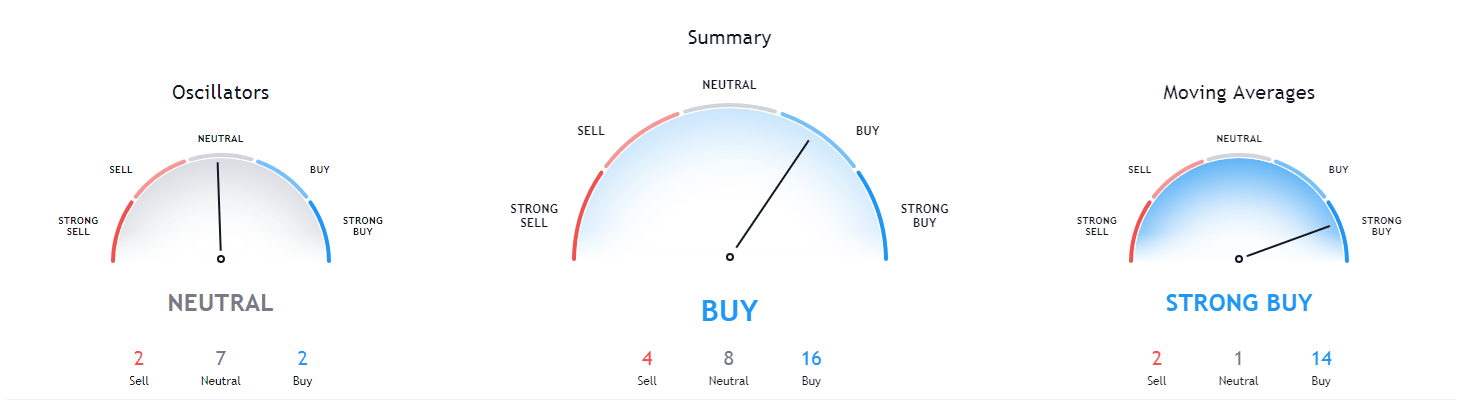
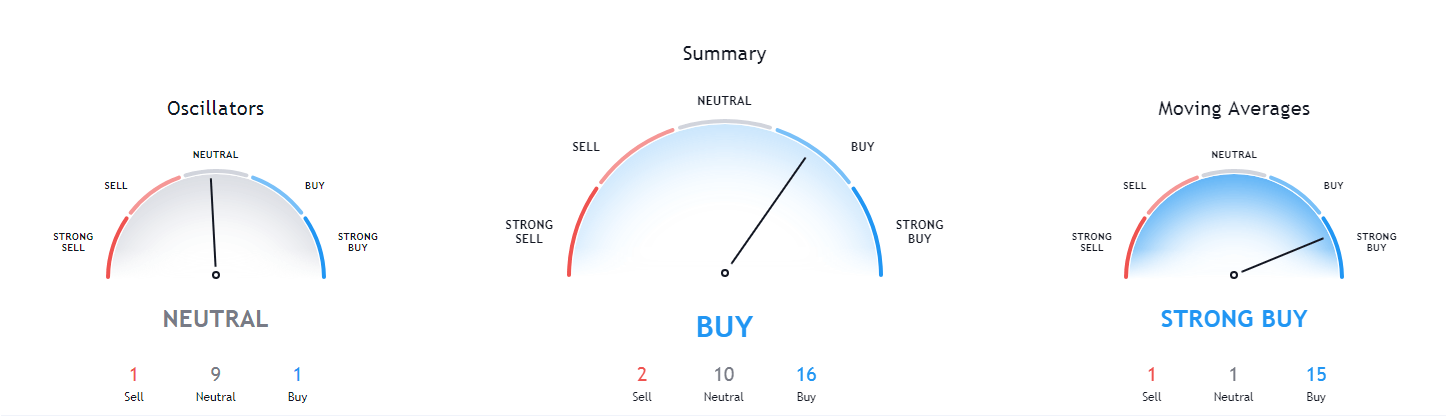
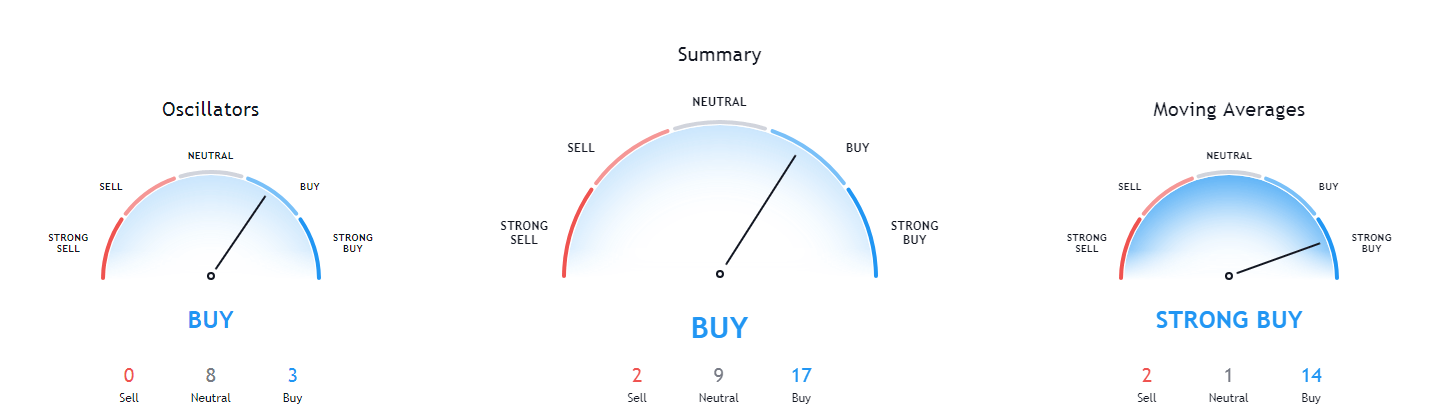
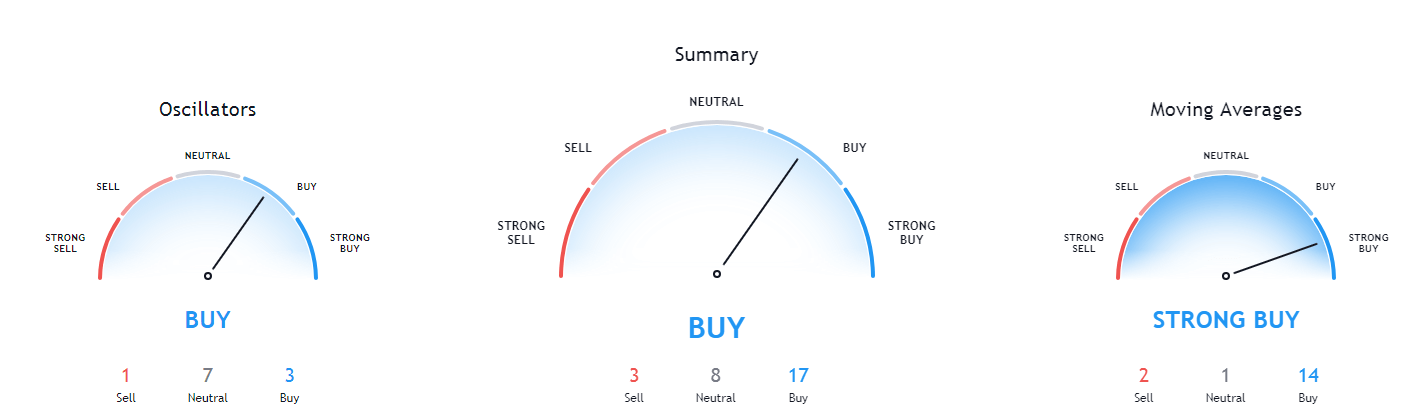
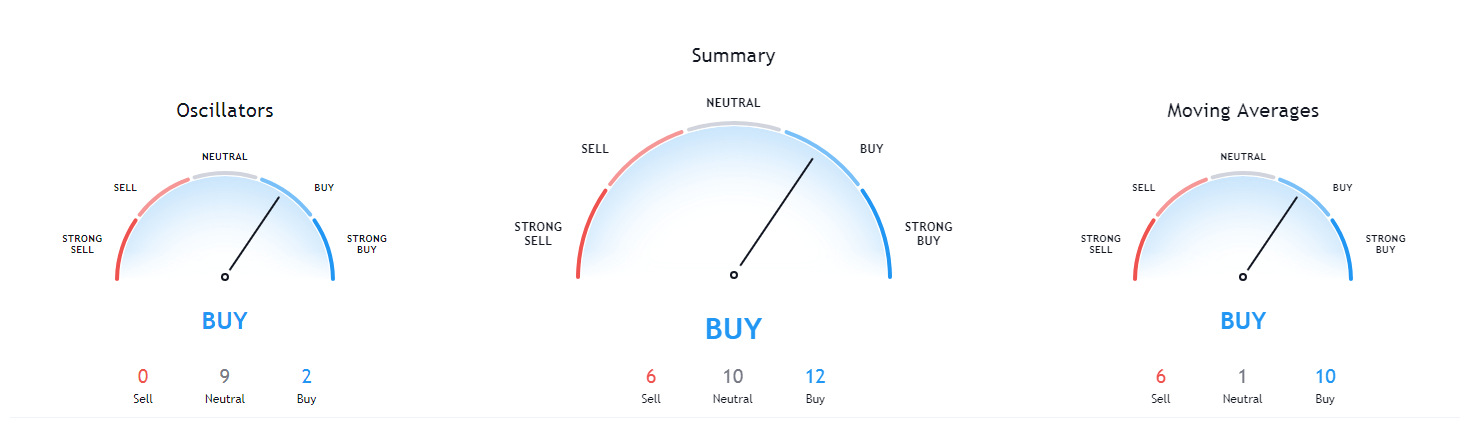
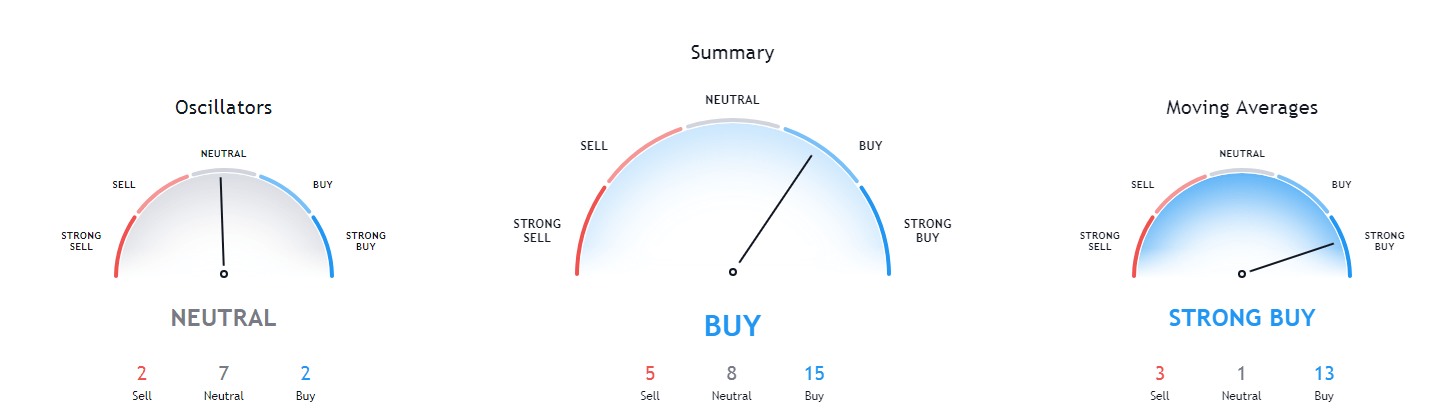
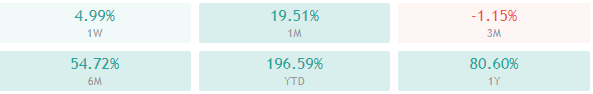
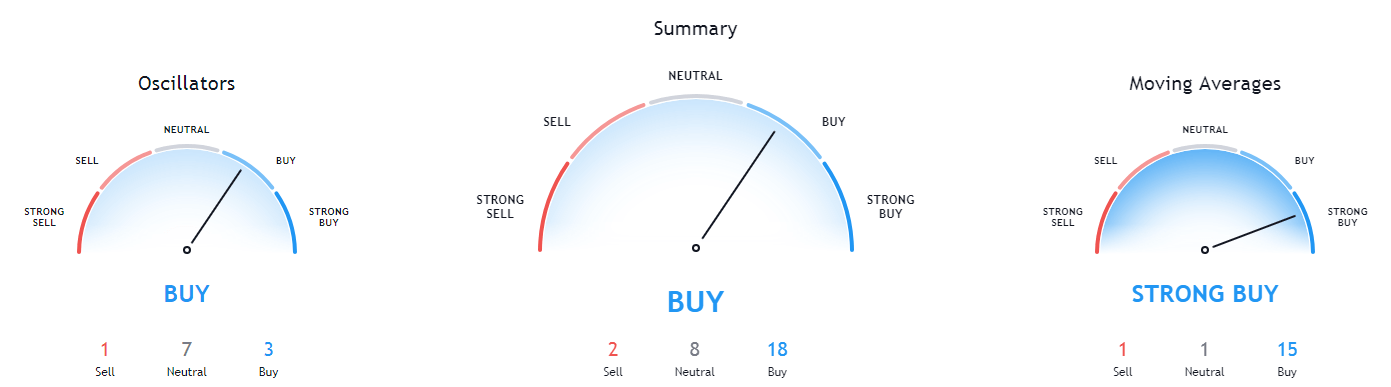
Bitcoin’s technical overview is extremely bullish on all time-frames, with longer time-frames showing even stronger bull overview than the shorter ones.
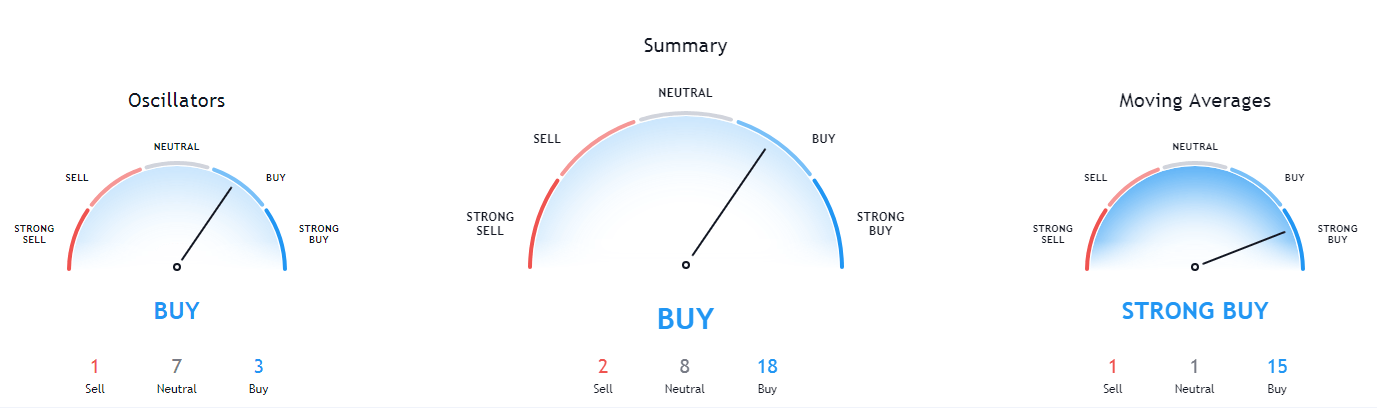
BTC/USD 1-day Technicals
Technical factors (4-hour Chart):
- Price is above both its 50-period EMA and 21-period EMA
- Price is at the middle Bollinger band
- RSI is descending (57.23)
- Volume is above-average (descending
Key levels to the upside Key levels to the downside
1: $11,500 1: $11,300
2: $11,630 2: $11,180
3: $12,000 3: $11,000
Ethereum
Ethereum also experienced a pullback from its highs as ETH bulls couldn’t go past $496. However, unlike Bitcoin, Ethereum didn’t break any support levels during the move towards the downside. As it bounced off of the $378 support level, it continued moving alongside a very steep upwards-trending line, which is a very bullish short-term sign.
While moving alongside this line is unsustainable in the long-term, Ethereum might experience some more stable gains in the next couple of days.
ETH/USD 4-hour Chart
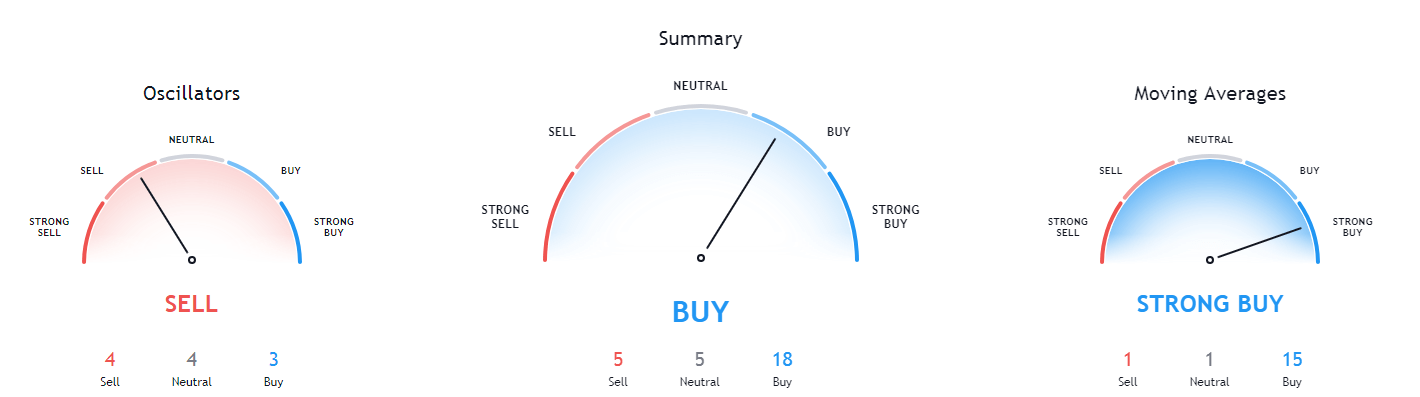
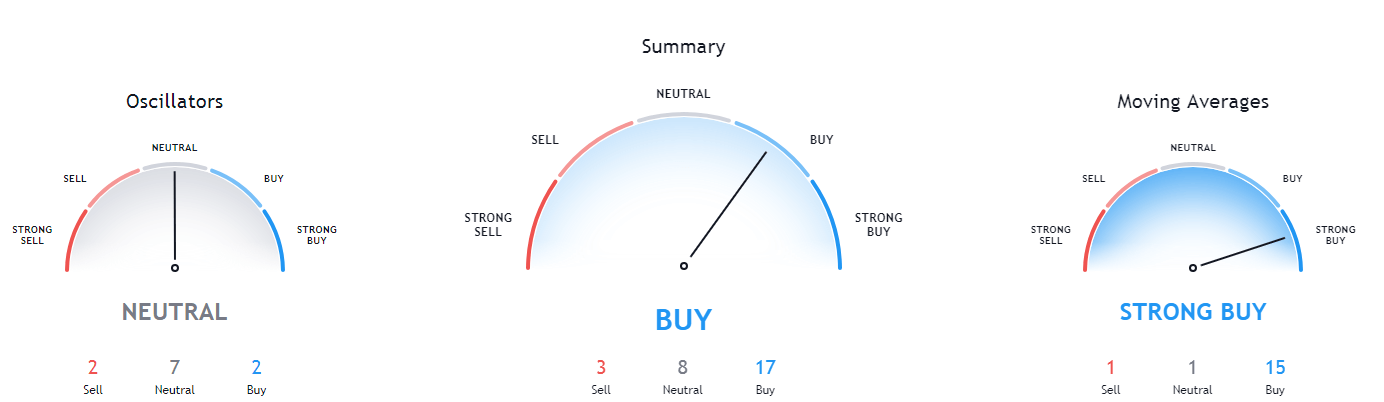
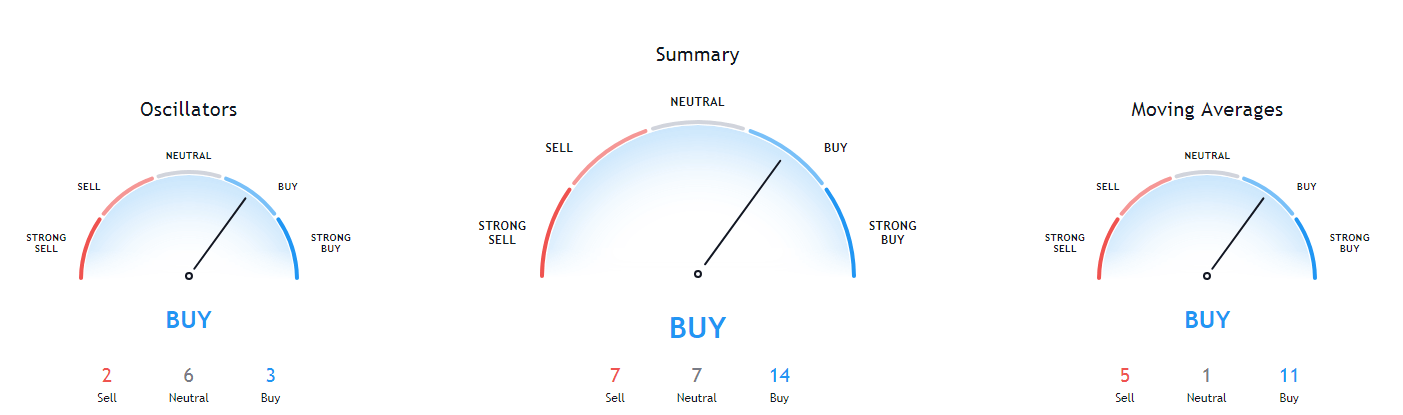
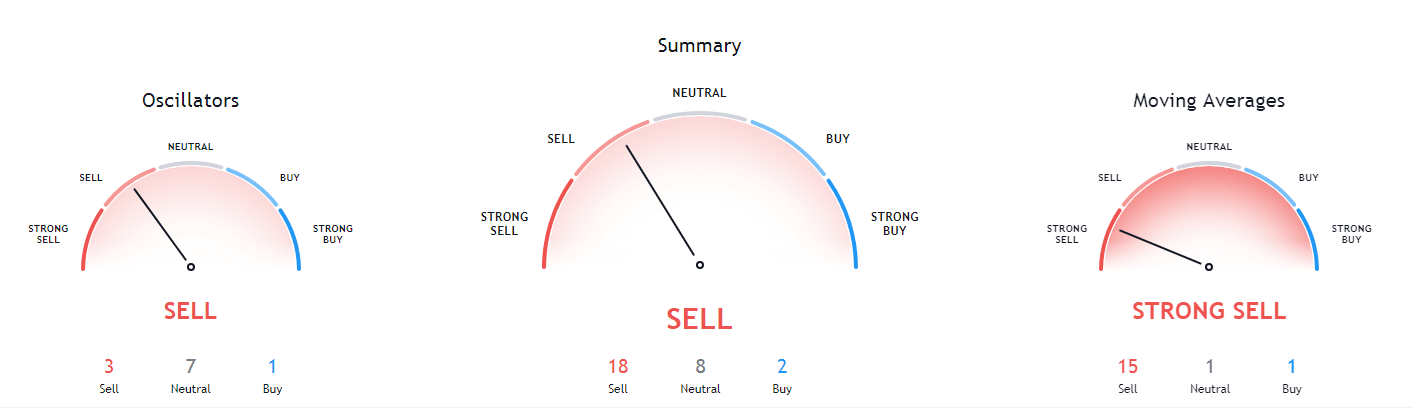
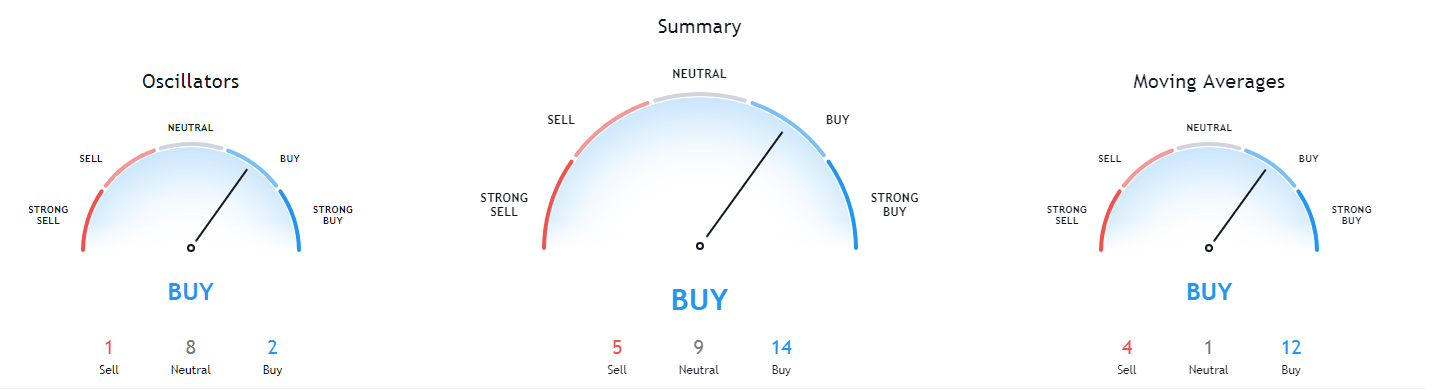
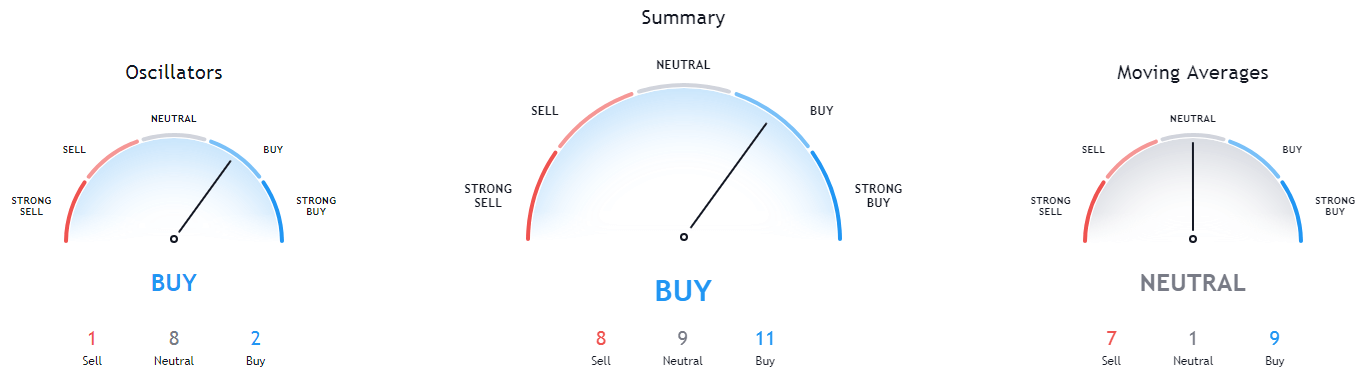
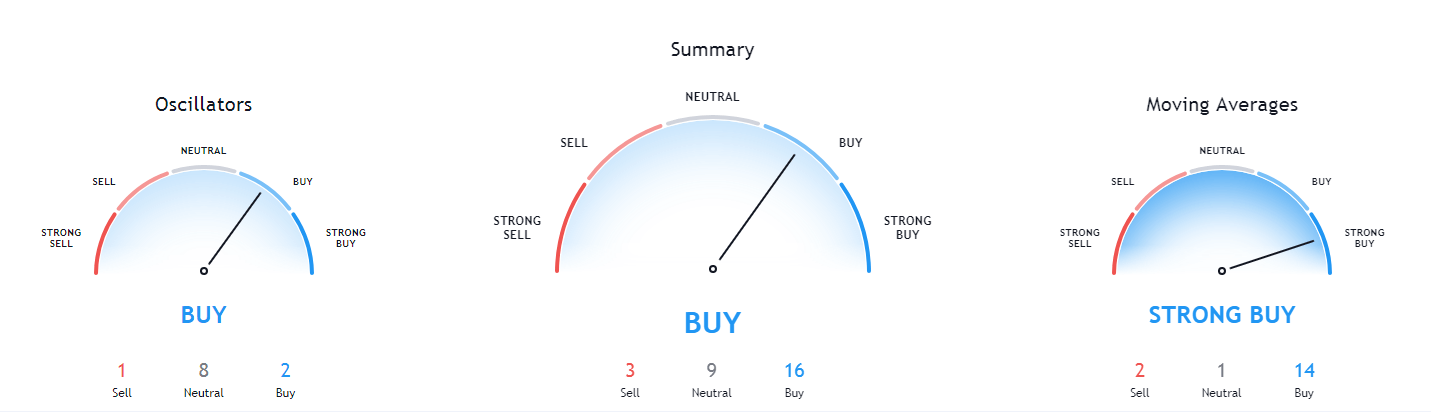
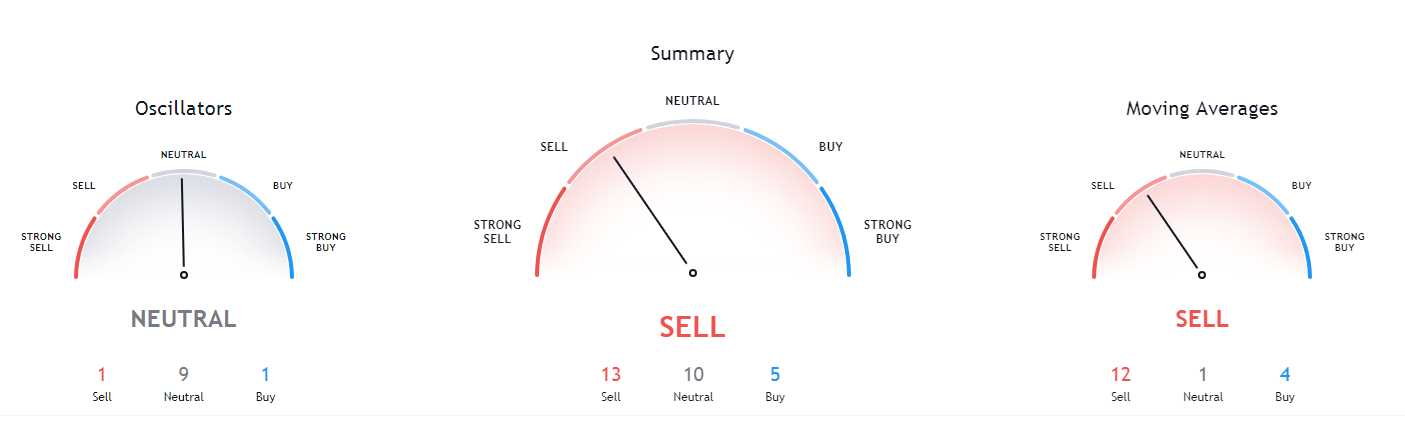
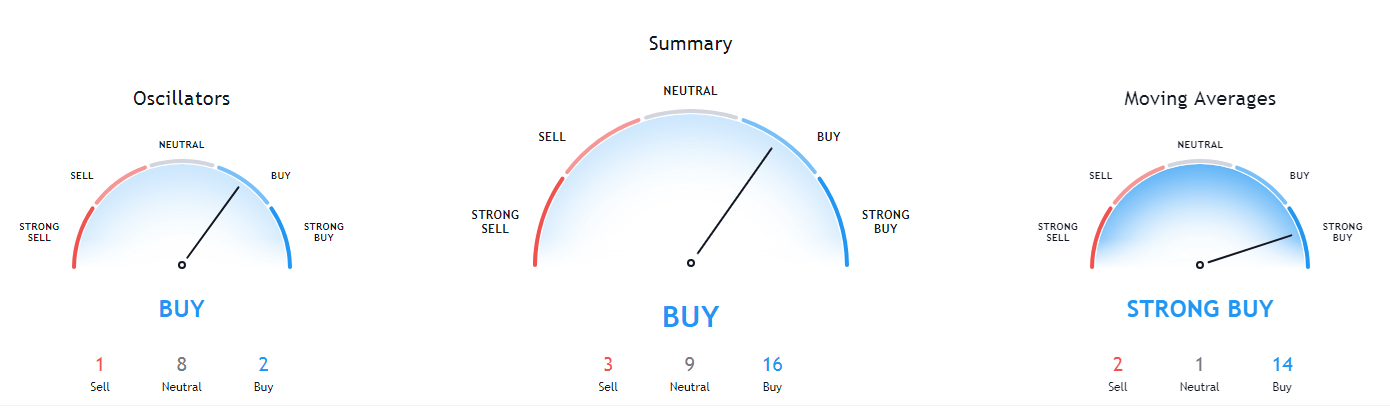
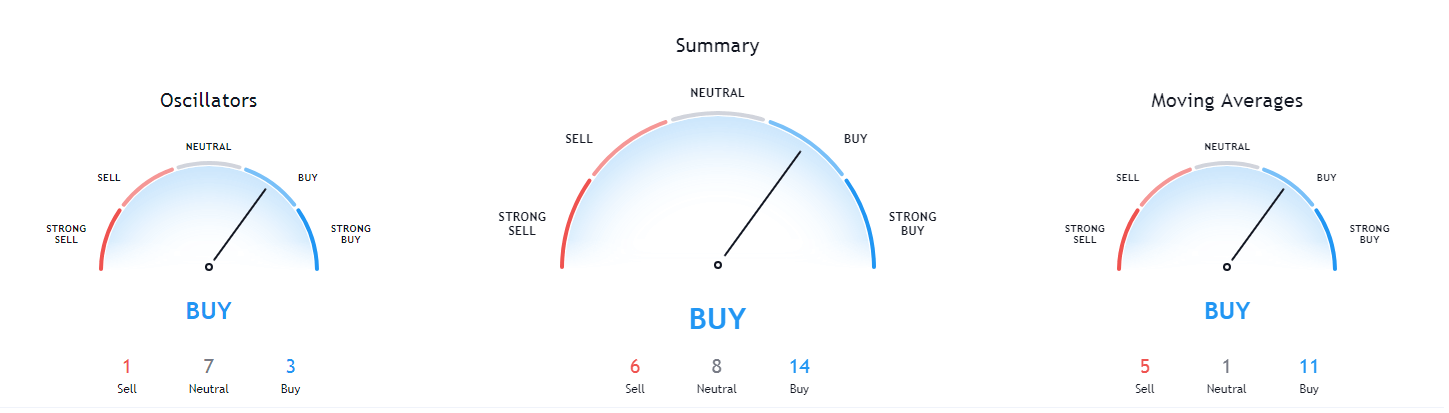
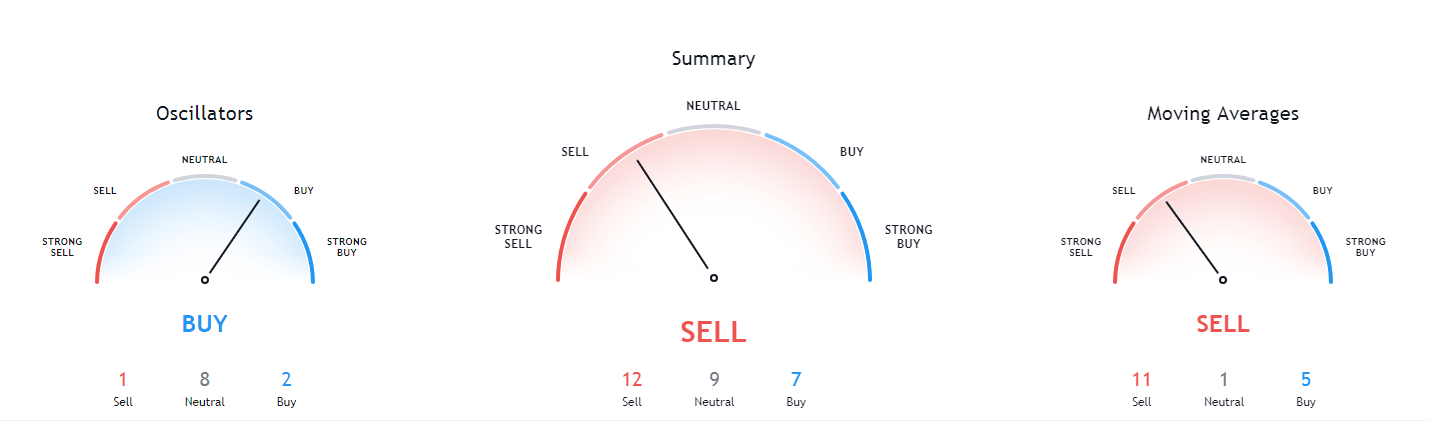
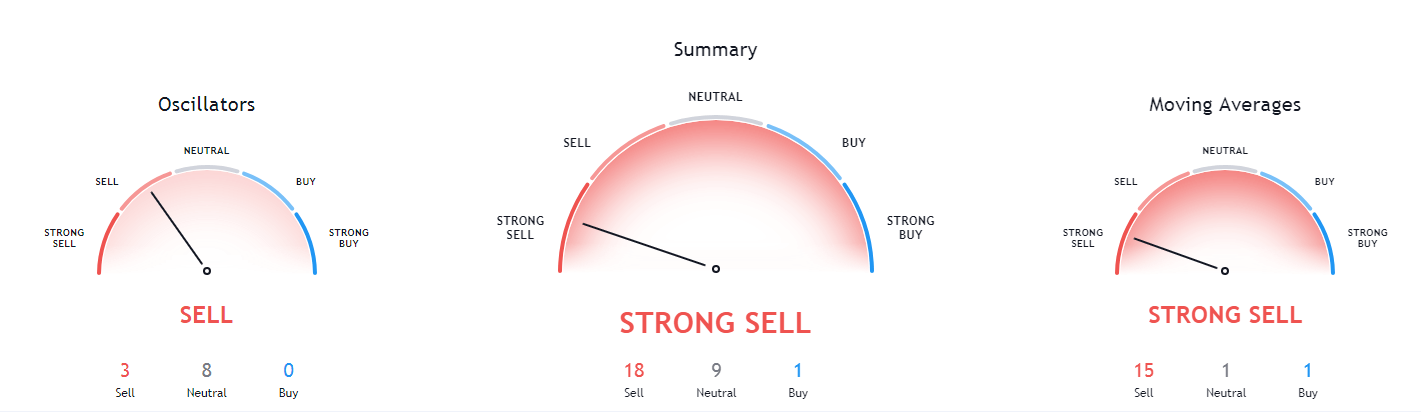
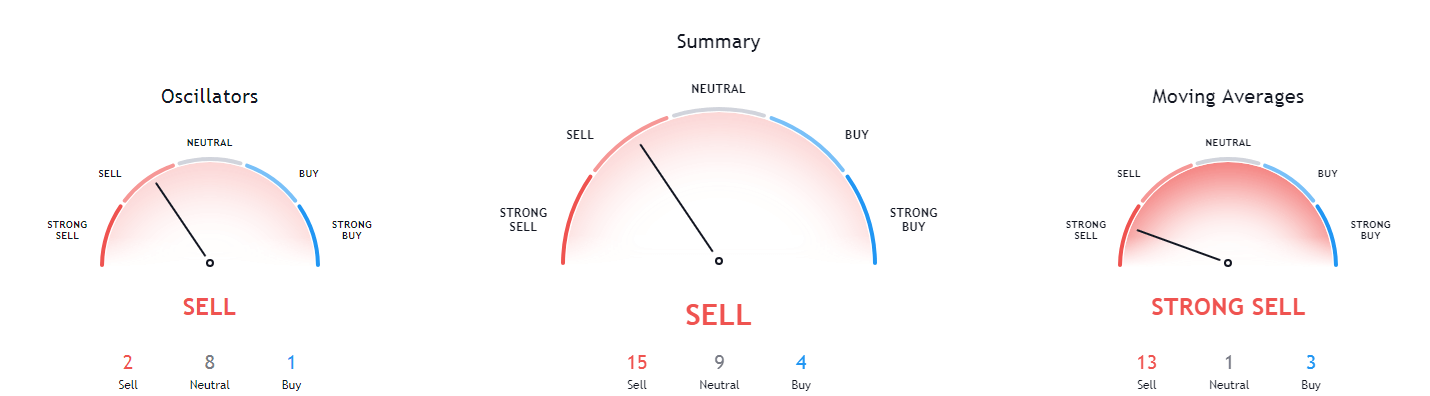
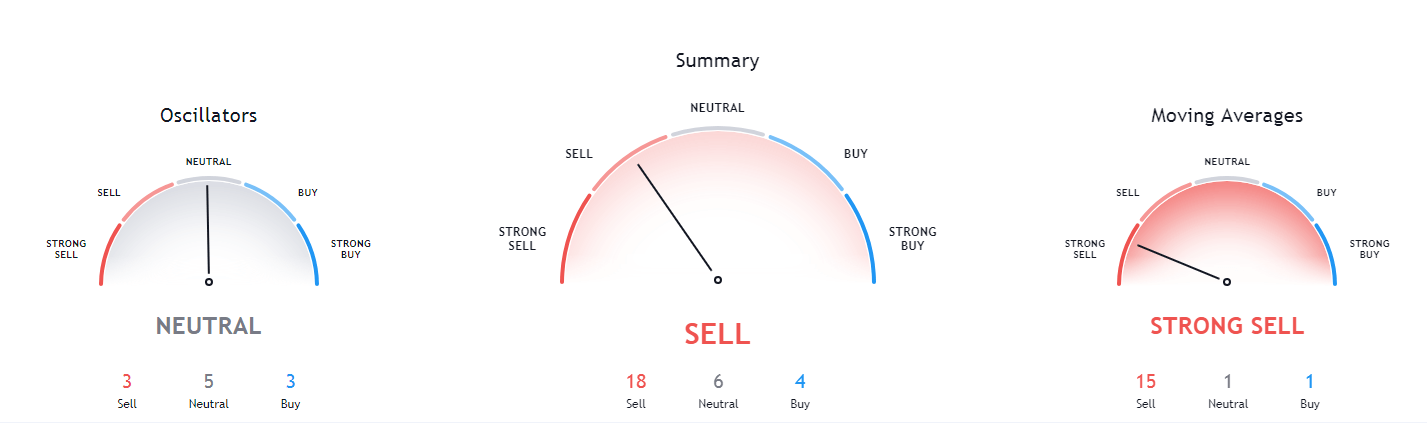
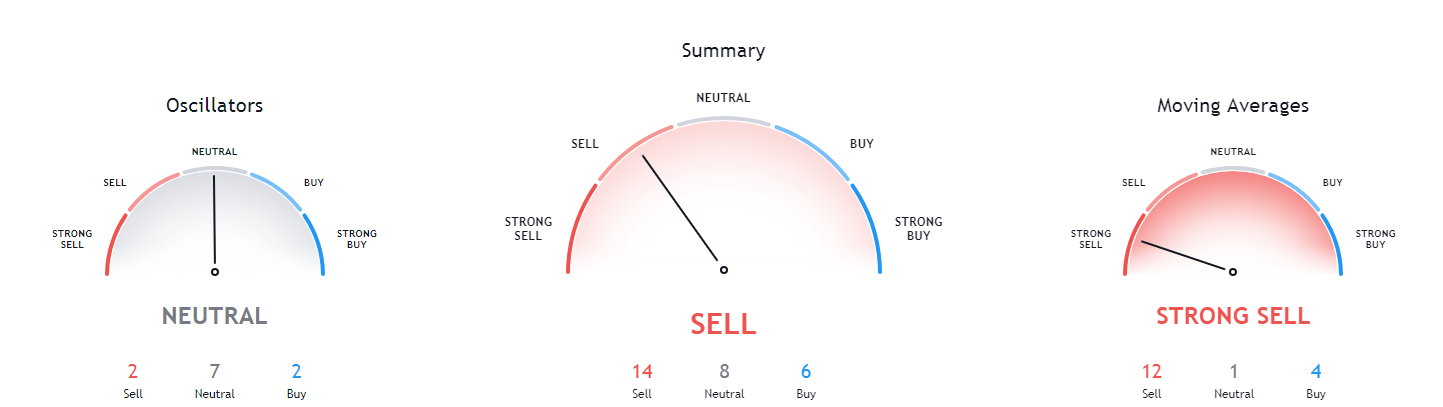
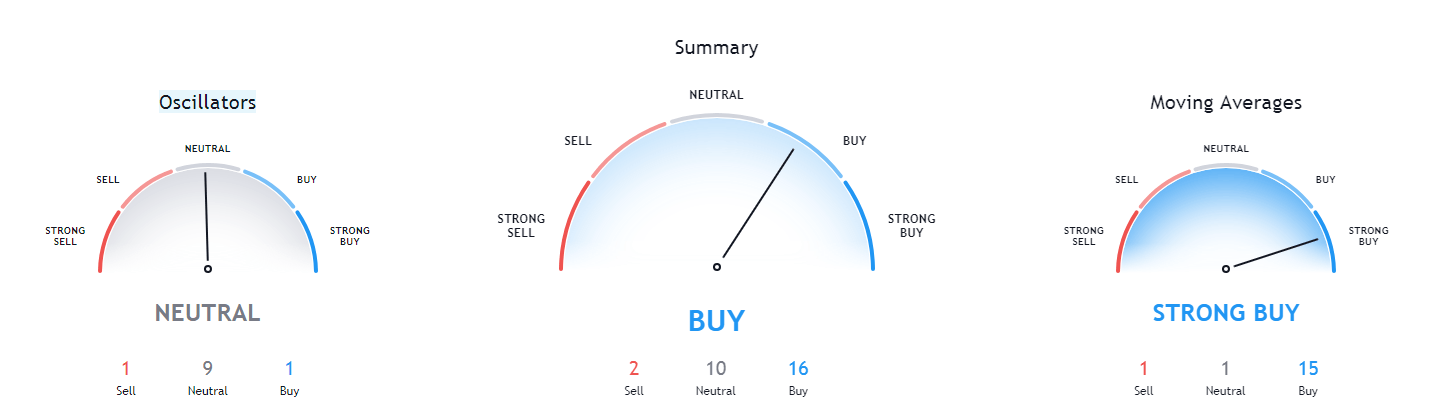
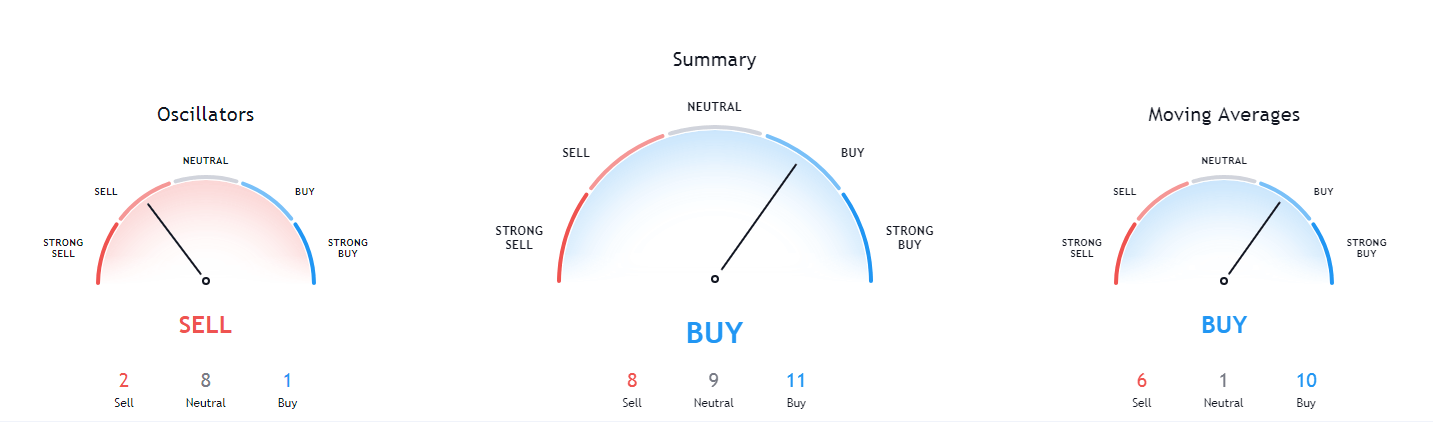
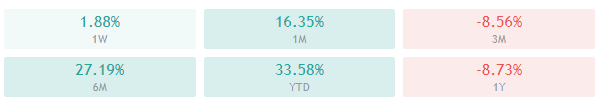
Ethereum’s 1-day and weekly overviews extreme tilt towards the bull-side, while its 4-hour and monthly overviews show a bit of indecisiveness, though they are still bullish.
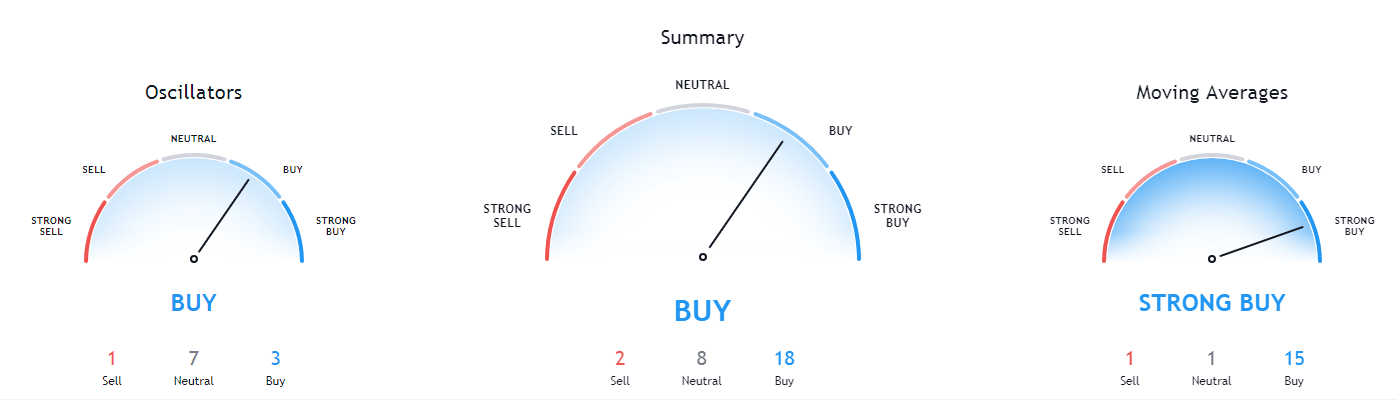
ETH/USD 1-day Technicals
Technical Factors (4-hour Chart):
- The price is above both its 50-period and its 21-period EMA
- The price slightly above its middle Bollinger band
- RSI is neutral (60.70)
- Volume is elevated (descending to average)
Key levels to the upside Key levels to the downside
1: $378 1: $371
2: $400 2: $360
3: $415 3: $334
Ripple
XRP is known for being less correlated to Bitcoin’s movements than most other cryptocurrencies, which it has shown today as well. The third-largest cryptocurrency by market cap has traded sideways and hasn’t experienced any pullbacks. It has been trading alongside the upward-trending (yellow) line, which will force XRP to either go under it or face its resistance at the $0.26 level. In the meantime, however, we may expect low volatility.
XRP/USD 4-hour Chart
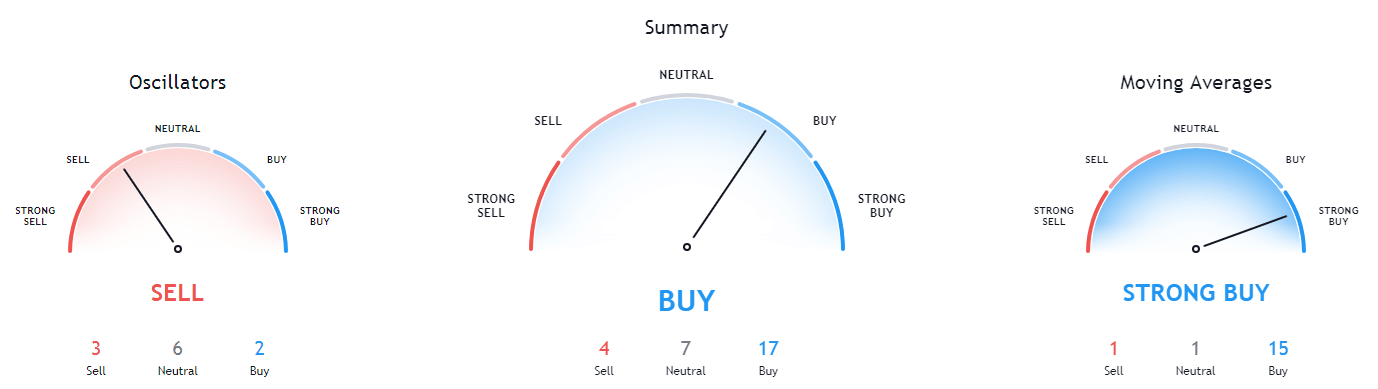
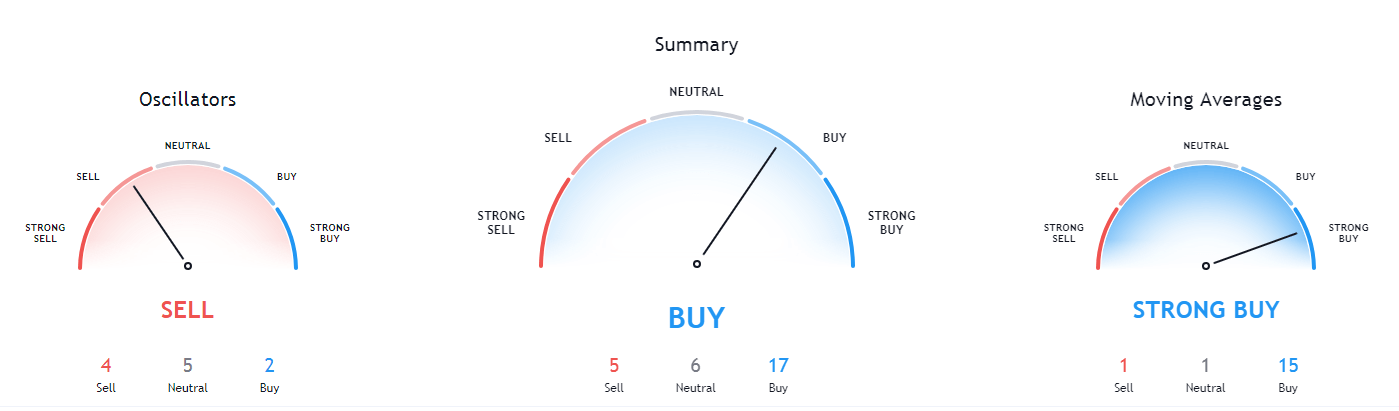
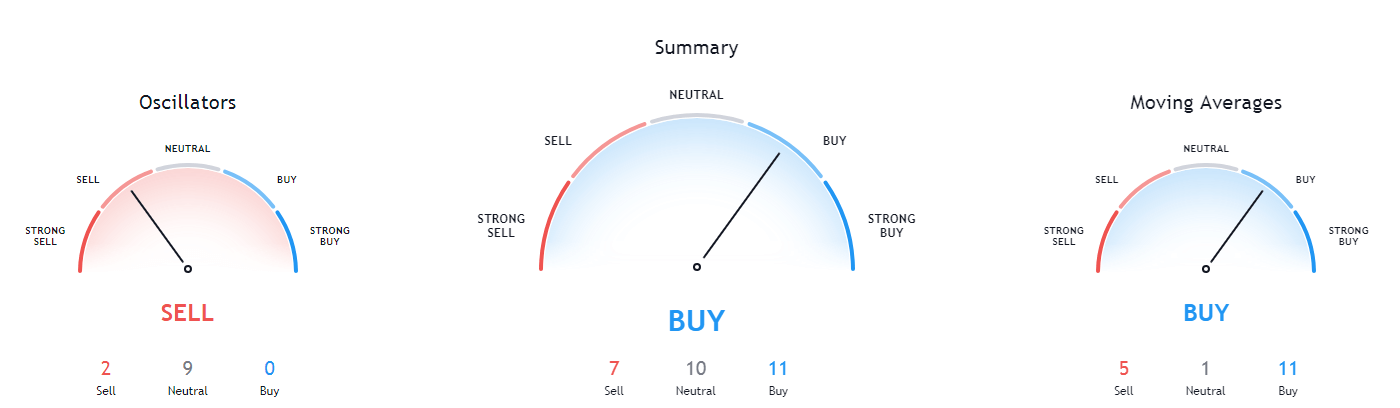
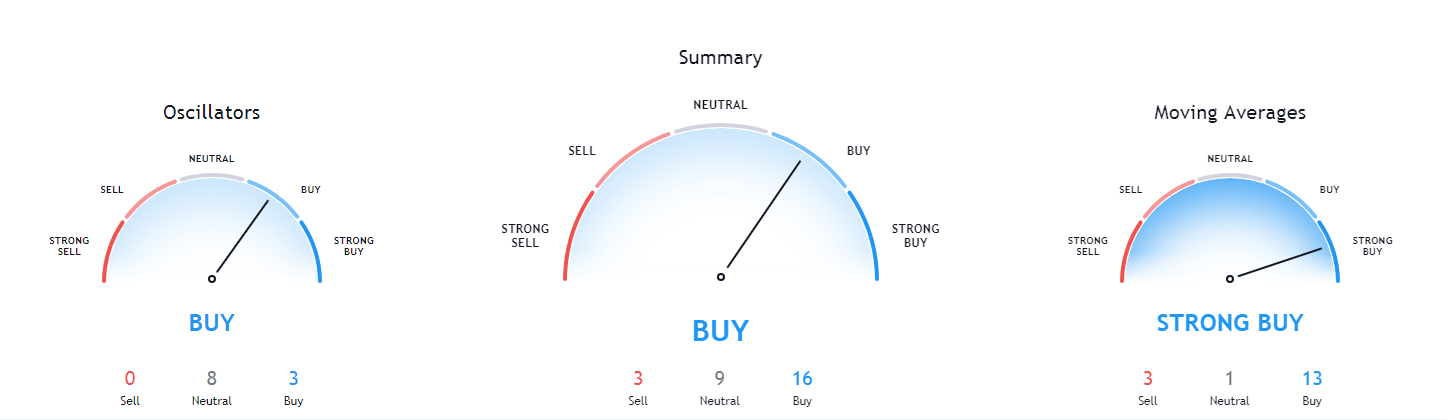
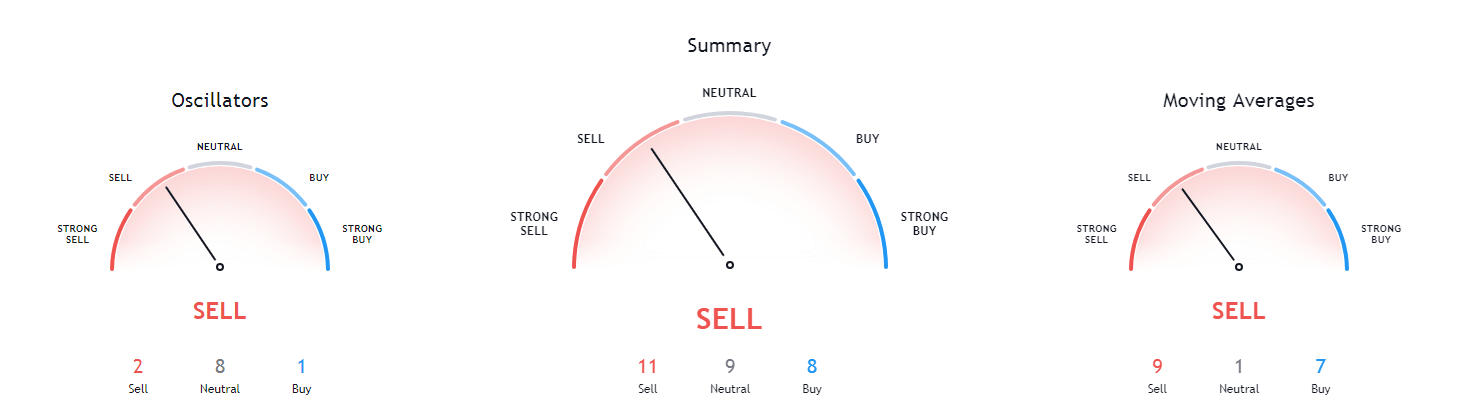
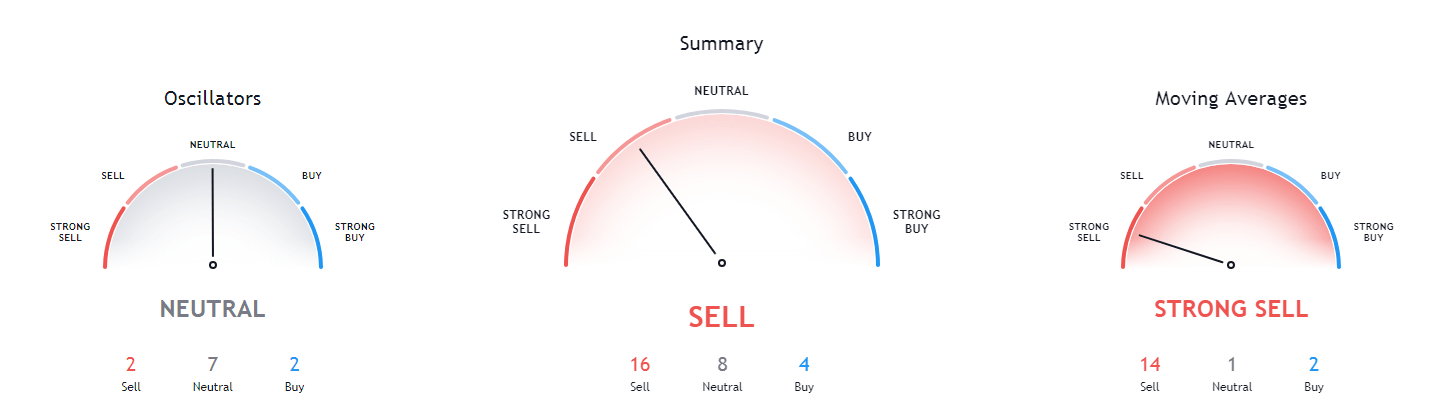
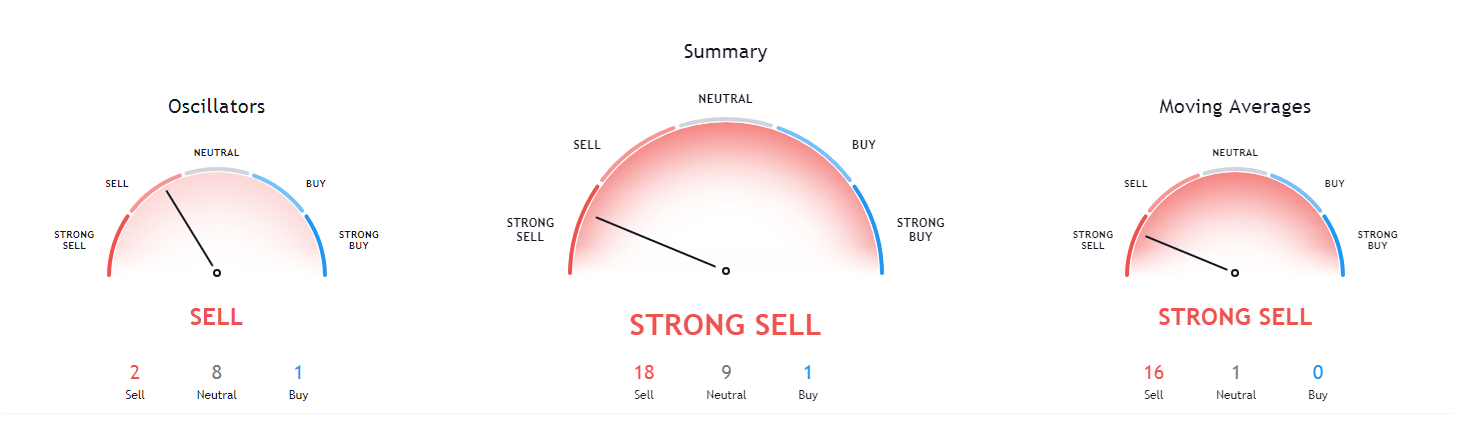
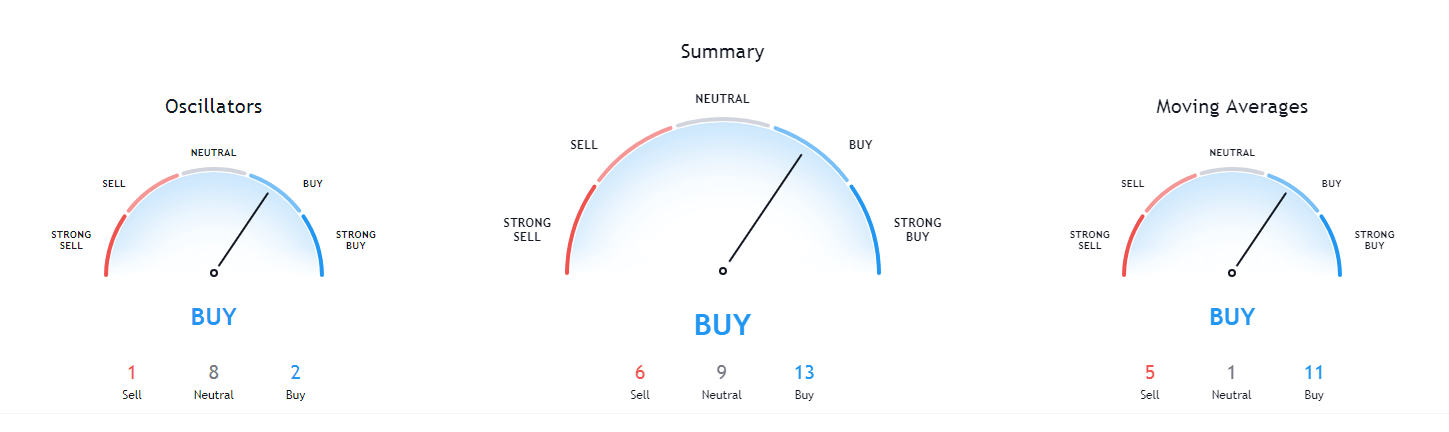
XRP’s technicals are quite inconsistent, as its daily and weekly overviews show quite a bullish tilt, while its monthly overview is almost completely bearish. Its 4-hour overview is leaning towards the buy-side but is quite neutral.
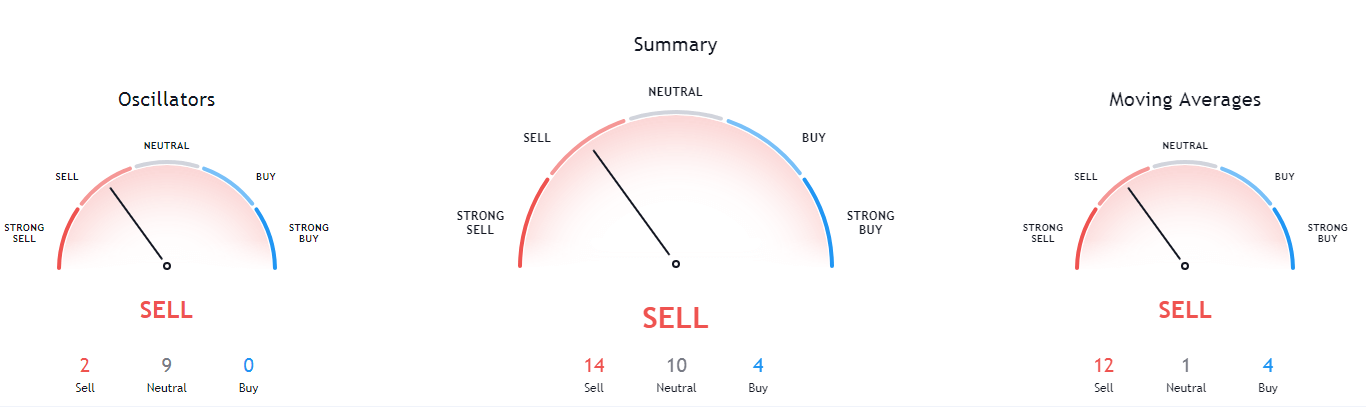
XRP/USD 1-day Technicals
Technical factors (4-hour Chart):
- The price is above its 50-period EMA as well as its 21-period EMA
- Price is at its middle Bollinger band
- RSI is flat (52.19)
- Volume is average but descending
Key levels to the upside Key levels to the downside
1: $0.266 1: $0.2454
2: $0.27 2: $0.235
3: $0.273 3: $0.227