General Overview
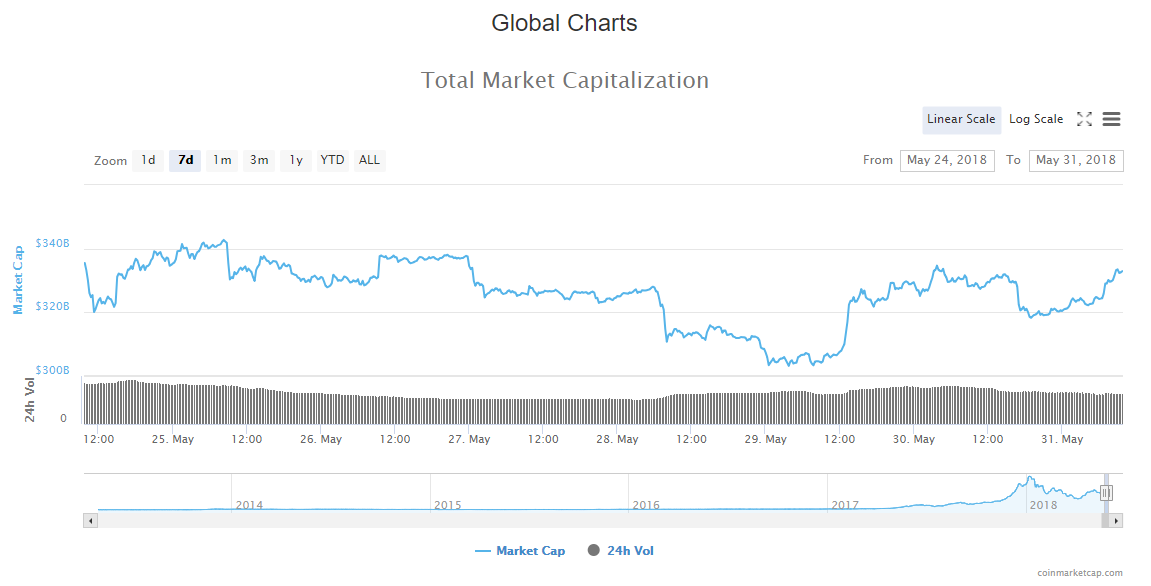
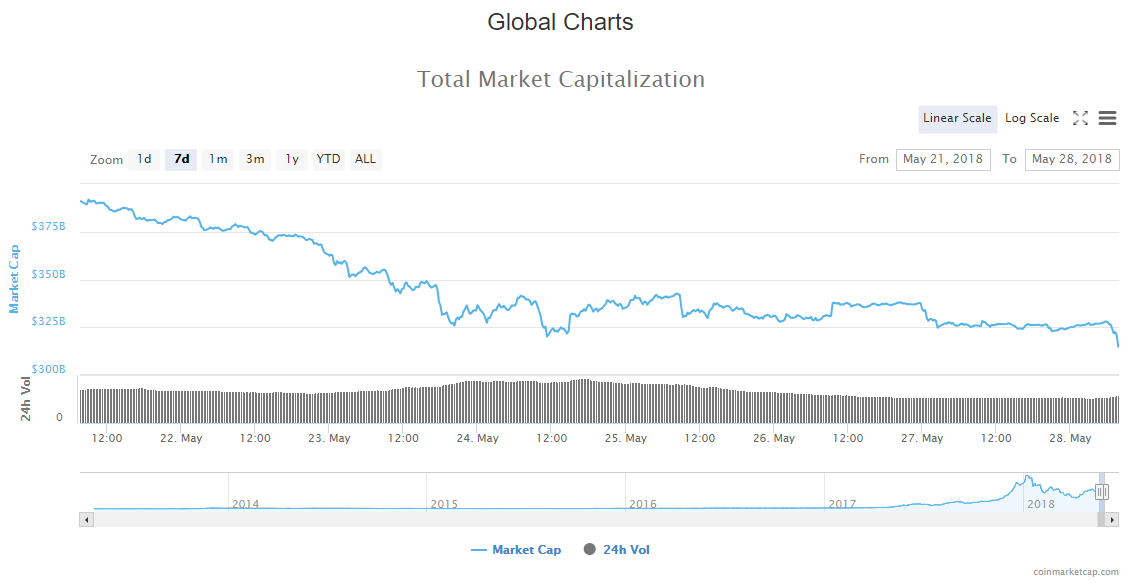
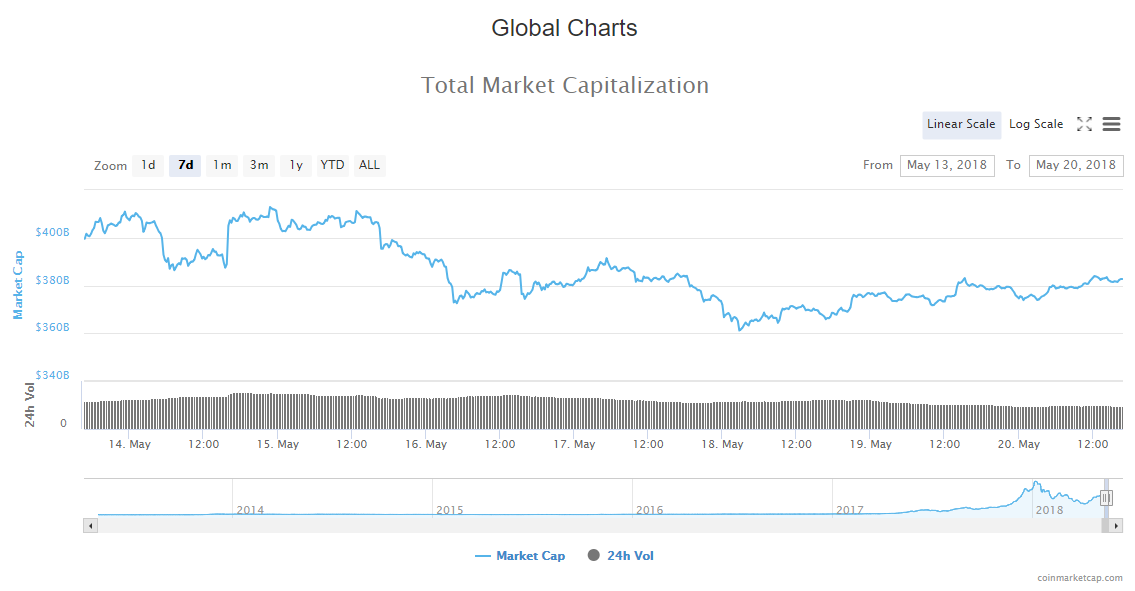
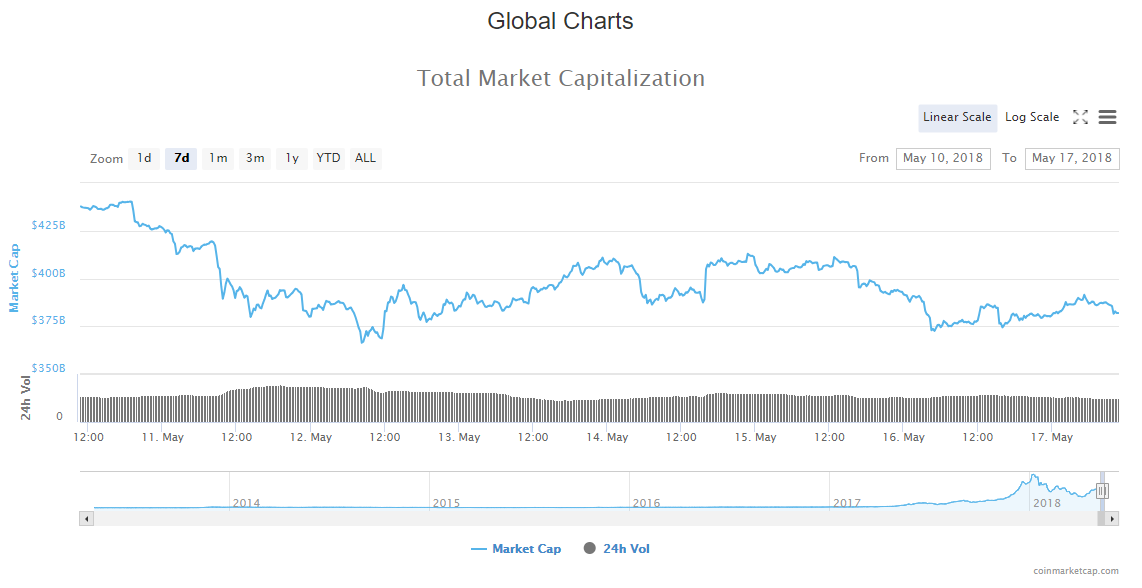
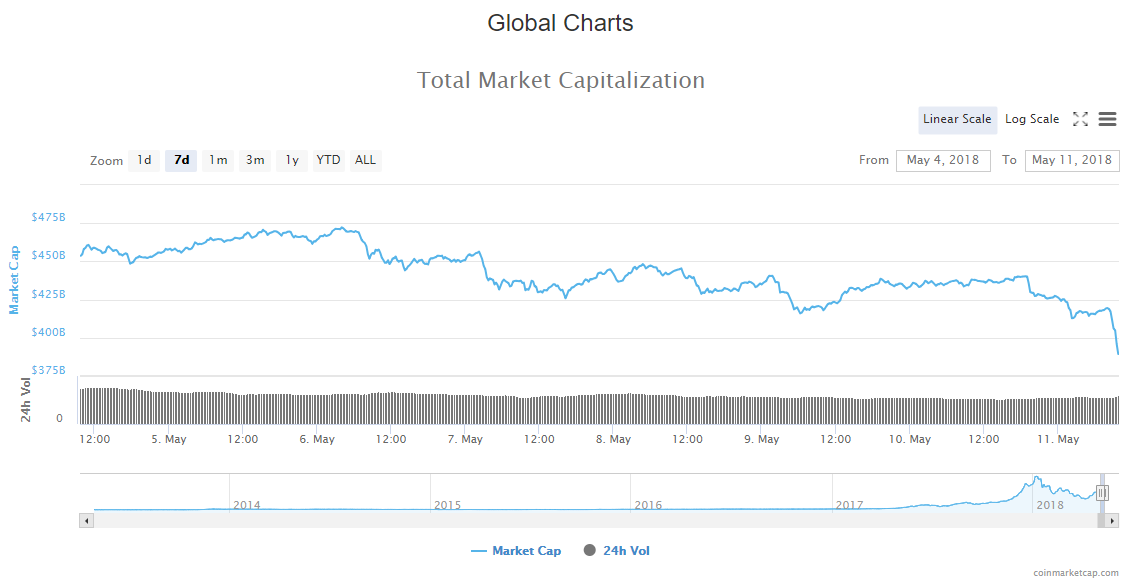
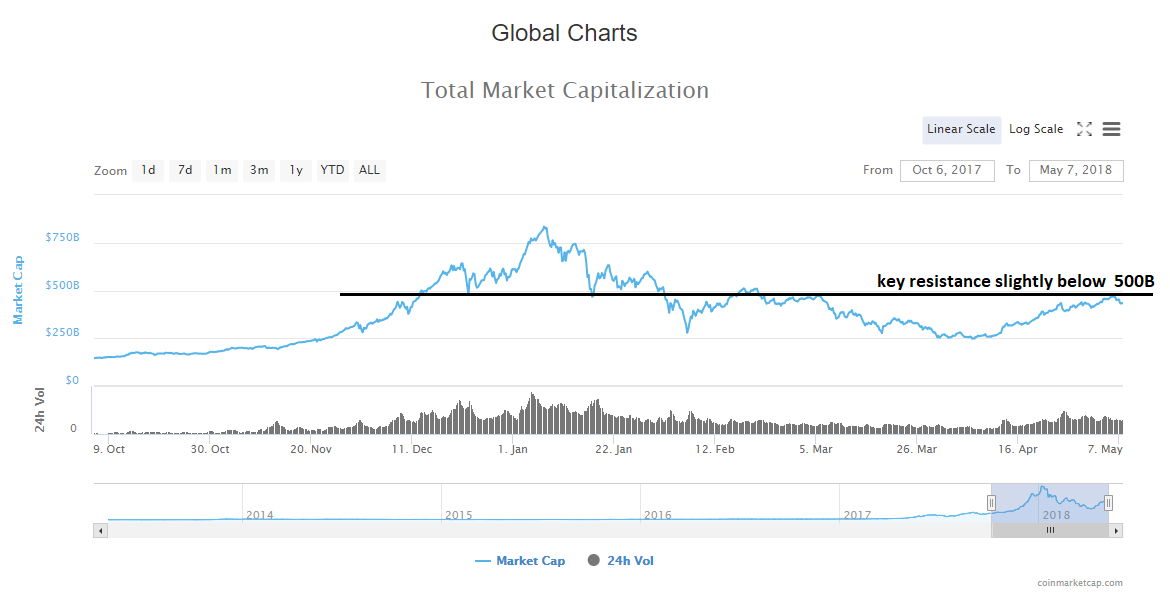
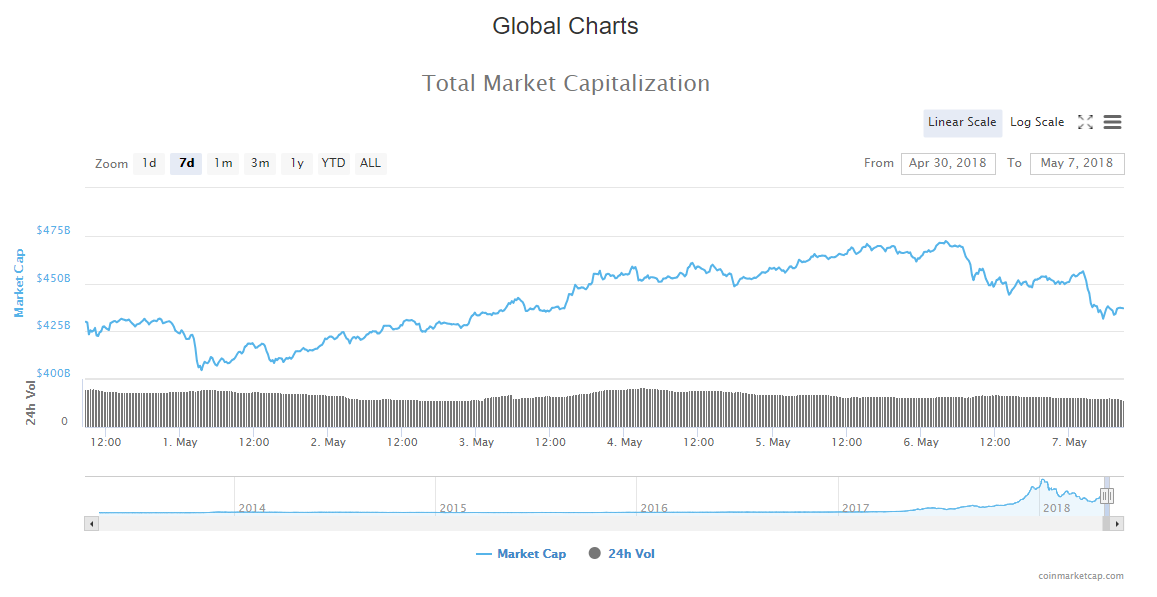
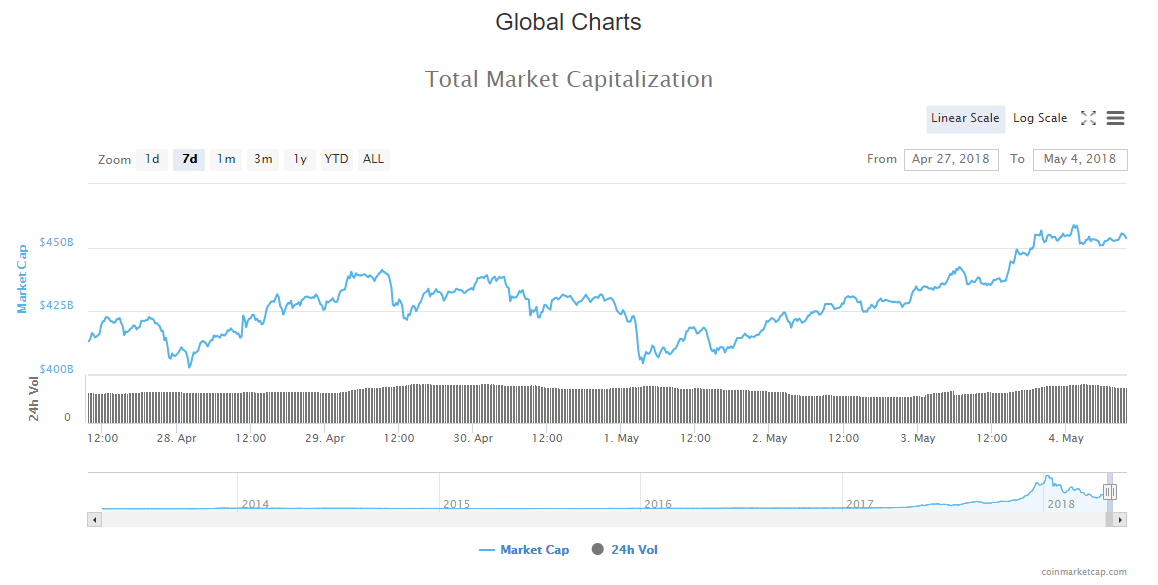
Market Cap: $342,083,903,530
24h Vol: $14,649,610,900
BTC Dominance: 38.1%
From yesterday’s high at 349,654,000,000$ the evaluation of the cryptocurrency market capitalisation has been declining steadilly and is now $7 billion lower.
 The market is currently in red with the average decline of 3% amongst the top 100 coins. Biggest losers are Loom network -11%, Veritaseum -9%, Theta Token -9.2%. Those who are in green are Zcoin +4%, Bibox Token +9.55%, MOAC +4% and Huobi Token +8%.
News
In the last 24 hours, news that came out is mostly regarding governmental in relation to cryptocurrency and blockchain technology. These are some of the significant headlines:
The U.S. Securities and Exchange Commission (SEC) said it was “underwhelmed” by regulatory adherence among cryptocurrency exchanges in fresh comments June 6.
Speaking to CNBC, Brett Redfearn, the SEC’s Director of Division of Trading and Markets, suggested exchanges that offer trading in tokens issued in Initial Coin Offering (ICO) – which may constitute securities under U.S. law – were reluctant to comply.
“We’re underwhelmed by the enthusiasm for coming within the regulatory structure right now,” he commented at the Sandler O’Neill Global Exchange and Brokerage Conference in New York, adding:
“There are a number of exchanges that are trading ICOs that I would think that we should see more registrations.”
As ICO tokens will be classified as securities, crypto exchanges would have to register to SEC and comply under a regulatory framework. As SEC is still having trouble with their classifications because of the different nature of different tokens, crypto exchanges are playing dumb, as regulatory compliance may cause complications within their business.
Money 20/20 conference is over, and there are overviews from the conference highlighting the main points.
A particular highlight of the Money 20/20 Europe showpiece was a discussion panel titled “Cryptocurrency, the central (bank) question”. It featured four prominent individuals from the Bank of England, Bank of Canada, Bank of Lithuania, and the Swiss National Bank.
The Bank of England has been particularly thorny in its stance towards cryptocurrencies in general over the past few years. Despite this, the Bank of England began to change its tune more recently, announcing a cryptocurrency task force that would provide an in depth study into the sector.
Dr Marius Jurgilas a member of the board of the Bank of Lithuania, stated:
“The product we (banks) are selling is trust. If our product is good, there would be no need to talk about cryptocurrencies. It’s a matter of trust, if we trust the institution mandated and entrusted to keep oversight of our payment systems, ensure that money is not affected by excessive inflation then there is no need for payment instruments or other means of storing value.
“But if society starts questioning, rightly or wrongly, or it thinks what we are selling could be done better, in a more convenient and cheap way, other things will appear. We as regulators have to react to that − we are not sitting entrenched in our positions, the work everyone is doing here shows that we are really paying attention.”
PhD Economist James Chapman, the Bank of Canada’s Senior Research Director in the Funds Management and Banking Department, stated his concerns regarding cryptocurrencies as potential threat to the fiat system:
“I don’t see that happening as long as central banks continue to do a good job of maintaining monetary policy. But could a cryptocurrency really spell the end of fiat currency? I think so. In a situation of hyperinflation where a central bank has abdicated responsibility for stability then you could see a case for cryptocurrency.”
Swiss National Bank‘s, Thomas Moser is an alternate member of the board and the Deputy Head of Department. His department deals with Economic Affairs, International Affairs, Statistics, Legal Services, and Communications. Switzerland is known to have a positive relation to cryptocurrency, that’s why his take on crypto is coming off in a supportive tone:
“Switzerland has been relatively enthusiast to crypto. We have a national railway system that transformed ticket machines to bitcoin atm. At every train station in Switzerland, you can put cash into a ticket machine and load a BTC wallet. Cryptocurrencies have been very well tolerated in Switzerland so far.”
When asked to state his views on the posibiliy of crypto replacing fiat he stated:
“In general no but I think it depends on the fiat currency of the central bank. Of course, if a currency is not performing well, you have hyperinflation and a country where people lose trust of rule of law of its central bank. It depends on the central bank, as long as they do a good job there is no reason for fiat currency to disappear.”
Source: cointelegraph.com
Meanwhile, Russian President Vladimir Putin, during his annual live question and answer session, gave an ambiguous but knowledgeable answer to the question:
“Will Russia have its own cryptocurrency? […] Will it be controlled by the government? […] Do you think that in the near future cryptocurrency will completely replace our regular, standard money?”
To the first question, he replied that Russia cannot have its own cryptocurrency, as cryptocurrency “by definition” cannot be owned by a centralized state since it “goes beyond borders.” He then continued by saying that Japan is partially excepting crypto as a means of payments but he doesn’t see that happening in Russia. However, he hasn’t disregarded potential use case for blockchain technology saying that:
Russia must keep an eye on this “phenomenon developing in the world” in order to determine how Russia can “participate in the process”. He added that Russia must also look into “how we can use it [cryptocurrency] in order to avoid any restrictions in the field of international financial activity,” perhaps a veiled reference to the potential use of cryptocurrency to avoid Western sanctions currently imposed on the country.
Source: cointelegraph.com
While Russia is still uncanny on cryptos, The Bank of Thailand (BoT) is considering issuing its own cryptocurrency, the bank’s governor revealed in a speech June 5, as reported by cointelegraph.
In his keynote on Thai economic development at Nomura Investment Forum Asia (NIFA) in Singapore, BoT governor Veerathai Santiprabhob spoke of a new project in which the central bank and other Thai banks join forces to develop a “new way of conducting interbank settlement” using a central bank-issued digital currency (CBDC).
As cryptocurrencies prove to be superior in the speed and cost, they are competing with the fiat/banking system, and so far they have been discarded and ignored. But we are now seeing a global attention to cryptos from big players like central banks and government official agencies, as technology gets better and adoption rate spreads across the globe.
This correlates with the saying: First they ignore you, then they laugh at you, then they fight you, then you win. Mahatma Gandhi
We were past the ‘then they laugh at you’ stage last year when Jamie Dimon called Bitcoin a fraud and people who believe and invest in it stupid. Now as you can see we are at the beginning of the ‘then they fight you’ stage, as central banks are gathering around to discuss how serious of a threat this is for them.
Analysis
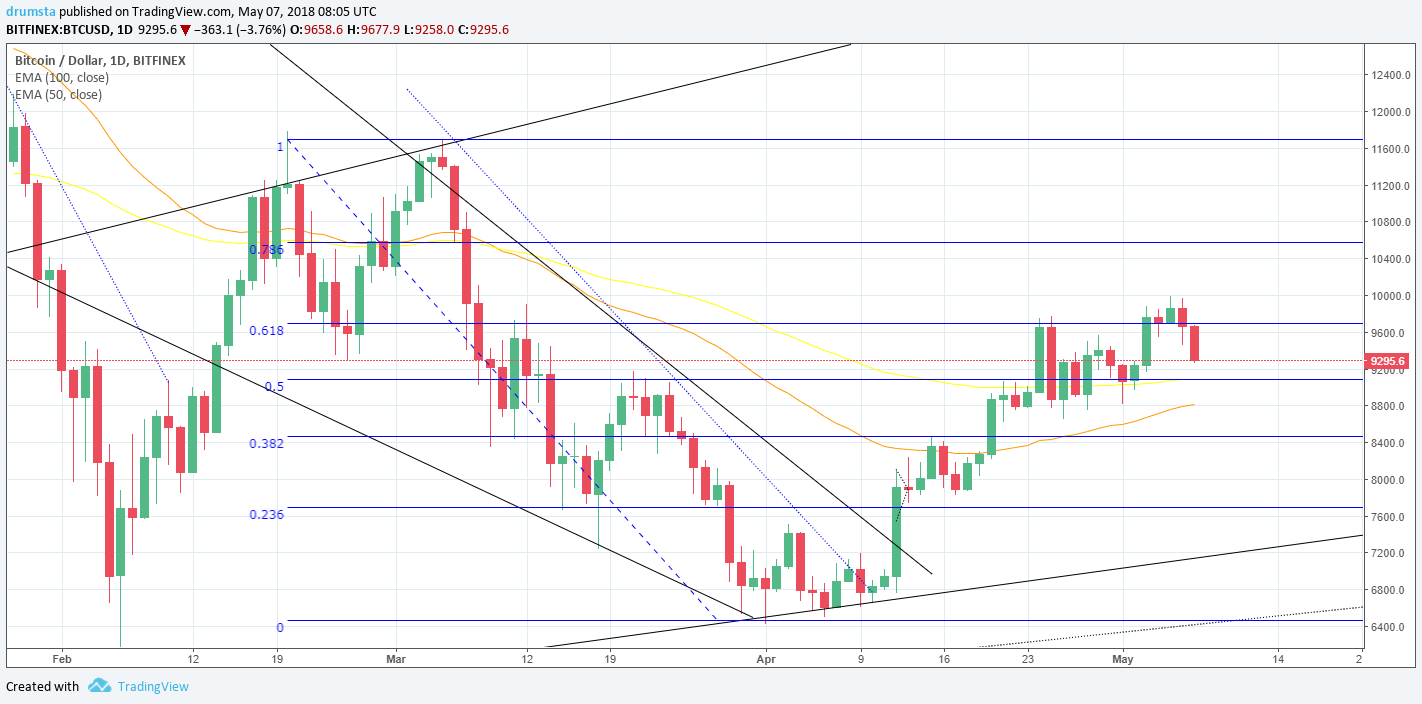
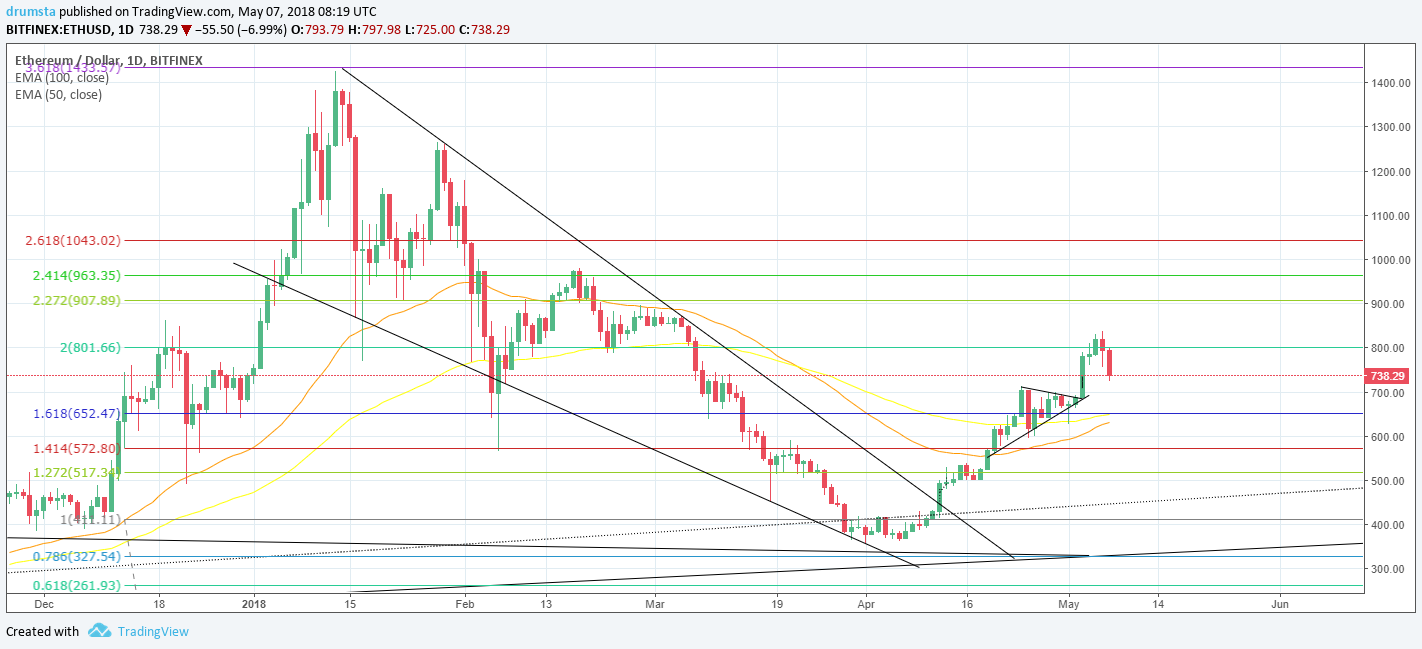
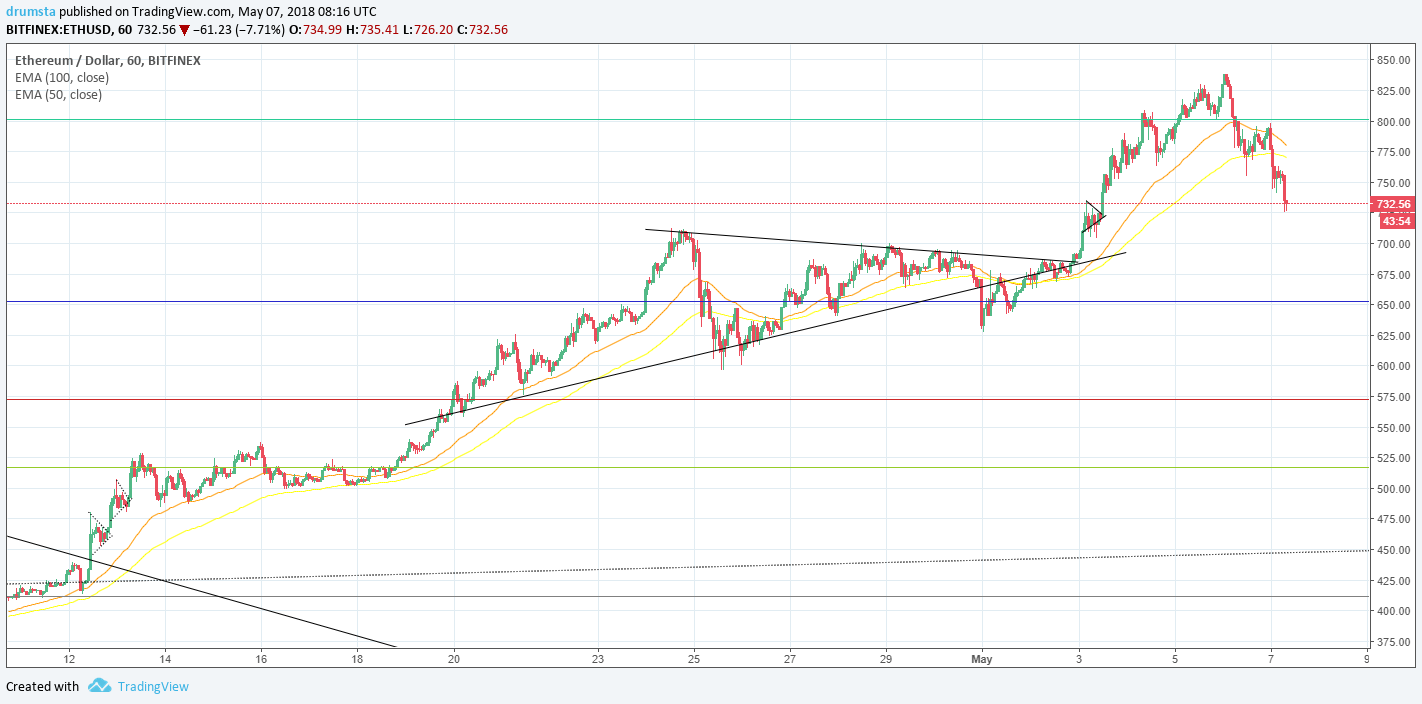
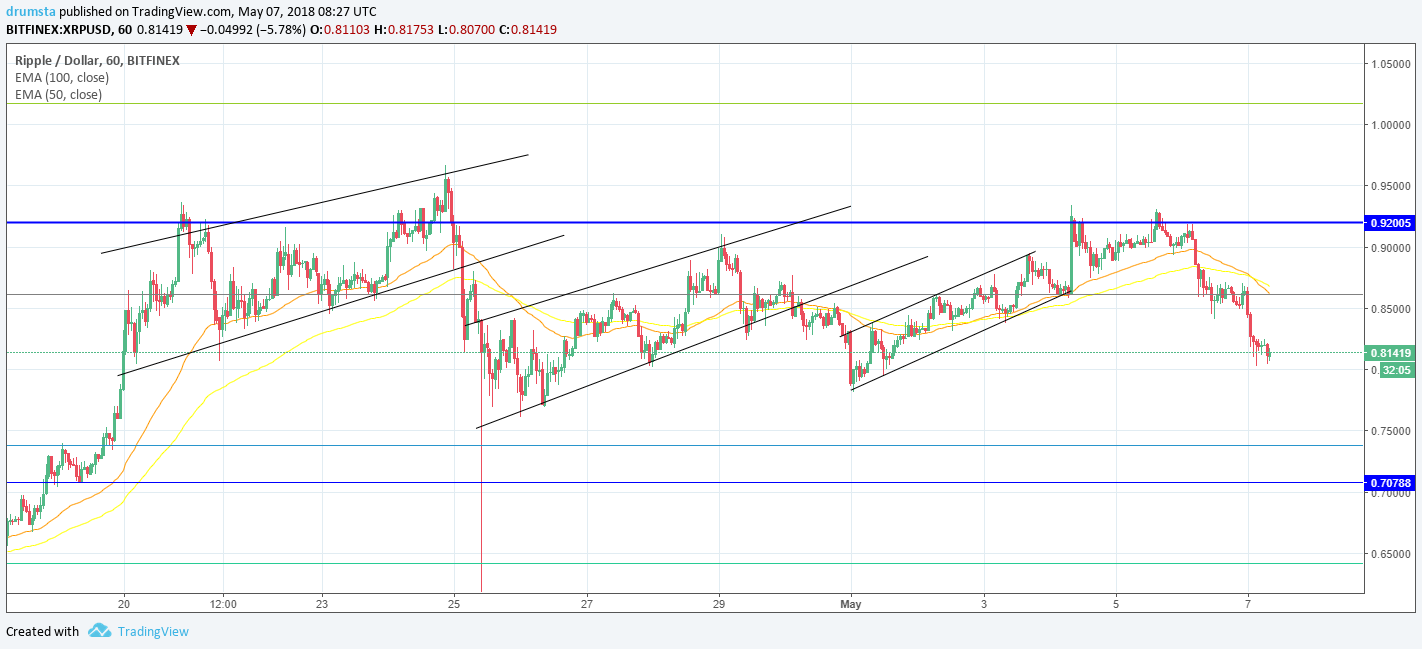
BTC/USD
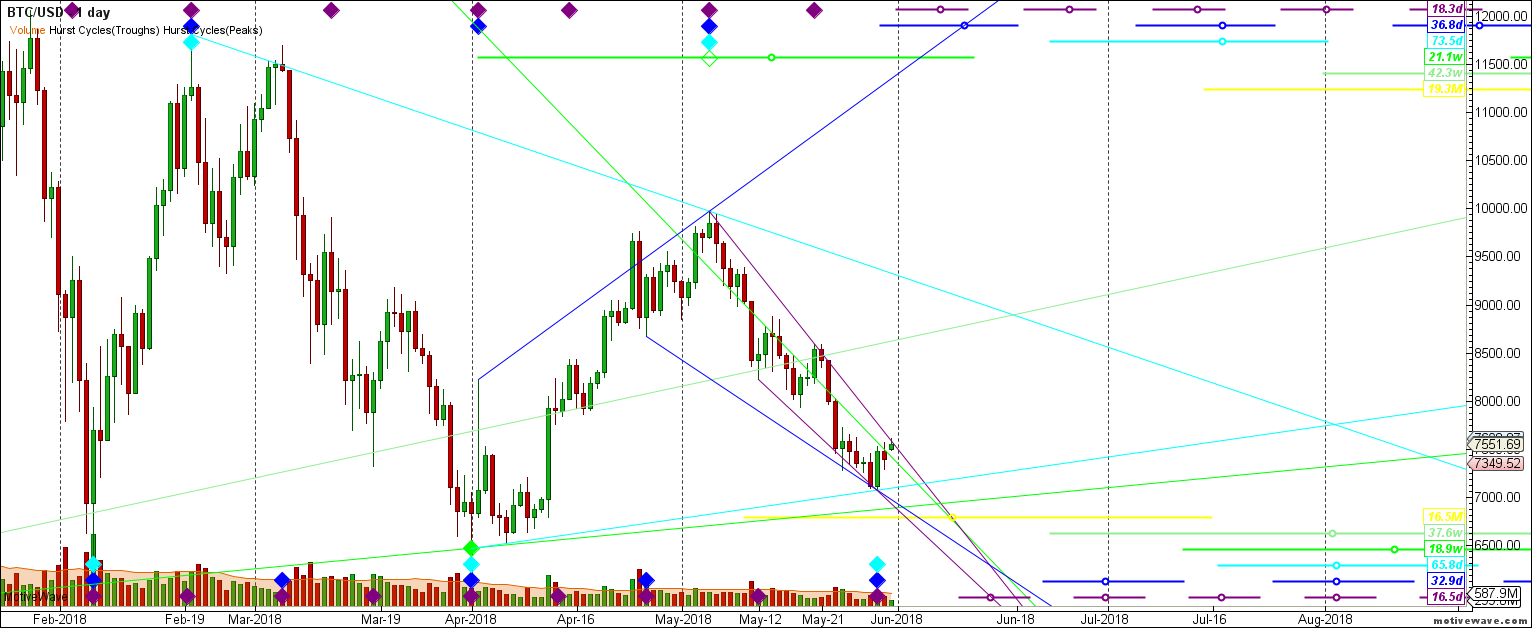
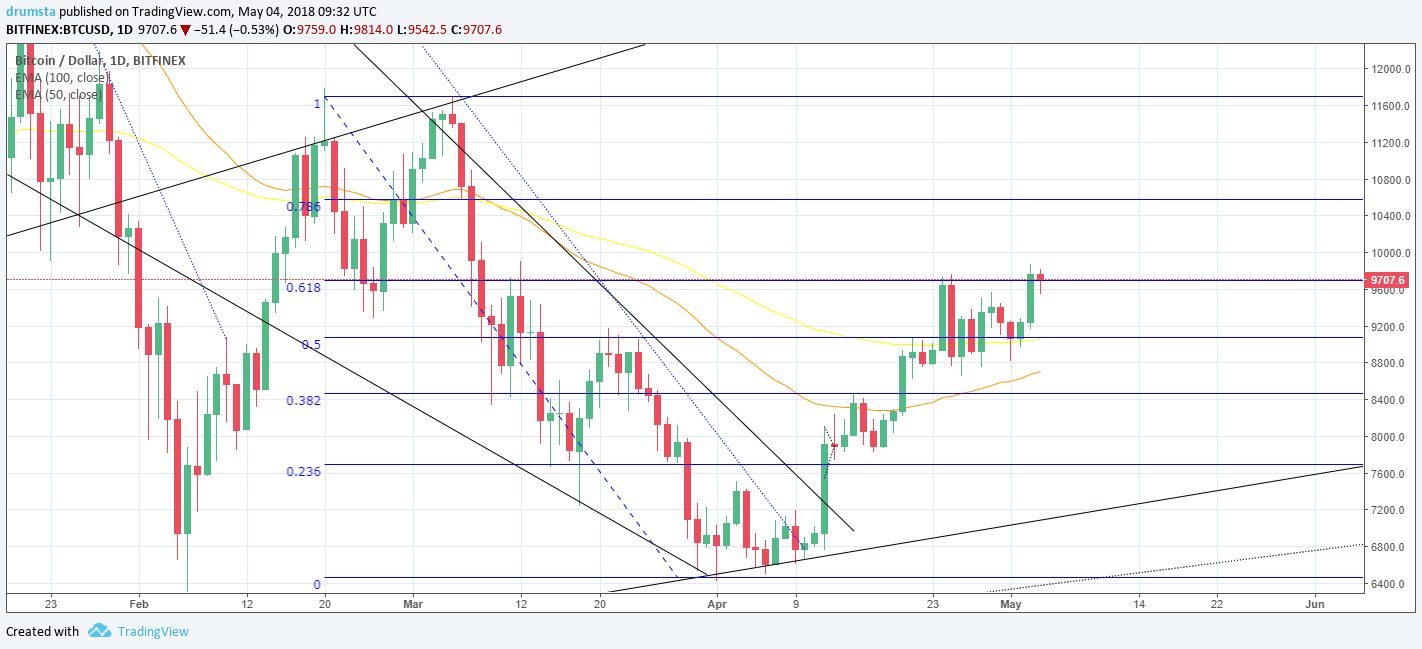
From yesterday’s high at 7735$ the price of Bitcoin has been on a steady decline and has decreased by 1.22%, which is price wise, 7641$.
The price of Bitcoin has been stopped out at the 0.236 Fibonacci level which serves as resistance and has fallen below the baseline support line again. We can see that the price is in an extended cluster as buyers and sellers are indecisive. As the price failed to create a higher high from the 3rd of June we are starting to see first signs of weakness, so I would expect the price to drop quickly from these levels, as buyers would back away, or turn into sellers.
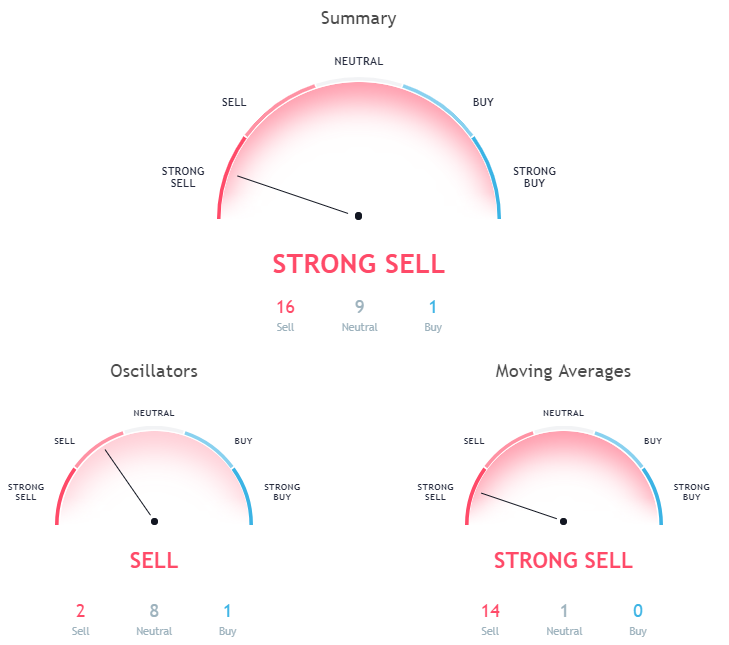
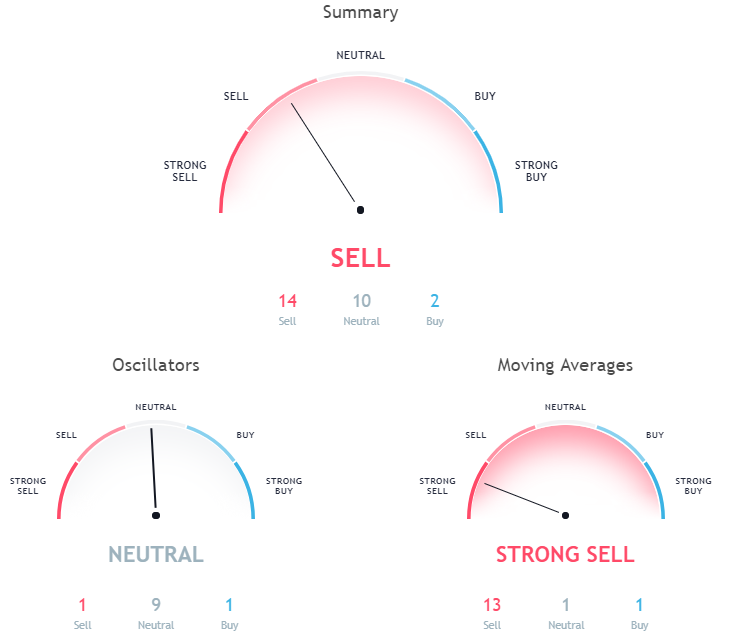
Market sentiment
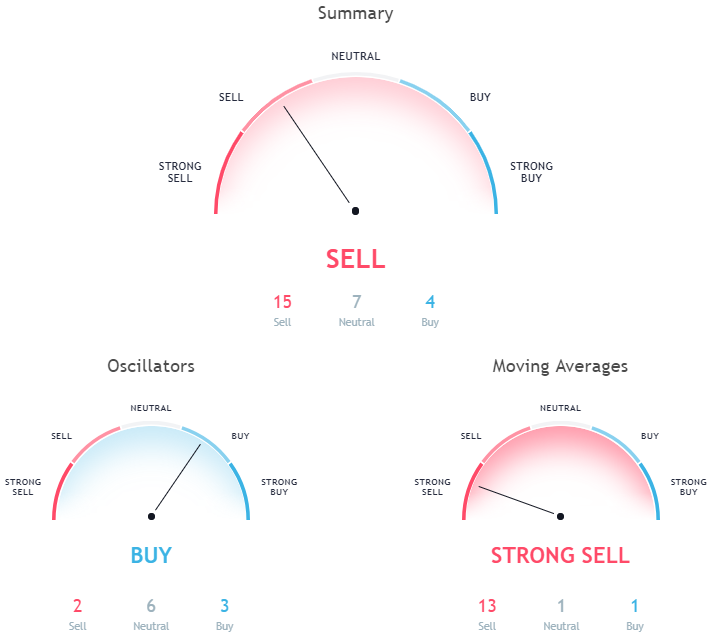
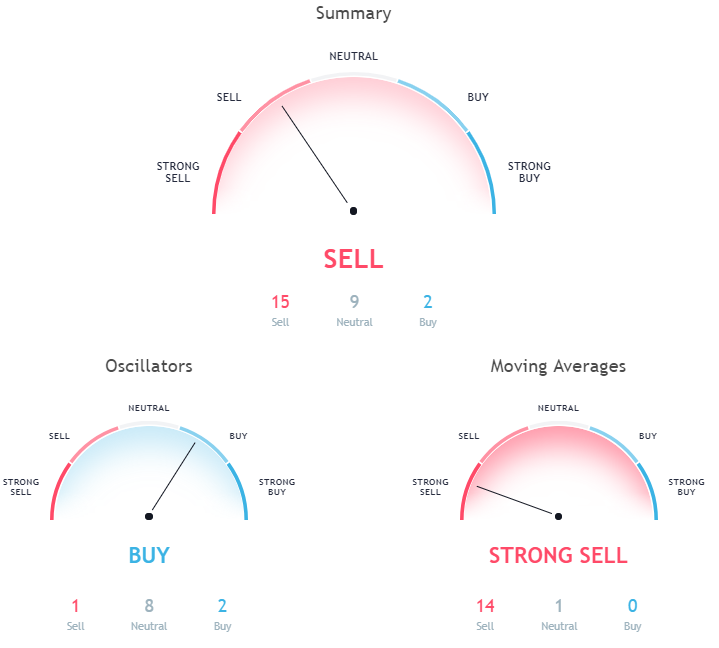
Bitcoin is in the sell zone.
Oscillators are on sell, and moving averages signal a sell.
Pivot points
S3 7426.8
S2 7558.4
S1 7623.6
P 7690.0
R1 7755.2
R2 7821.6
R3 7953.2
DASH/USD
From yesterday’s high, which was coincidently the same as the open, the price of Dash has decreased by 2.41% coming from 320.29$ to 311.4$ where it is currently sitting.
The price of Dash has escaped the descending channel couple of days ago but is still in a symmetrical triangle while consolidating. It now looks near a breakout and we will see if this consolidation was just a pause of the downtrend or we are going to see a trend reversal.
Market sentiment
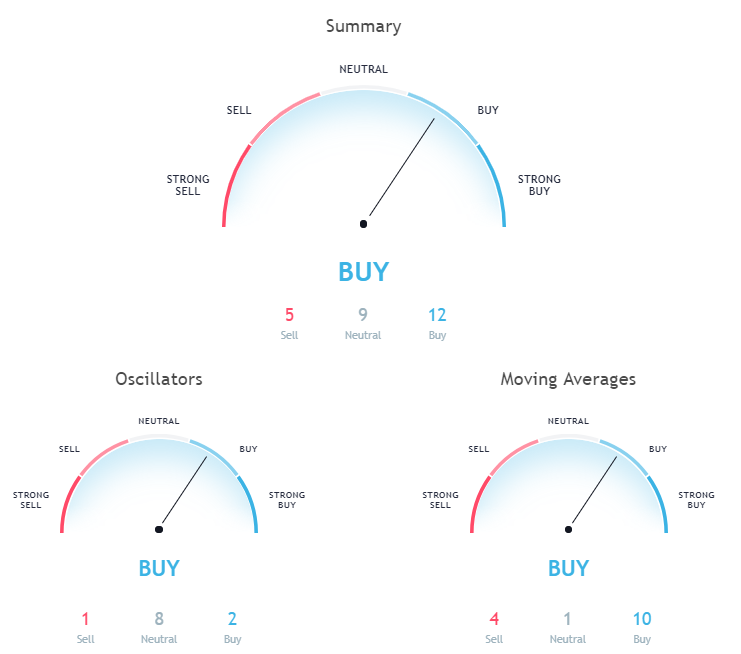
Hourly chart technicals signal a sell.
Oscillators are showing a buy, but moving averages are signalling a strong sell.
Pivot points
S3 299.82
S2 308.073
S1 312.125
P 316.32
R1 320.37
R2 324.57
R3 332.82
XMR/USD
From yesterday’s high at 169.7$ the price of Monero fell by 4.6% to 161.6$ where it is currently.
Yesterday’s high was on the symmetrical triangle resistance, and from there the price went on a downward trajectory, breaking out from the triangle on the downside. I am expecting the price to go down to the wedge support to retest prior lows.
Market sentiment
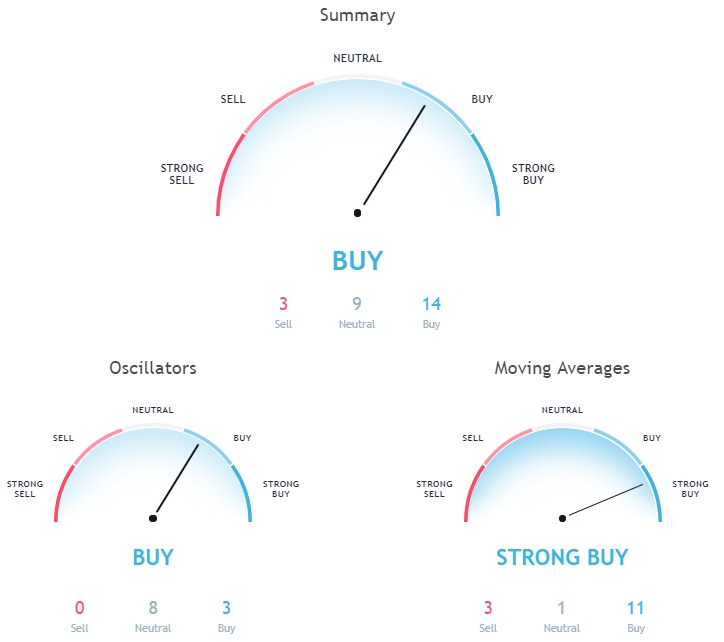
Hourly chart technicals signal a strong sell.
Oscillators signal a sell, and moving averages a strong one.
Pivot points
S3 148.487
S2 157.167
S1 160.483
P 165.847
R1 169.163
R2 174.527
R3 183.207
NEO/USD
The price of Neo has declined since yesterday’s open at 54.65$ by 4.3% and is now sitting at 52.31$.
As you can see from the daily chart, the price was repealed by the resistance at the 0.382 Fibonacci level and is now sitting on the range support. I am expecting the price to go down slightly further to the baseline support (bold black line), where there is also the 0.236 Fibo level for a retest.
Market sentiment
Neo is in the sell zone, as indicated by hourly chart technicals.
Oscillators are on neutral, and moving averages signal a strong sell.
Pivot points
S3 49.49
S2 51.63
S1 52.59
P 53.76
R1 54.73
R2 55.90
R3 58.03
Conclusion
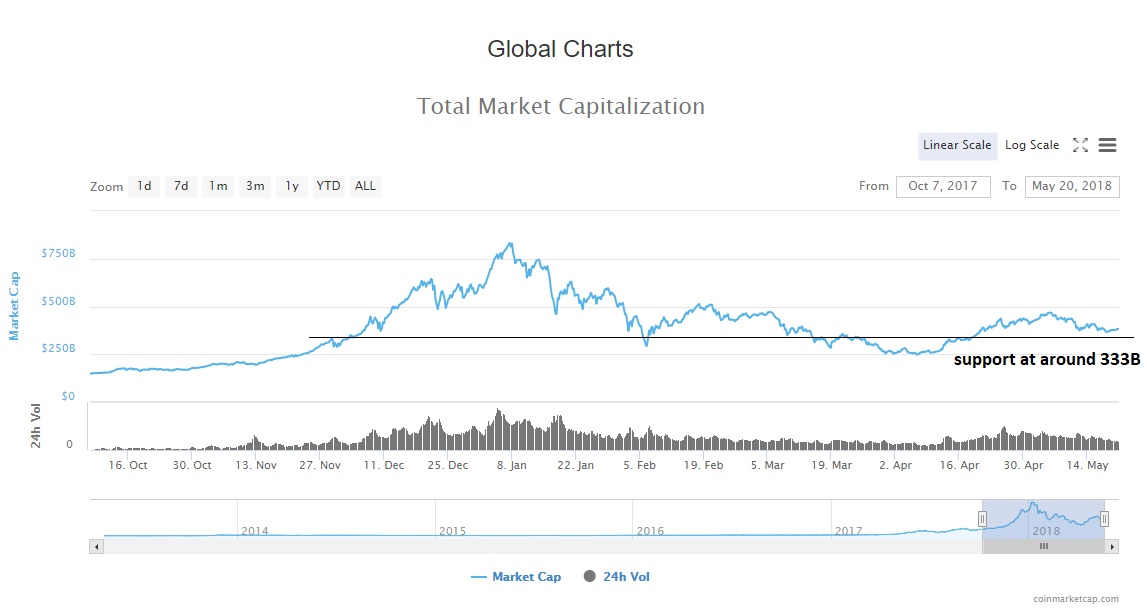
As the prices are showing the first signs of weakness, after almost a whole week went by in a stagnating way, and having in mind that weekend is coming, we are likely to see the first stages of a sell-off of what will last at least until Monday and will retest prior lows.


 Pivot points:

 Pivot points:
 Pivot points:
 Pivot points:
 Pivot points:


 The current market sentiment for Bitcoin is positive, meaning 70% out of 85 mentions in total are positive.
 Pivot points:
 The current market sentiment for Ethereum is positive, meaning 78% out of total 97 mentions are positive.


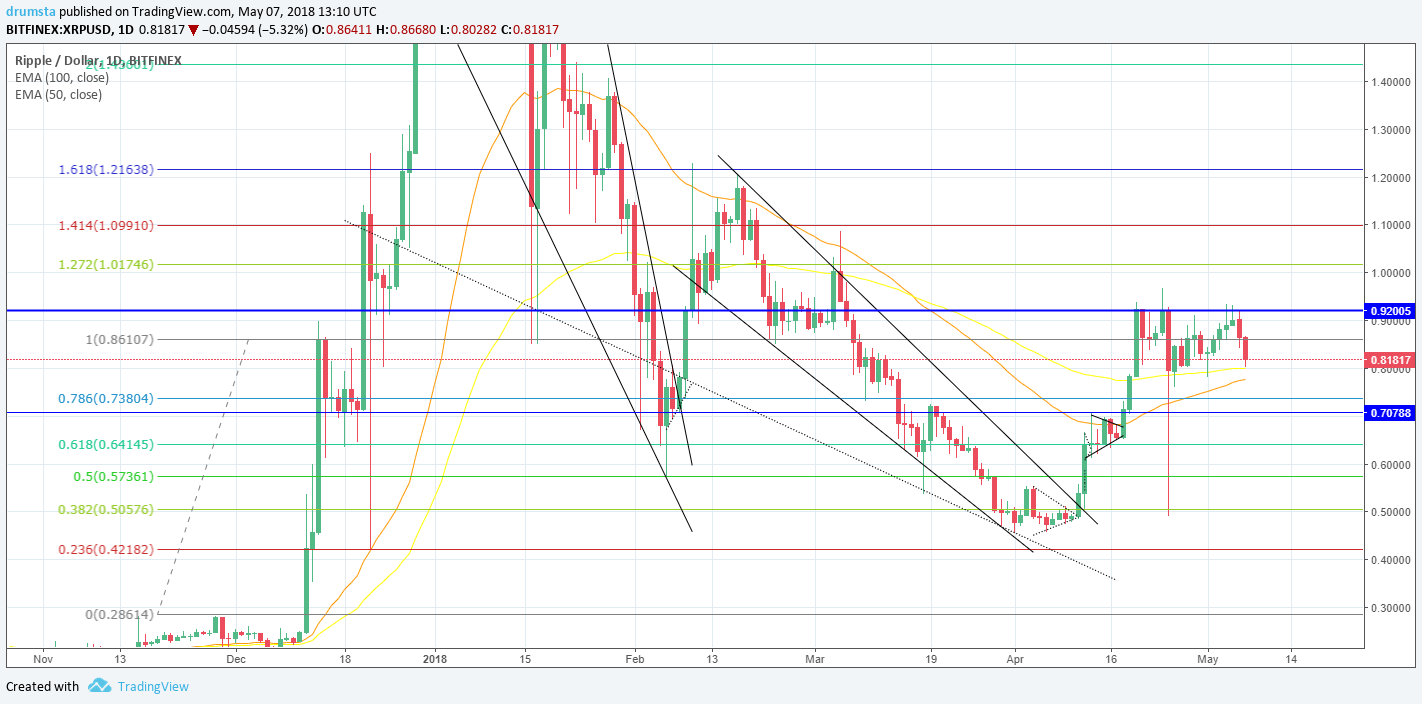
 The current market sentiment for Ripple is slightly positive, meaning 69% of 42 mentions in total are positive.
 Pivot points:


 Pivot points:
 The current market sentiment for Ripple is positive, meaning 87,88% of 66 mentions in total are positive.
 Pivot points:


