General overview
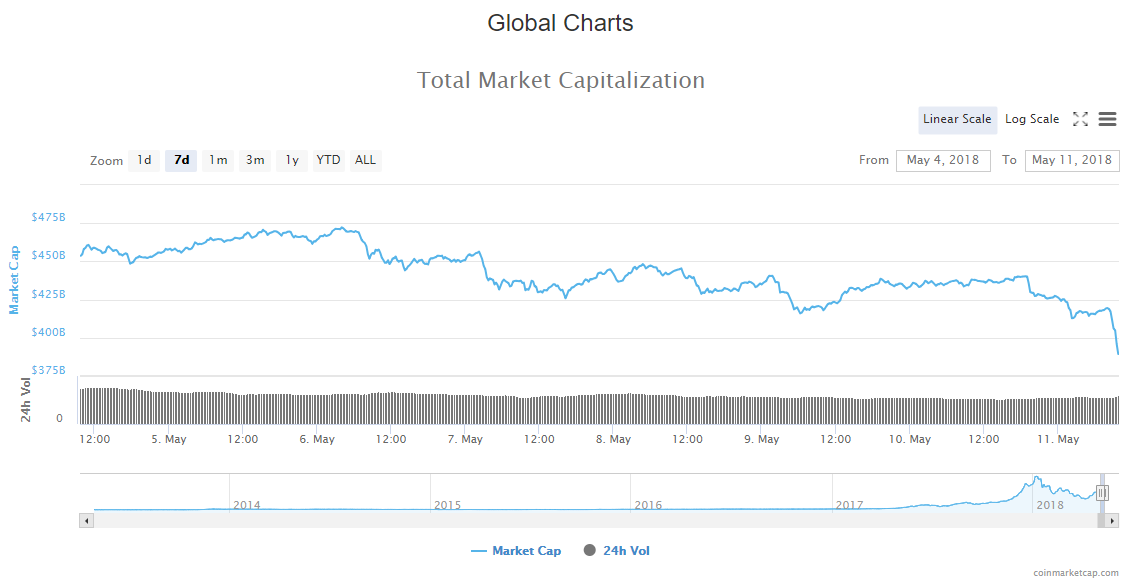
Market Cap: $397,806,215,035

24h Vol: $27,157,849,685
BTC Dominance: 37.7%
Daily Cryptocurrency Update: In the last 24 hours, cryptocurrency market cap fell from 440B to 389B with a steep fall.
Among the top 100 coins, the average price drop is around 14%.
News
The top stories that came out in the last 24 hours are mostly positive with the dominant topic being an adoption of the blockchain technology.
These are some of the significant headlines (Green positive, Brown negative):
- Ethereum ‘Stakeholders’ Meet To Discuss Governance, Without Vitalik Buterin’s Involvement
- Bank Of America CTO Calls Bitcoin ‘Troubling’, Reconfirms Credit Card Purchase Ban
- Iran Sanctions: Citizens Use Crypto To Move $2.5 Bln Out Of Country
- Robinhood App Raises $363 Mln To Expand Its Zero-Fee Crypto Trading Platform US-Wide
- De Beers Tracks Diamonds With Blockchain For The First Time
- Dutch Ministry Develops National Blockchain Research Agenda
- Kodak Announces Token Offering Goal For Blockchain Image Protection Platform
- Ripple Cross-Border Payments Pilot: Financial Institutions Report Significant Time, Cost Savings
- Huawei Releases Bitcoin Wallet In App Store, Pre-Installed On All New Smartphones
- Nvidia Reports First Quarter Crypto Sales, Expects Two-Thirds Drop In the Second Quarter
Analysis
BTC/USD
From yesterdays opening, the price of Bitcoin has fallen by 6.27% – from $9329 to $8751 where it is now.
Looking at the daily chart we can see that the price has fallen below 0.5 Fibonacci level and the 50 days EMA.
Zooming into an hourly chart we can see that the price is looking for support, and has found one at 0.786 Fibonacci extension level.
Market Sentiment
- The overall market sentiment for the BTC is in the SELL zone.
- Oscillators are in a neutral zone while Moving averages show a STRONG SELL.
Pivot points:
S3   8356.5
S2   8747.4
S1   8882.7

P    9138.3

R1   9273.6
R2   9529.2
R3   9920.1
ETH/USD
In the last 24 hours, the price of Ethereum has decreased by 11% from yesterday’s high at $766 to $682 where is now sitting.
As you can see from the daily chart the price is in a downward trajectory, heading down toward 0.5 Fibonacci retracement level, trying to find support.
On its hourly chart, we can see that, after yesterday’s breakout from the triangle from the upside, the price failed to exceed the $840 level and create new highs, and has dropped significantly, which made the EMA’s cross.
Market Sentiment
- The overall market sentiment for the ETH is in the SELL zone.
- Oscillators are in a neutral, although leaning to the sell zone, while Moving averages show a STRONG SELL.
Pivot points:
S3    645.29
S2    691.64
S1    707.51

P     737.99

R1    753.86
R2    784.34
R3    830.69
XRP/USD
From yesterday’s high, the price of Ripple has fallen by 18%, from $0.81 to $0.667 where it is now.
On the daily chart, we can see that the price fell below 0.382 Fibonacci retracement level, and the support line 2, and is in a downward trajectory heading toward 0.236 level.
On the hourly chart, we can see that the price broke out off the descending channel with strong momentum.
Market Sentiment
- The overall market sentiment for the XRP is in the SELL zone.
- Oscillators are in a sell zone as well, while Moving averages show a STRONG SELL.
Pivot points:
S3   0.64964
S2   0.70799
S1   0.72798

P    0.76634

R1   0.78633
R2   0.82469
R3   0.88304
Conclusion
Daily Cryptocurrency Update: We are seeing the final stages of the correction, but more downside is expected, especially having in mind that the weekend is coming. The prices of the three major cryptocurrencies are looking for support at new lows. For a clearer picture of what’s coming next, make sure to check the weekly update, in which I provide a forecast for the upcoming week.
Related posts
 Daily Crypto Update, Sept 30 – Bitcoin under $8,000 drives Crypto Assets Down!
 Daily Crypto Review, Apr 17 – Bitcoin above $7,000; The US expanding on the idea of the Digital Dollar
 Daily Crypto Review, Apr 20 – Blockchain Jobs Booming; Lightning Network Unsafe?
 Daily Crypto Review, Apr 22 – The Netherlands testing grounds for EU digital currency; Ripple Labs suing YouTube