General overview
Market Cap: $420,694,166,630
24h Vol: $23,401,165,415
BTC Dominance: 36.8%
In the last 24 hours, the cryptocurrency market cap has dropped by approximately 10B, from 430B to around 420B.
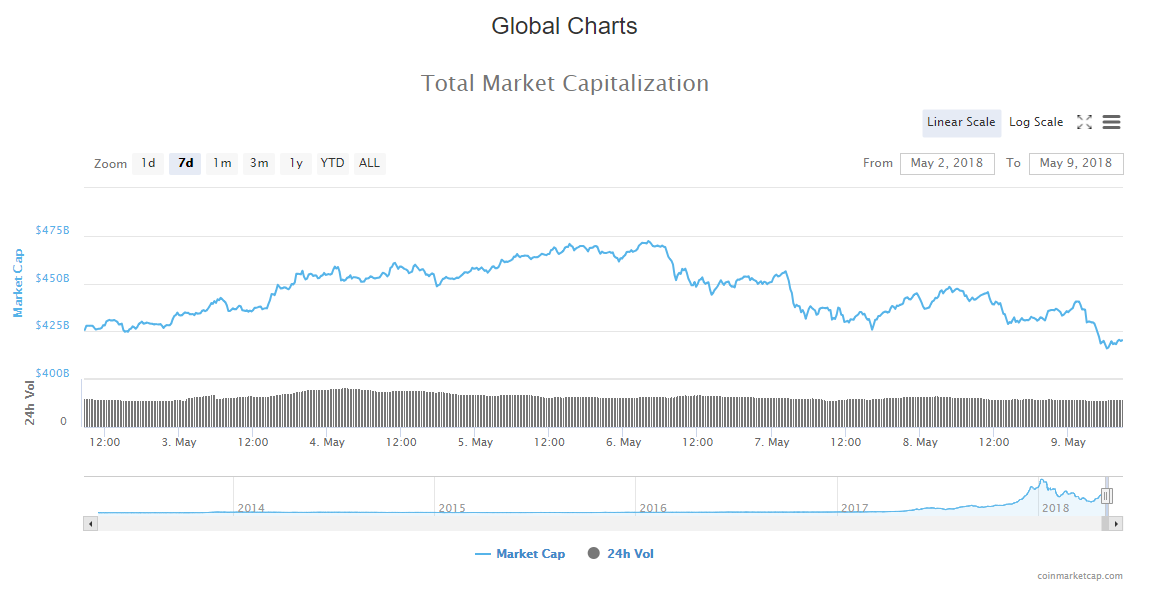
The valuation is at the same level as it was nine days ago, at the start of the month.
The market is currently in red, with the biggest decrease of around 11% for some cryptocurrencies like Salt, Kyber Network, Ox and Aion. Meanwhile, some cryptos are in the green like Pundi X +25%, Augur +12%, Zilliqua +10.11%.
News
Some of the significant stories that came out yesterday are the following:
Facebook Forms Exploratory Blockchain Team Led By Coinbase Board Member
David Marcus, the head of Facebook’s messaging app Messenger, announced that the social media site is exploring possible applications for blockchain technology, CNBC reported May 8. “I’m setting up a small group to explore how to best leverage blockchain across Facebook, starting from scratch,” Marcus shared in a post Tuesday afternoon on his personal page. Marcus has been leading Messenger for almost four years. In December, he joined cryptocurrency exchange Coinbase as a board member. However, Facebook hasn’t revealed how interested it is in applying blockchain.
Source: cointelegraph.com
Ukrainian Securities Regulator To Consider Crypto As Financial Instrument
The Ukrainian National Securities and Stock Market Commission (SSMCS) will consider recognizing cryptocurrencies as a financial instrument, according to an announcement on the 8th of May. The head of the commission, Timur Khromaev, made the announcement in a Facebook post following the annual conference of the International Organization of Securities Commissions (IOSCO) on Crypto and Initial Coin Offerings (ICOs).
Source: cointelegraph.com
Ex-Goldman Sachs President Says Global Cryptocurrency Will Come, But It’s Not Bitcoin
Gary Cohn, former Goldman Sachs President as well as former chief economic advisor to US President Donald Trump, believes that there will a global cryptocurrency in the future, but it will be a coin “more easily understood” than Bitcoin (BTC), CNBC reports May 8.
Source: cointelegraph.com
Analysis
BTCUSD
From yesterday’s opening until now, the price of Bitcoin has decreased by 3.14% – from $9380 to $9081.
On the daily chart, we can see that the price is currently sitting on a 0.5 Fibonacci retracement level, slightly below the 100-day EMA. This is the fourth consecutive red candle on the daily chart, which indicated that bears are in control.
Zooming into an hourly chart, we can see the interaction with the Fibo level. The price has fallen below it four times, after which it quickly bounced back above it, leaving a lot of wicks. This looks like the price is struggling to find support there, but the bears have more power at the moment.
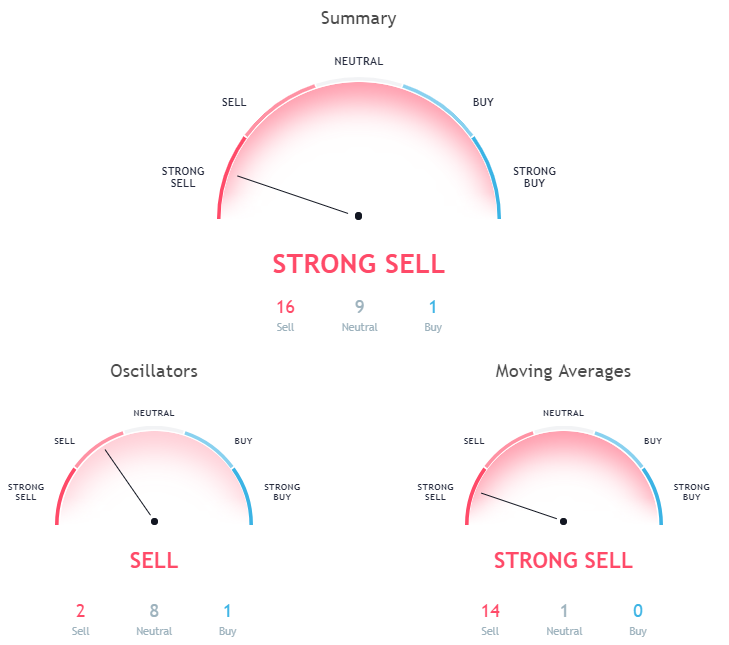
Market Sentiment
Overall, hourly chart signals a strong sell.
Pivot points:
S3  8382.3
S2  8808.0
S1  8996.3
P   9233.7
R1  9422.0
R2  9659.4
R3 10085.1
ETH/USD
In the last 24 hours, the price of Ethereum has dropped from $770 to $716, which is a 7% decrease.
Looking at the daily chart, we can see that the price has fallen below the 0.786 Fibonacci level, and is currently looking for support at the prior high of the triangle from which the price broke out, which is around the $710 level. Exponential moving averages are below the price and the 0.618 Fibo level, so the price is likely heading towards them for support.
Zooming into an hourly chart, we can see that the price is ready for another drop.
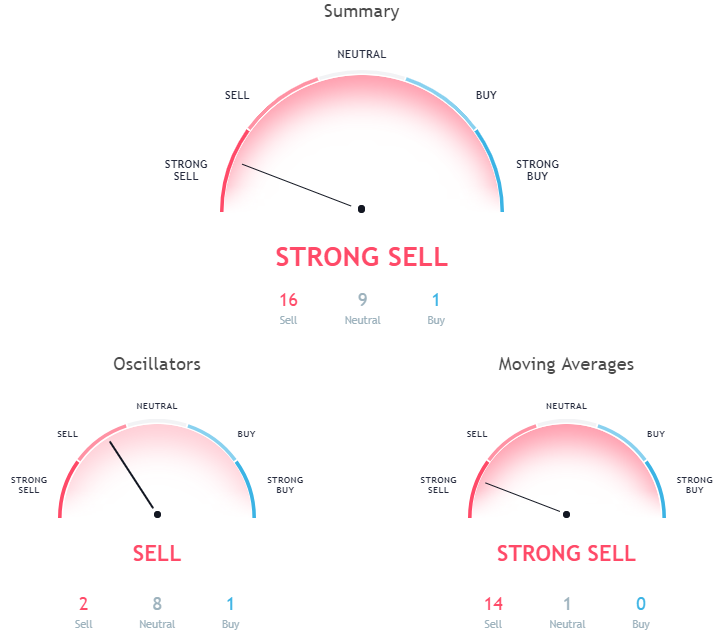
Market Sentiment
Overall hourly chart signals a strong sell.
Pivot points:
S3  637.60
S2  692.76
S1  720.35
P   747.92
R1  775.51
R2  803.08
R3  858.24
XRP/USD
Since yesterday’s open, the price of Ripple has dropped by 8.68% going from $0.84 to $0.769 where is currently sitting.
Looking at the daily chart, we can see that the price is currently below the 50-day EMA, which didn’t serve as support, so the price is heading towards the 0.786 Fibonacci retracement level, as it is the next significant level which can serve as support.
Zooming into an hourly chart, we can see that the 0.786 Fibonacci level is crossing over my downward channel support line, which would be a perfect point of reference for a short-term target.
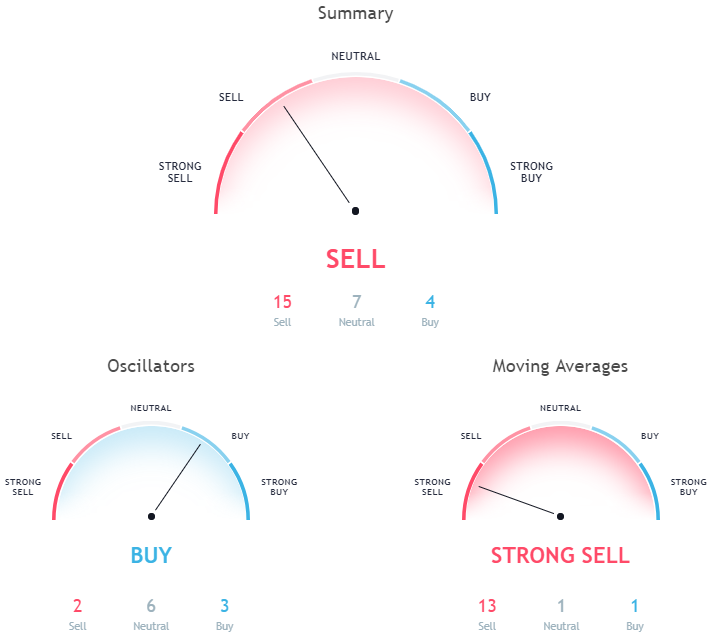
Market Sentiment
Overall, hourly chart signals a sell.
Pivot points:
S3 0.70279
S2 0.75859
S1 0.78247
P  0.81439
R1 0.83827
R2 0.87019
R3 0.92599
Conclusion
Having three major cryptocurrencies falling below their pivot points, they are now looking for a strong support which can hold back this bear momentum. Even though we can see that this find is almost completed I wouldn’t say this for a correction overall. I am expecting a larger move to the downside in the following days, as buyers were exhausted previously. The only thing that can push prices back up, and past the prior high is some global hype like we have seen in December, so a catalyst is needed.
Related posts
 Daily Crypto Review, July 16 – Bitcoin Giveaway Scam Hits Twitter: Jeff Bezos, Barack Obama, Kanye West And More Targeted
 Daily Crypto Review, Oct 28 – Bitcoin Rushing Towards $14,000; Over 50% of US Investors Interested in Crypto
 Daily Crypto Review, Nov 13 – Bitcoin Above $16,000: What’s Next?
 Daily Crypto Review, Nov 19 – Ethereum 2.0 Most Likely Not Launching on Time; Crypto Sector Consolidating