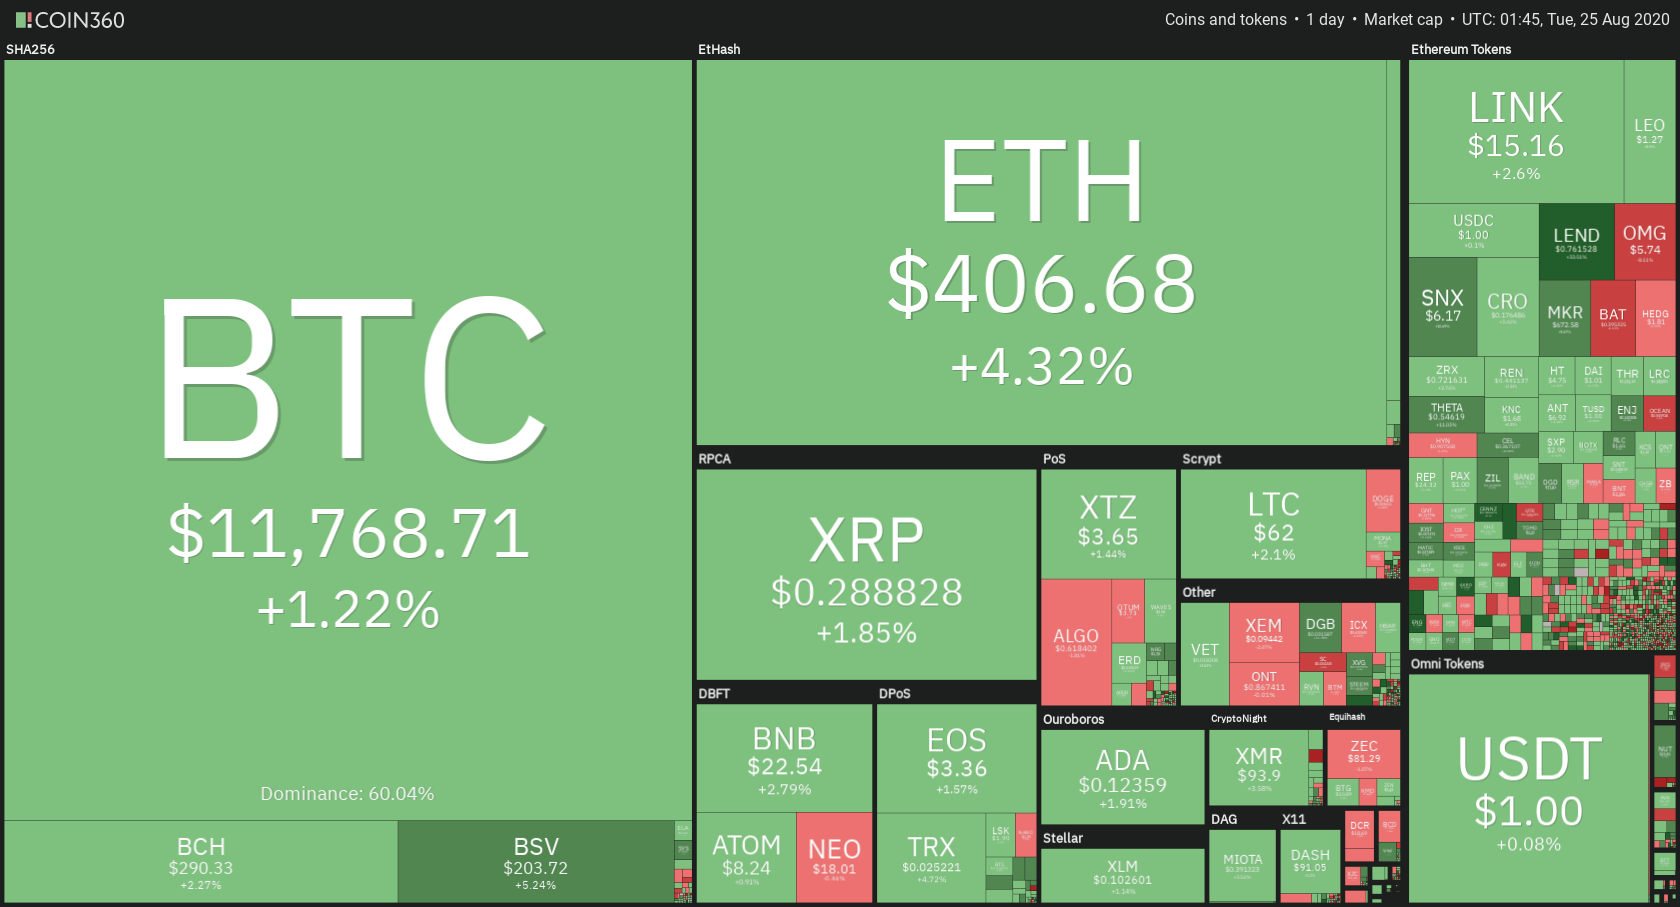
The cryptocurrency sector has mostly stayed at the same place as Bitcoin was fighting for the psychological $11,000 resistance. Bitcoin is currently trading for $10,938, which represents an increase of 0.46% on the day. Meanwhile, Ethereum gained 1.8% on the day, while XRP gained 1.33%.
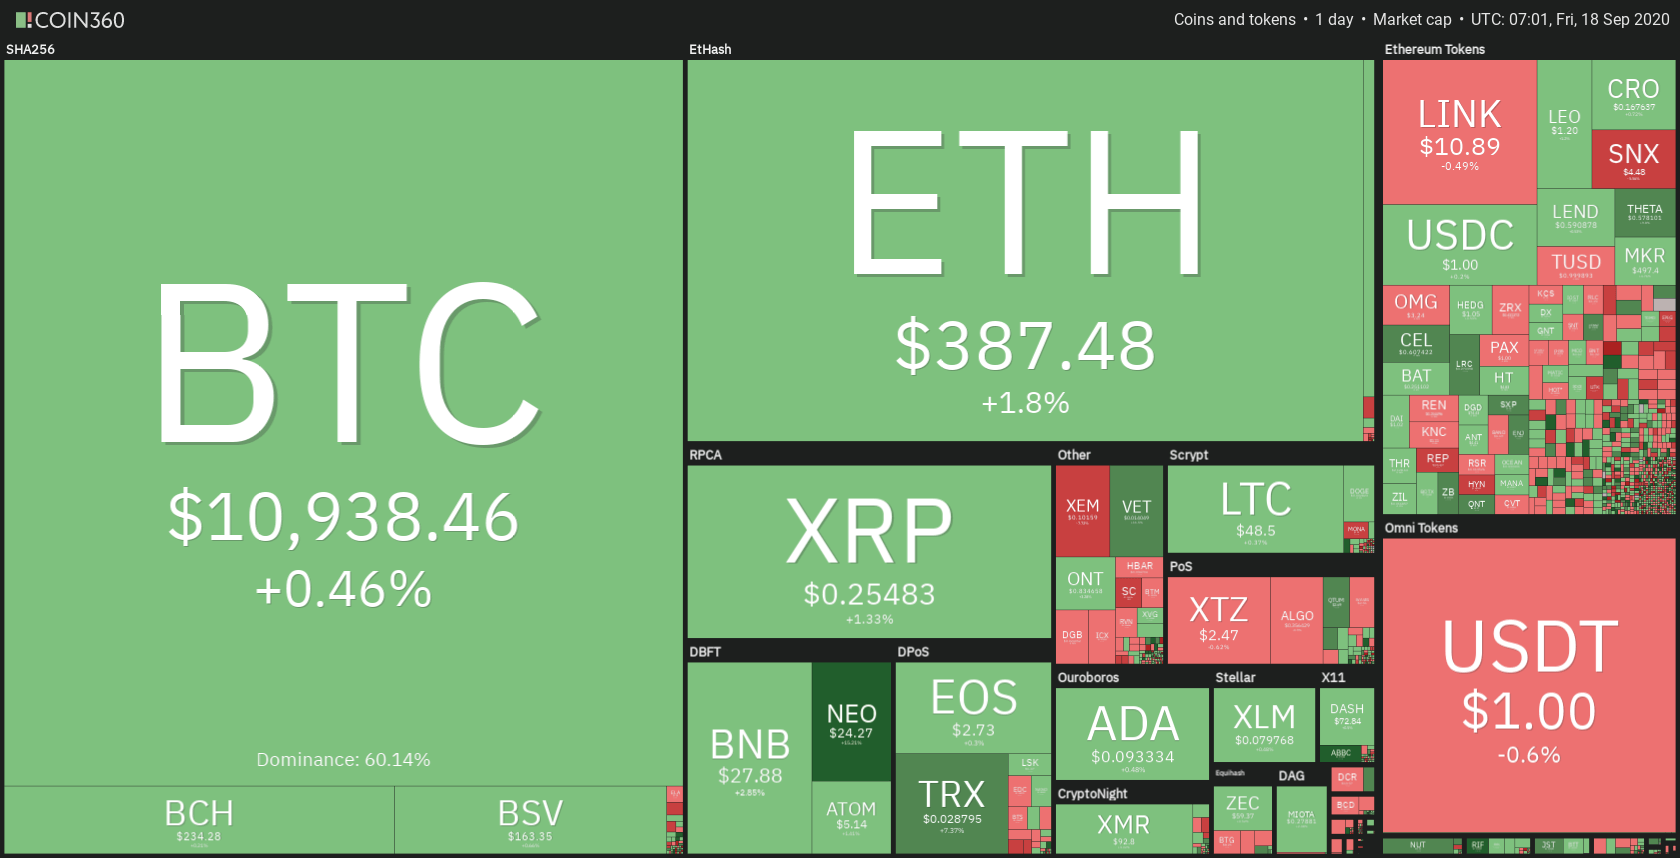
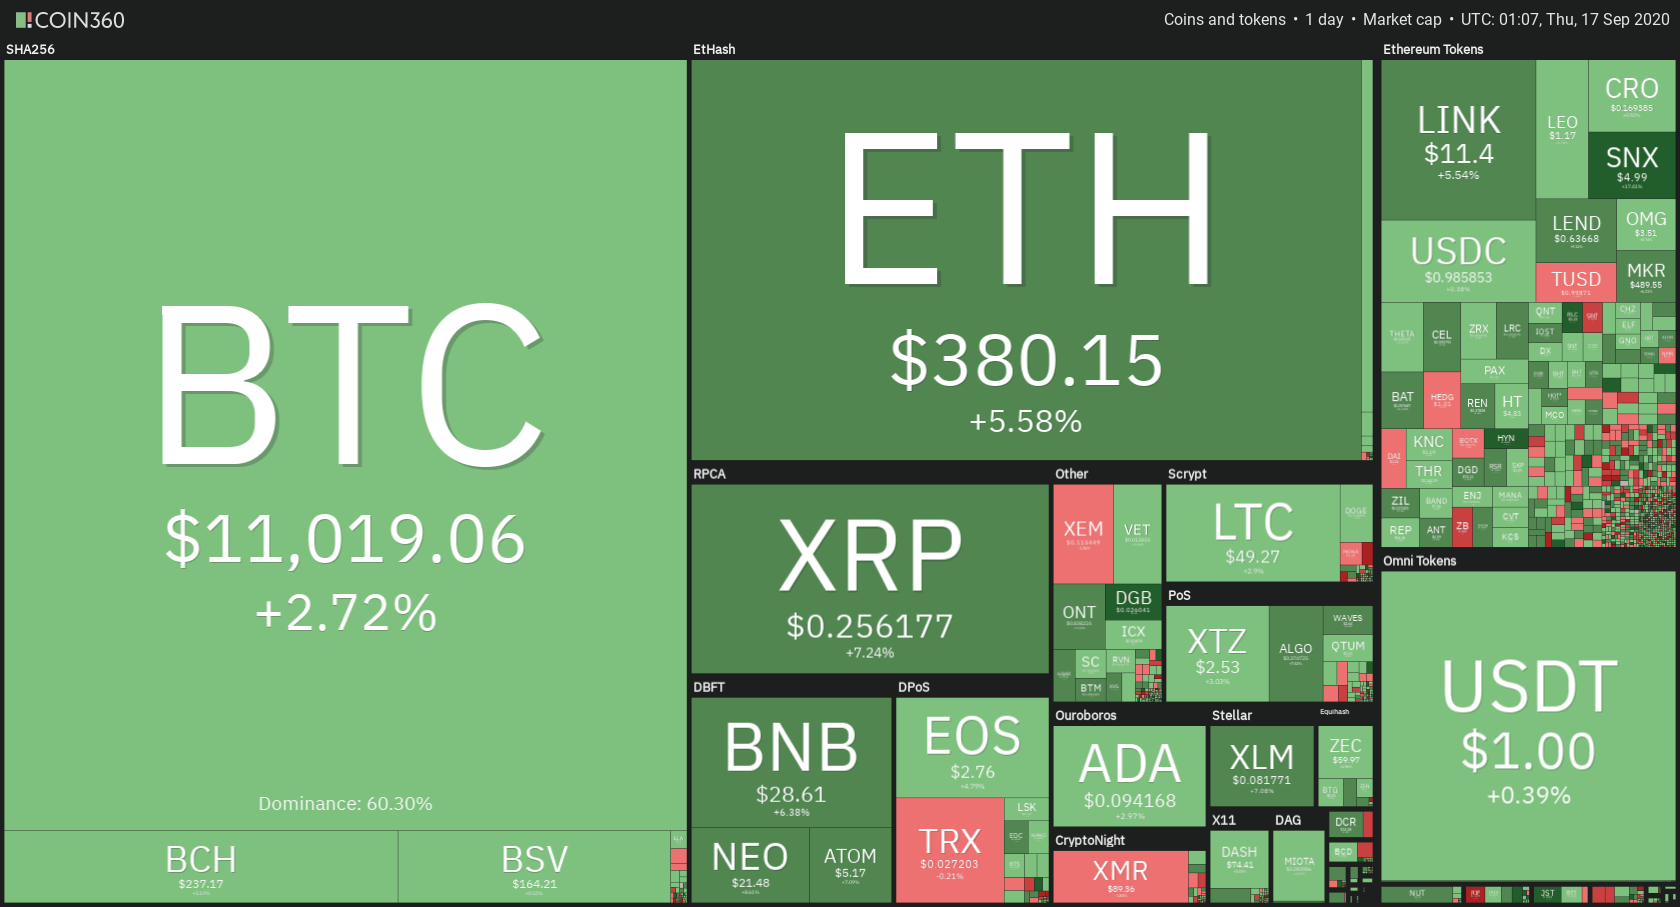
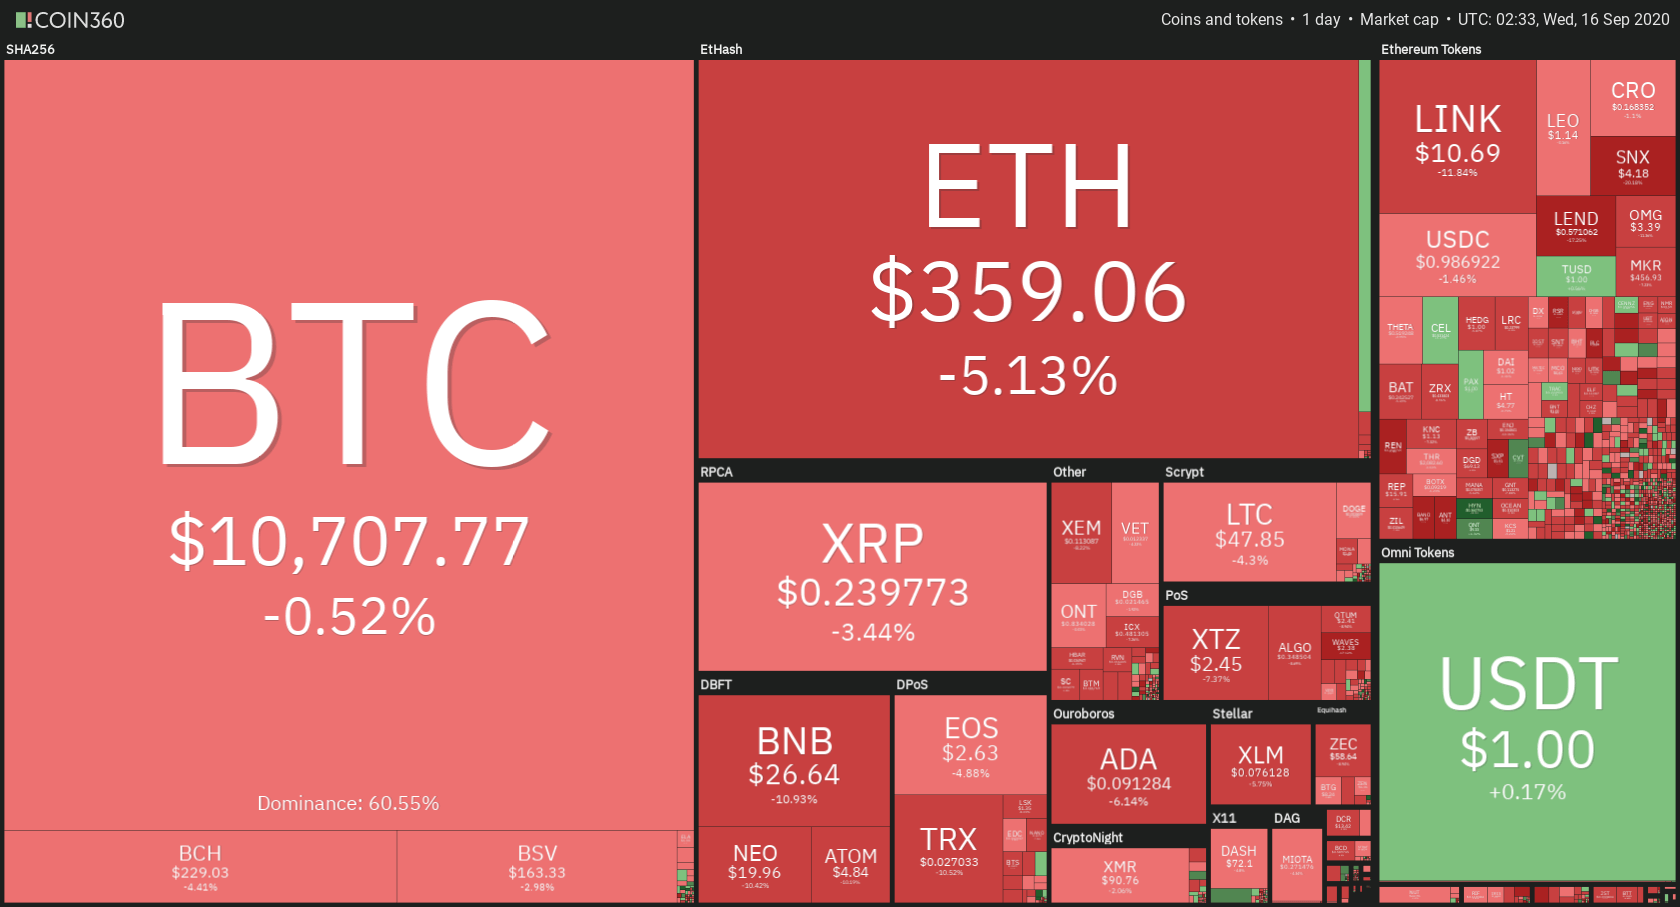
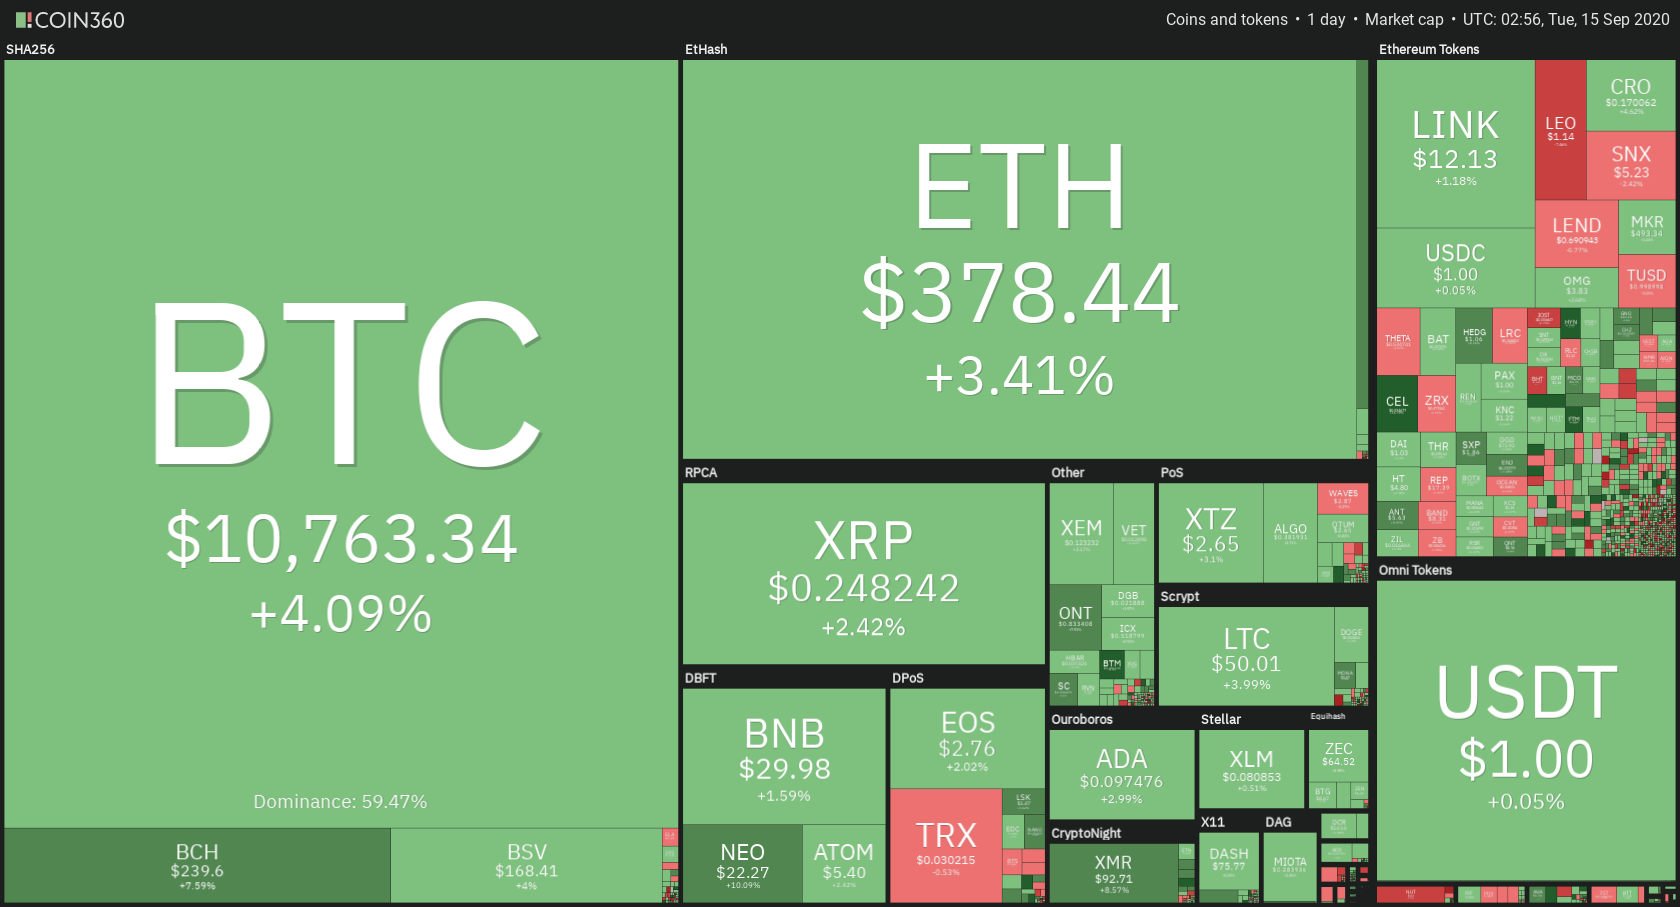
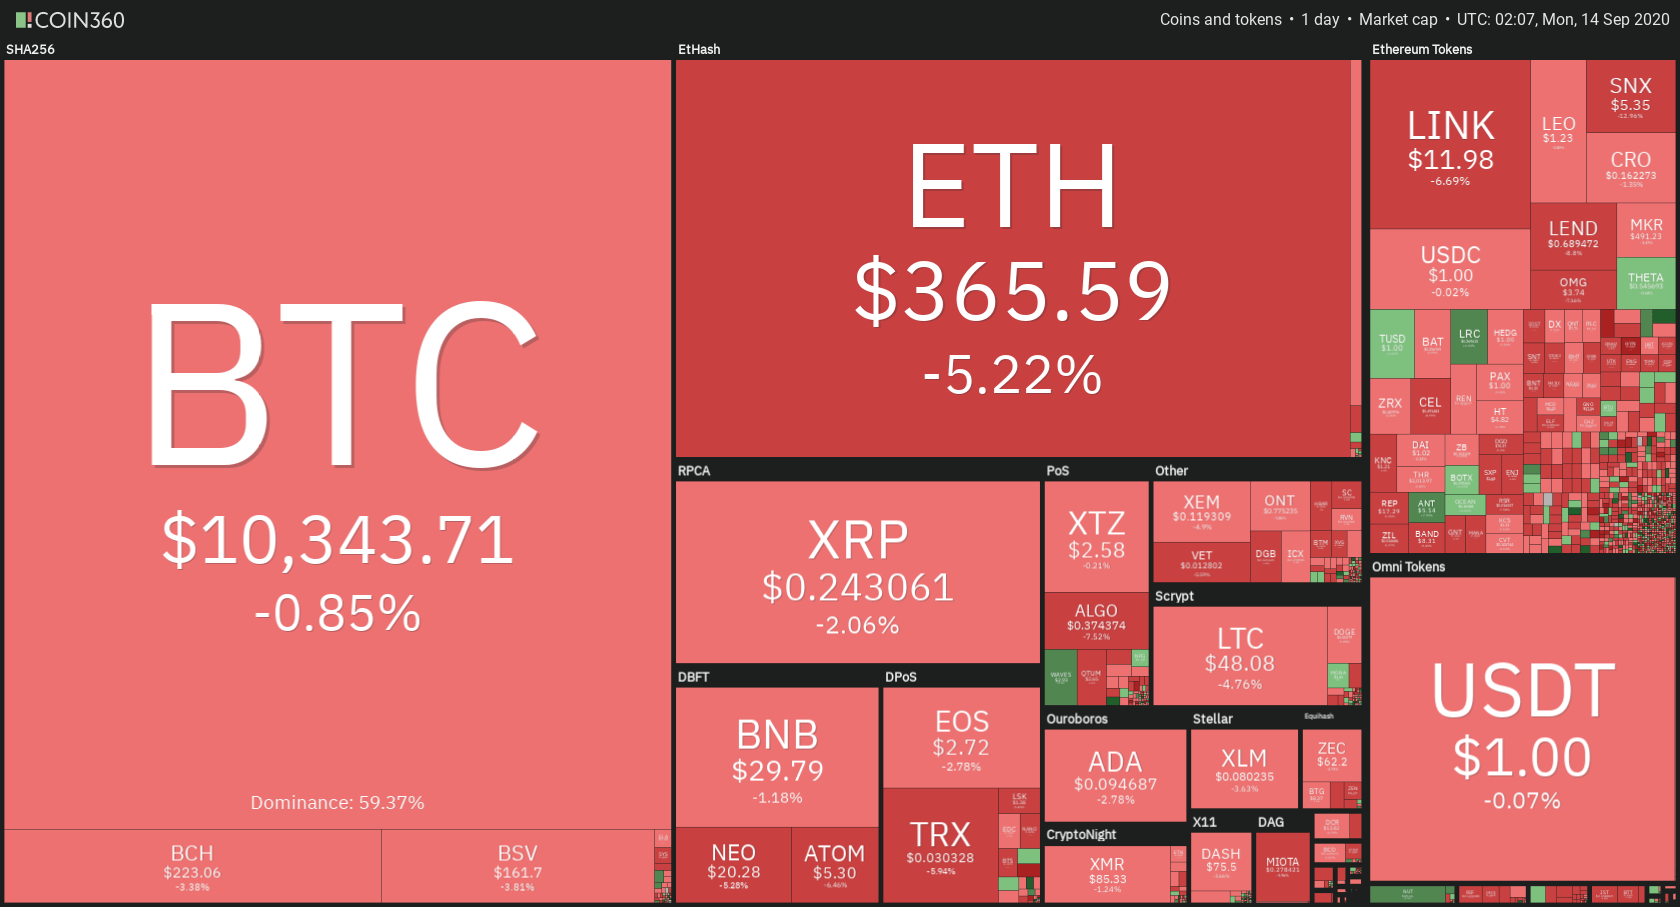
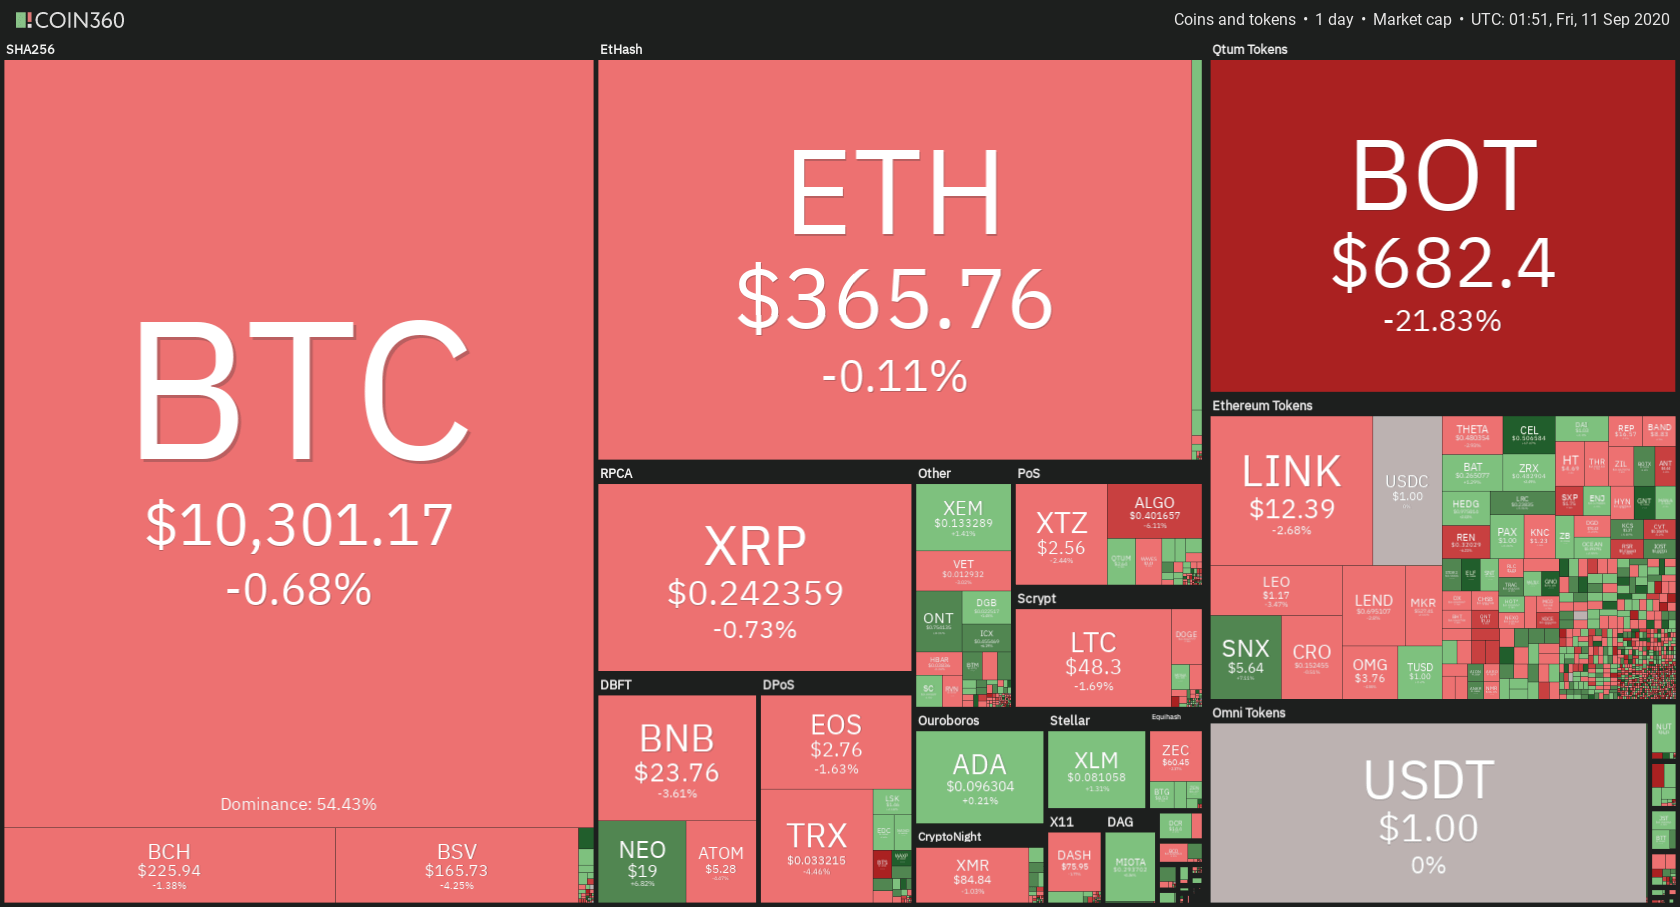
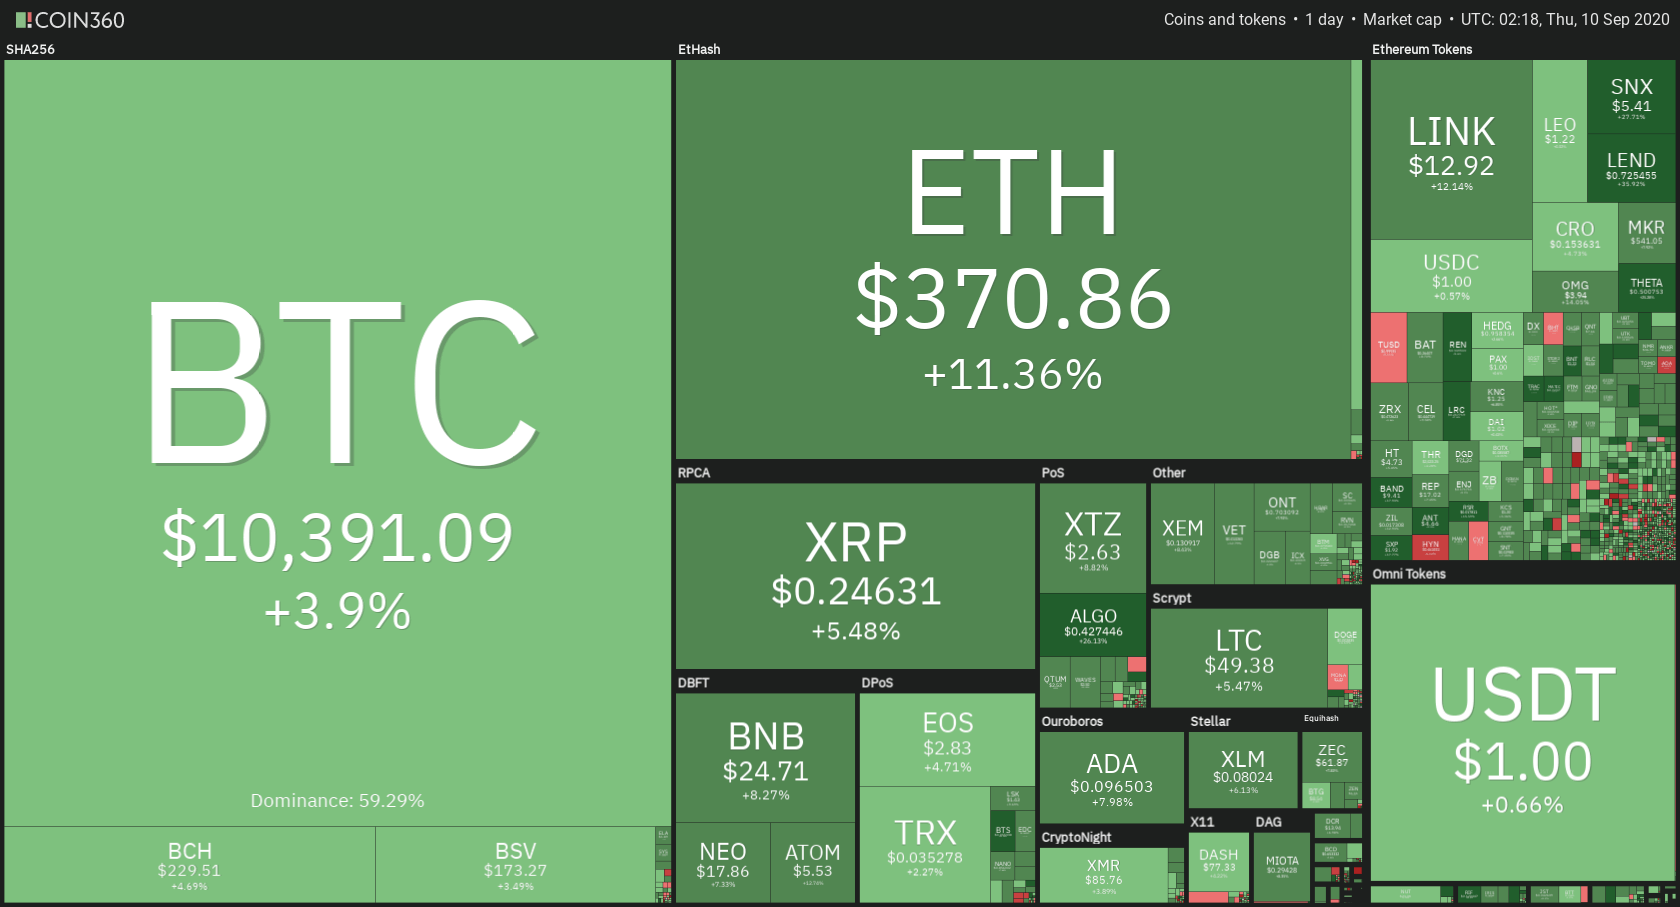
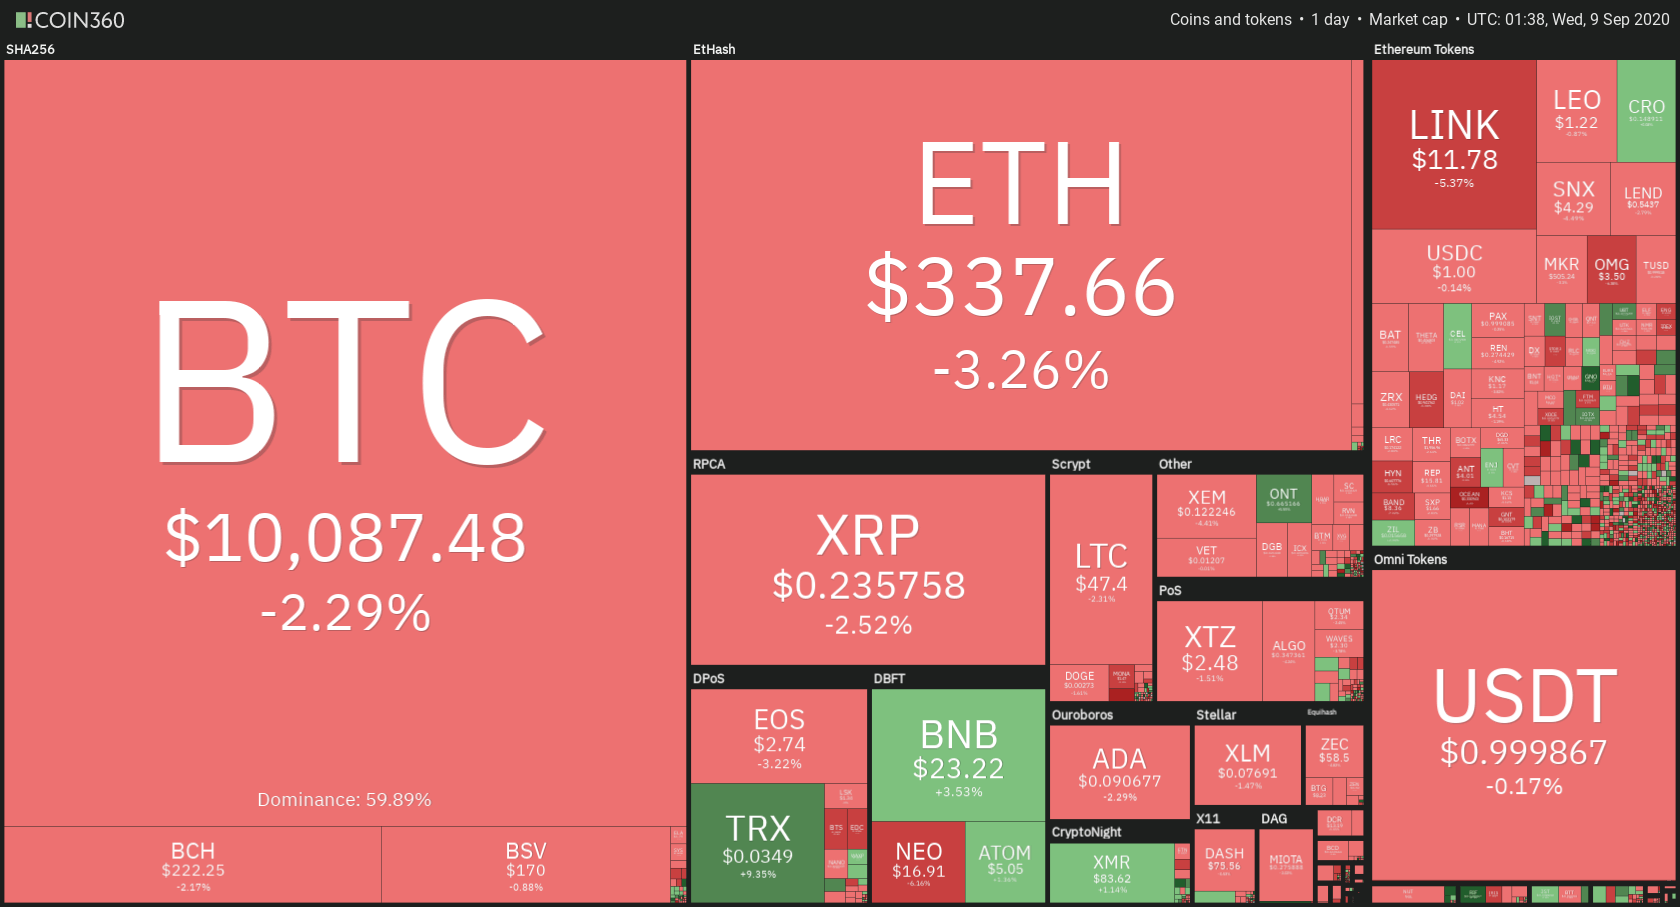
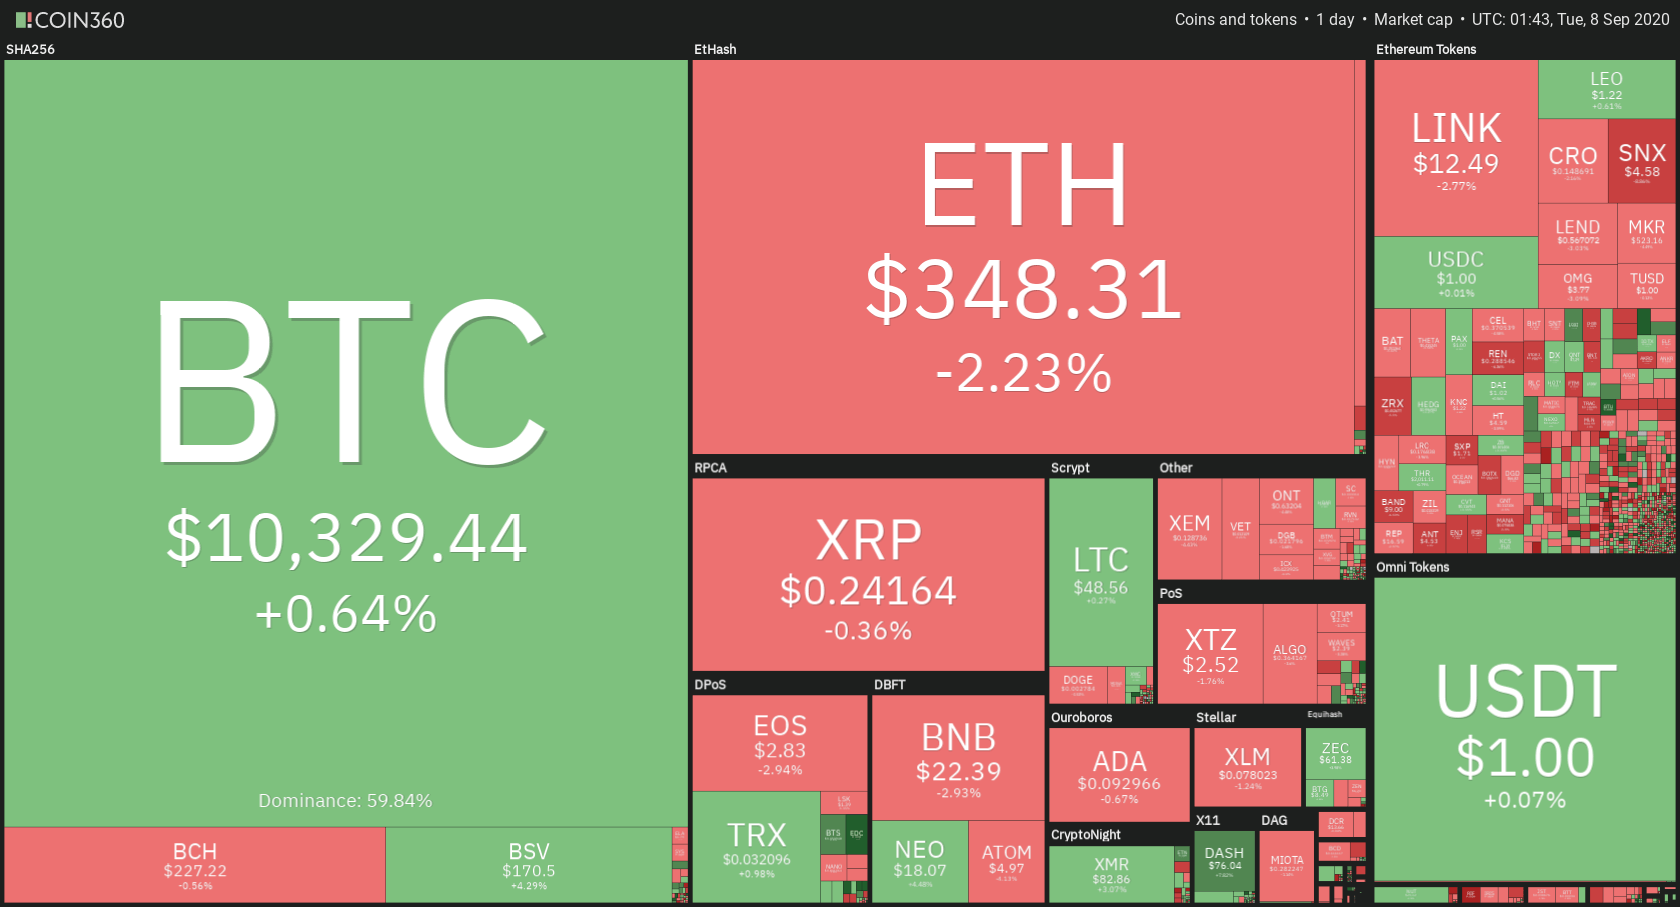
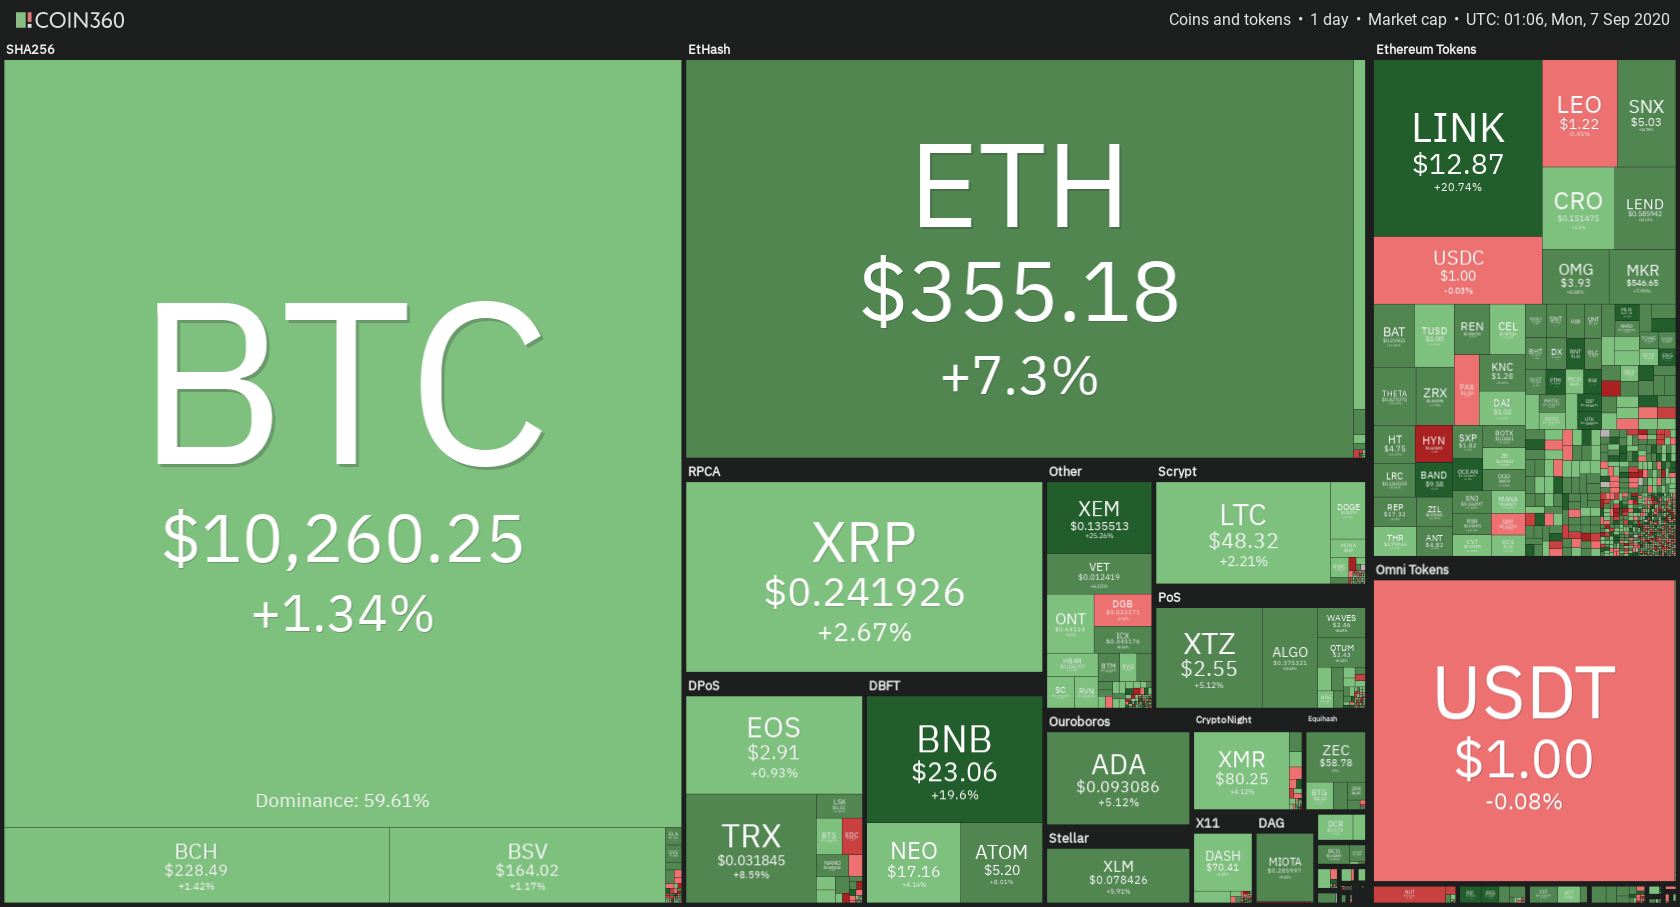
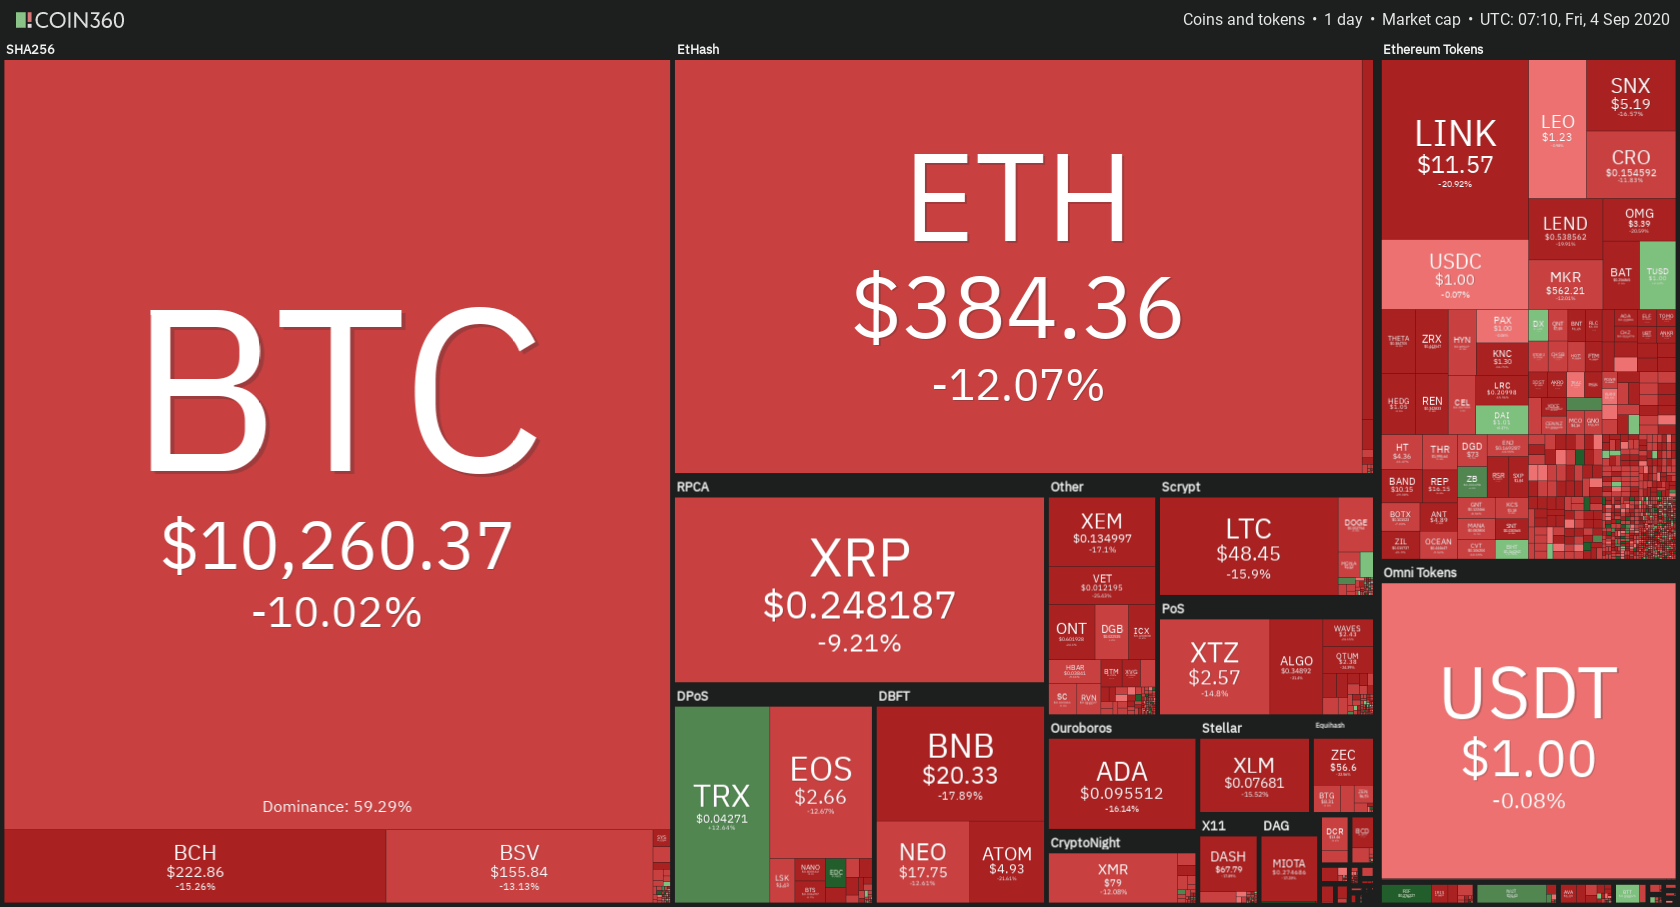
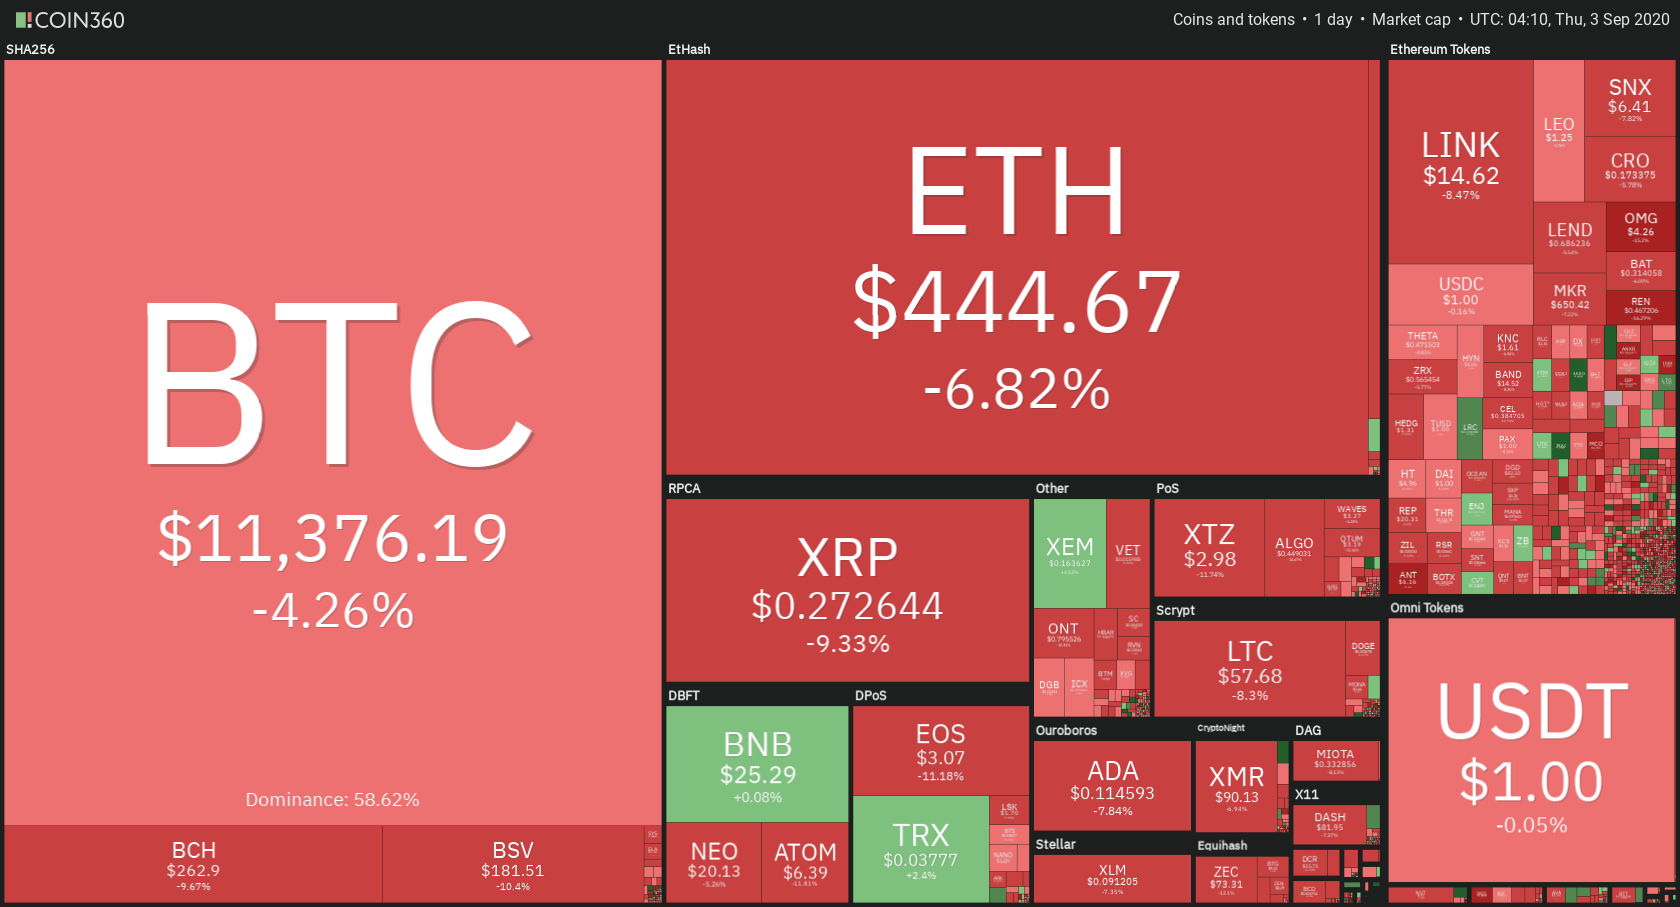
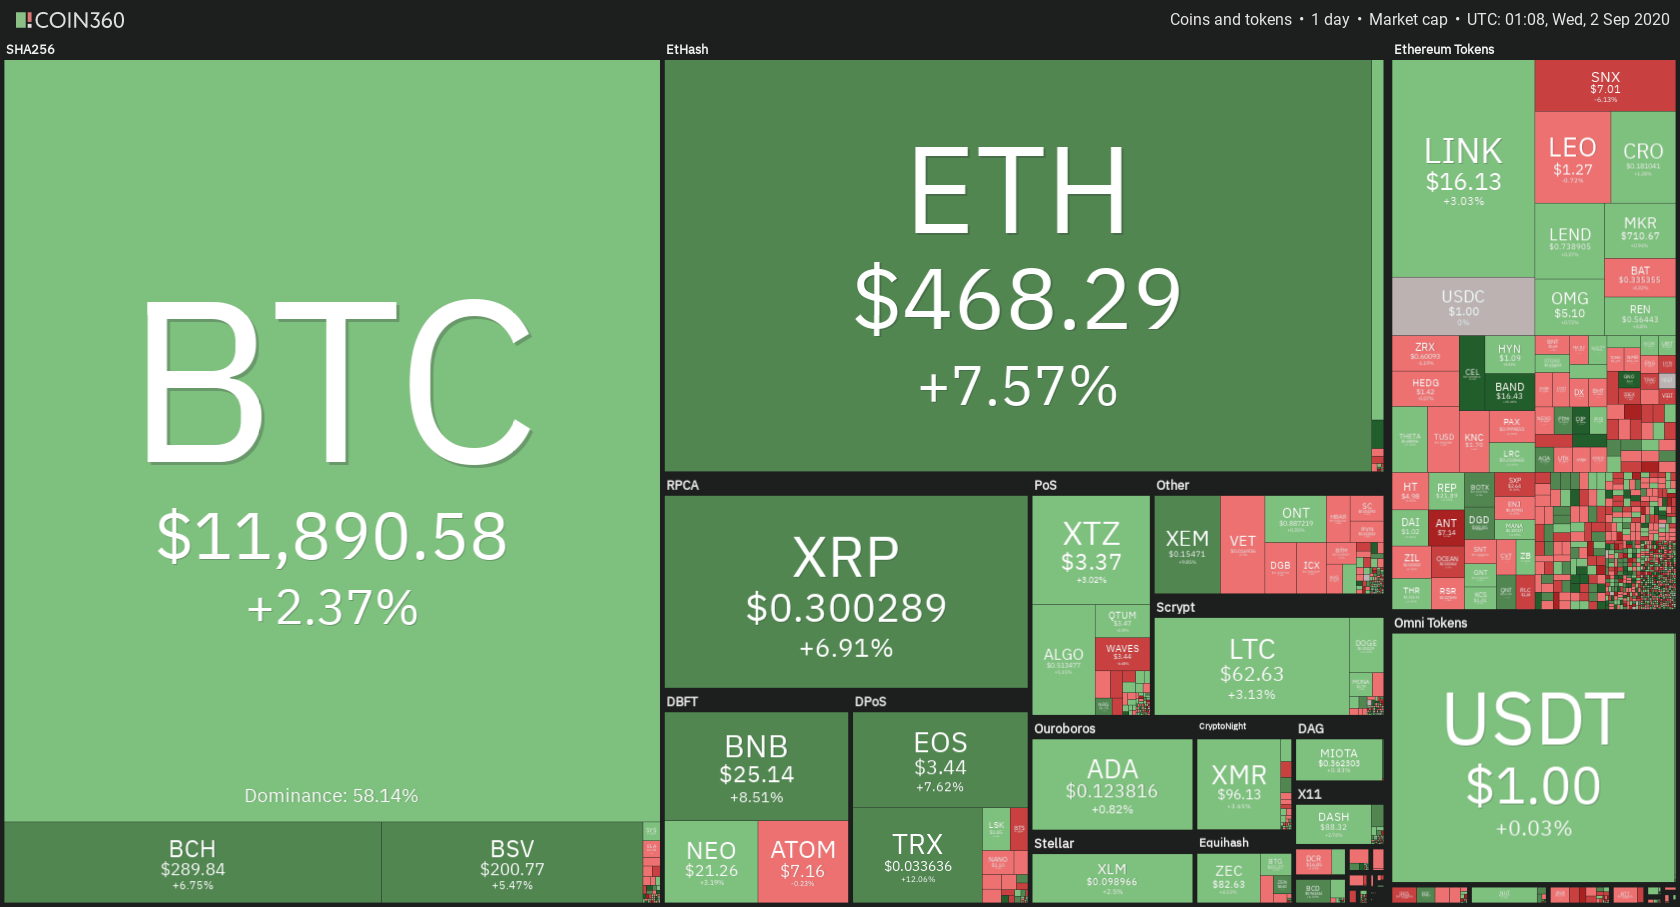
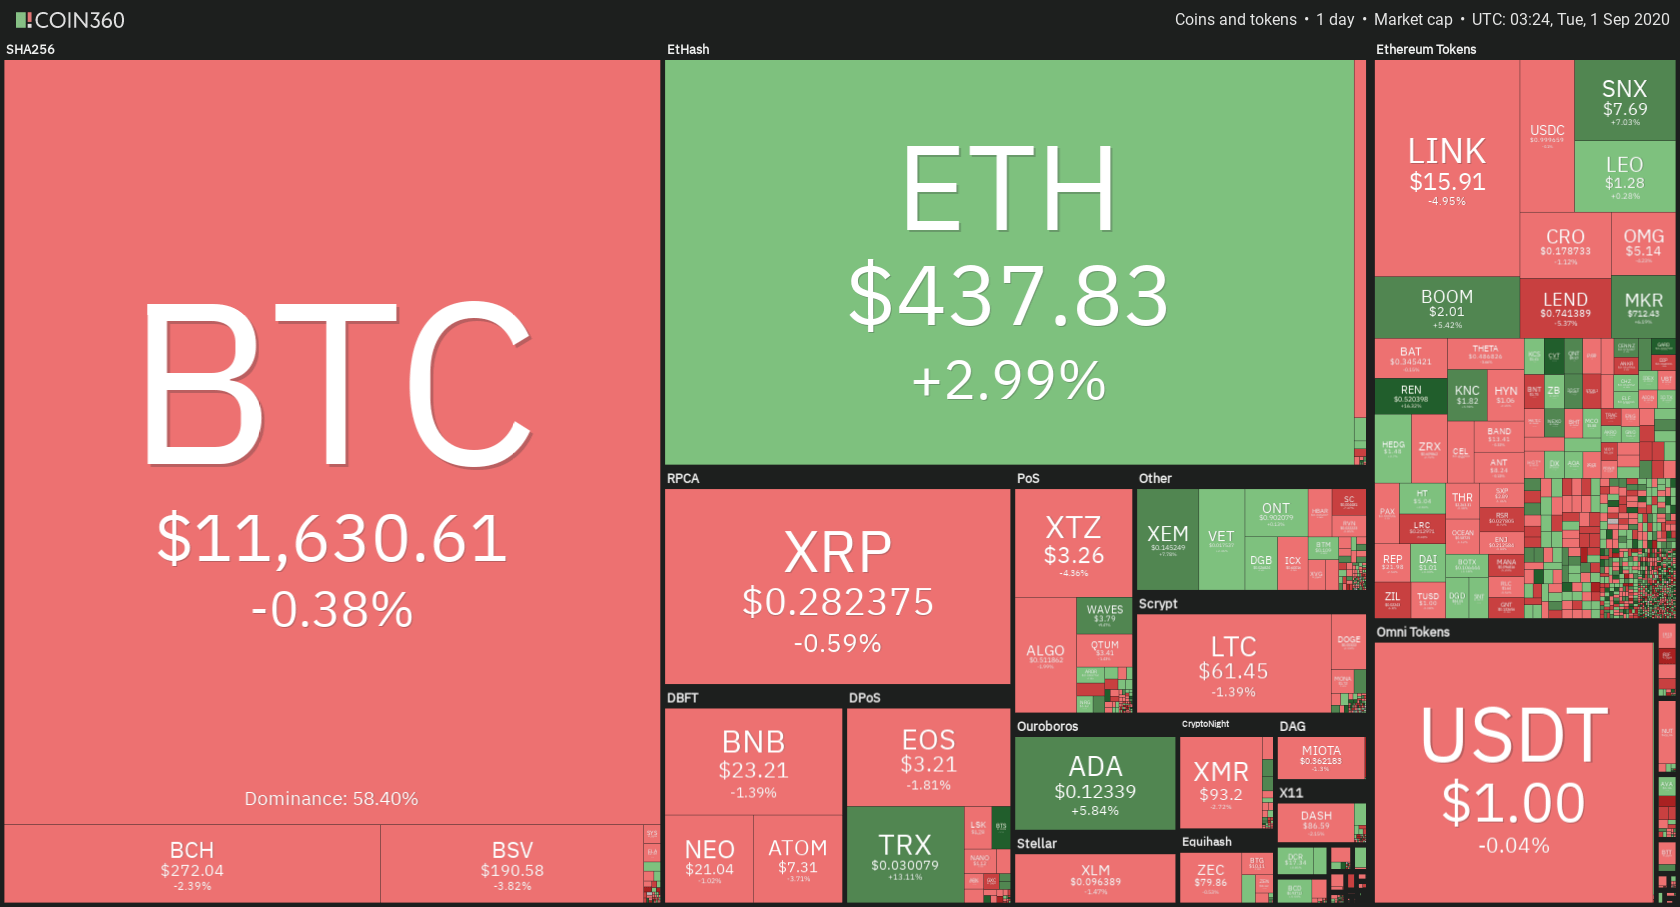
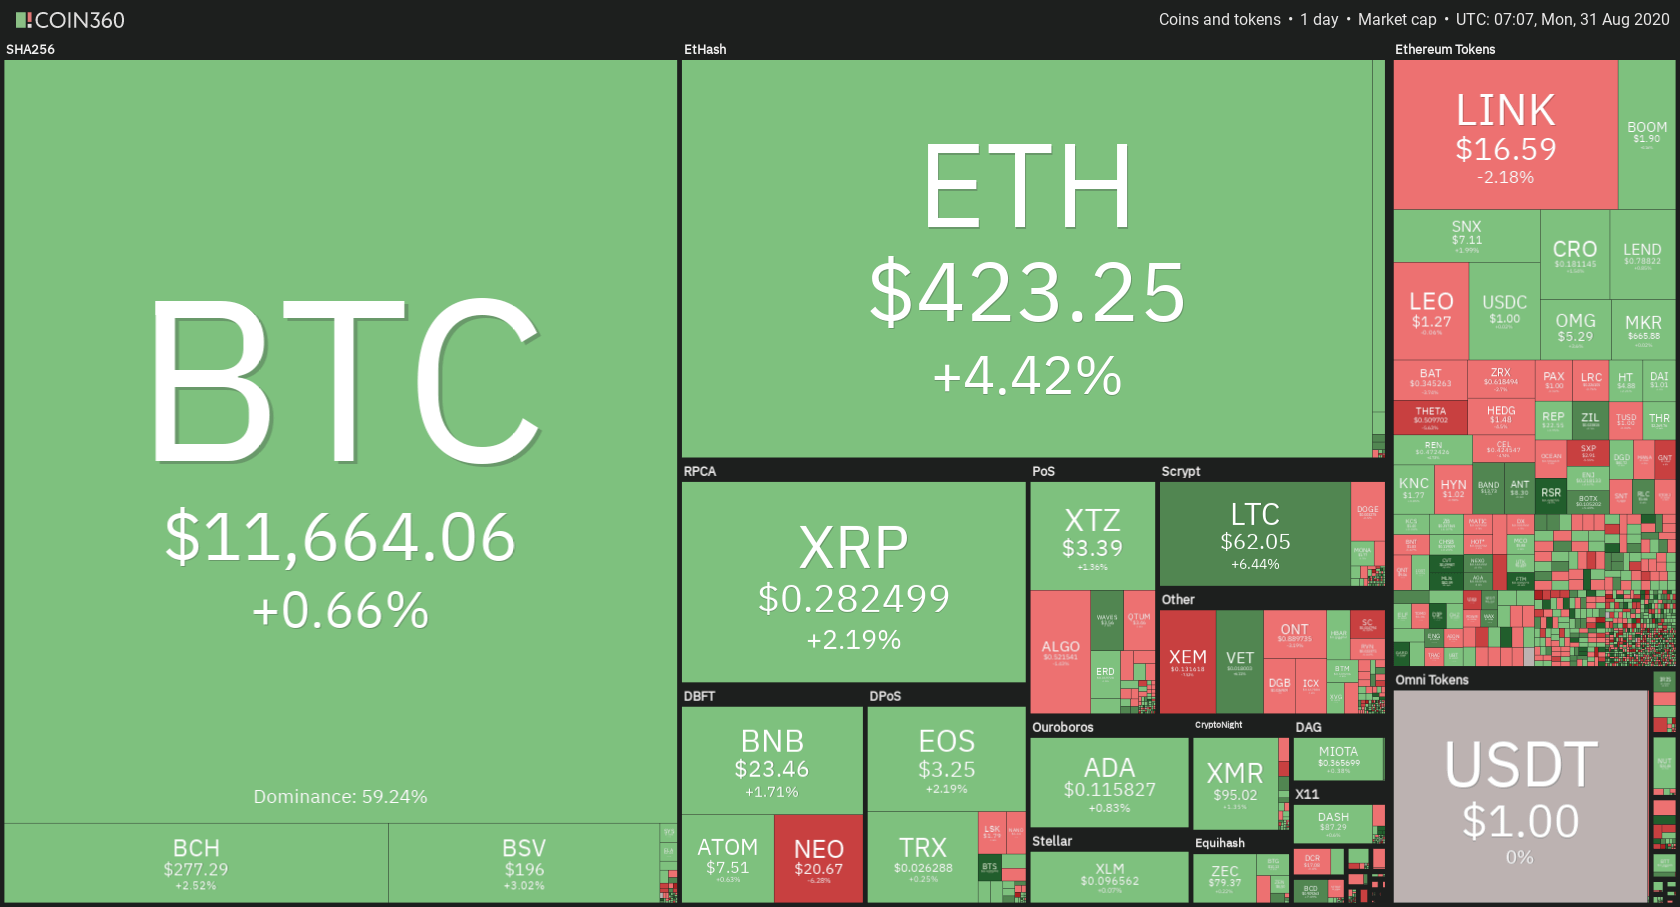
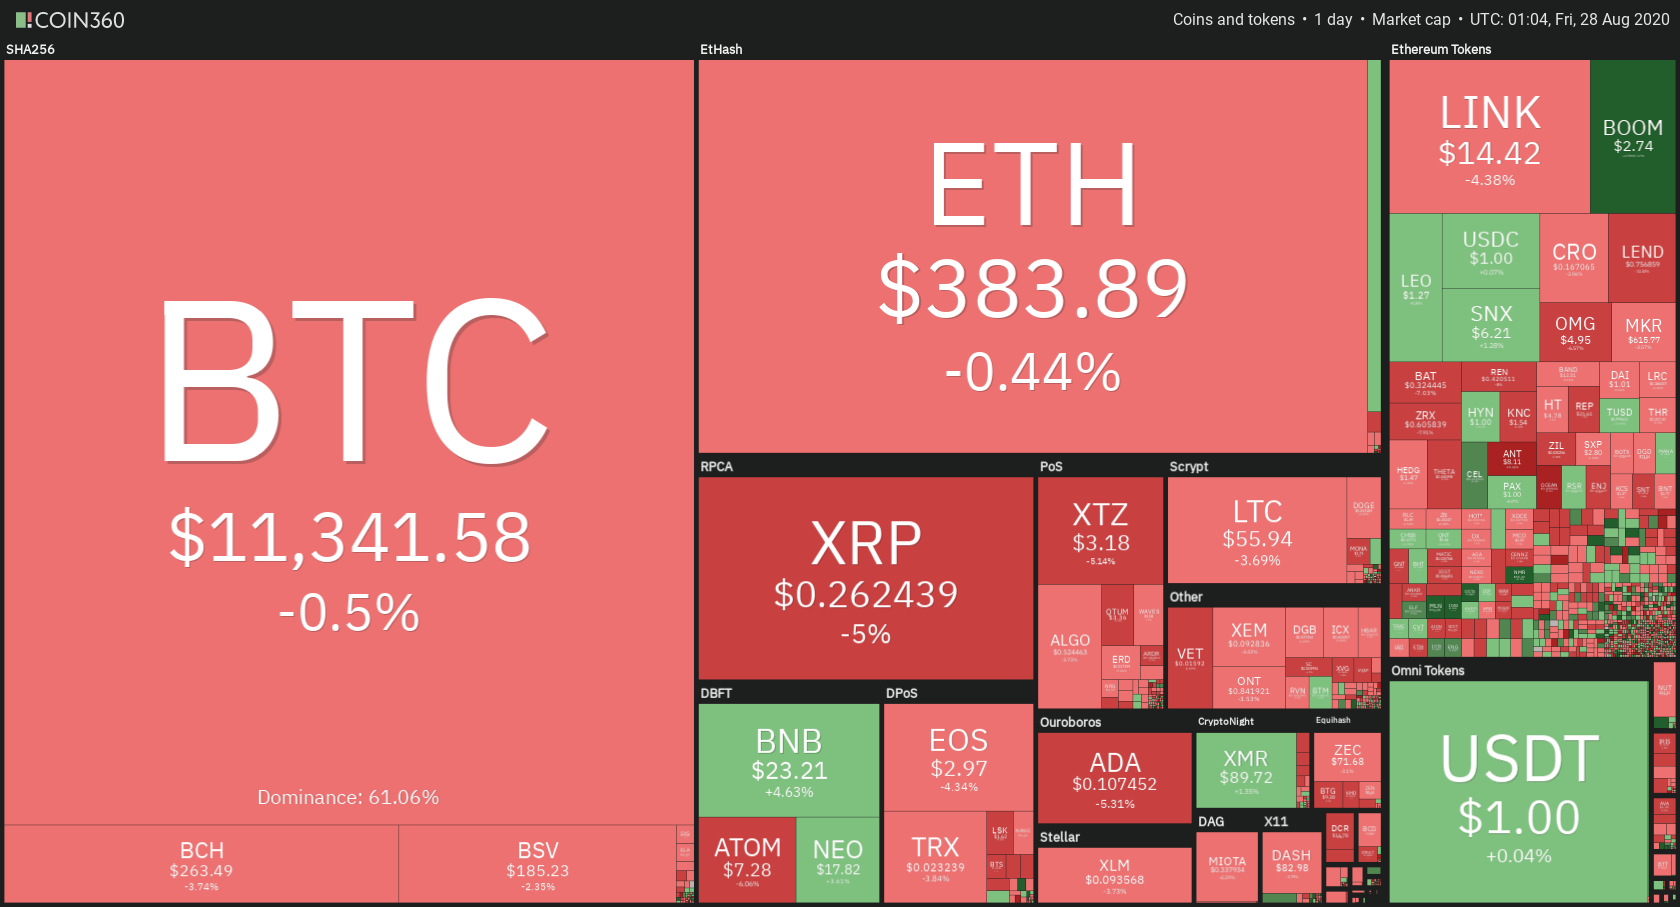
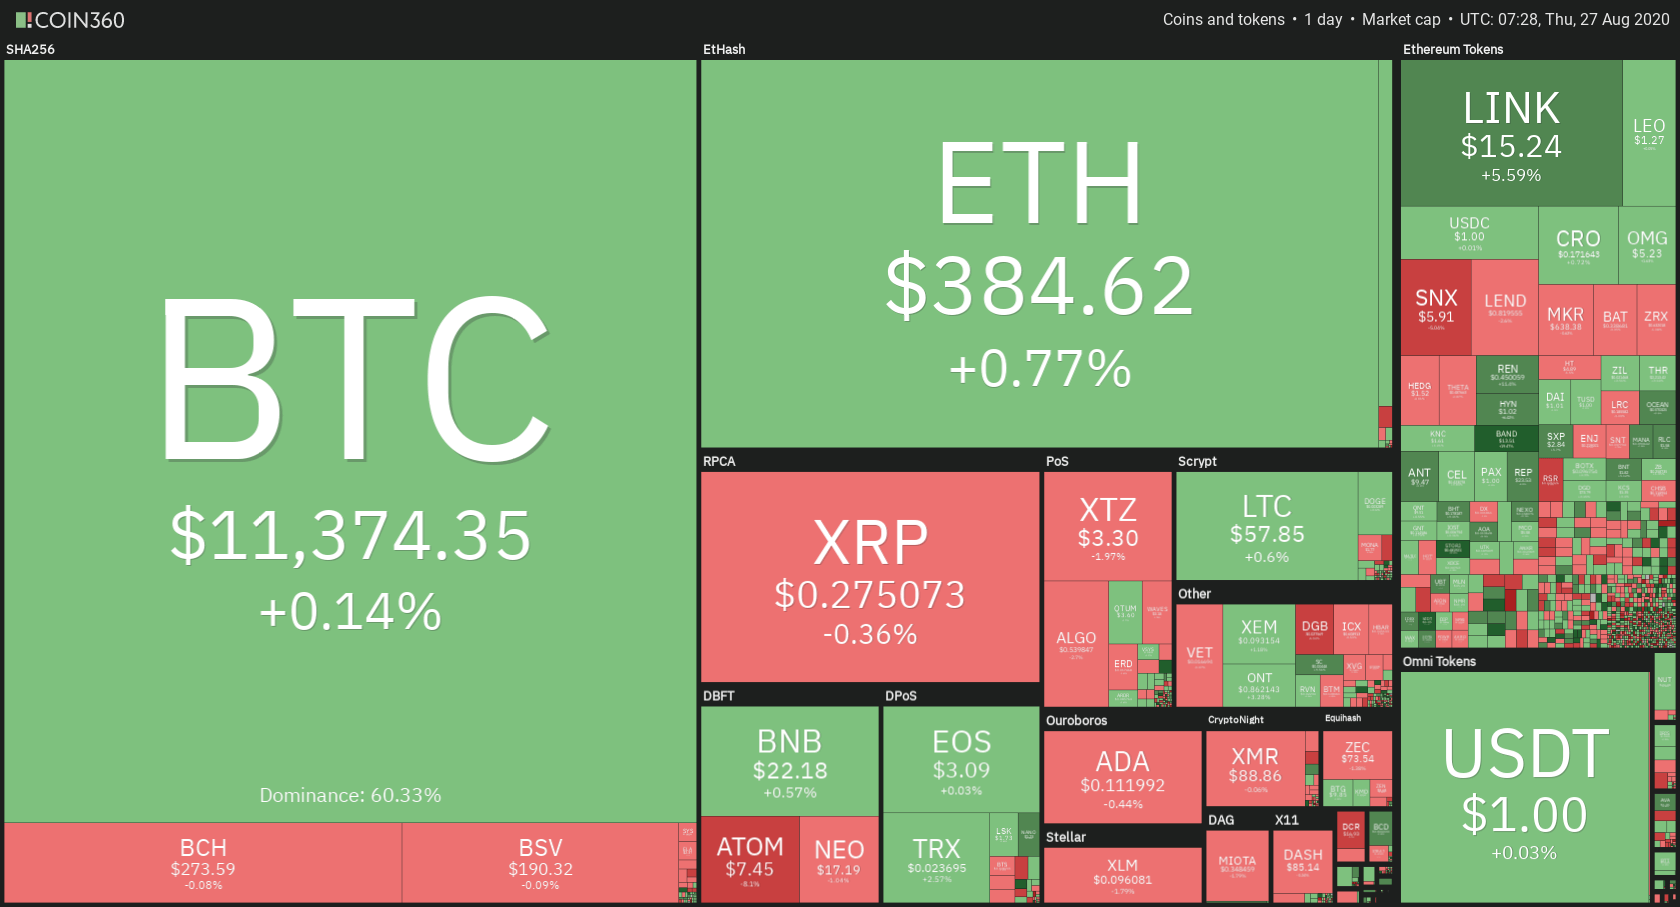
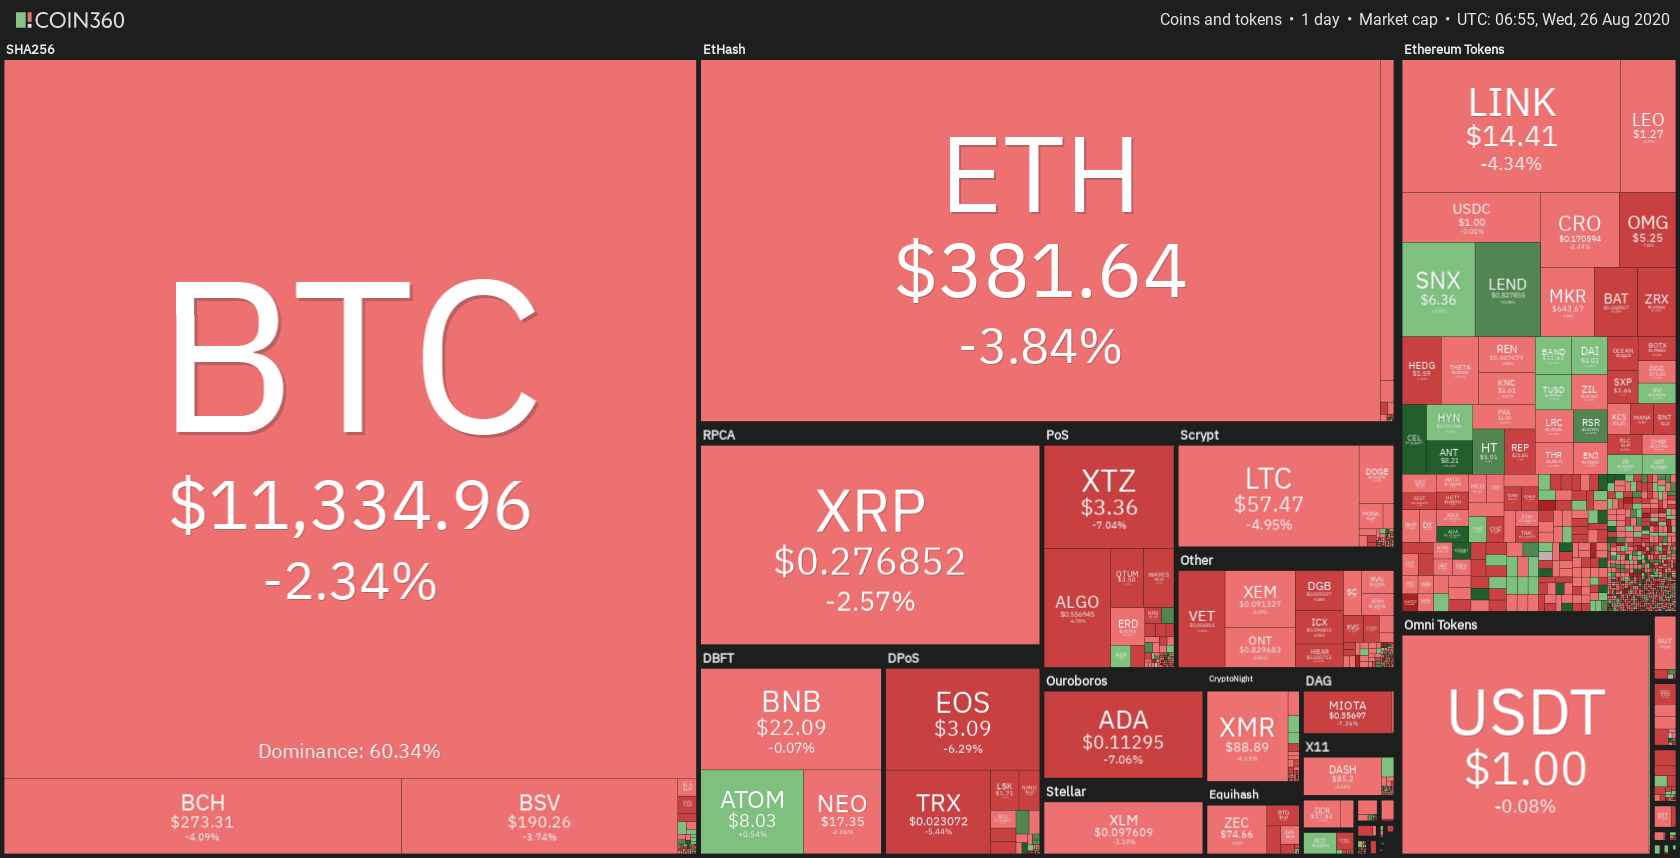
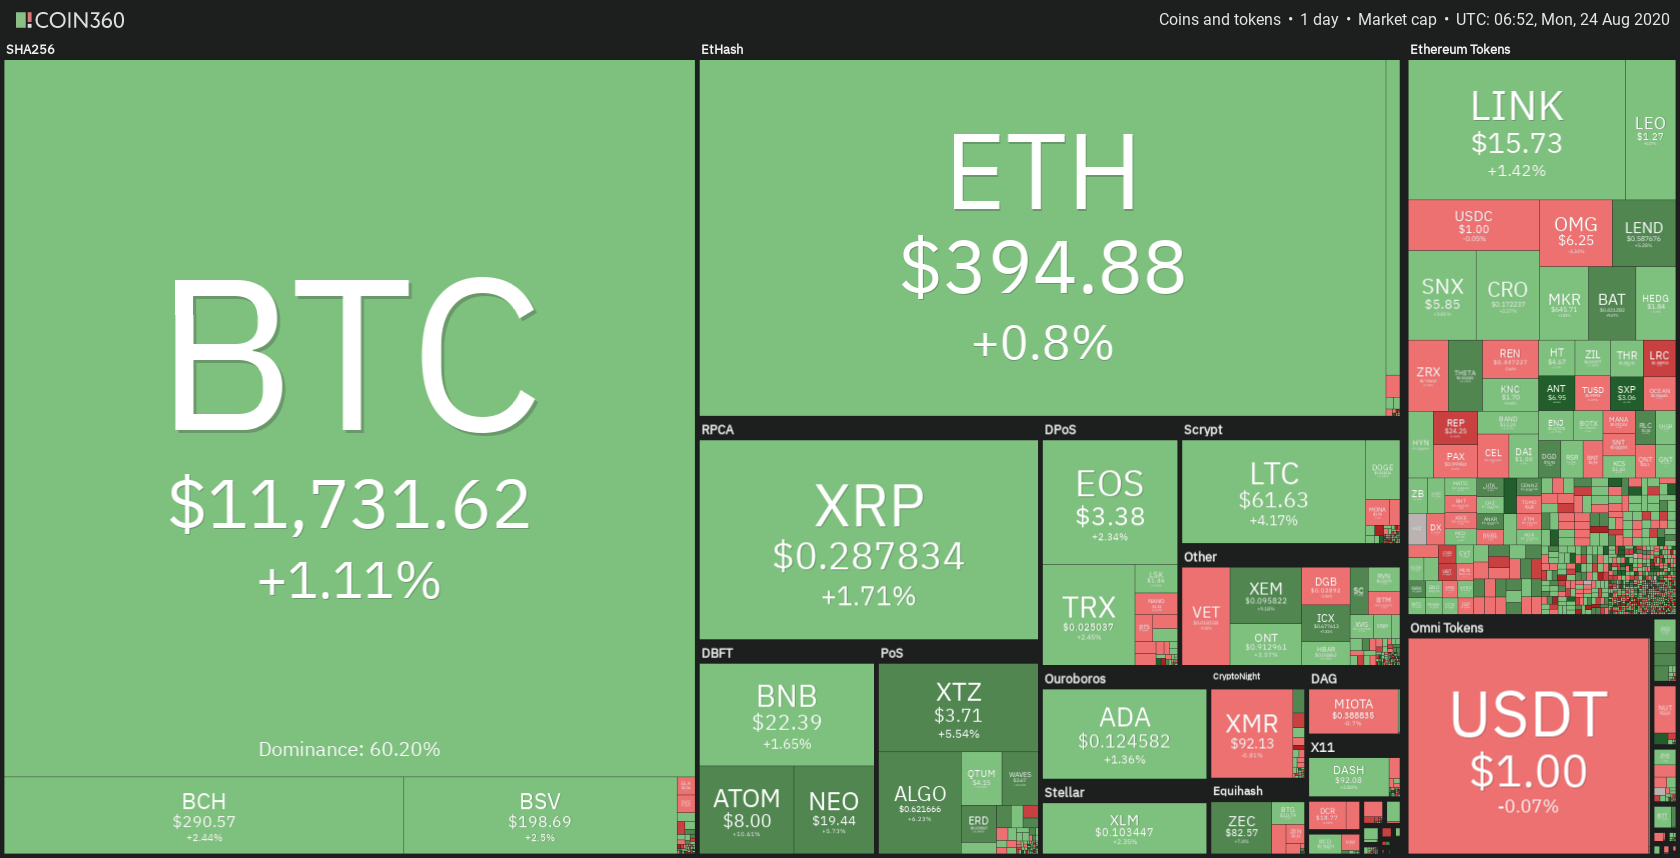
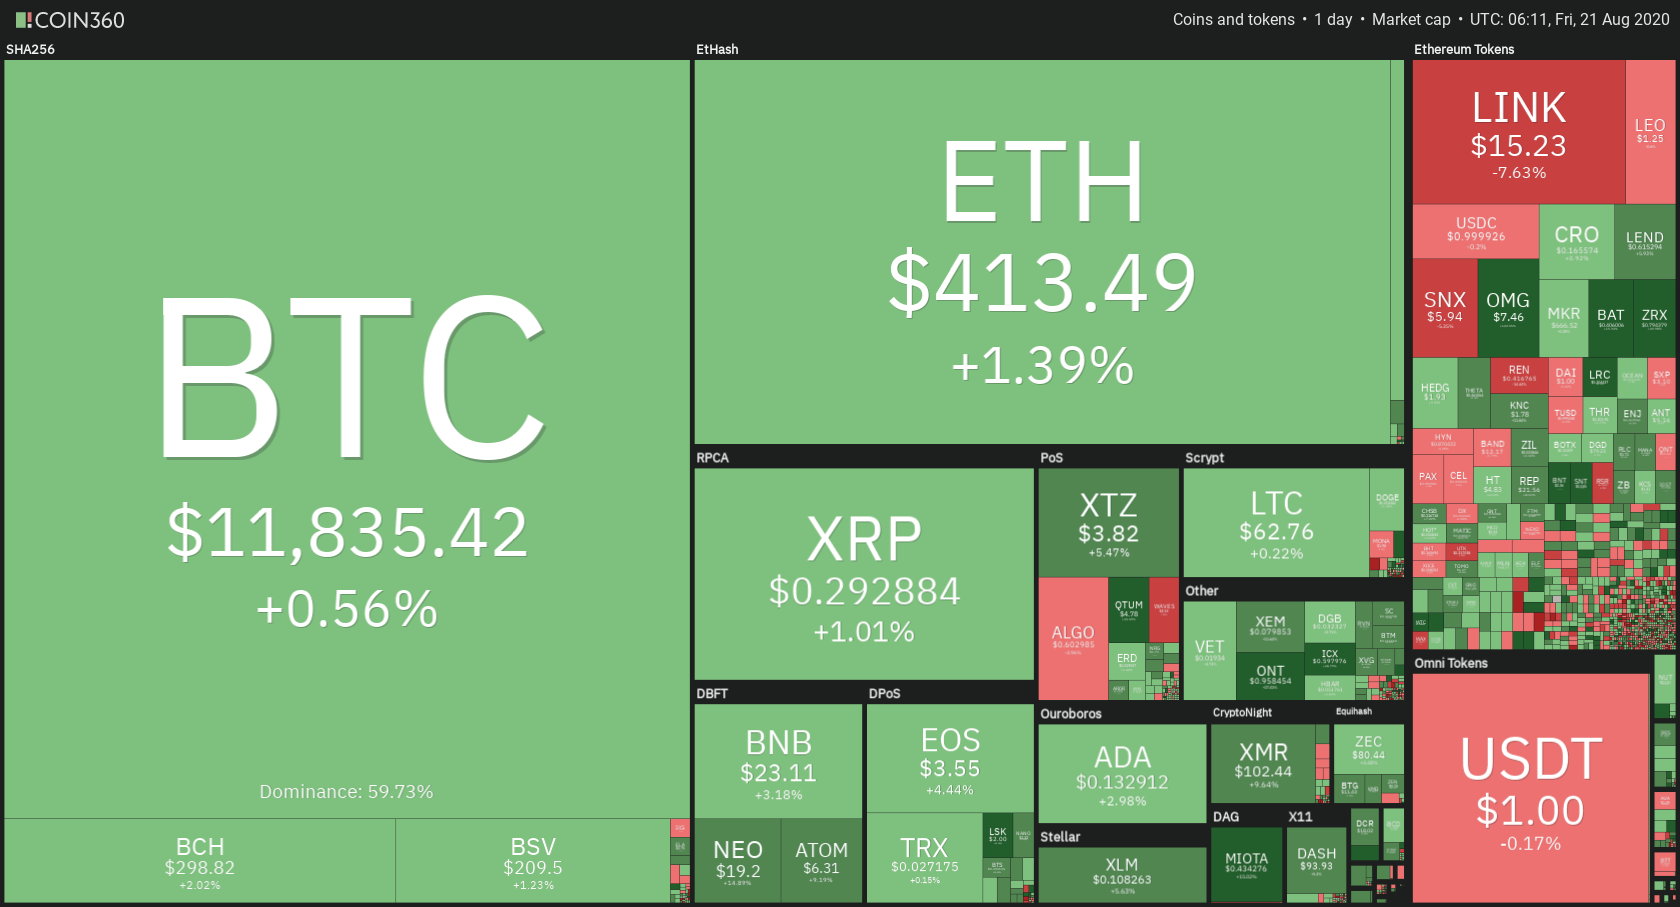
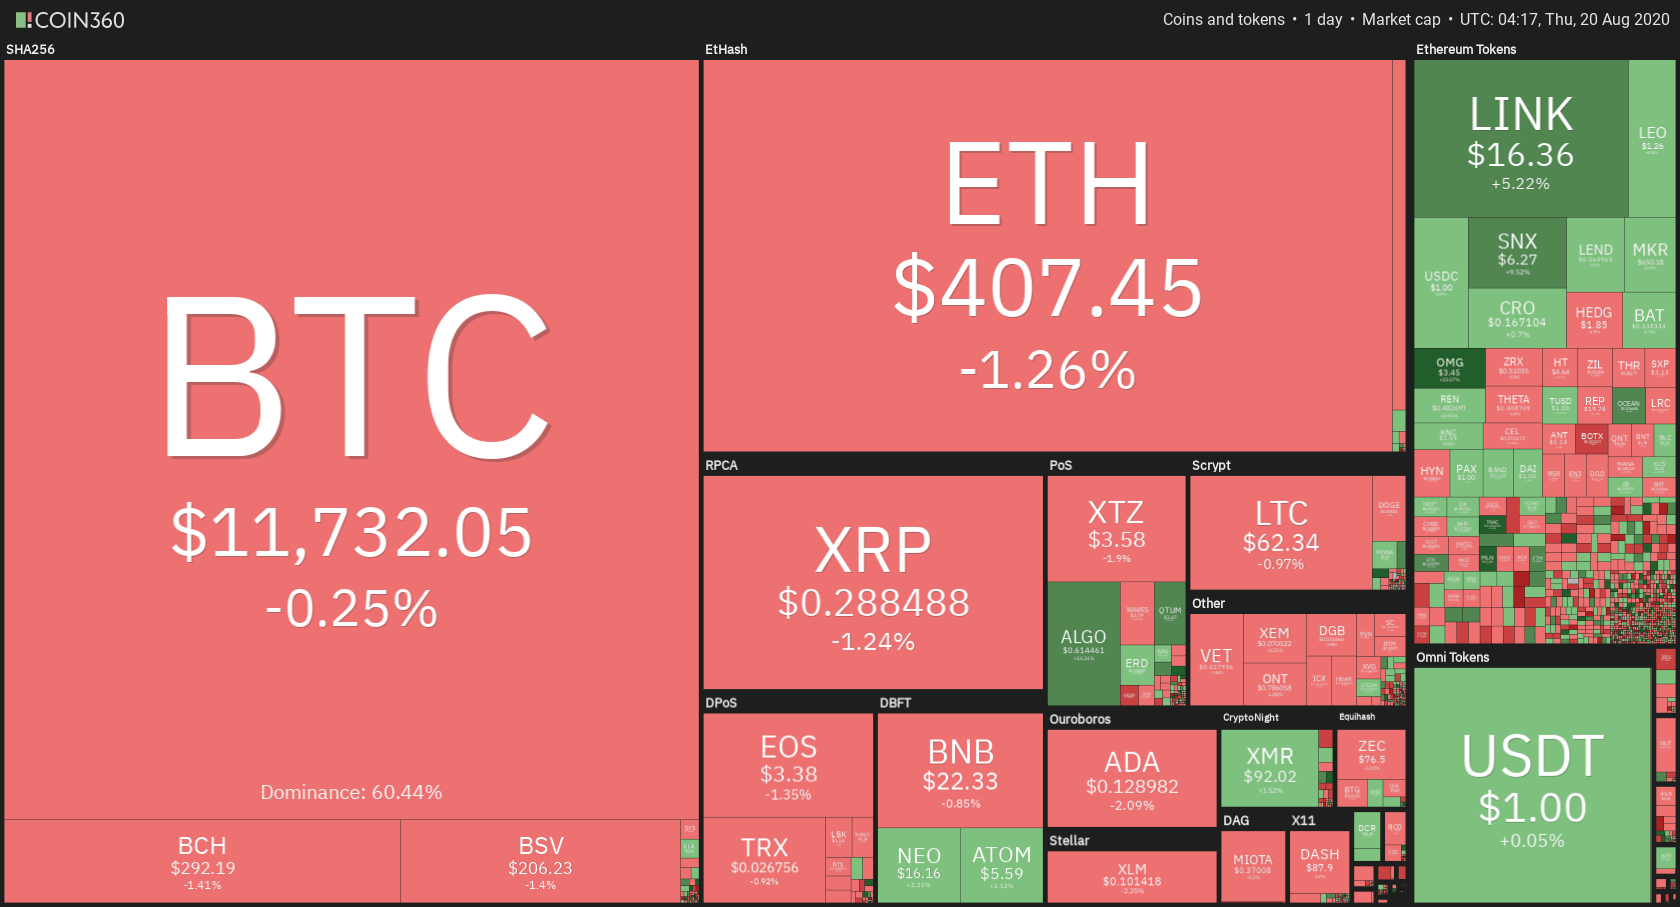
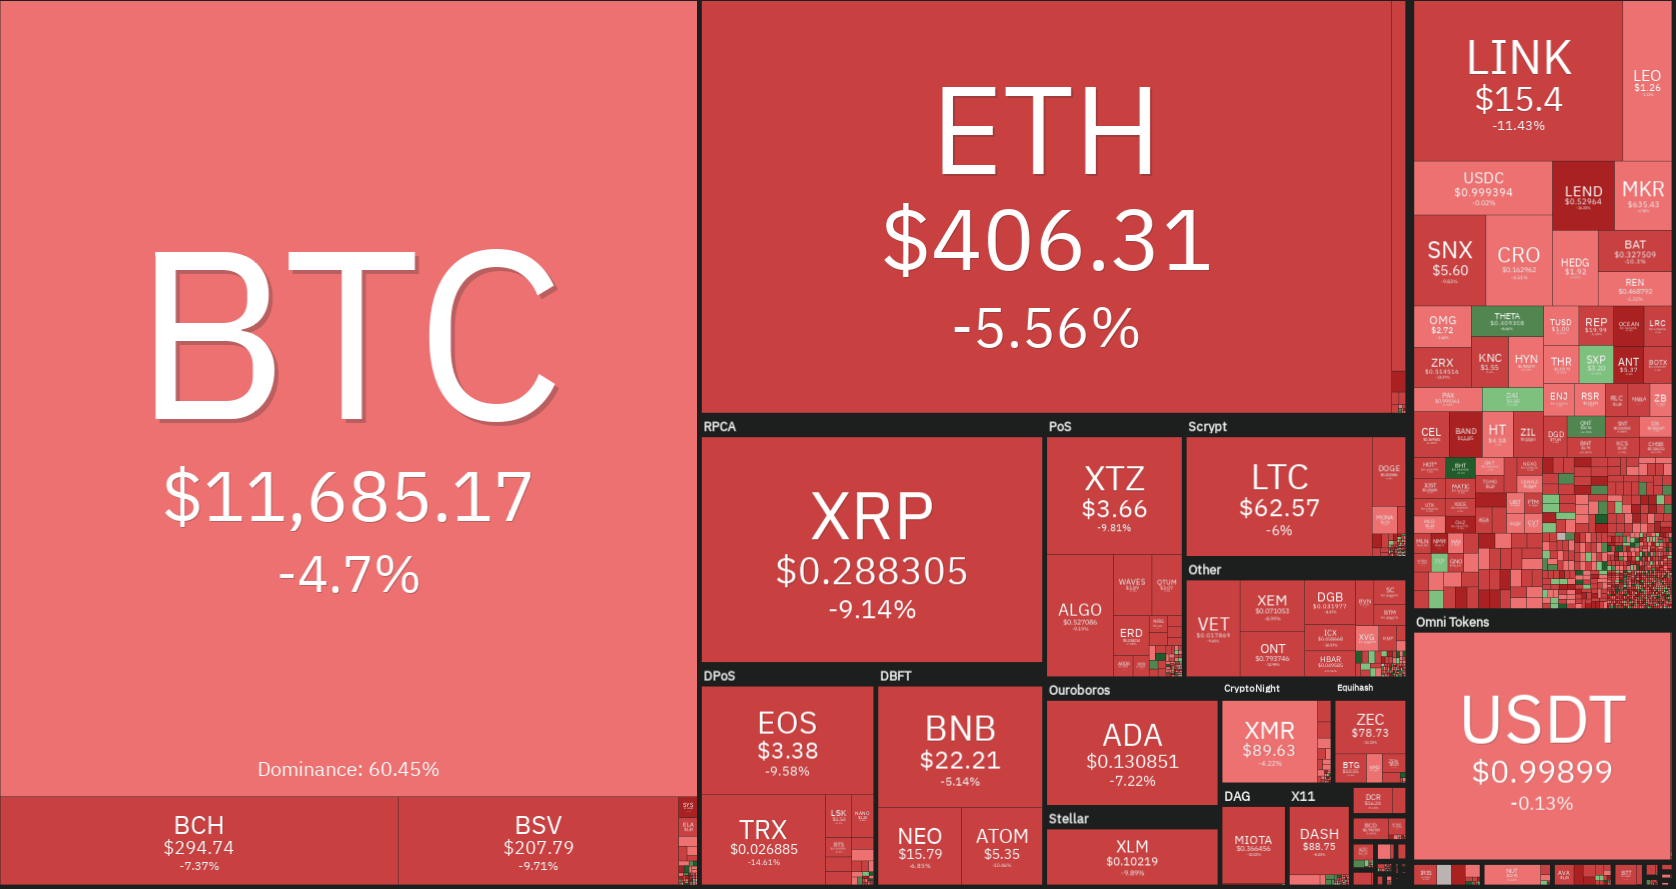
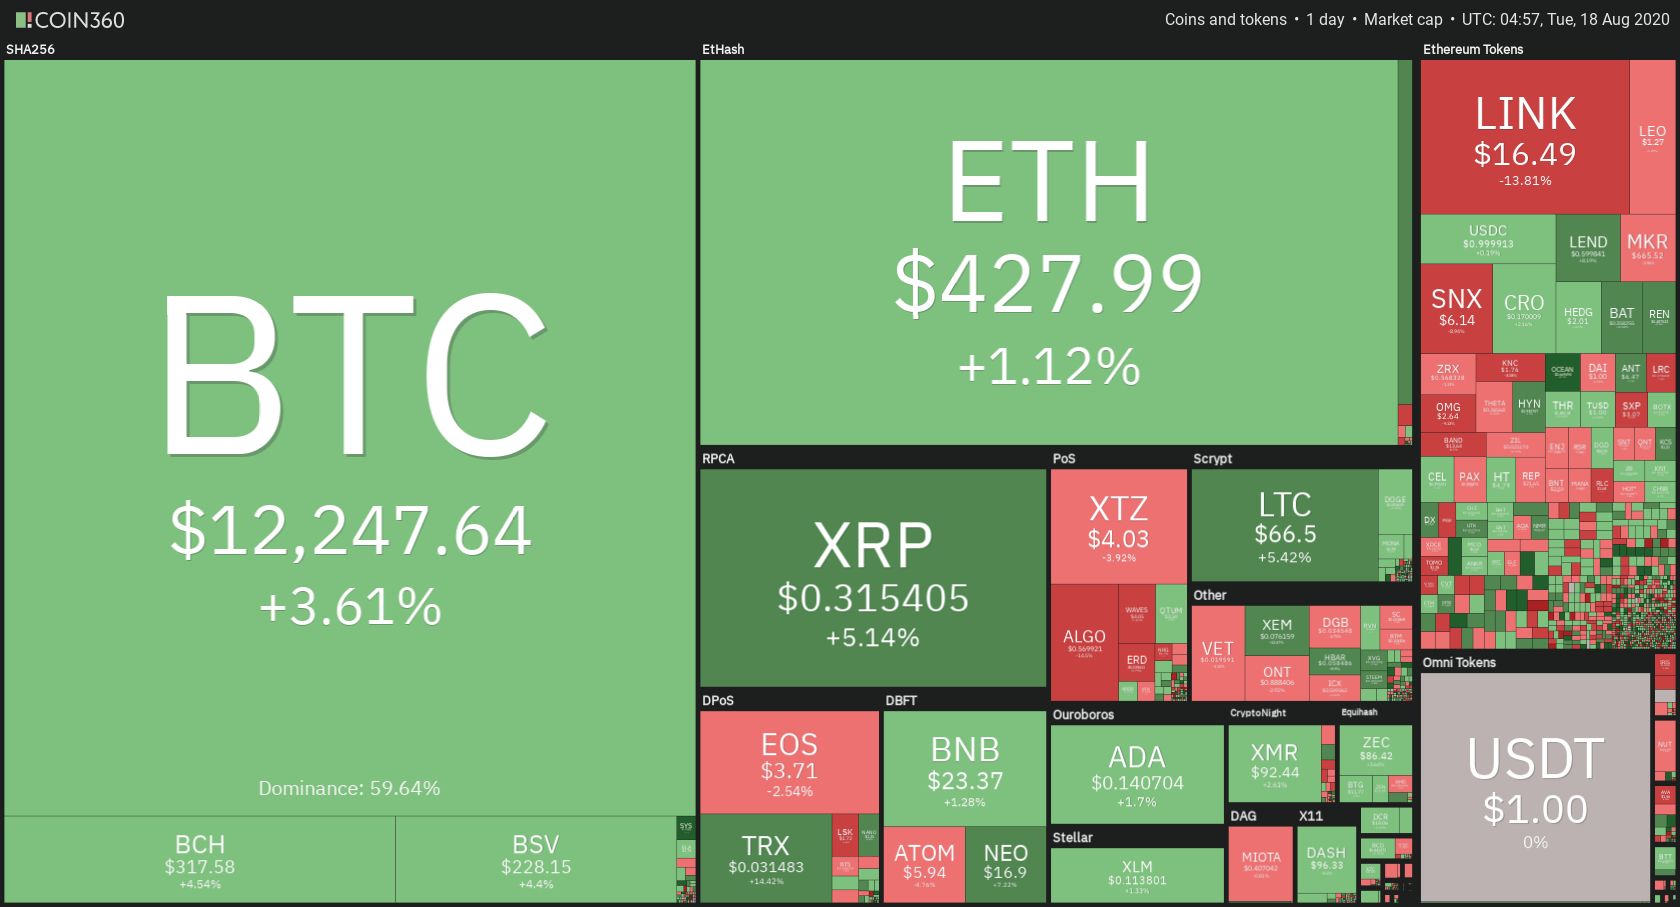
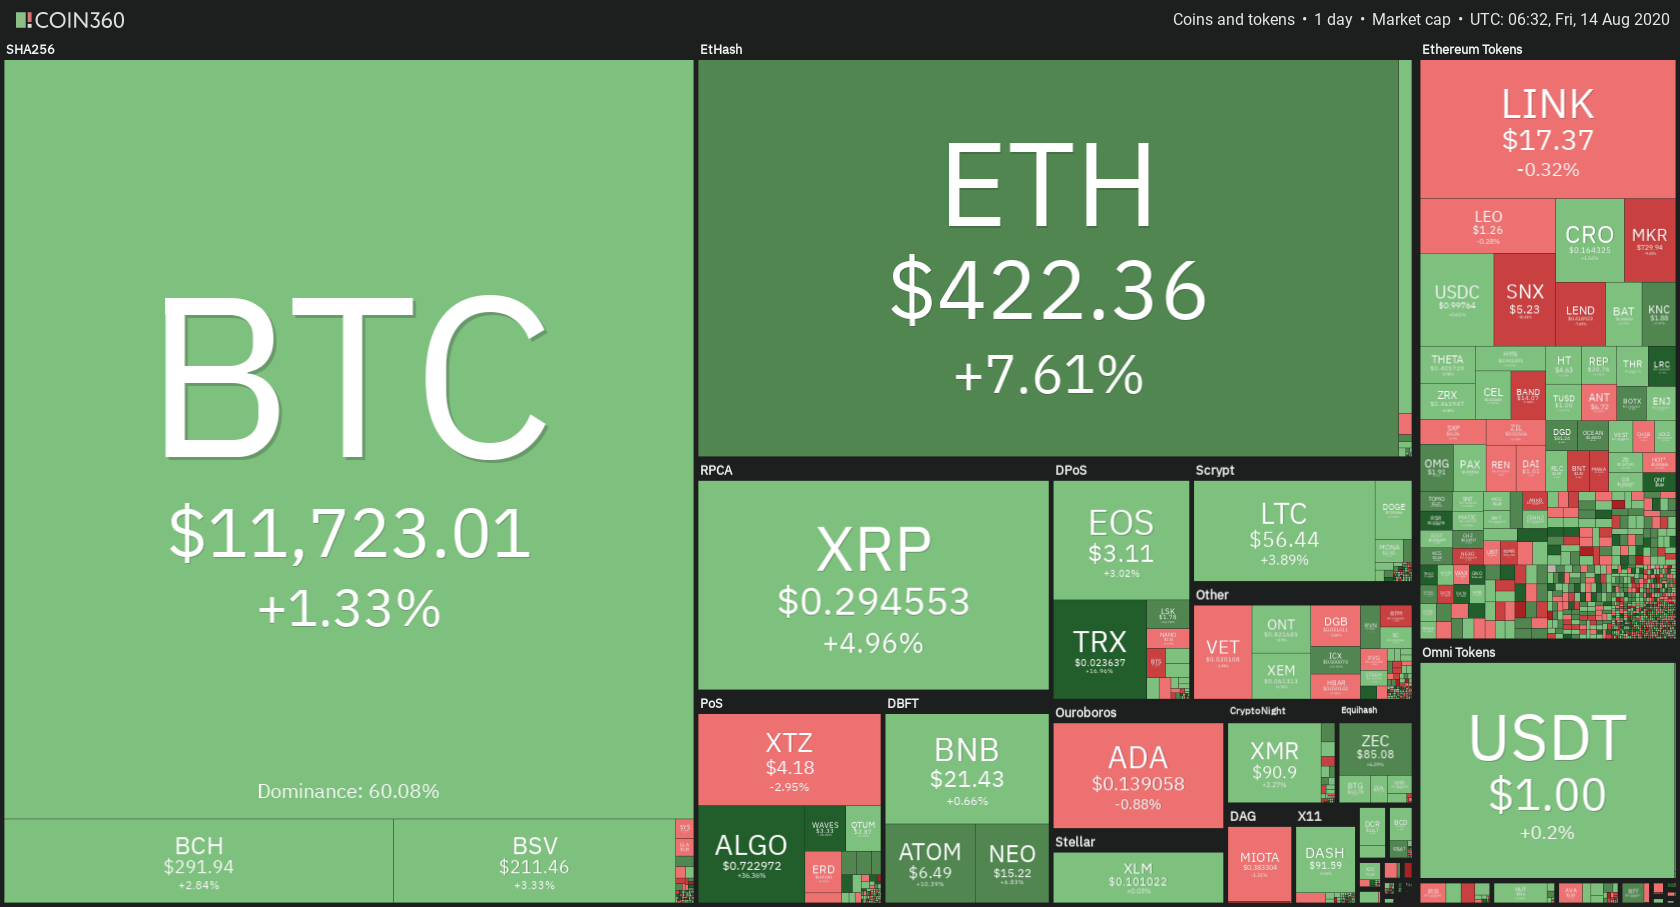
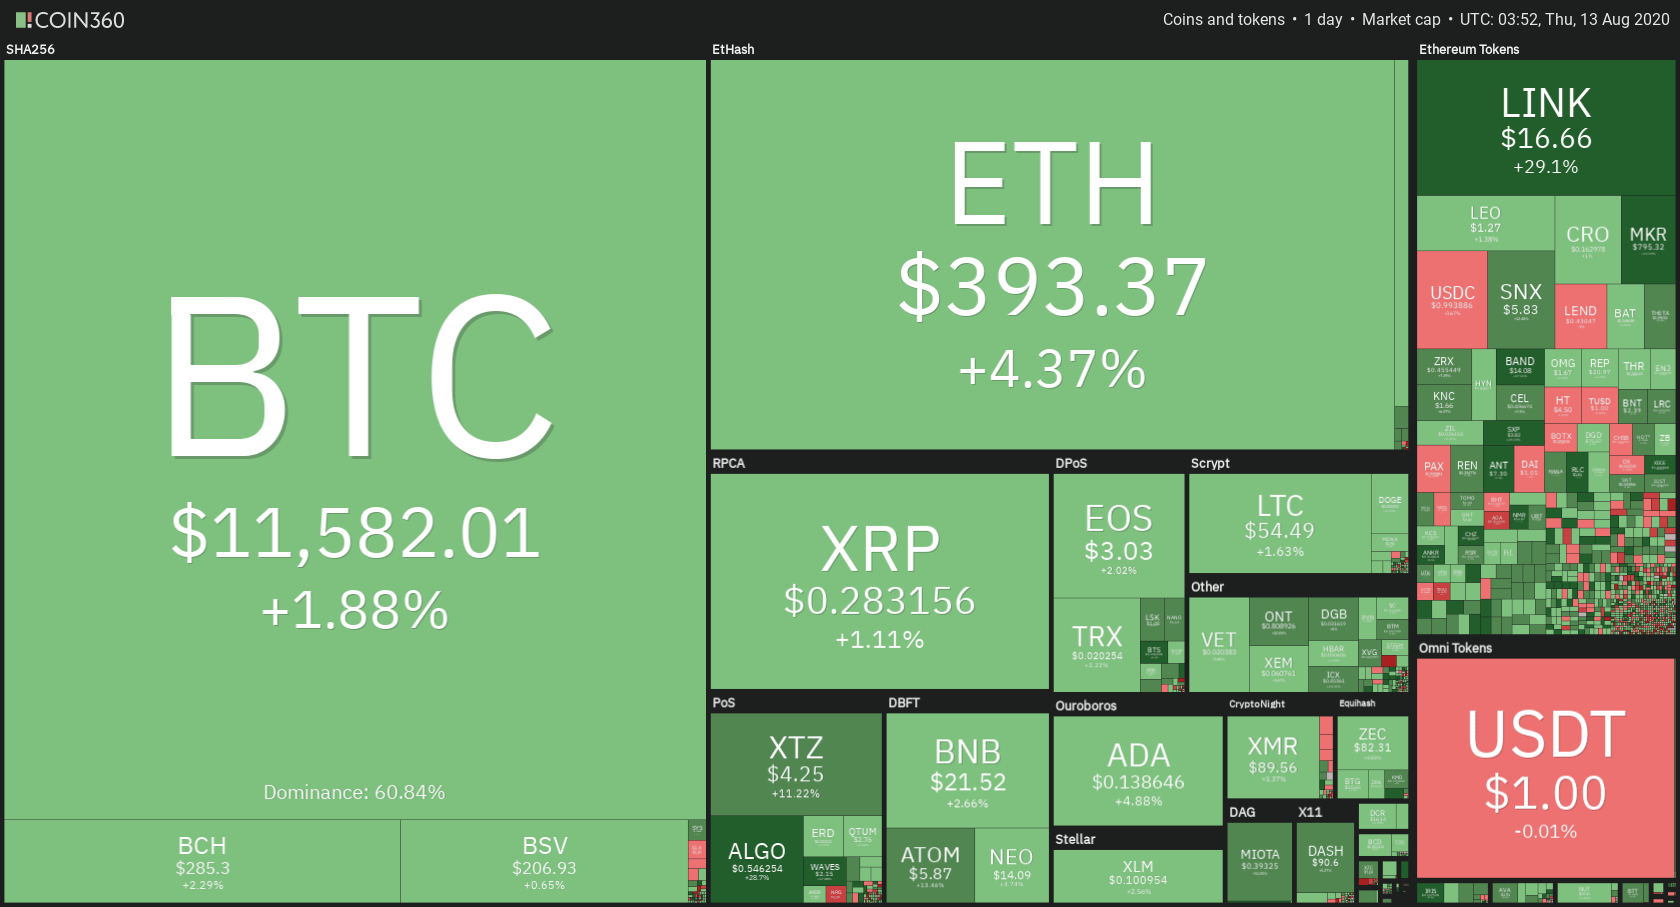
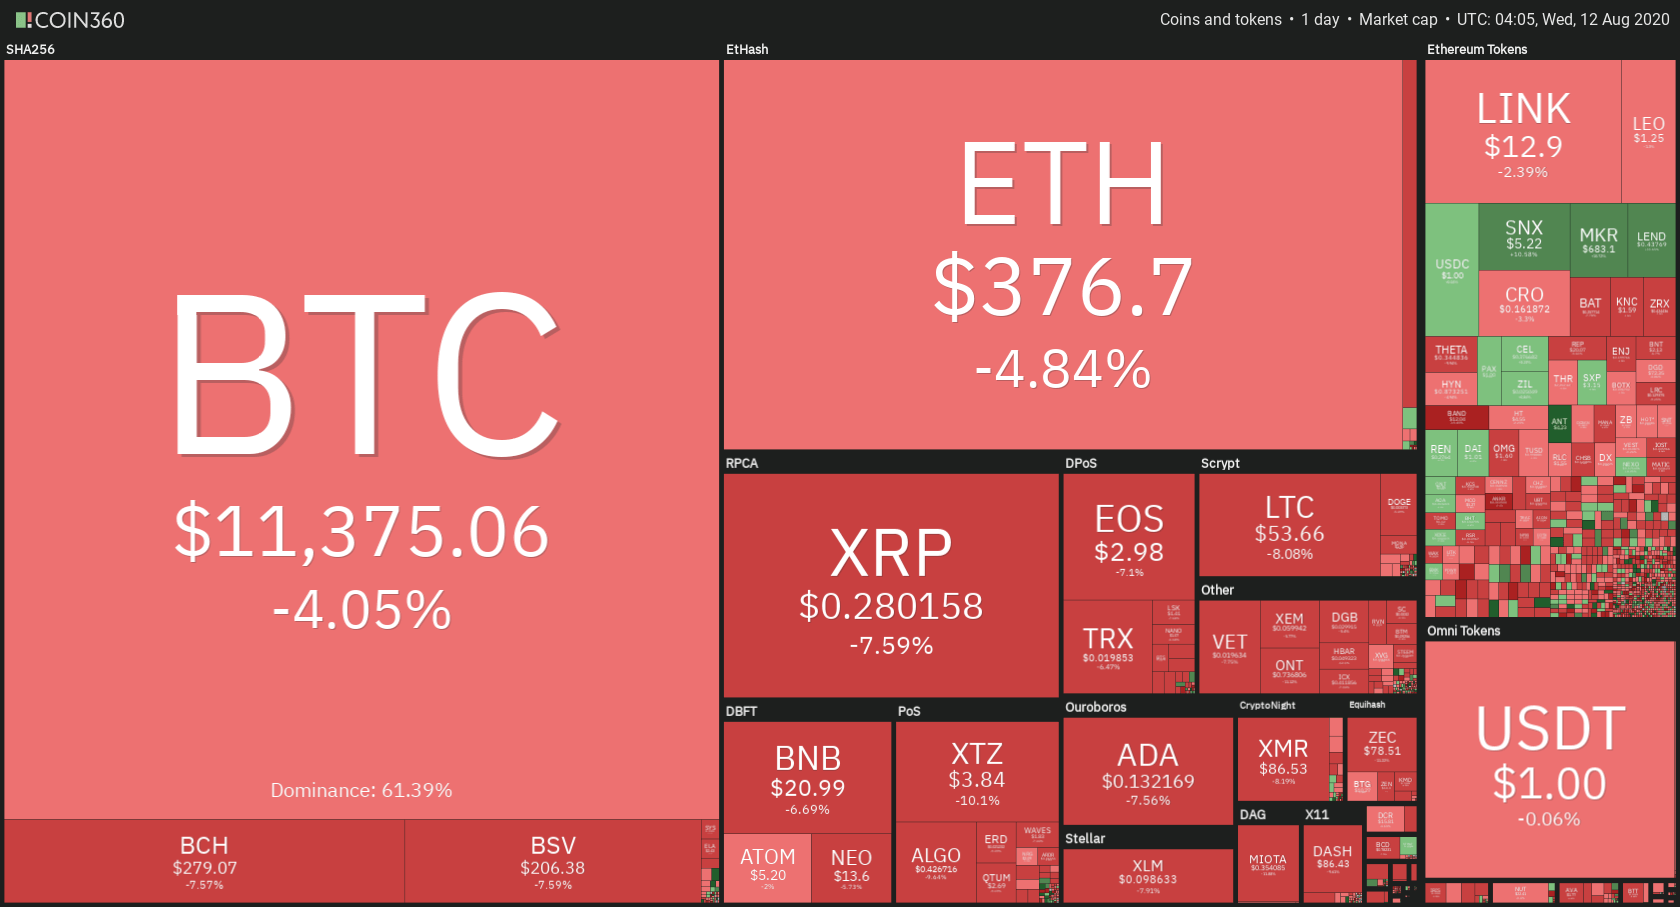
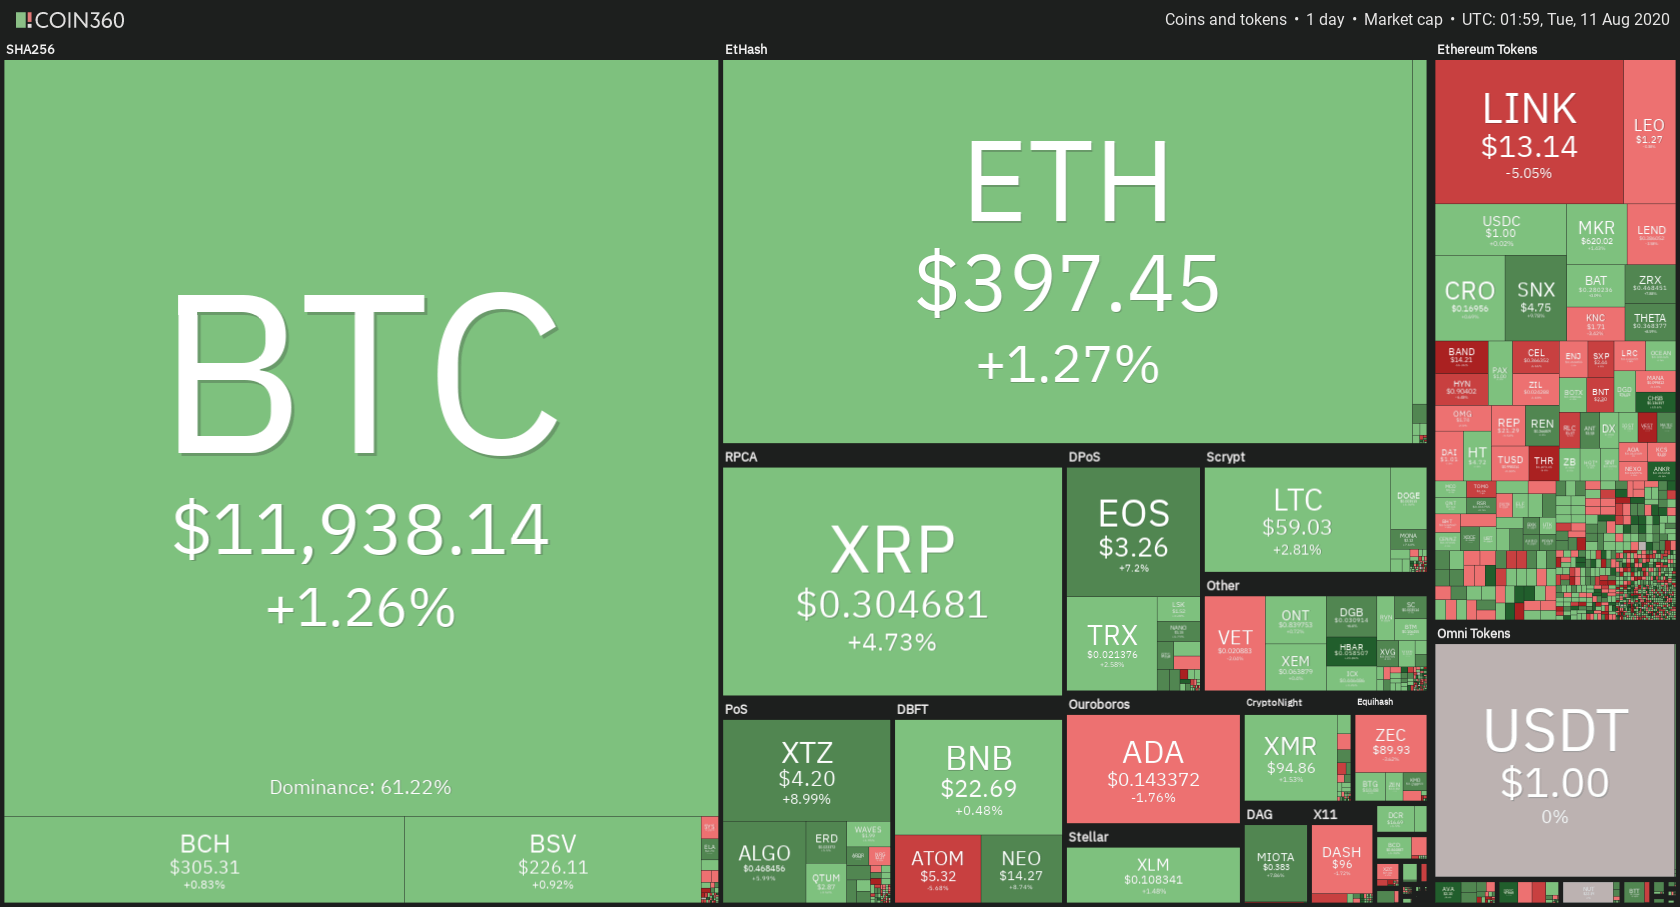
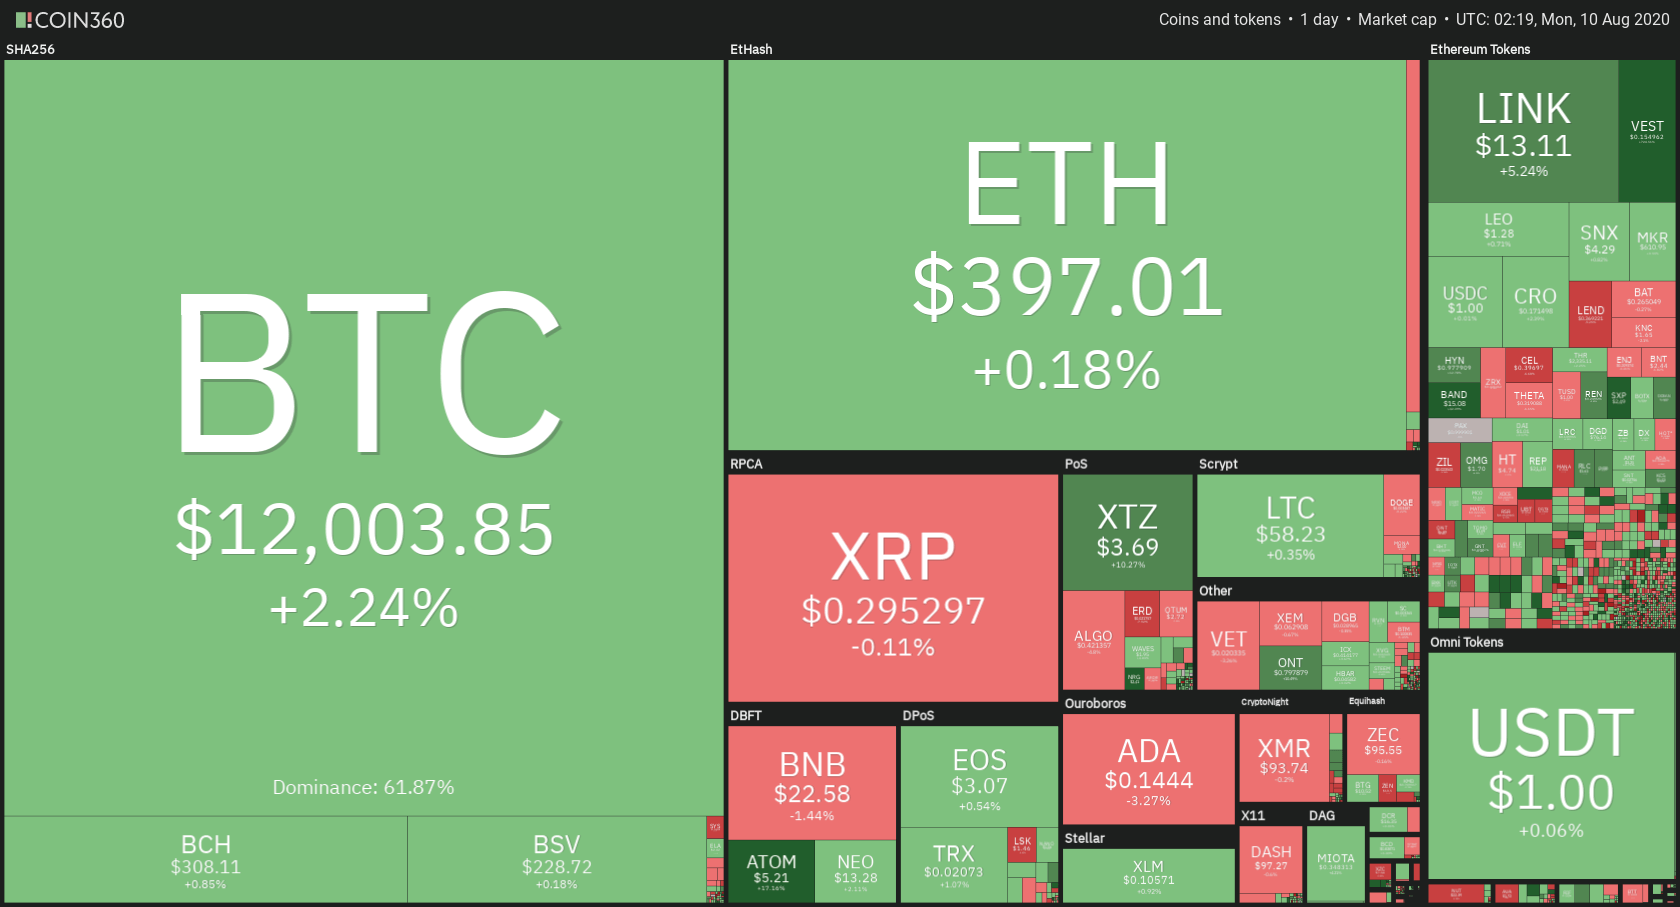
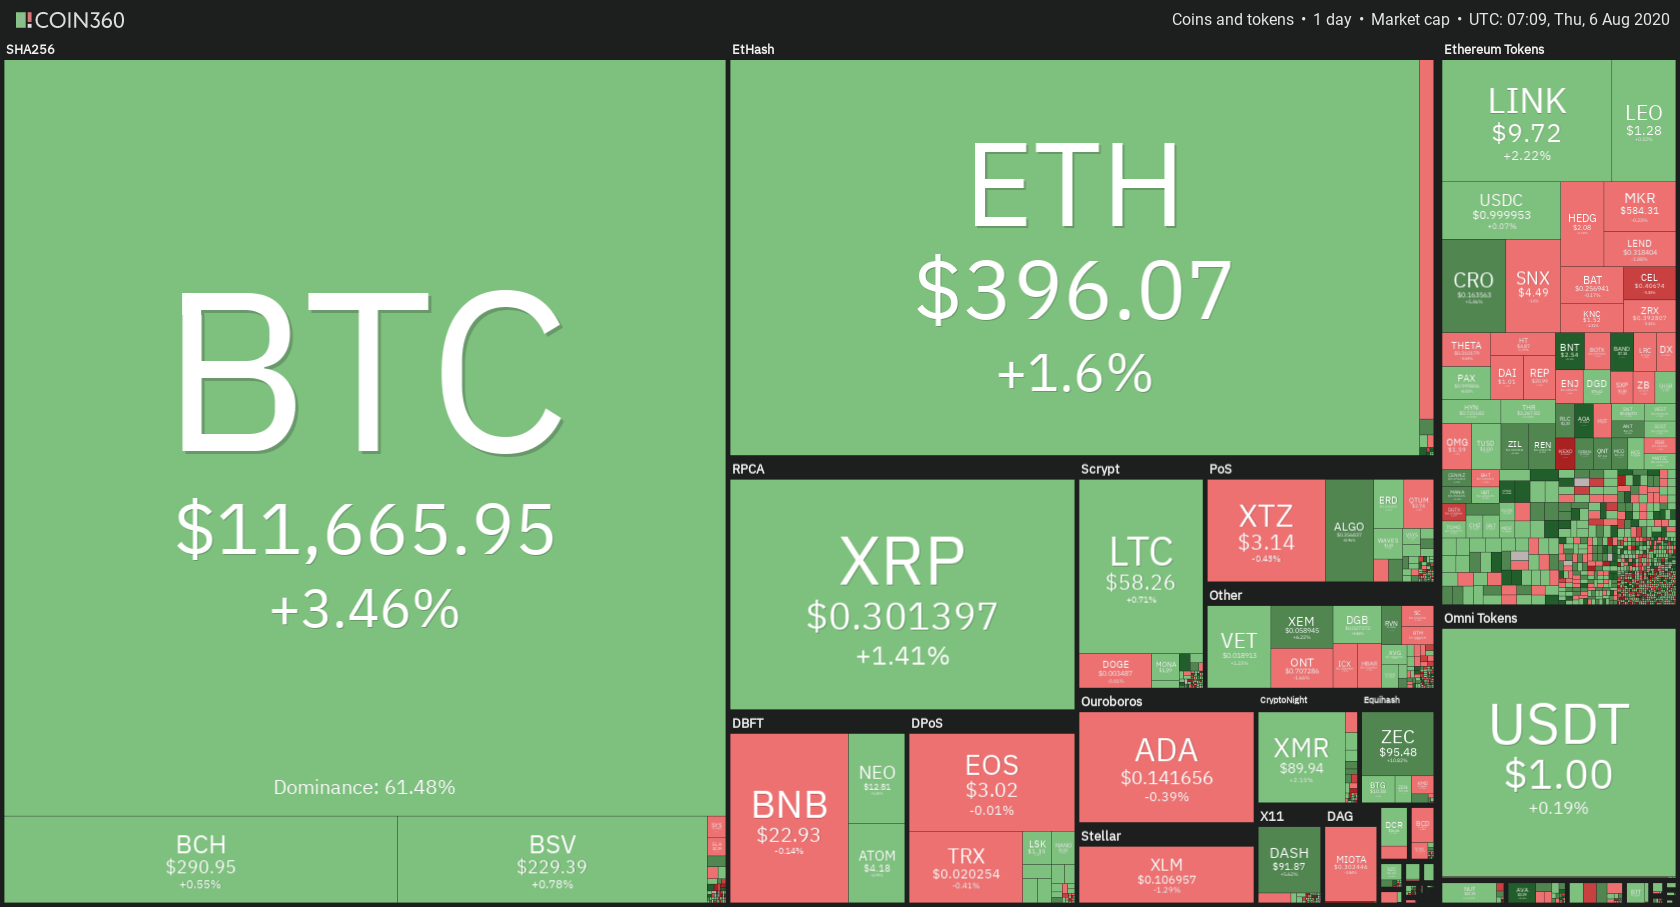
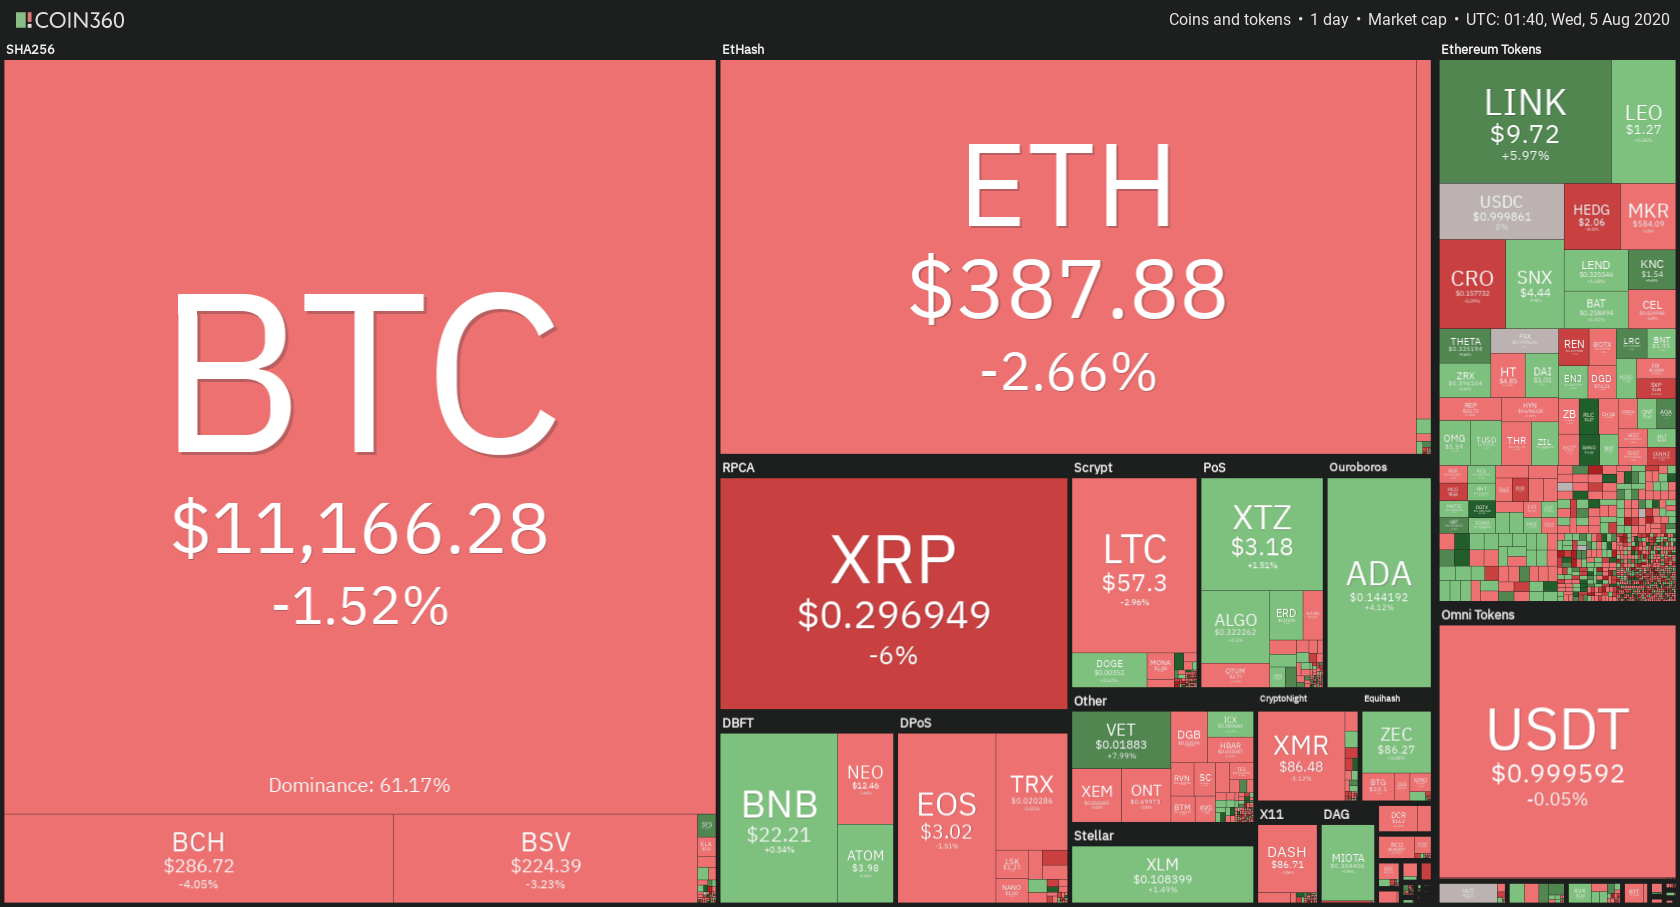
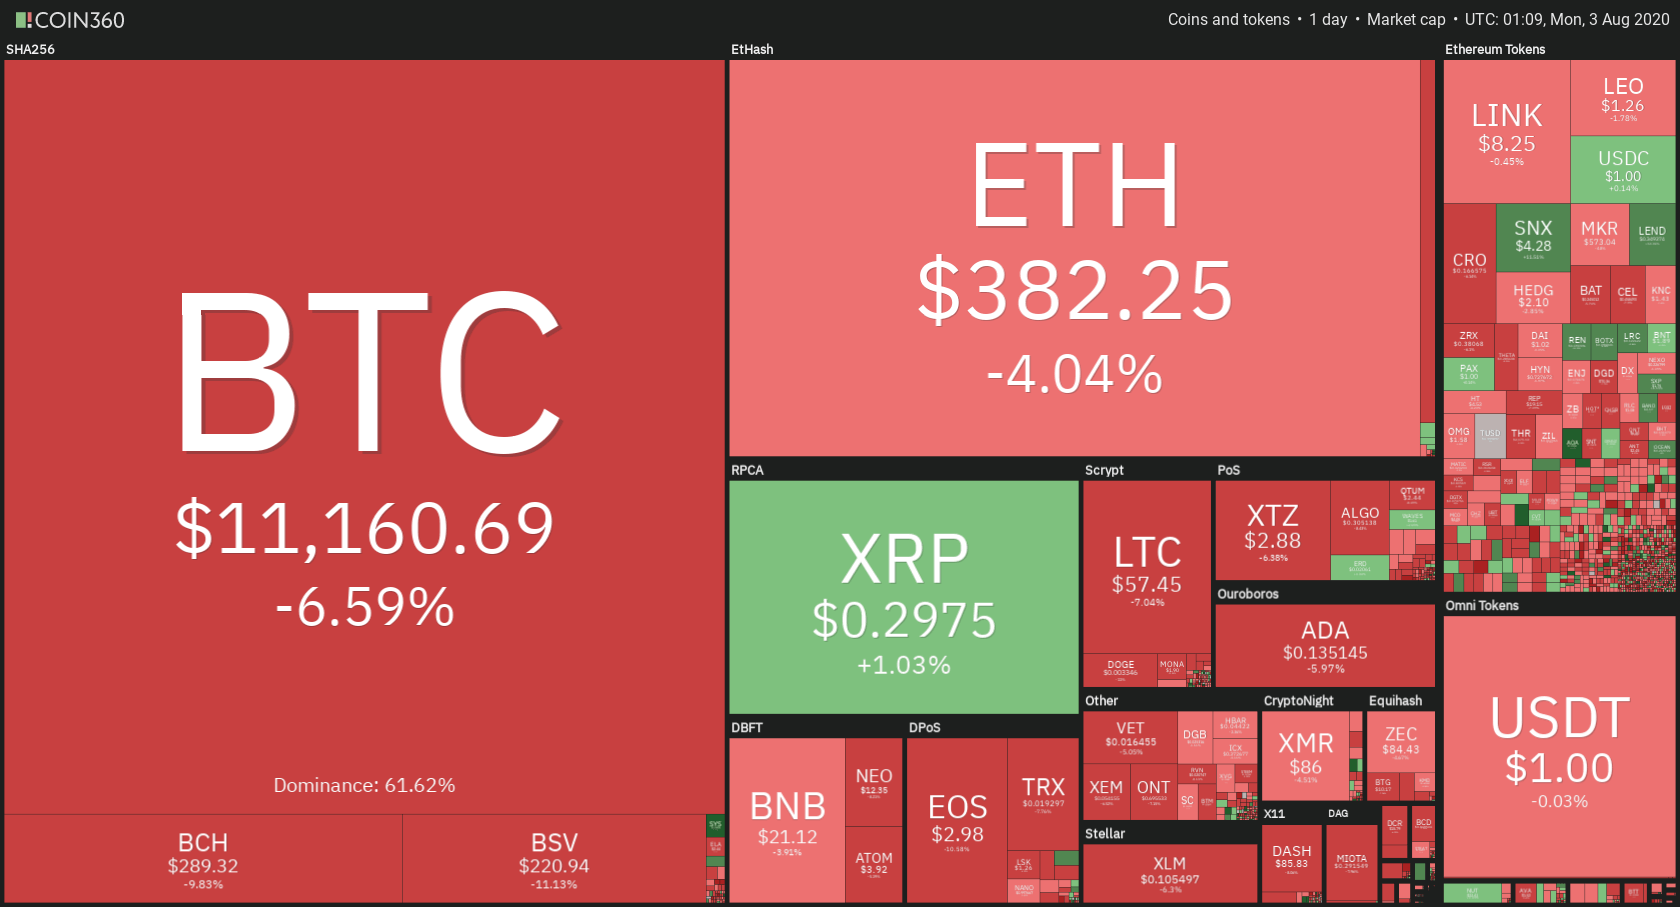
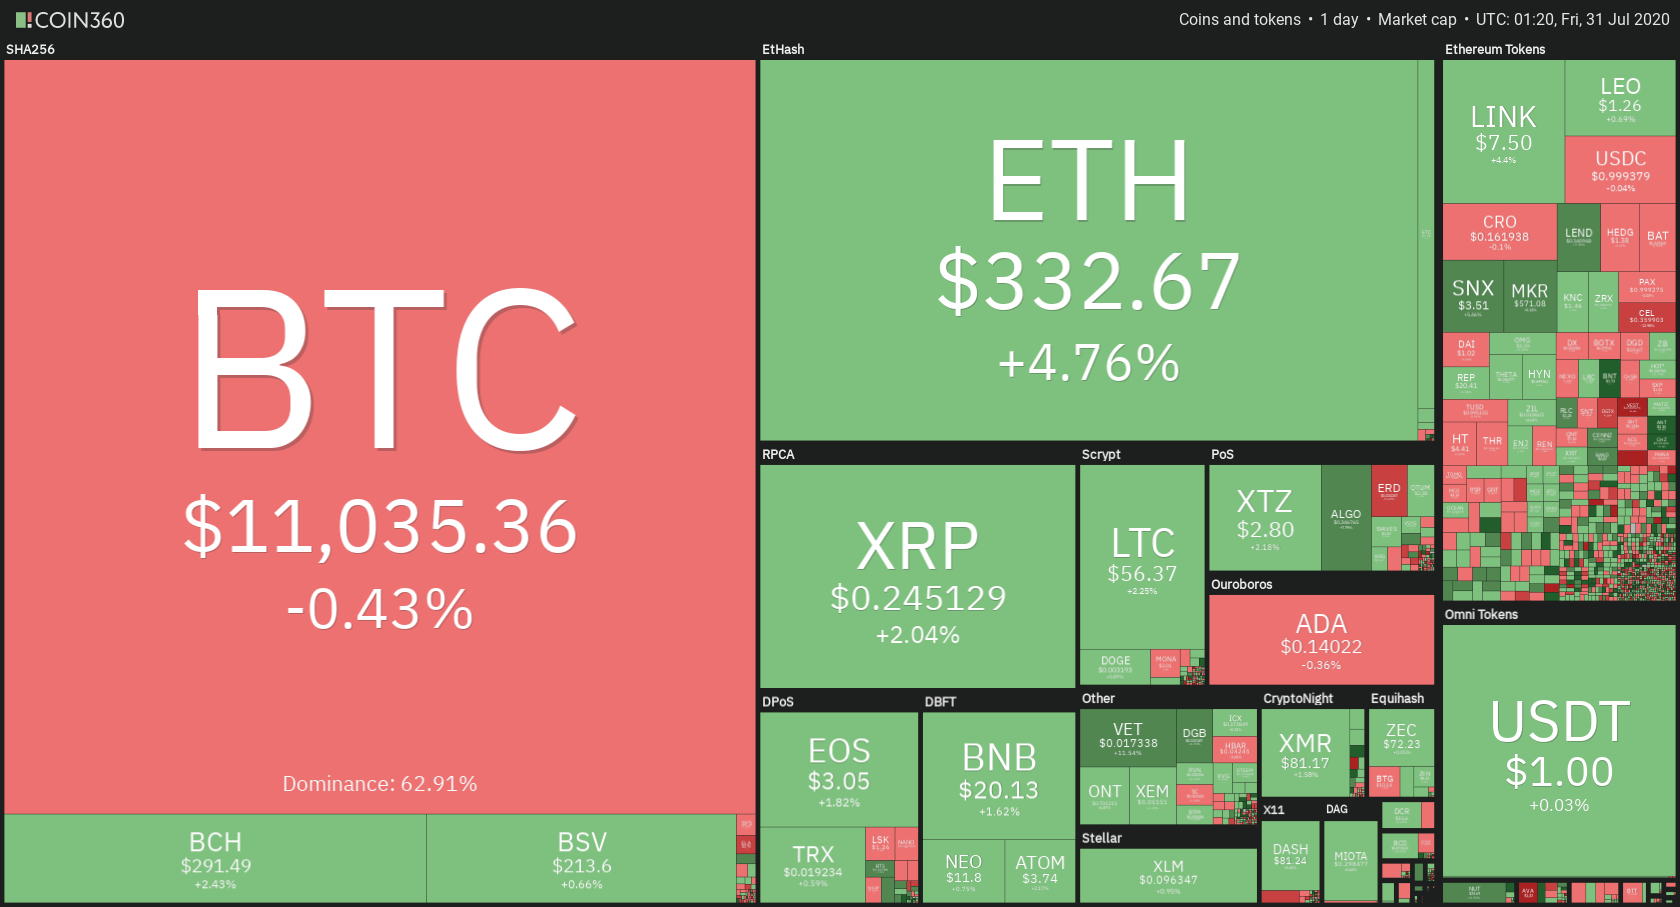
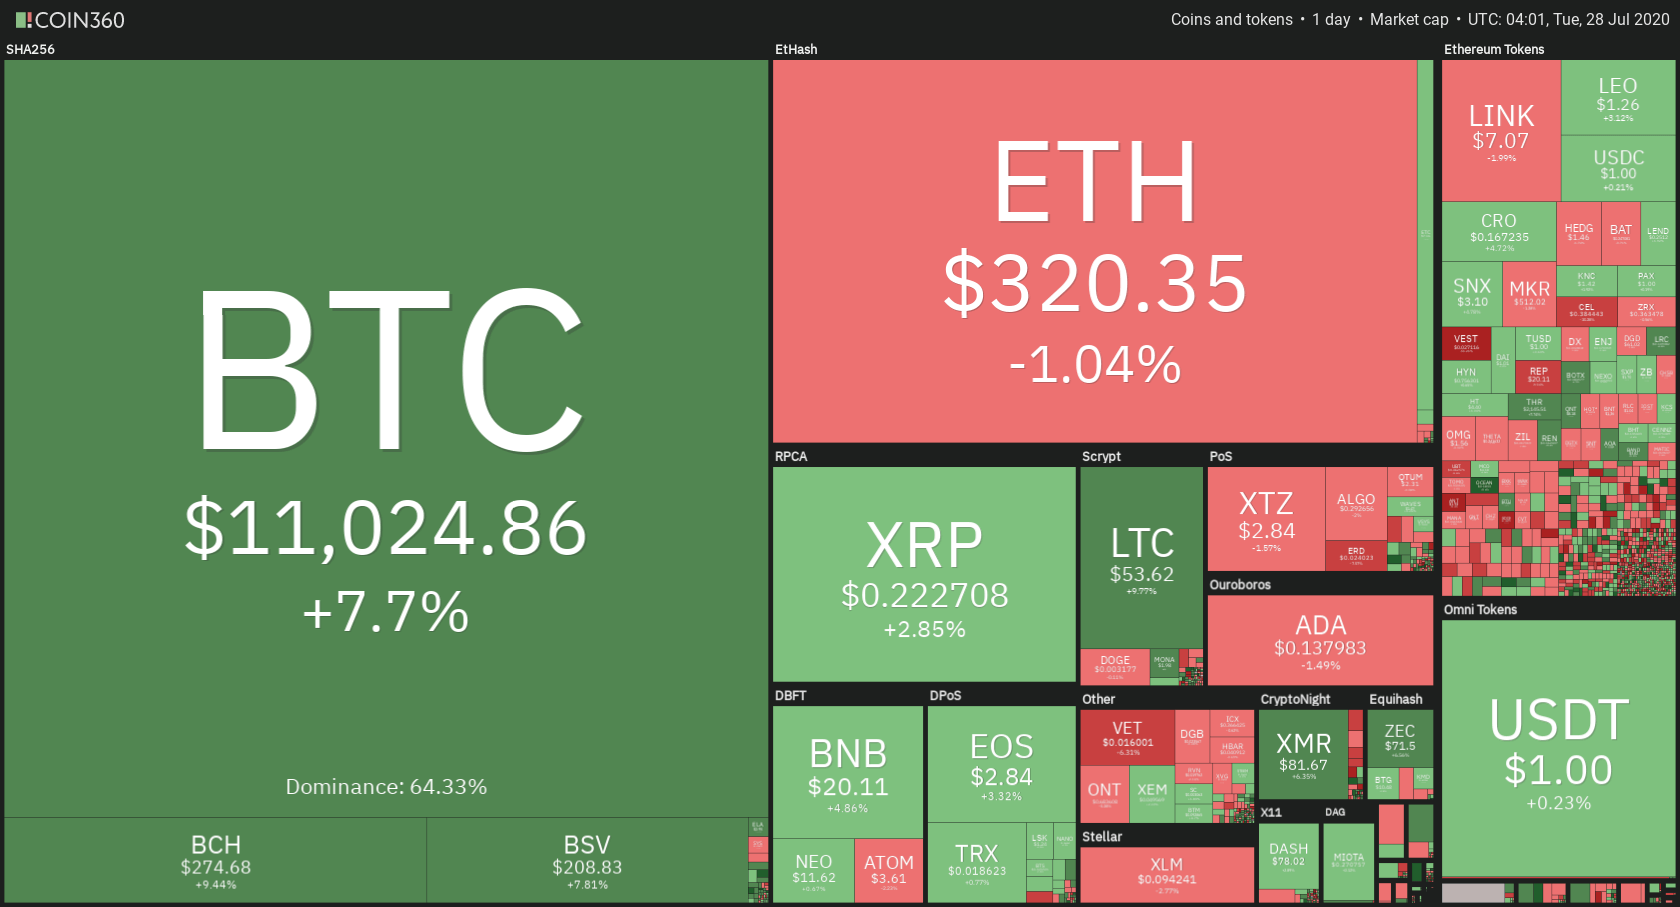
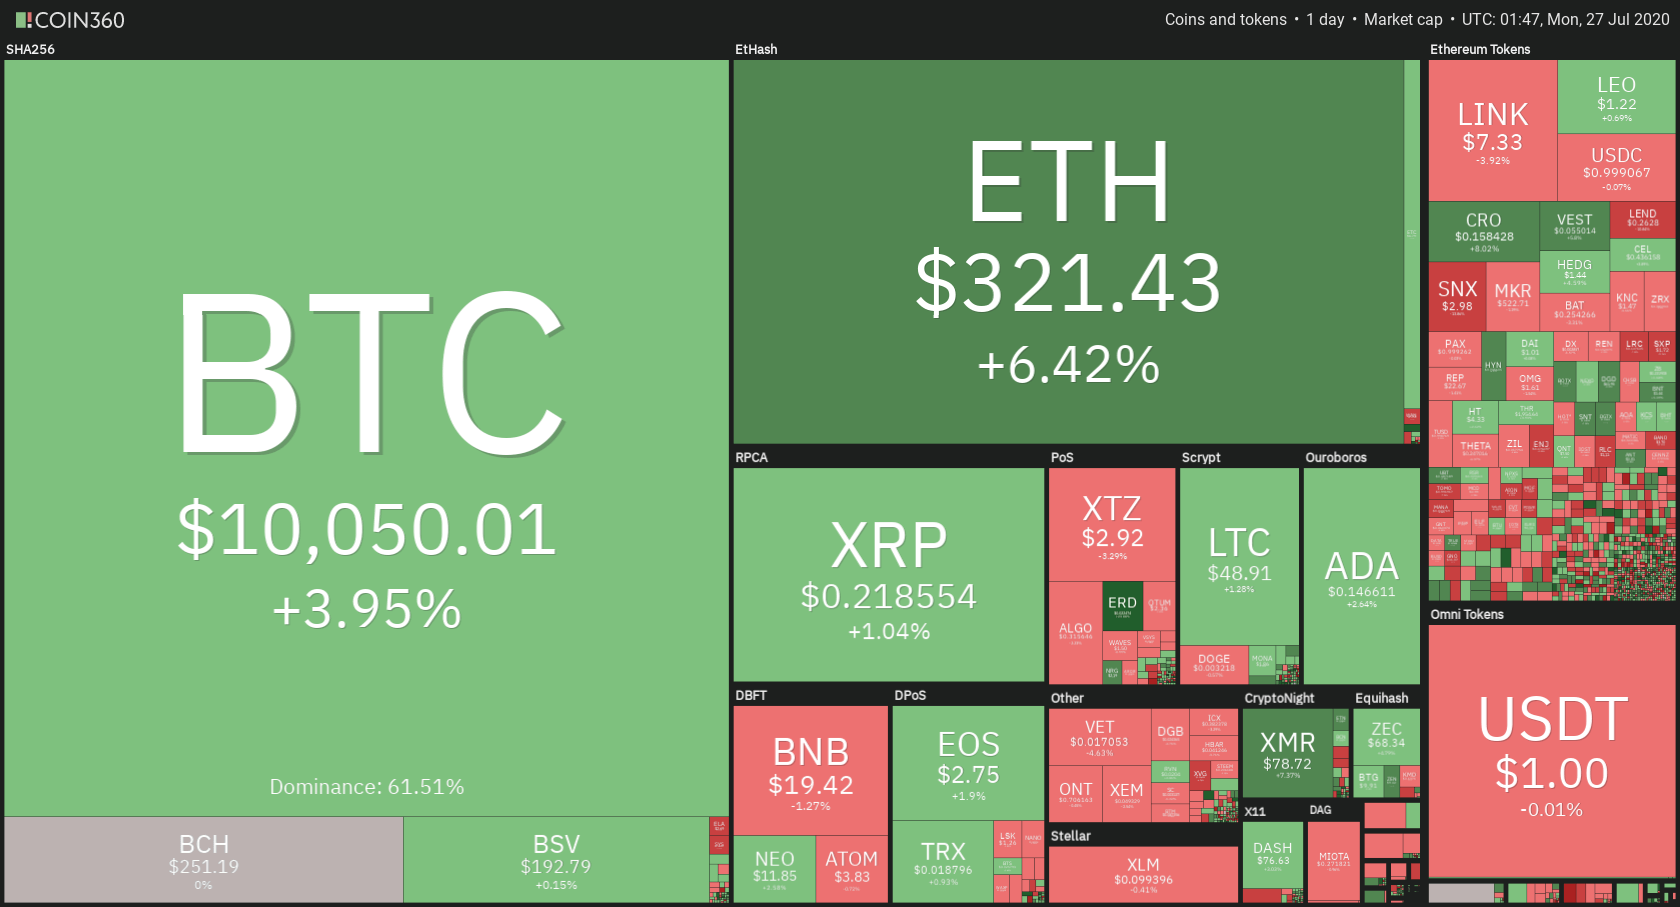
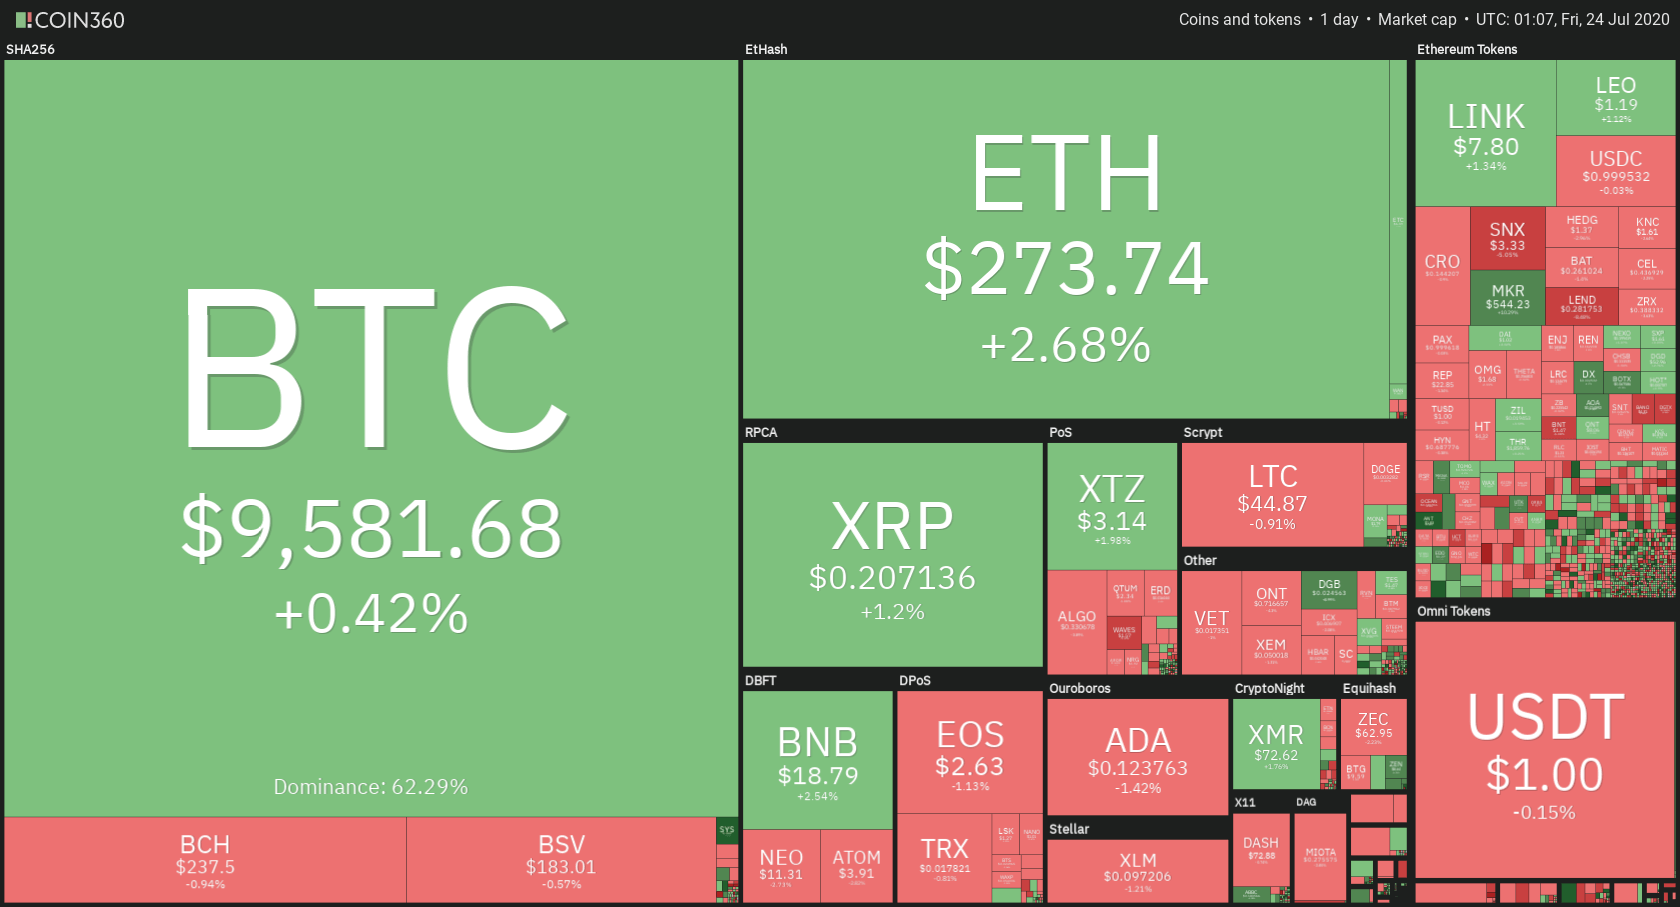
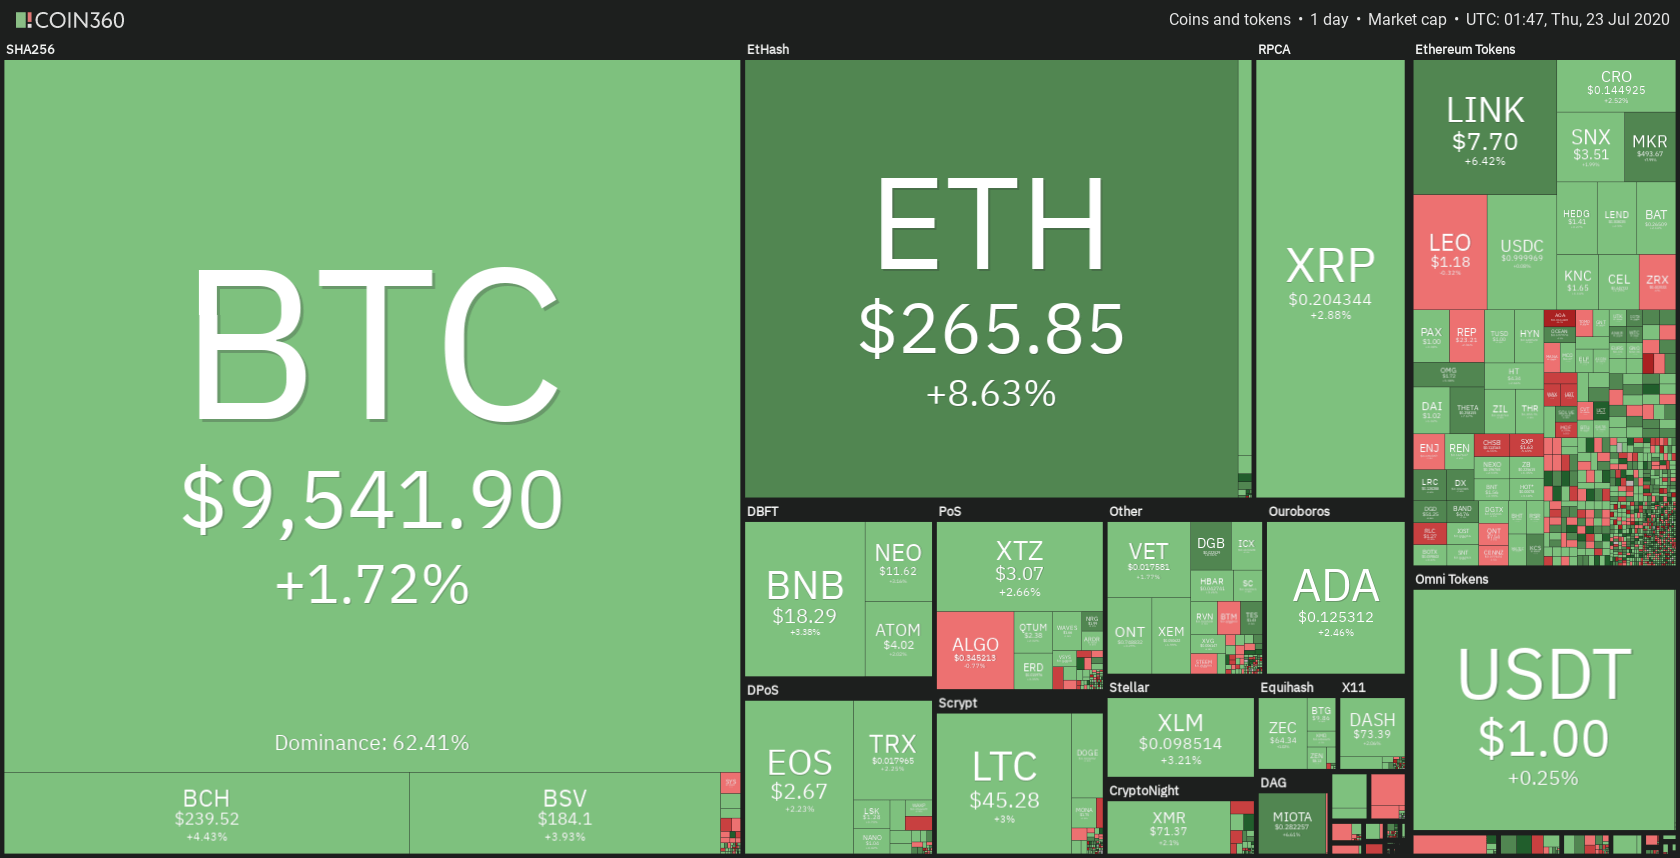
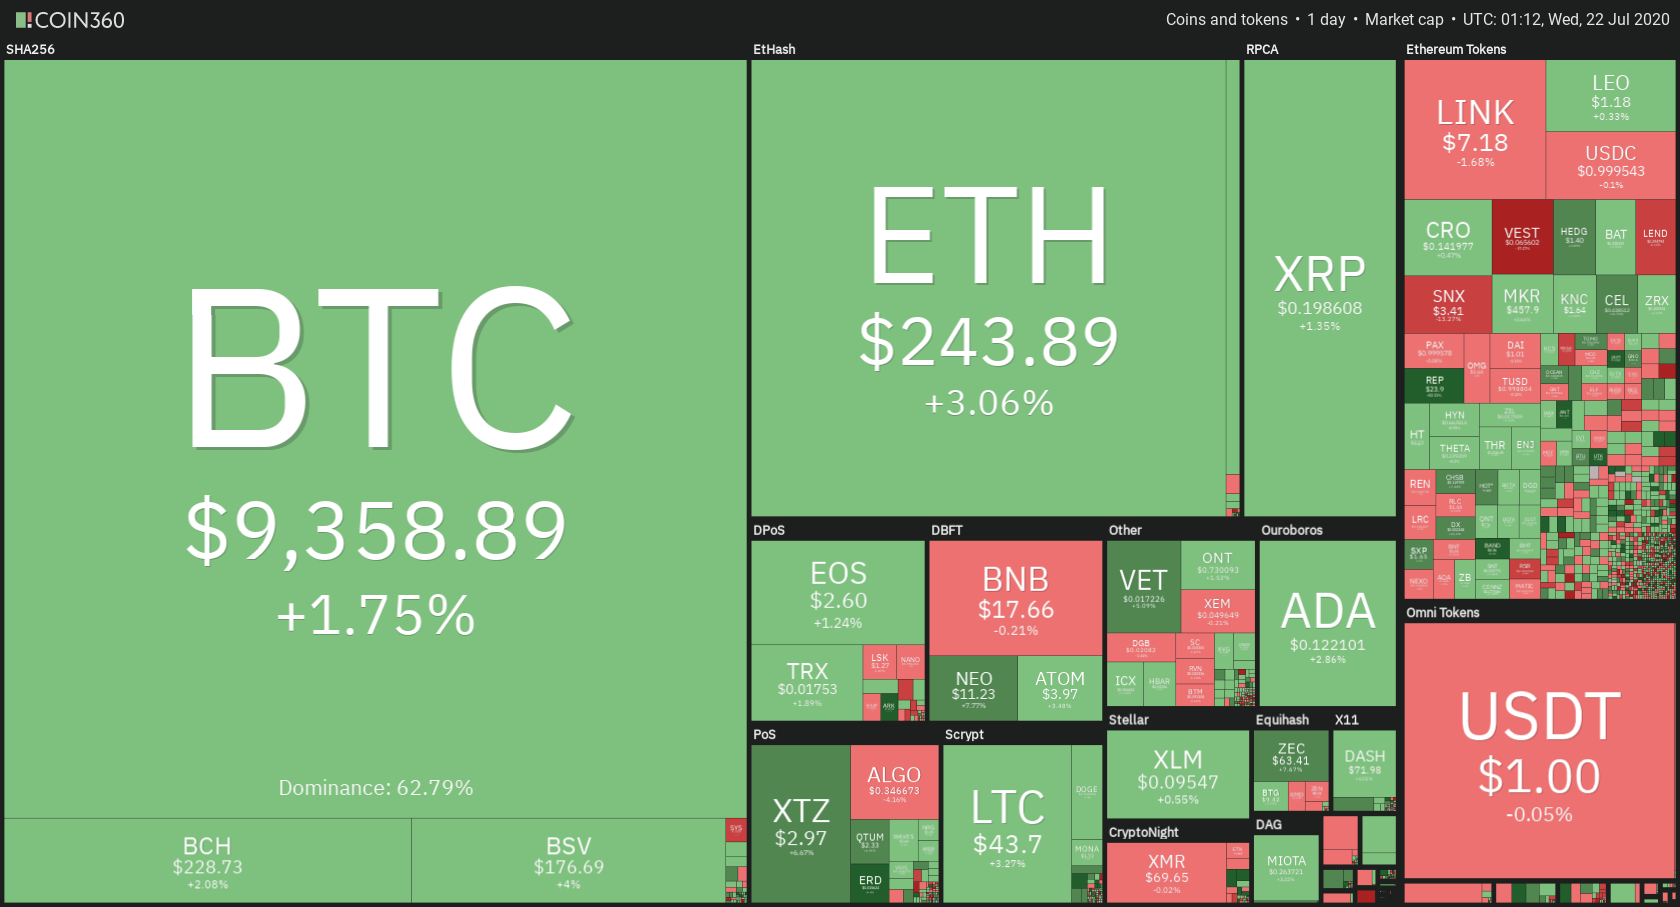
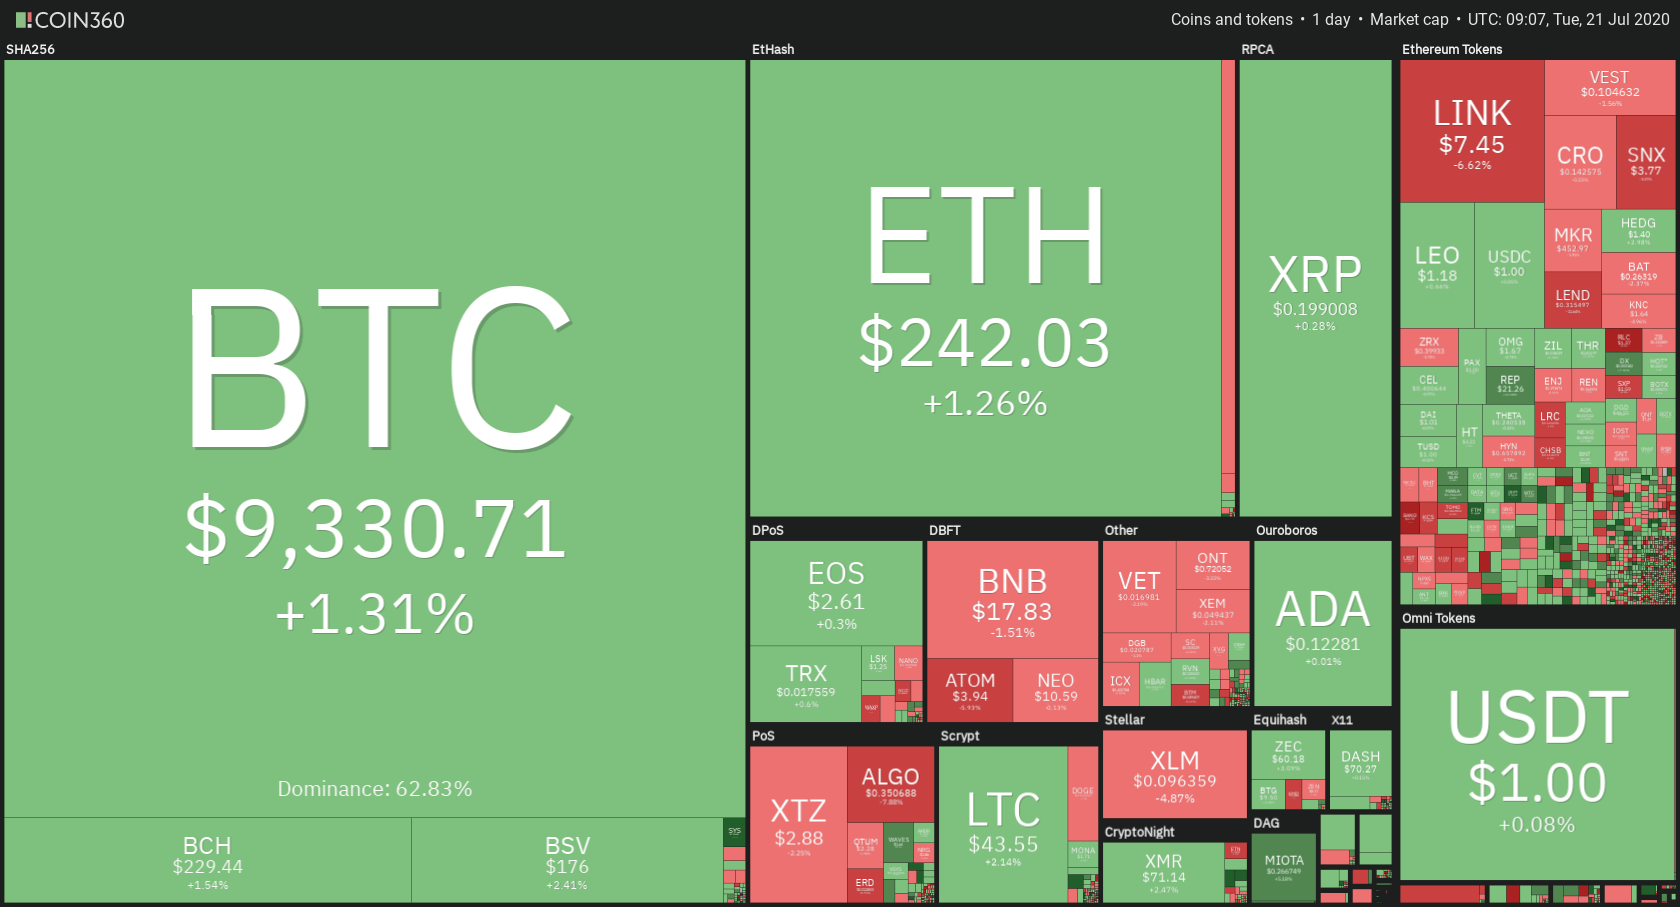
Daily Crypto Sector Heat Map
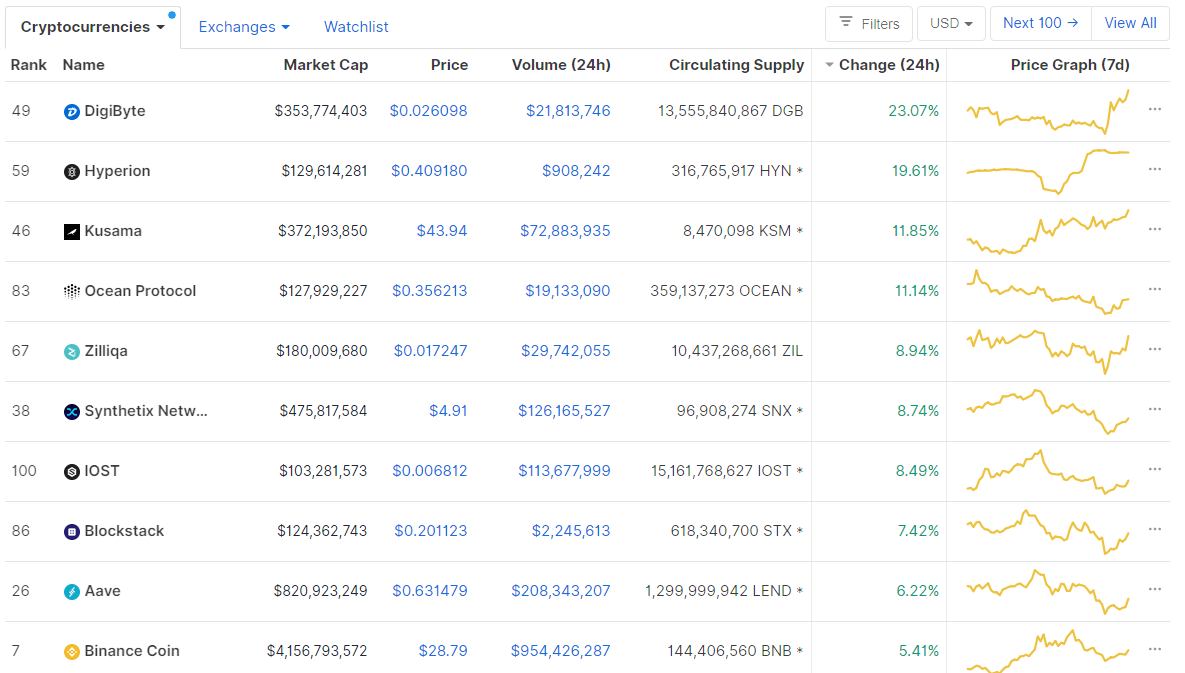
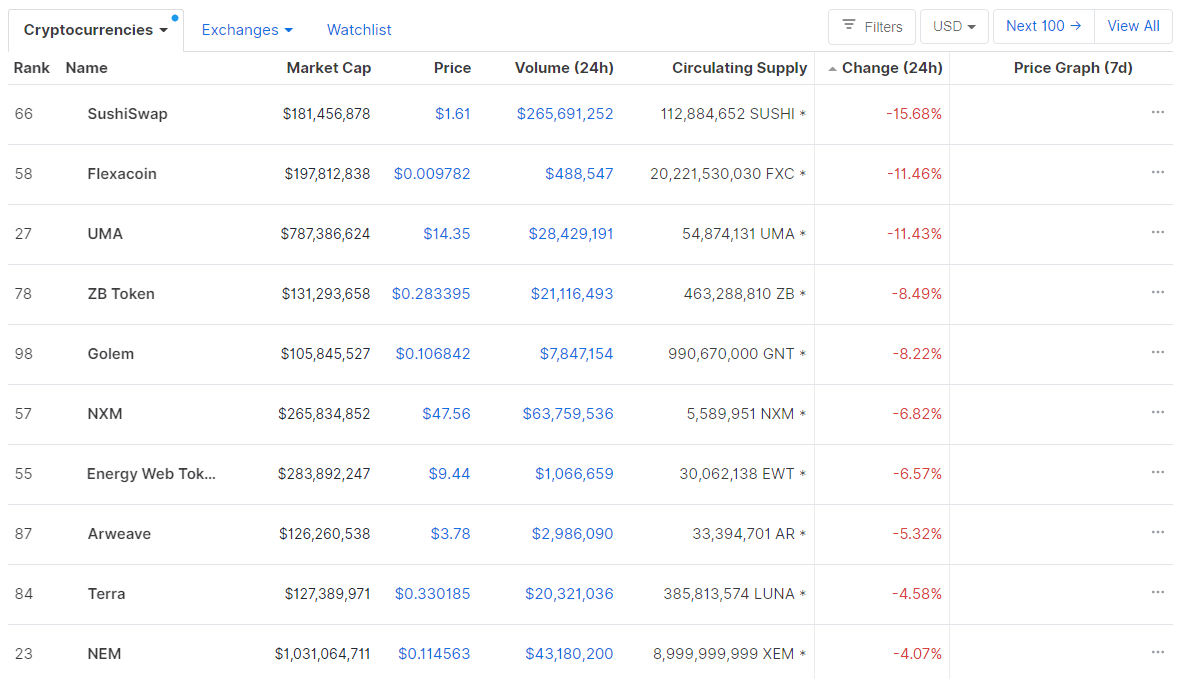
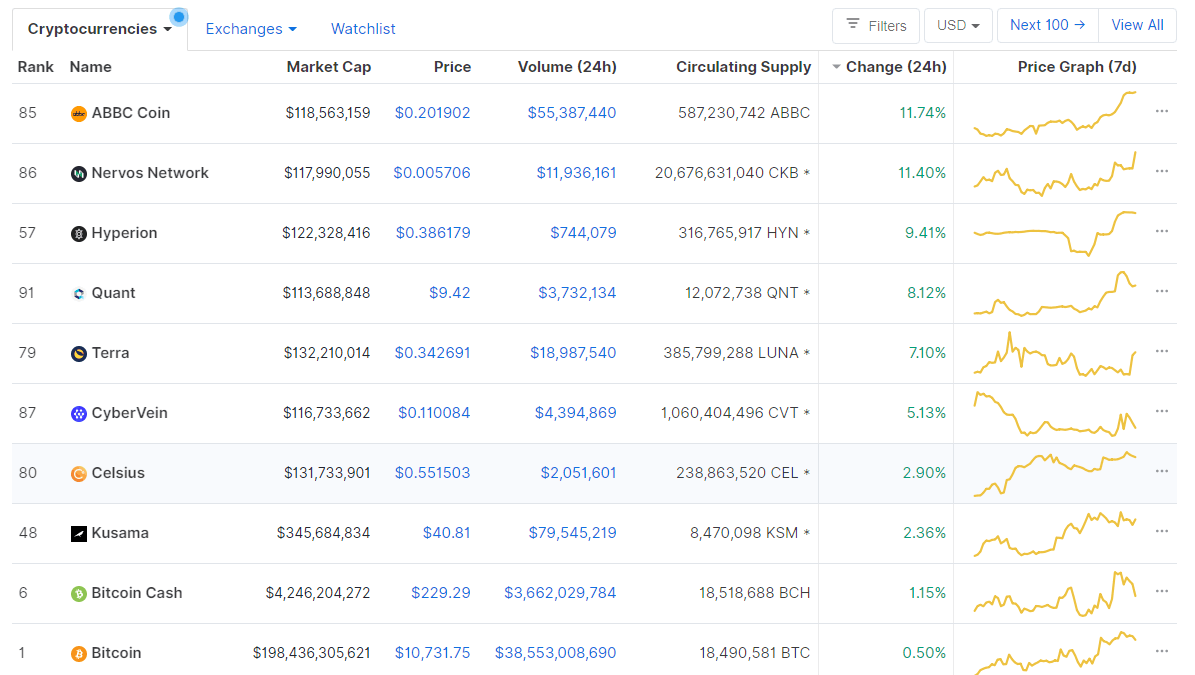
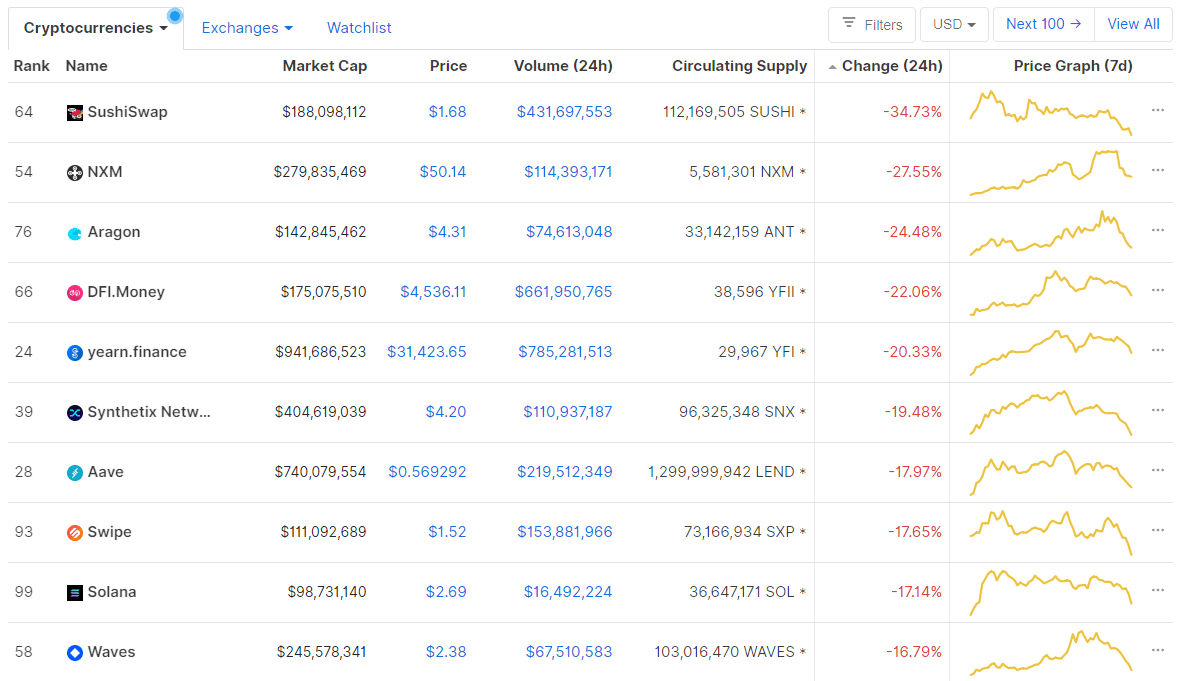
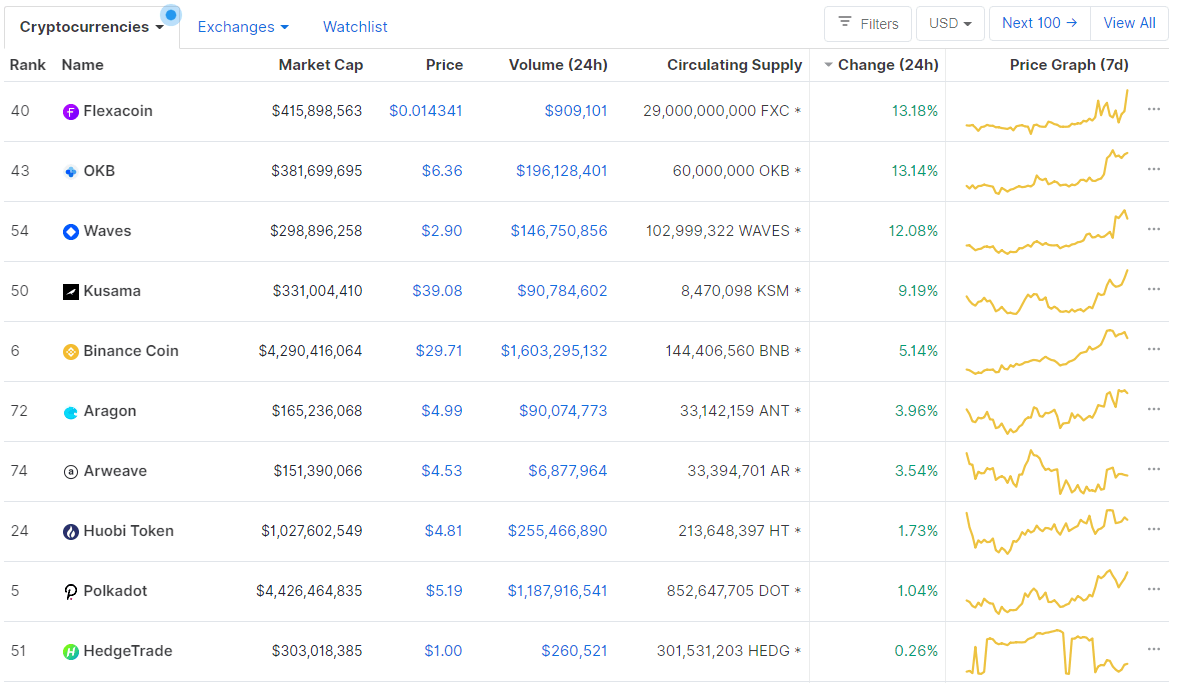
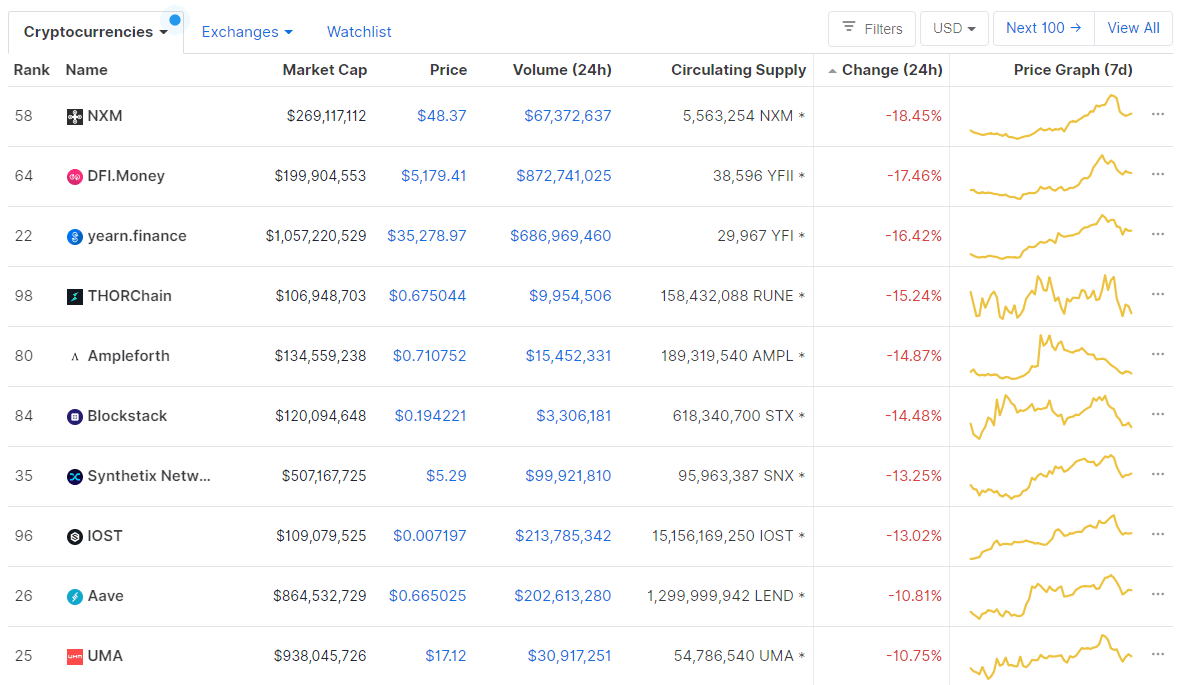
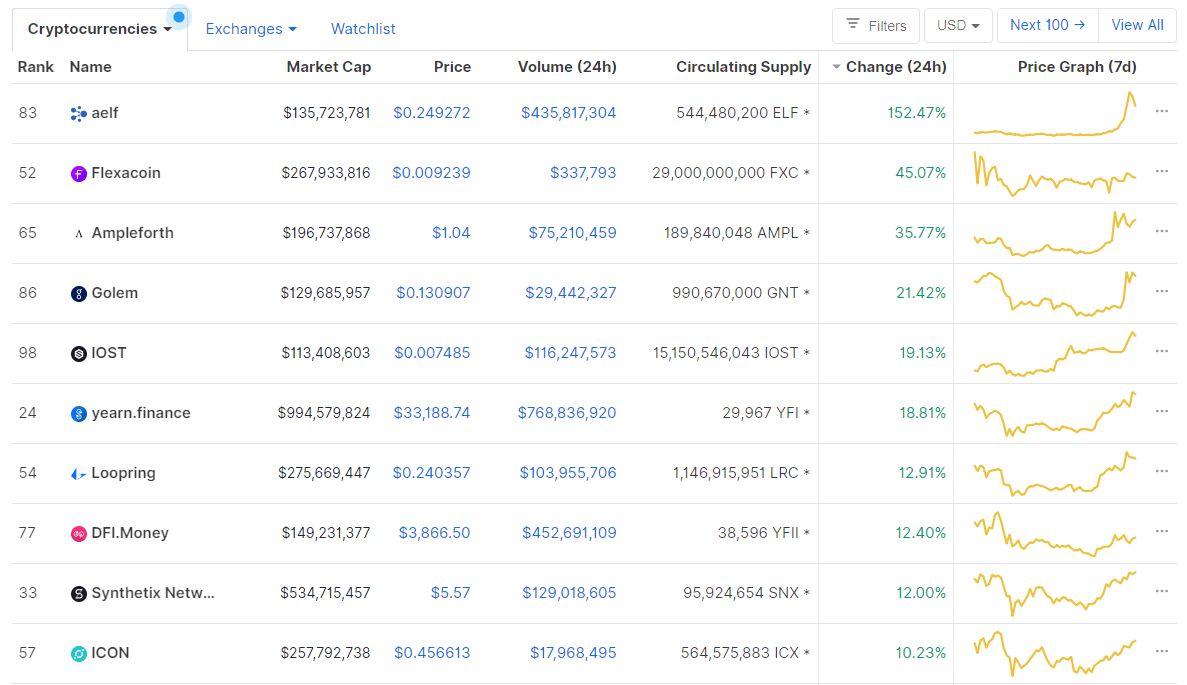
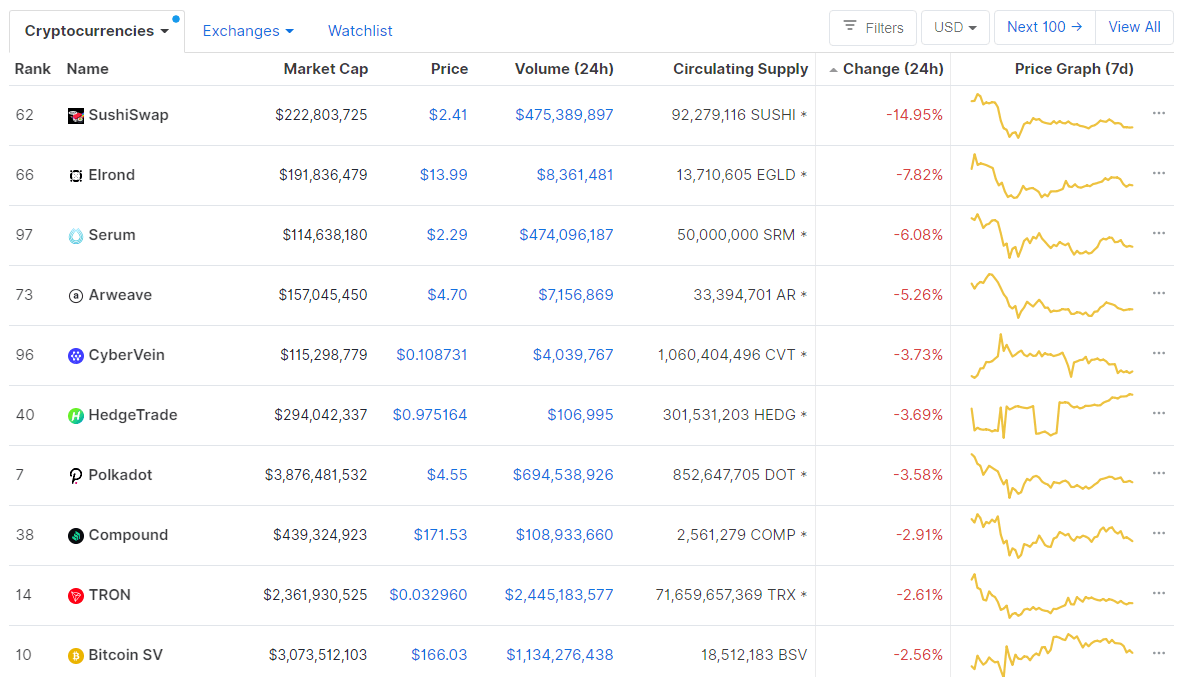
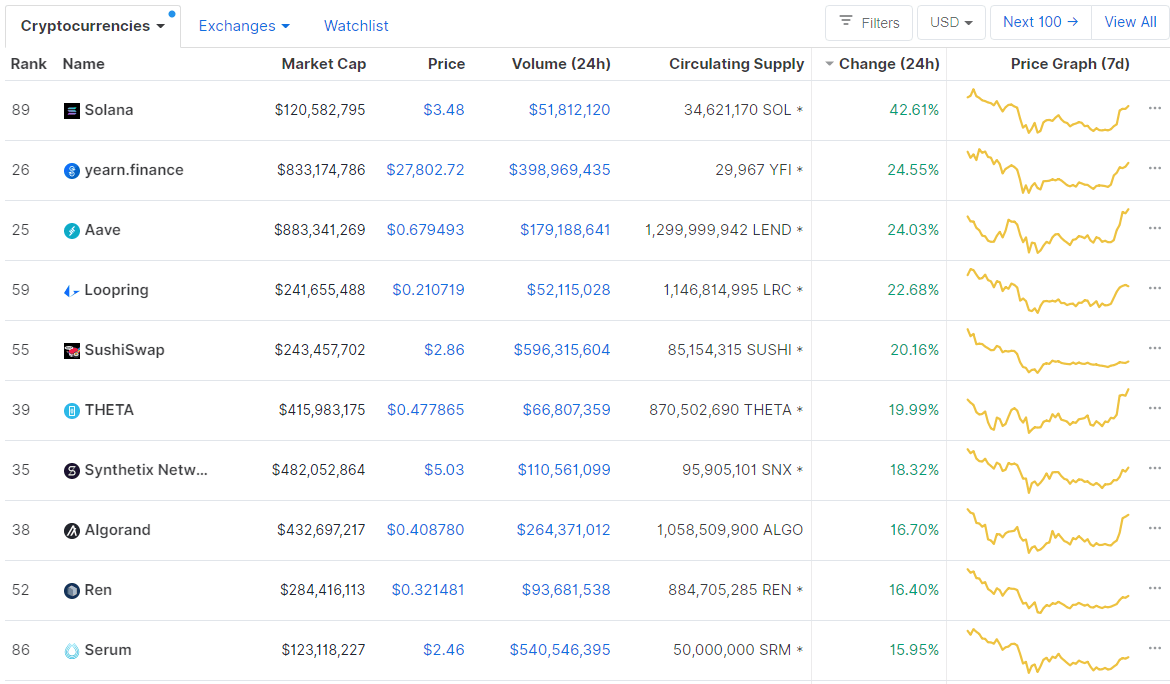
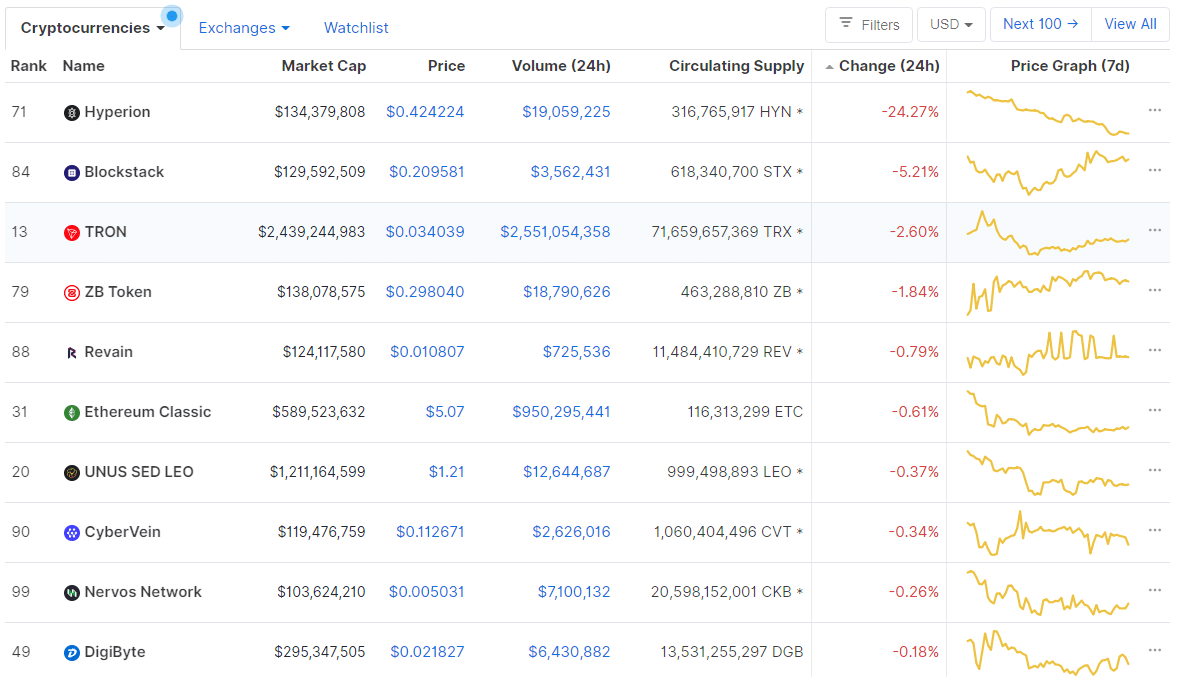
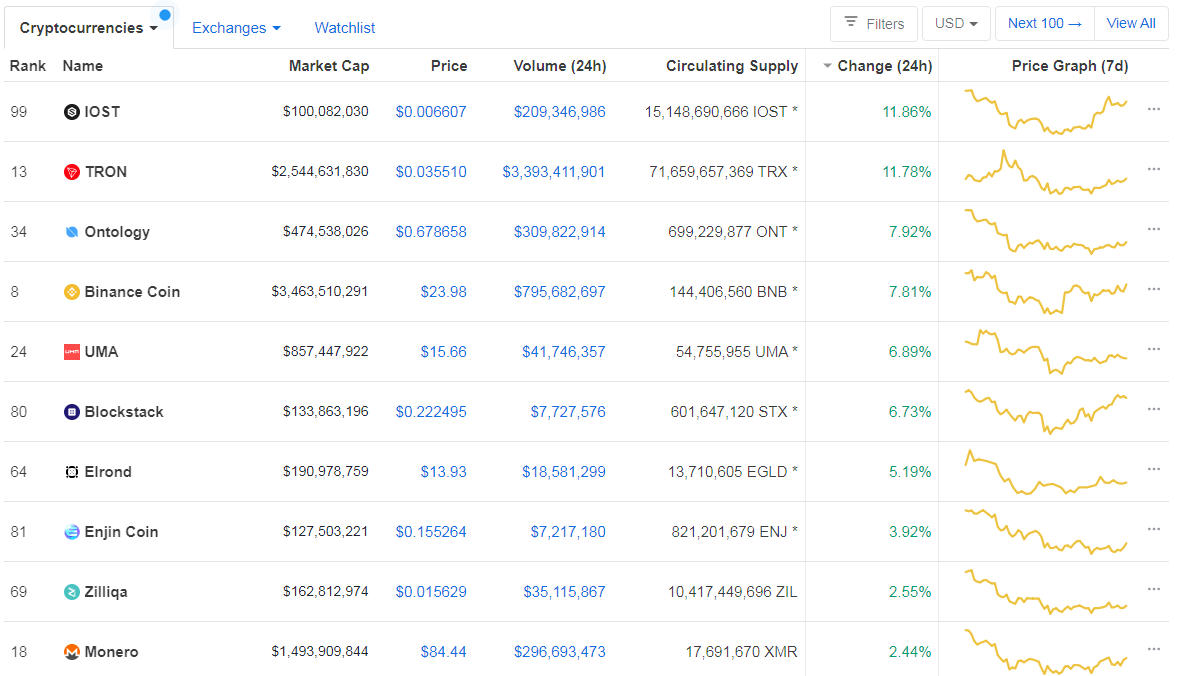
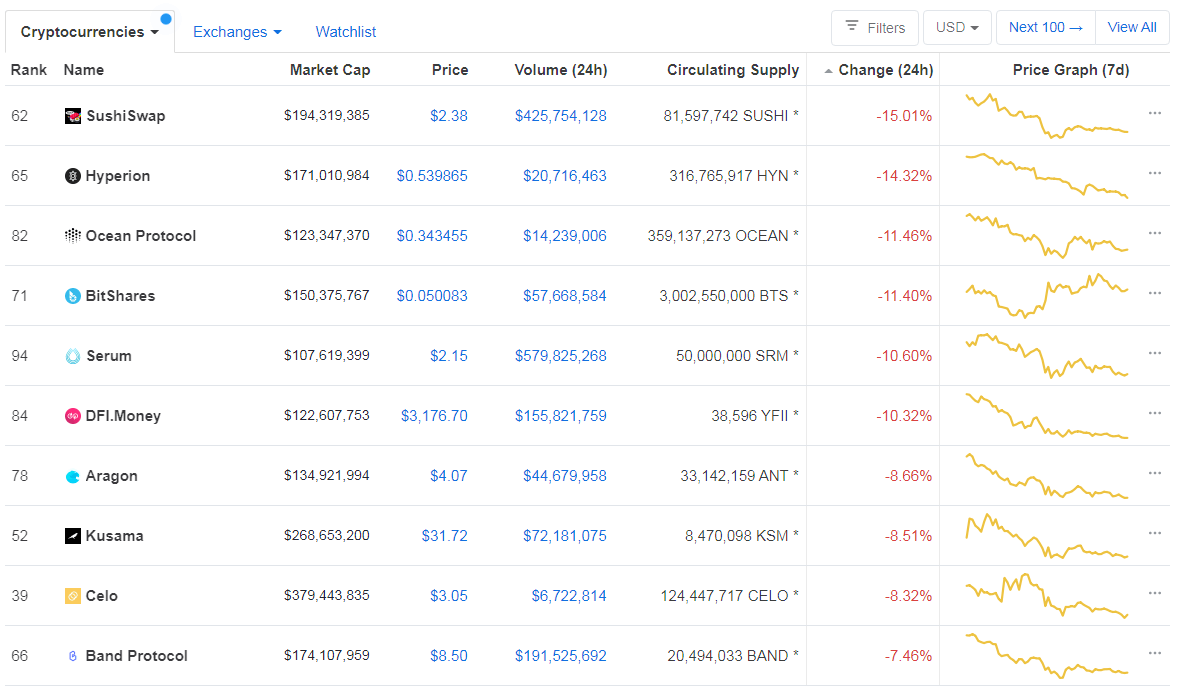
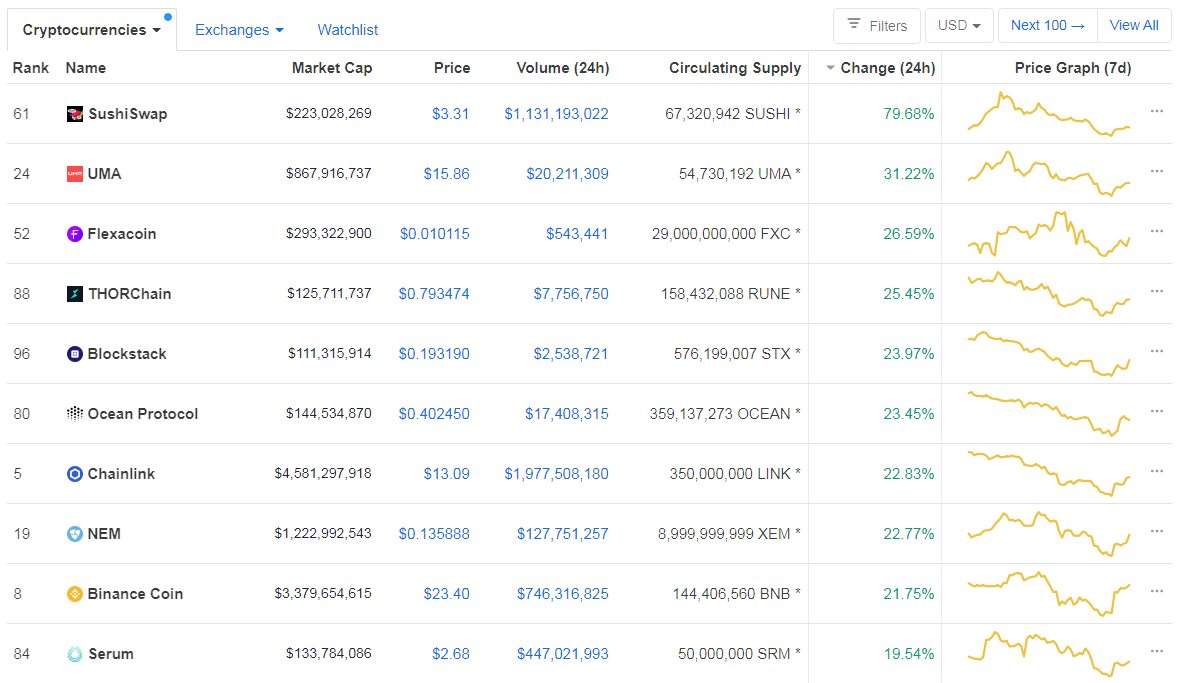
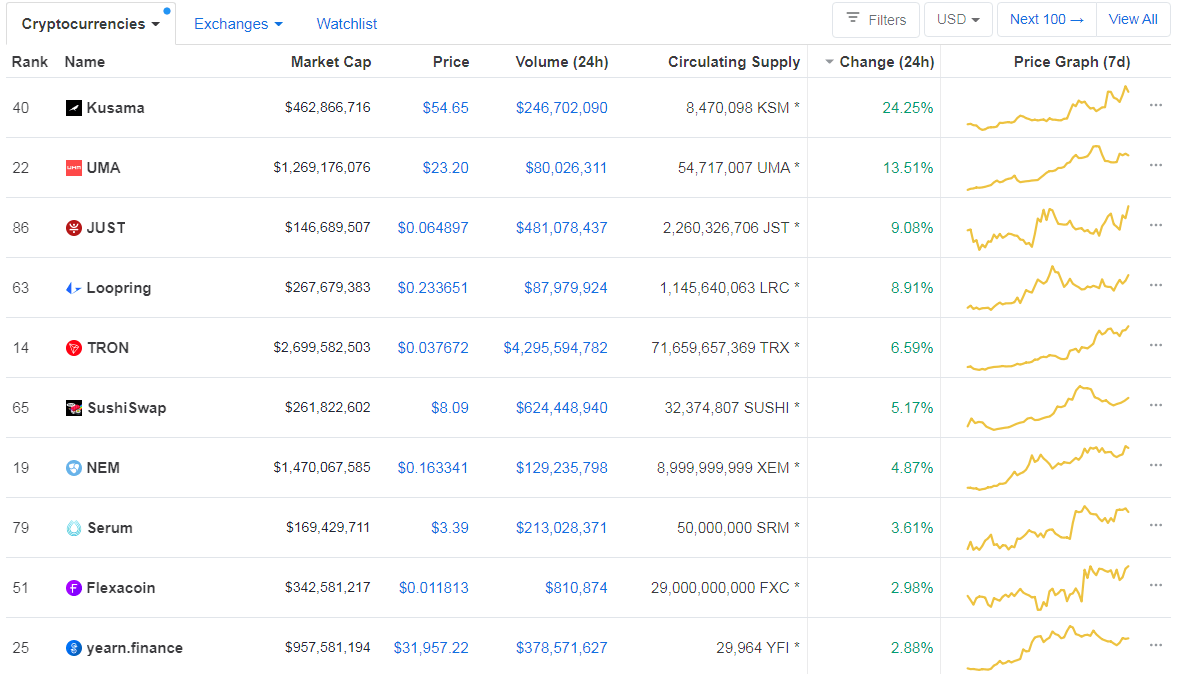
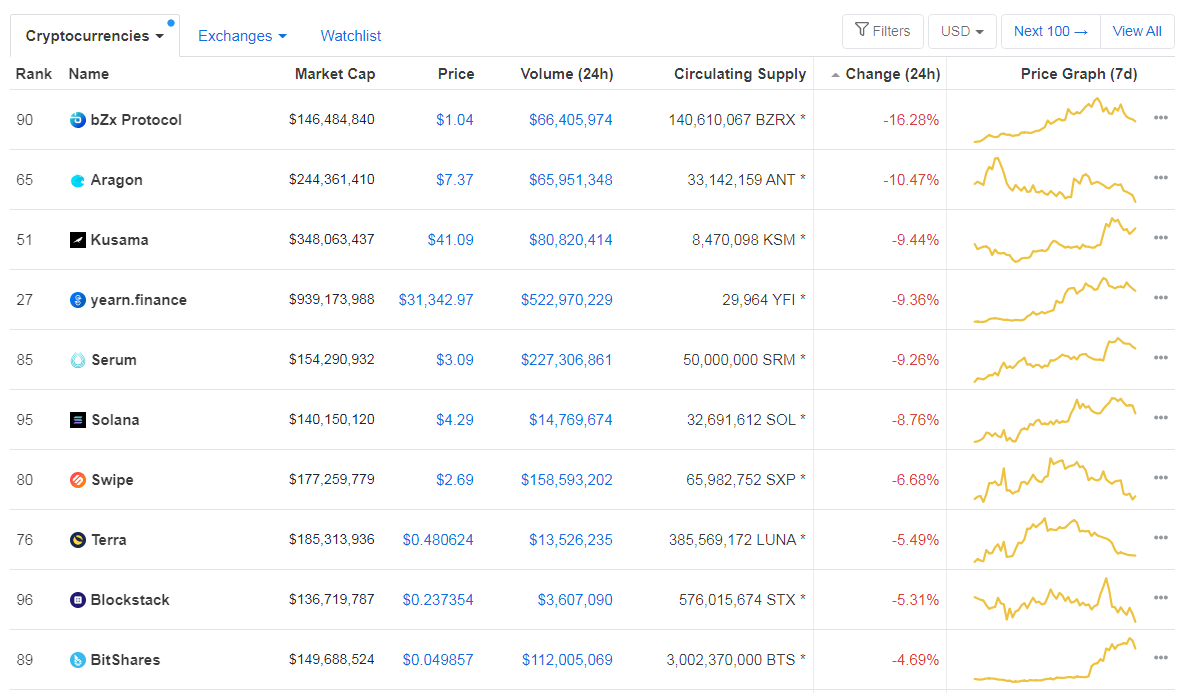
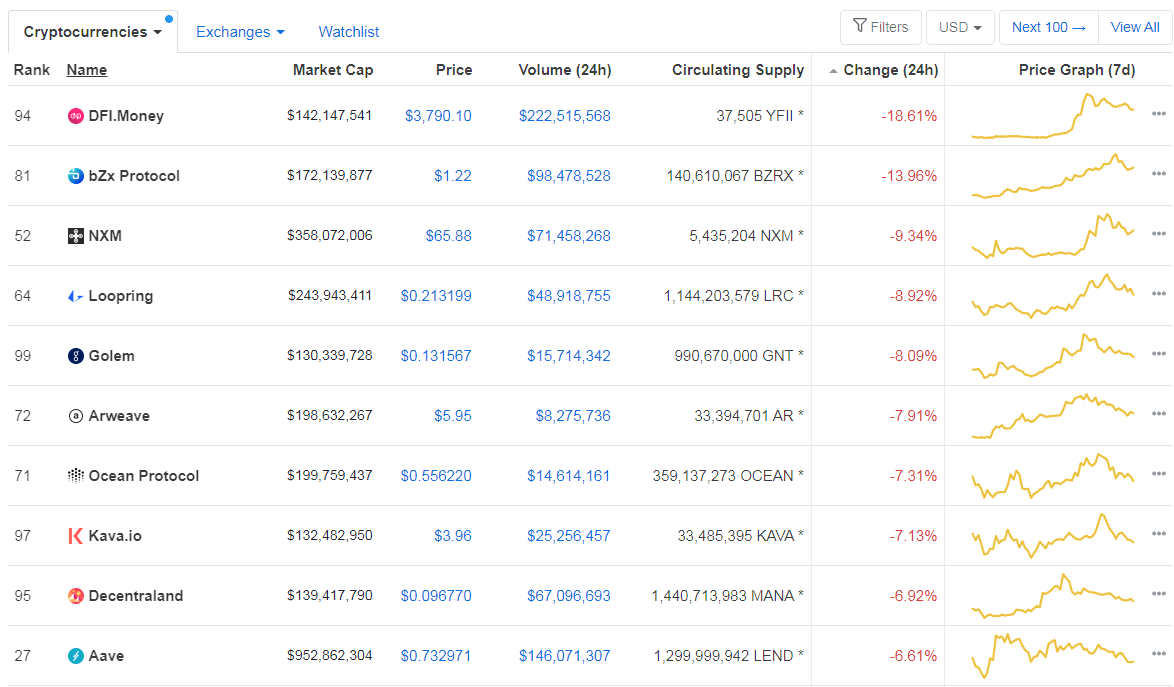
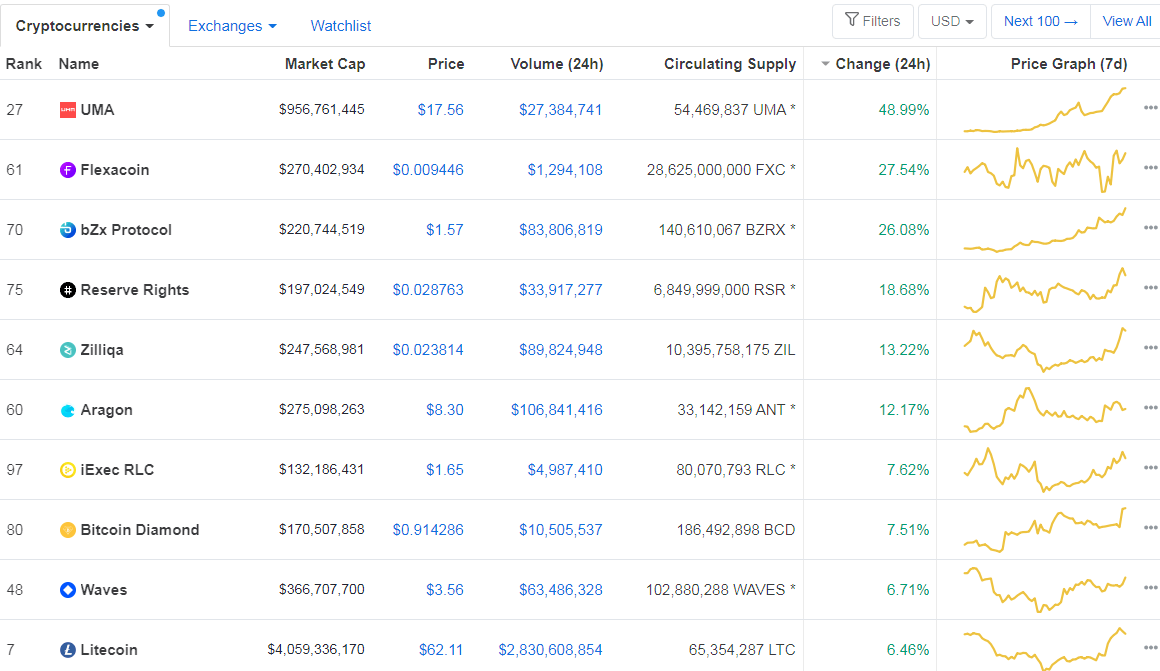
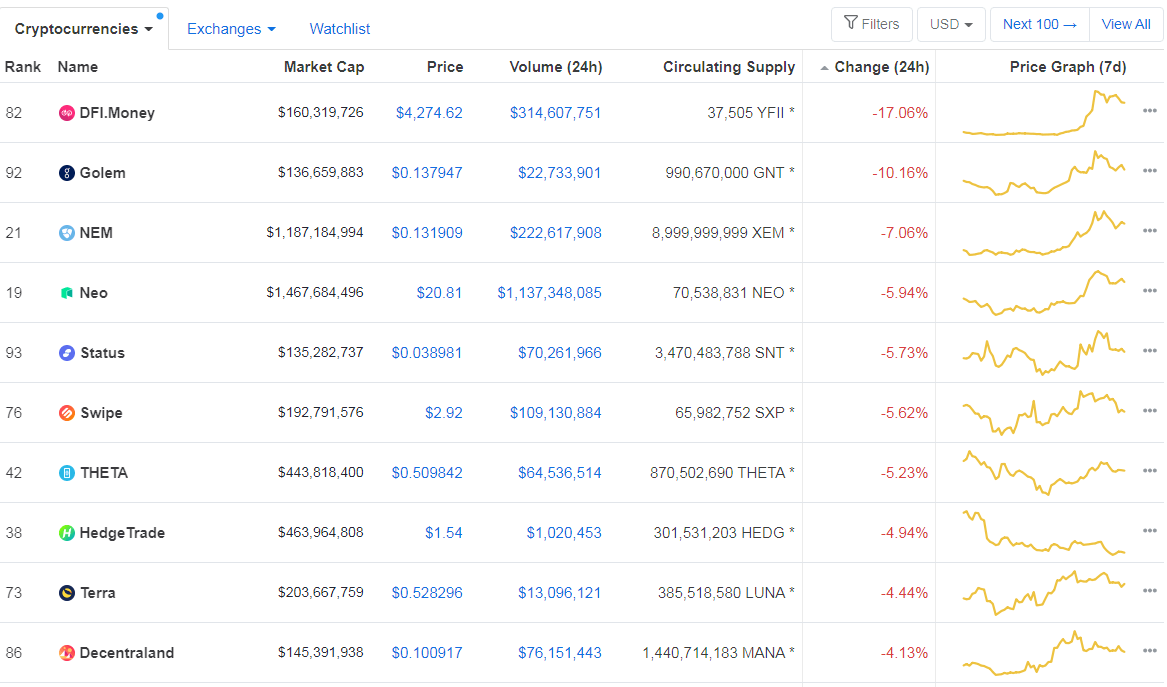
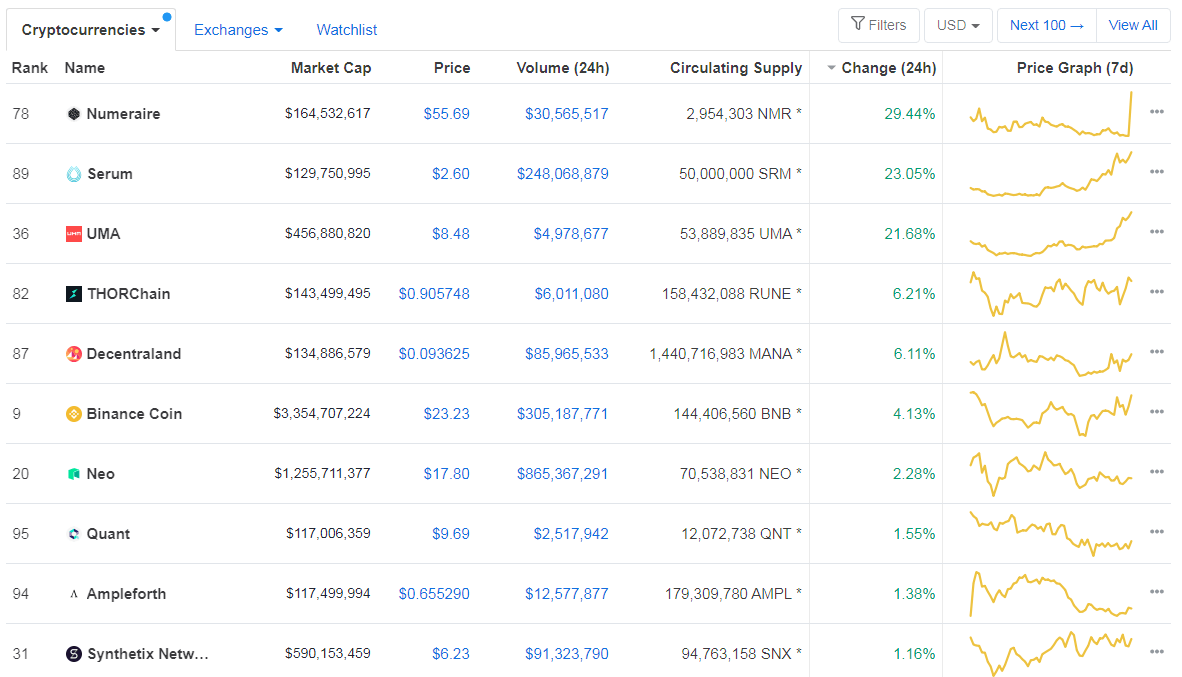
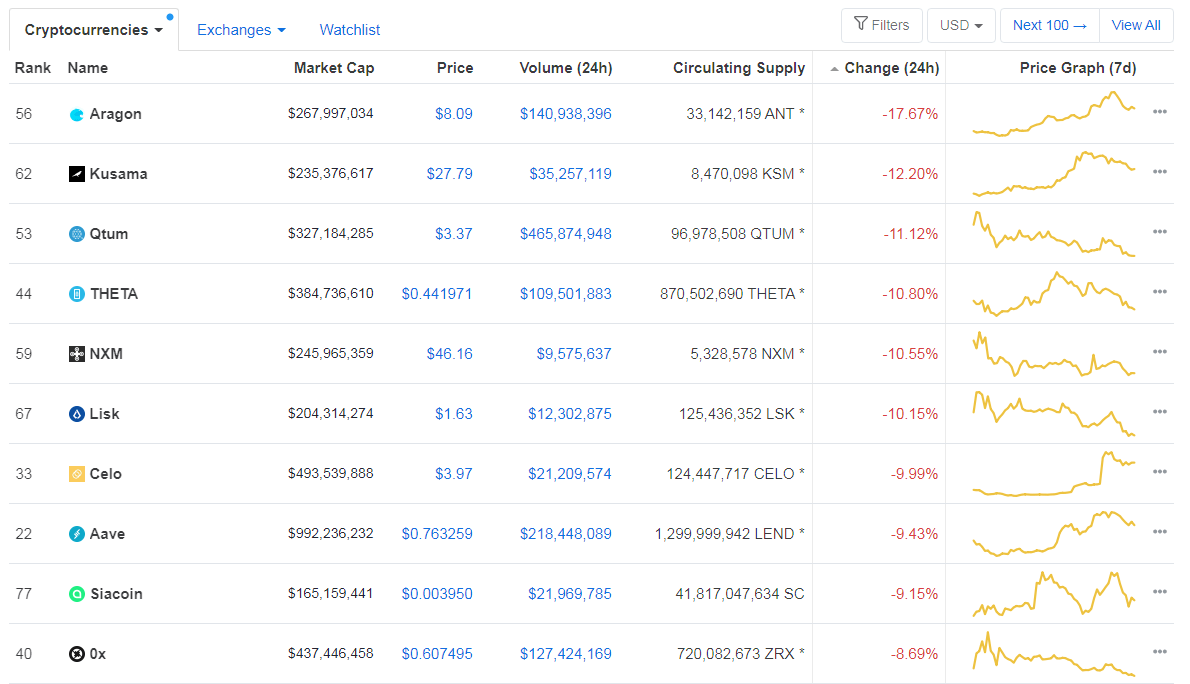
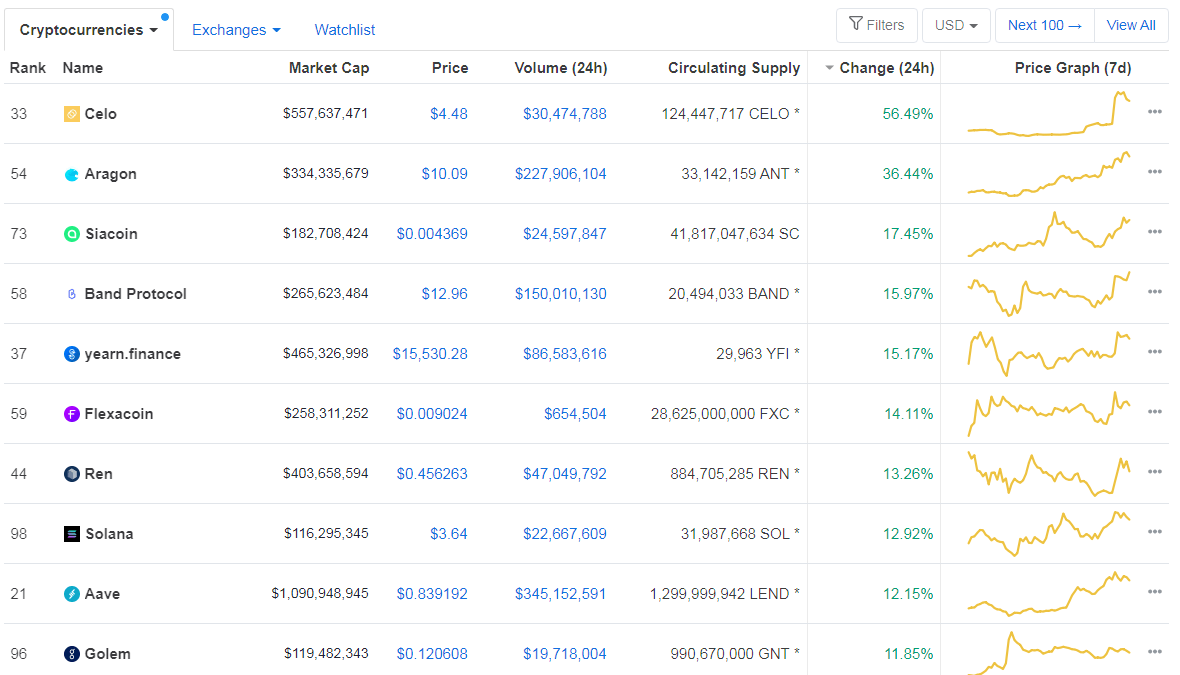
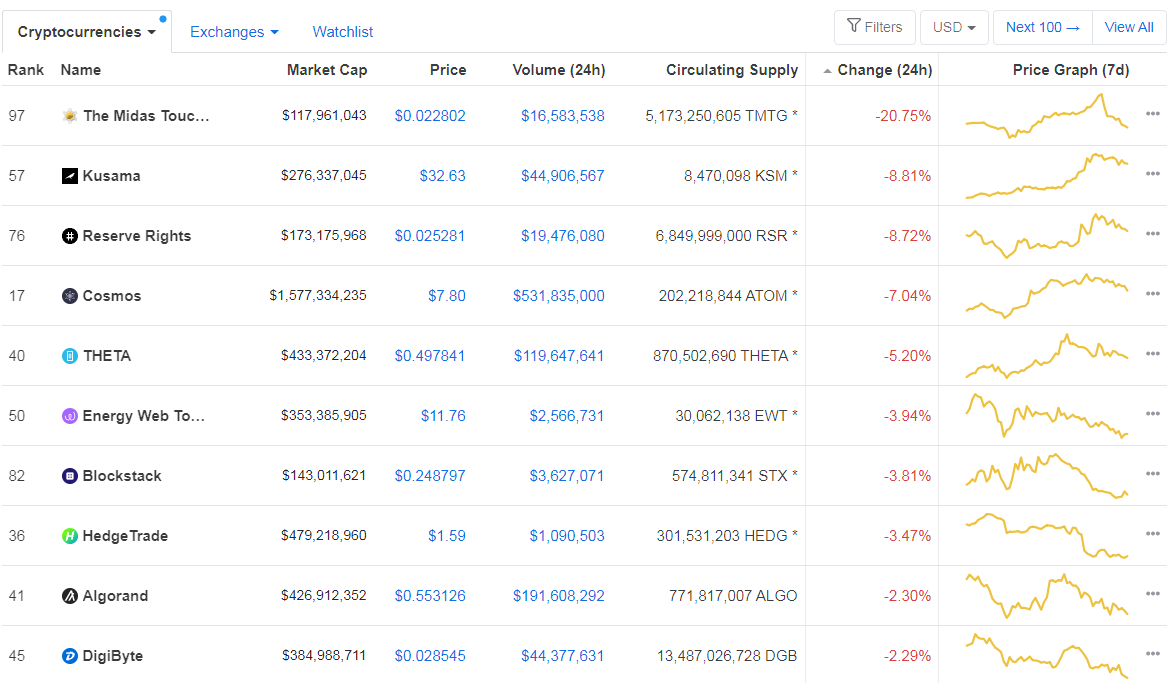
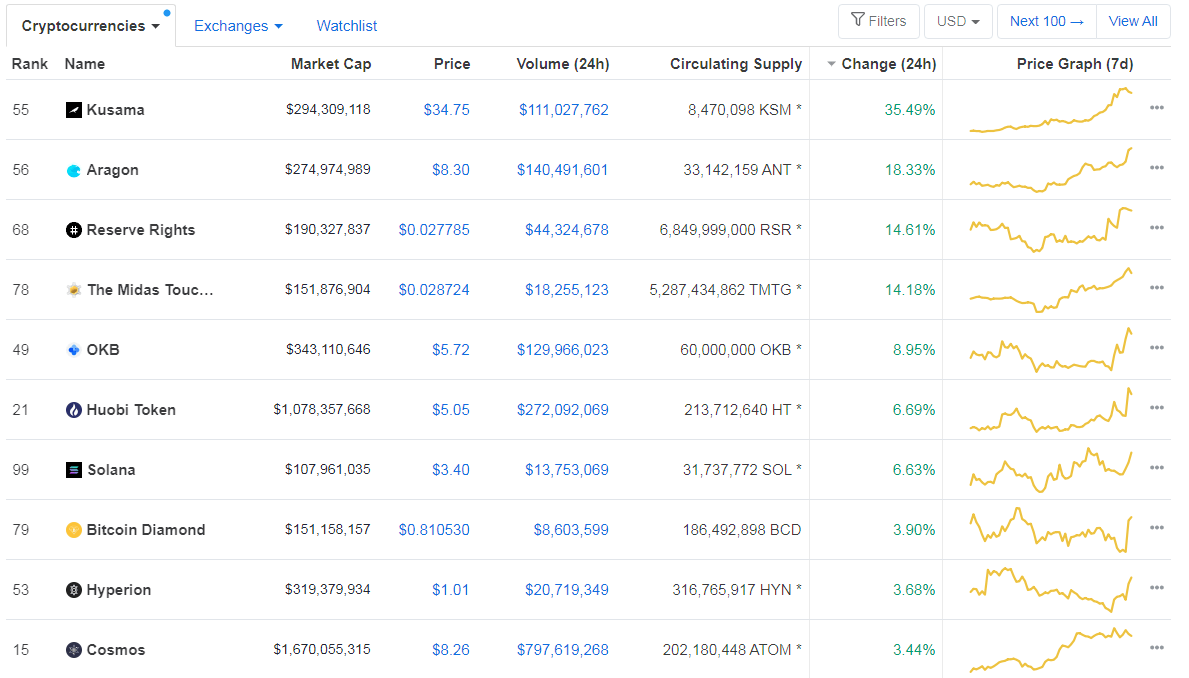
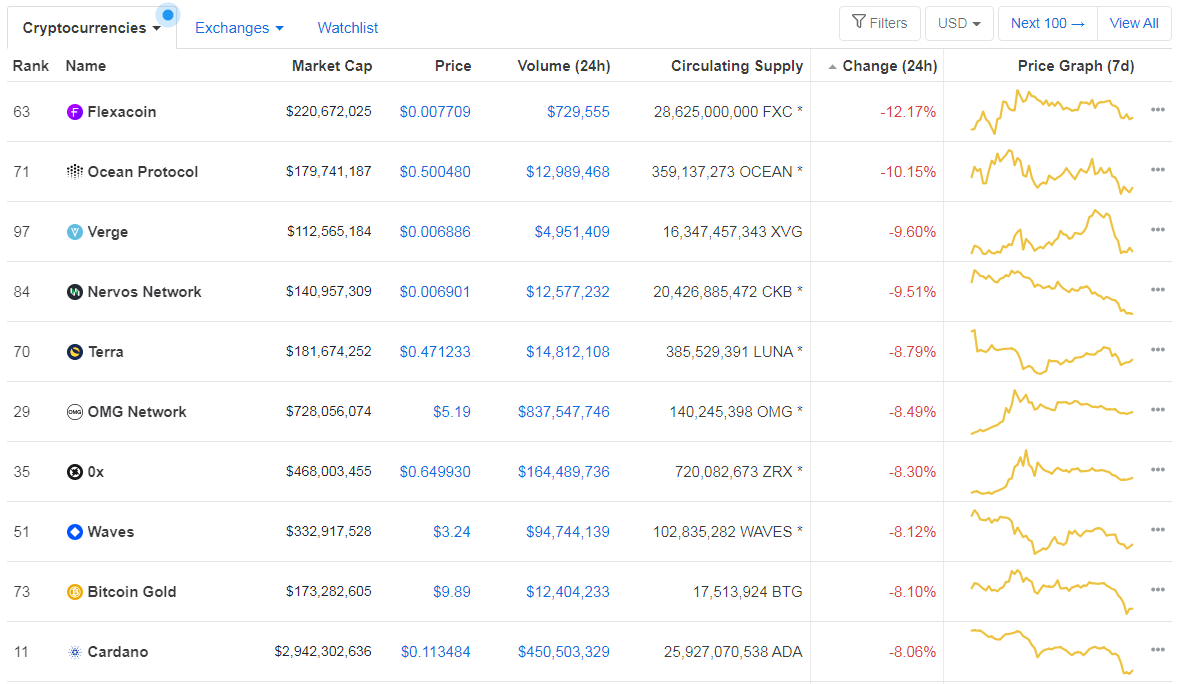
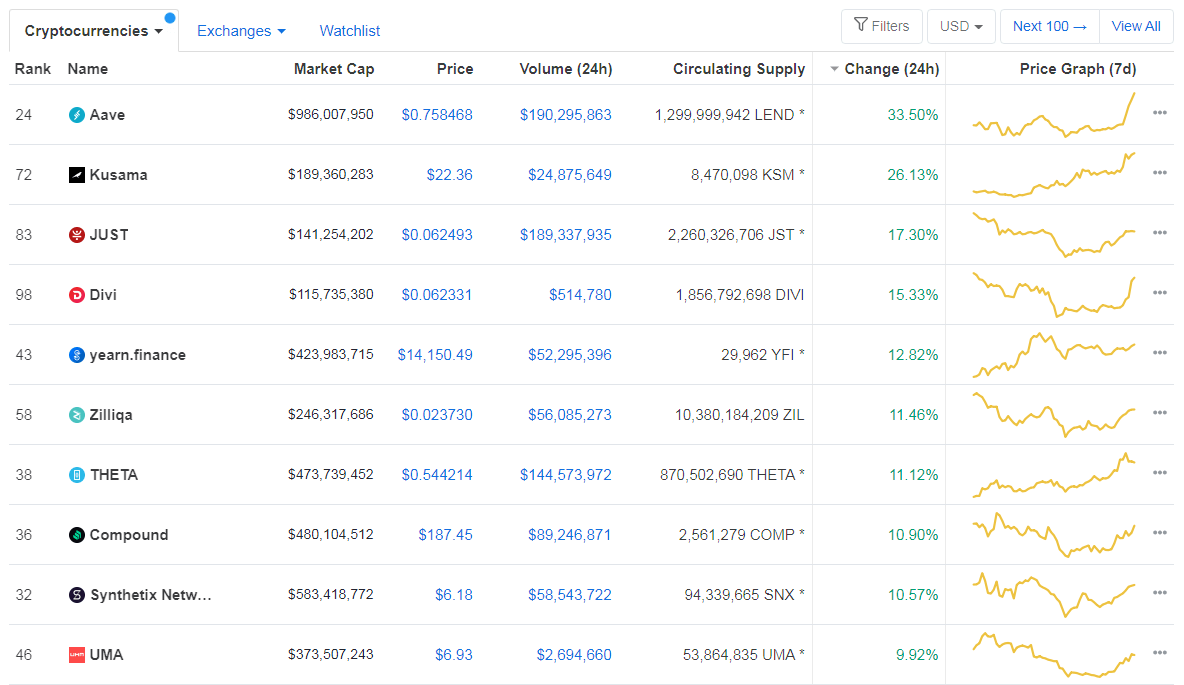
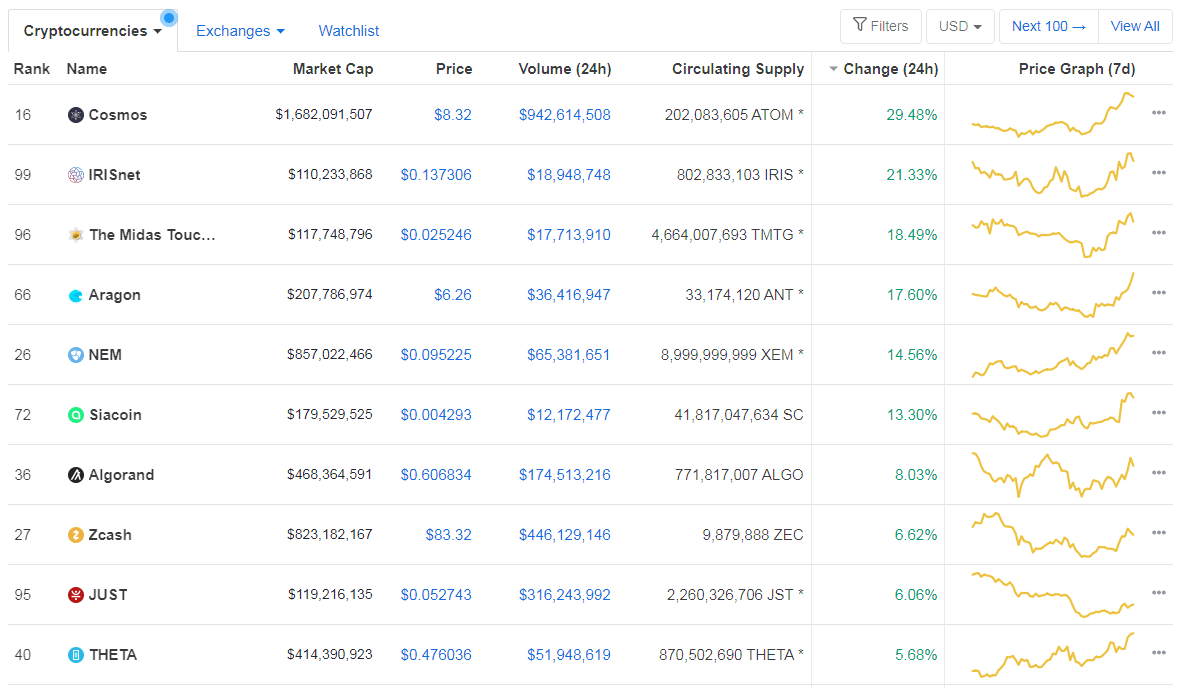
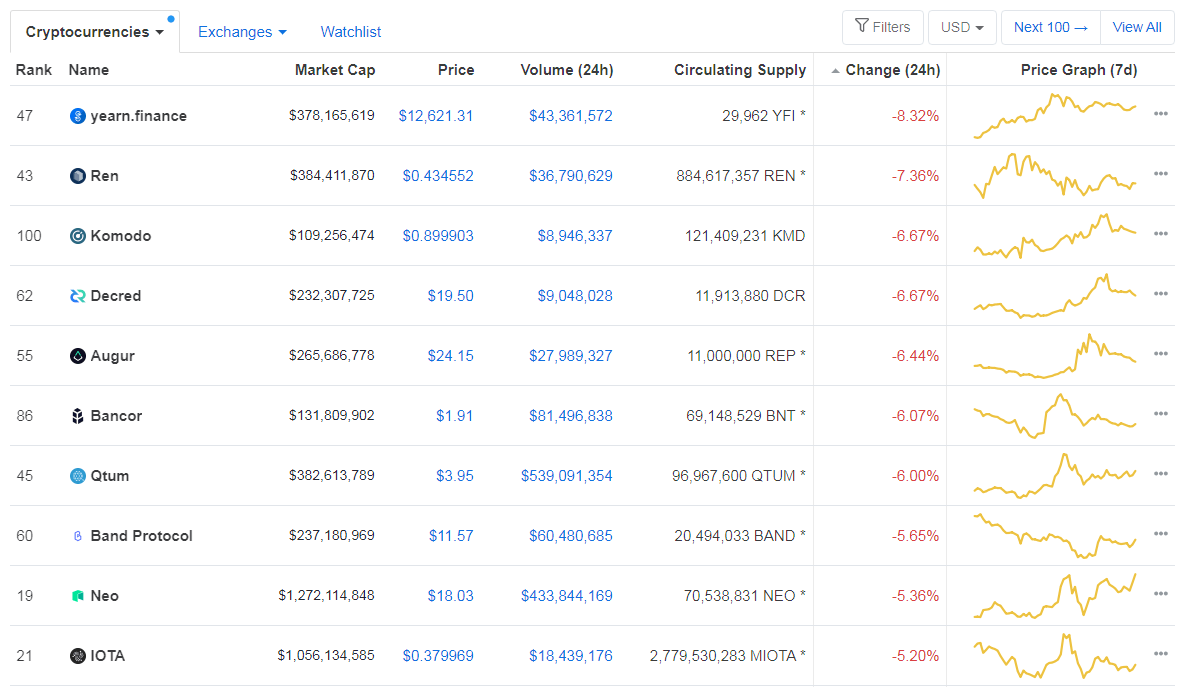
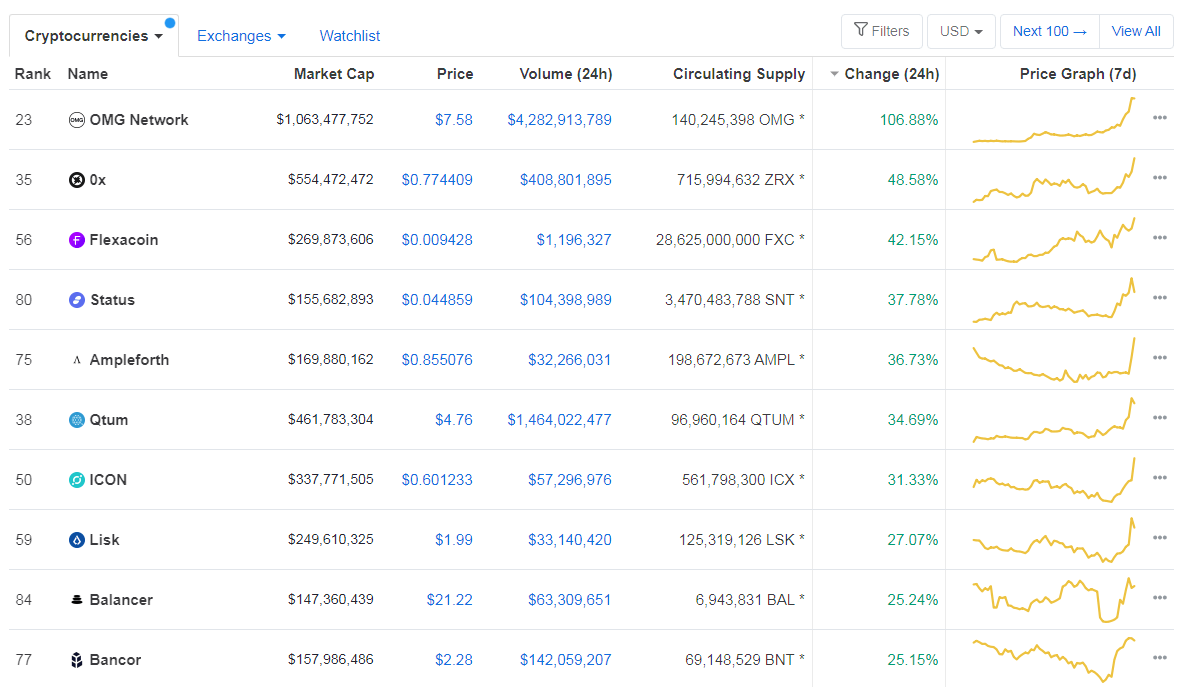
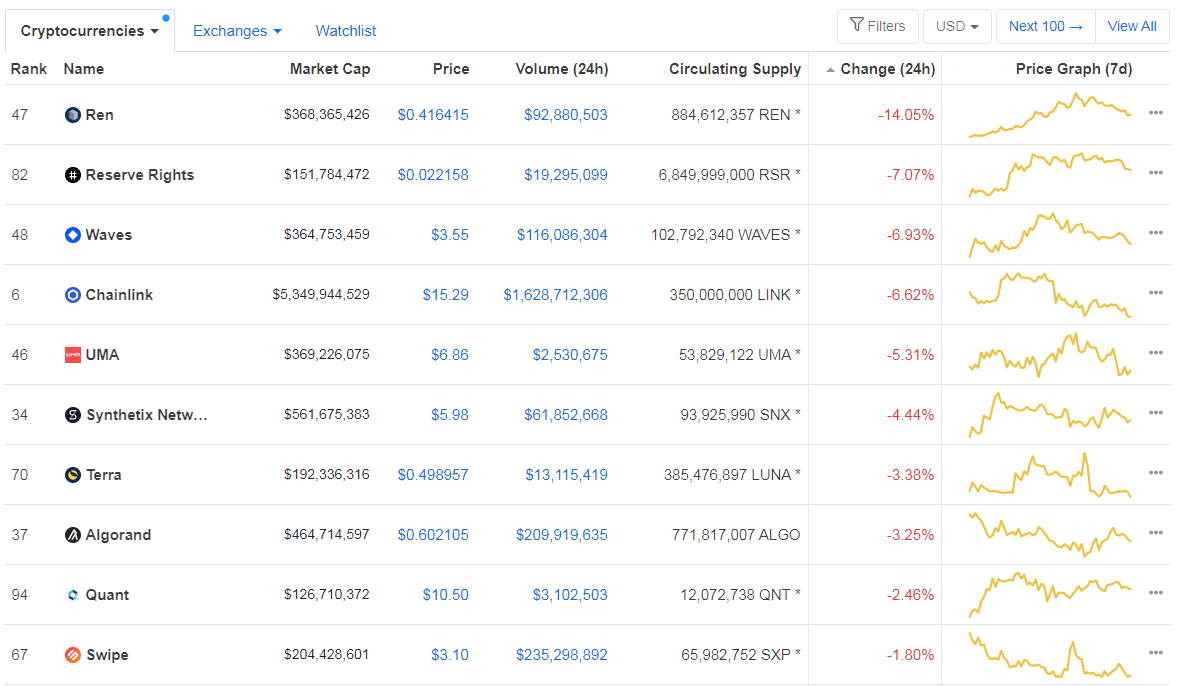
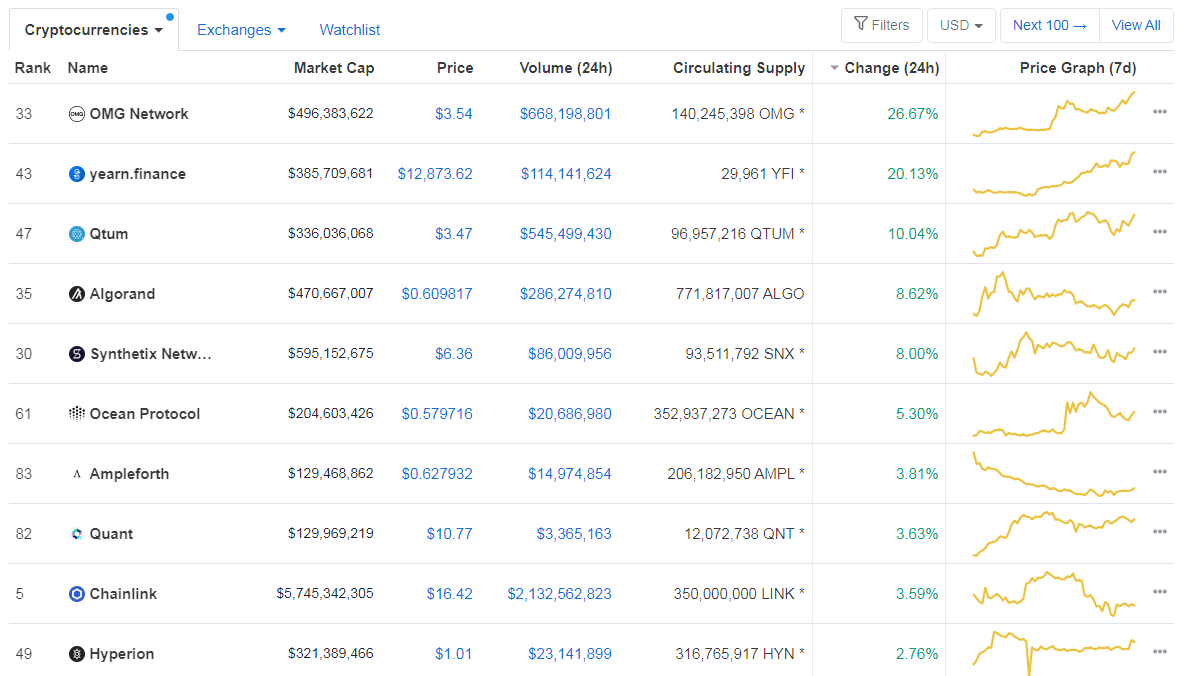
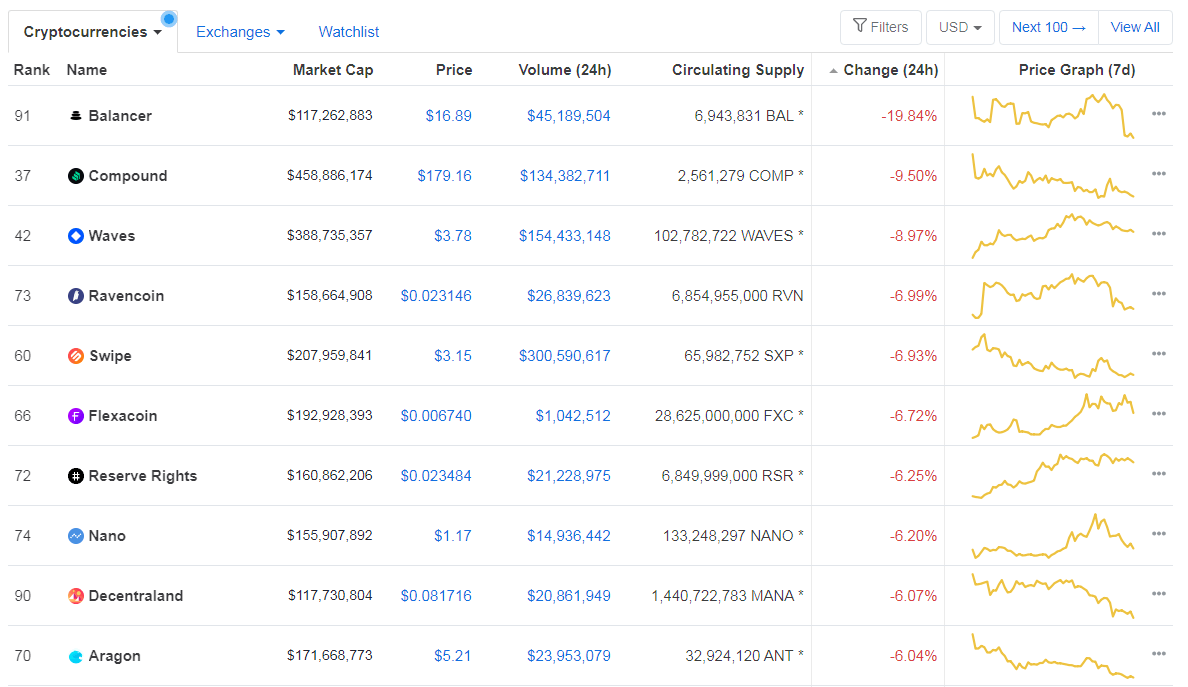
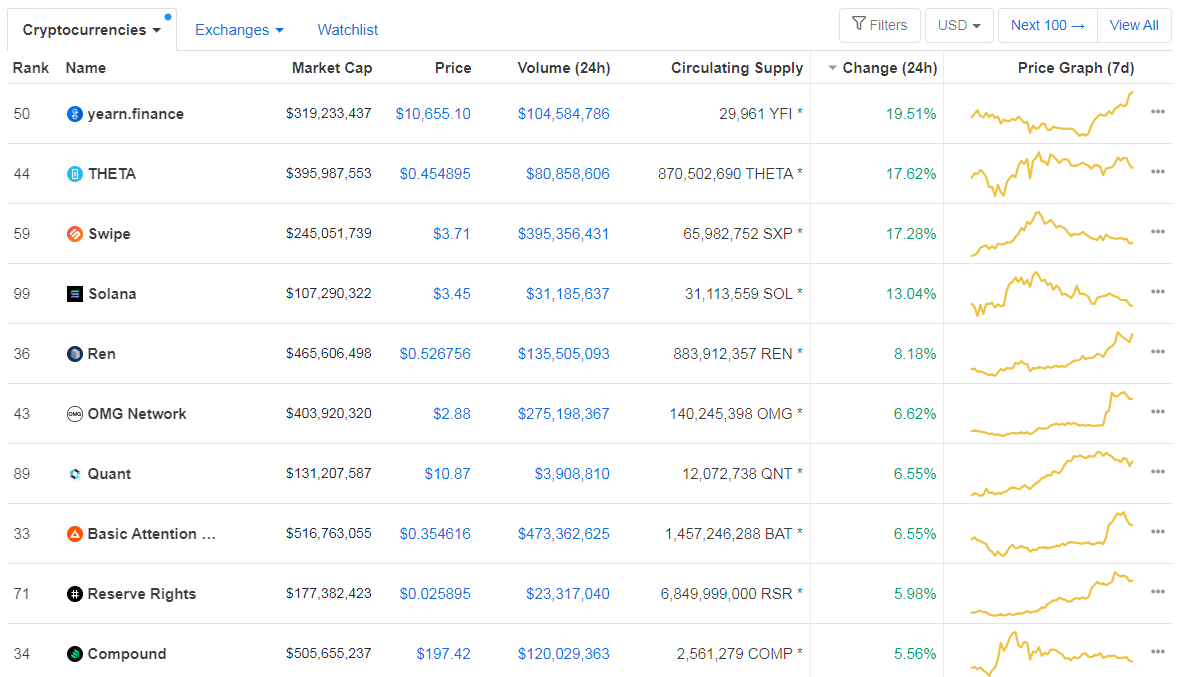
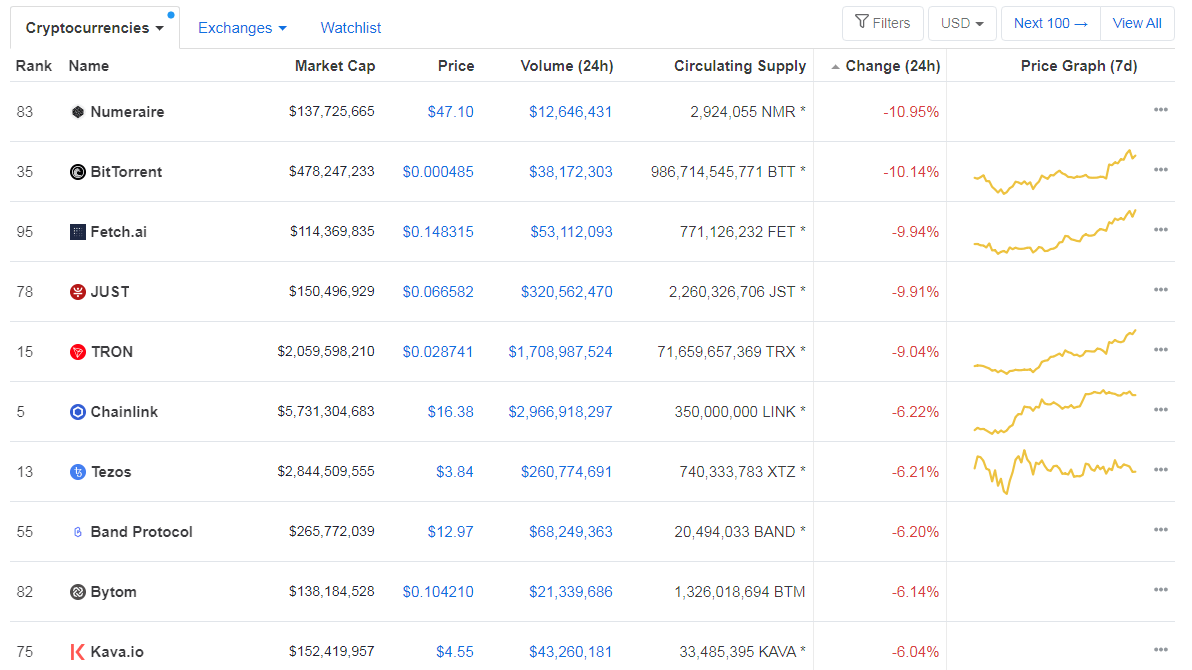
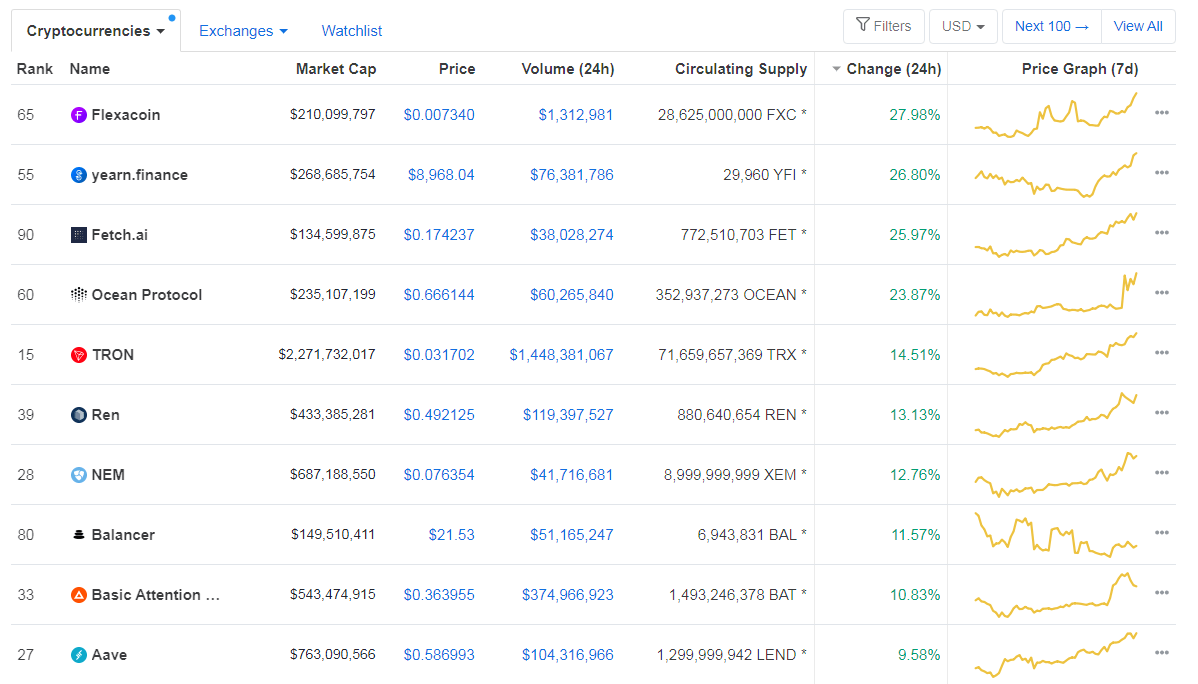
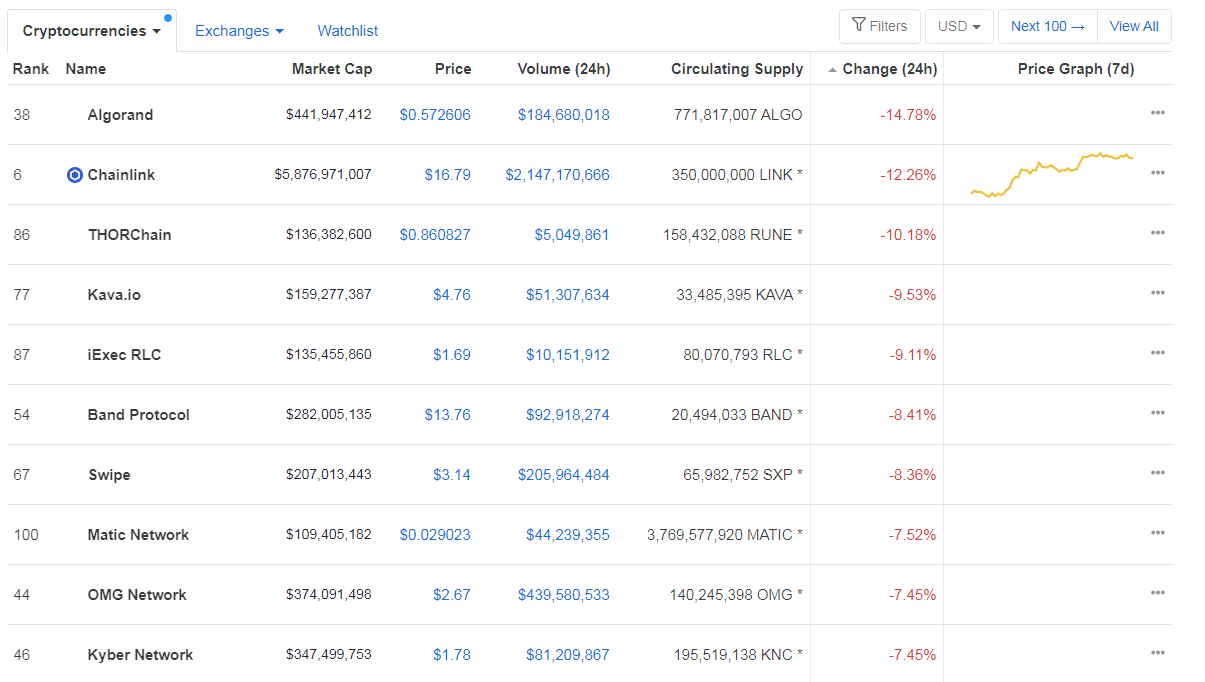
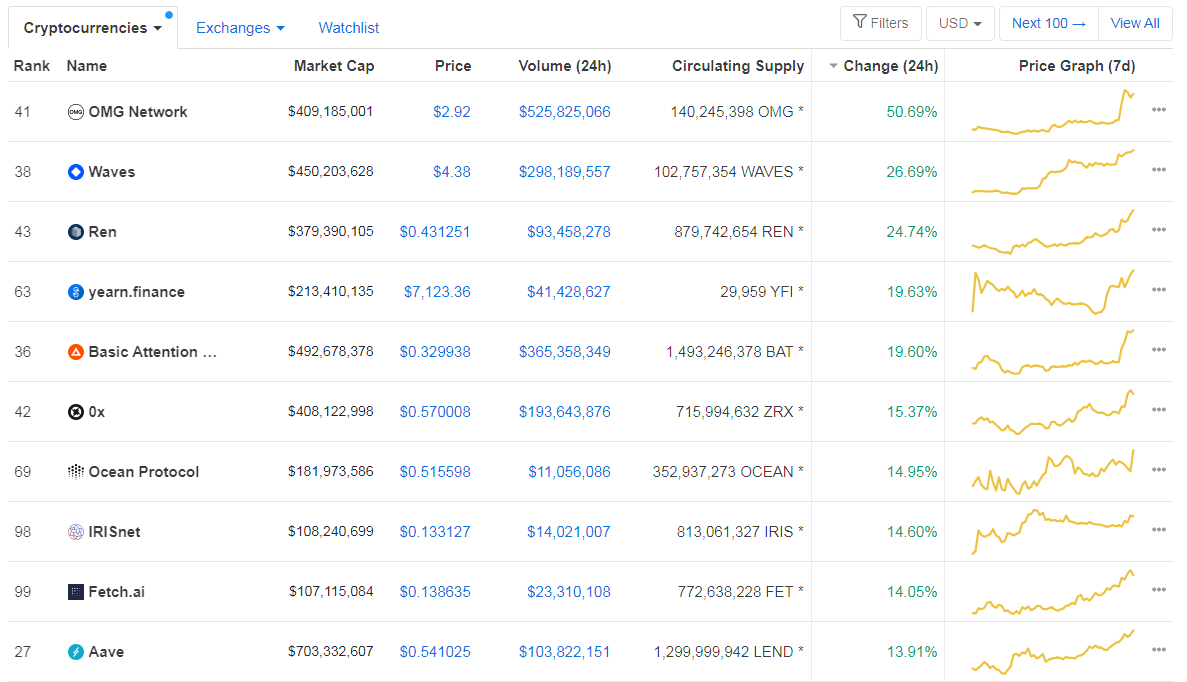
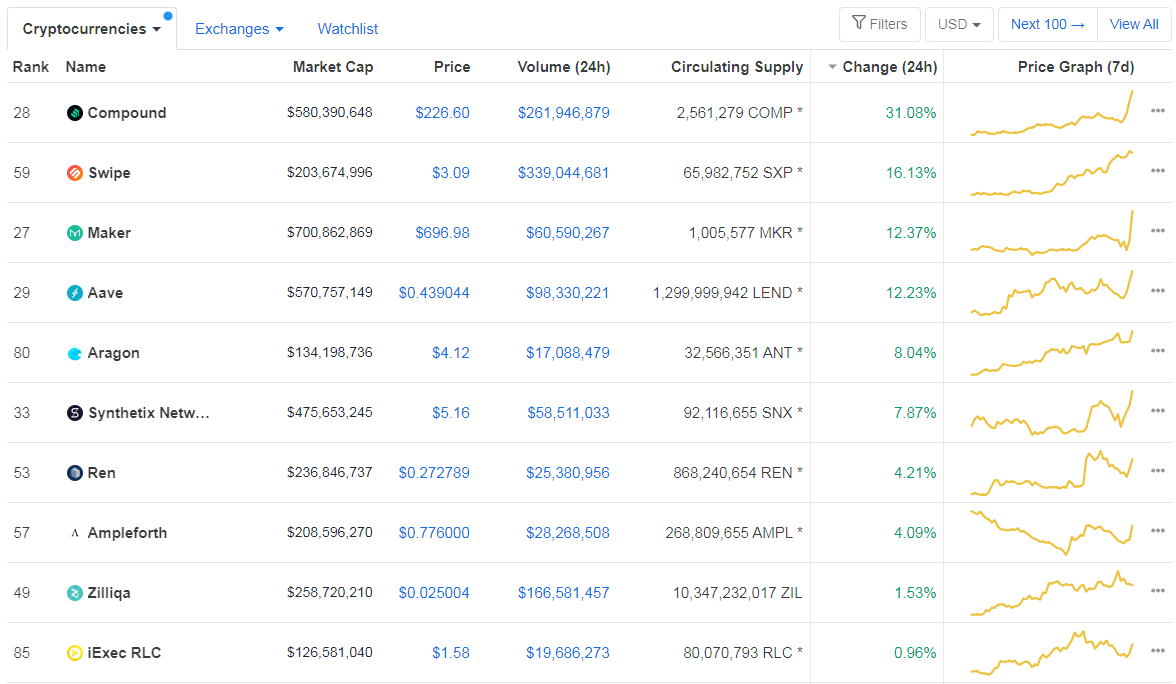
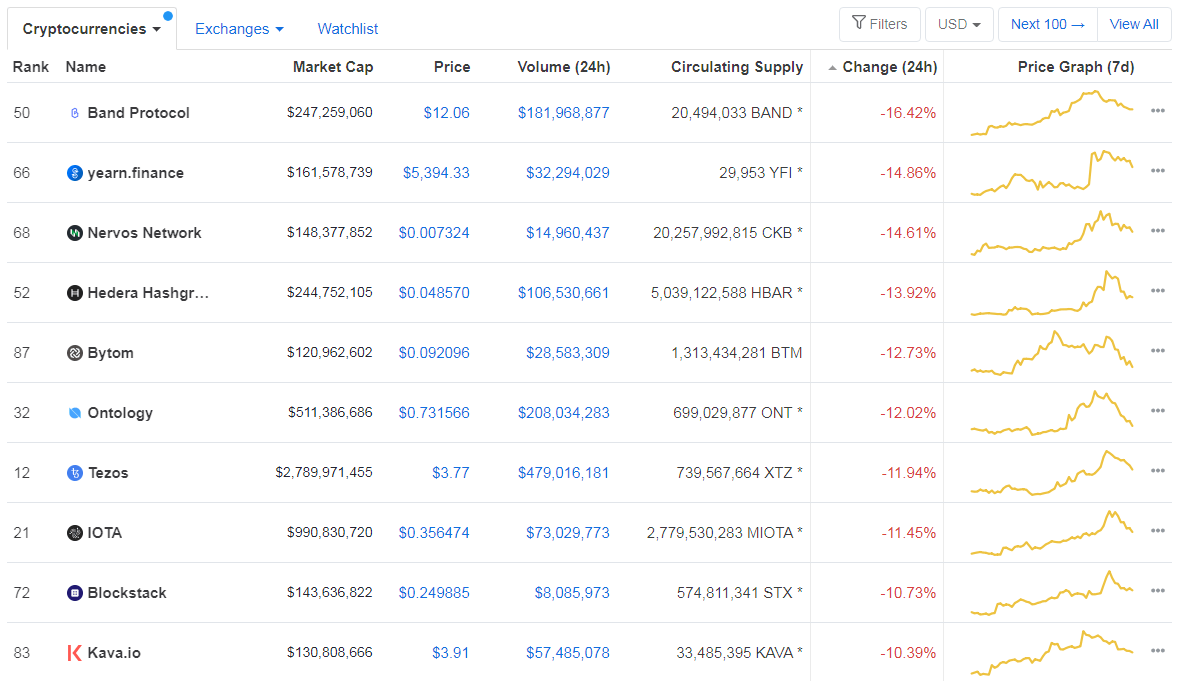
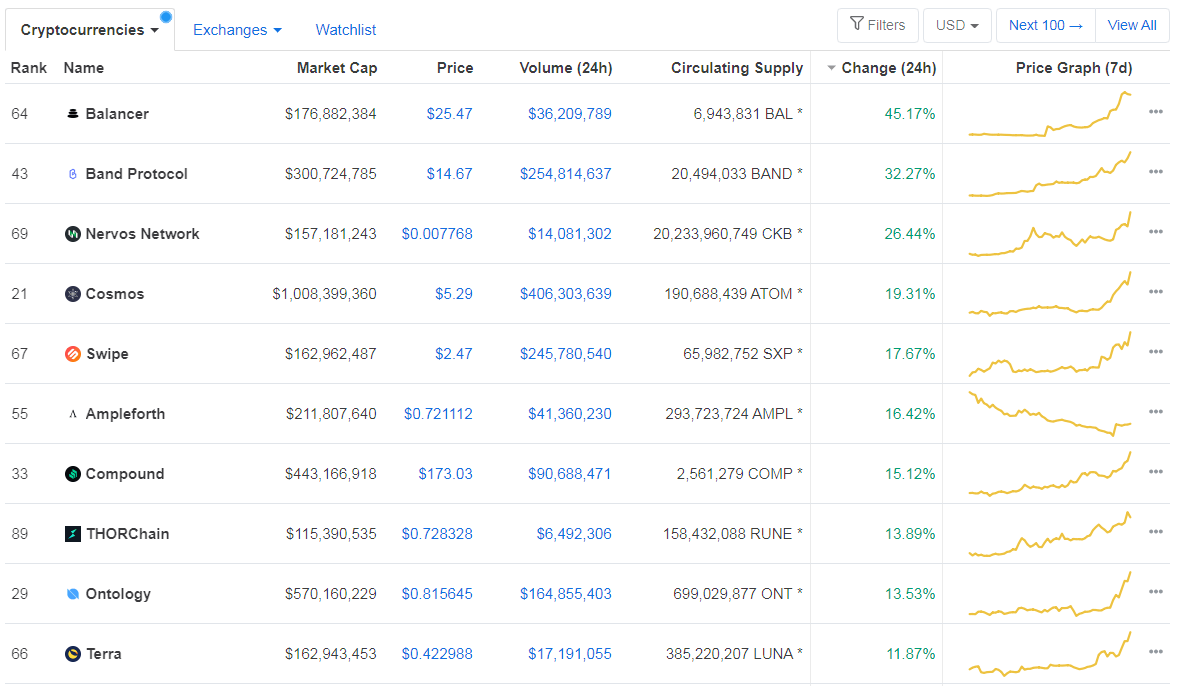
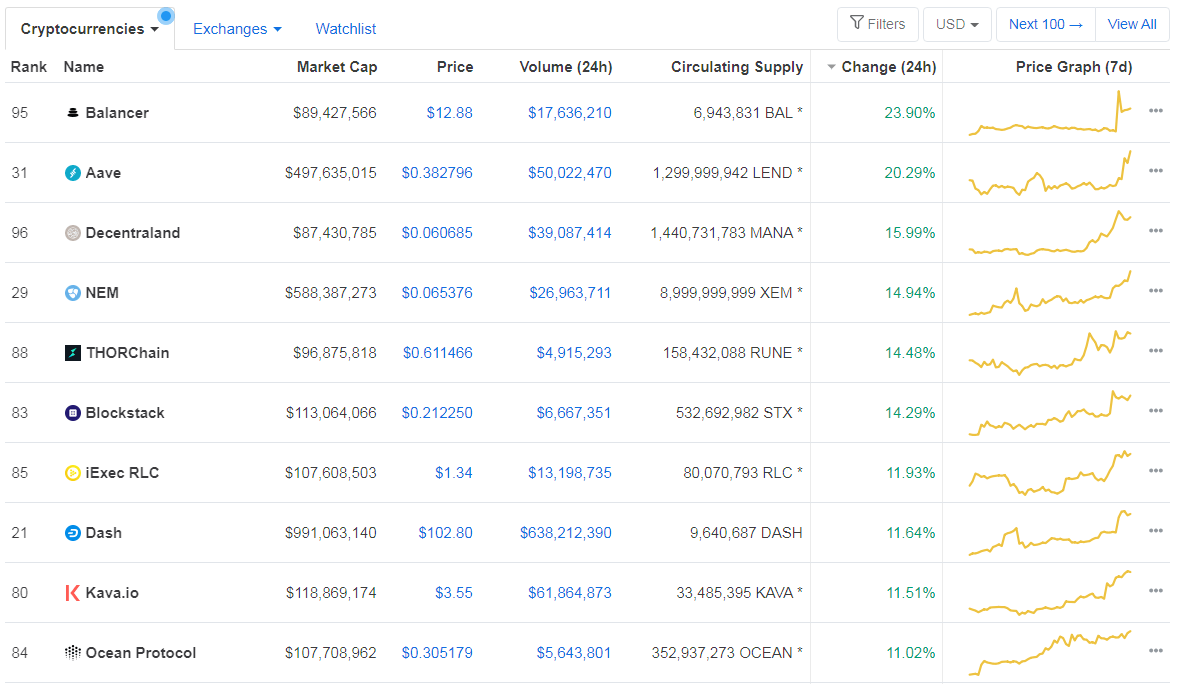
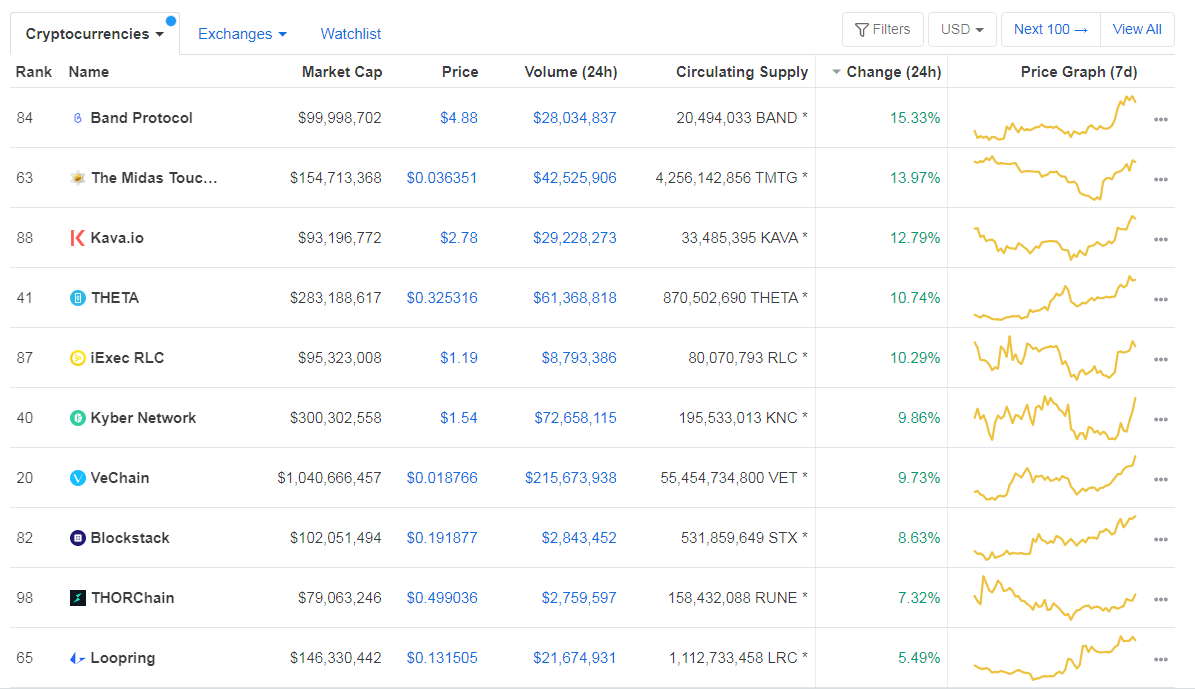
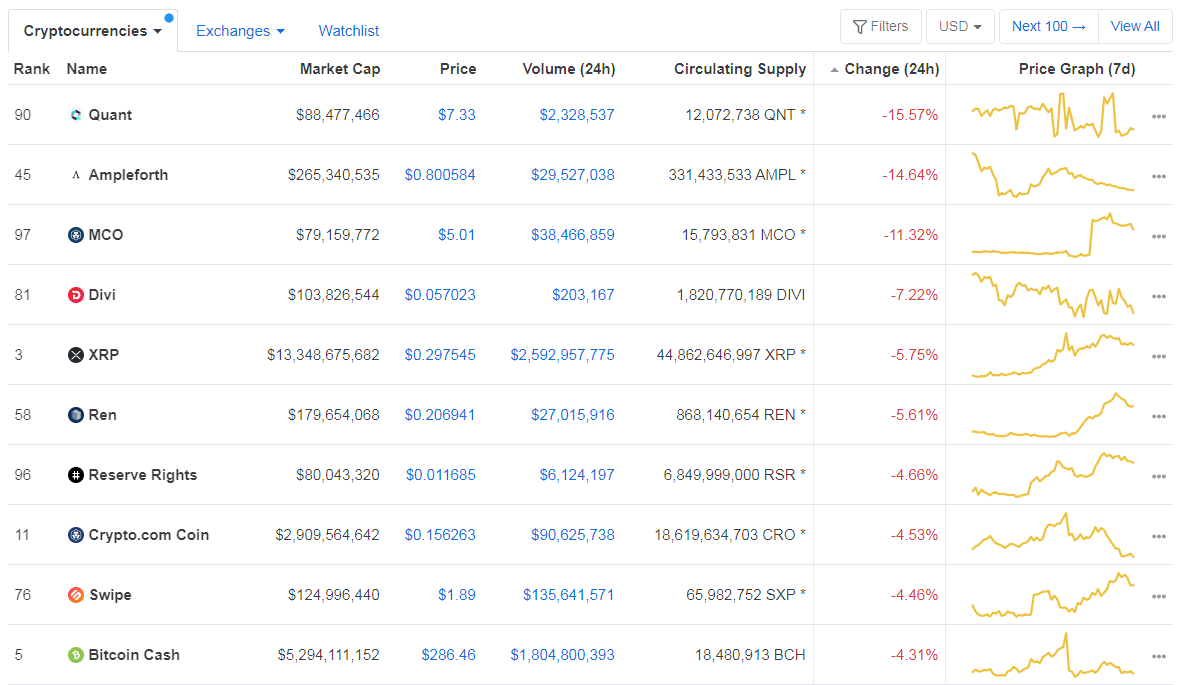
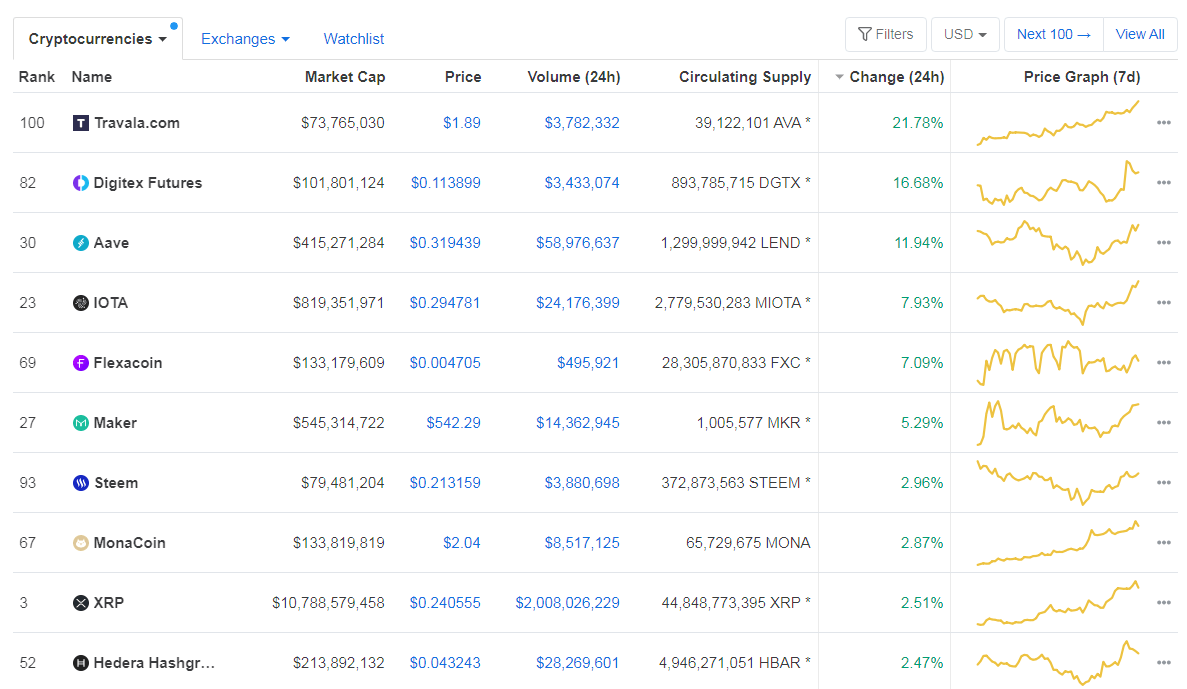
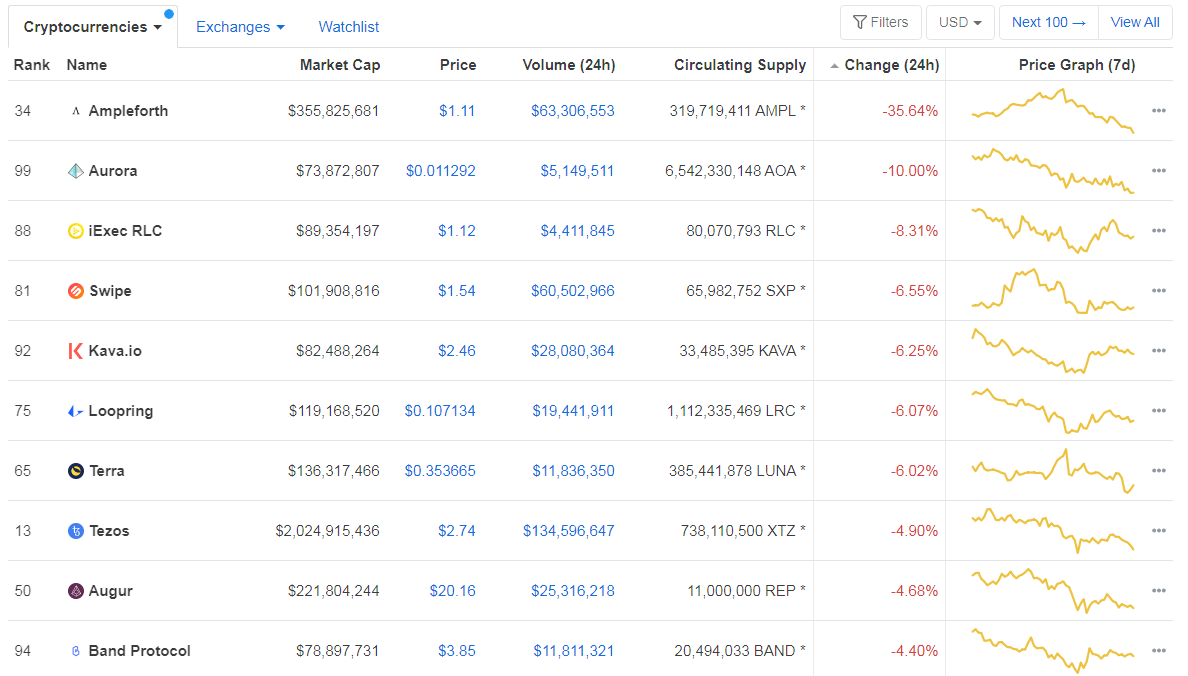
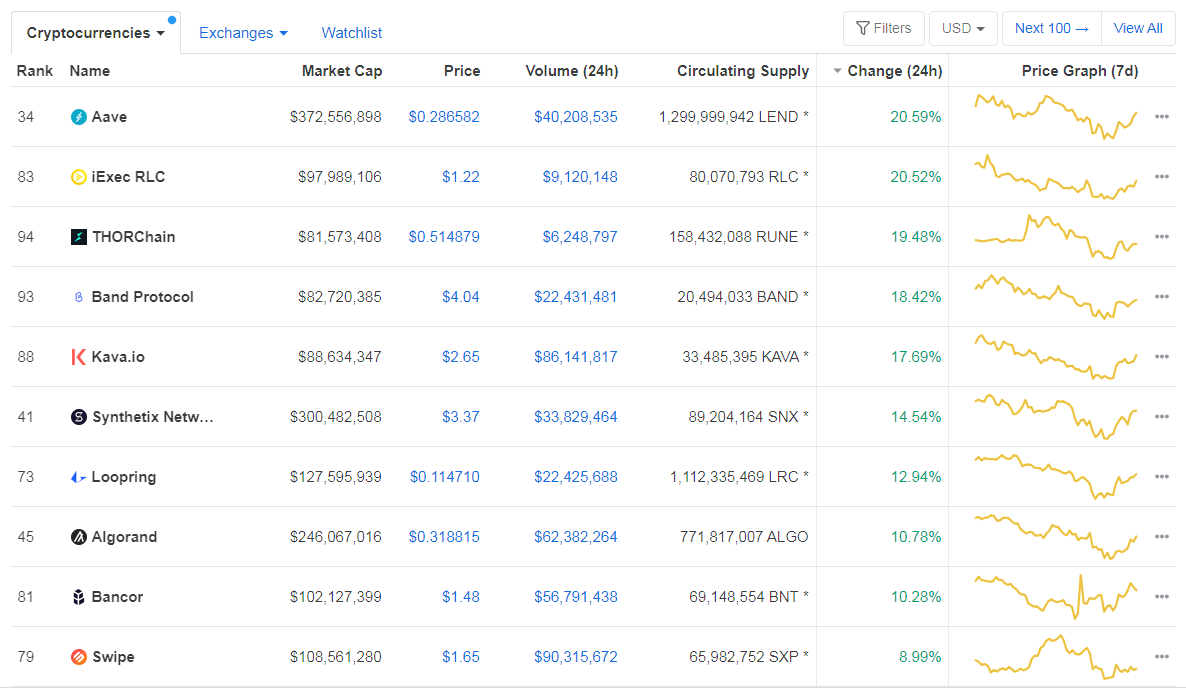
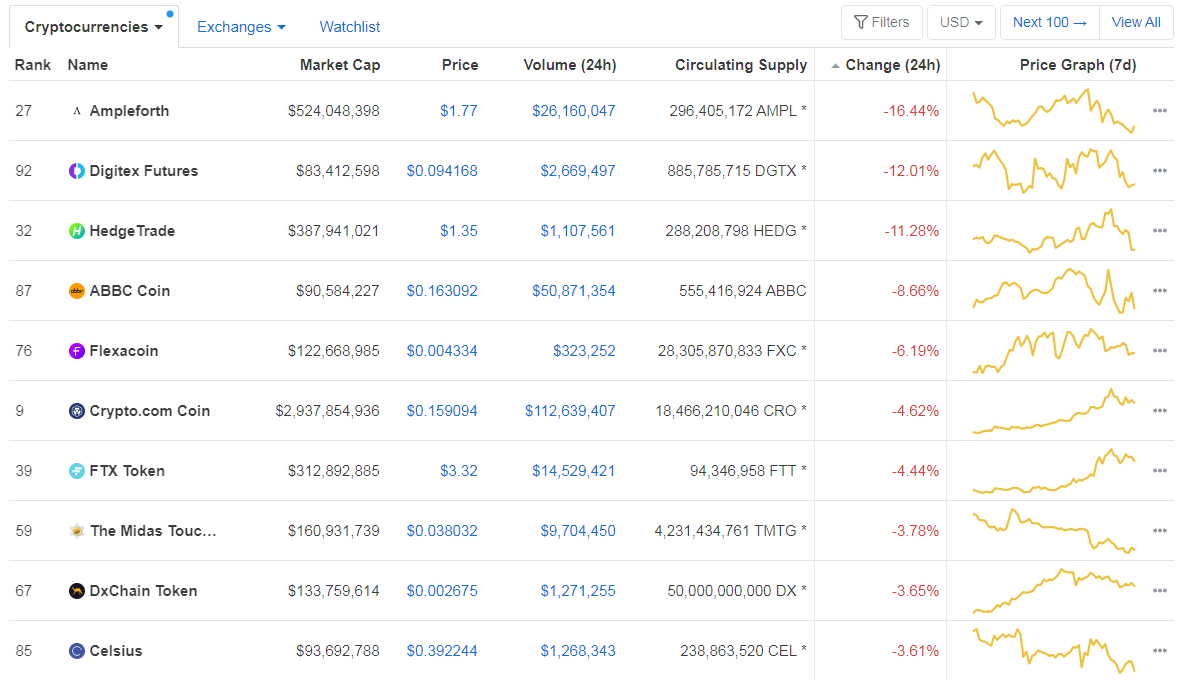
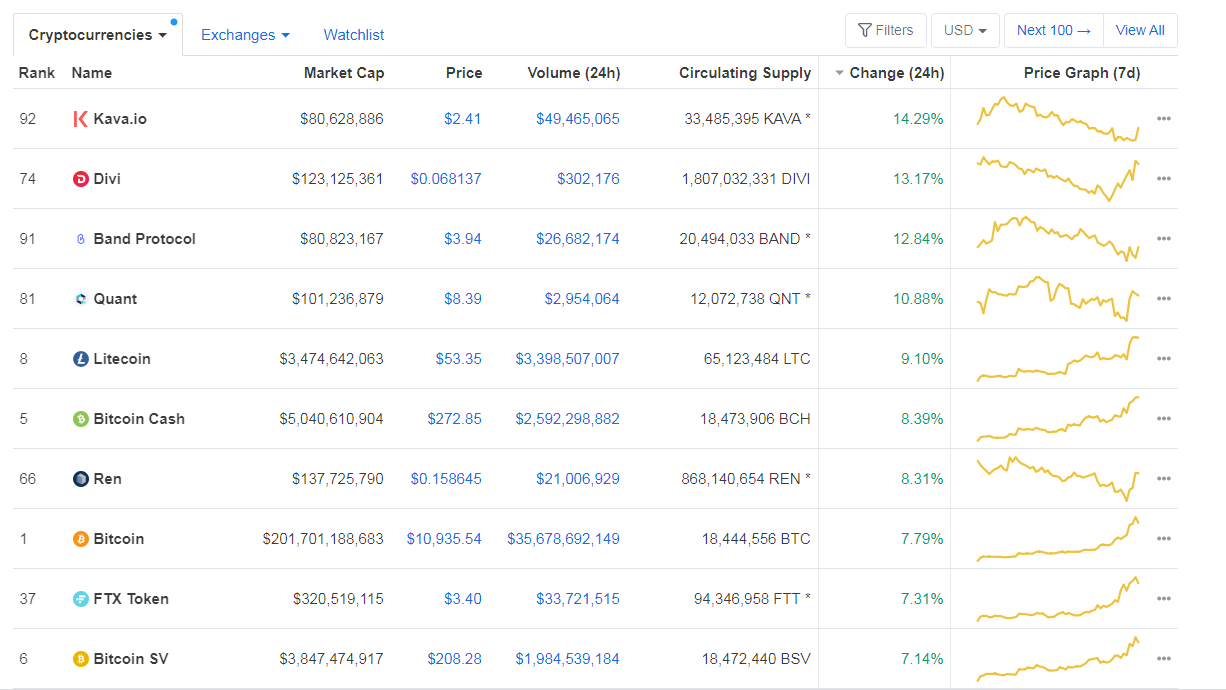
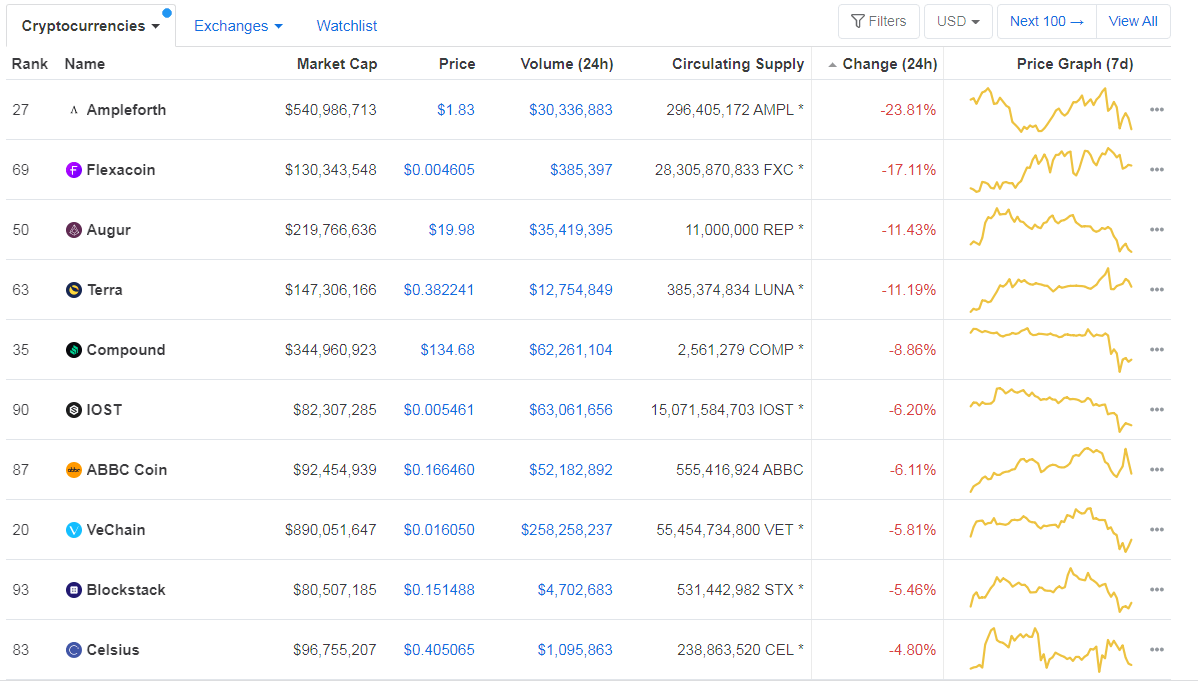
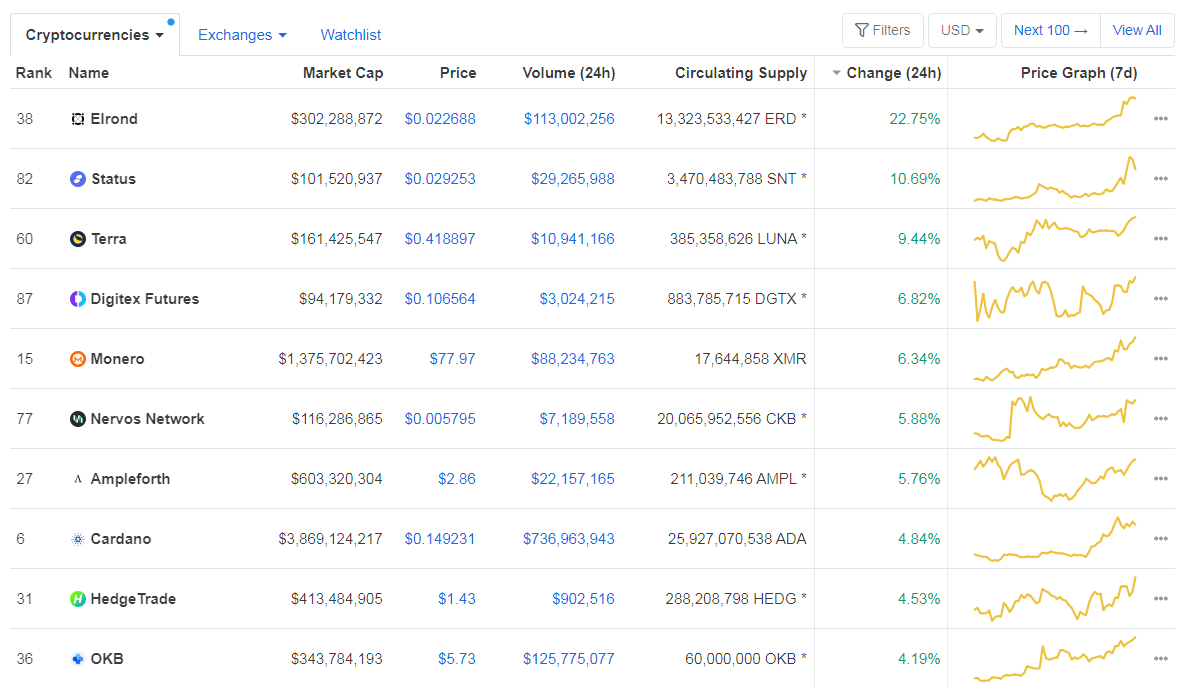
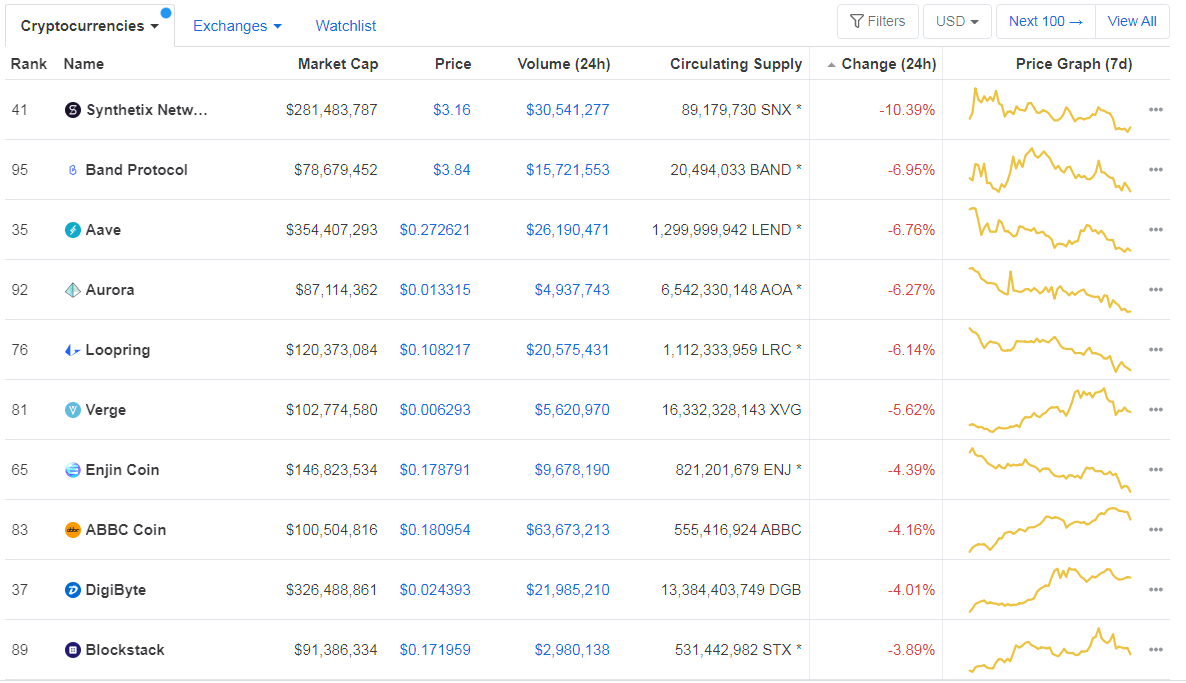
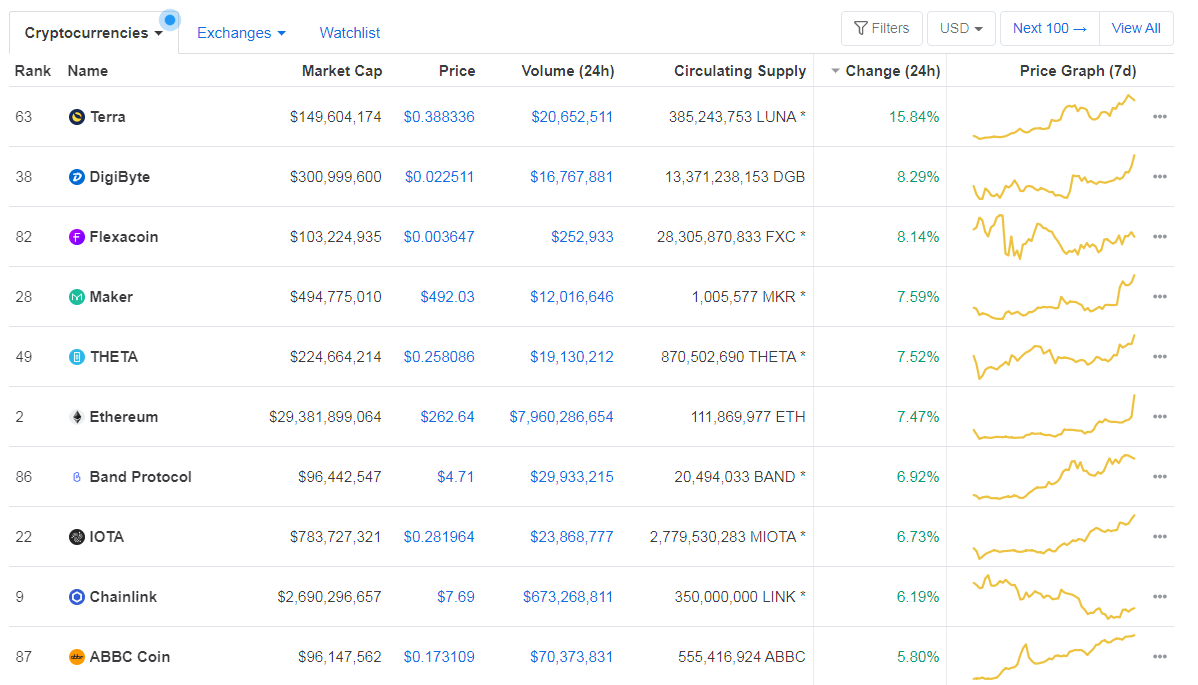
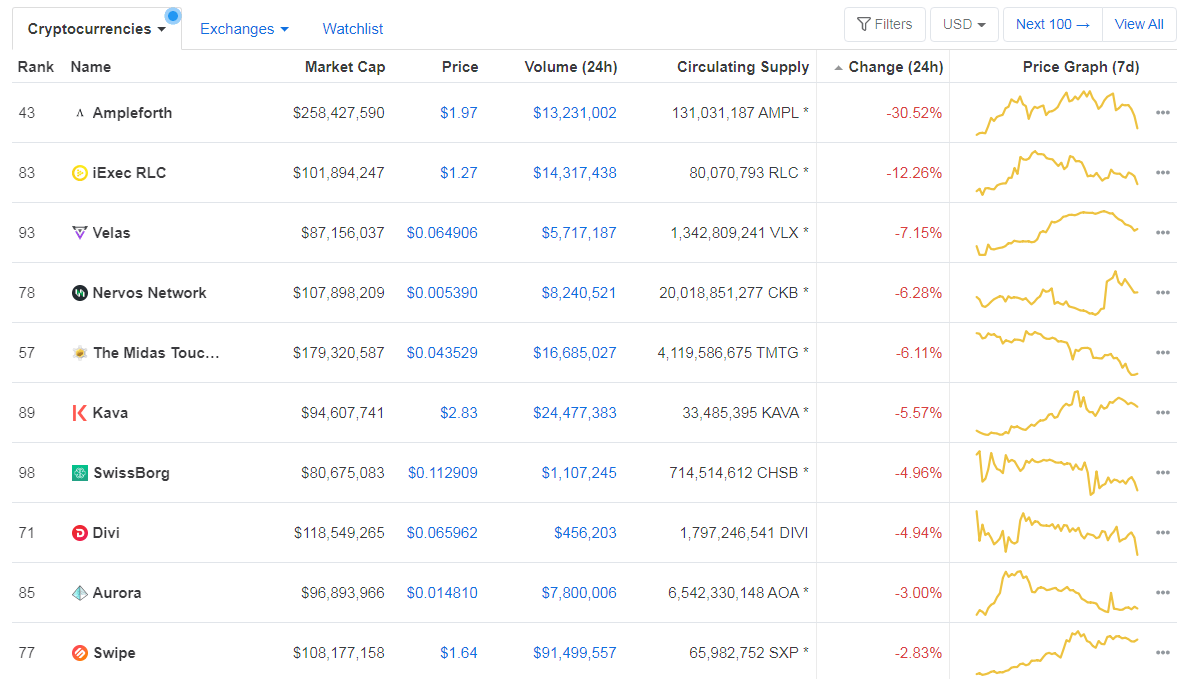
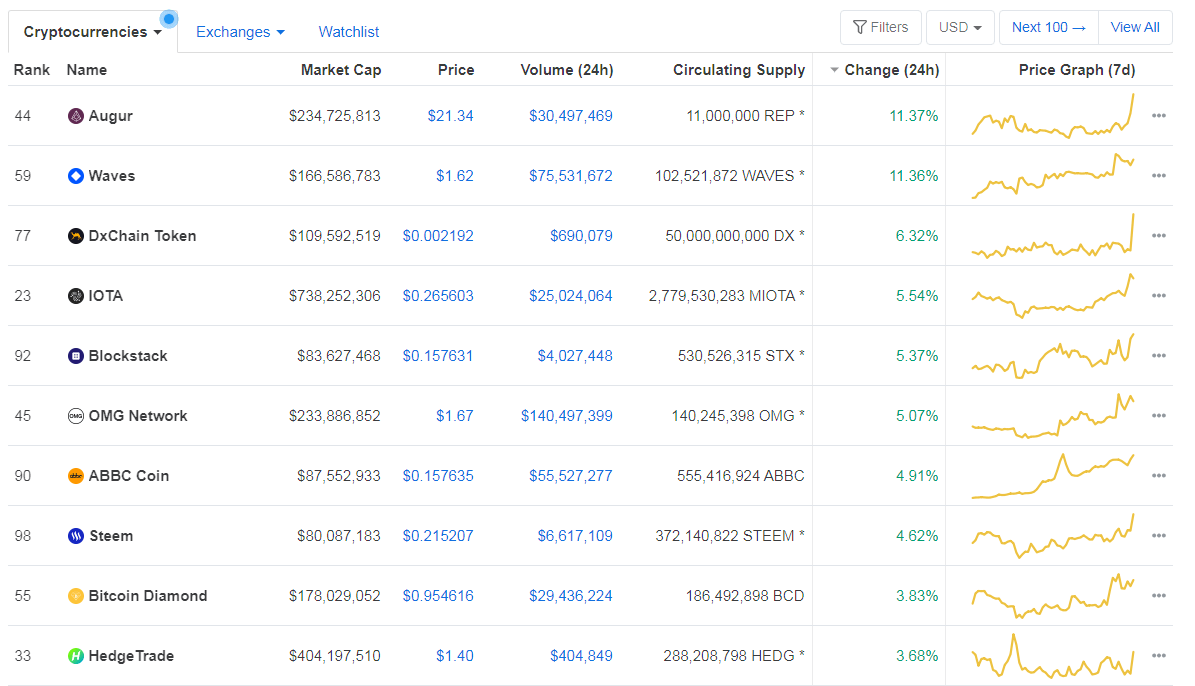
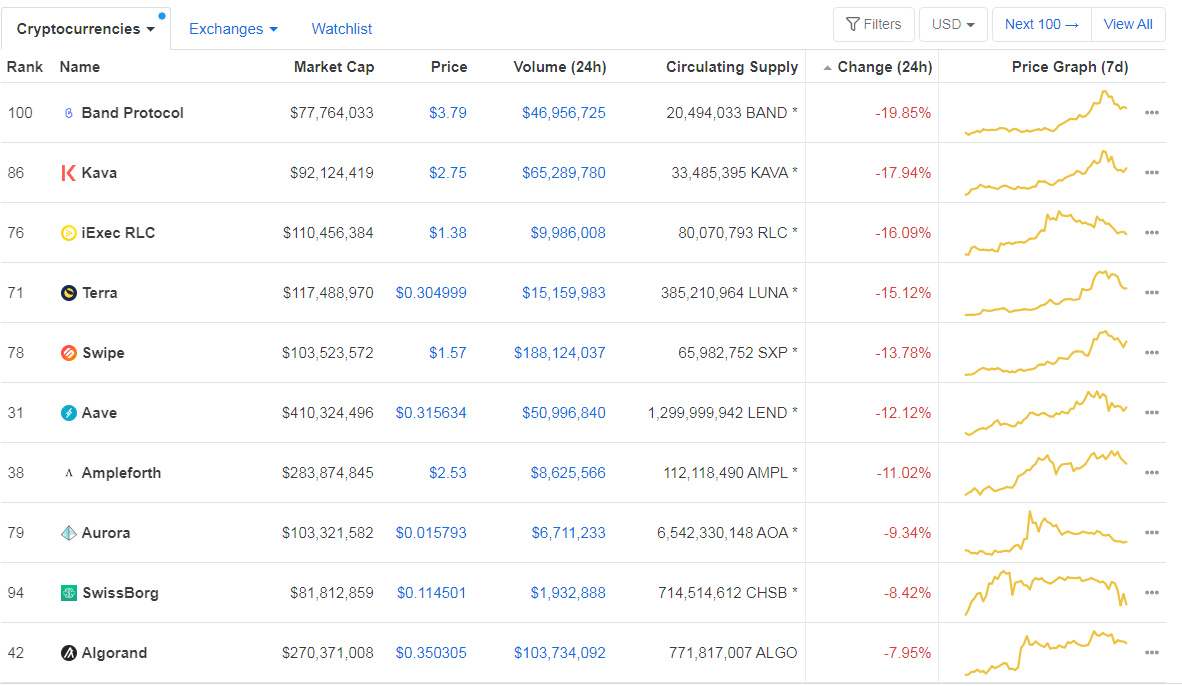
If we look at the top100 cryptocurrencies, |Uniswap gained an astonishing 112.59 % on the day, making it the most prominent daily gainer. ABBC Coin (28.18%) and SushiSwap (21.75%) also did great. On the other hand, Hyperion lost 19.78%, making it the most prominent daily loser. It is followed by Flexacoin’s loss of 12.93% and Celo’s loss of 11.74%.
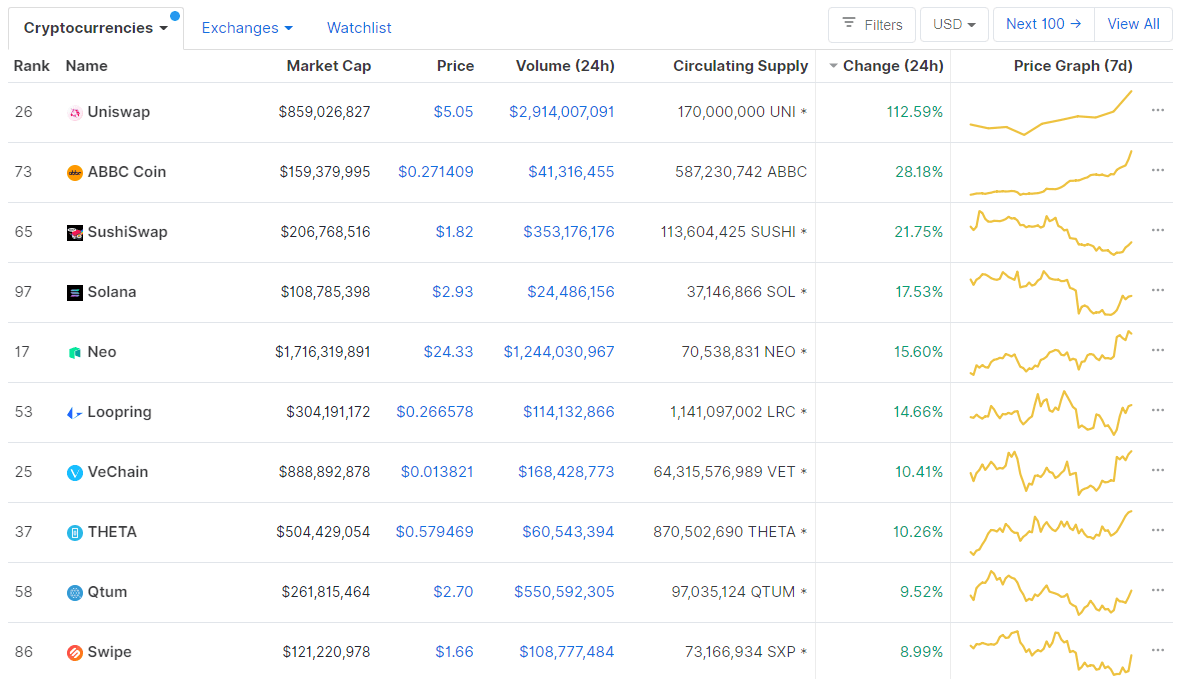
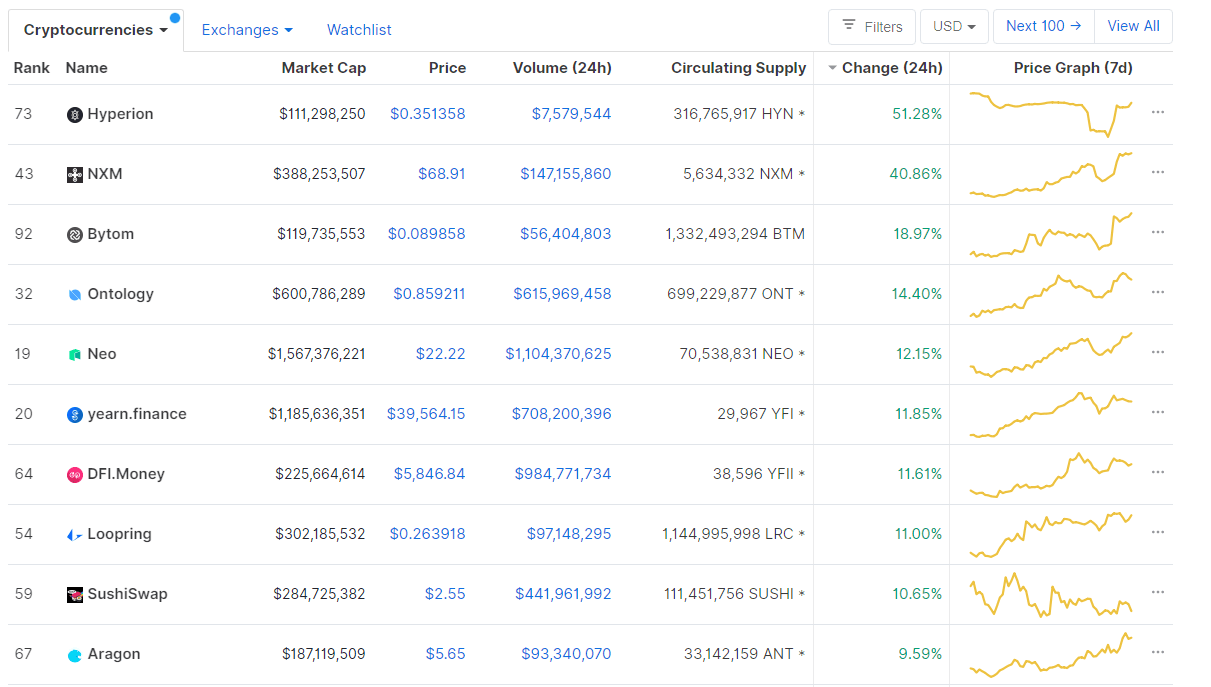
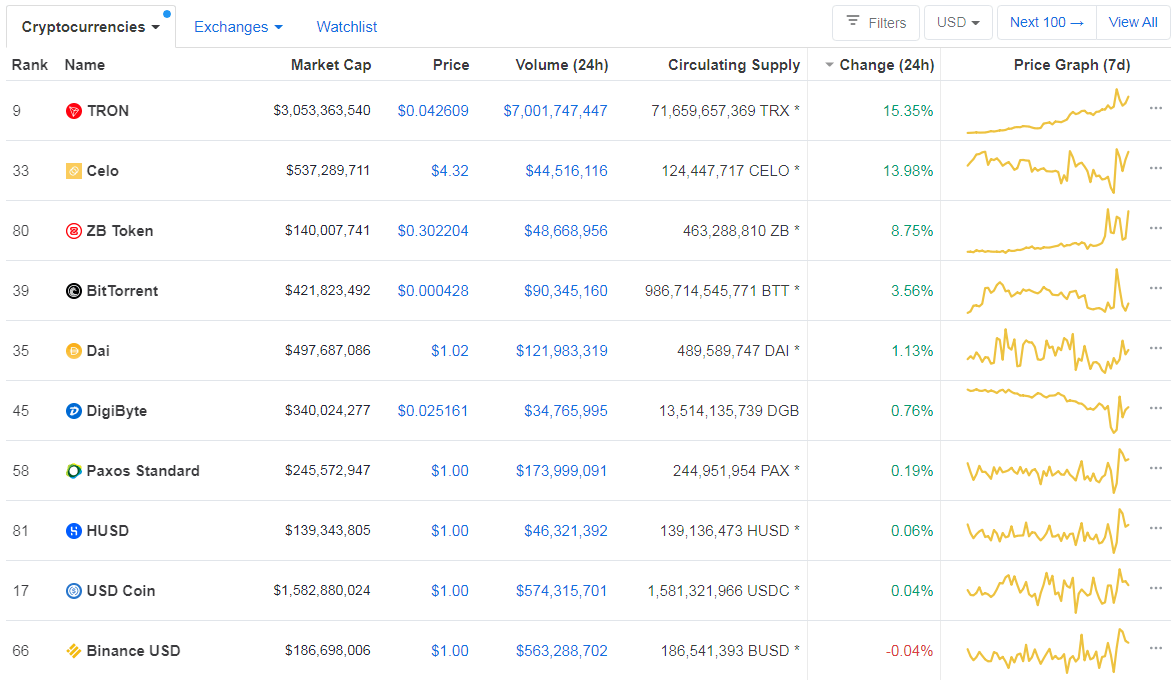
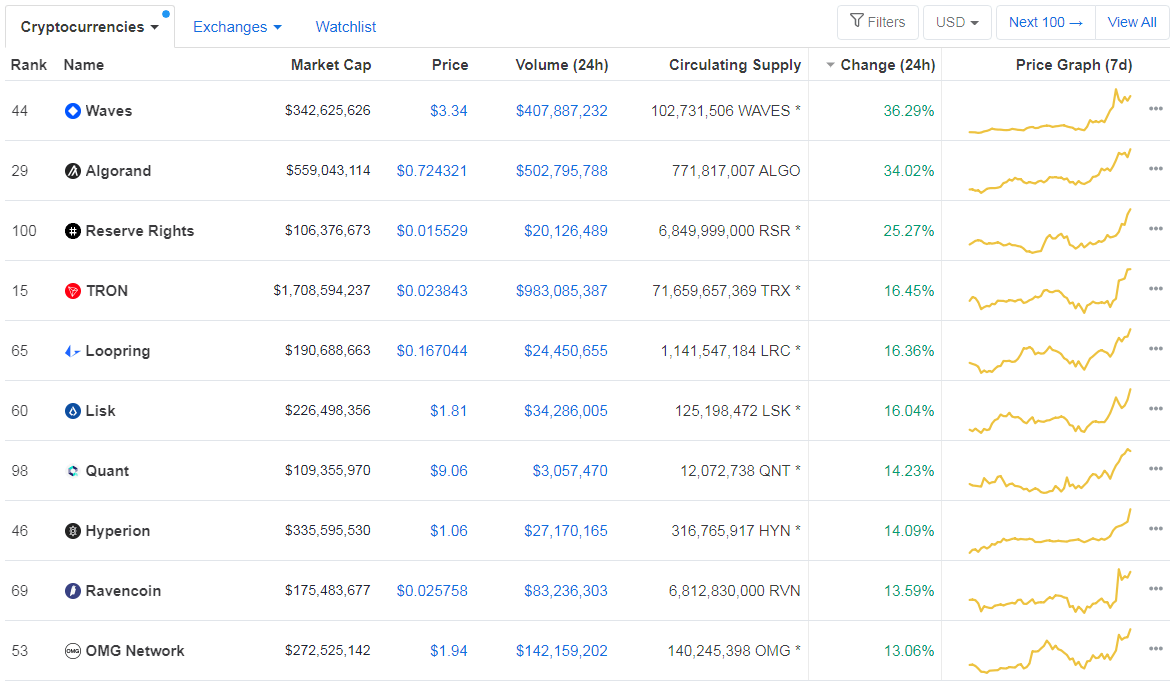
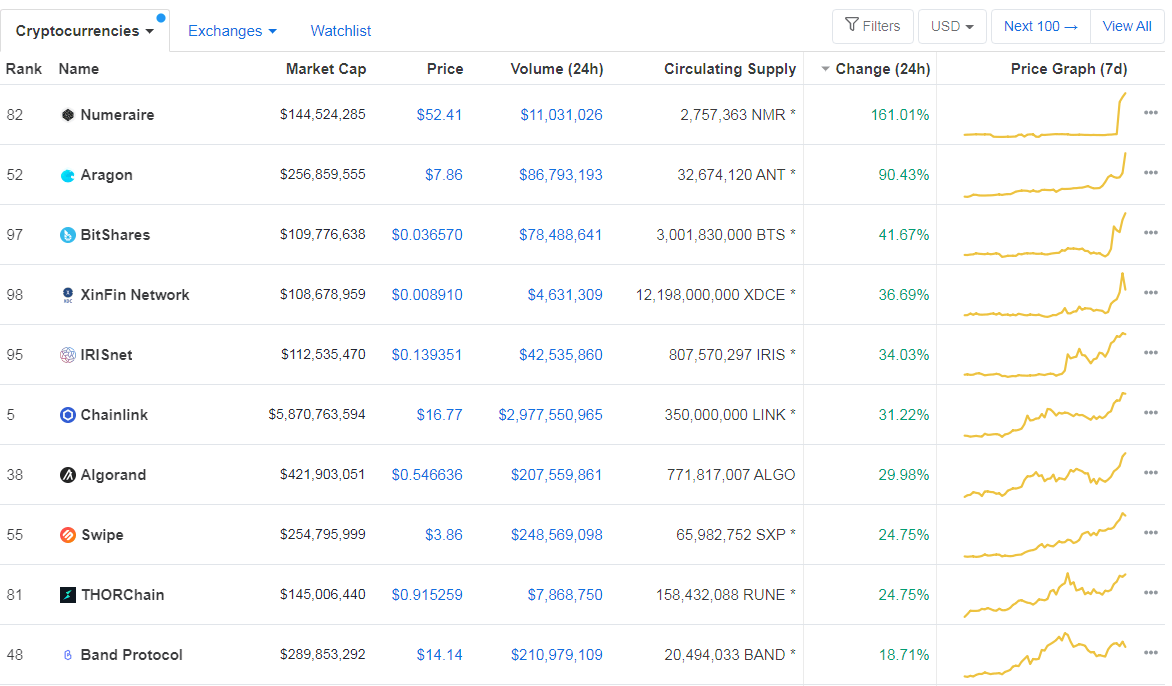
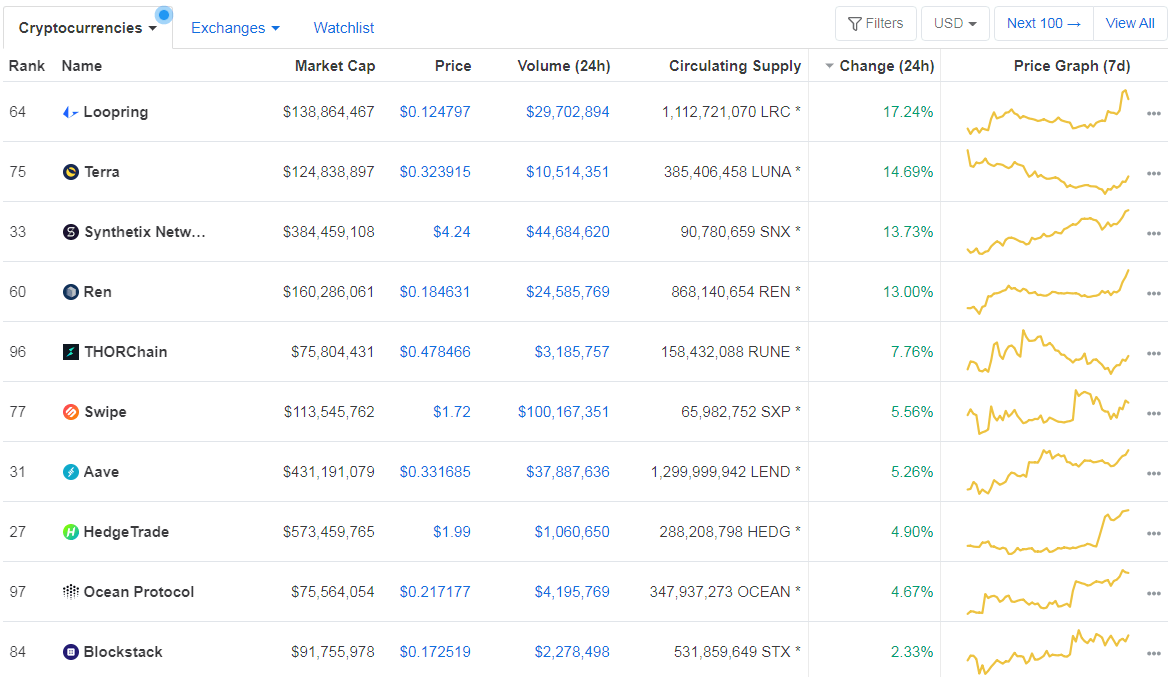
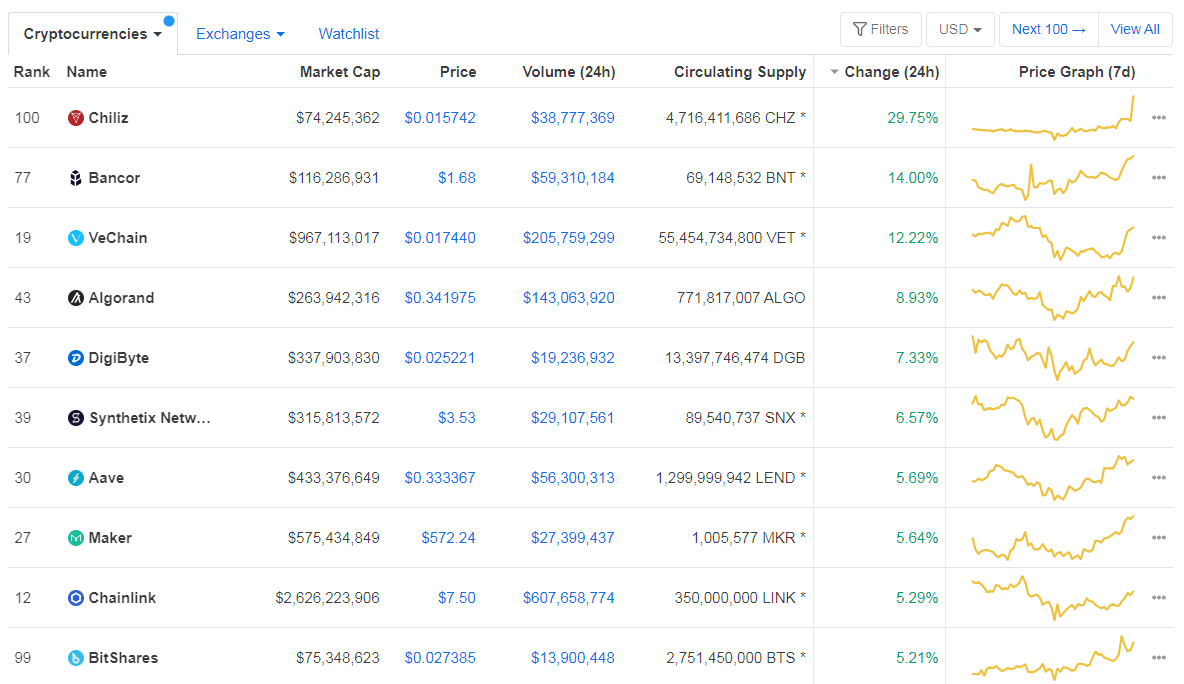
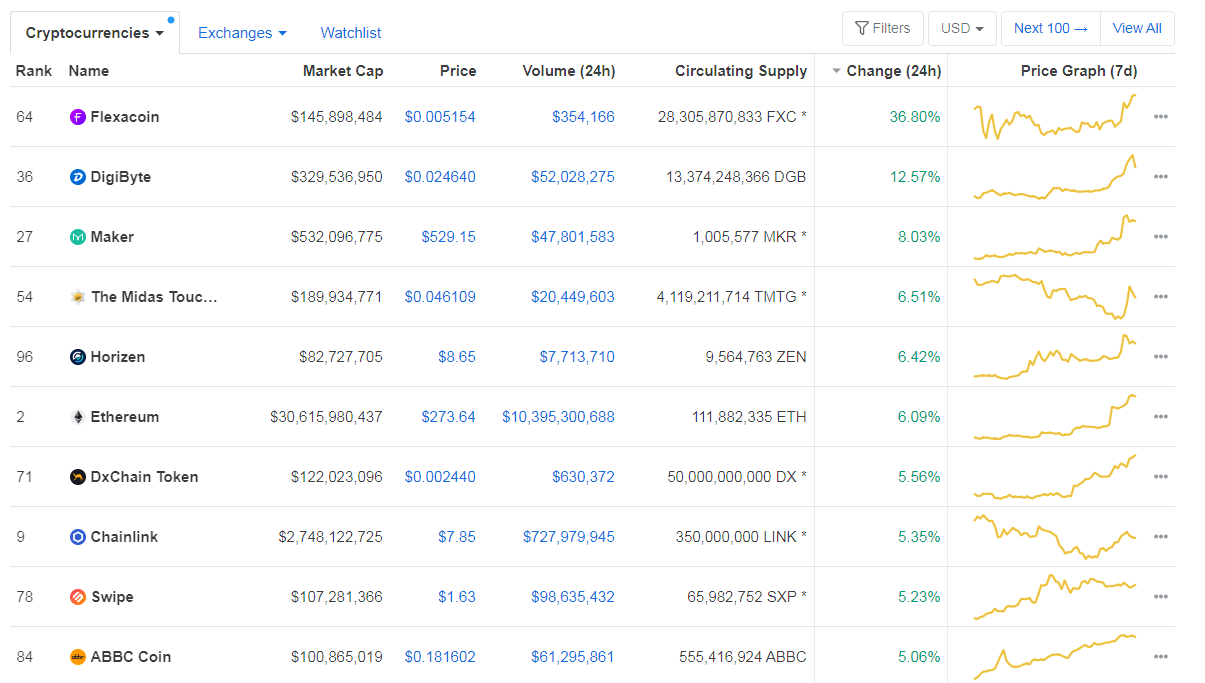
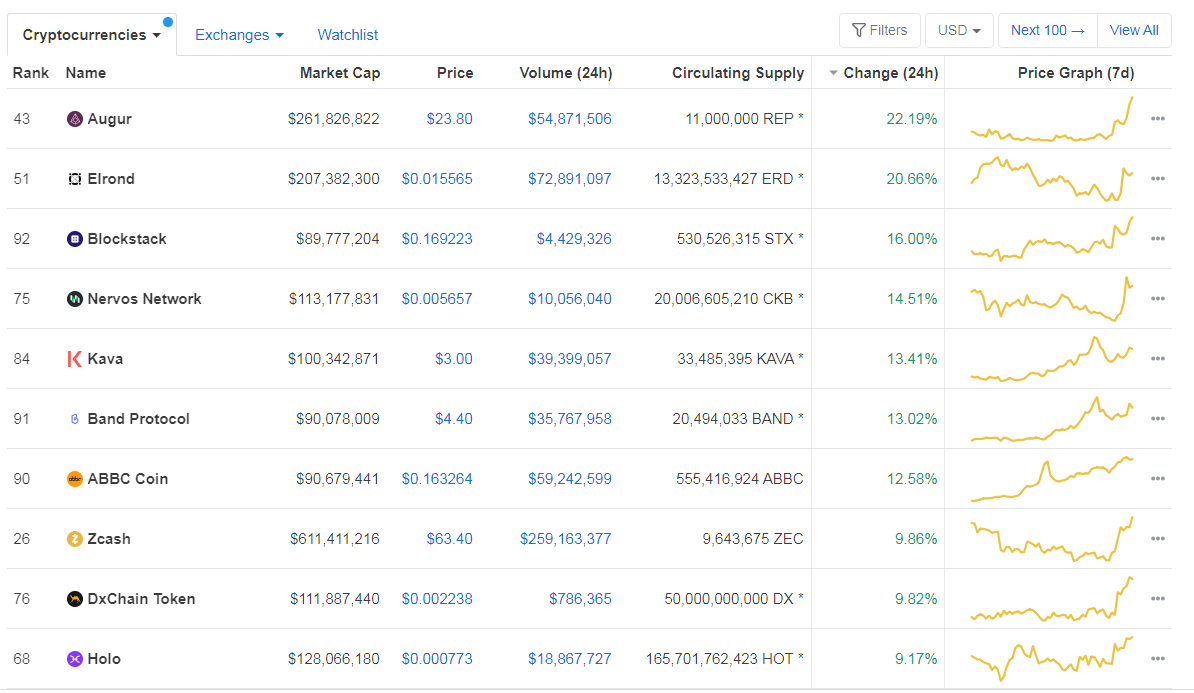
Top 10 24-hour Performers (Click to enlarge)
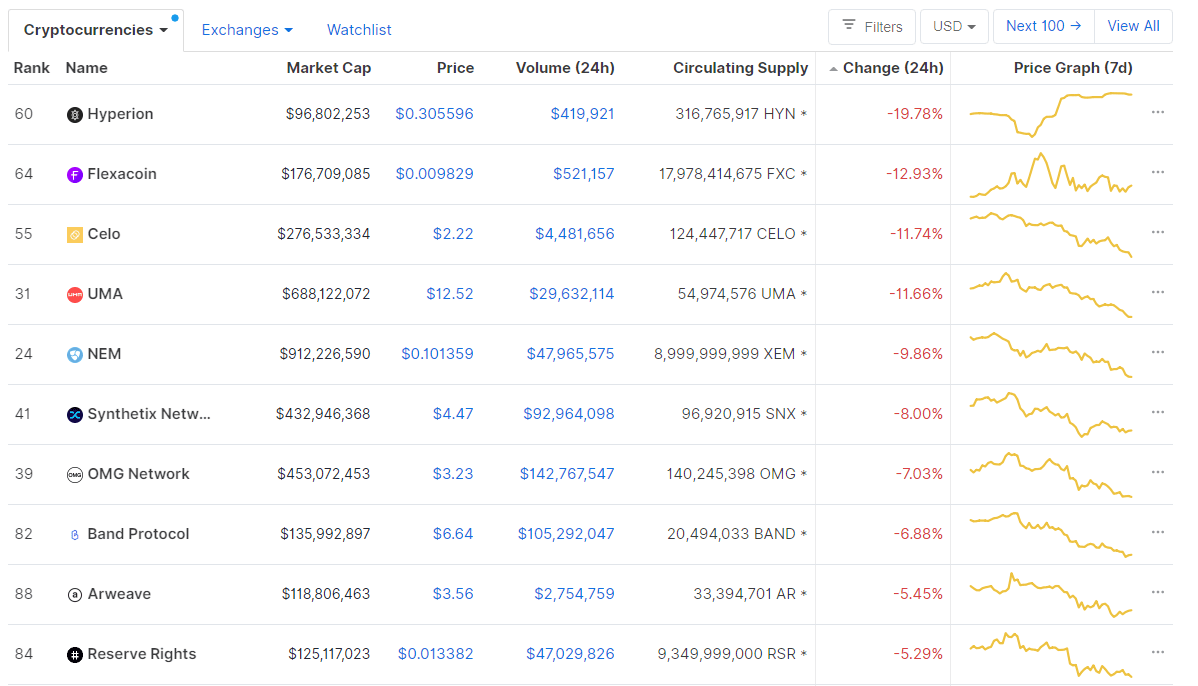
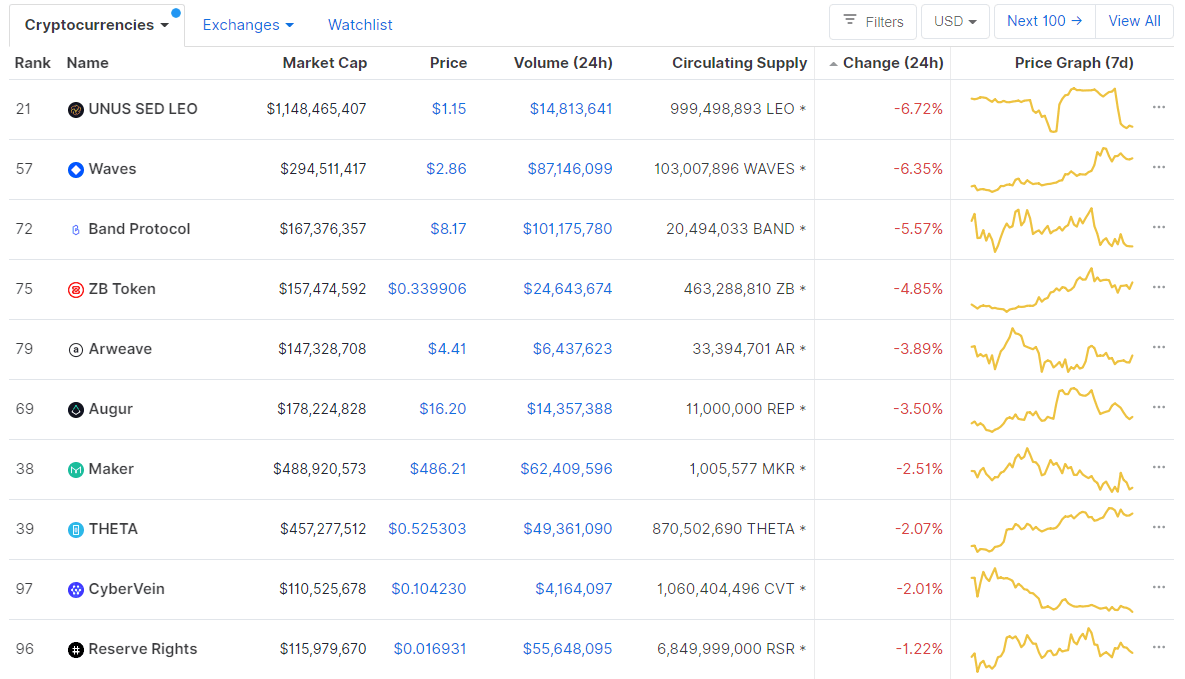
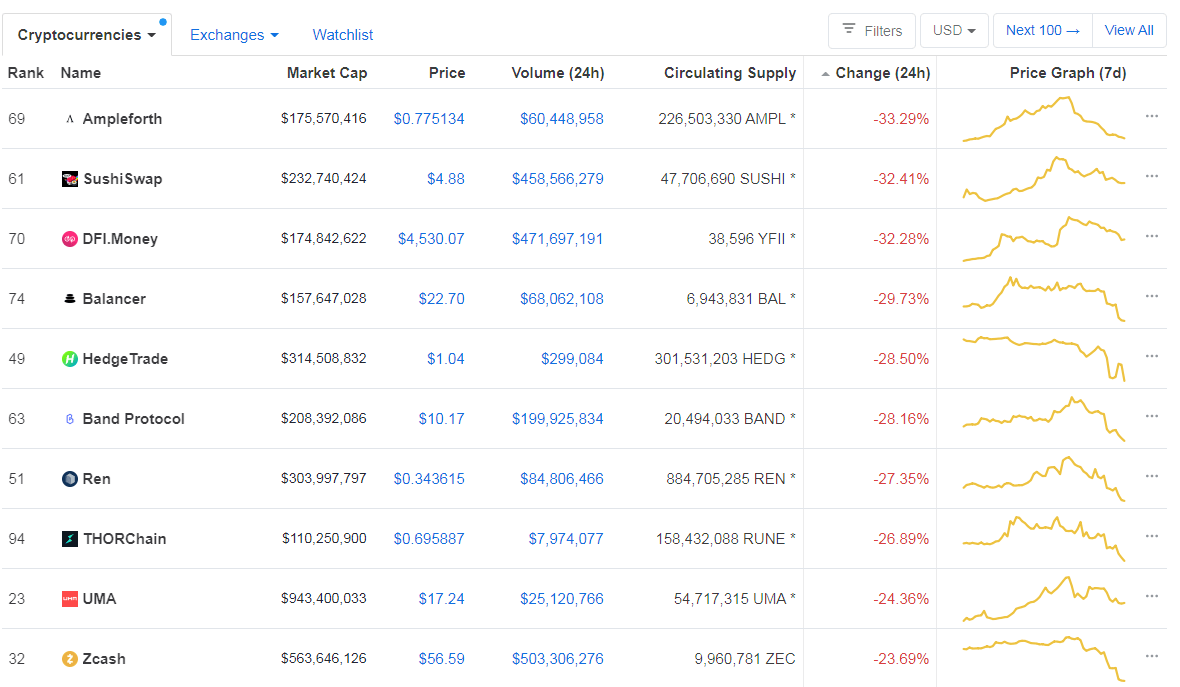
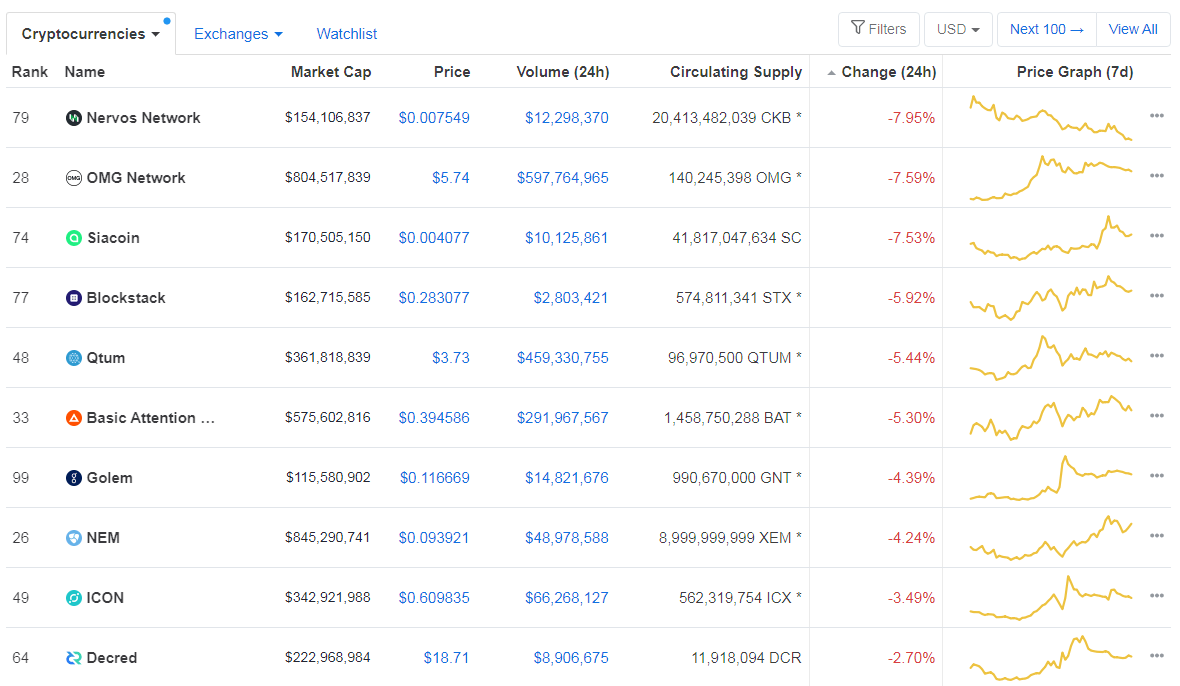
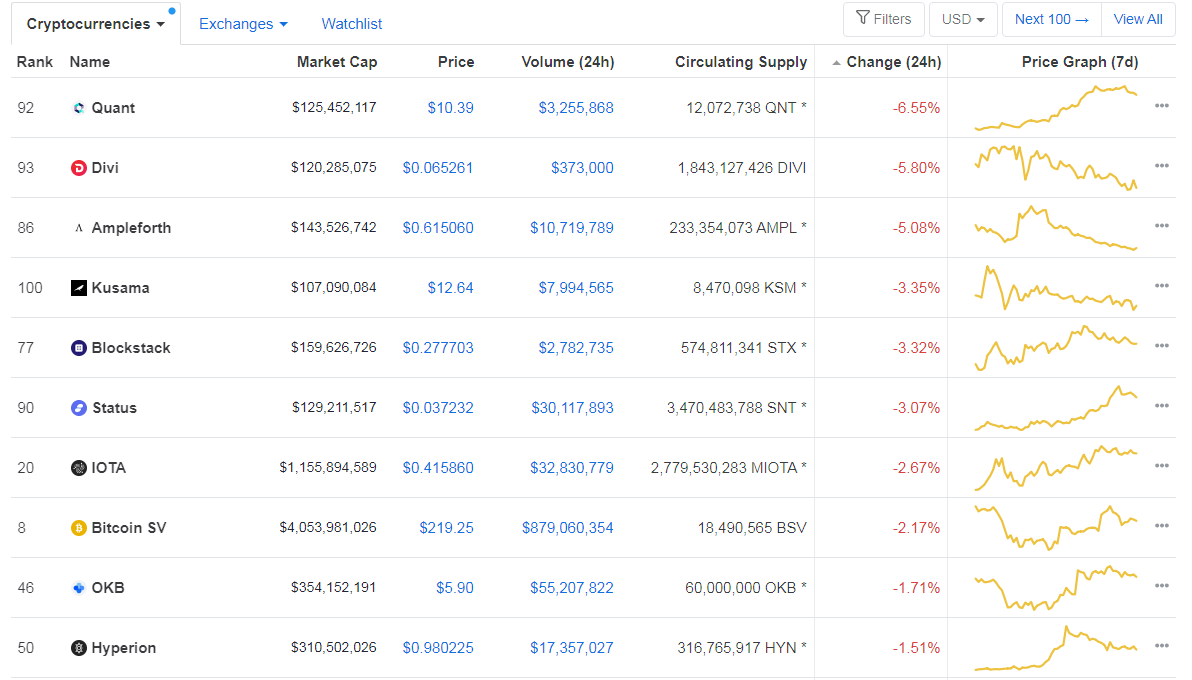
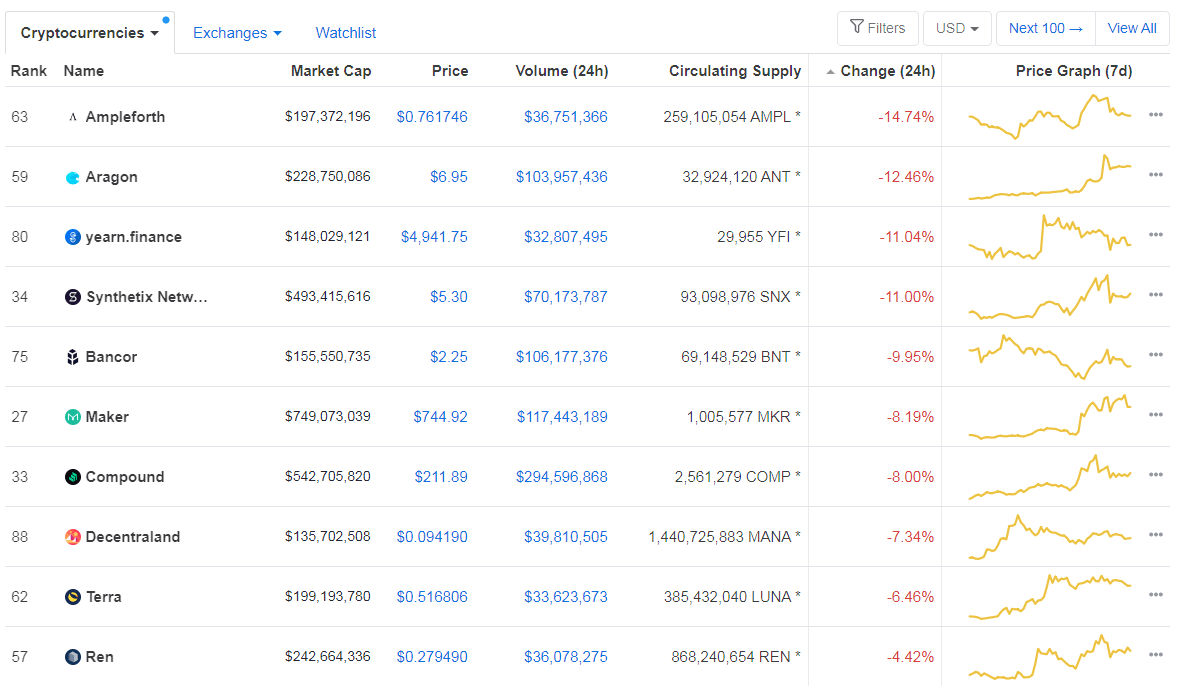
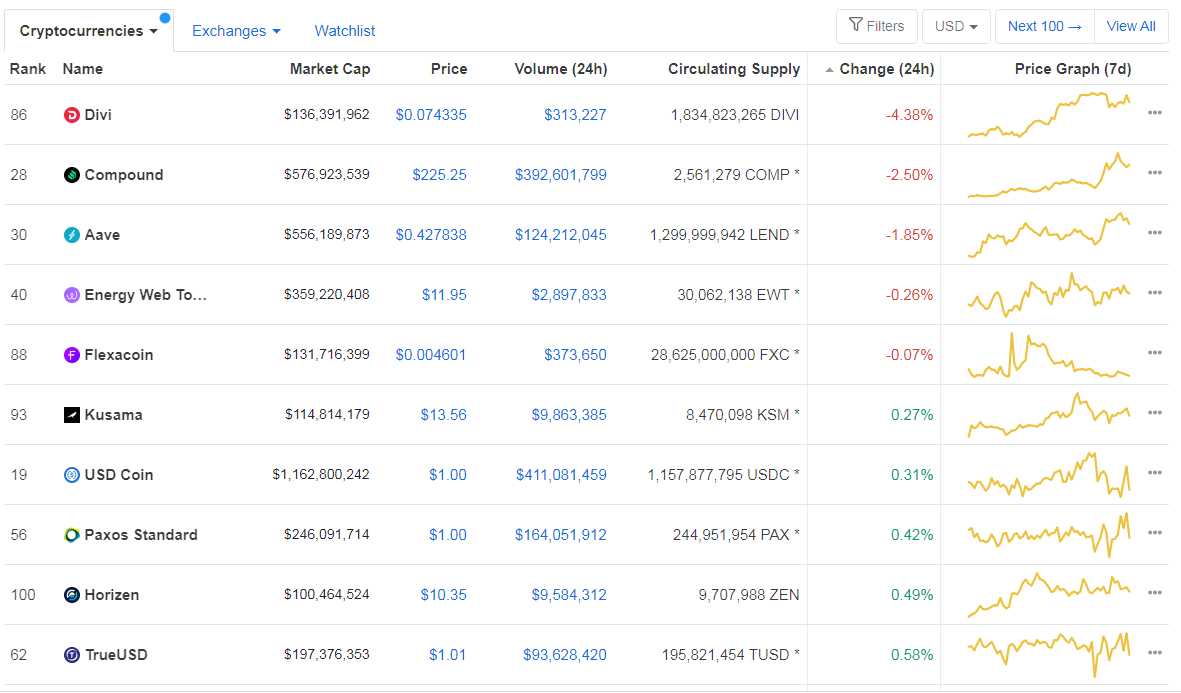
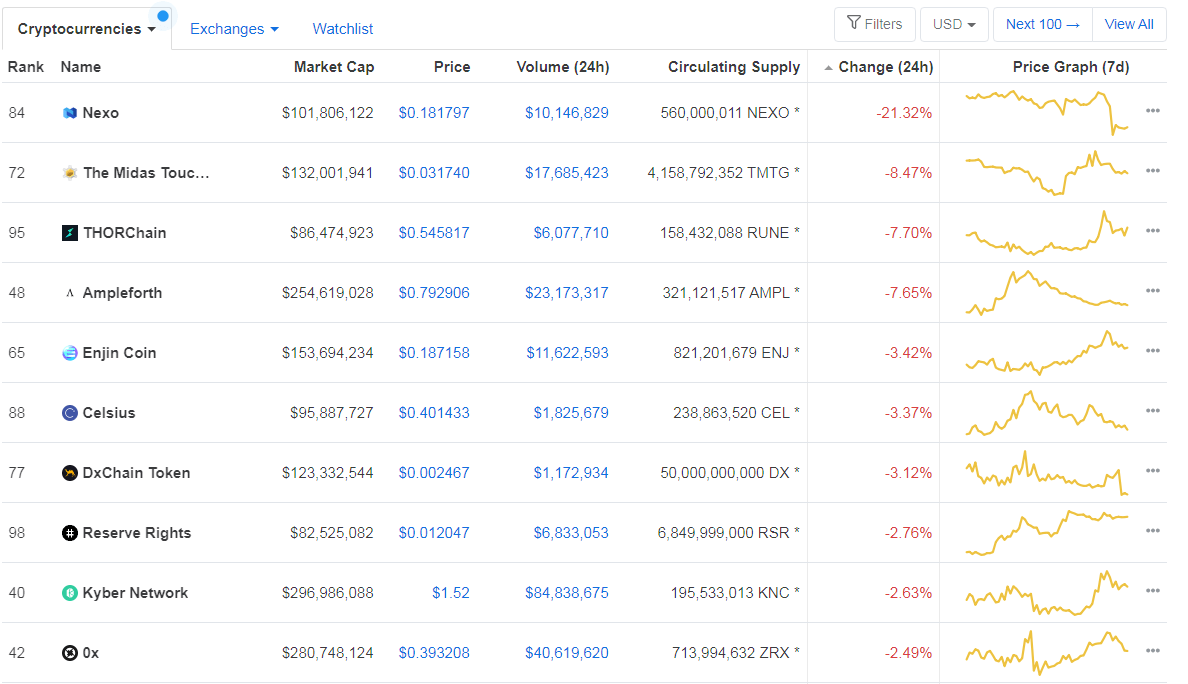
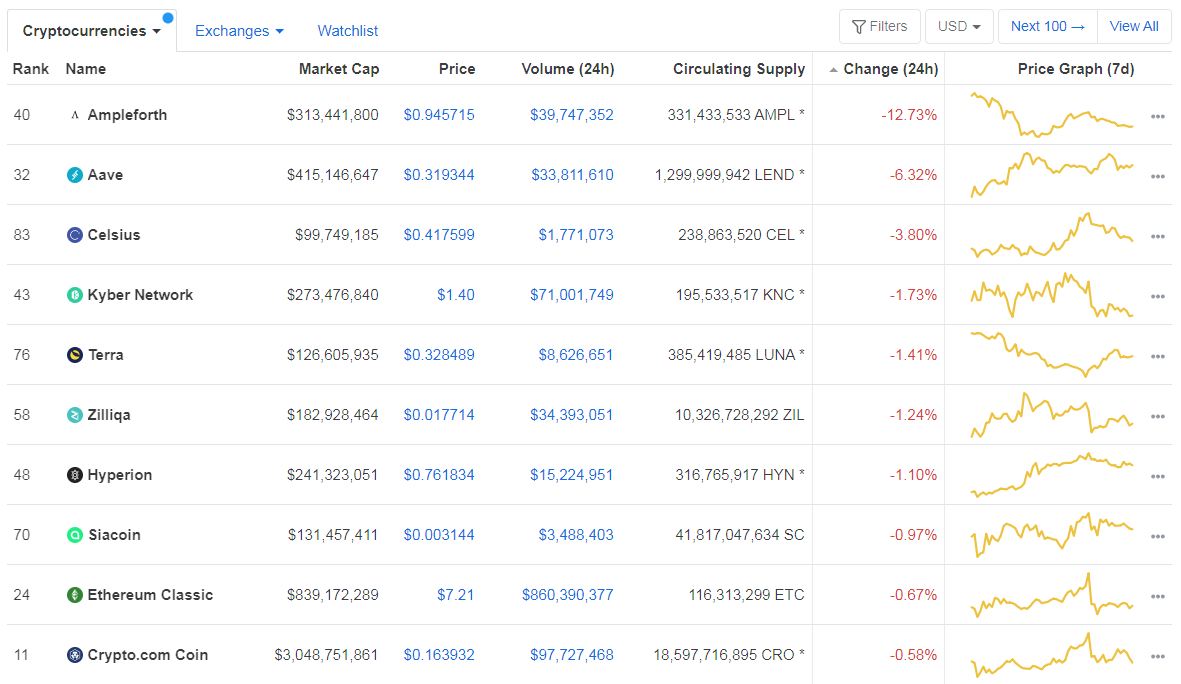
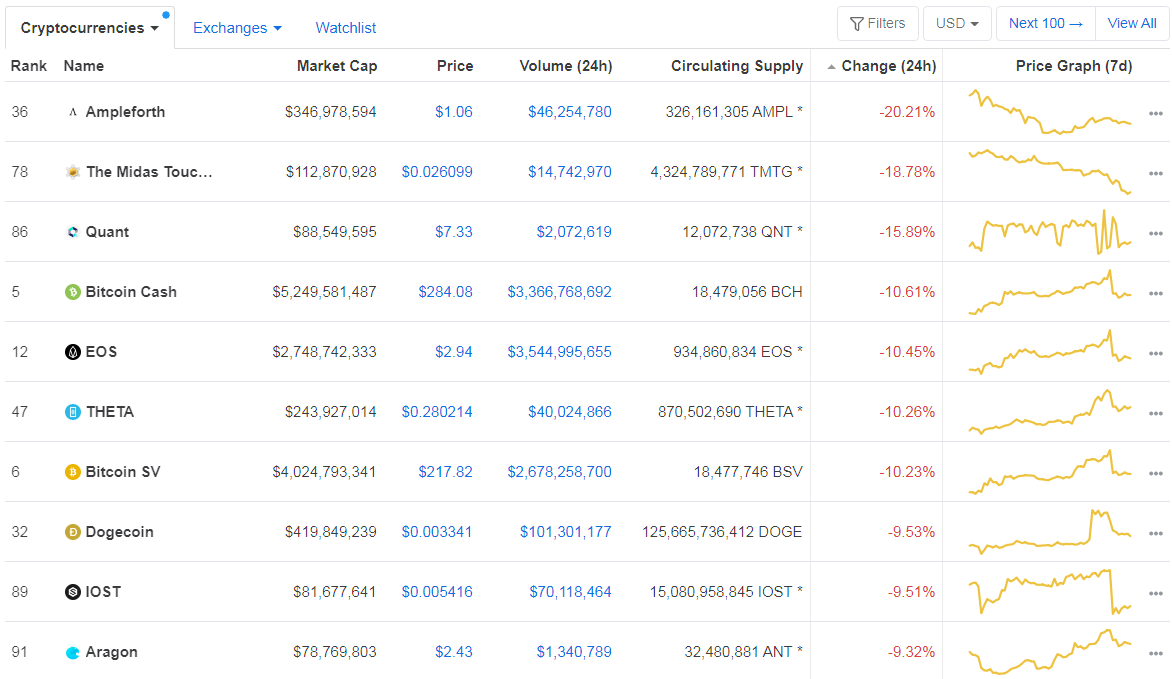
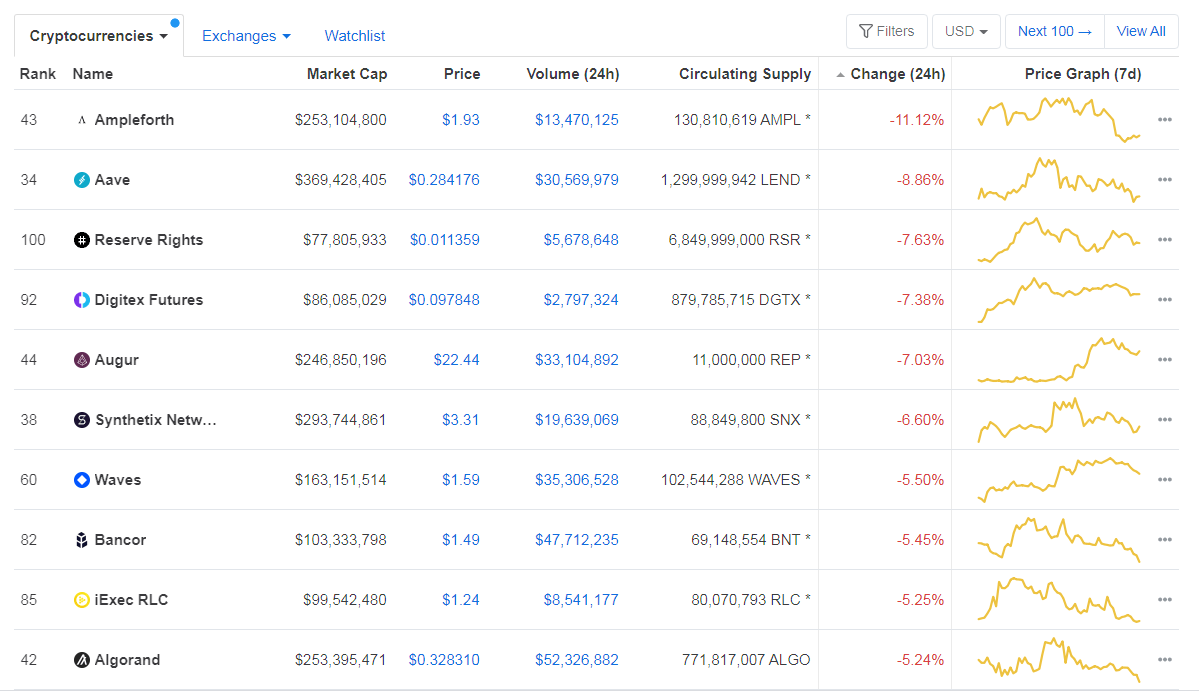
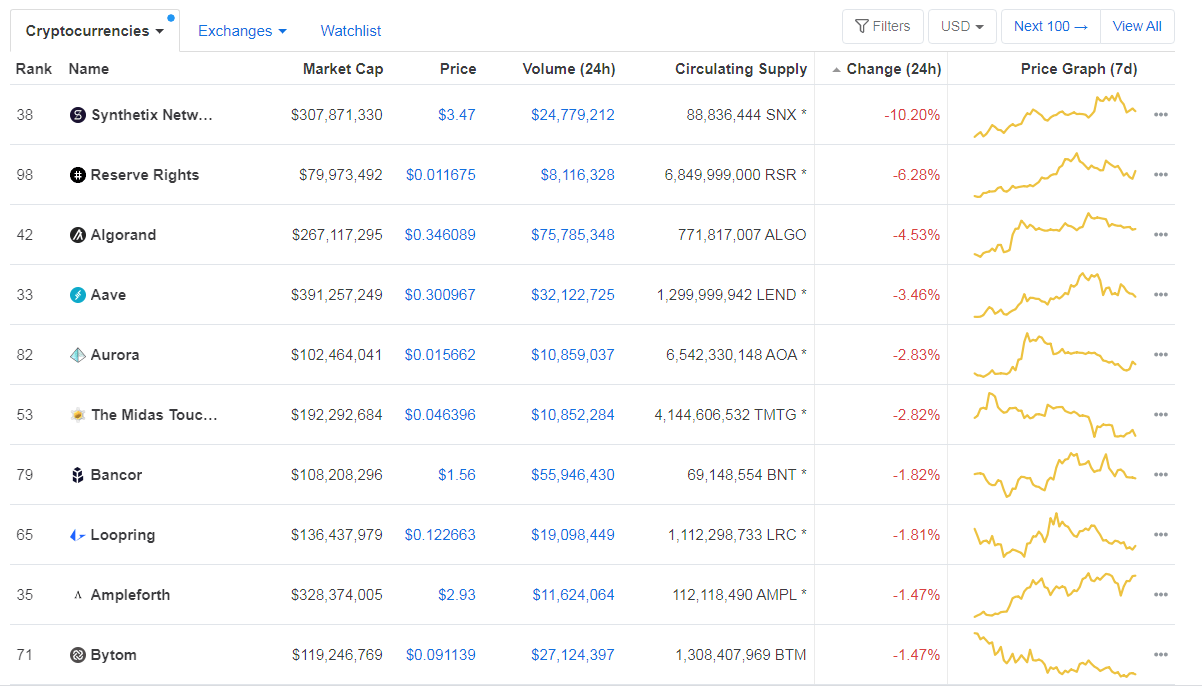
Bottom 10 24-hour Performers (Click to enlarge)
Bitcoin’s dominance level experienced a slight decrease since our last report, with its value currently being at 60.14%. This value represents a 0.16% difference to the downside when compared to when we last reported.
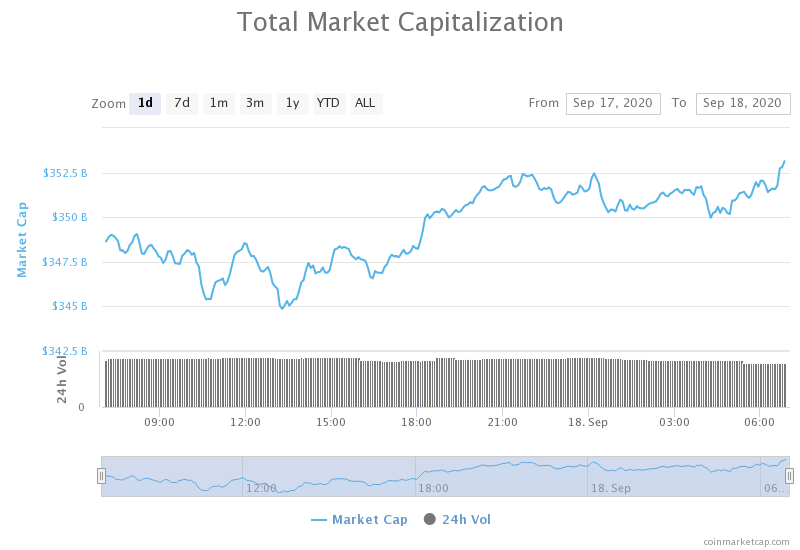
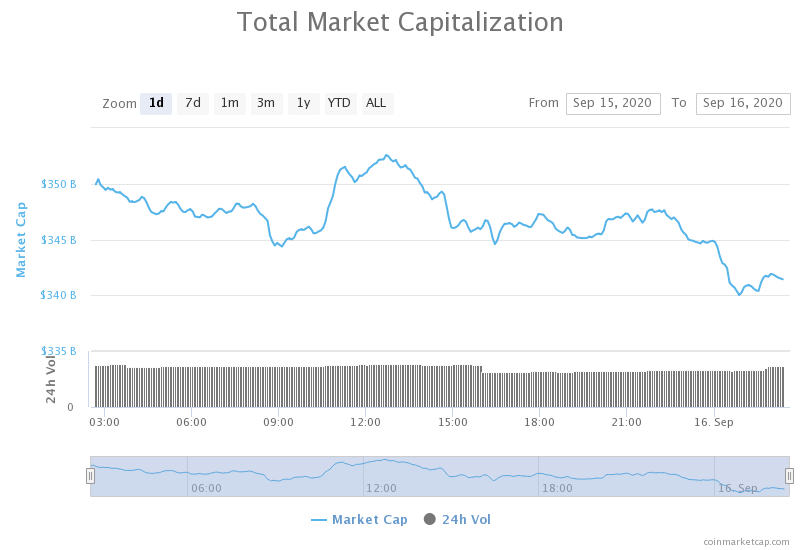
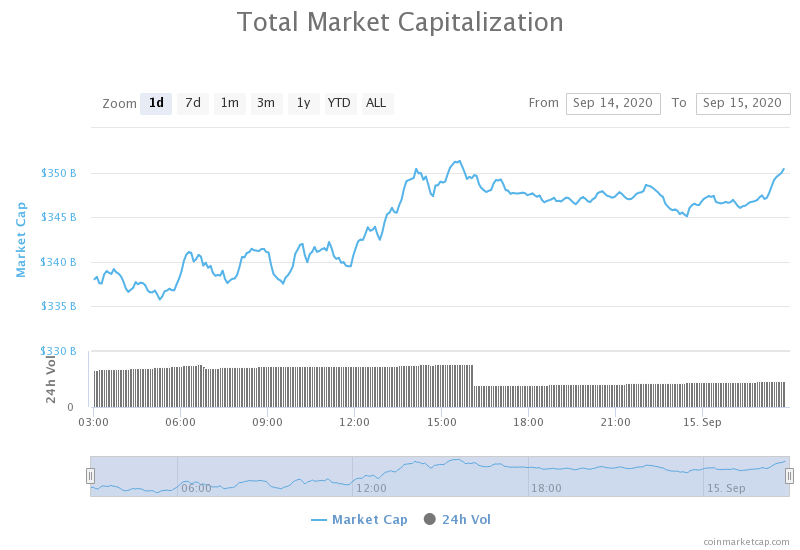
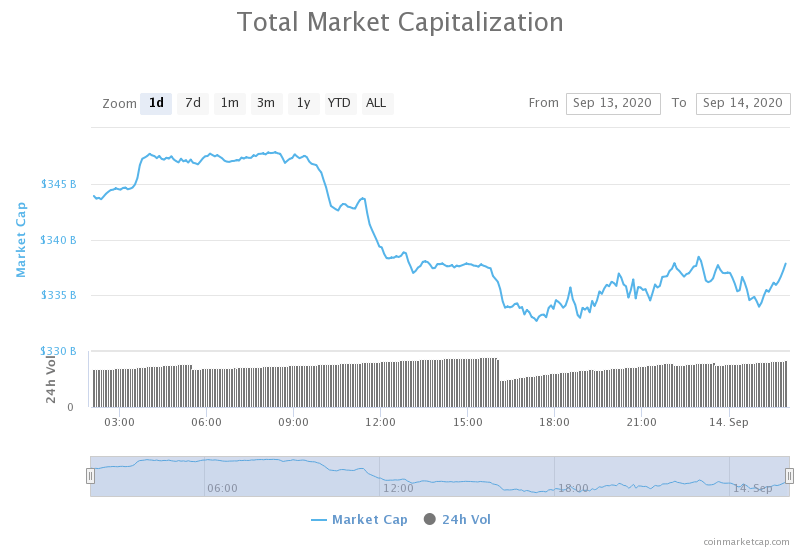
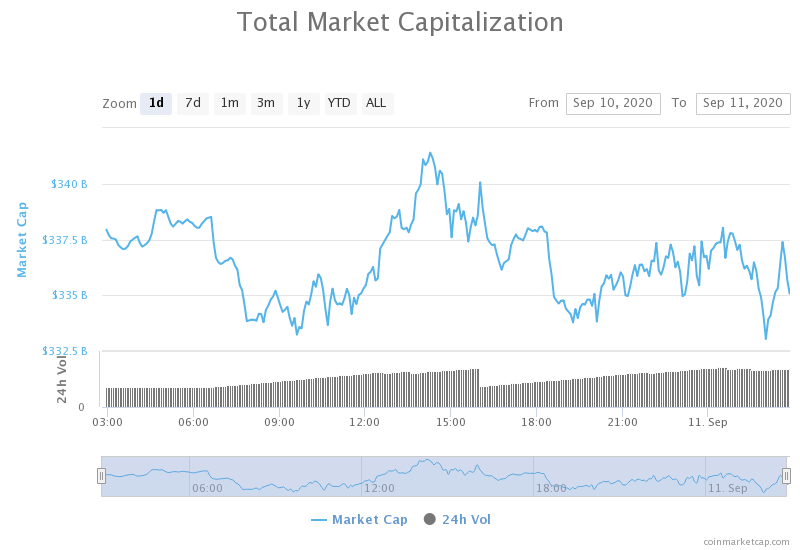
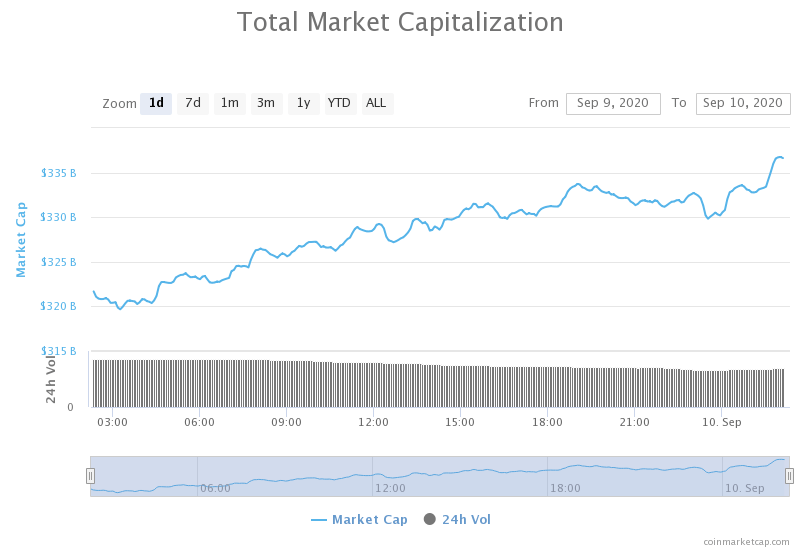
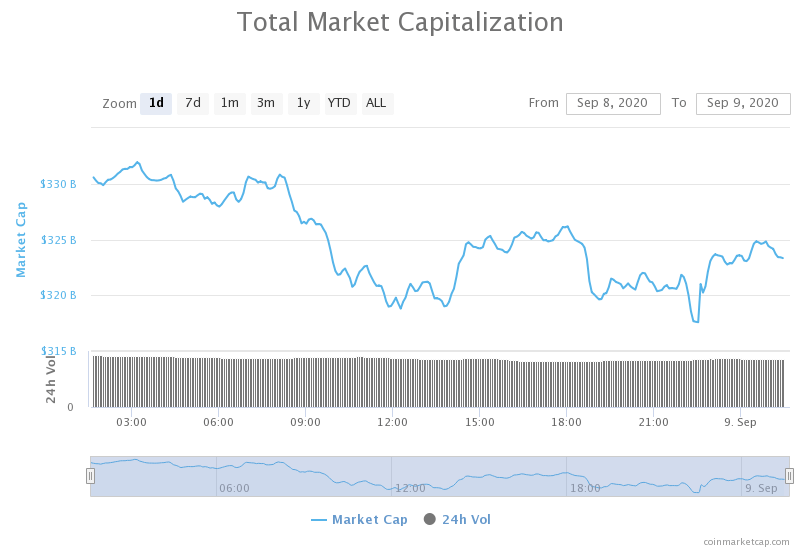
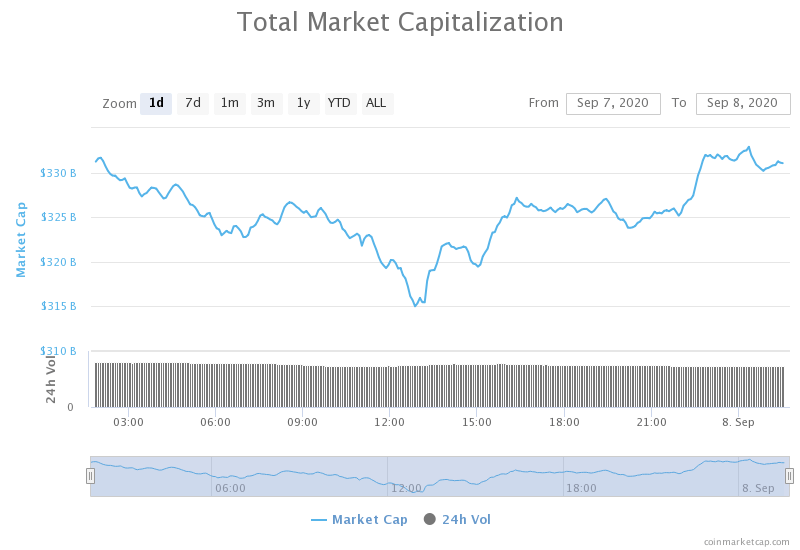
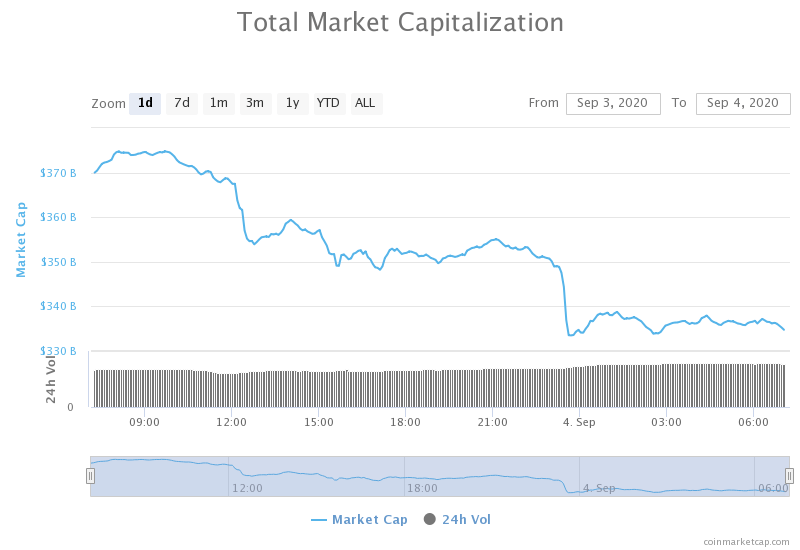
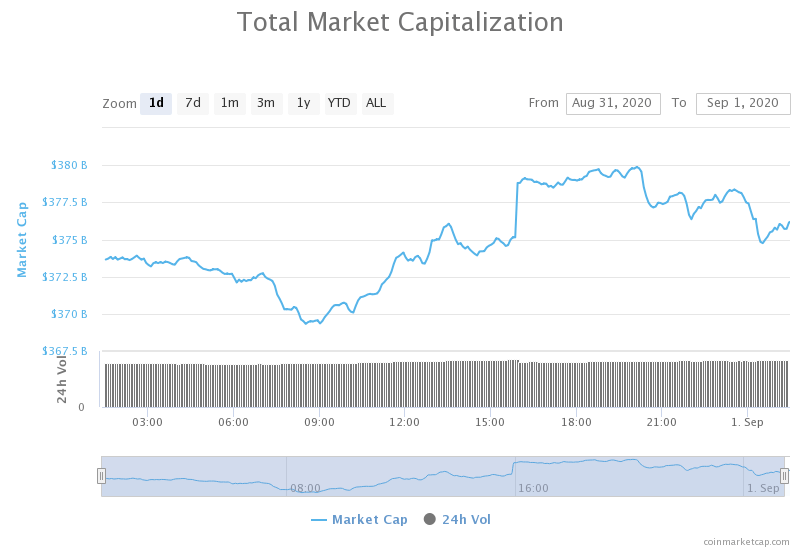
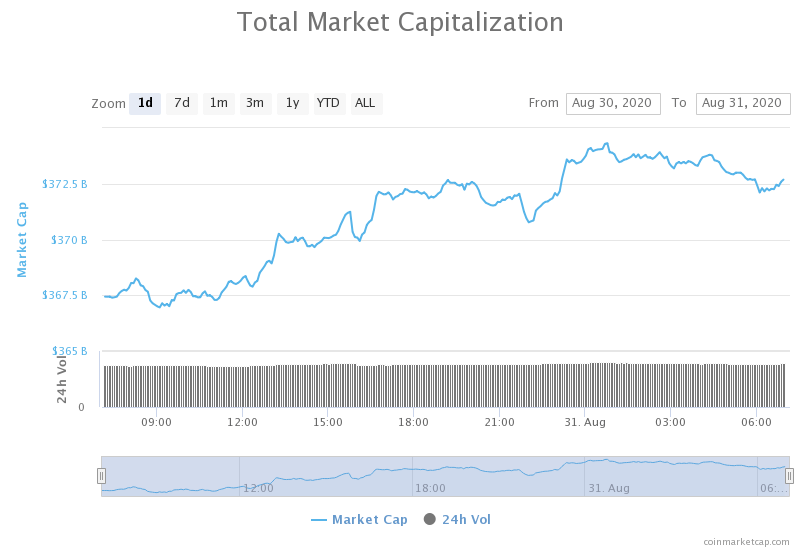
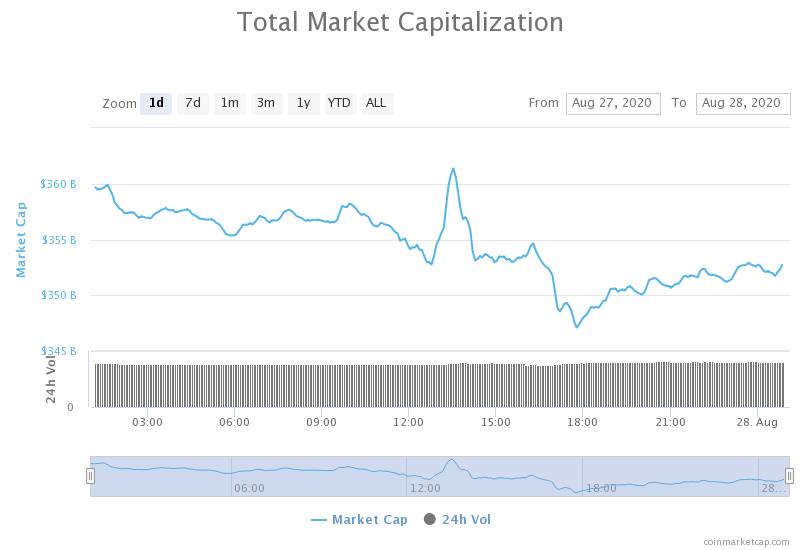
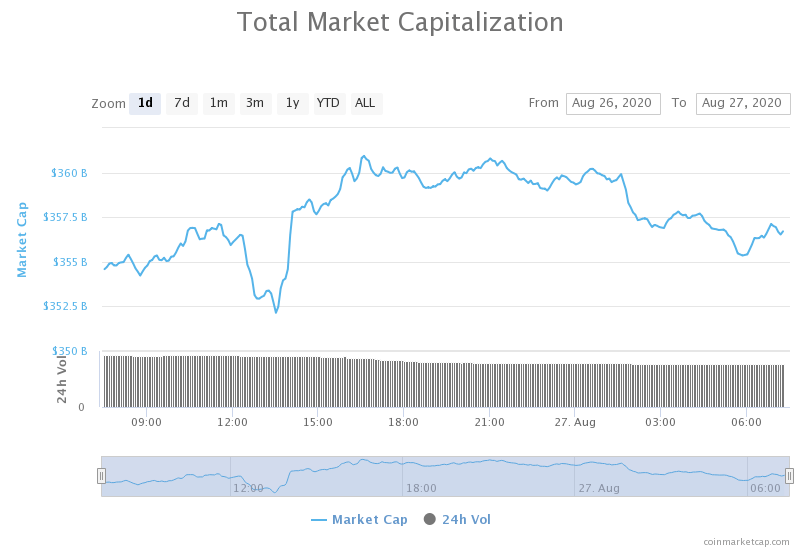
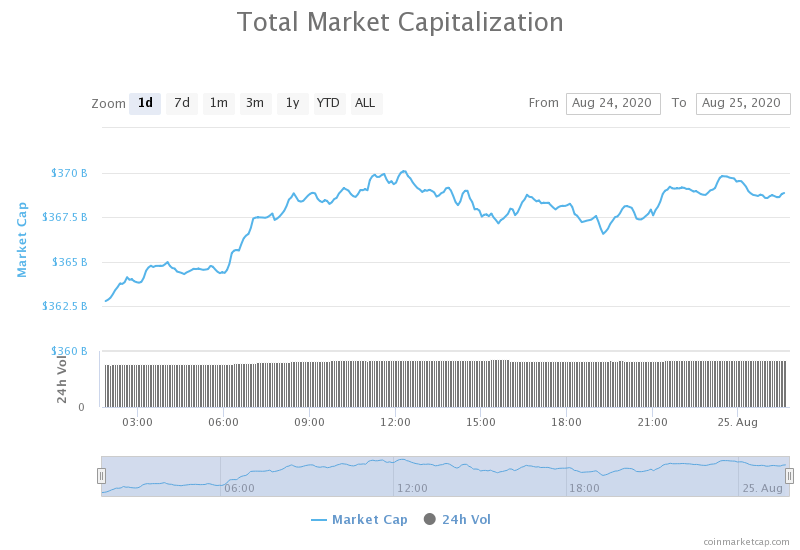
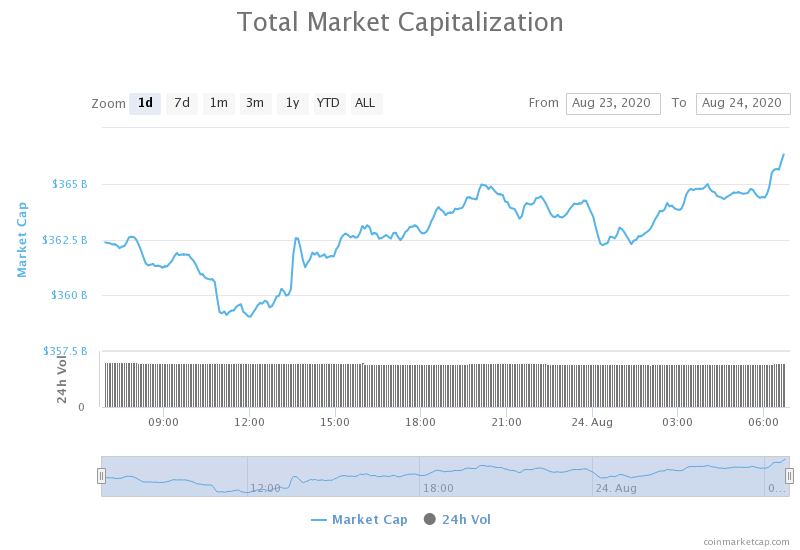
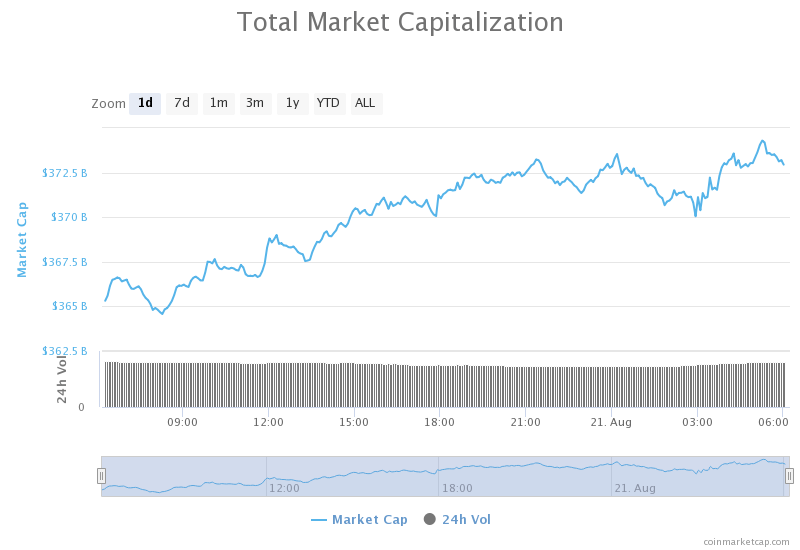
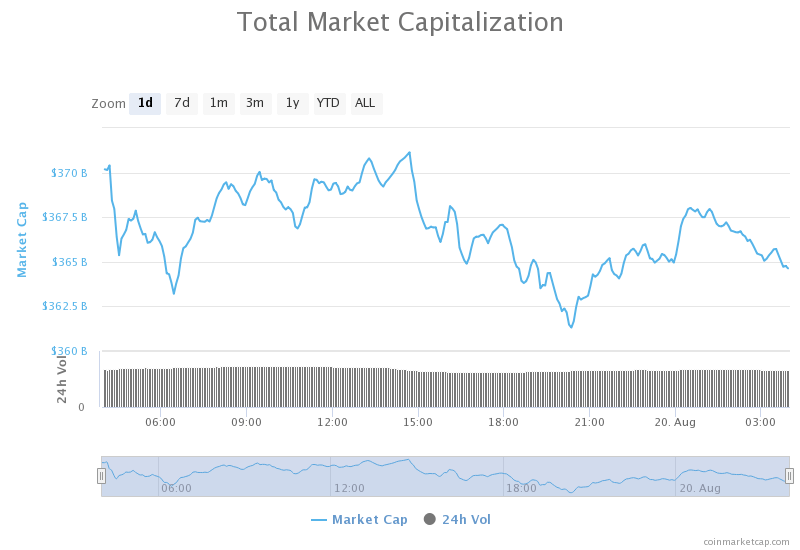
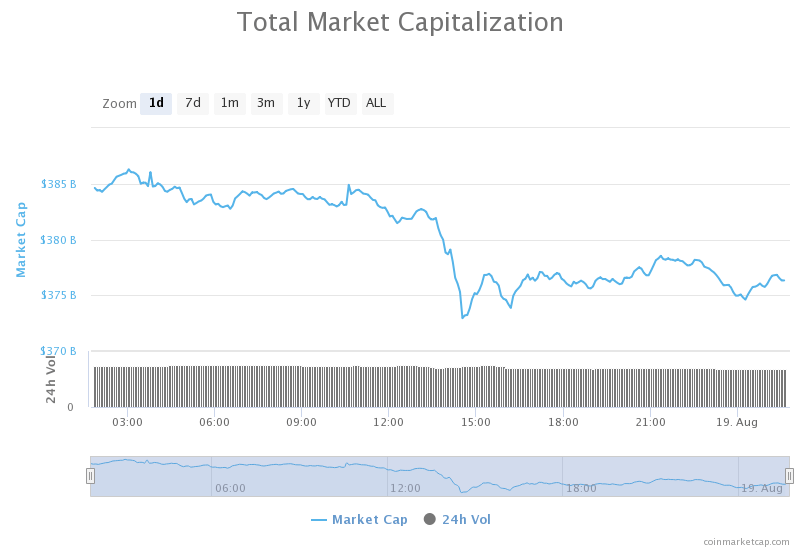
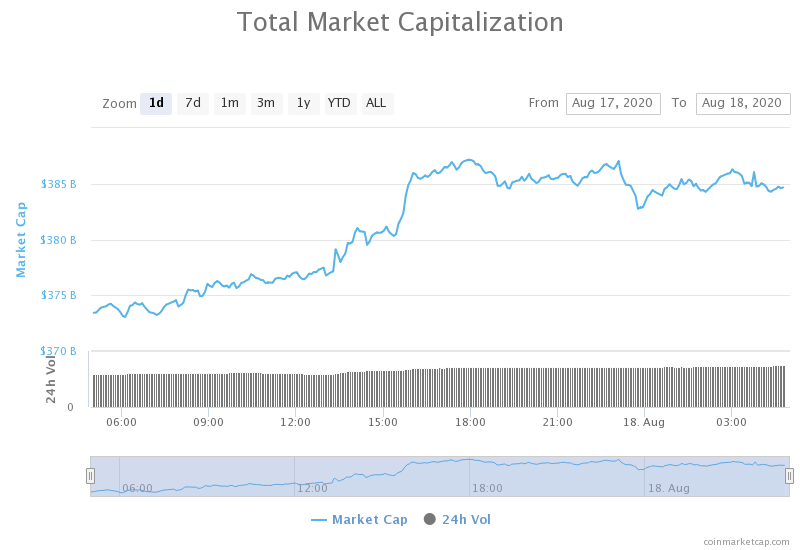
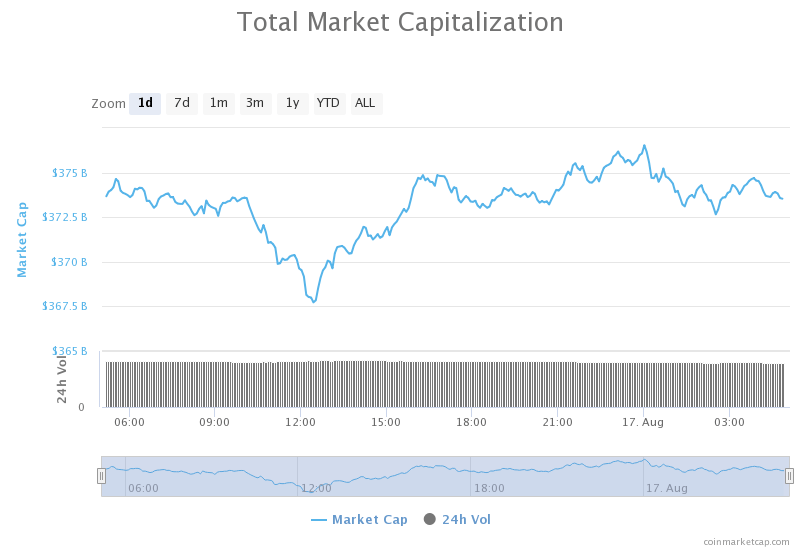
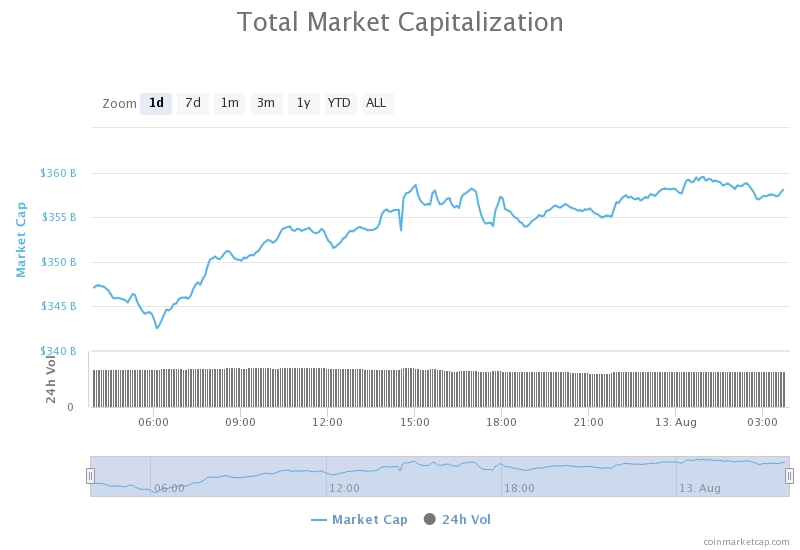
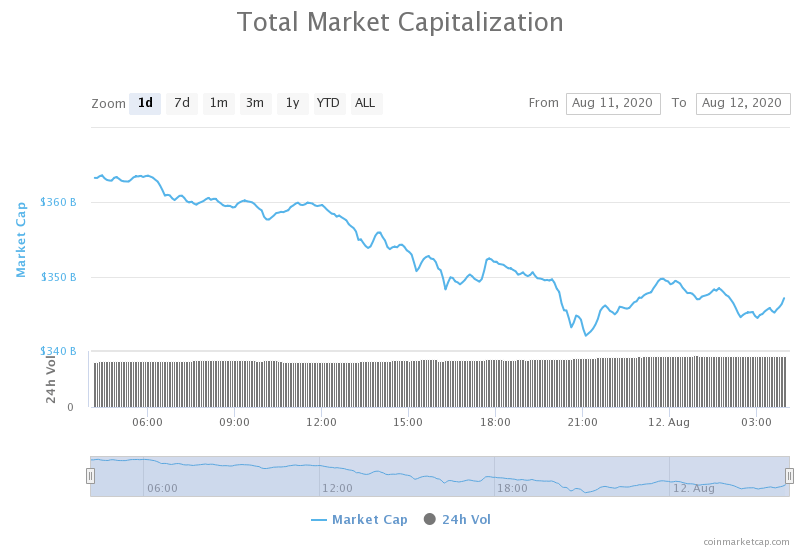
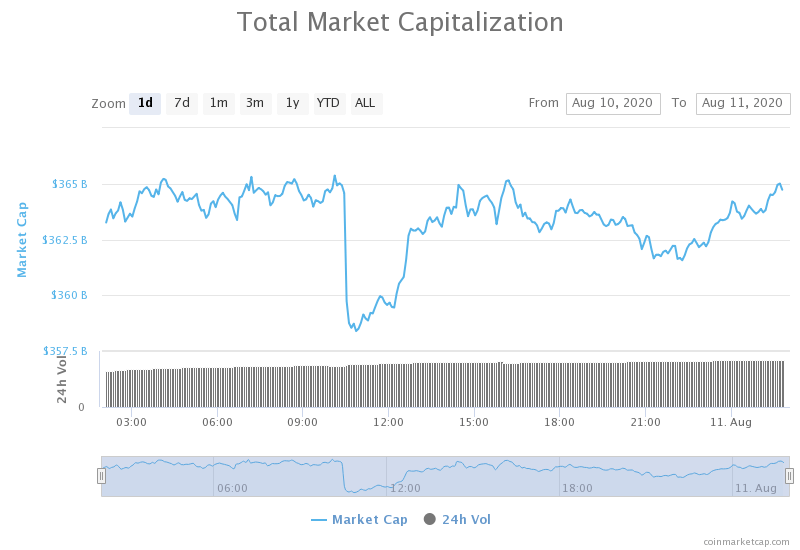
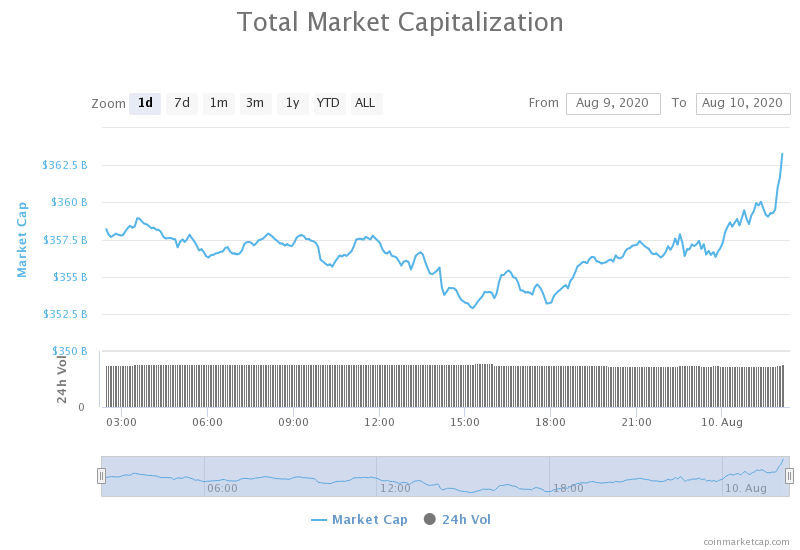
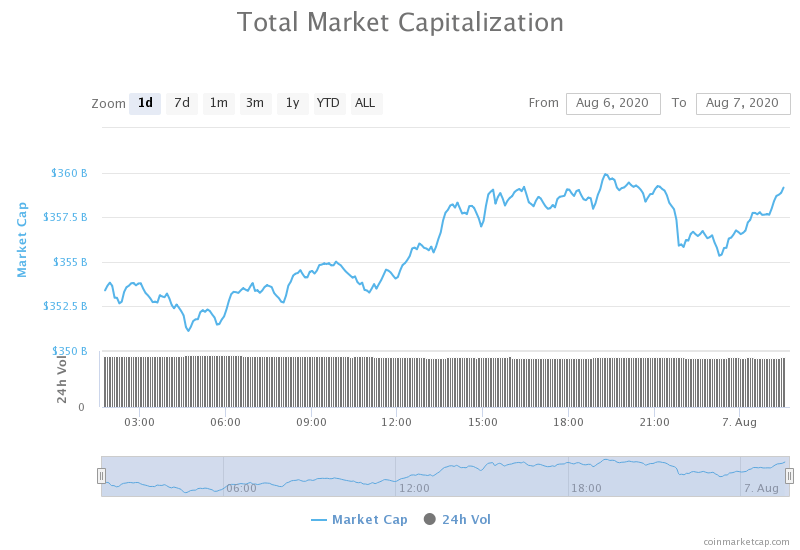
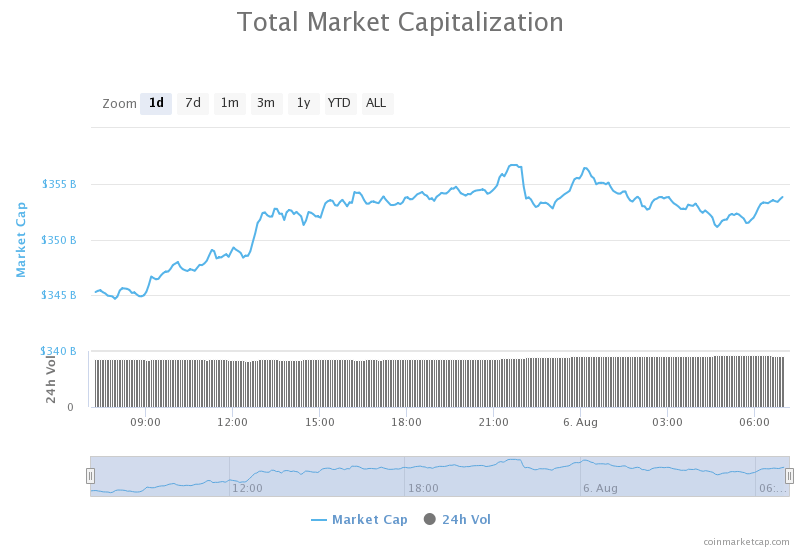
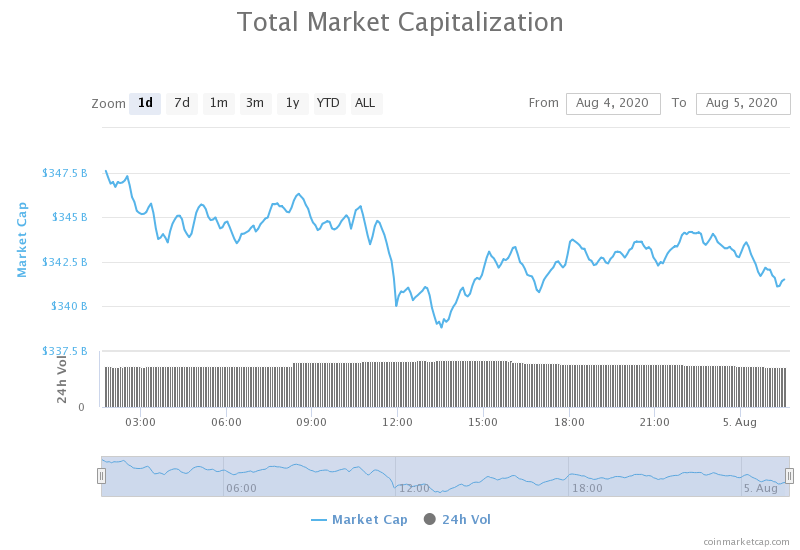
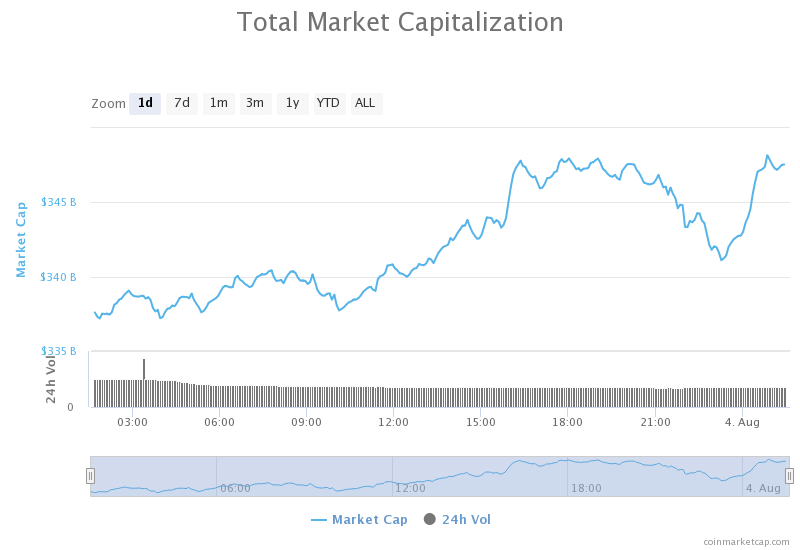
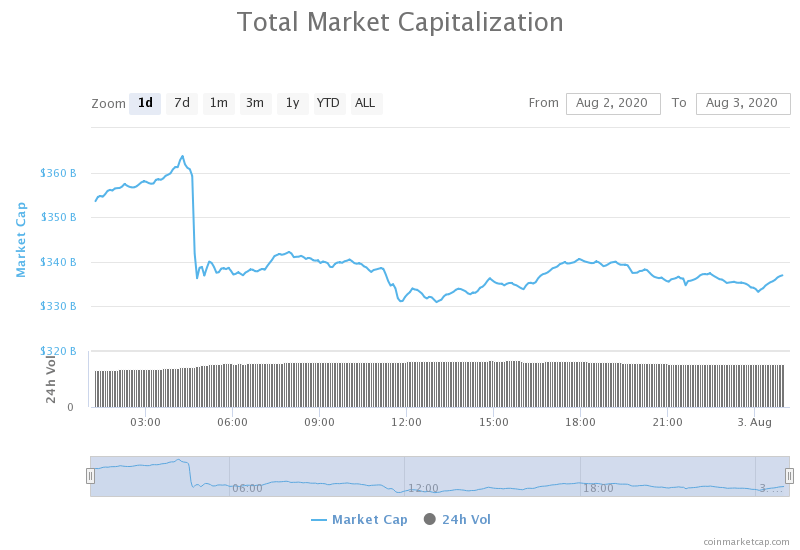
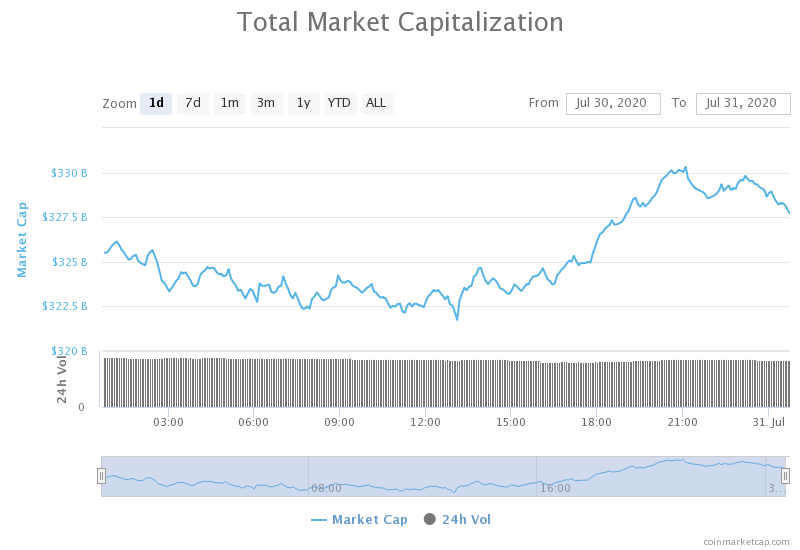
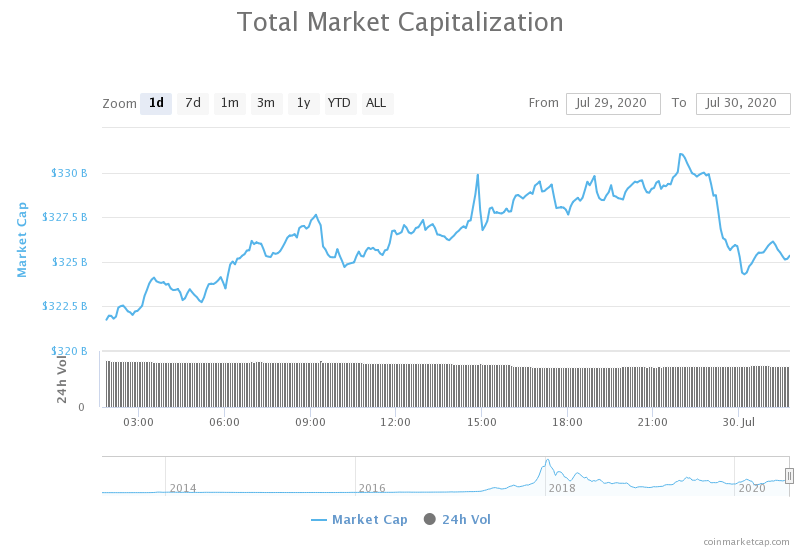
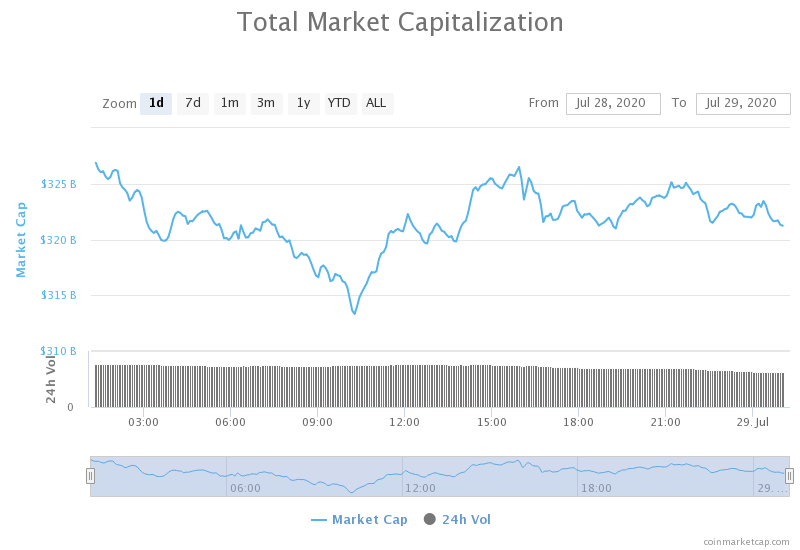
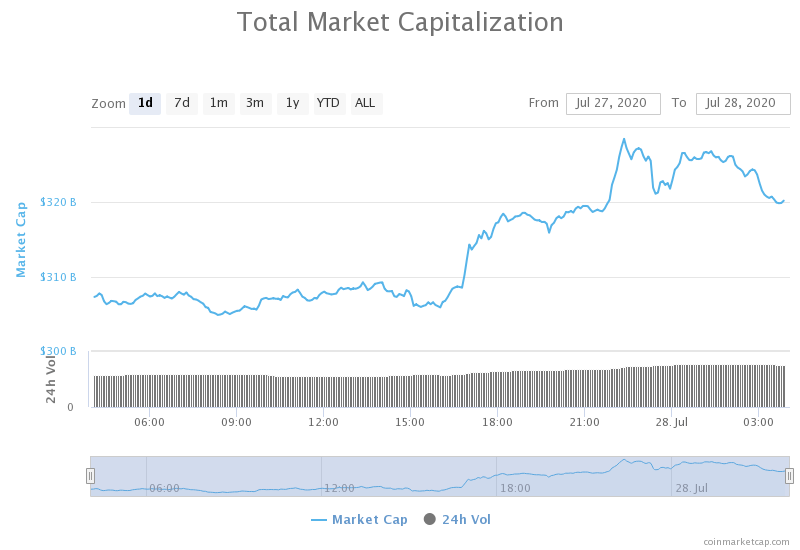
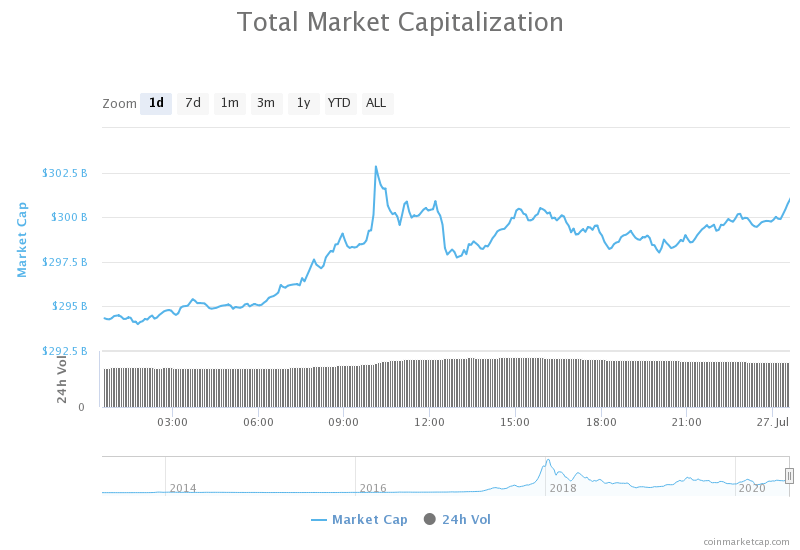
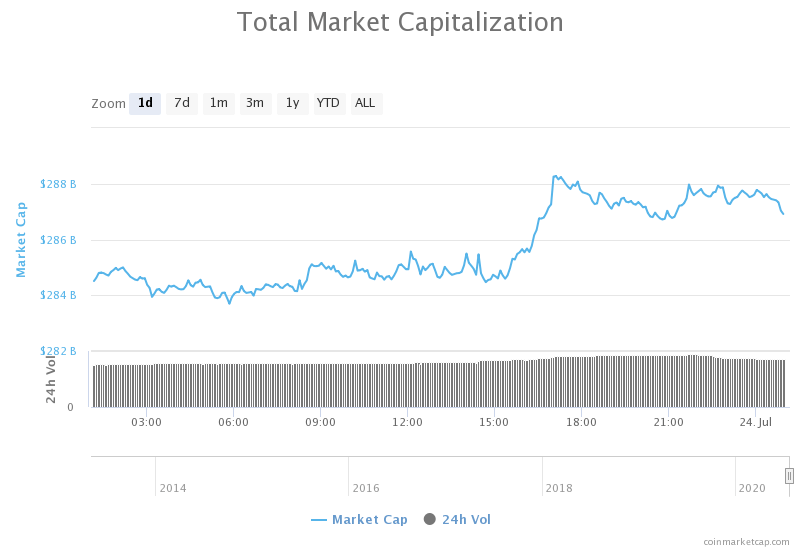
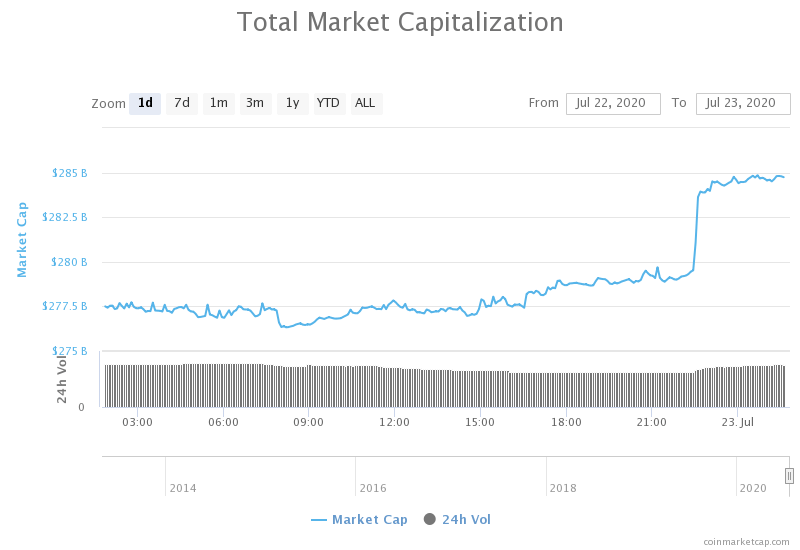
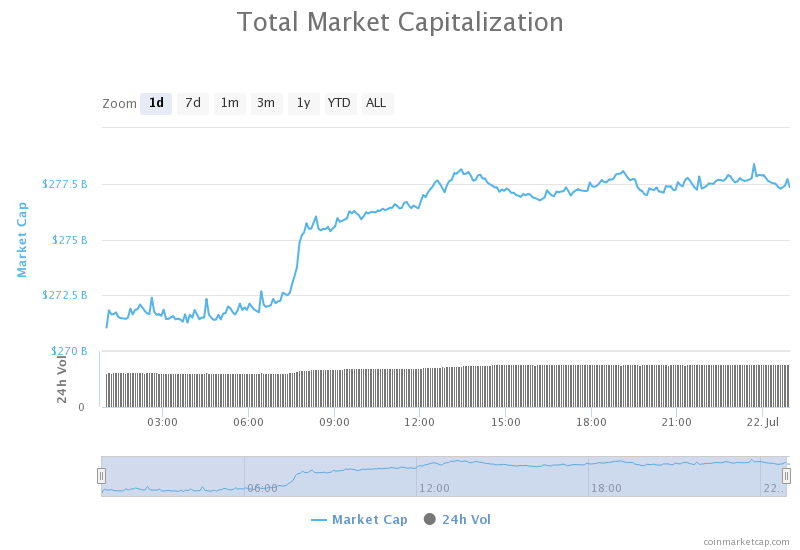
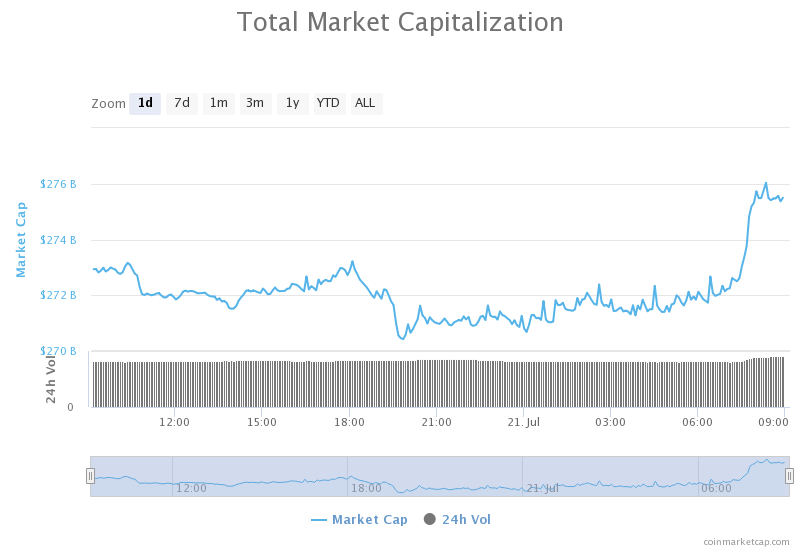
Daily Crypto Market Cap Chart
The crypto sector capitalization stayed at the same place in the past 24 hours. Its current value is $354.50 billion, which represents an increase of $0.59 billion when compared to our previous report.
_______________________________________________________________________
What happened in the past 24 hours?
_______________________________________________________________________
- Decentralized exchange Uniswap goes live with a governance token, dubbed UNI (The Block)
- DEX volumes continue to soar in September, crossing almost $15 billion month-to-date (The Block)
- As network costs rise, Coinbase will require its Pro customers to pay withdrawal fees (The Block)
- Cardano Looks Poised for Further Losses, On-Chain Metrics Show (Cryptobriefing)
- Teller DeFi Credit Score Lender to Include Yield Farming (Cryptobriefing)
- Ethereum Fees Spike After Uniswap’s UNI Token Launch (Cryptobriefing)
- Kraken Becomes The First Cryptocurrency Exchange to Obtain Banking Charter (Cryptobriefing)
- Bitcoin’s social sentiment level is at a new low – could prices surge? (Cryptoslate)
- Bitcoin Supply on Ethereum Tops $1B (Coindesk)
- Tether market cap increases almost 4X in 2020 to $15 billion (Cointelegraph)
_______________________________________________________________________
Technical analysis
_______________________________________________________________________
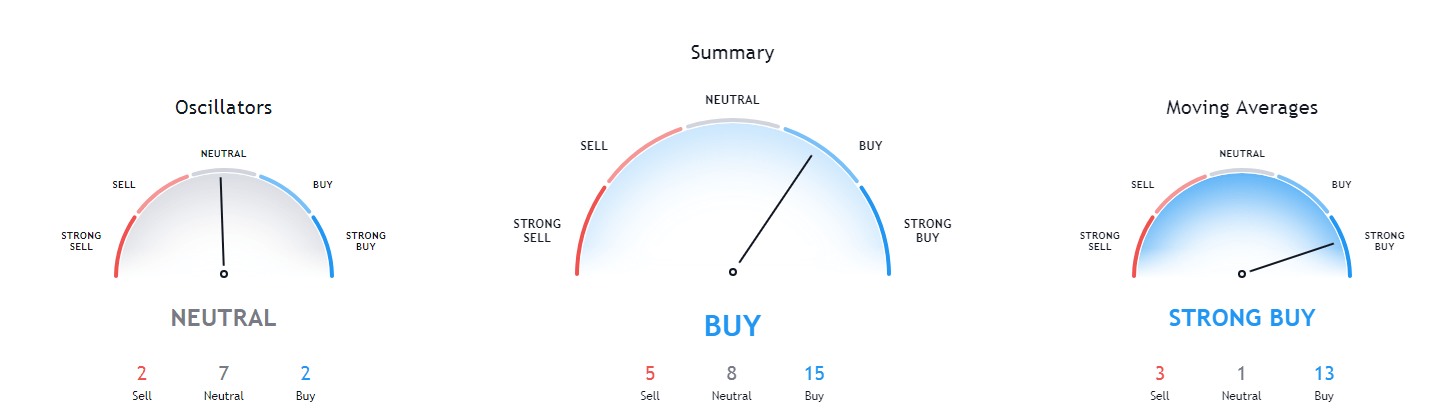
Bitcoin
Bitcoin has spent the day trying to confirm its position above $11,000 or to push above it yet again after it dropped below the level. The largest cryptocurrency by market capitalization struggled to cross this psychological resistance but confirmed the $10,850 support, which puts it in a narrow range that traders can use to their advantage.
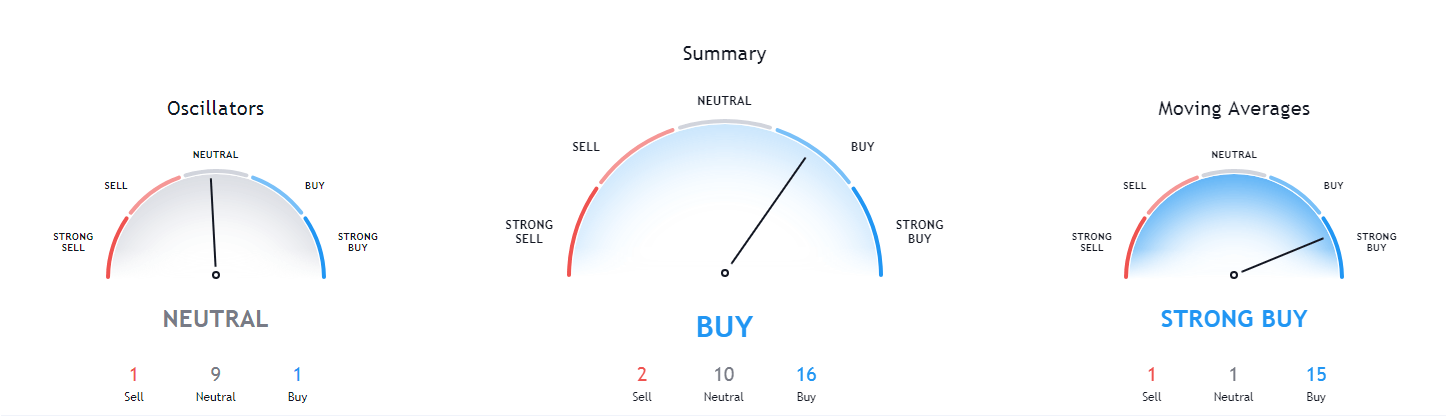
Bitcoin’s short-term indicators are a bit less bullish than a couple of days ago, as Bitcoin did not manage to break the $11,000 mark. However, its long-term technicals are still extremely tilted towards the upside.
BTC/USD 4-hour Chart
Technical factors:
- Price is above both its 50-period EMA and 21-period EMA
- Price is right between its middle and top Bollinger band
- RSI is flat but overextended to the upside (64.35)
- Volume is slowly descending
Key levels to the upside Key levels to the downside
1: $11,000 1: $10,850
2: $11,090 2: $10,630
3: $11,460 3: $10,500
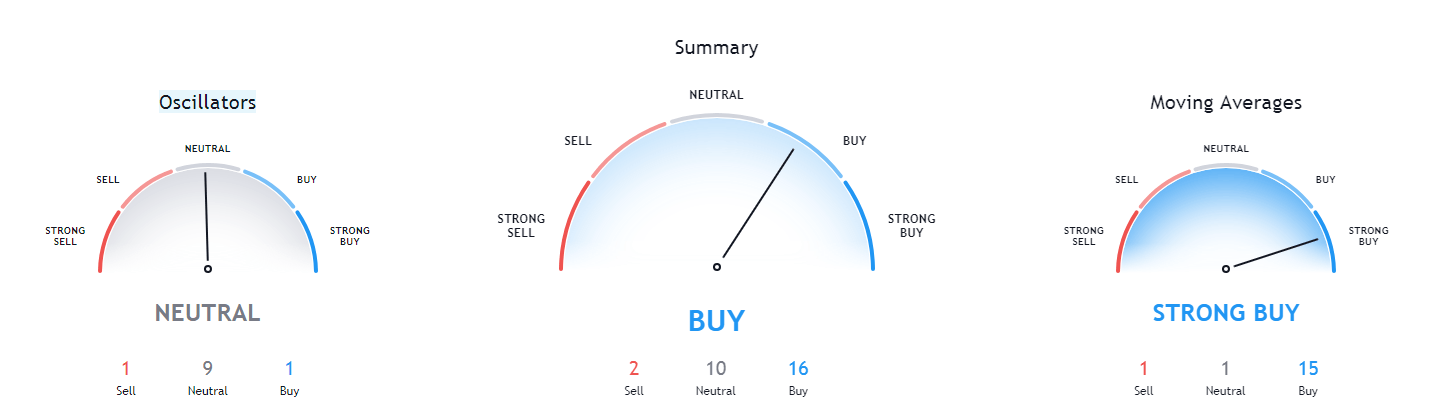
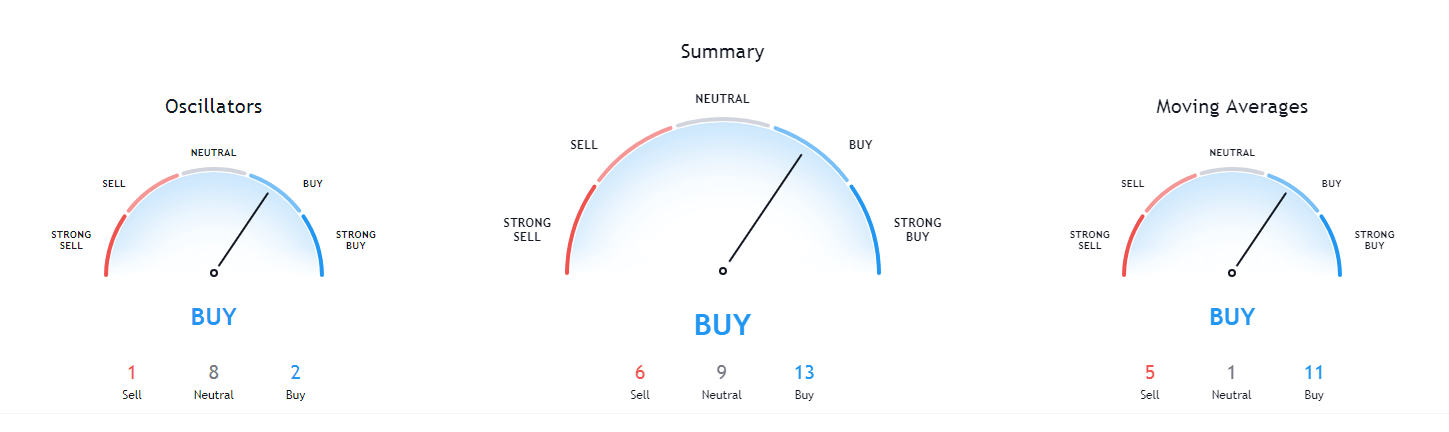
Ethereum
Ethereum has followed its tight movement towards the ascending trend line, which took its price a bit higher than yesterday. Technicals, as well as the influx of people using Ethereum due to UNI token launching, bumped its price up to around 2% towards the upside.
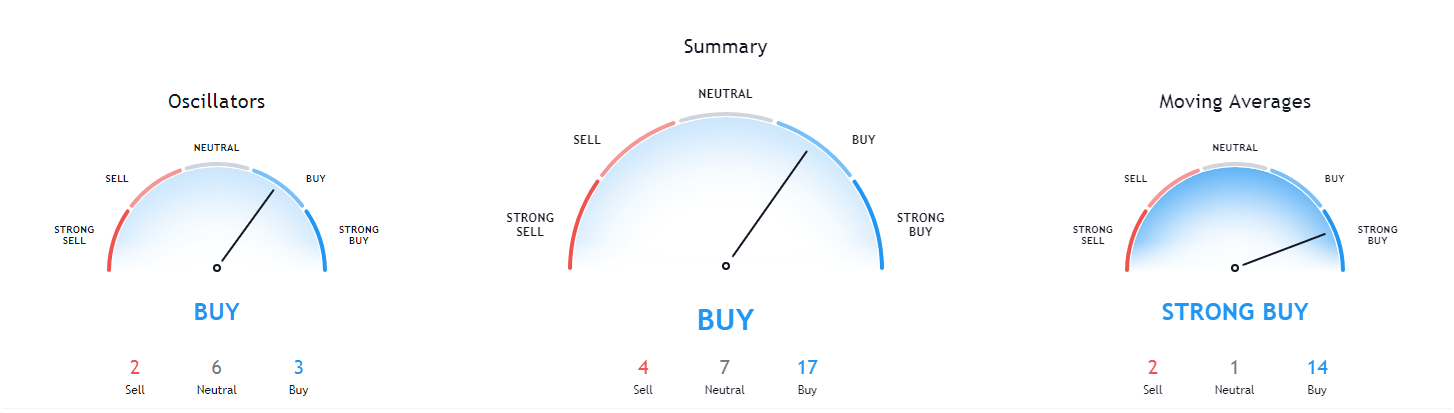
With this being said, Ethereum’s technicals have turned extremely bullish as many traders called for the double bottom that formed, propelling ETH’s price up towards $400.
ETH/USD 4-hour Chart
Technical Factors:
- The price is above both its 21-period and its 50-period EMA
- The price slightly closer to its top Bollinger band than the middle one
- RSI slowly descending (60.41)
- Volume is average
Key levels to the upside Key levels to the downside
1: $371 1: $360
2: $400 2: $340
3: $415 3: $300
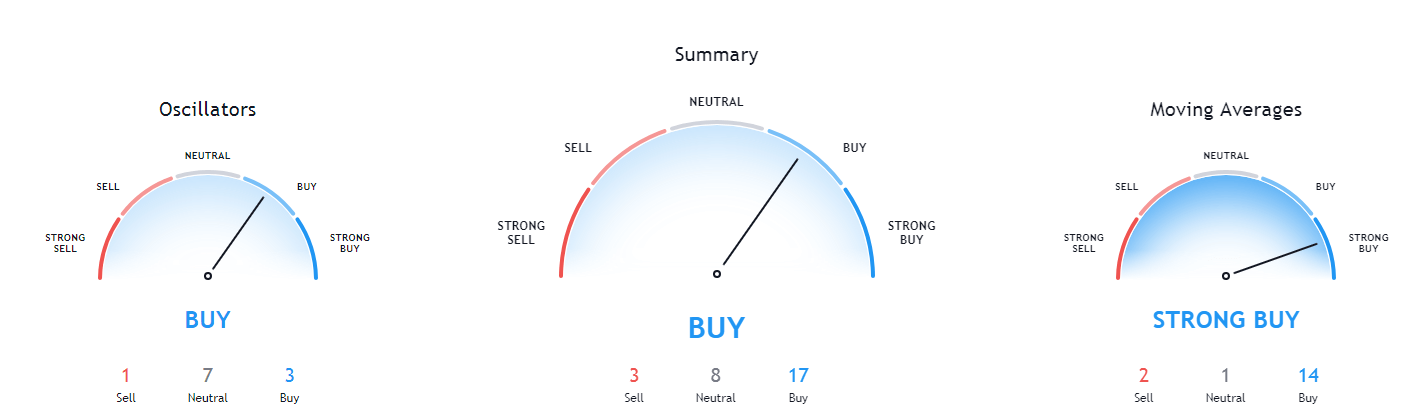
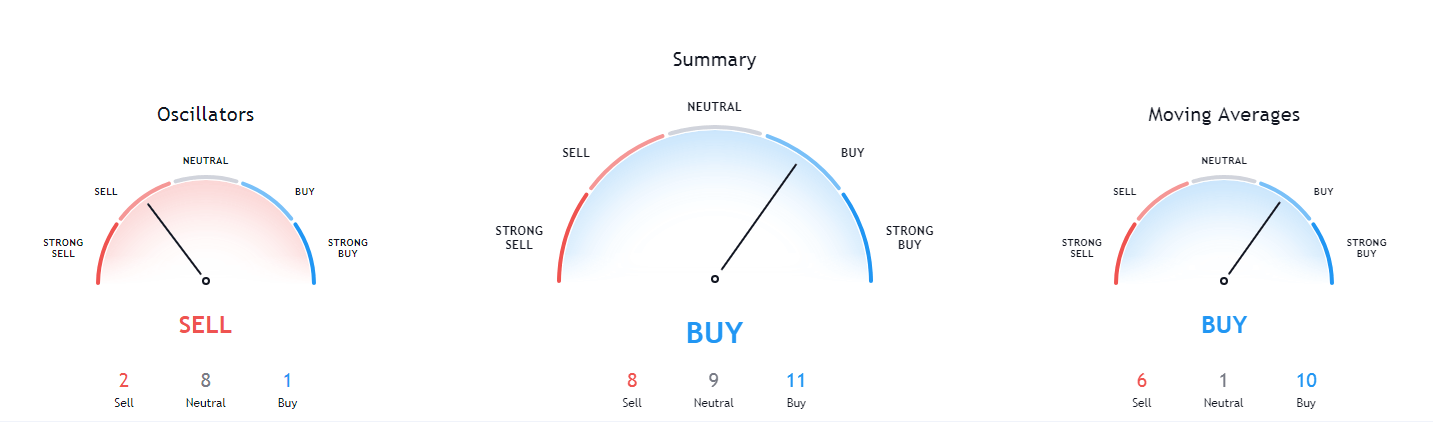
Ripple
XRP has continued its push towards the upside and has continued heading towards the $0.266 resistance level. The steady push has slowed down a bit due to a decrease in volume but has shown no signs of completely stopping. XRP is in quite a good spot now, as many traders are calling for long positions (mostly on the 1-day and 1-week charts).
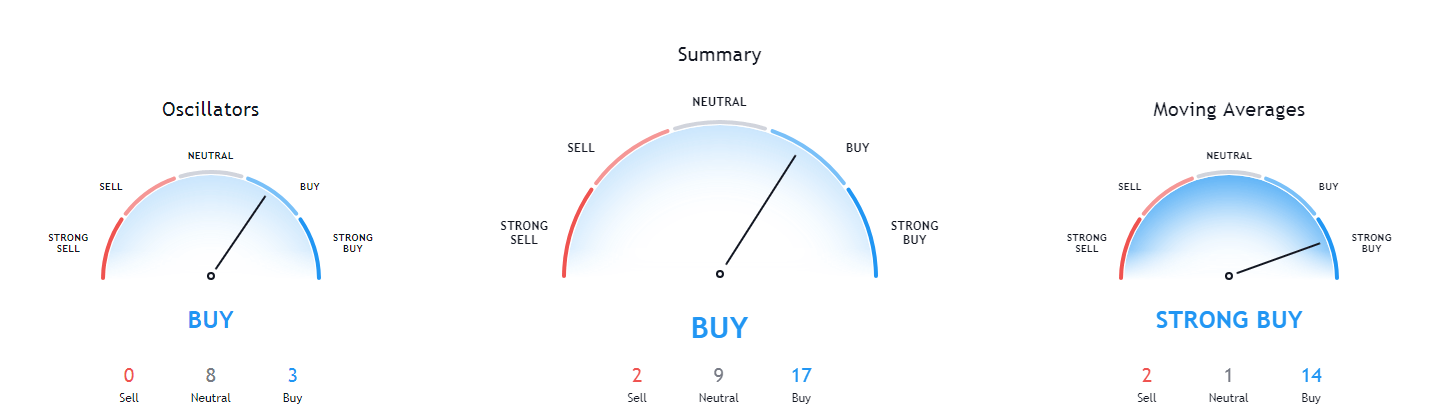
XRP saw a change of its short-term technicals to extremely bullish, while its mid-term technicals (1-month) are still tilted towards the sell-side. With that being said, more and more traders are slightly less bearish on XRP in the mid-term.
XRP/USD 4-hour Chart
Technical factors:
- The price is well above its 21-period EMA and its 50-period EMA
- Price is very close to its top Bollinger band
- RSI is pushing towards overbought (64.37)
- Volume is descending
Key levels to the upside Key levels to the downside
1: $0.266 1: $0.2454
2: $0.285 2: $0.235
3: $0.31 3: $0.227