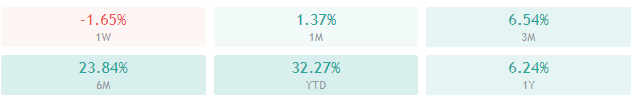
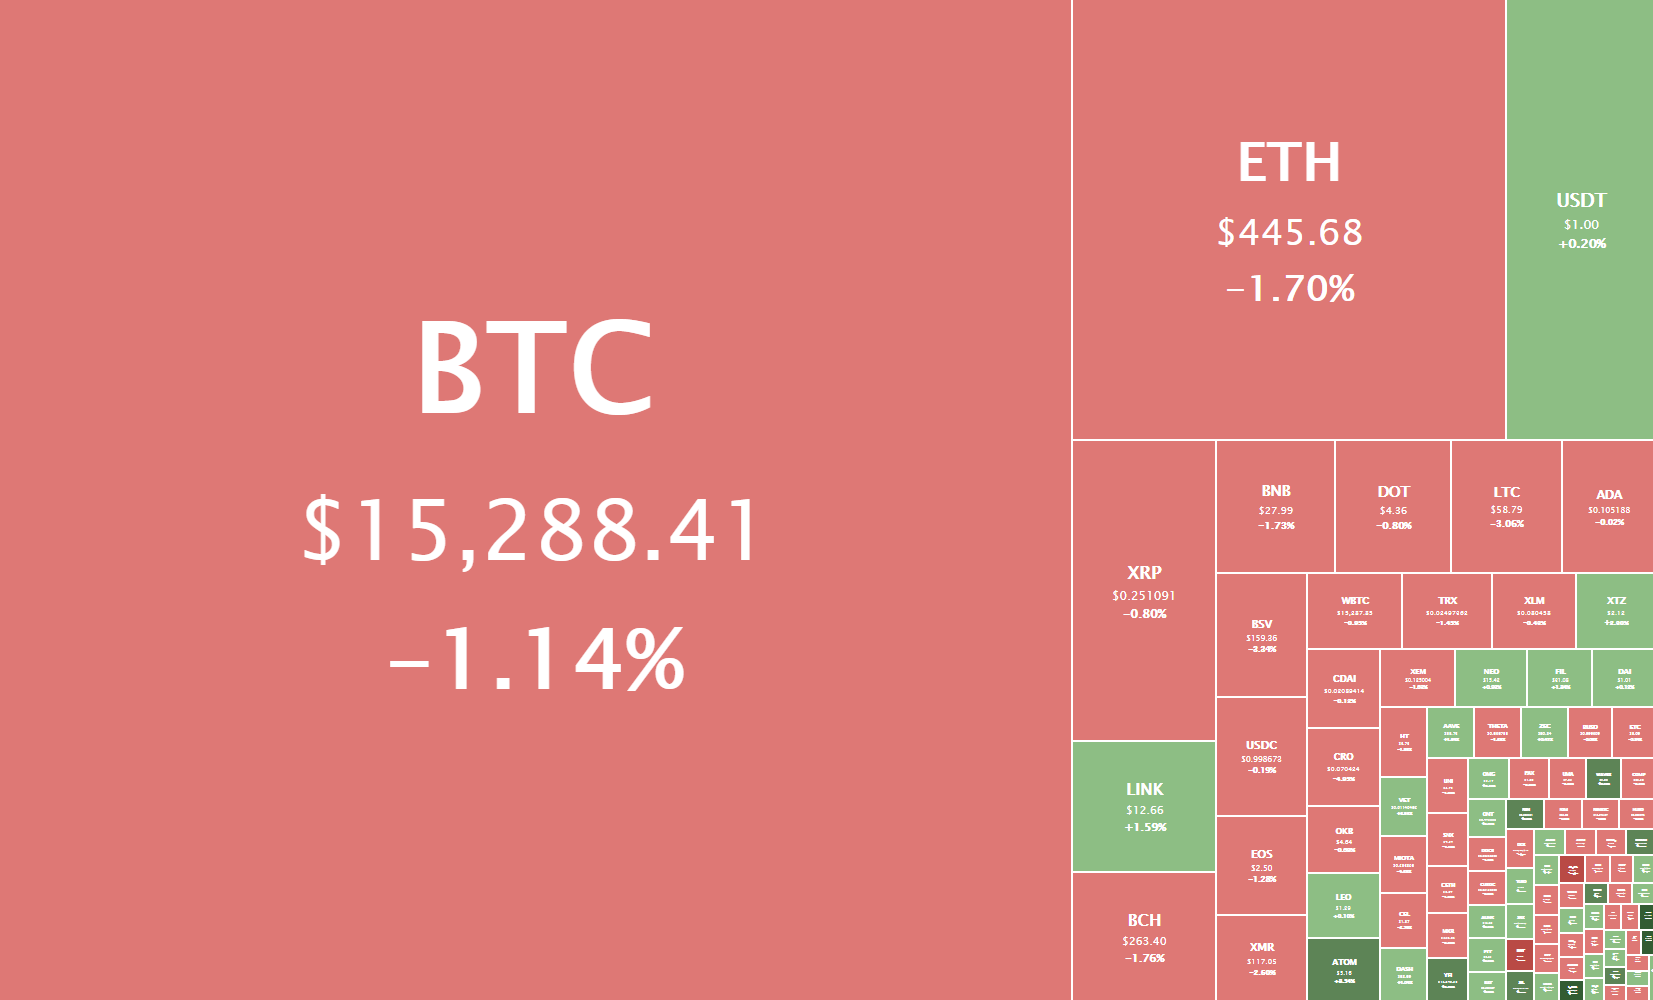
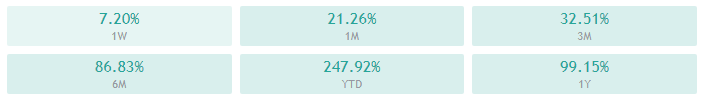
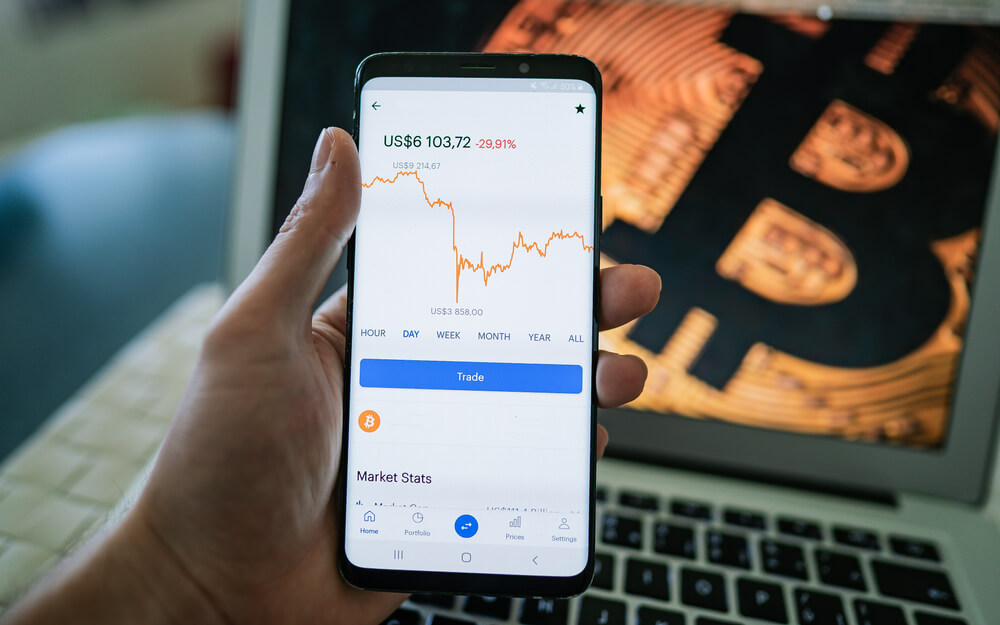
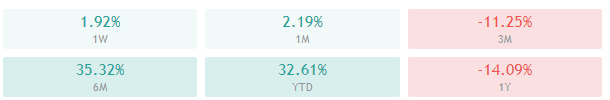
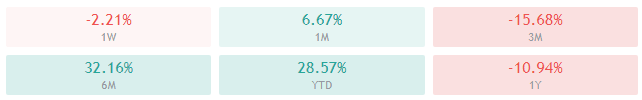
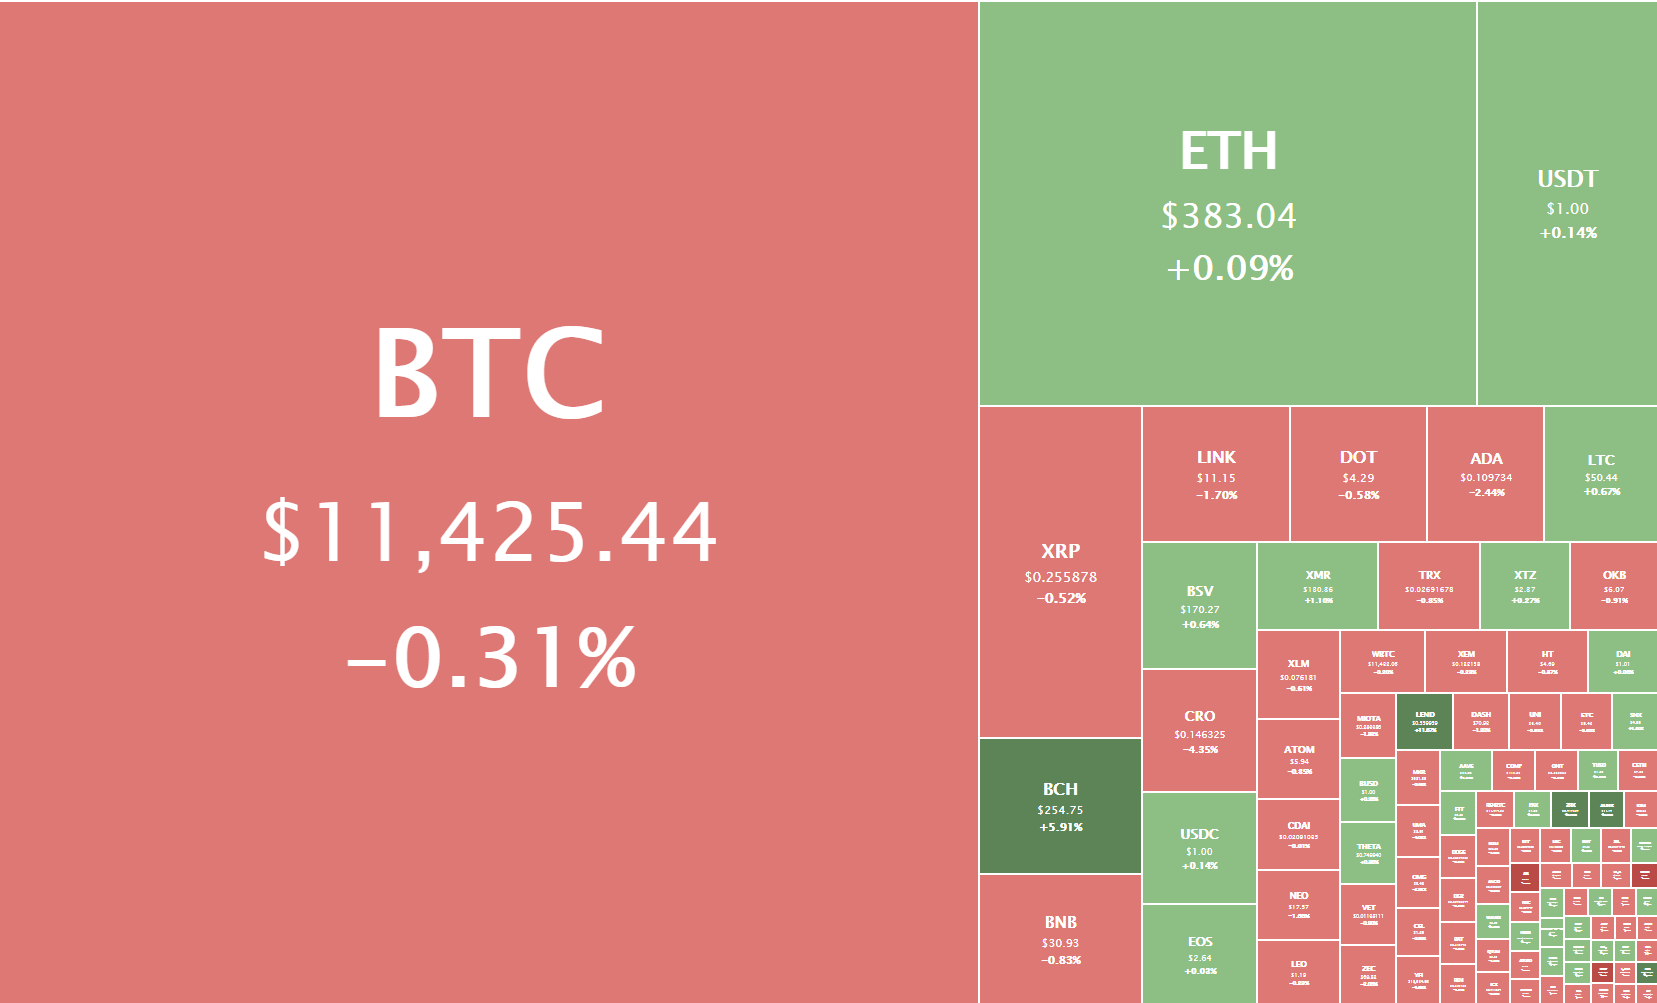
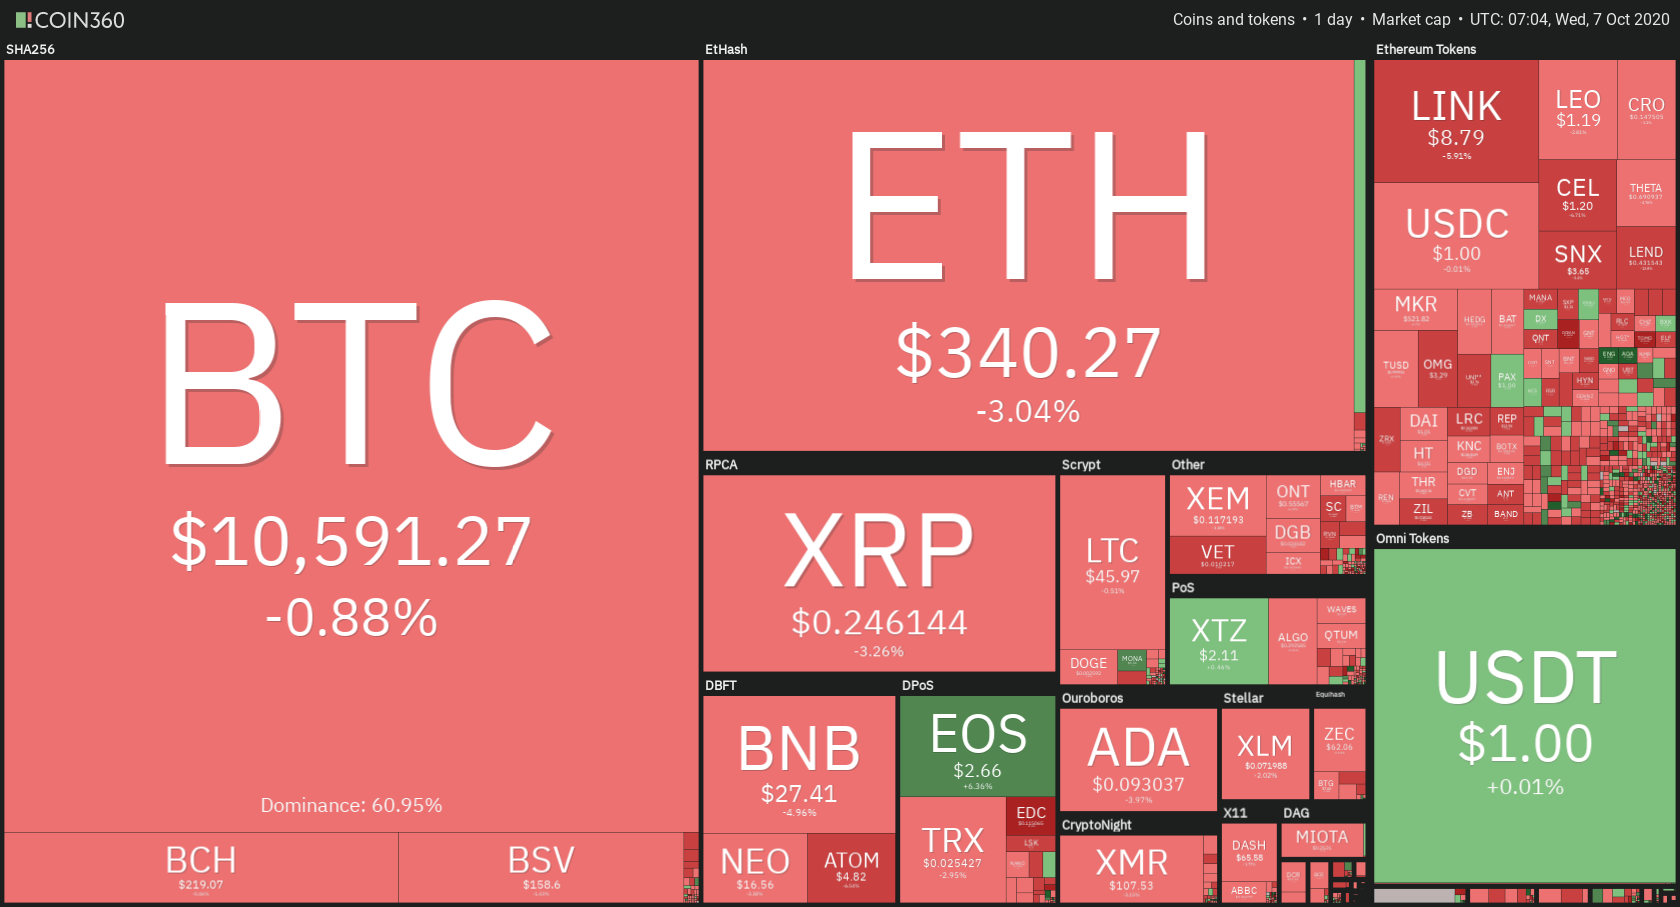
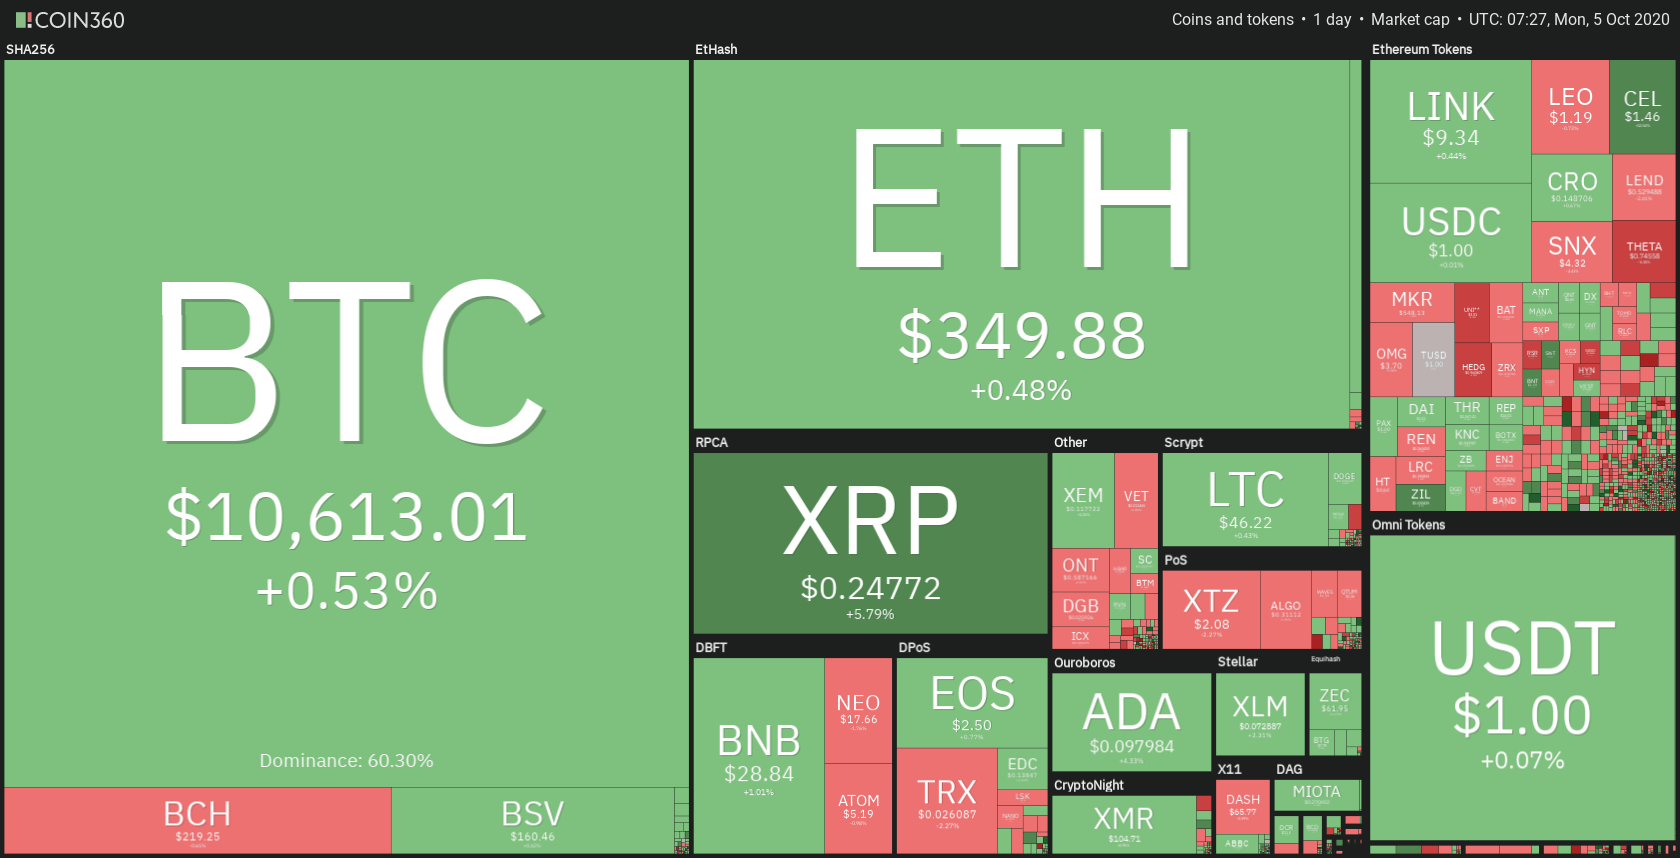
The cryptocurrency sector has spent the weekend pretty flat as Bitcoin was experiencing a period of low volatility. The largest cryptocurrency by market cap is currently trading for $16,272, representing an increase of 1.37% on the day. Meanwhile, Ethereum lost 1.19% on the day, while XRP lost 0.69%.
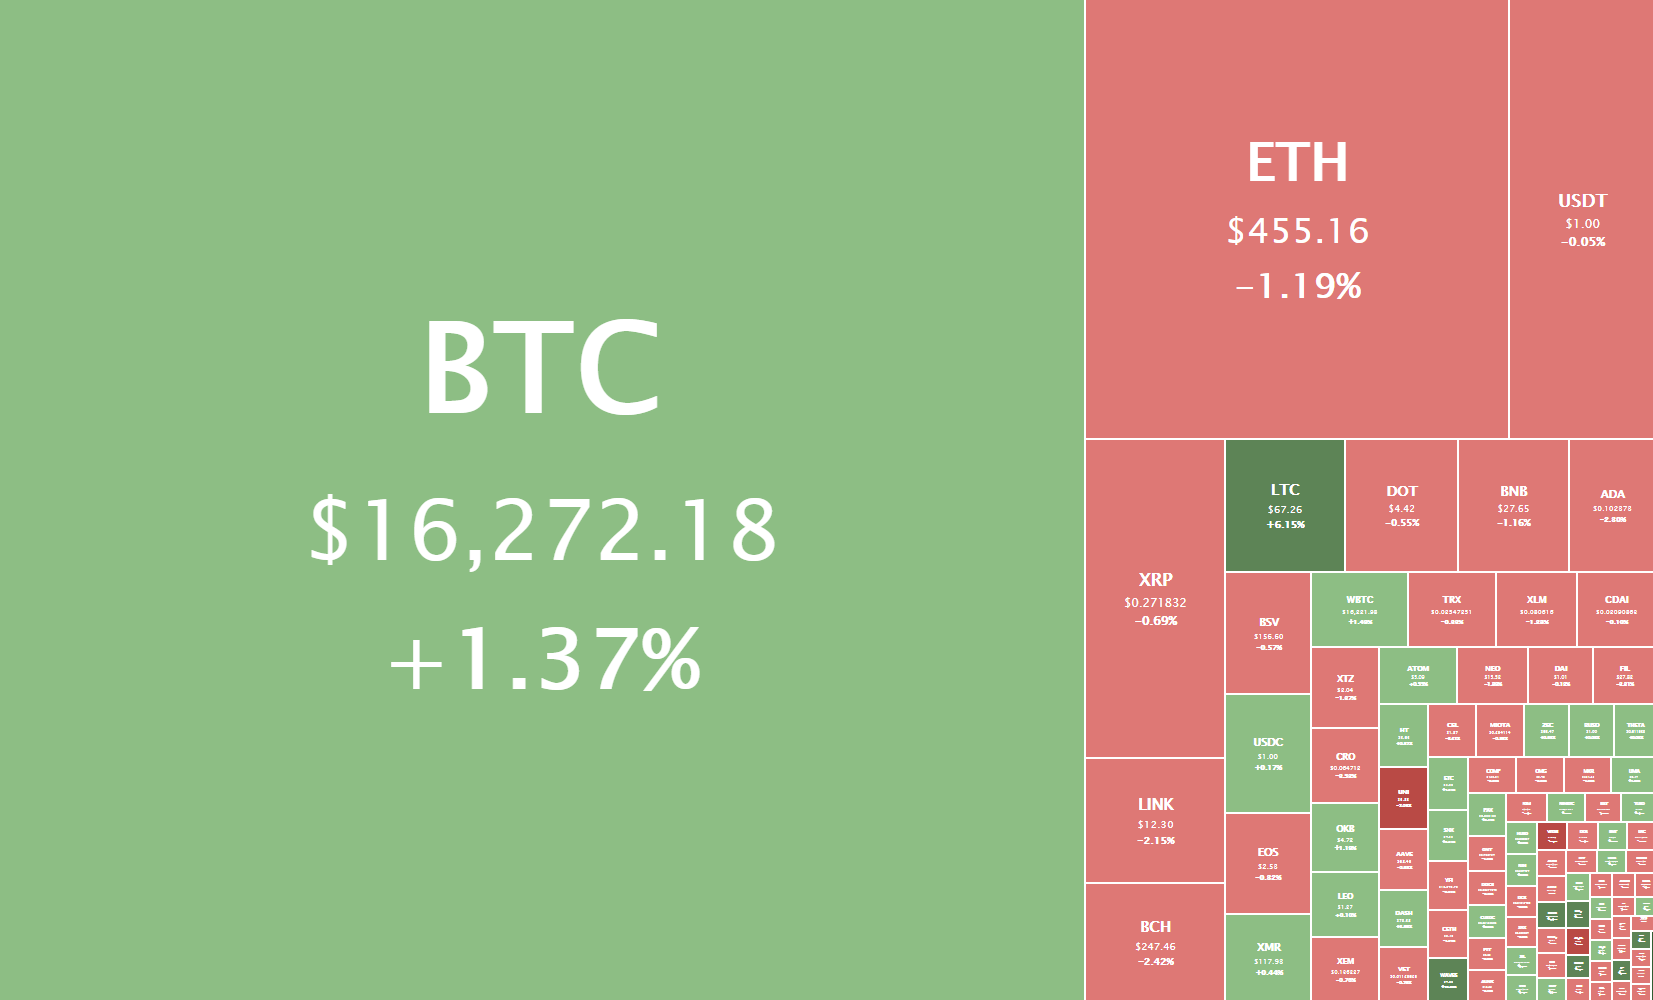
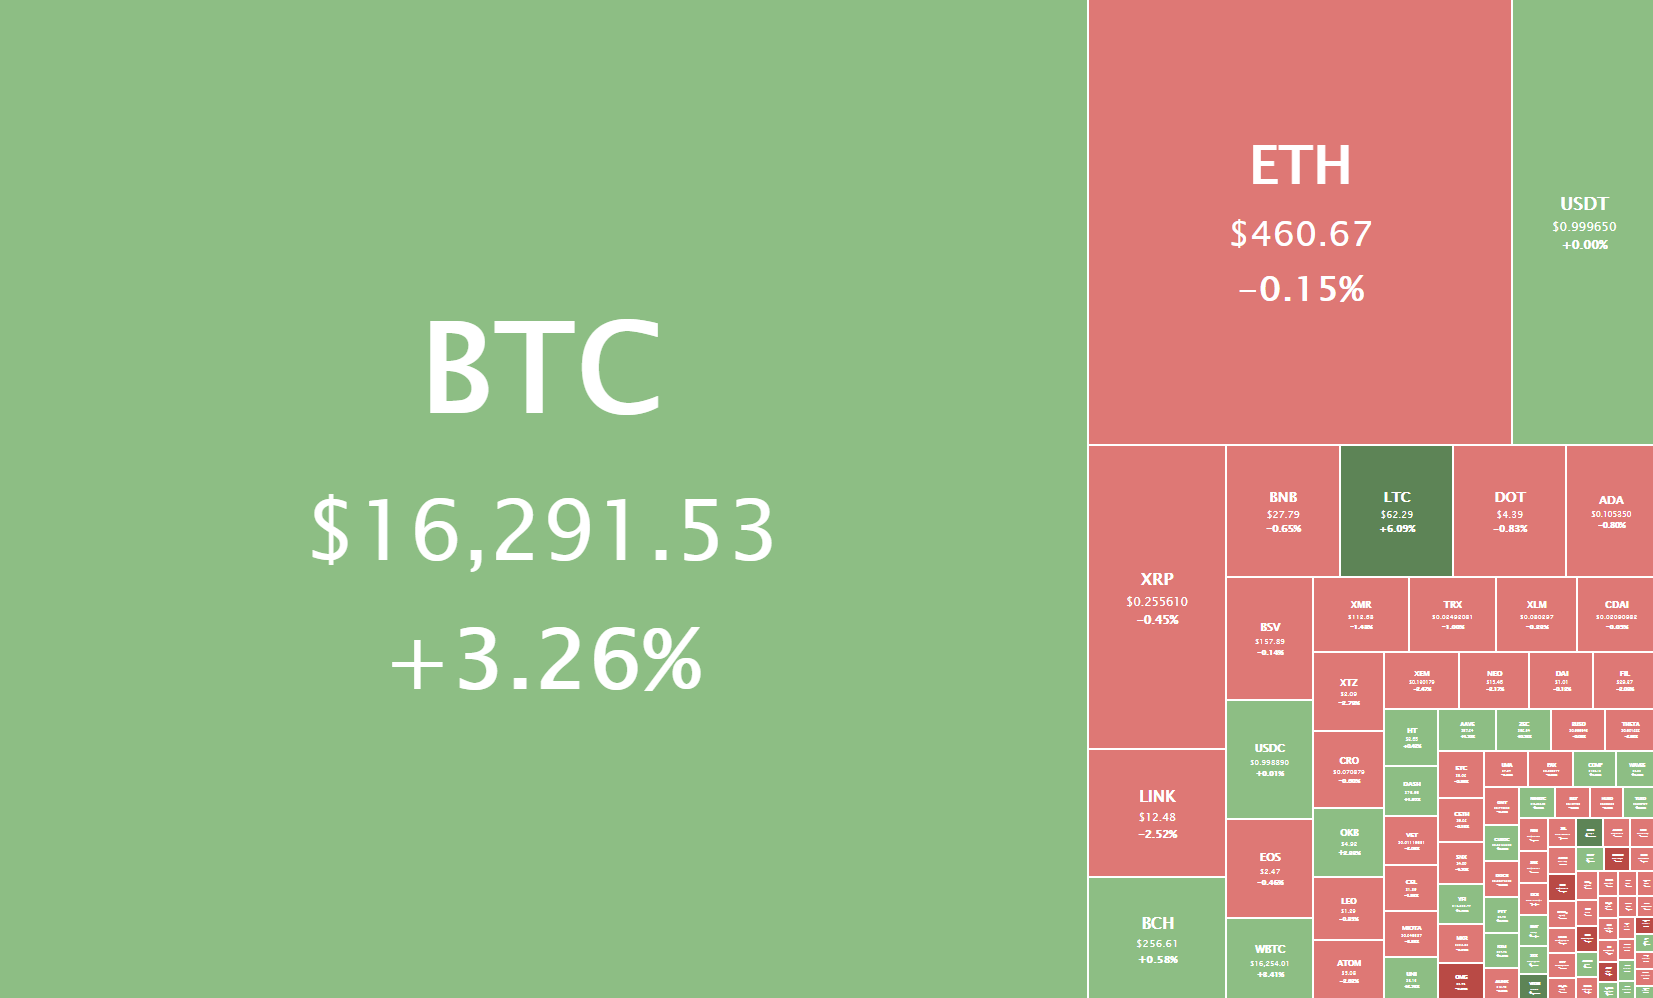
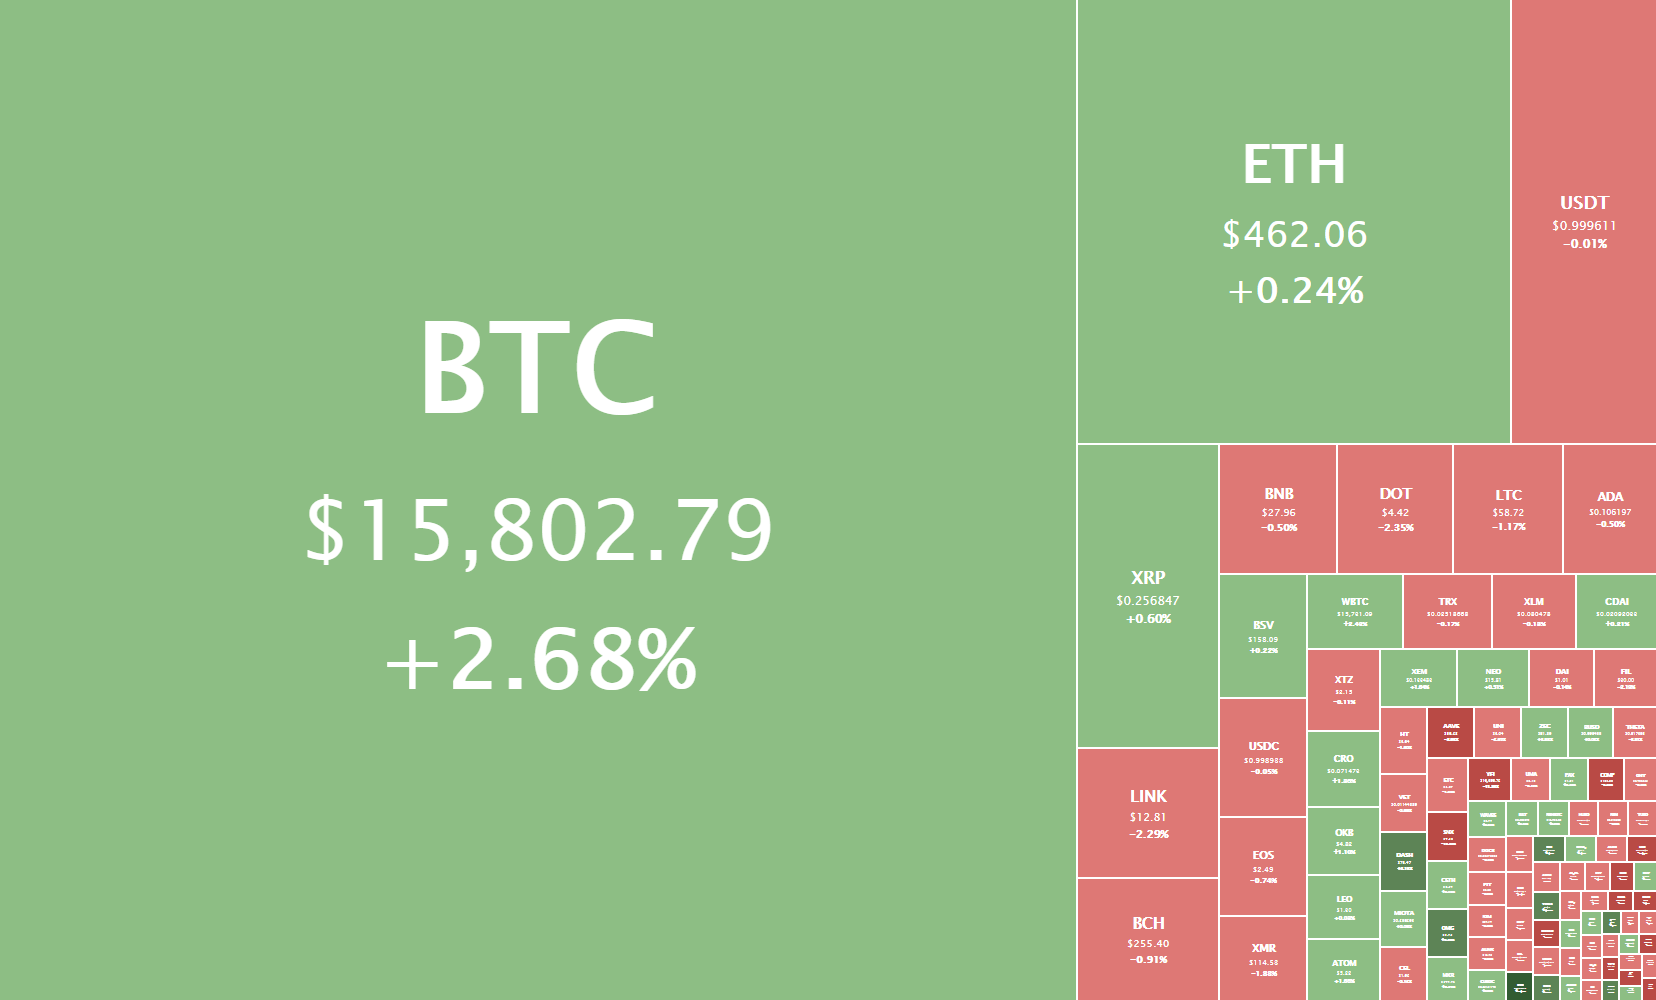
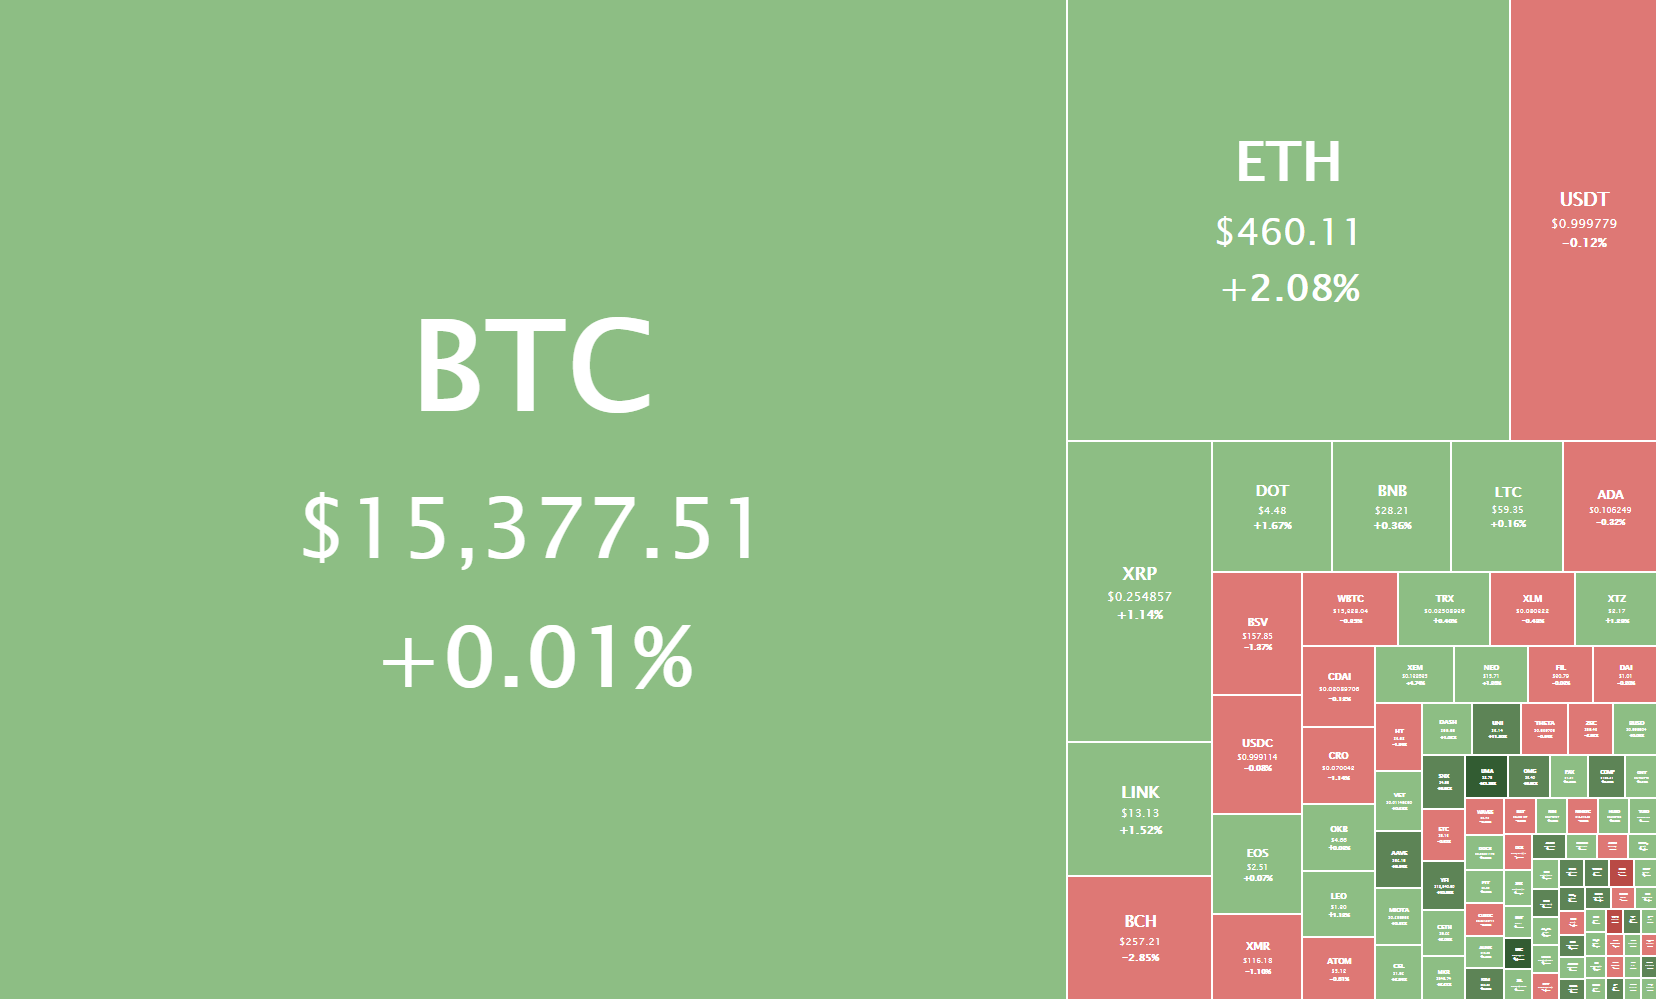
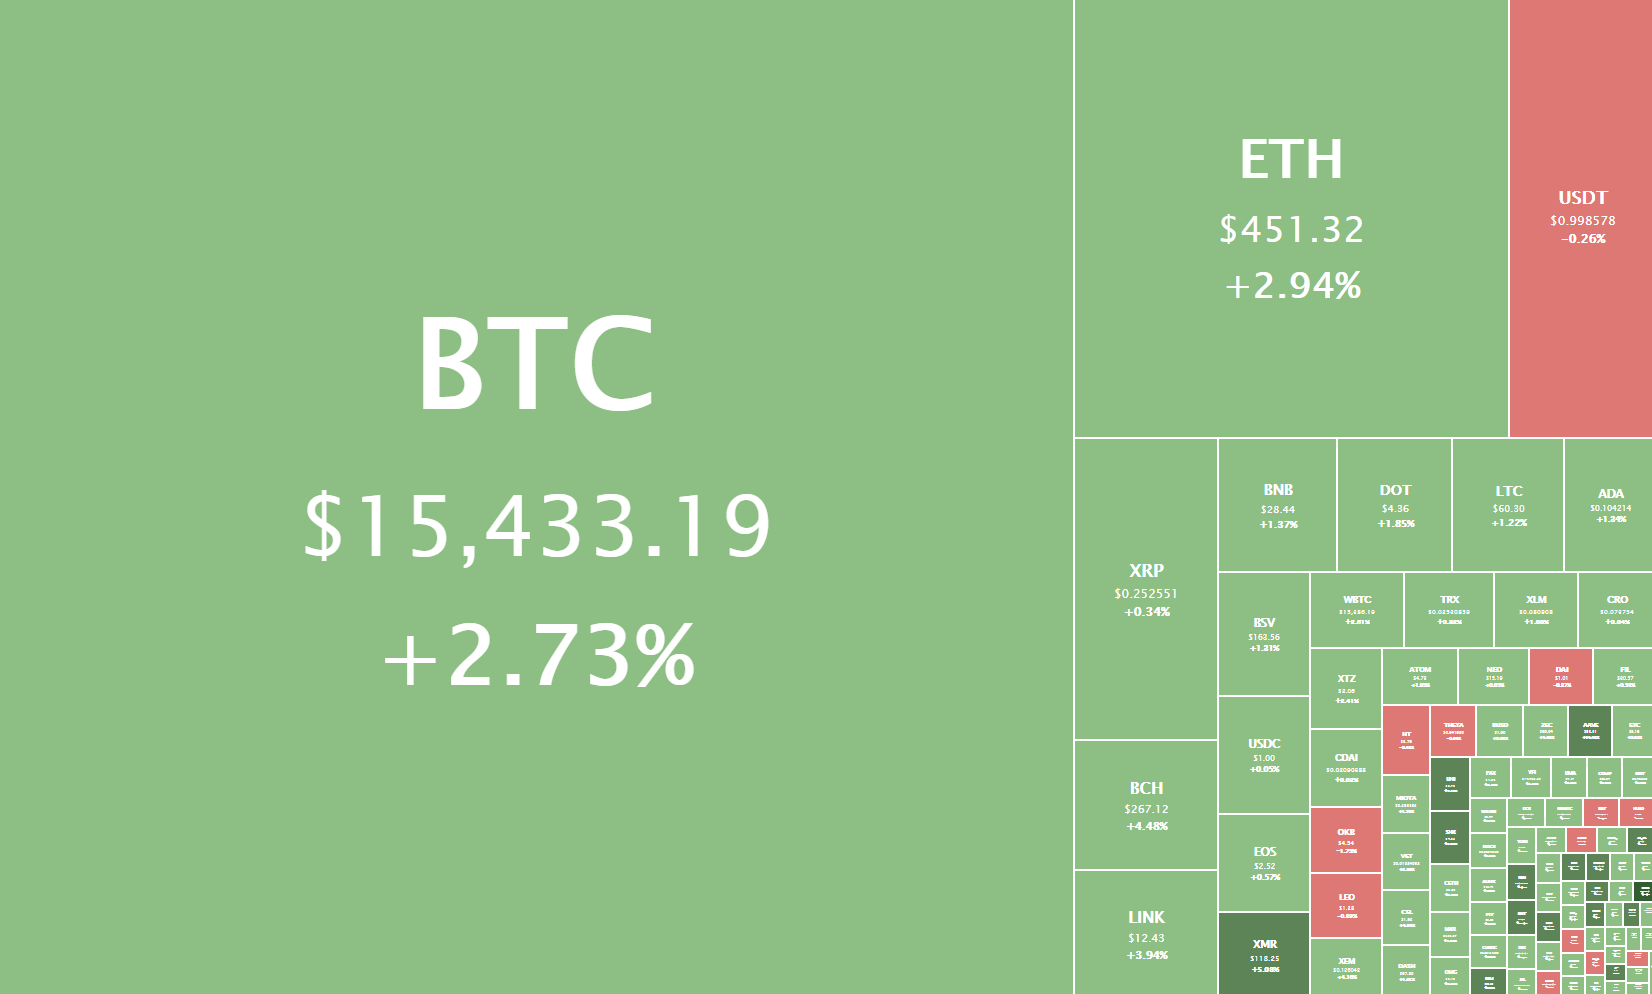
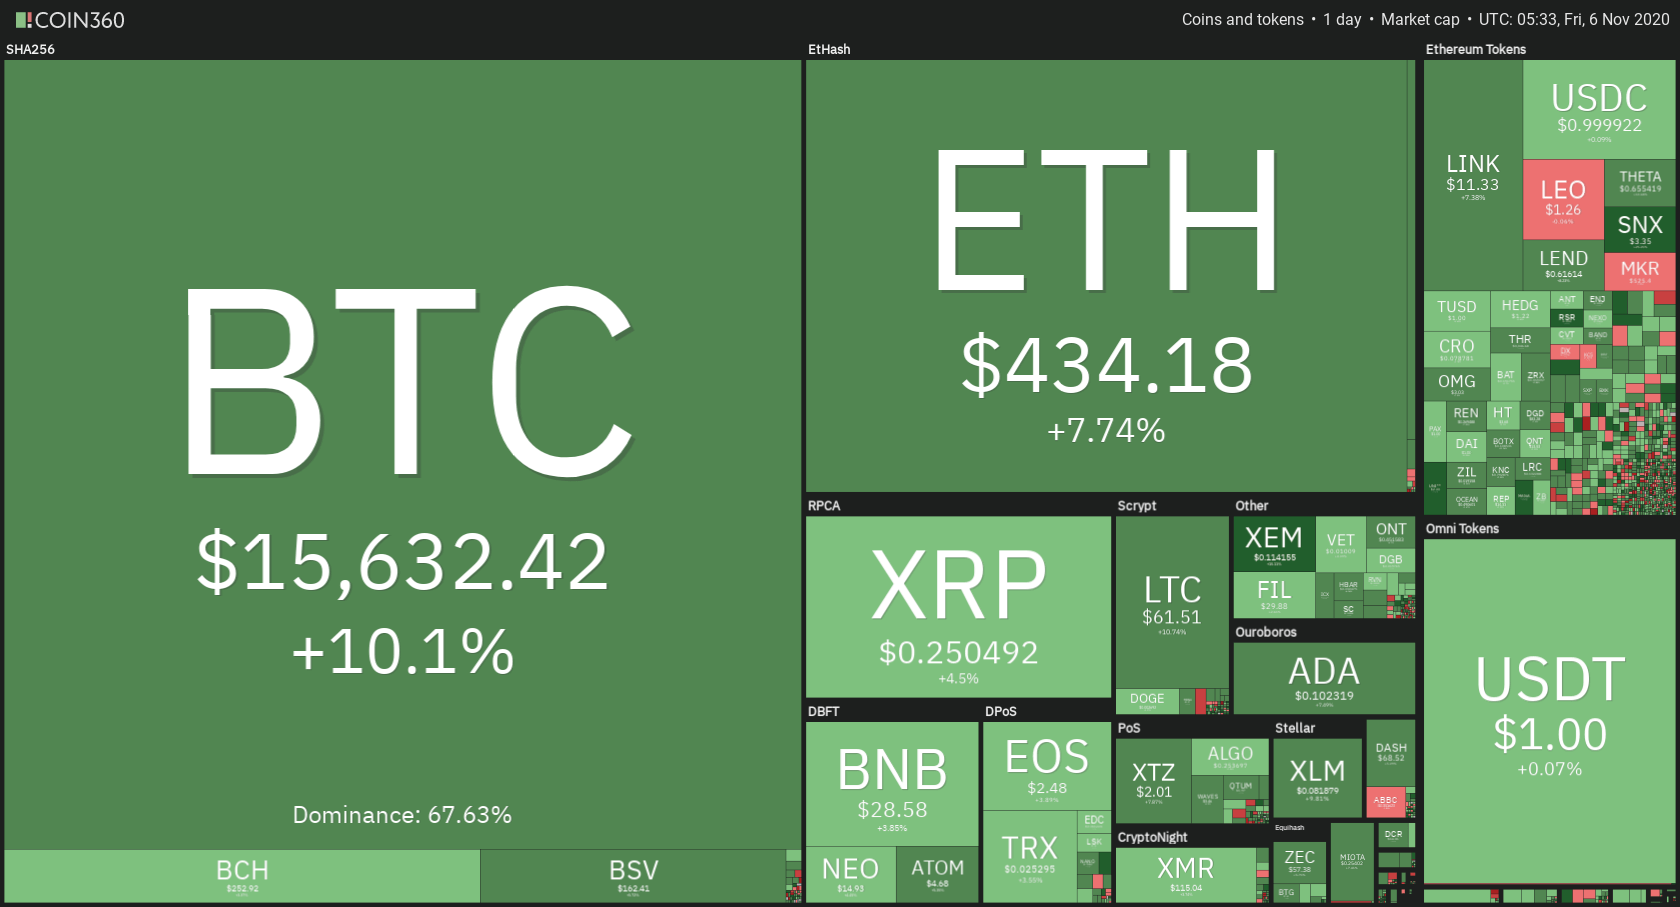
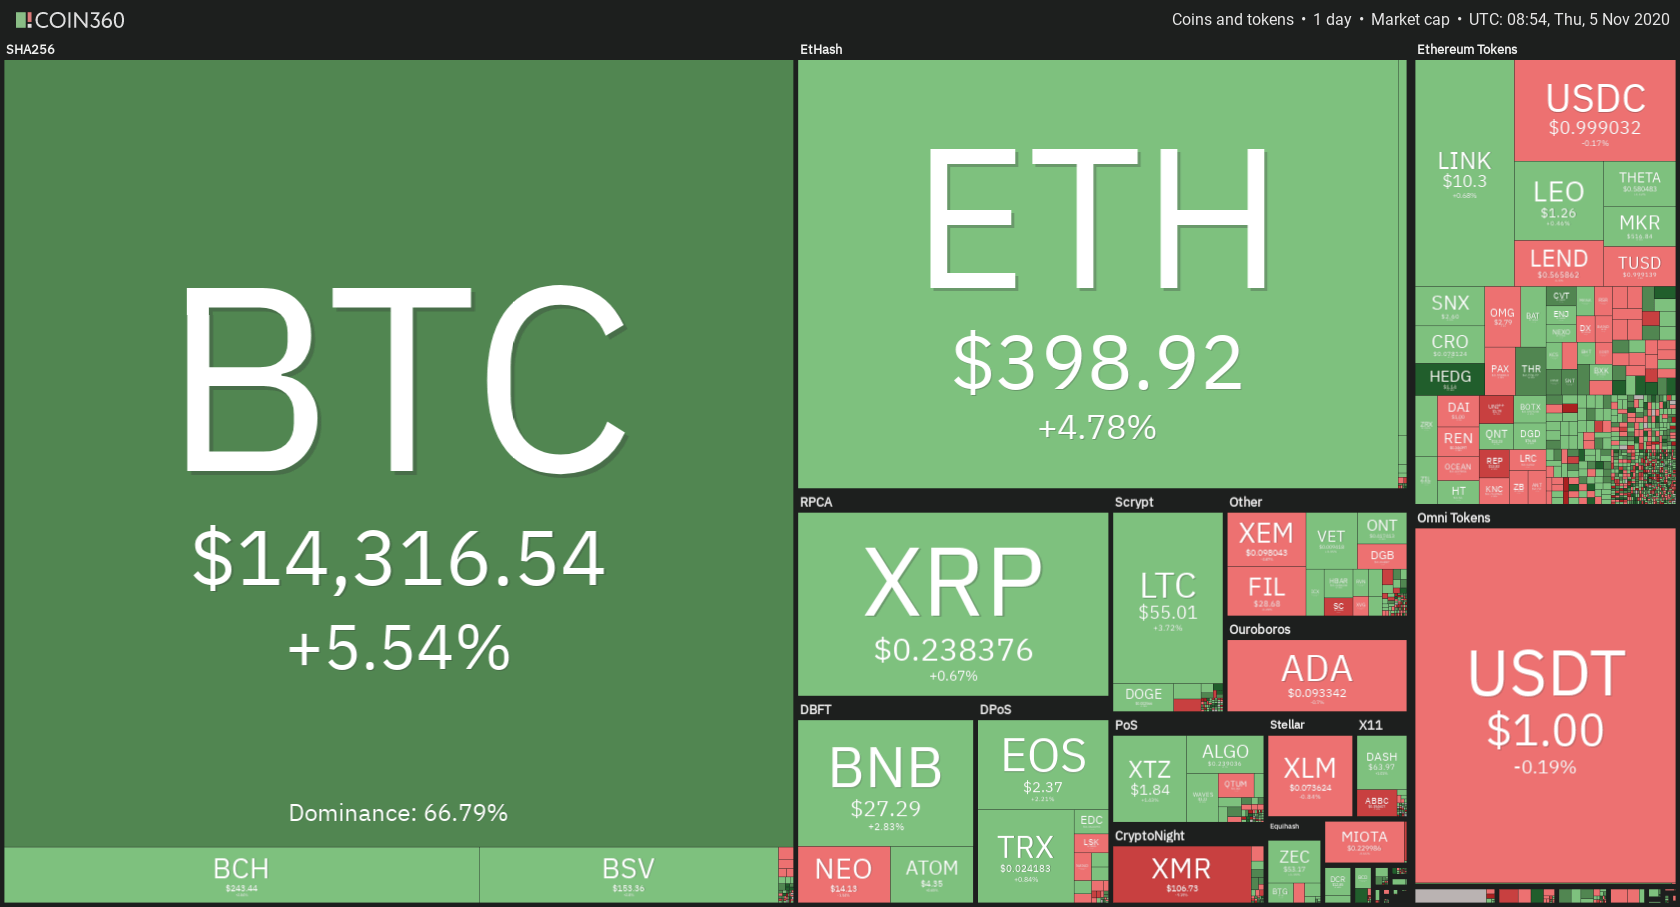
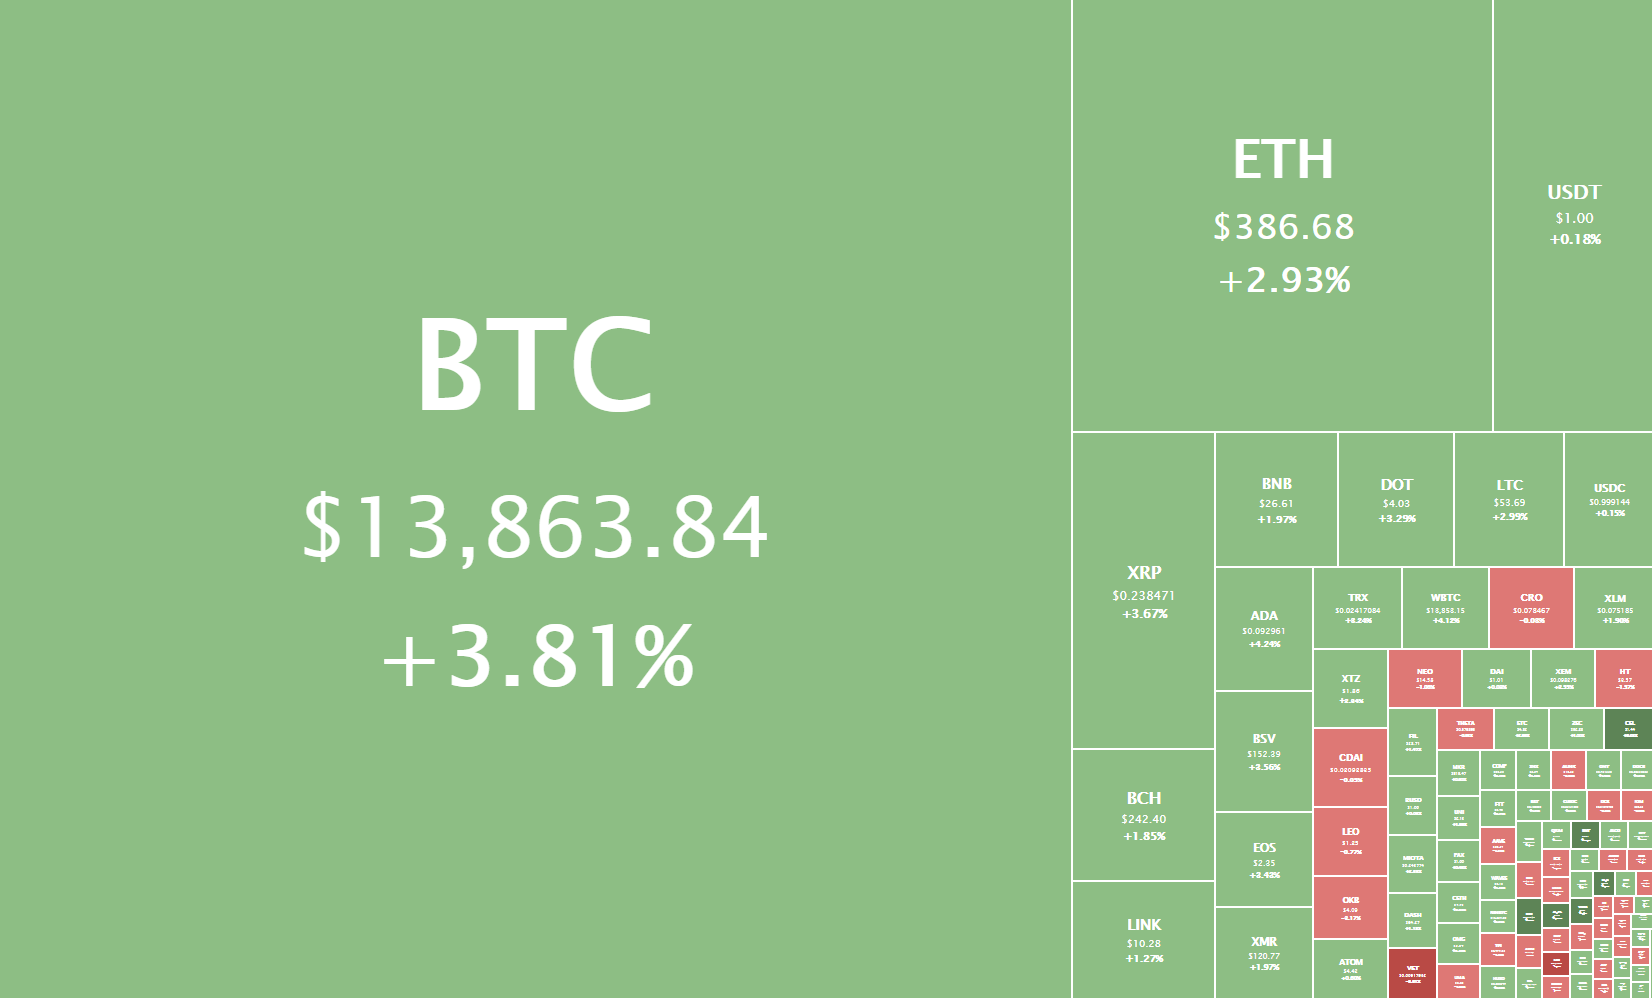
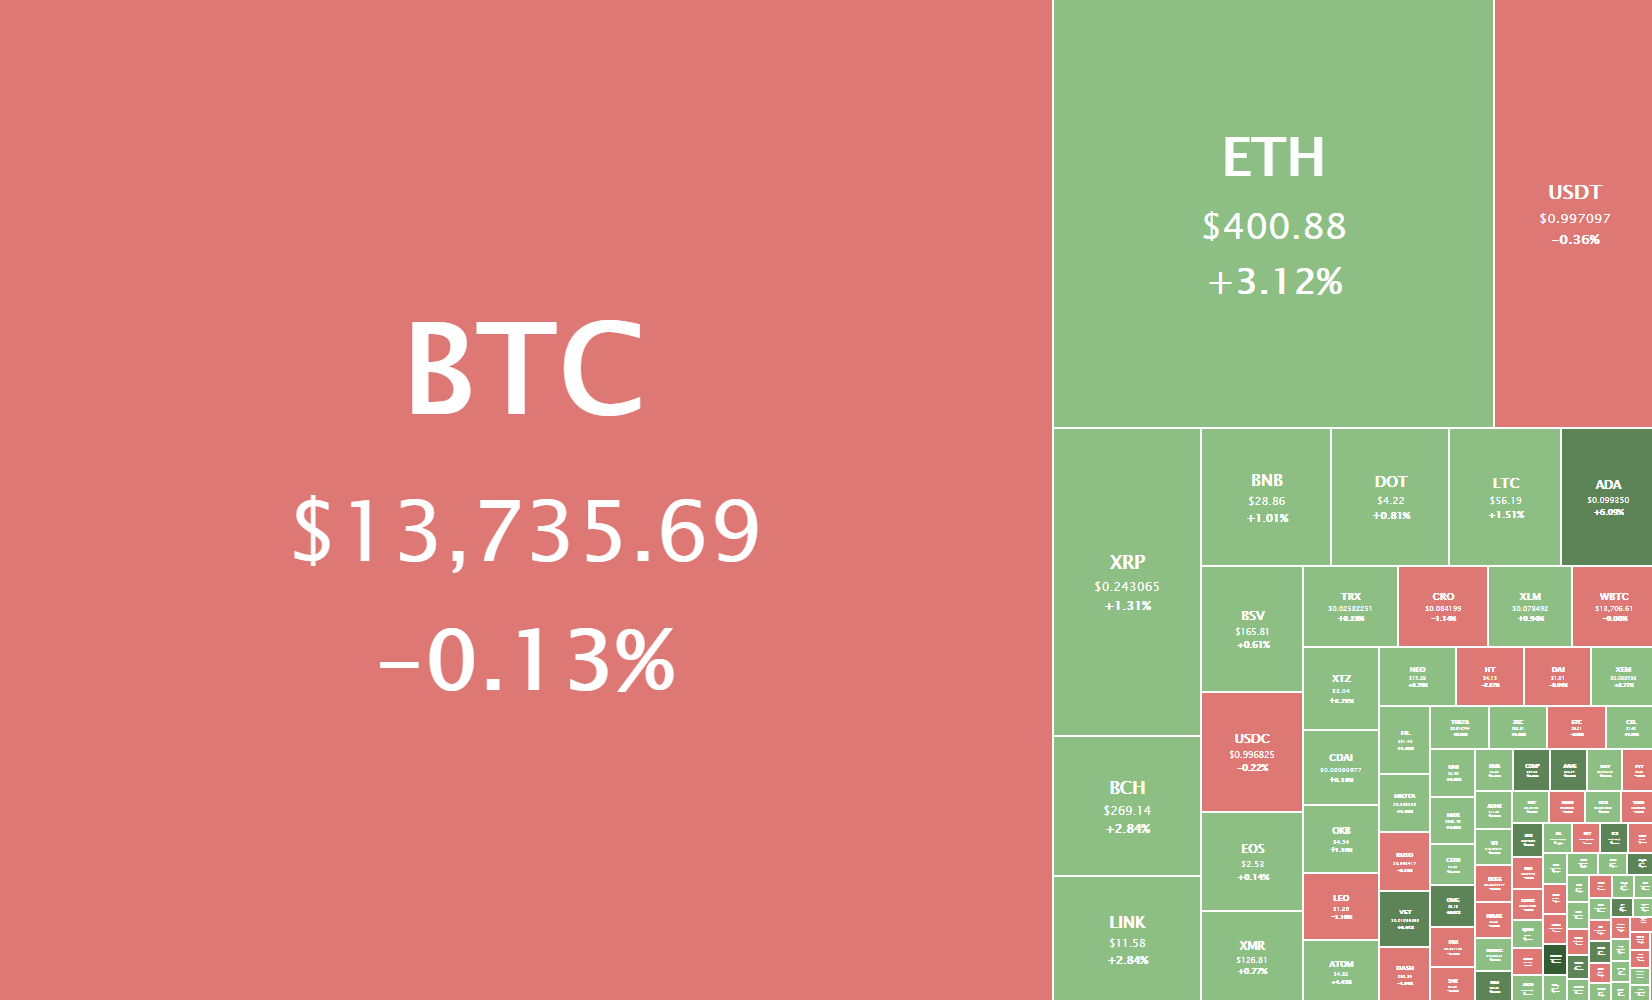
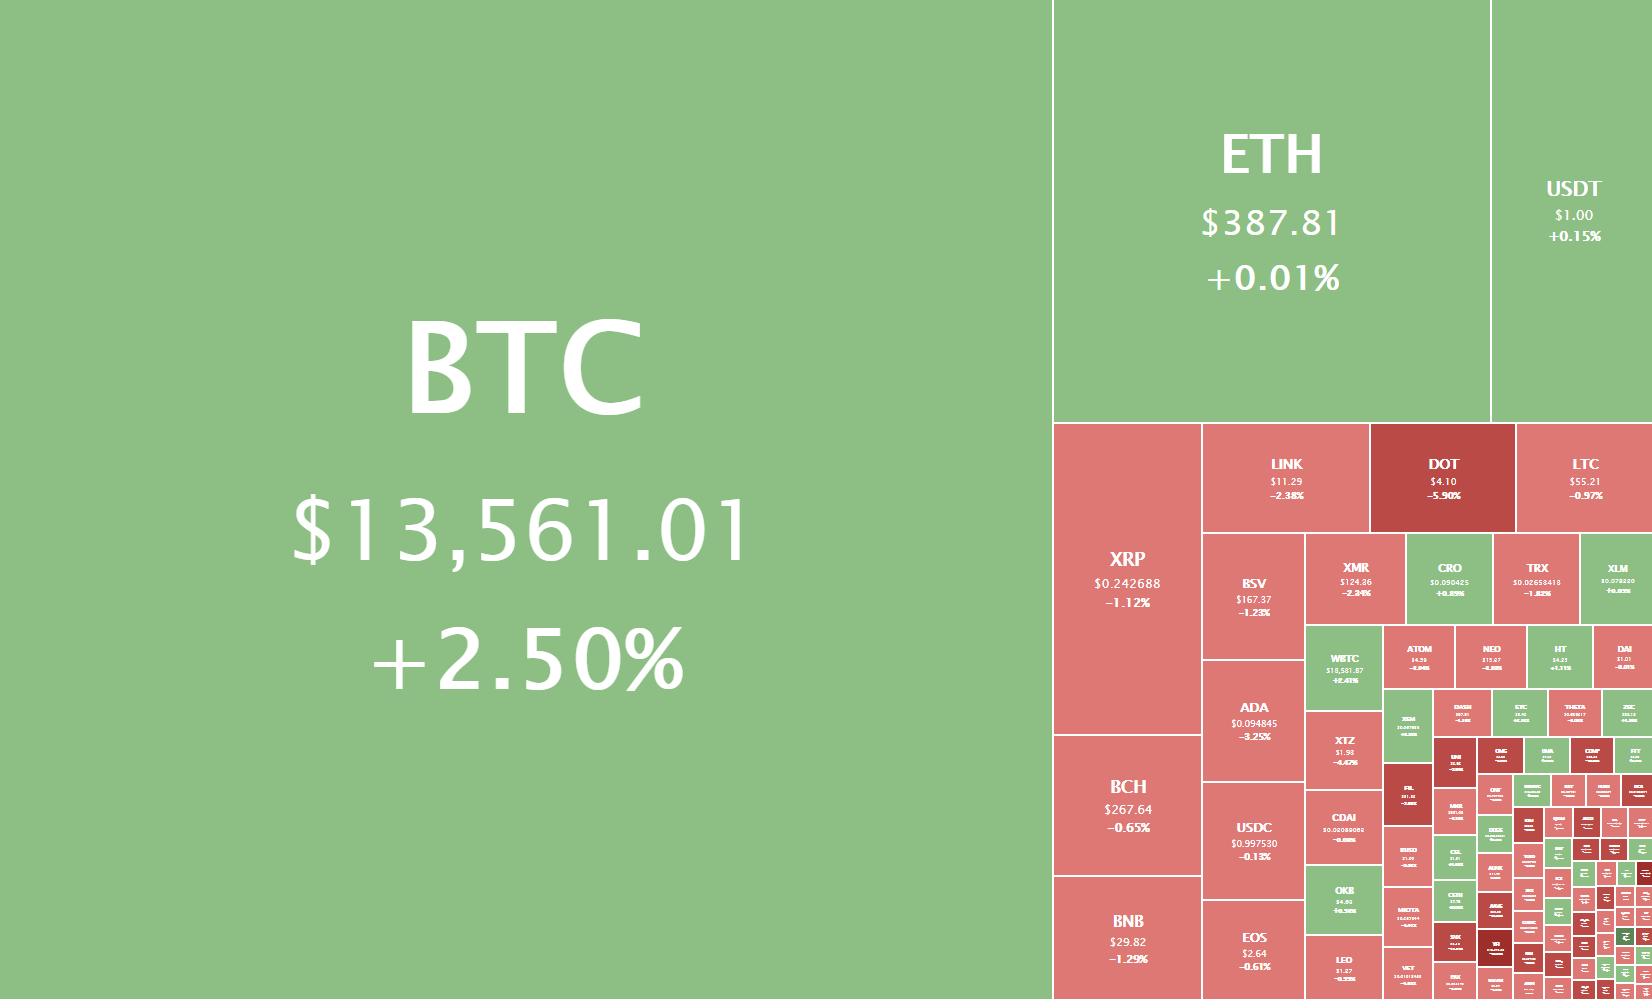
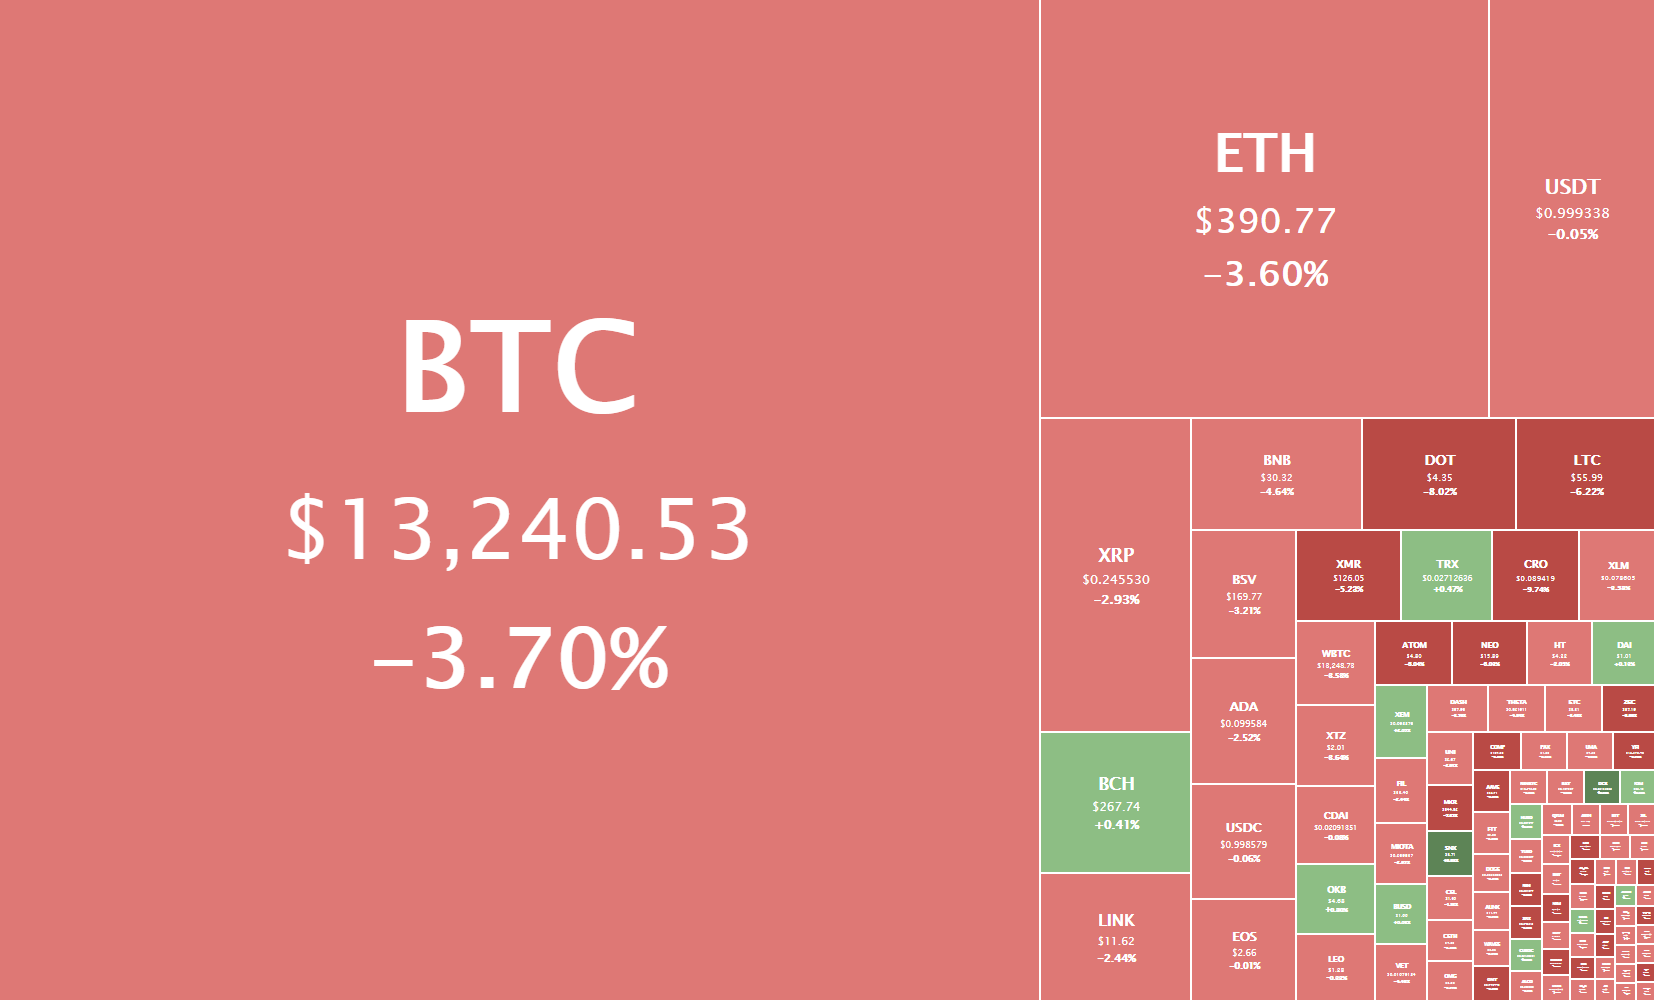
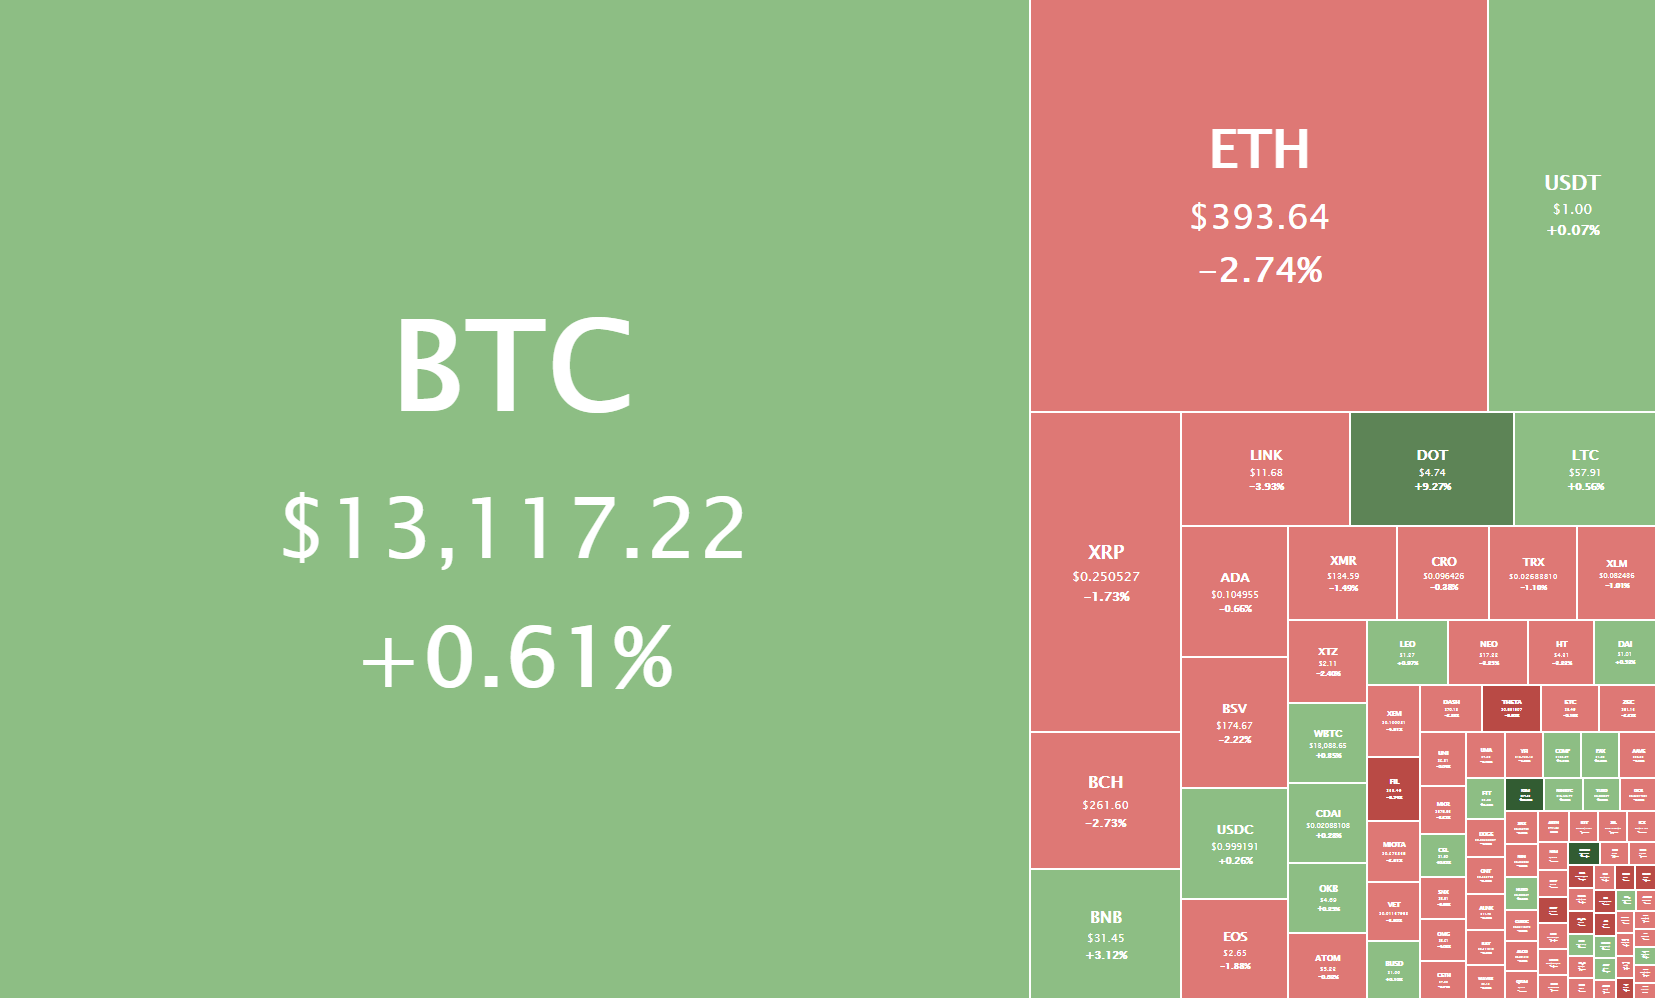
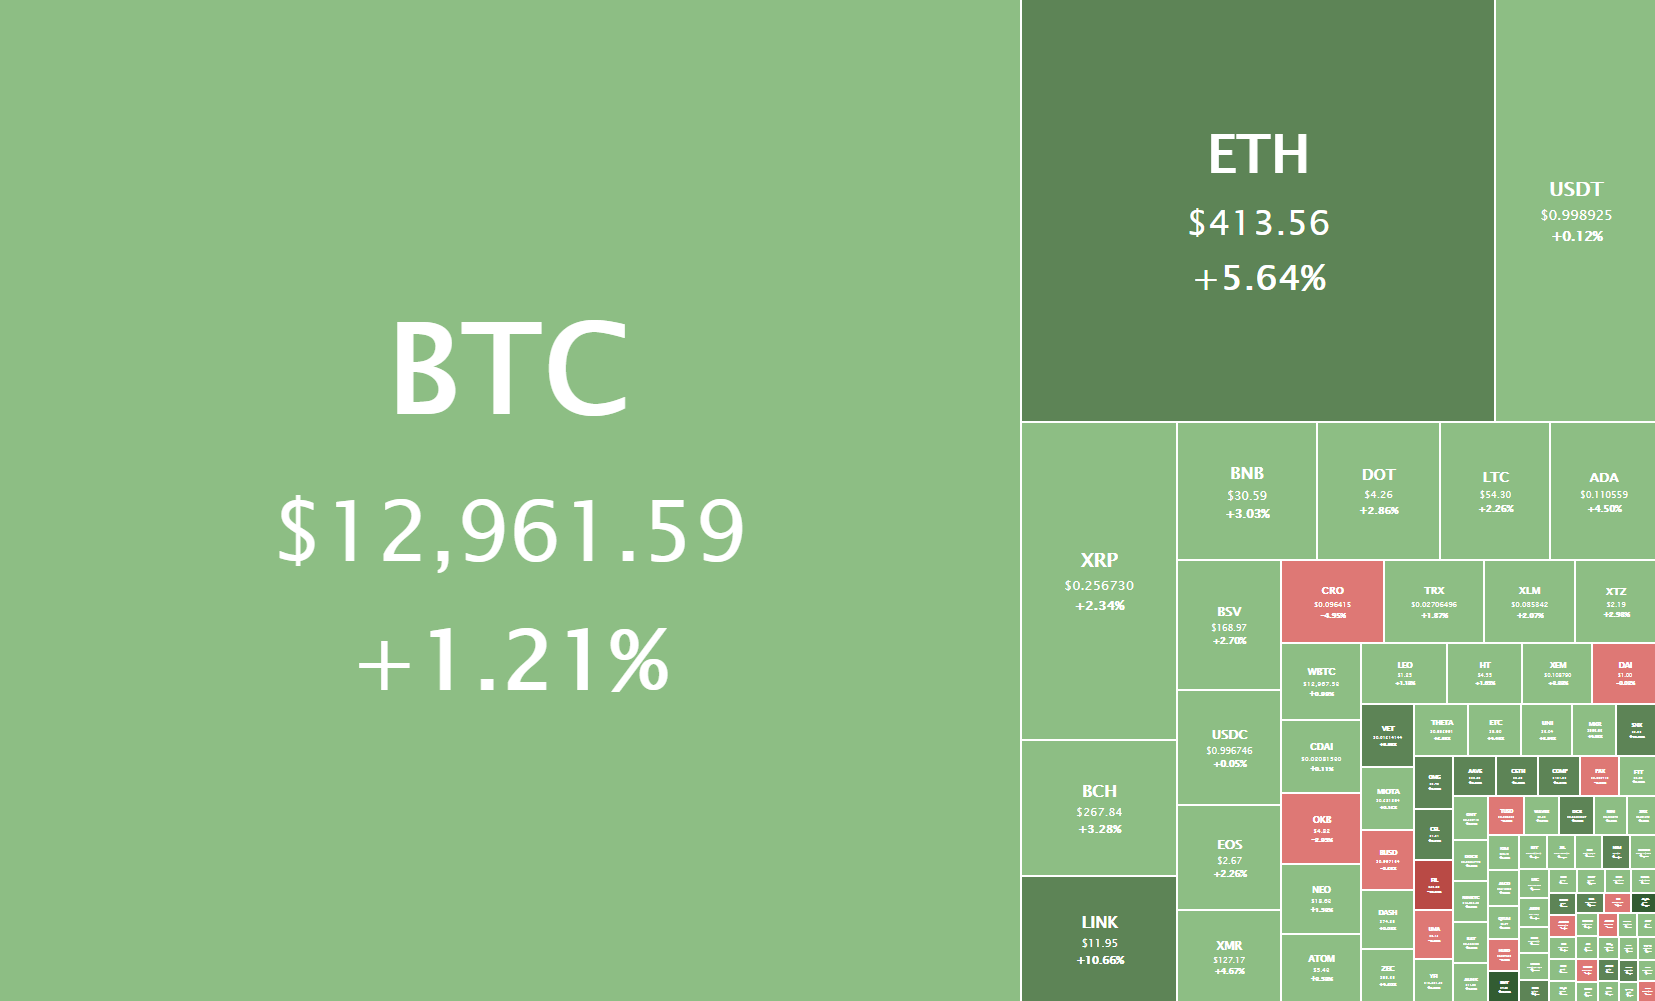
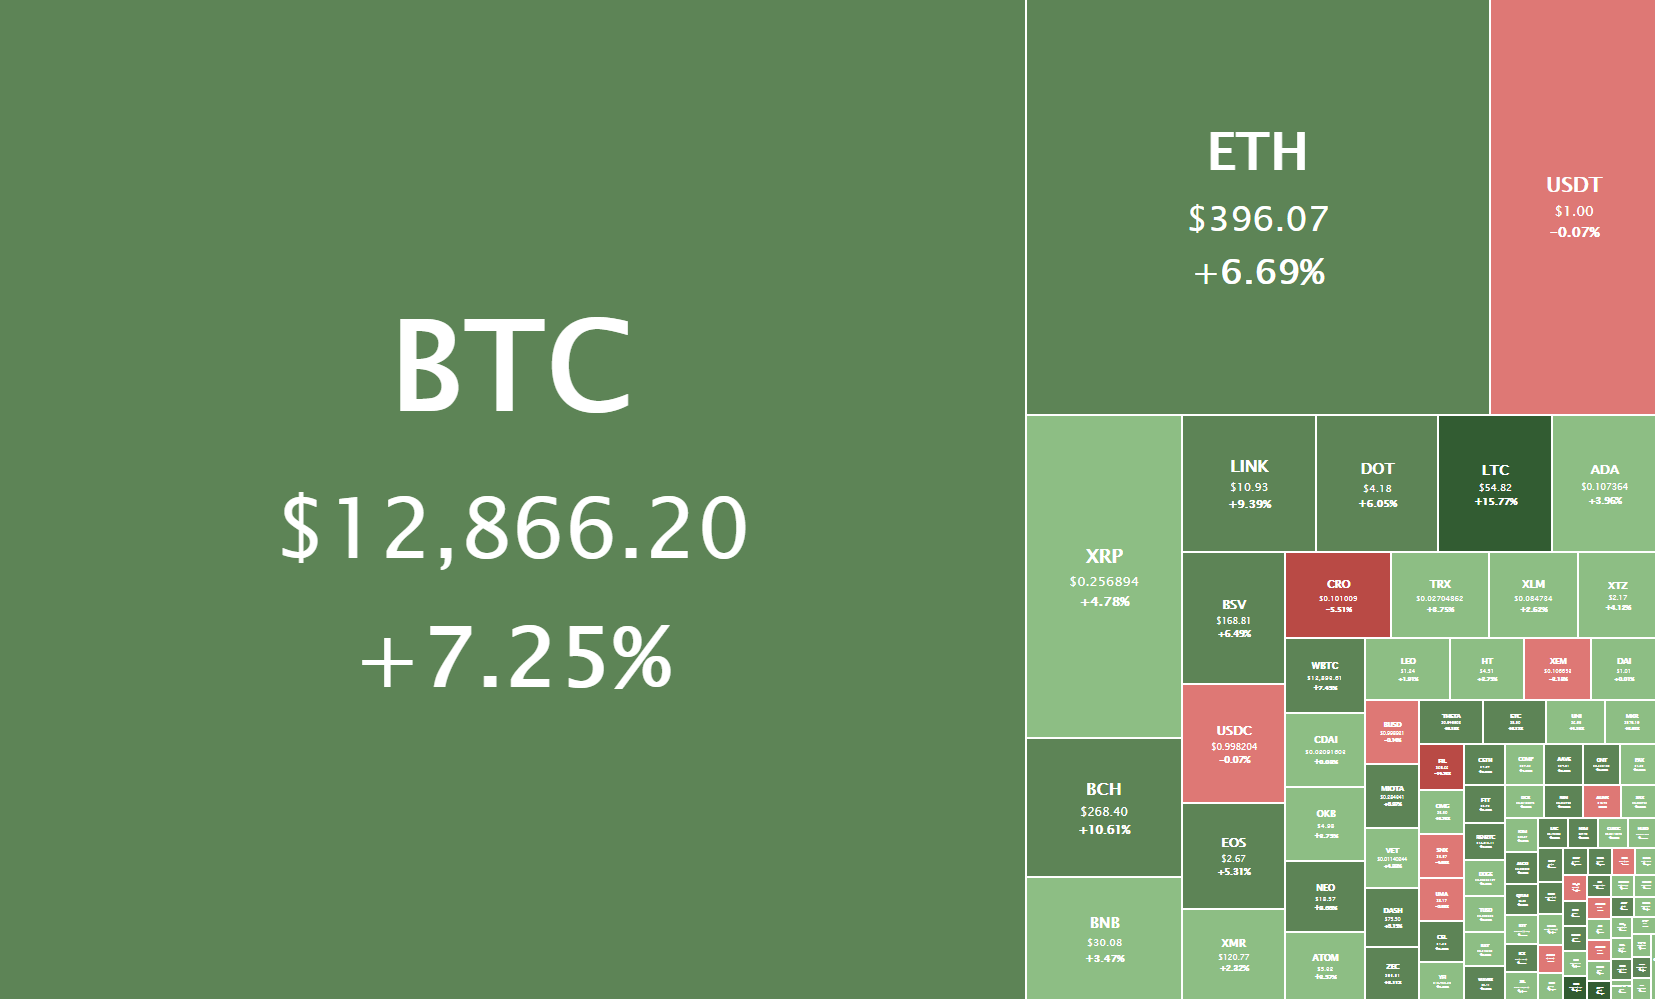
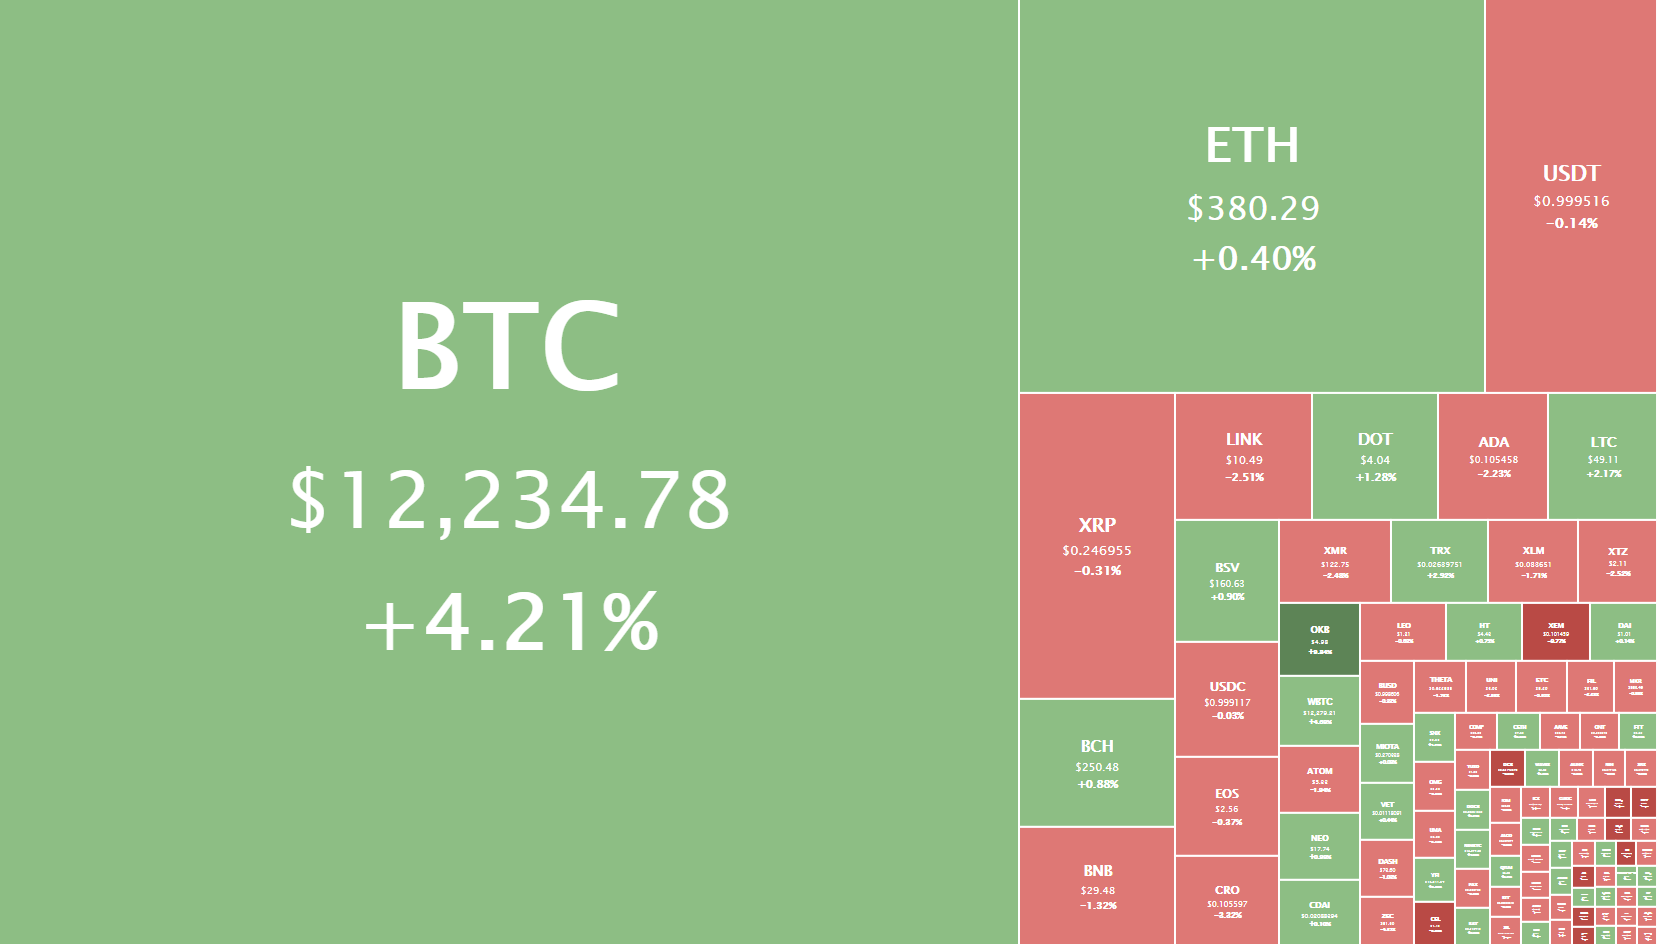
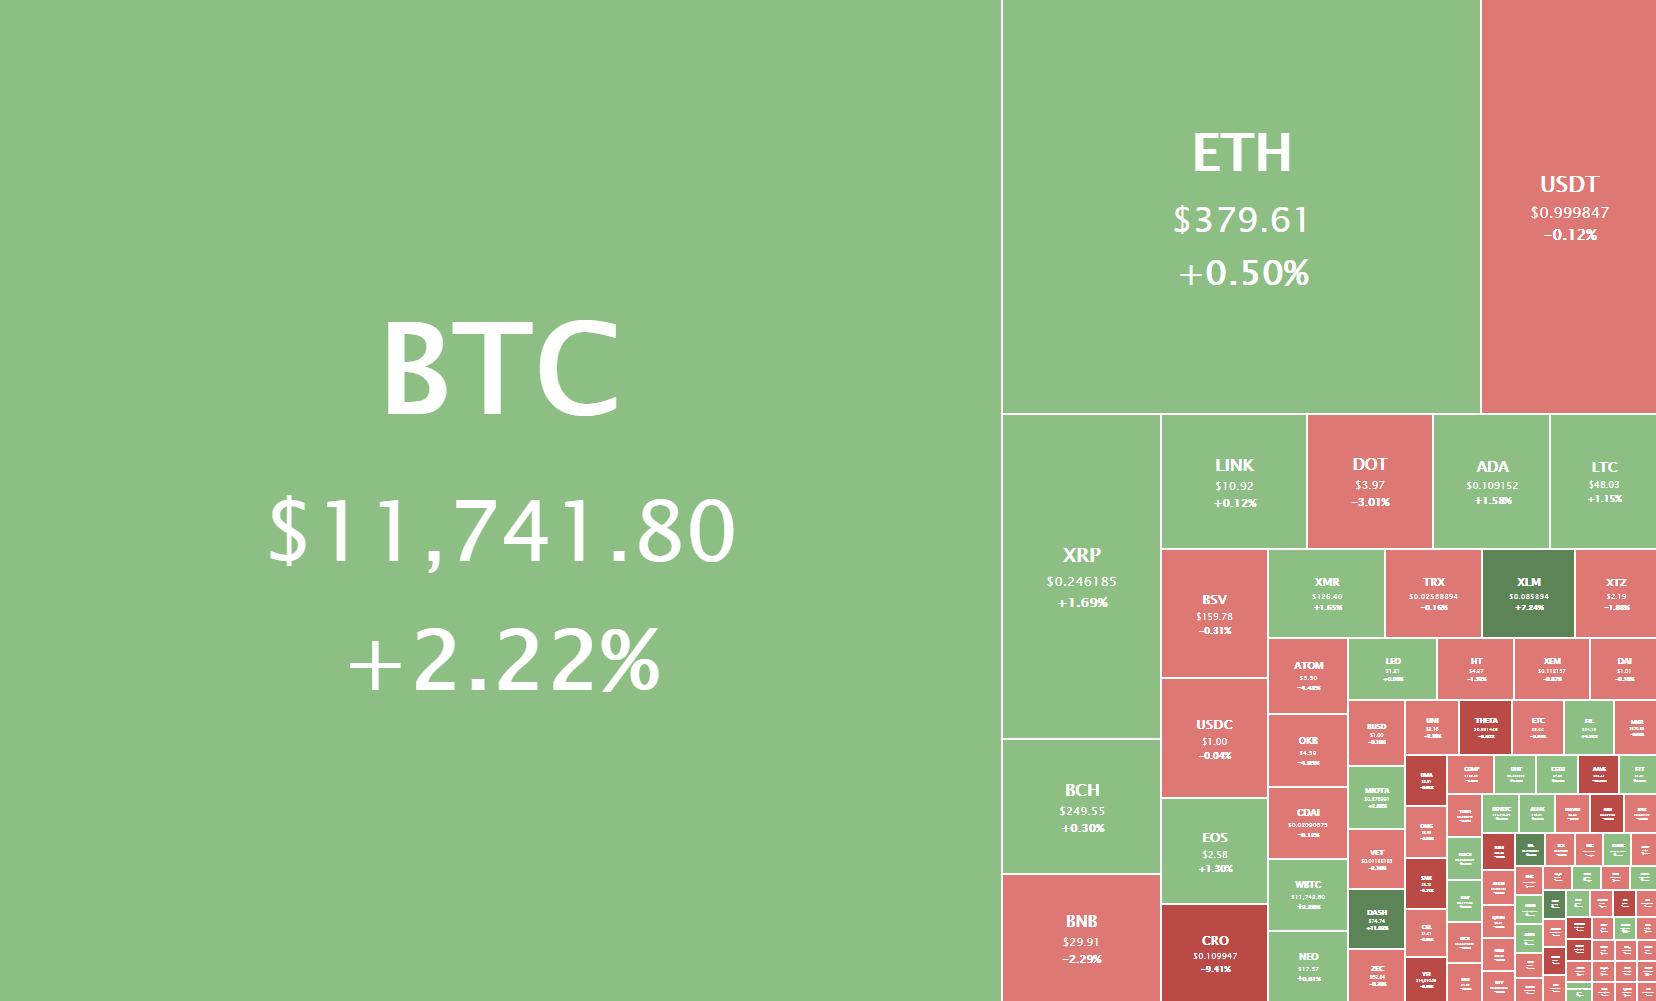
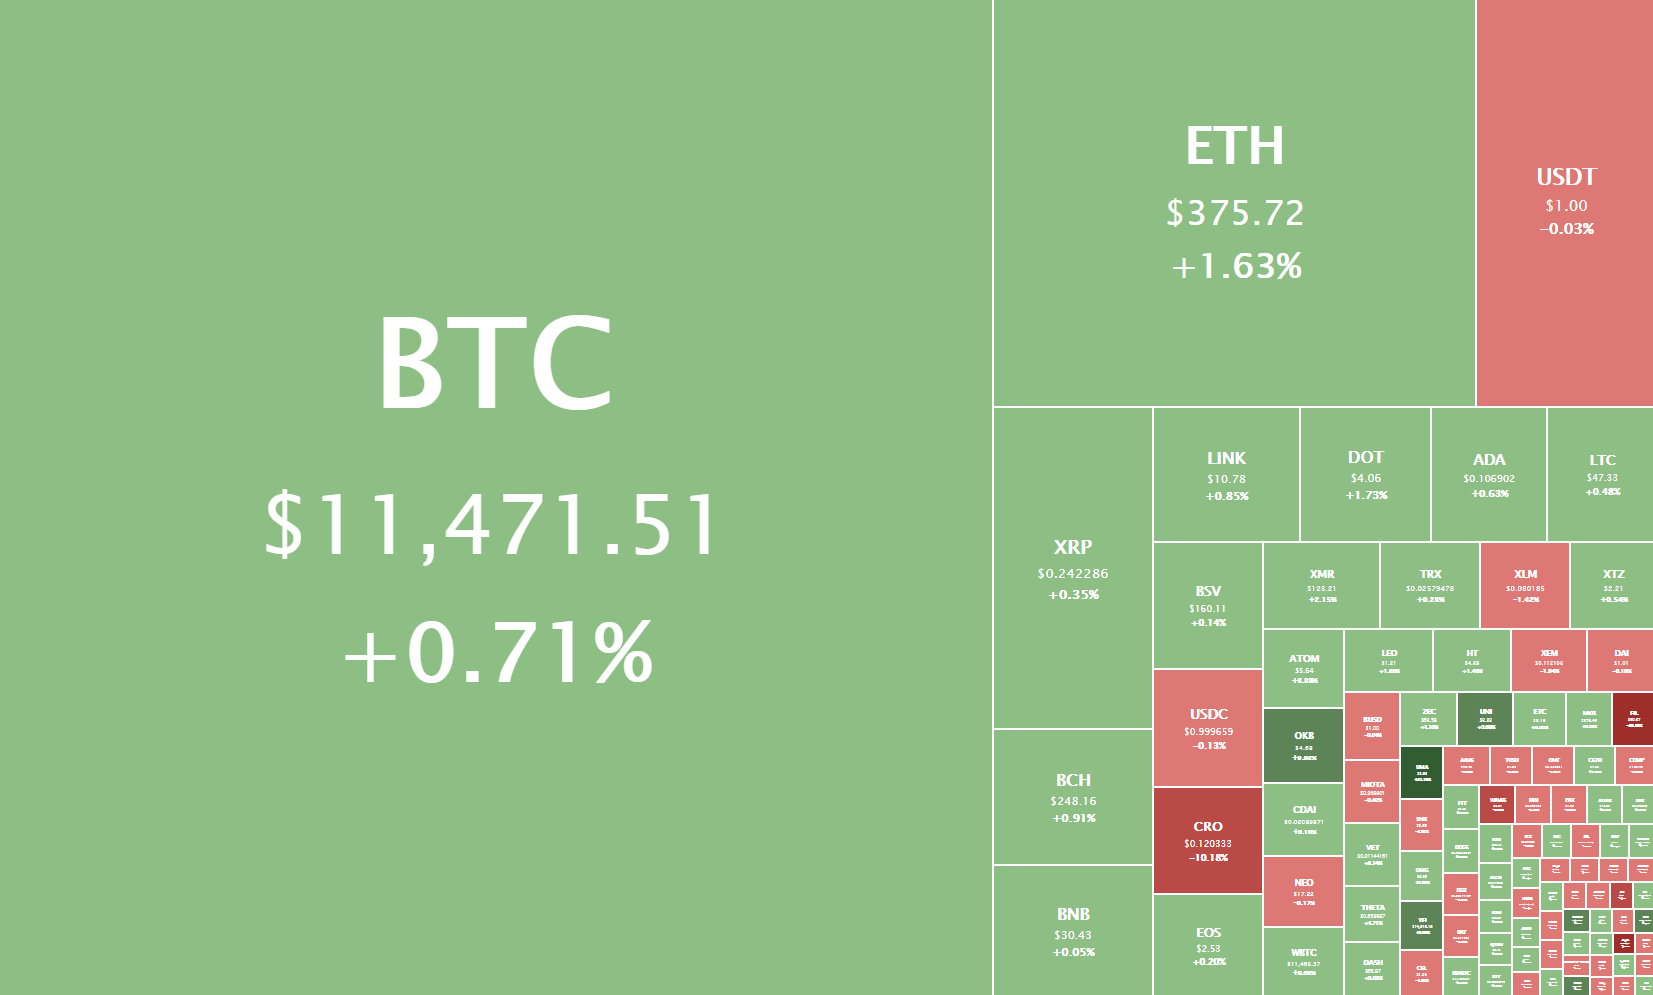
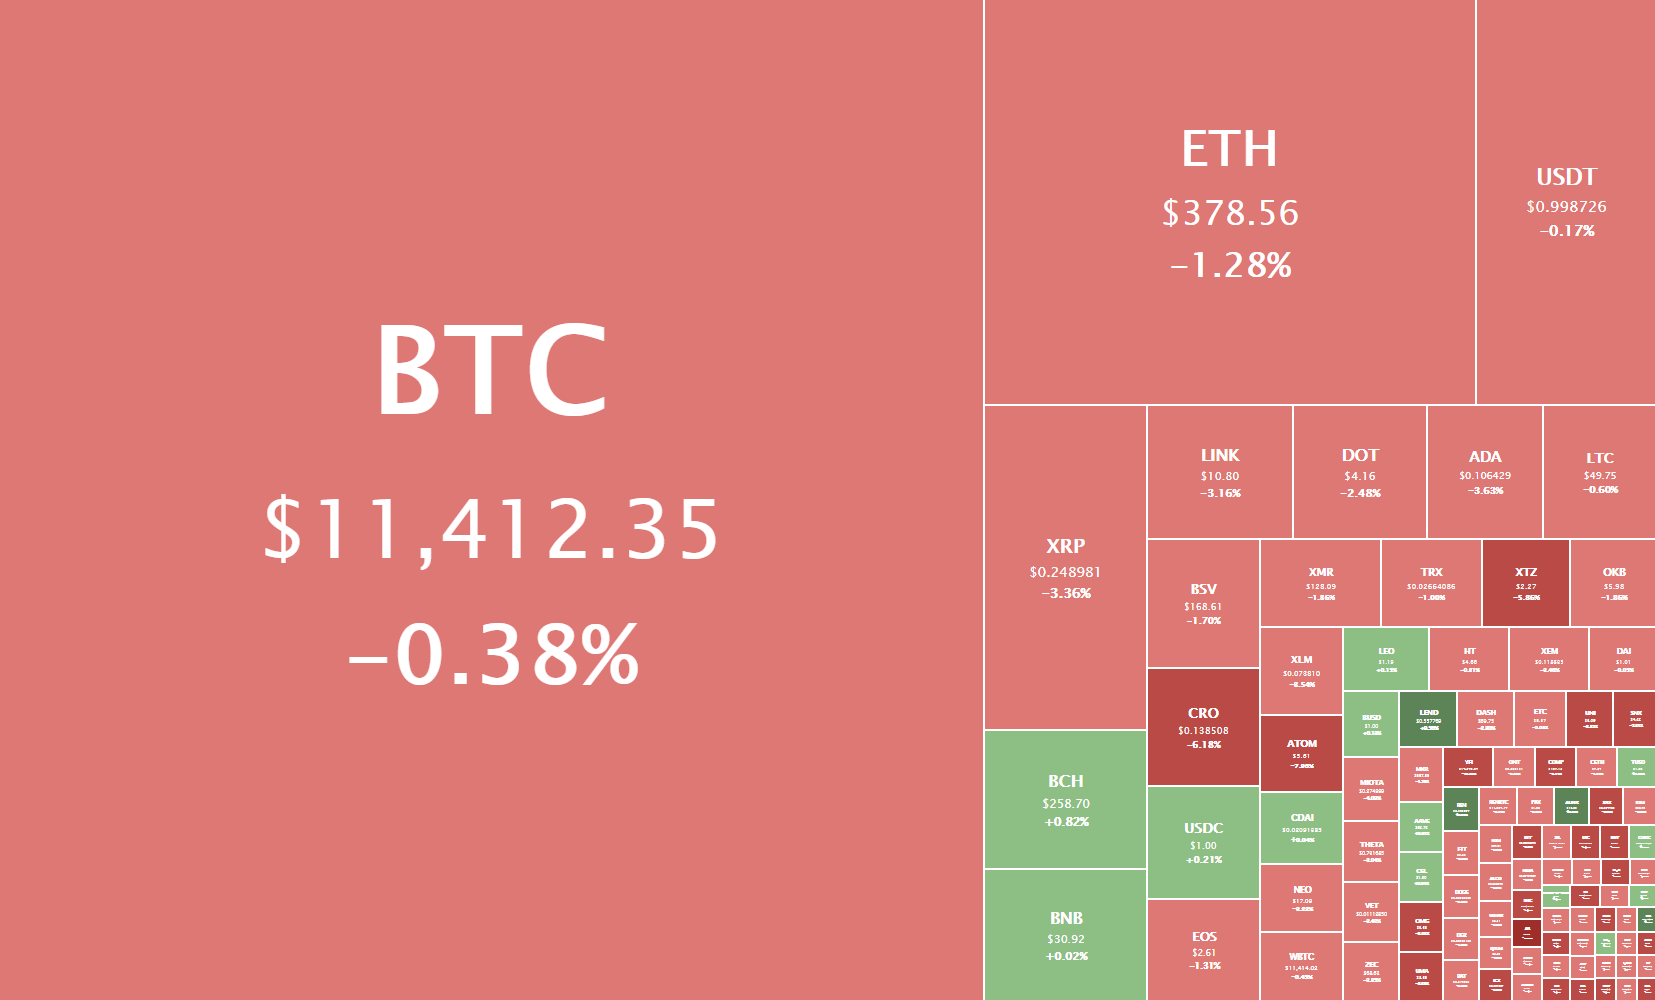
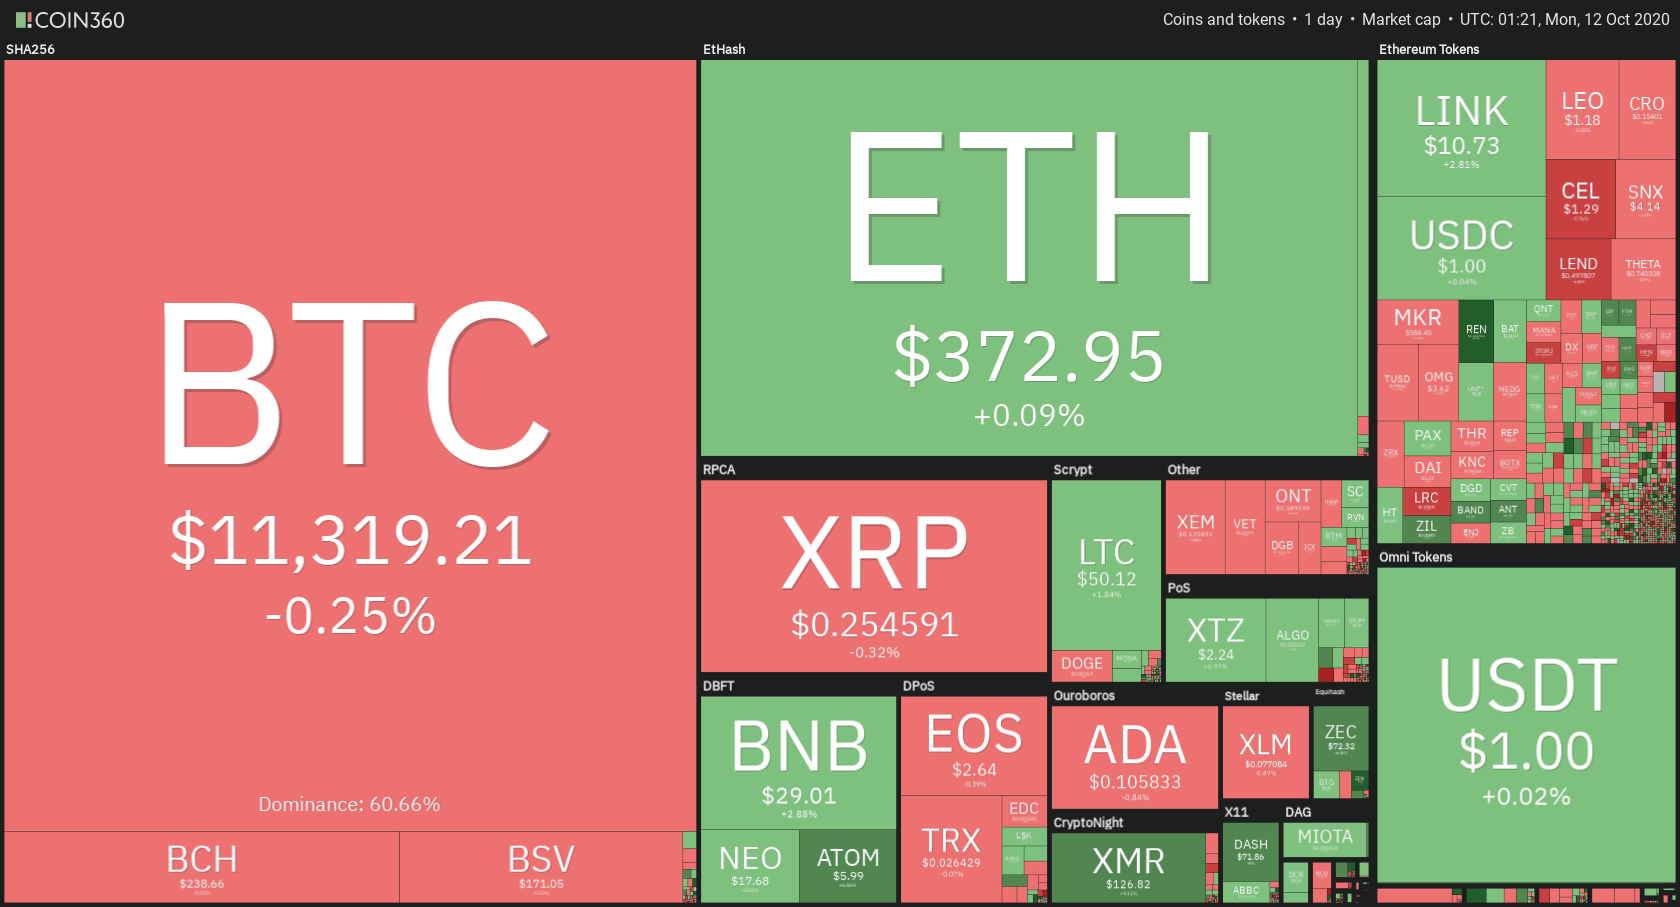
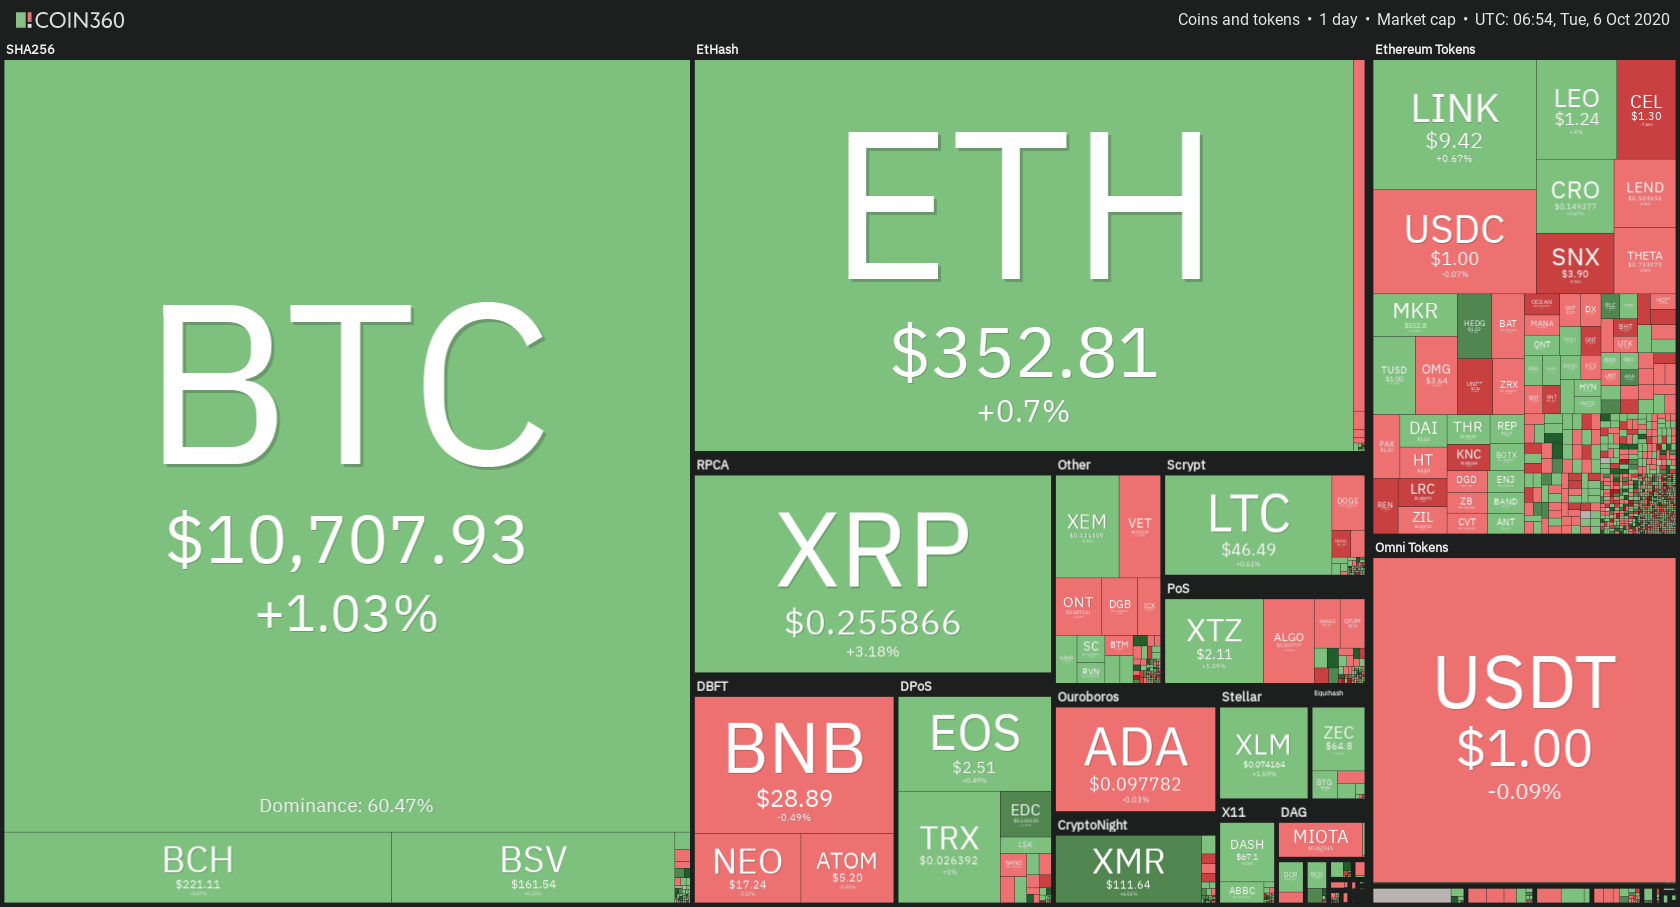
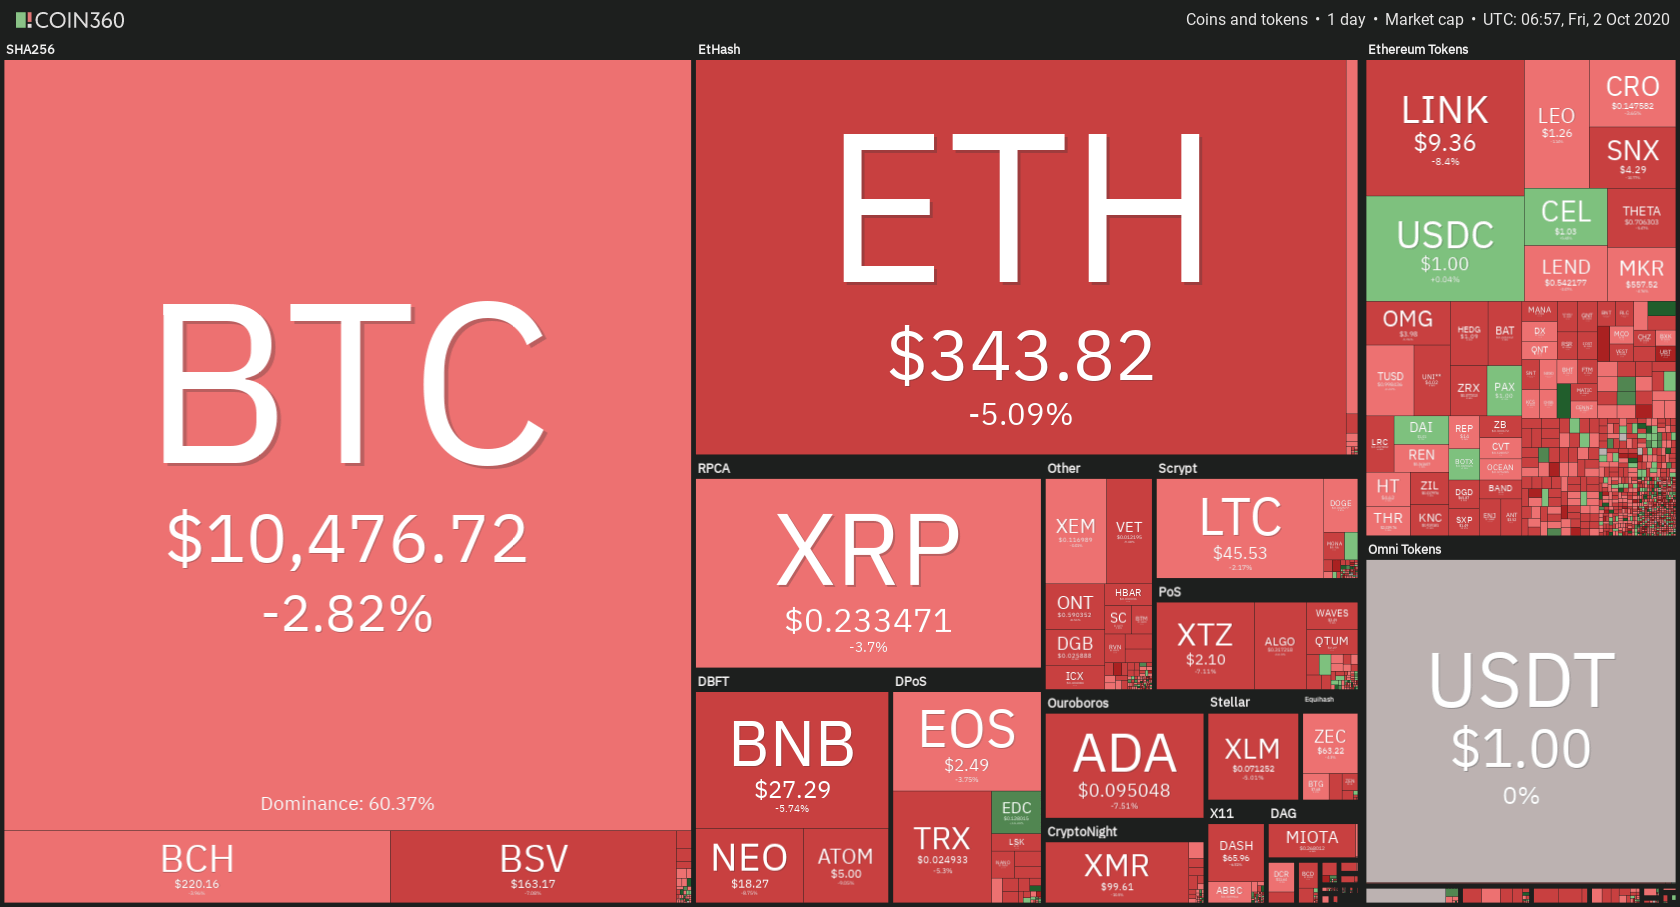
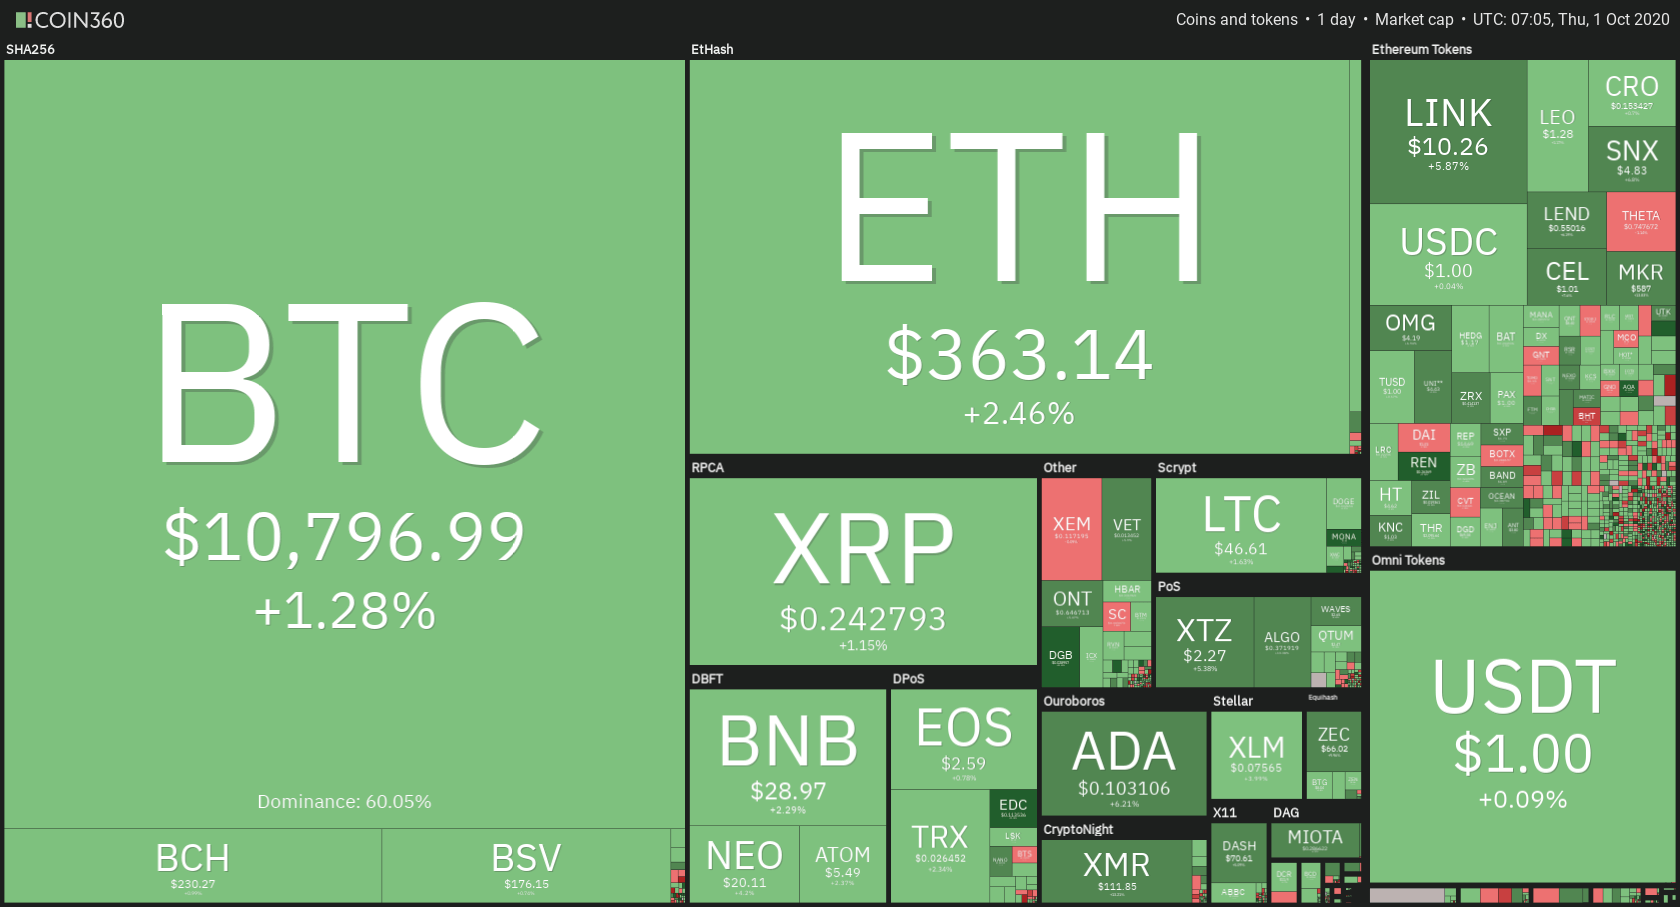
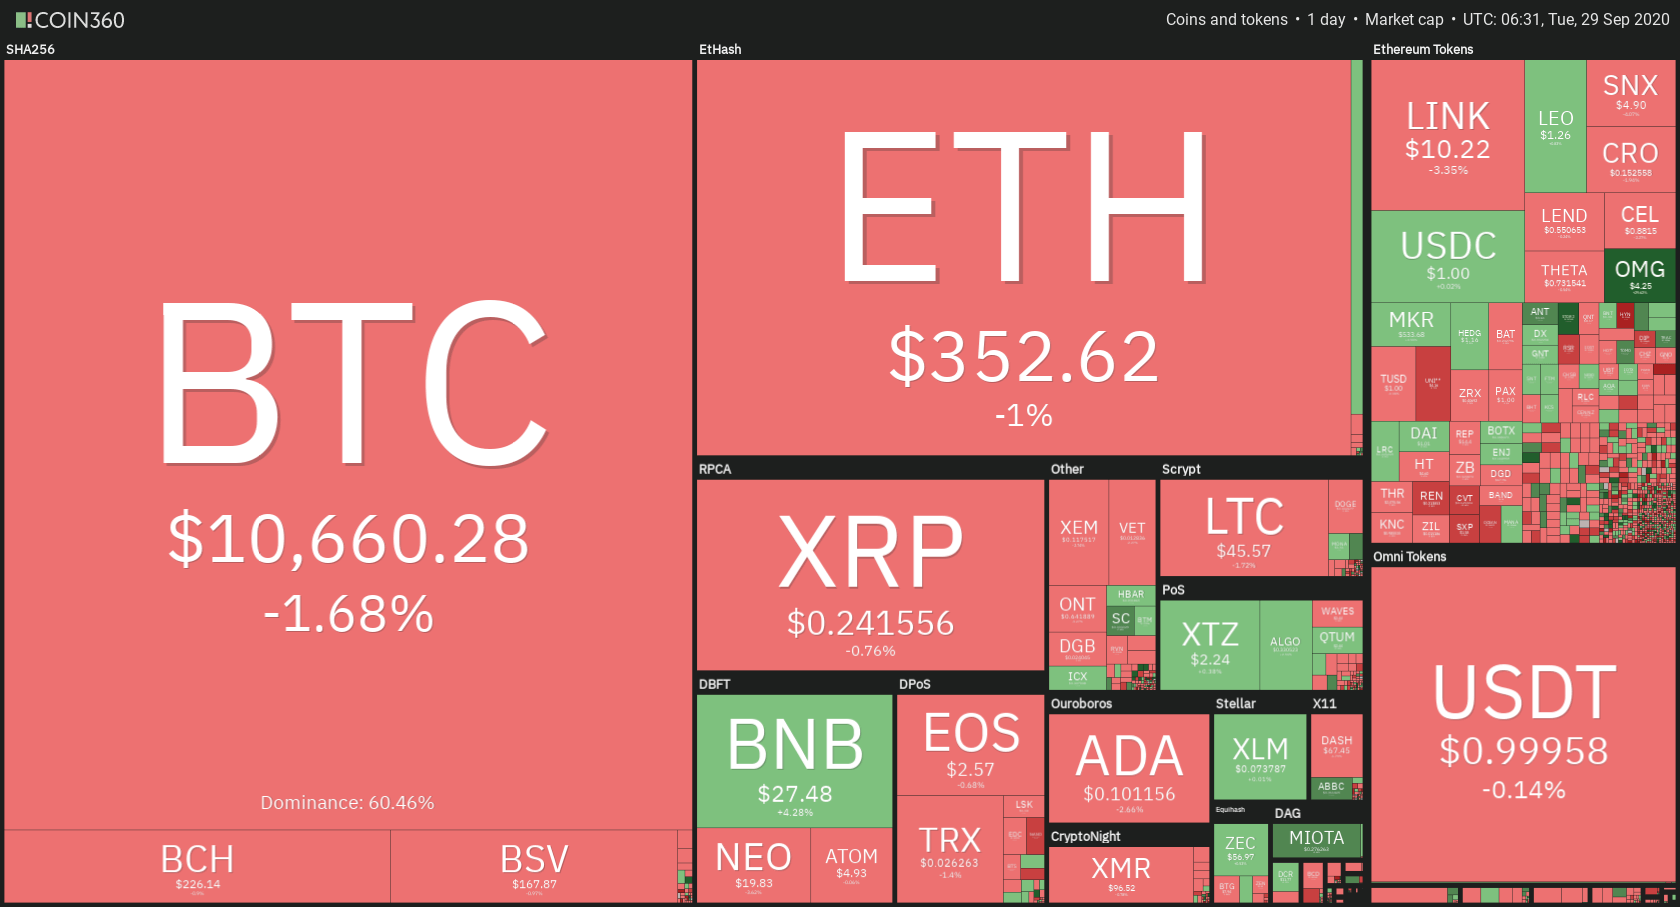
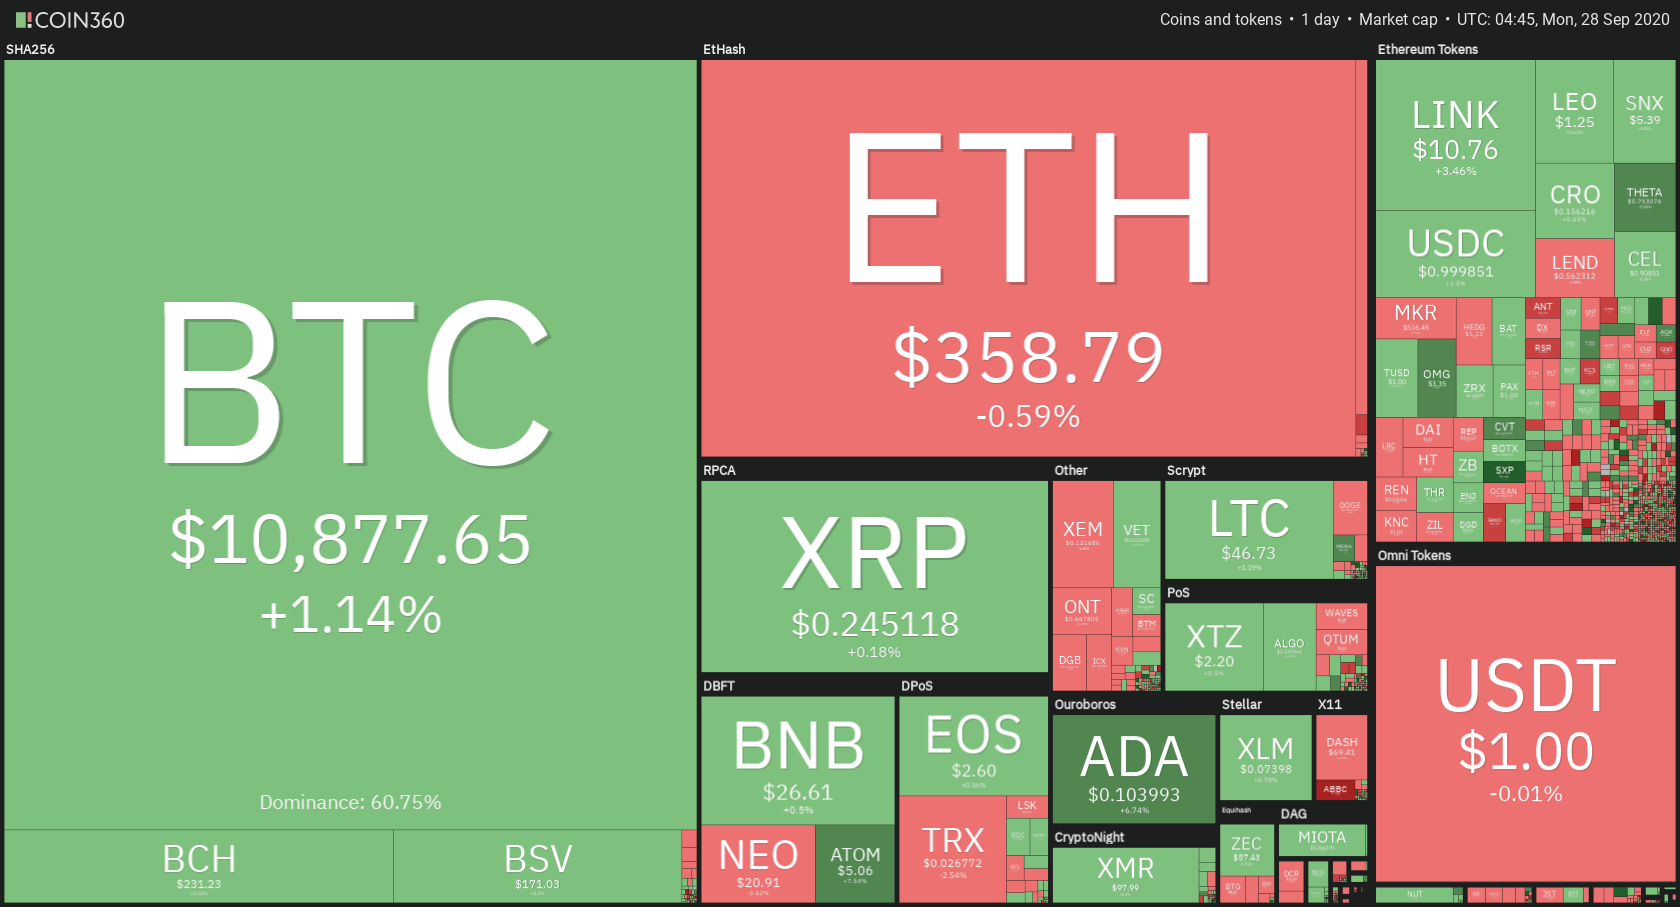
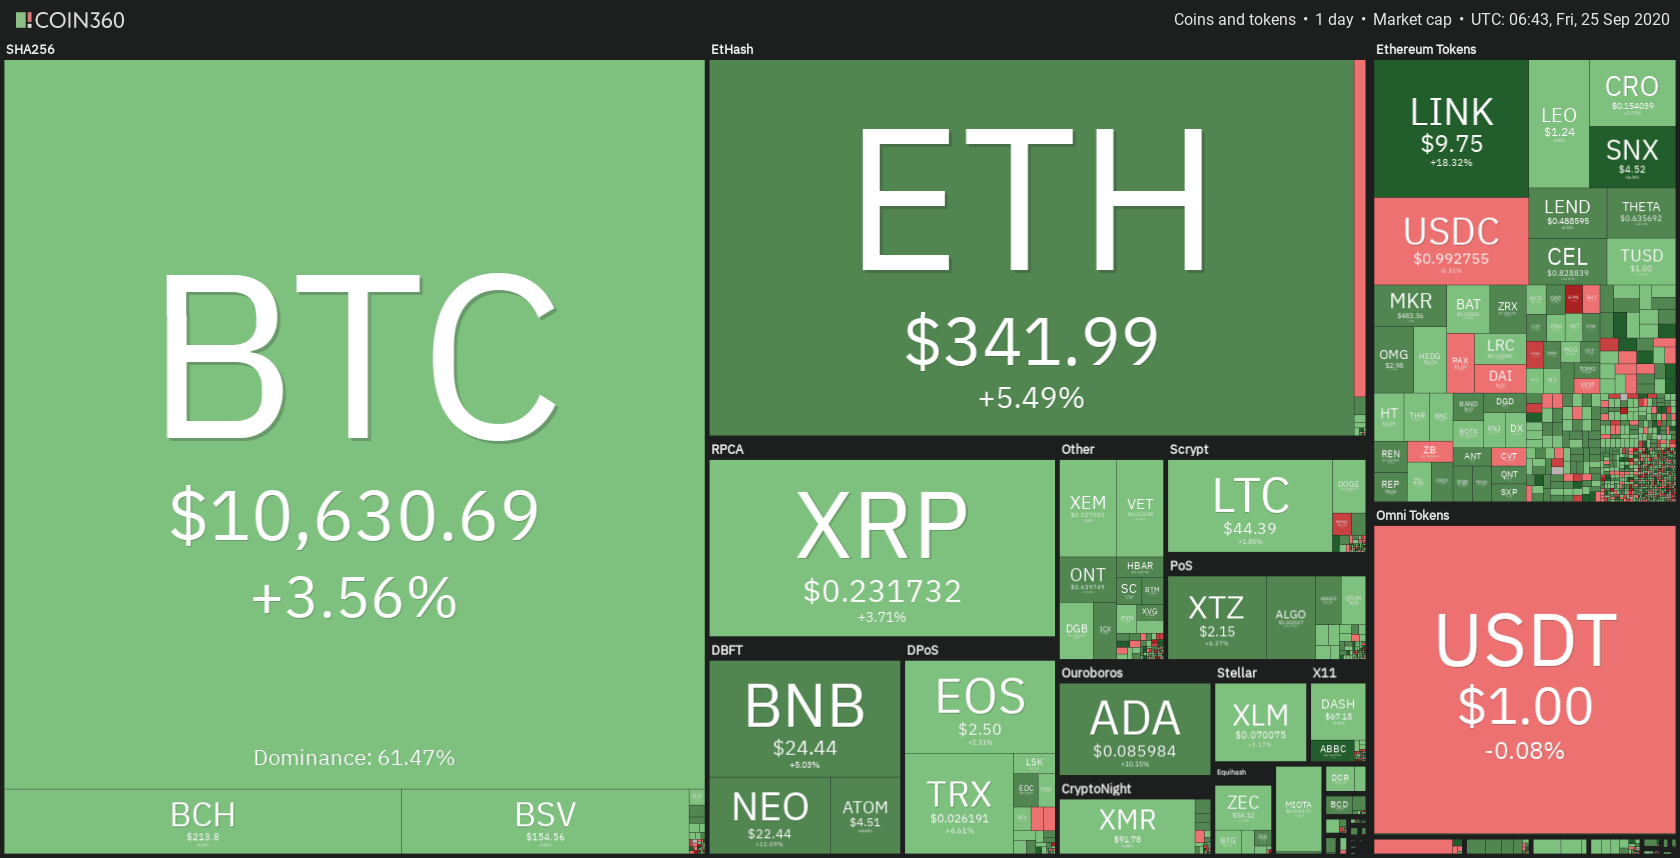
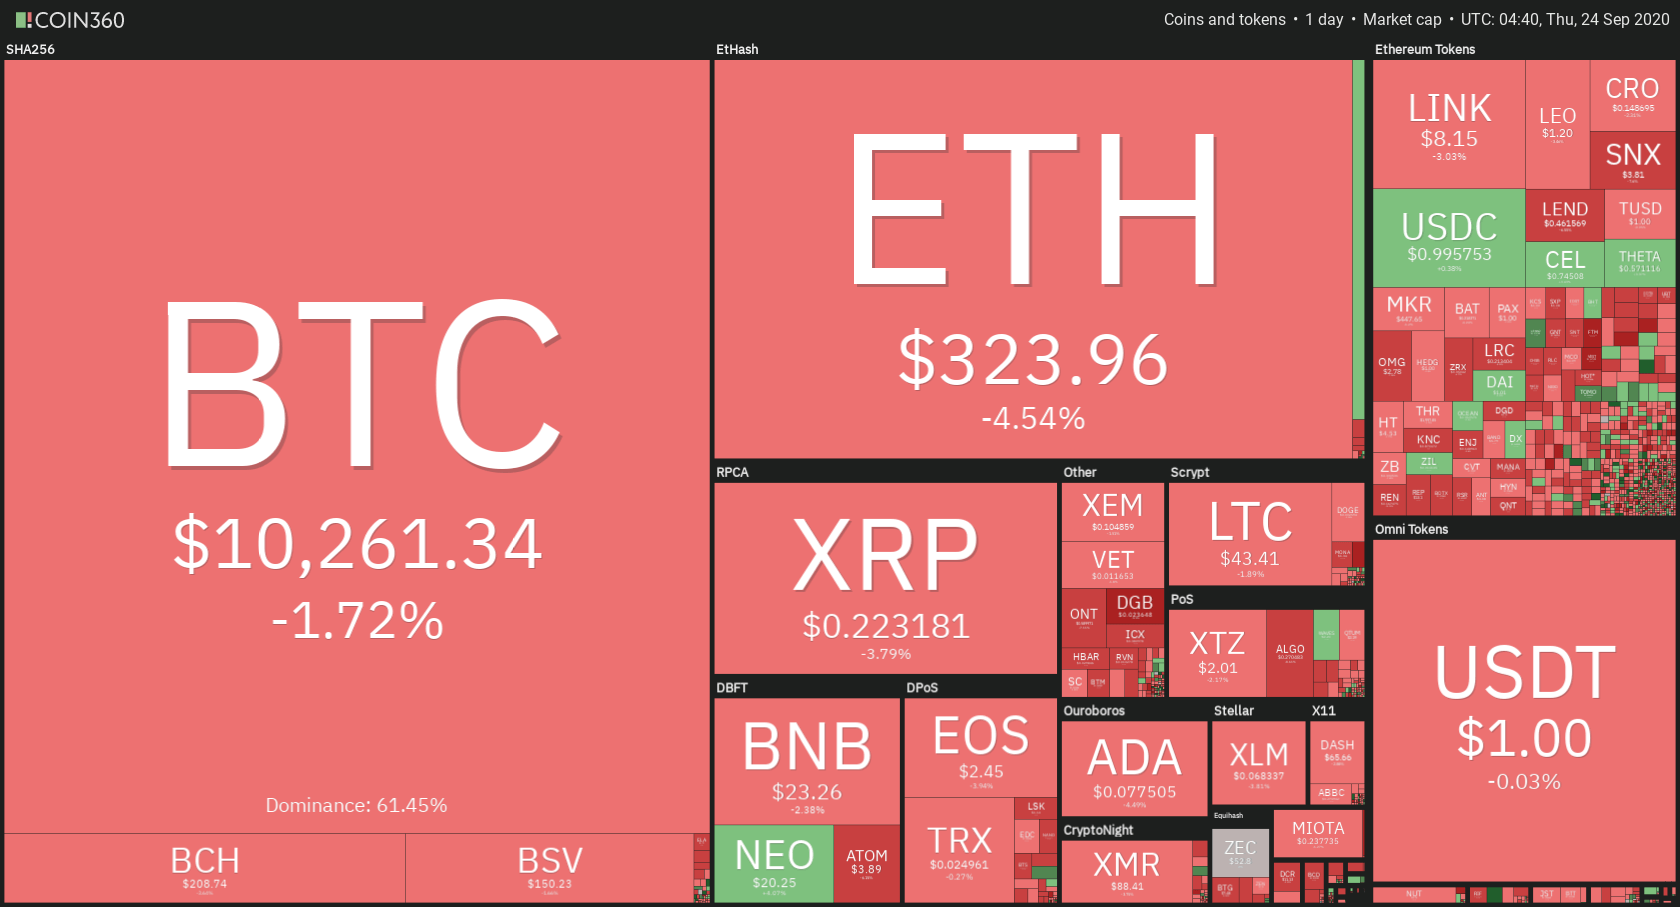
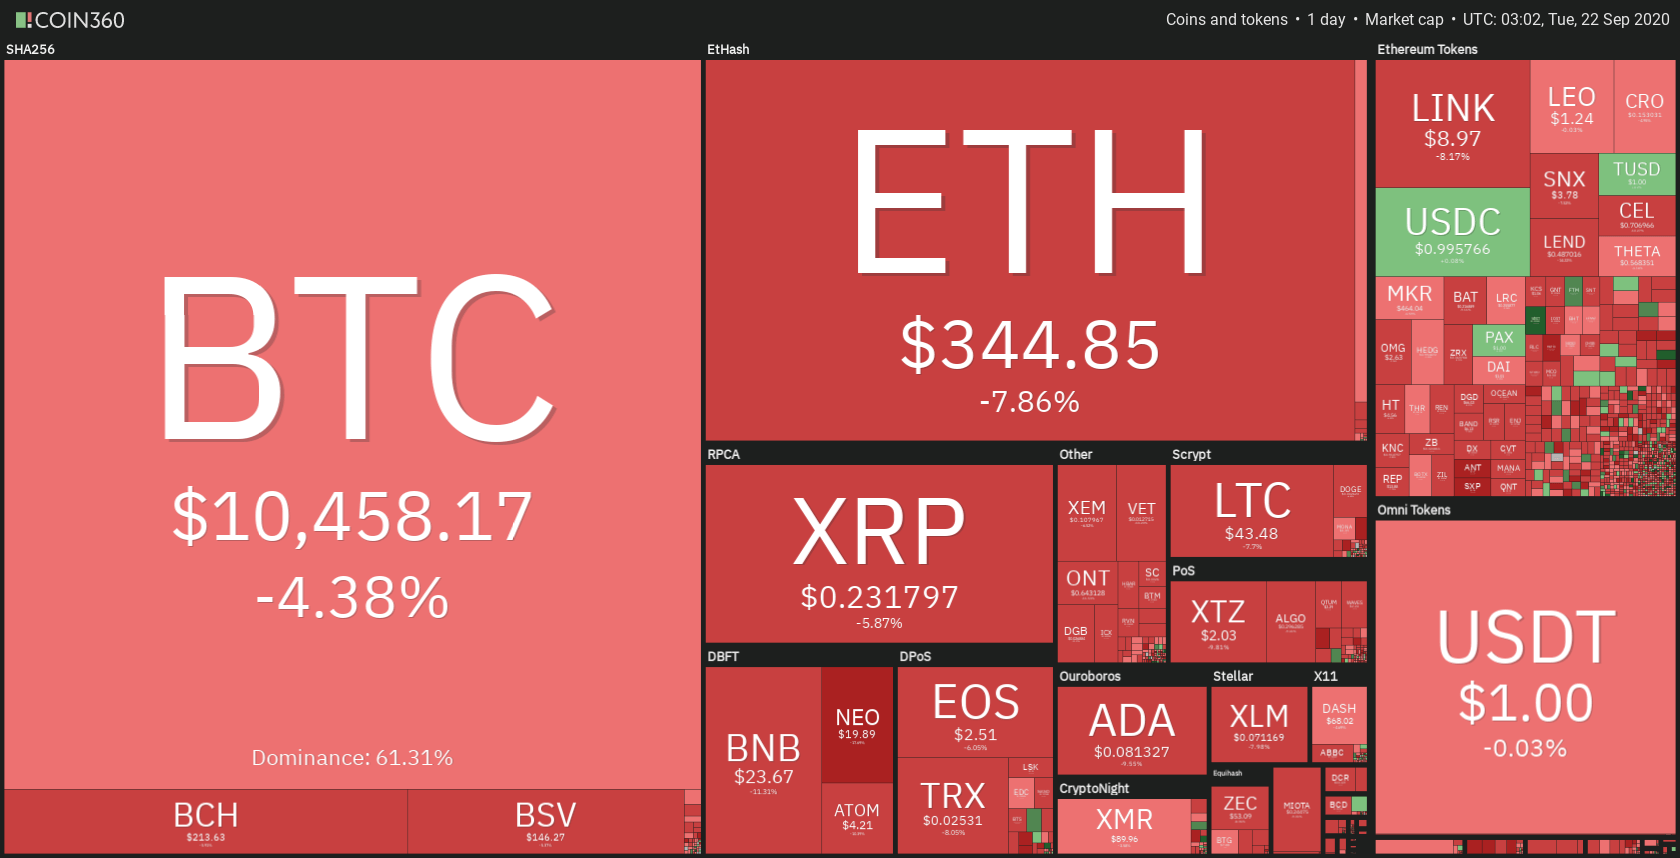
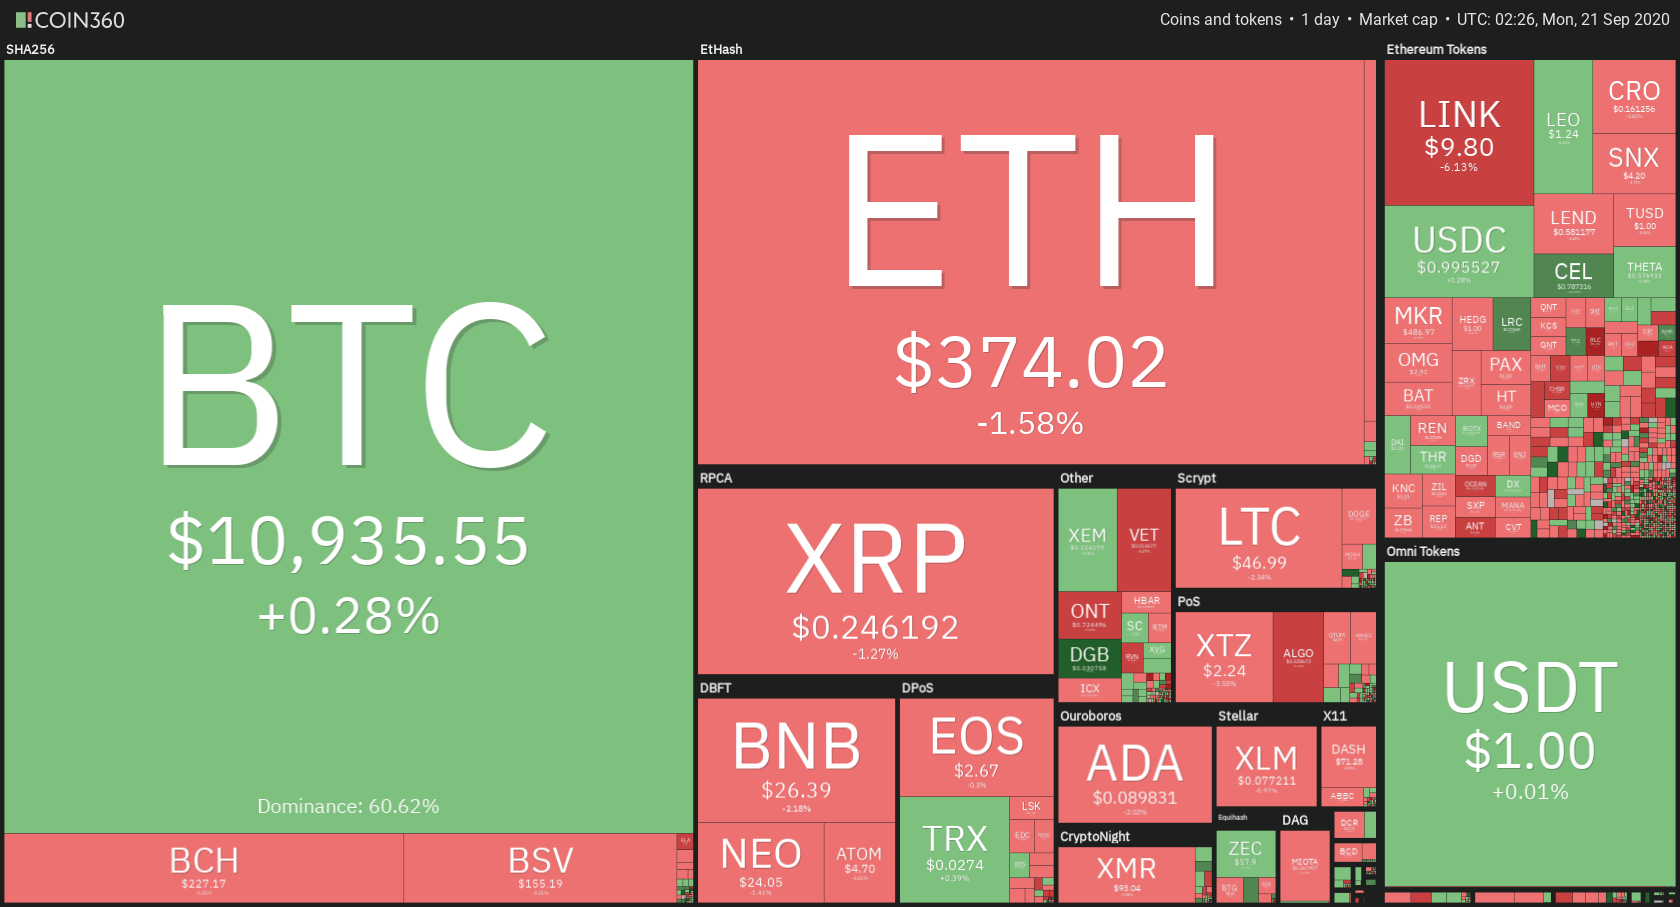
Daily Crypto Sector Heat Map
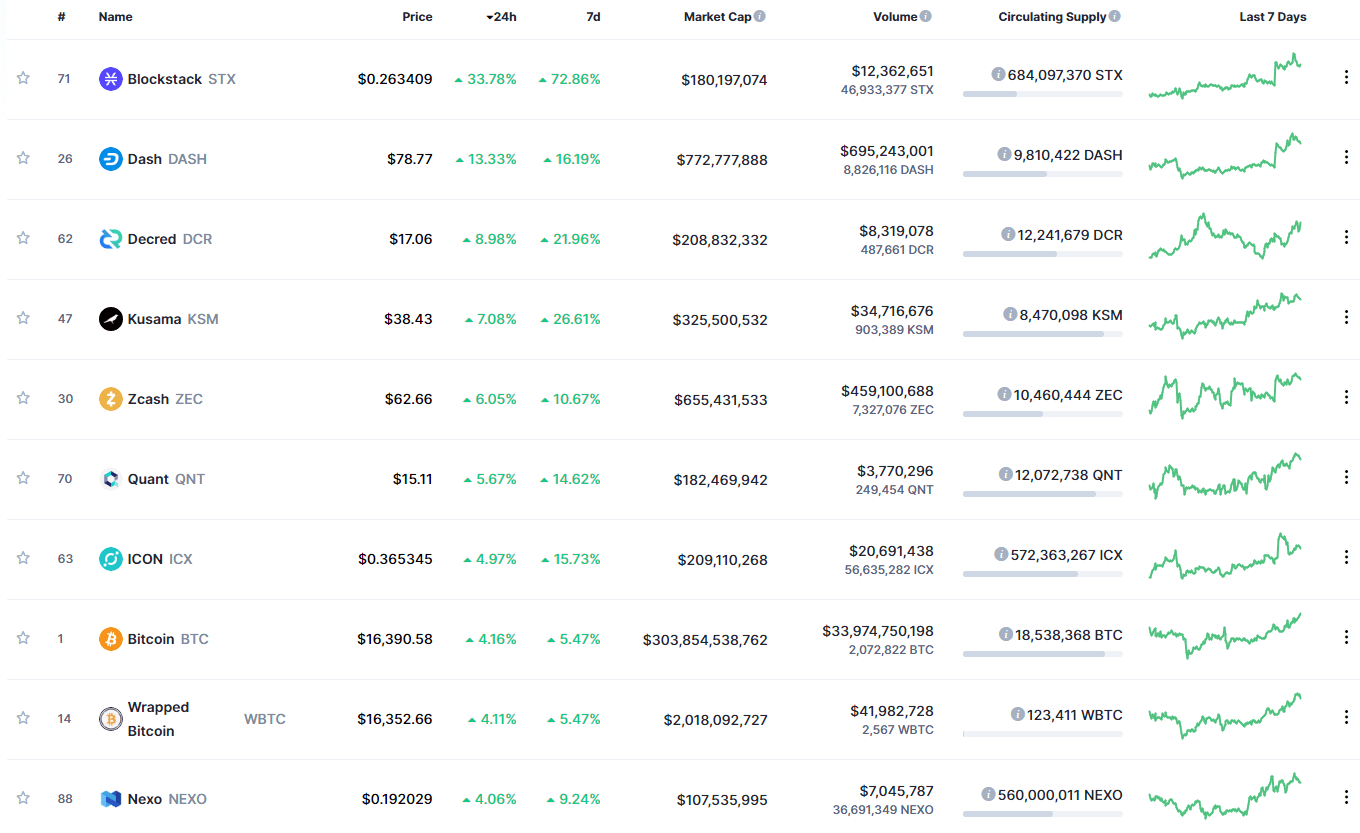
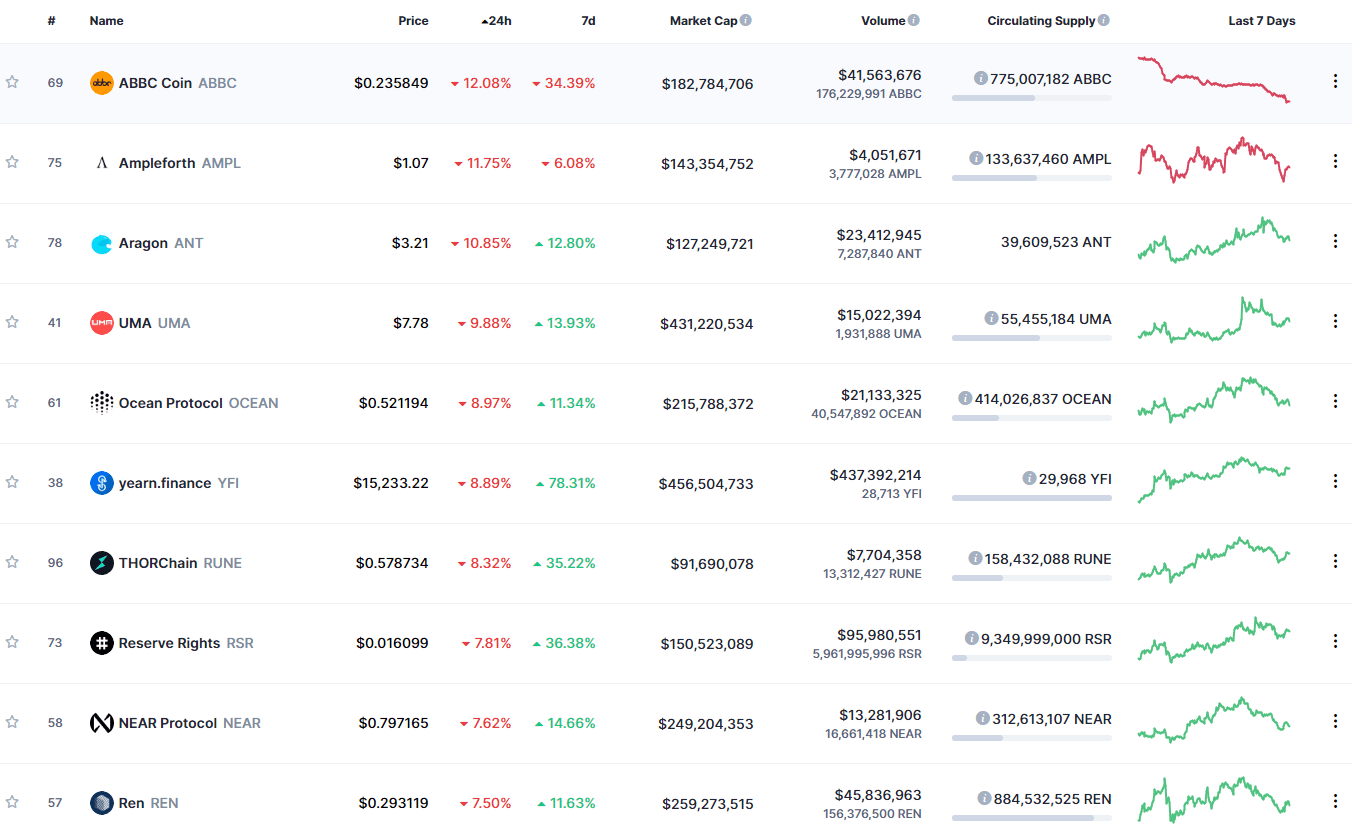
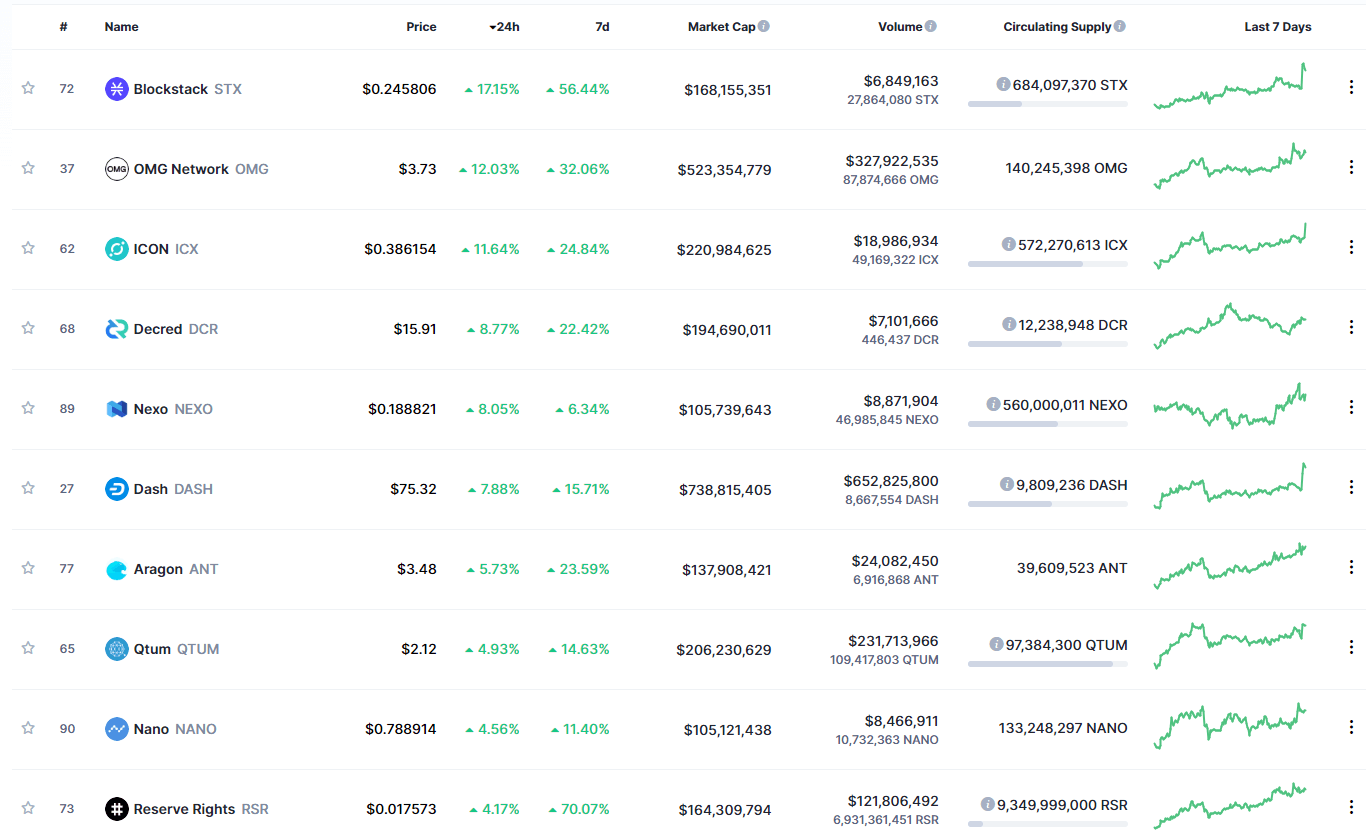
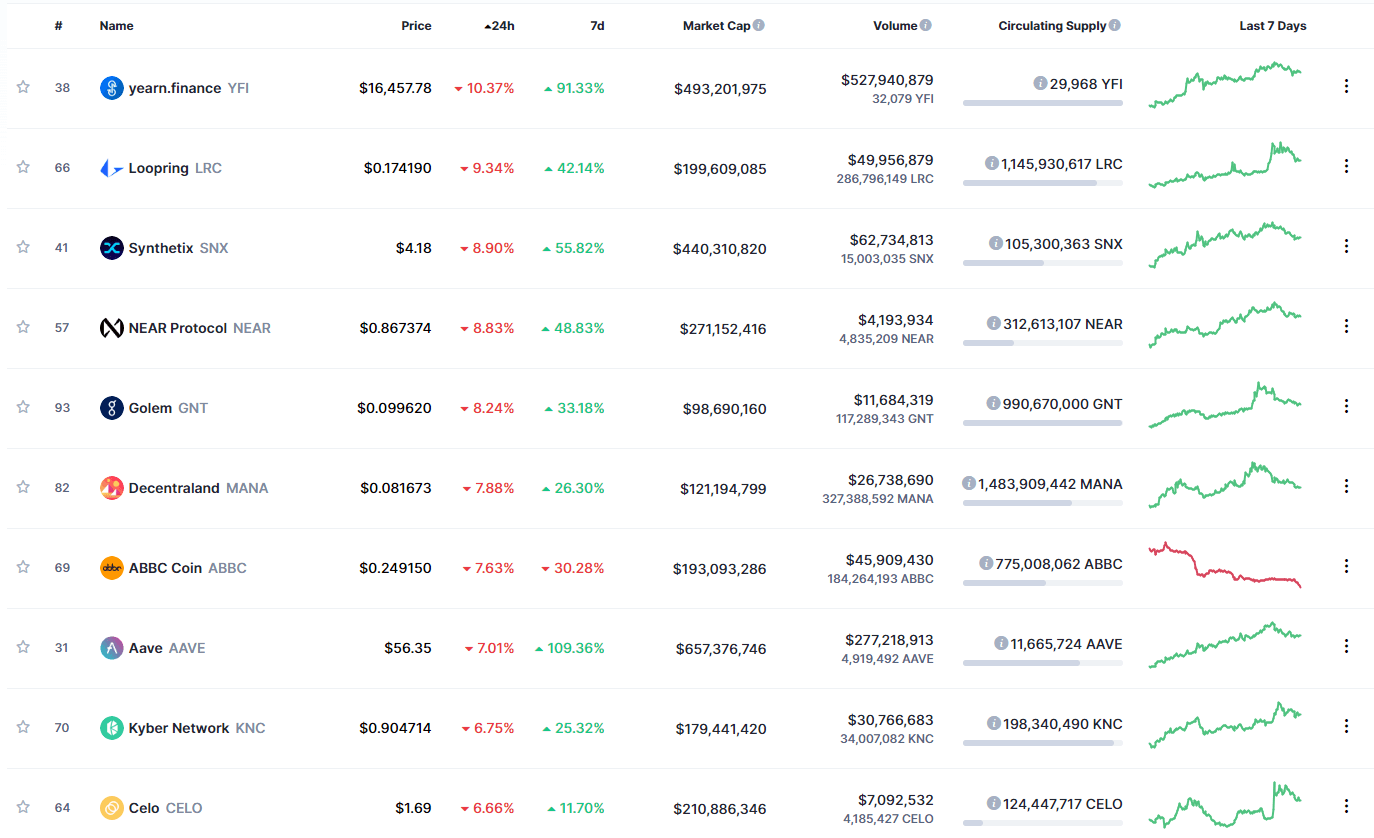
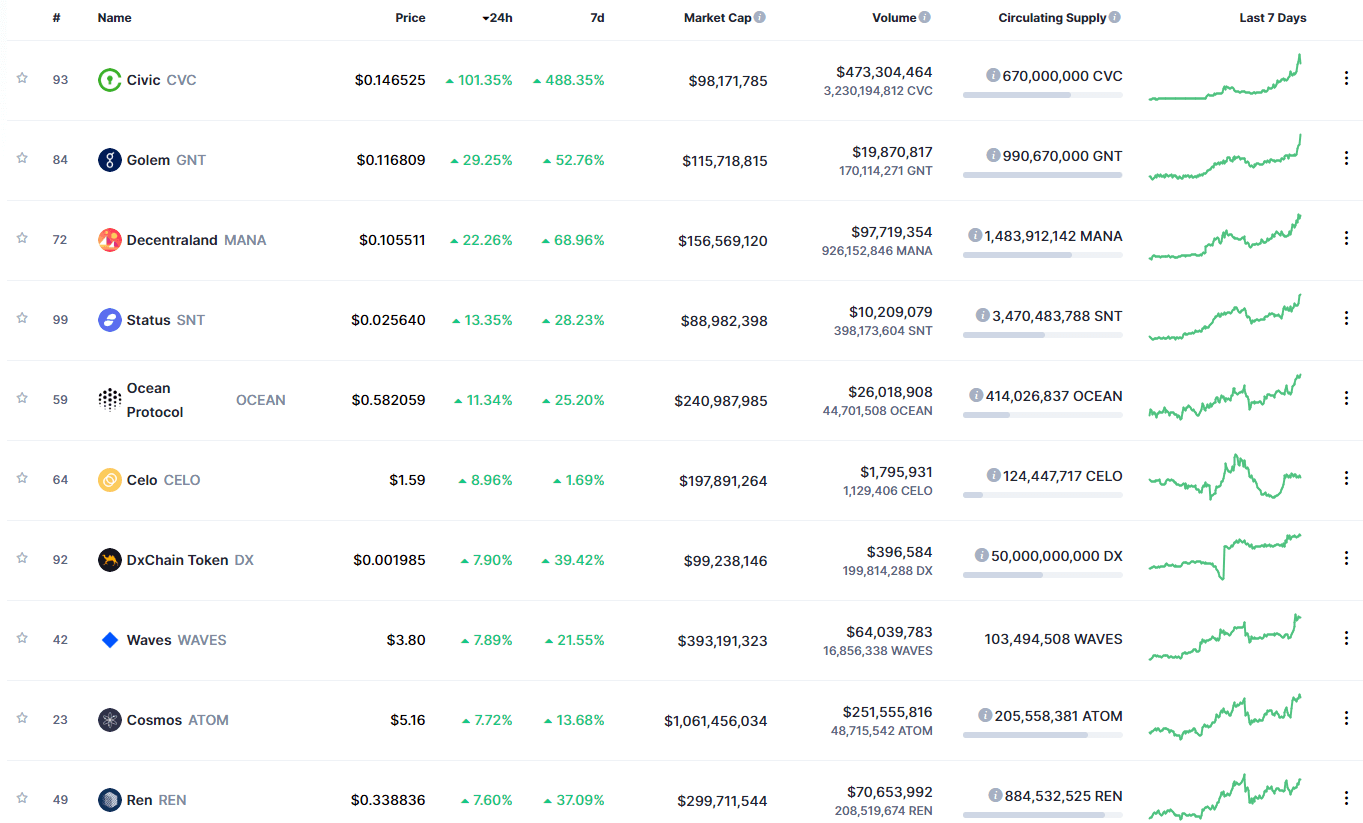
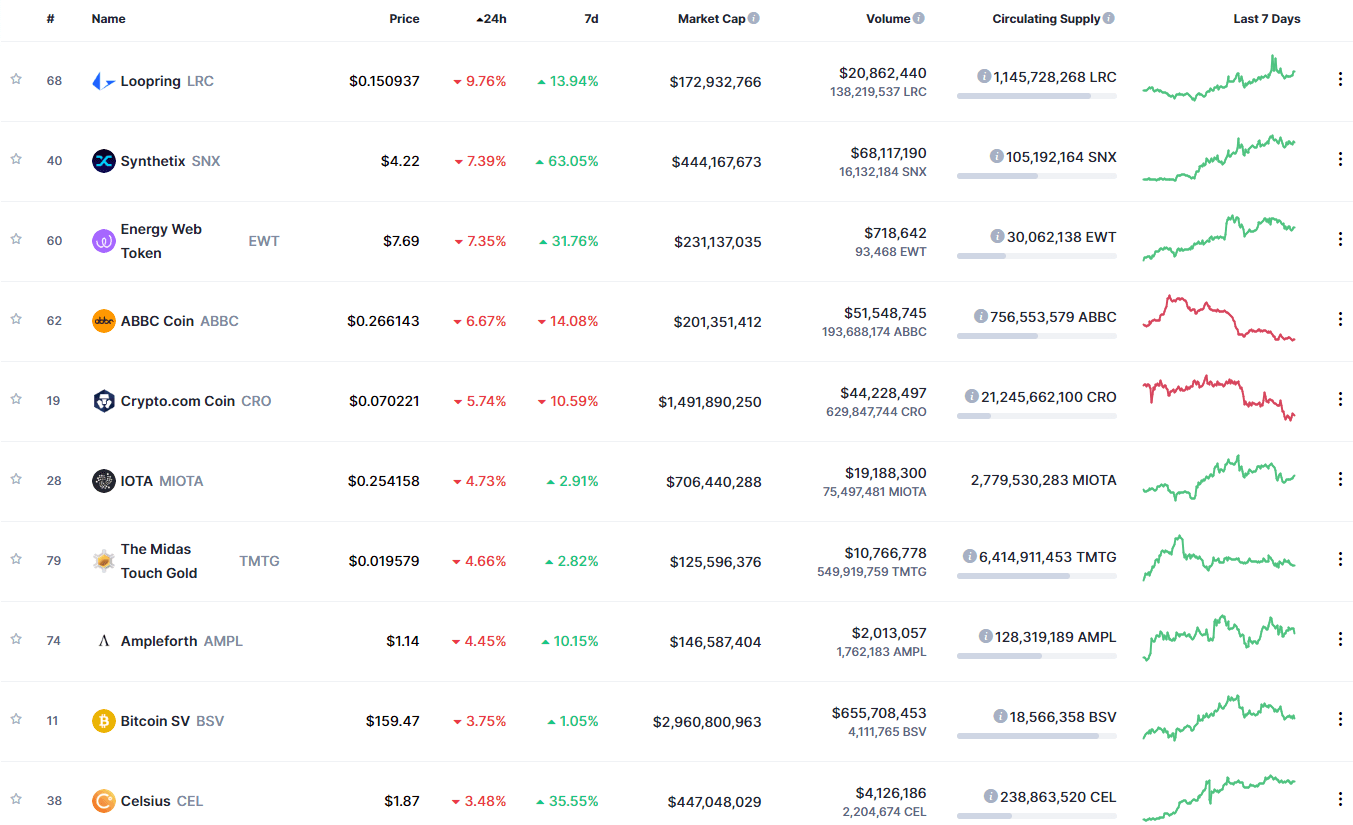
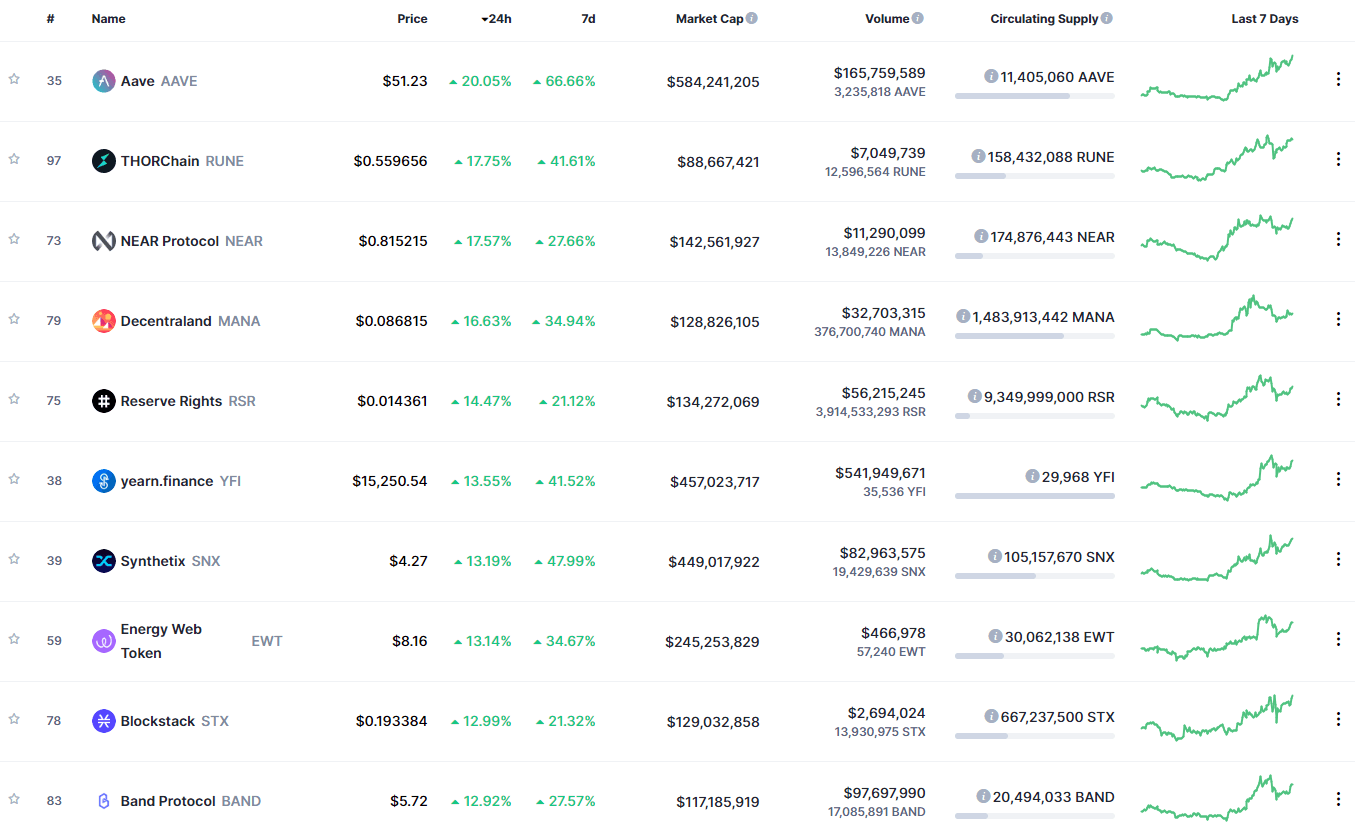
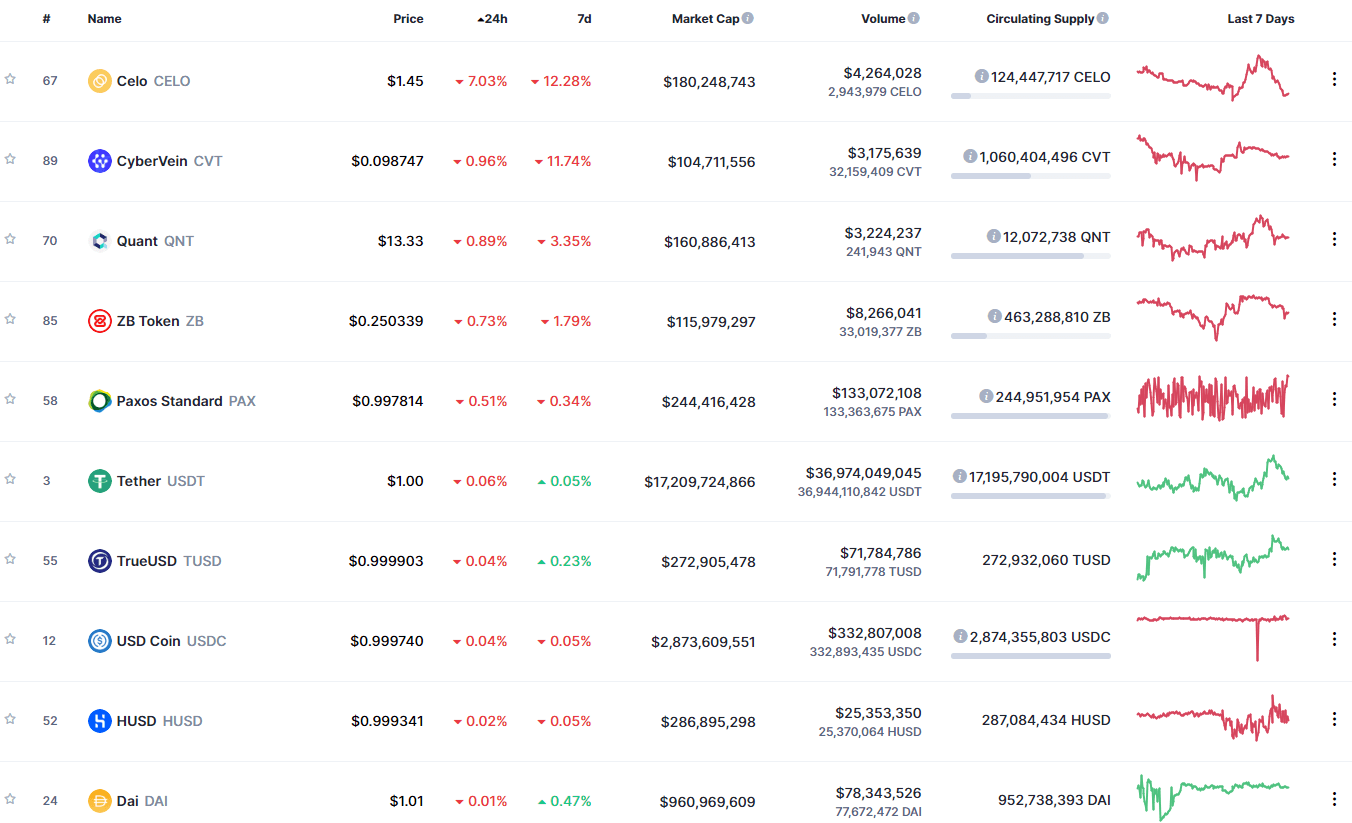
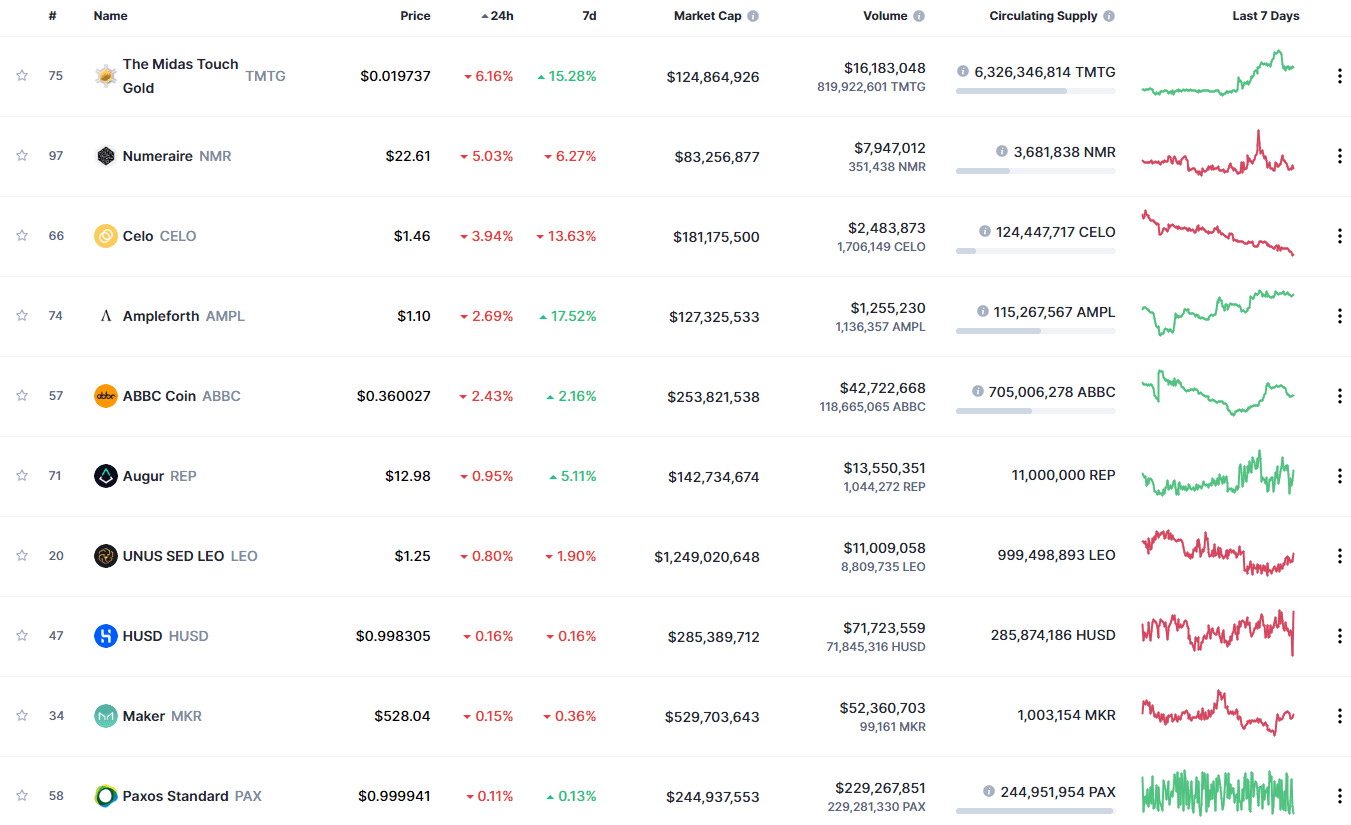
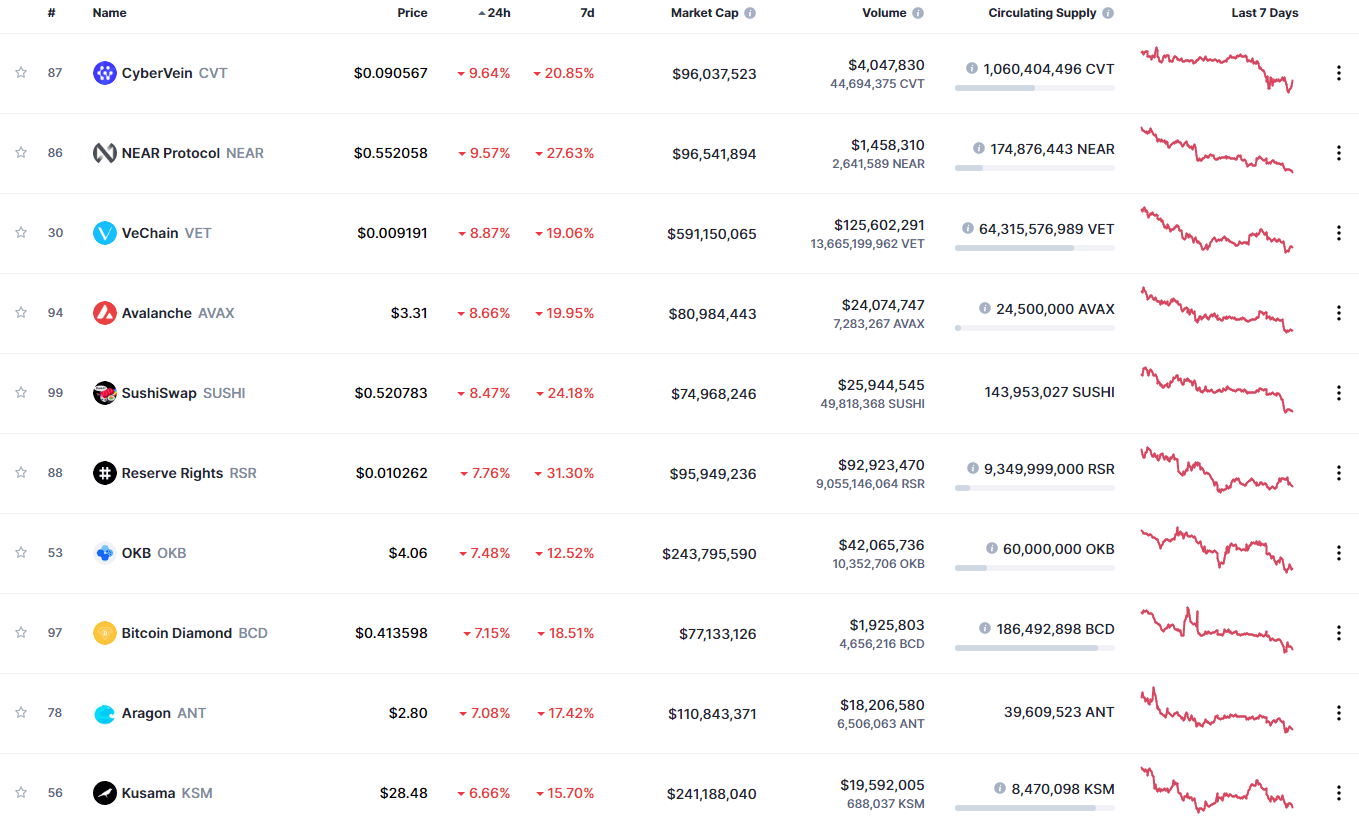
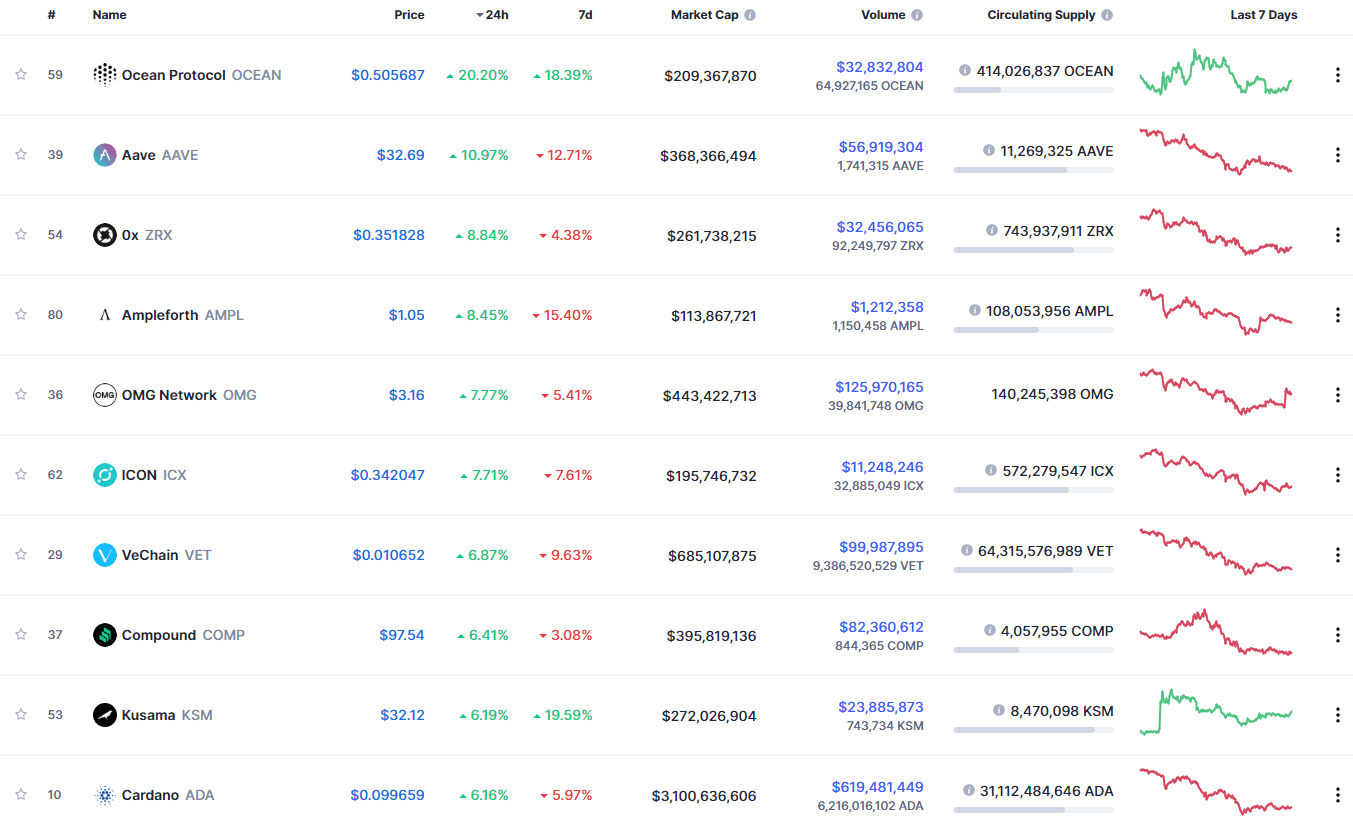
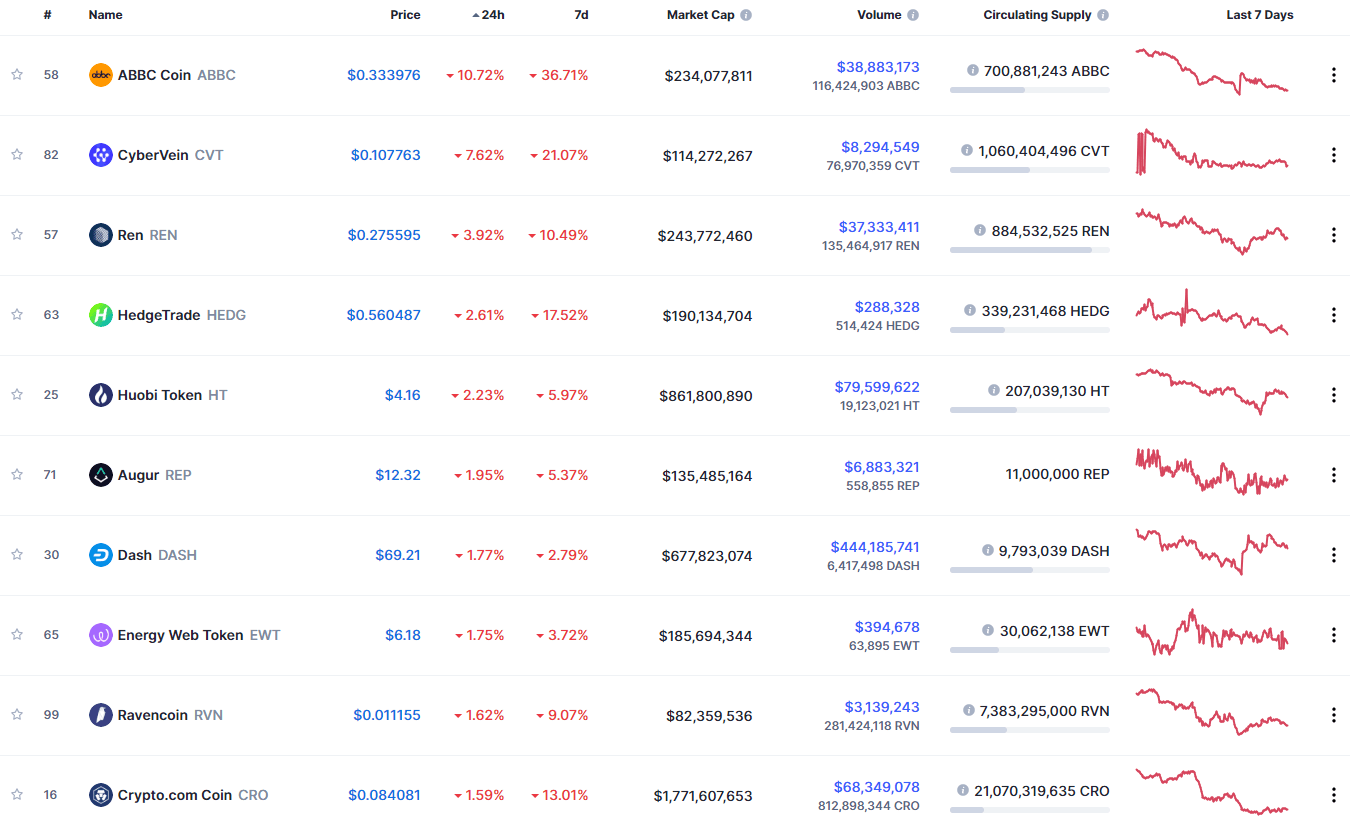
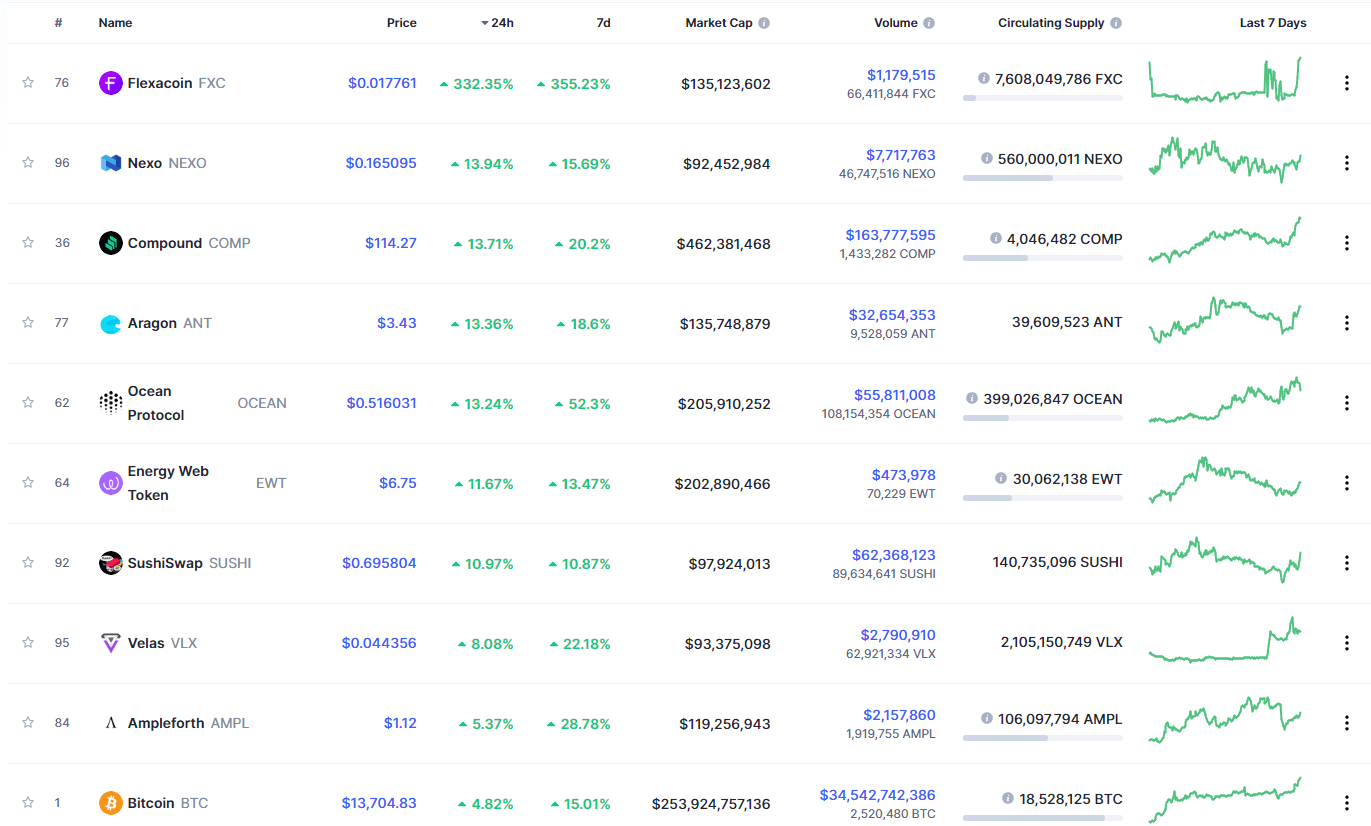
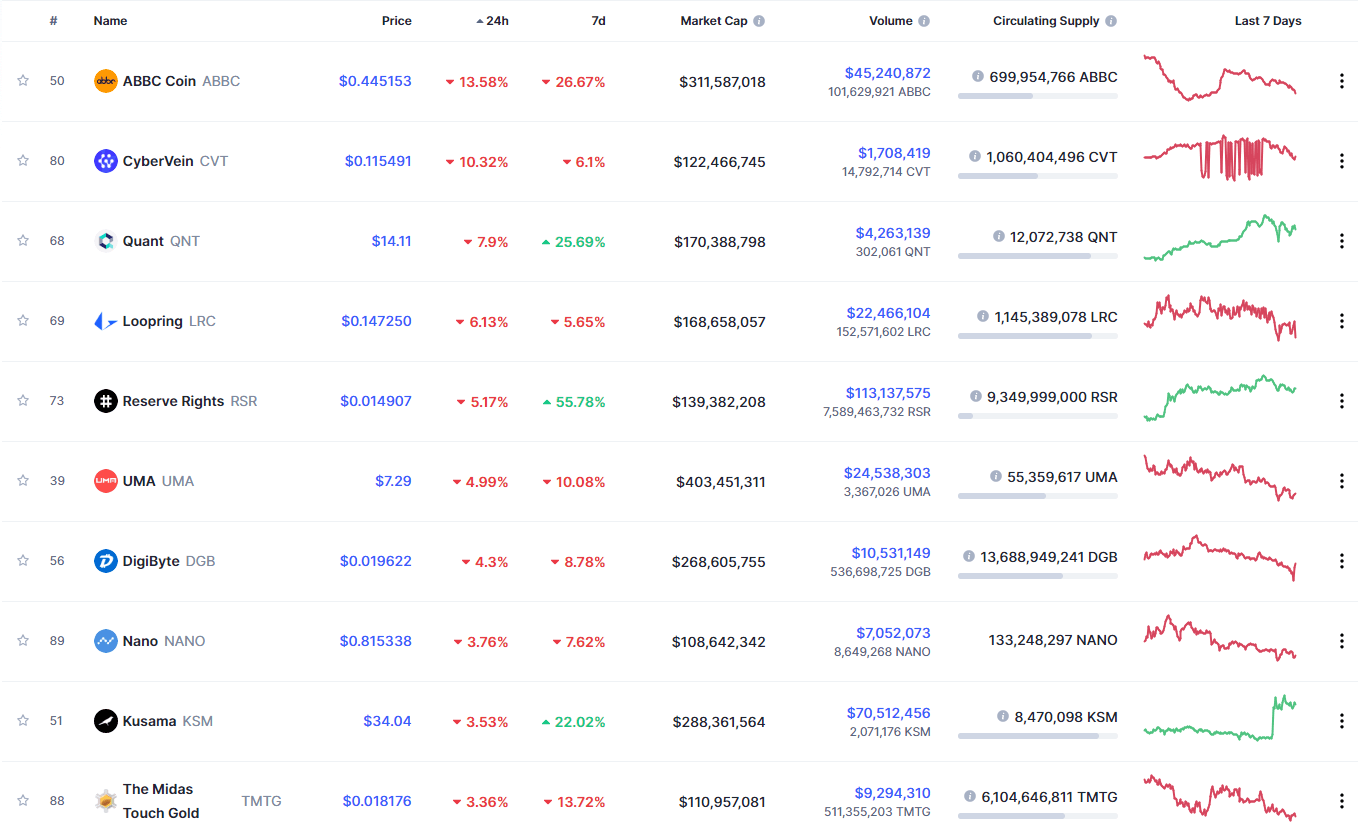
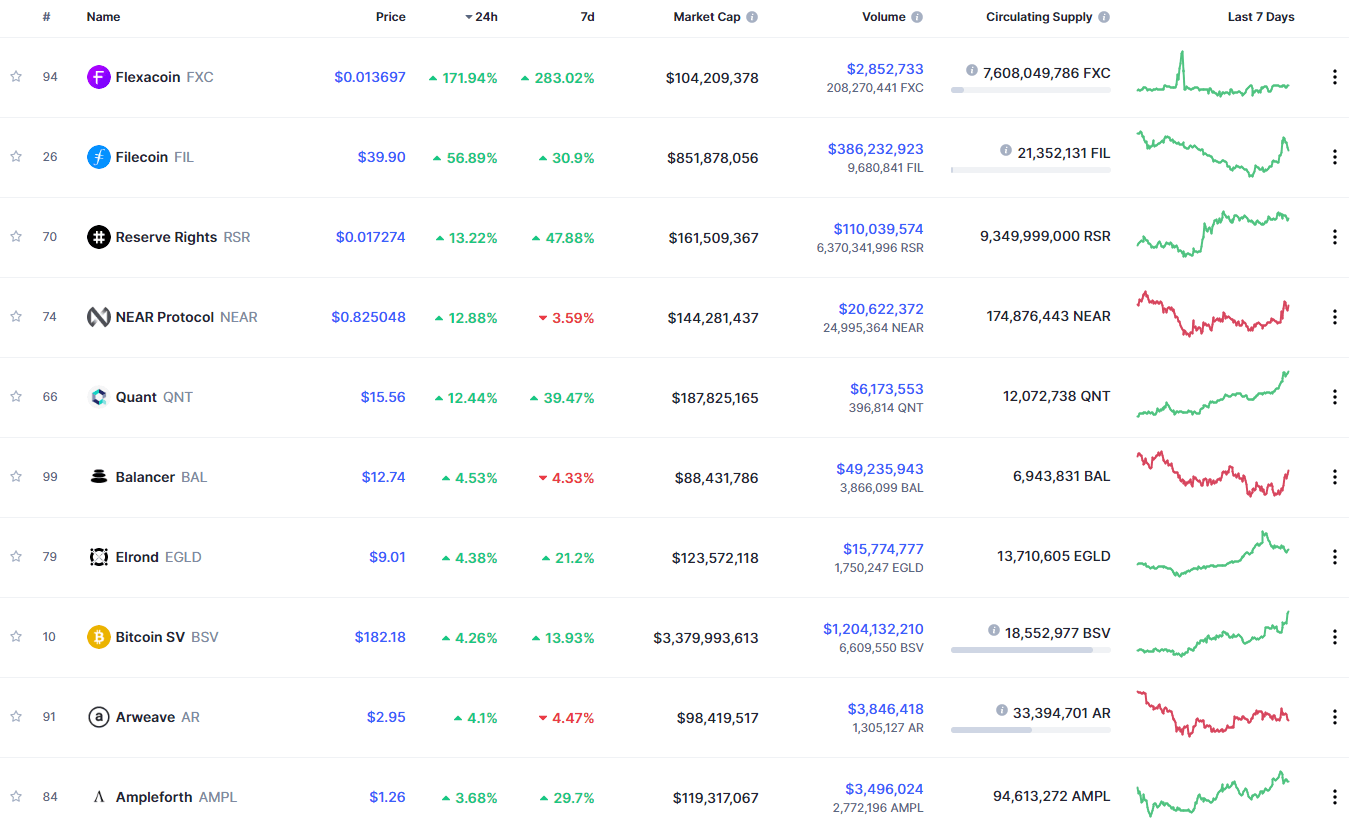
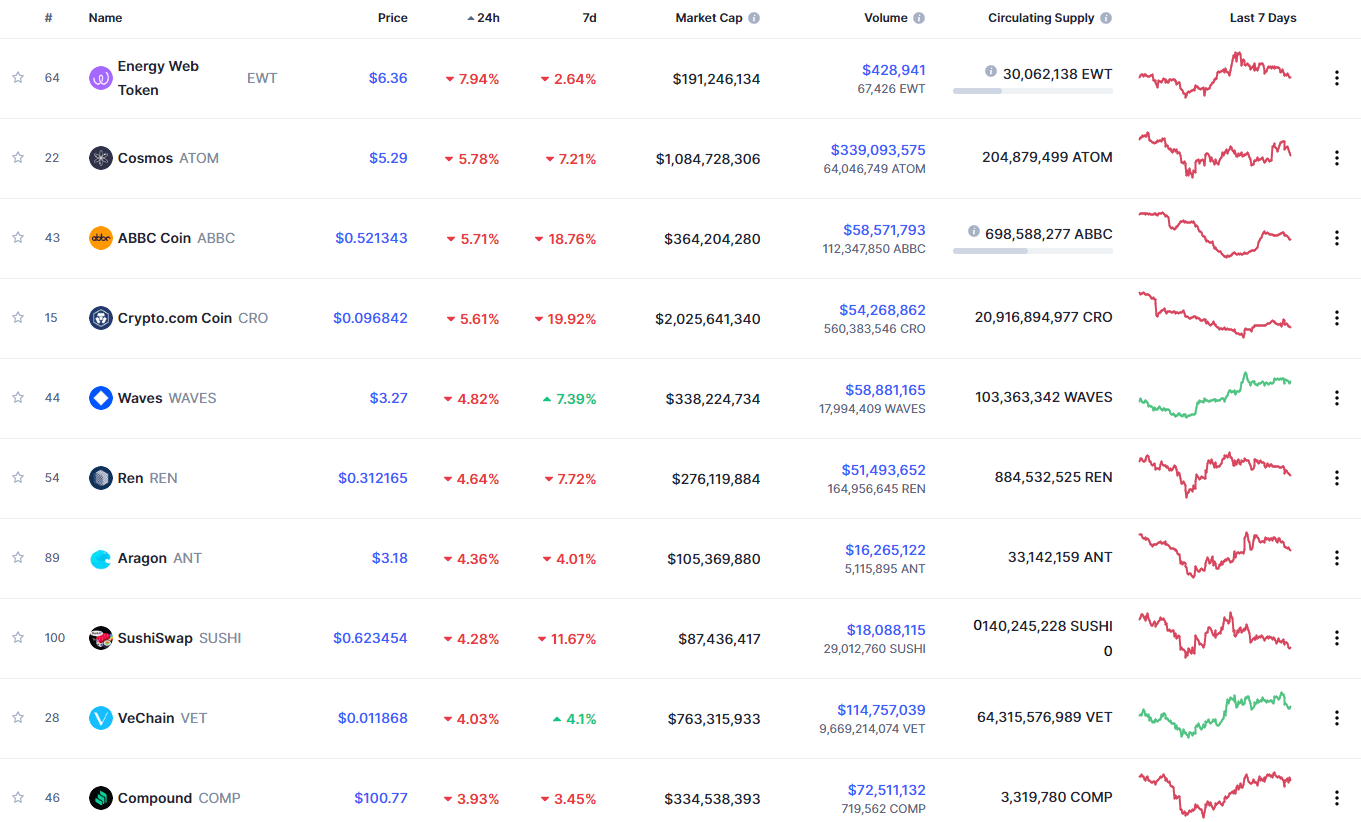
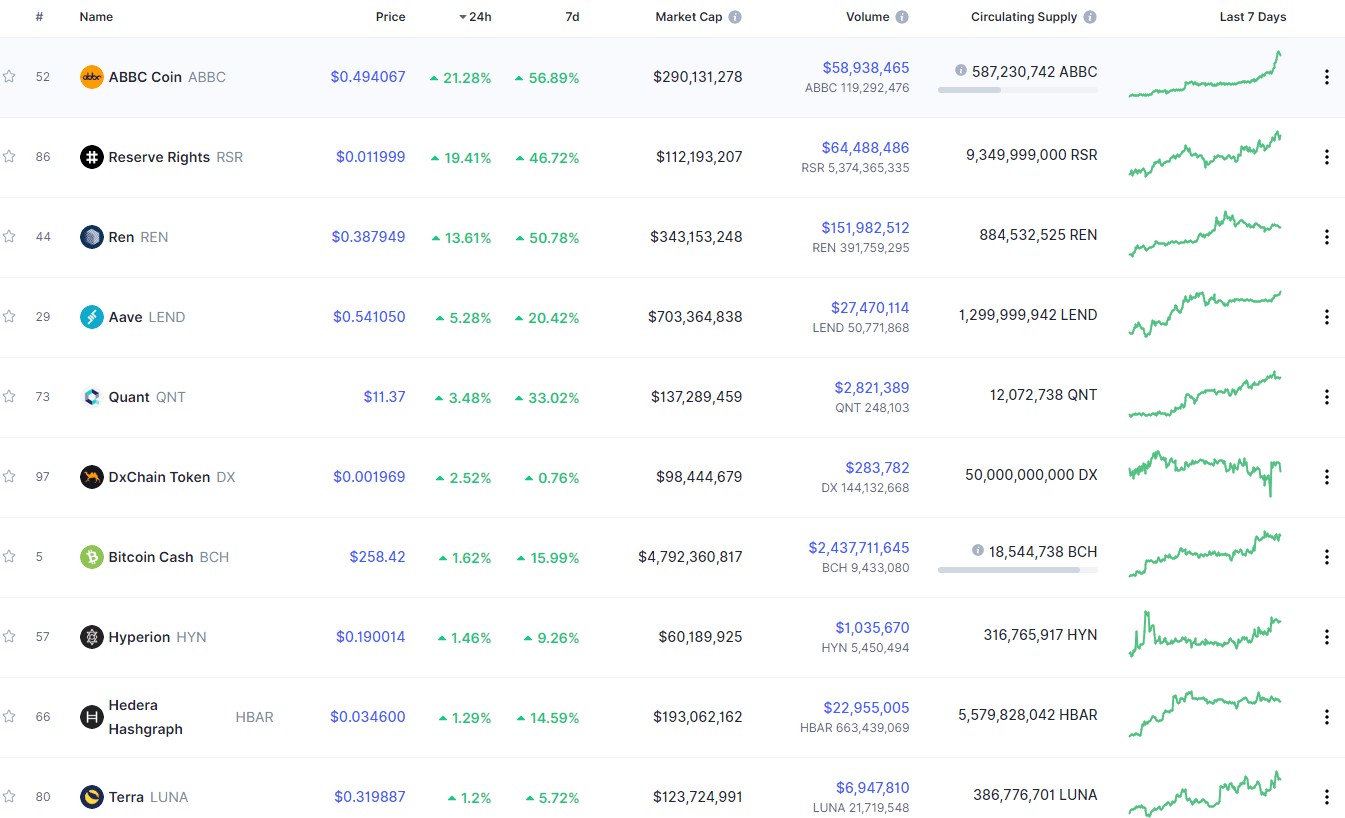
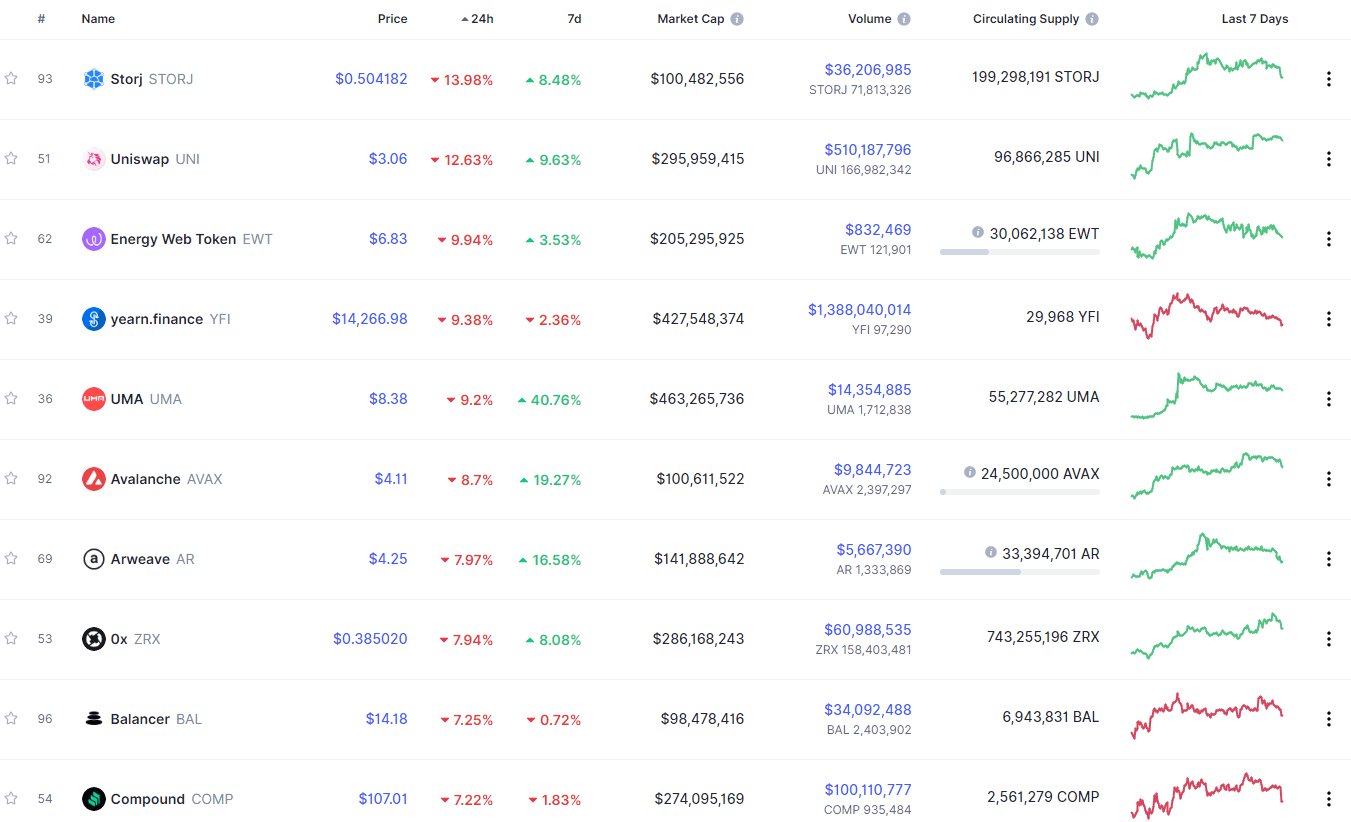
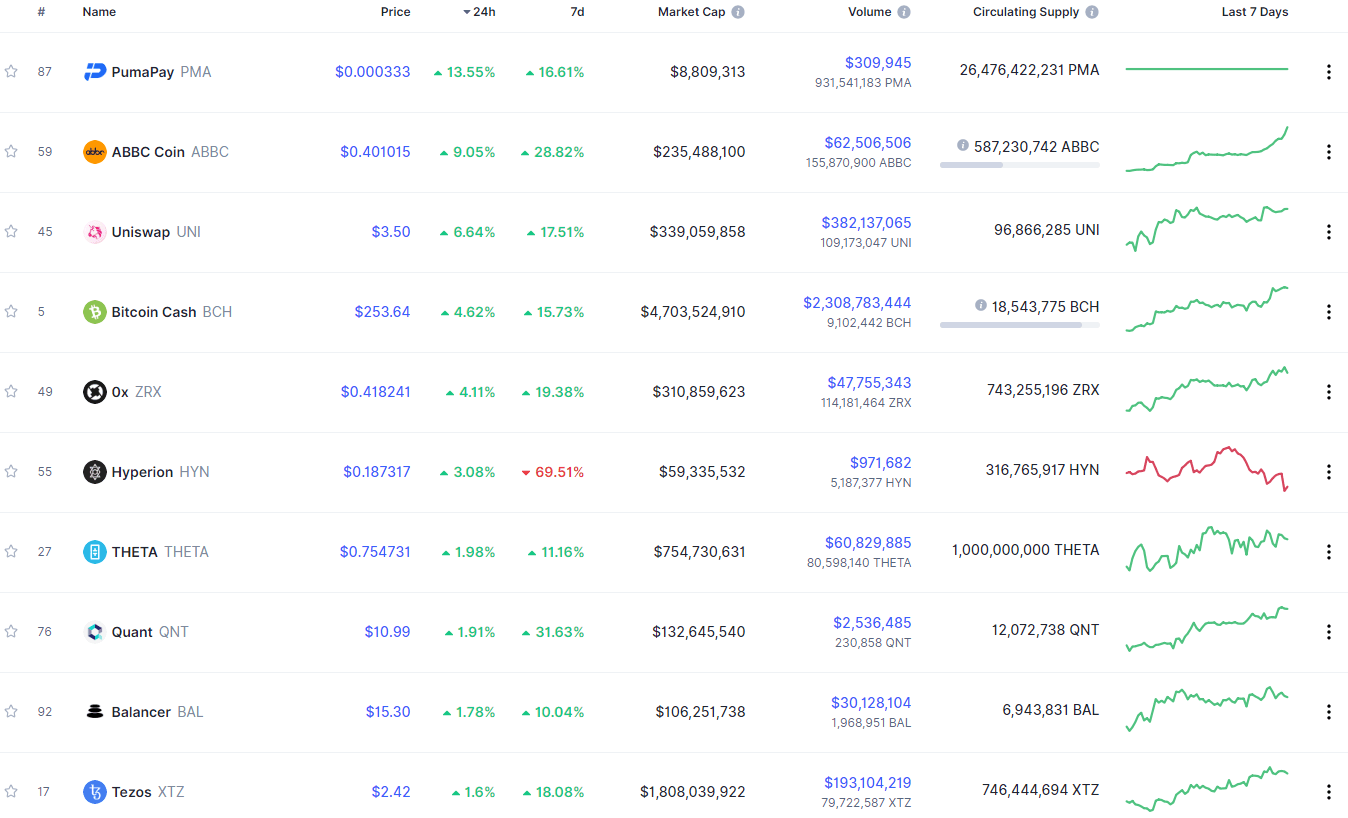
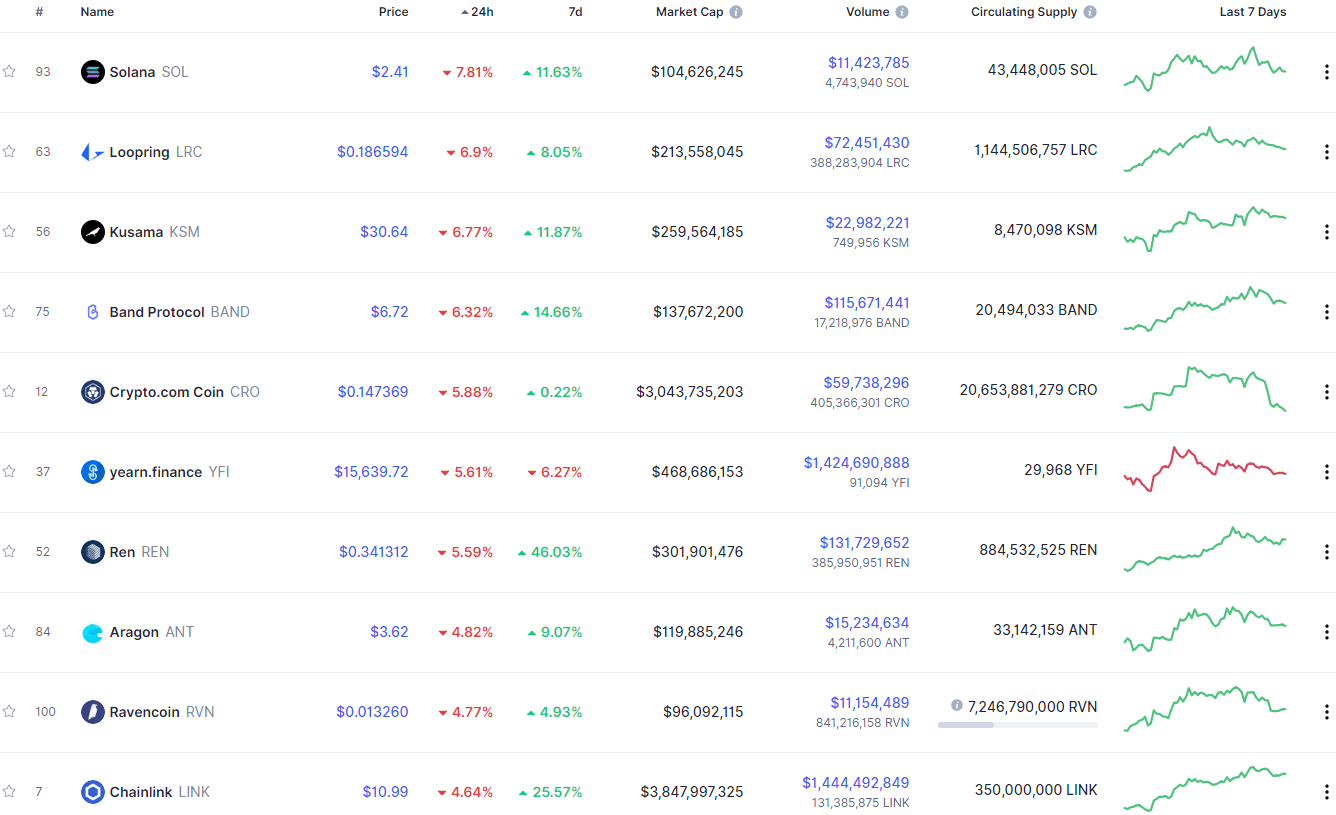
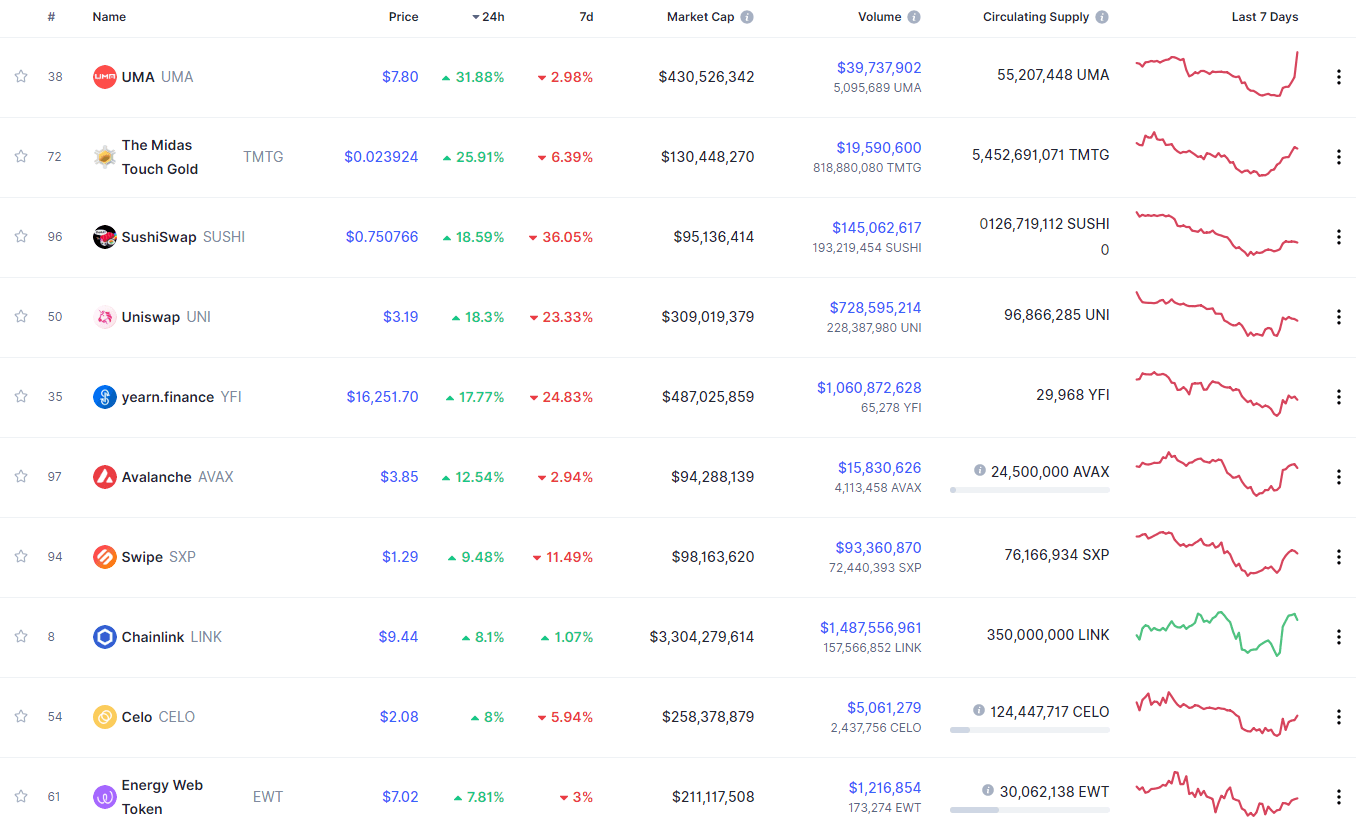
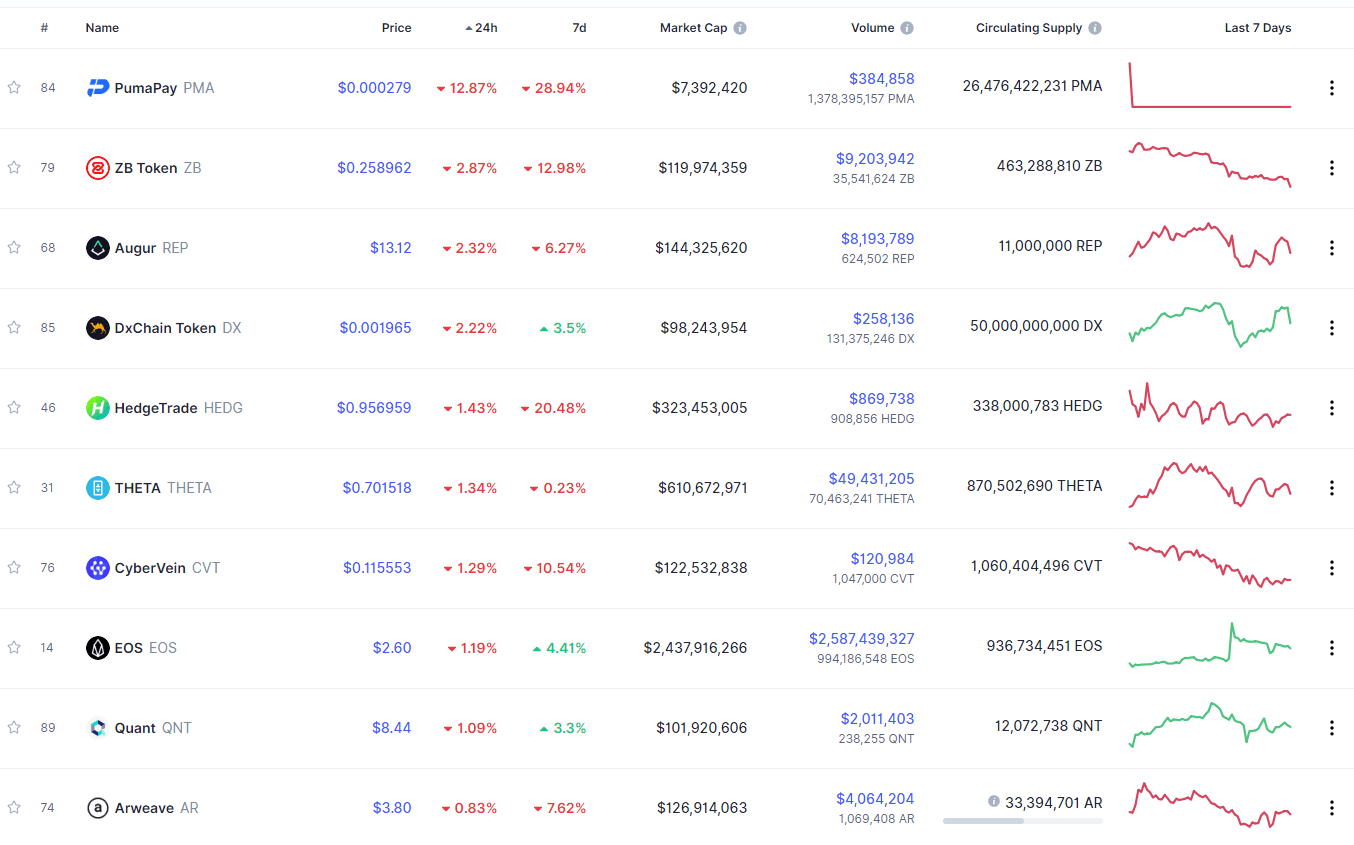
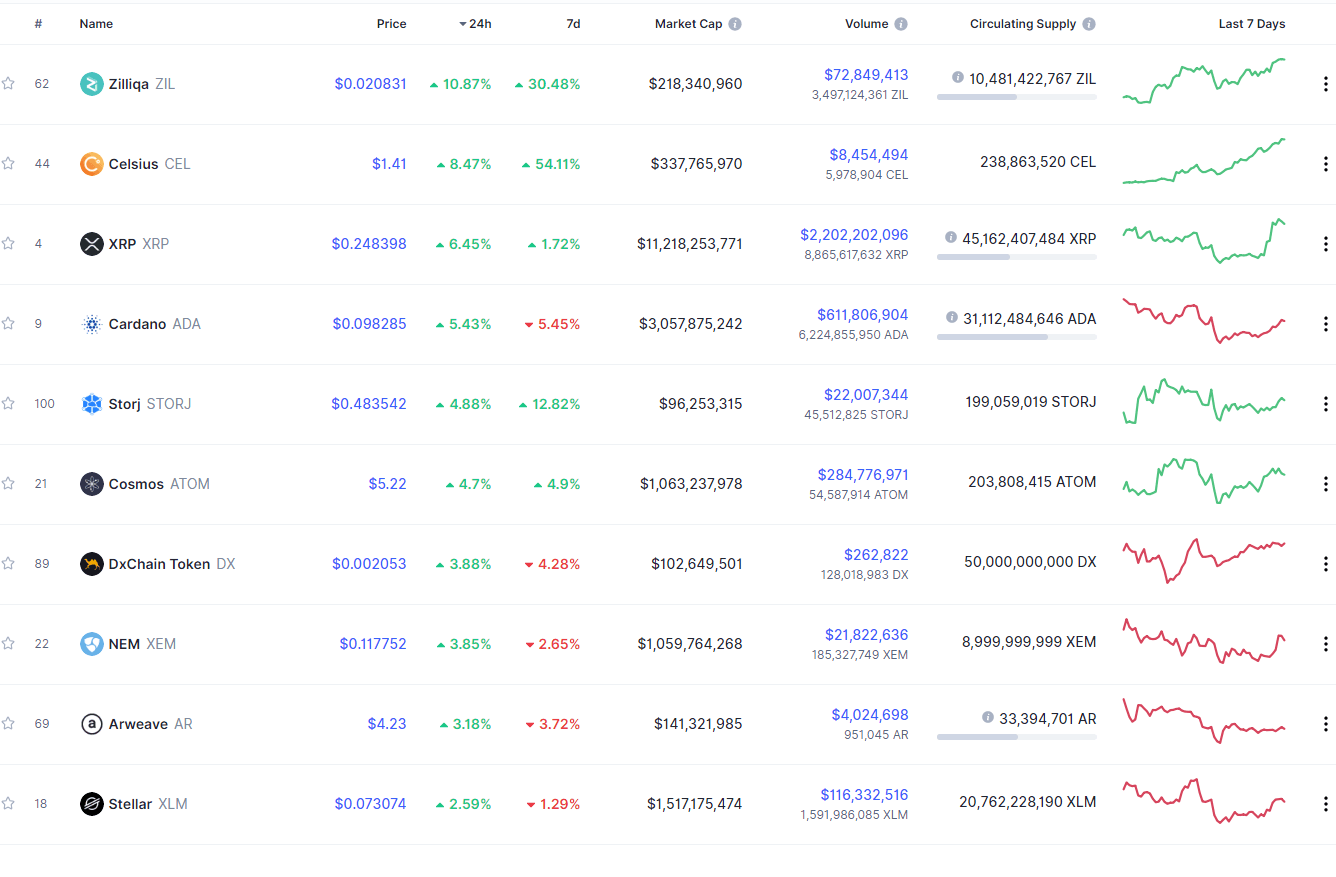
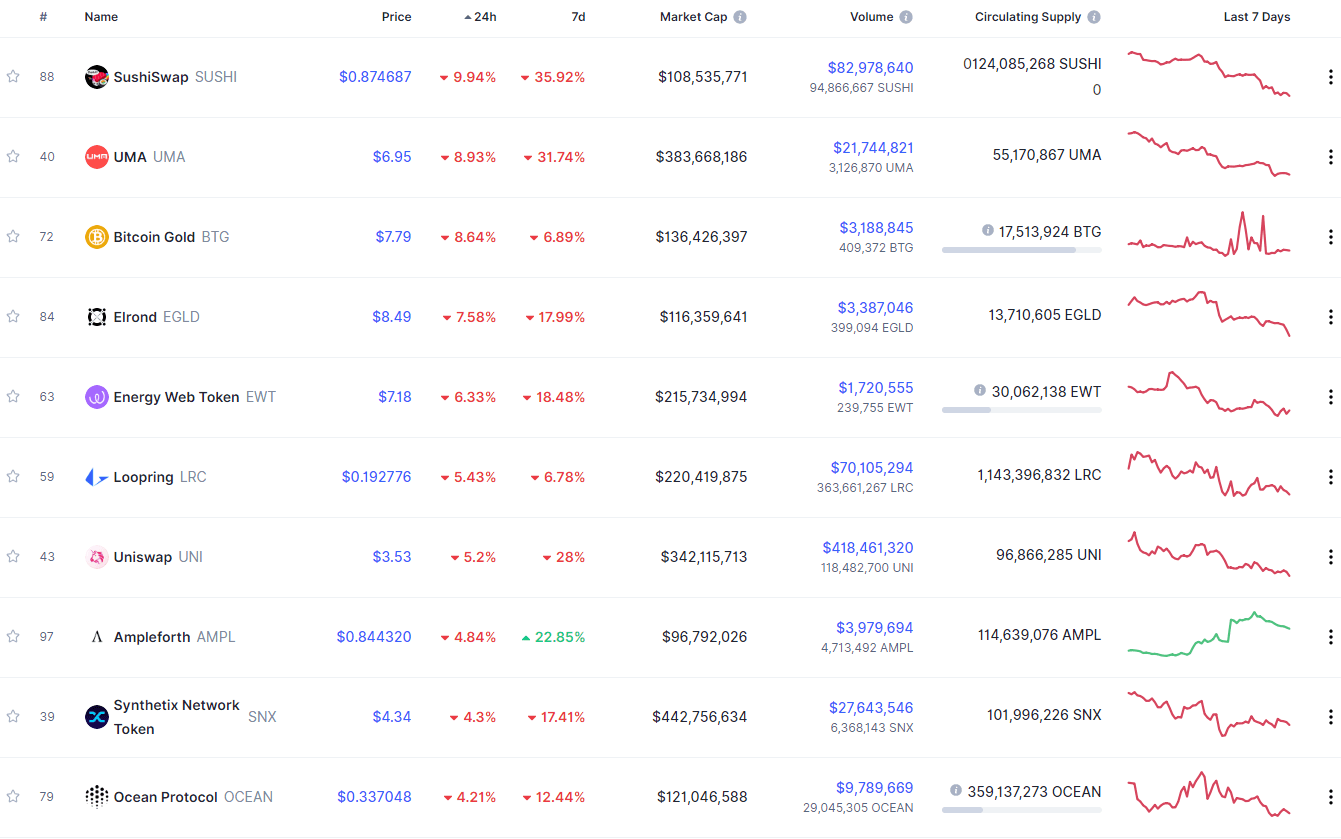
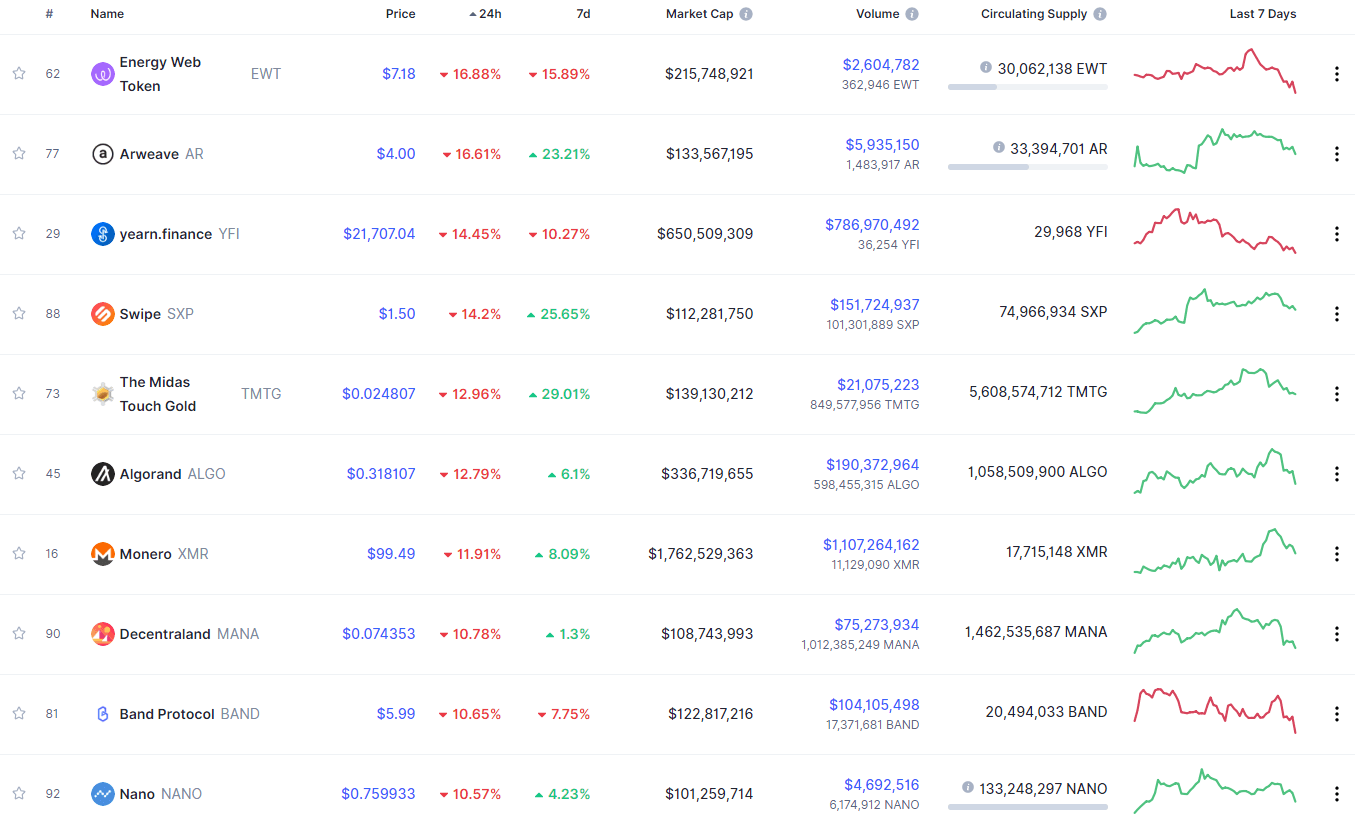
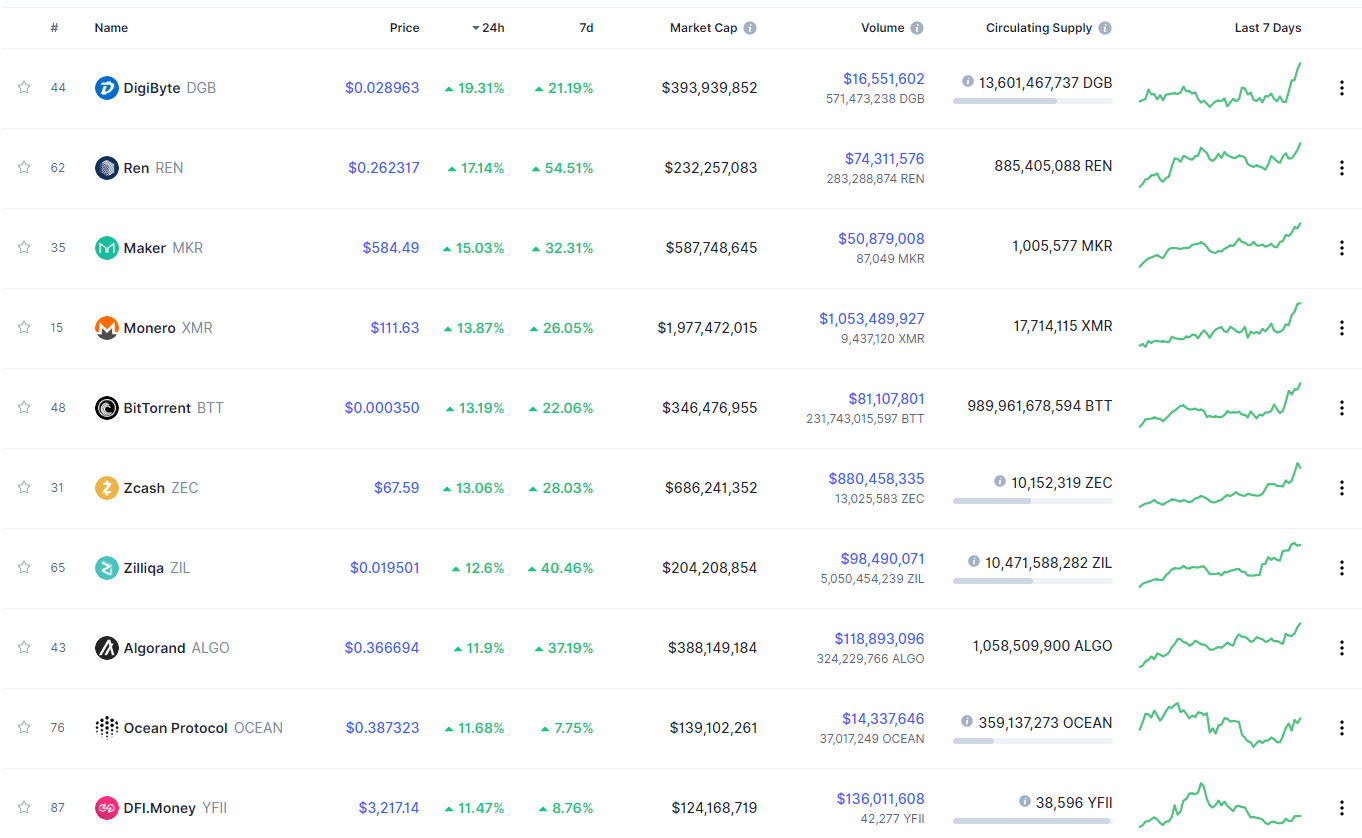
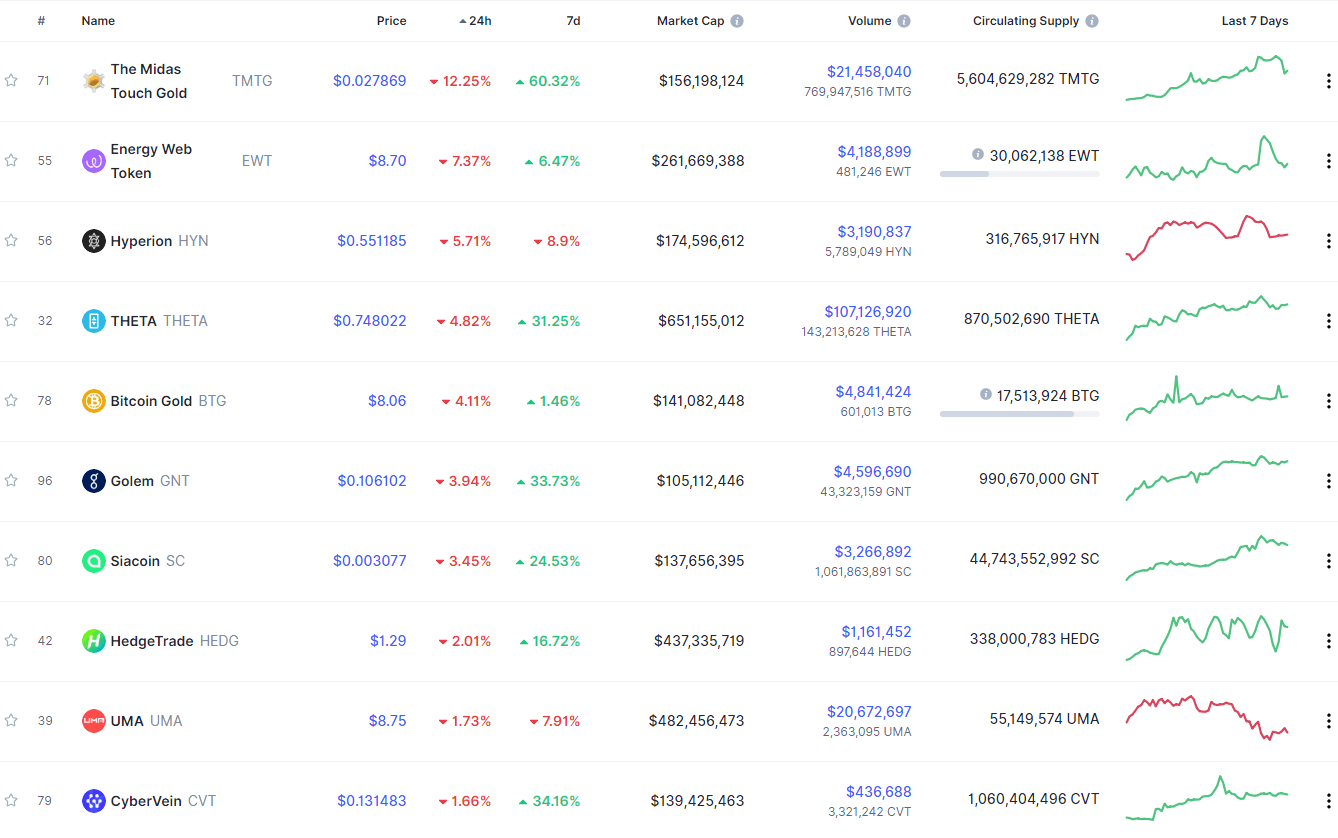
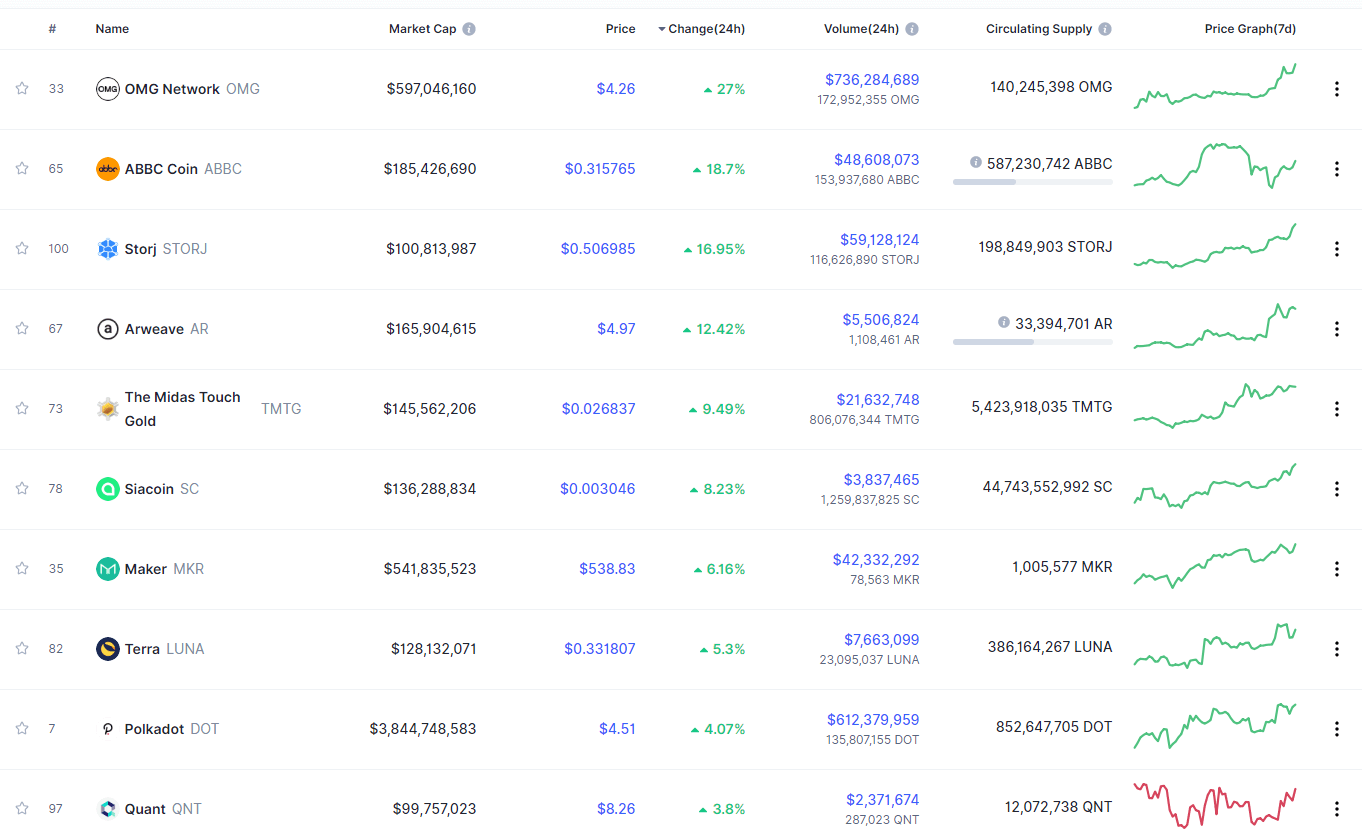
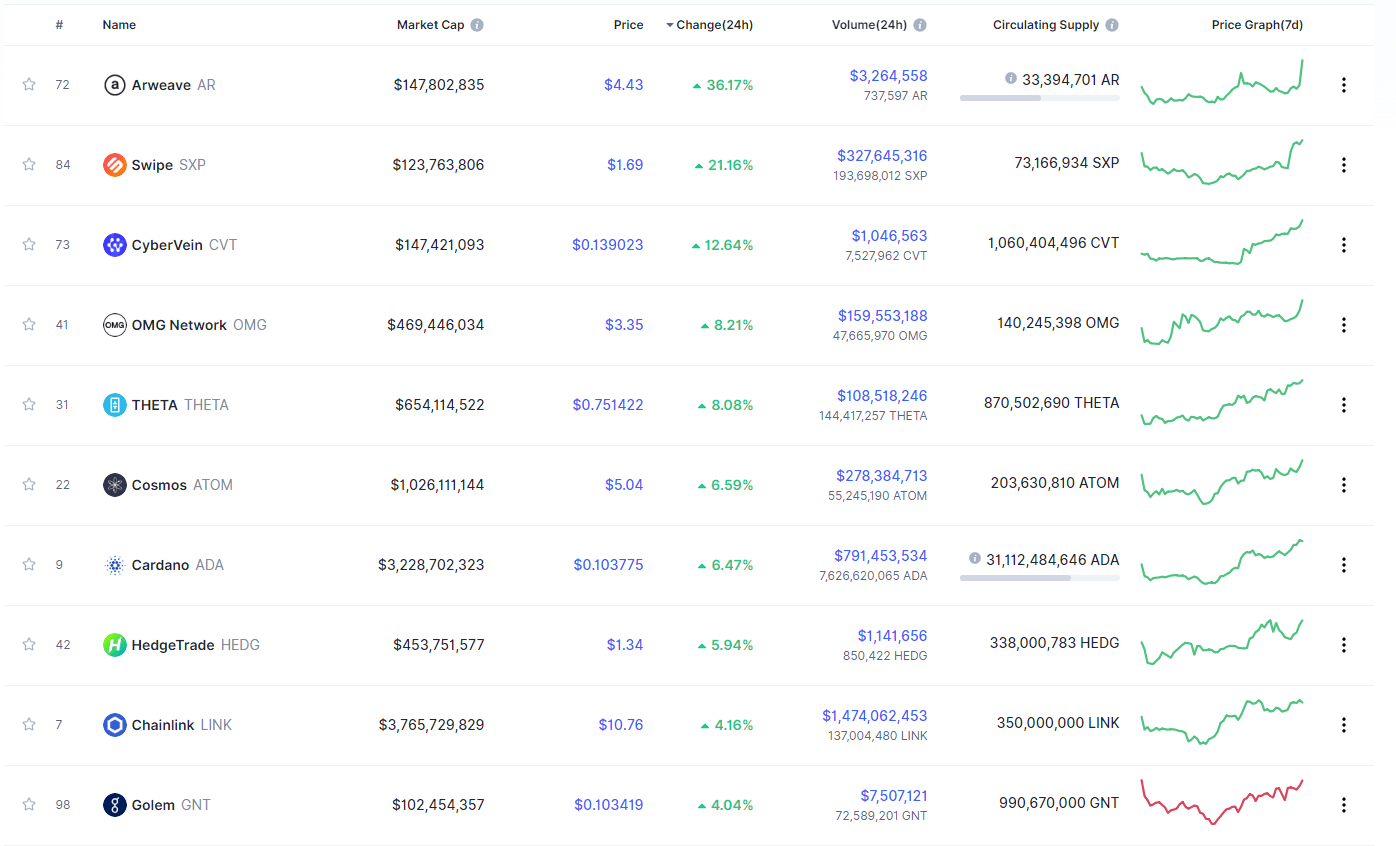
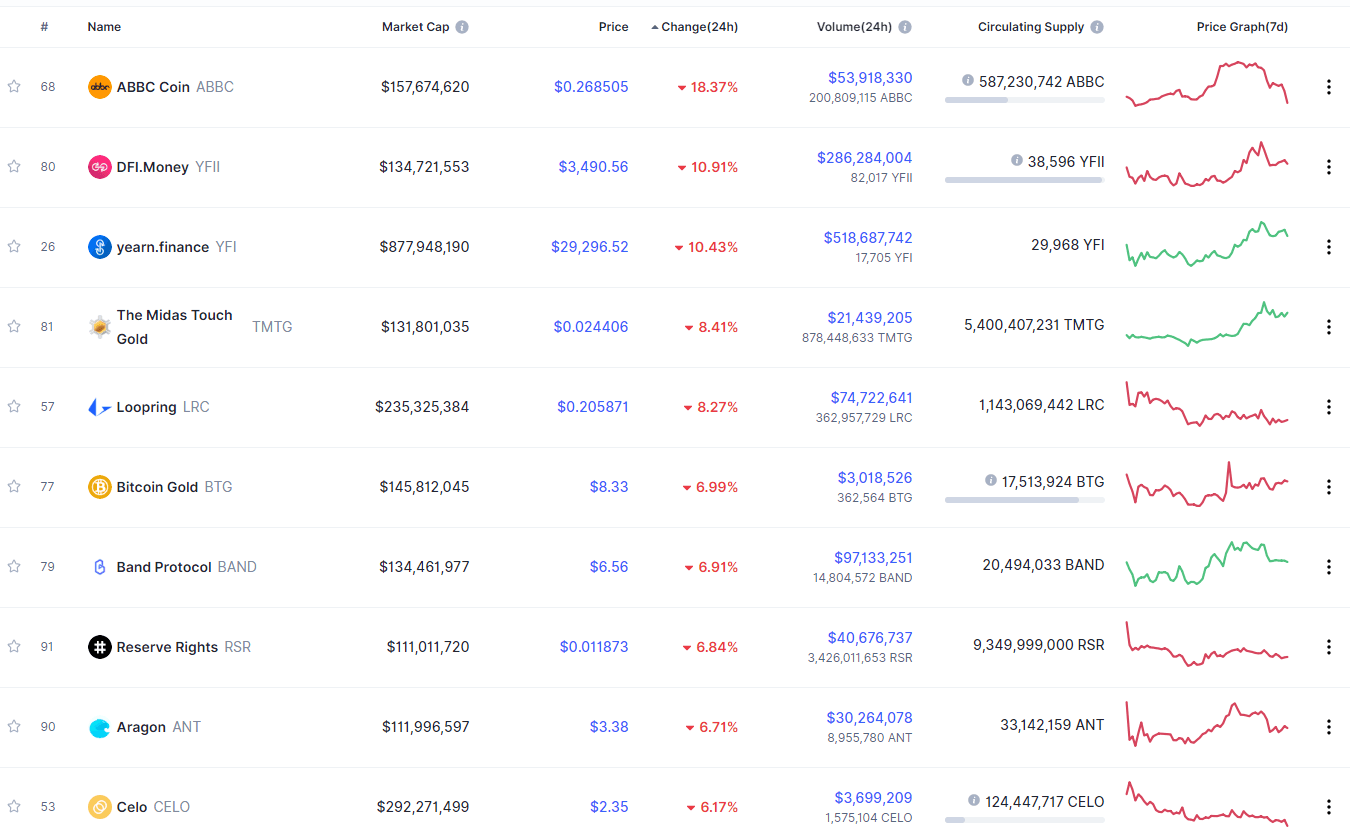
SushiSwap gained 13.81% in the past 24 hours, making it the most prominent daily gainer out of the top100 cryptos ranked by market capitalization yet again today. It is closely followed by THORChain’s gain of 9.54% and Curve DAO Token’s 4.80% gain. On the other hand, ABBC Coin lost 45.16%, making it the most prominent daily loser. The Midas Touch Gold lost 8.96% while Ampleforth lost 8.88%, making them the 2nd and 3rd most prominent daily losers.
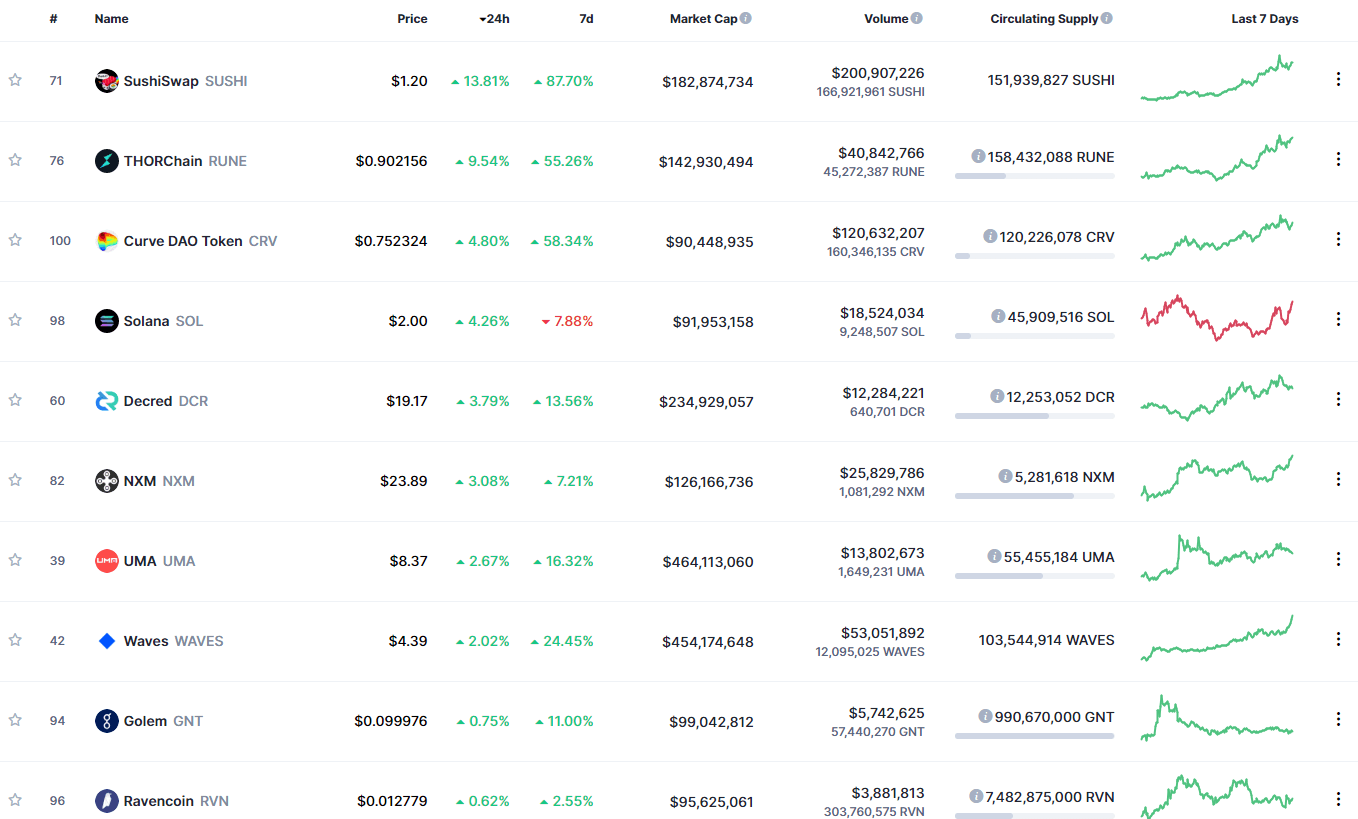
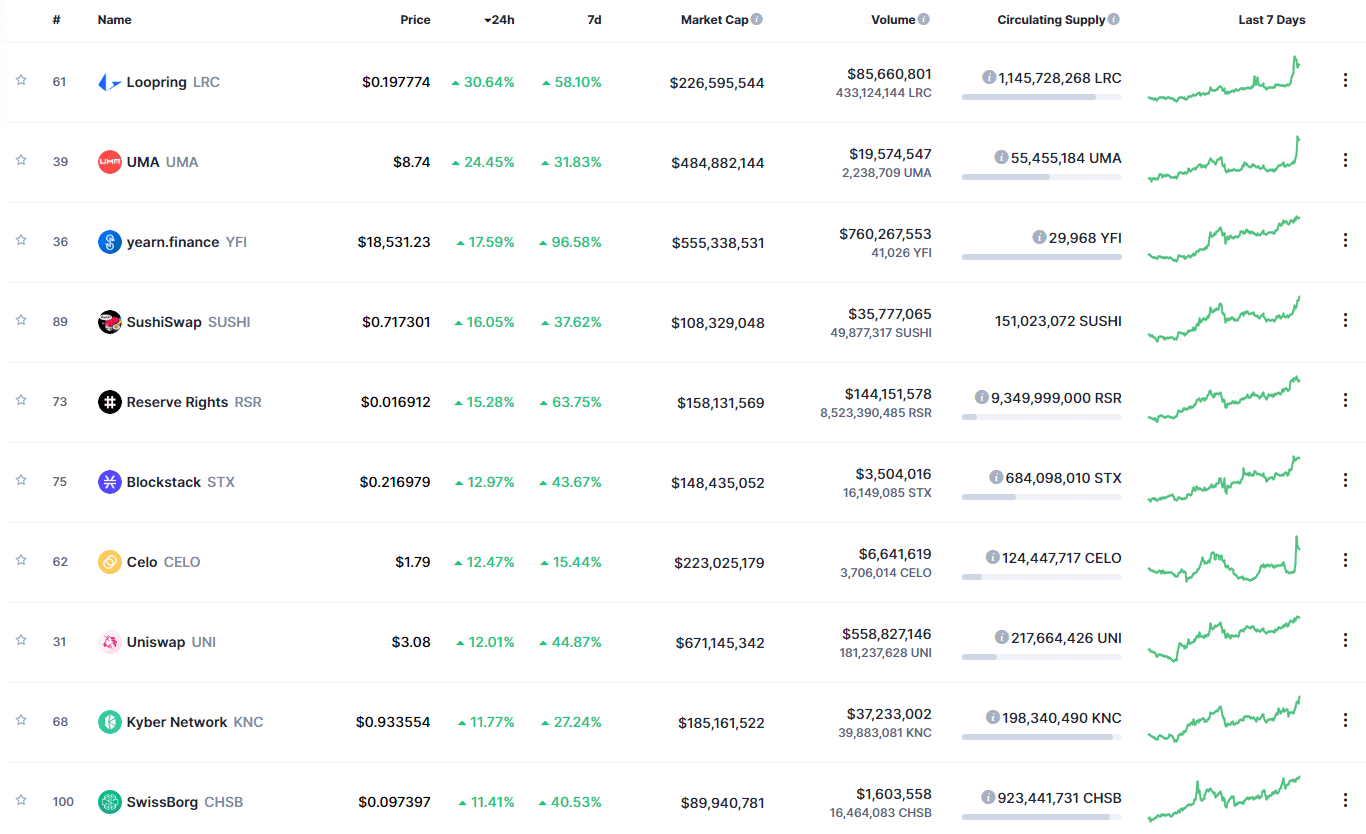
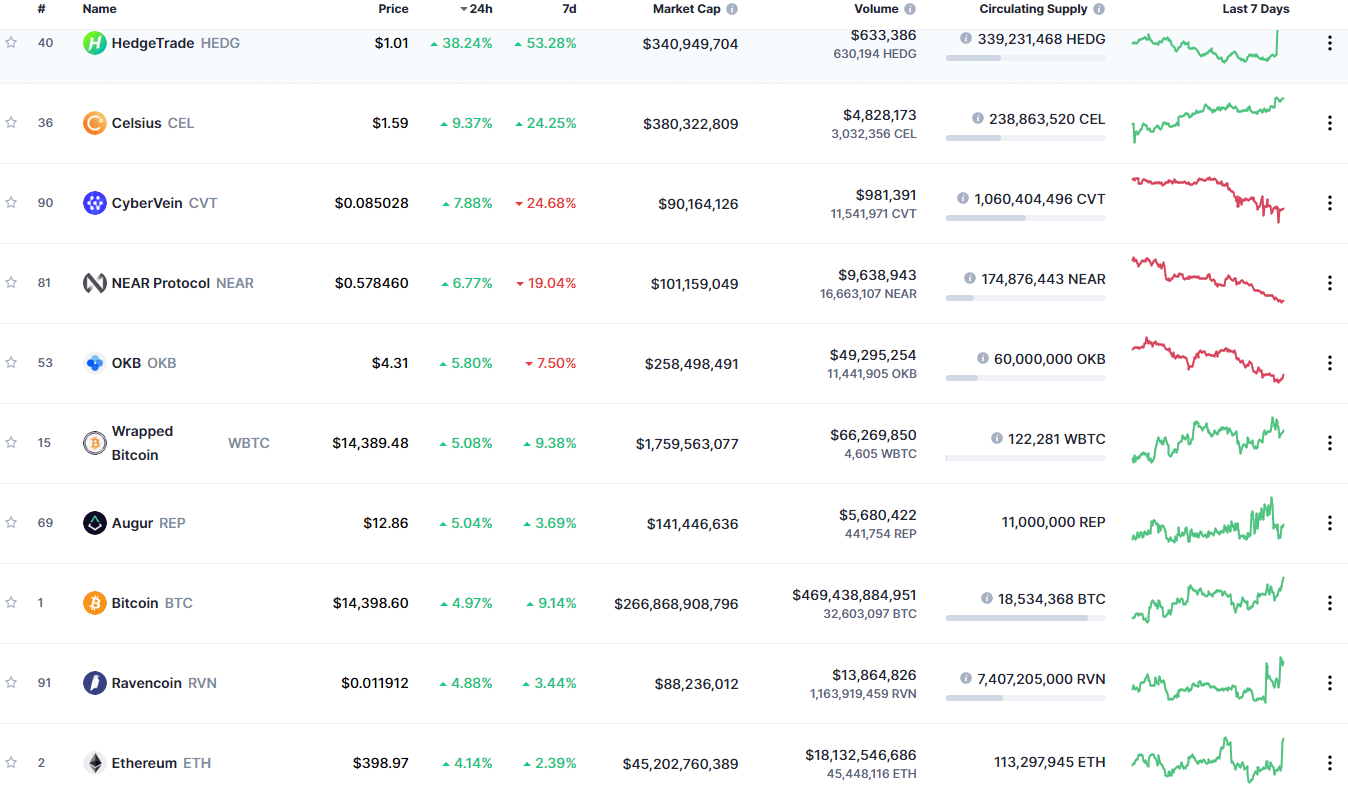
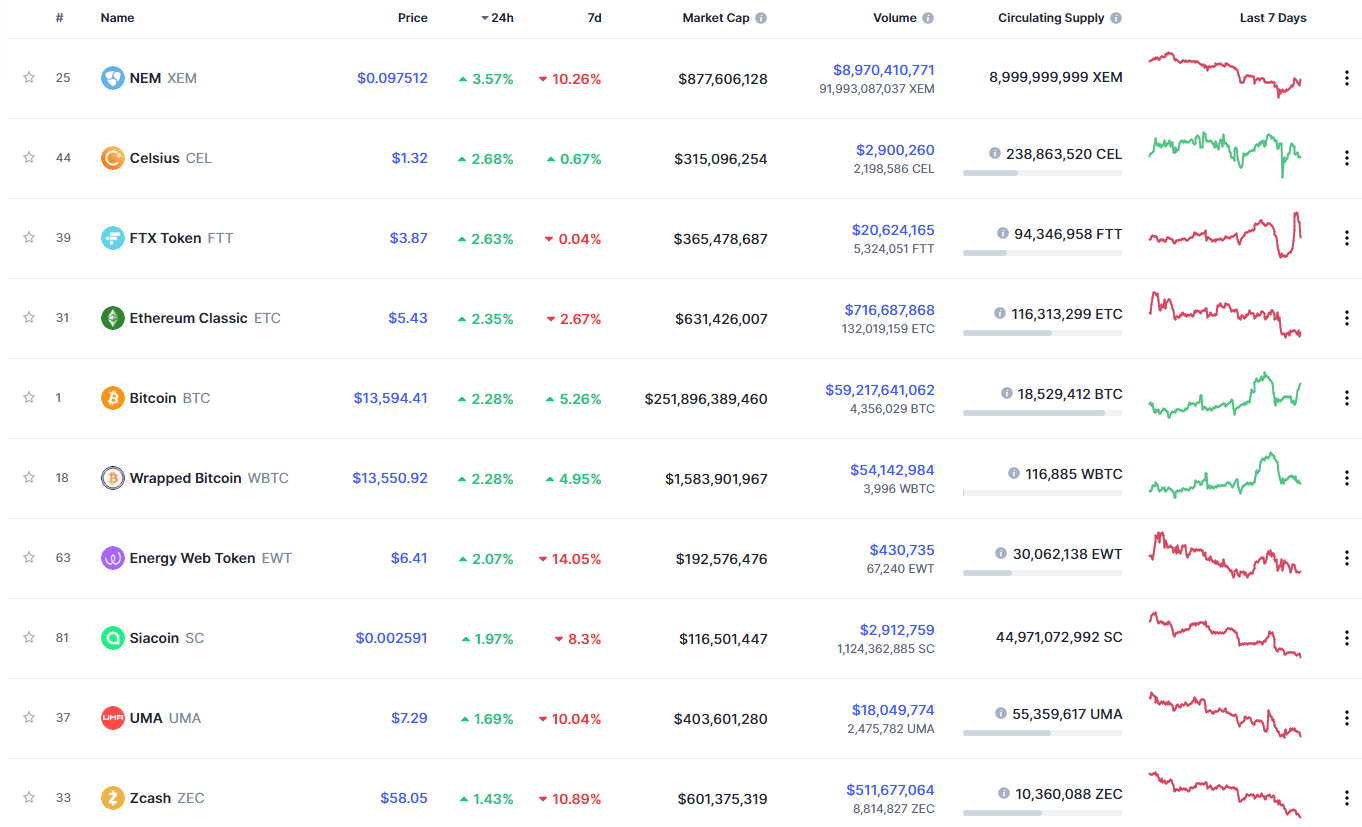
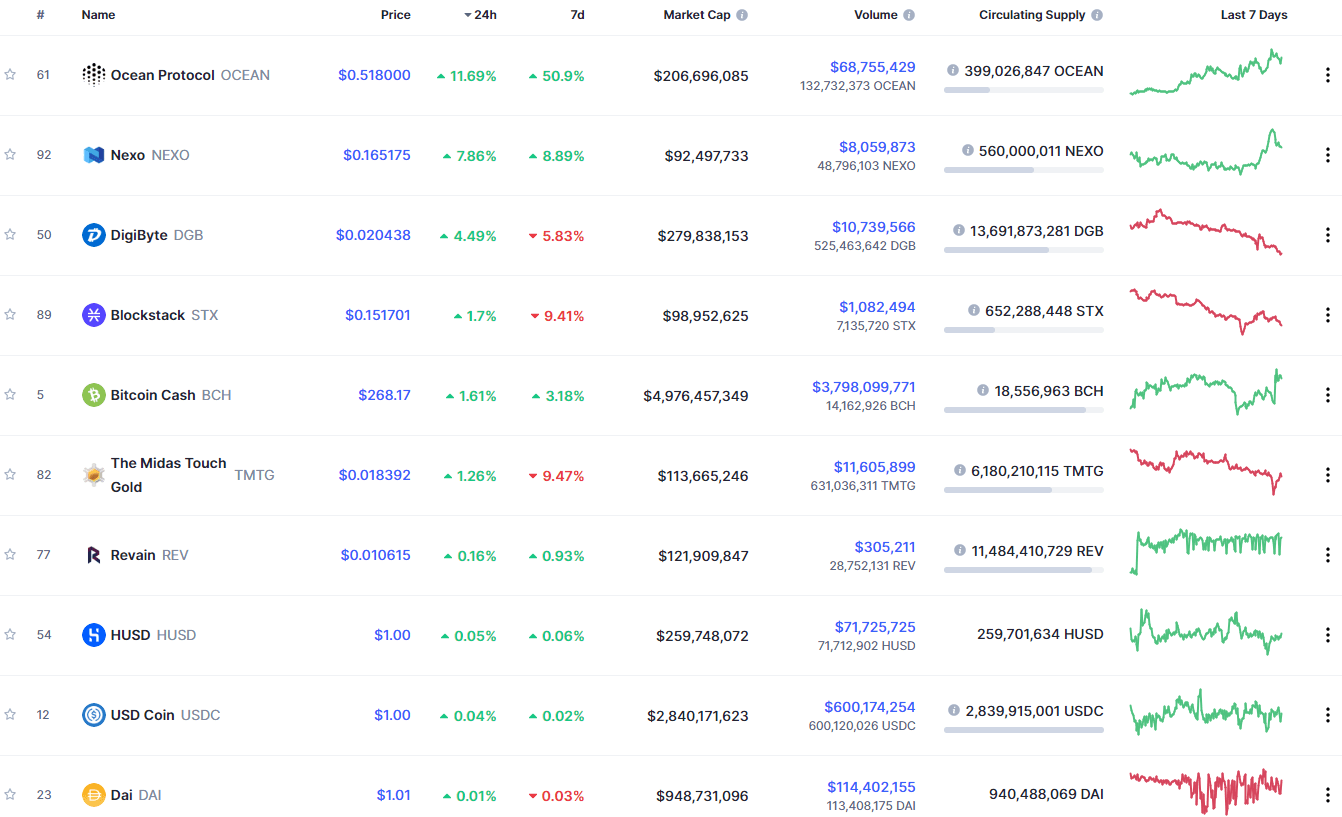
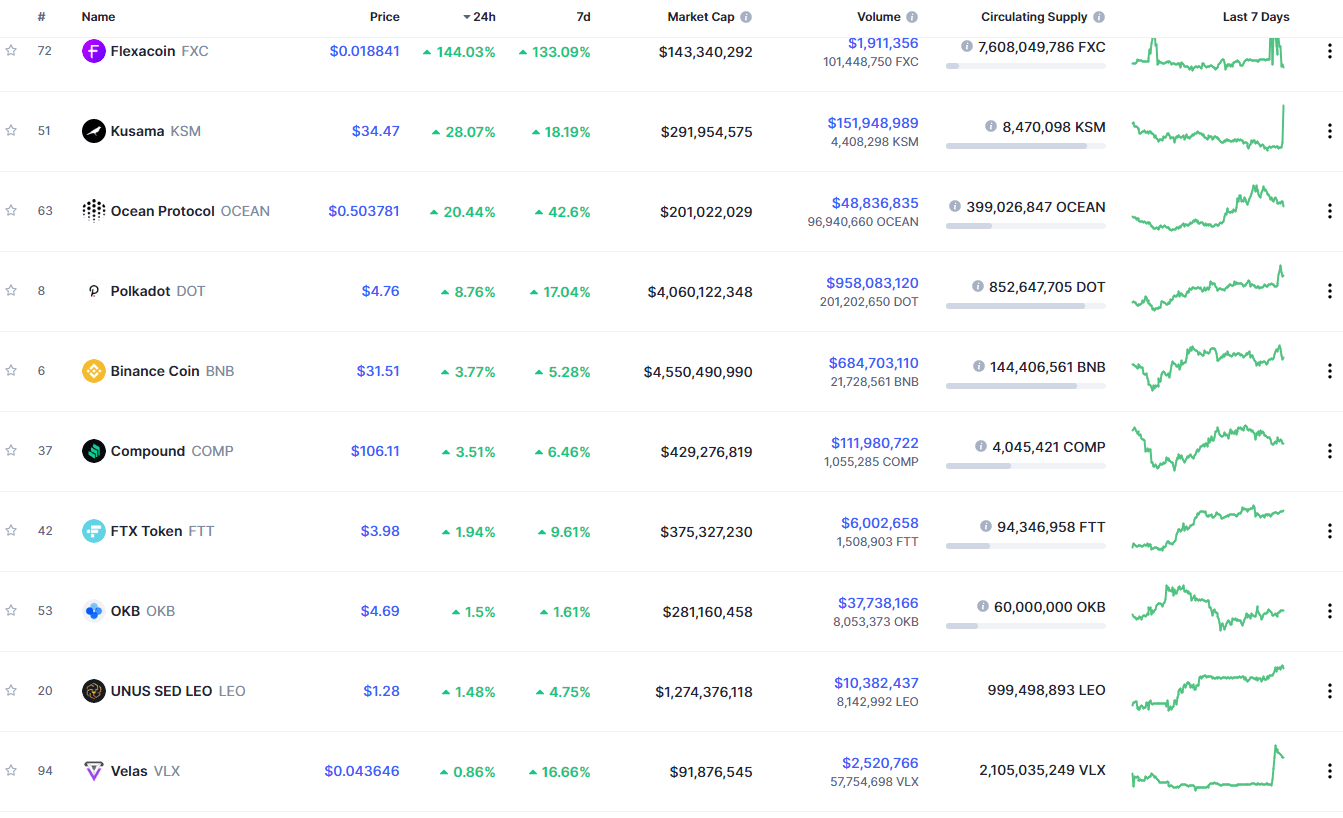
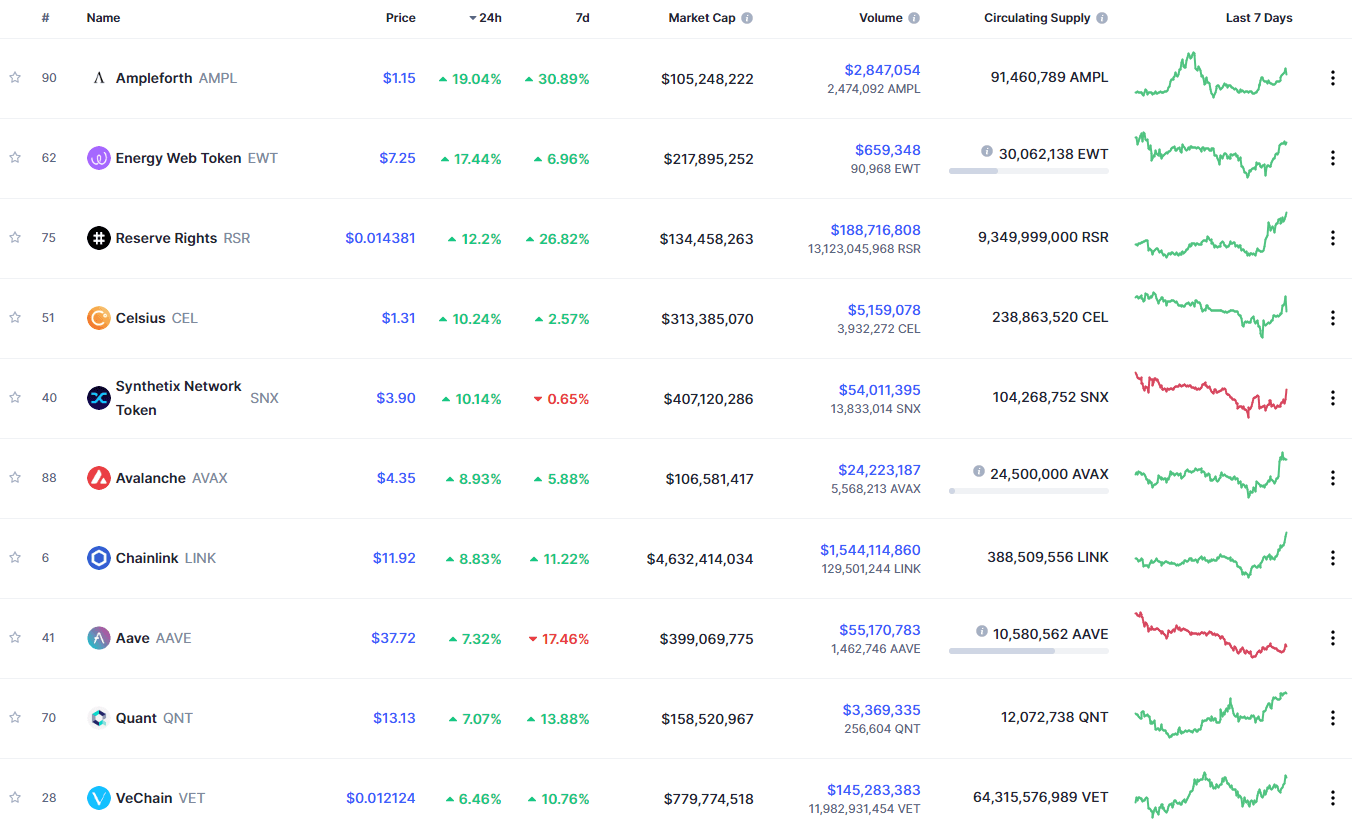
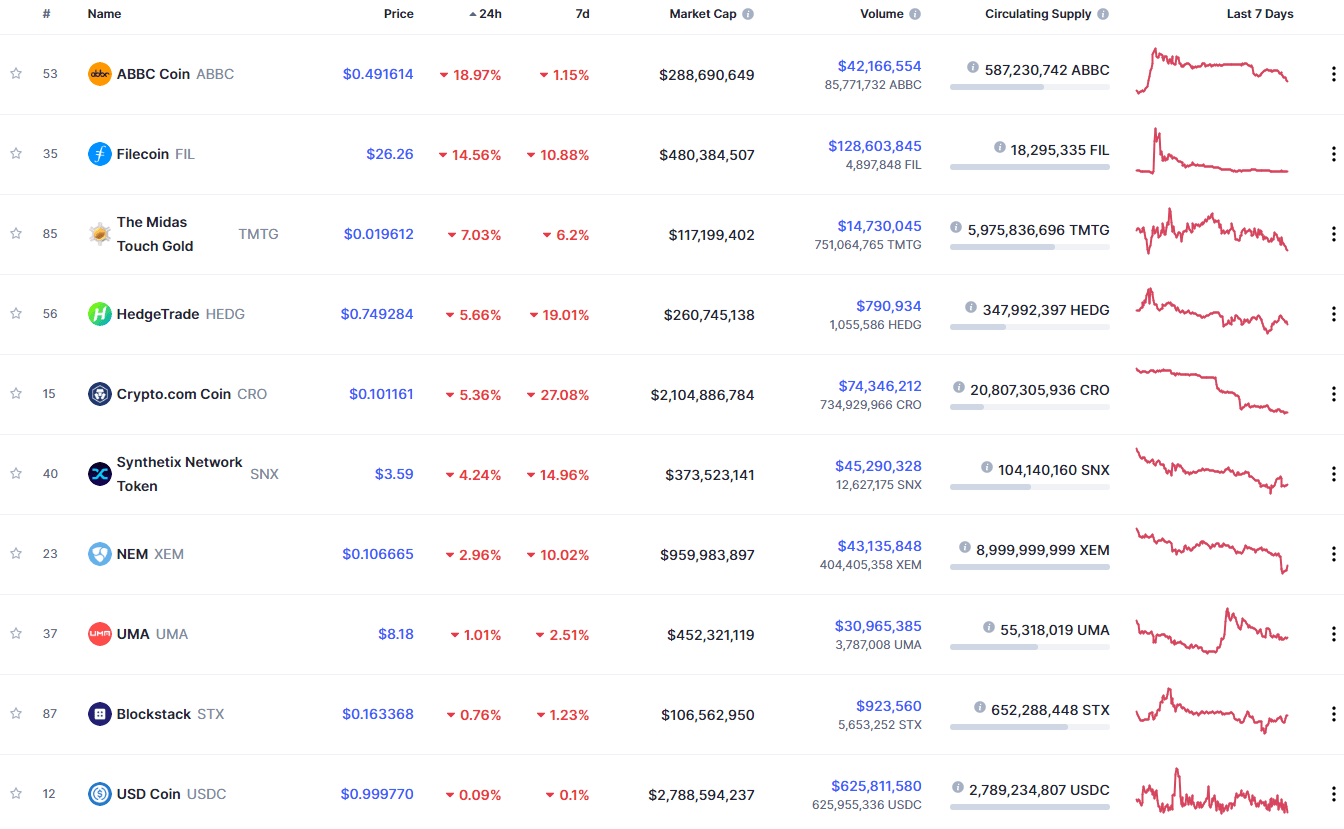
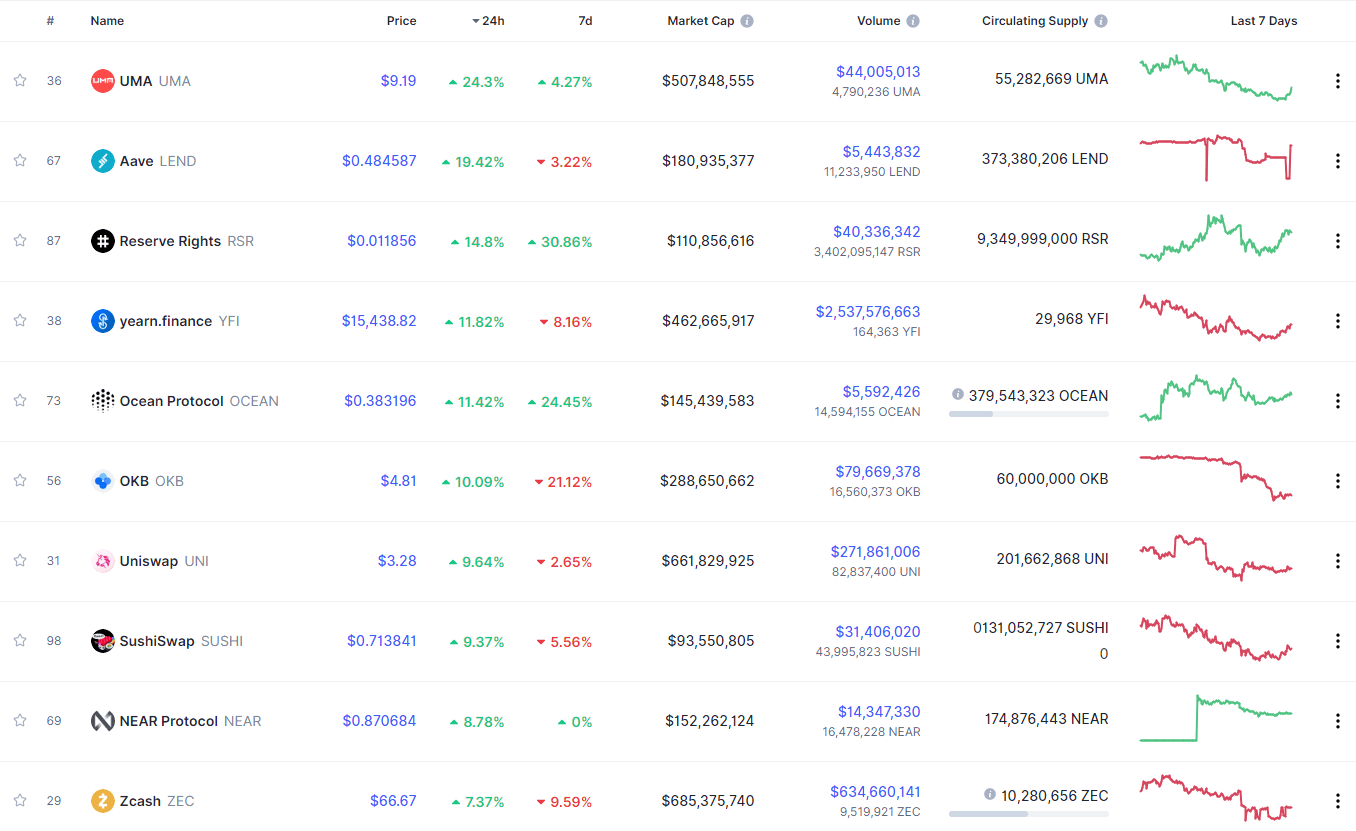
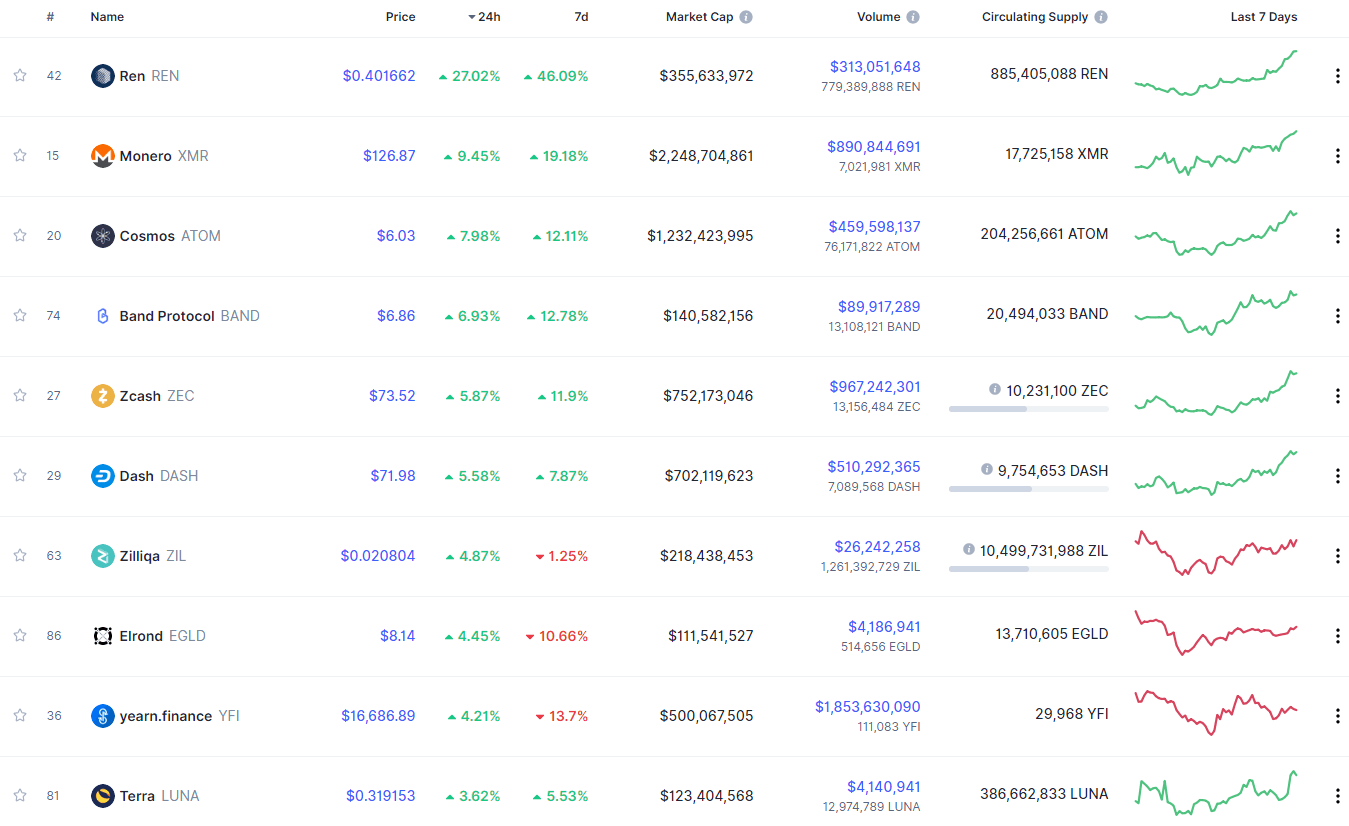
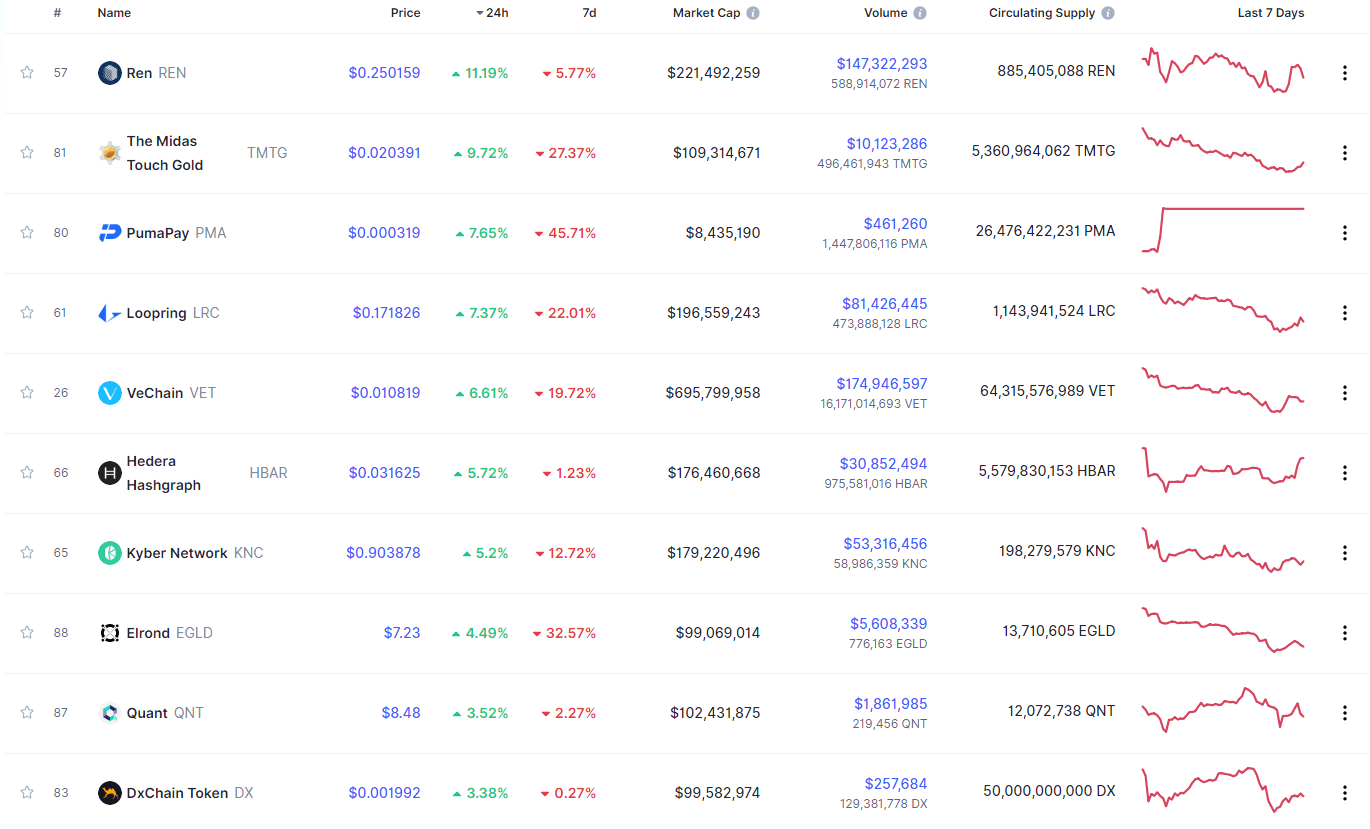
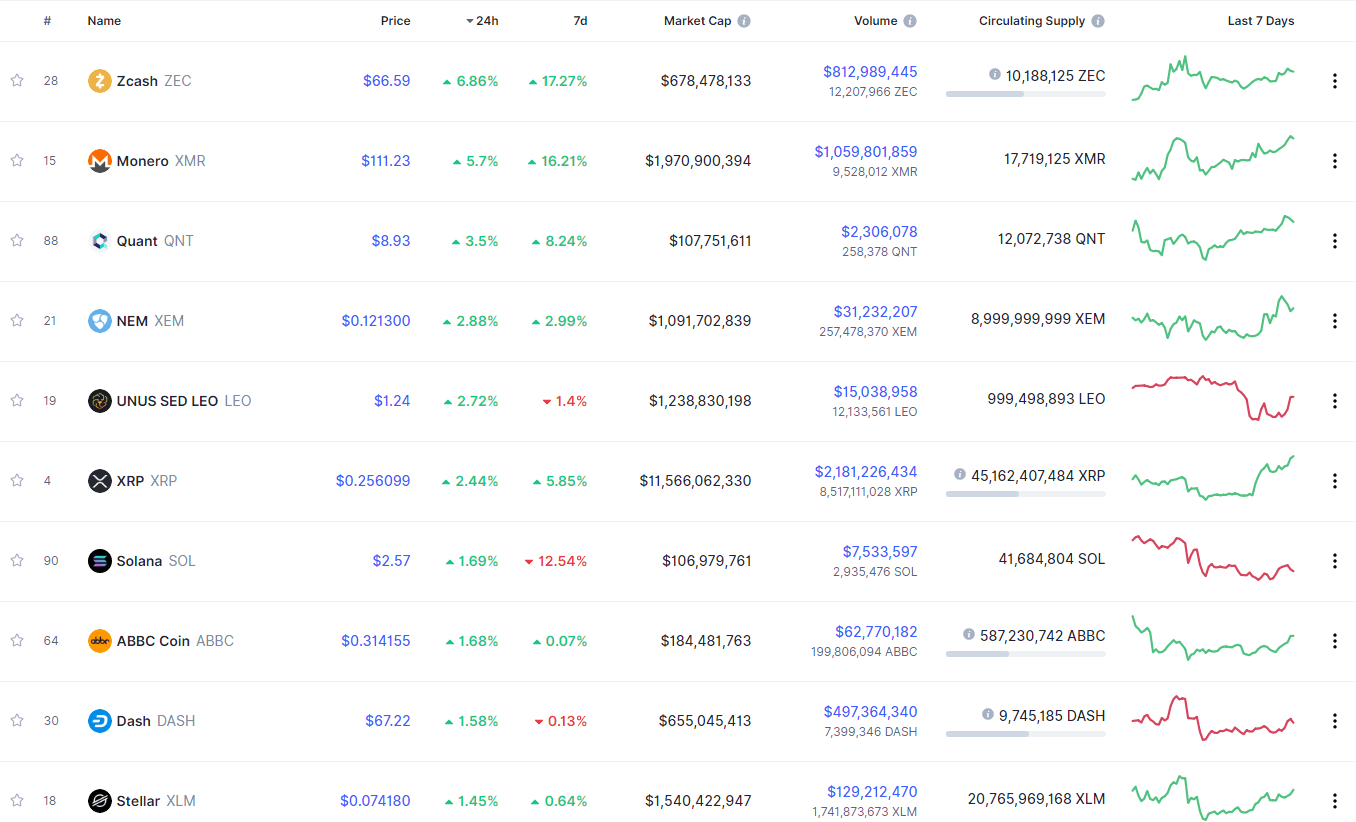
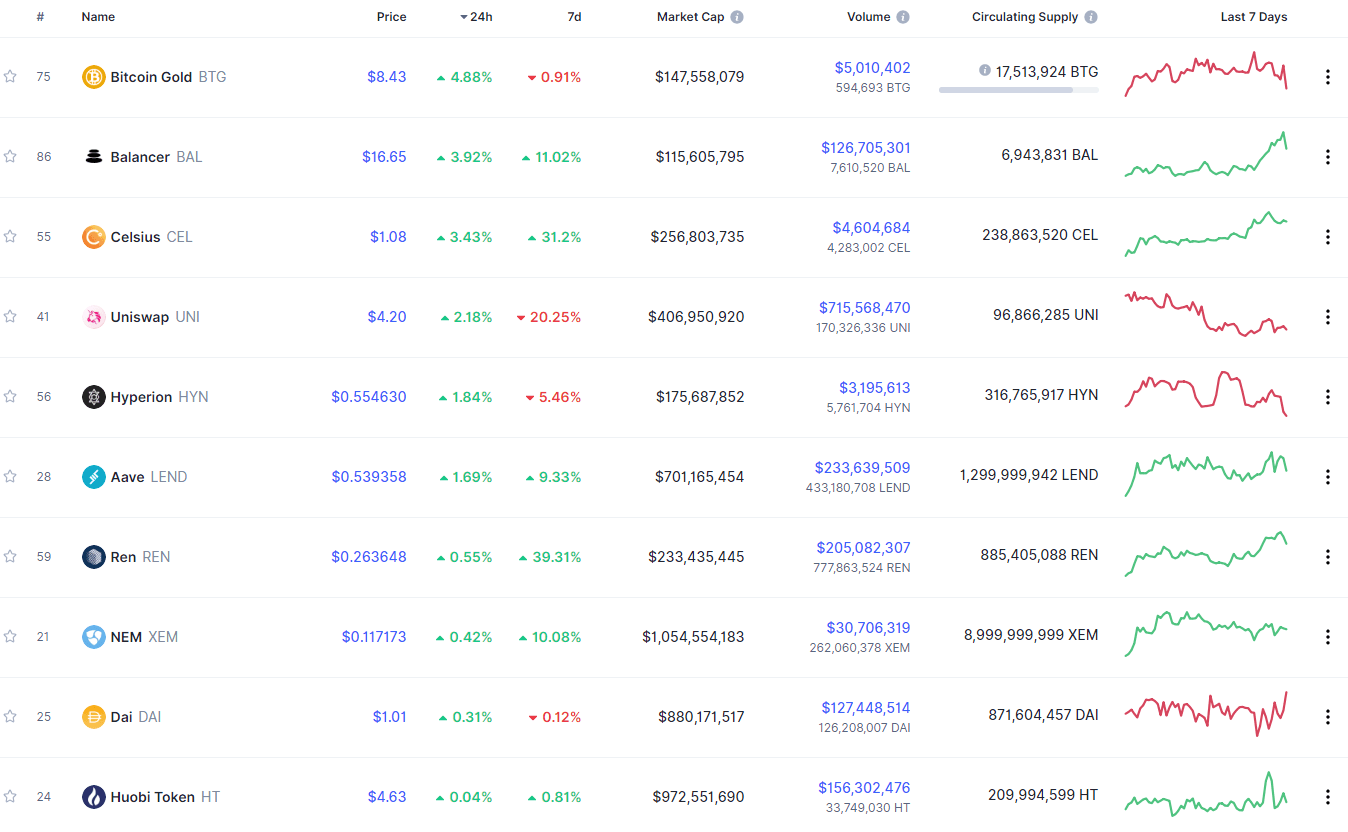
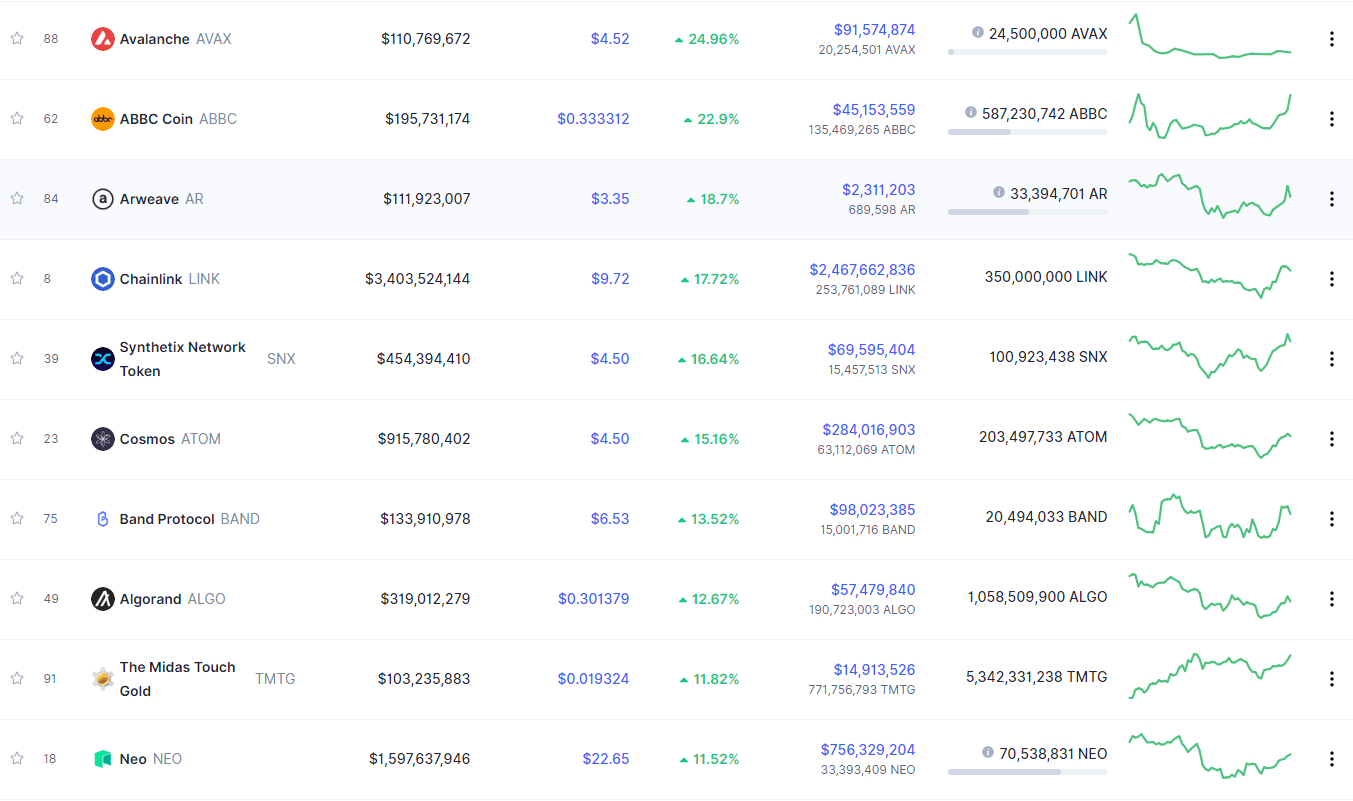
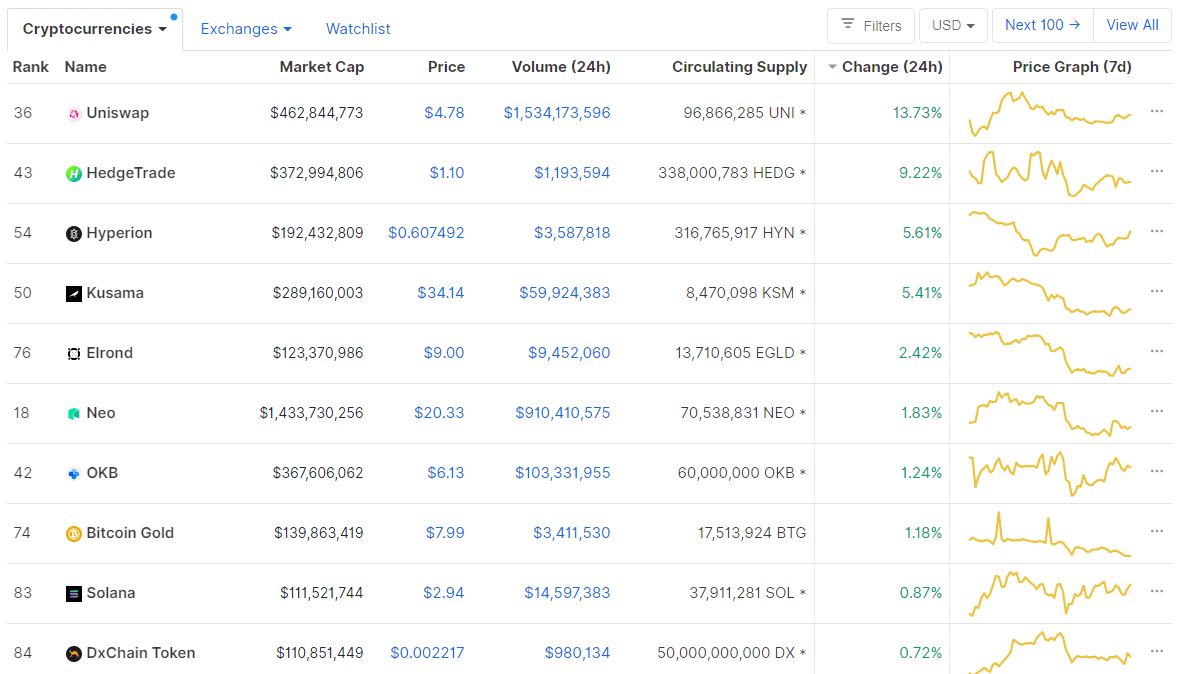
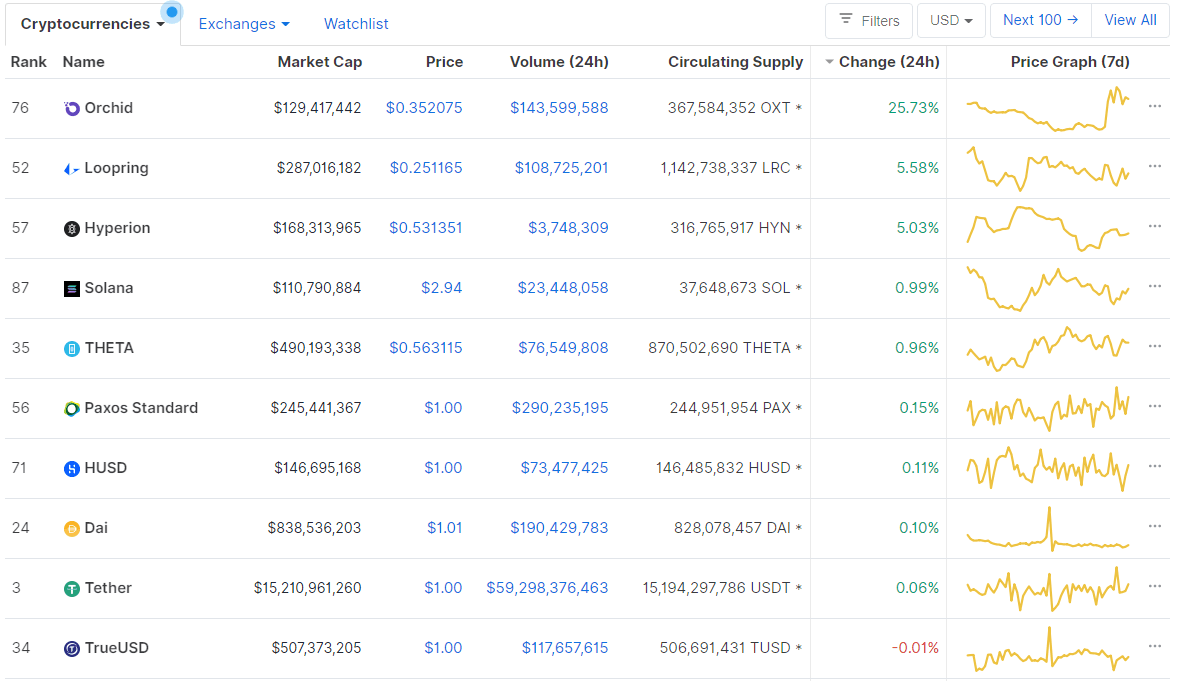
Top 10 24-hour Performers (Click to enlarge)
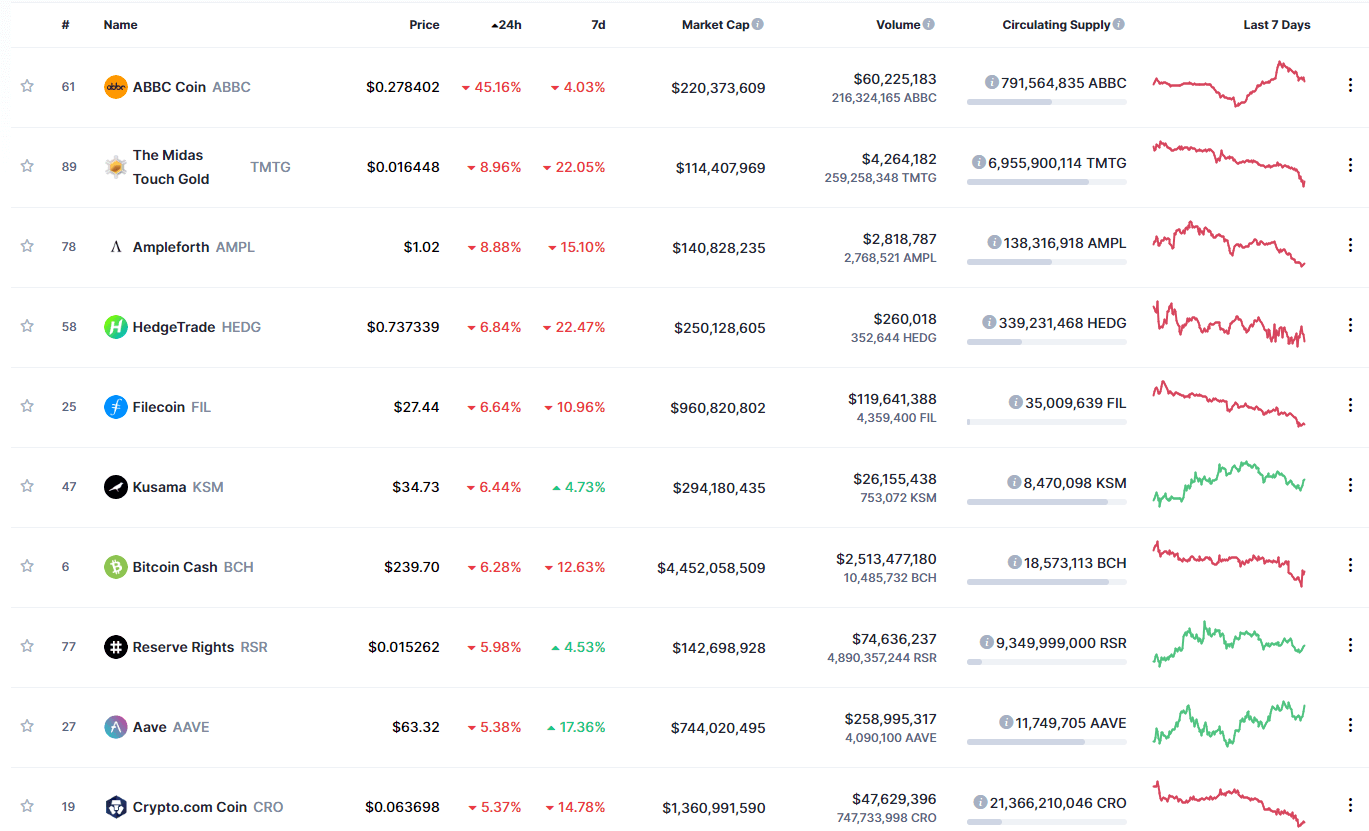
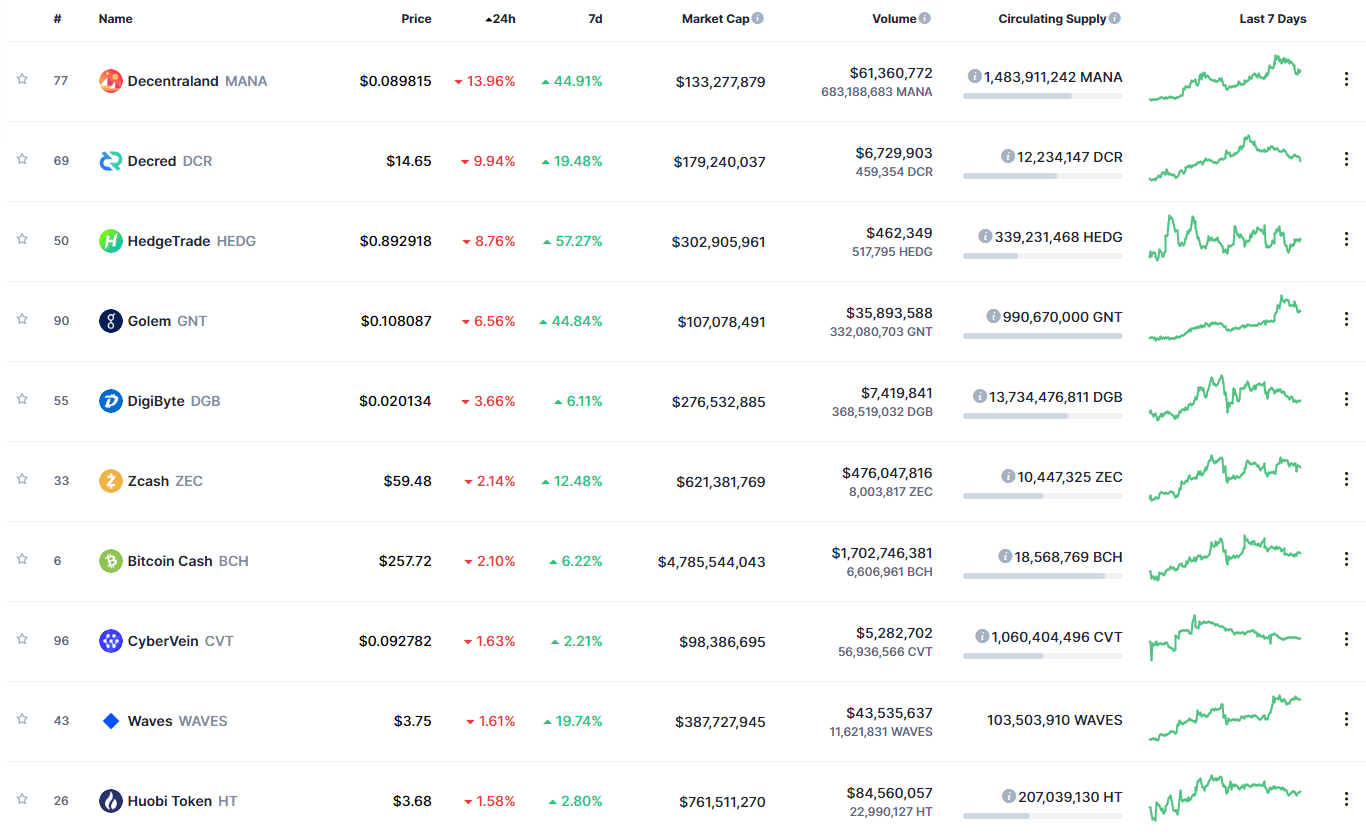
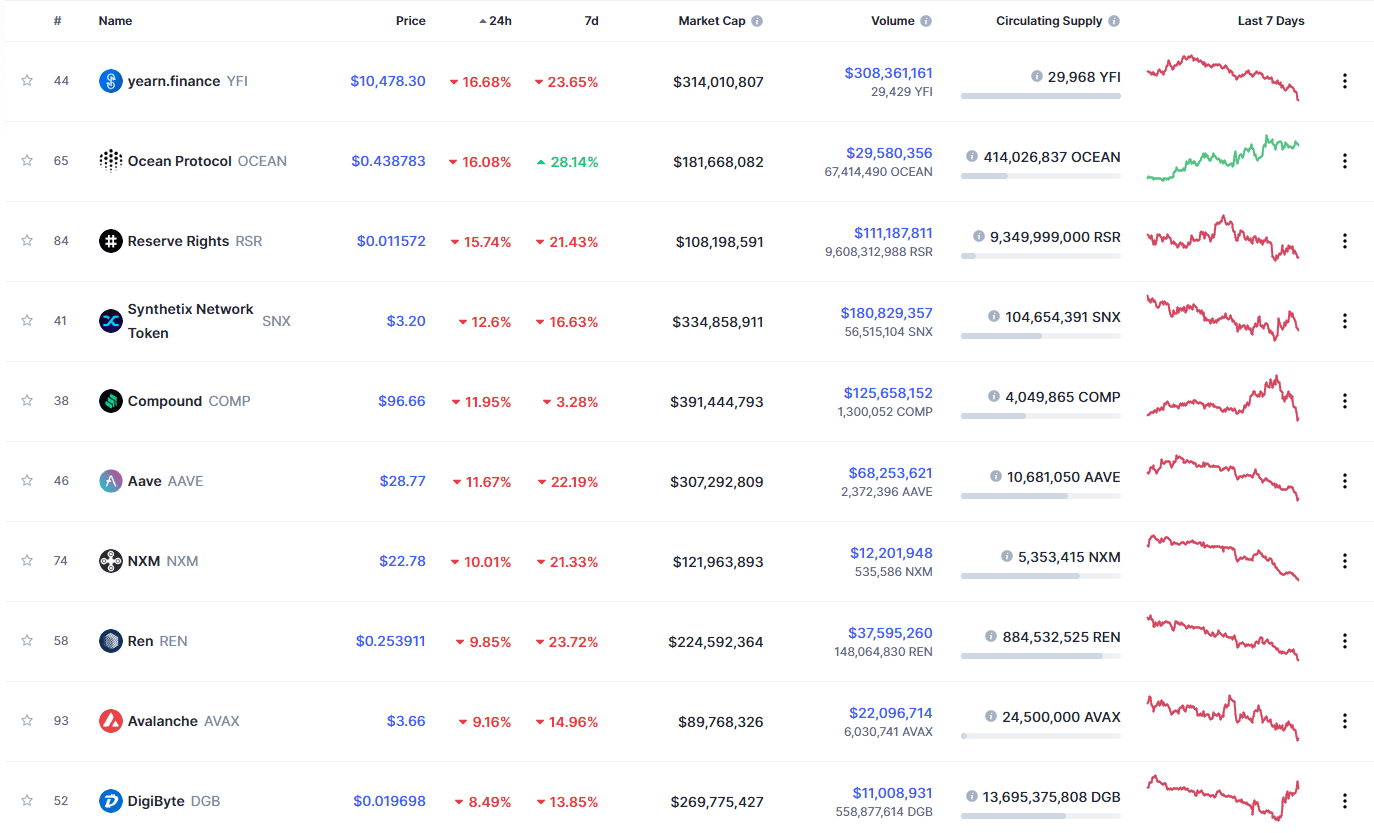
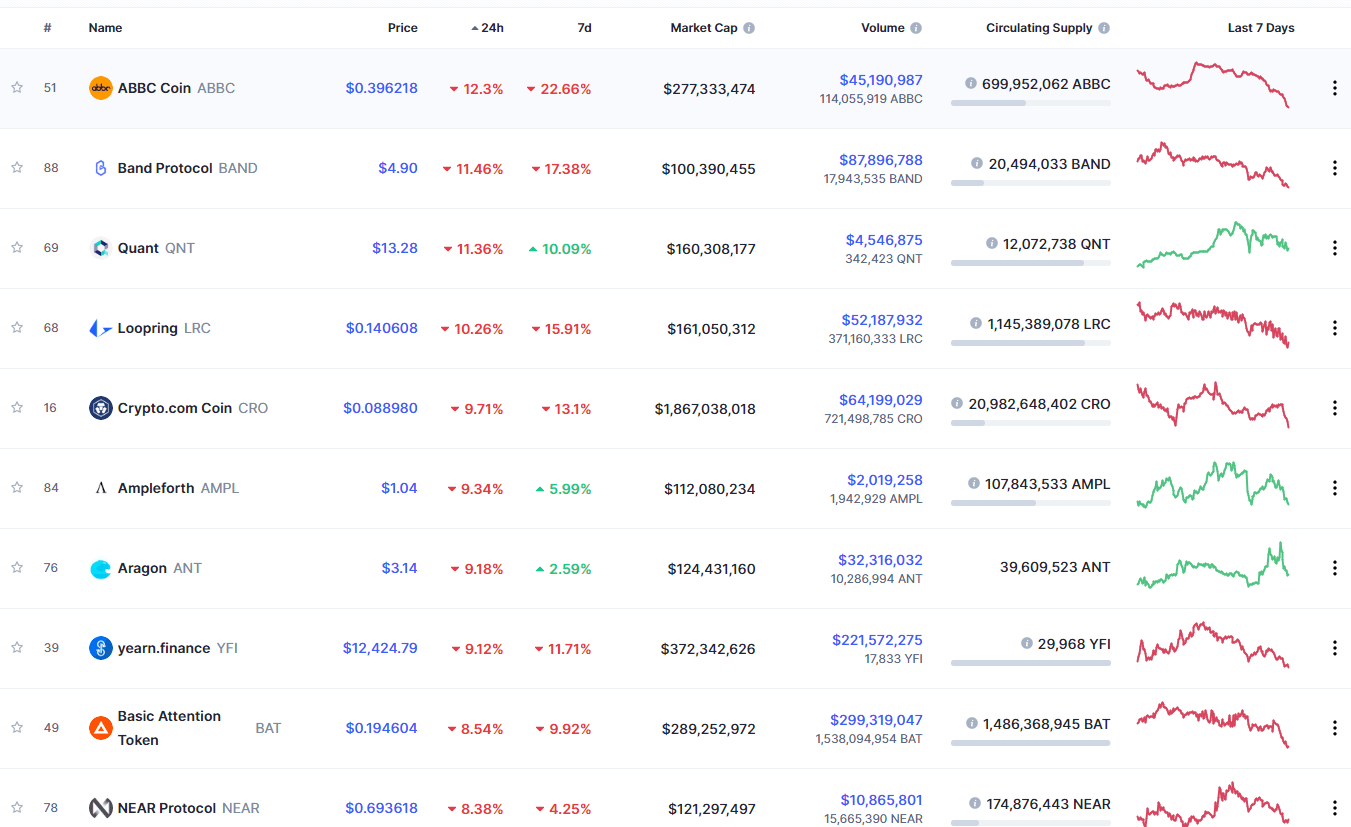
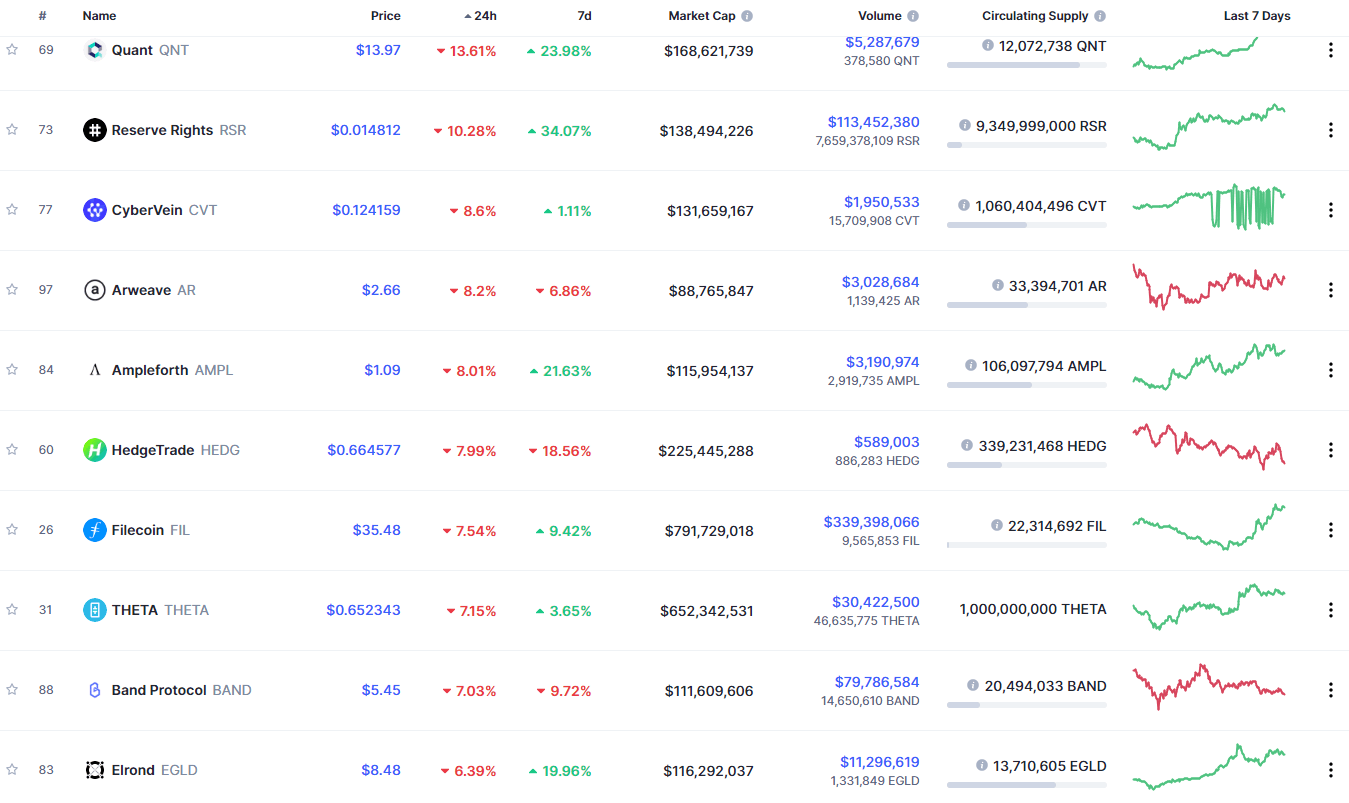
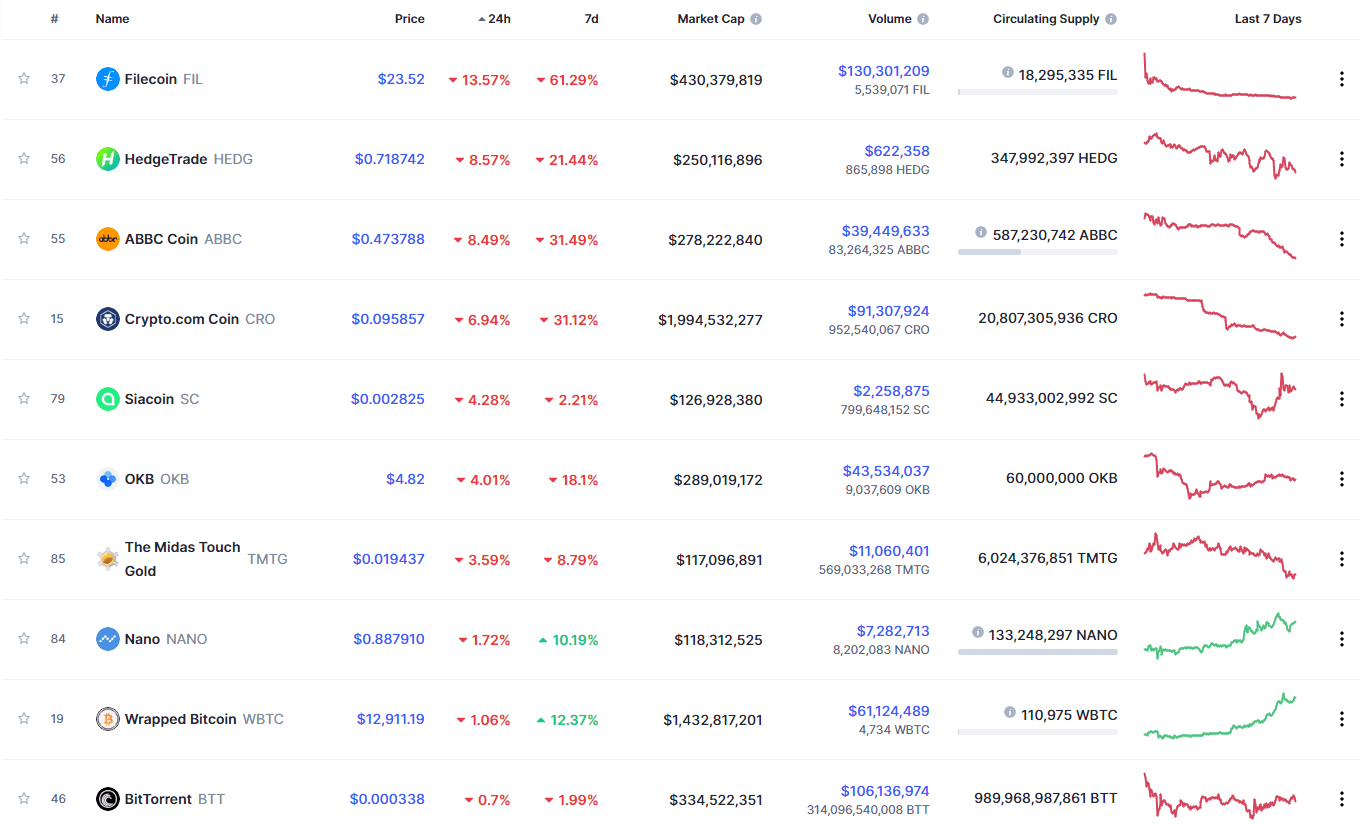
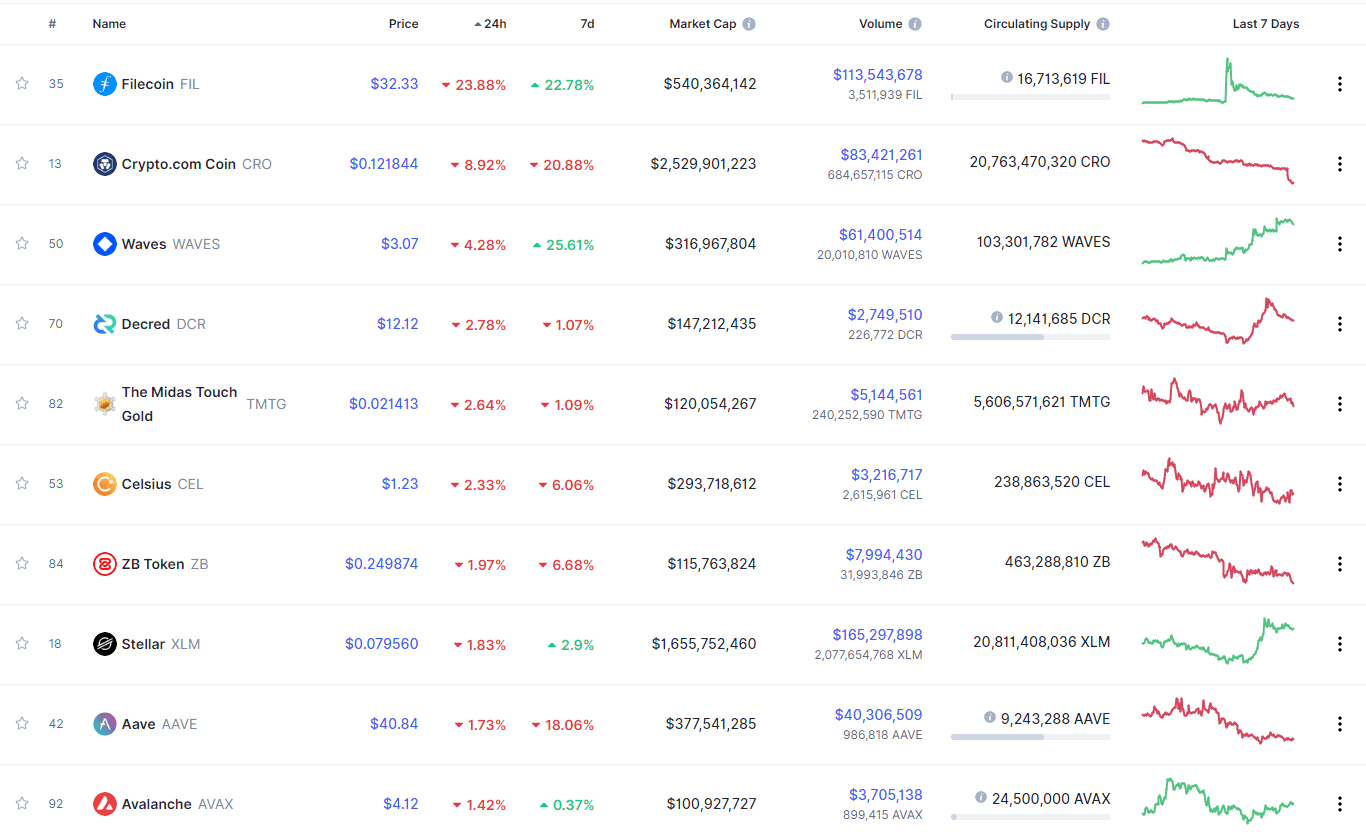
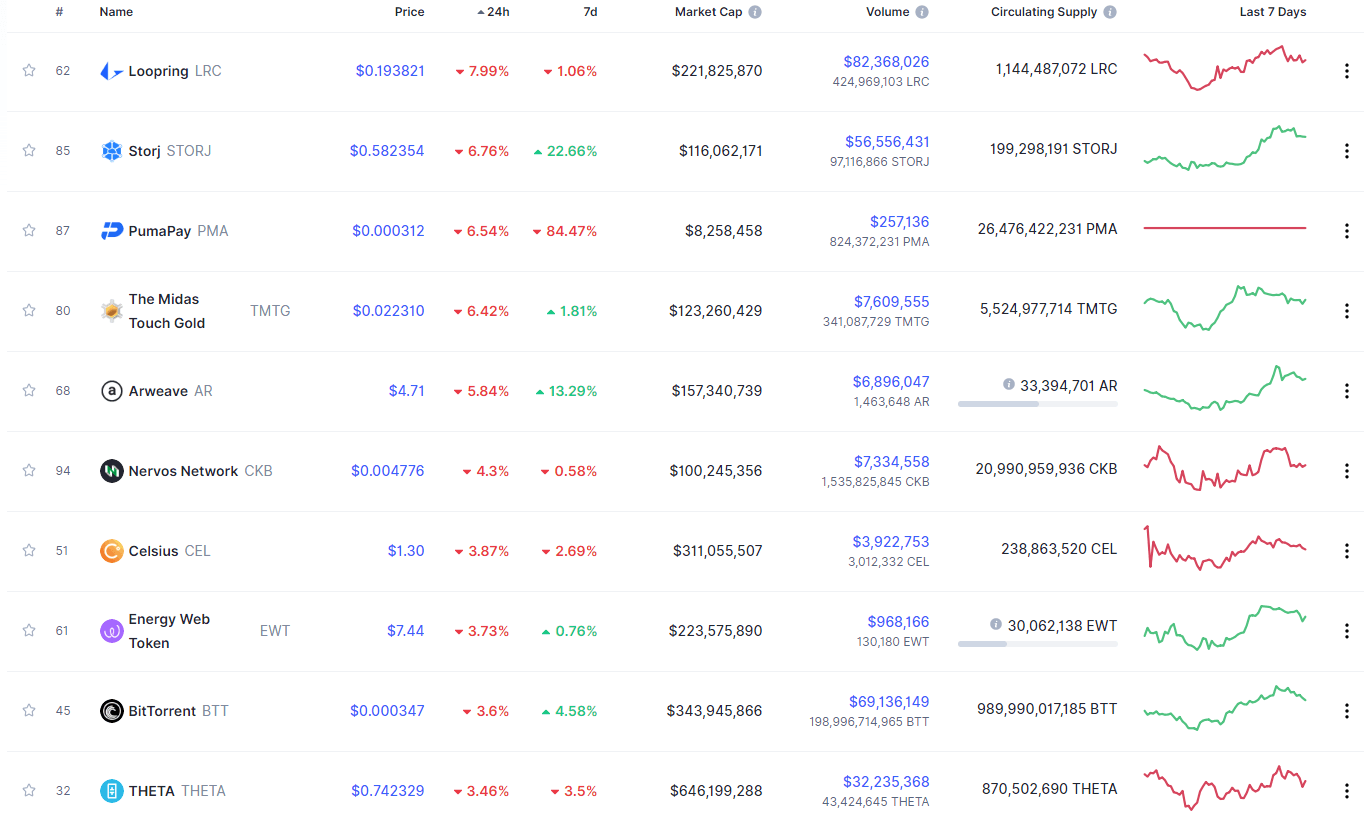
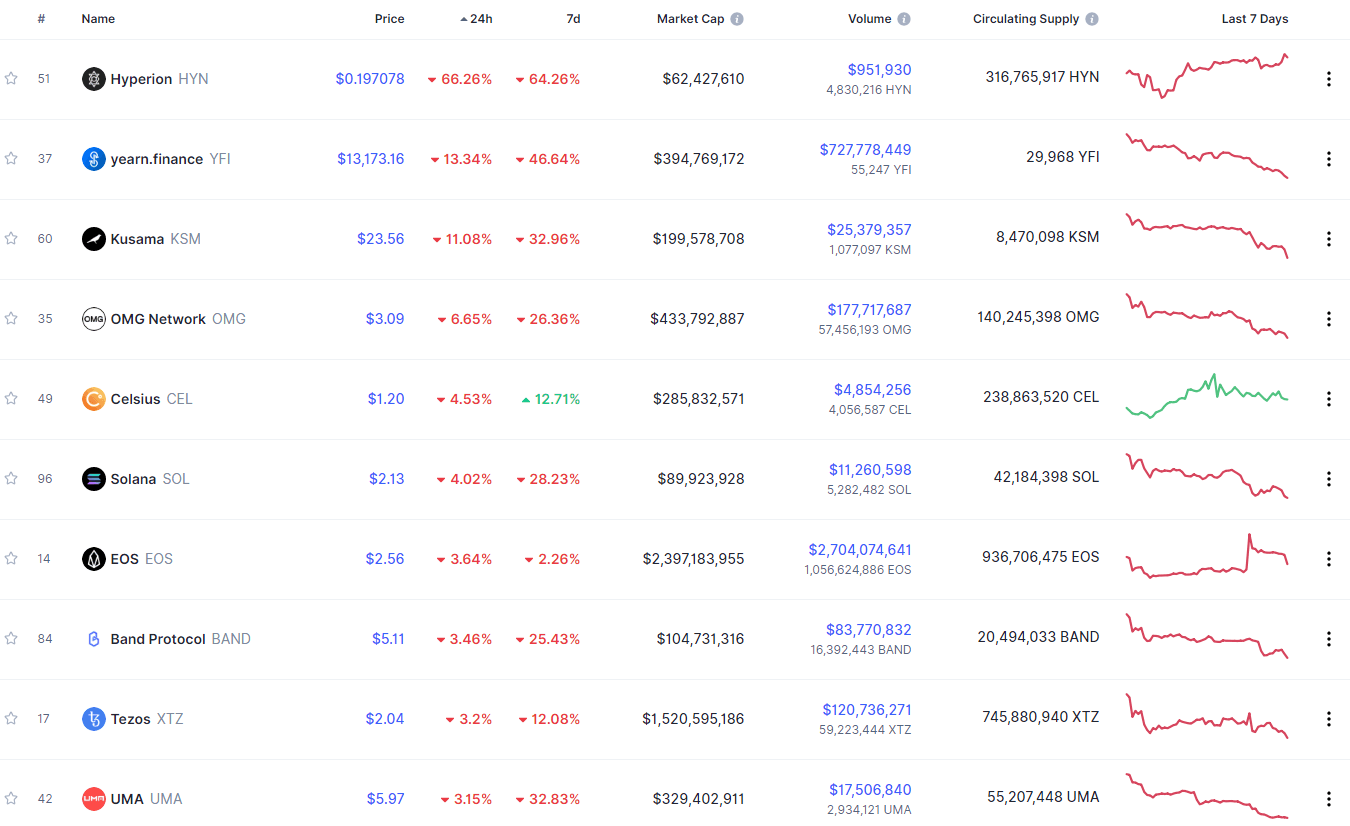
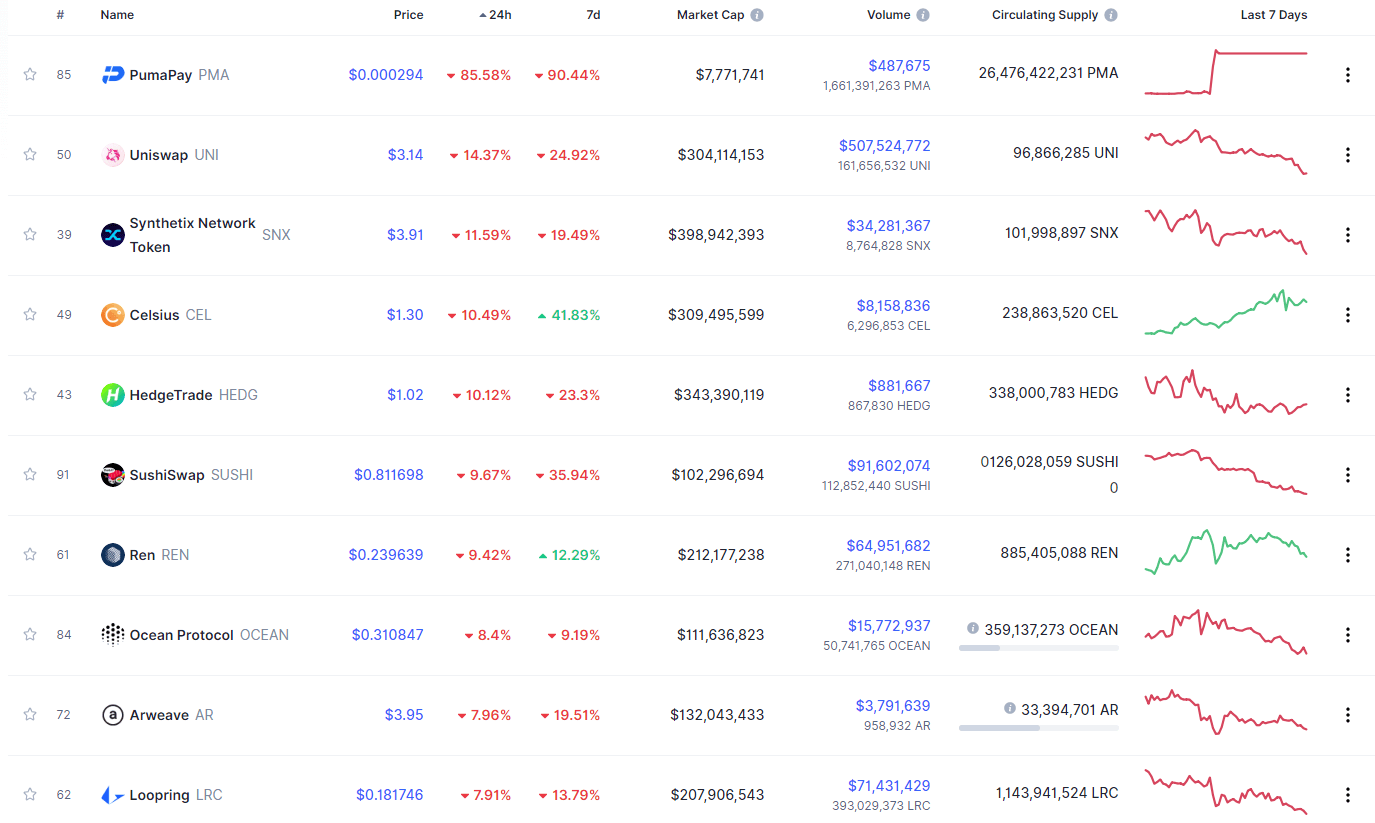
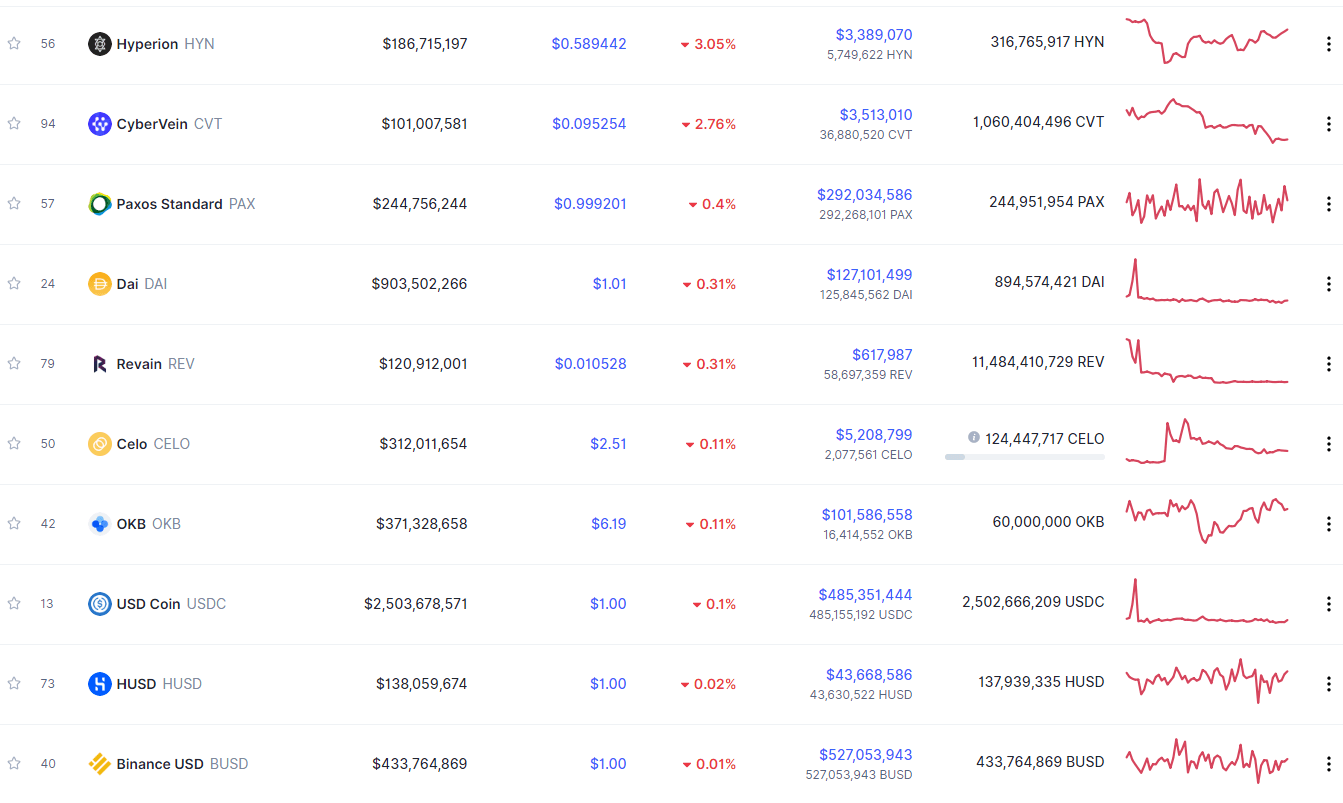
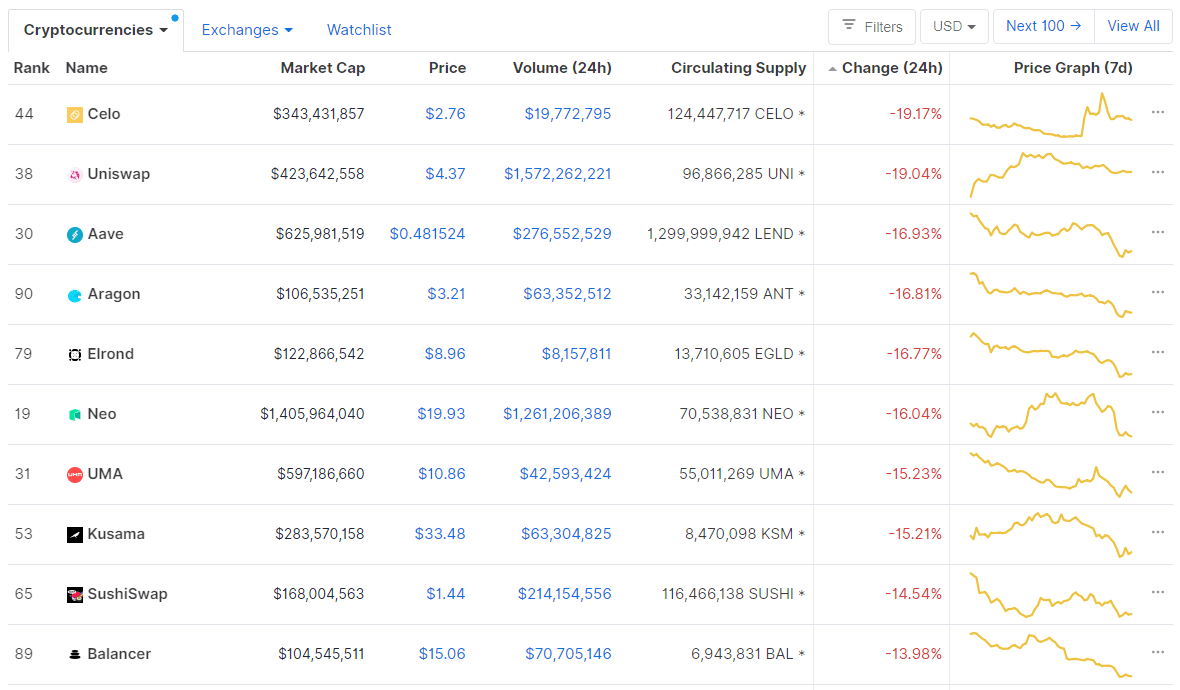
Bottom 10 24-hour Performers (Click to enlarge)
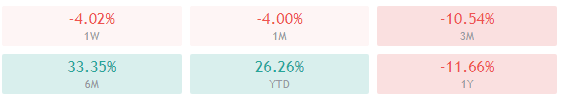
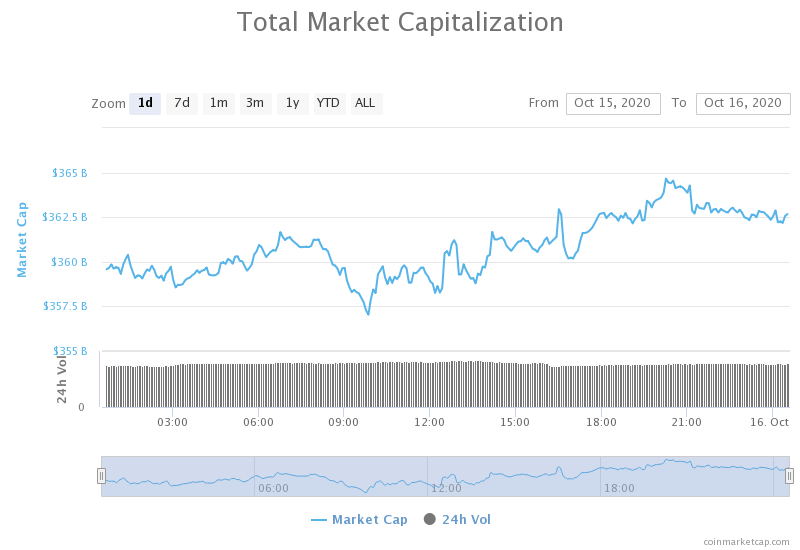
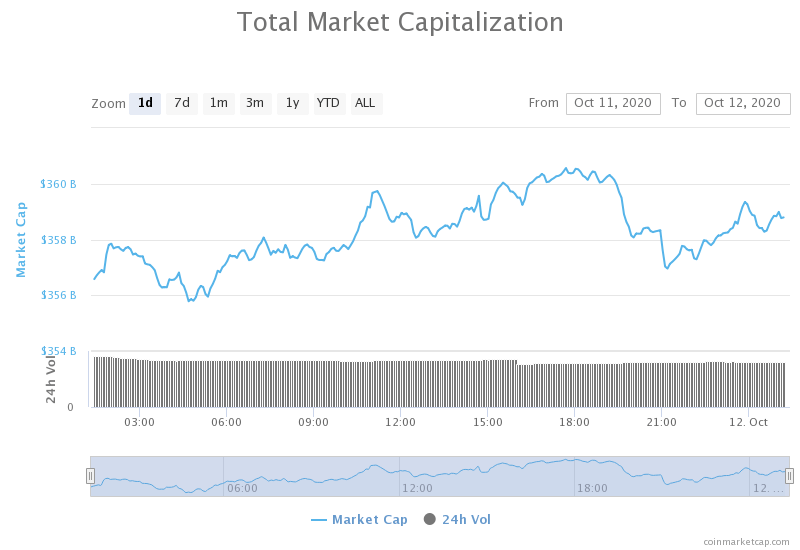
Bitcoin’s market dominance has decreased slightly over the weekend, with its value is currently staying at 65%. This value represents a 0.3% difference to the downside compared to the value it had on Friday.
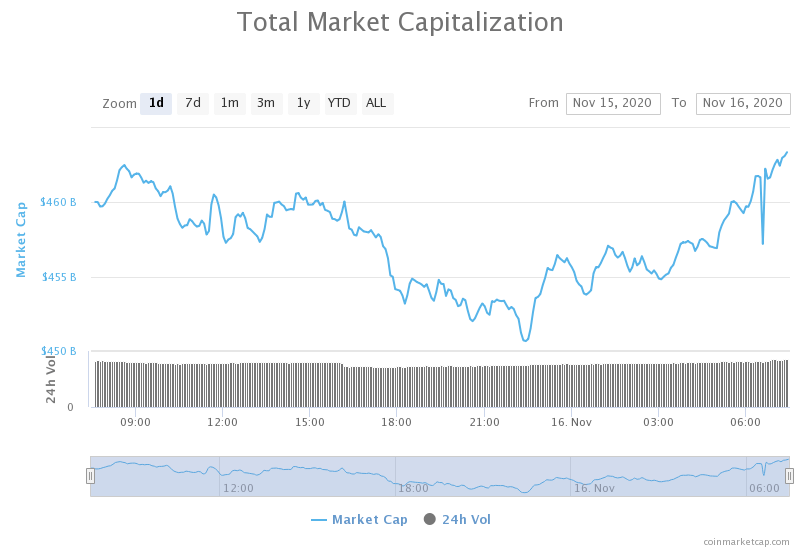
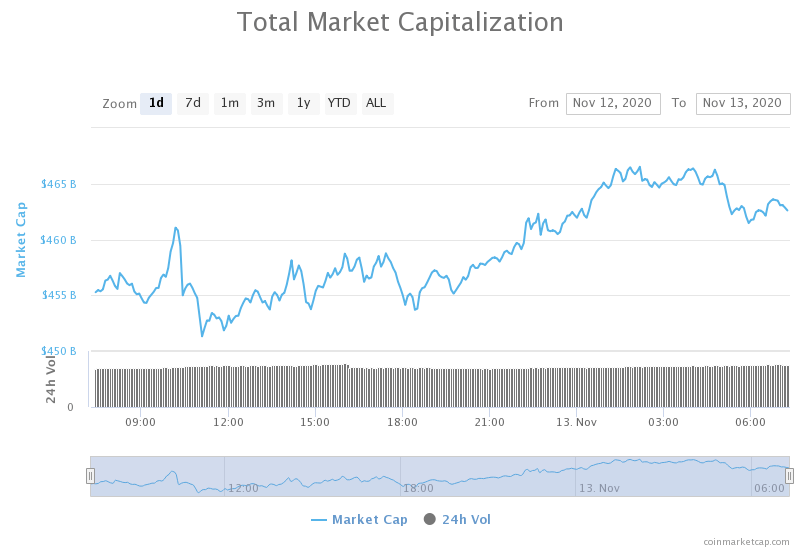
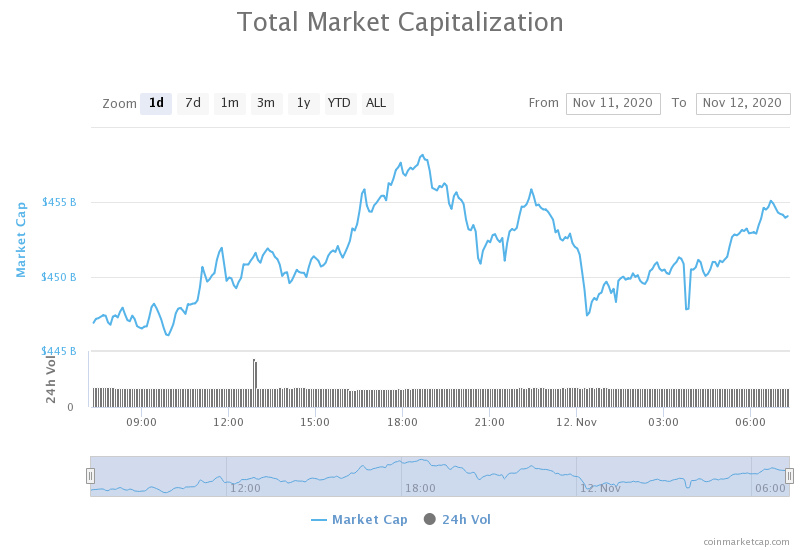
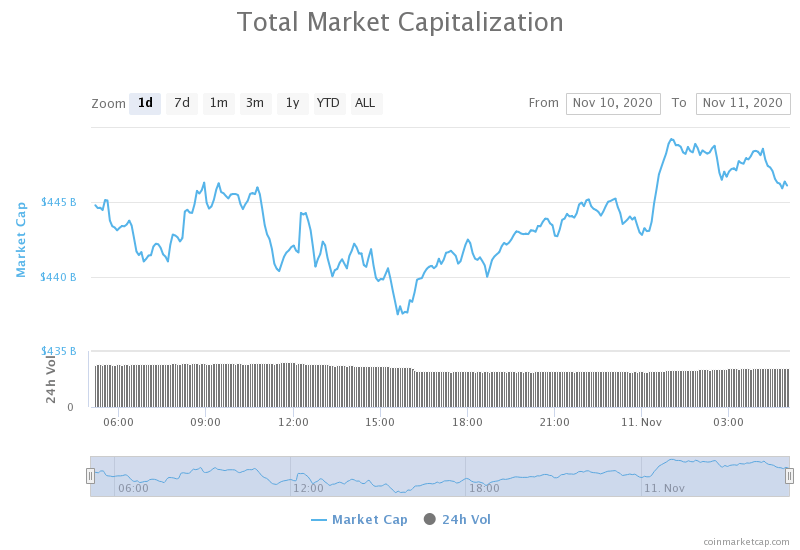
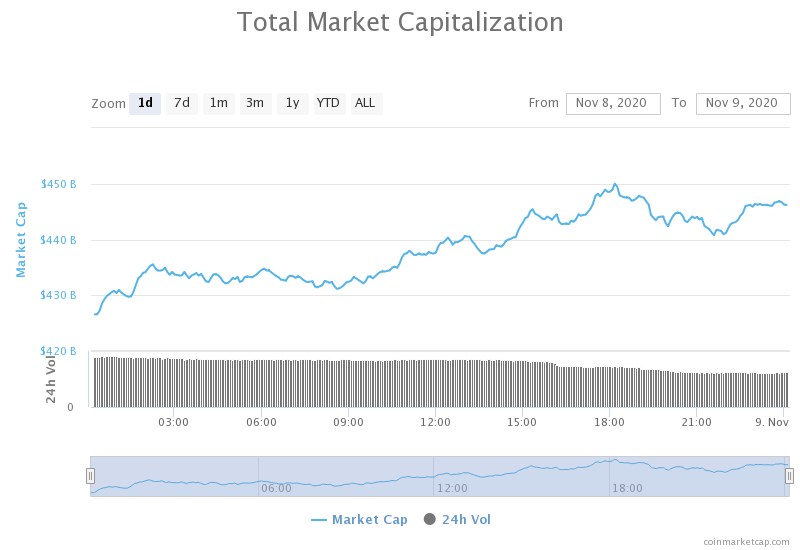
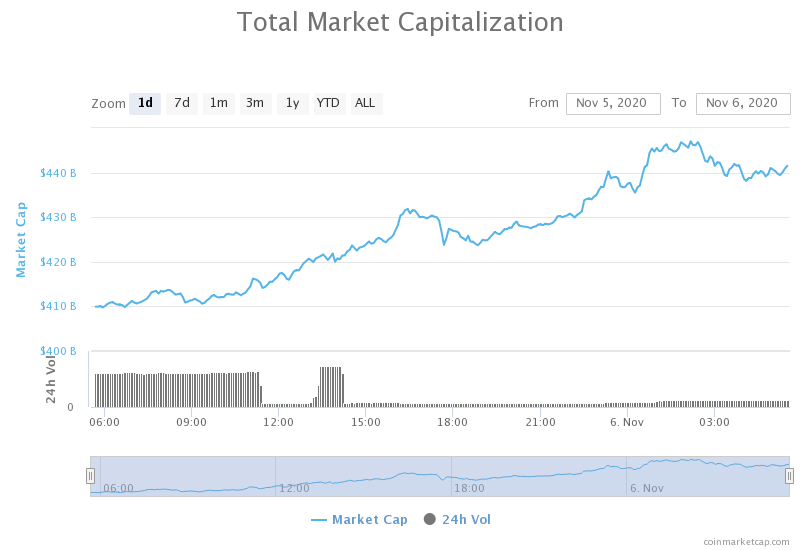
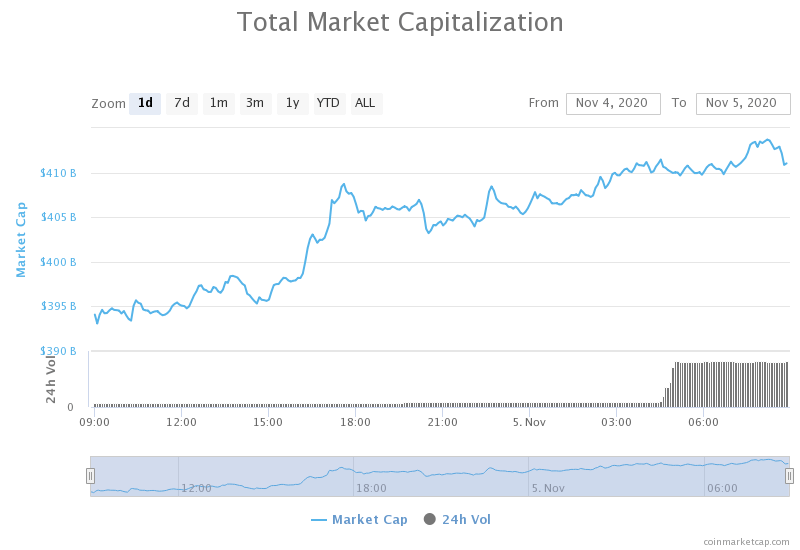
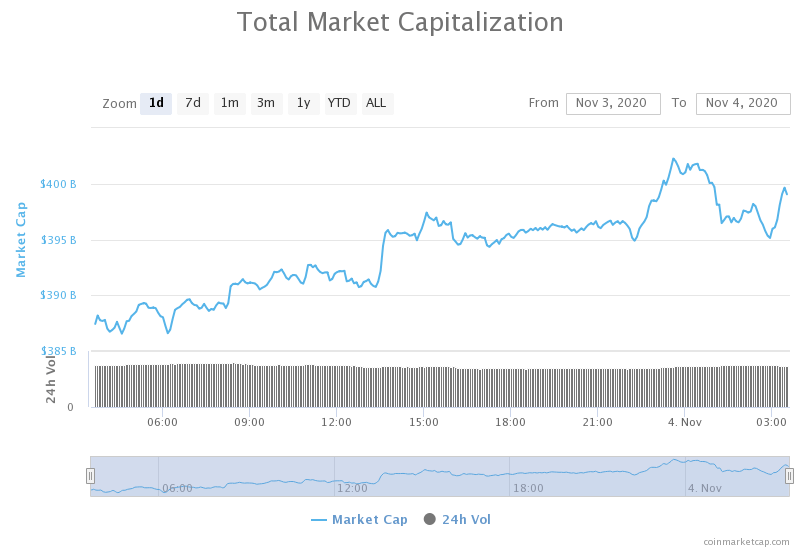
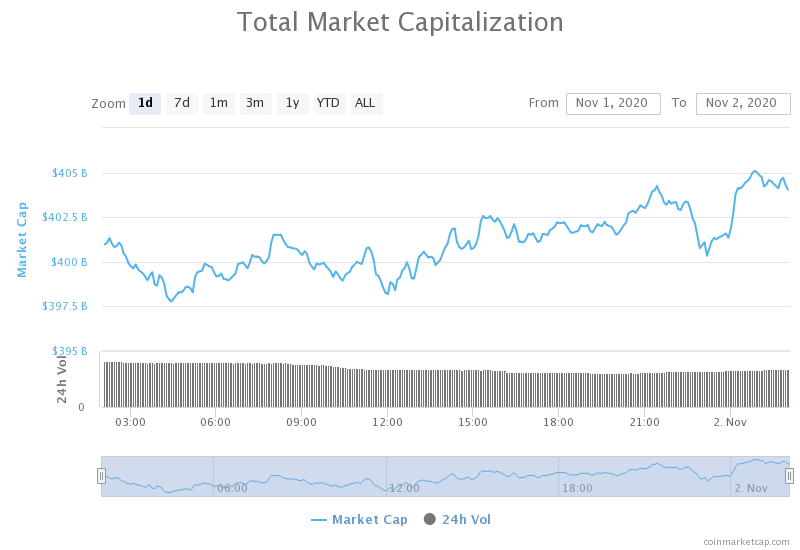
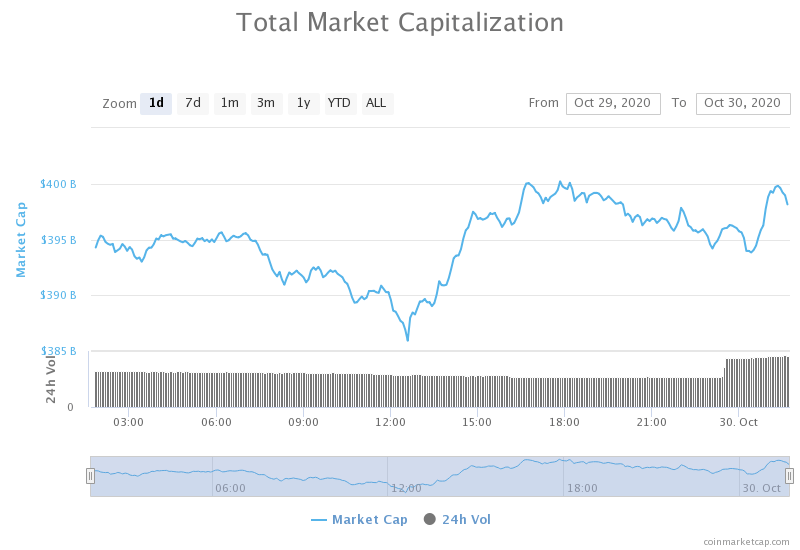
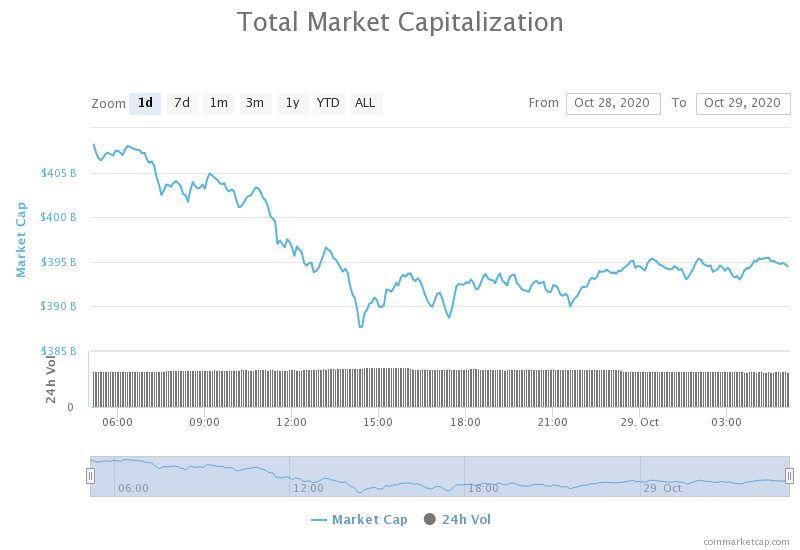
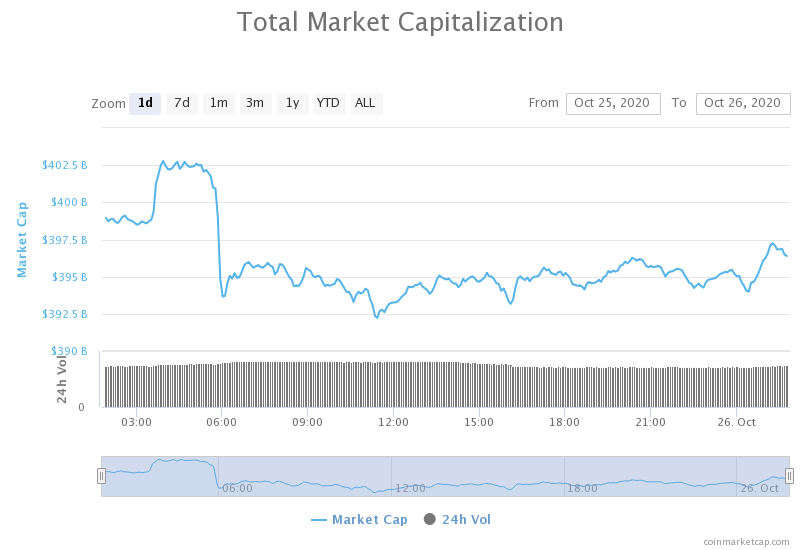
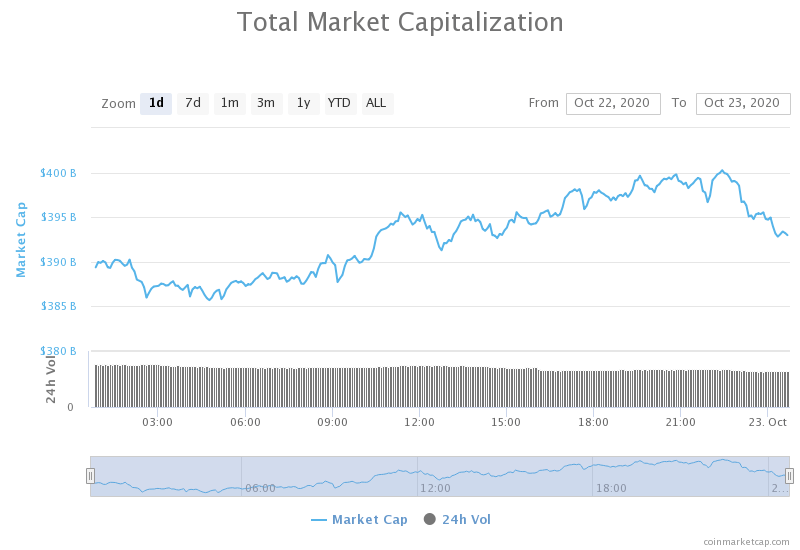
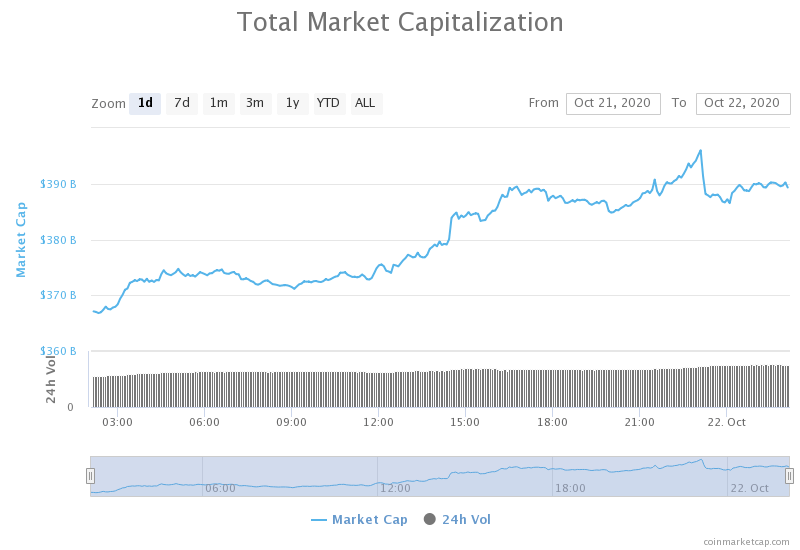
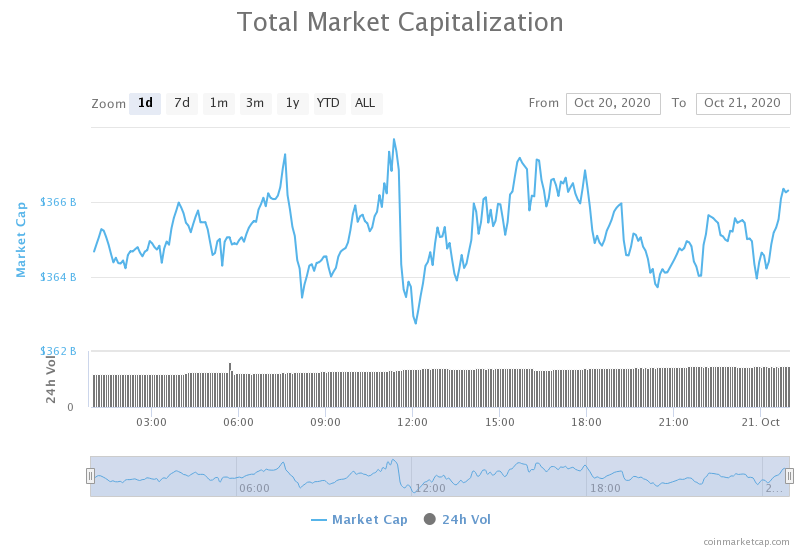
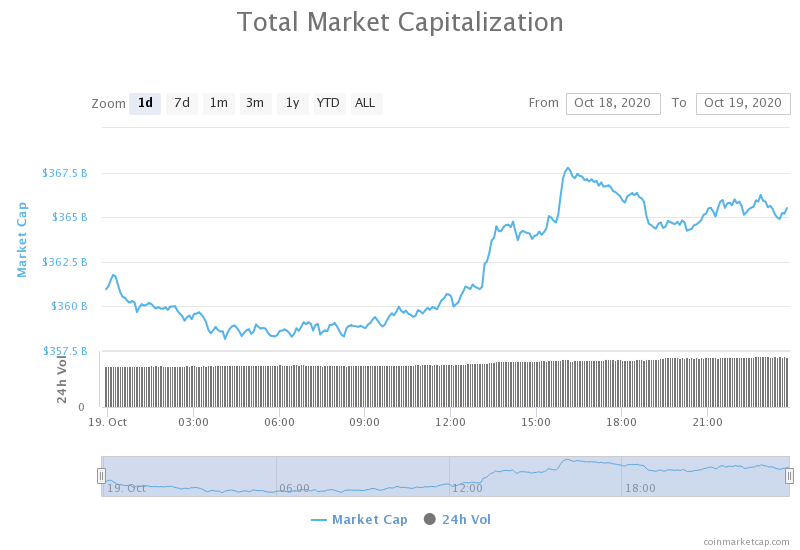
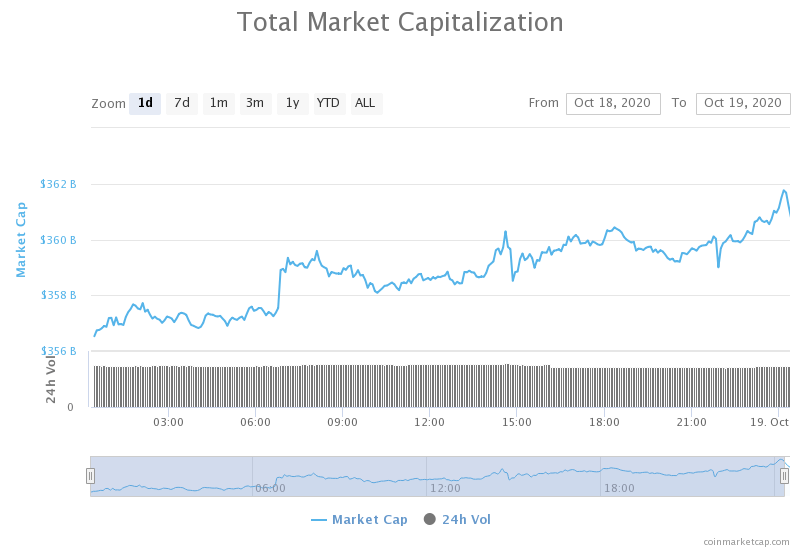
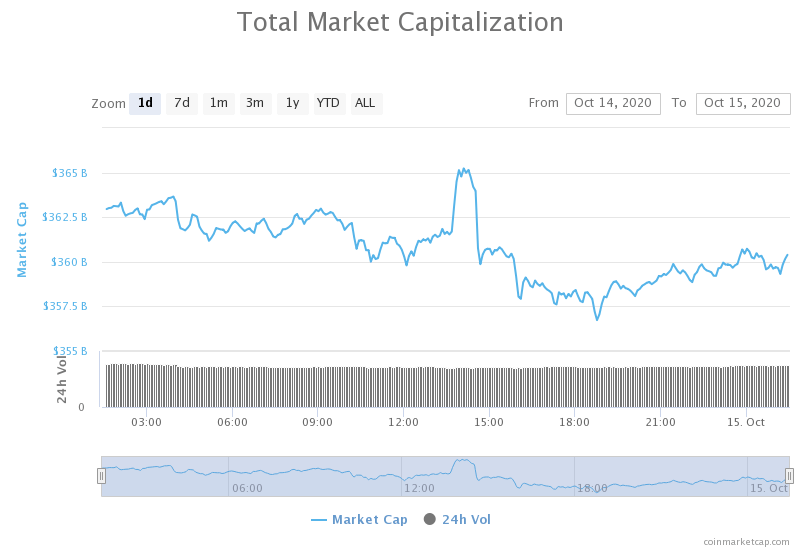
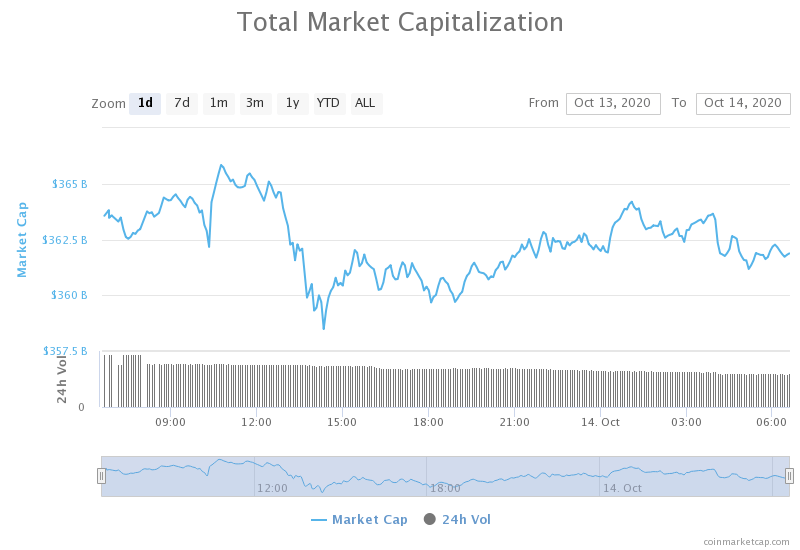
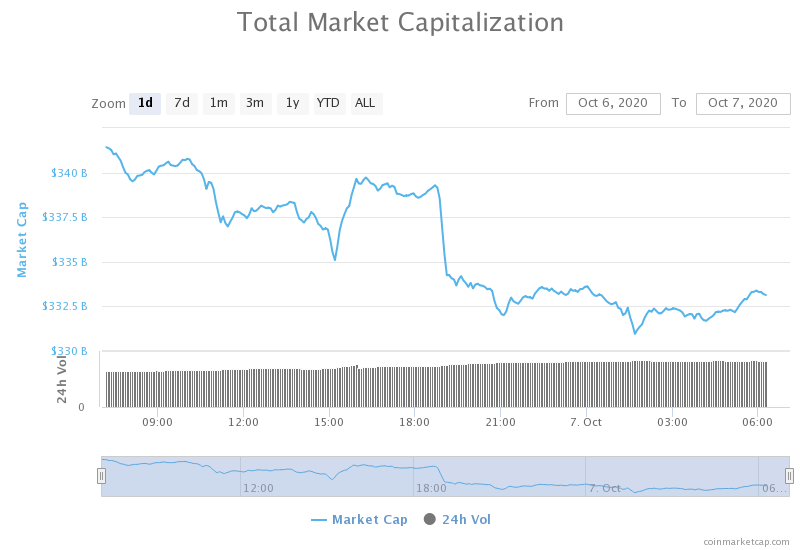
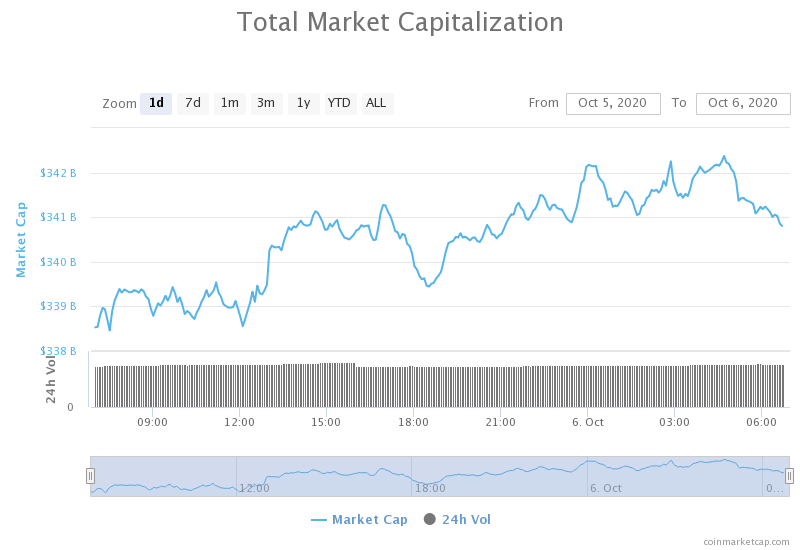
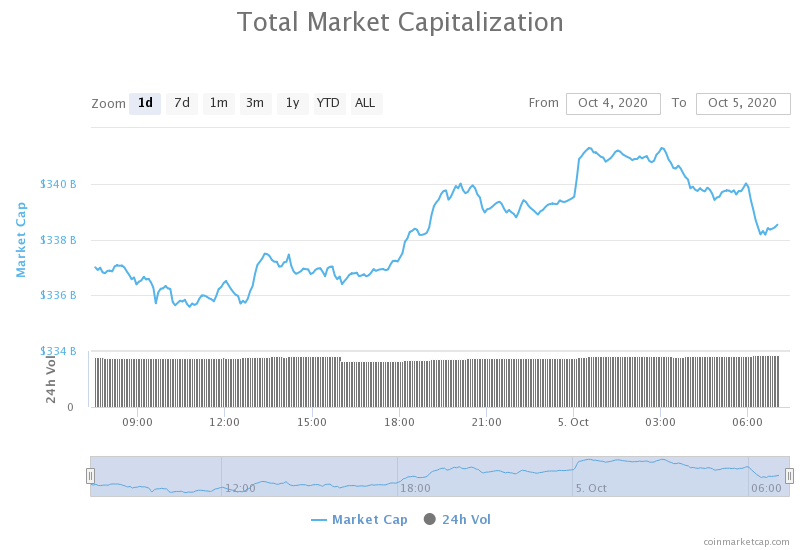
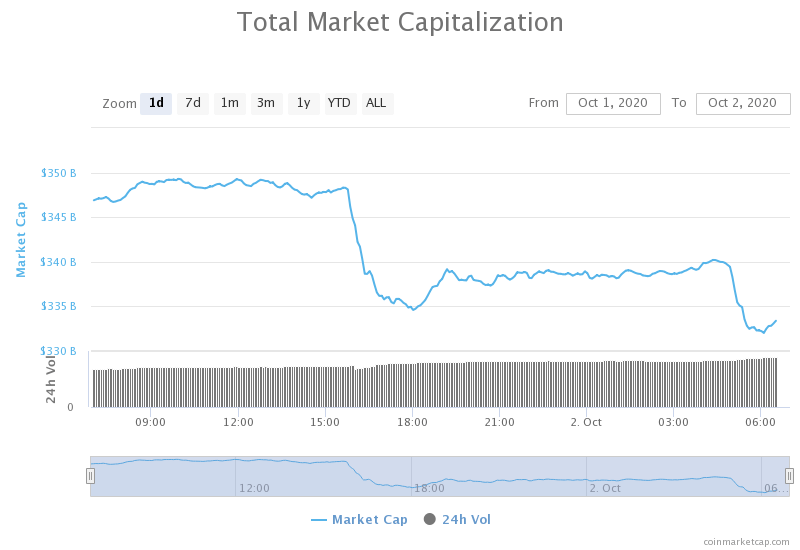
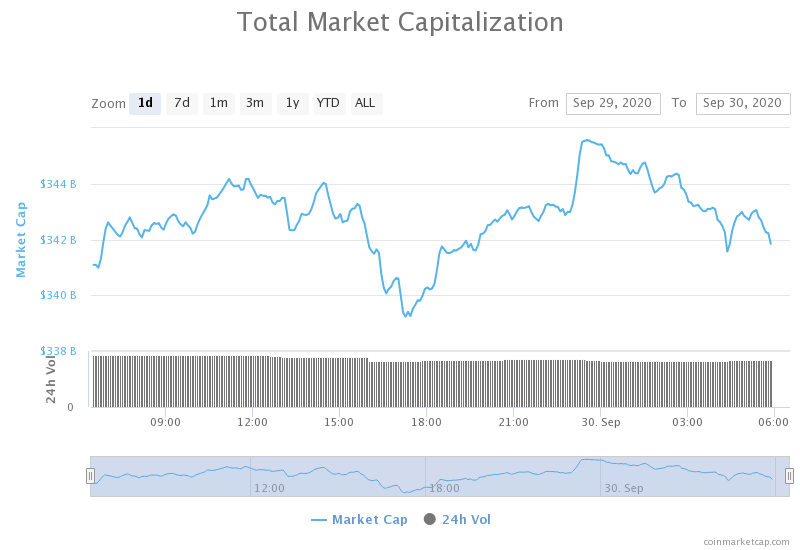
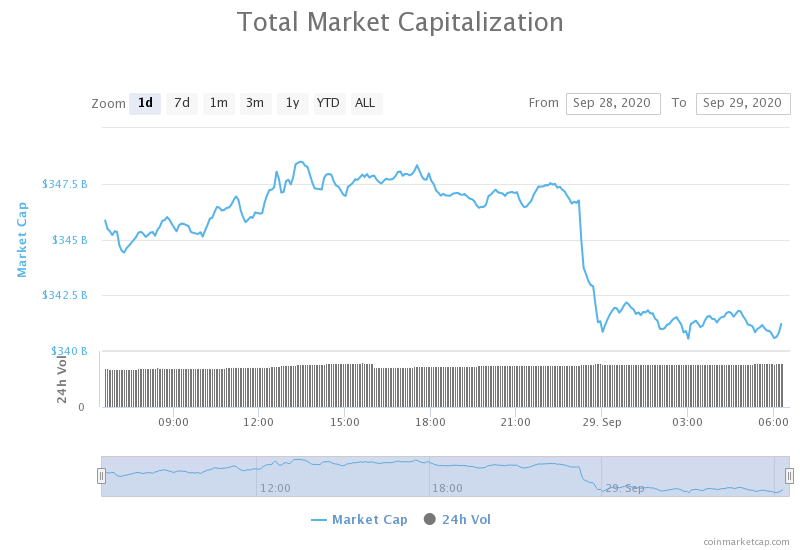
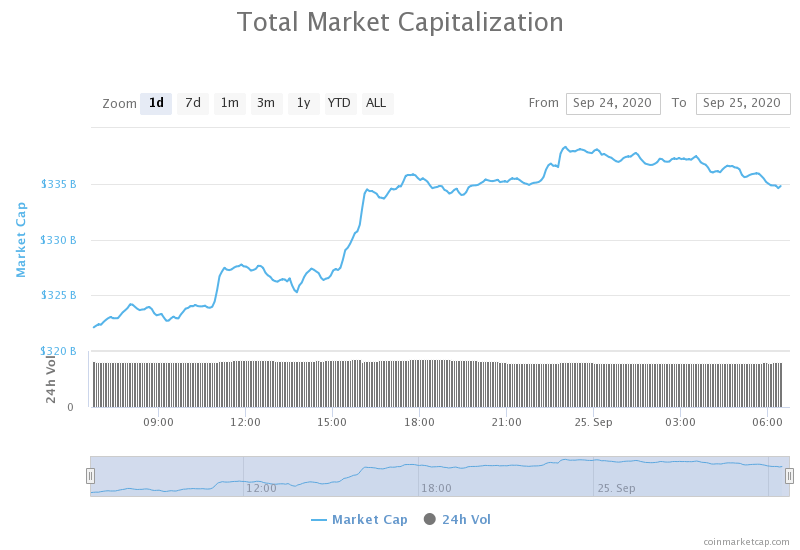
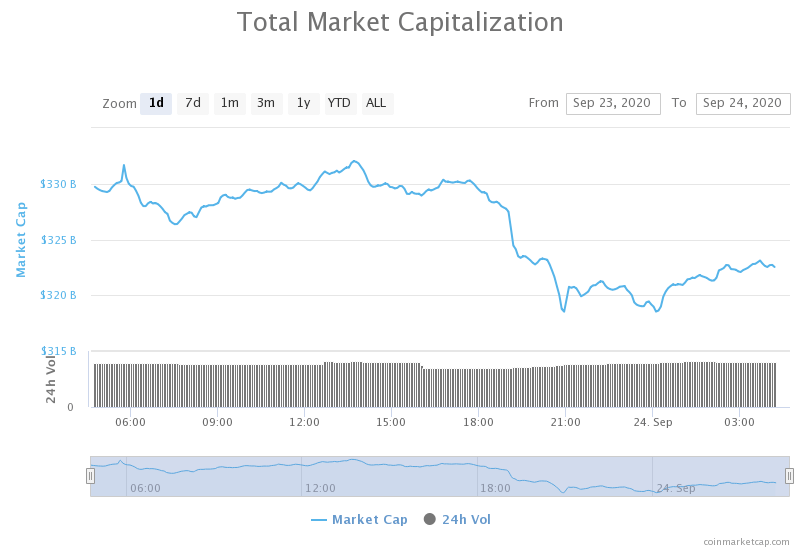
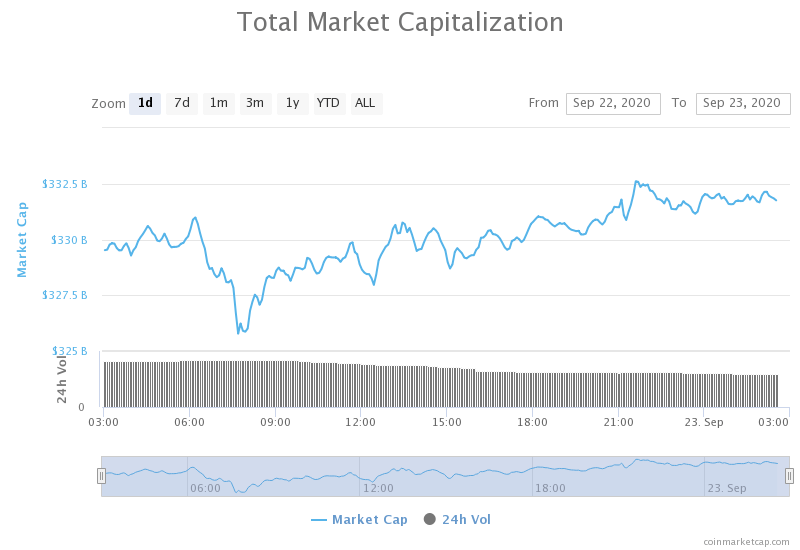
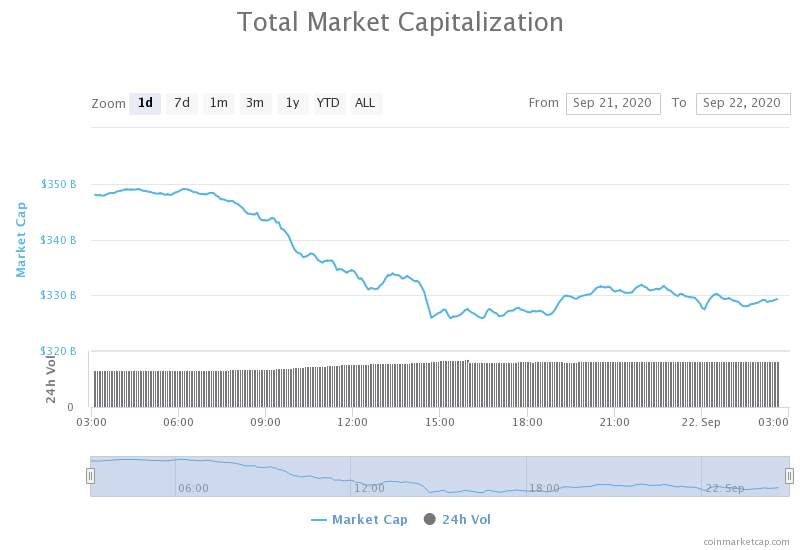
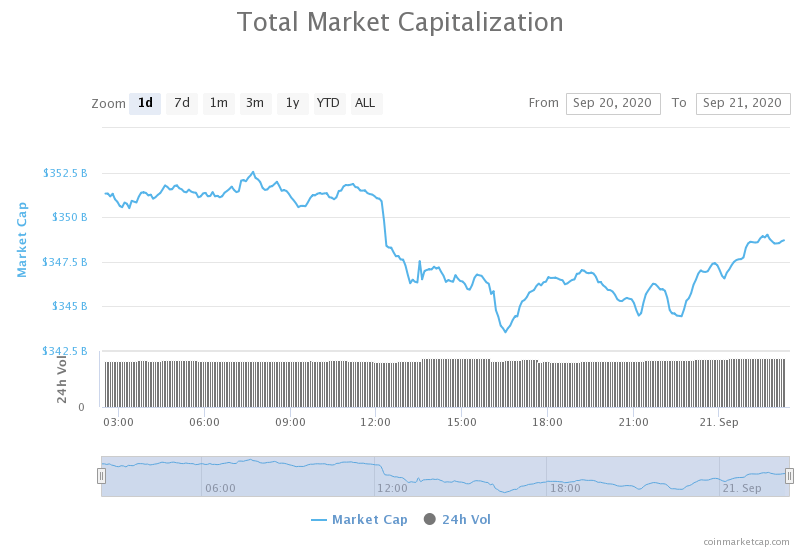
Daily Crypto Market Cap Chart
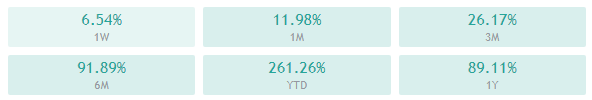
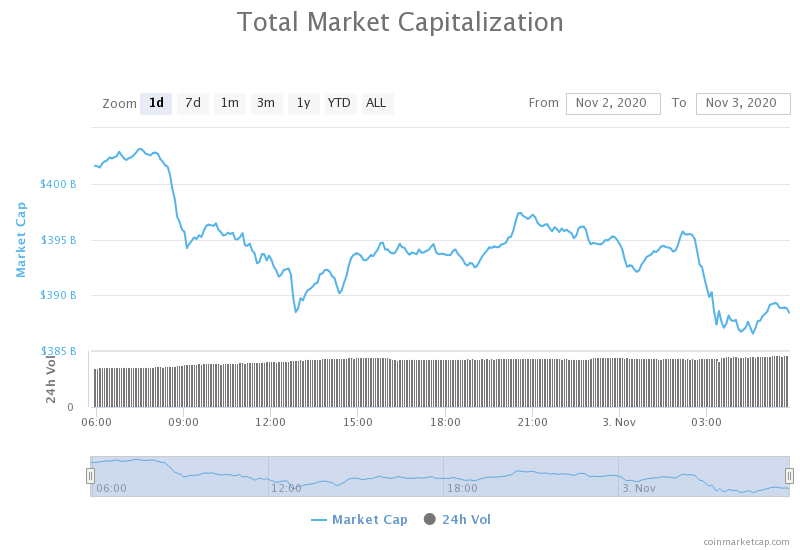
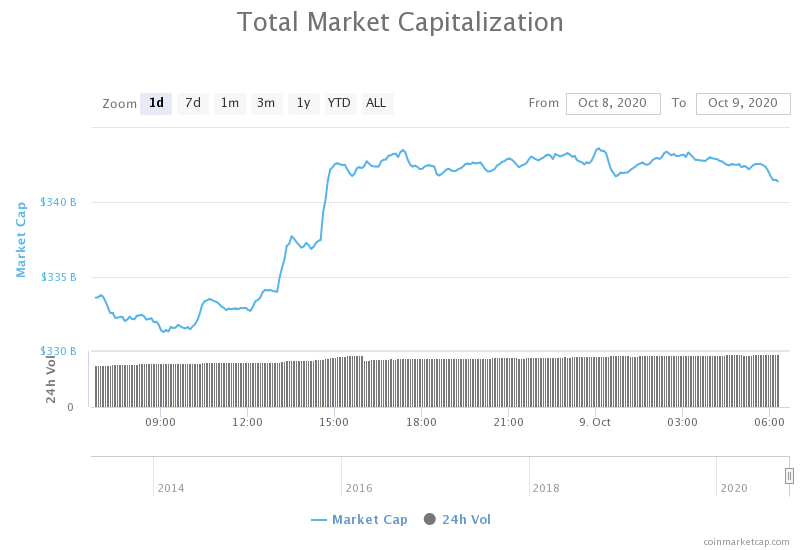
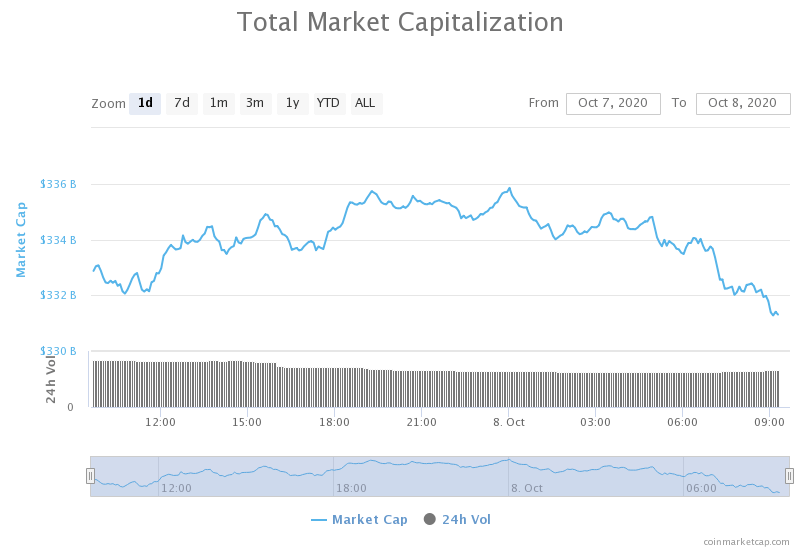
The crypto sector capitalization has gone up very slightly over the course of the weekend. Its current value is $463.37 billion, representing an $0.51 billion increase compared to our previous report.
_______________________________________________________________________
What happened in the past 24 hours?
_______________________________________________________________________
- Grayscale Nears $10 Billion AUM, Institutional Demand for Bitcoin Heats Up (Cryptobriefing)
- Bitcoin Cash Hard Fork Complete, Battle for Dominant Chain Begins (Cryptobriefing)
- New Bitcoin Mining Pool Says It Will Censor BTC Transactions (Cryptobriefing)
- Why are crypto communities baffled by PayPal’s Bitcoin and Ethereum descriptions (Cryptoslate)
- This company wants to help the US feds in selling $1 billion of seized Bitcoin (Cryptoslate)
- Ethereum’s consensus bug chain split revives the specter of network centralization (The Block)
- US regulators have hit crypto firms with at least $198 million in financial penalties to date (The Block)
- Crypto Long & Short: What We’re Getting Wrong About Druckenmiller and Bitcoin (Coindesk)
- Central bank digital currencies (CBDC’s) are dead in the water (Cointelegraph)
- Blockchain voting is a possible alternative for trusted democratic elections (Cointelegraph)
Blockseer, a US-based DMG Blockchain Solutions’ subsidiary, has recently announced a private beta version of a brand new Bitcoin mining pool. This particular mining pool is, however, quite unique and different. The Blockseer Mining Pool will, unlike any other mining pool, censor transactions from wallets that are blacklisted. They also plan on mandating the miners to undergo KYC procedure, according to marketing materials.
Any new blocks generated by the Blockseer pool will include only filtered transactions, and the filters will be based on the Walletscore’s data.
While some agree that this way of transacting might be the future, the vast majority of public figures say that this is pure censorship and that it goes against the basic principles of Bitcoin as a free cryptocurrency, where a transaction is a transaction, no matter where it comes from.
_______________________________________________________________________
Technical analysis
_______________________________________________________________________
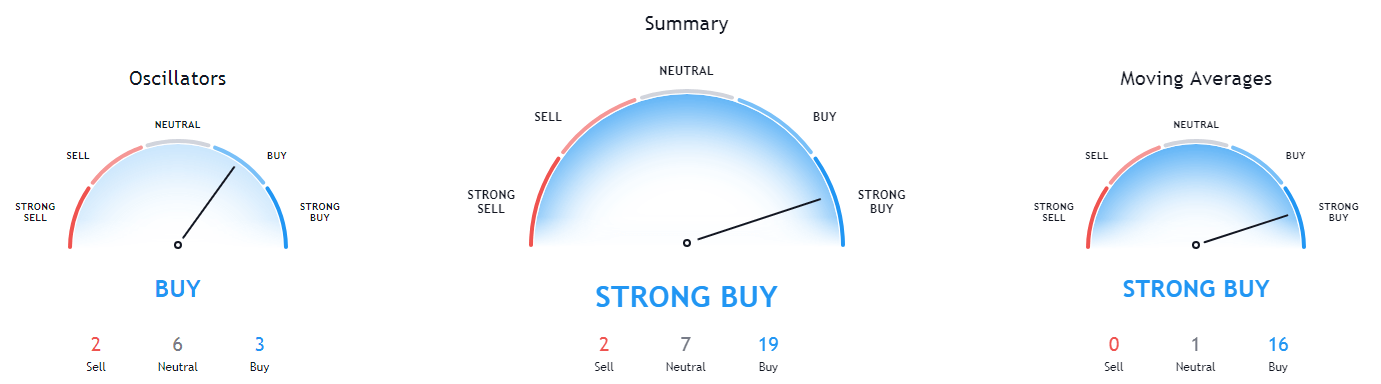
Bitcoin
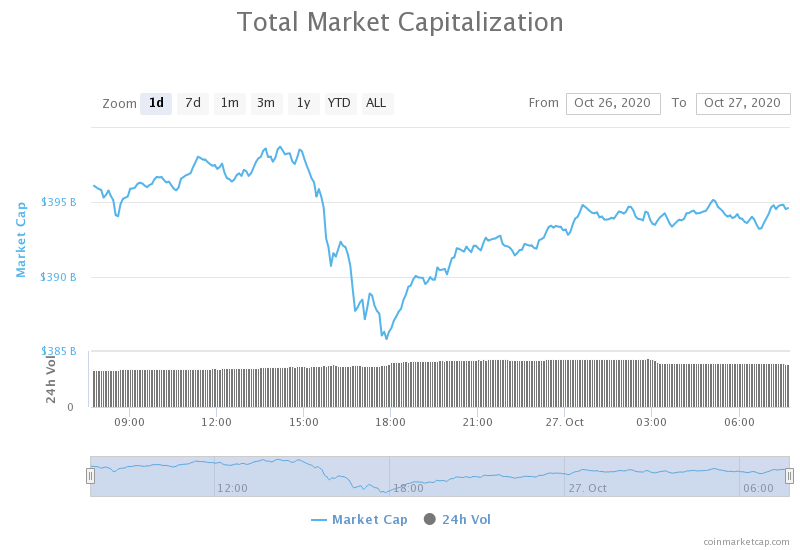
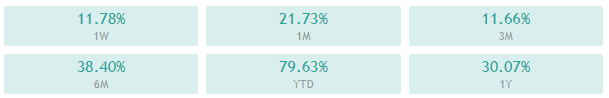
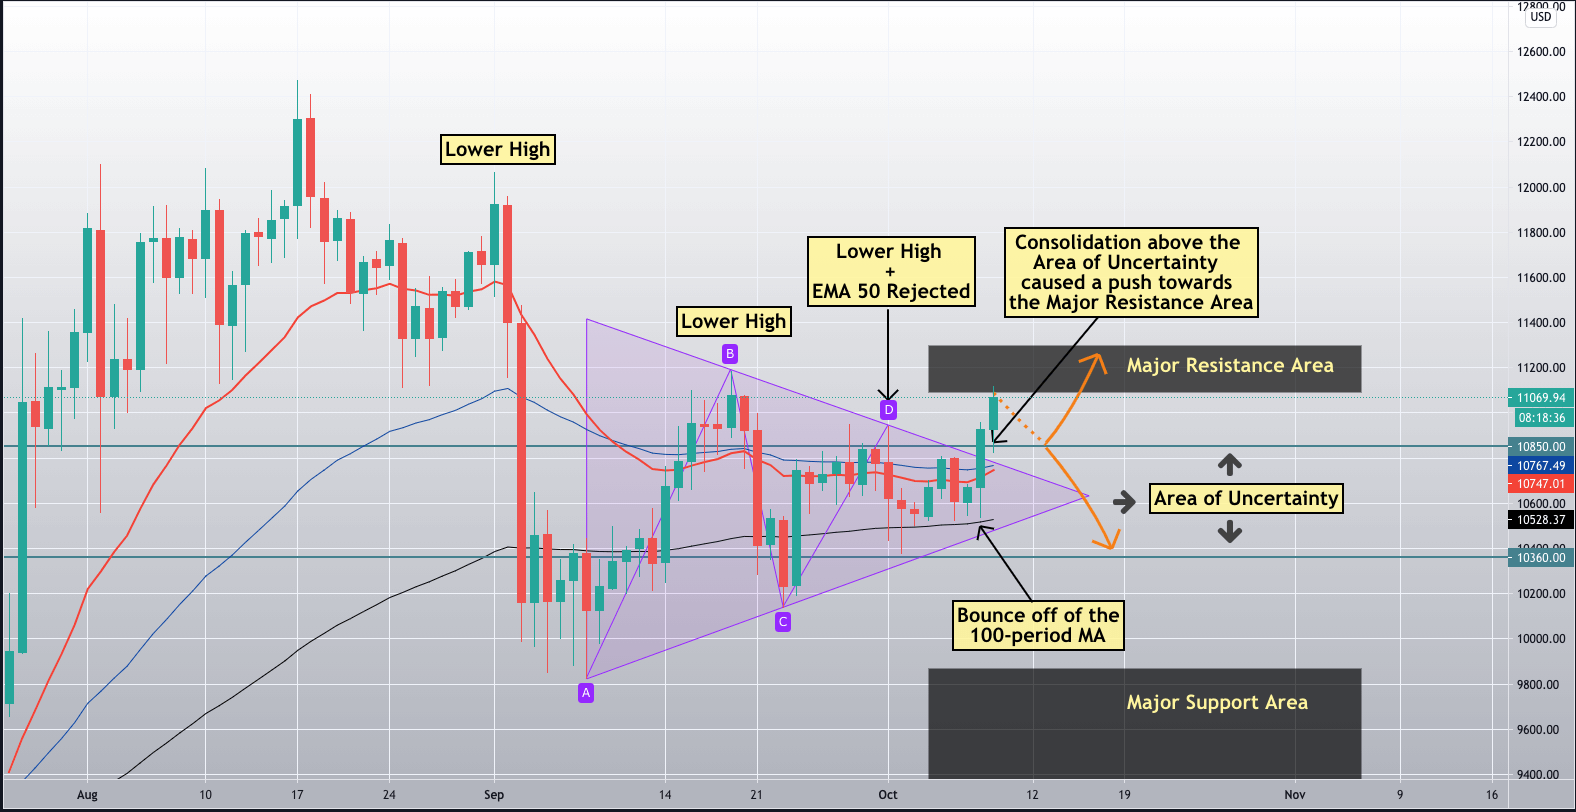
The largest cryptocurrency by market capitalization has spent the weekend experiencing very low volatility while fighting an incredibly important battle. Bitcoin was fighting to stay above the $16,000 mark after the move to the upside has died down at $16,500 on Nov 13, thus triggering a pullback.
An interesting outlook on Bitcoin is that the now won fight for $16,000 has created a higher low, and Bitcoin might push even higher in the following days. Traders should pay attention to volume increases around the $16,400-$16,500 mark.
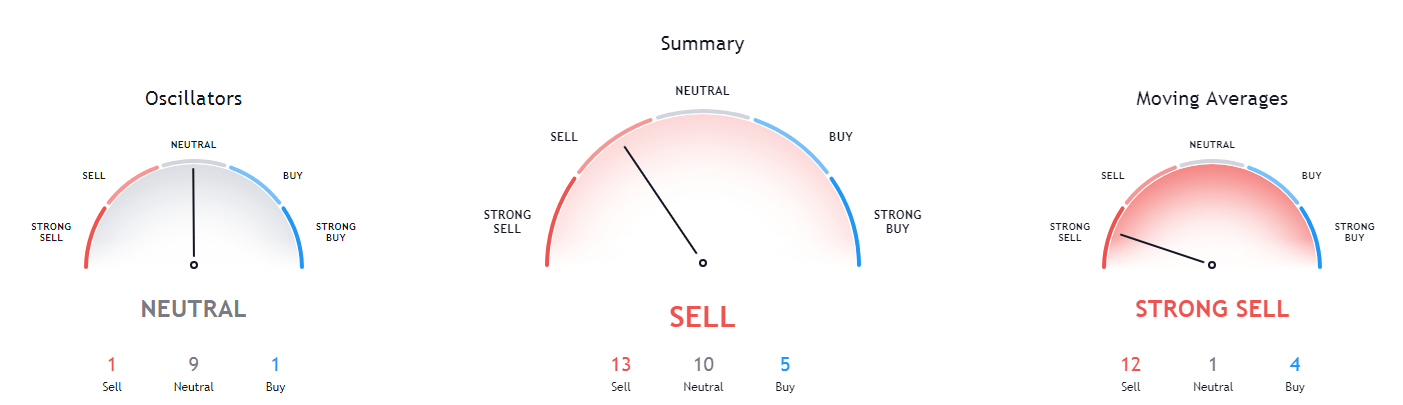
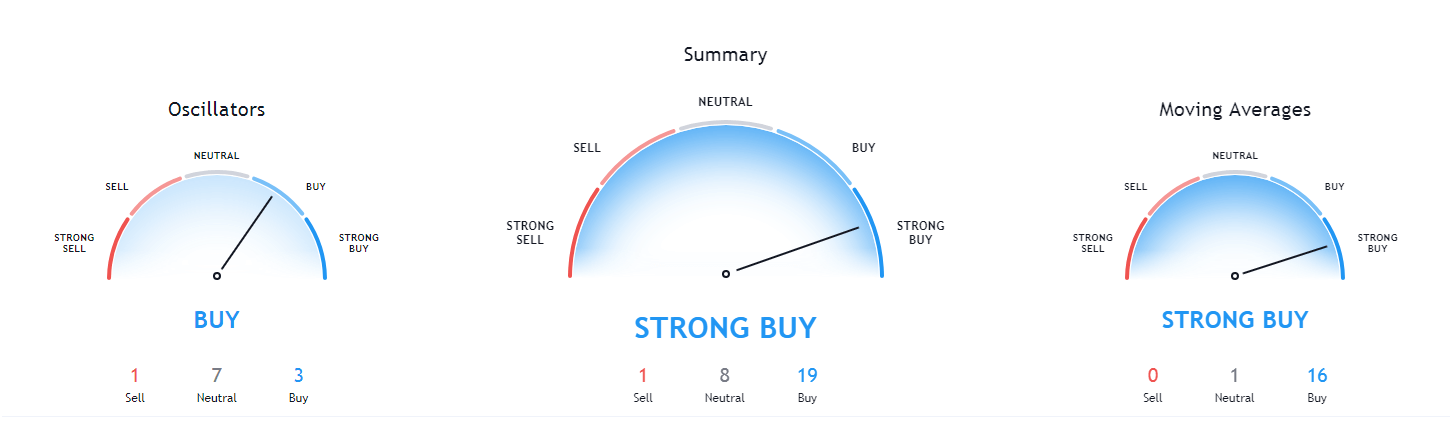
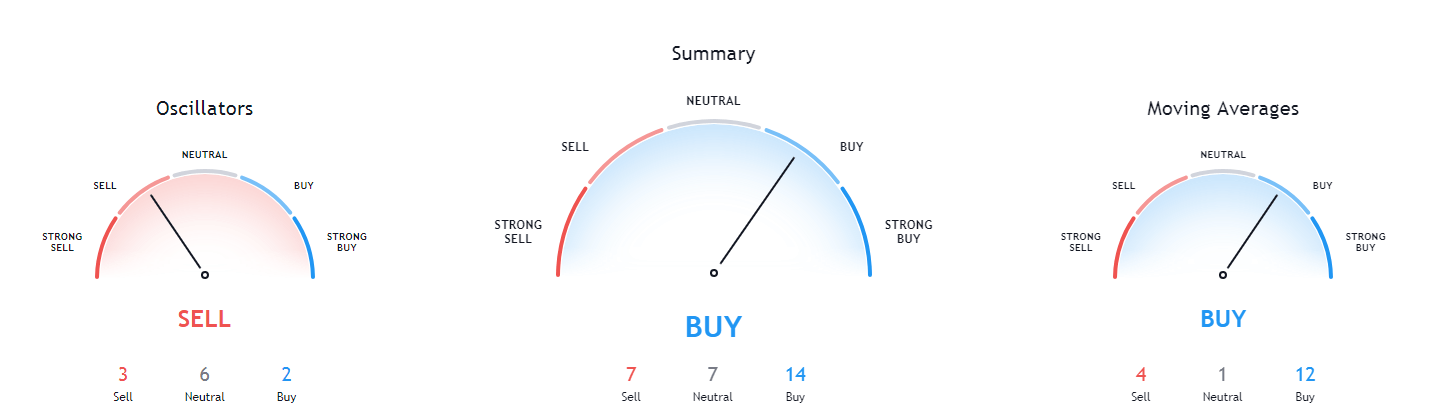
BTC/USD 4-hour Chart
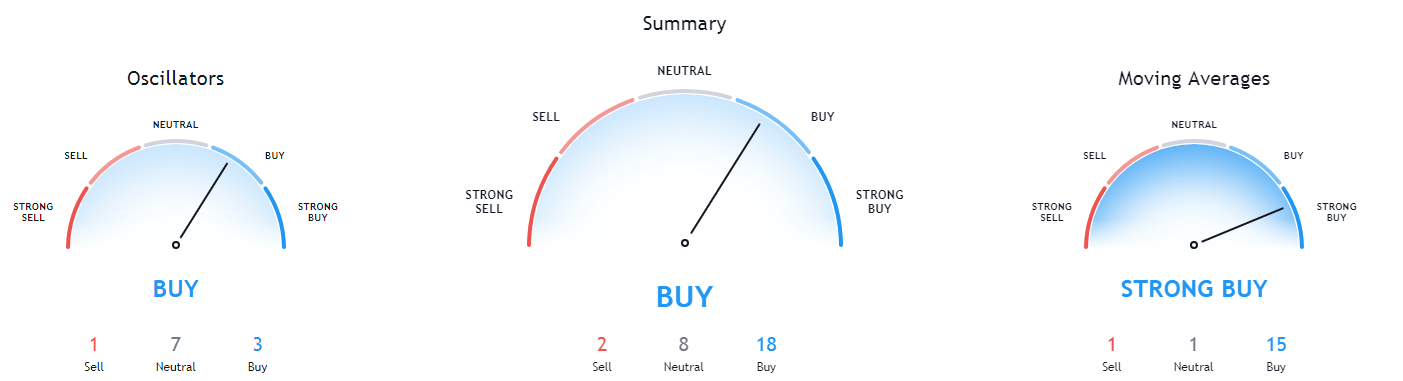
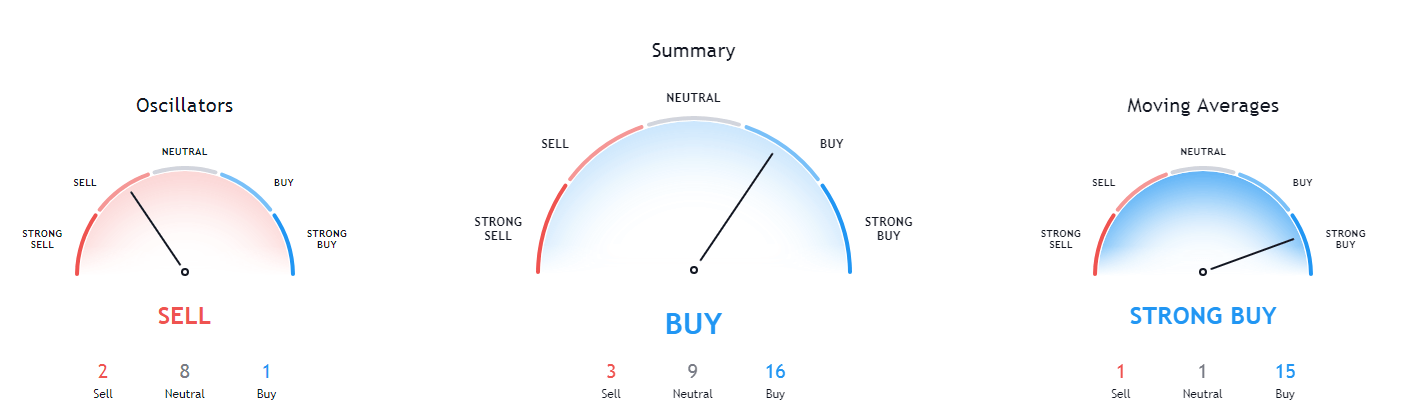
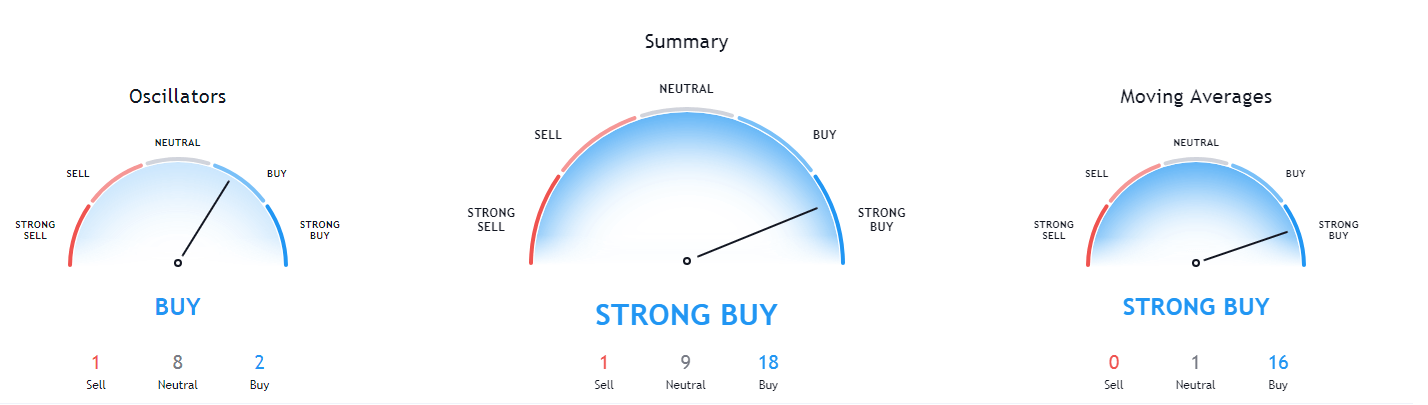
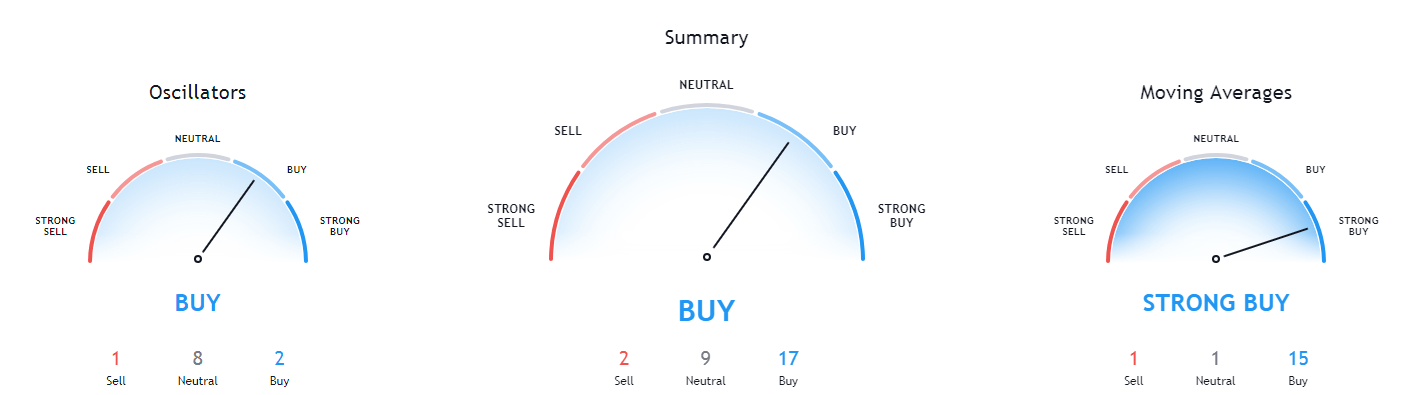
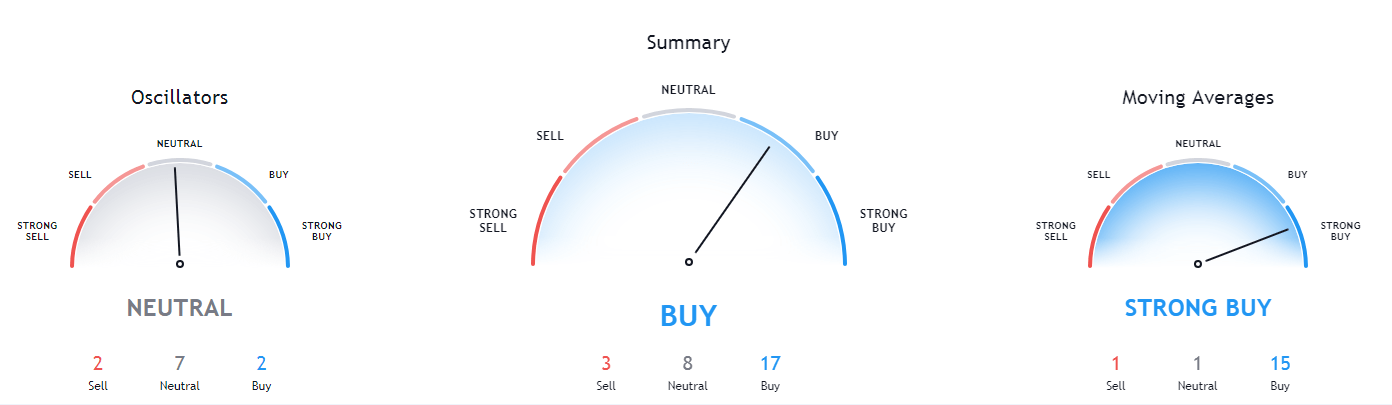
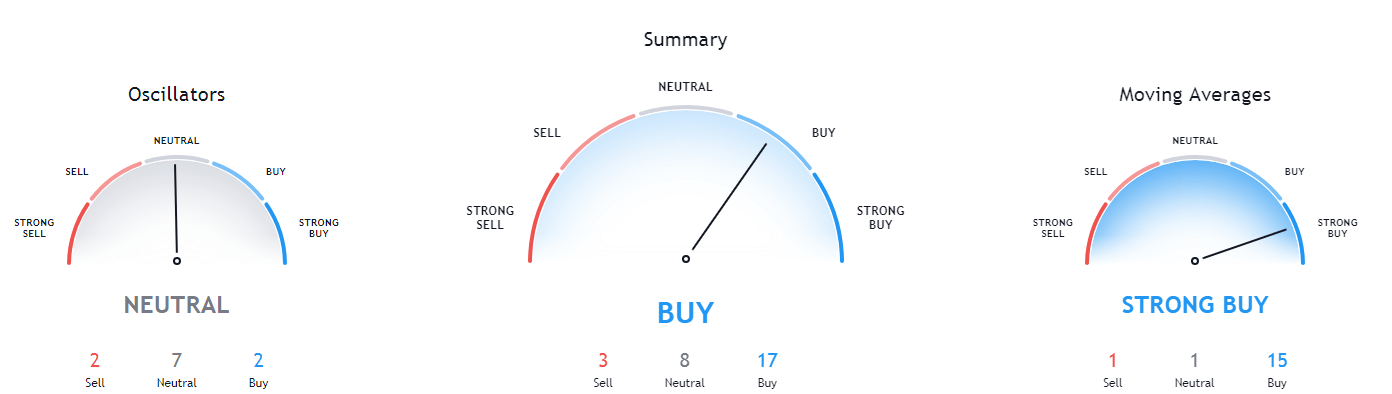
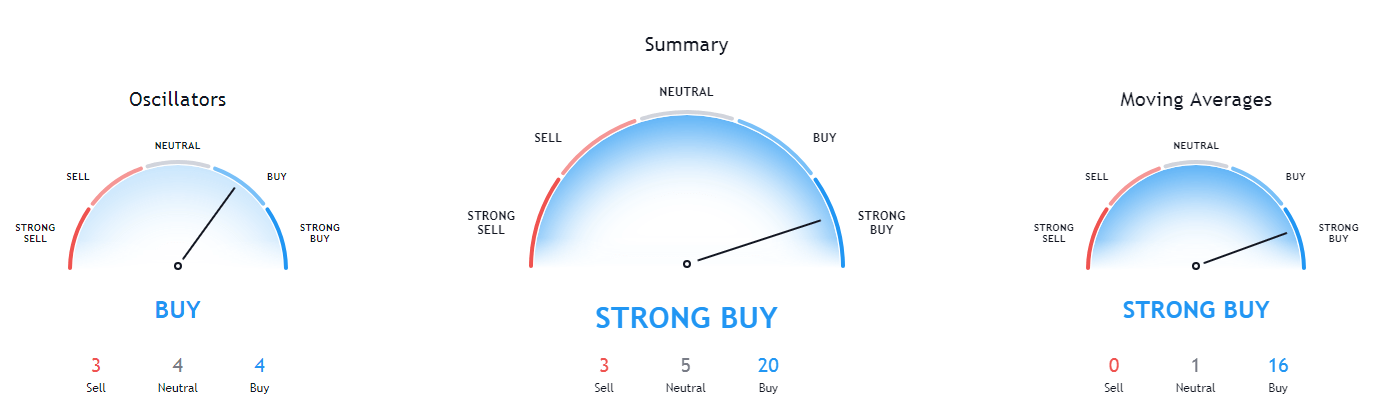
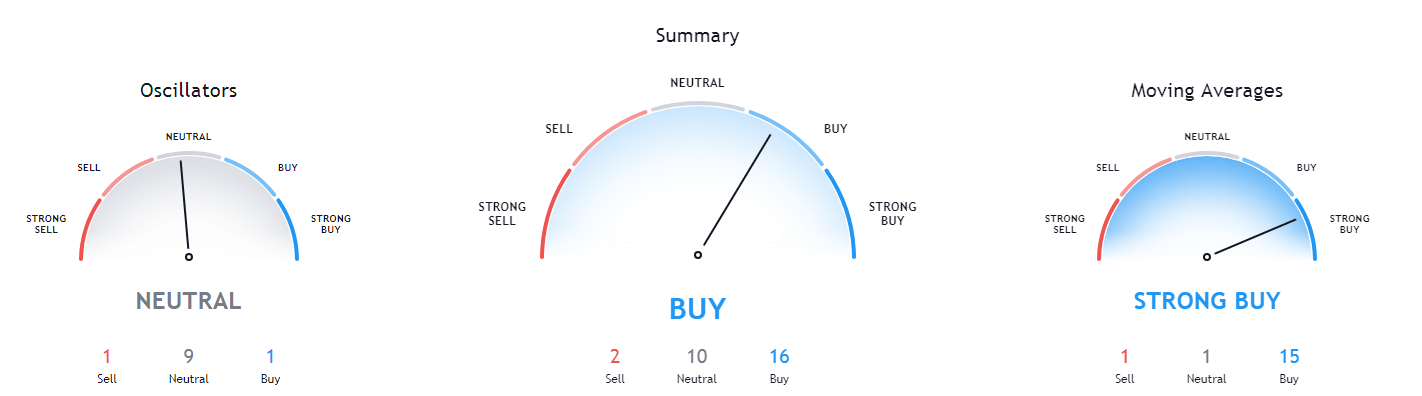
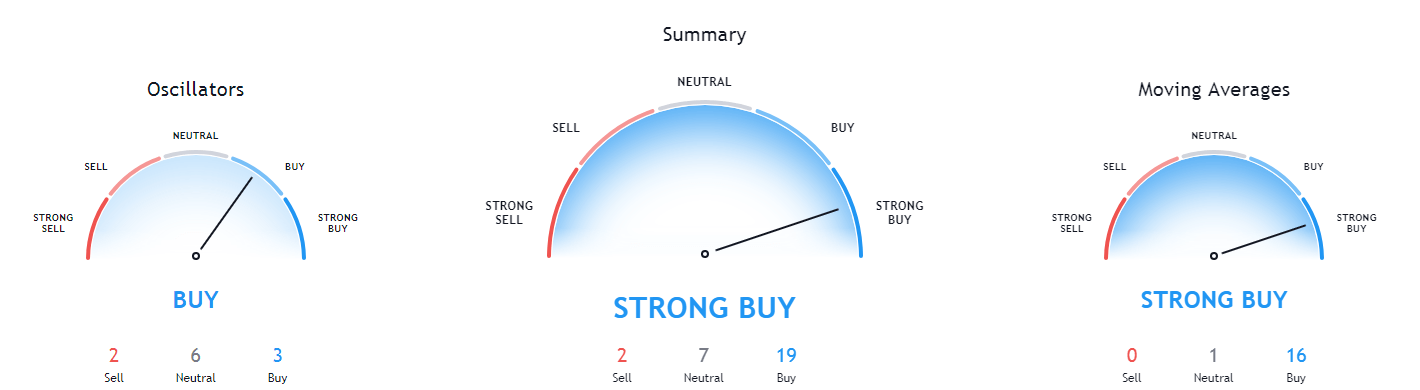
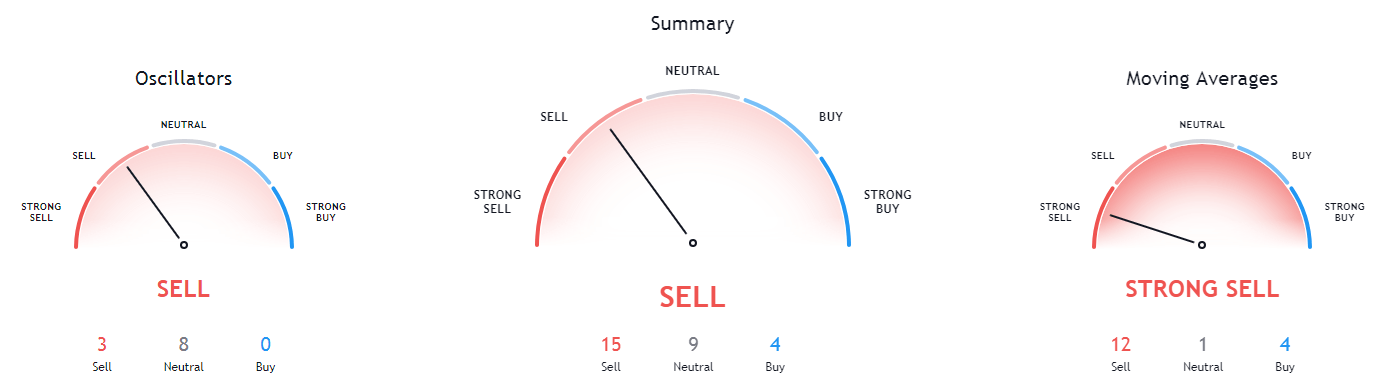
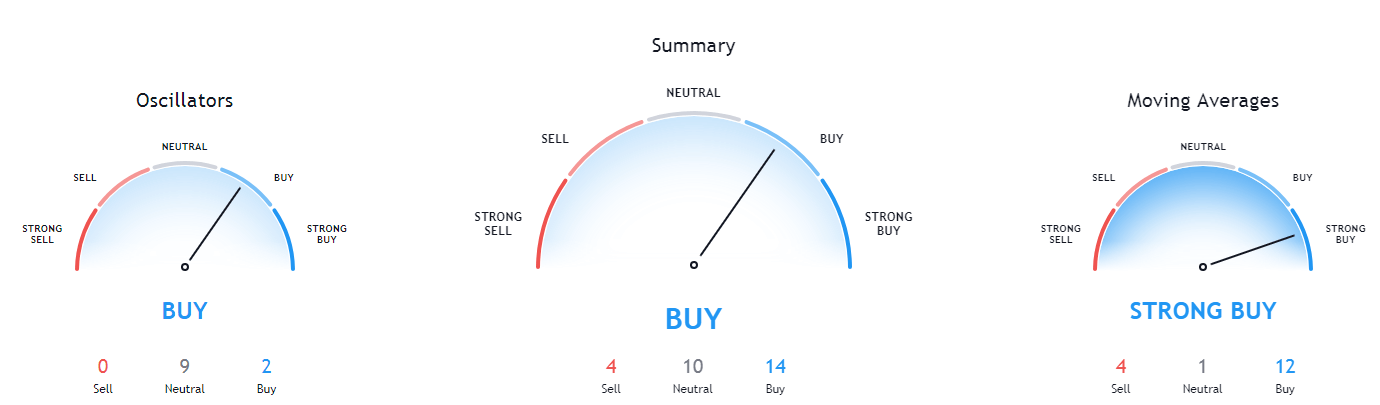
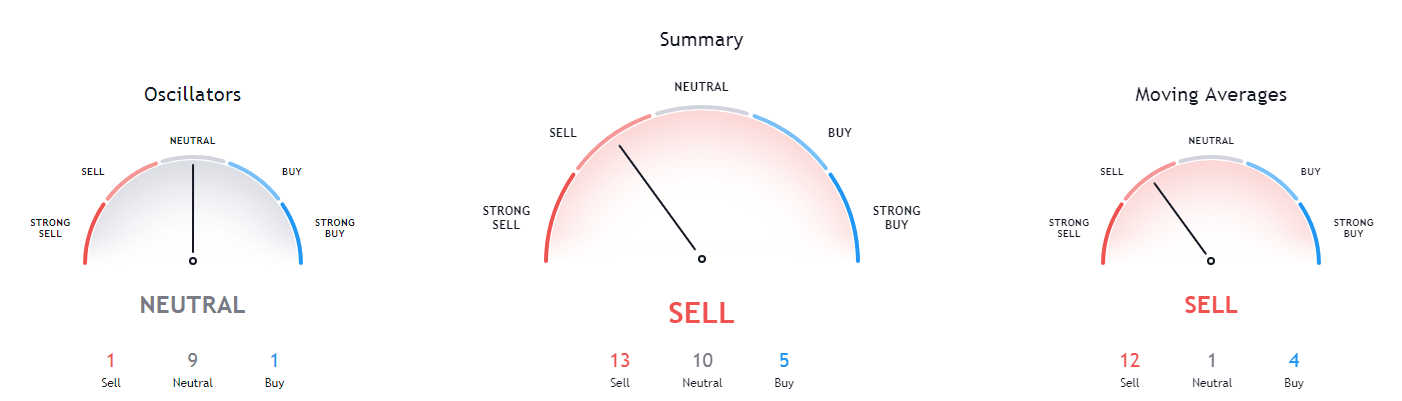
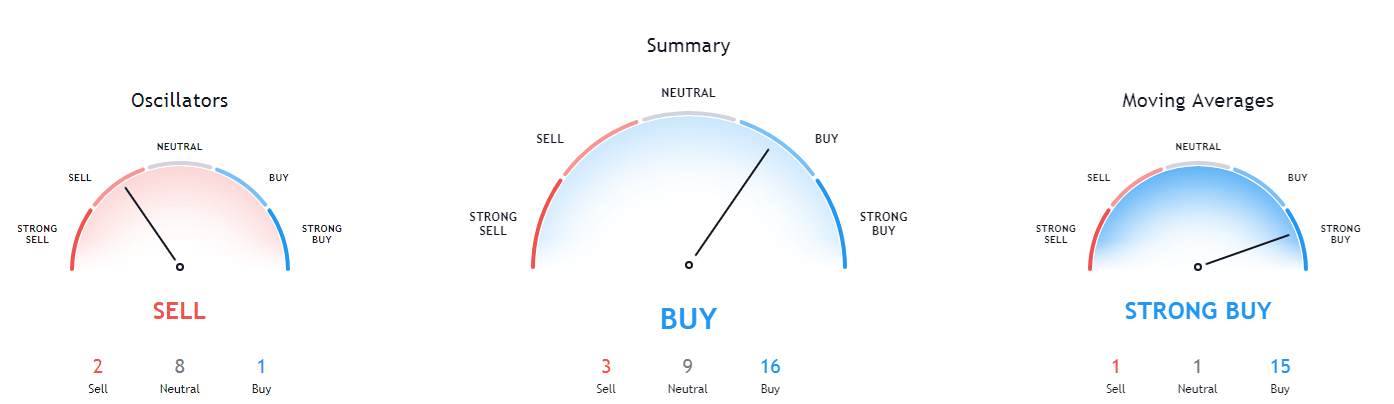
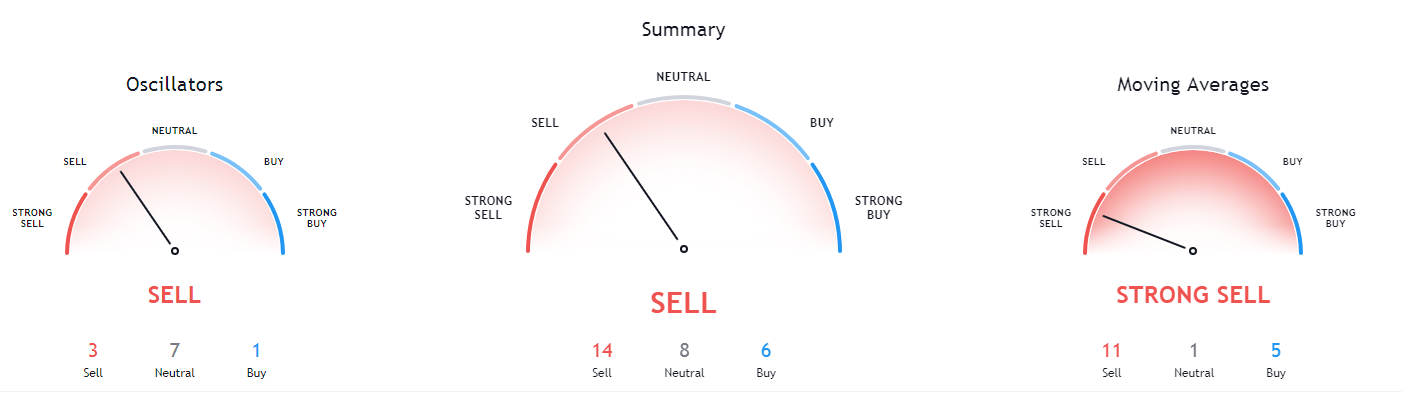
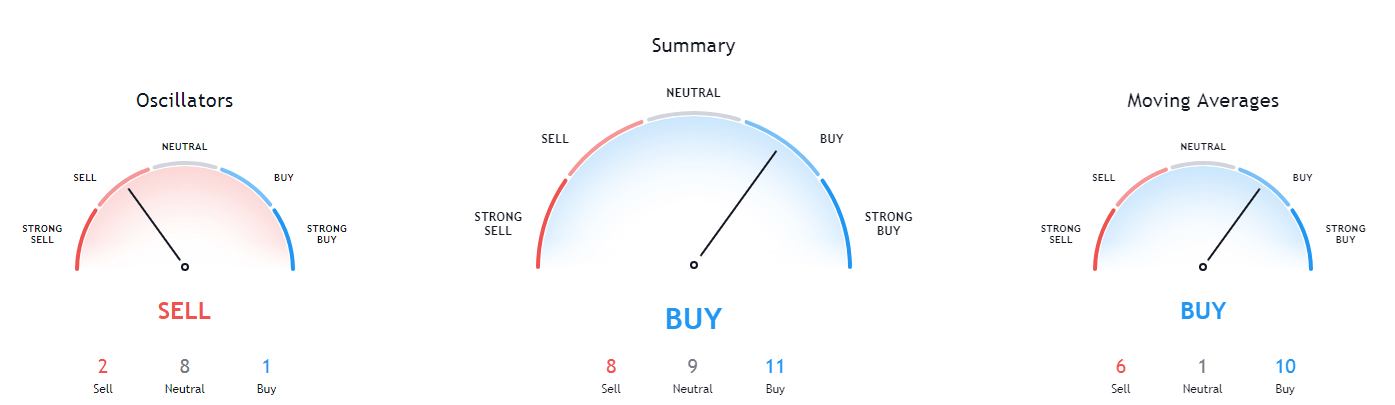
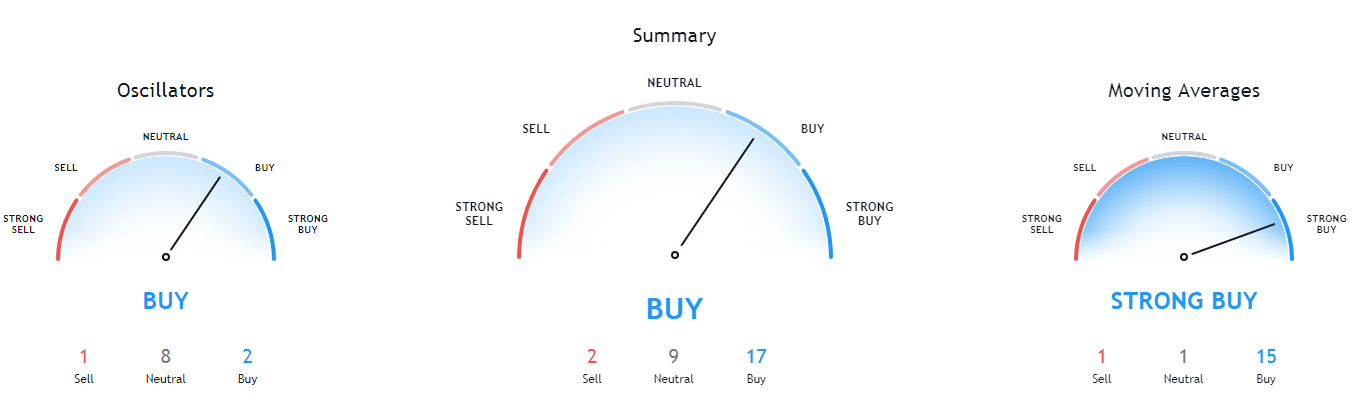
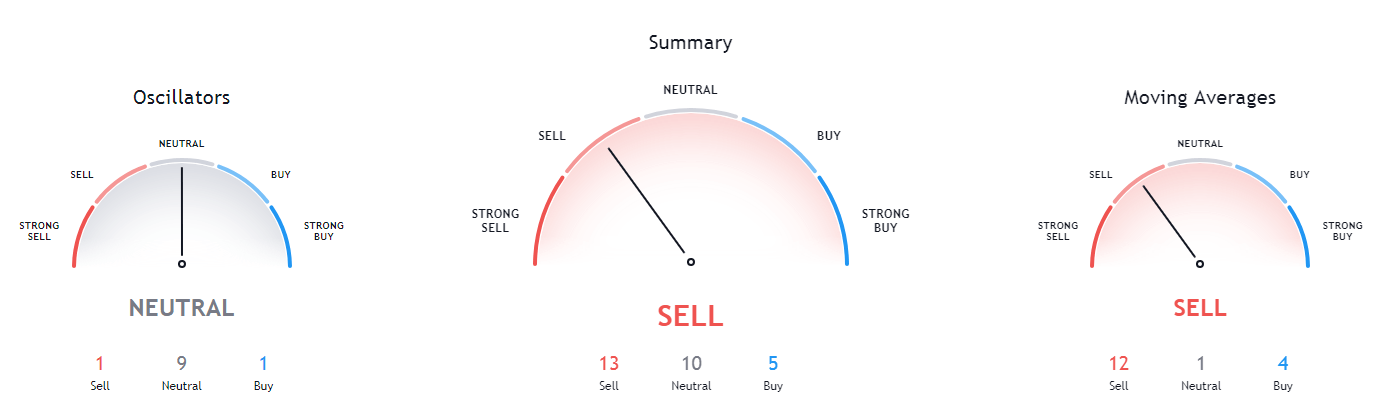
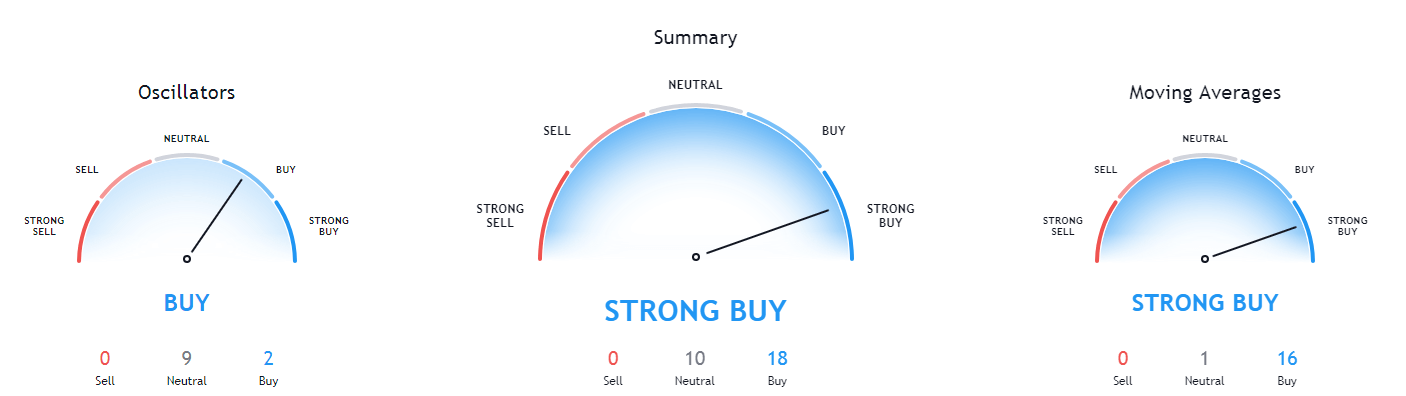
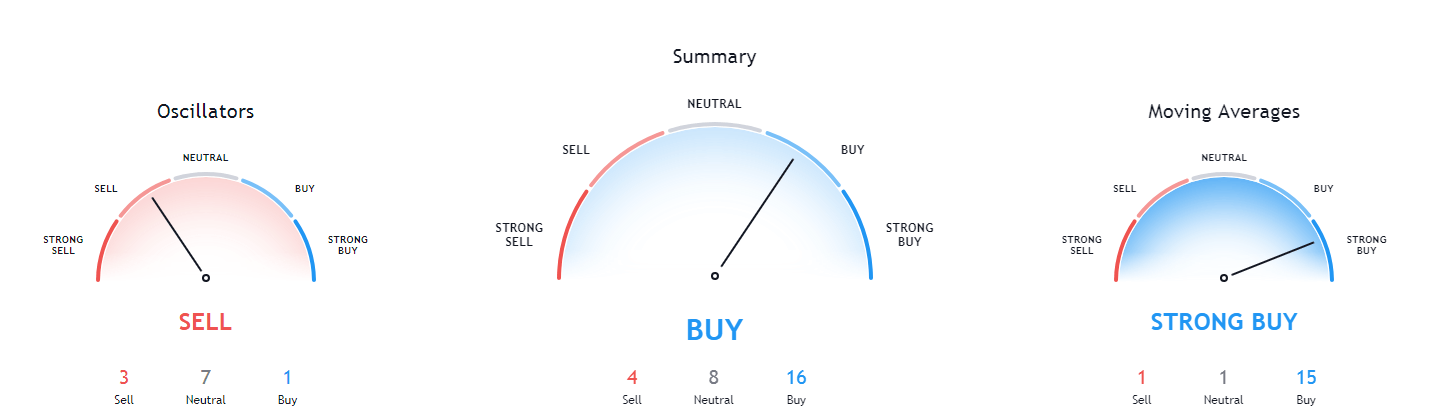
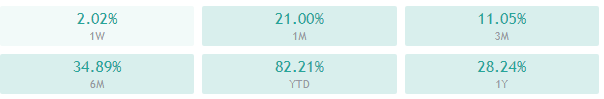
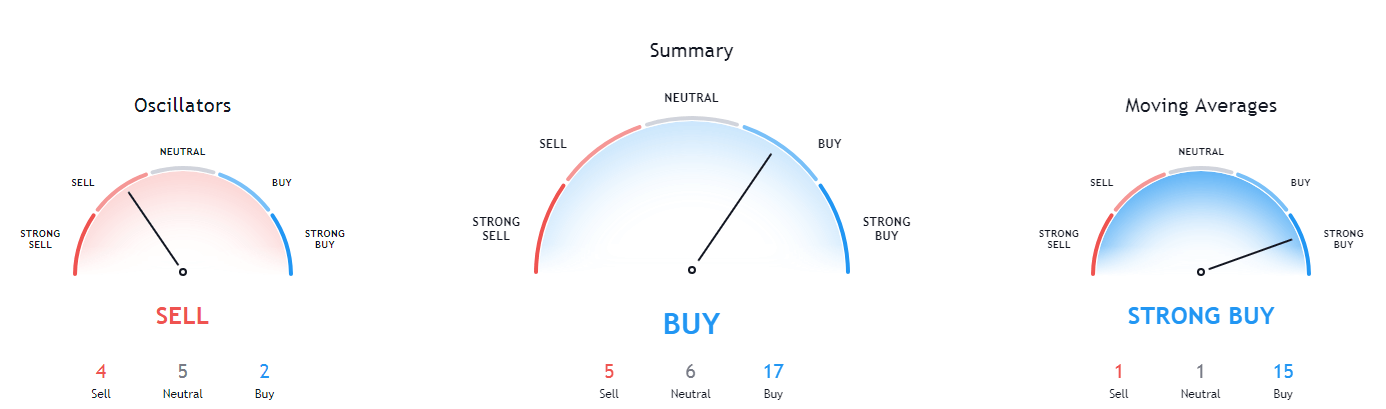
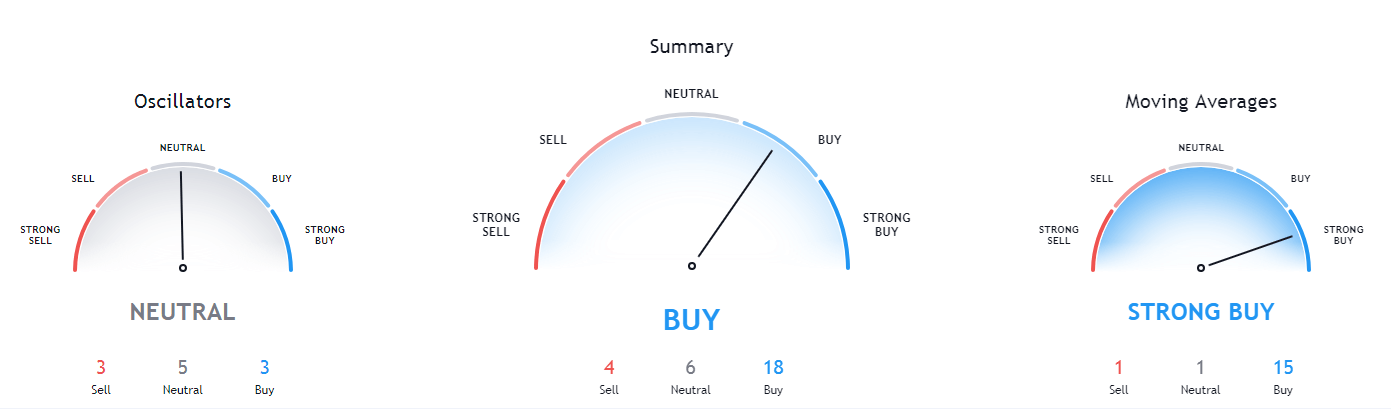
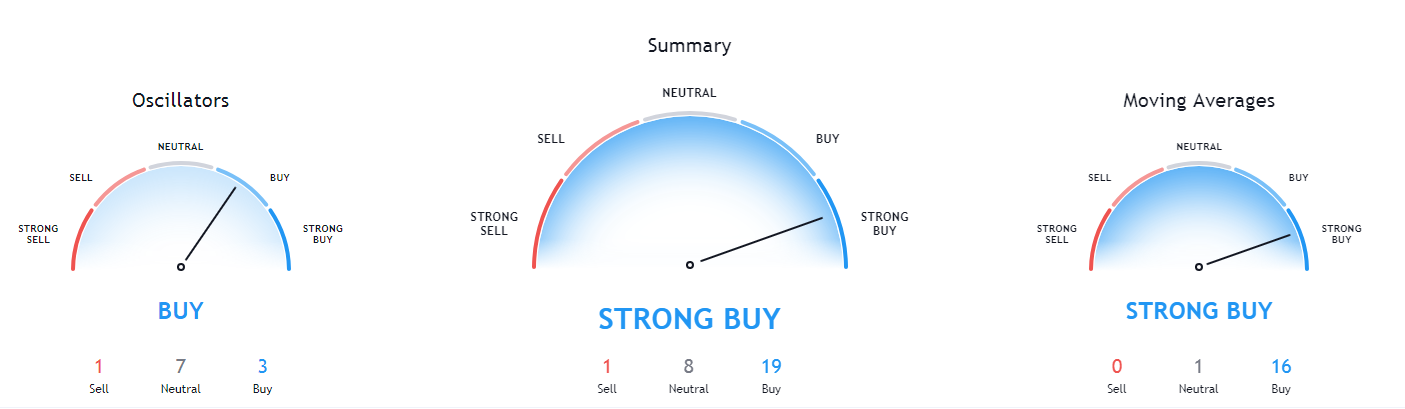
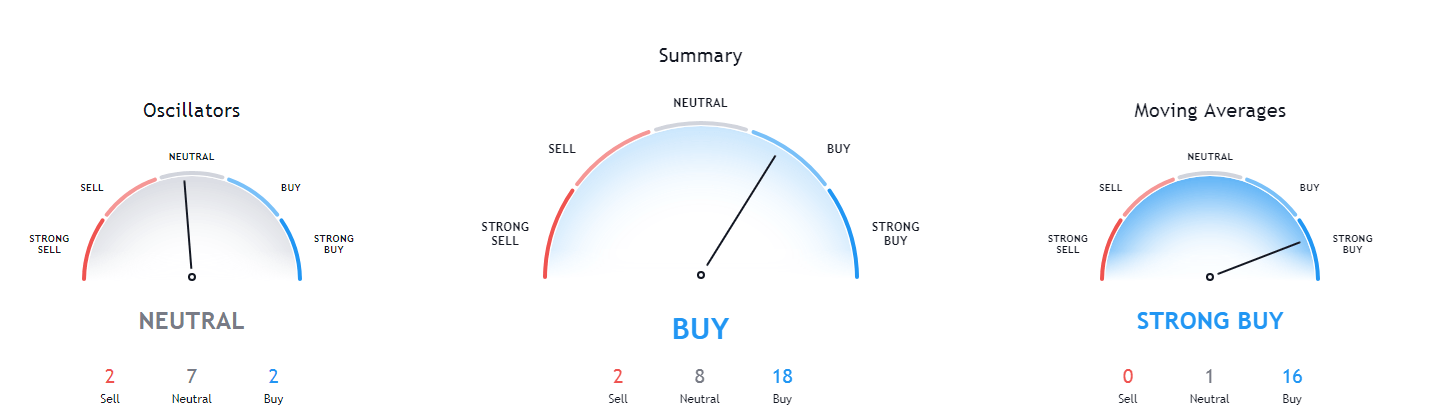
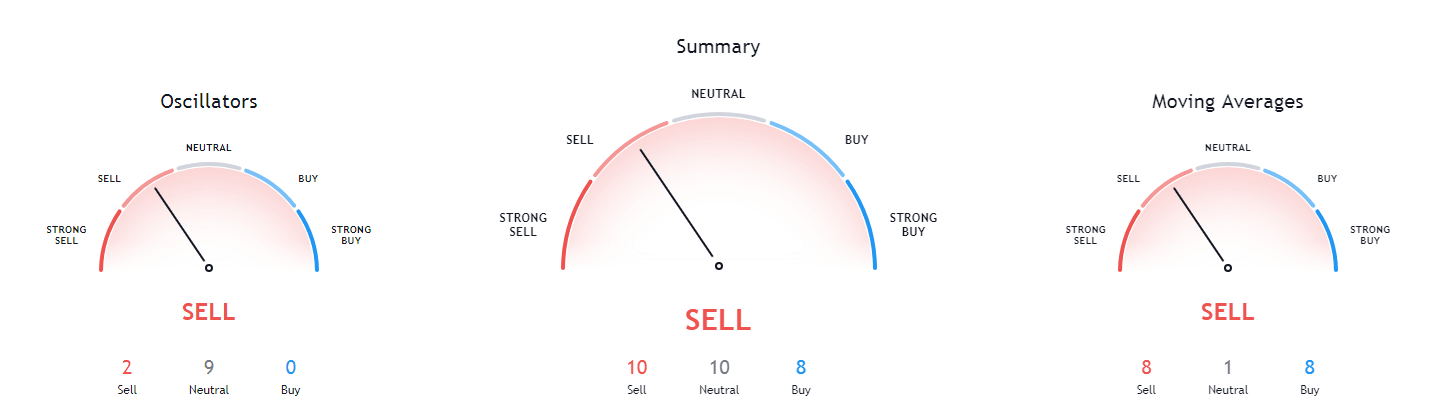
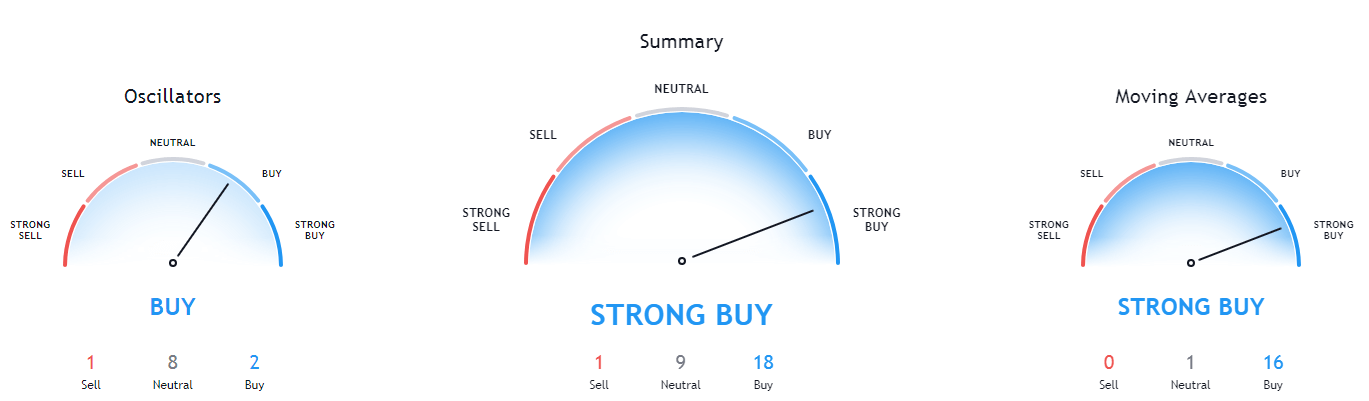
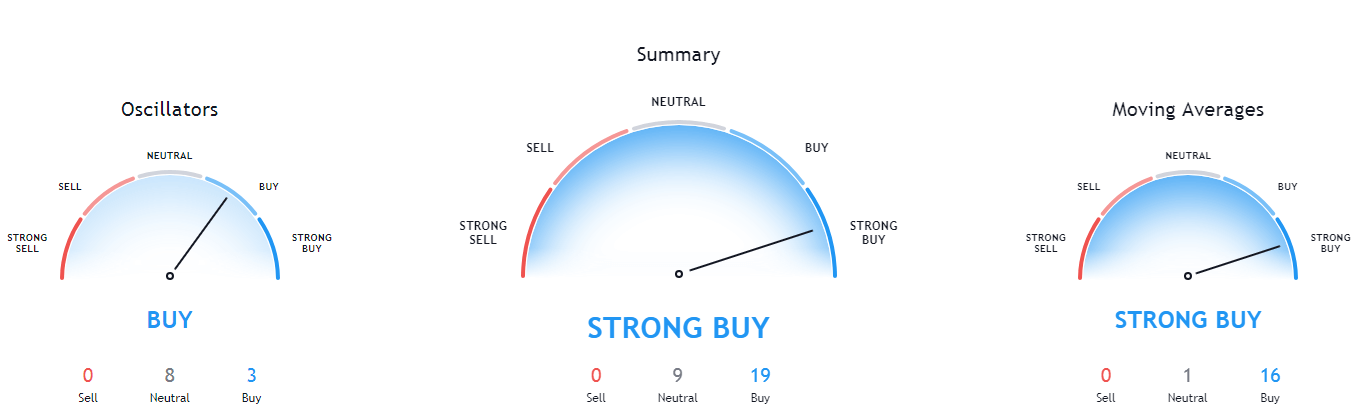
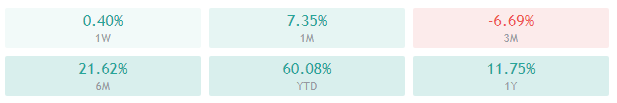
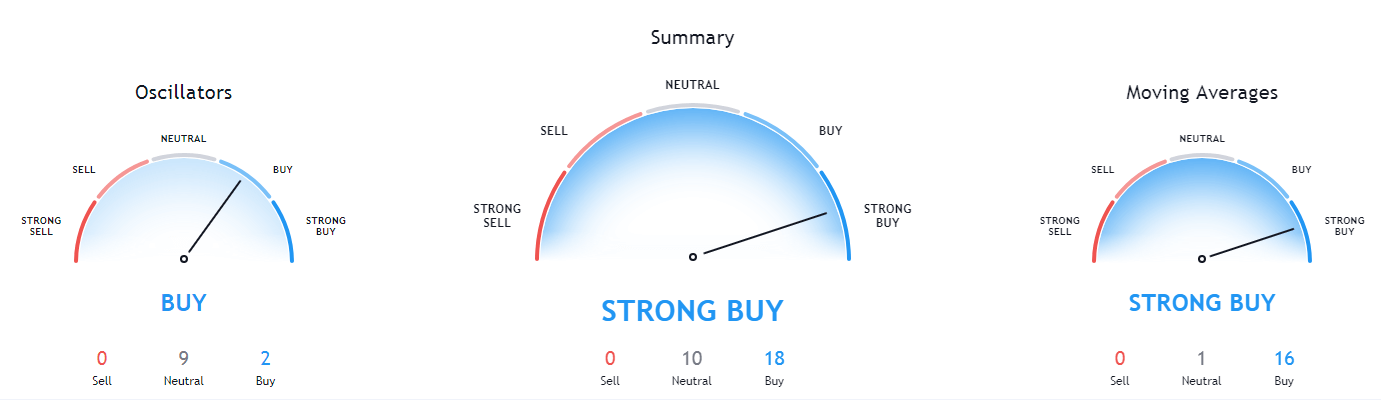
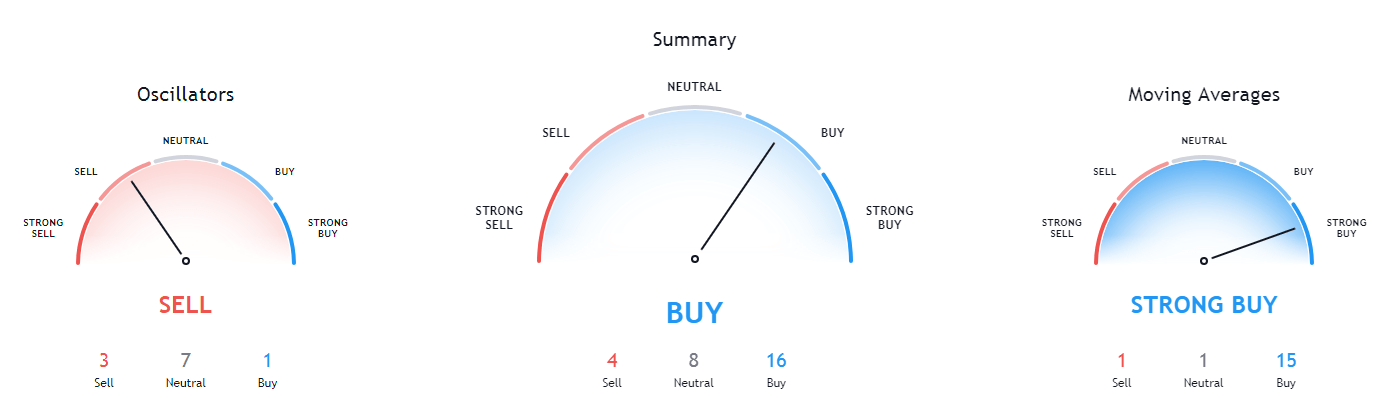
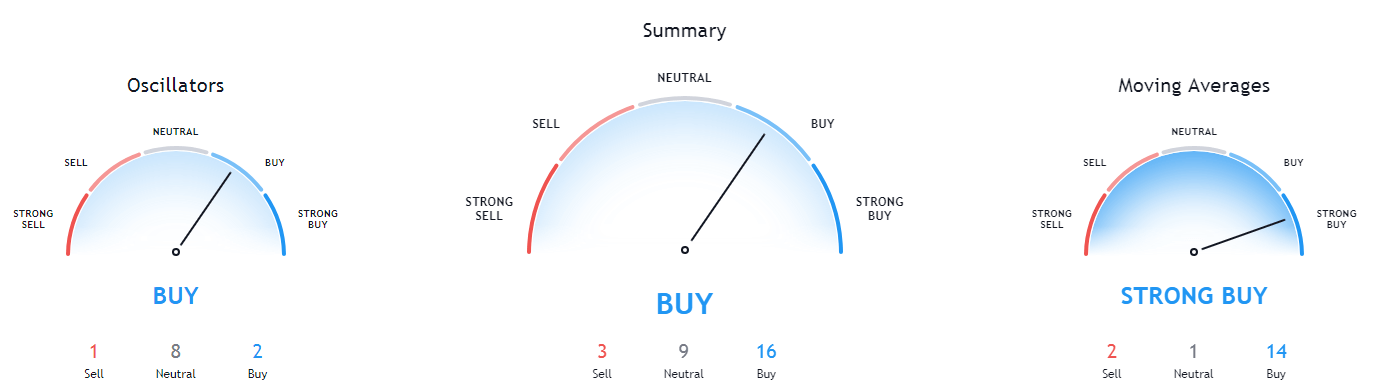
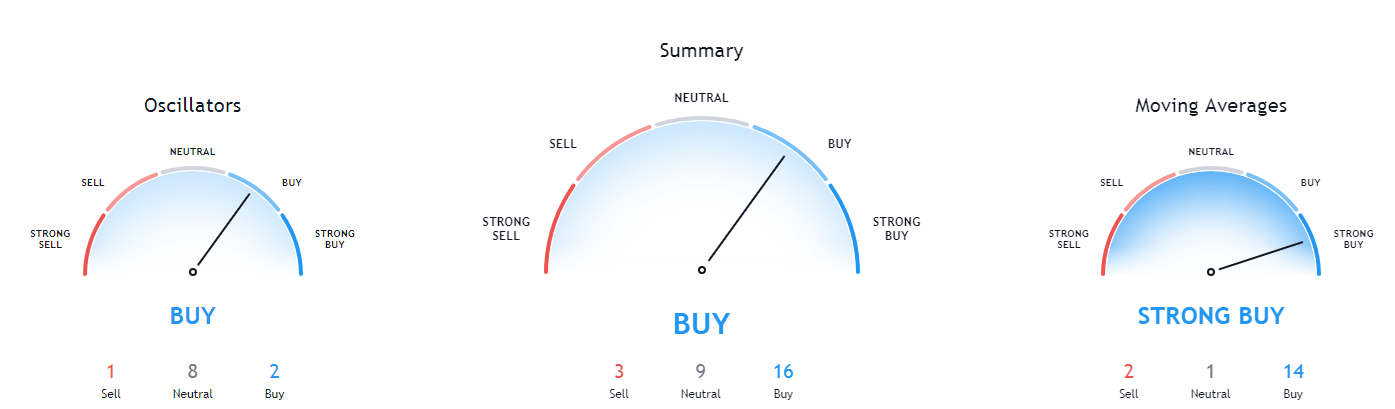
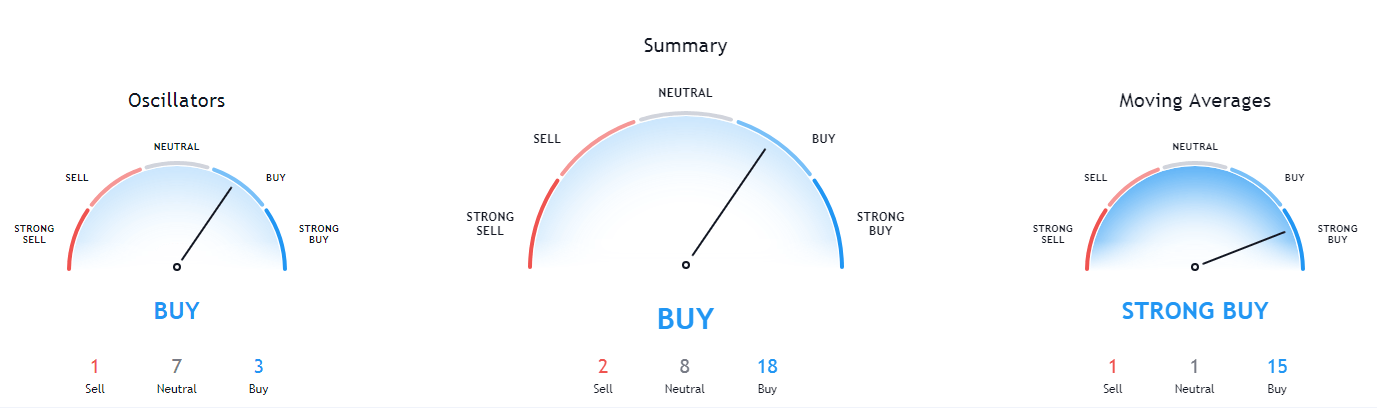
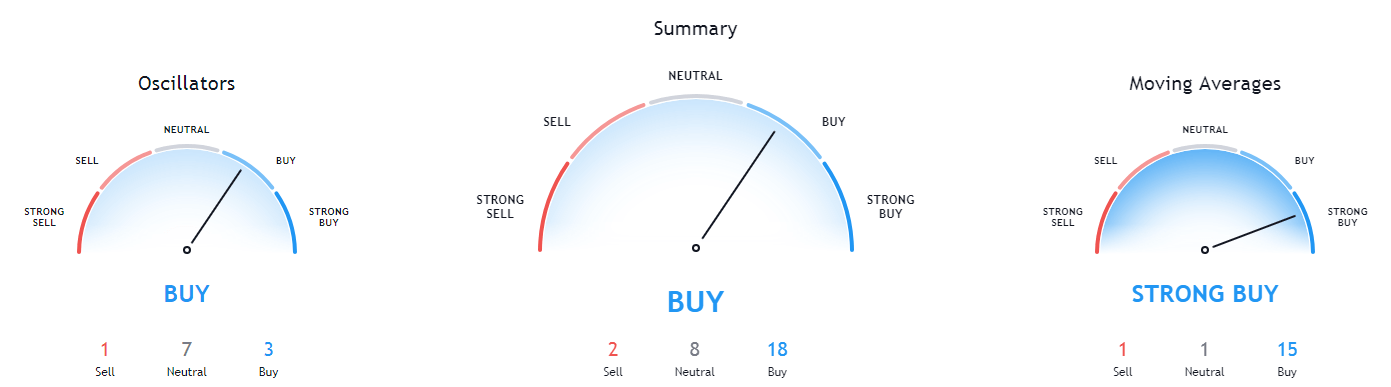
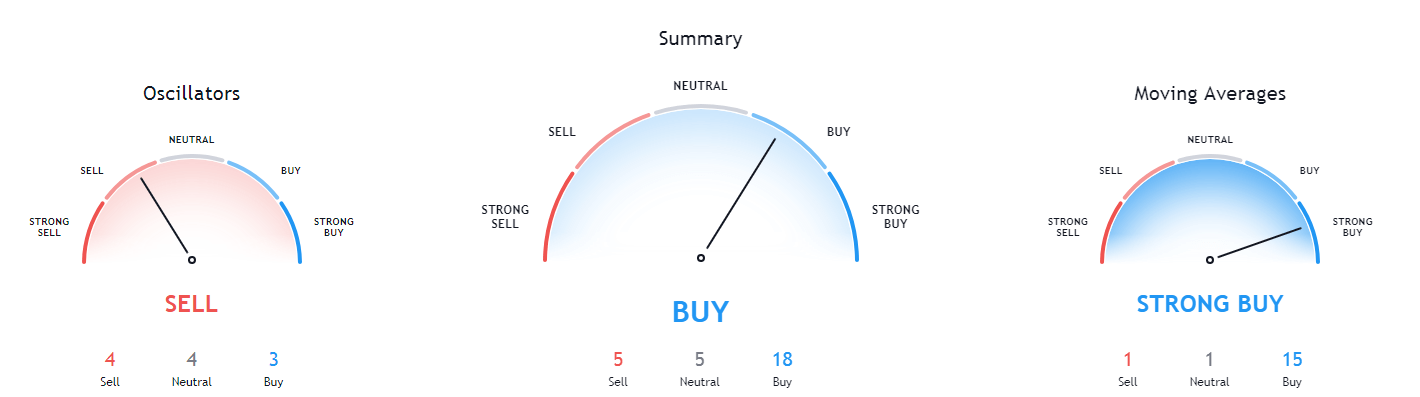
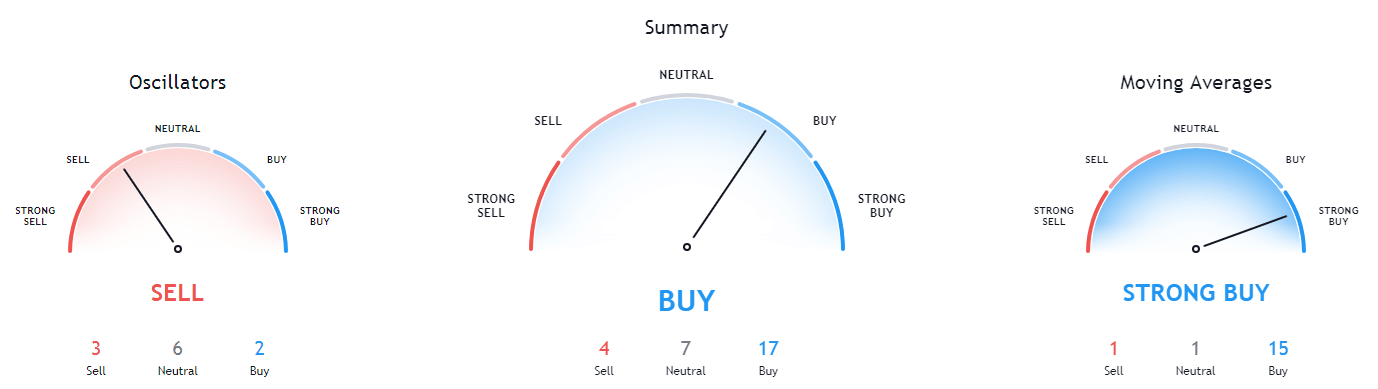
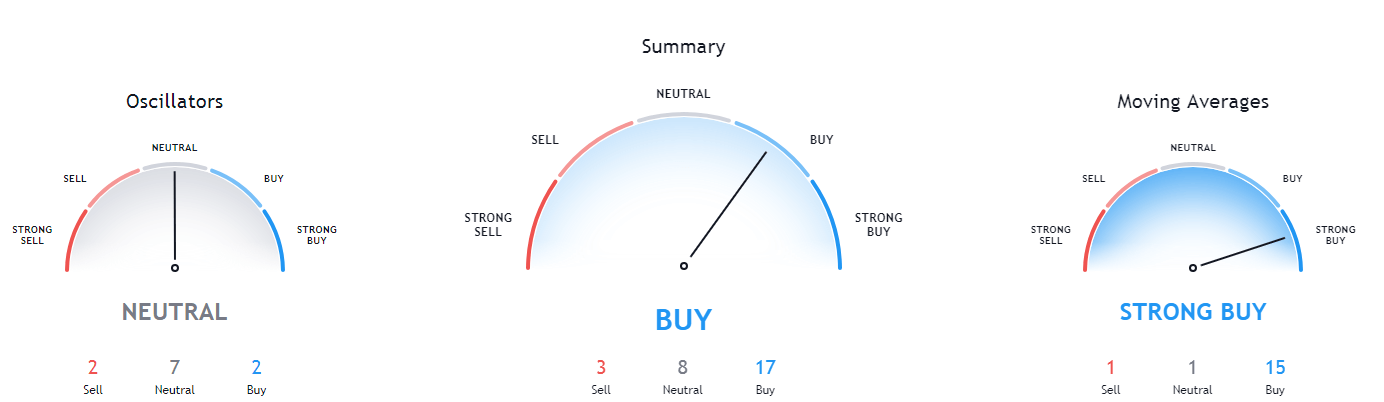
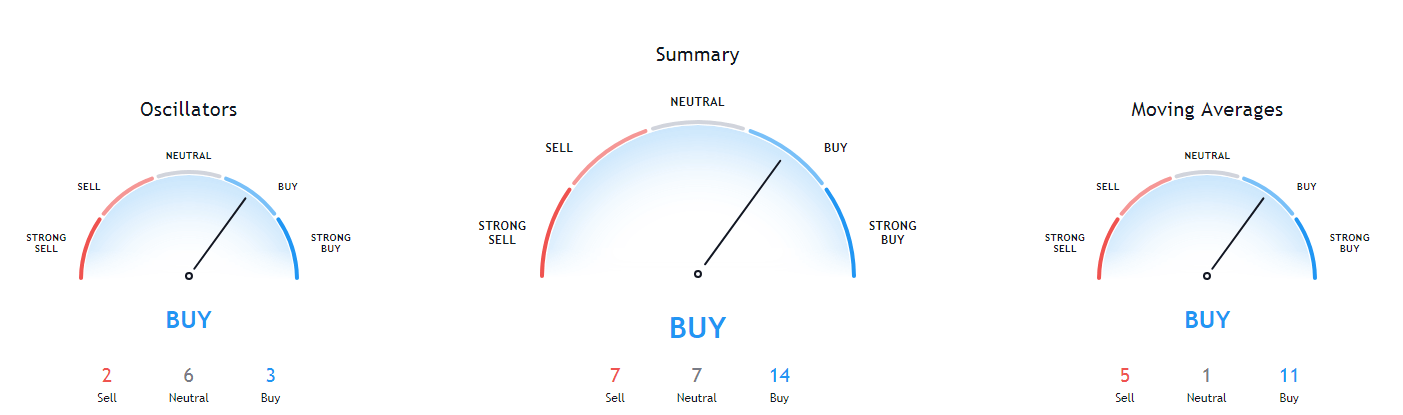
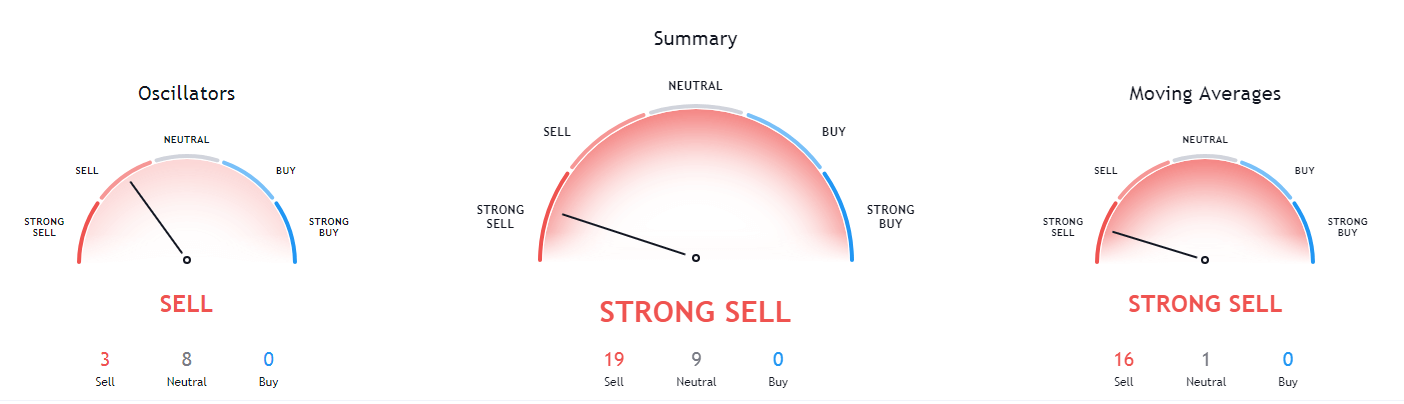
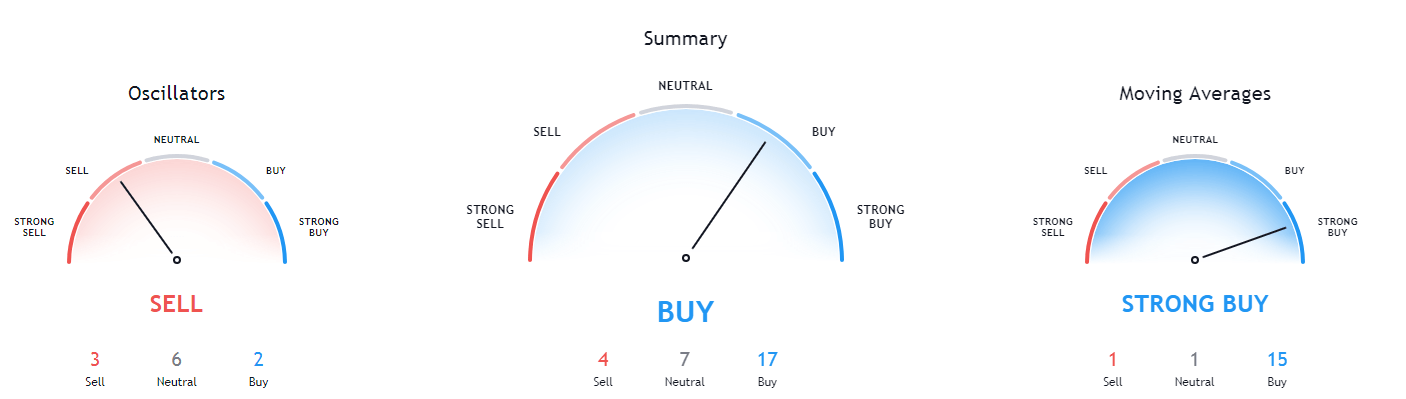
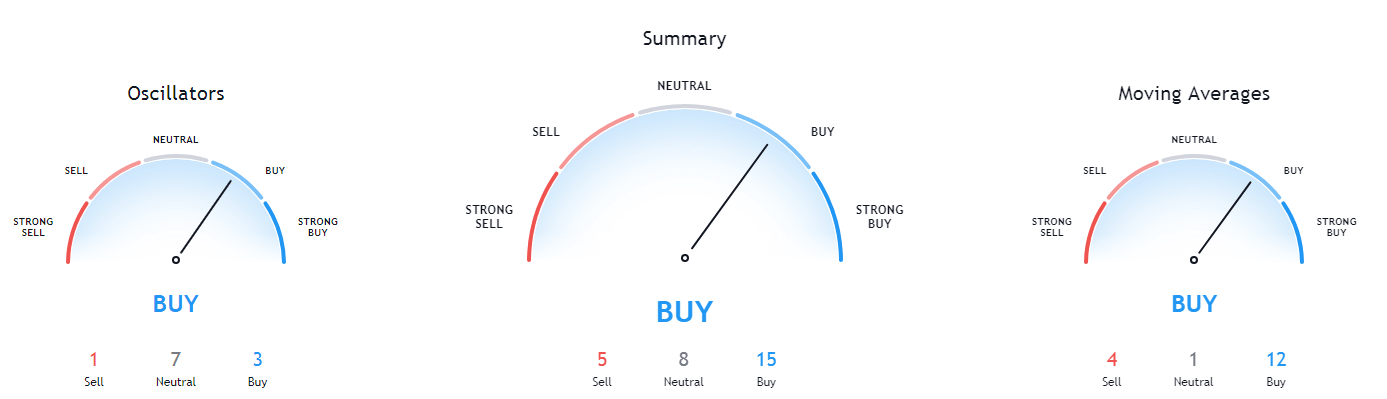
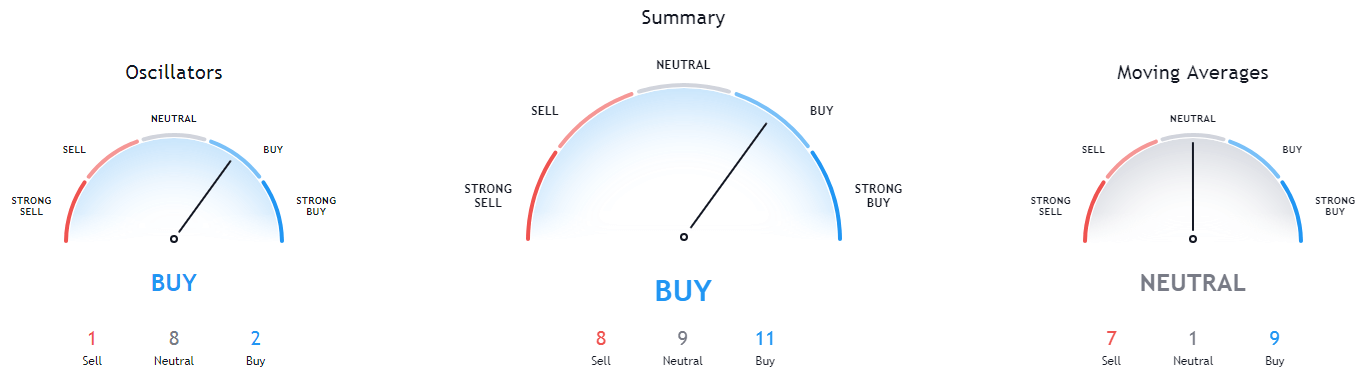
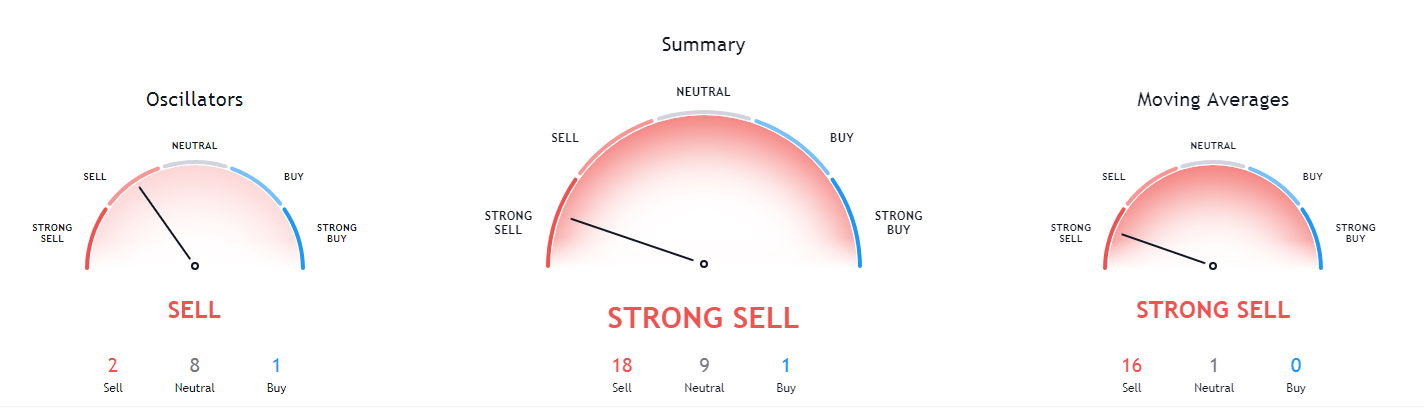
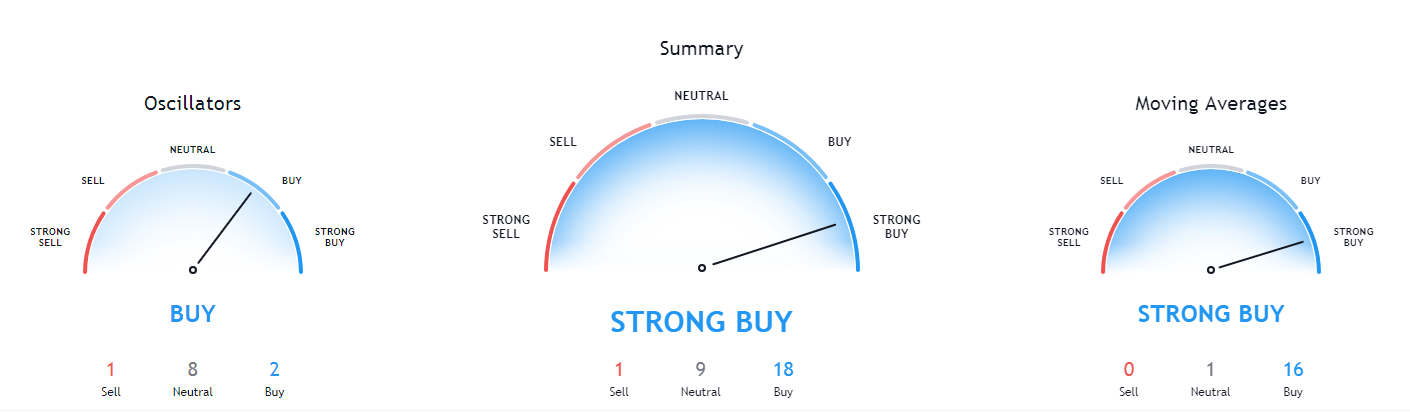
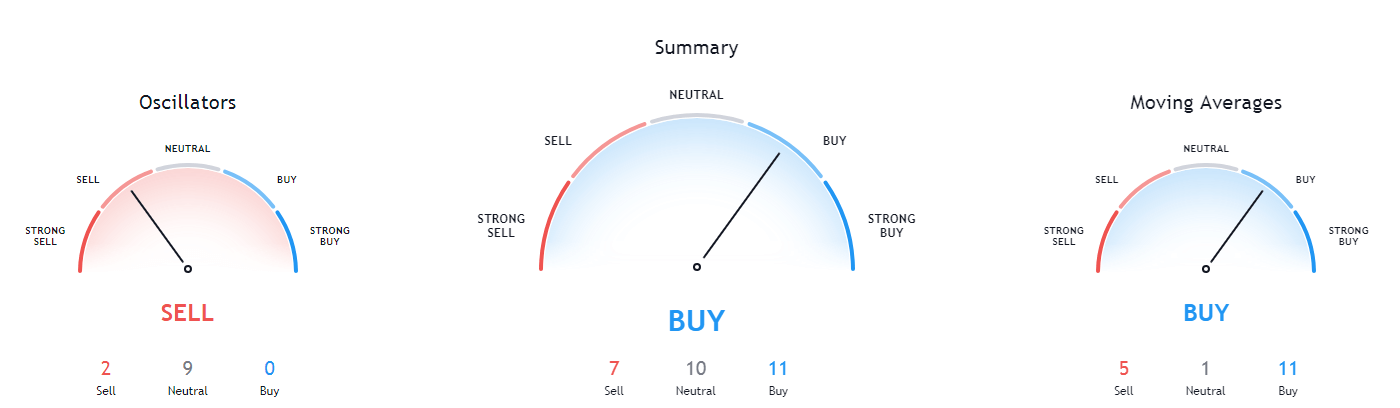
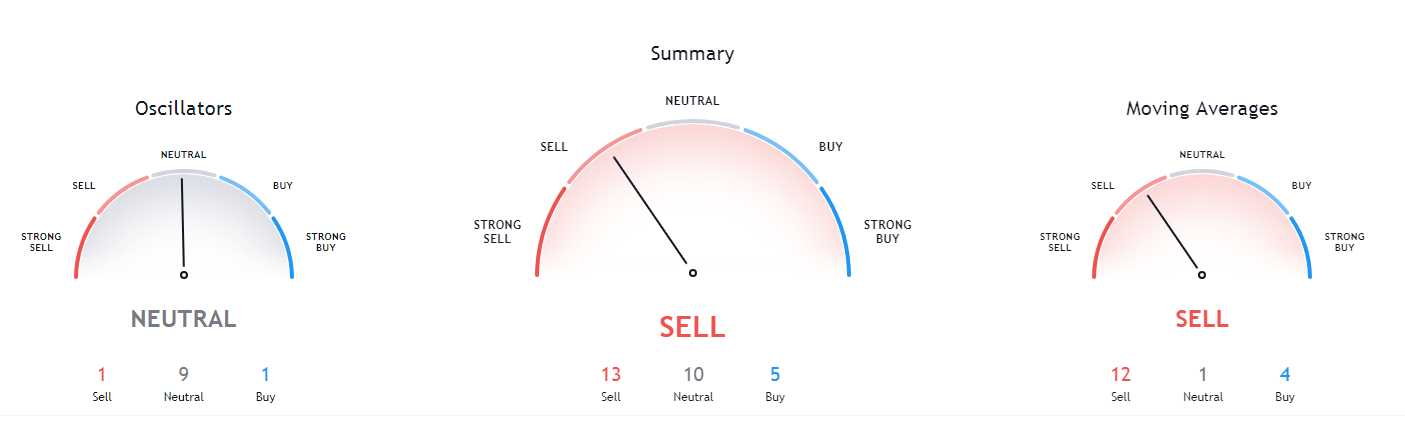
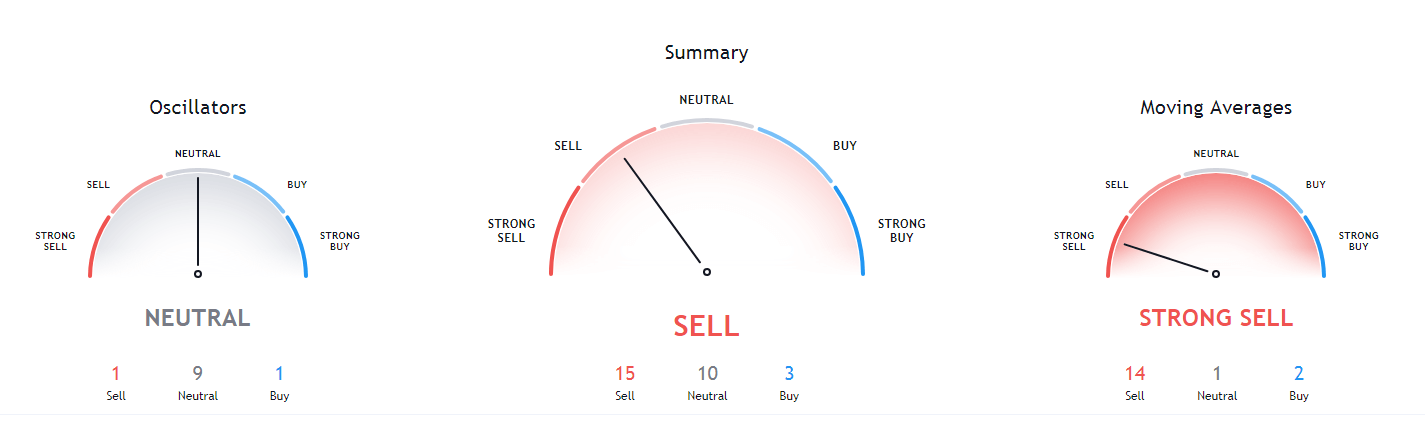
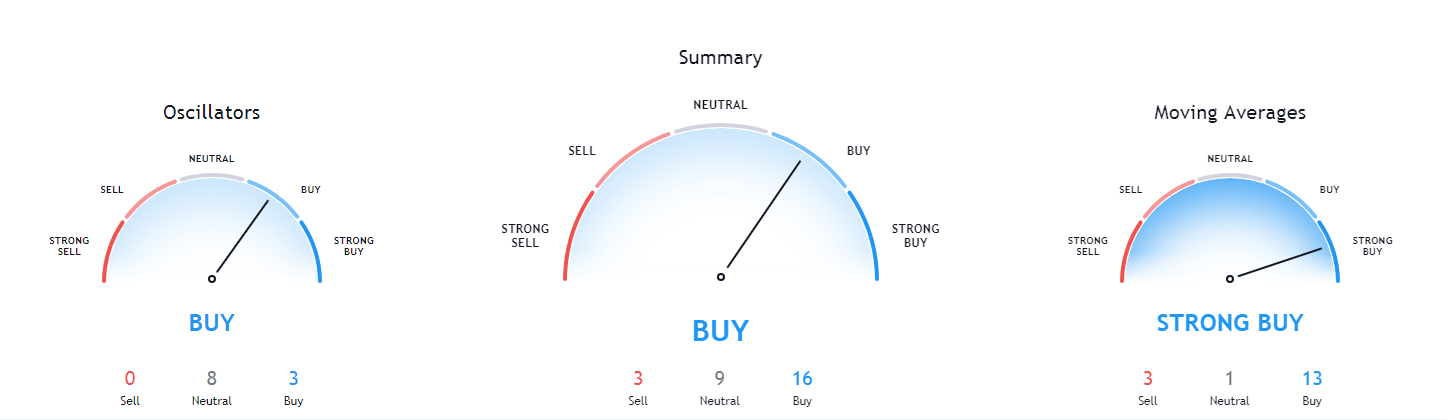
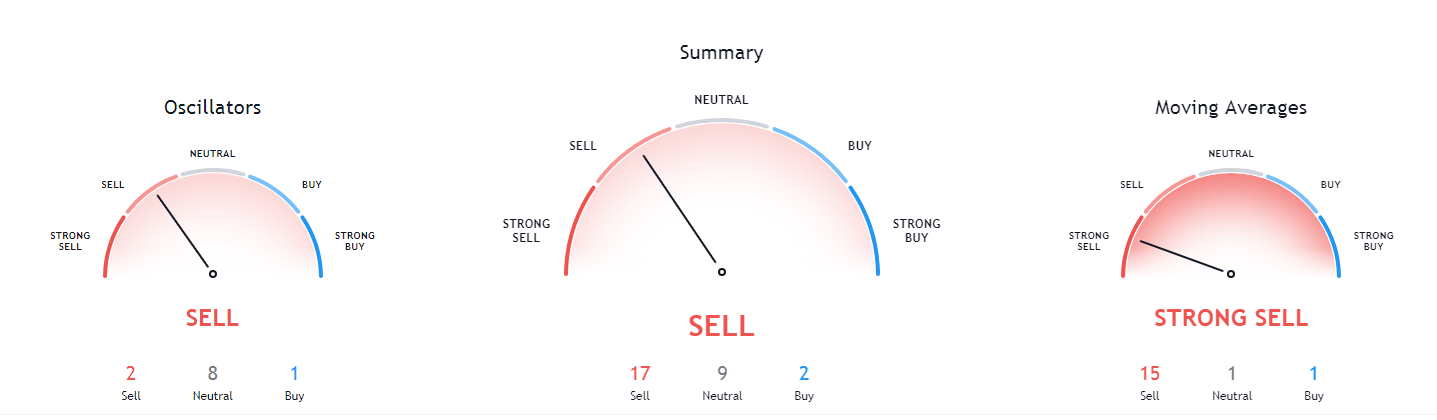
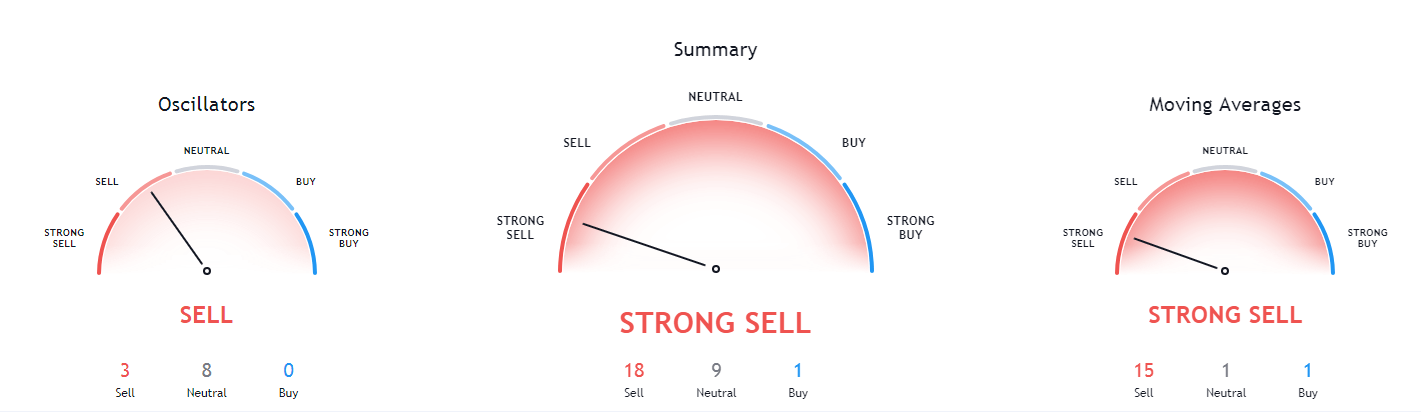
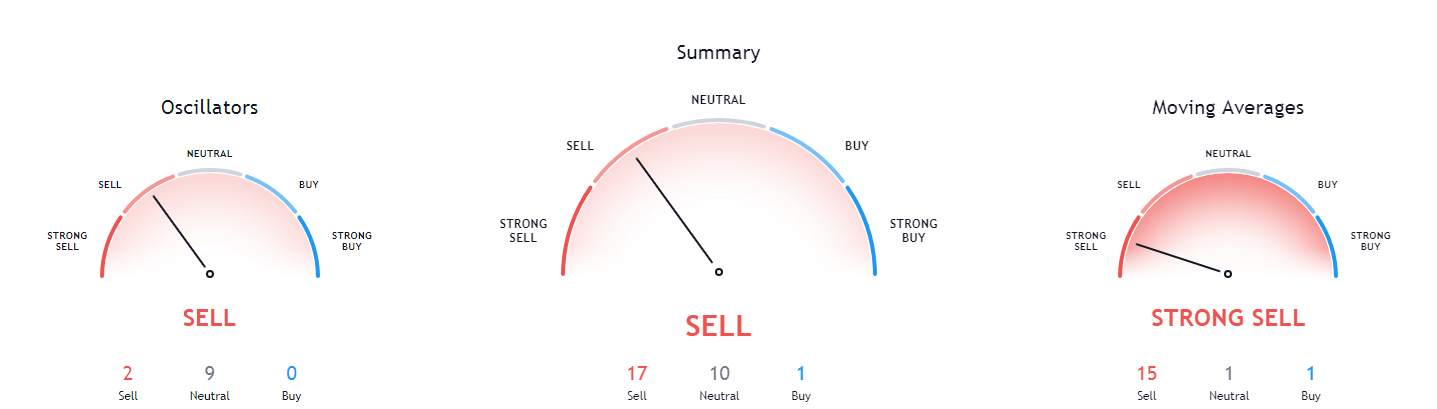
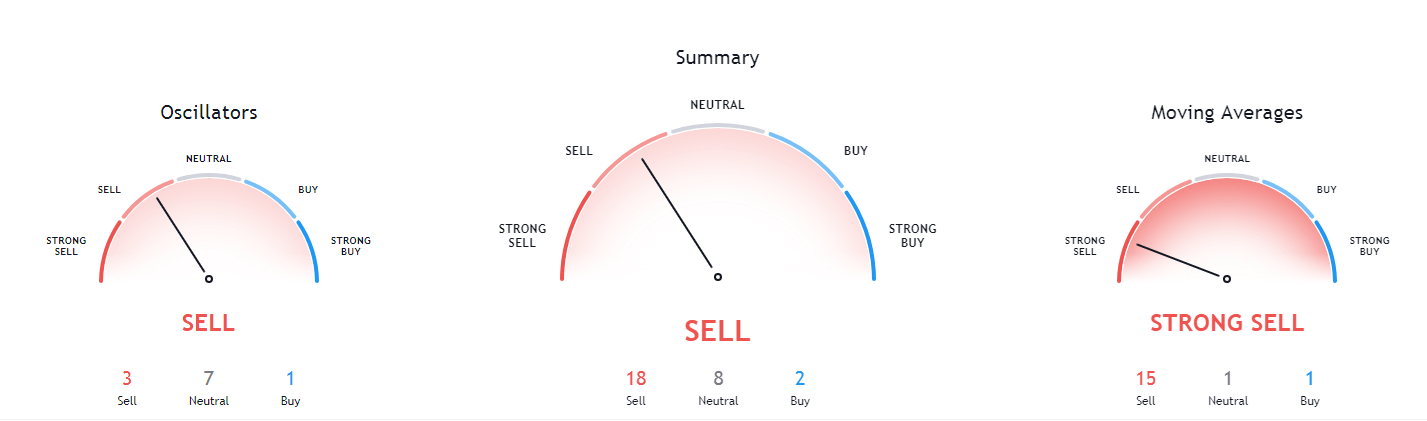
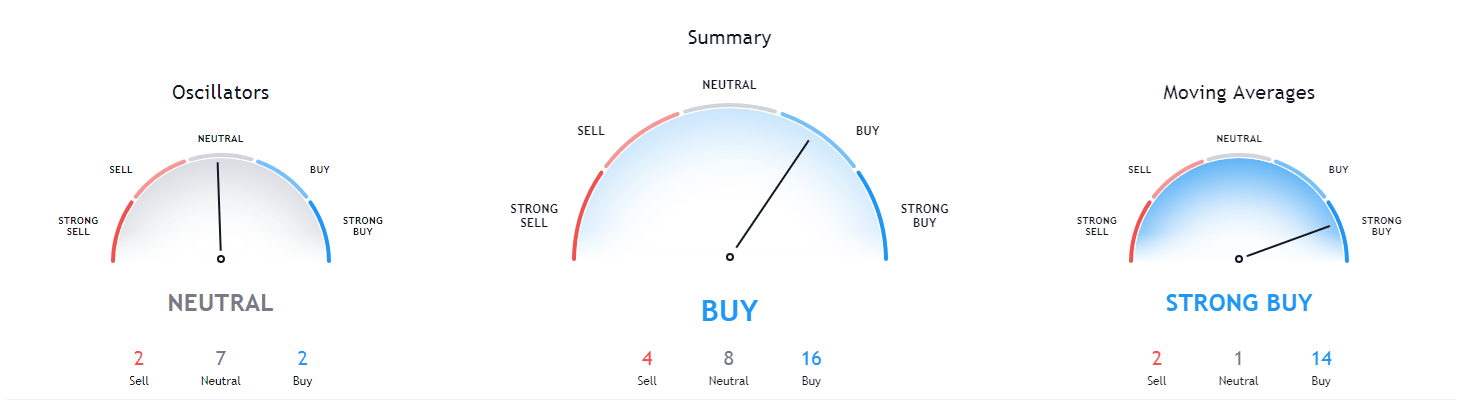
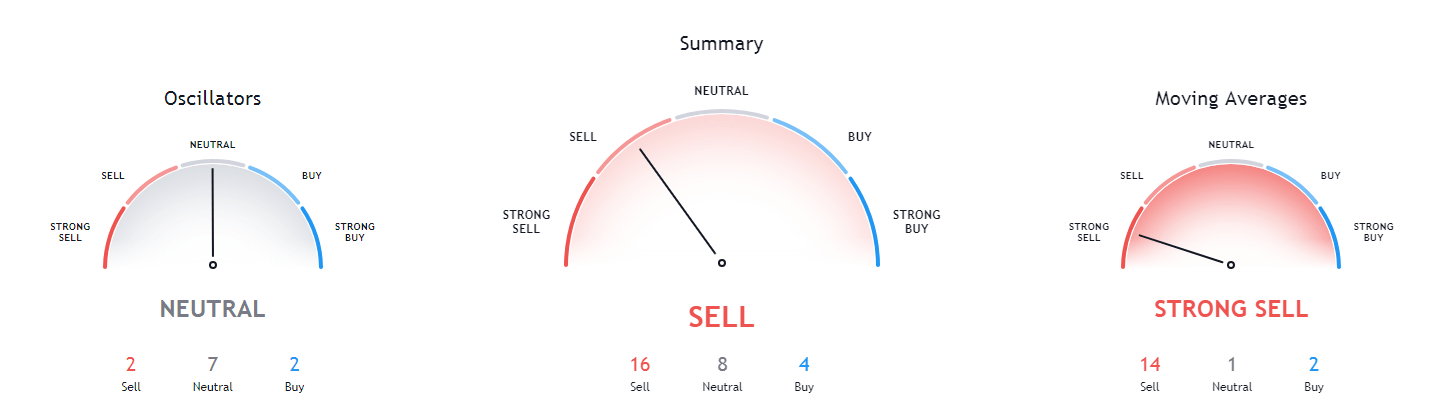
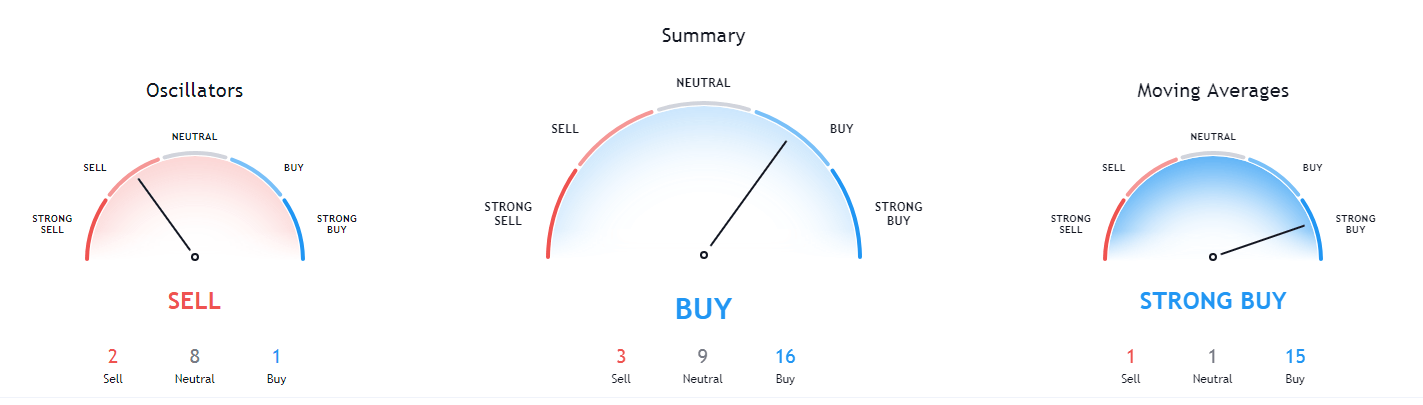
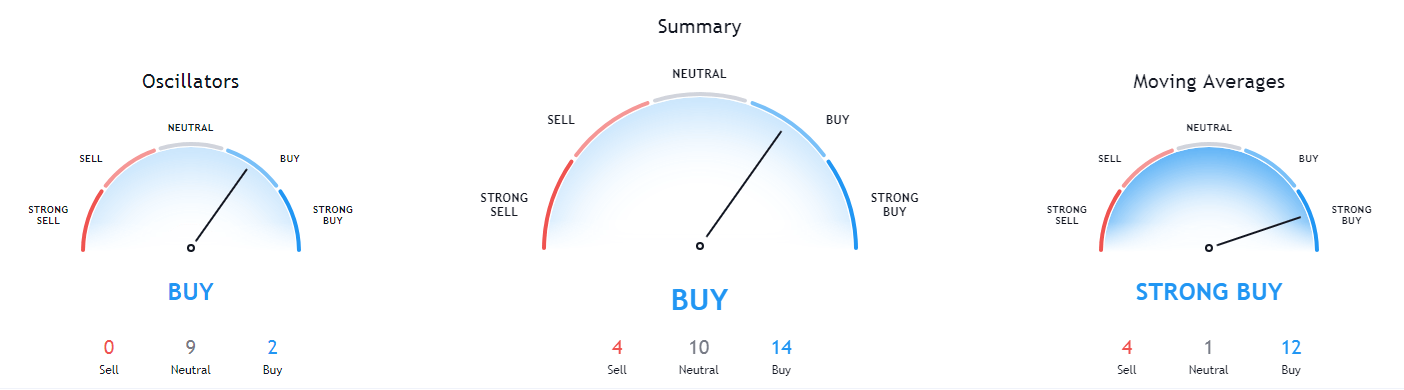
Bitcoin’s technicals are tilted slightly to the buy-side on the 4-hour, daily and weekly time-frames. However, all of these time-frames show signs of neutrality. On the other hand, its monthly overview is completely bullish.
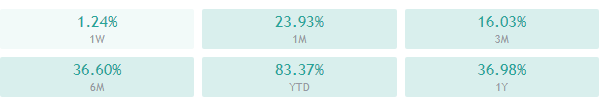
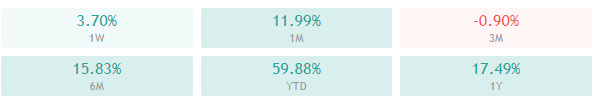
BTC/USD 1-day Technicals
Technical factors (4-hour Chart):
- Price is above its 50-period EMA and at its 21-period EMA
- Price is near its middle Bollinger band
- RSI is neutral (58.99)
- Volume is slightly above average
Key levels to the upside Key levels to the downside
1: $16,500 1: $16,000
2: $16,700 2: $15,480
3: $17,000 3: $14,640
Ethereum
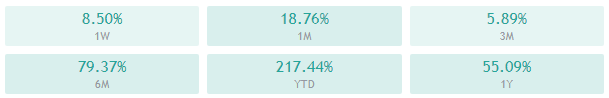
Ethereum has, just like Bitcoin, spent the weekend fighting to stay above its support level. The second-largest cryptocurrency by market cap, however, did not manage to win its fight. Ether has triggered a pullback after bouncing from the $478 level, which caused its price to first hover around the yellow top ascending channel line until it finally broke it to the downside. The move was stopped at $440, and Ethereum has since recovered and is currently trading just below the yellow line.
Our call on Friday for Ethereum dropping below the line was correct, as ETH did exactly as expected. However, the combination of factors at the moment make Ethereum a not-so-good trade, and traders should perhaps look at other options before choosing to trade it.
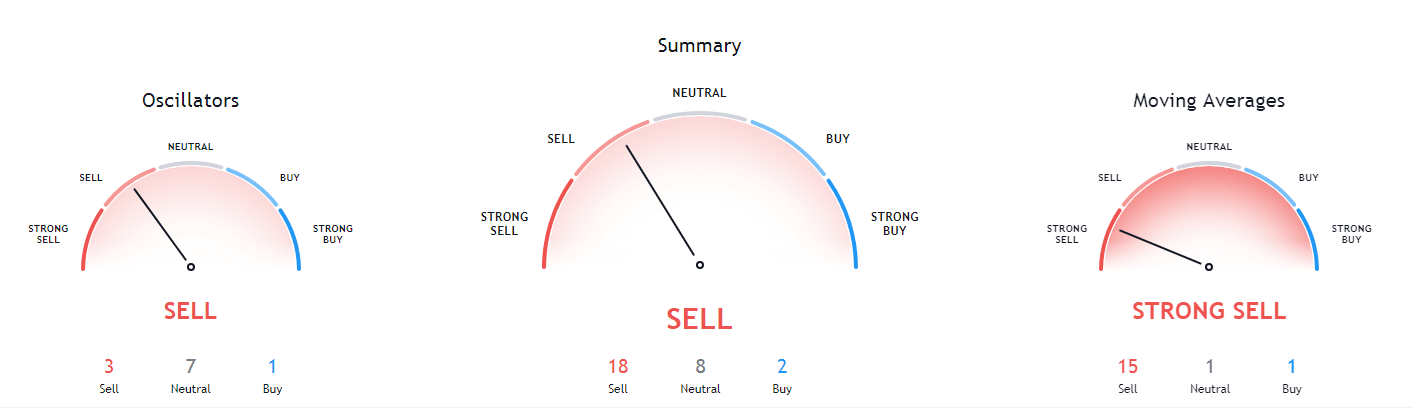
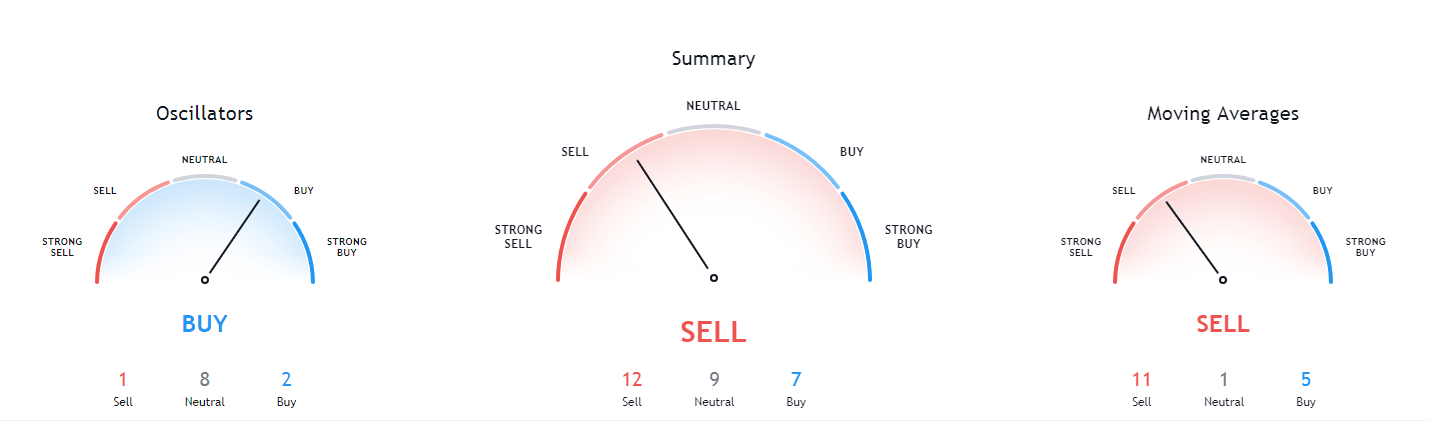
ETH/USD 4-hour Chart
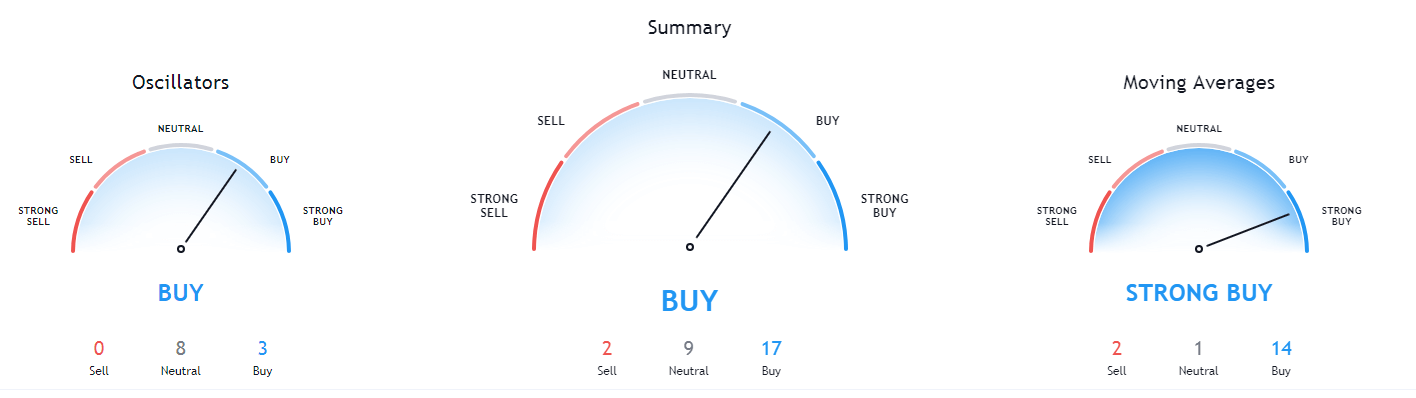
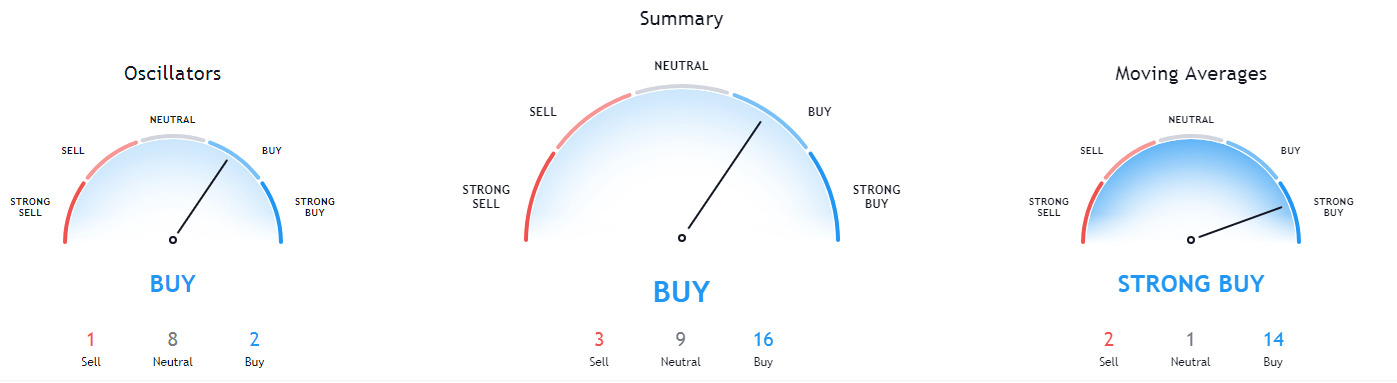
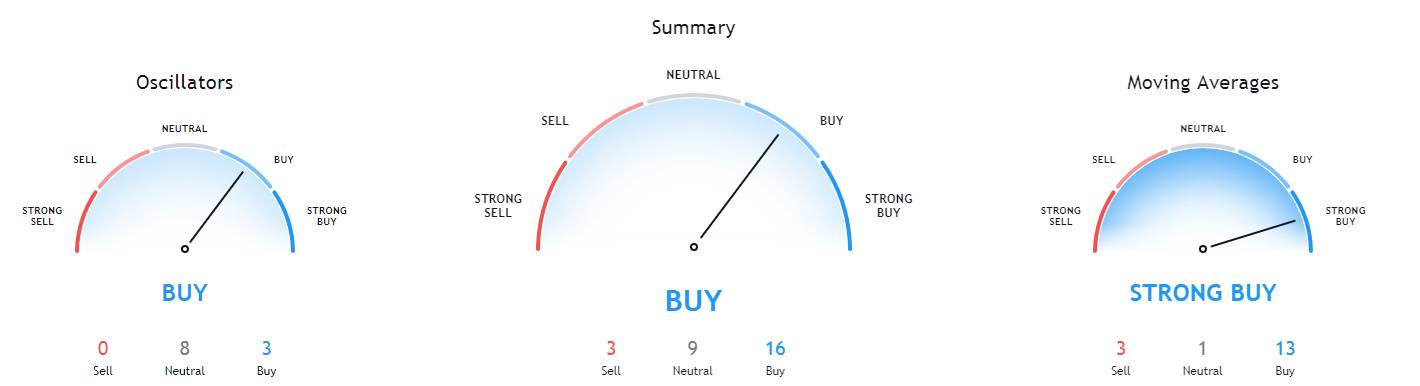
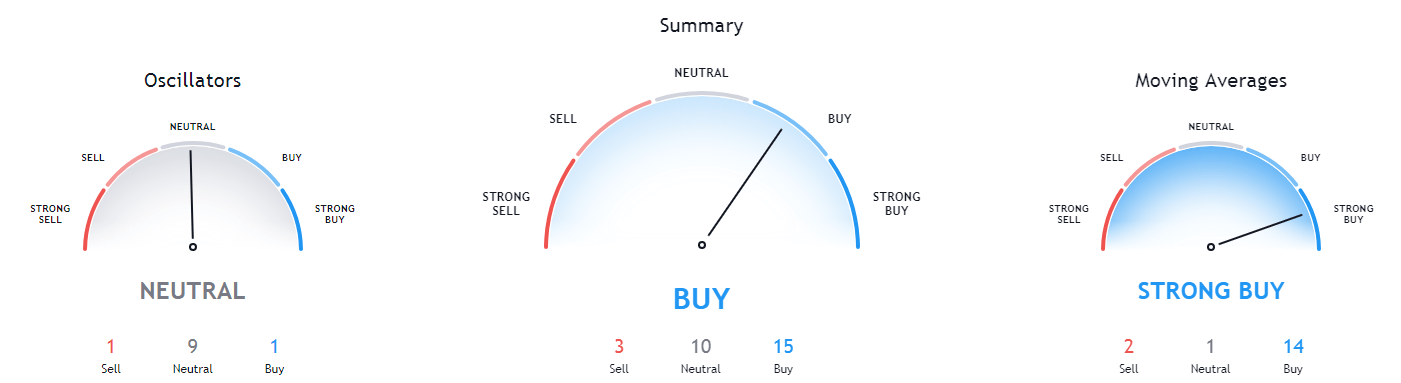
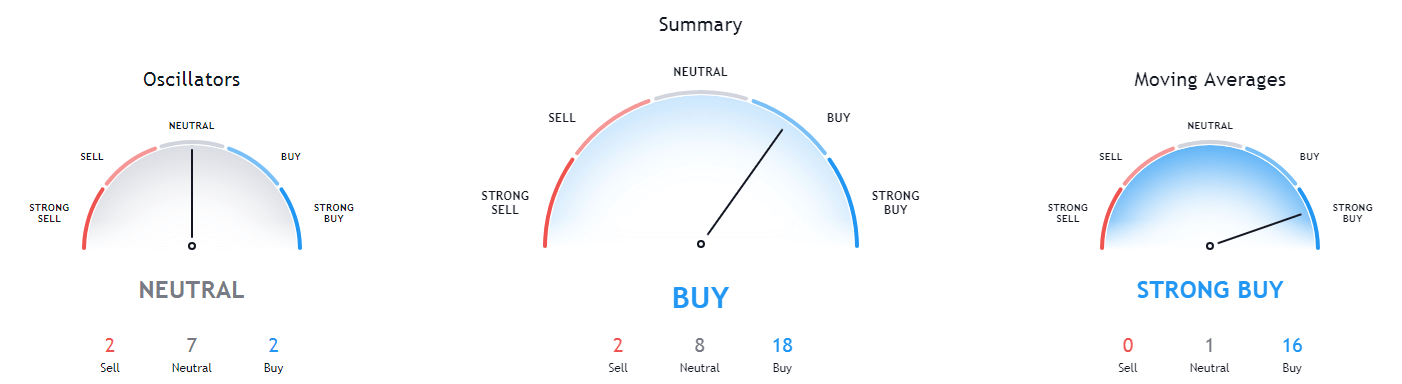
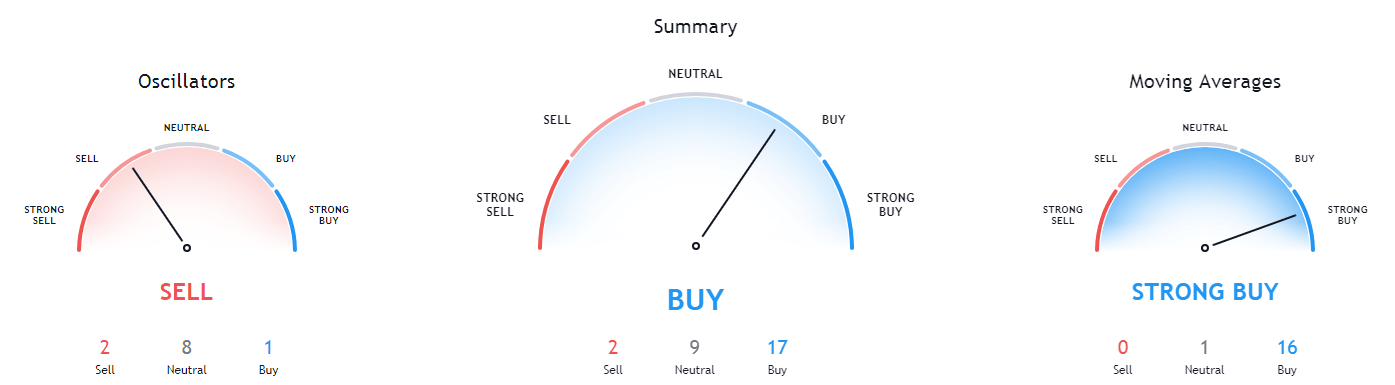
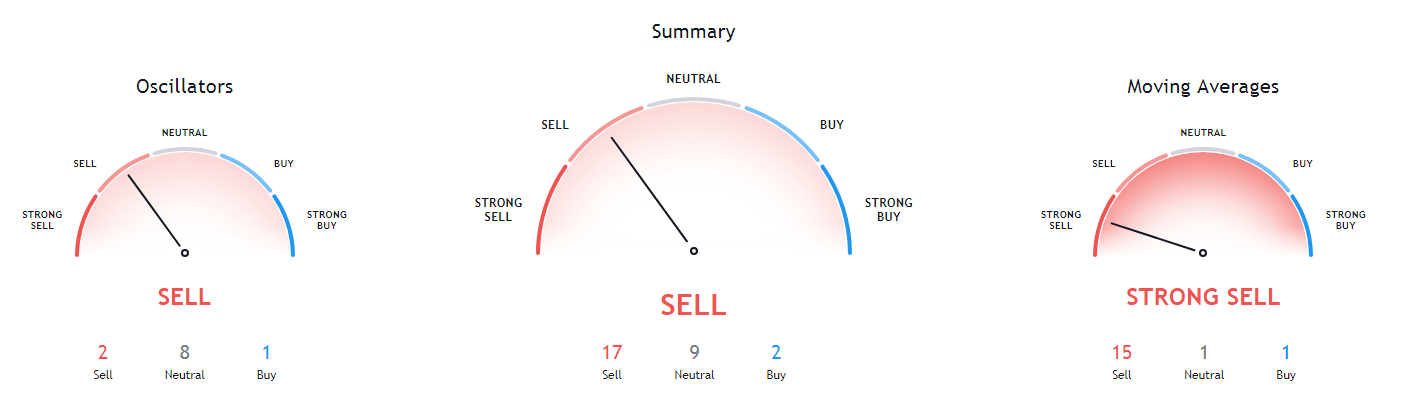
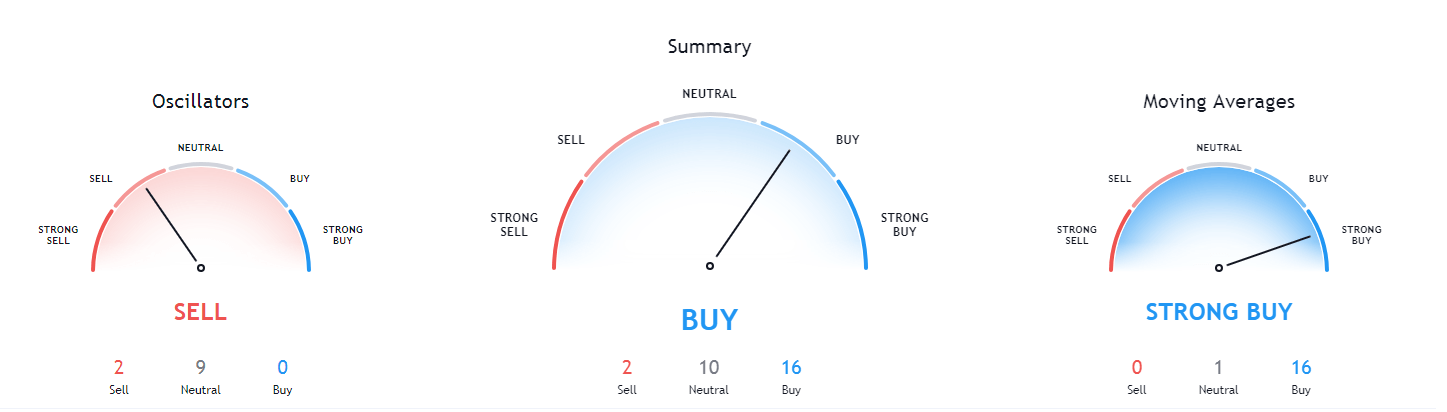
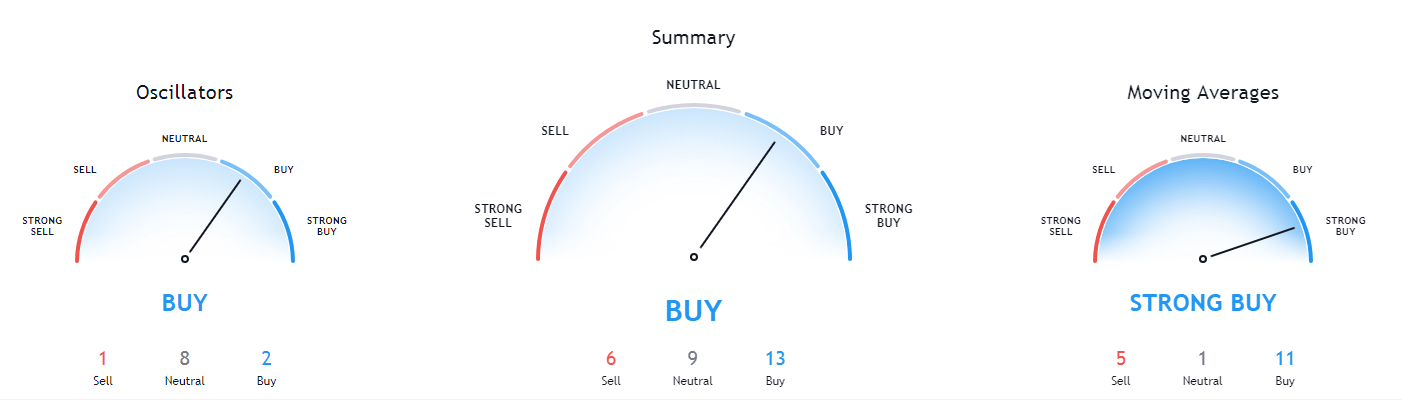
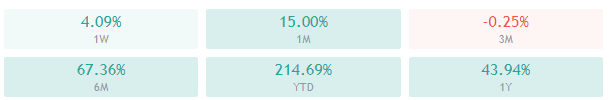
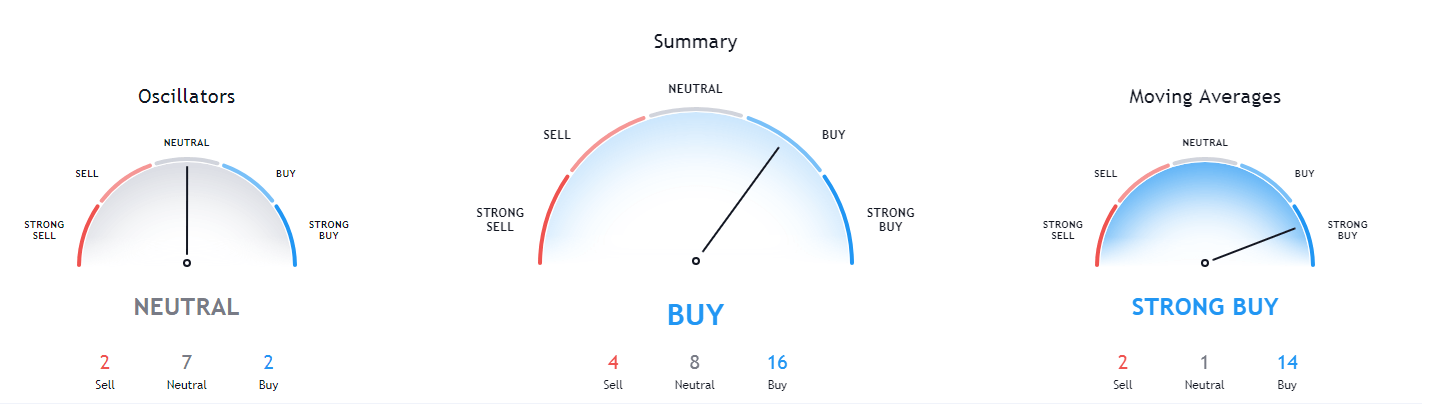
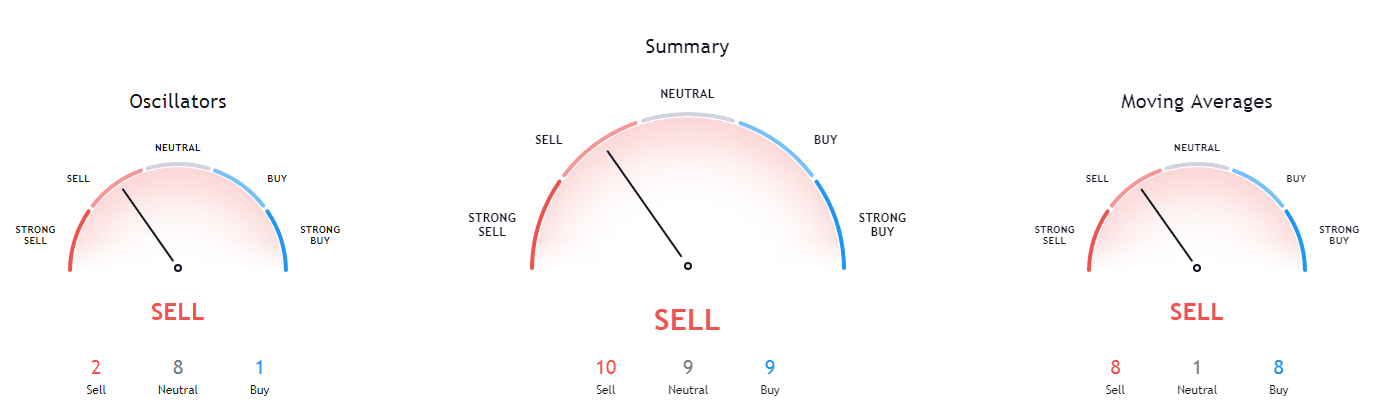
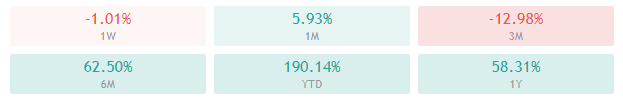
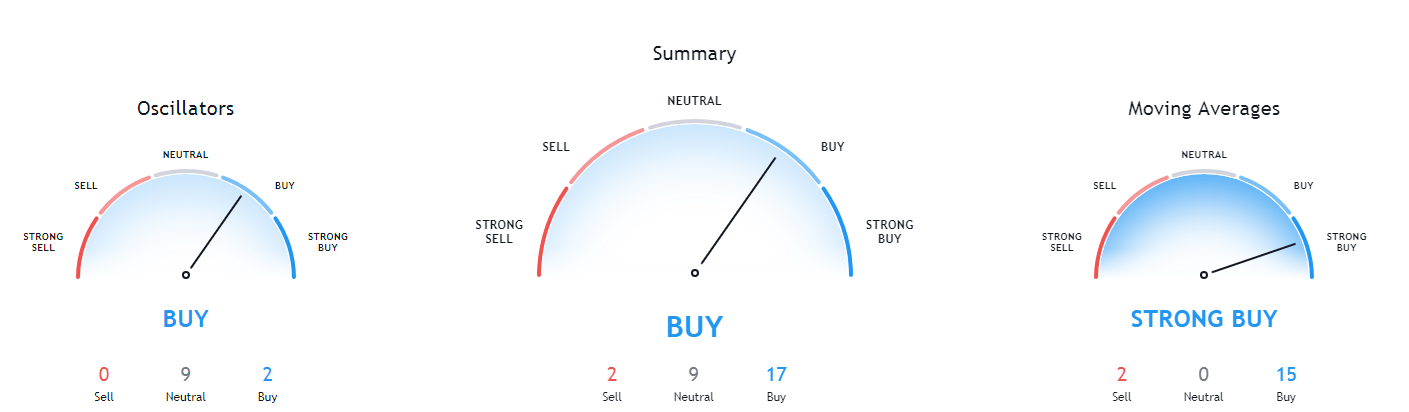
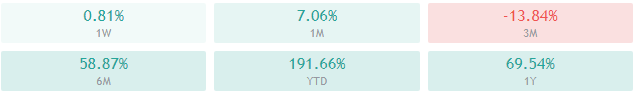
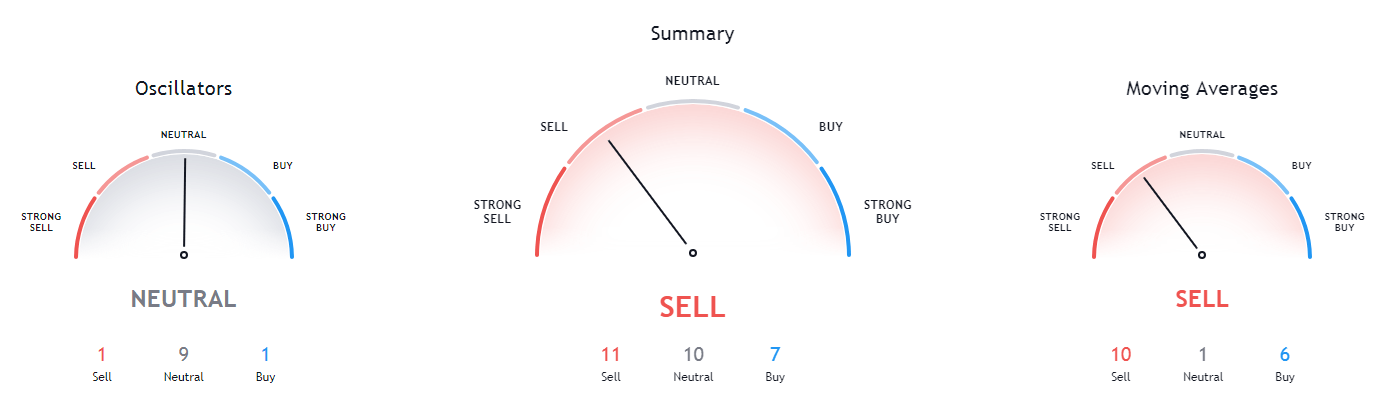
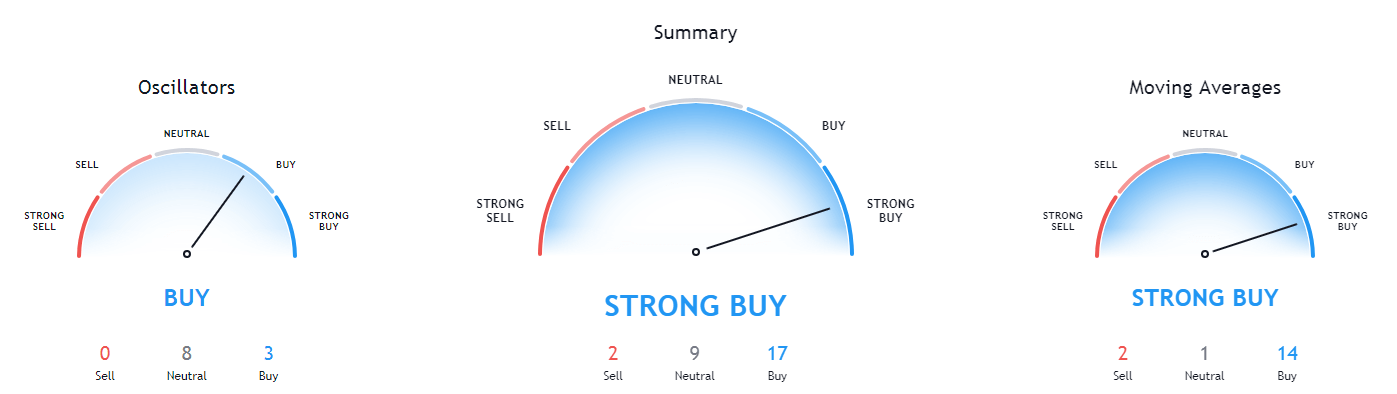
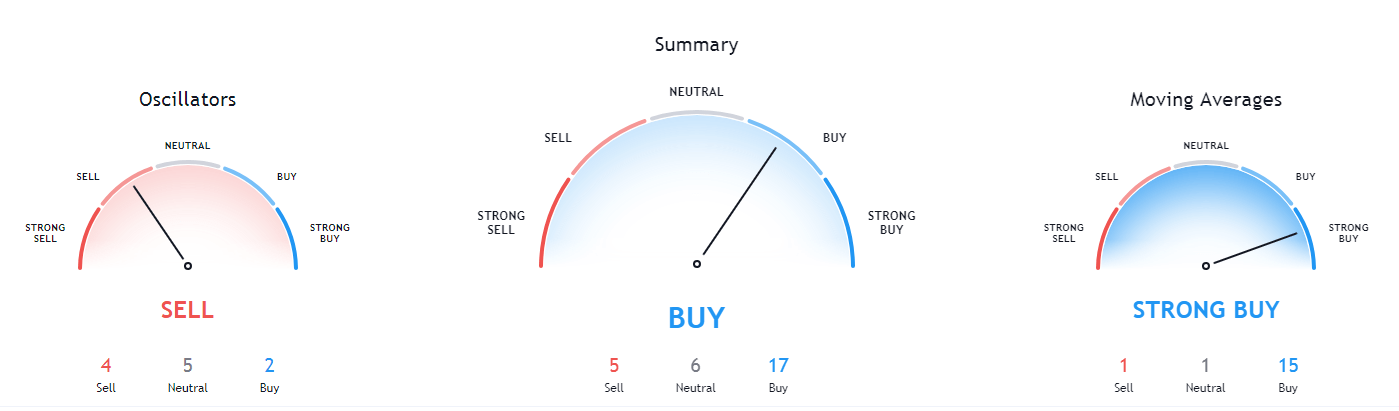
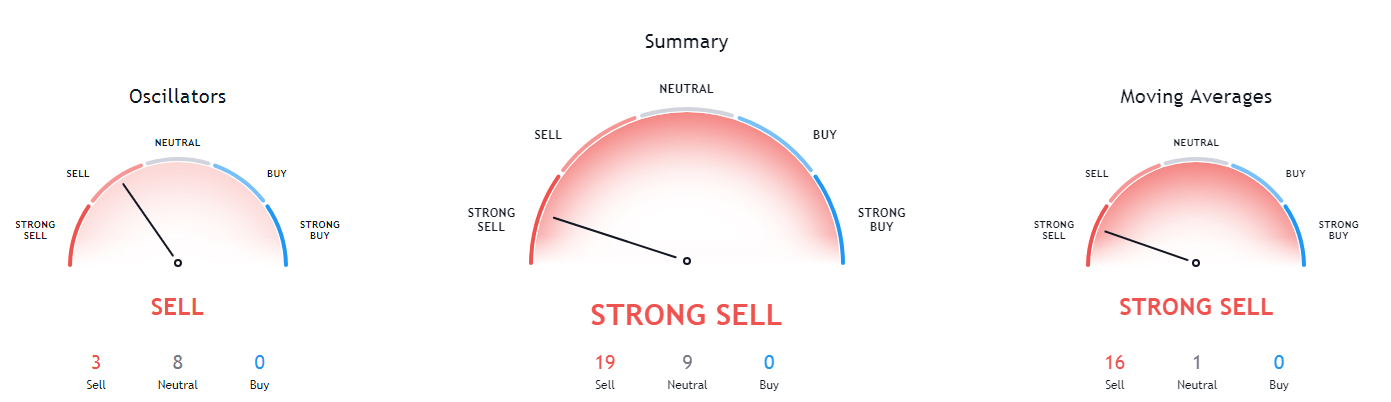
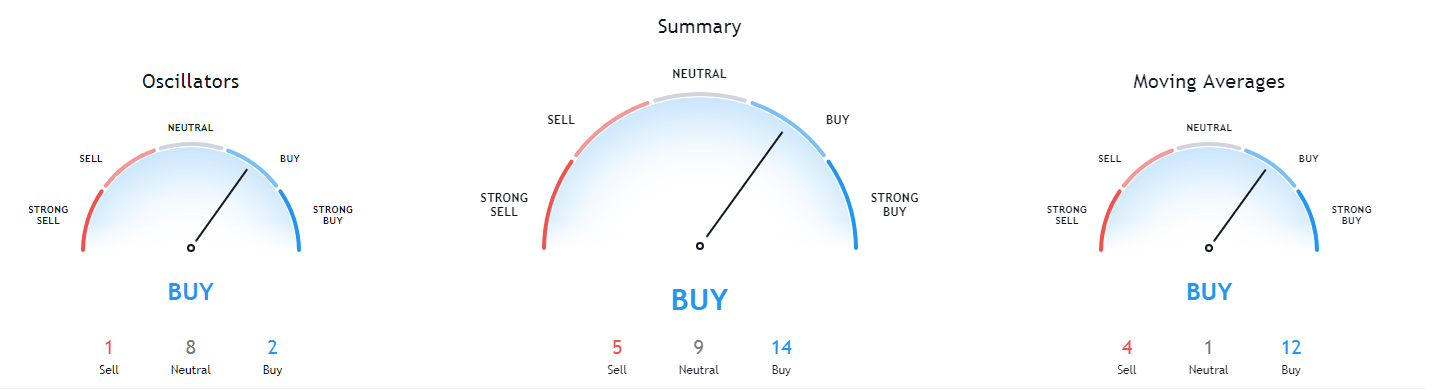
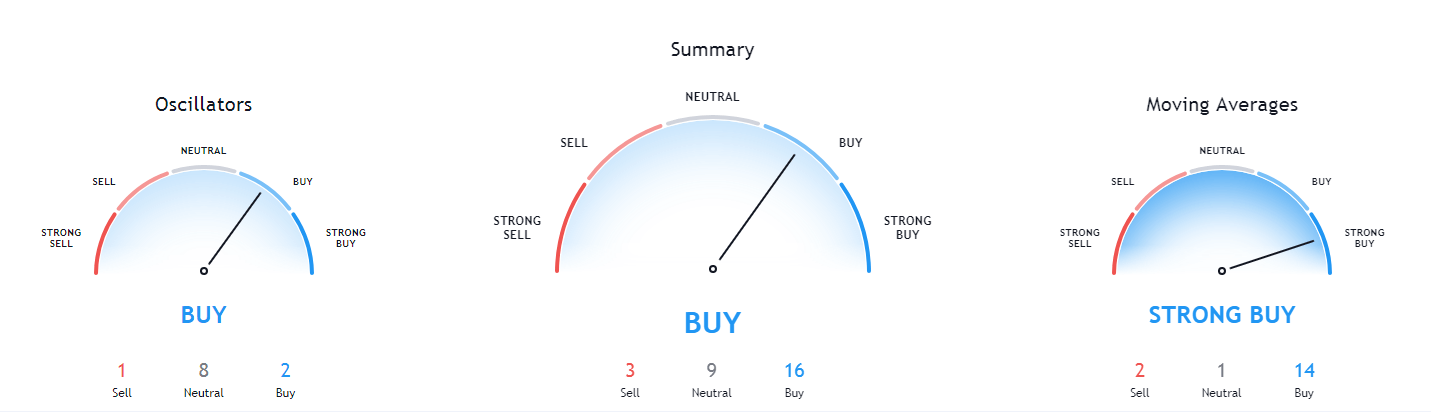
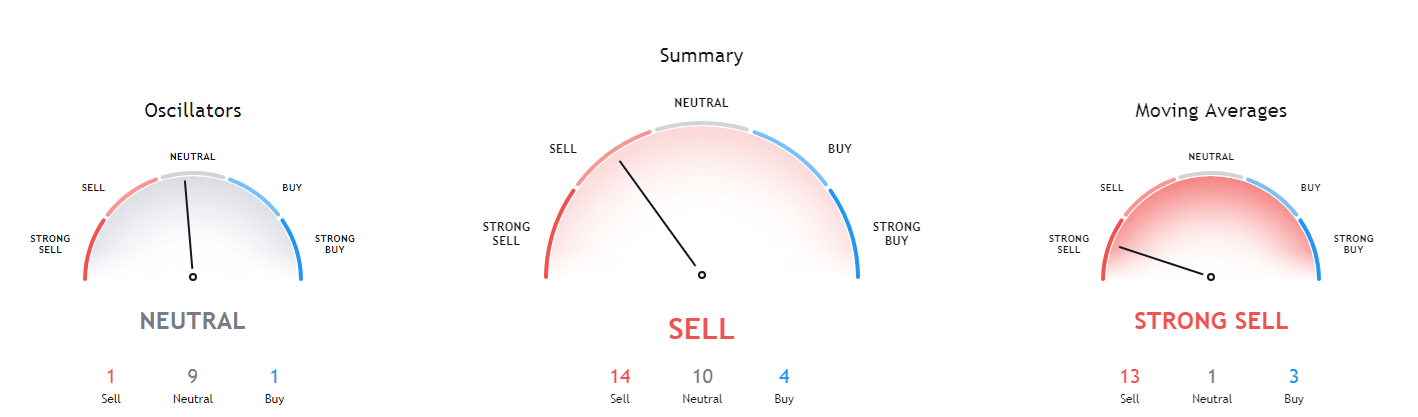
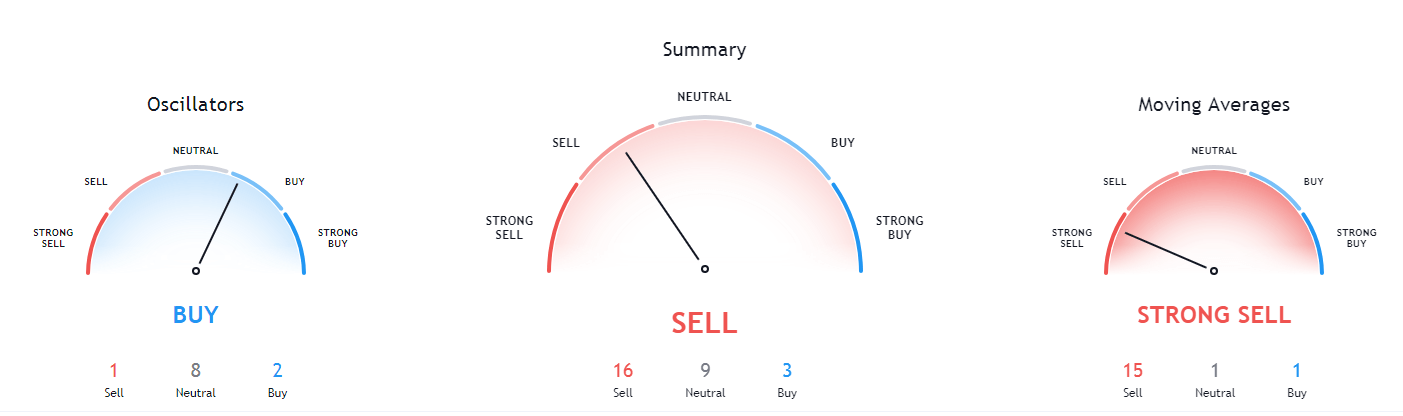
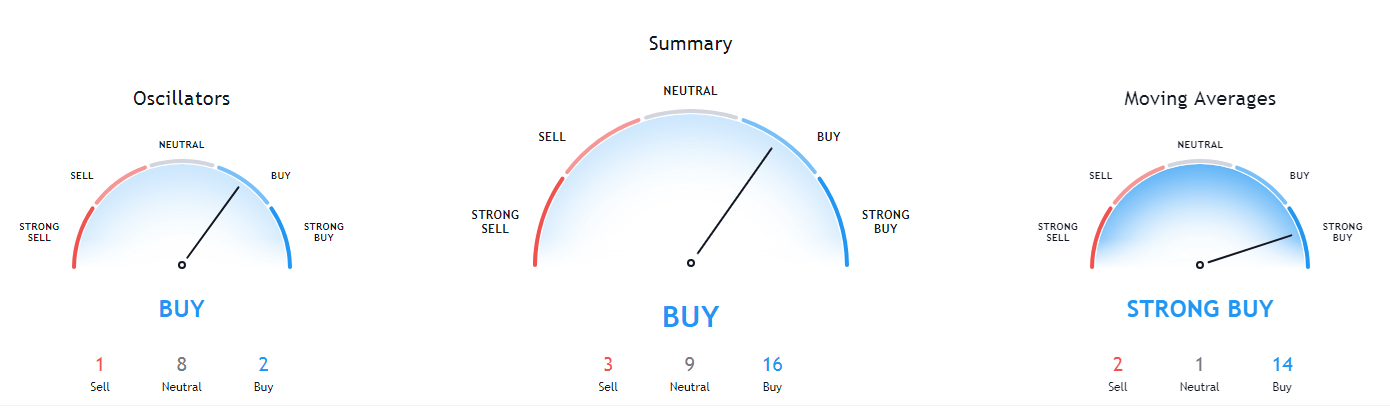
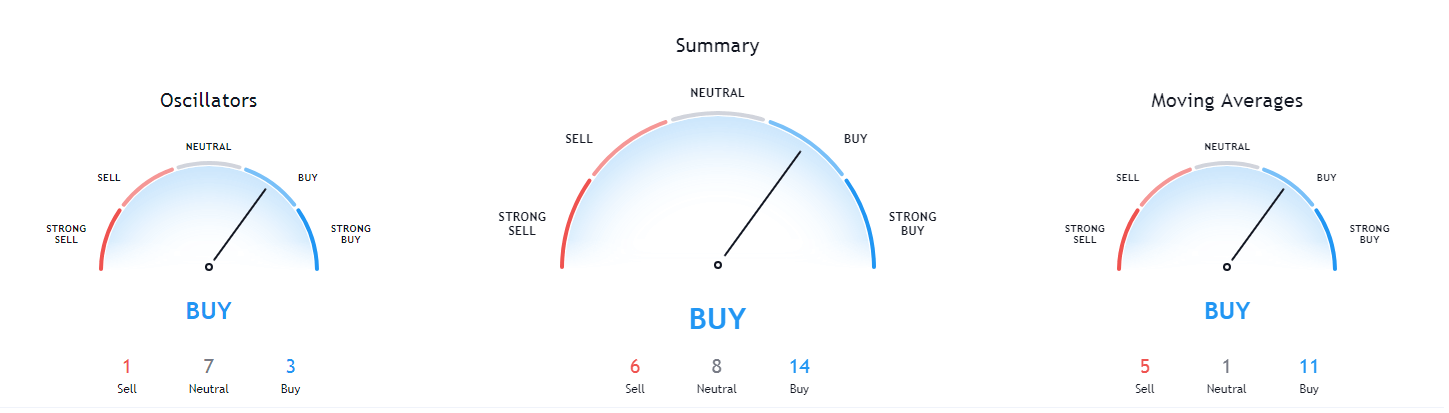
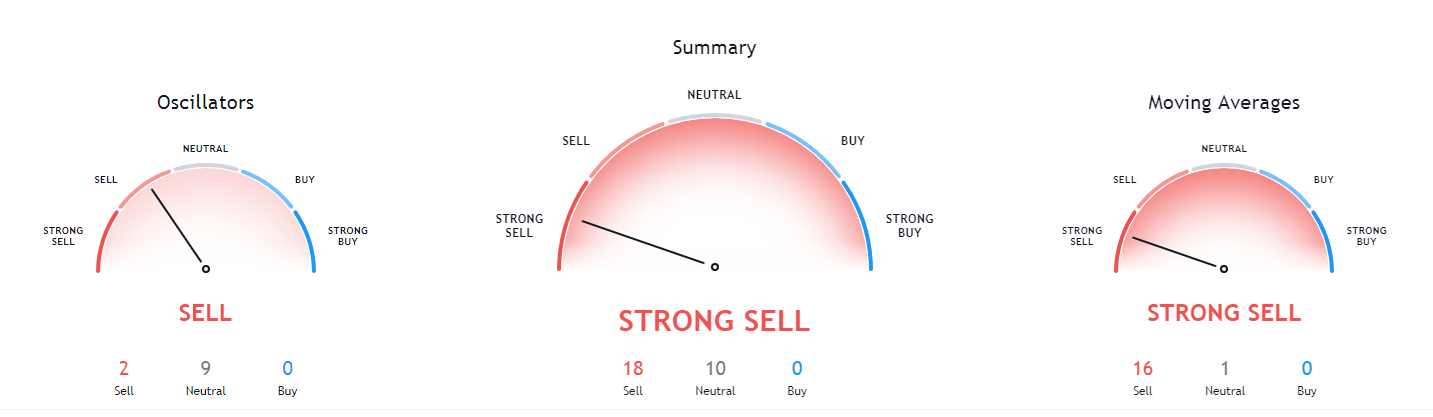
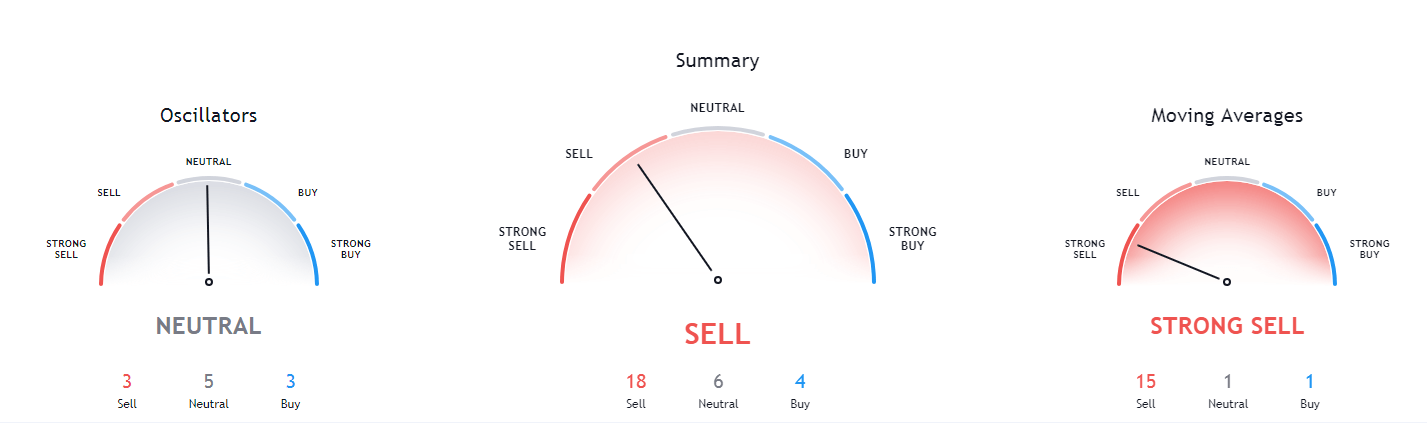
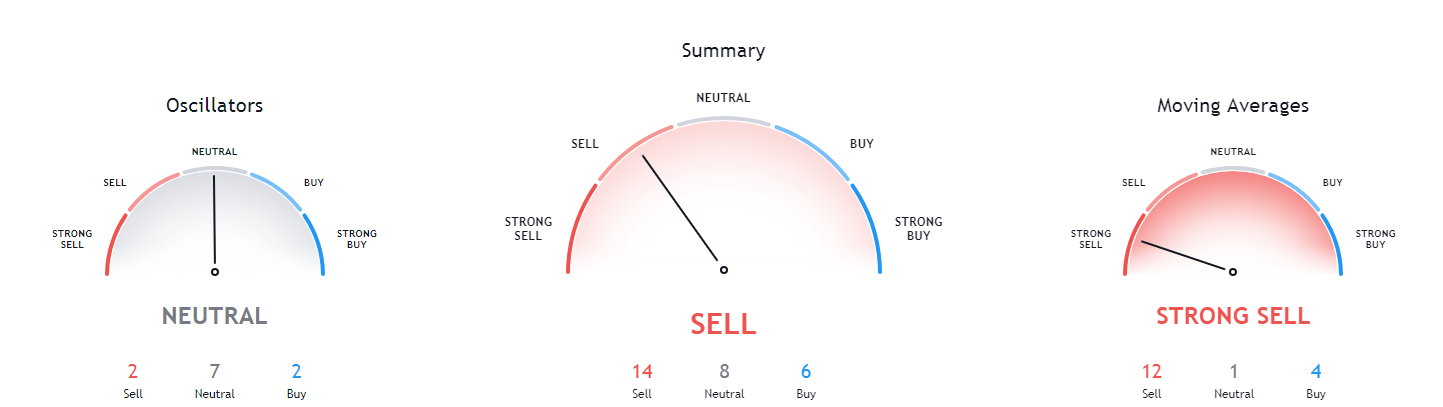
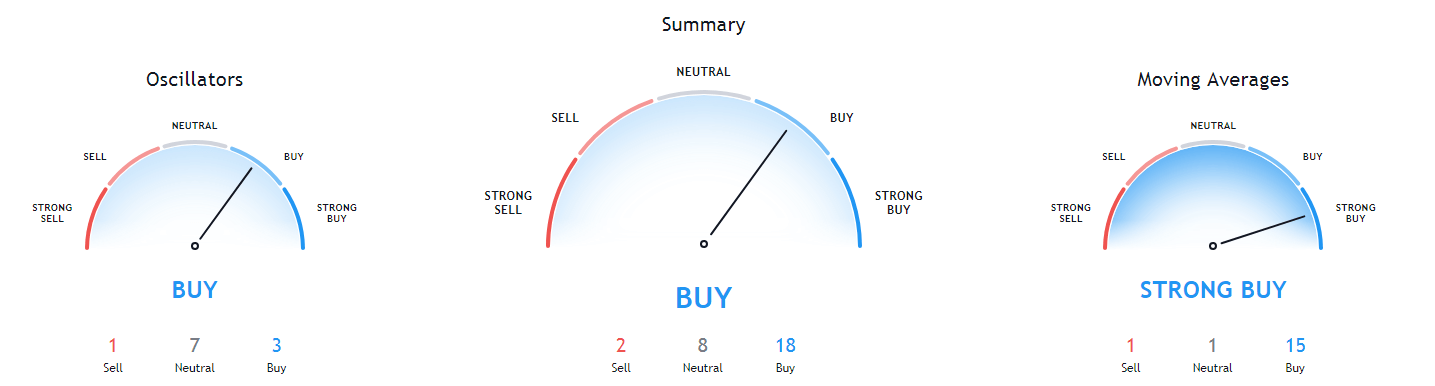
Ethereum’s technicals are extremely bullish on its weekly and monthly time-frames and very bullish (but not as much as the aforementioned time-frames) on its daily overview. Its 4-hour overview, however, is tilted heavily towards the sell-side.
ETH/USD 1-day Technicals
Technical Factors (4-hour Chart):
- The price is slightly above its 50-period and slightly below its 21-period EMA
- Price is slightly below its middle Bollinger band
- RSI is neutral (47.32)
- Volume is average
Key levels to the upside Key levels to the downside
1: $470 1: $451
2: $490 2: $445
3: $500 3: $420
Ripple
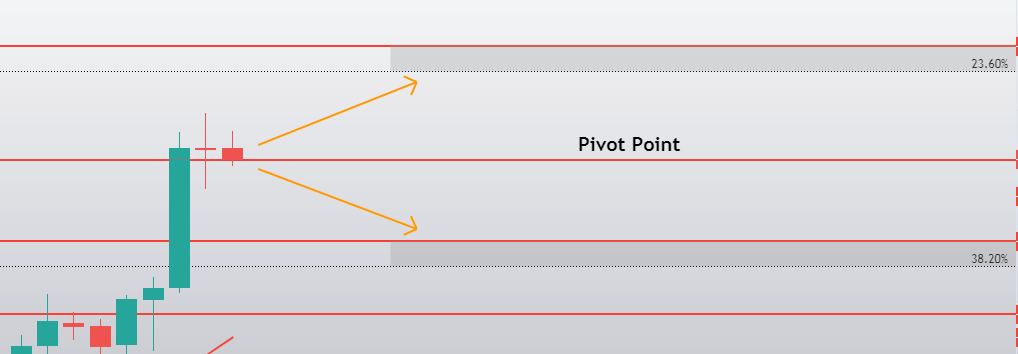
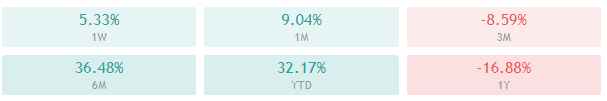
The fourth-largest cryptocurrency by market cap had an incredible day on Friday, as its price pushed above 2 of its major resistance levels. XRP has managed to, in a span of around 12 hours, push past the $0.26 and $0.266 levels and took the weekend to consolidate above them and create a strong foundation. The $0.266 level was tested as support twice already, successfully both times.
Traders can finally look at XRP as a crypto that moves somewhere else than sideways, and look for opportunities in places other than the range between $0.2454 and $0.26.
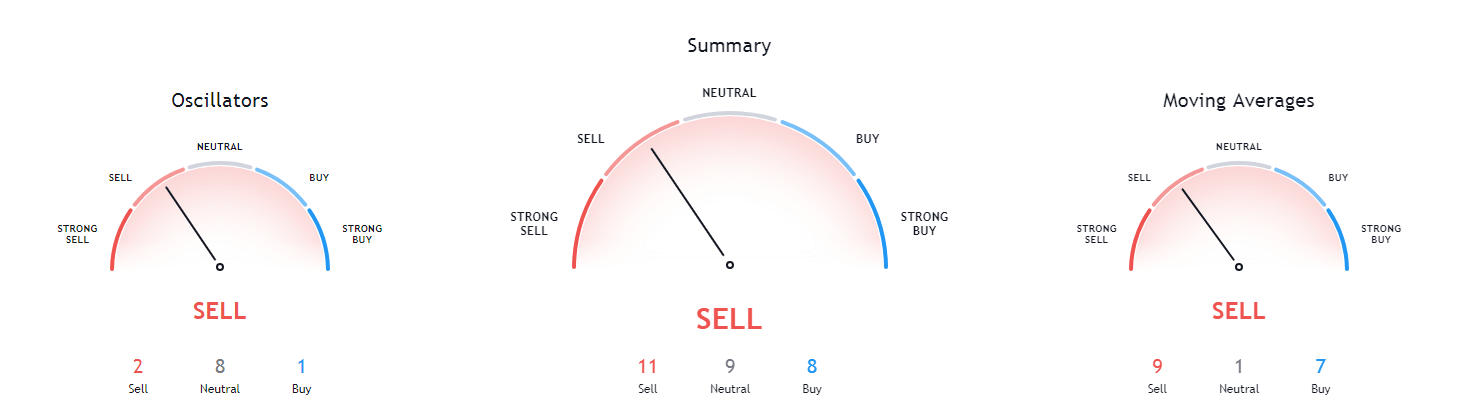
XRP/USD 4-hour Chart
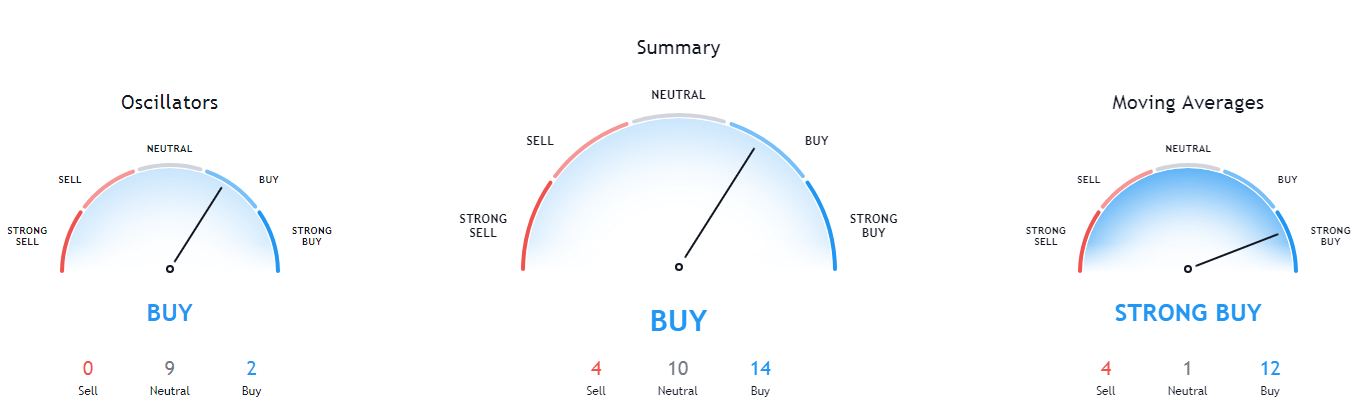
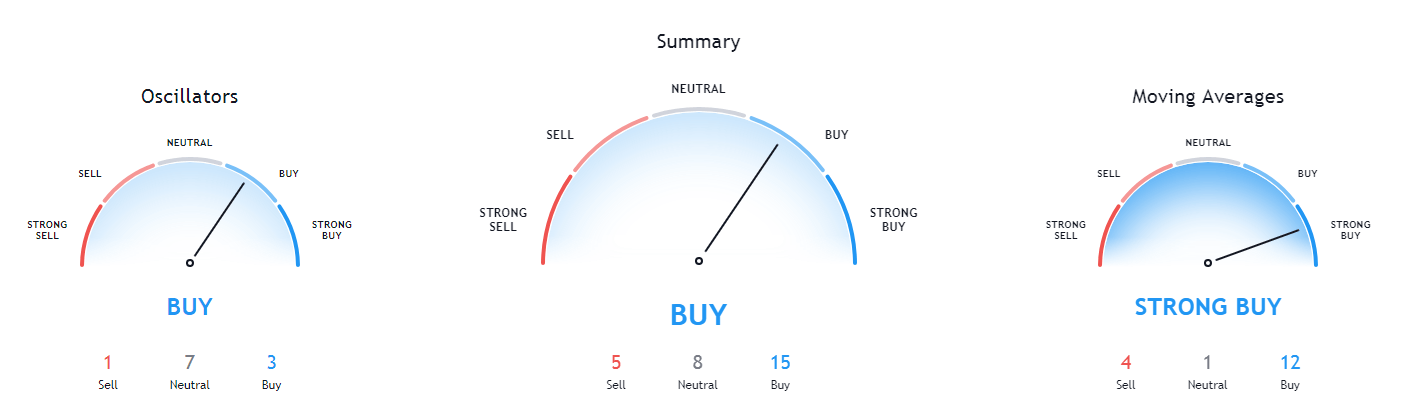
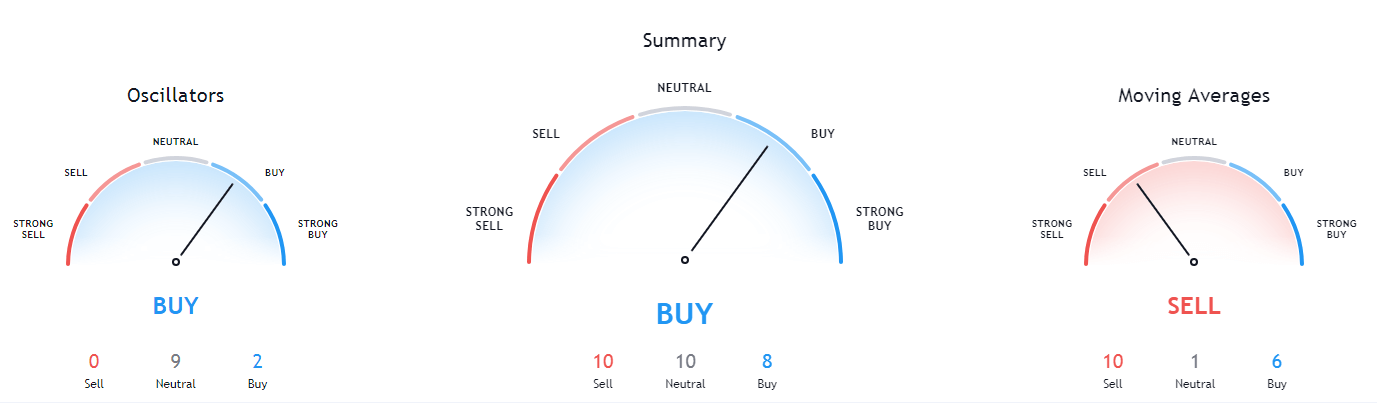
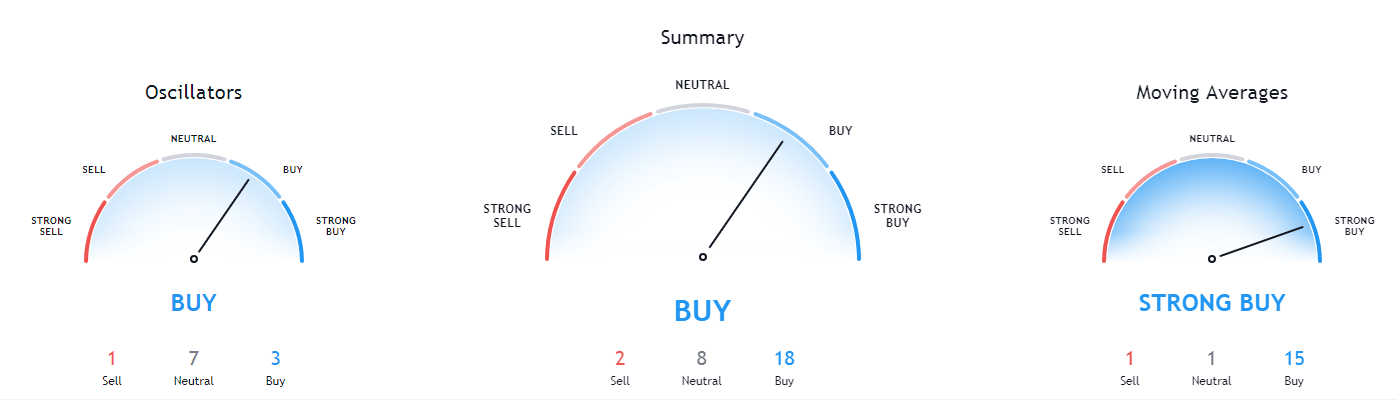
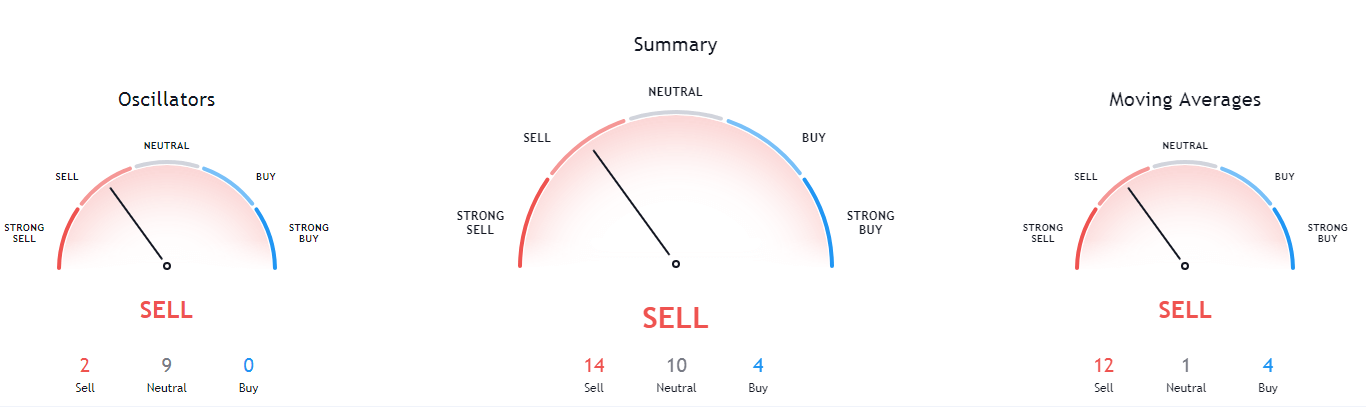
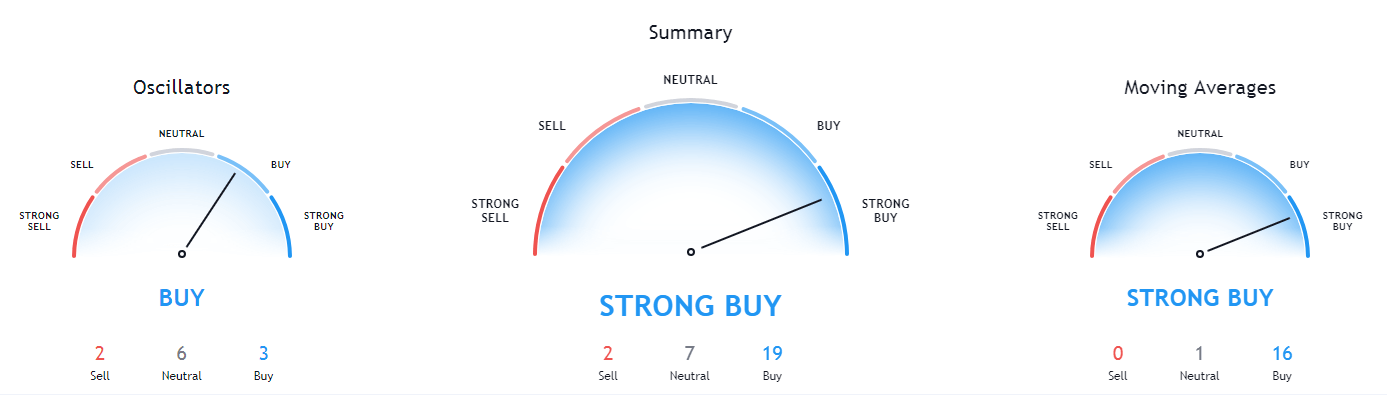
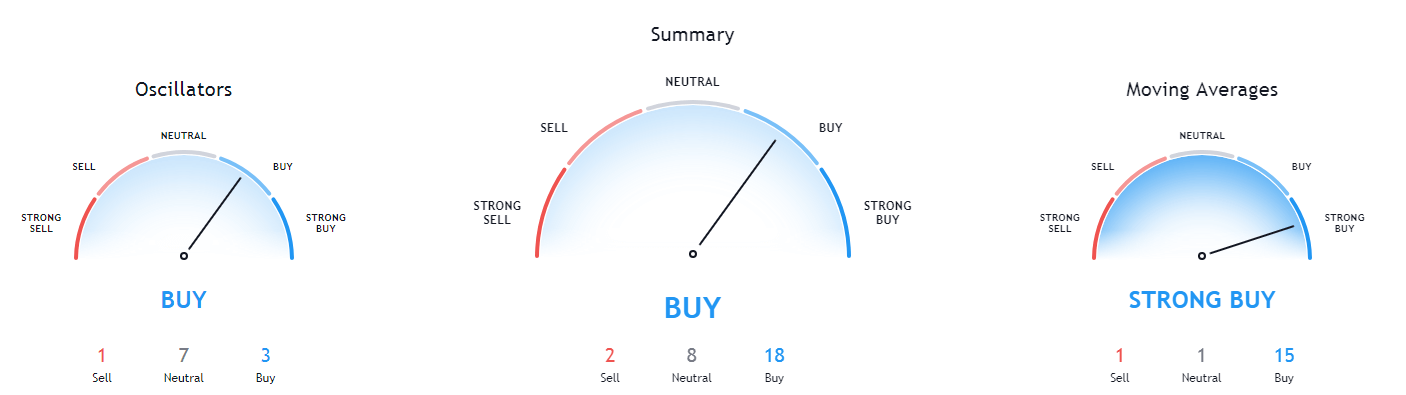
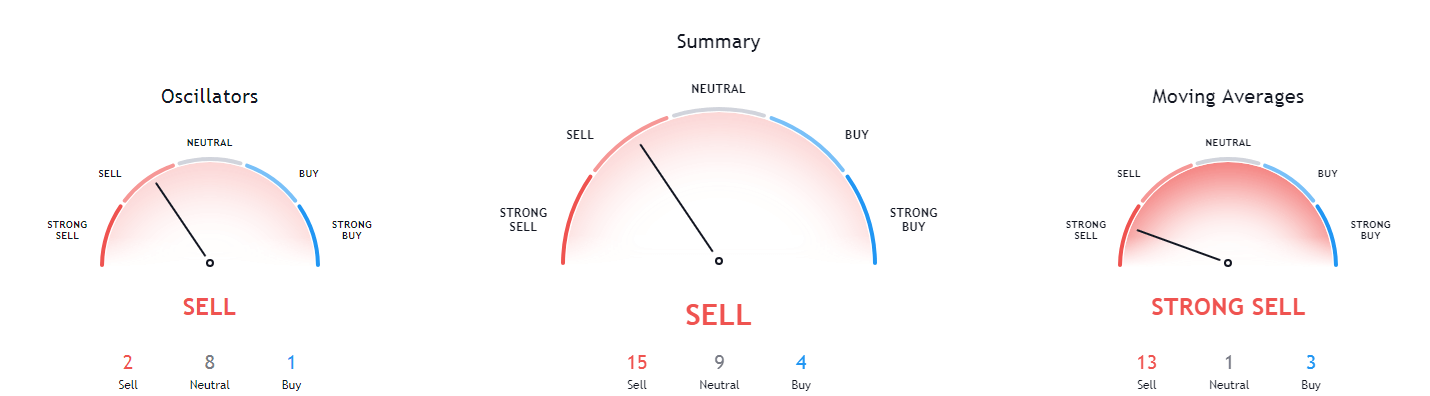
XRP’s technicals are slightly tilted towards the buy-side on all time-frames, with more or less neutrality signs. The important change from the last report (and many reports before) is XRP’s monthly overview, which has finally turned bullish.
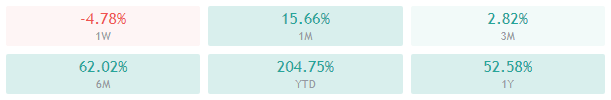
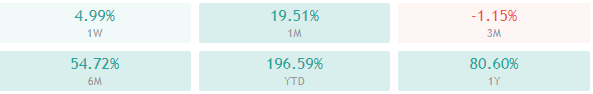
XRP/USD 1-day Technicals
Technical factors (4-hour Chart):
- The price is above its 50-period EMA and slightly above at its 21-period EMA
- Price is between its middle and top Bollinger band
- RSI is neutral (59.63)
- Volume is average
Key levels to the upside Key levels to the downside
1: $0.27 1: $0.266
2: $0.2855 2: $0.26
3: $0.31 3: $0.2454