The cryptocurrency sector has surprised the market and pushed towards the upside despite the short-term bearish sentiment surrounding it recently. Bitcoin is currently trading for $10,630, representing an increase of 3.56% on the day. Meanwhile, Ethereum gained 5.49% on the day, while XRP gained 3.71%.
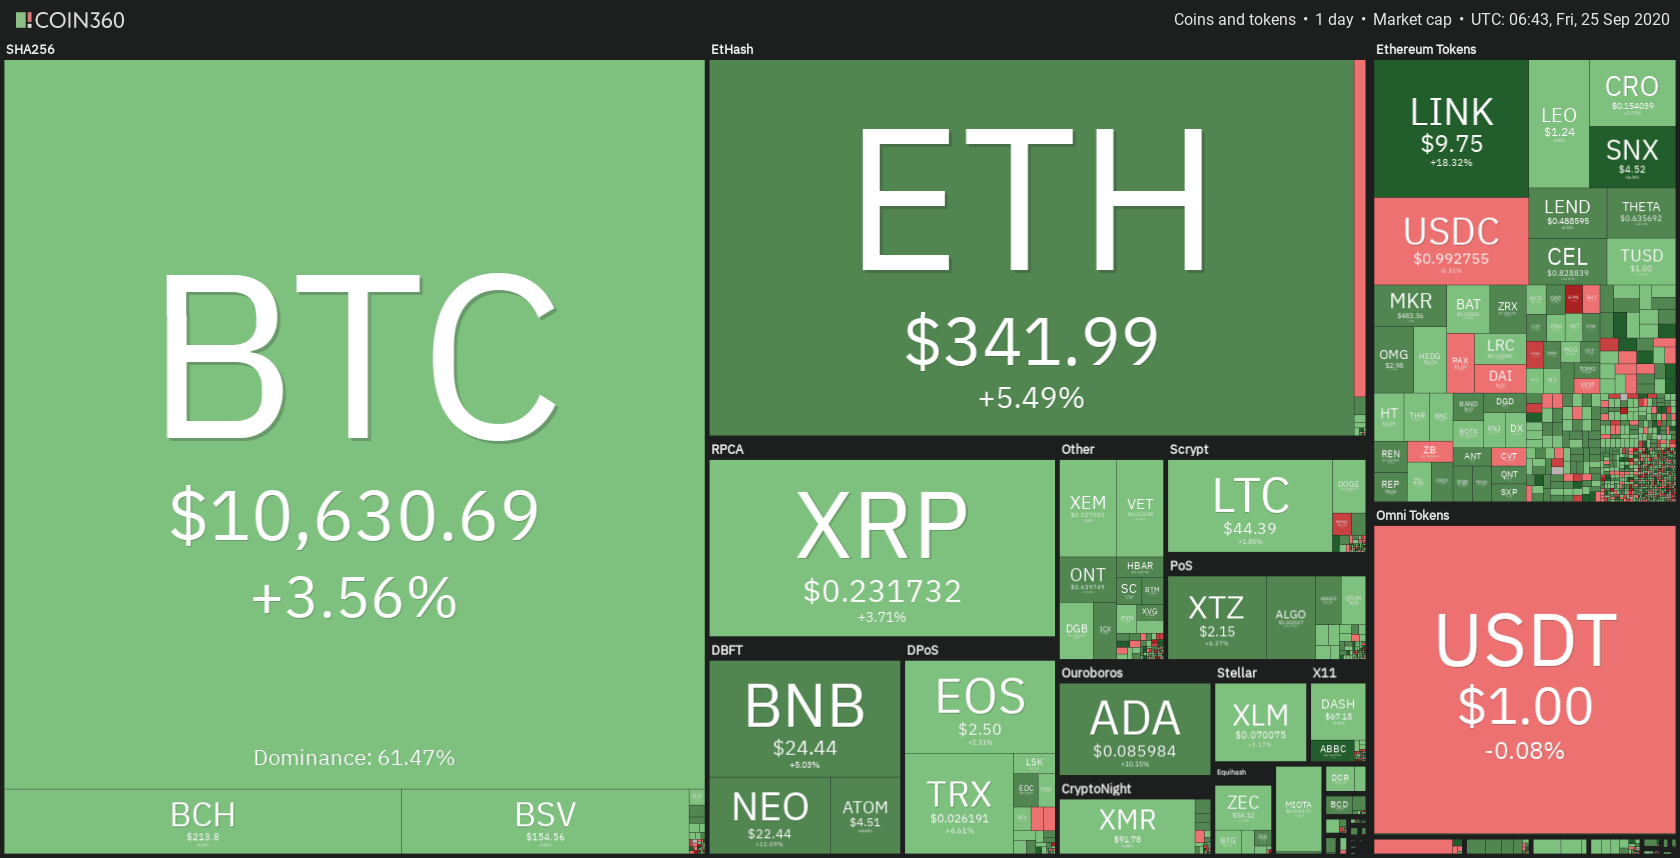
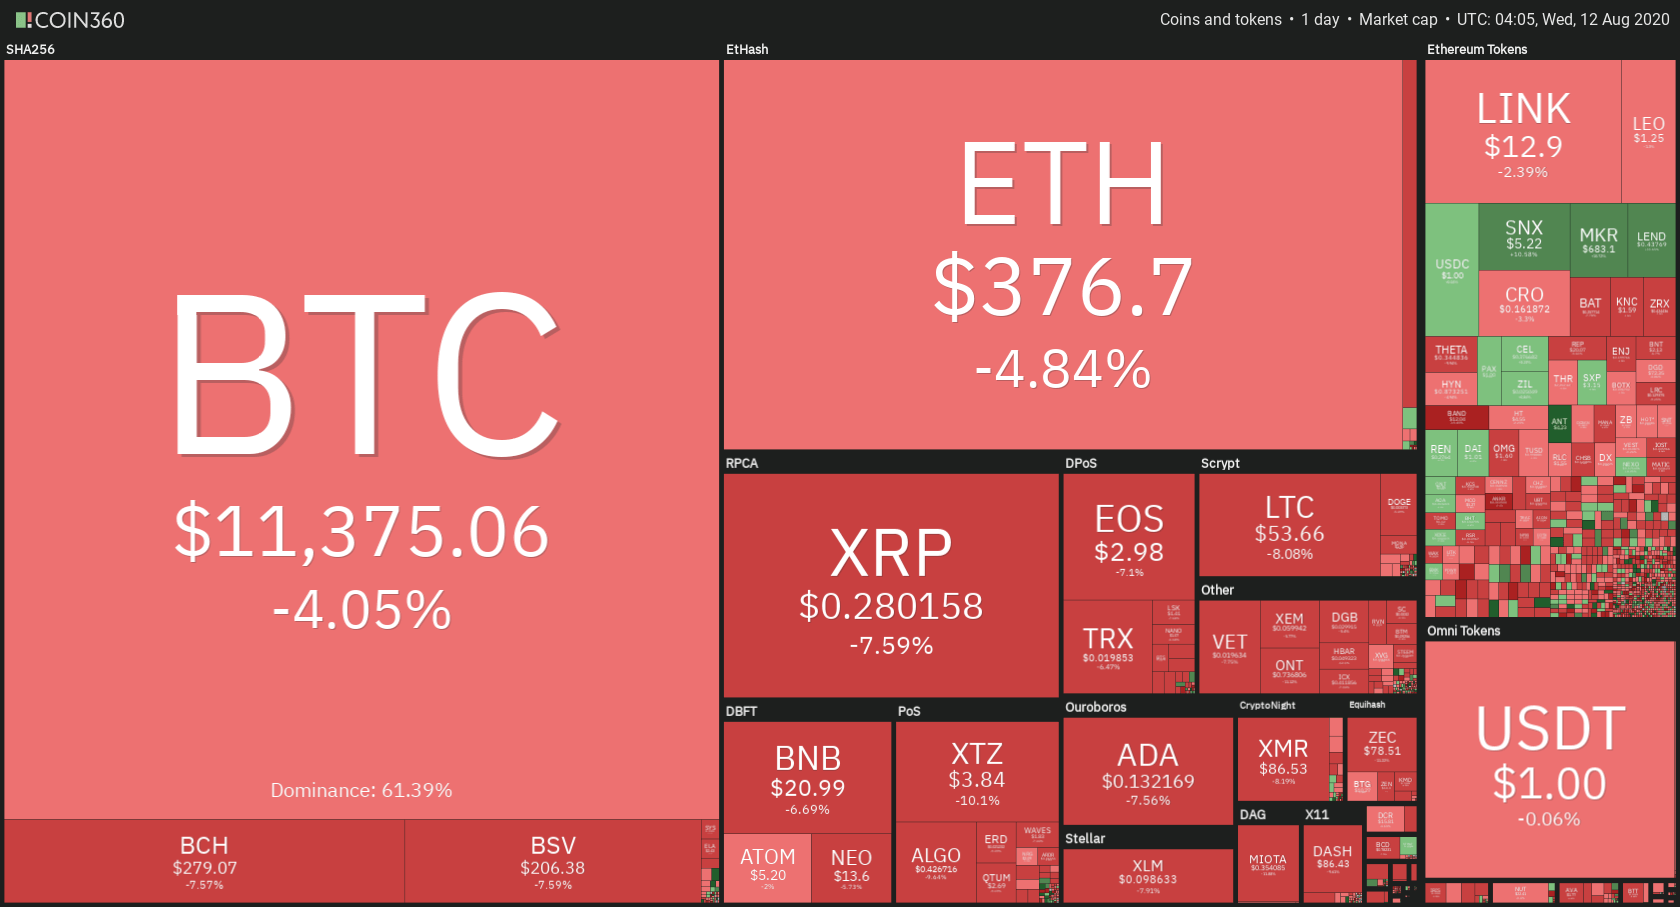
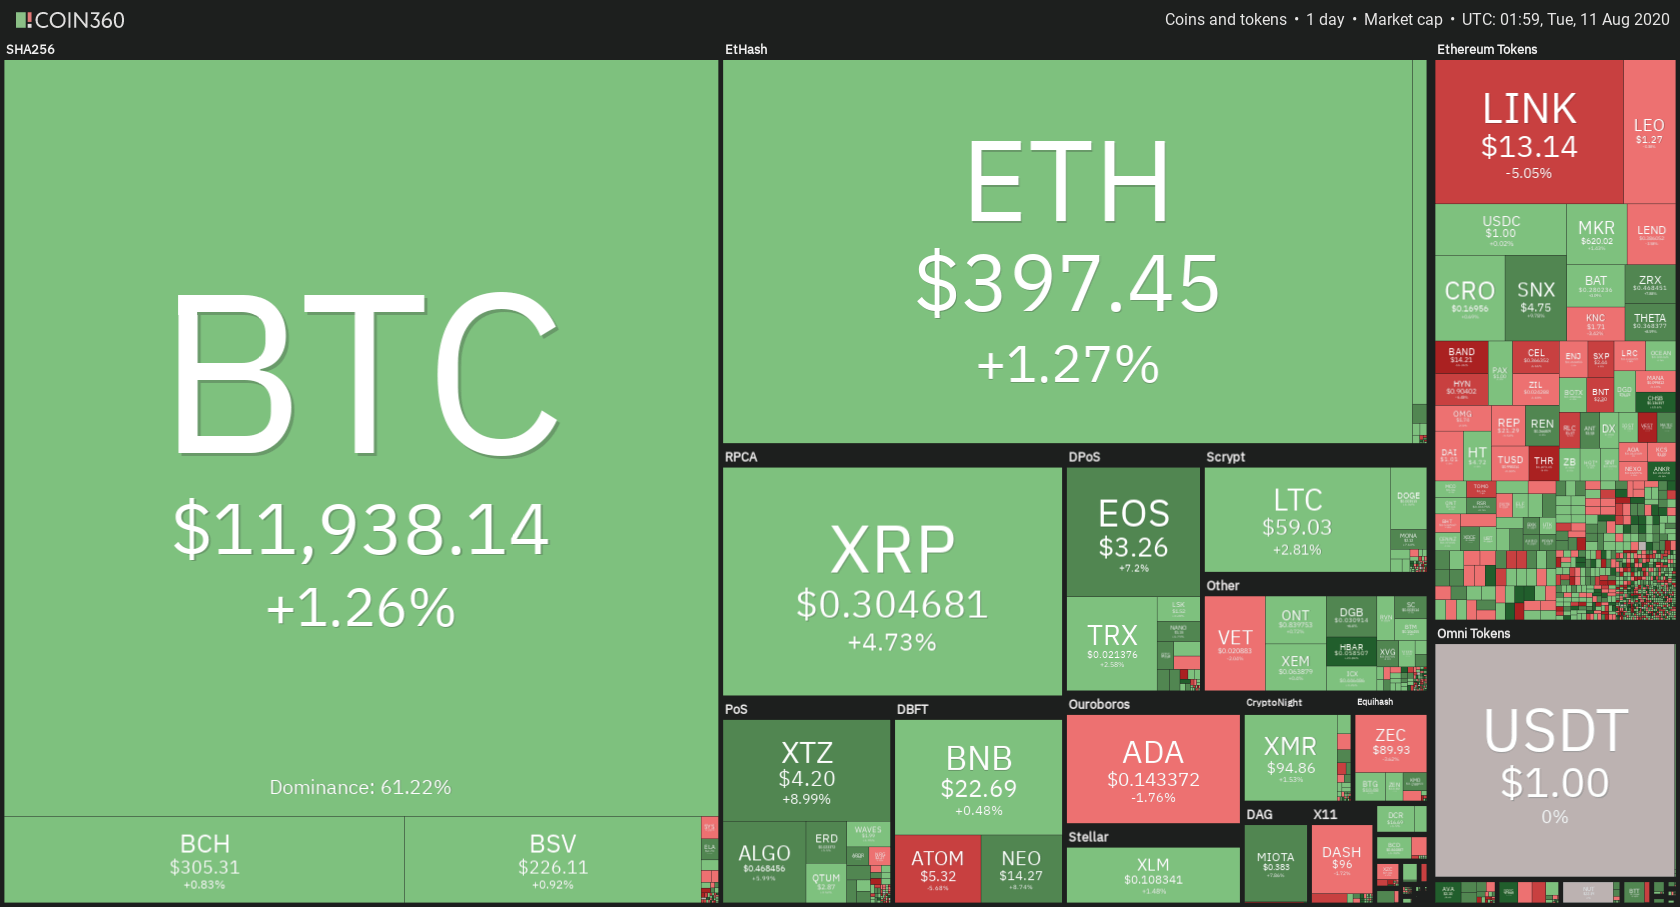
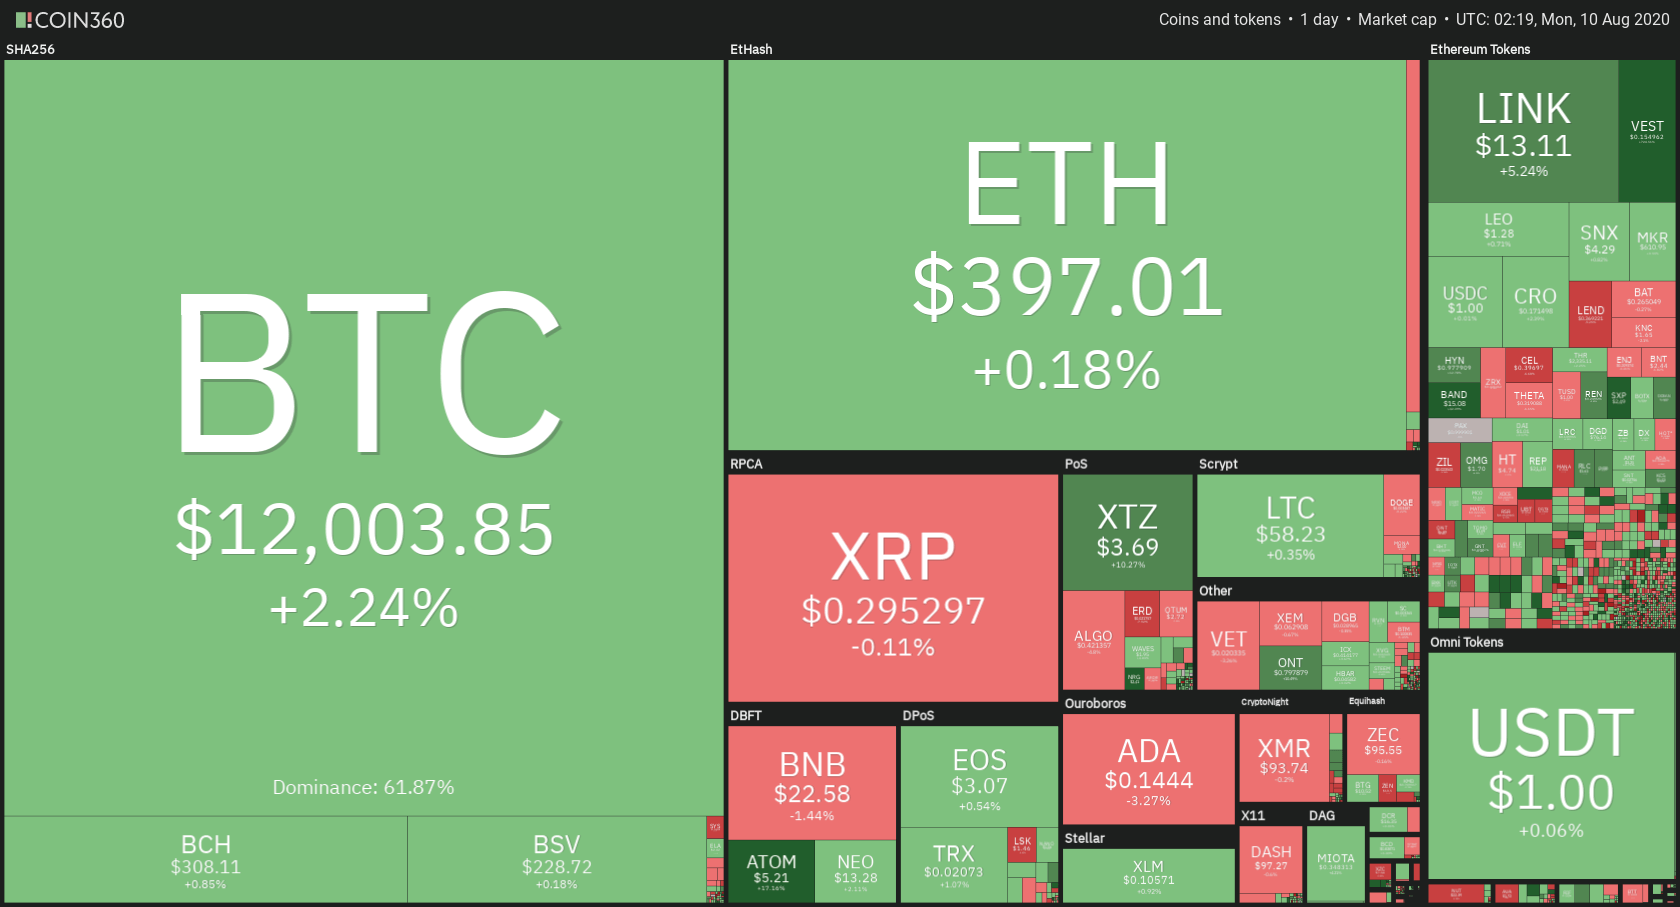
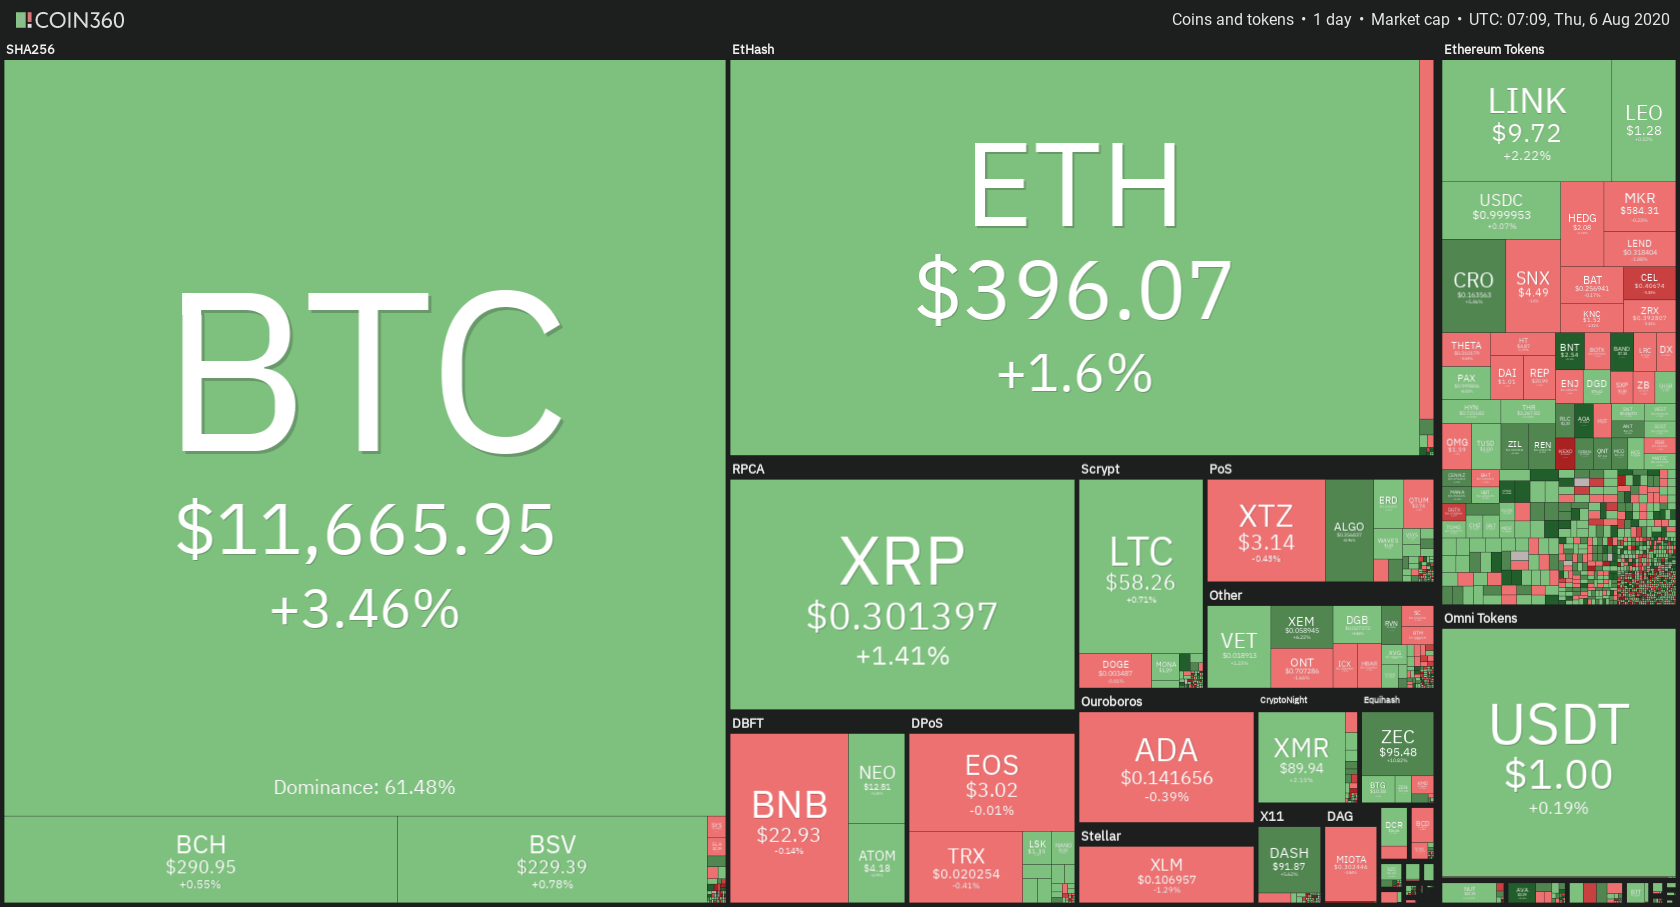
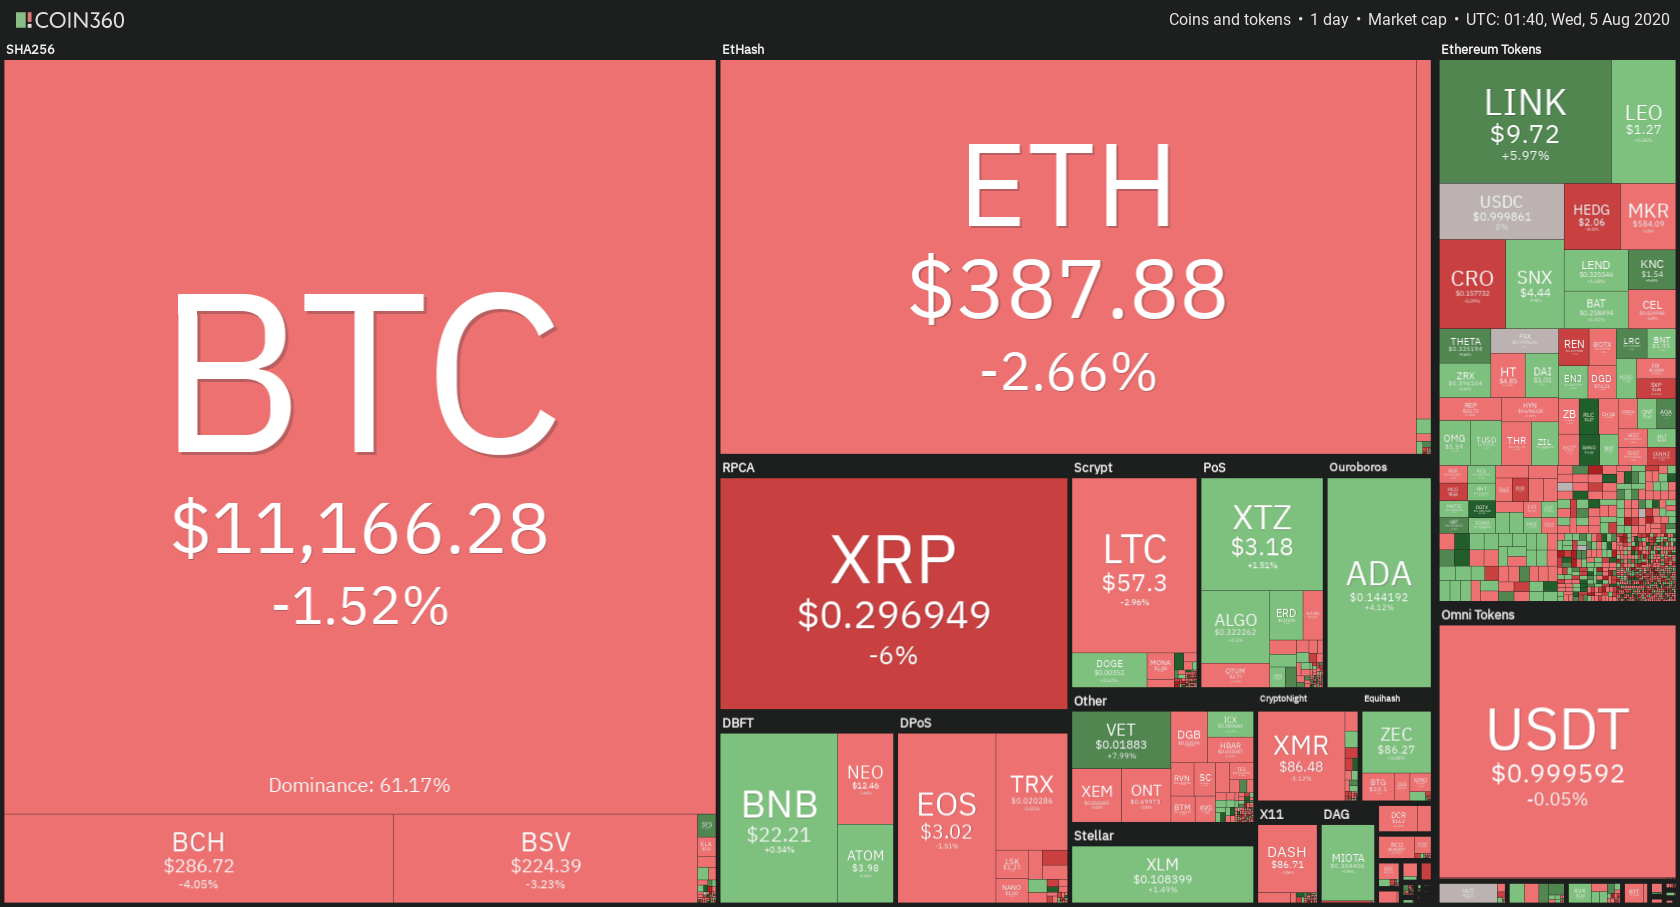
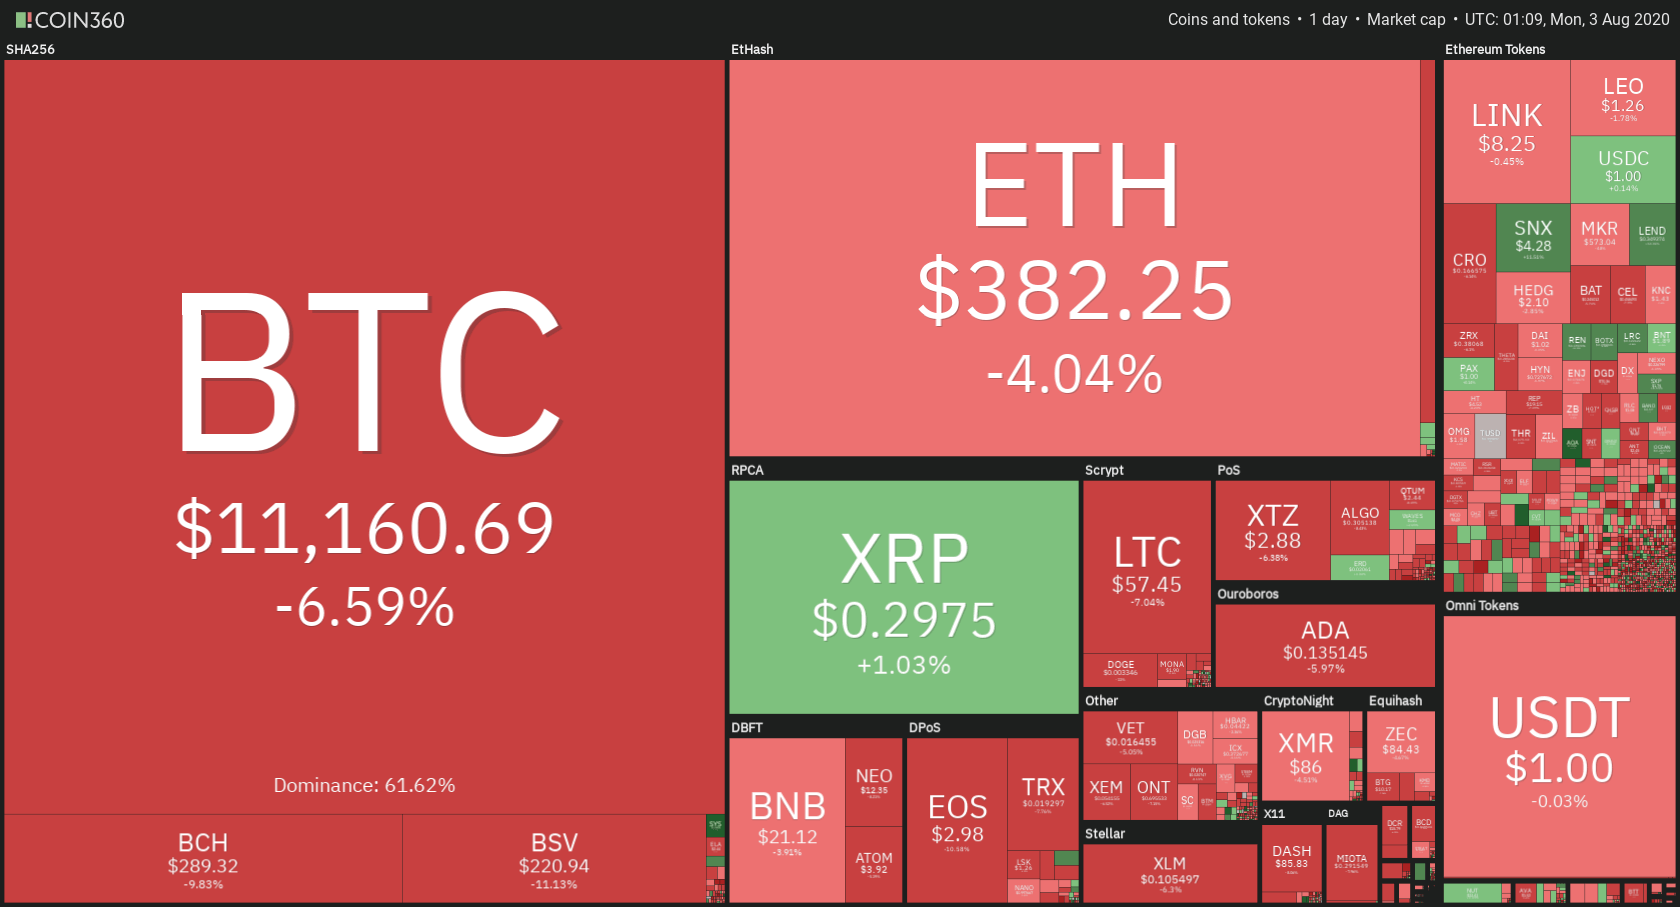
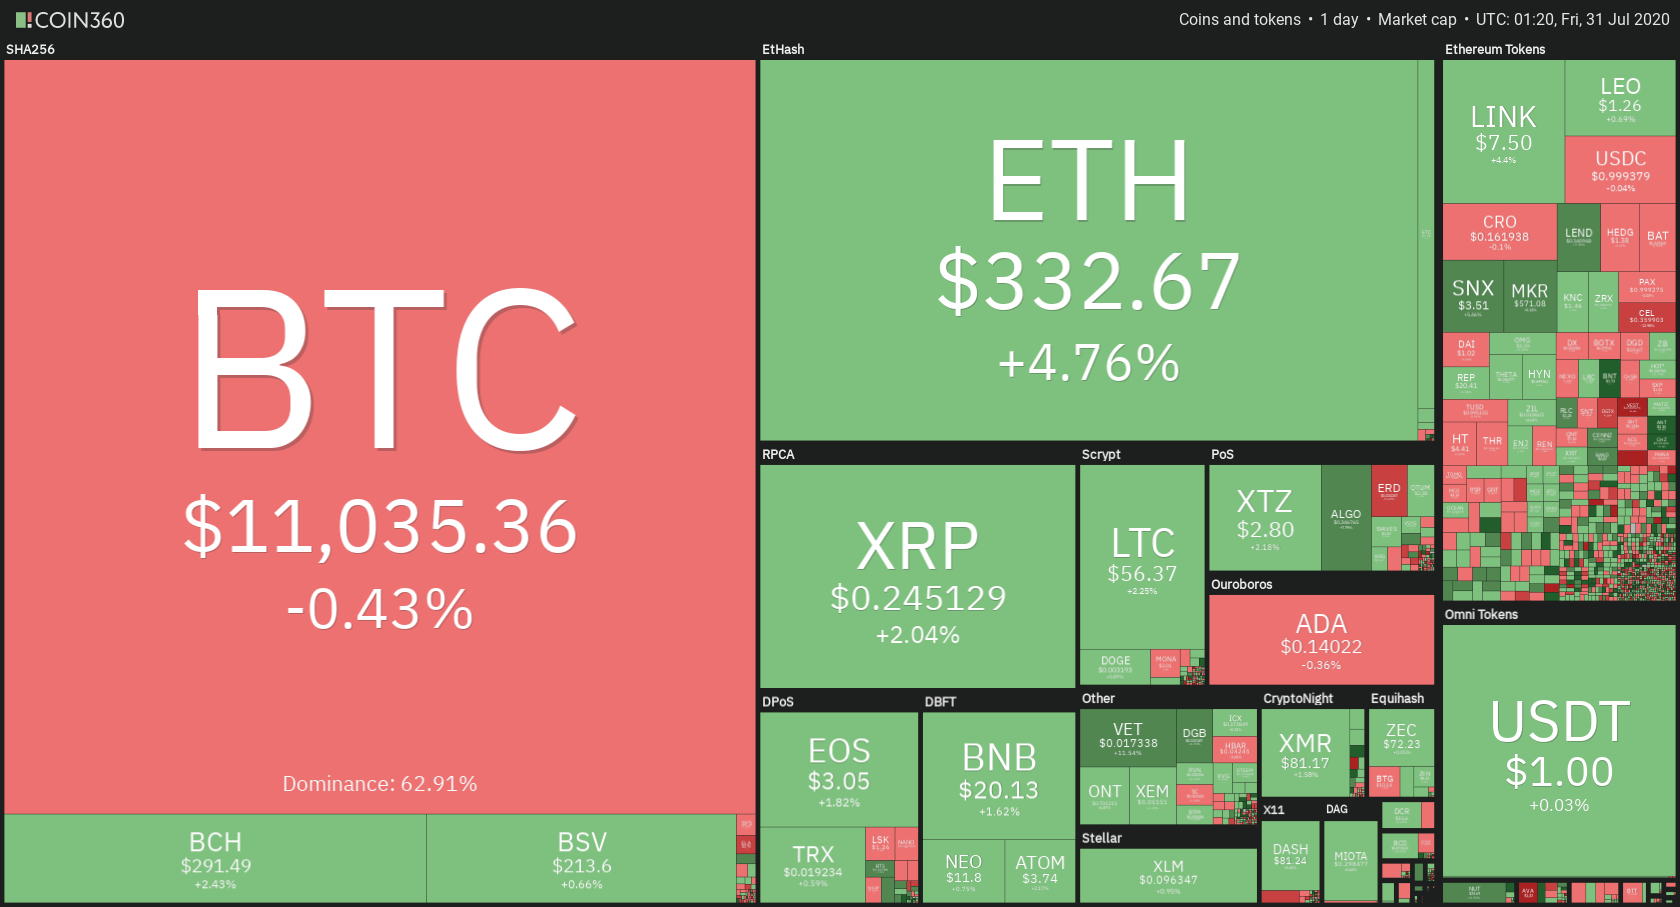
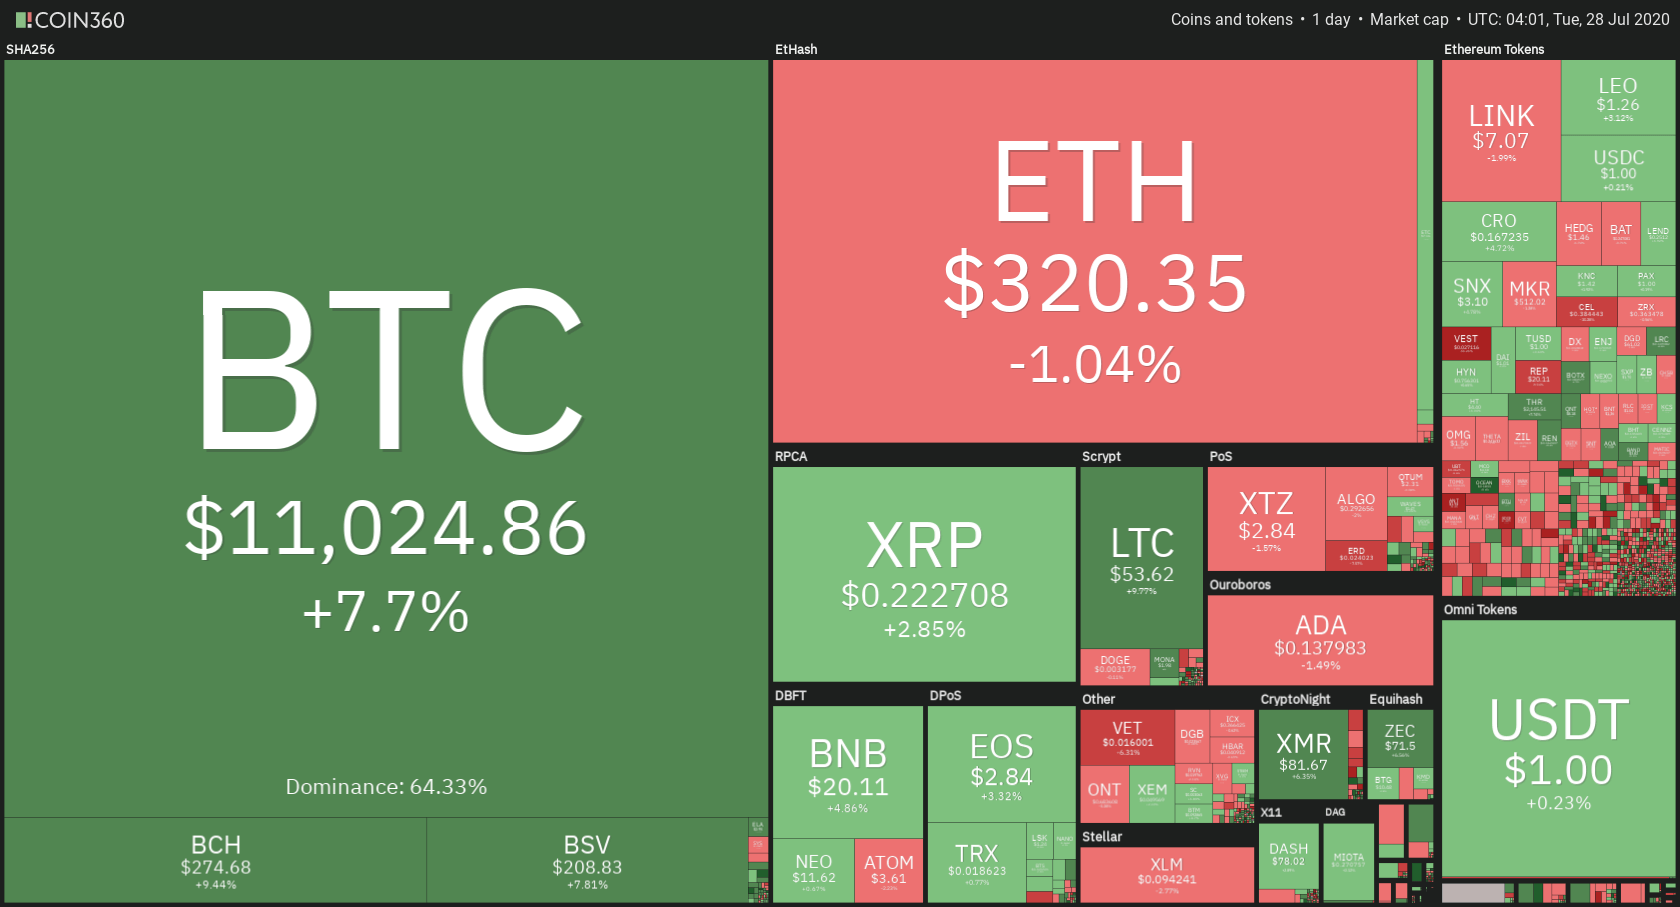
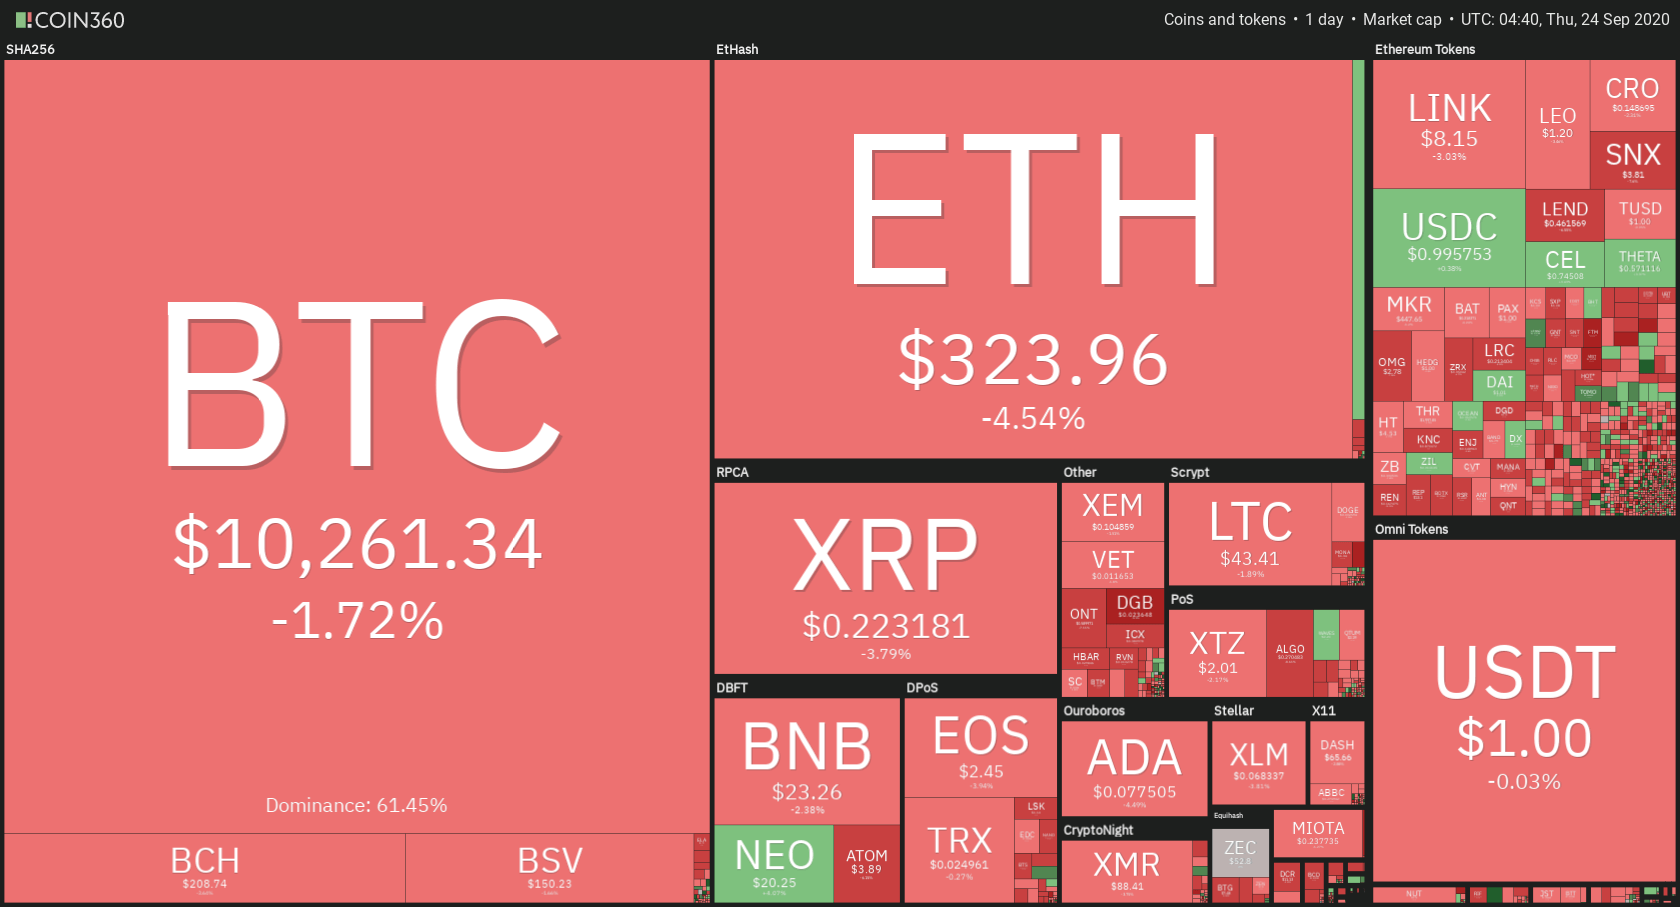
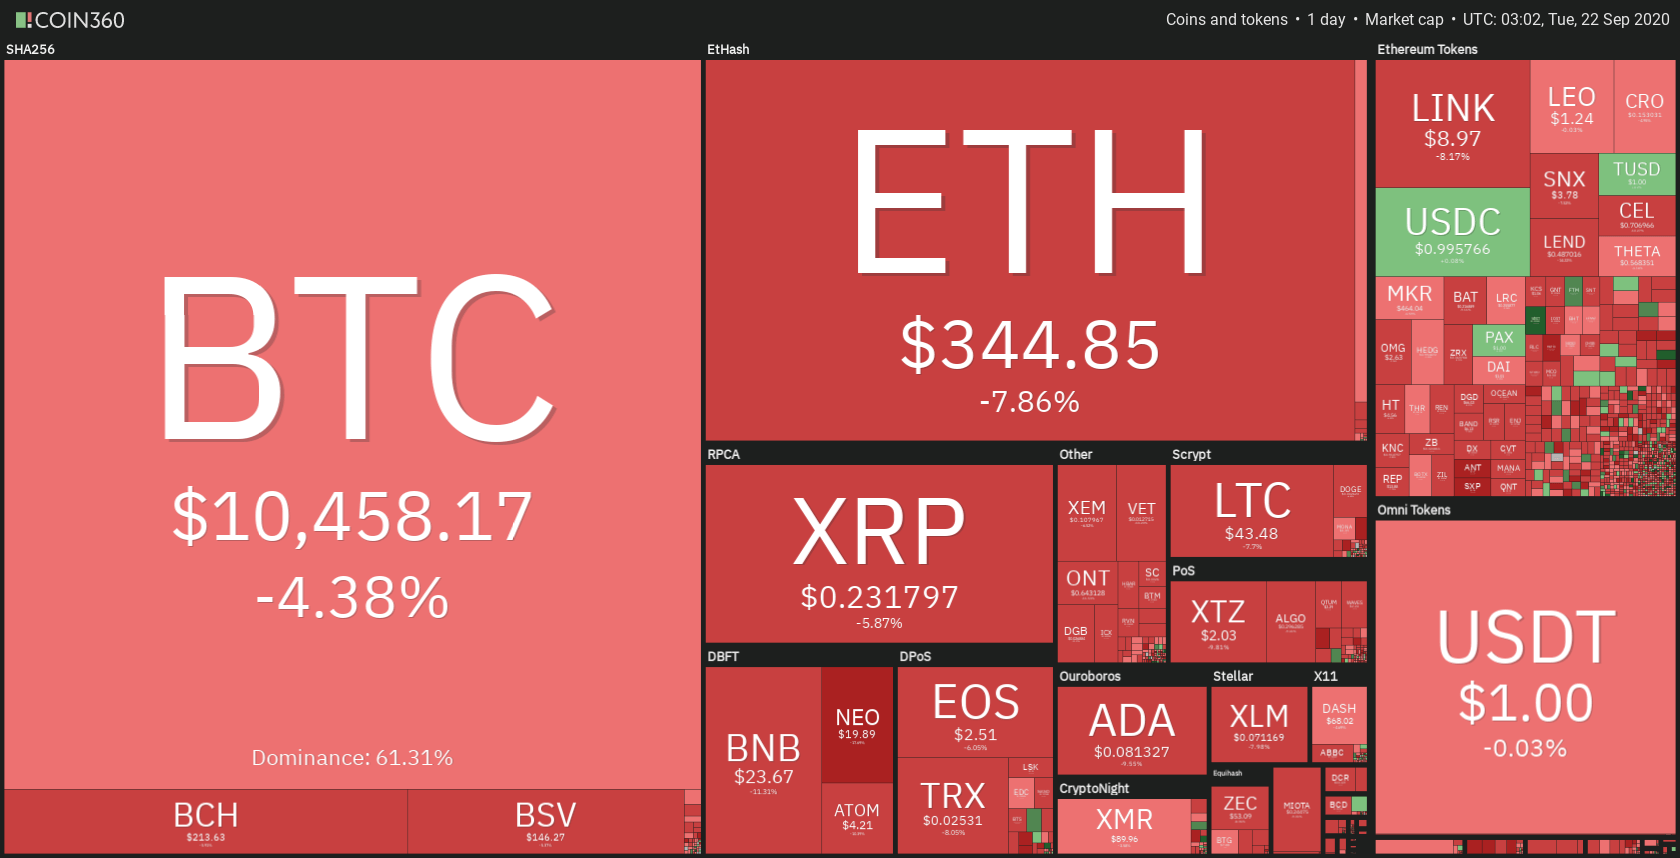
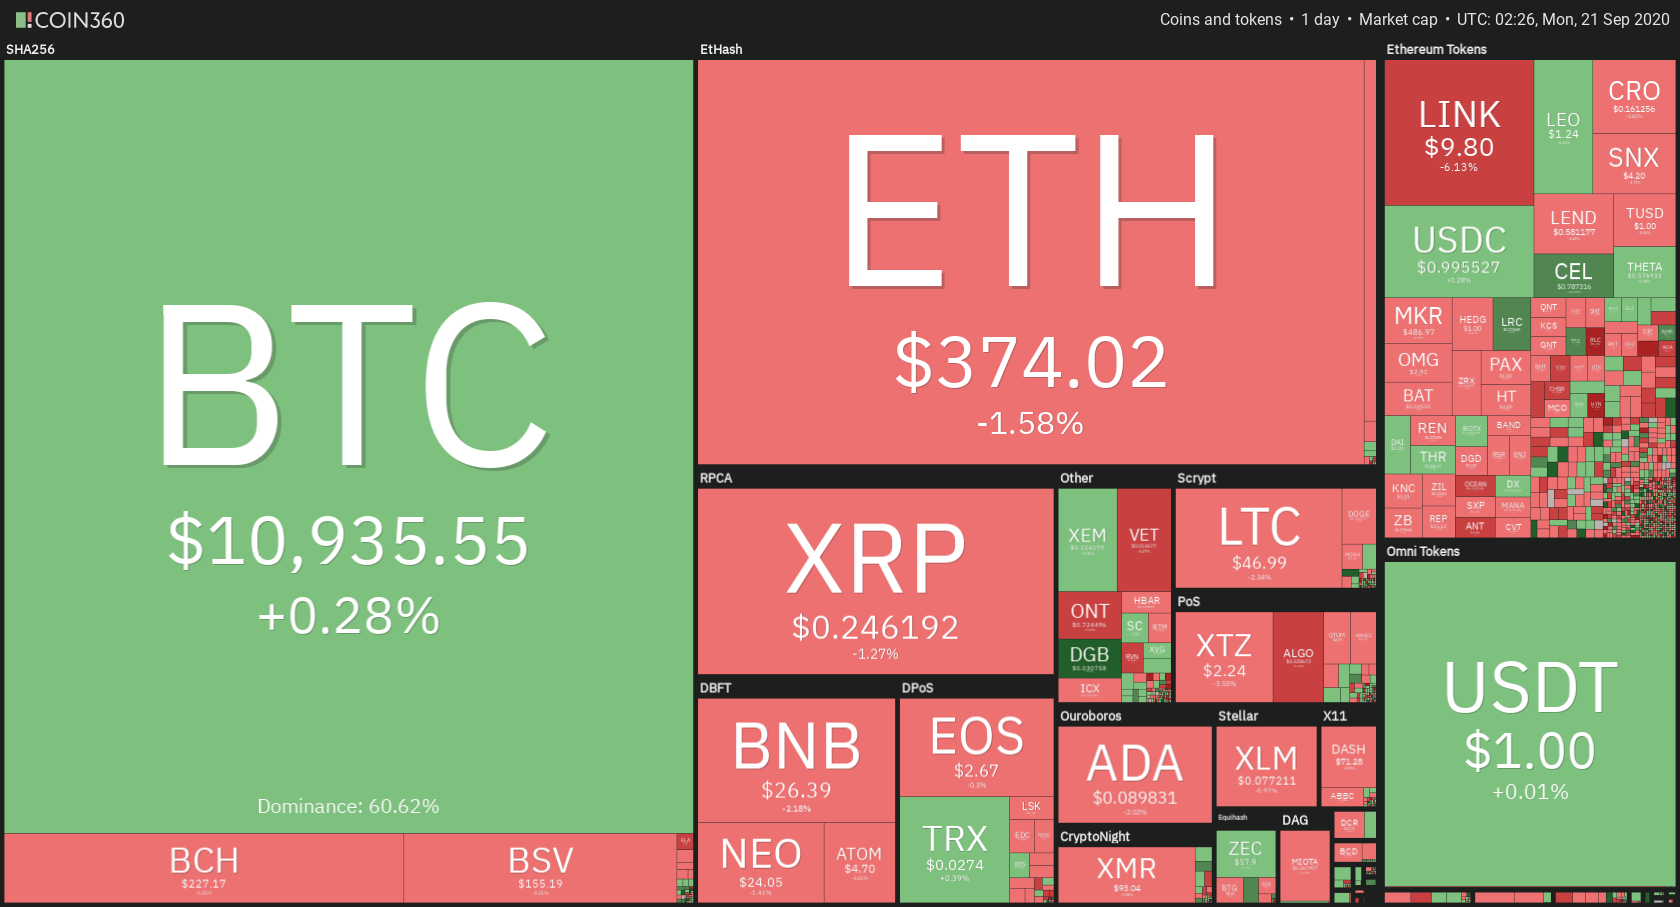
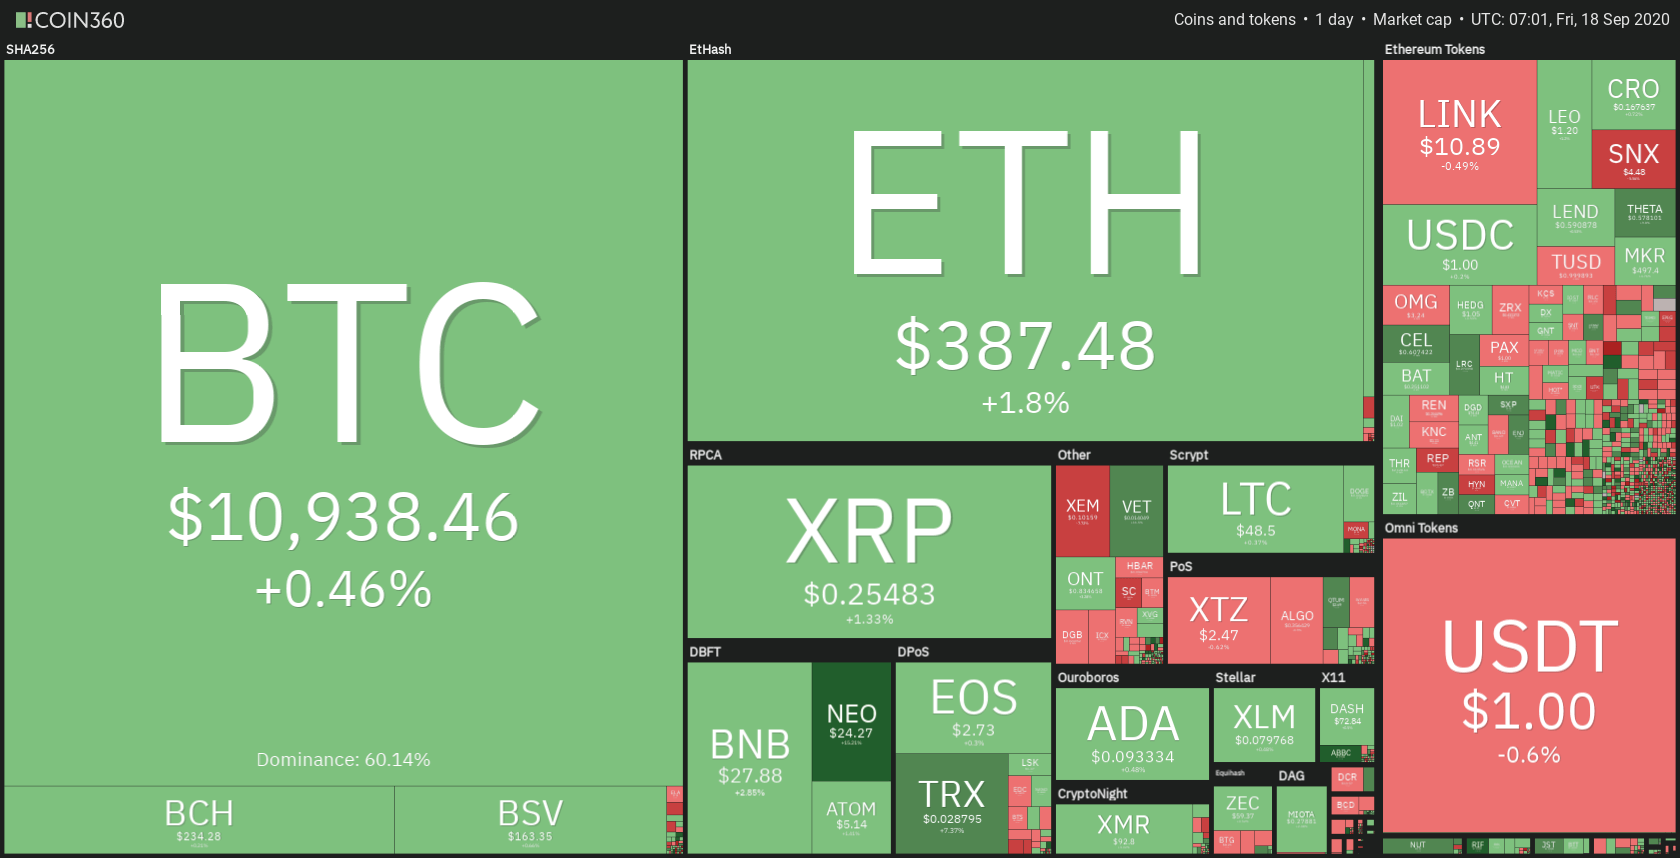
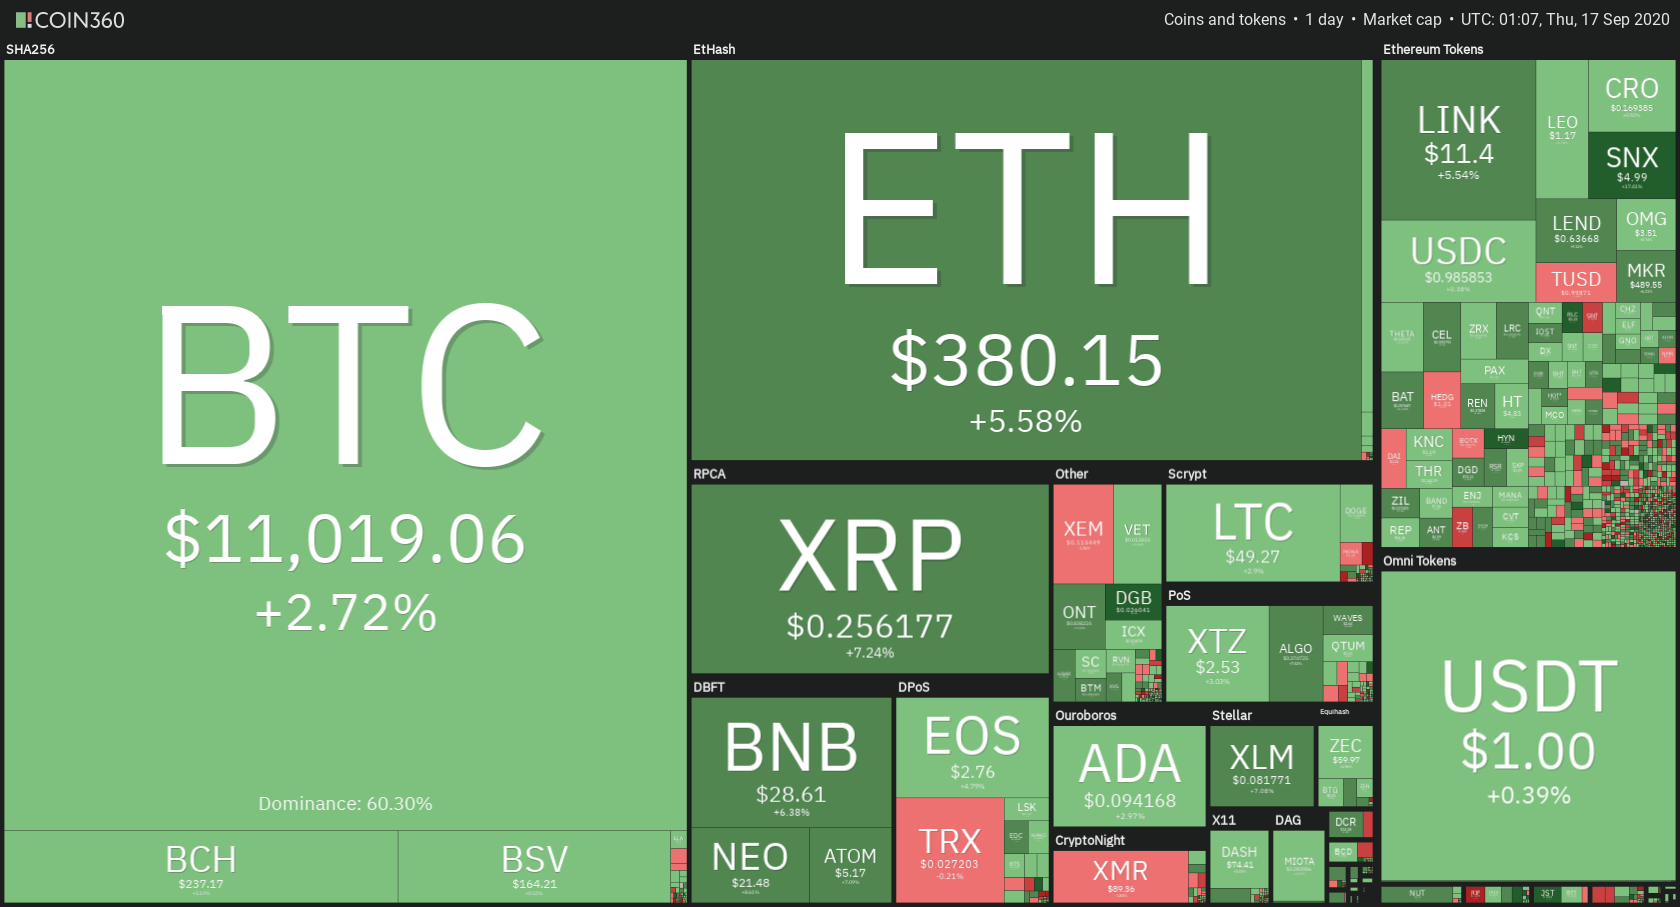
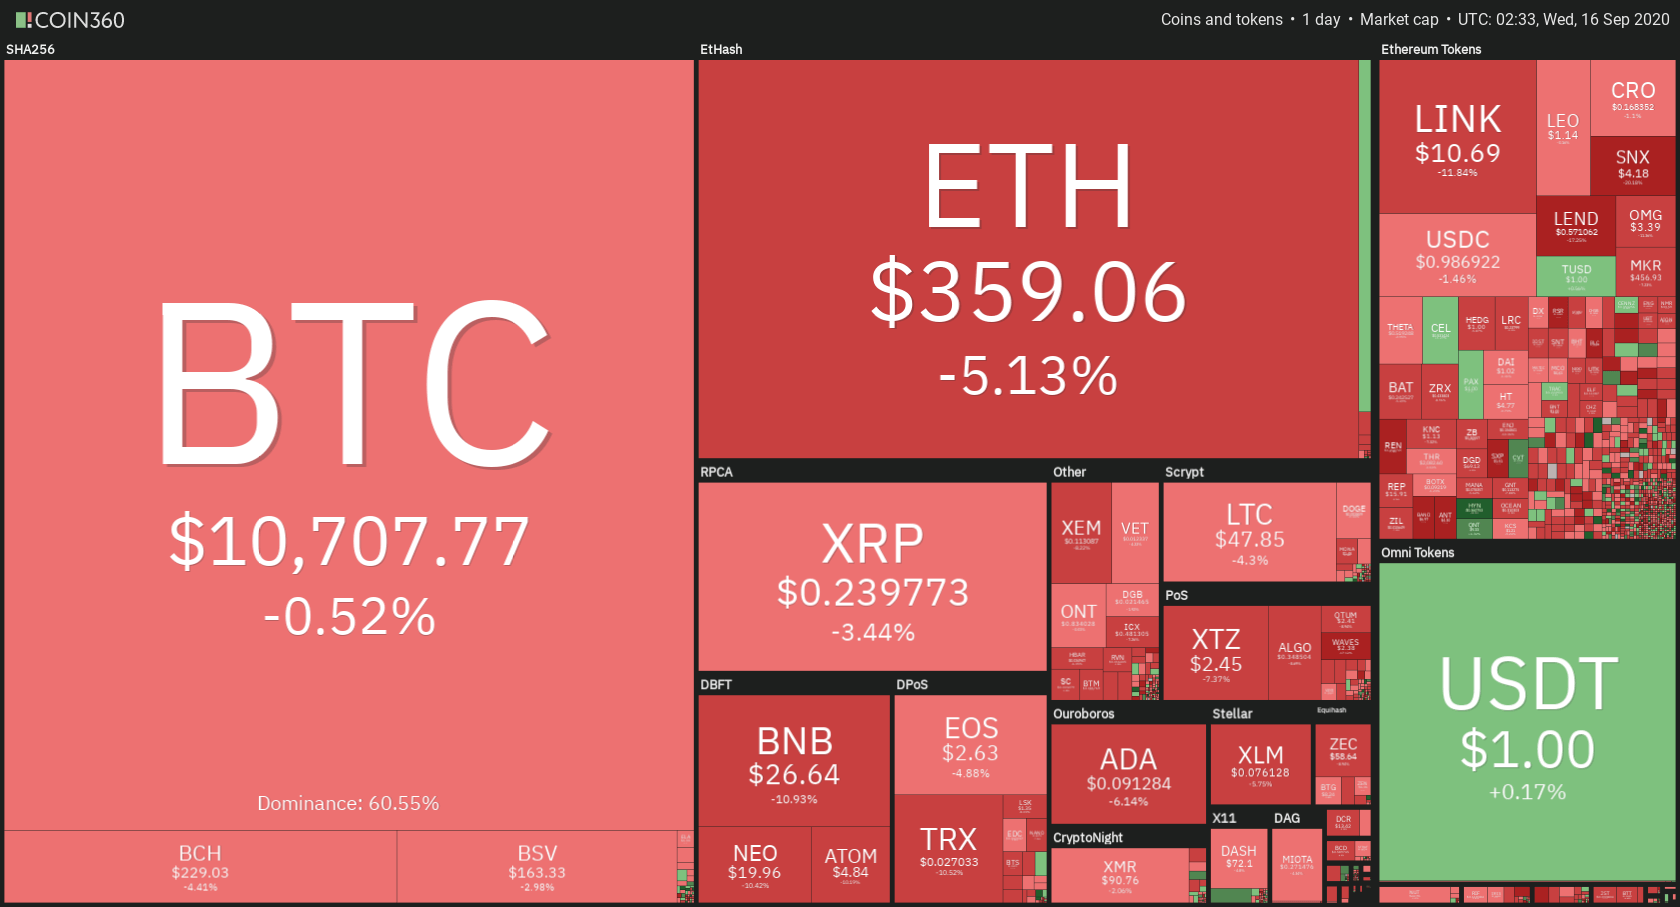
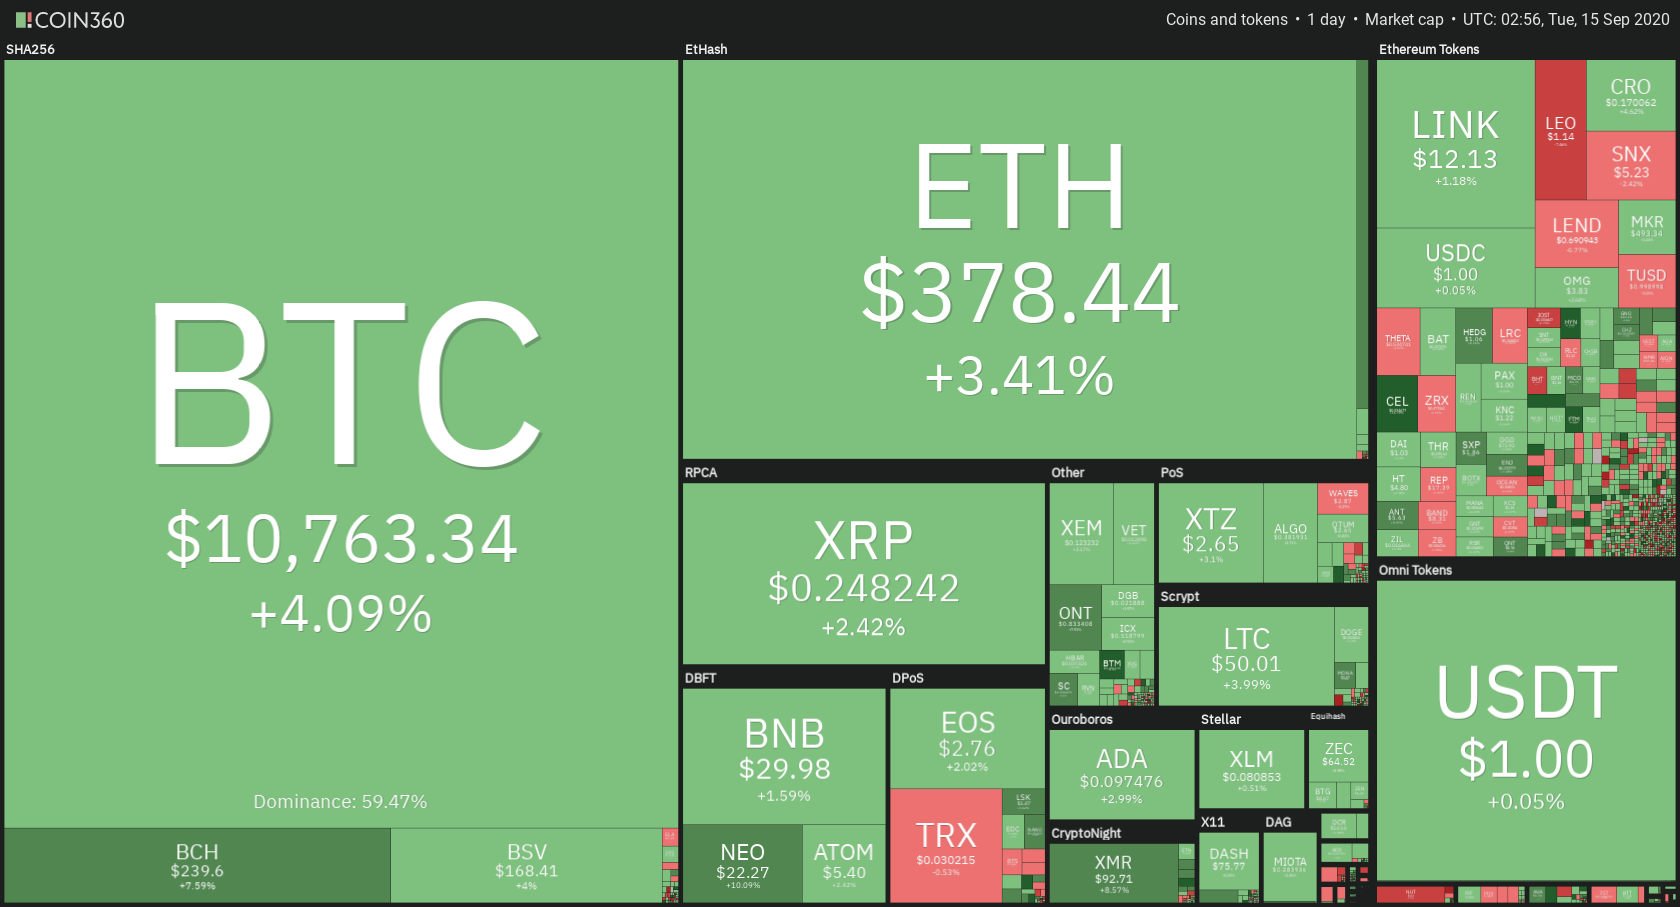
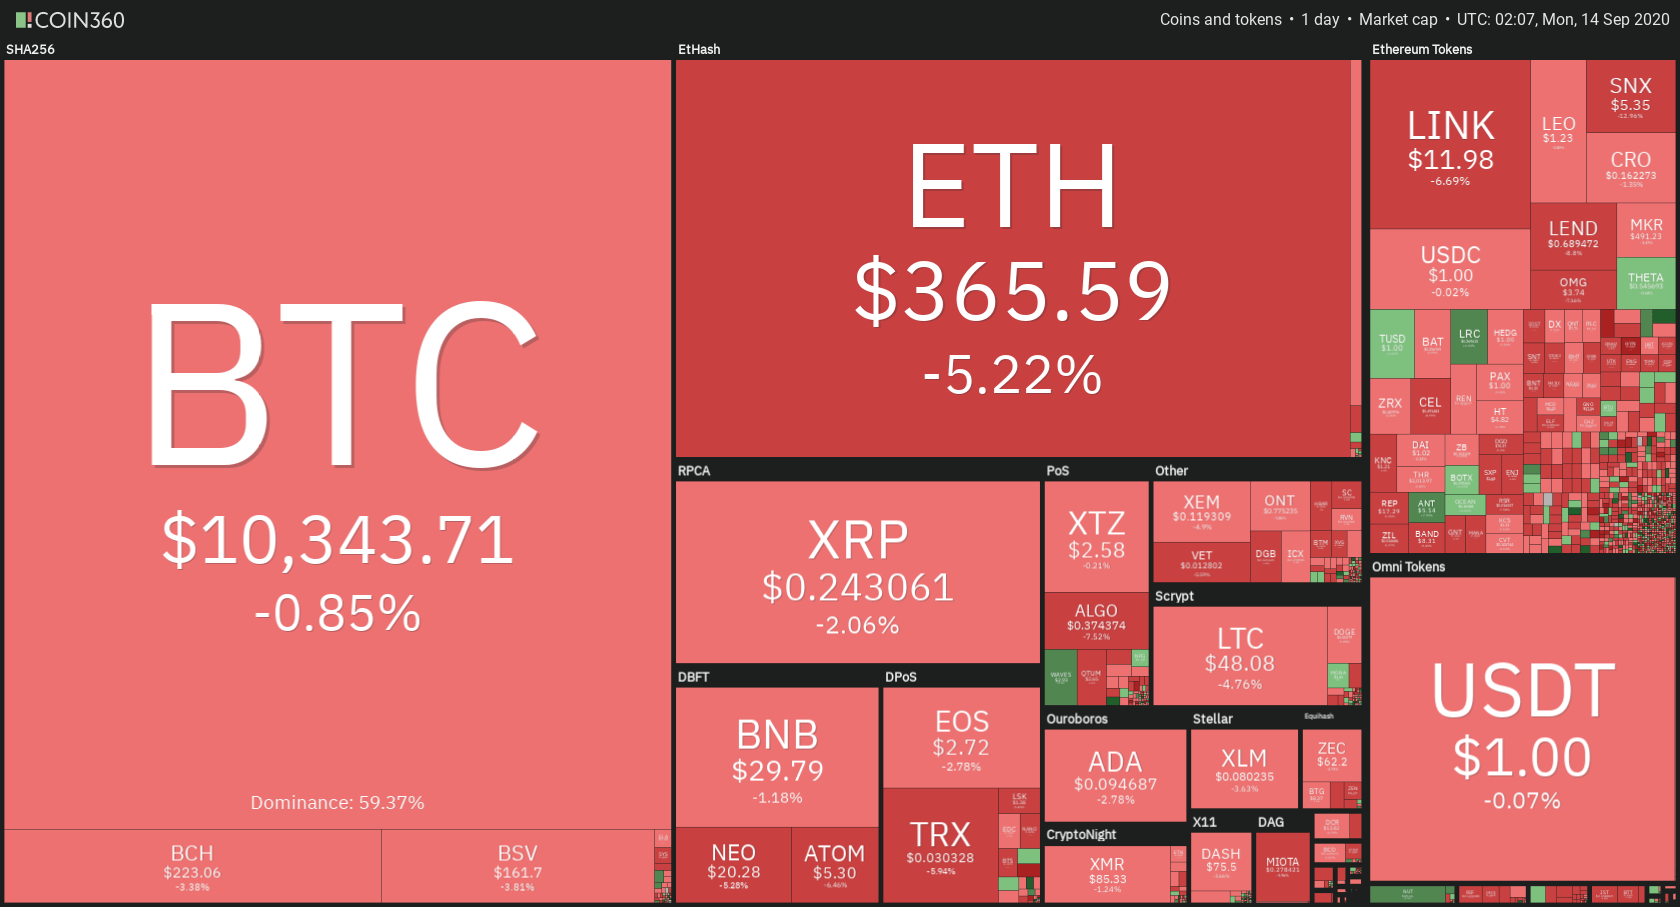
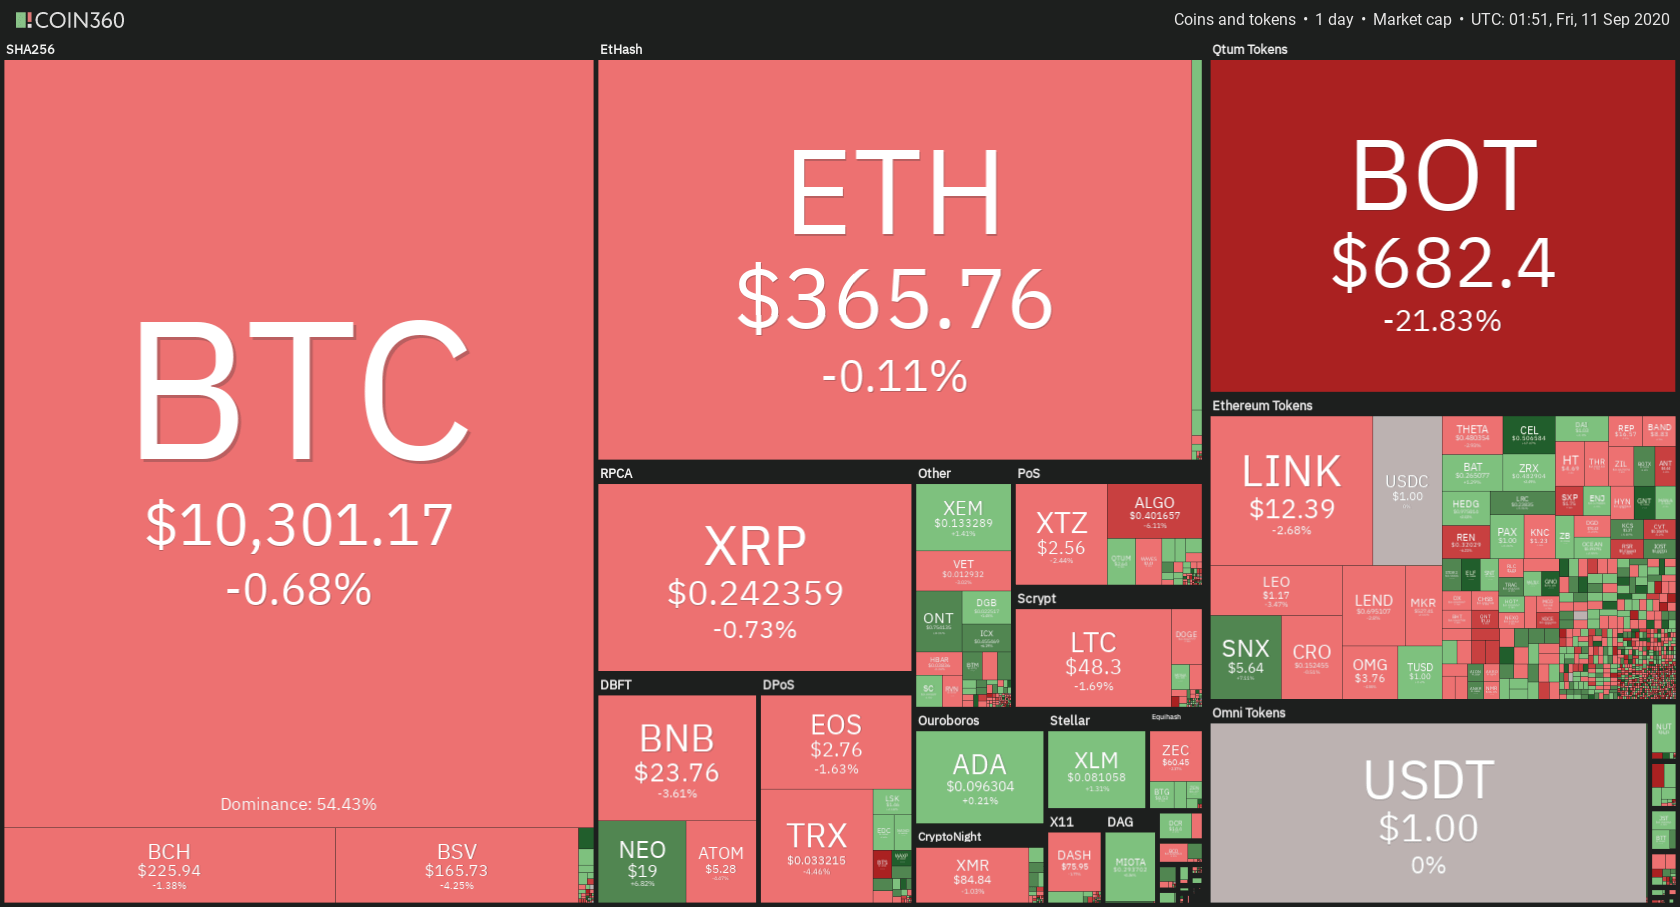
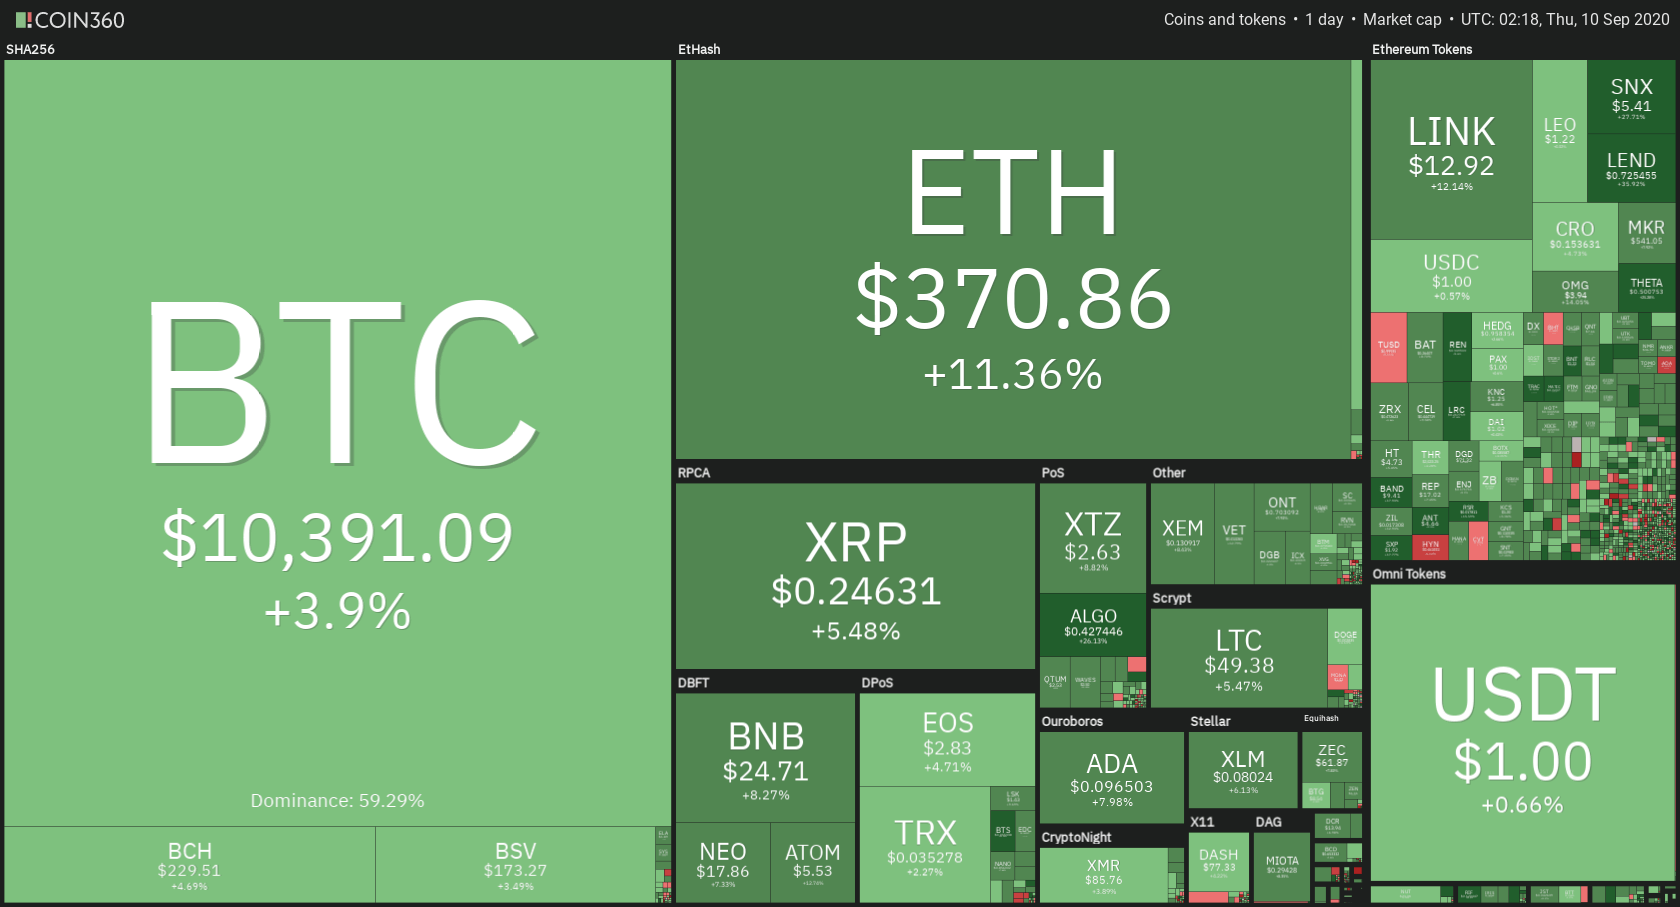
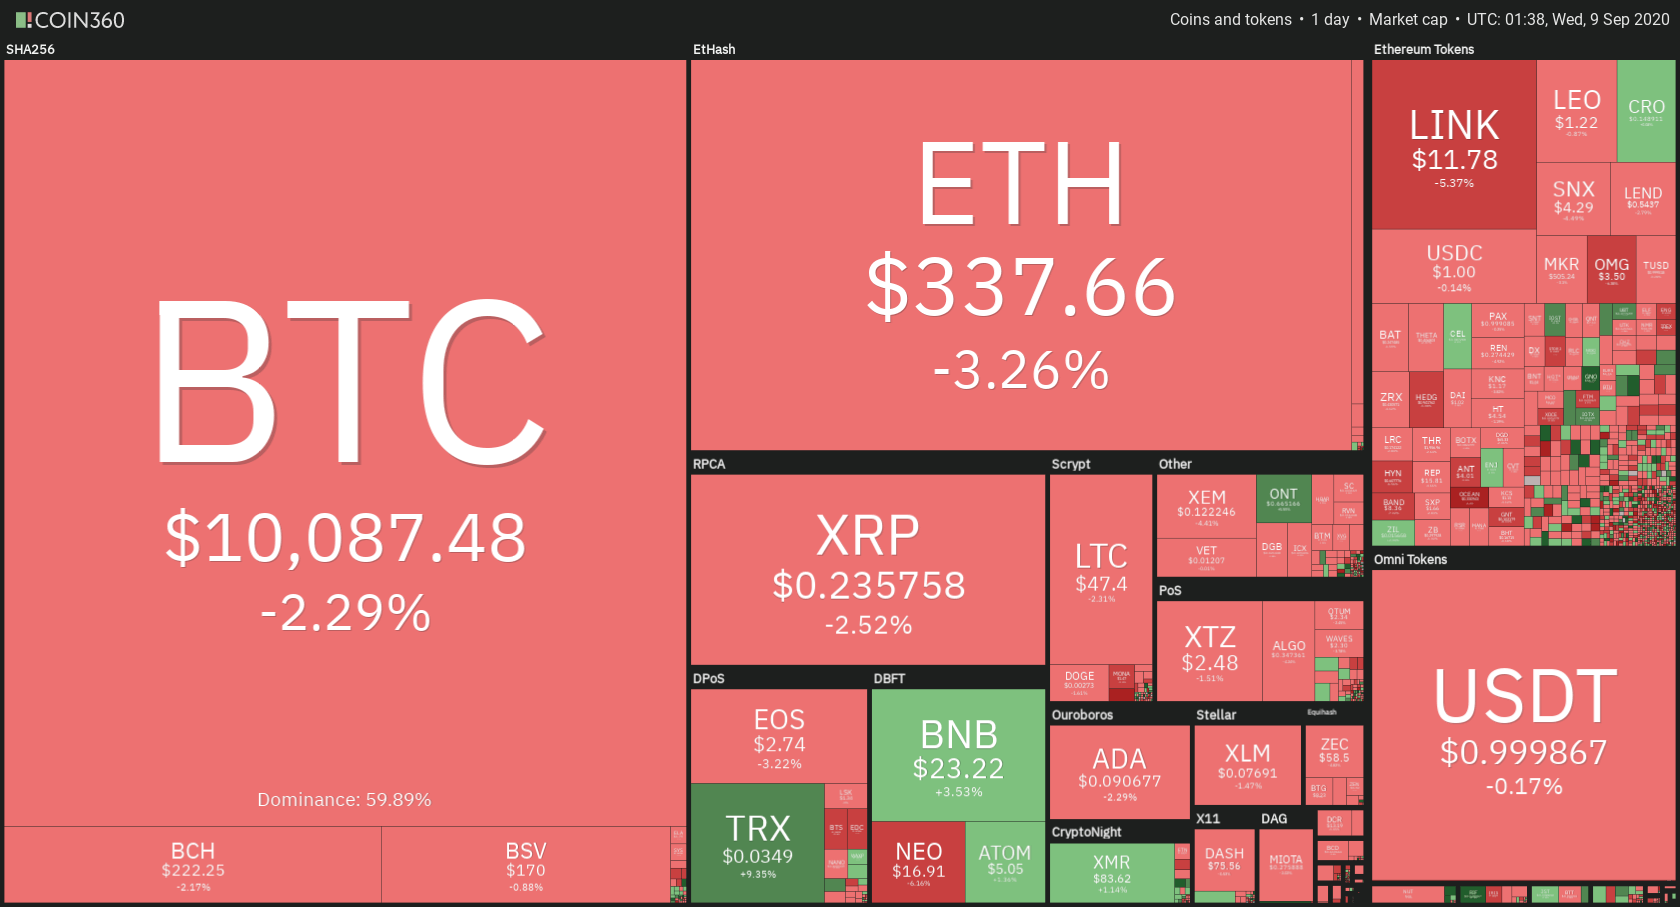
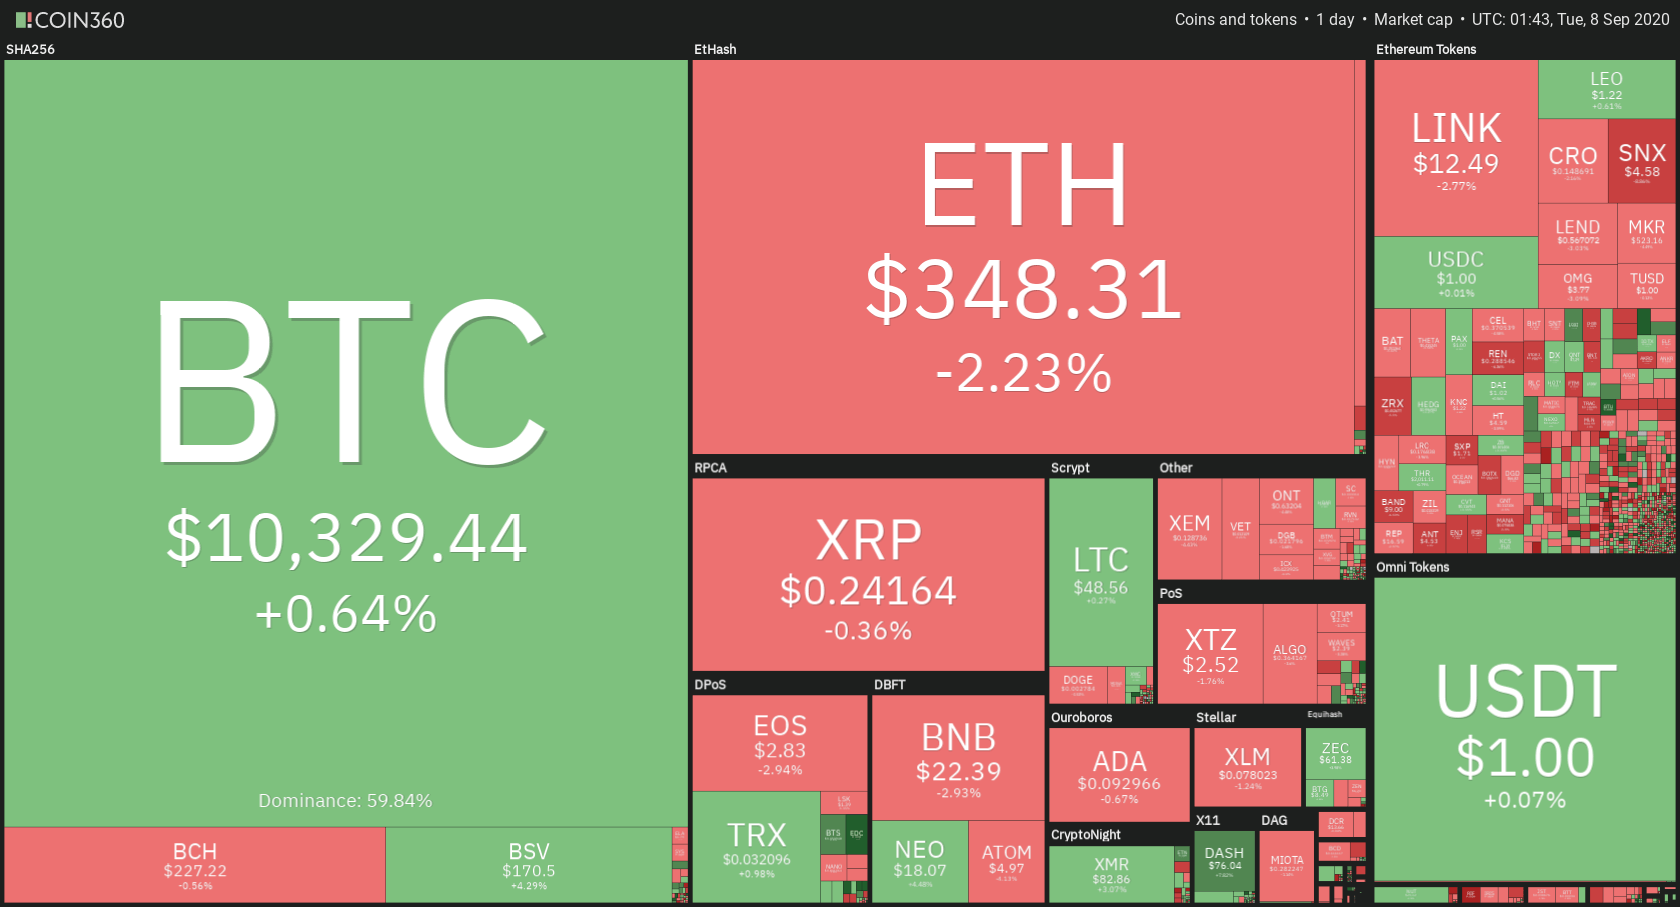
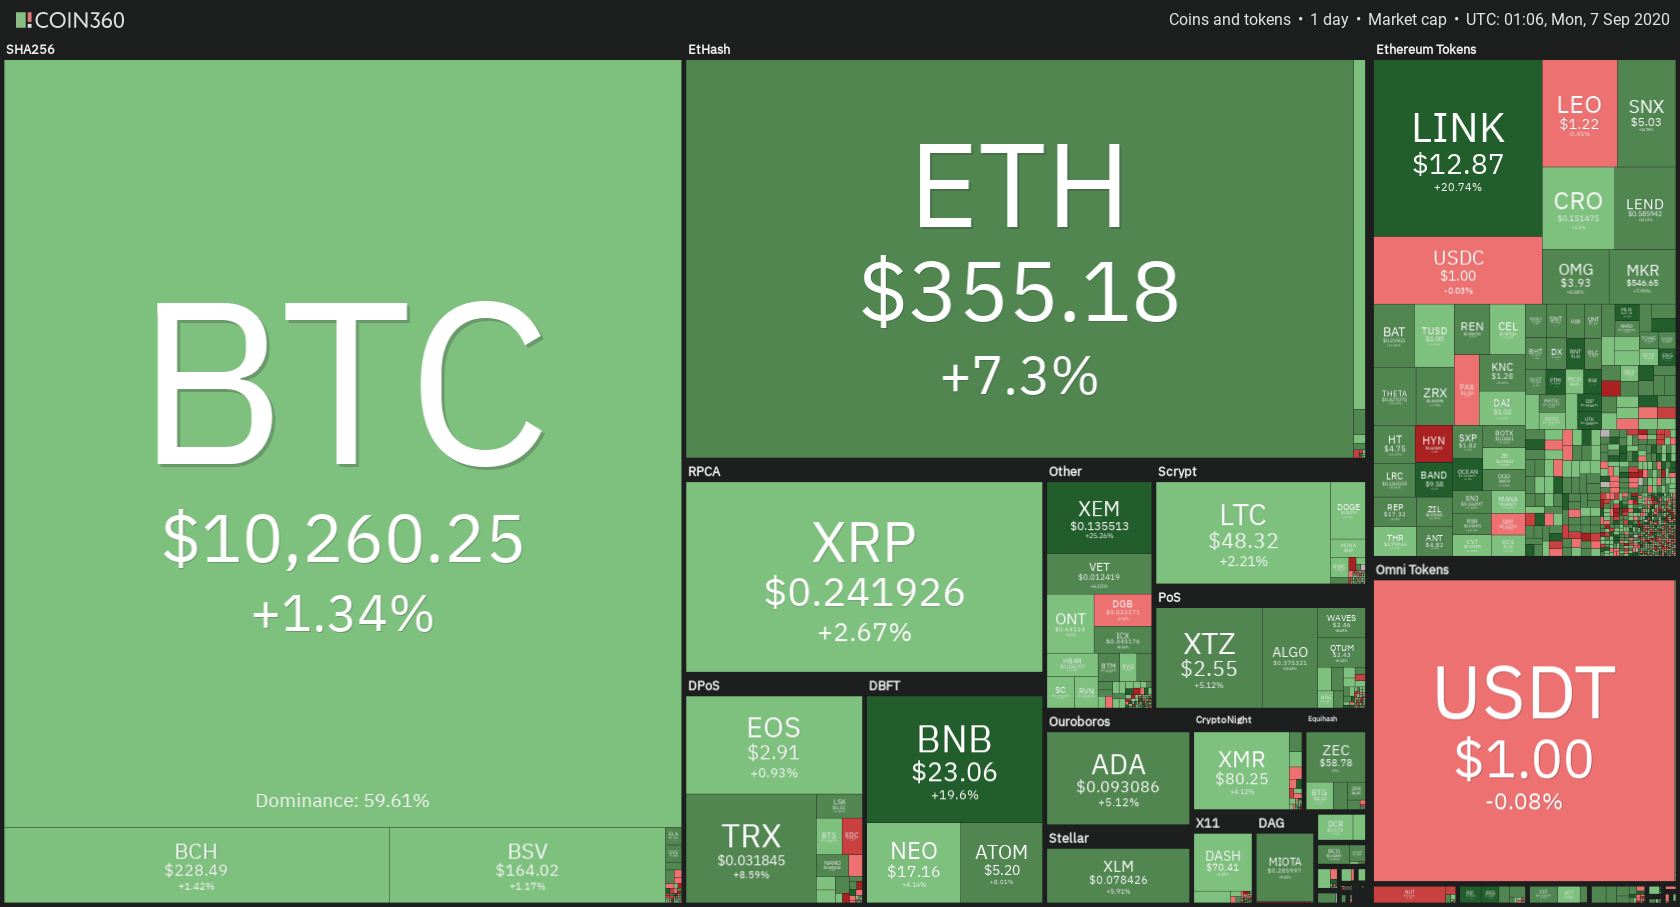
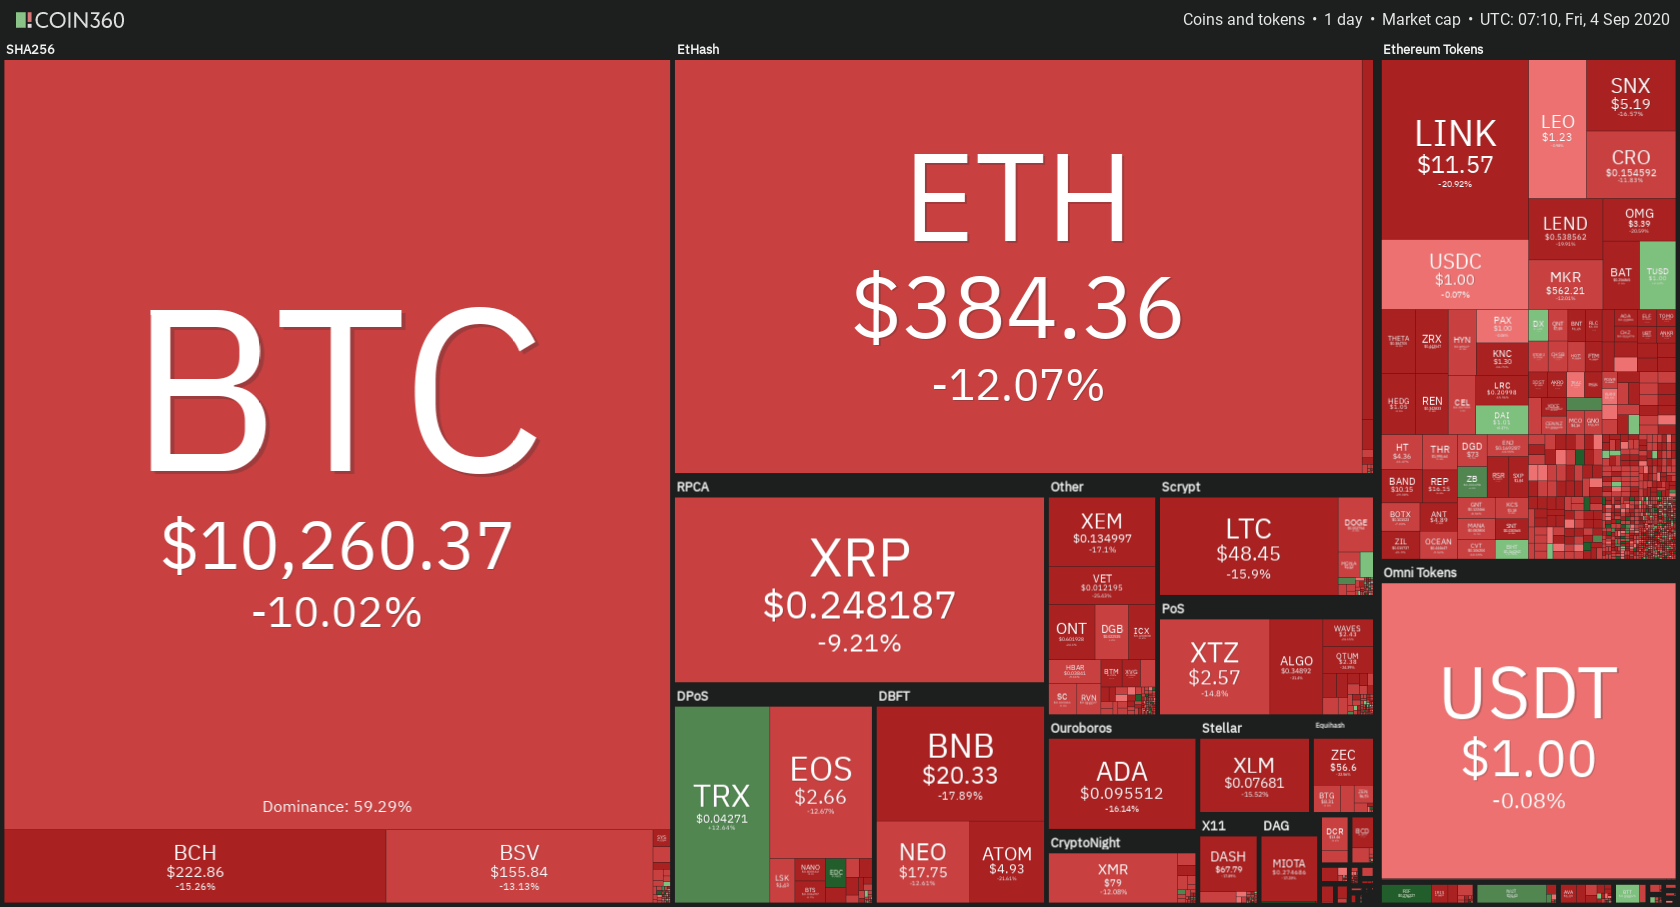
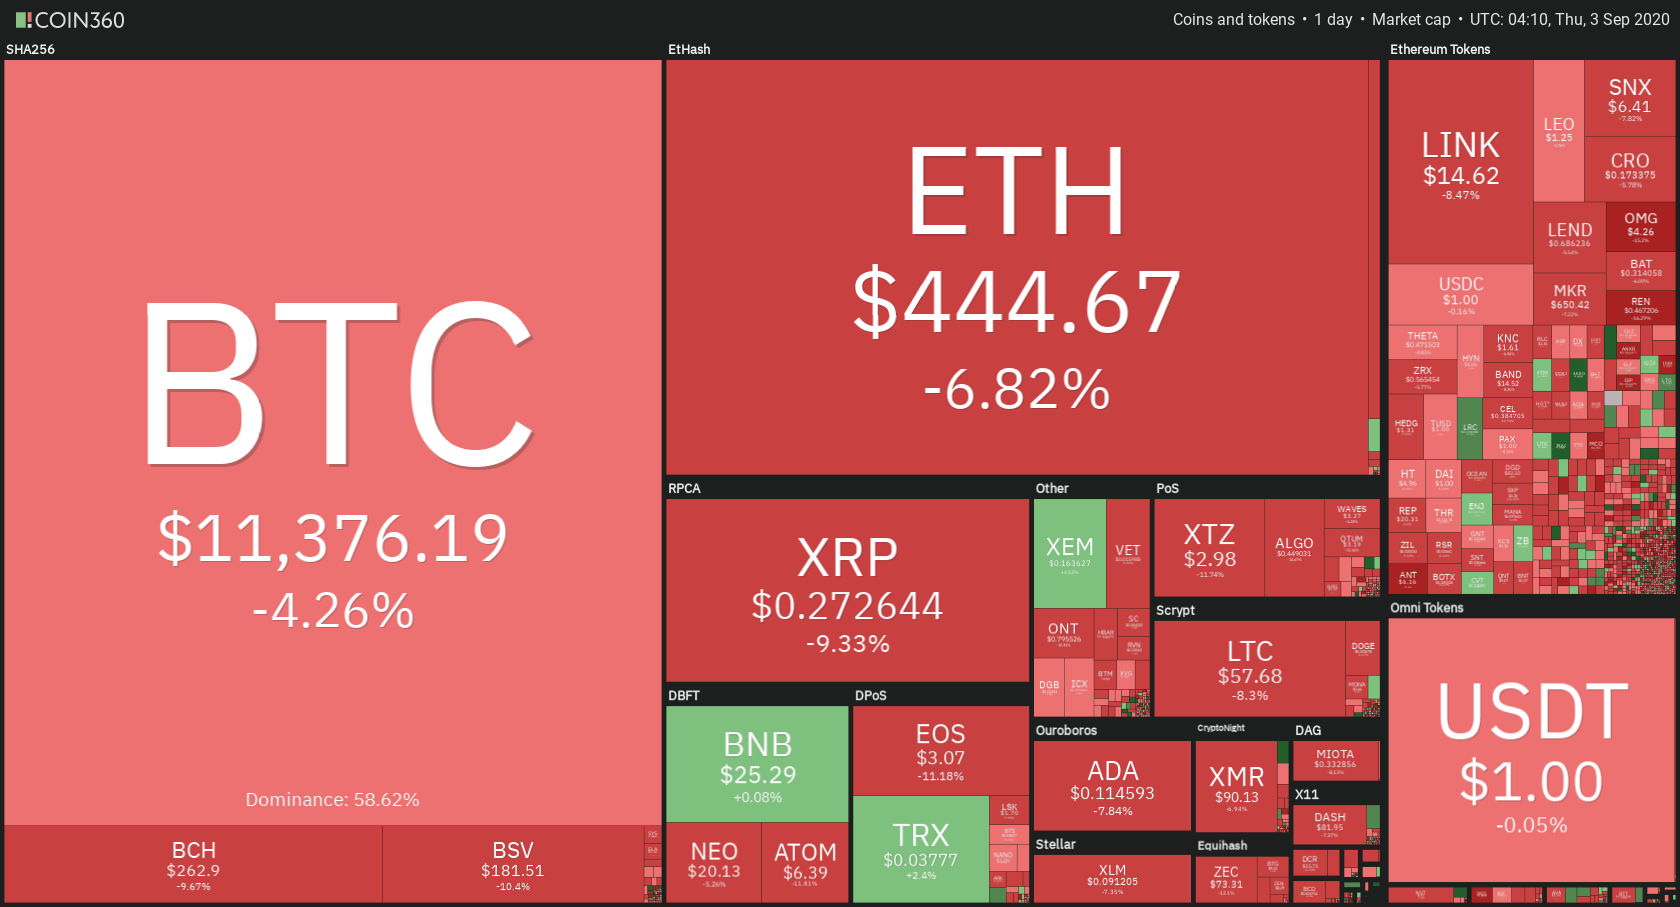
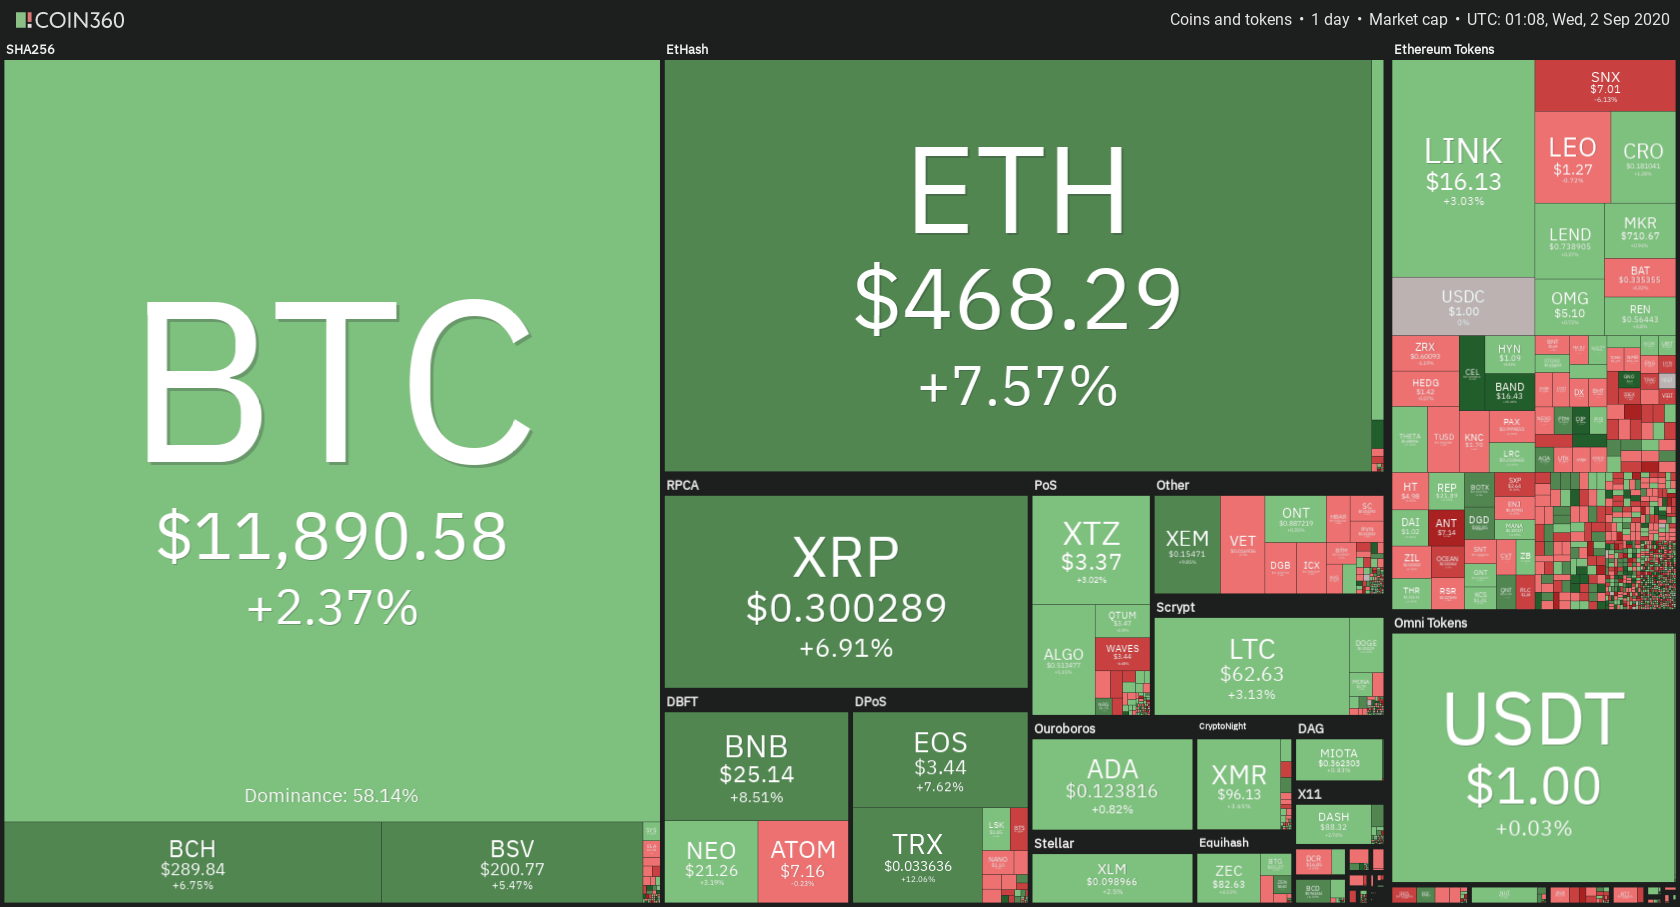
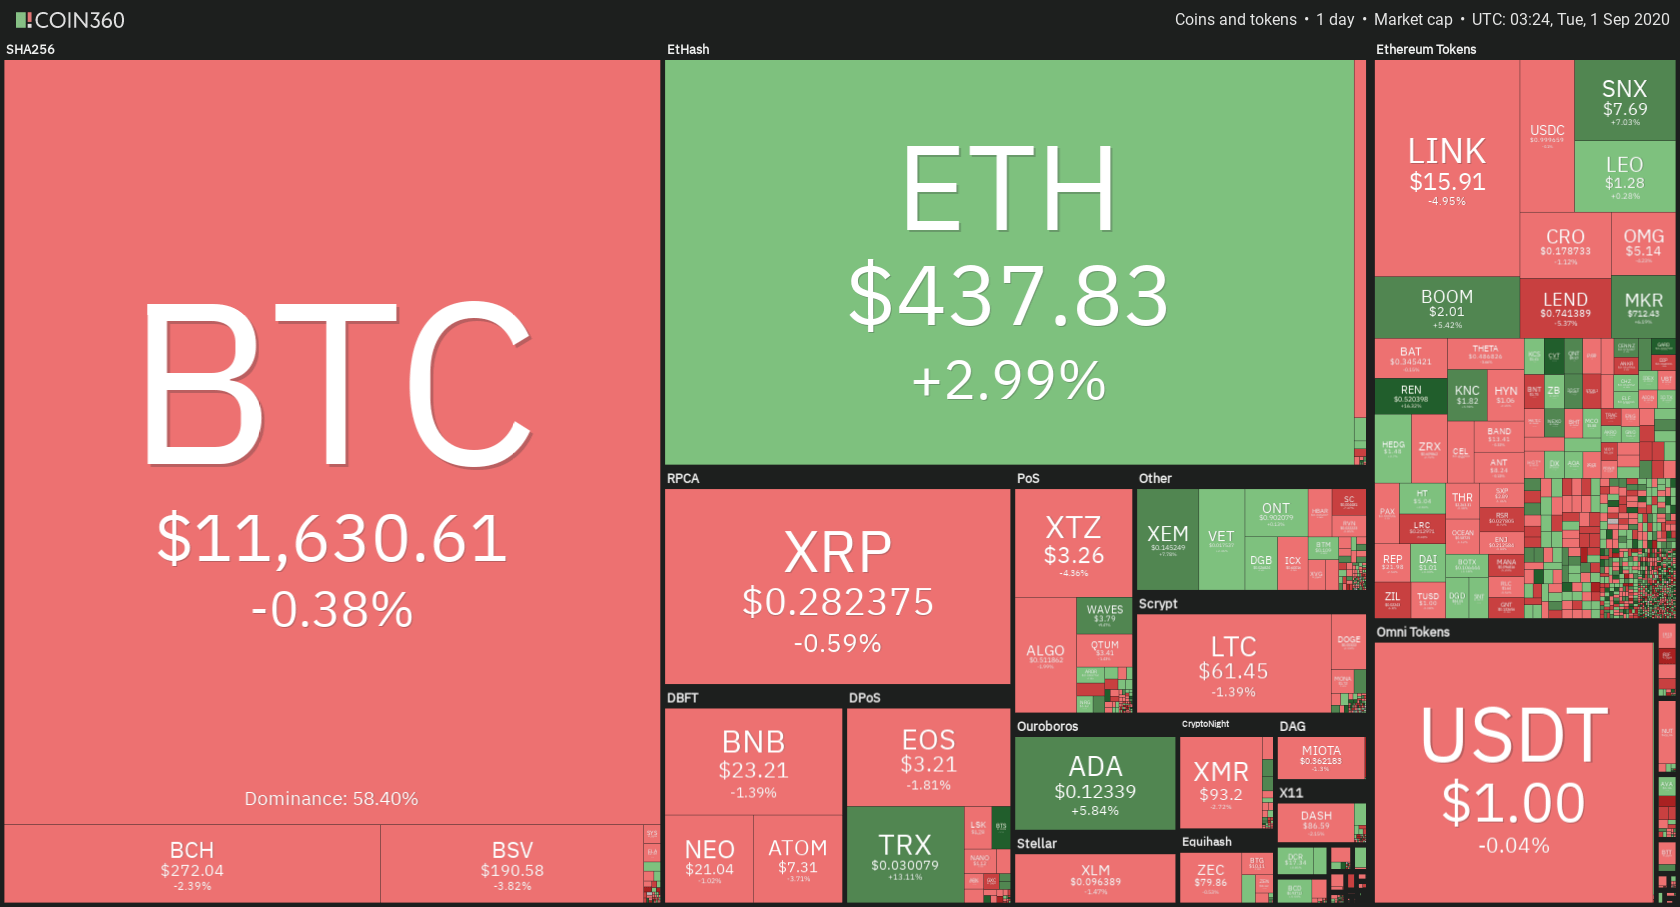
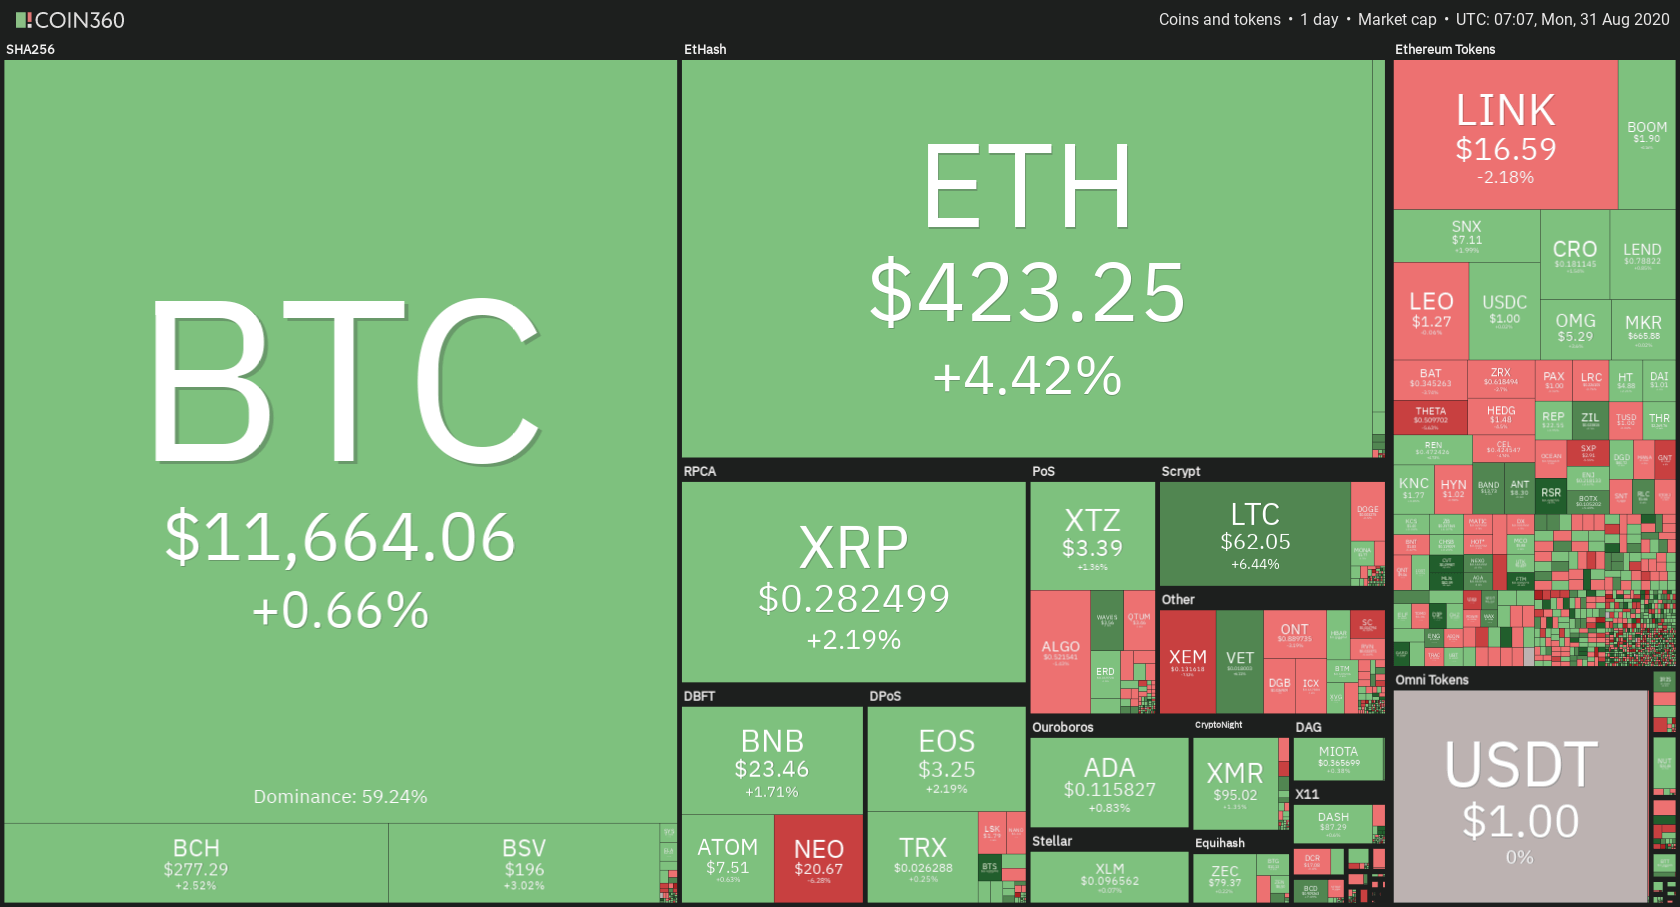
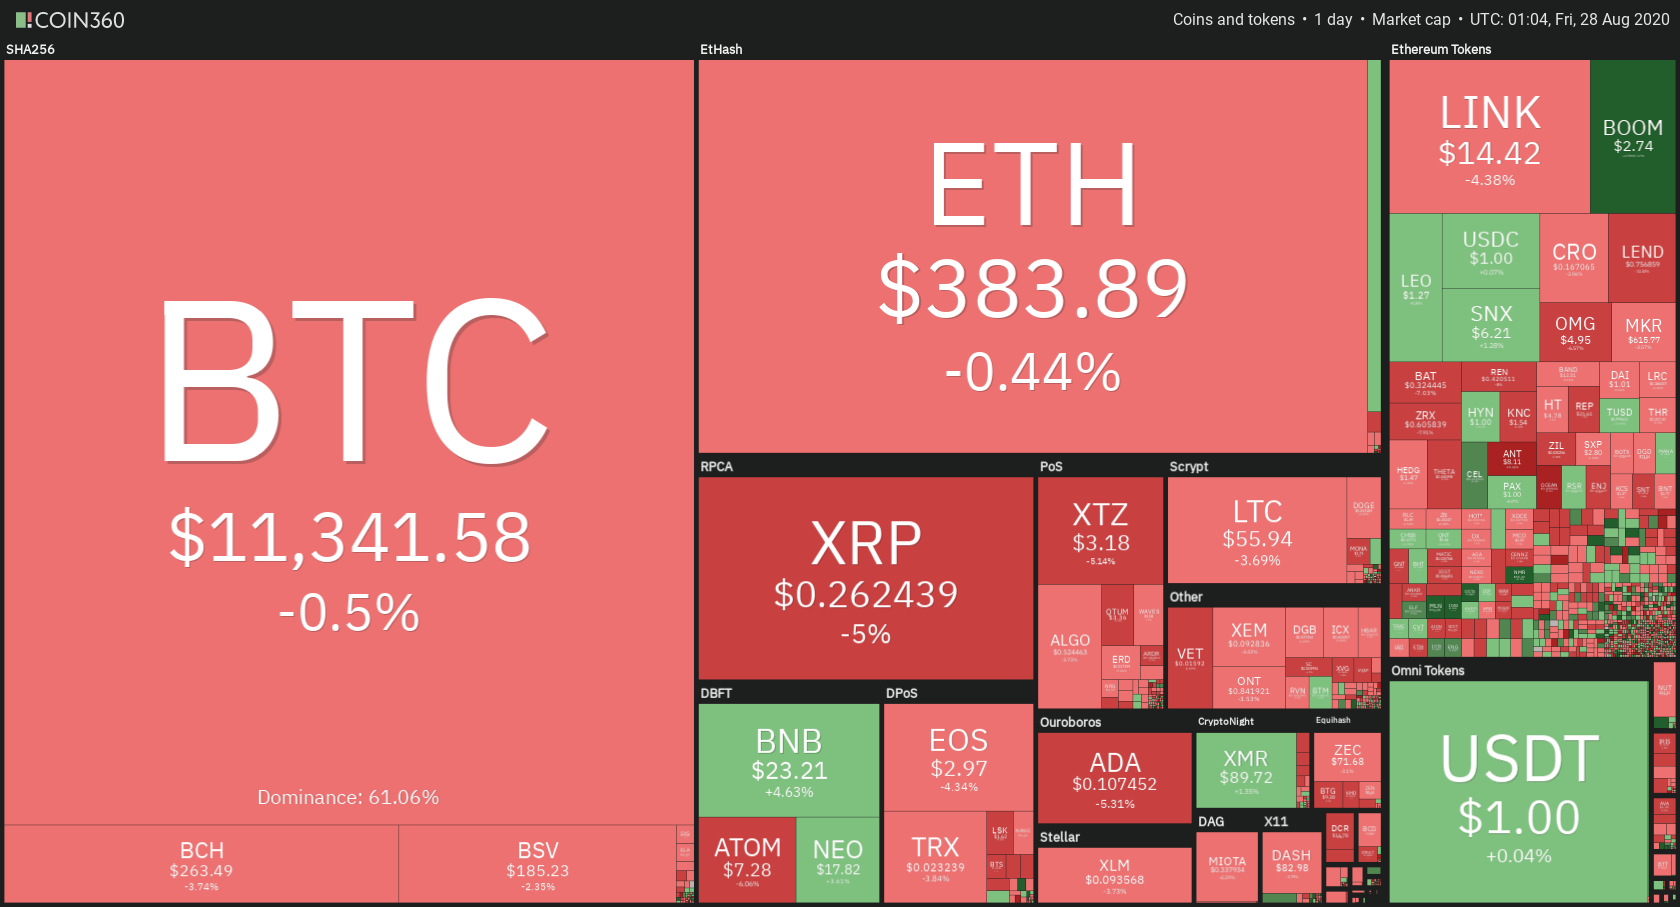
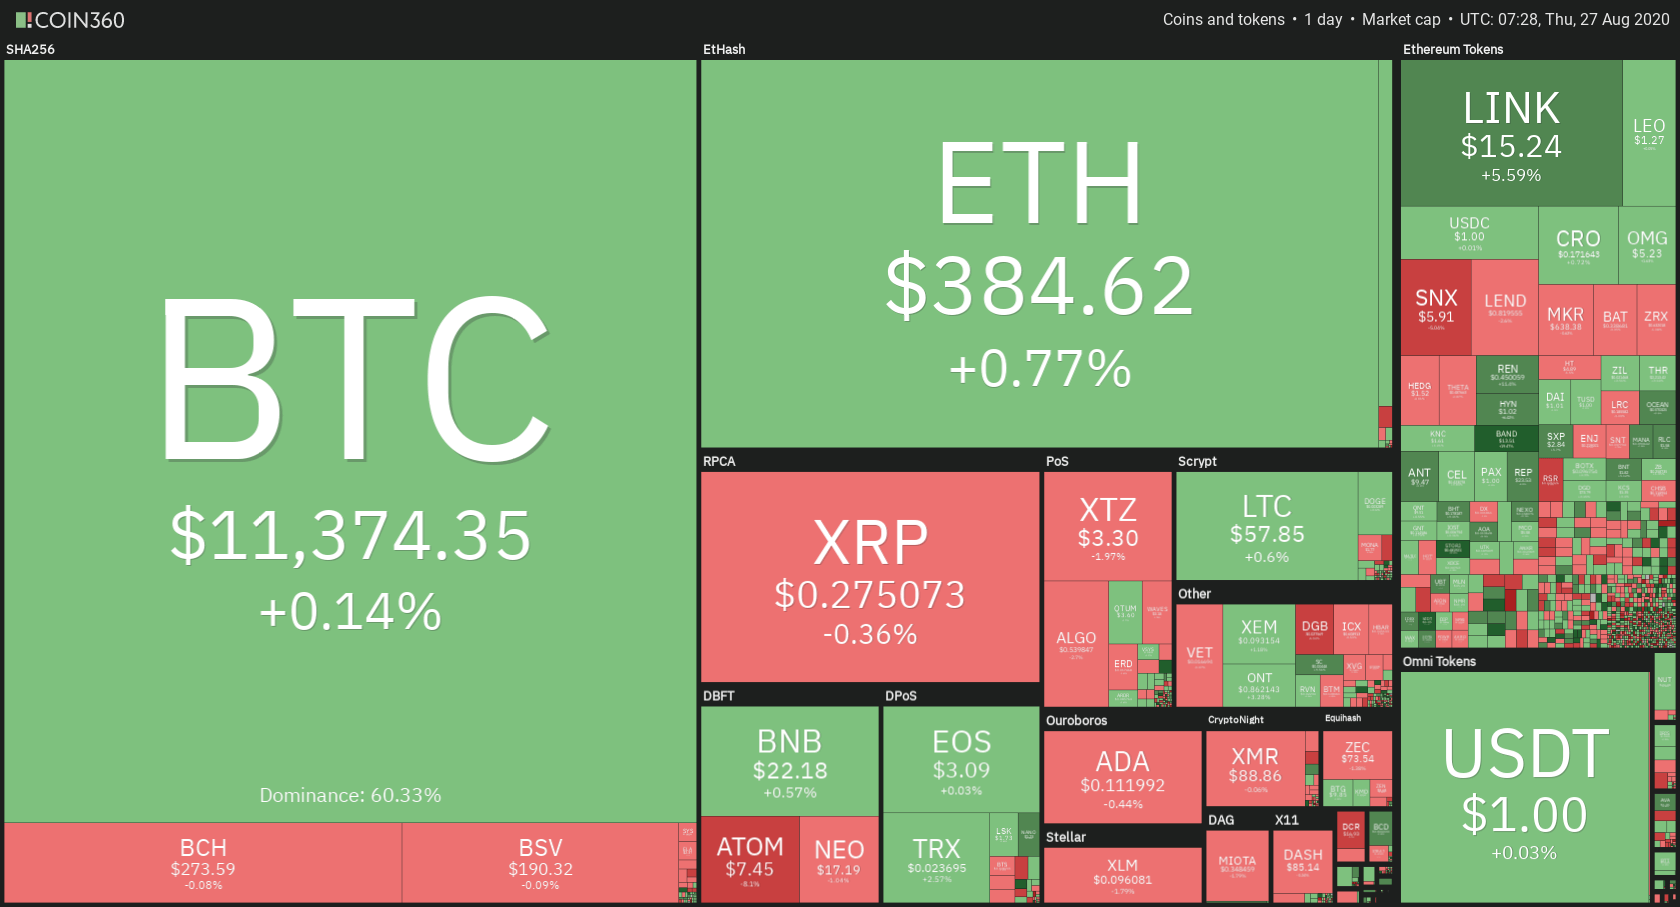
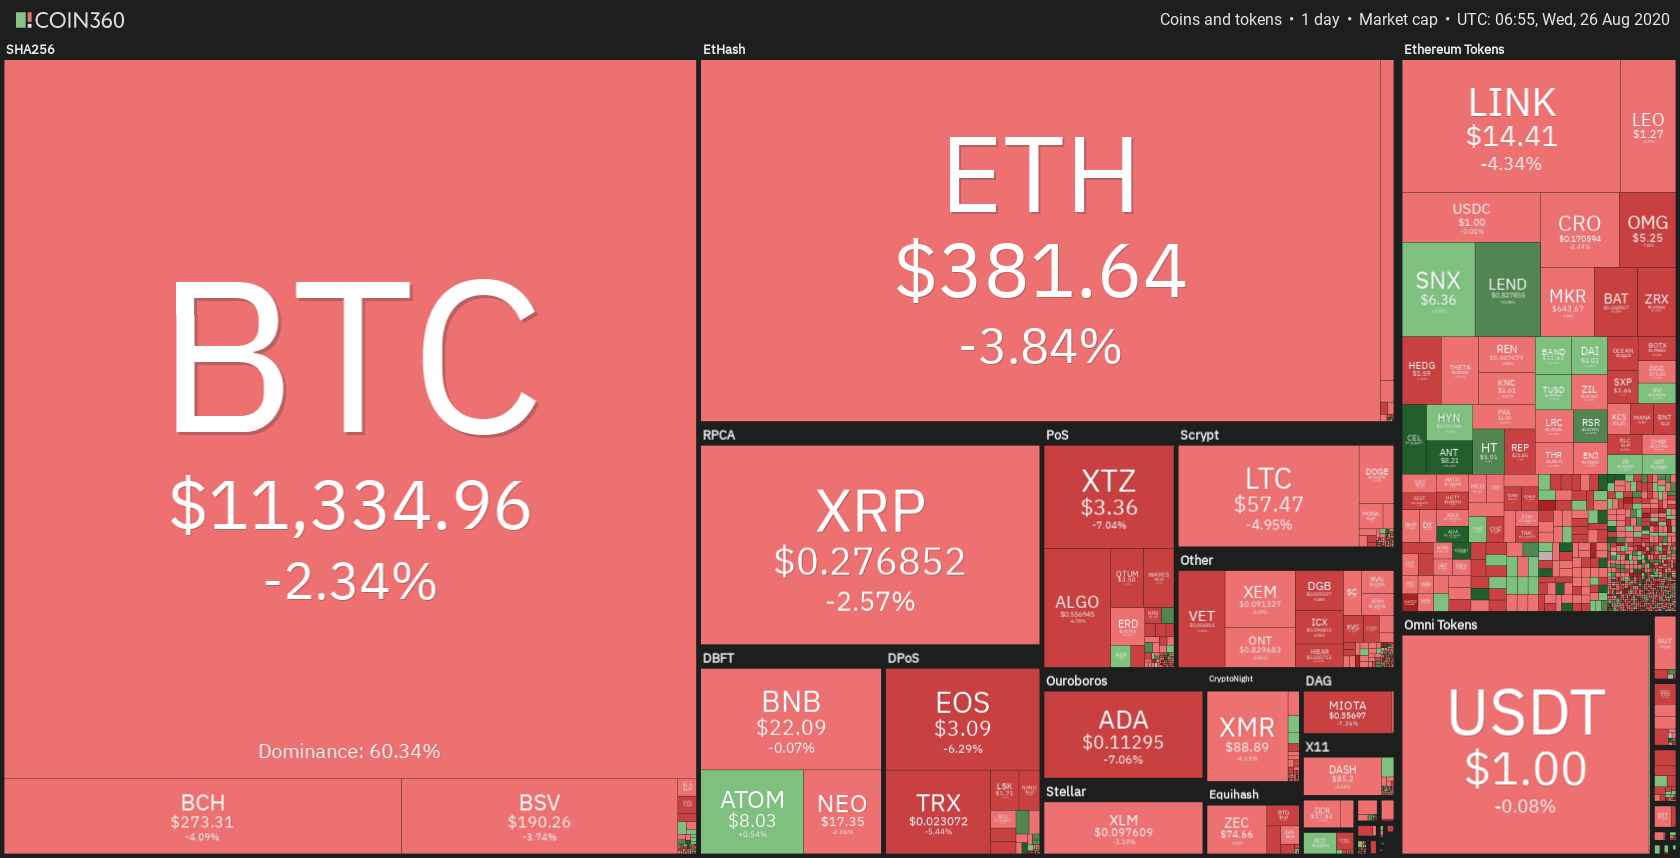
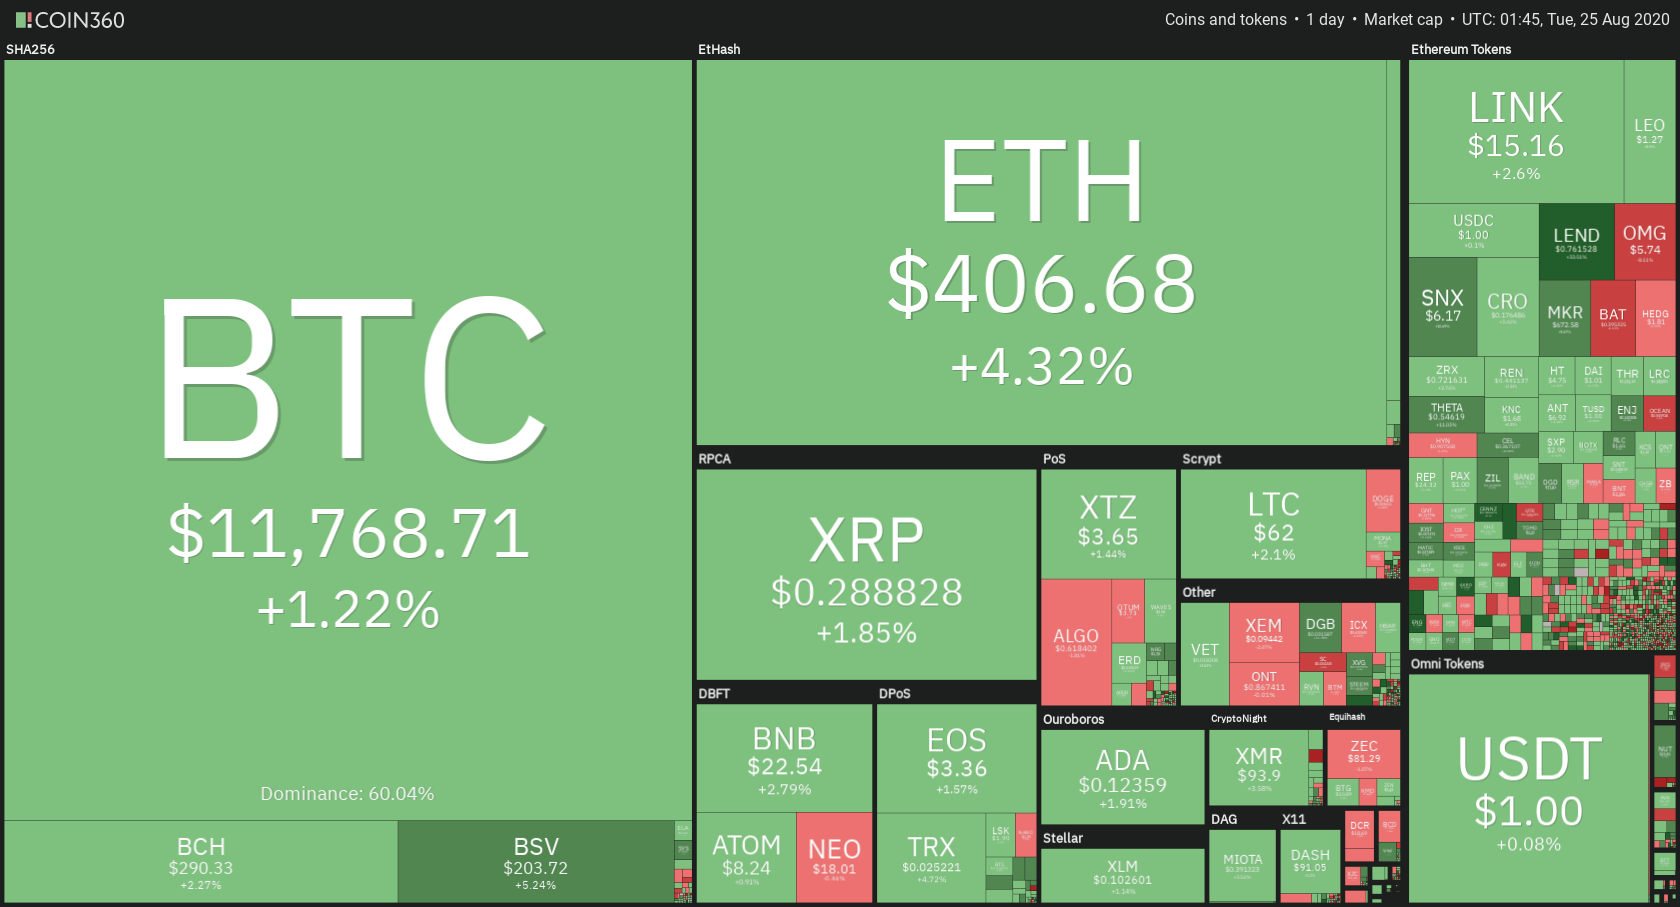
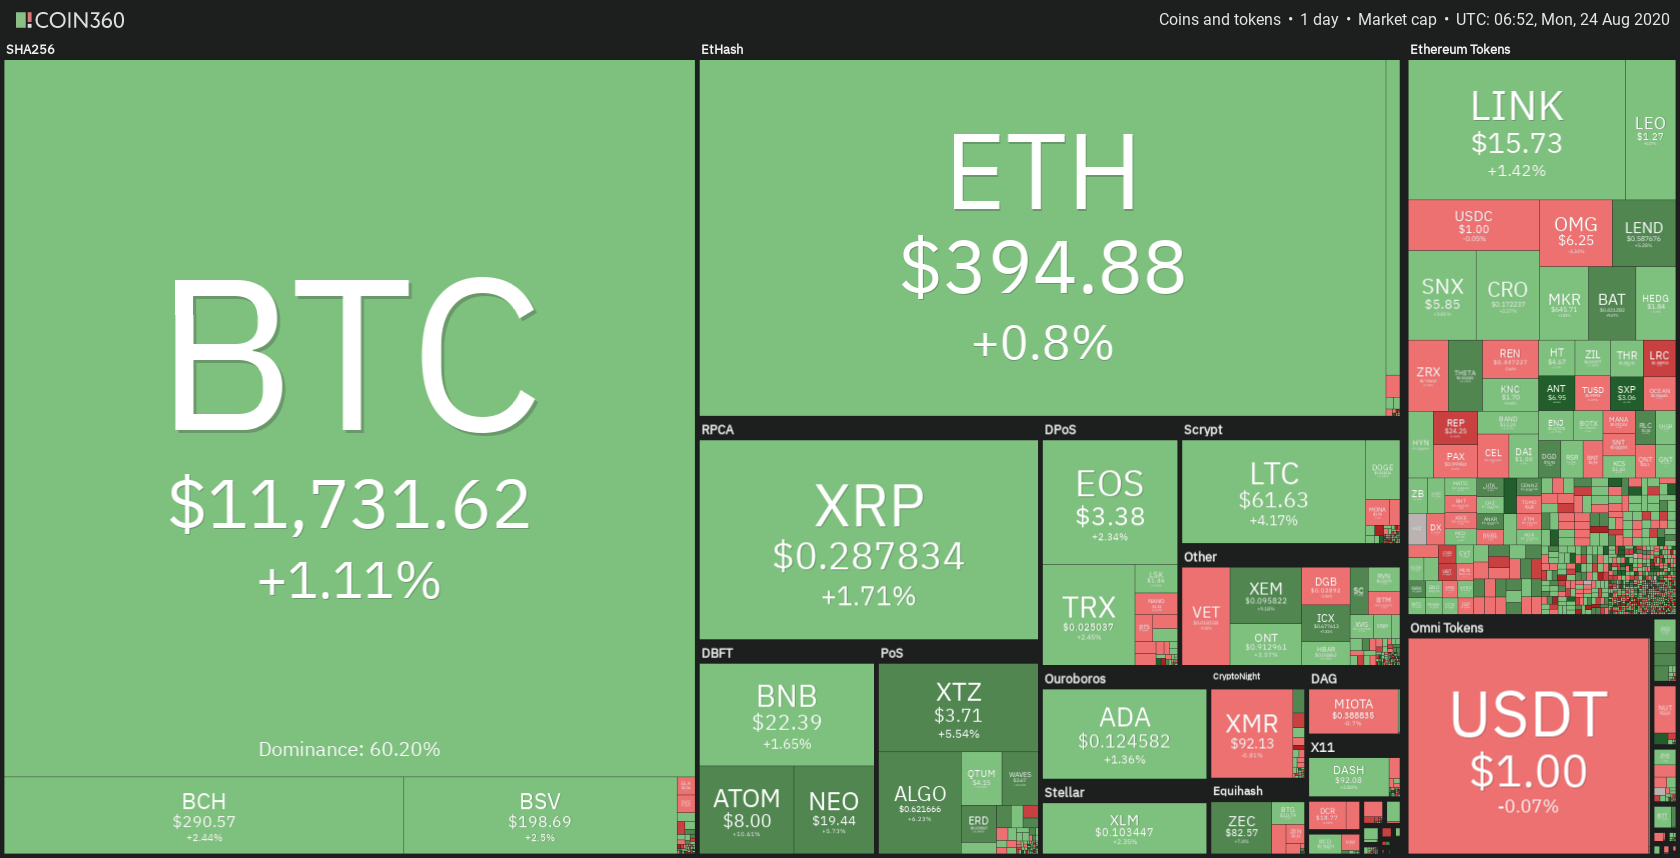
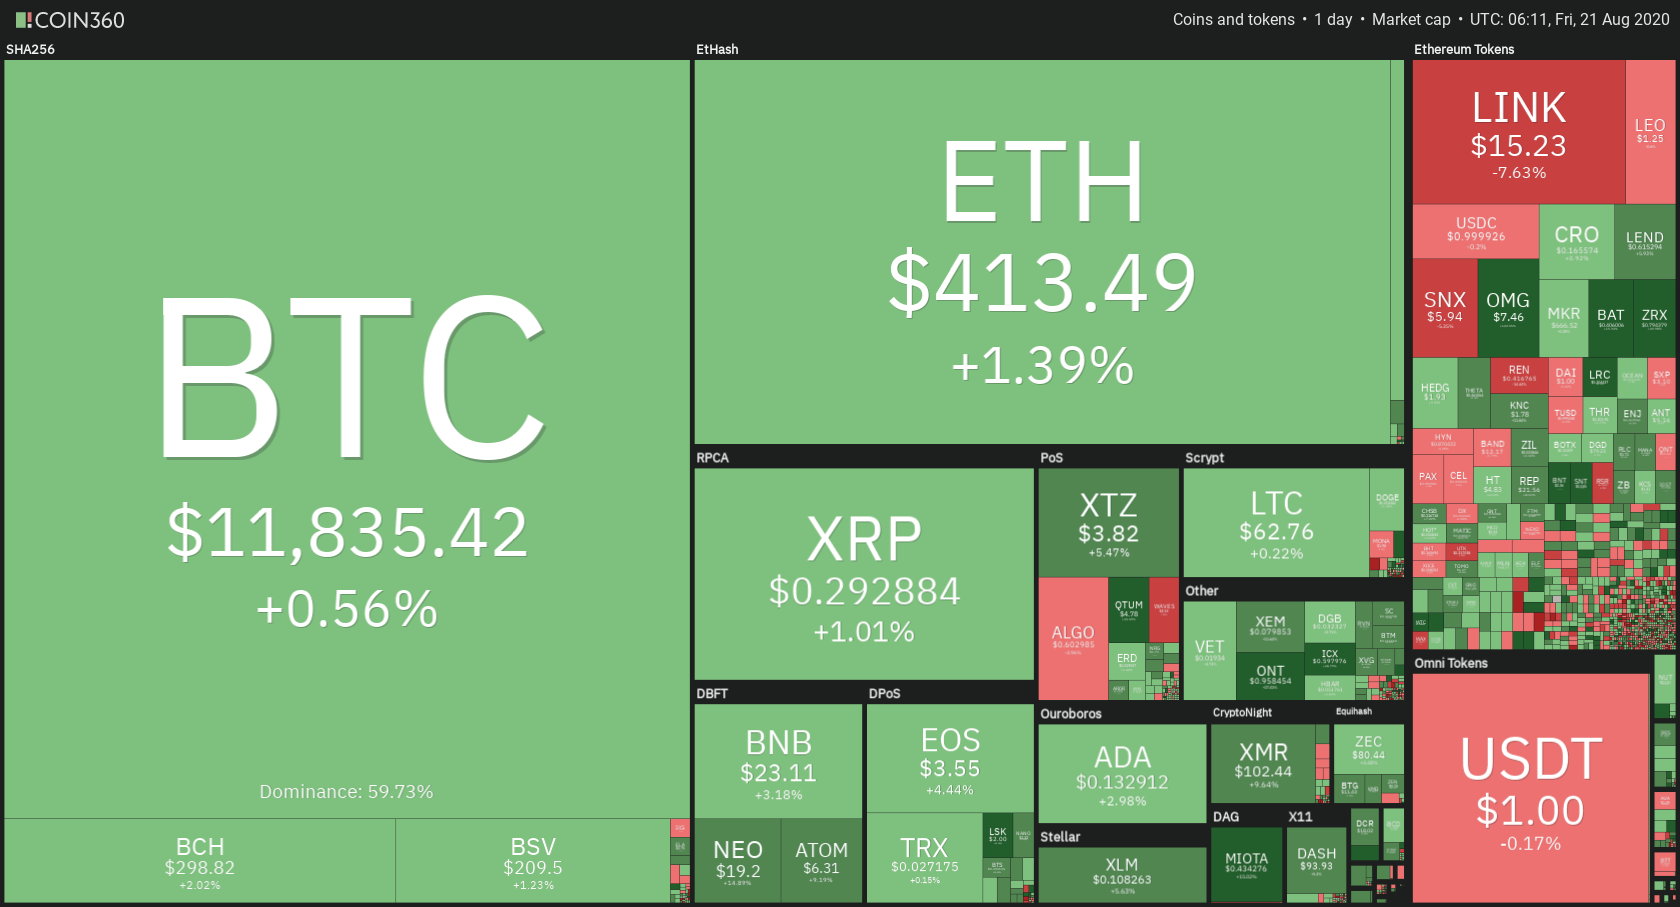
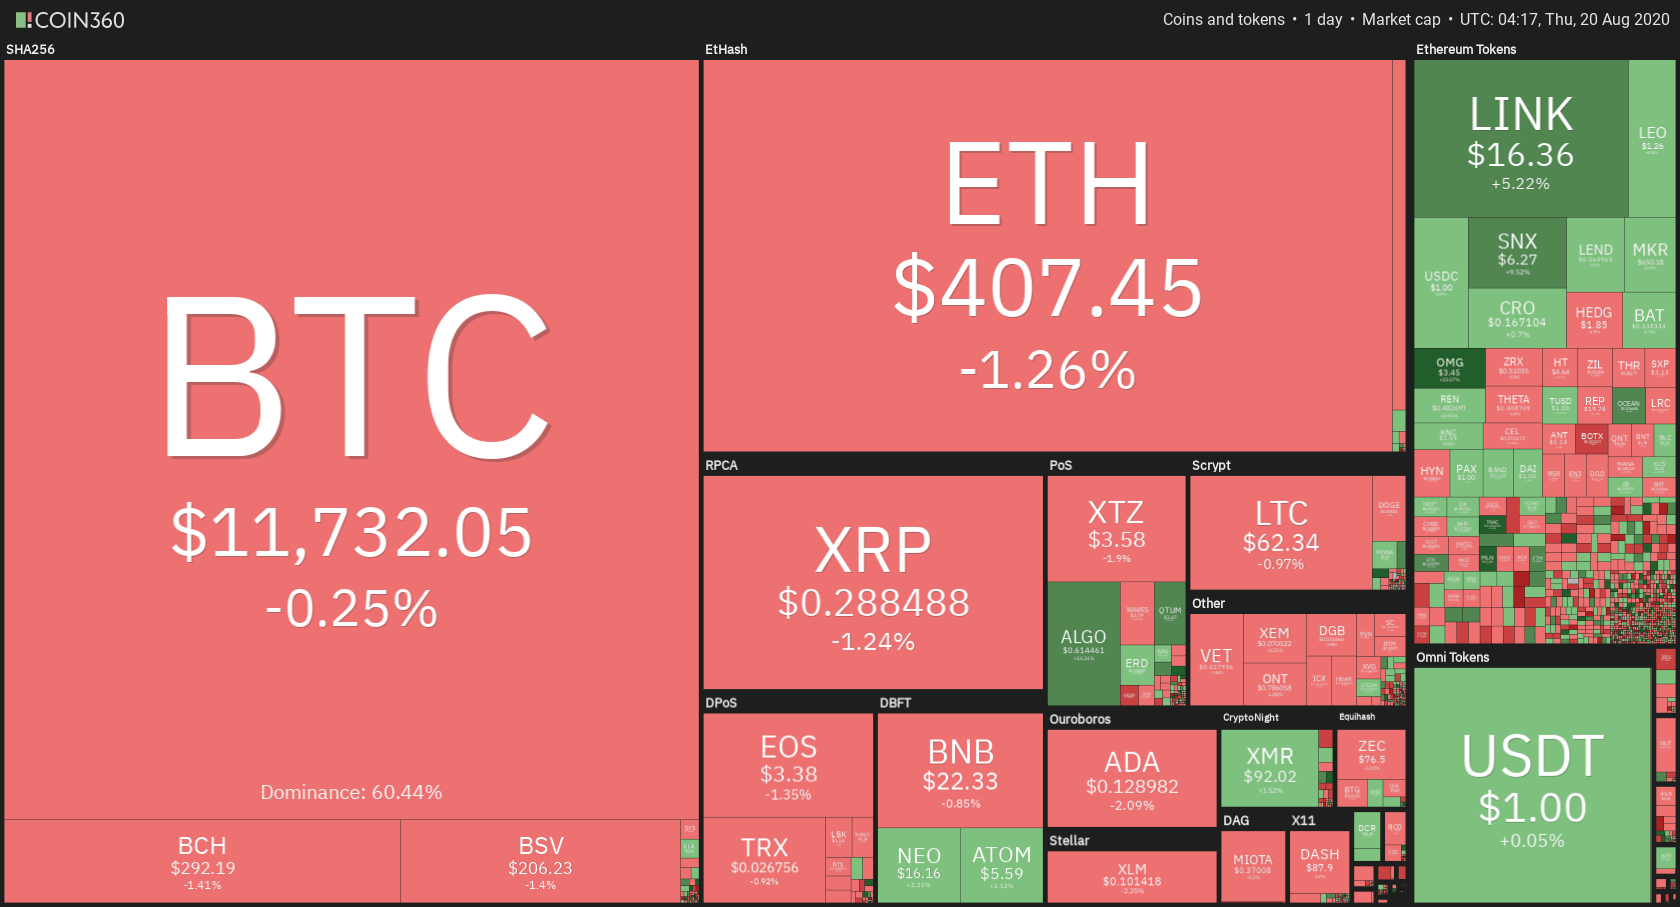
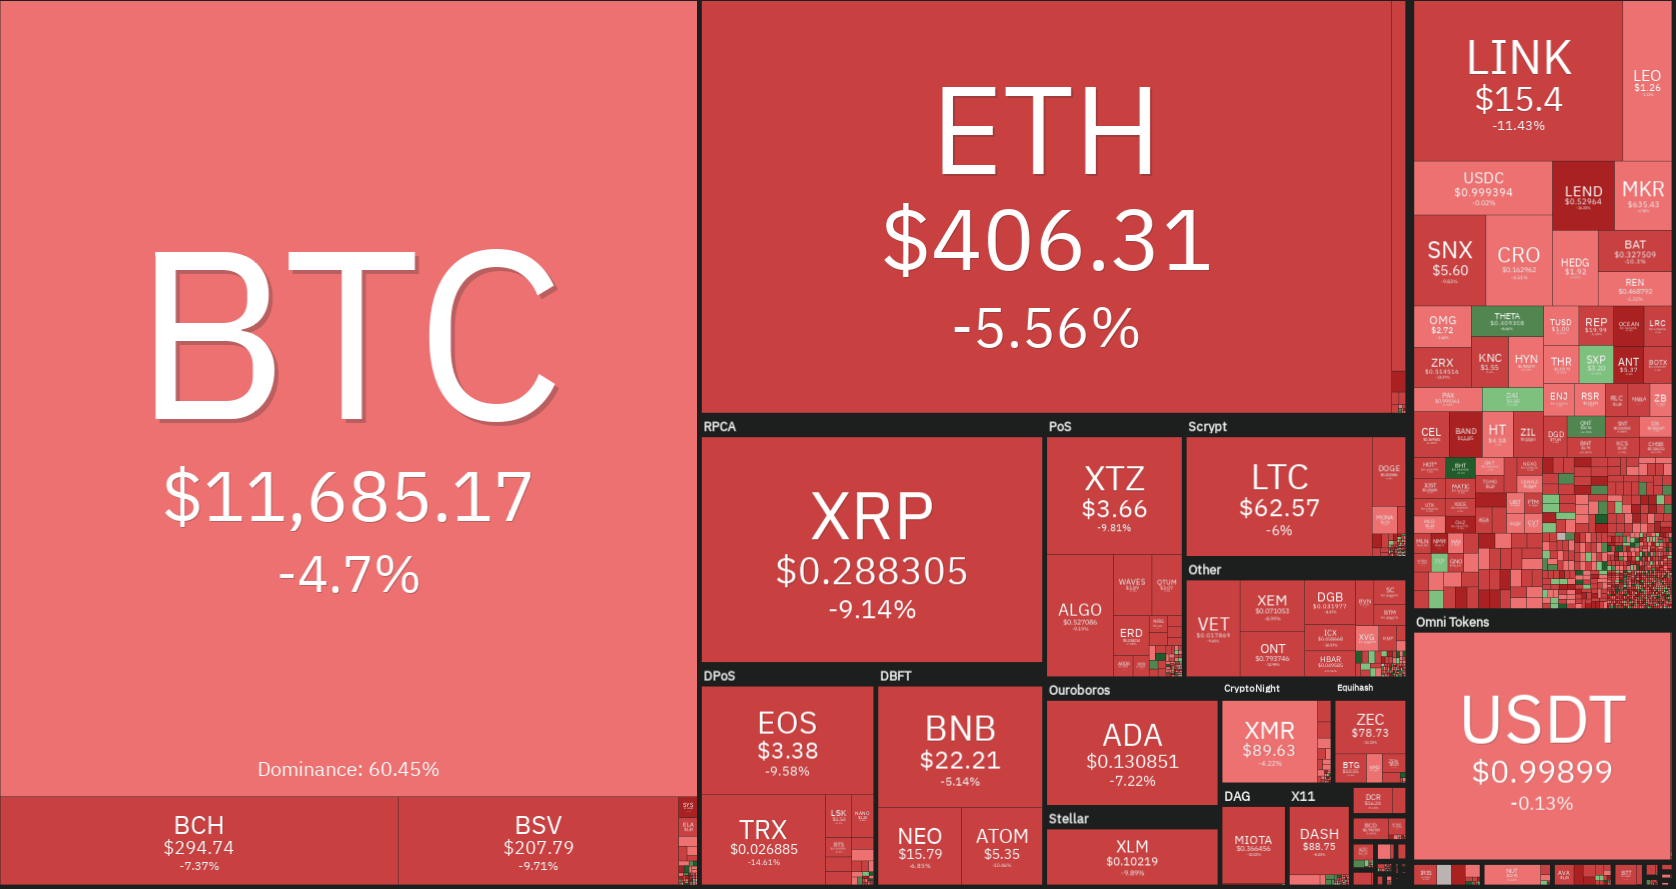
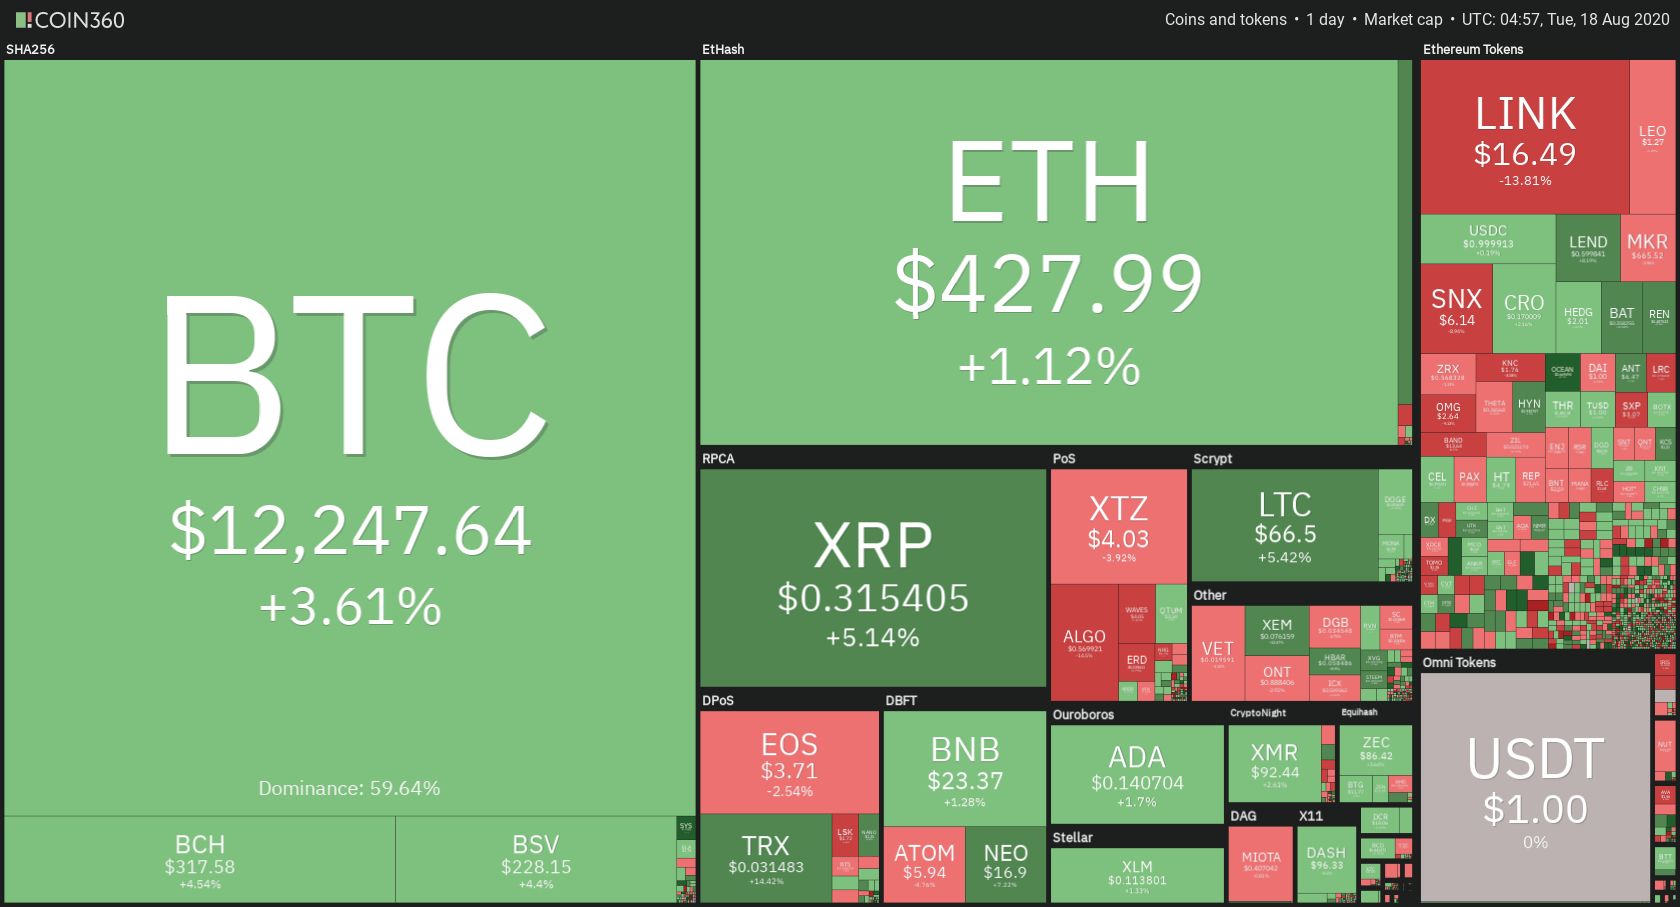
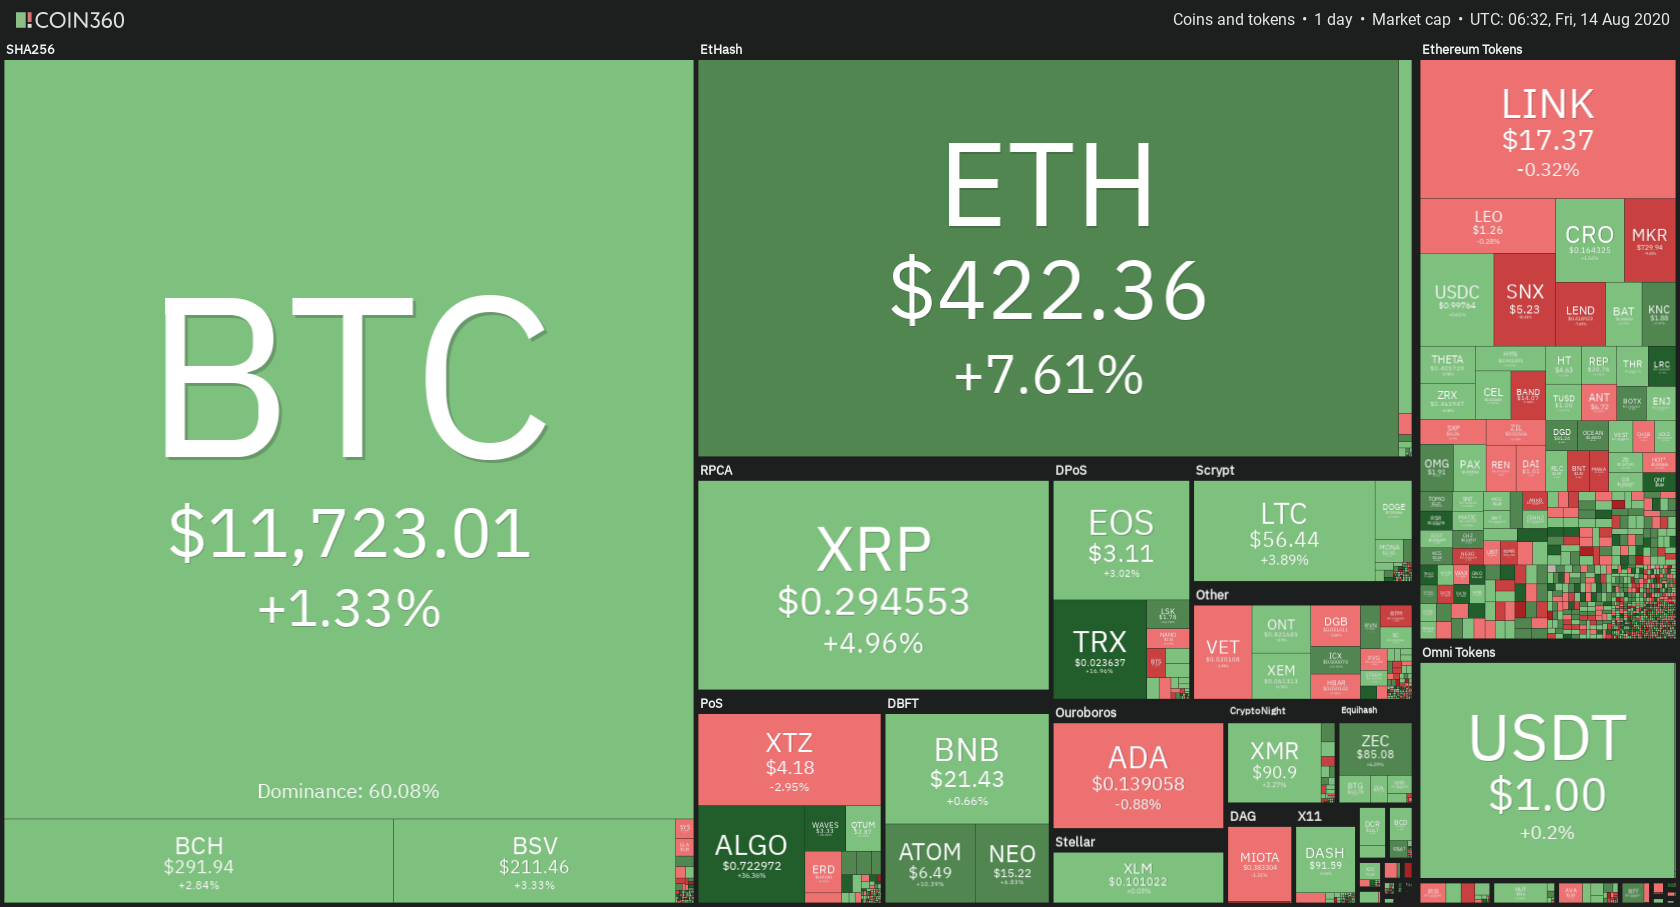
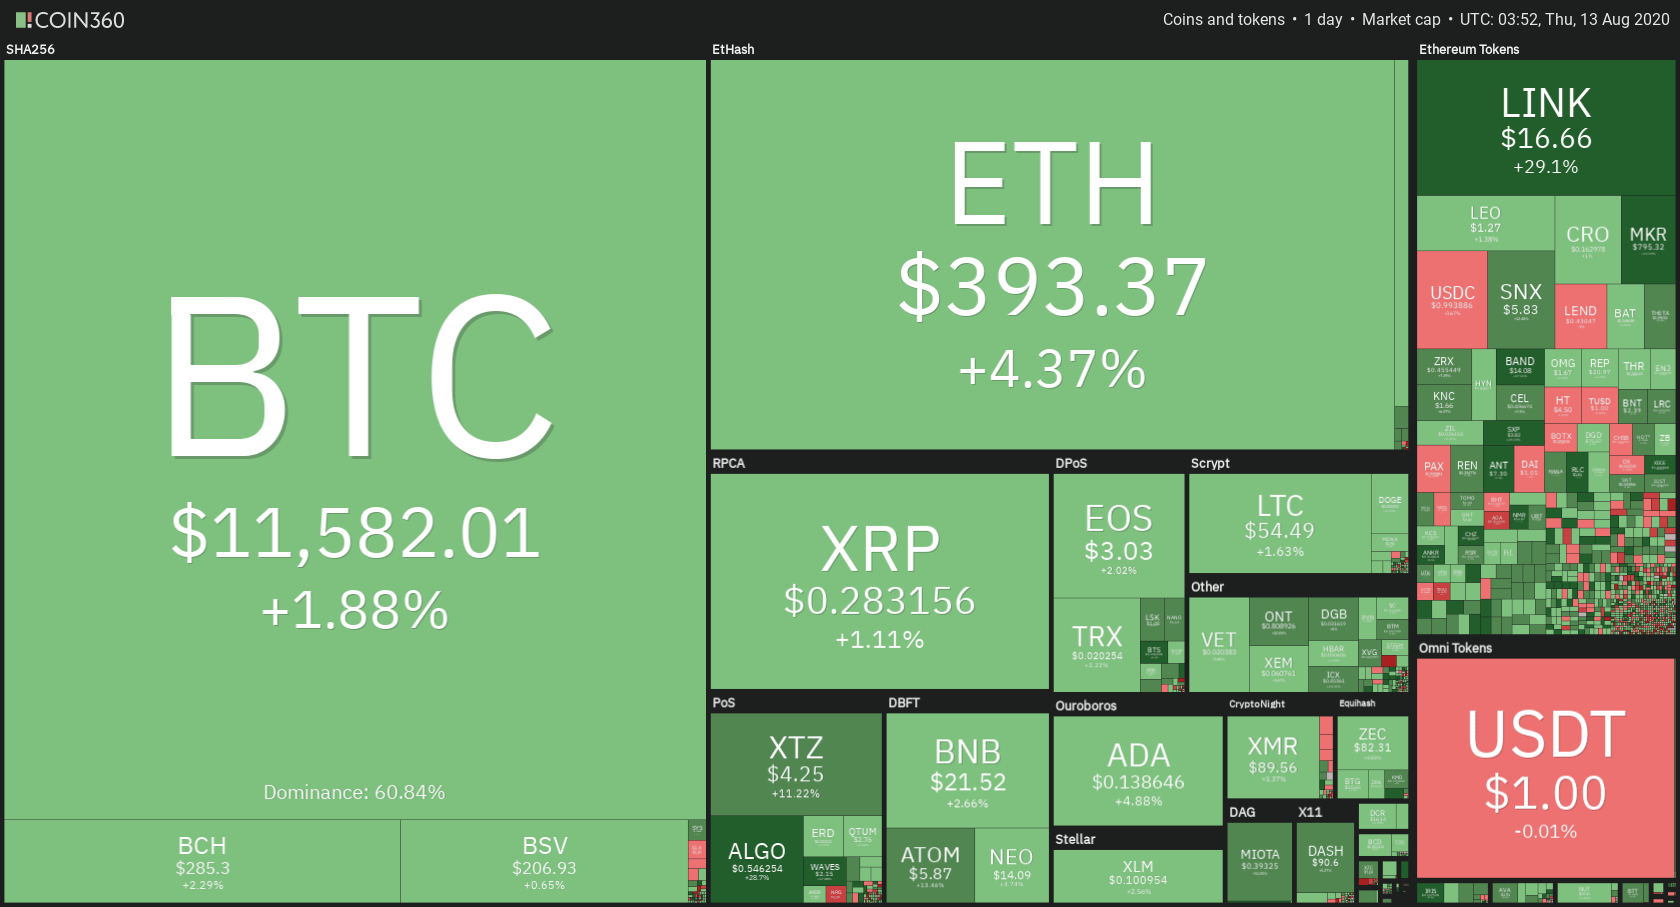
Daily Crypto Sector Heat Map
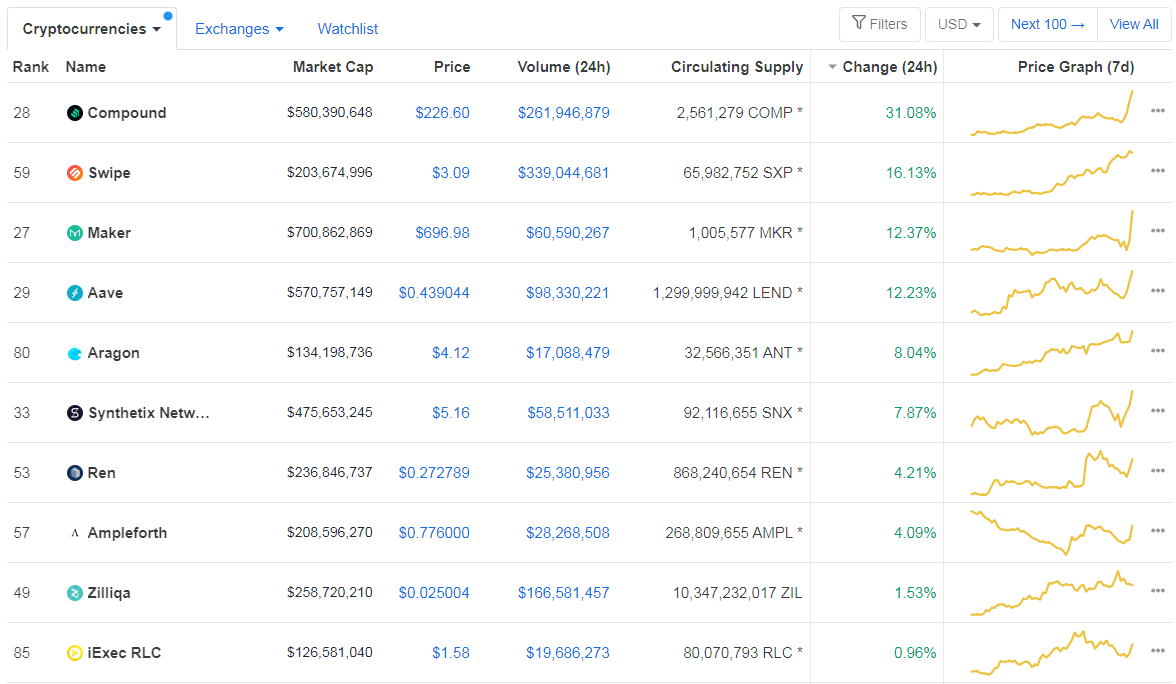
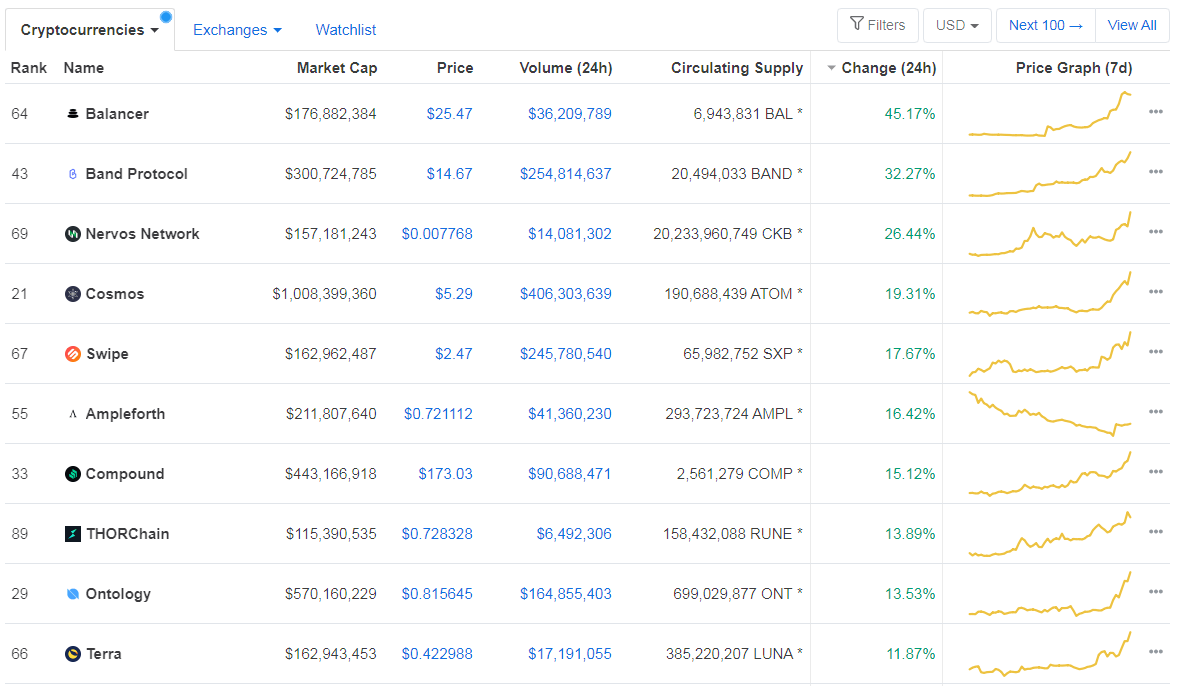
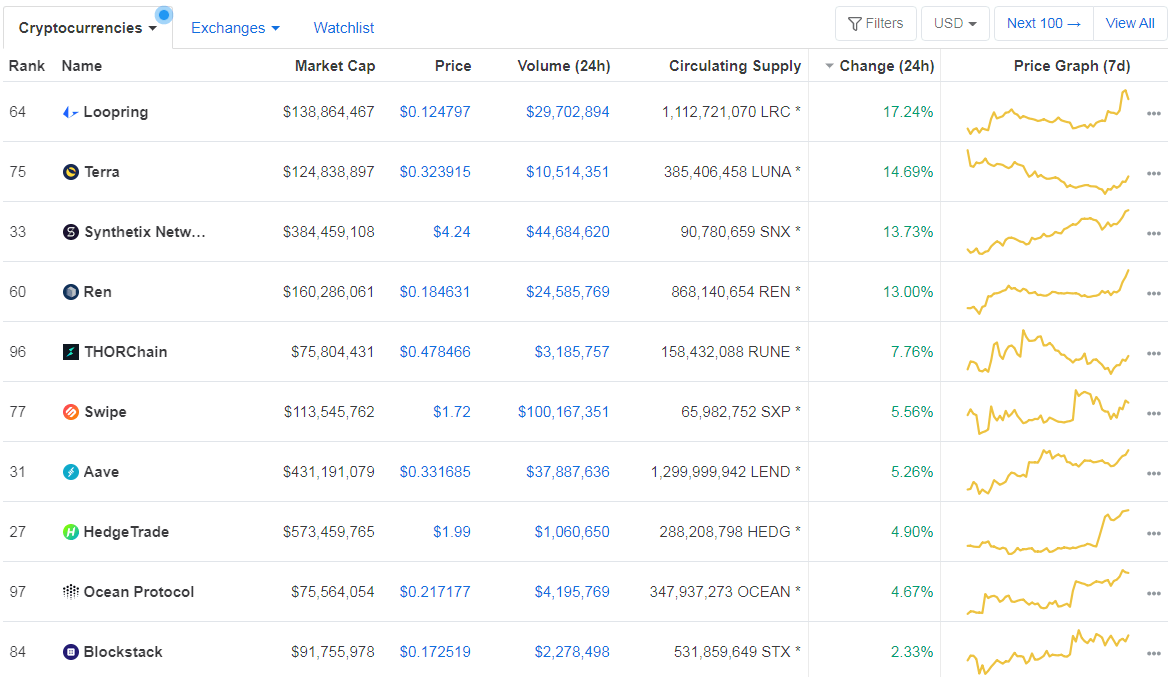
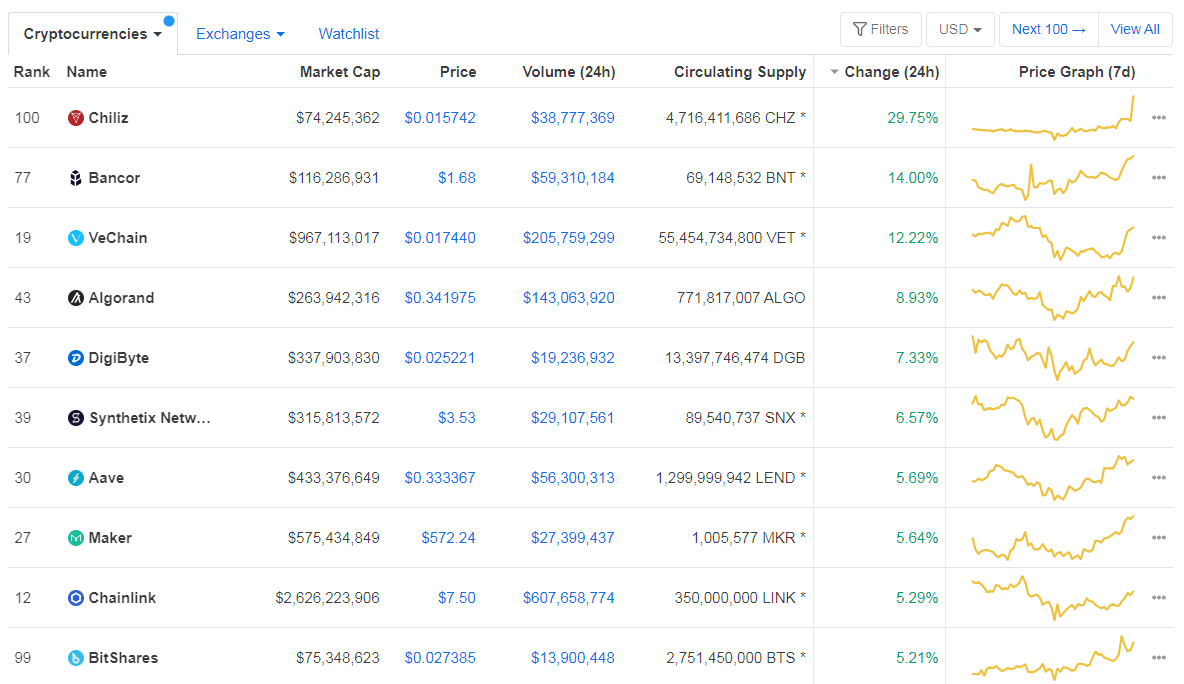
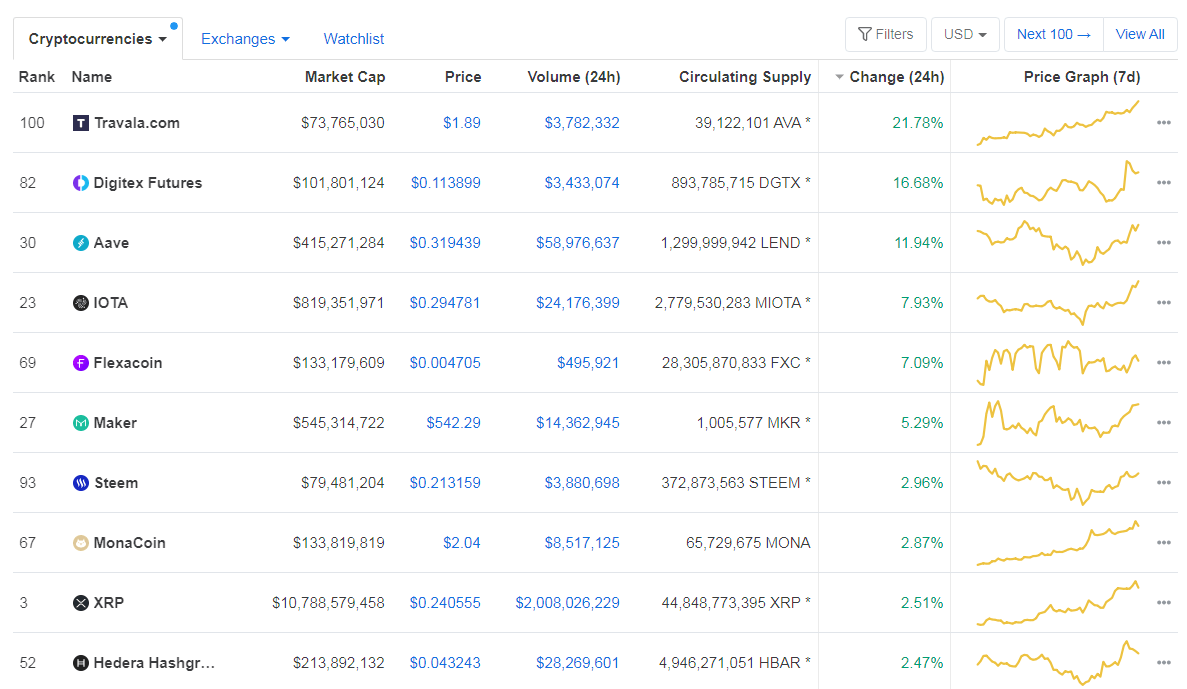
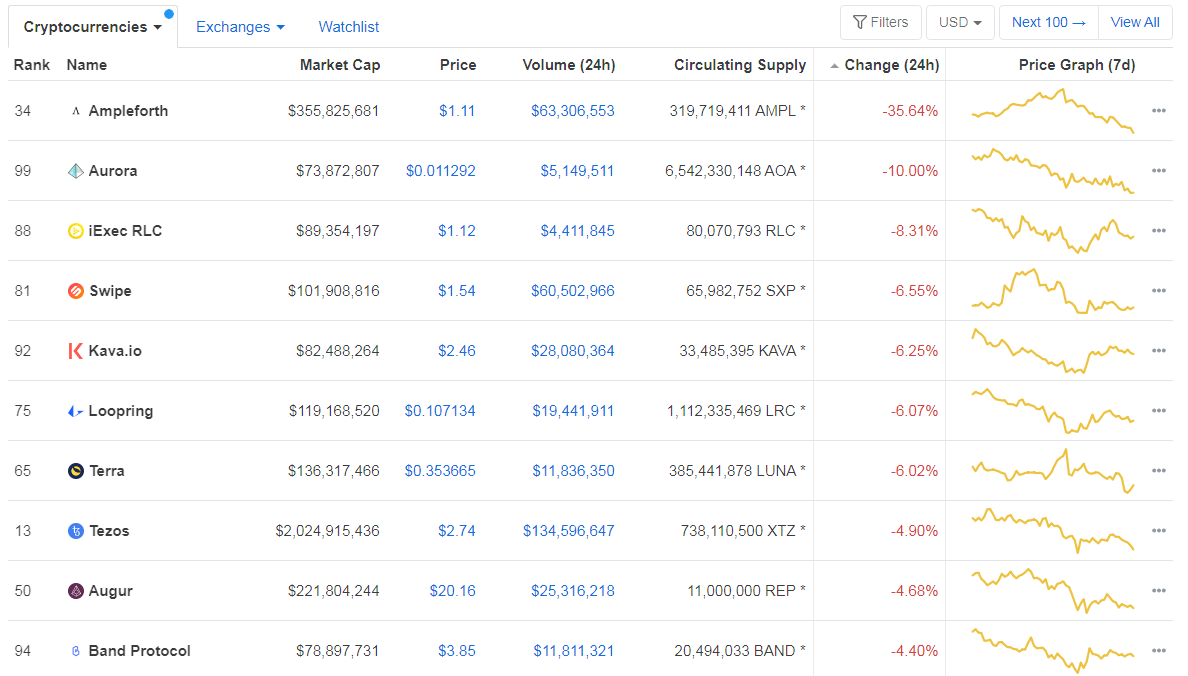
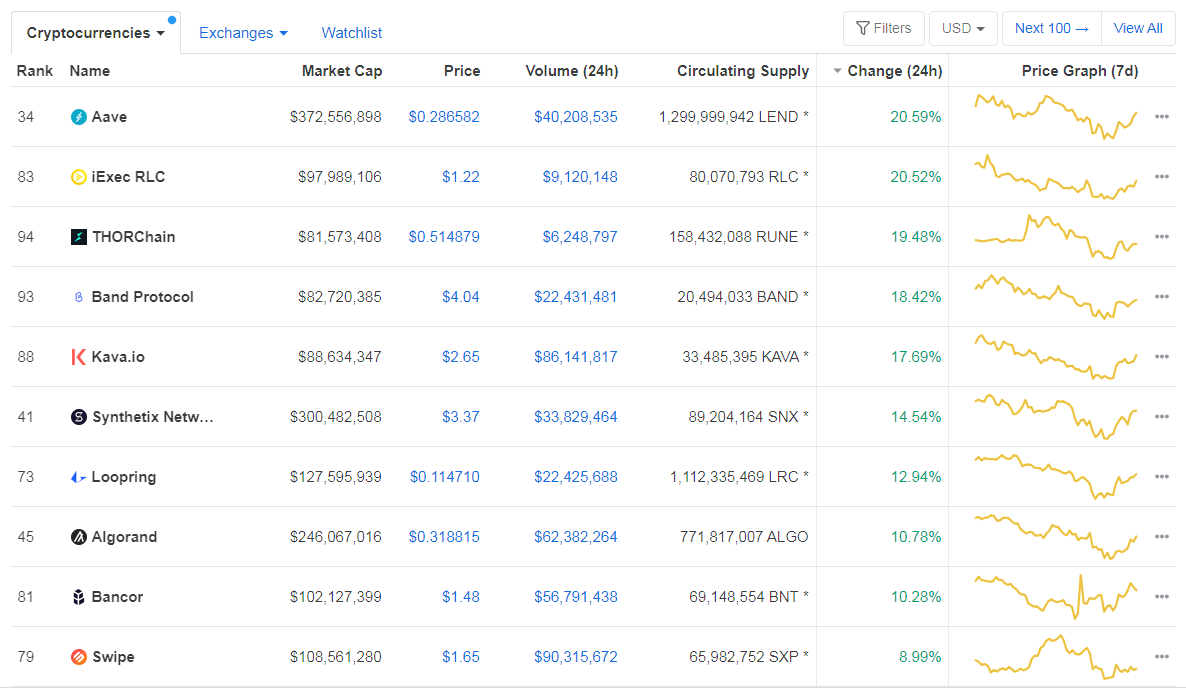
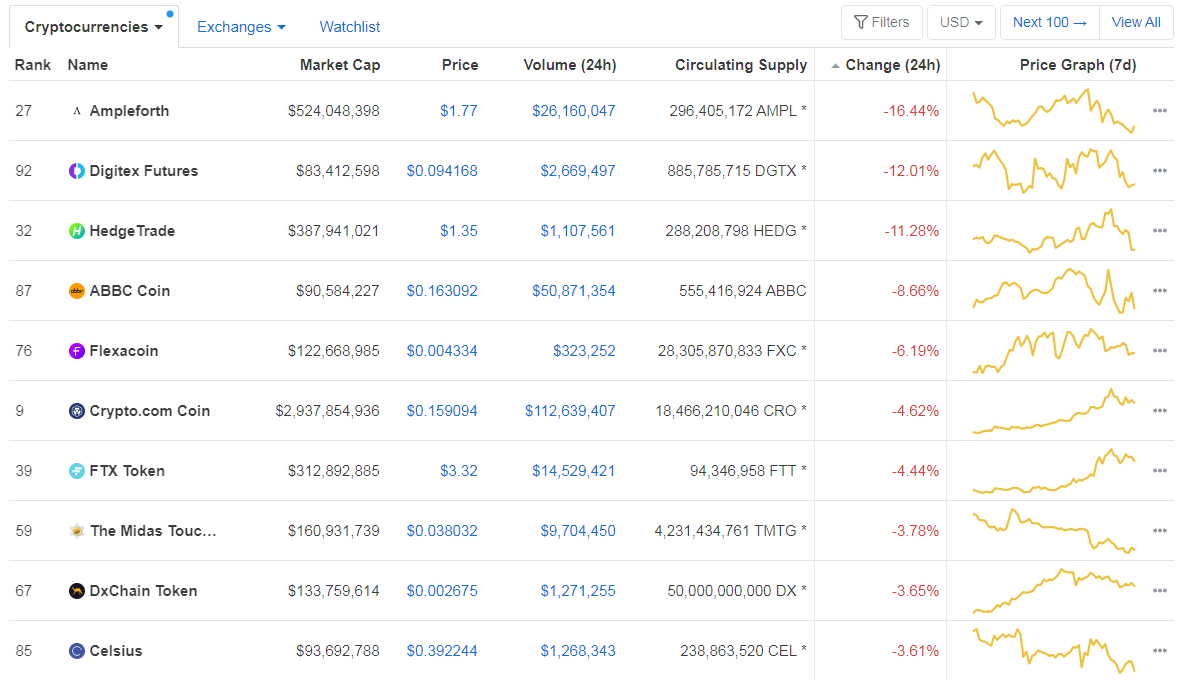
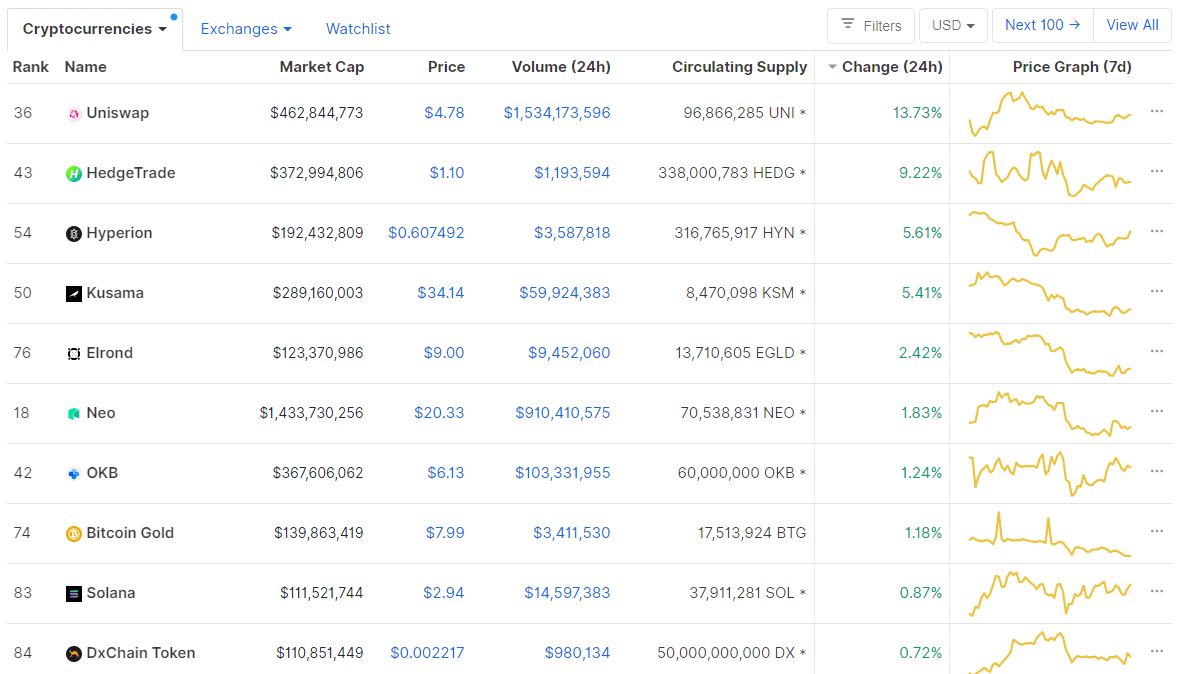
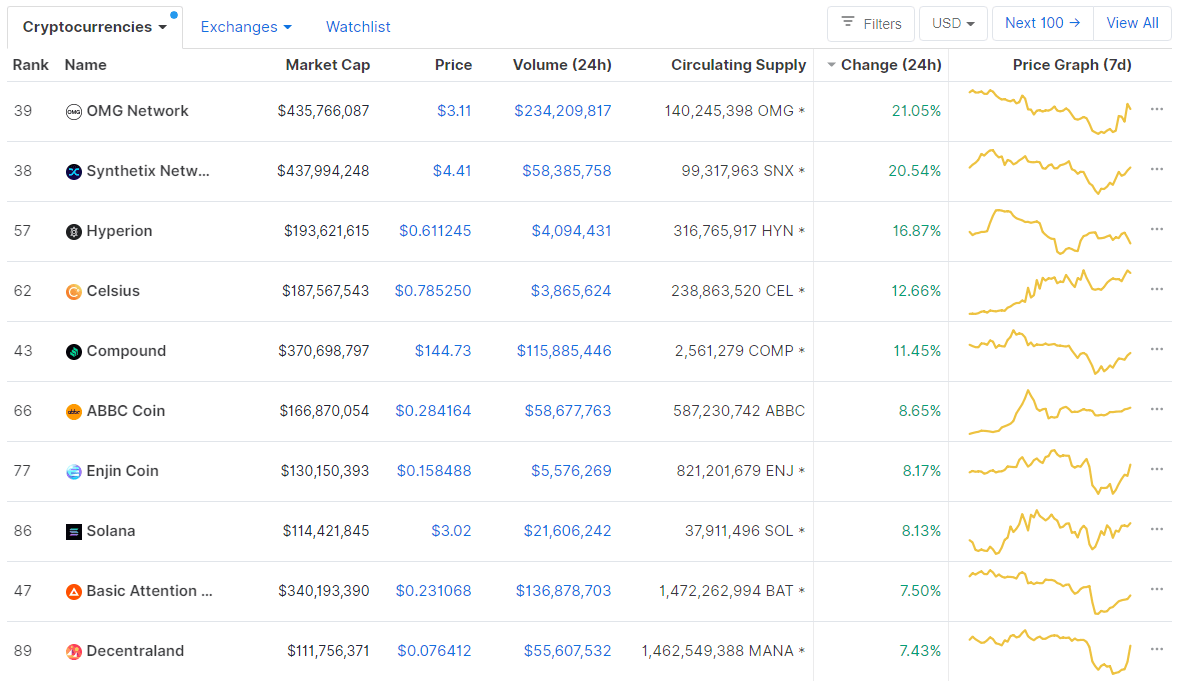
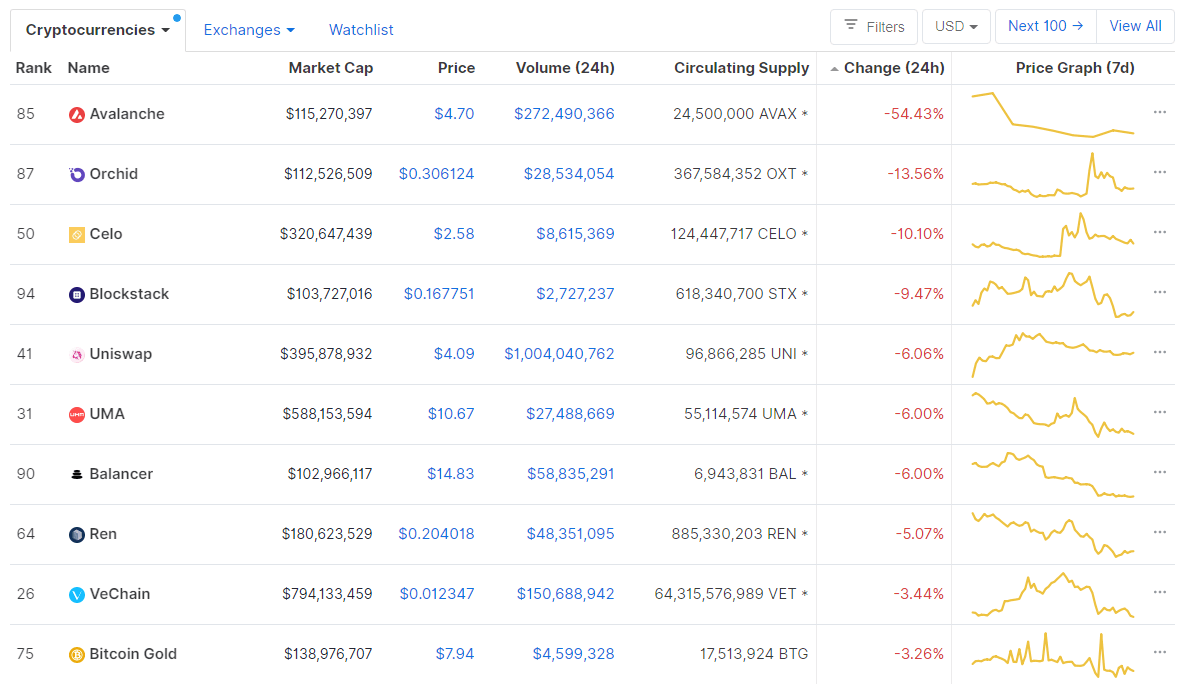
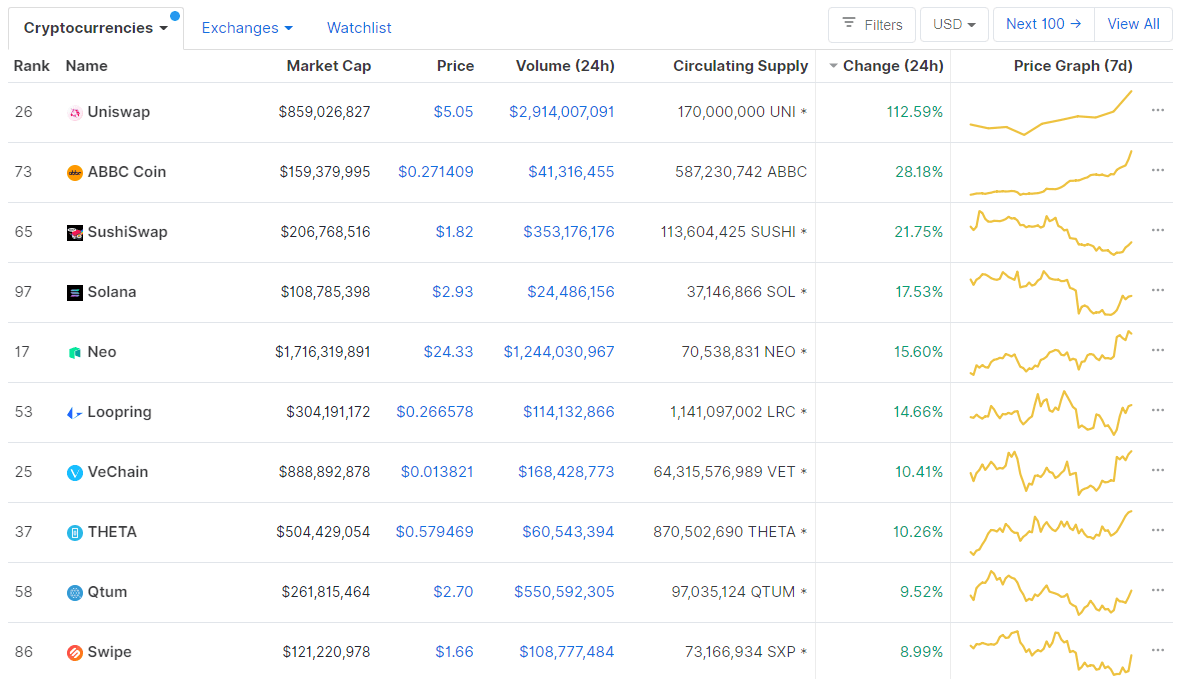
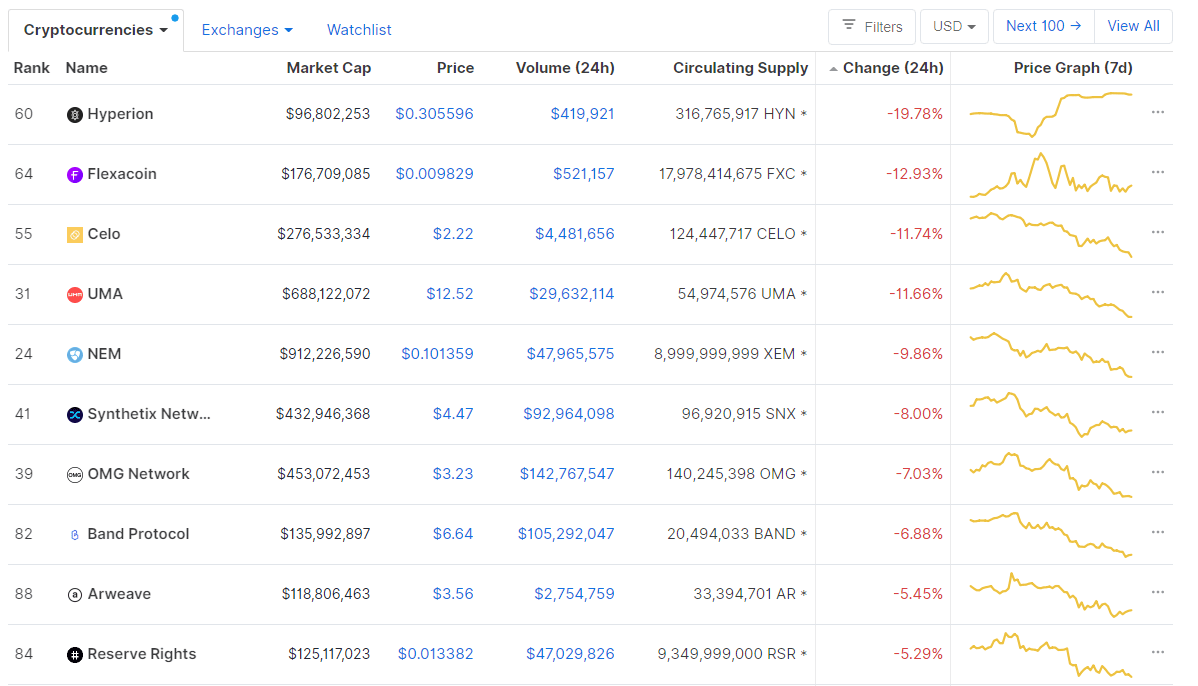
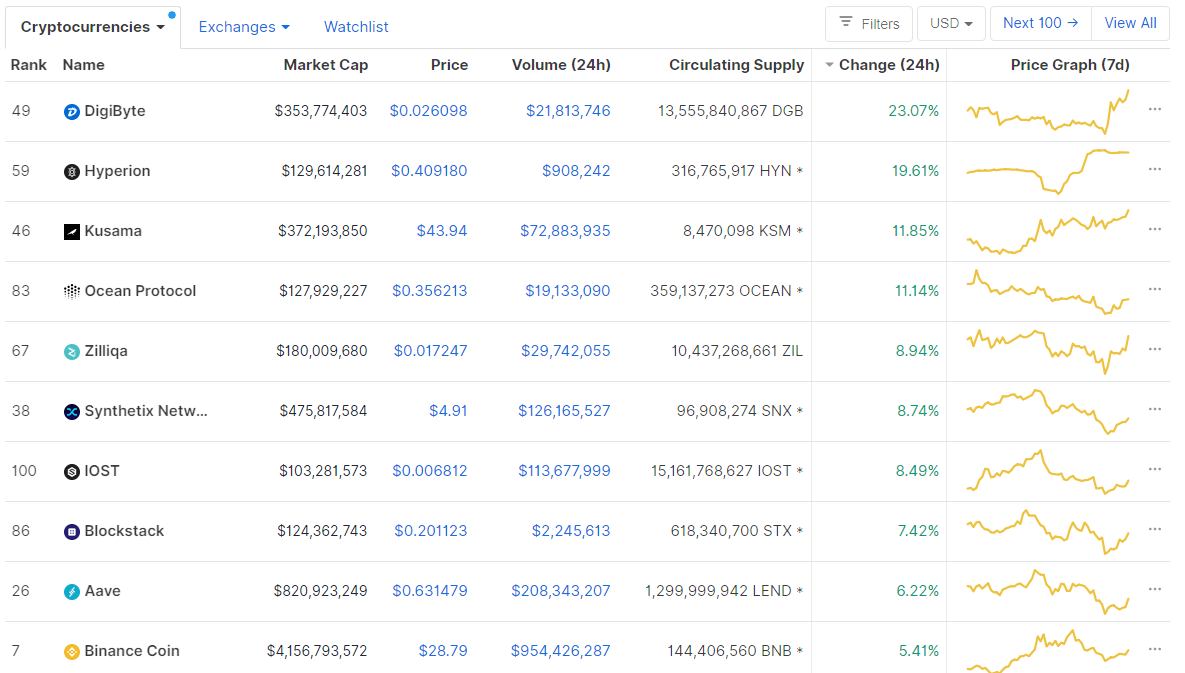
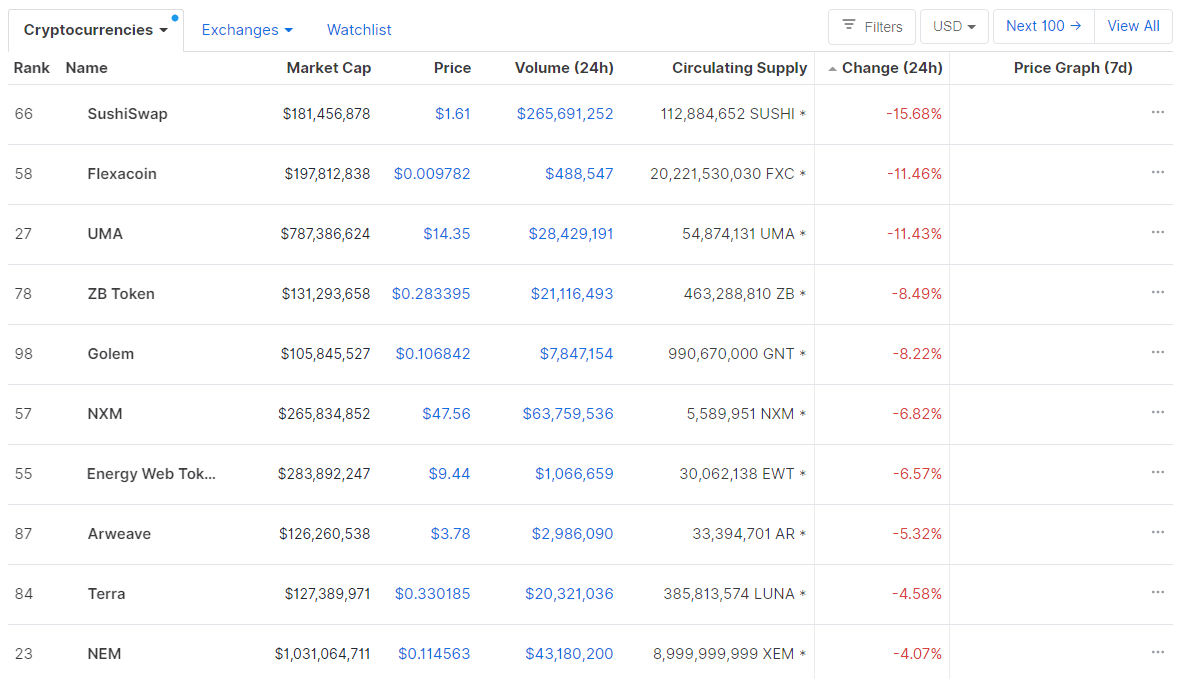
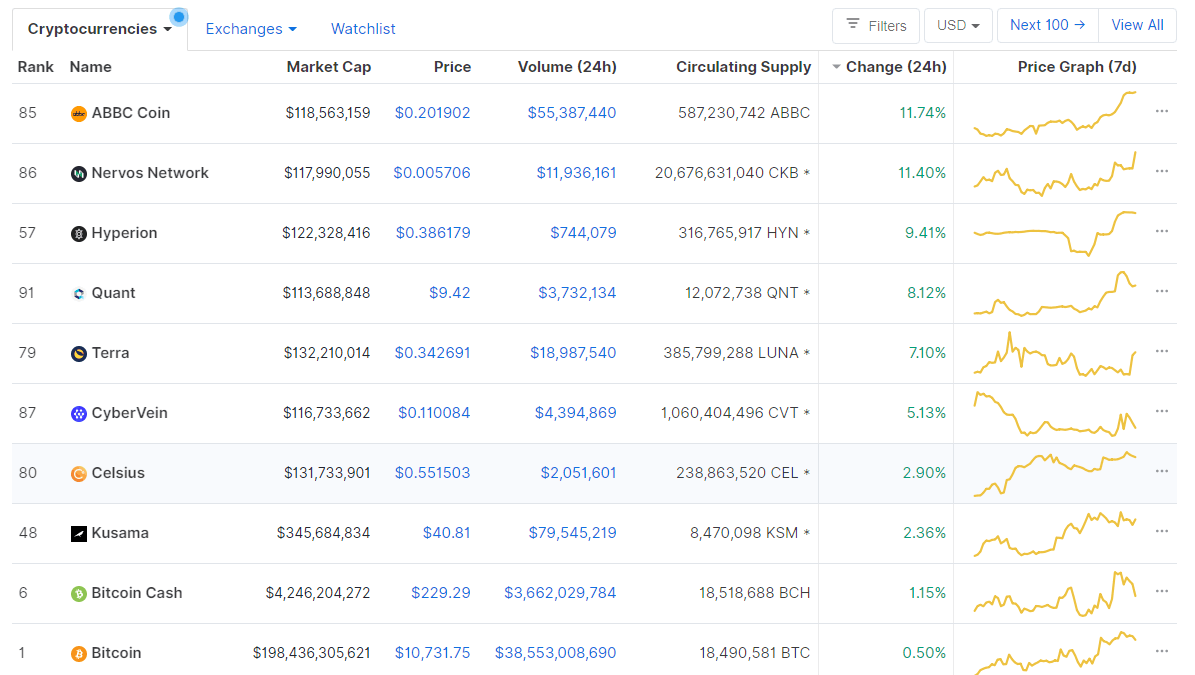
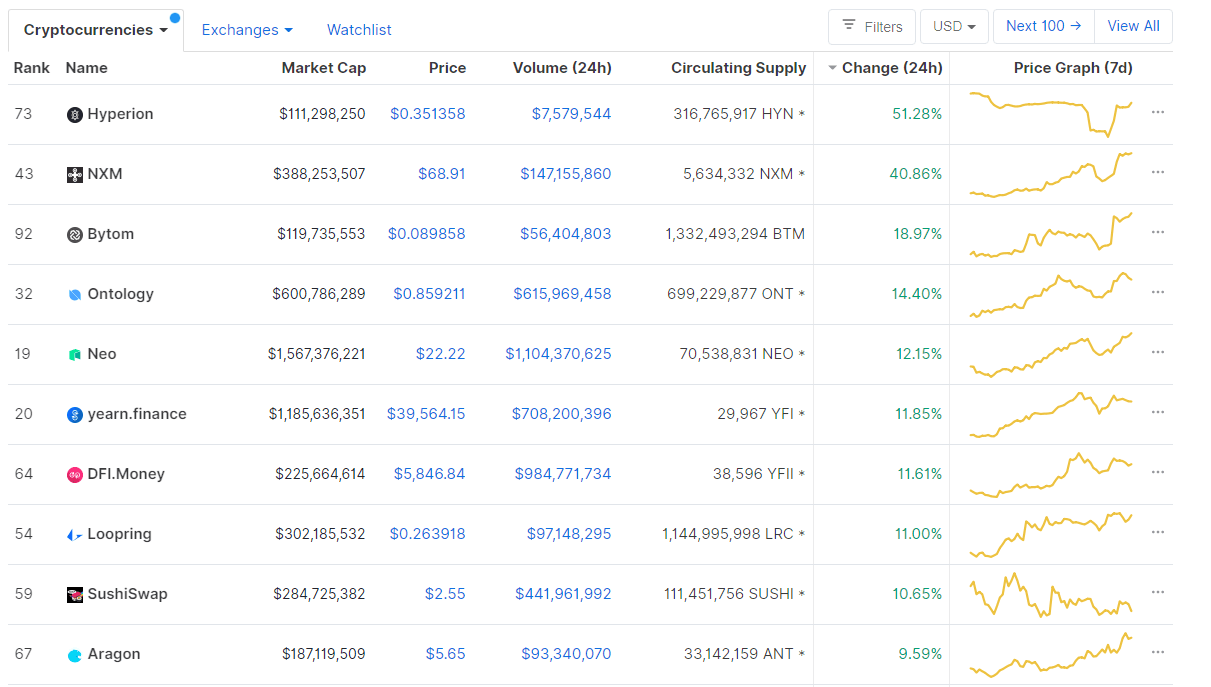
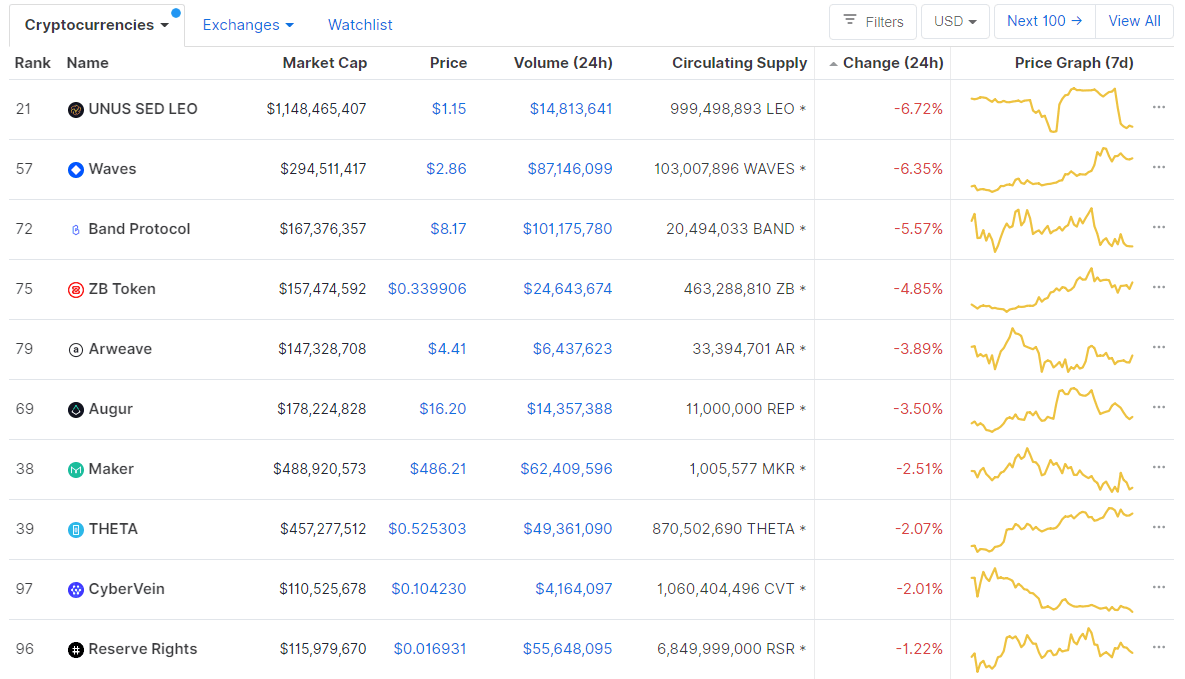
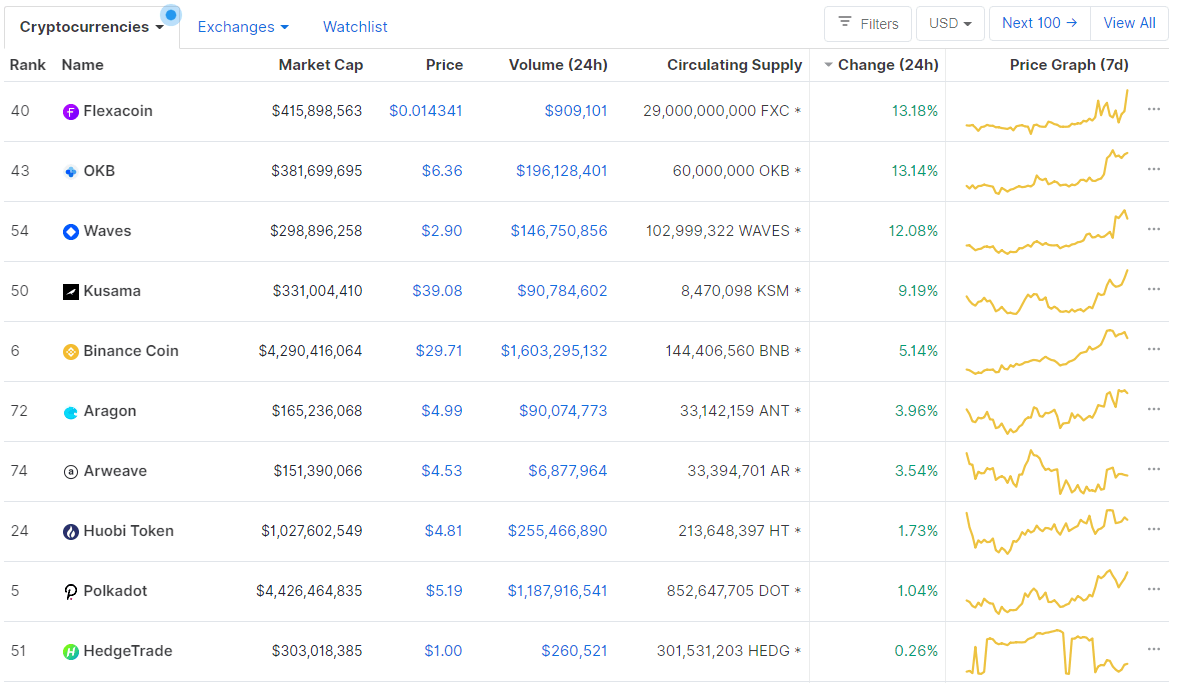
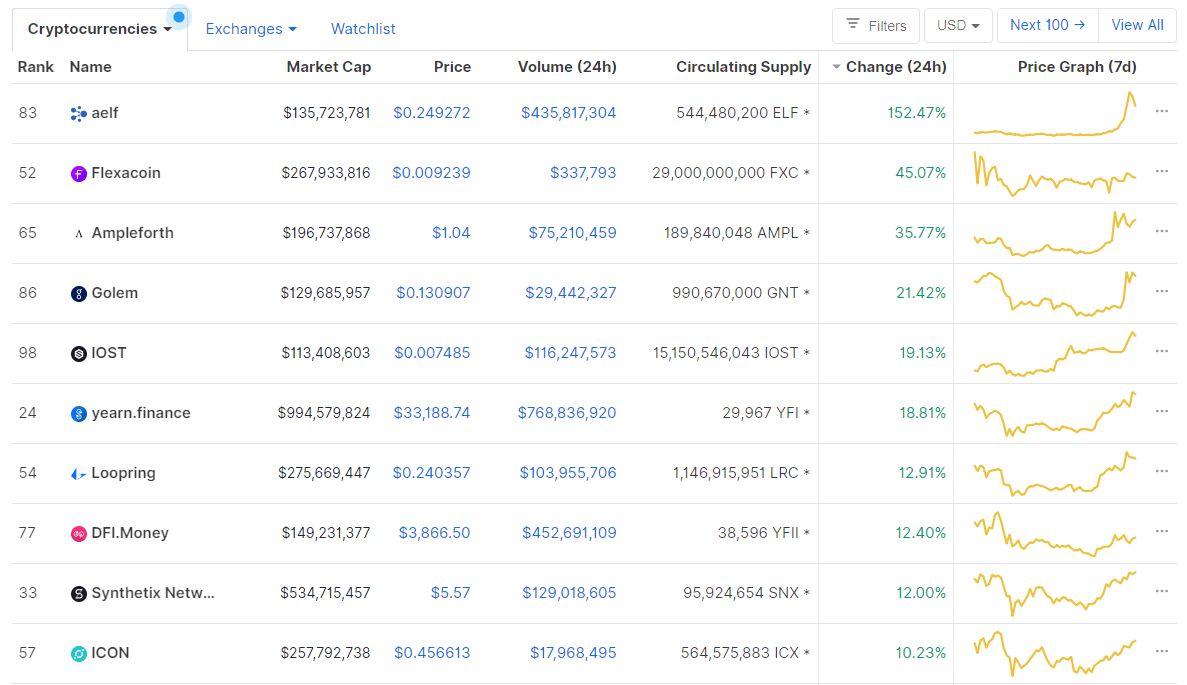
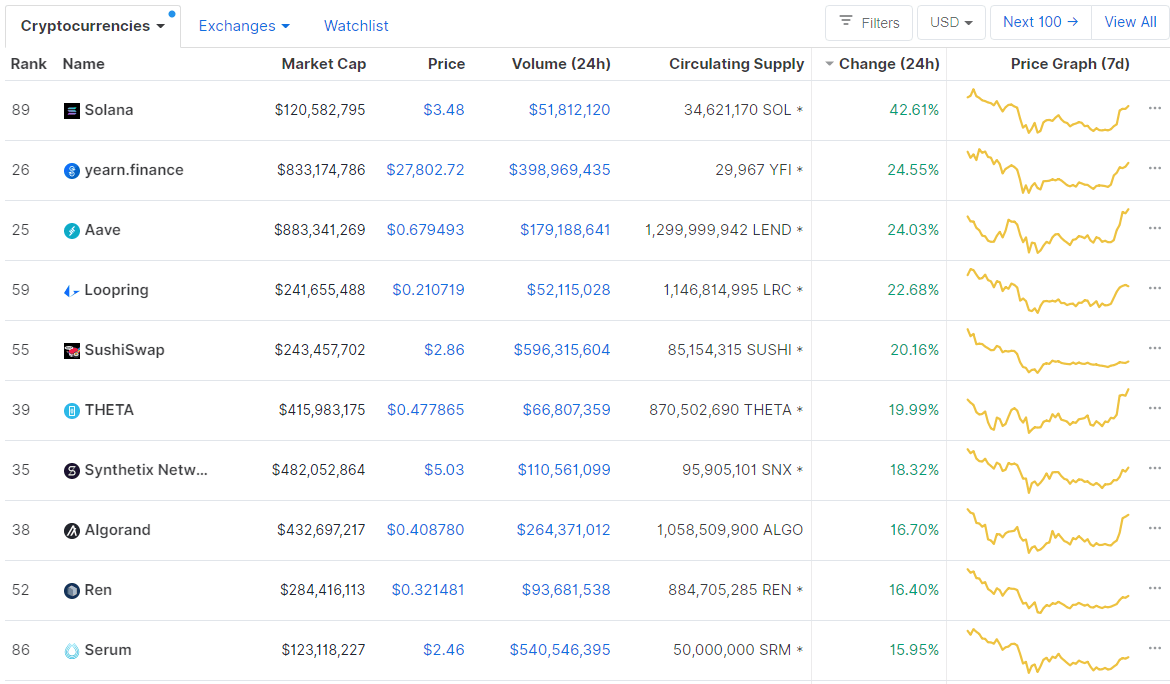
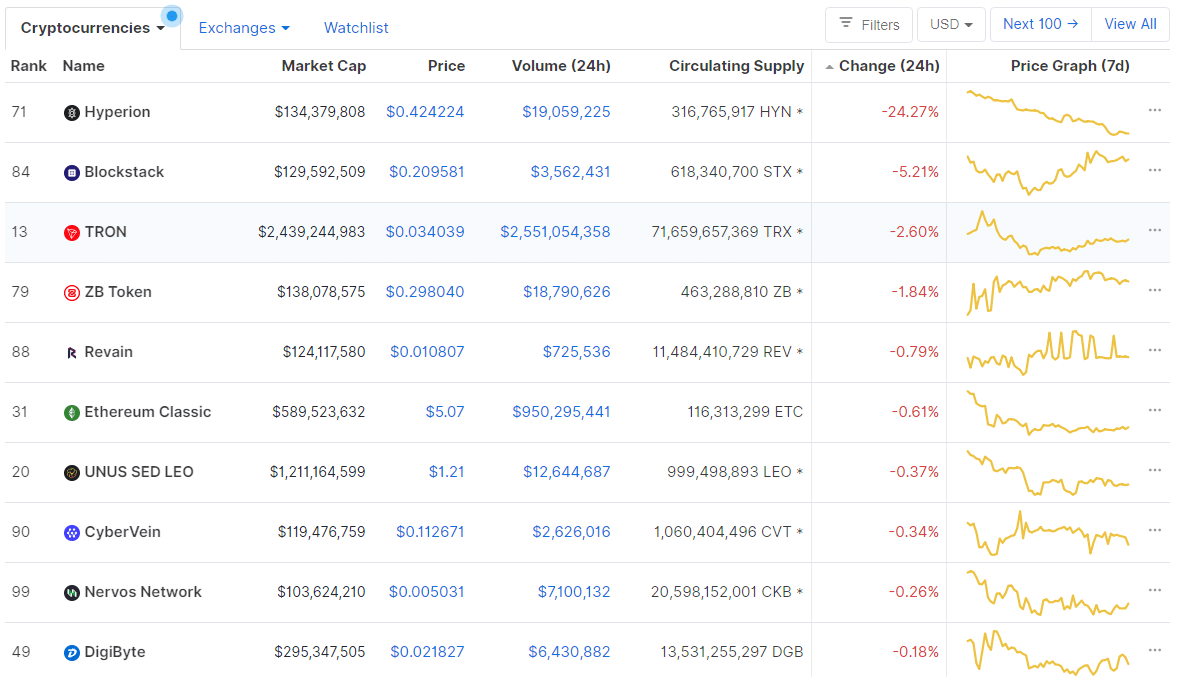
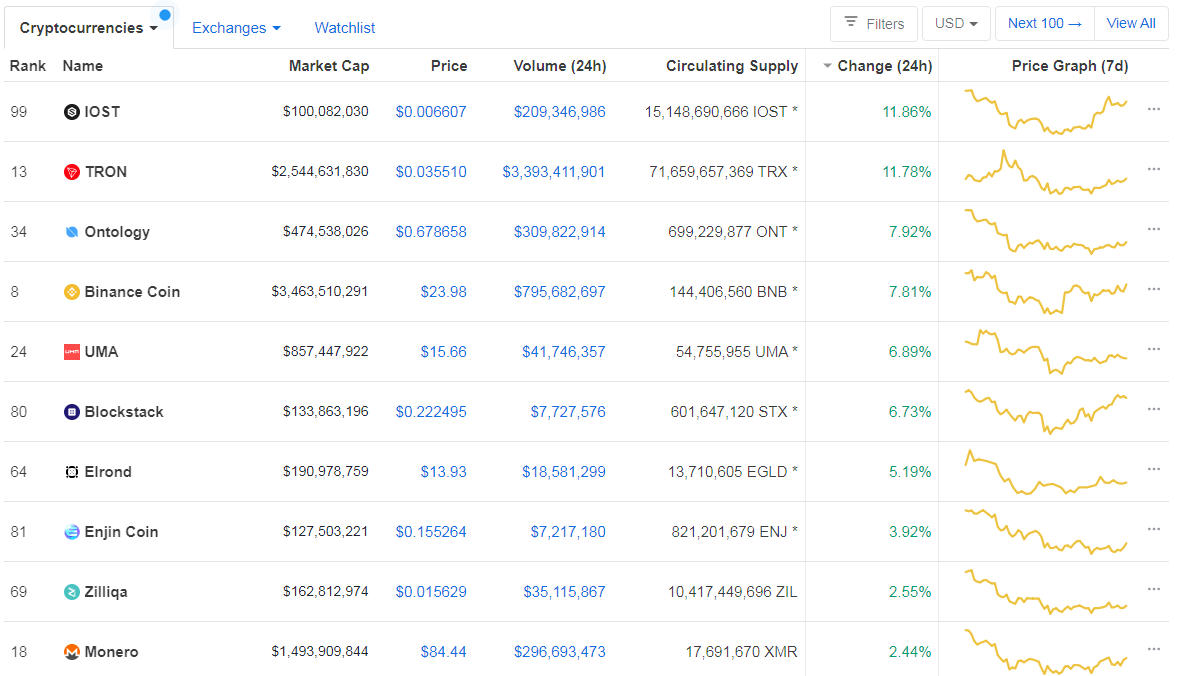
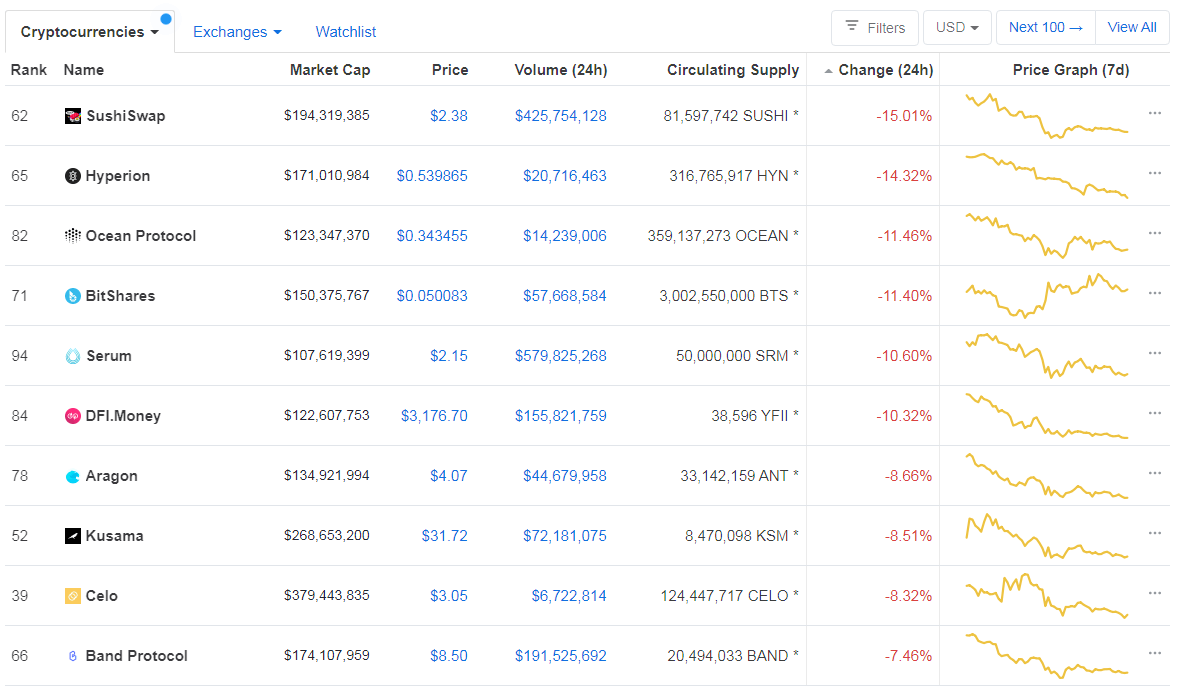
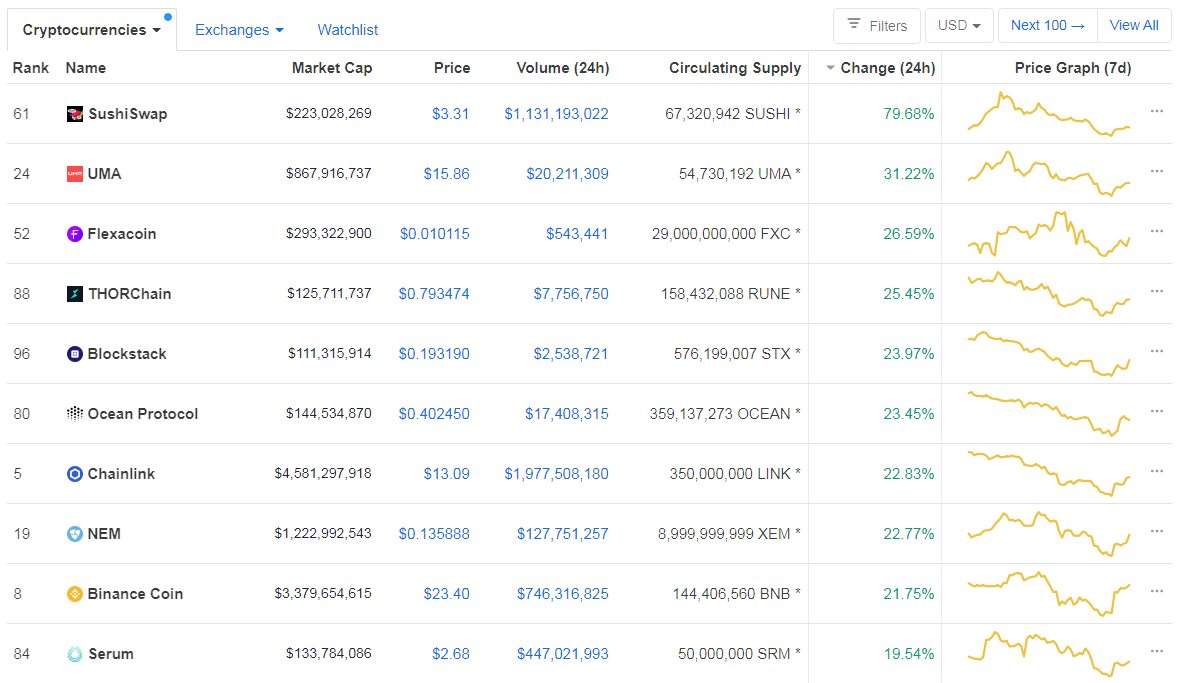
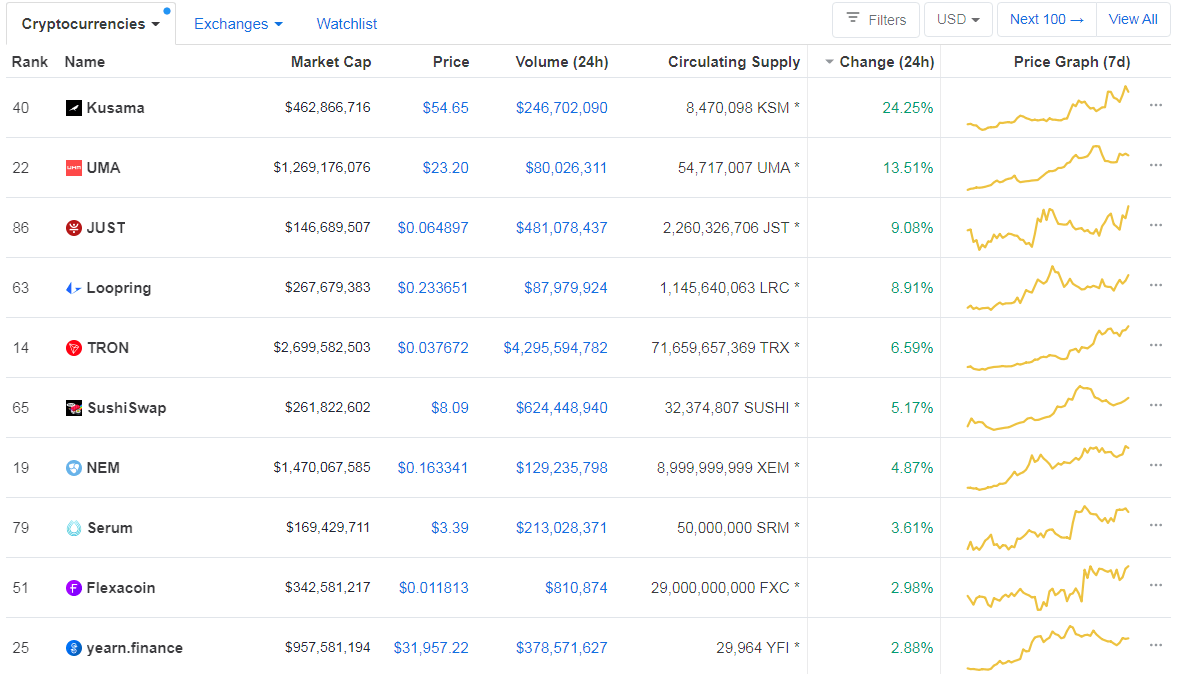
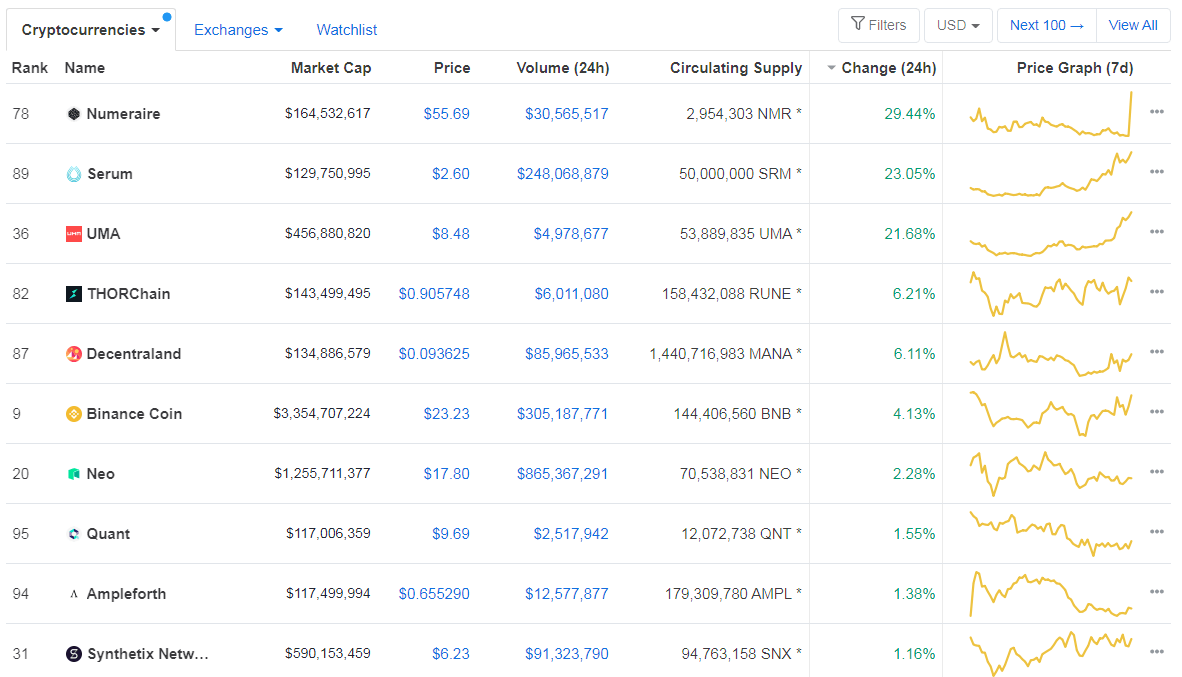
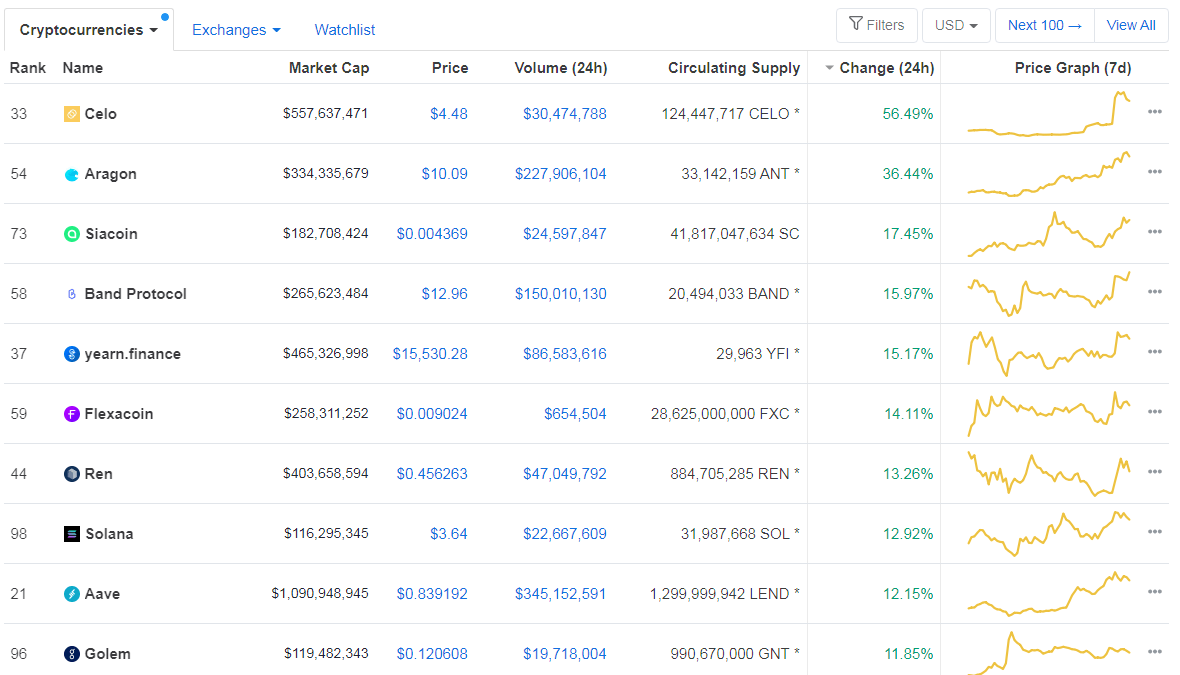
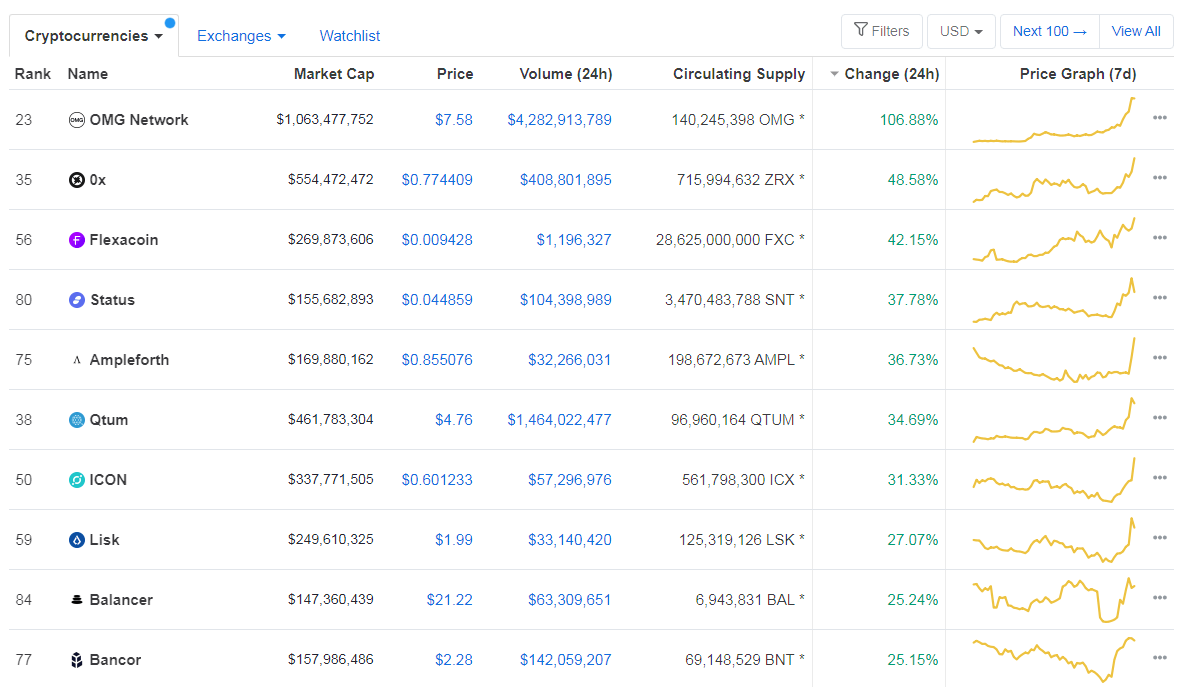
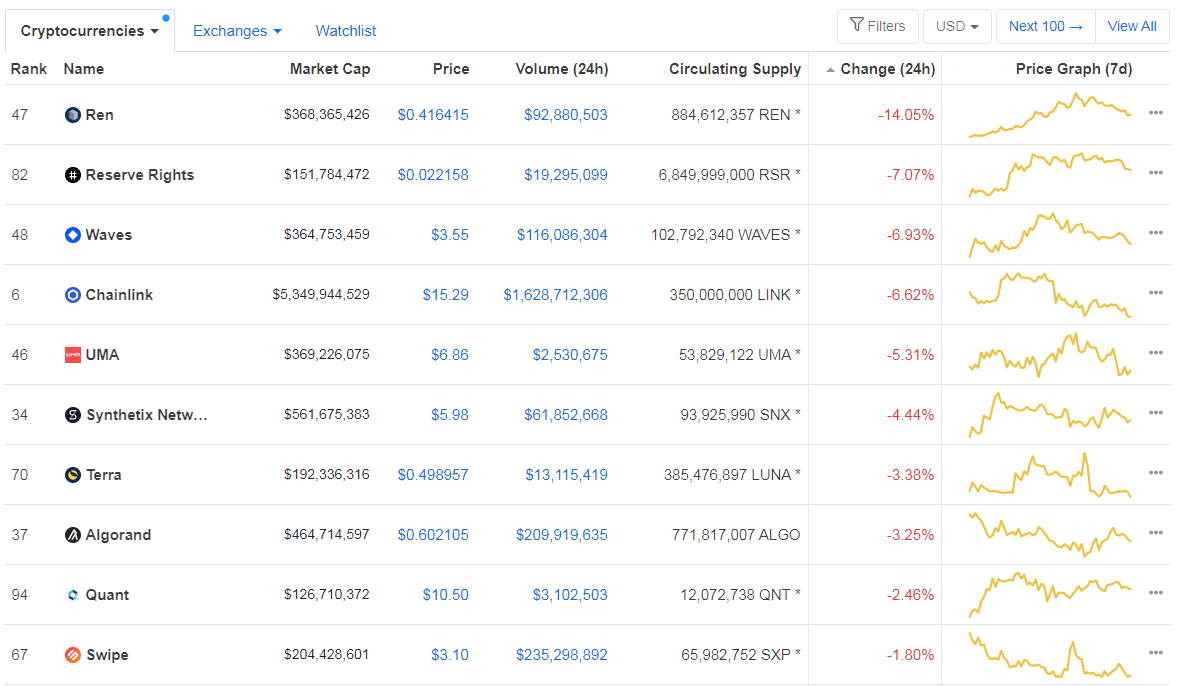
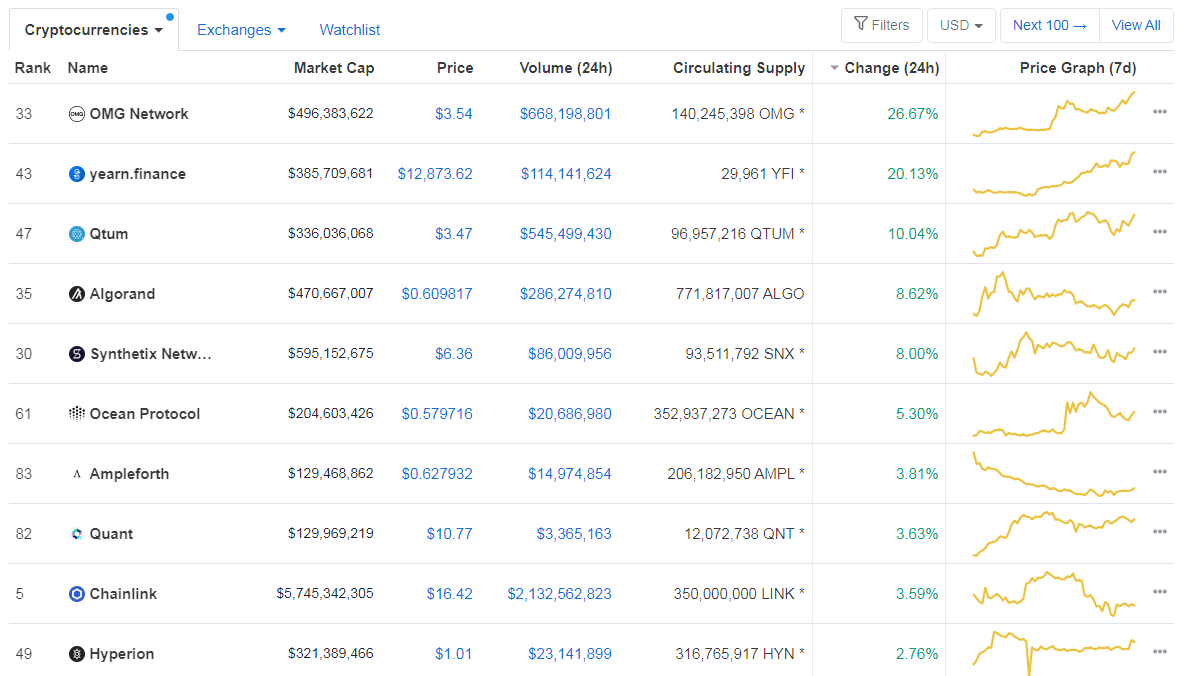
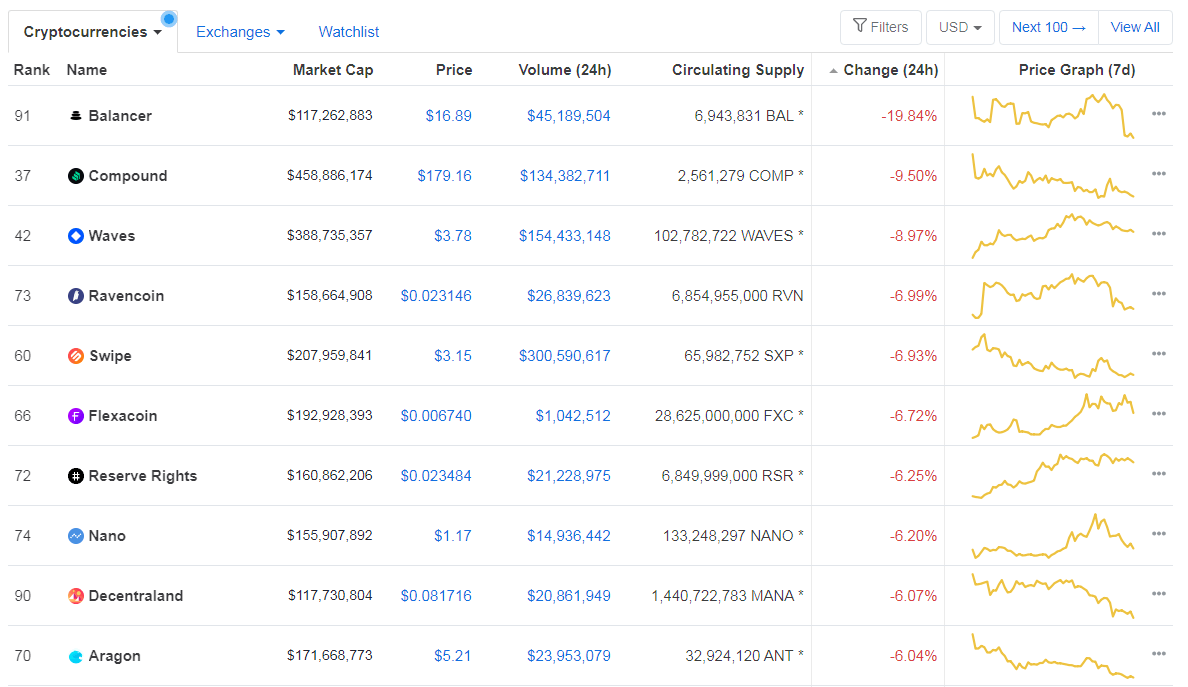
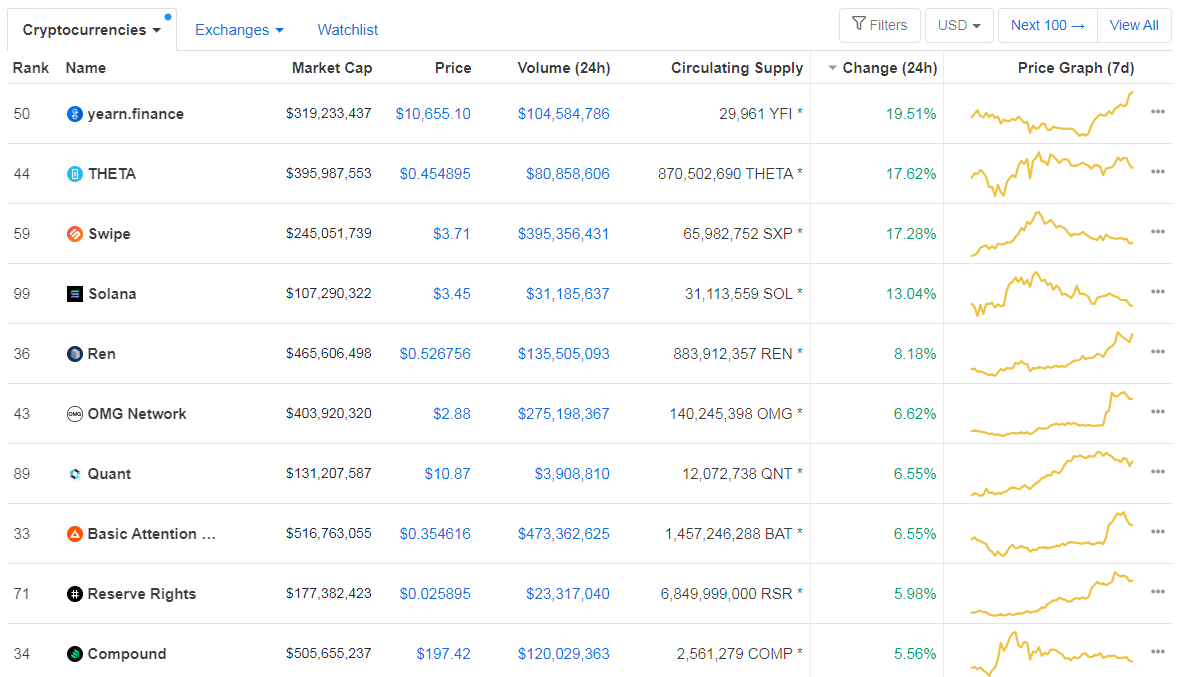
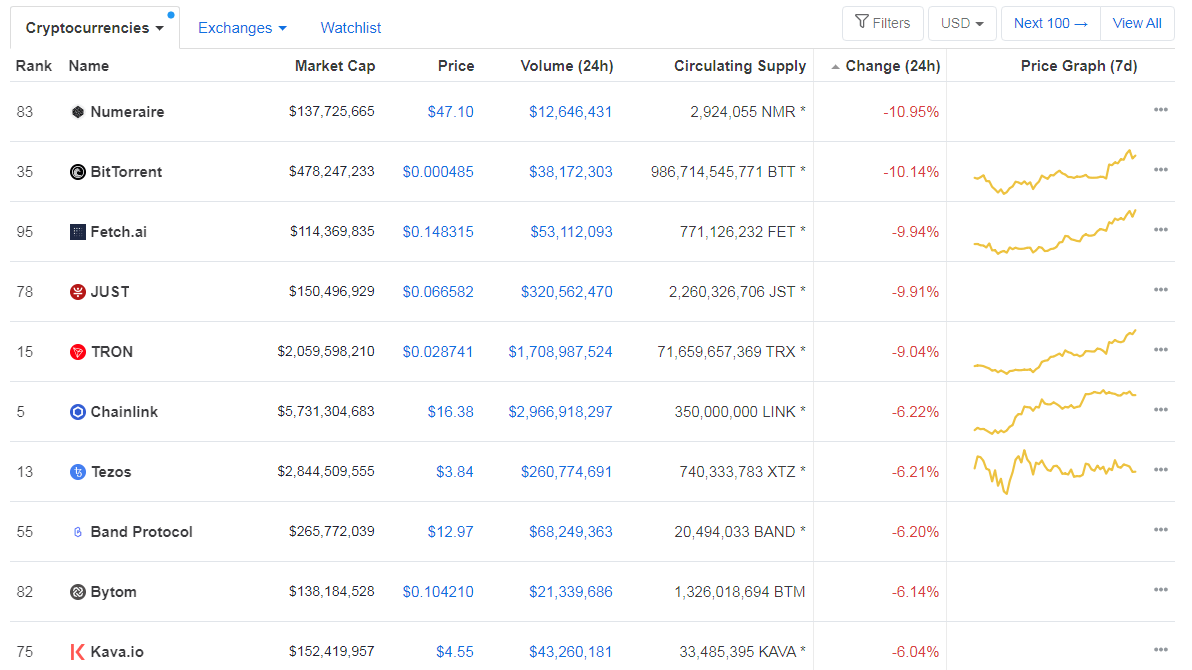
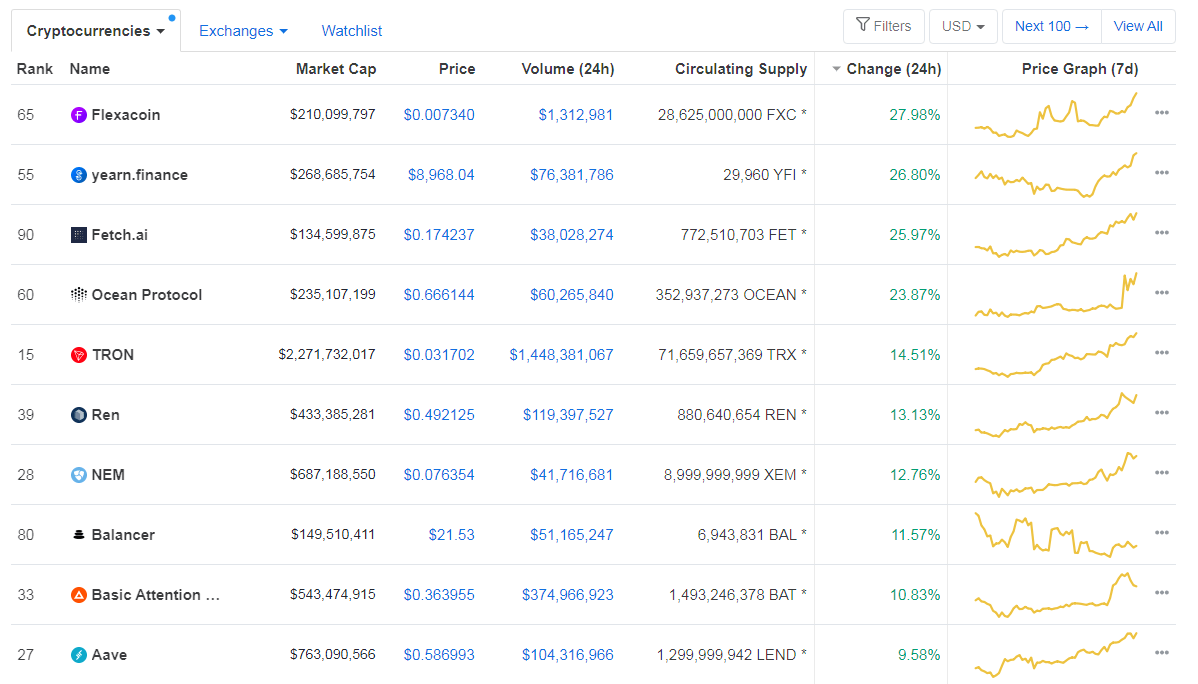
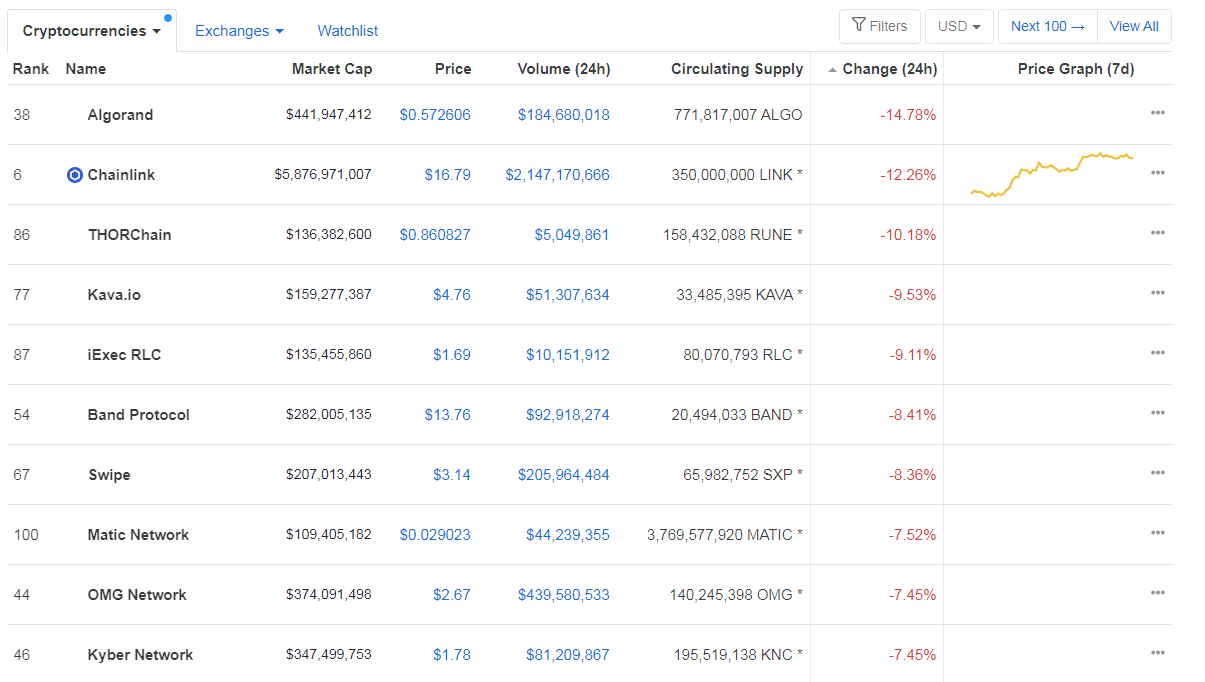
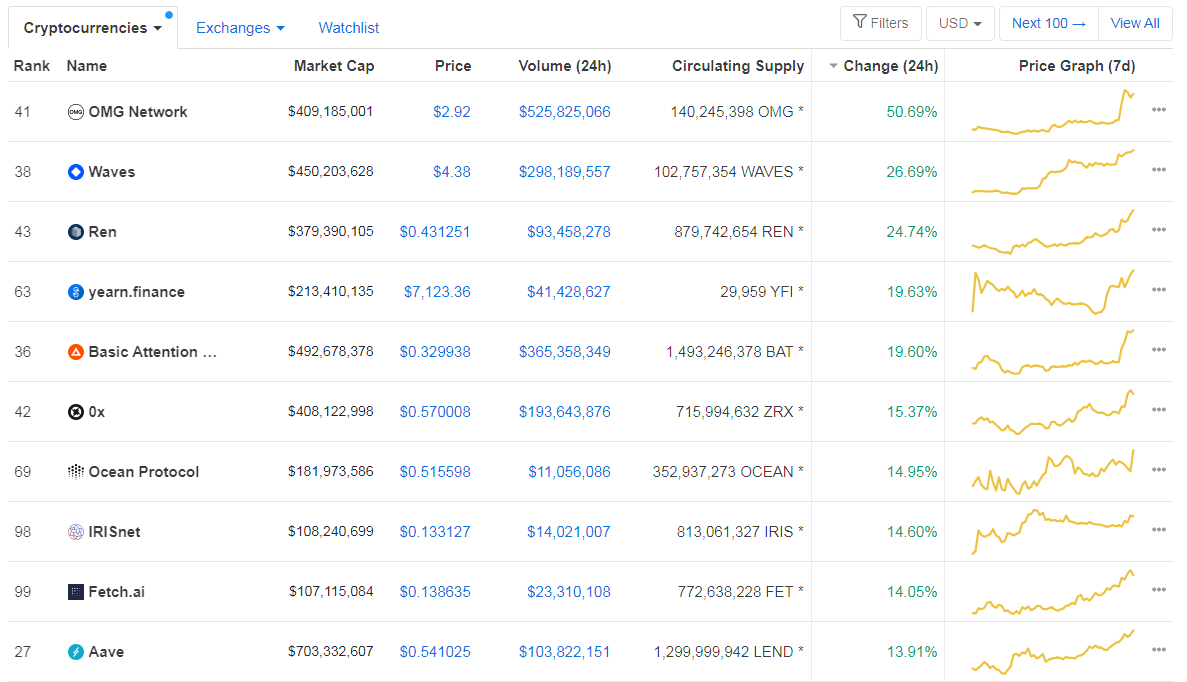
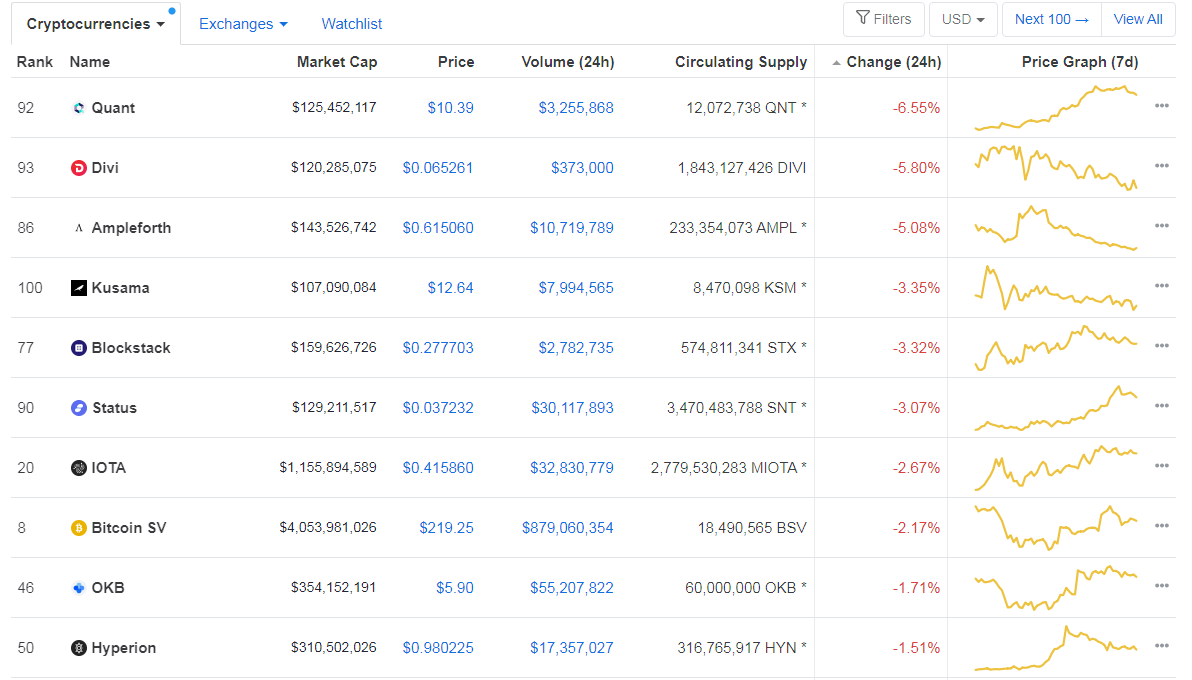
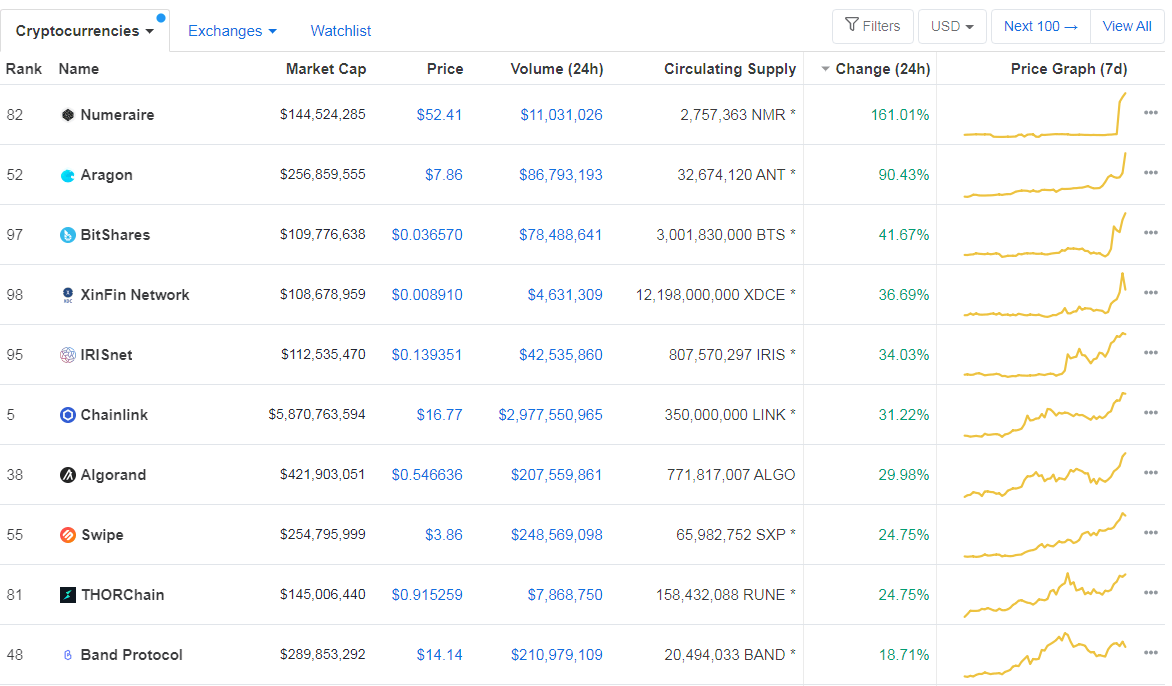
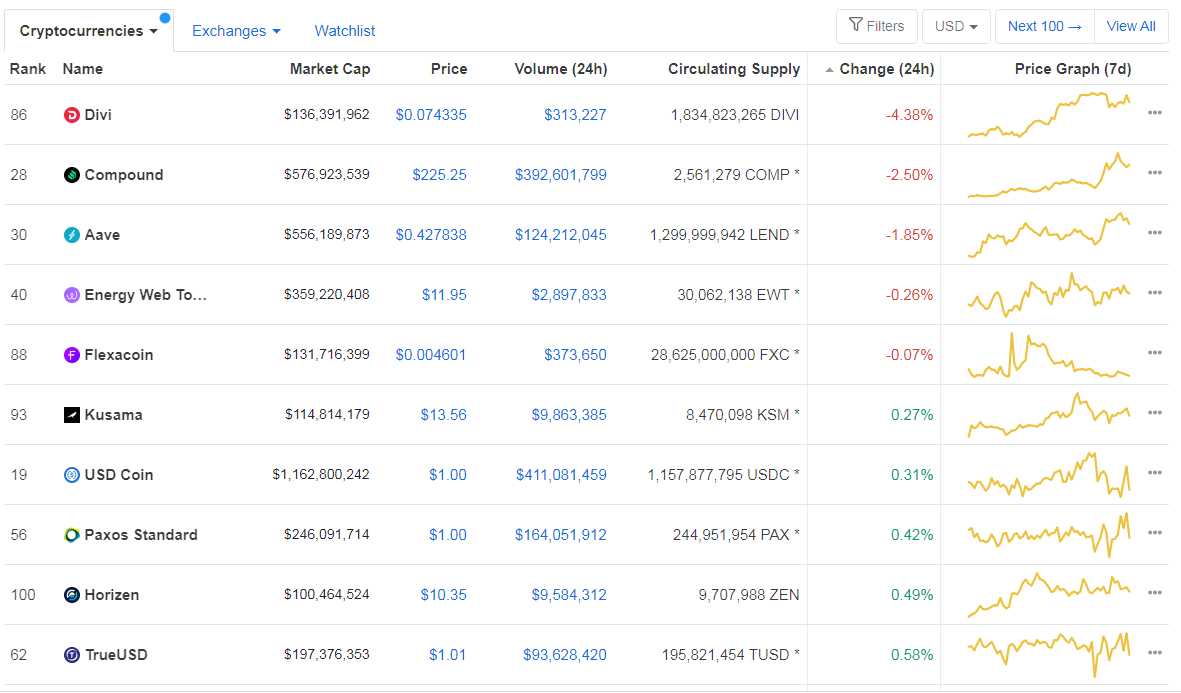
If we look at the top100 cryptocurrencies, Avalanche gained 24.96% on the day, making it the most prominent daily gainer. ABBC Coin (22.9%) and Arweave (18.7%) also did great. On the other hand, Hyperion lost 3.05%, making it the most prominent daily loser. It is followed by CyberVein’s loss of 2.76% and Reserve Paxos Standard’s loss of 0.4%.
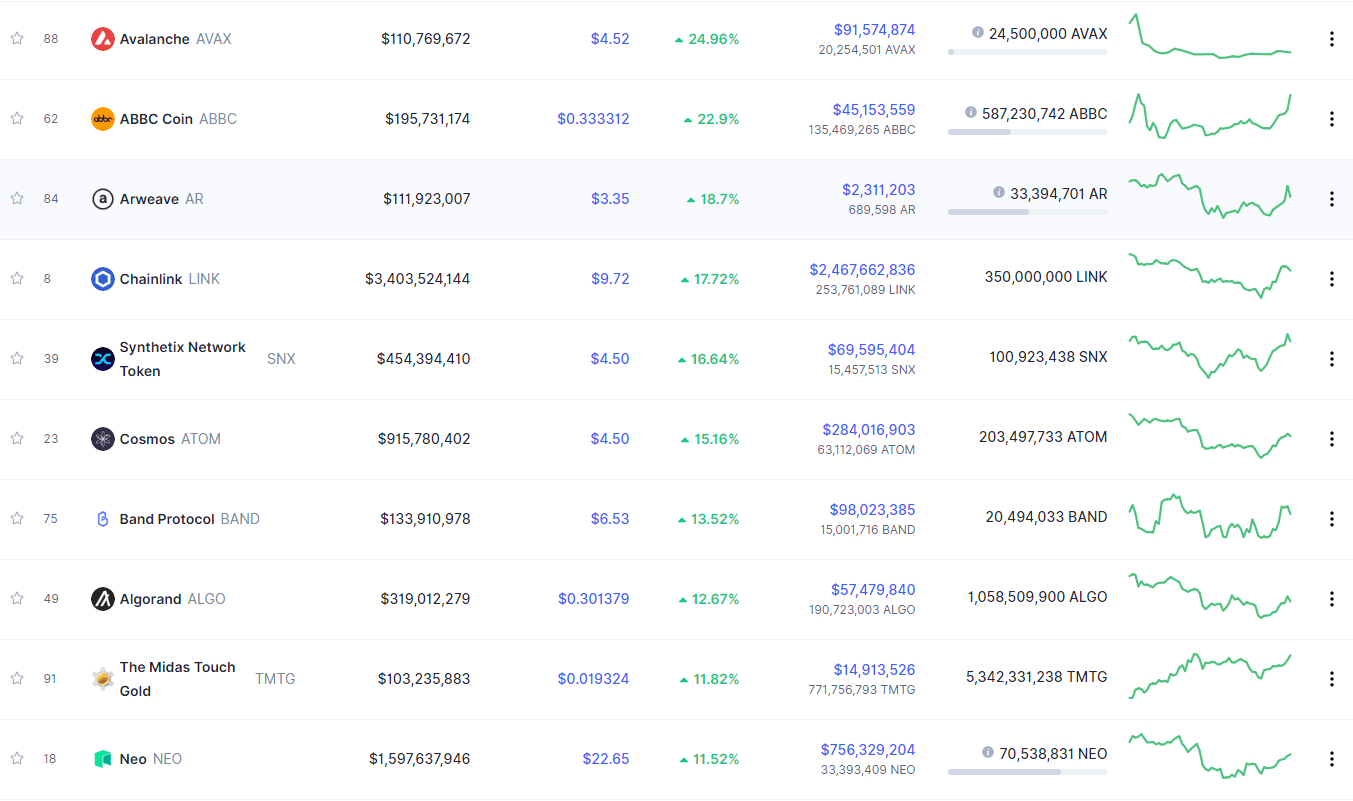
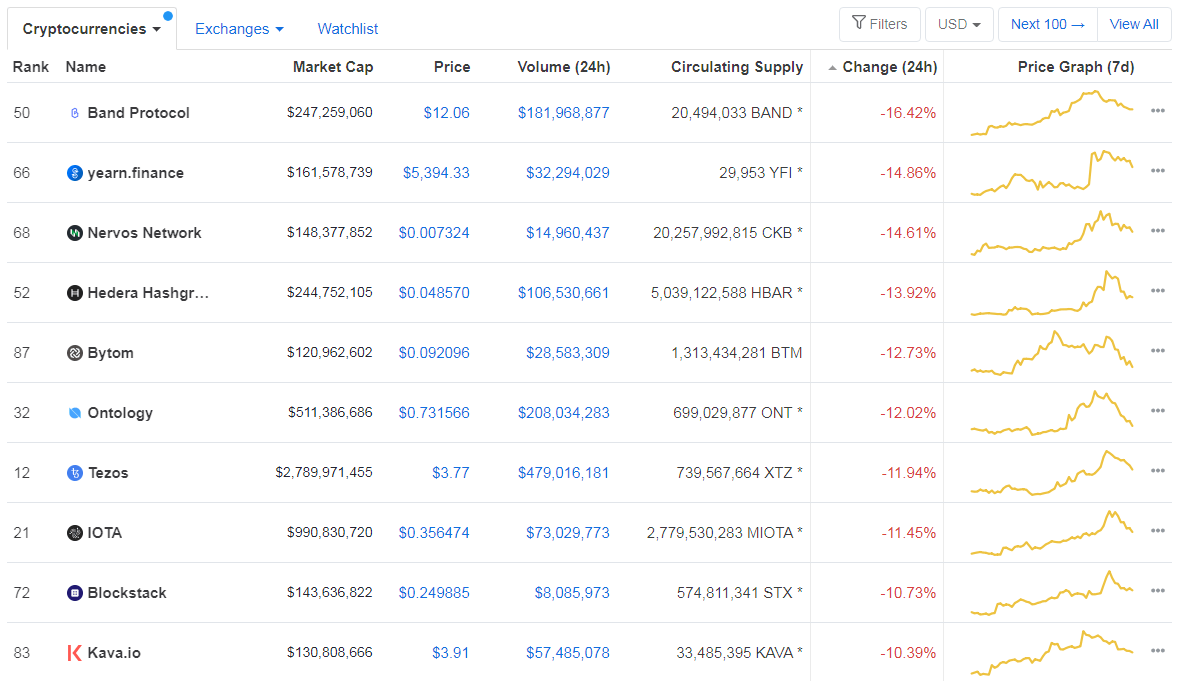
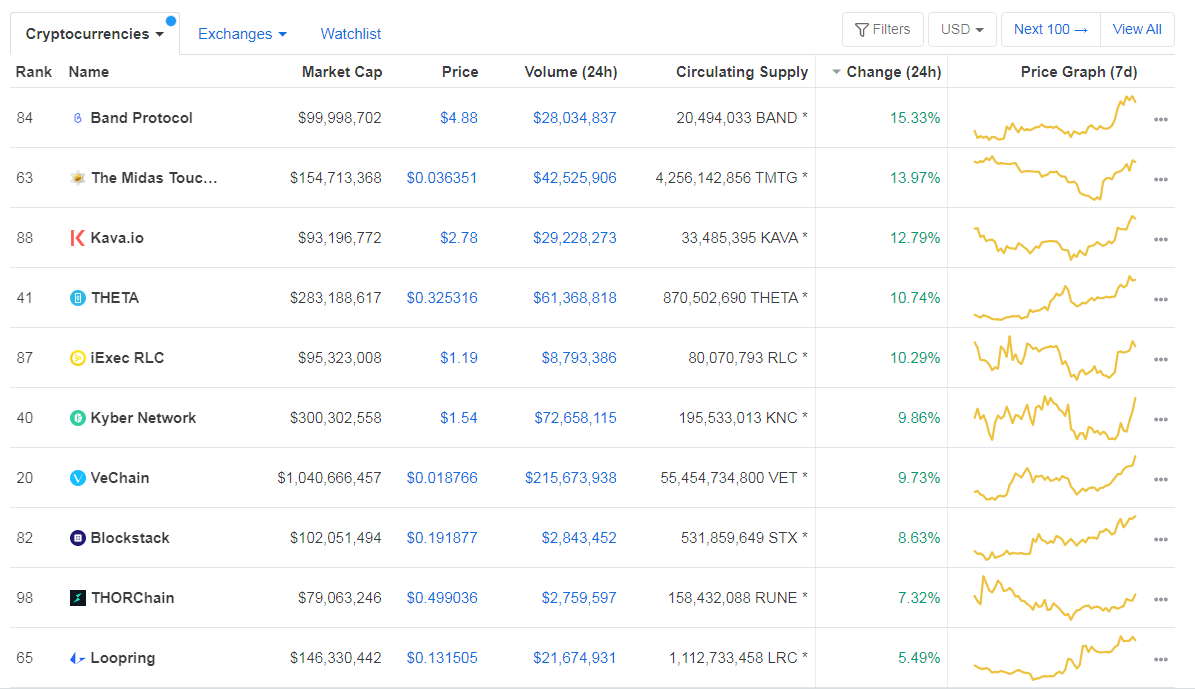
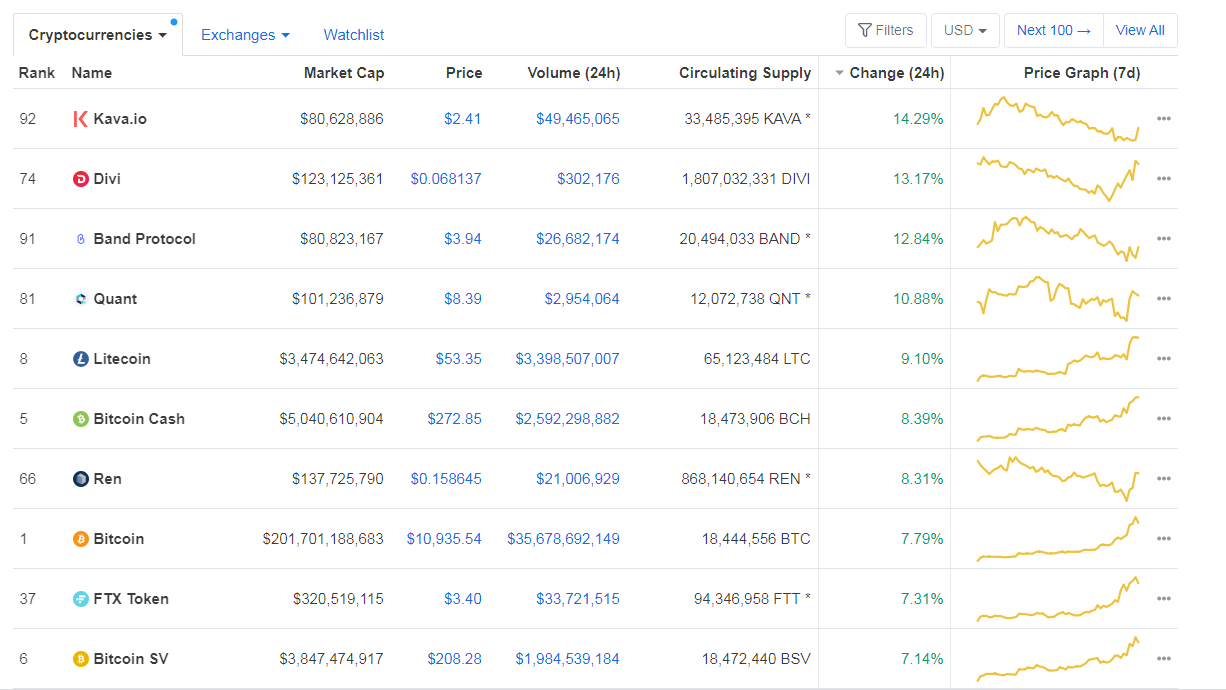
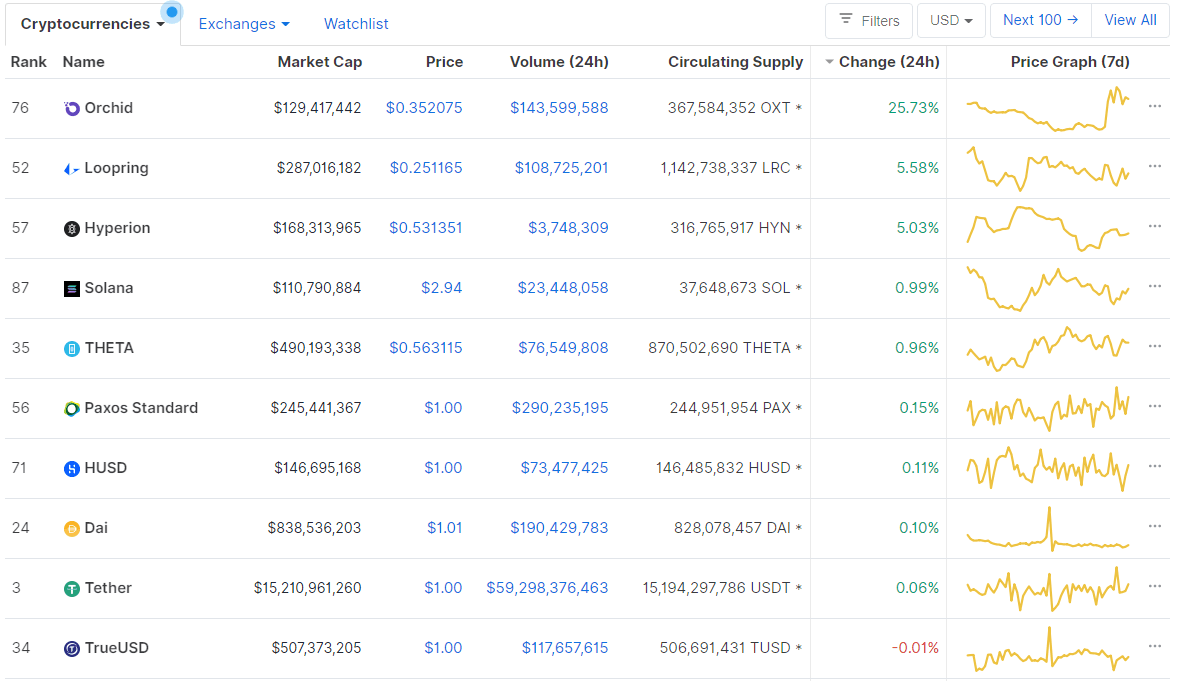
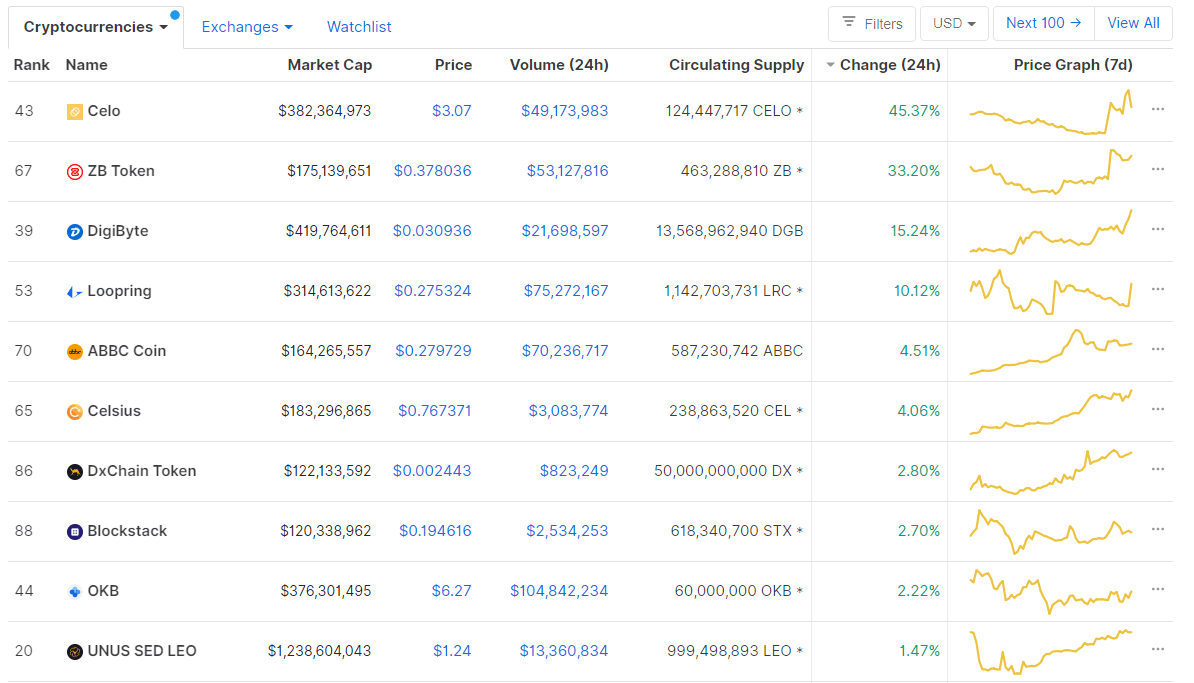
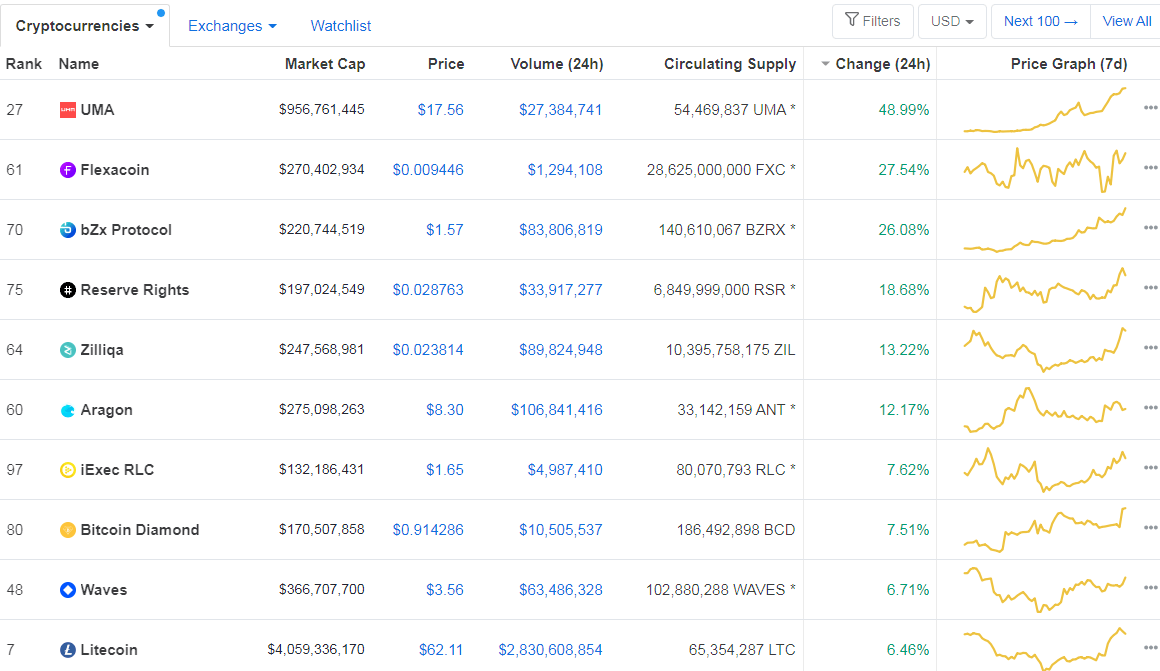
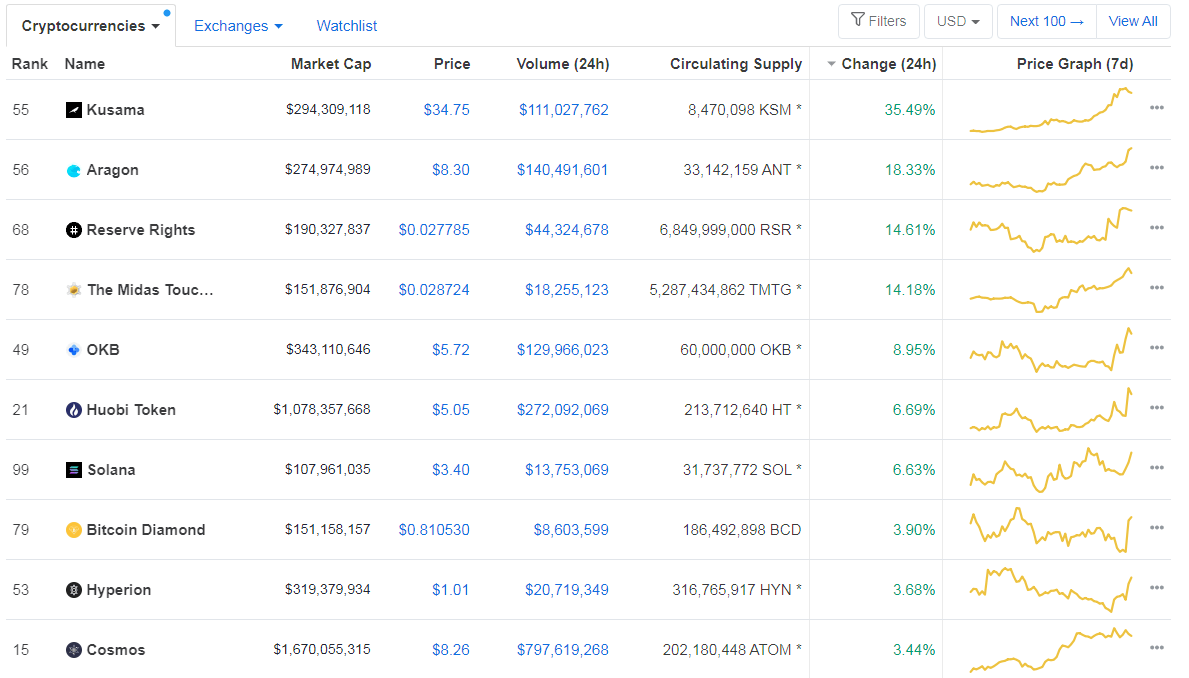
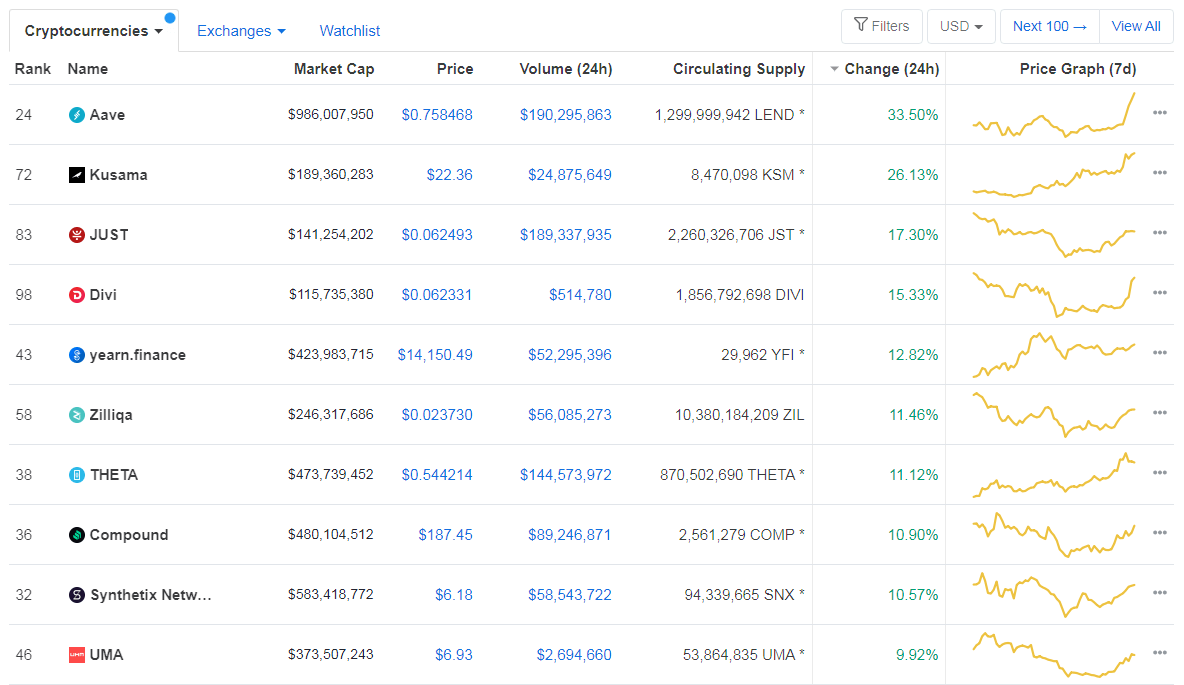
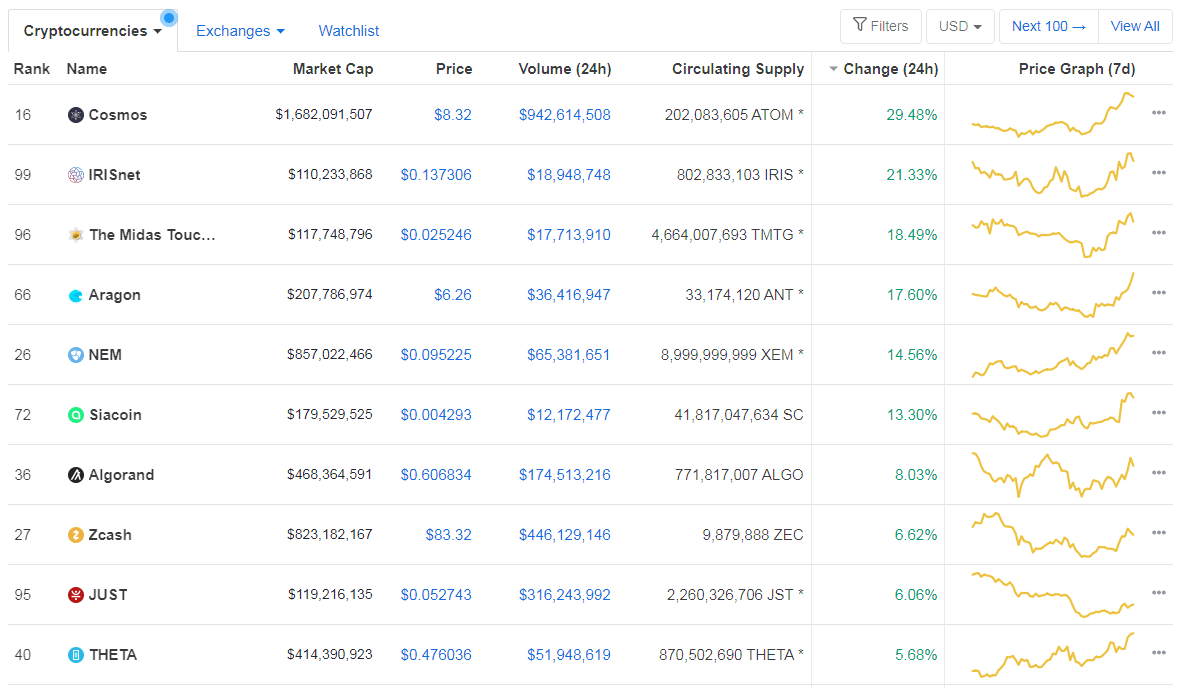
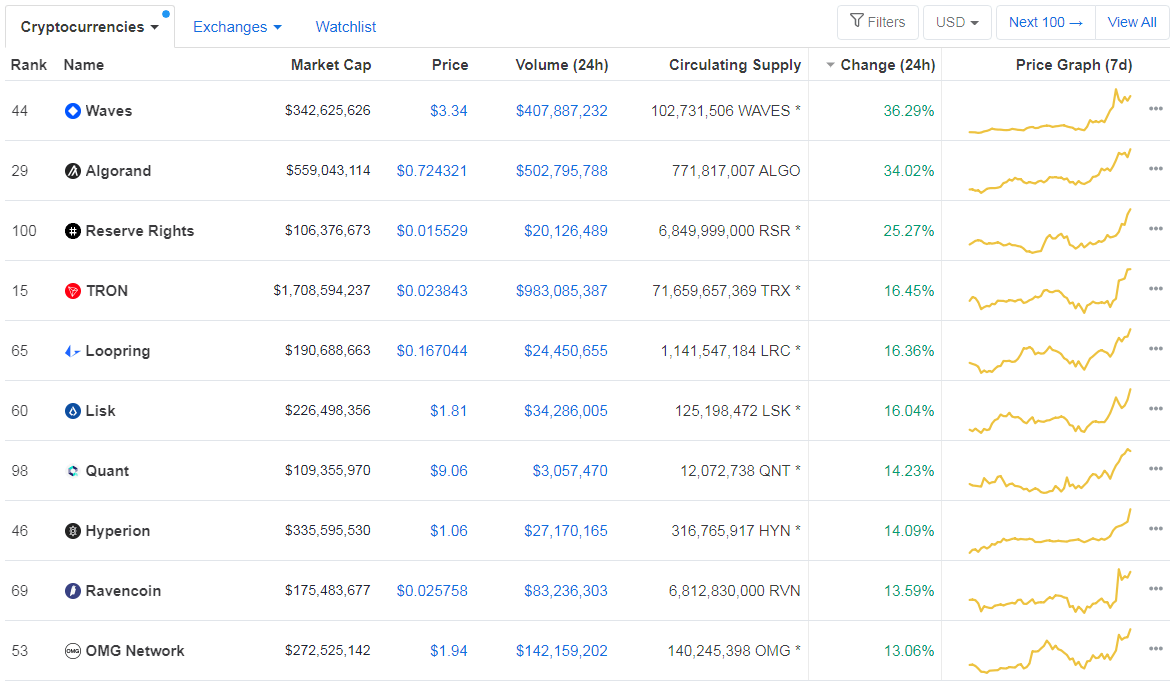
Top 10 24-hour Performers (Click to enlarge)
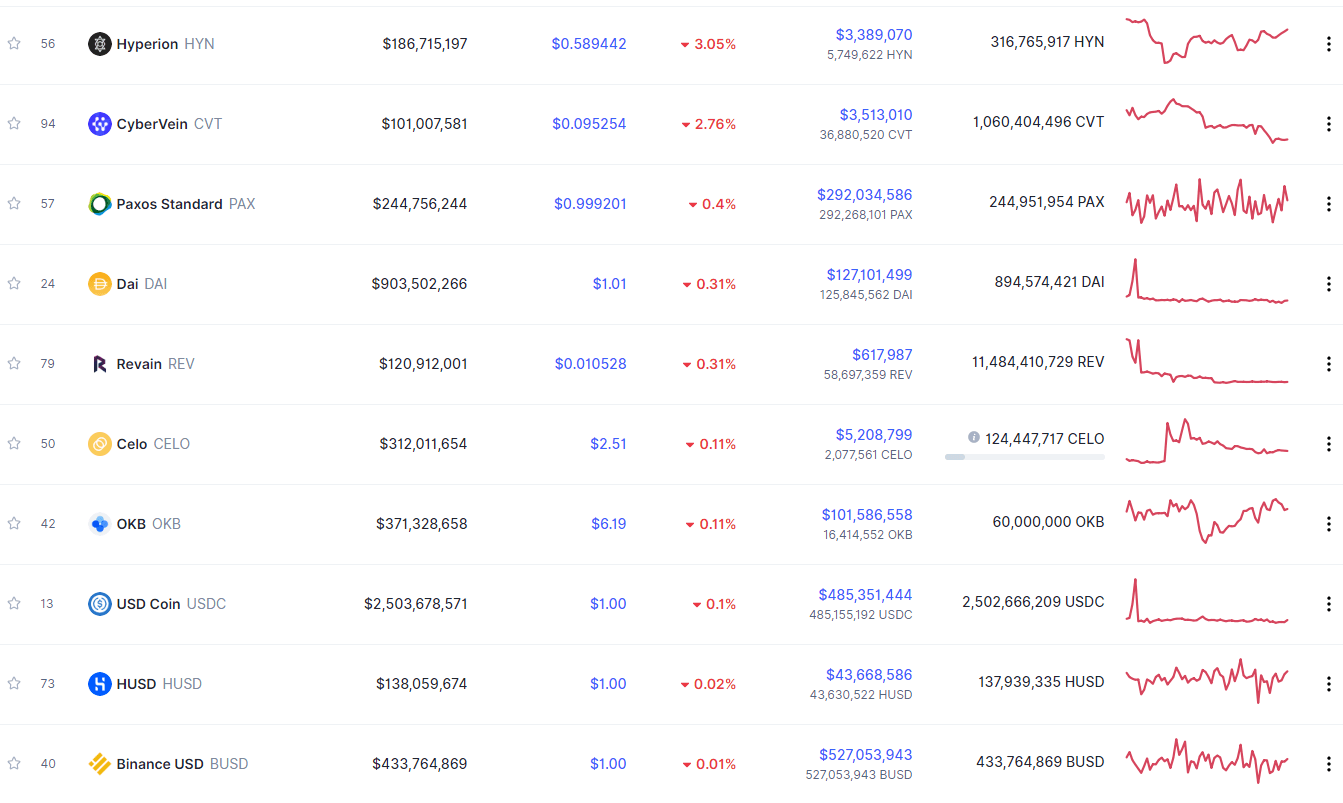
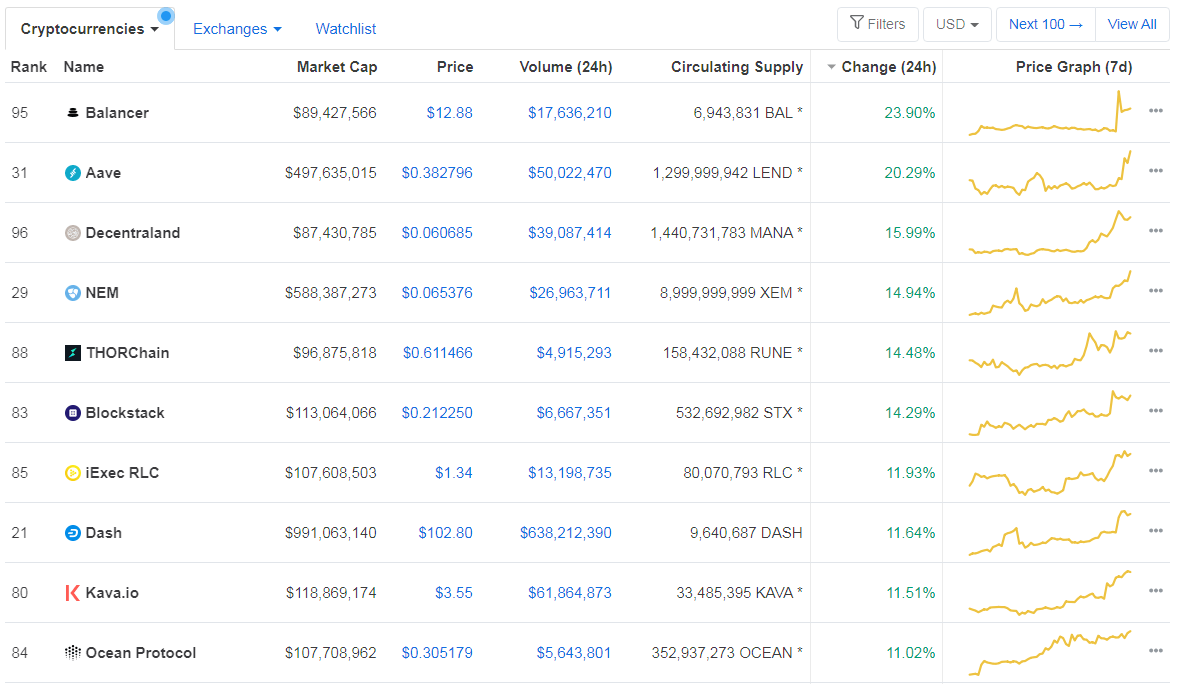
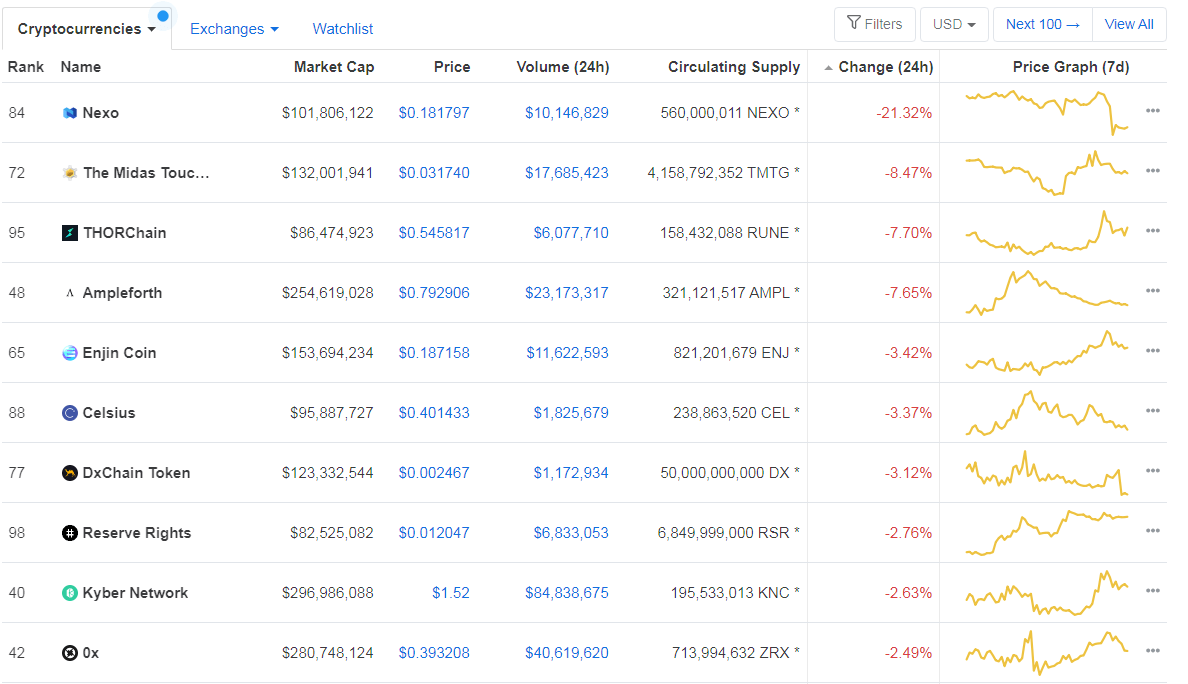
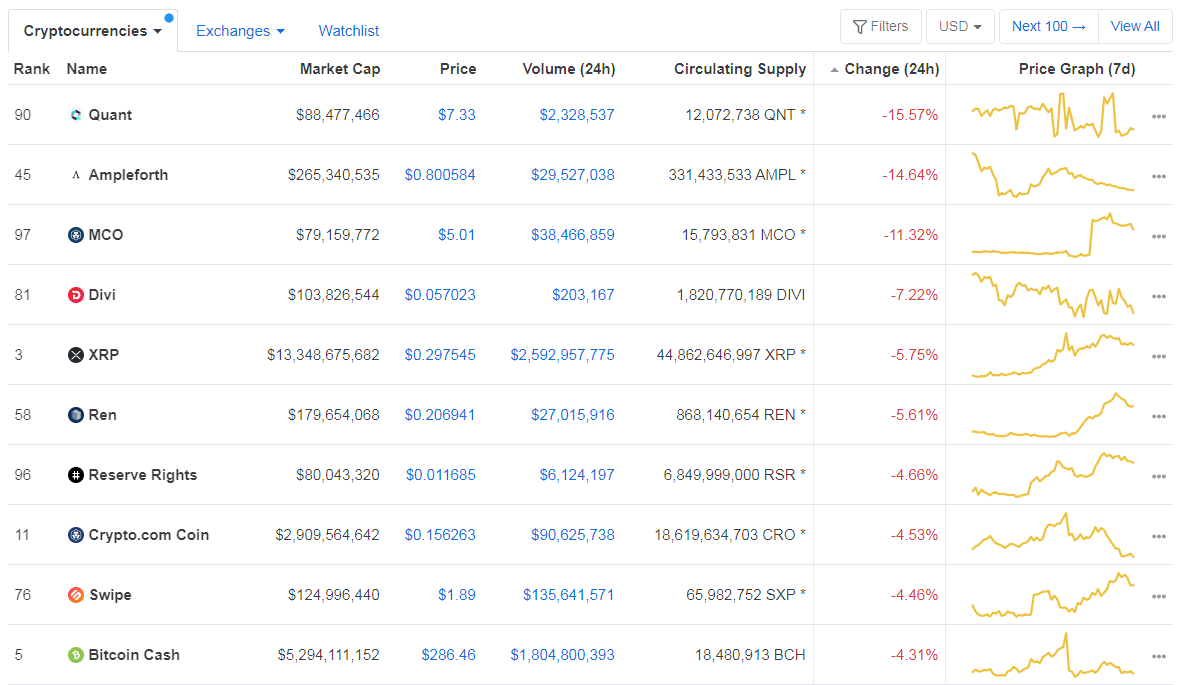
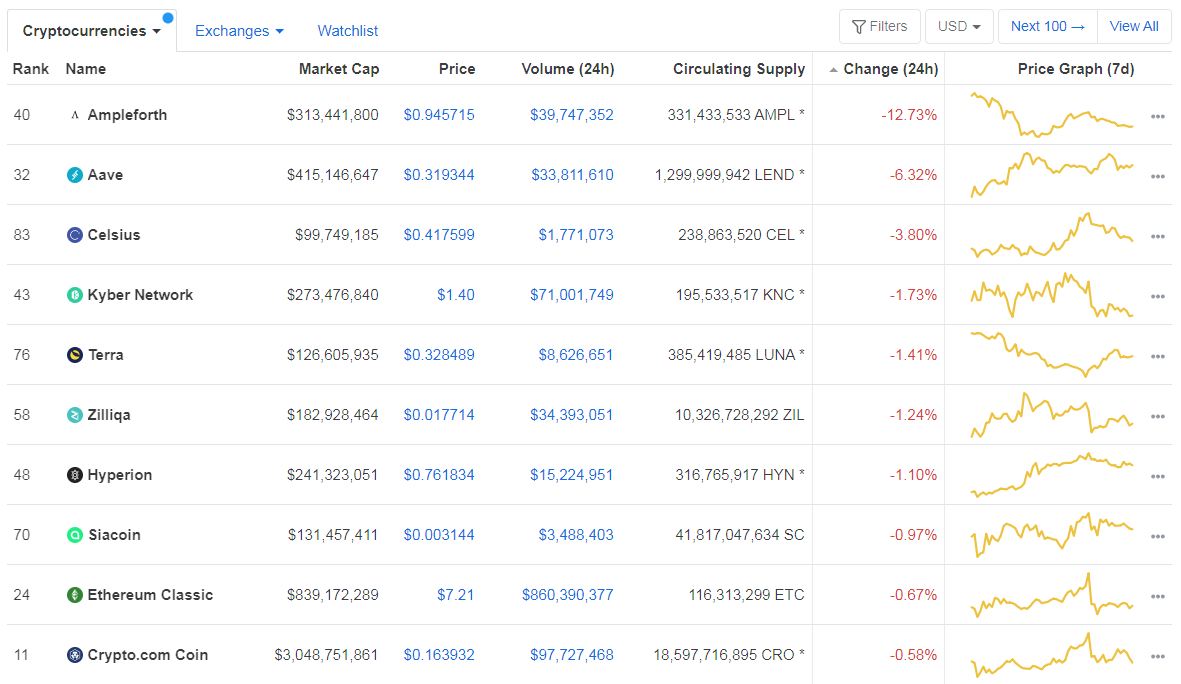
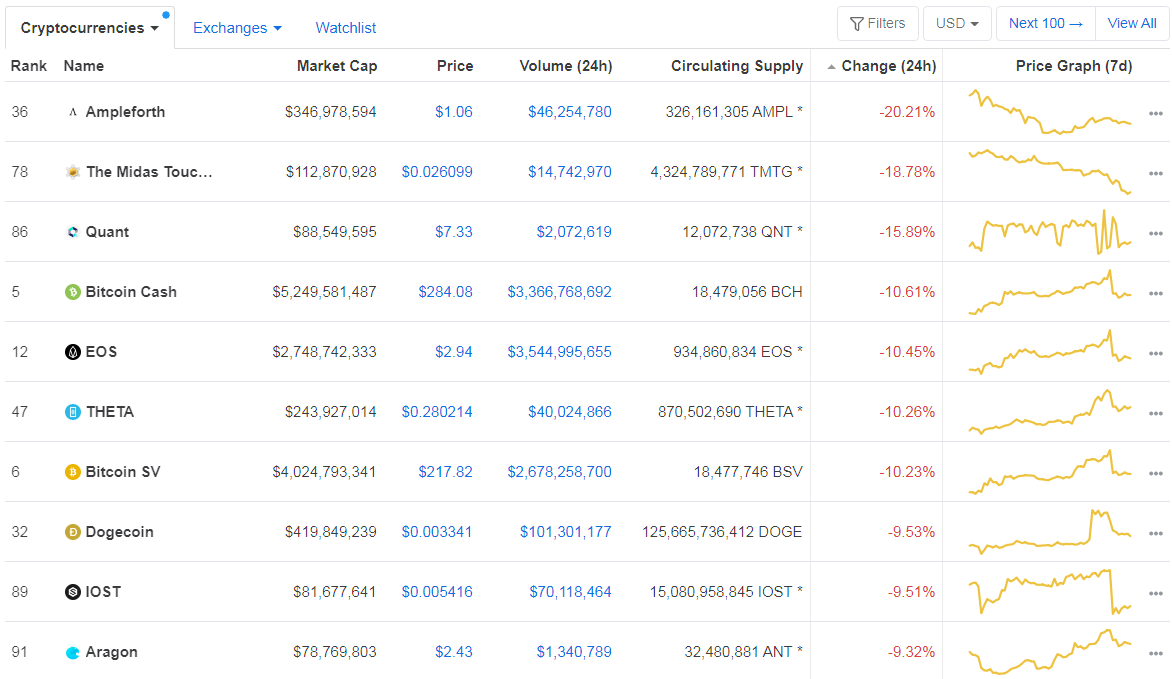
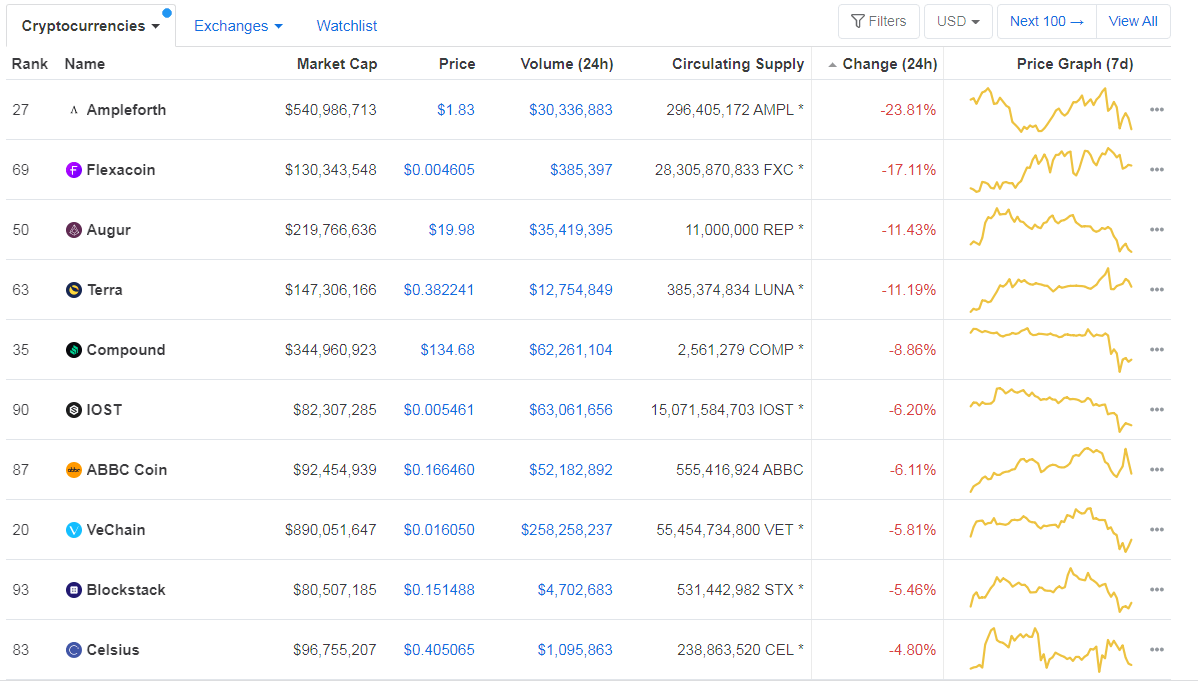
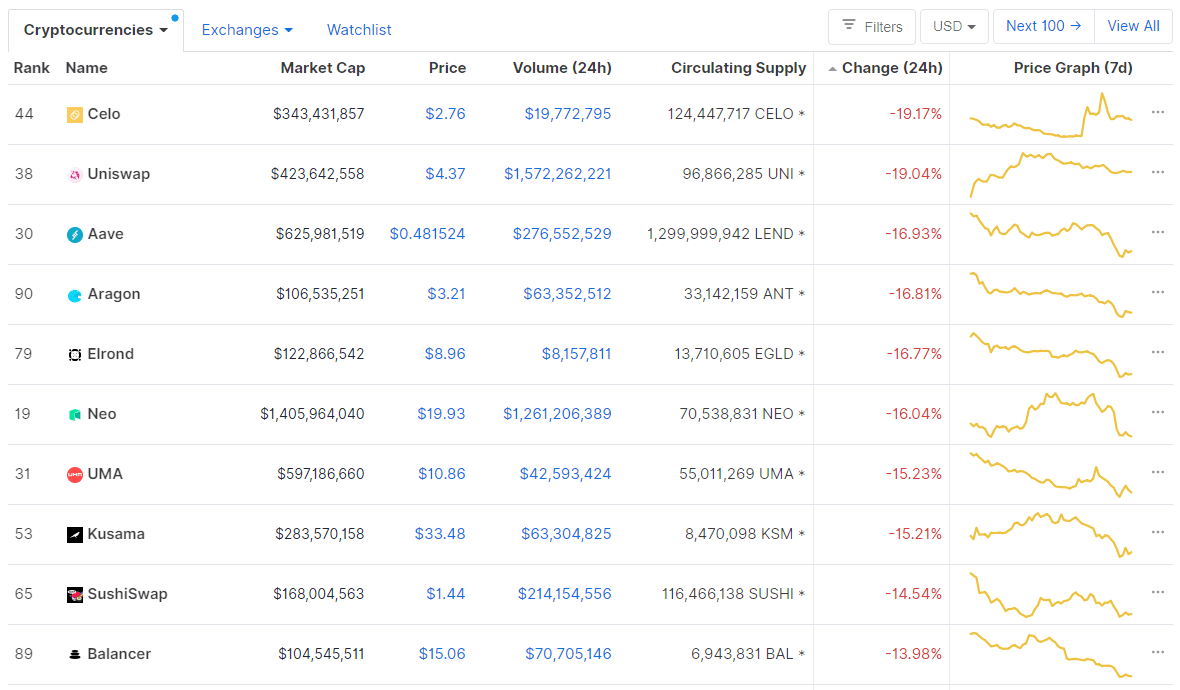
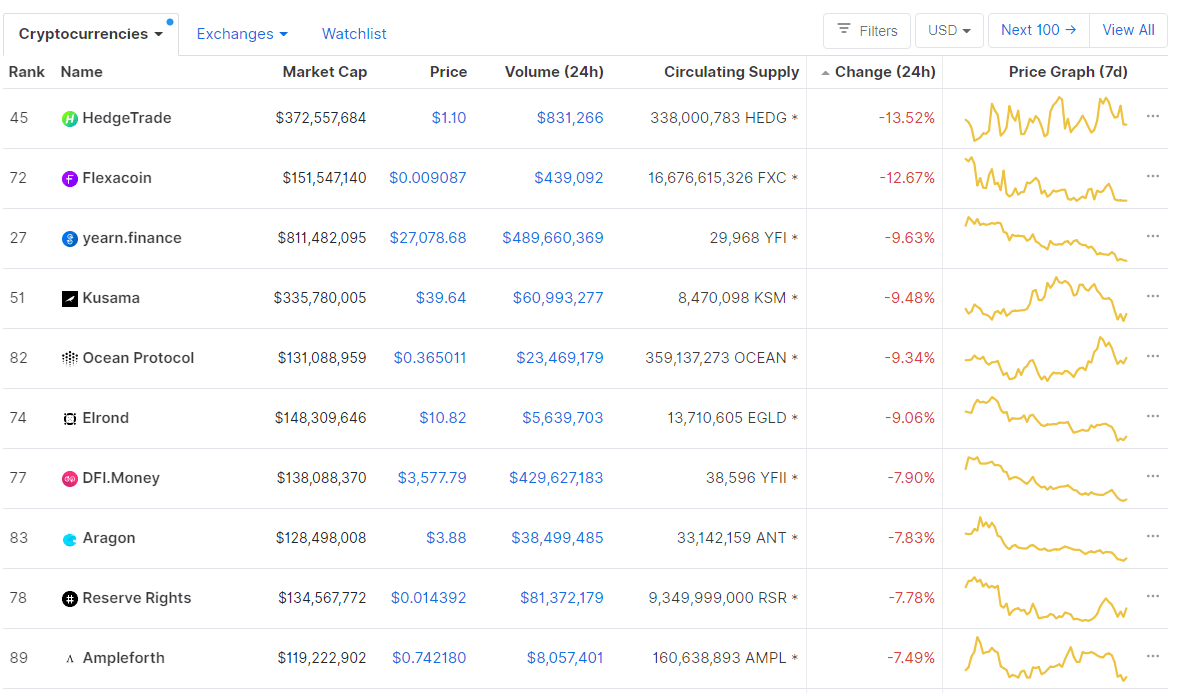
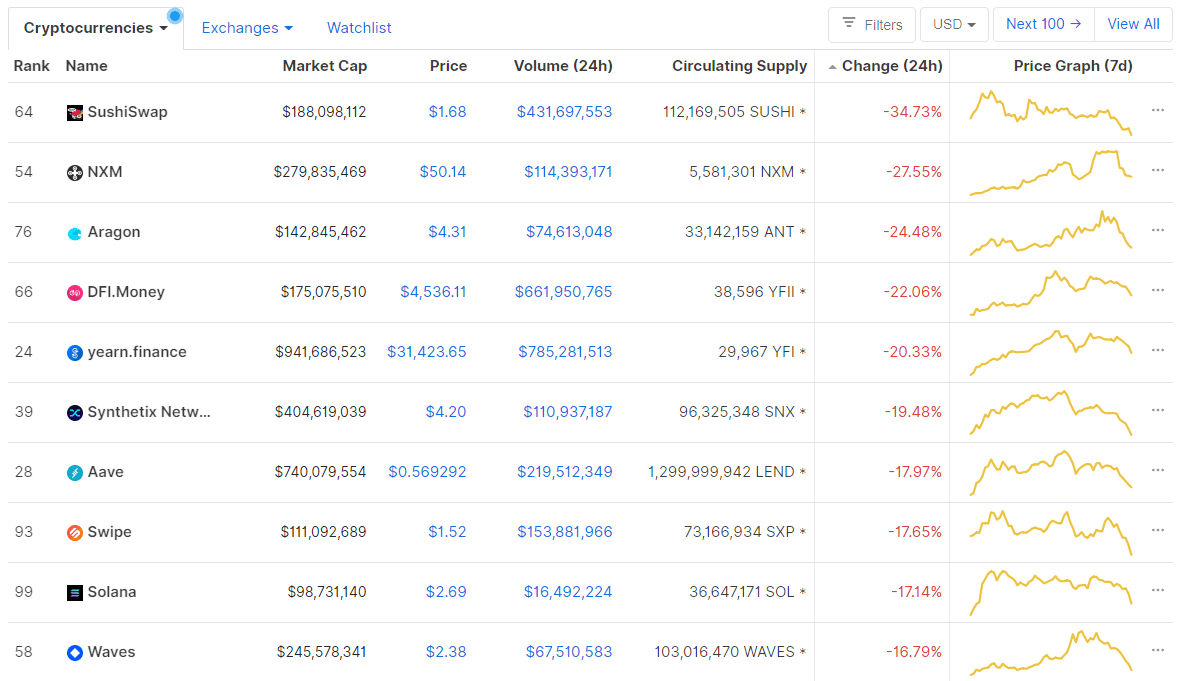
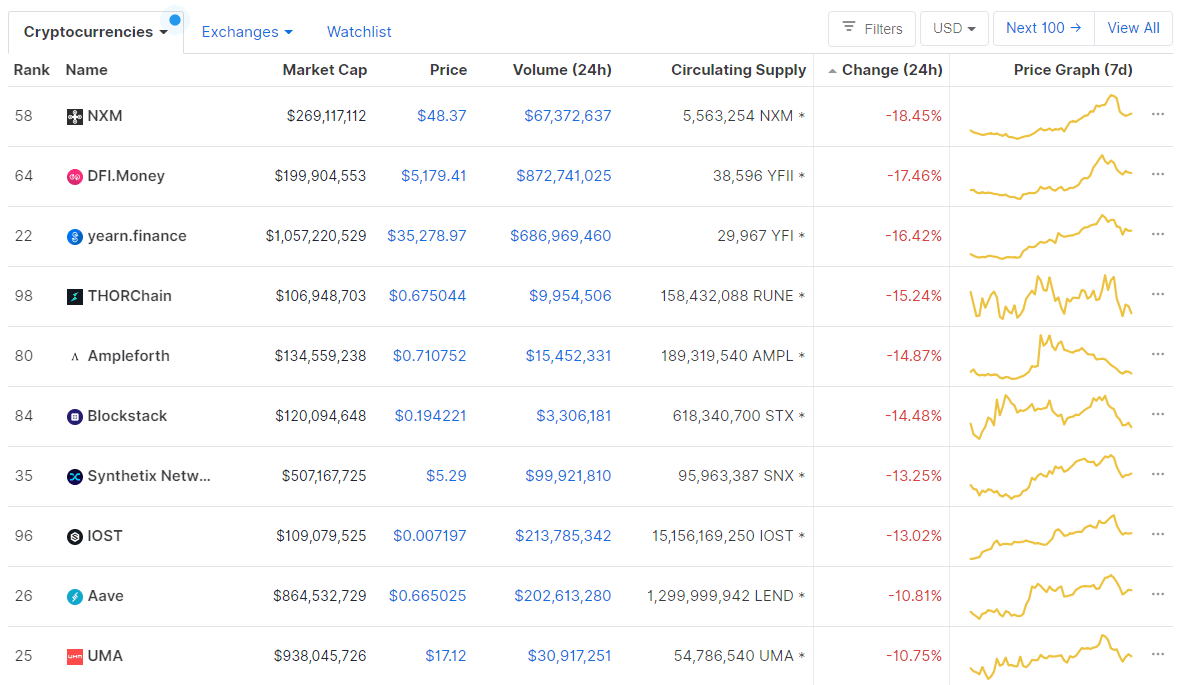
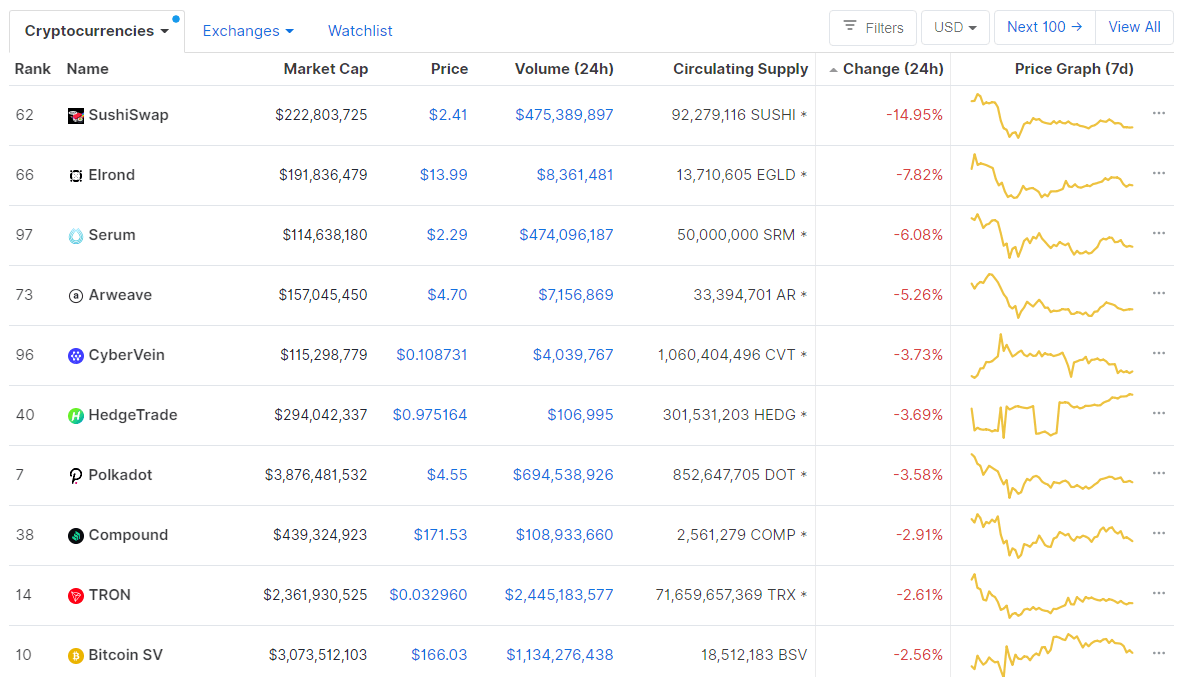
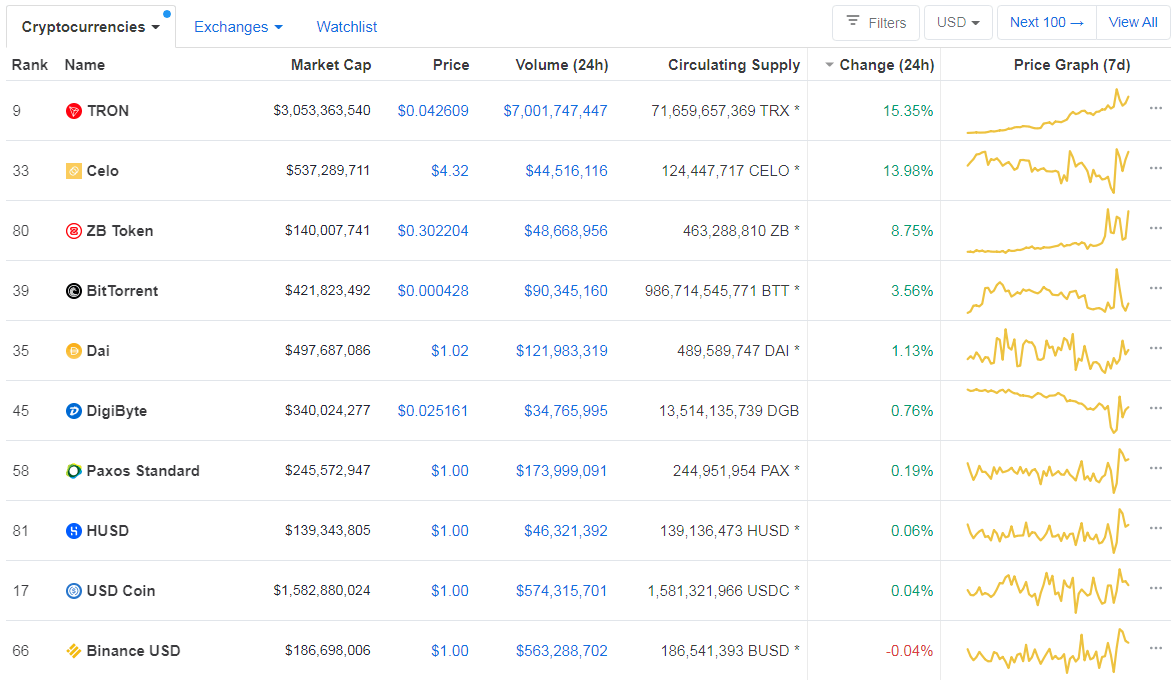
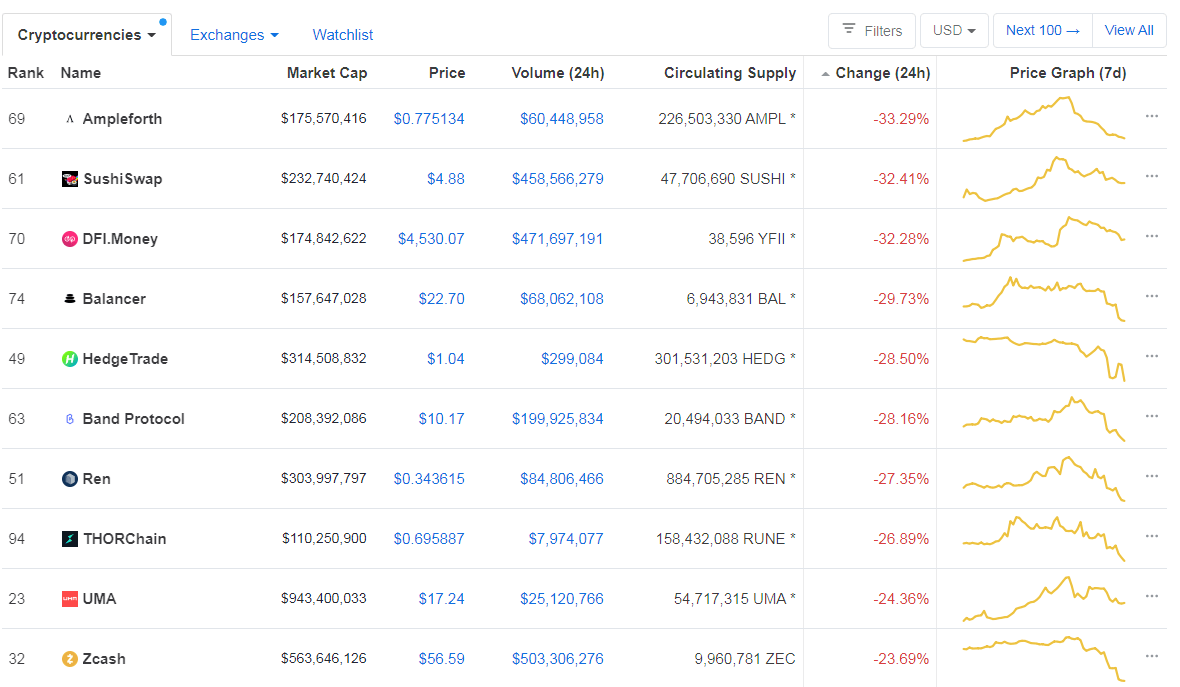
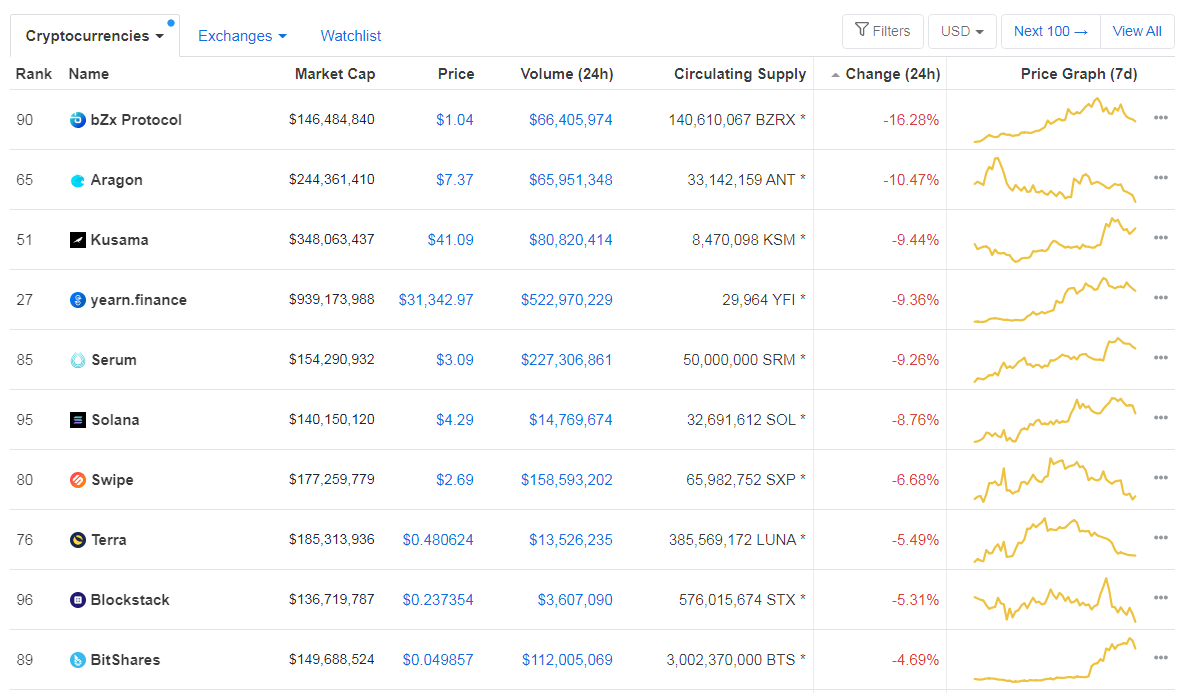
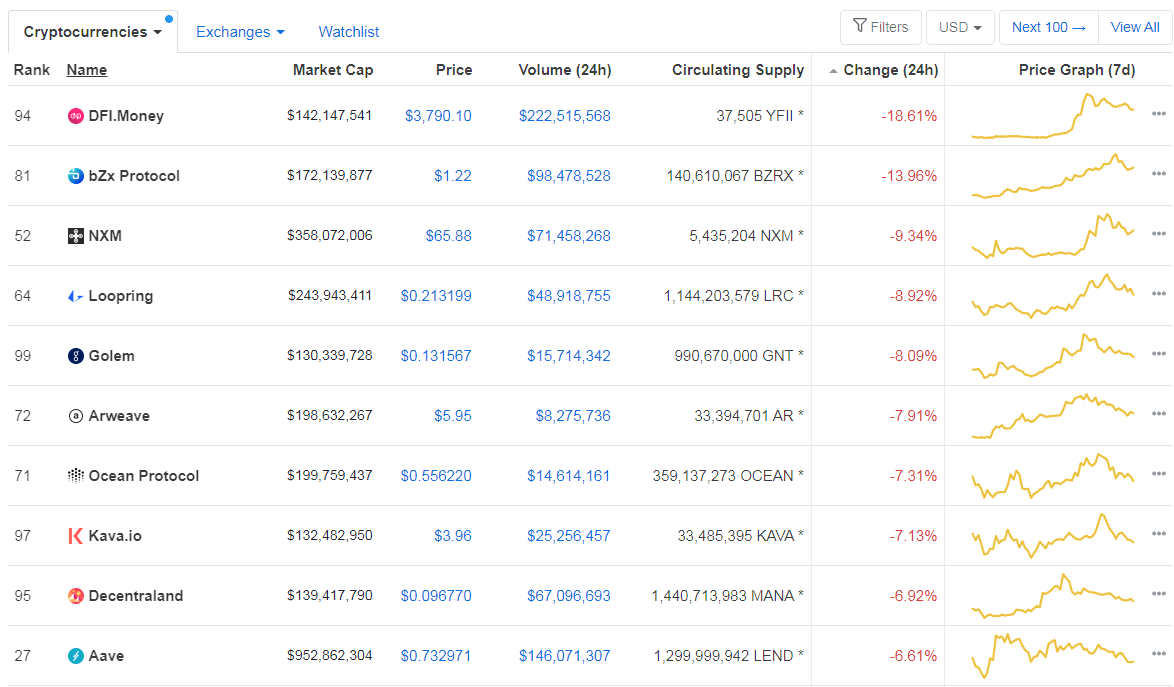
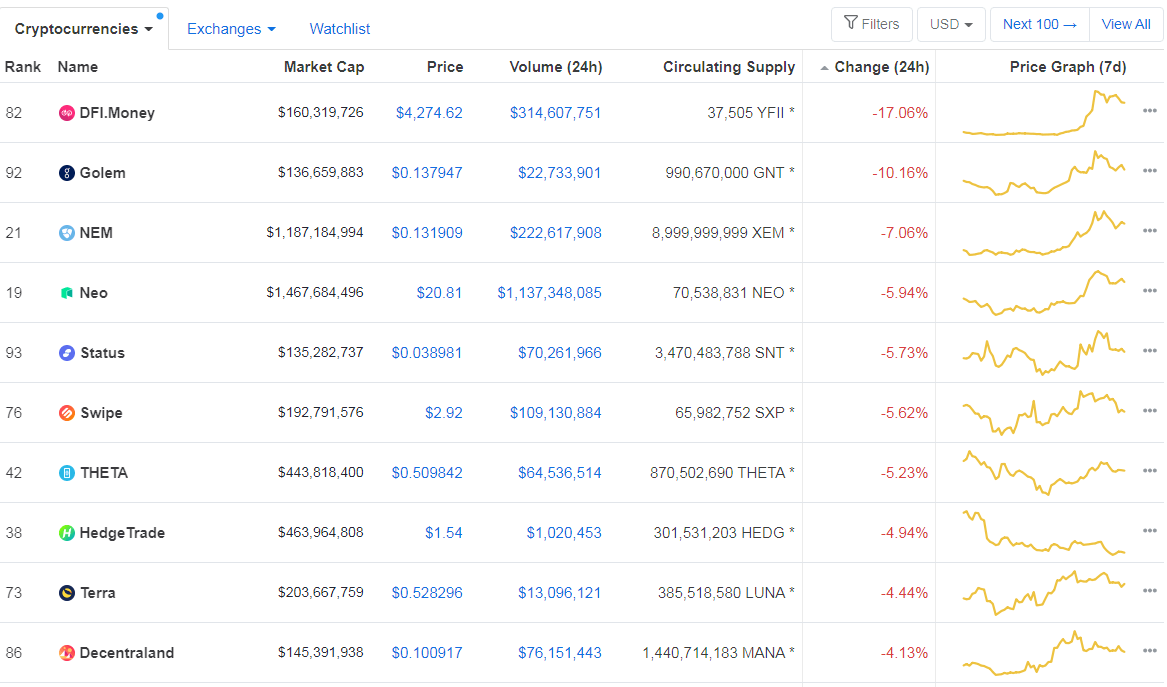
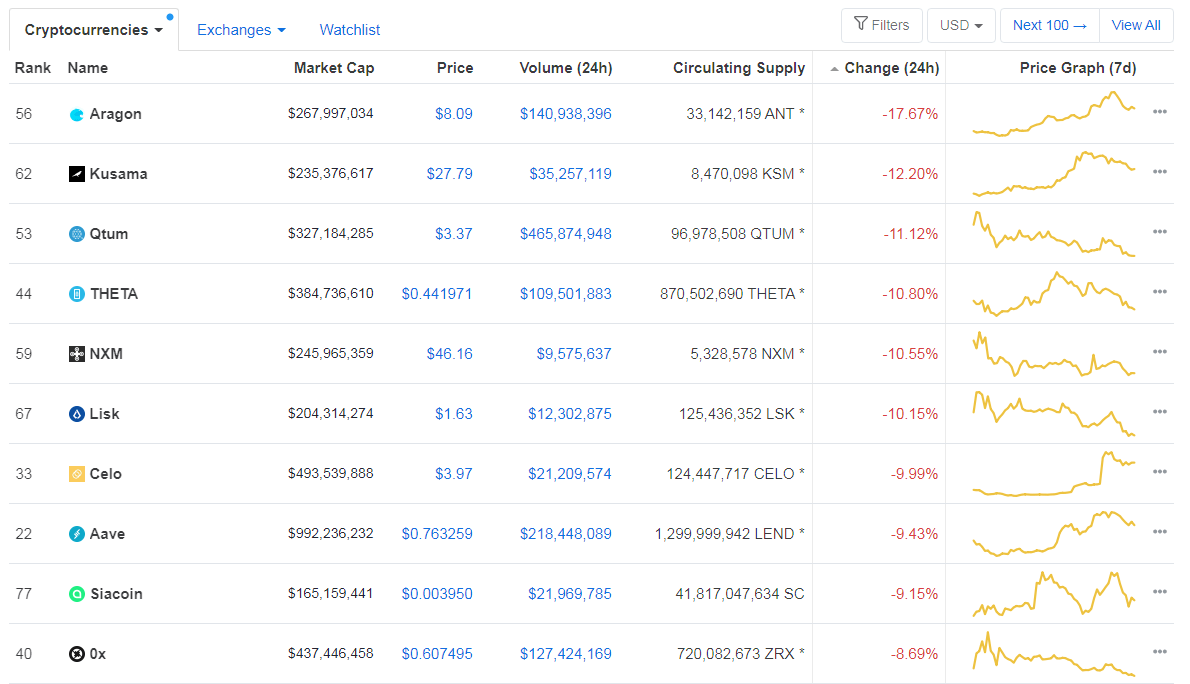
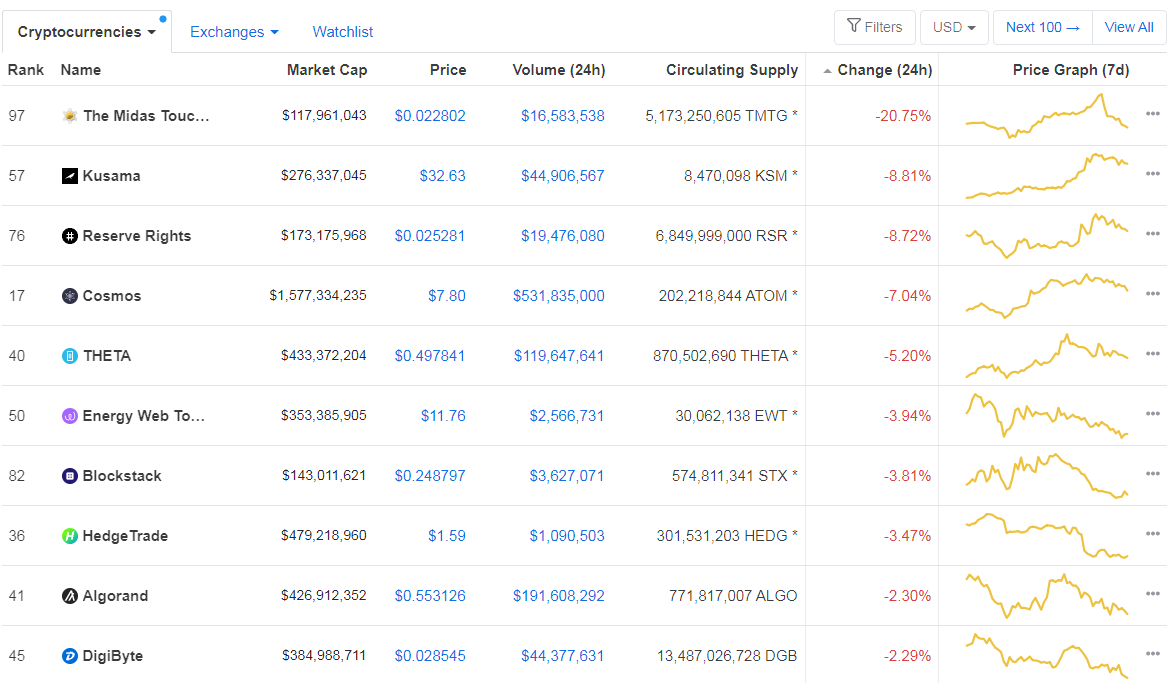
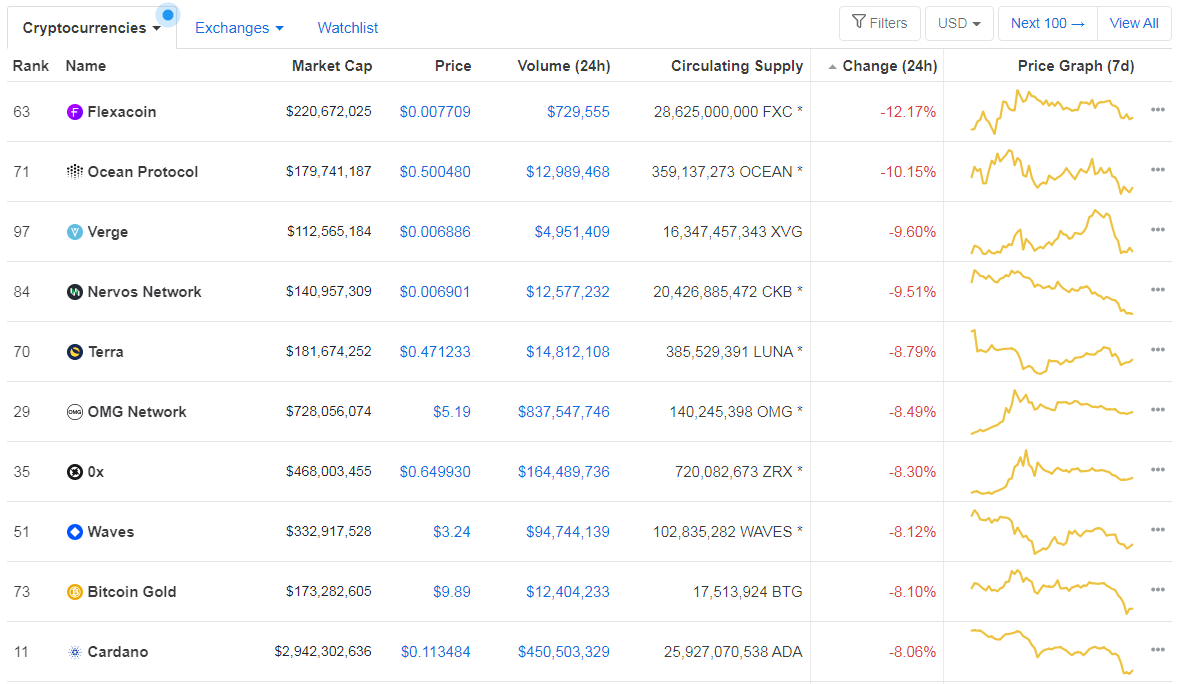
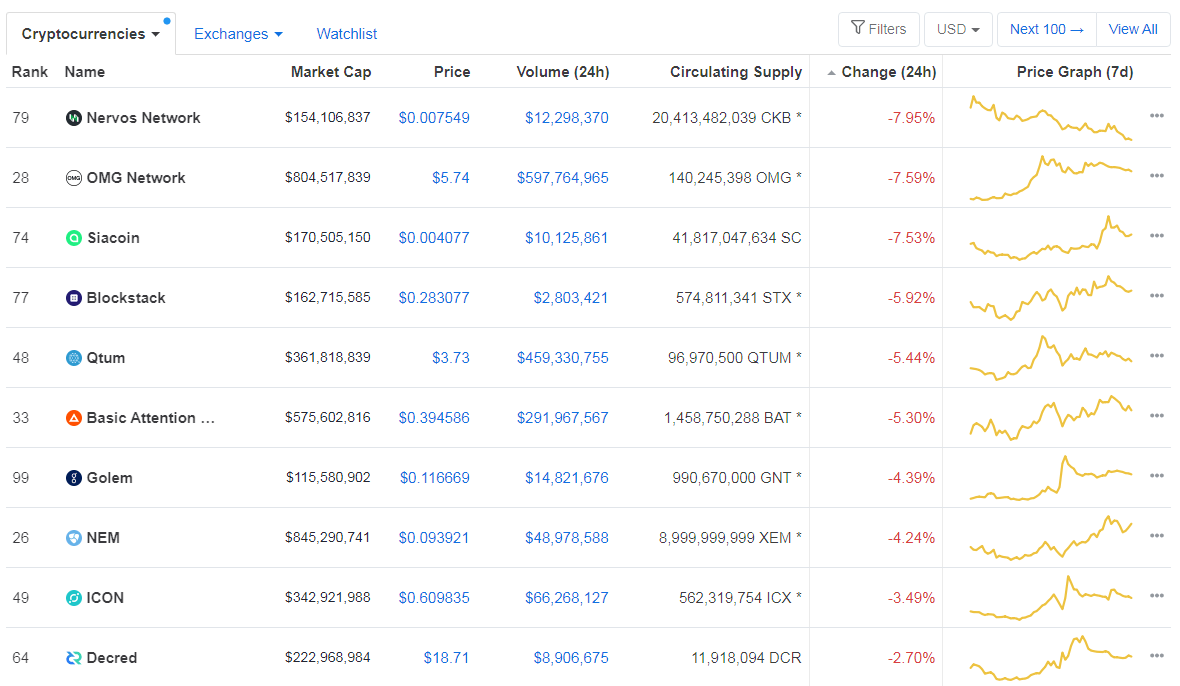
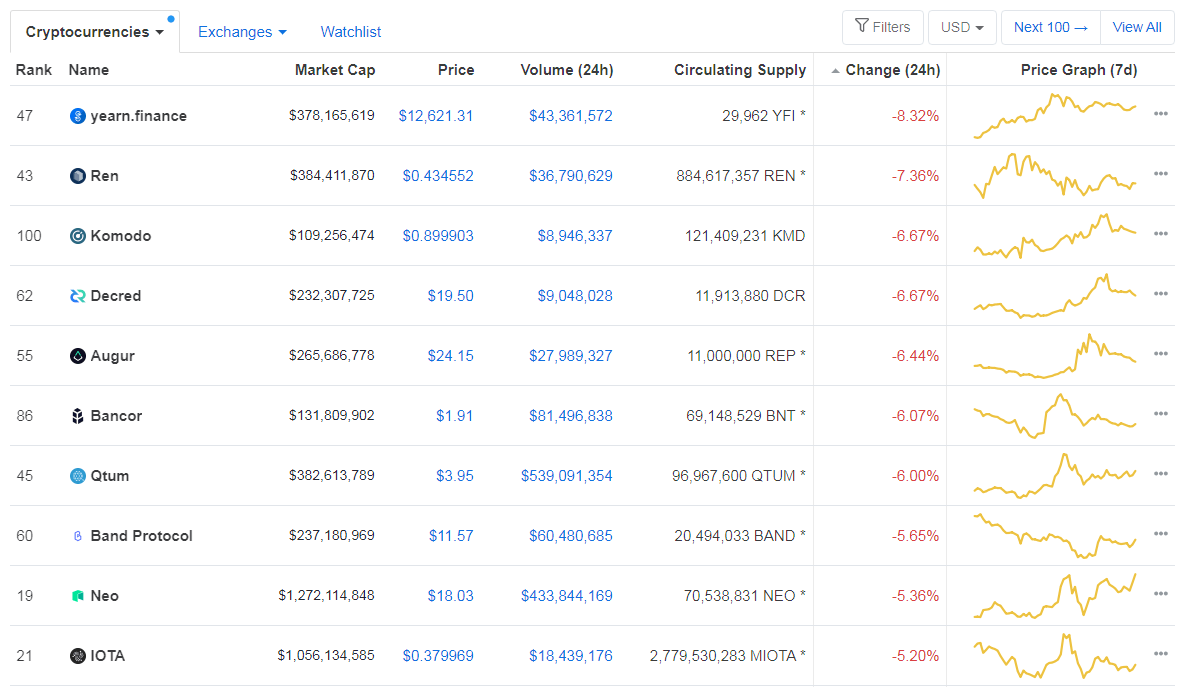
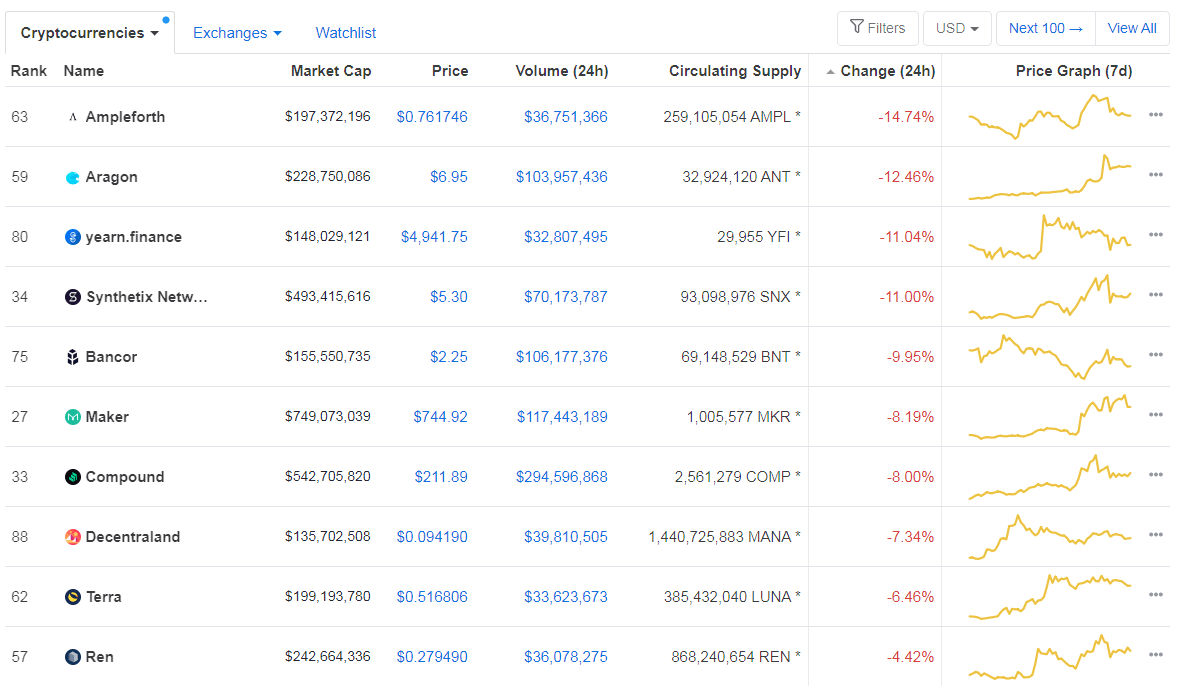
Bottom 10 24-hour Performers (Click to enlarge)
Bitcoin’s level of market dominance stayed at the same spot since our last report, with its value currently being at 61.47%. This value represents a 0.02% difference to the upside when compared to when we last reported.
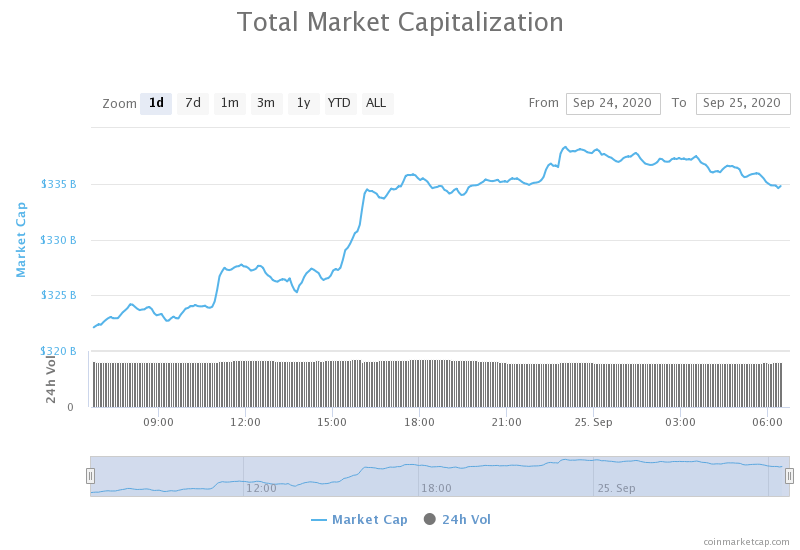
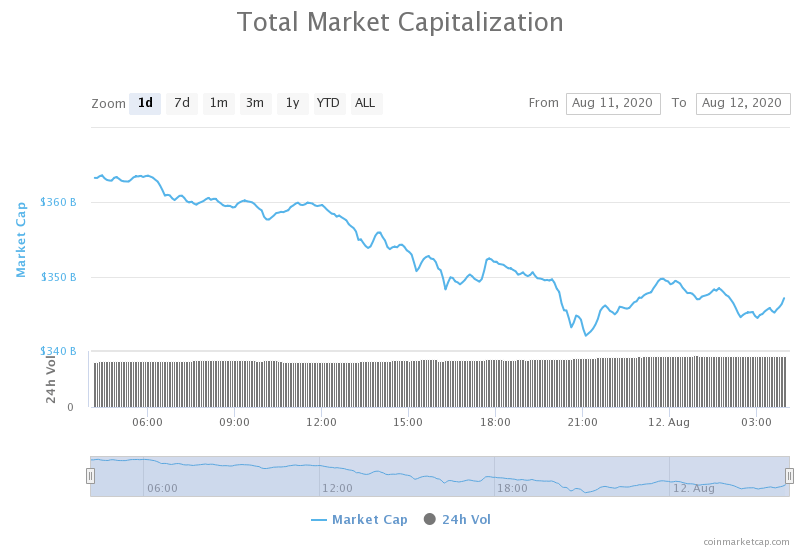
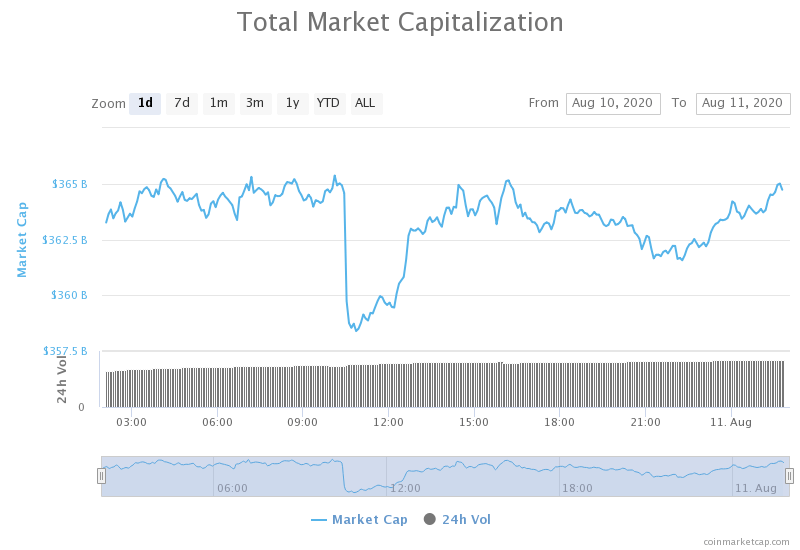
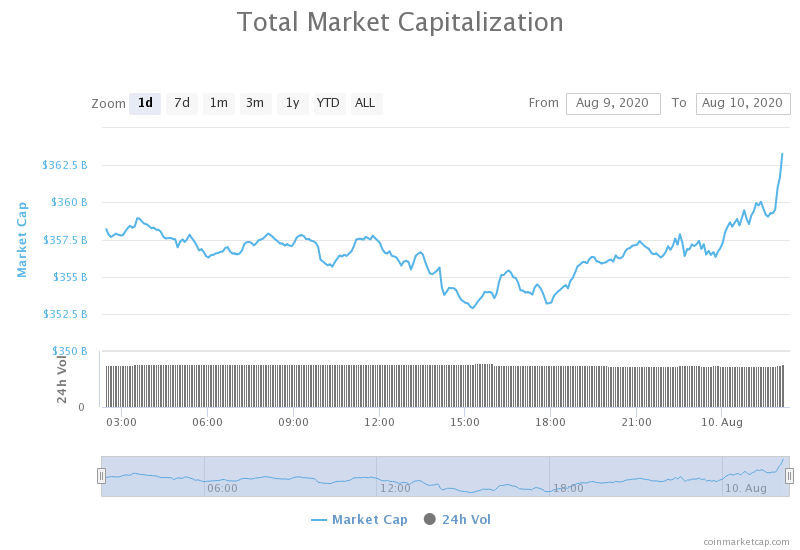
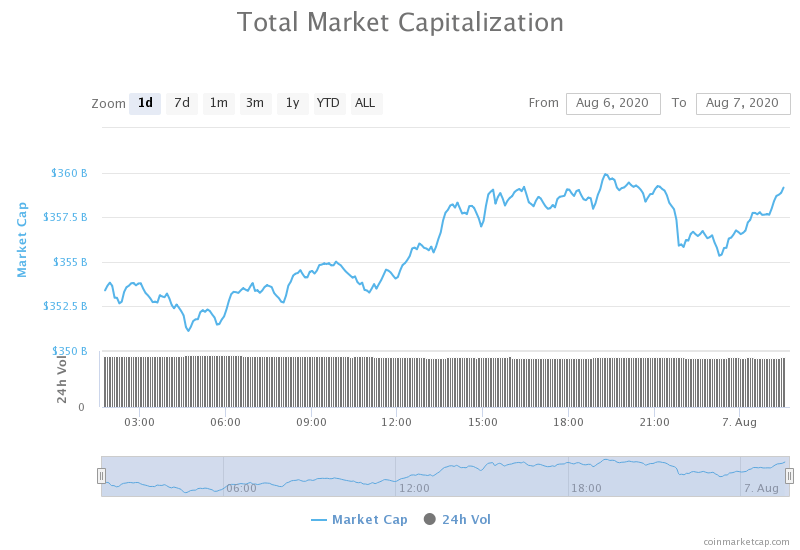
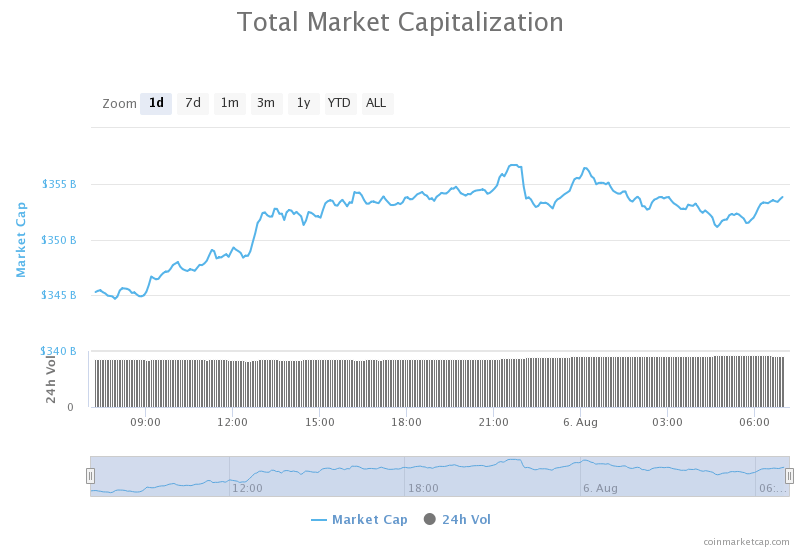
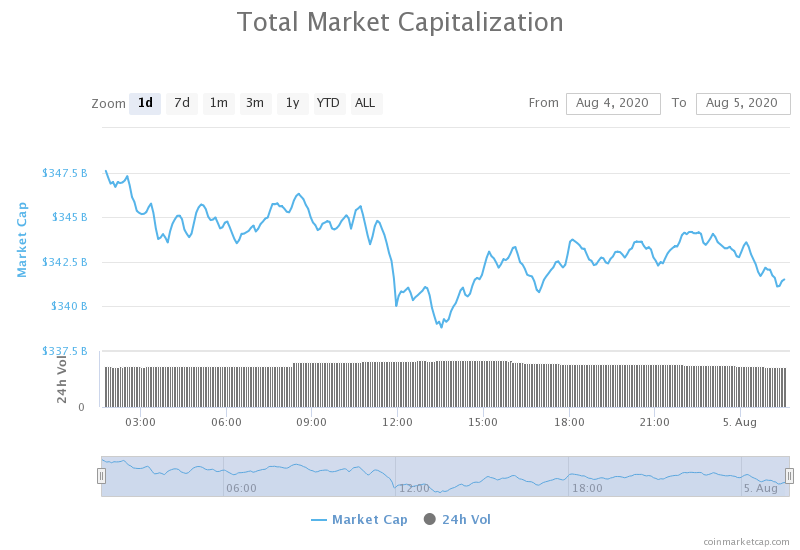
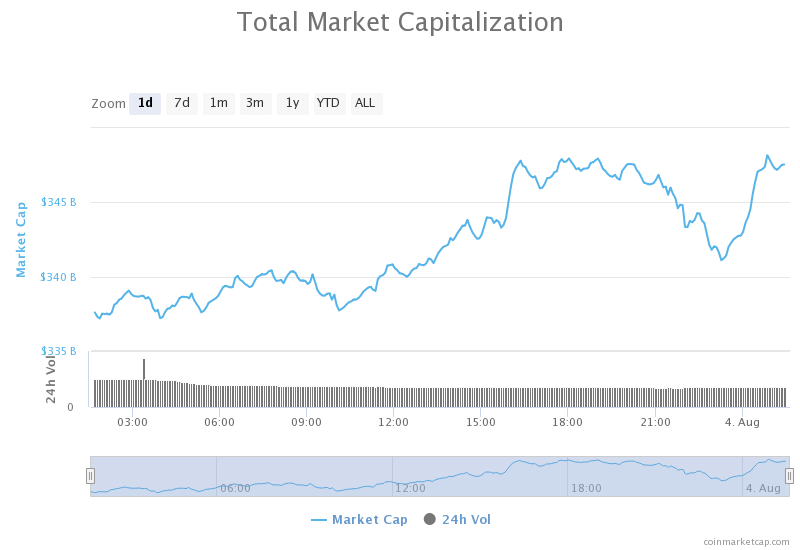
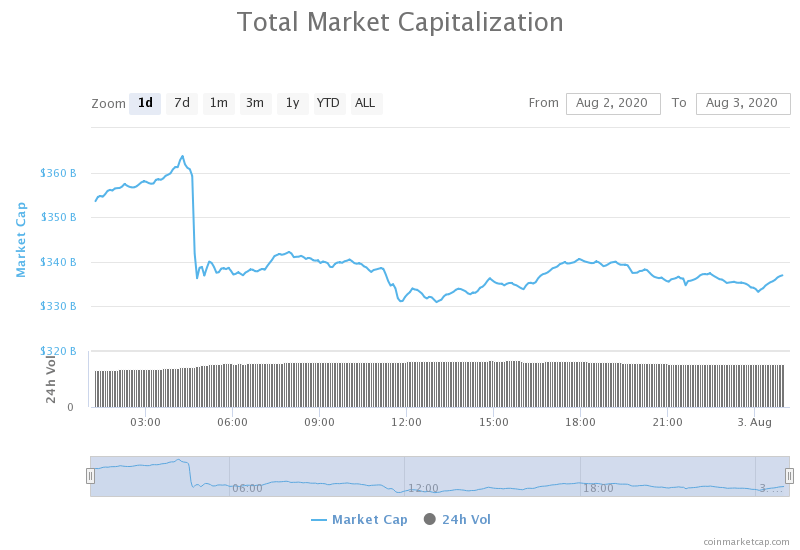
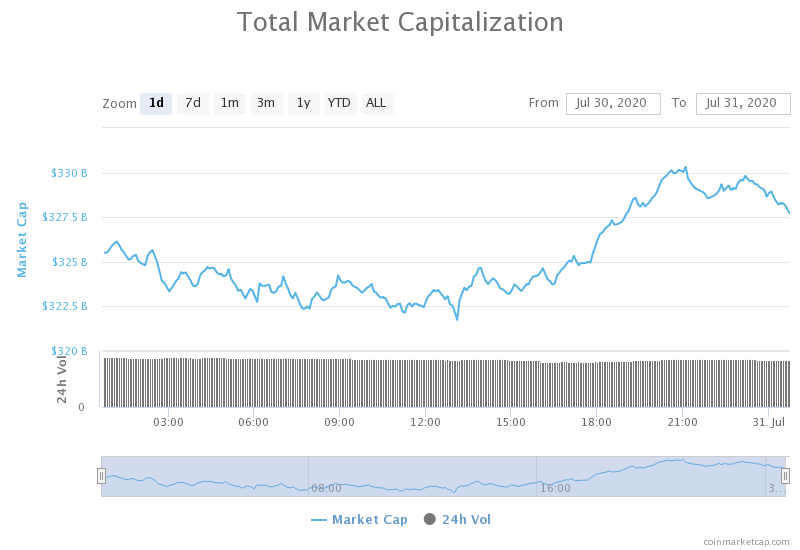
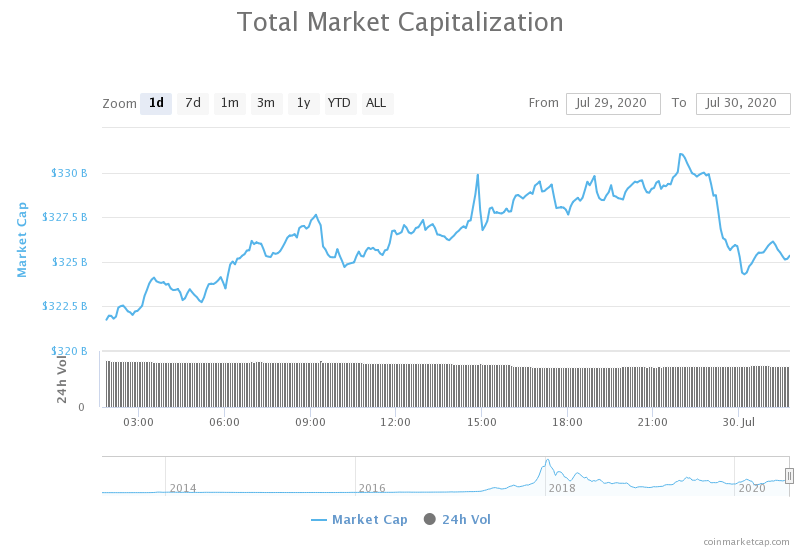
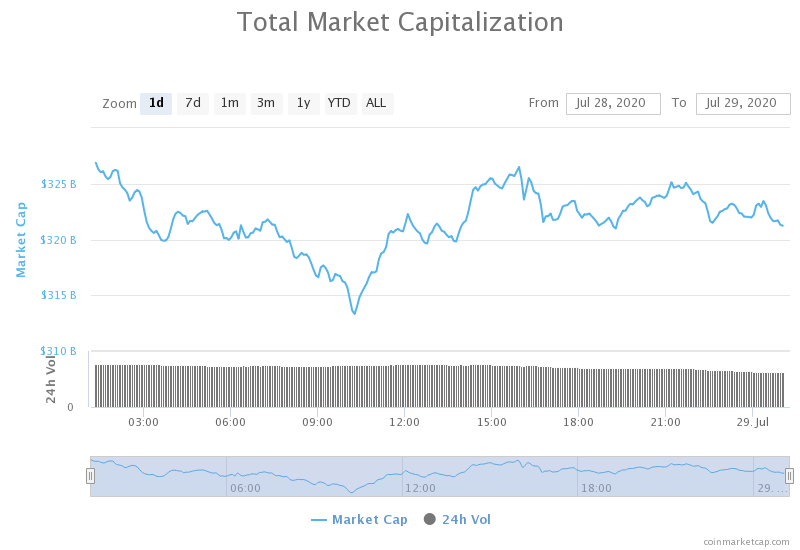
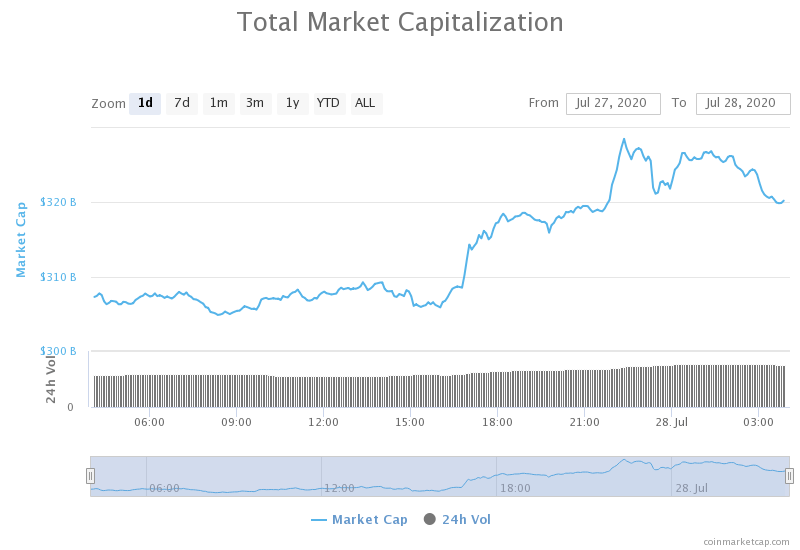
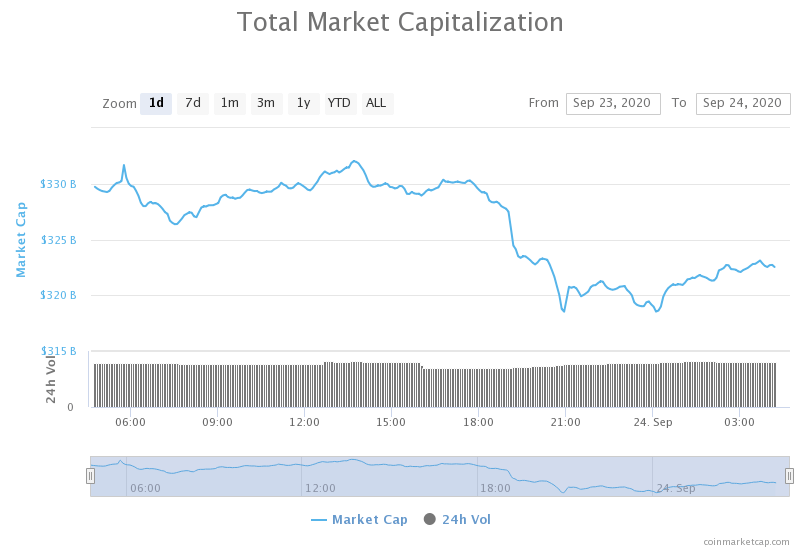
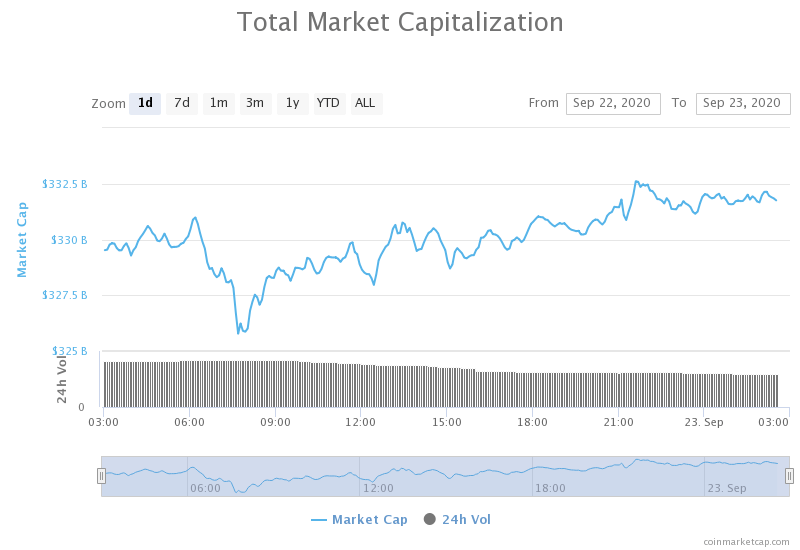
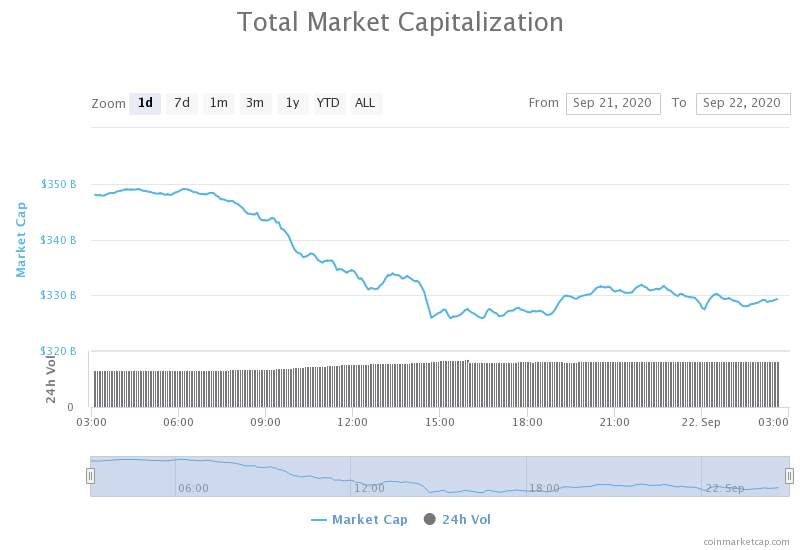
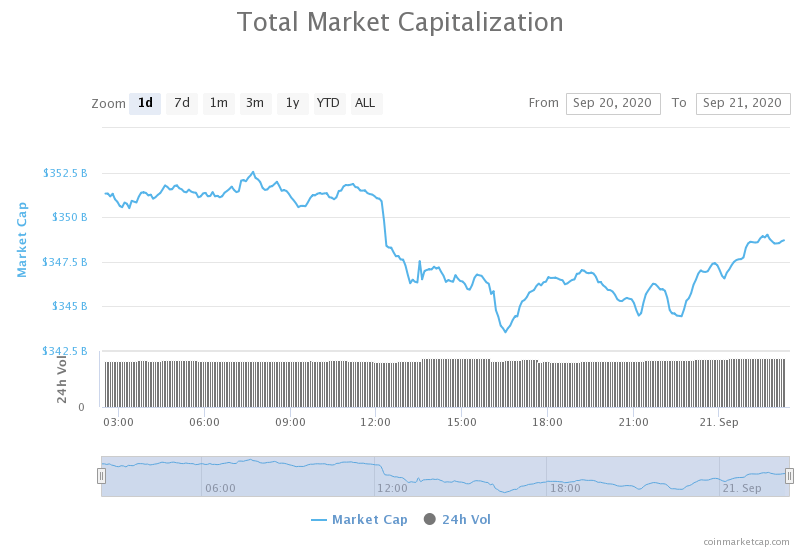
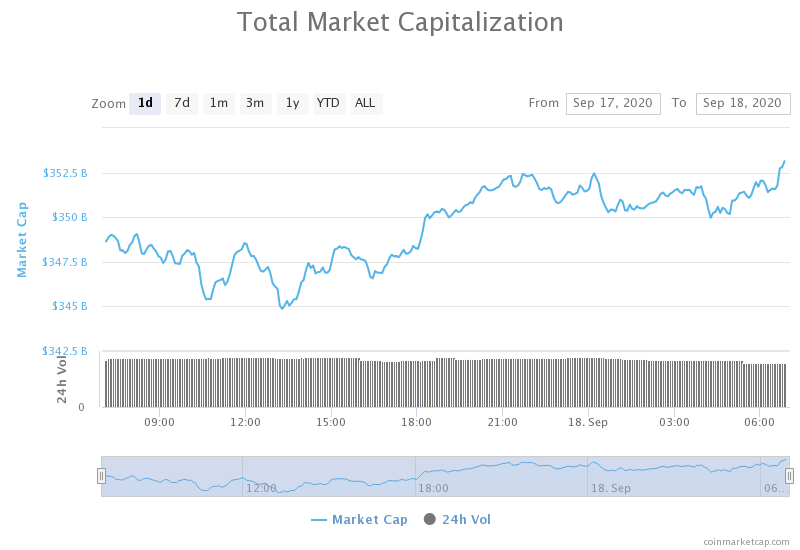
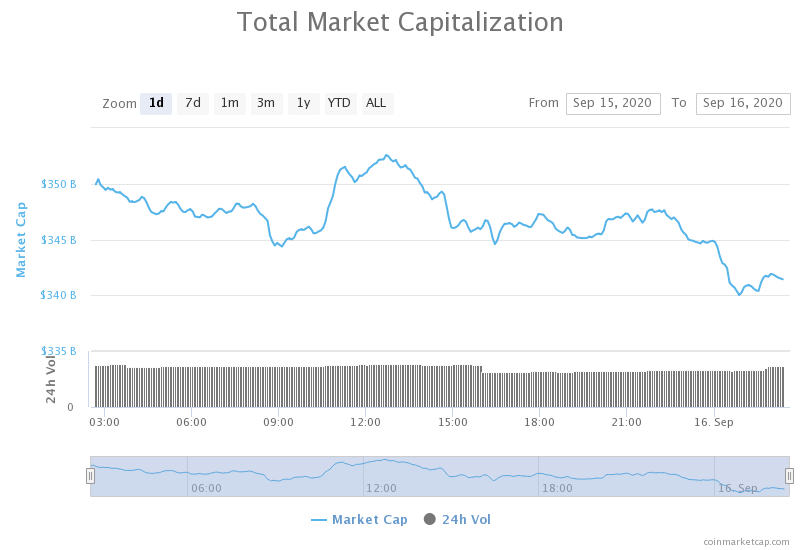
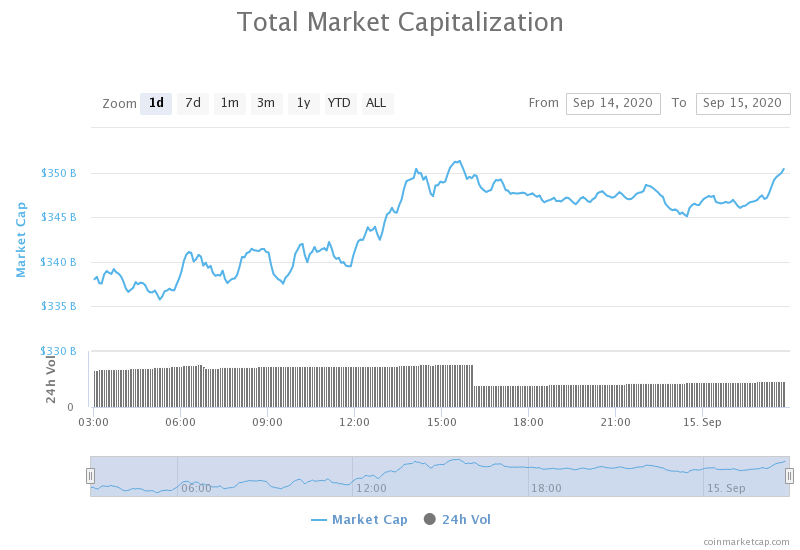
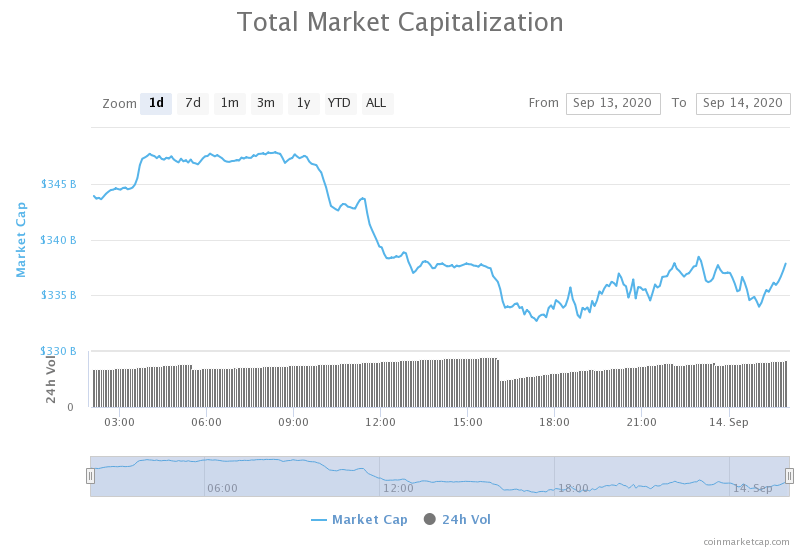
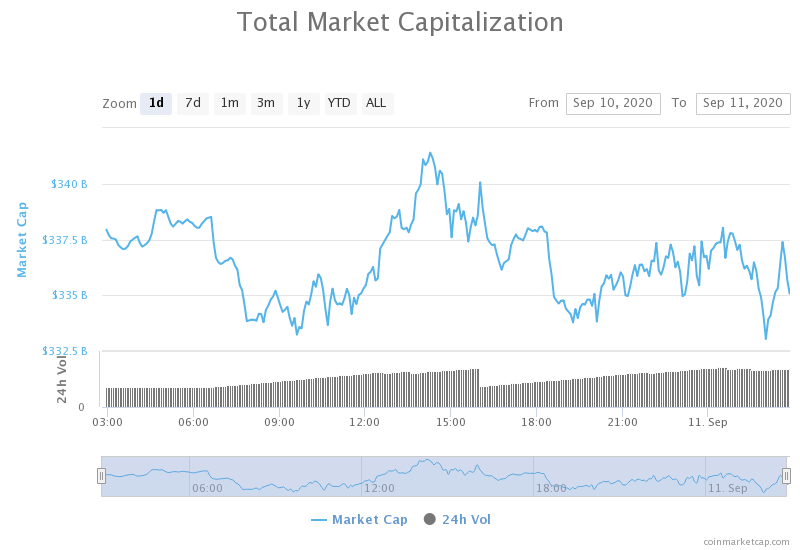
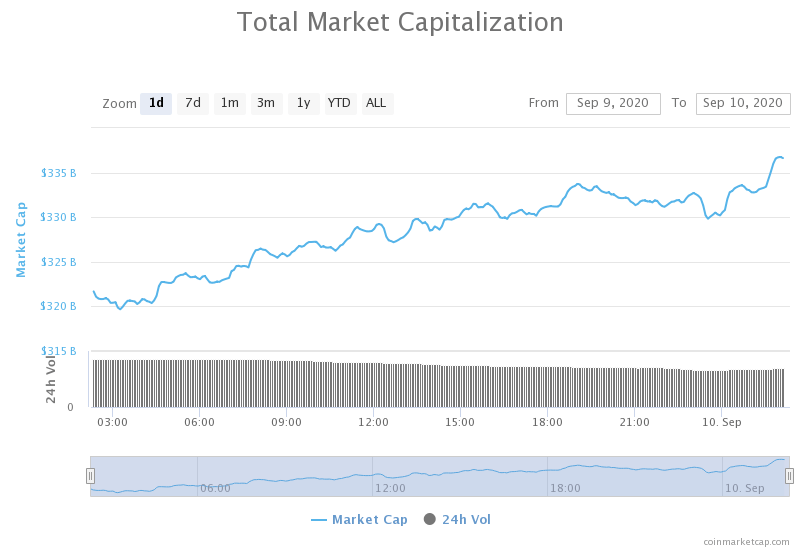
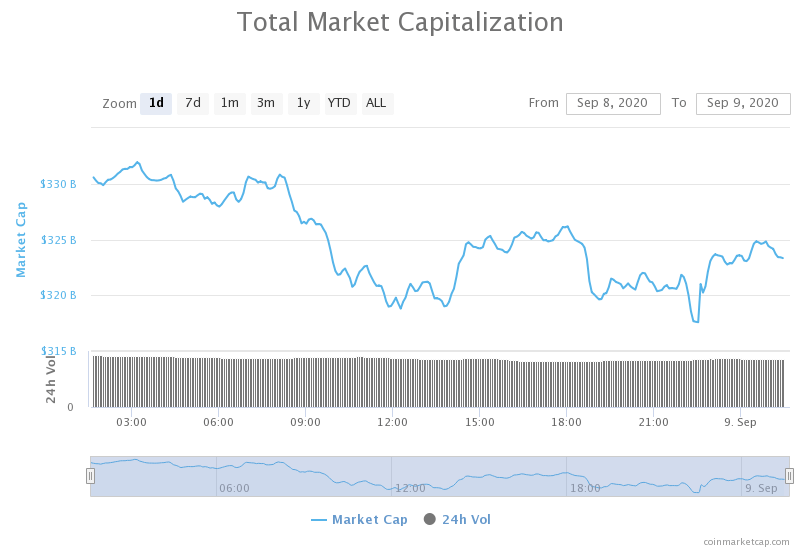
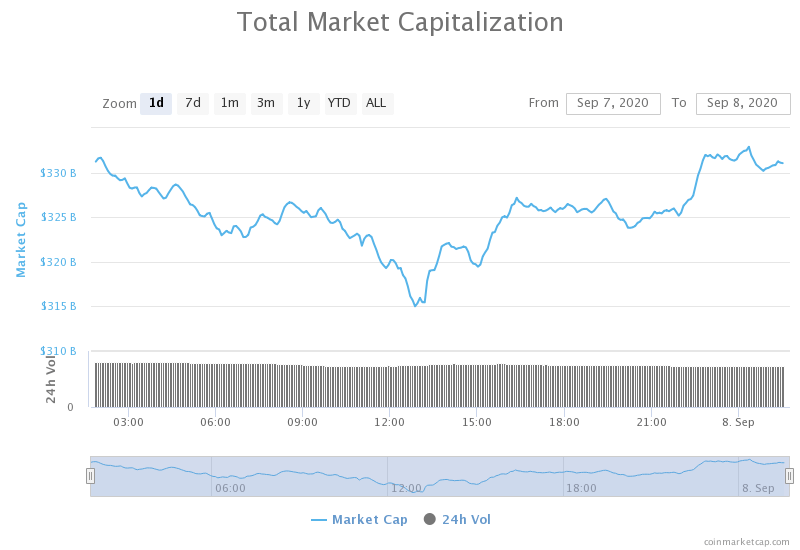
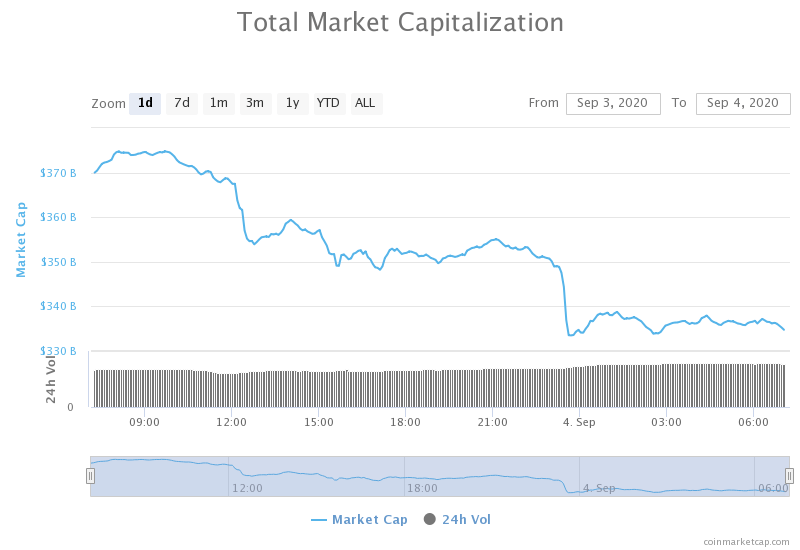
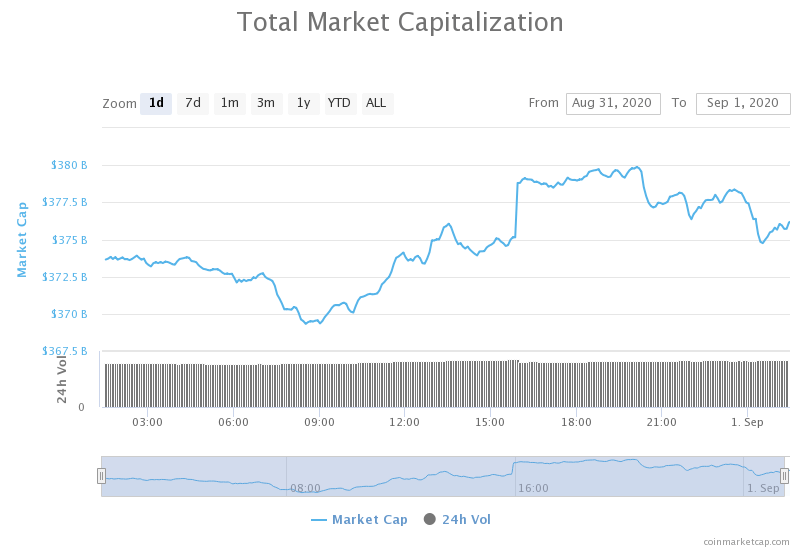
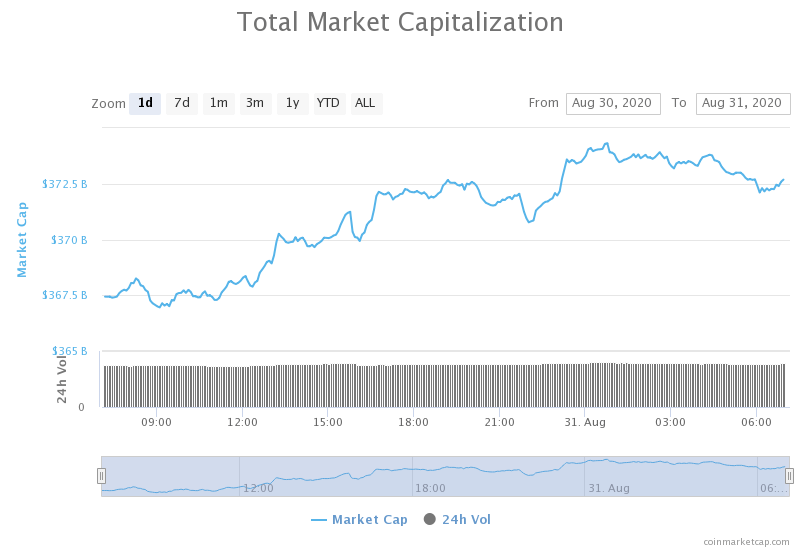
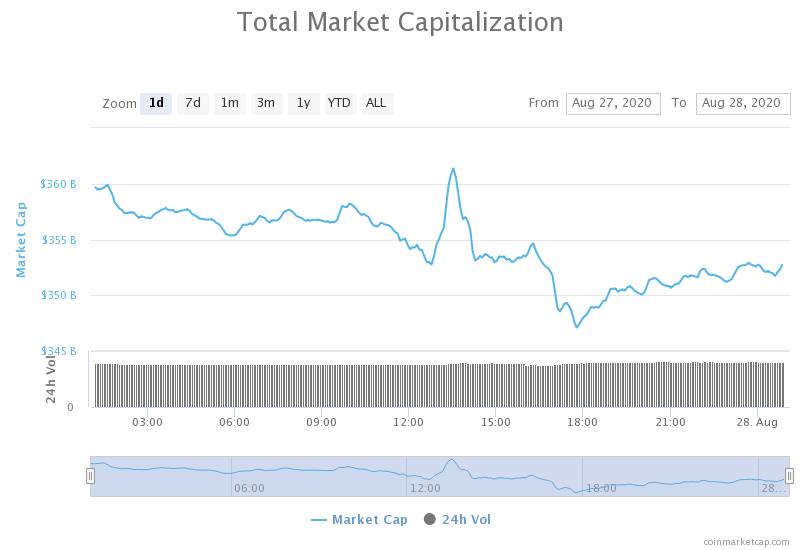
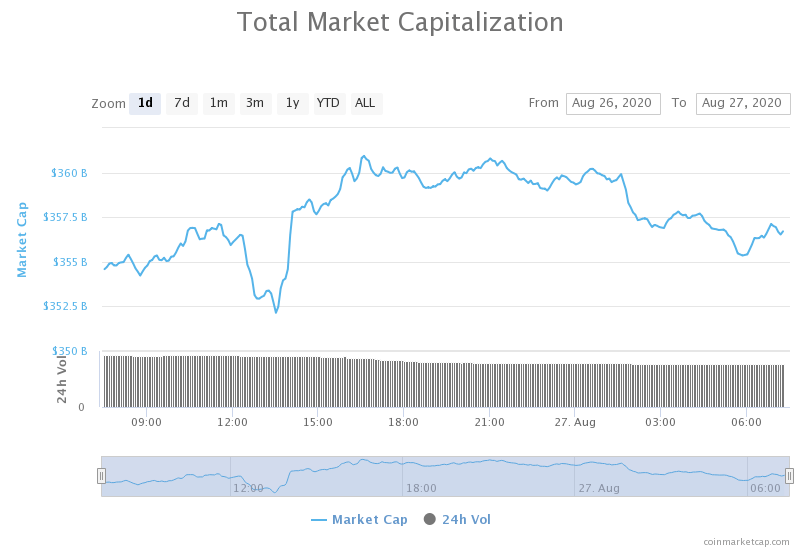
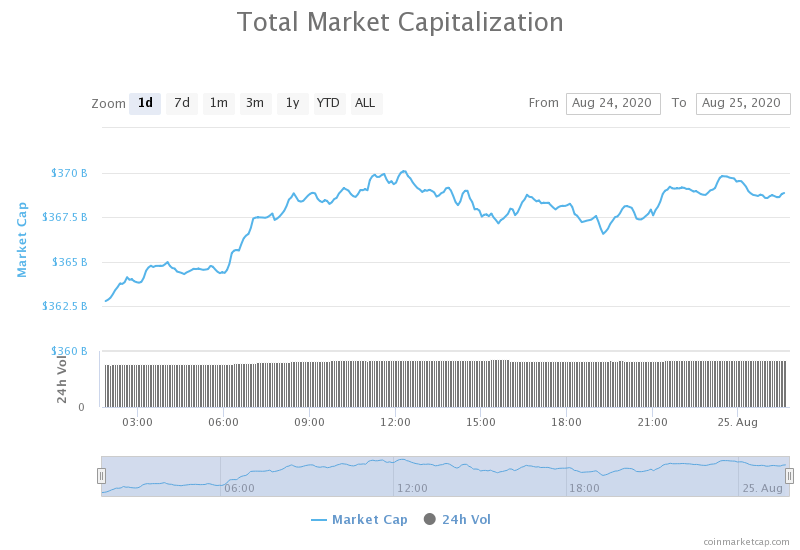
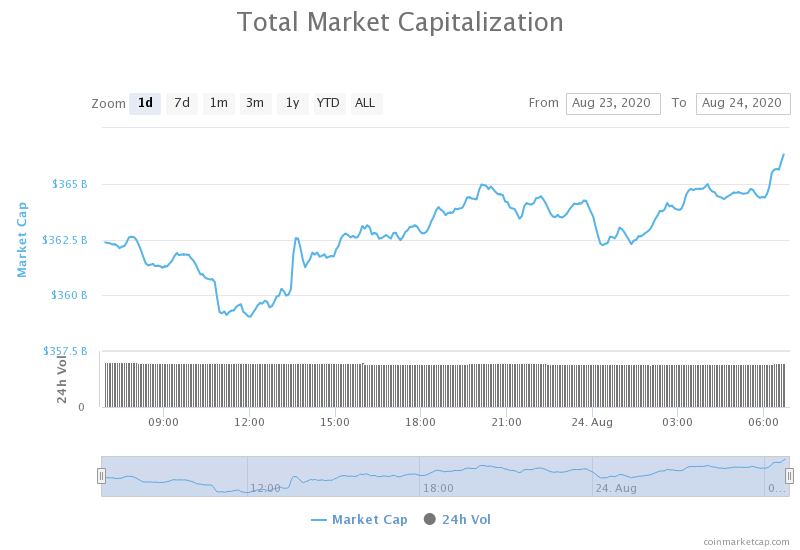
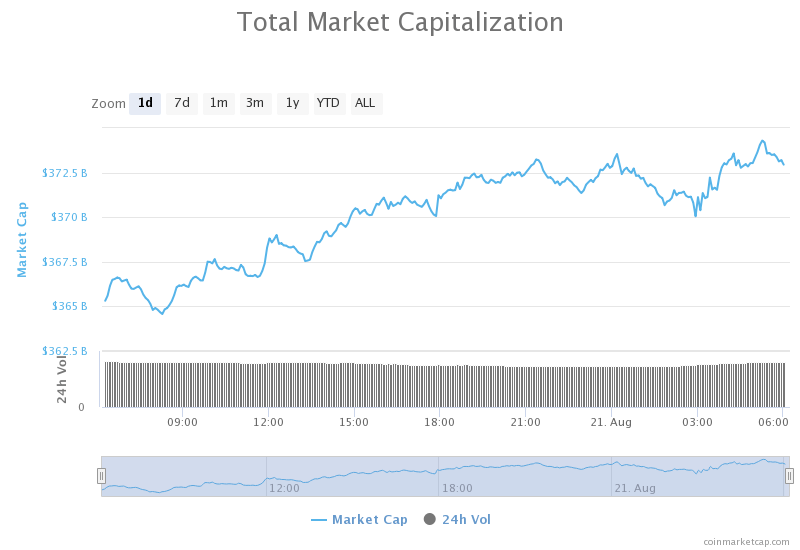
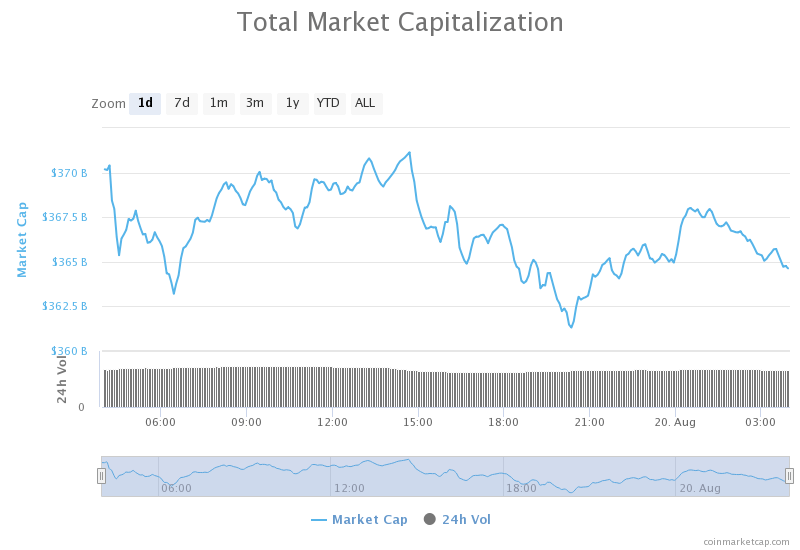
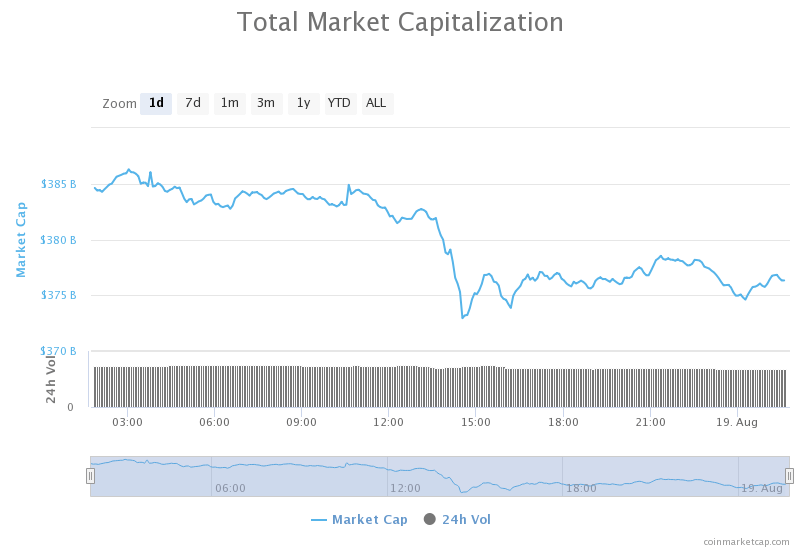
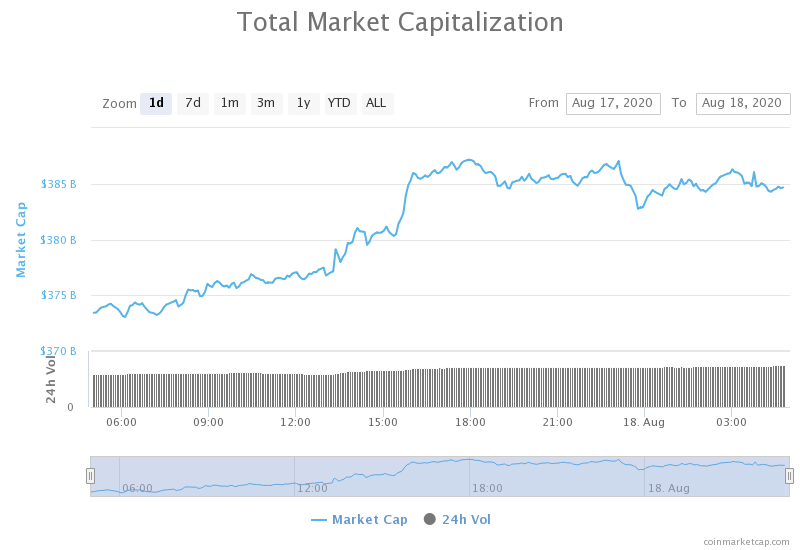
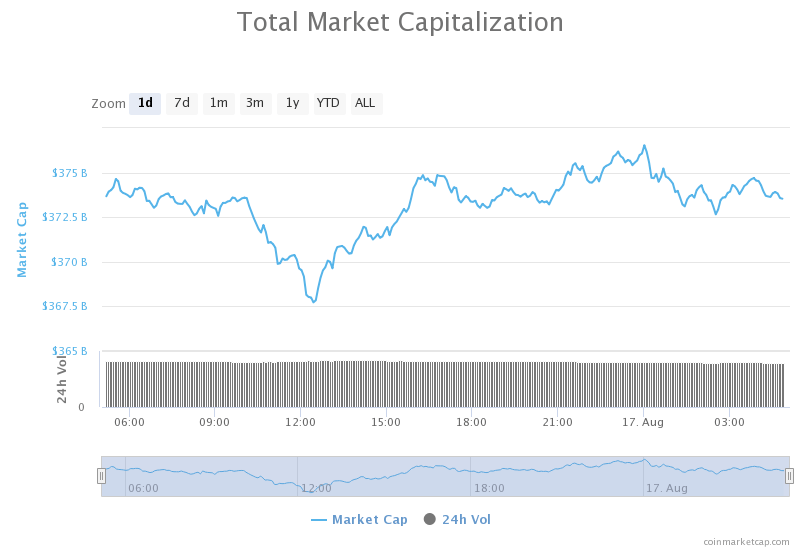
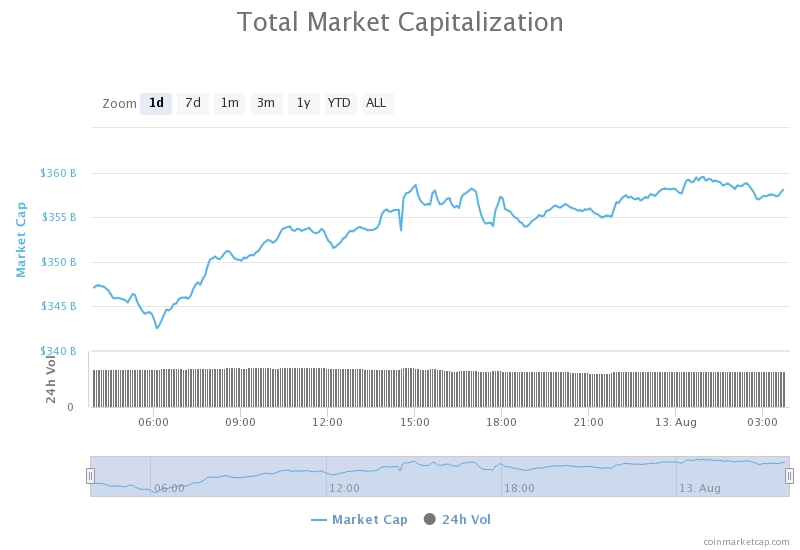
Daily Crypto Market Cap Chart
The crypto sector capitalization has increased in value over the past 24 hours. Its current value is $336.29 billion, which represents a decrease of $11.24 billion when compared to our previous report.
_______________________________________________________________________
What happened in the past 24 hours?
_______________________________________________________________________
- Bitcoin’s realized cap is now $43 billion above the 2017 all-time high (Cointelegraph)
- Glassnode: Uniswap team may have misled community over team token vesting (Cointelegraph)
- 100M people worldwide now use crypto-based assets, says Cambridge study (Cointelegraph)
- Coinbase wallet users targeted by new Android malware (Cointelegraph)
- Russia’s Ministry of Finance proposes higher reporting standards for cryptocurrency (The Block)
- Canadian report finds people with low financial literacy more likely to own crypto compared to the highly financially literate (The Block)
- Market Wrap: Bitcoin Hits $10.7K; Options Market Likes Sub-$360 Ether (Coindesk)
- Data Reveals Trading Volume on Tron’s DEX JustSwap Inflated by Millions (Cryptobriefing)
- Venezuelan Government Plans to Regulate All Bitcoin Mining (Cryptobriefing)
- Yearn.finance (YFI) yields are plunging: is this a risk for the Ethereum DeFi darling? (Cryptoslate)
_______________________________________________________________________
Technical analysis
_______________________________________________________________________
Bitcoin
Bitcoin has spent the past 24 hours pushing towards the upside, which resulted in a price increase of around 6% during its peak. The largest cryptocurrency by market cap has reached $10,800 before the bulls have exhausted their resources. This move towards the upside has put BTC within the large triangle, meaning that we can expect another strong move (to either side of the triangle) in the short future.
BTC/USD 1-day Chart
If we take a look at the 4-hour time-frame, the largest cryptocurrency by market cap has pushed past 23.6% Fib retracement and established itself well above it. Once the move ended, BTC found immediate support at the 50-period moving average.
BTC/USD 4-hour Chart
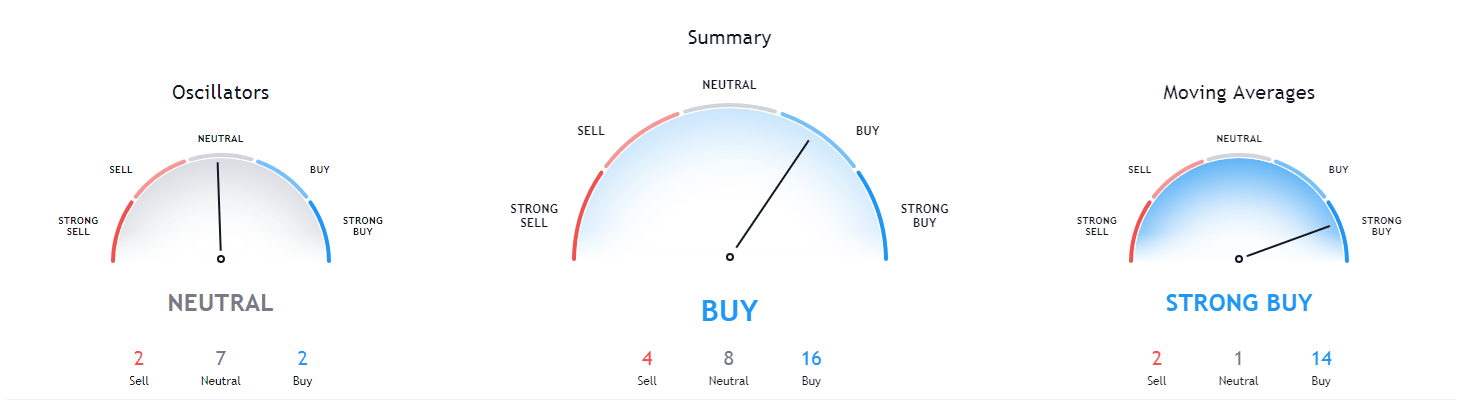
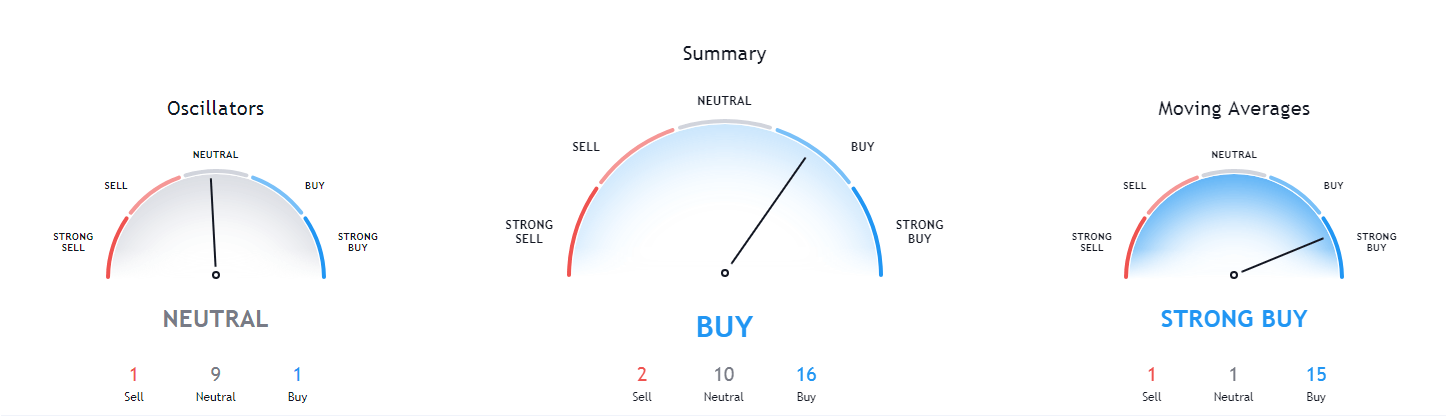
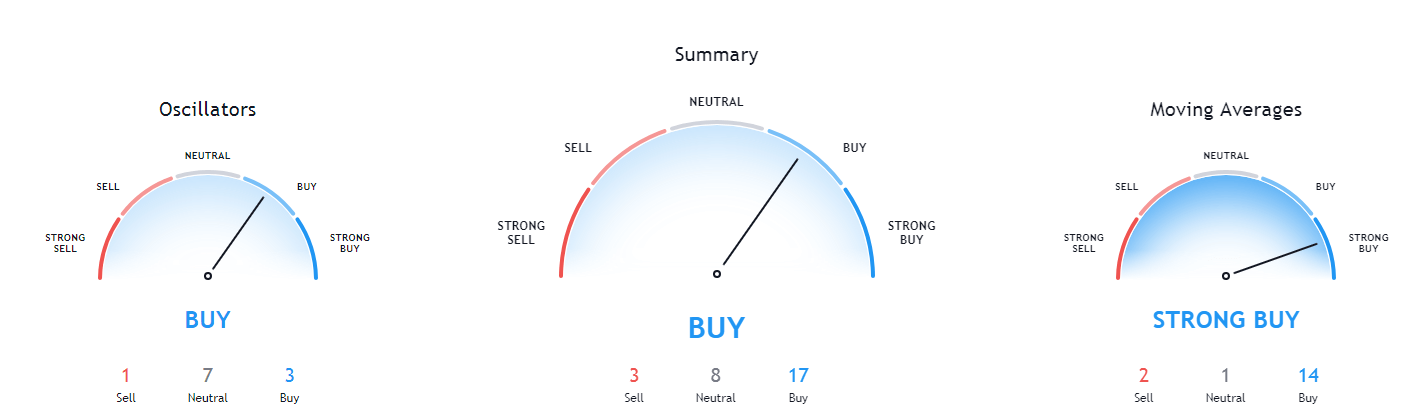
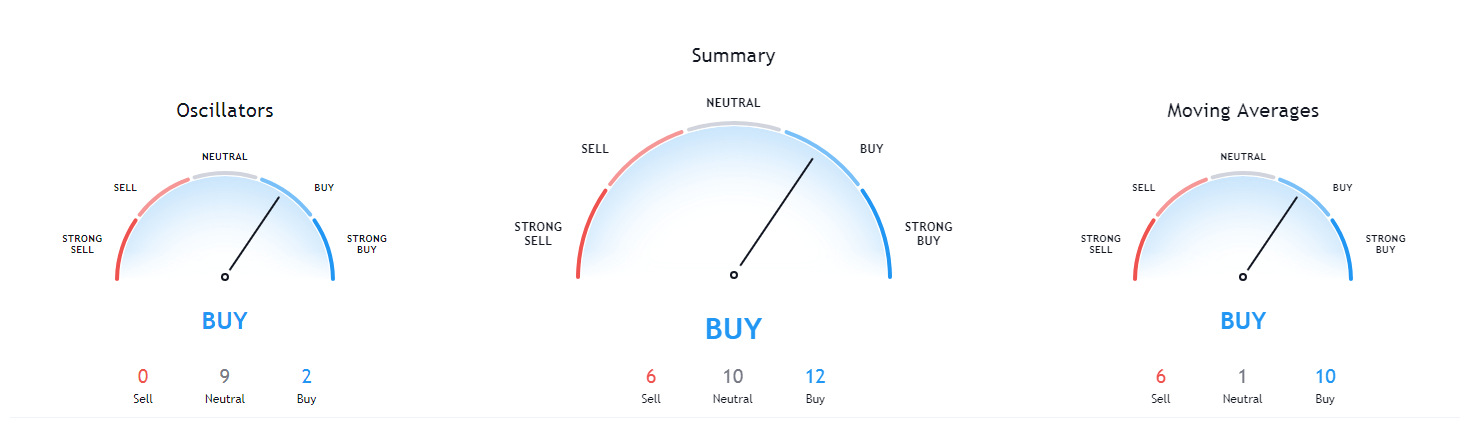
Bitcoin’s short-term technicals have changed its overview from very bearish to slightly bullish. On the other hand, its long-term technicals remained extremely bullish on all time-frames longer than 4-hours.
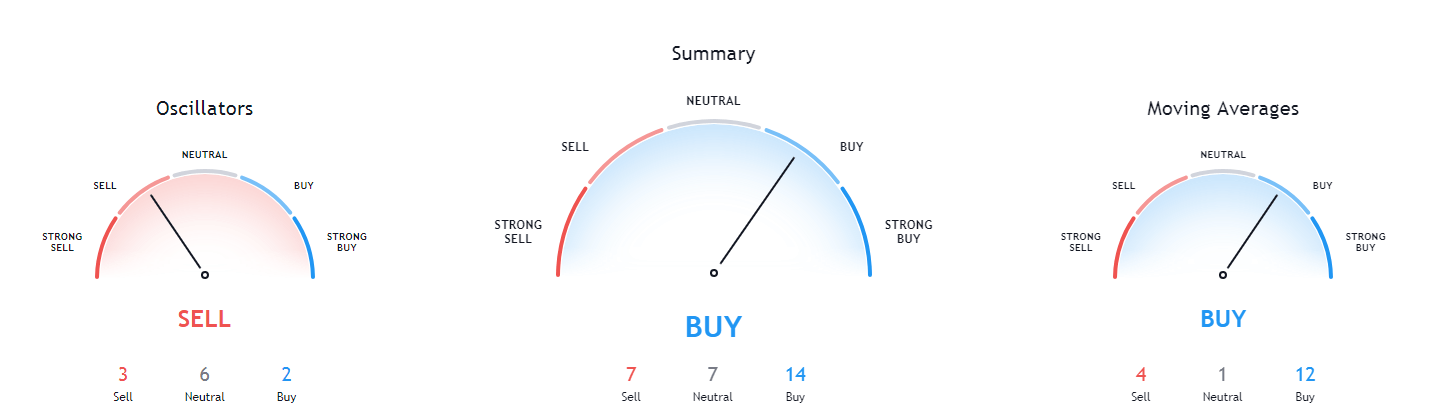
BTC/USD 4-hour Technicals
Technical factors (4-hour Chart):
- Price is above both its 50-period EMA and 21-period EMA
- Price near its top Bollinger band
- RSI is neutral and tilted towards the upside (56.98)
- Volume is volatile
Key levels to the upside Key levels to the downside
1: $10,850 1: $10,630
2: $11,000 2: $10,500
3: $11,090 3: $10,015
Ethereum
Ethereum has pushed towards the upside, following Bitcoin’s move and gaining a bit less than 10% in the past 24 hours (during its peak). The second-largest cryptocurrency by market cap pushed past the $340 resistance line and established itself above it, therefore turning it into support. However, further moves towards and past $360 may be difficult at the moment, as we saw option traders for October expiration contracts “betting” that Ether is most likely going to trade between $340 and $360.
ETH/USD 4-hour Chart
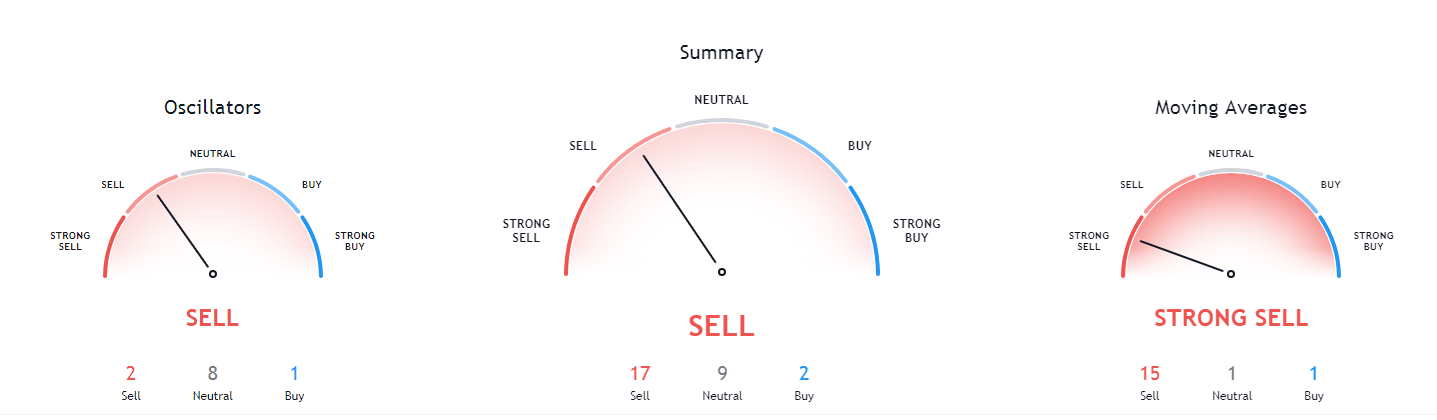
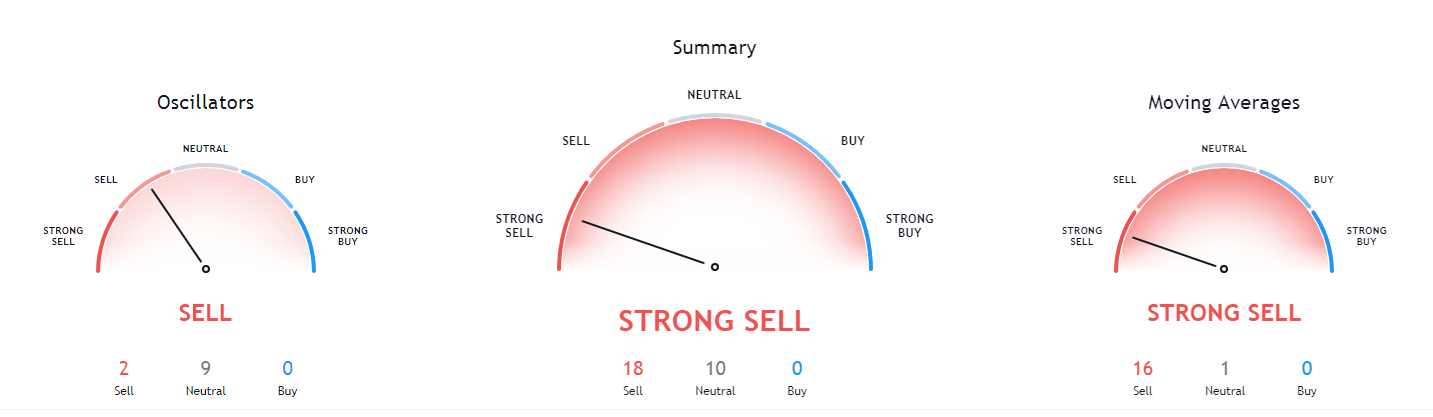
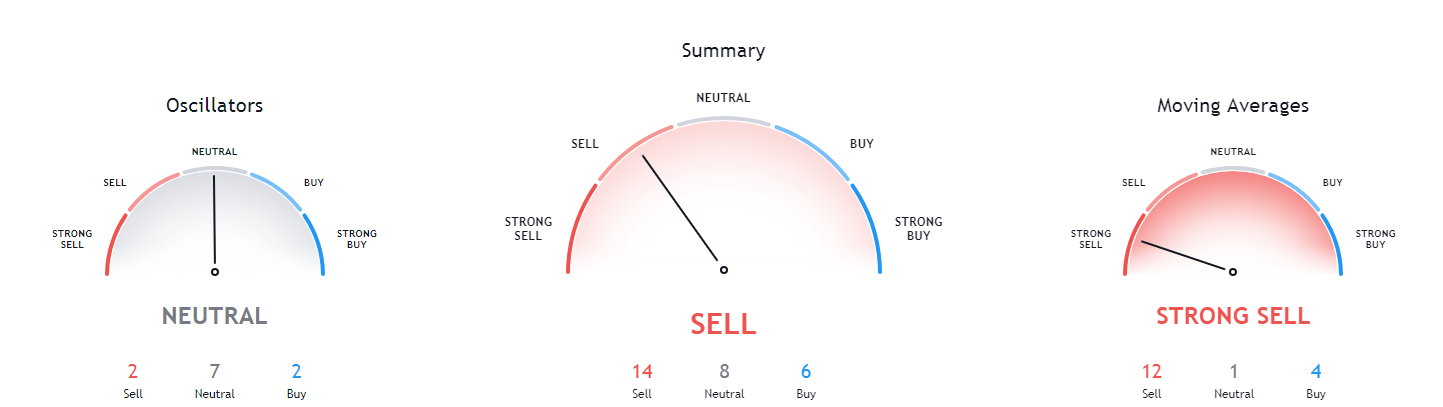
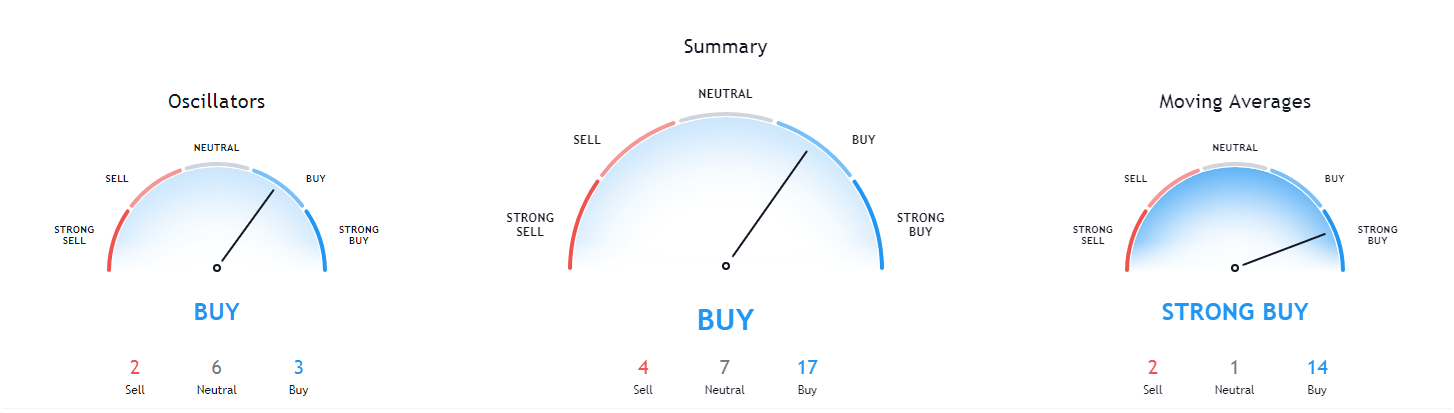
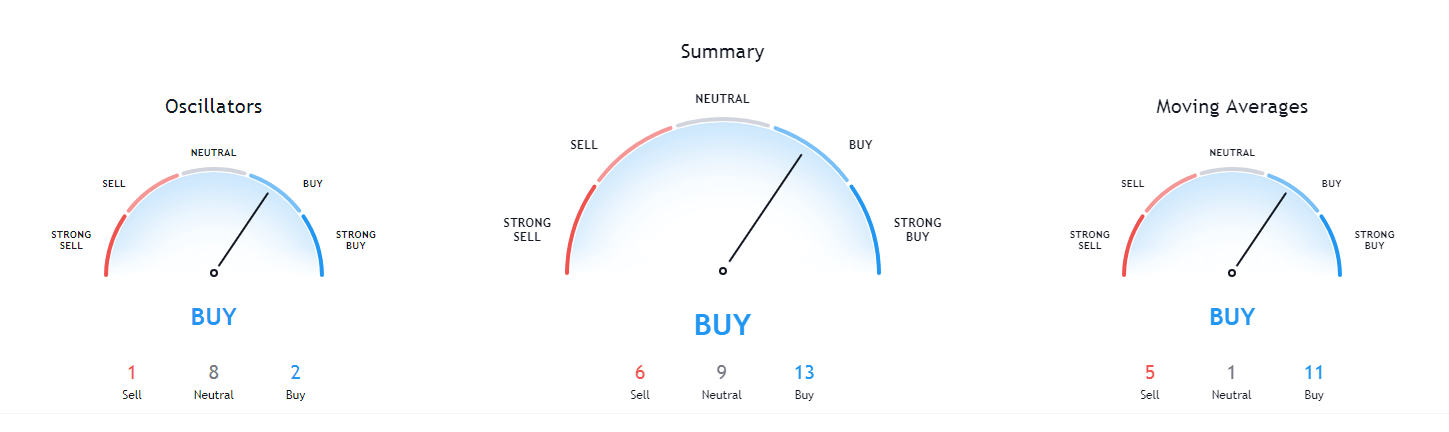
Ethereum’s short-term technicals have not changed much since yesterday, tilting just slightly less to the sell-side than before. Its overview of longer time frames is extremely bullish, especially on the 1-day and 1-month technical overview.
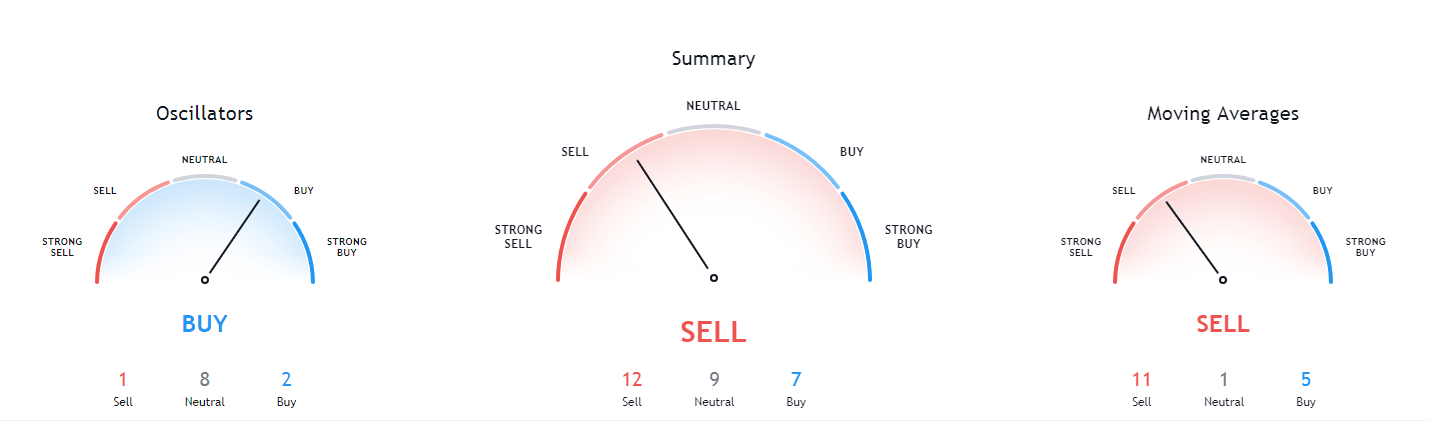
ETH/USD 4-hour Technicals
Technical Factors (4-hour Chart):
- The price is below its 50-period and right at its 21-period EMA
- The price is between its top and middle Bollinger band
- RSI is neutral (47.68)
- Volume increased (but descending towards average)
Key levels to the upside Key levels to the downside
1: $360 1: $340
2: $371 2: $300
3: $400 3: $289
Ripple
While XRP didn’t differ from the rest of the top cryptocurrencies and pushed towards the upside as well, the gains it made may not remain gains for long. XRP managed to gain around 5% in the past 24 hours (during its peak) but found great resistance at the 5th leg of the Elliot impulse wave. XRP quickly bounced off of it, indicating that we may see consolidation and a continuation towards the downside, where XRP will fulfill its move at the $0.219 target.
XRP/USD 4-hour Chart
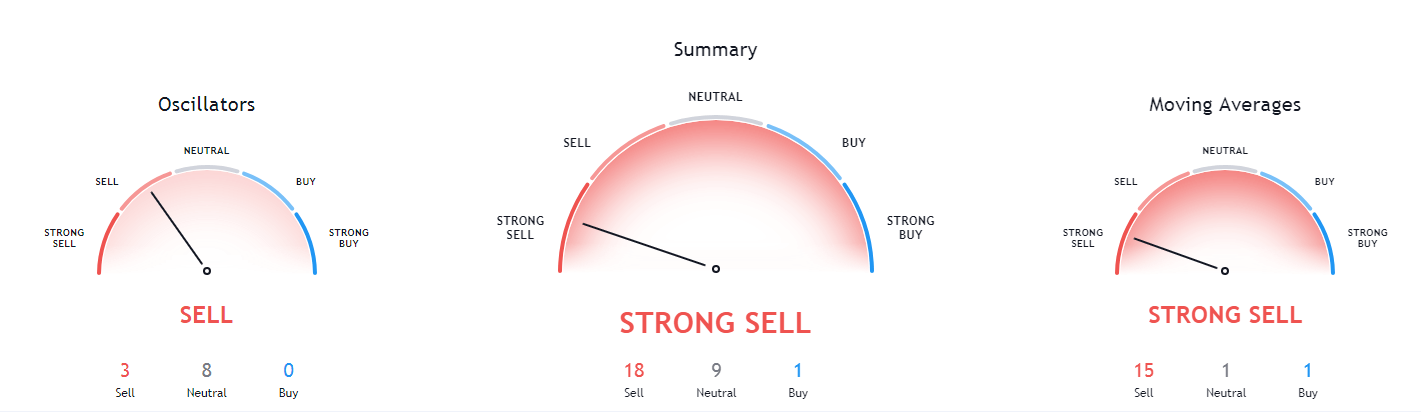
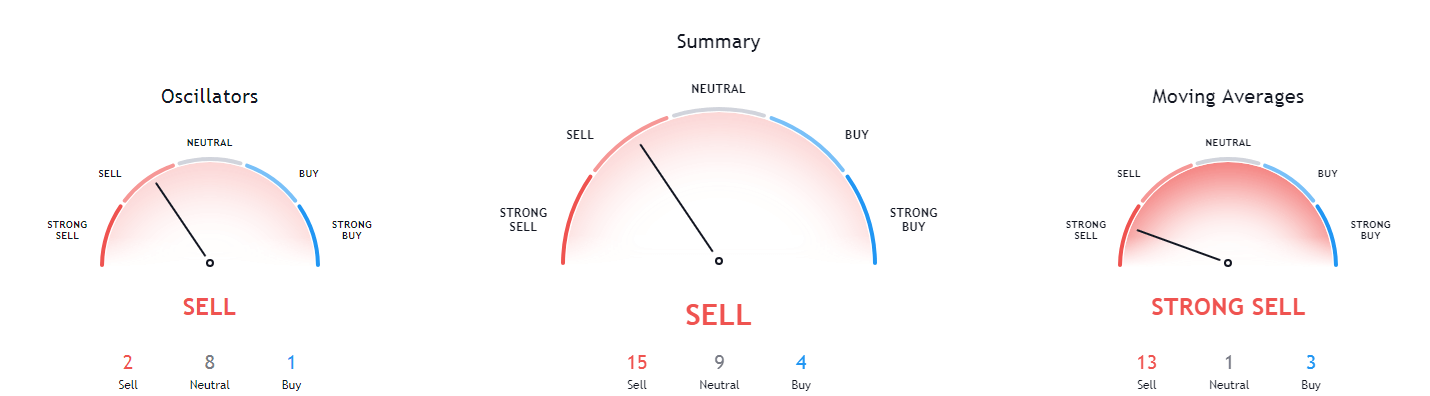
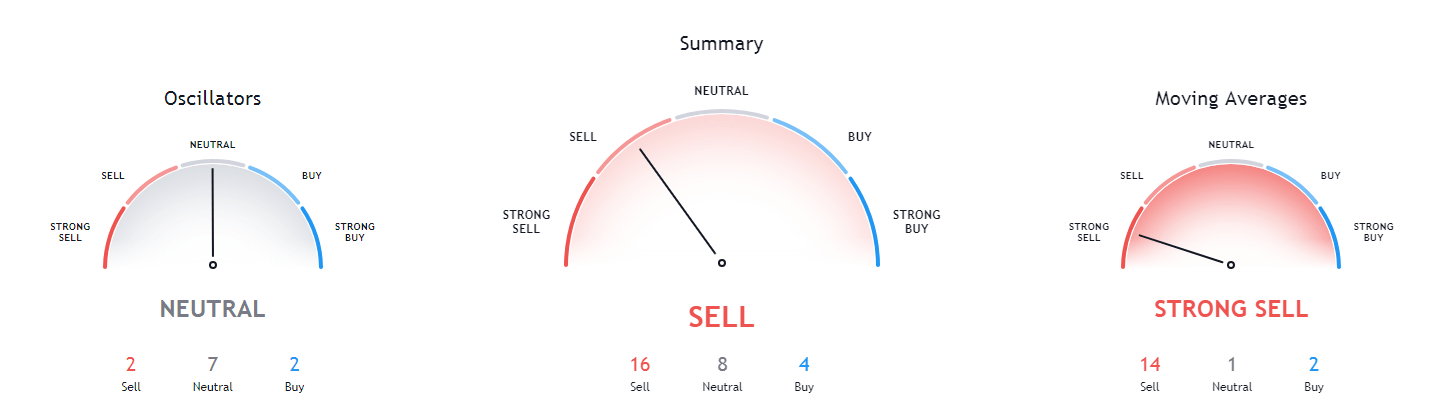
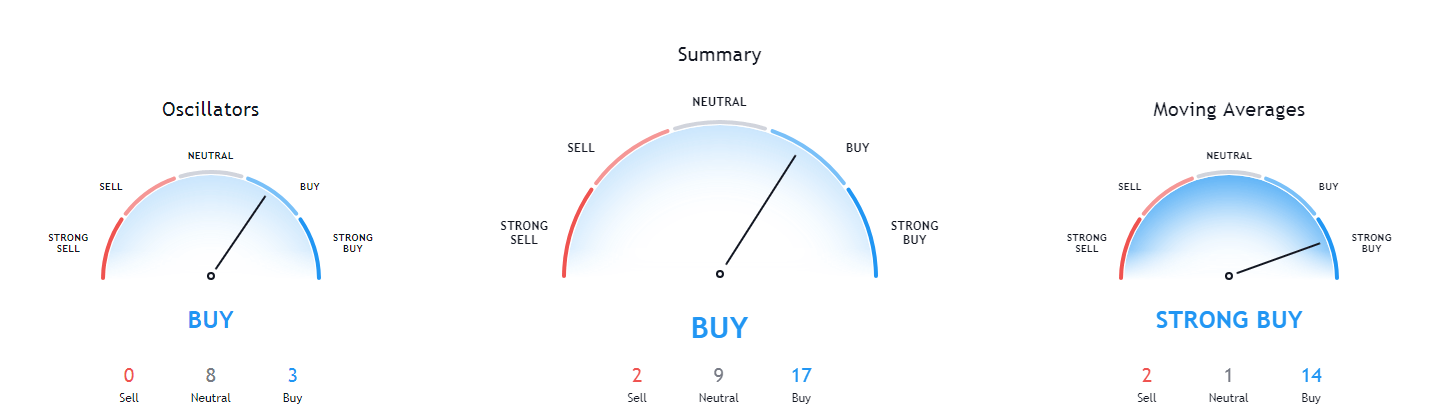
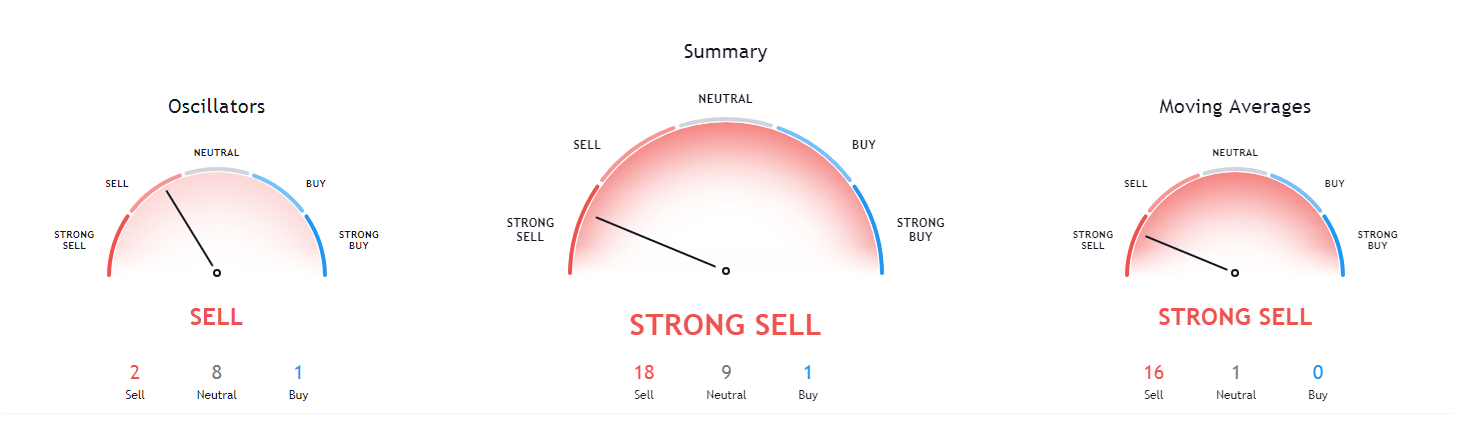
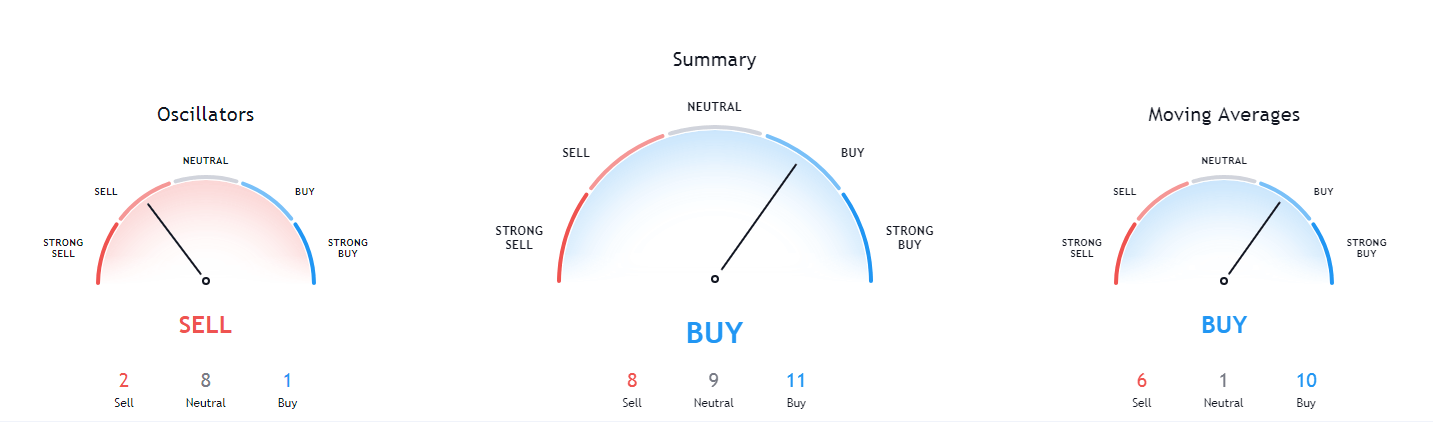
XRP’s bearish sentiment extends across all time frames, with its 4-hour overview showing a bit lighter tilt towards the sell-side, and its longer time-frame overviews showing a strong tilt towards the sell-side.
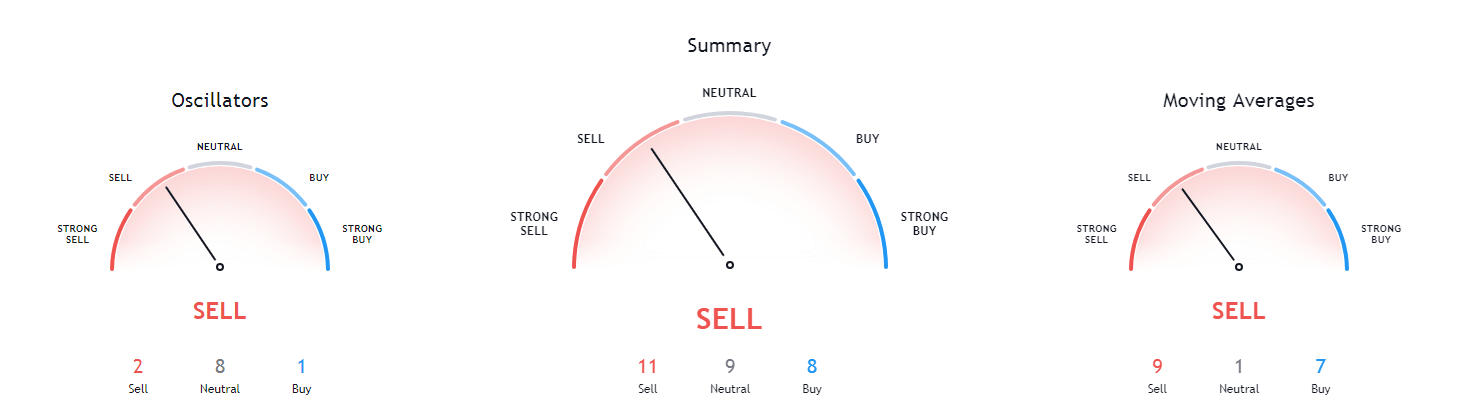
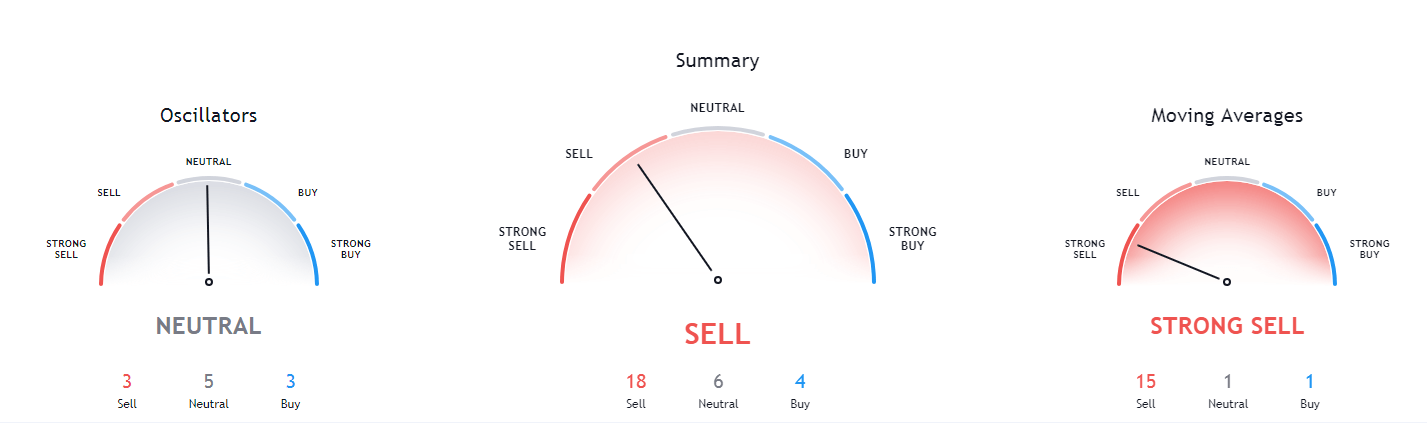
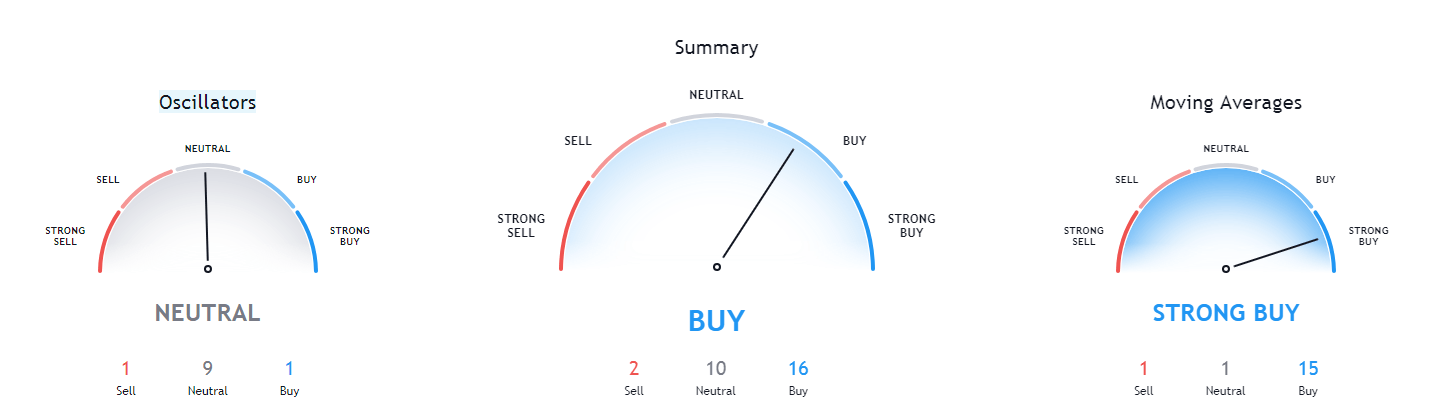
XRP/USD 4-hour Technicals
Technical factors (4-hour Chart):
- The price is below its 50-period EMA and just above its 21-period EMA
- Price is slightly above its middle Bollinger band
- RSI is natural (49.02)
- Volume is slightly above average
Key levels to the upside Key levels to the downside
1: $0.235 1: $0.227
2: $0.2454 2: $0.221
3: $0.266 3: $0.214


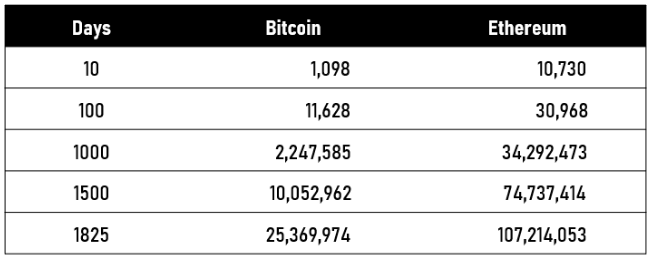
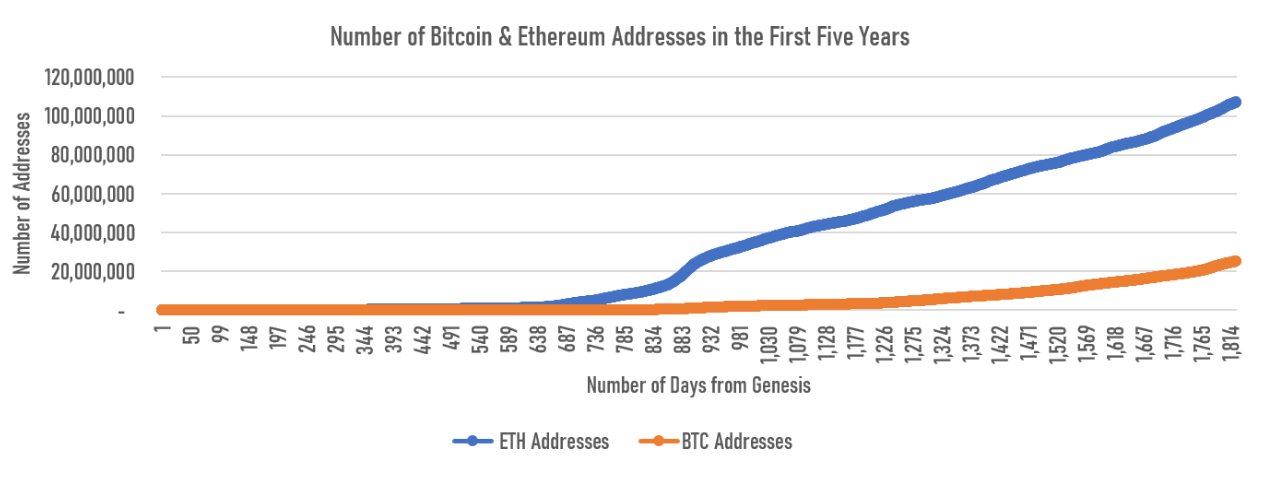
 One key metric suggests that Ethereum has enjoyed a much faster adoption rate as well as the growth rate in the first five years of its existence than Bitcoin.