The cryptocurrency market spent had quite a bullish weekend. Out of the major cryptocurrencies, Ethereum and Bitcoin broke the strongest barriers. Bitcoin is currently trading for $10,050, which represents an increase of 3.95% on the day. Meanwhile, Ethereum gained 6.42% on the day, while XRP gained 1.04%.
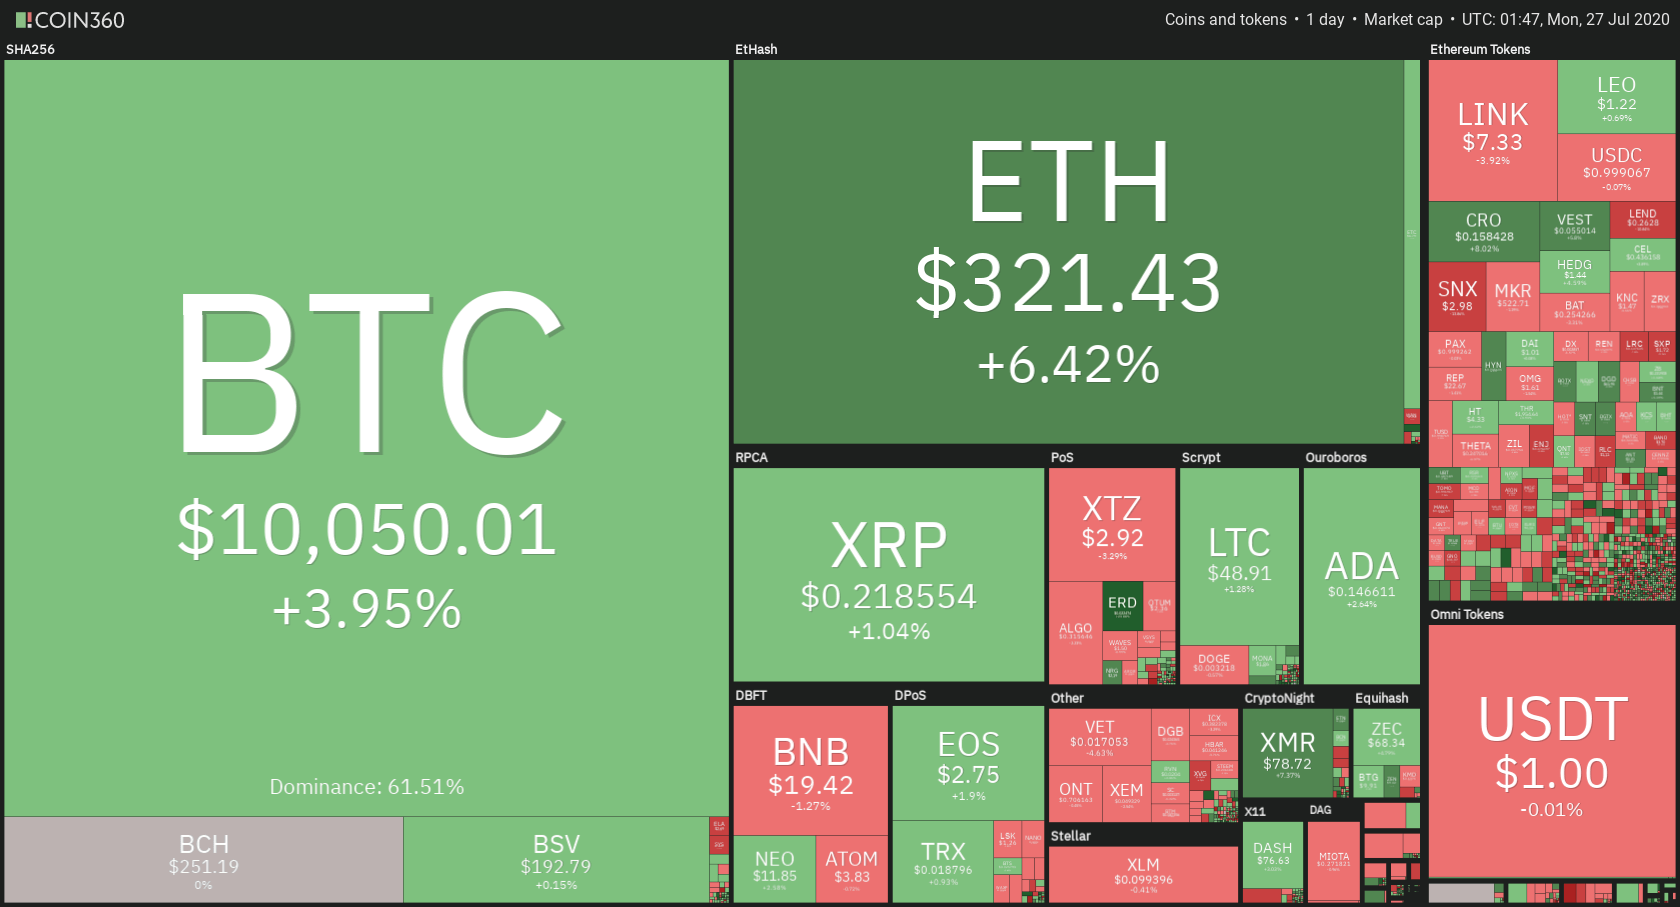
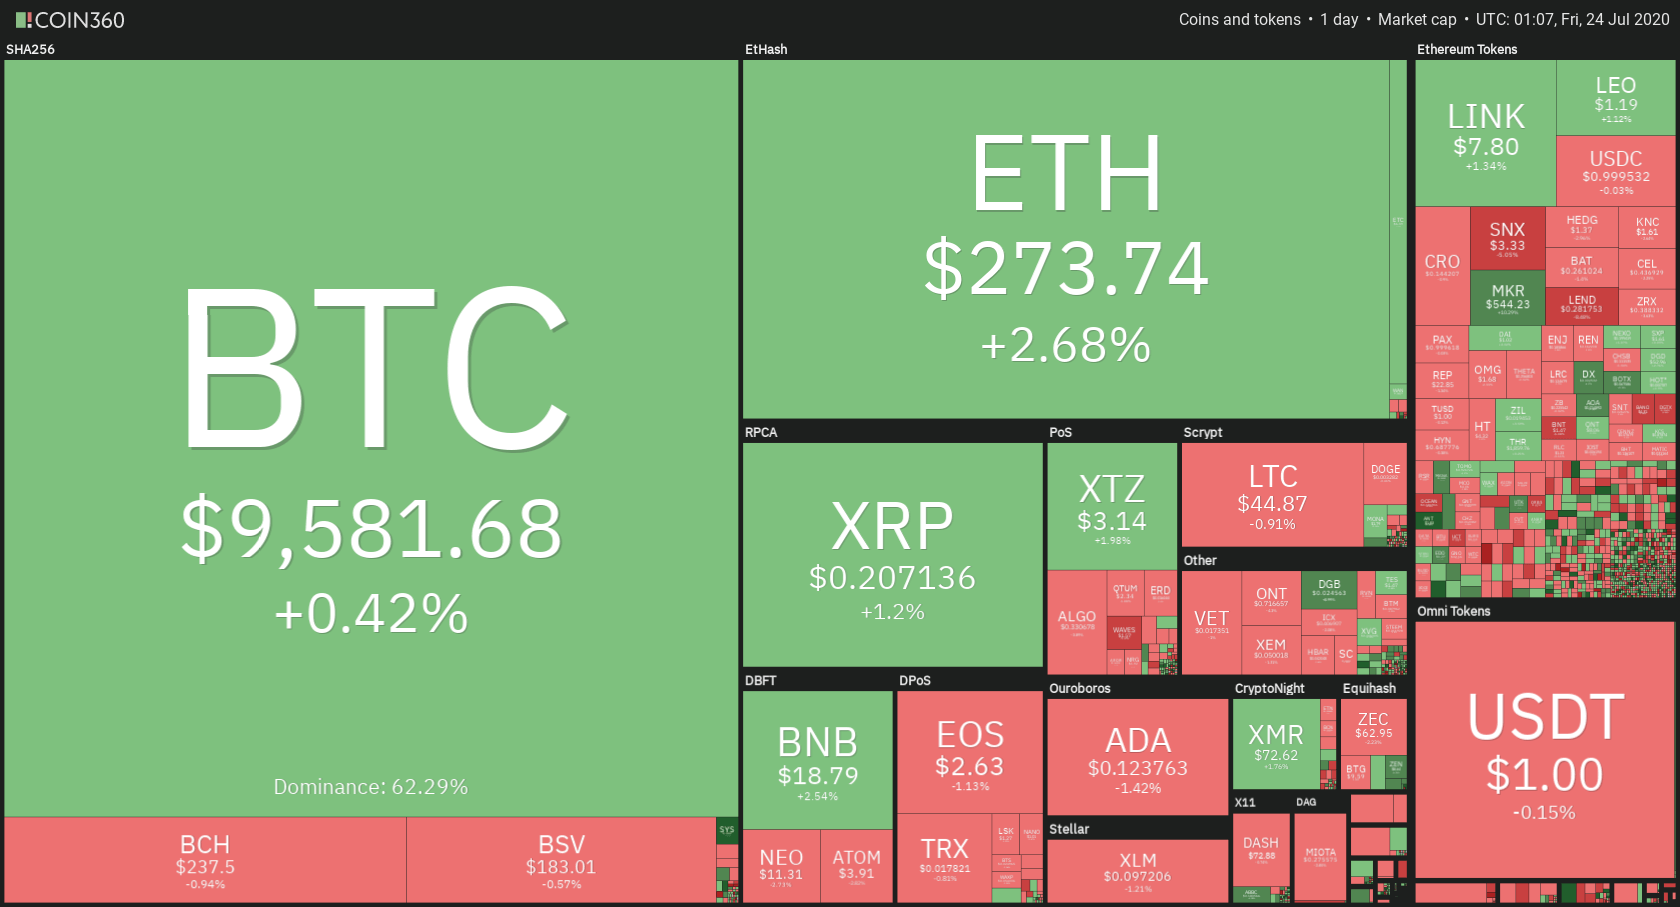
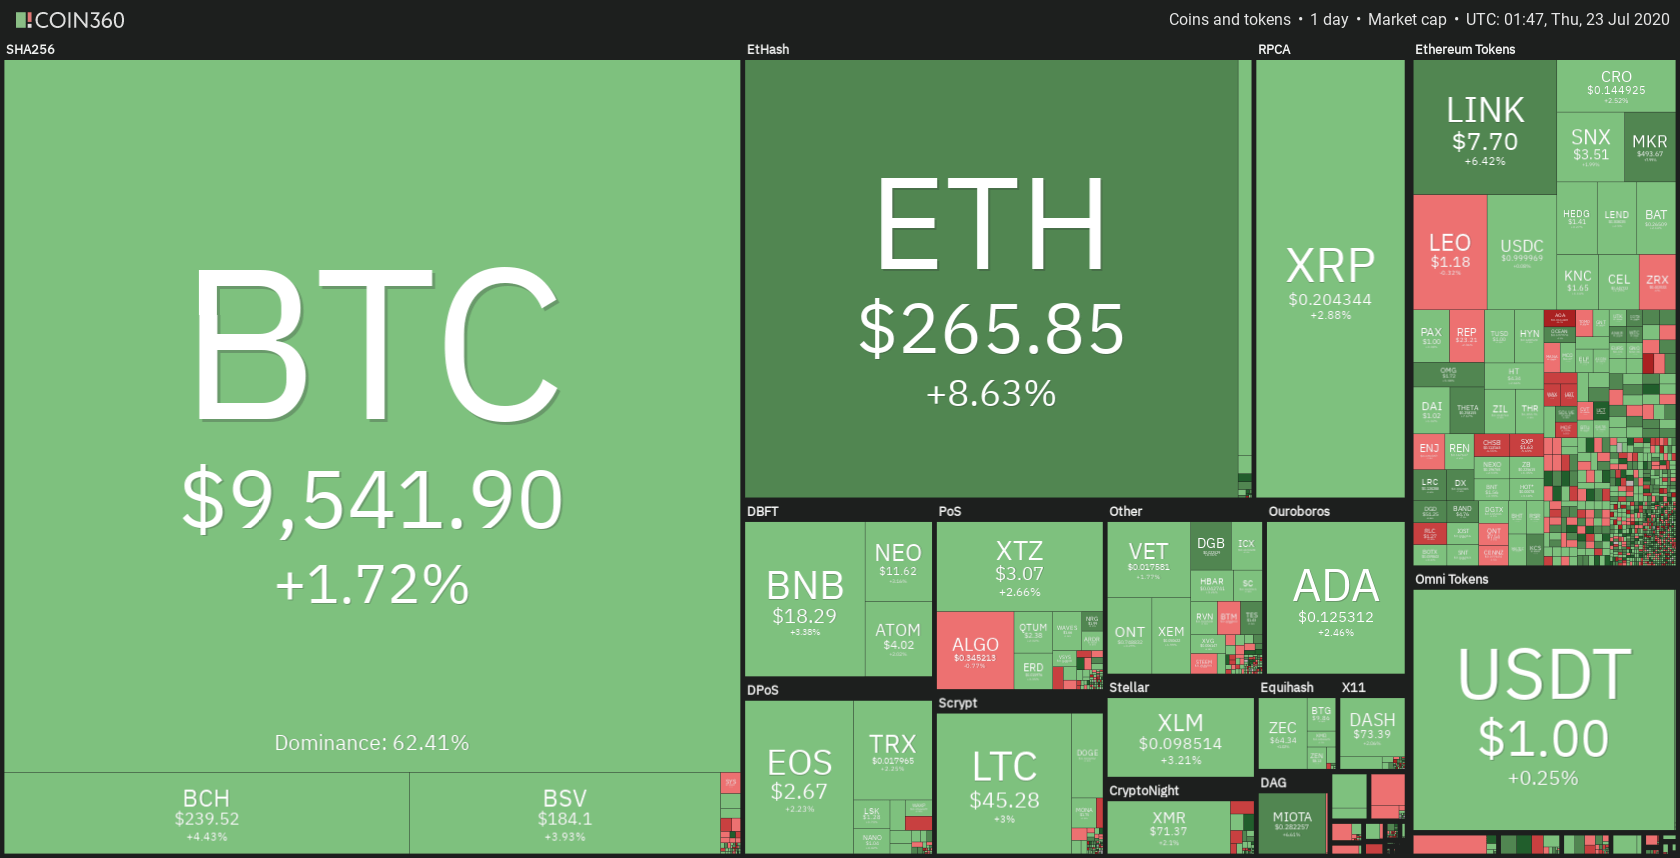
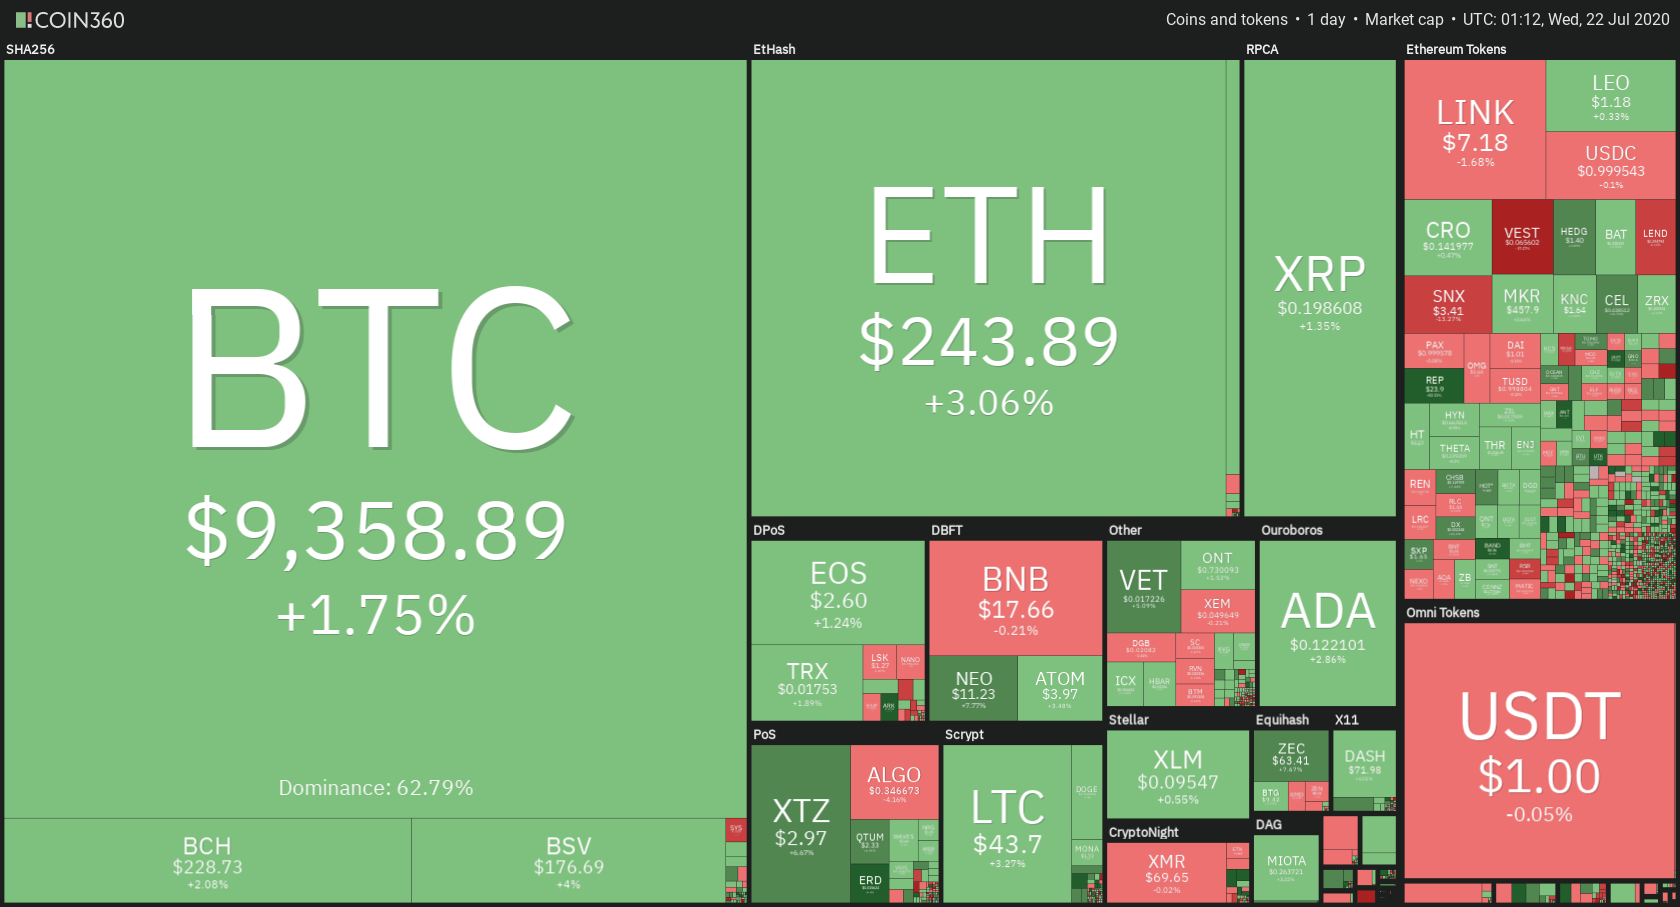
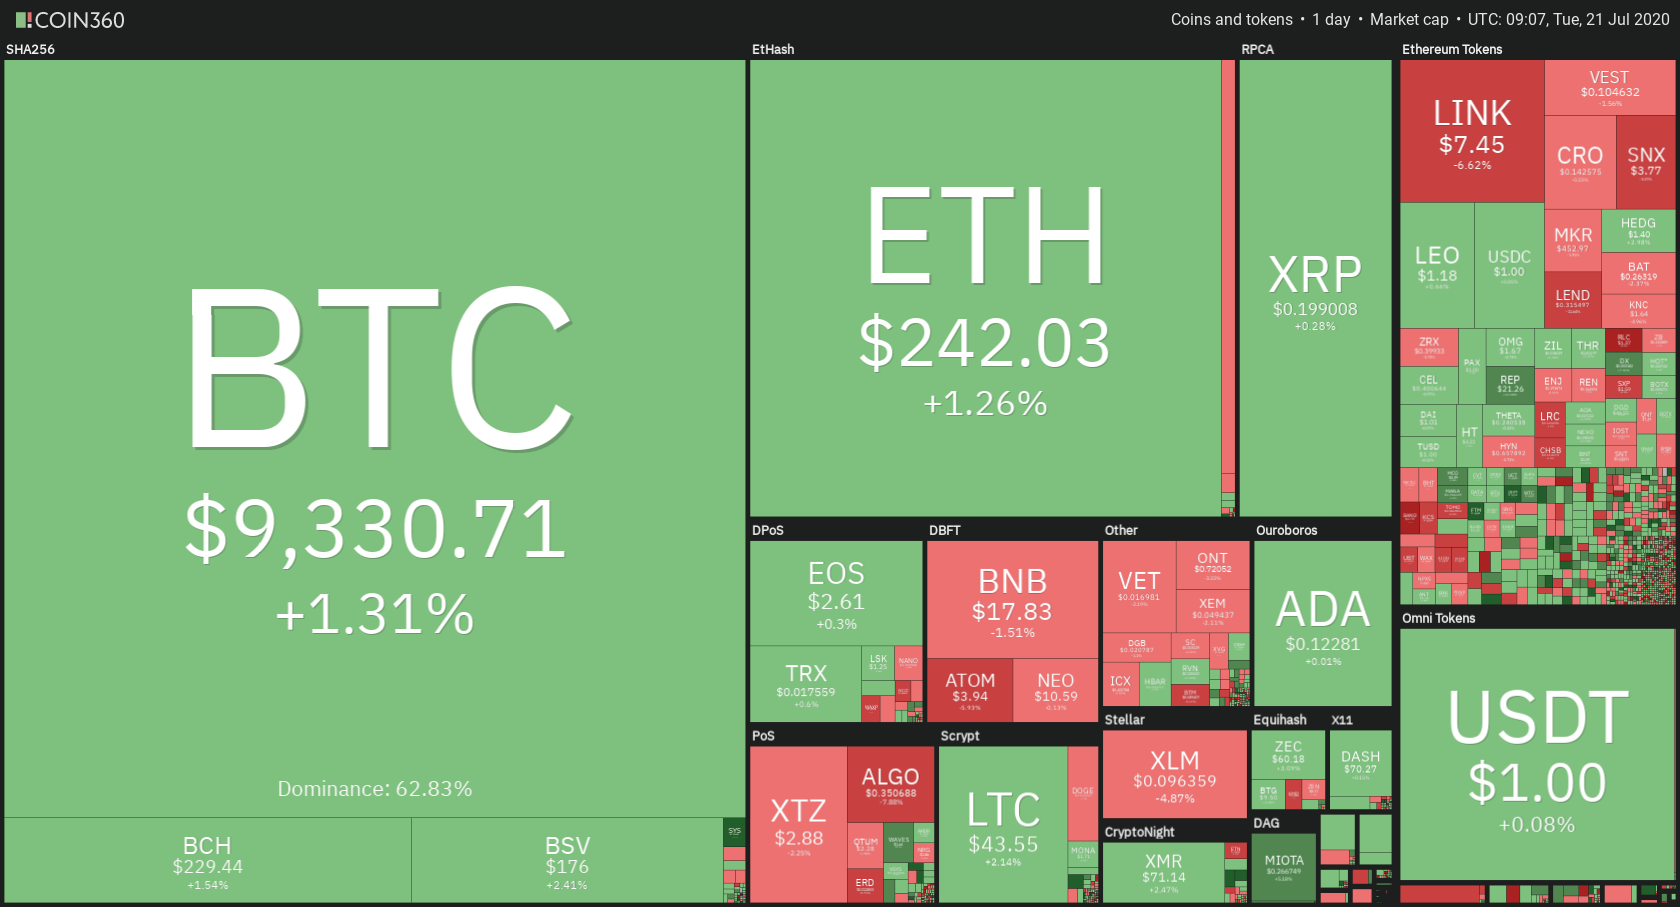
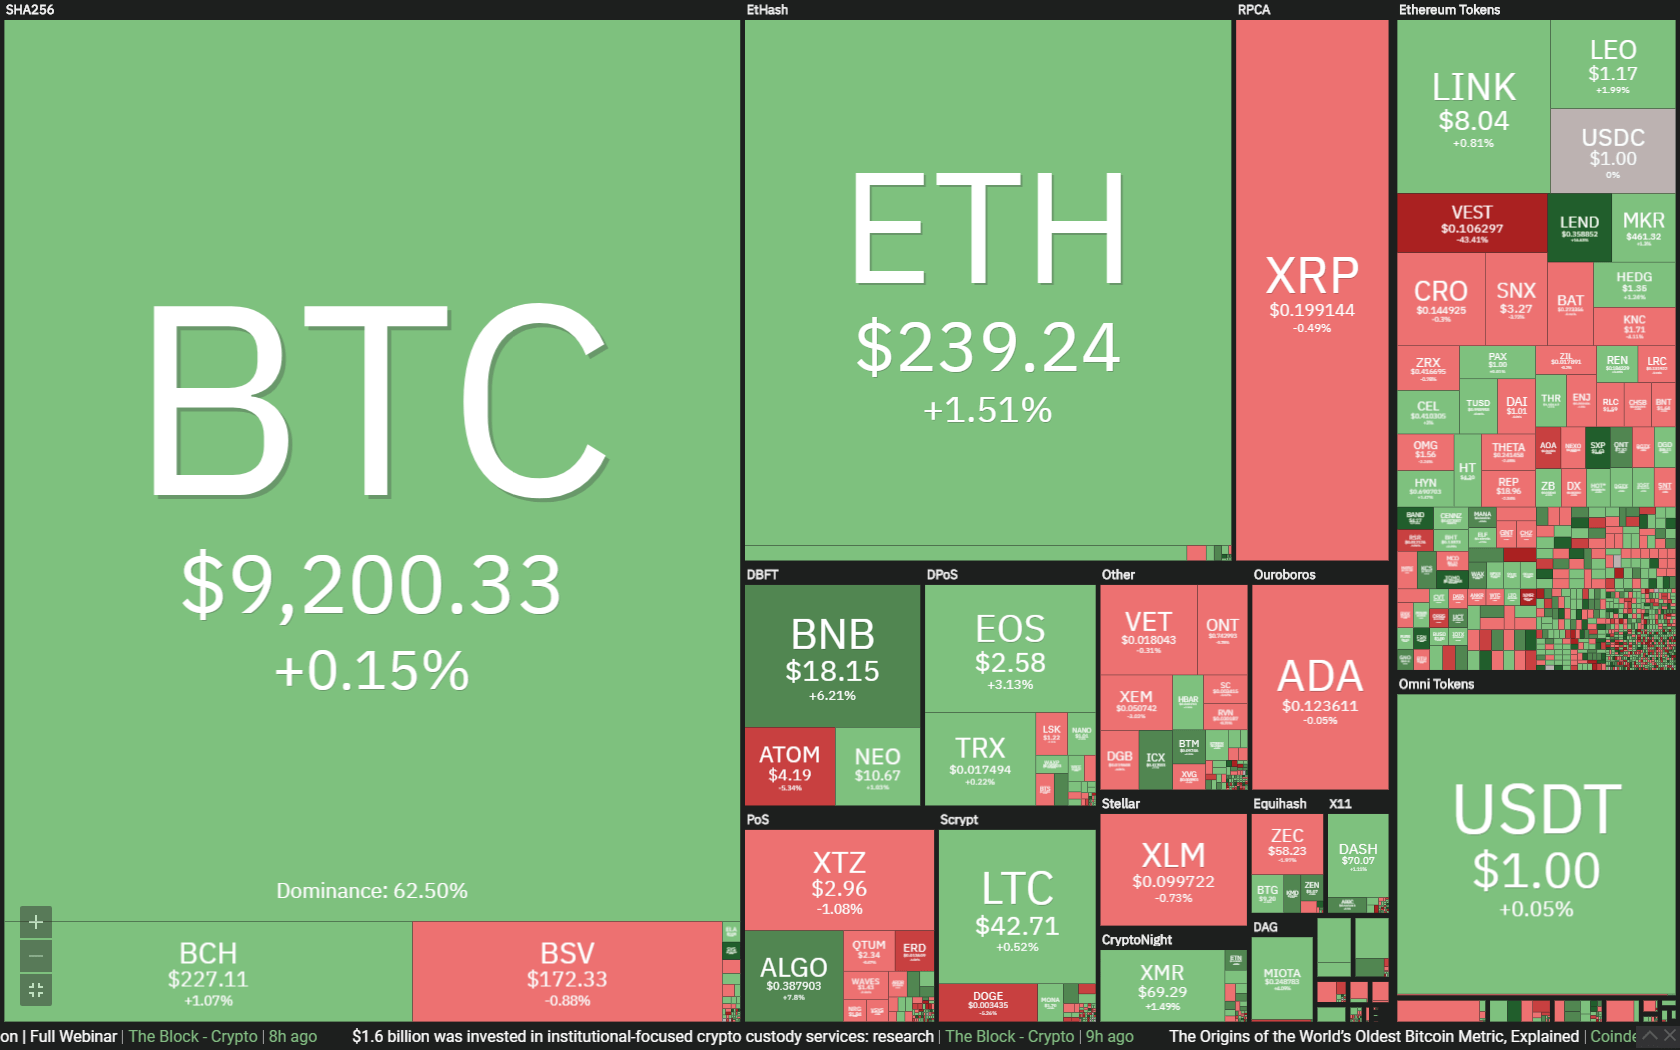
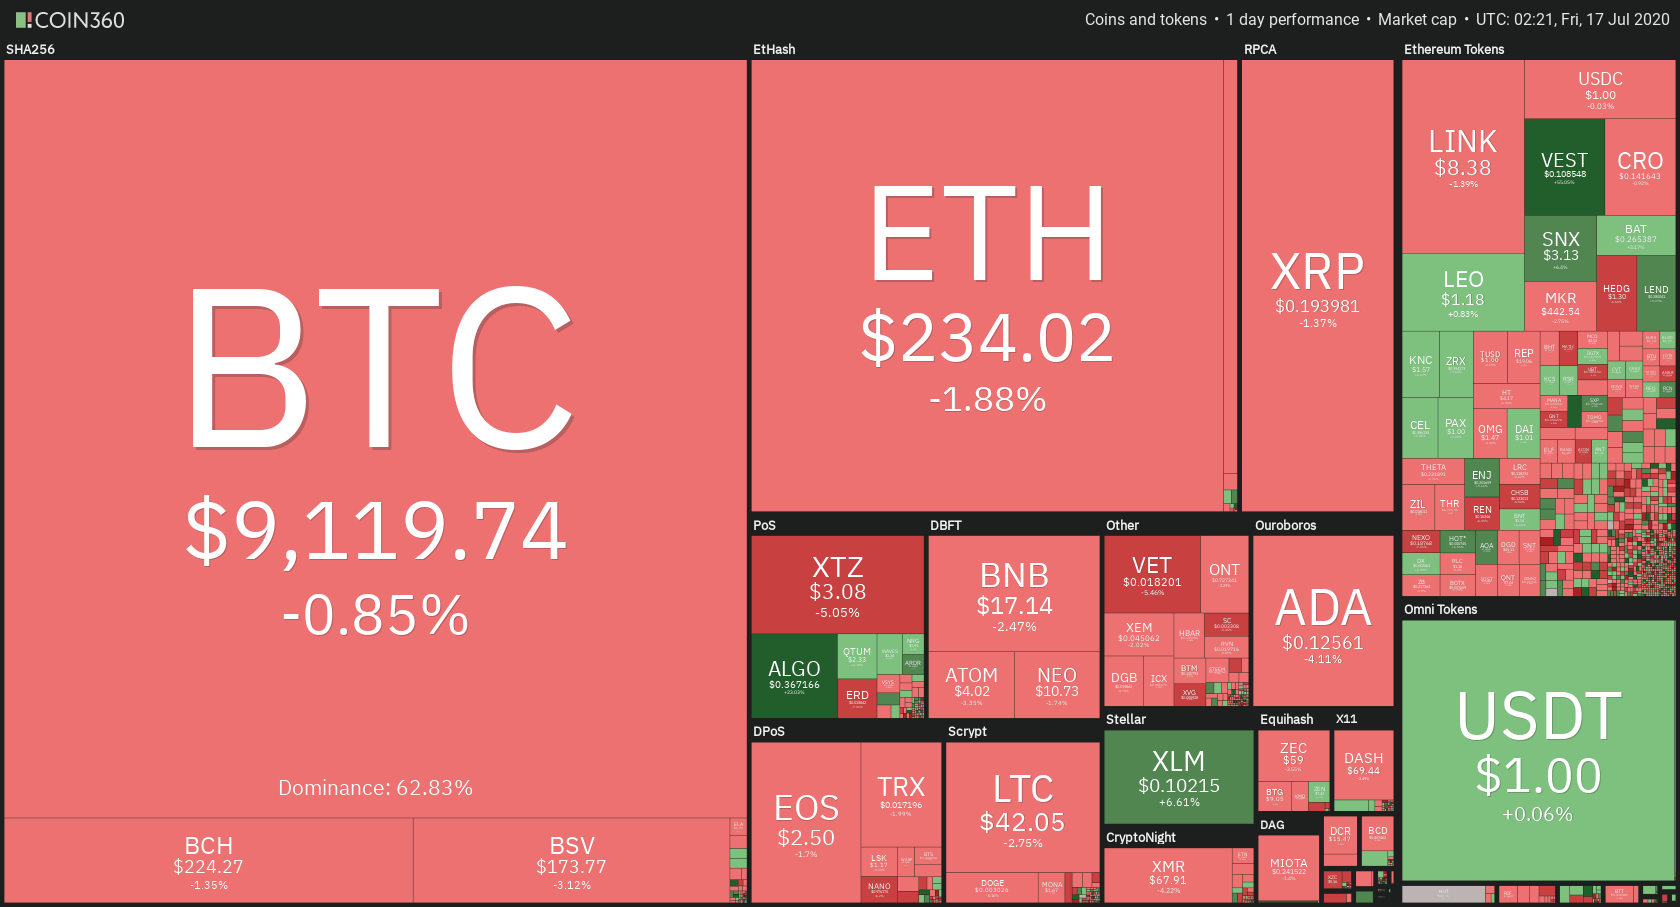
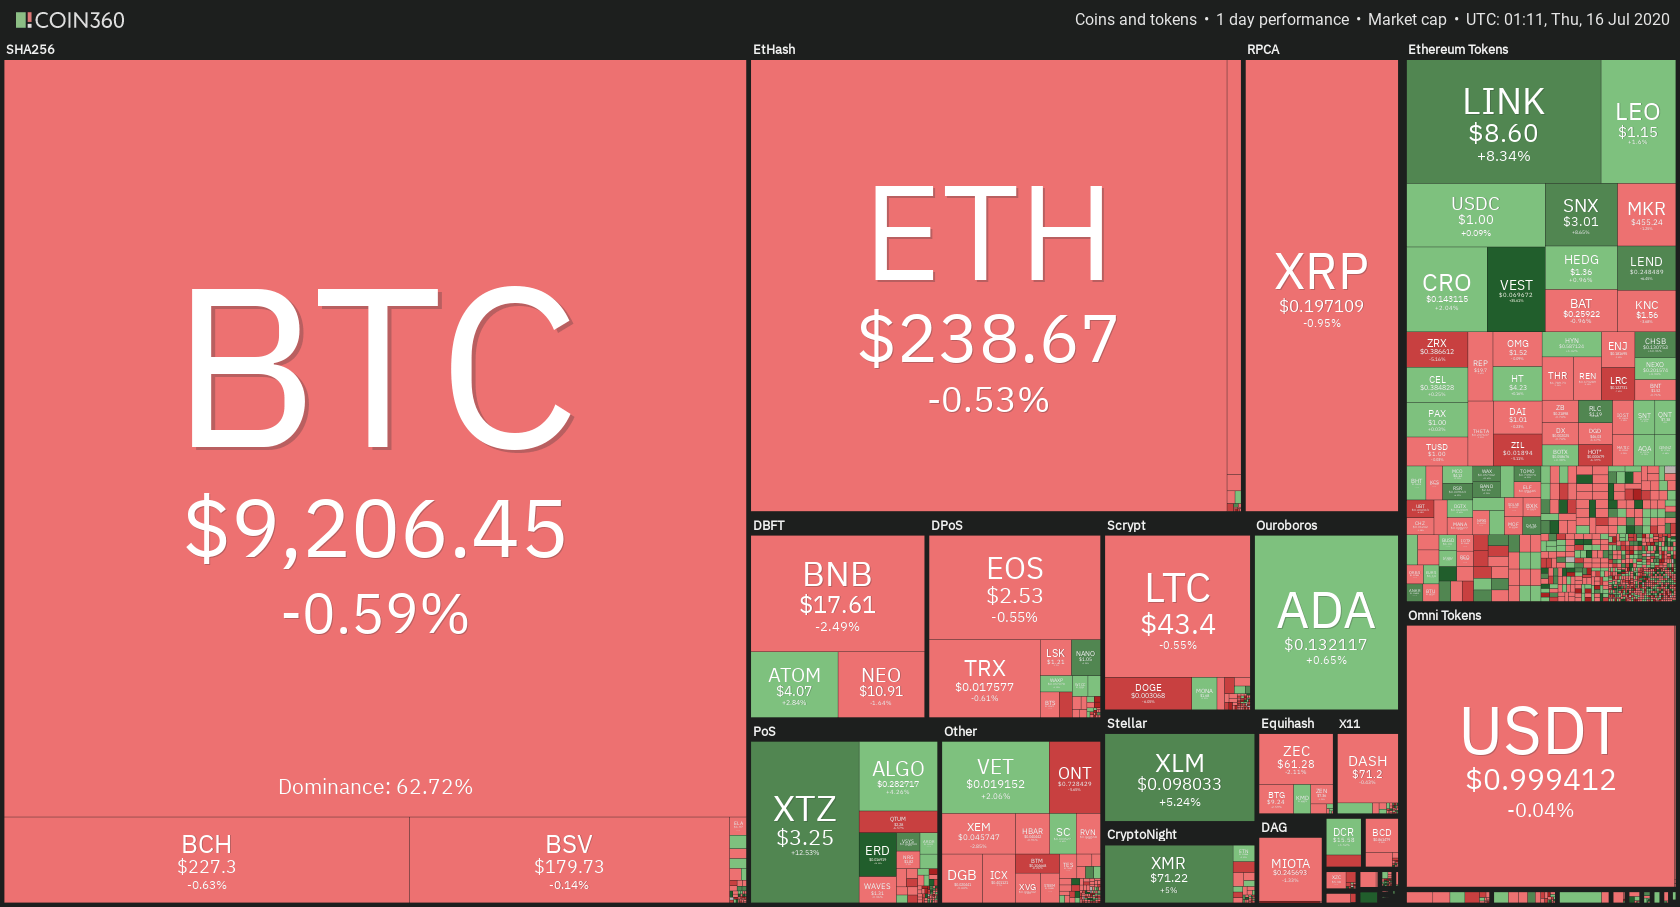
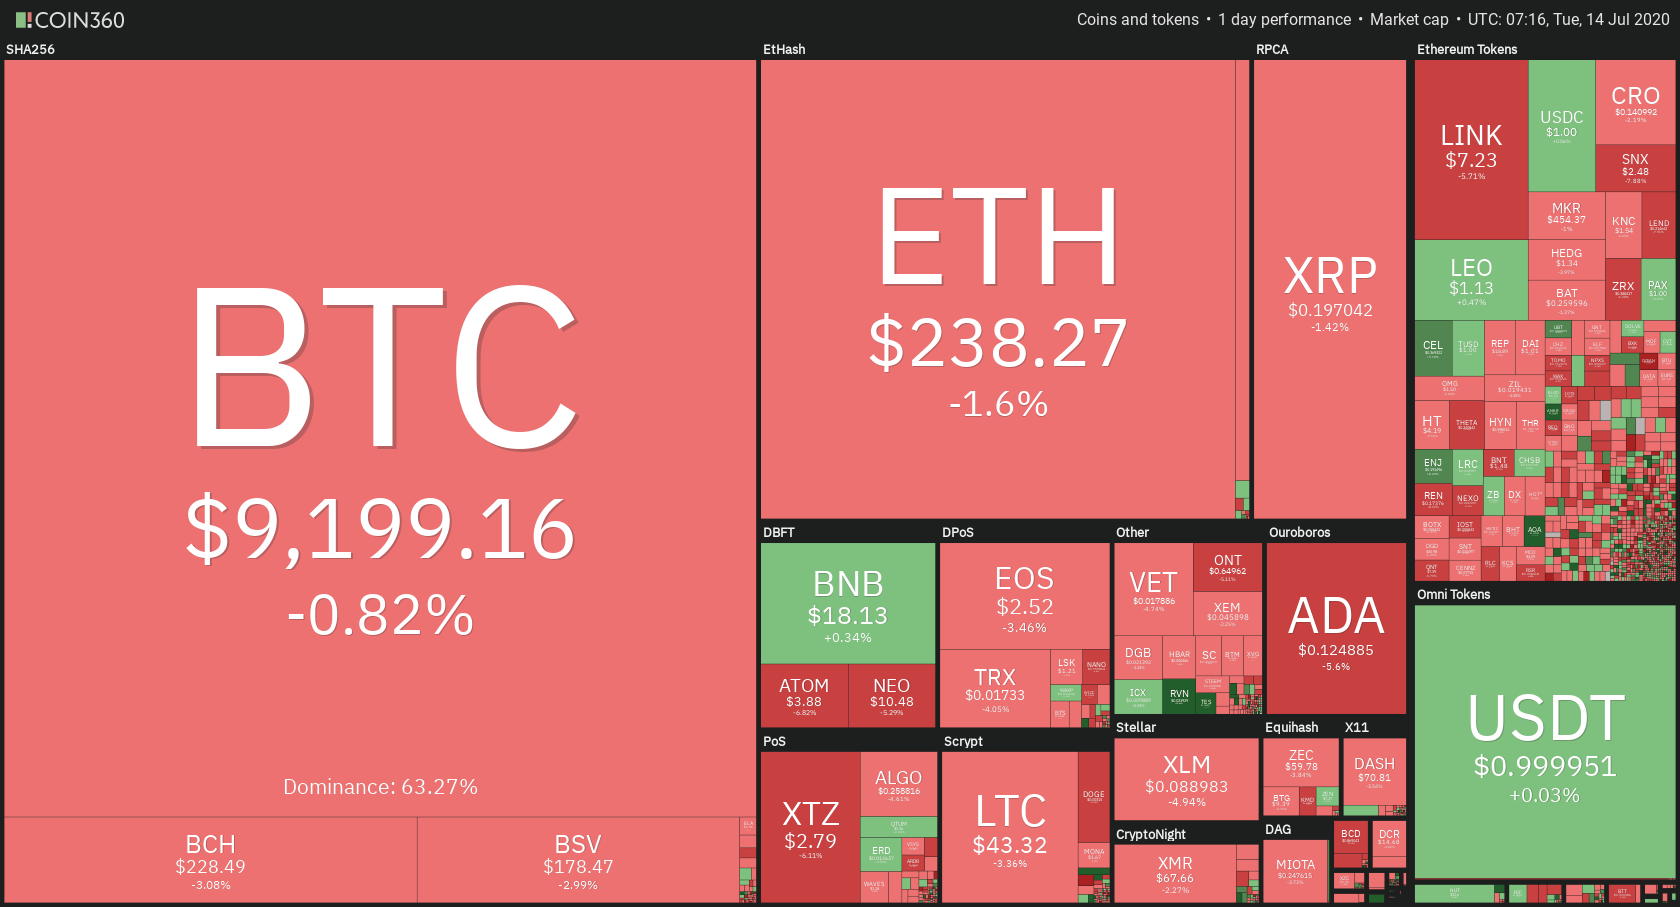
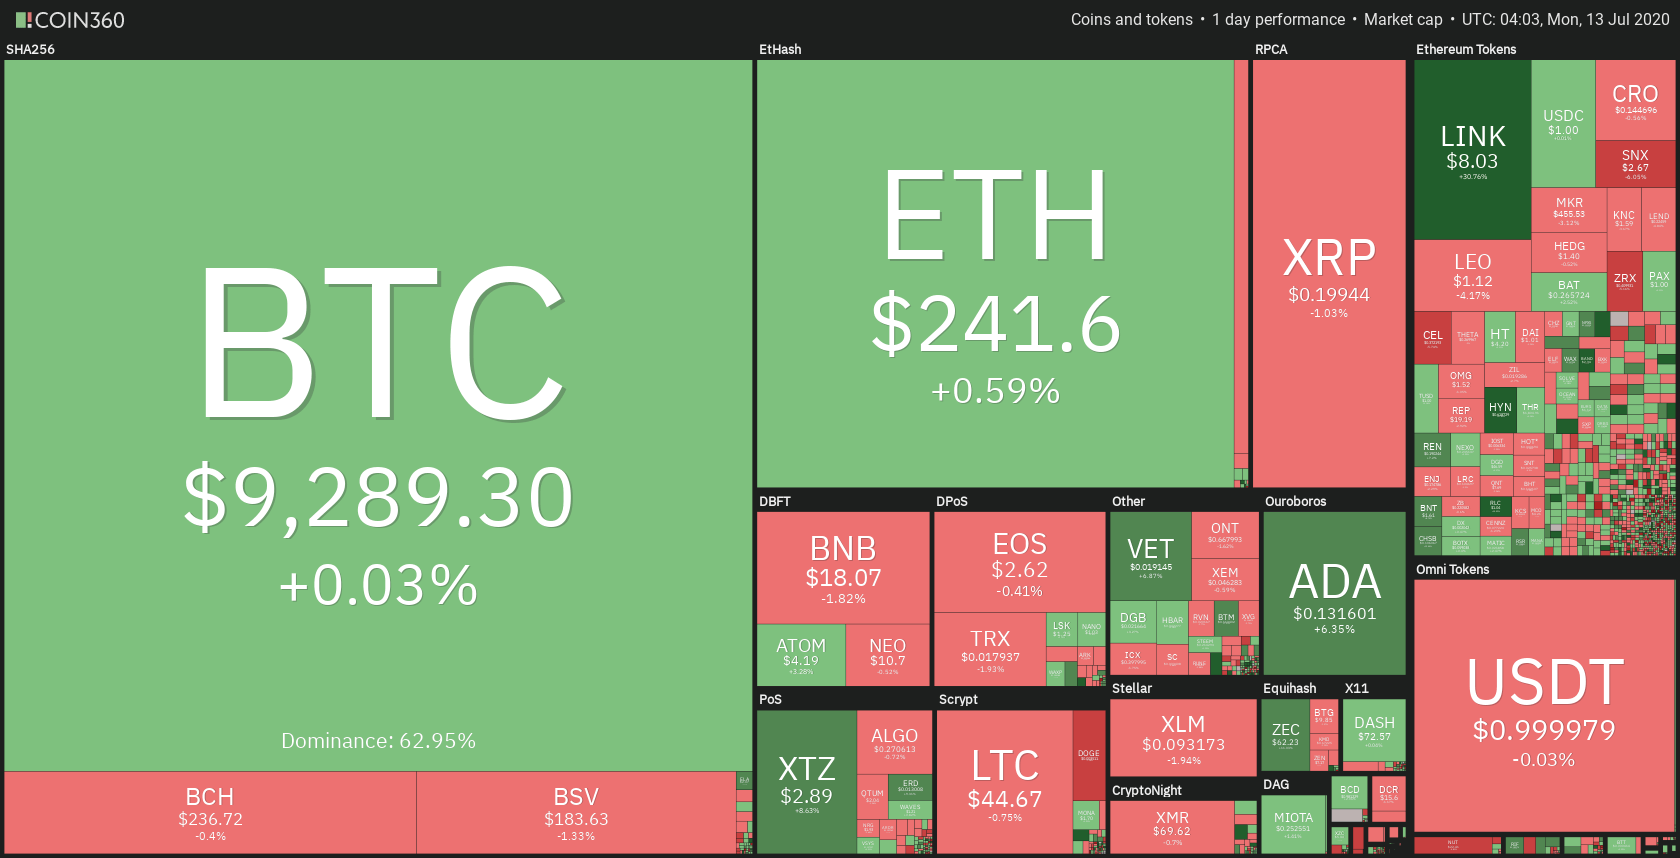
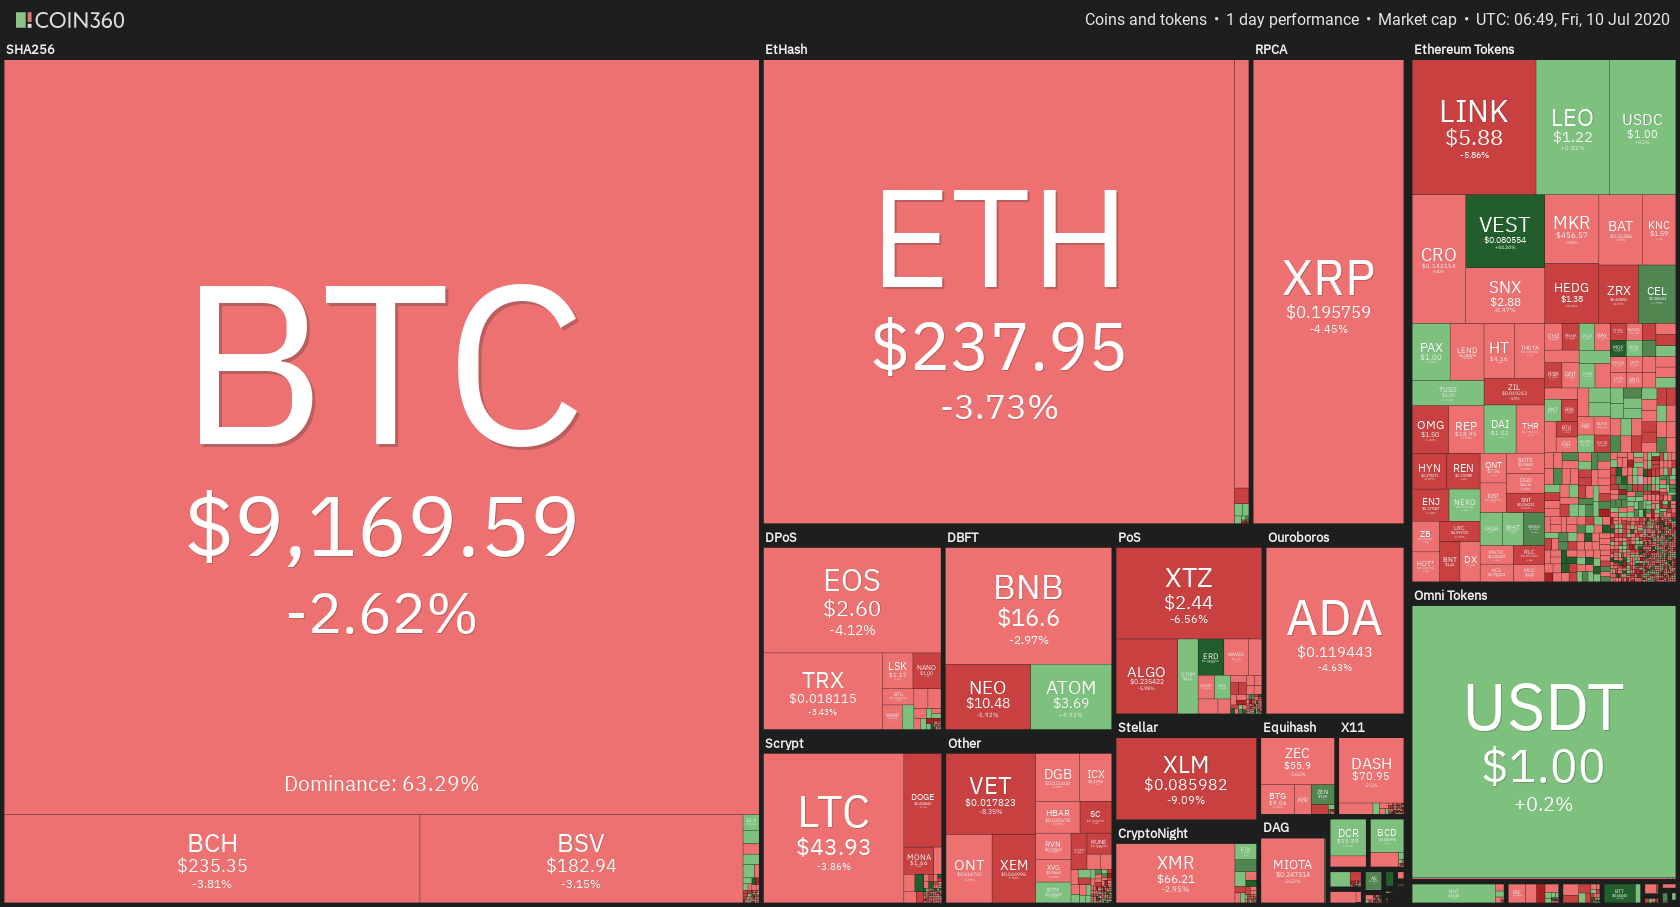
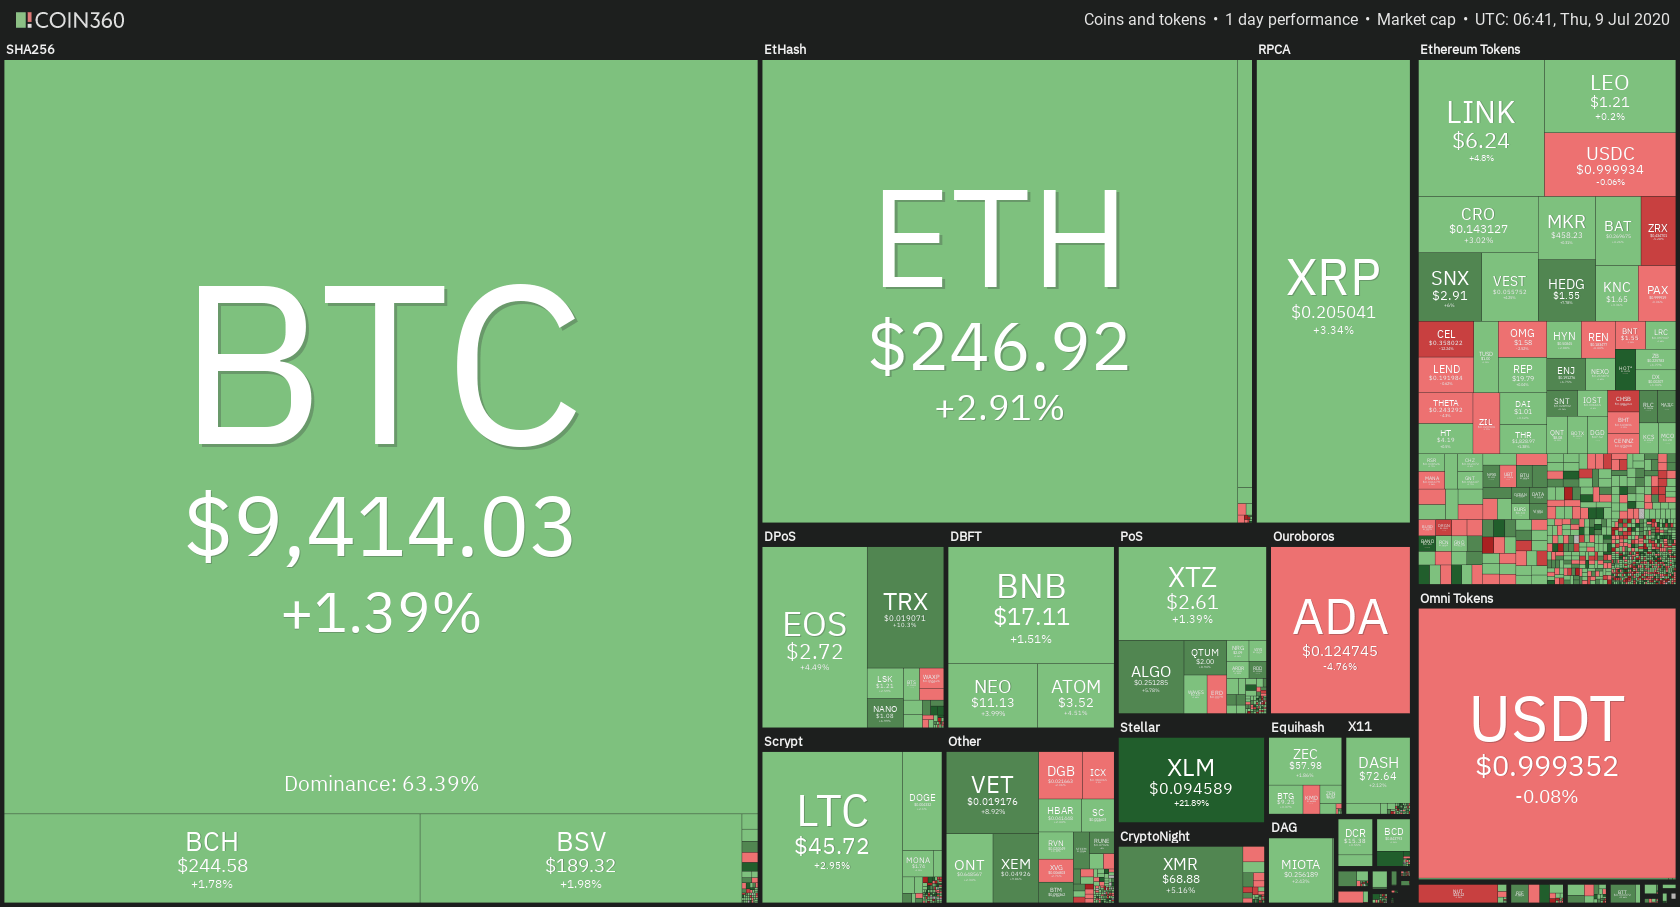
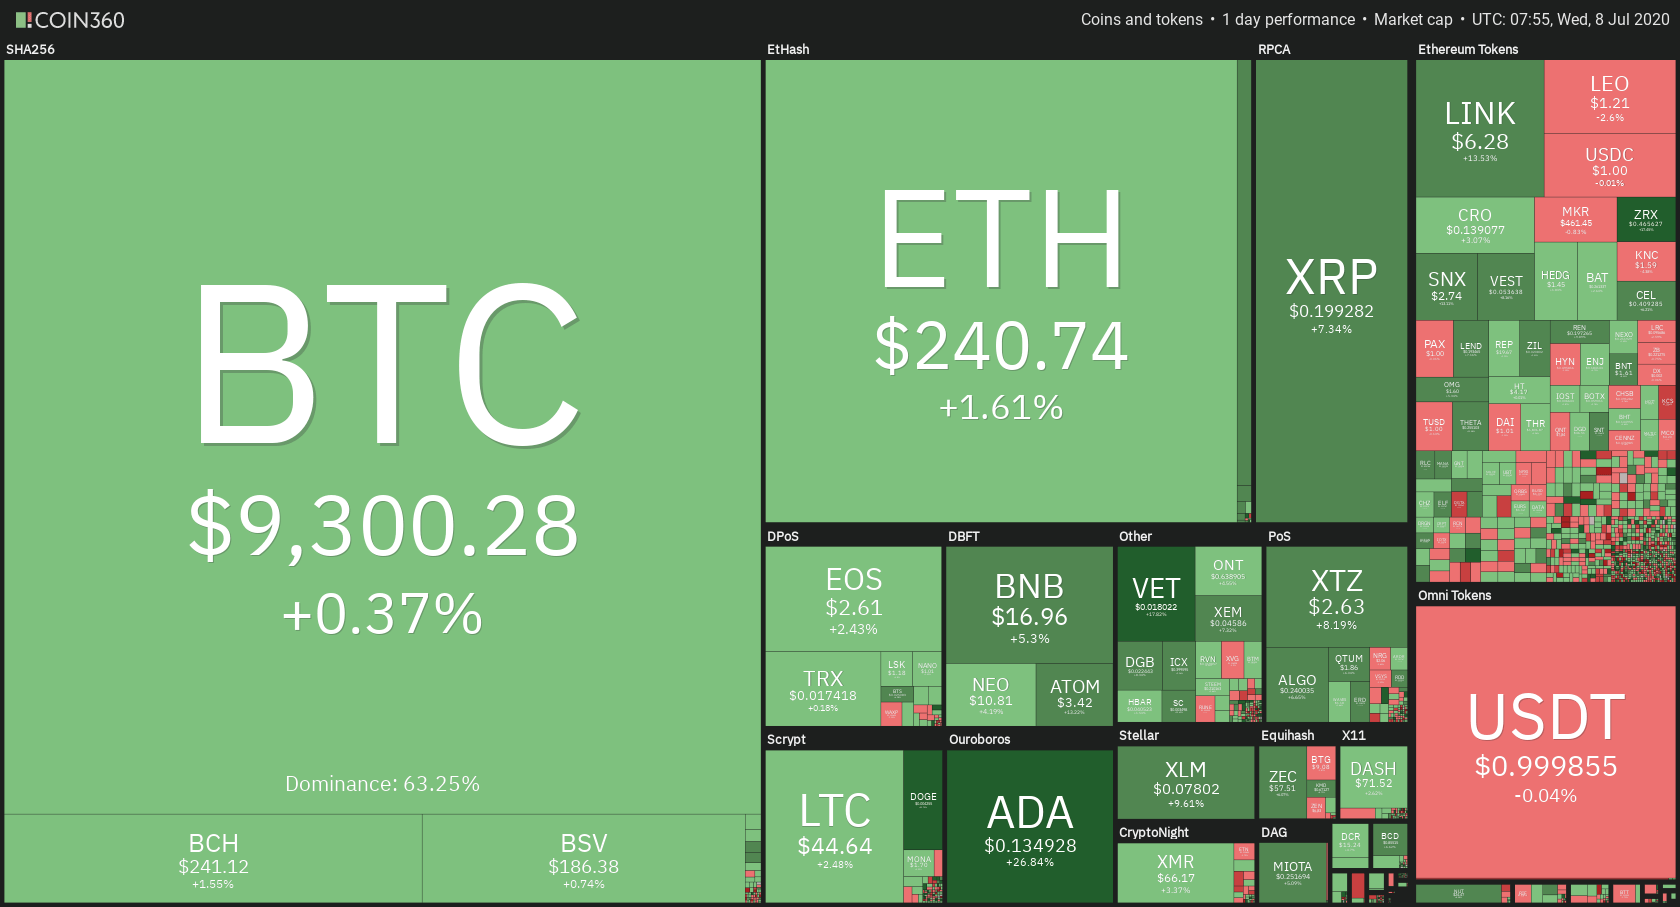
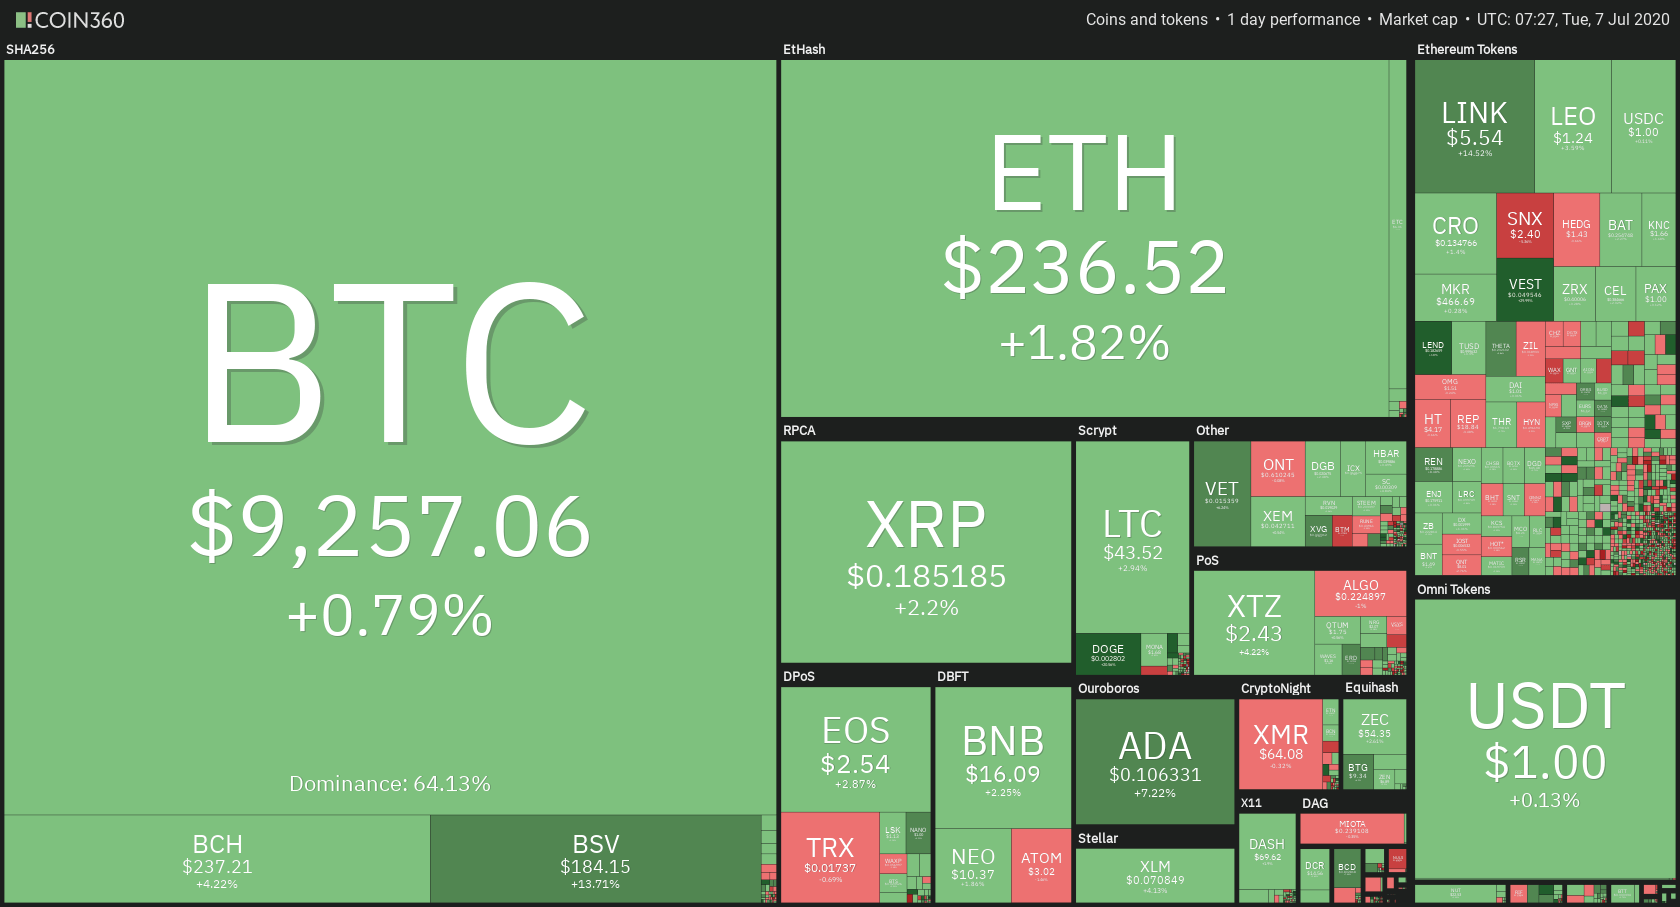
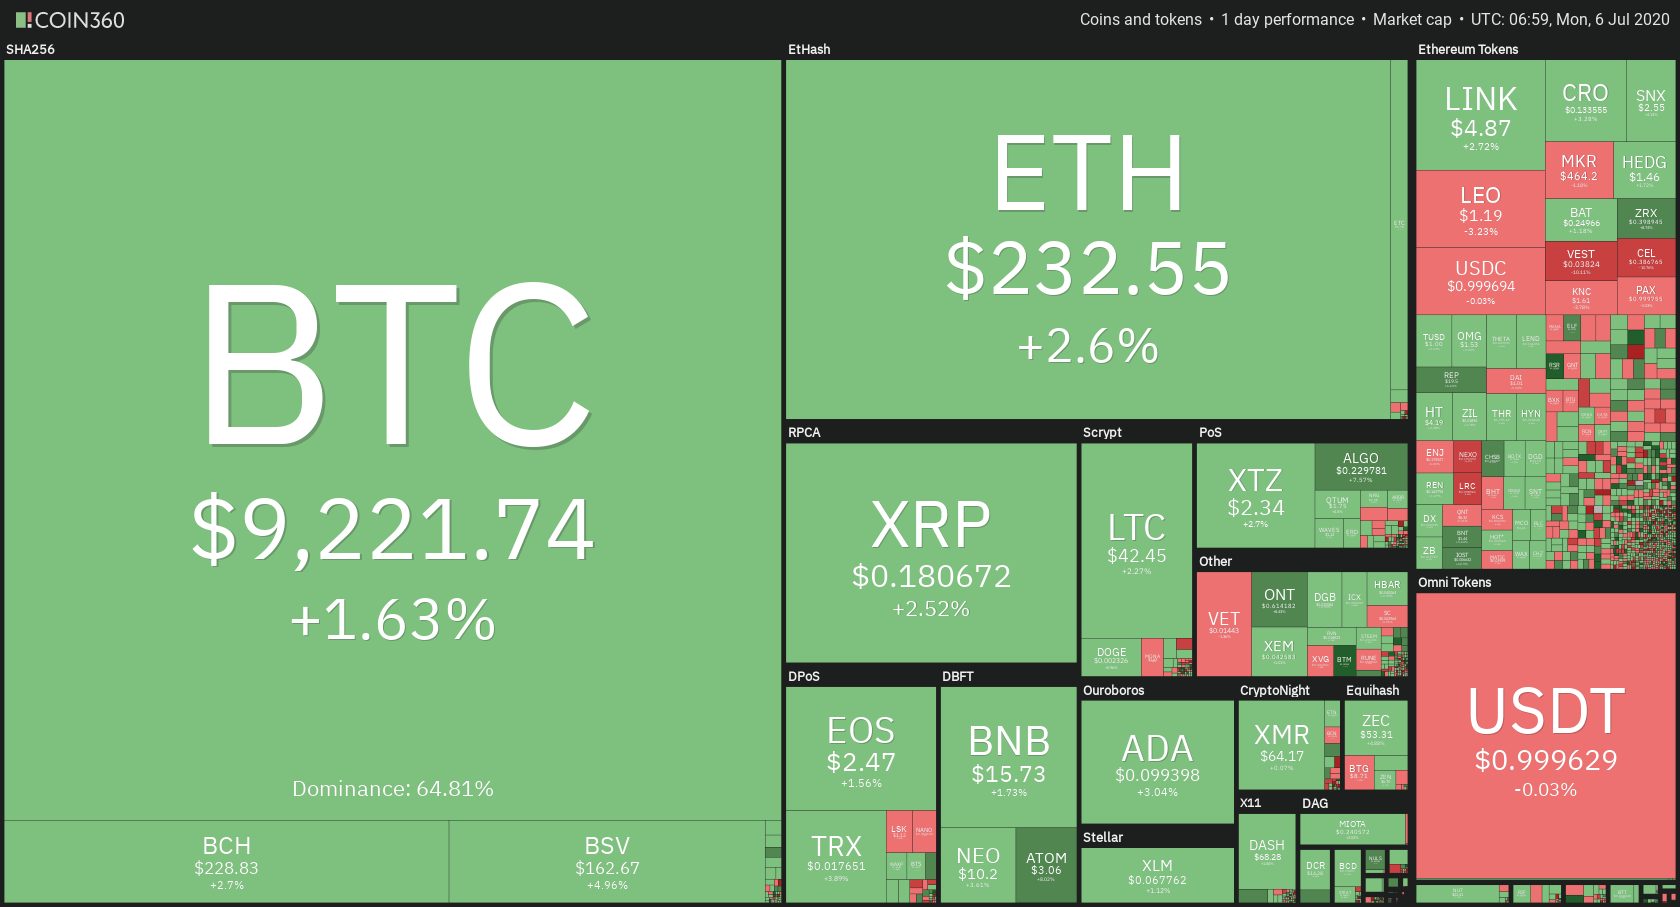
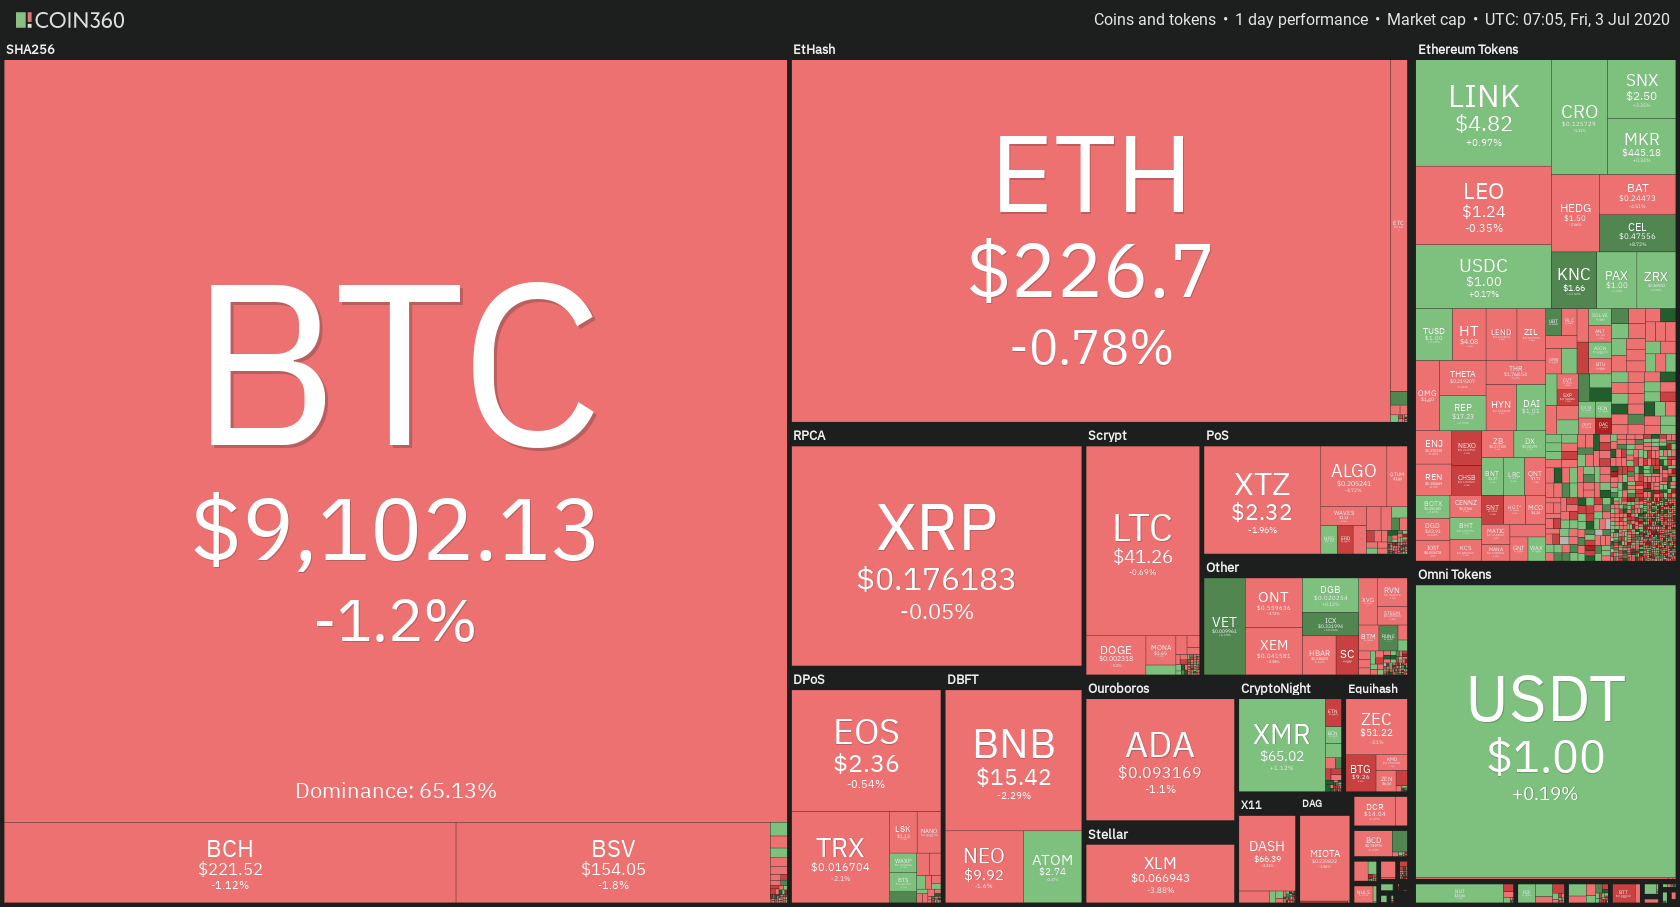
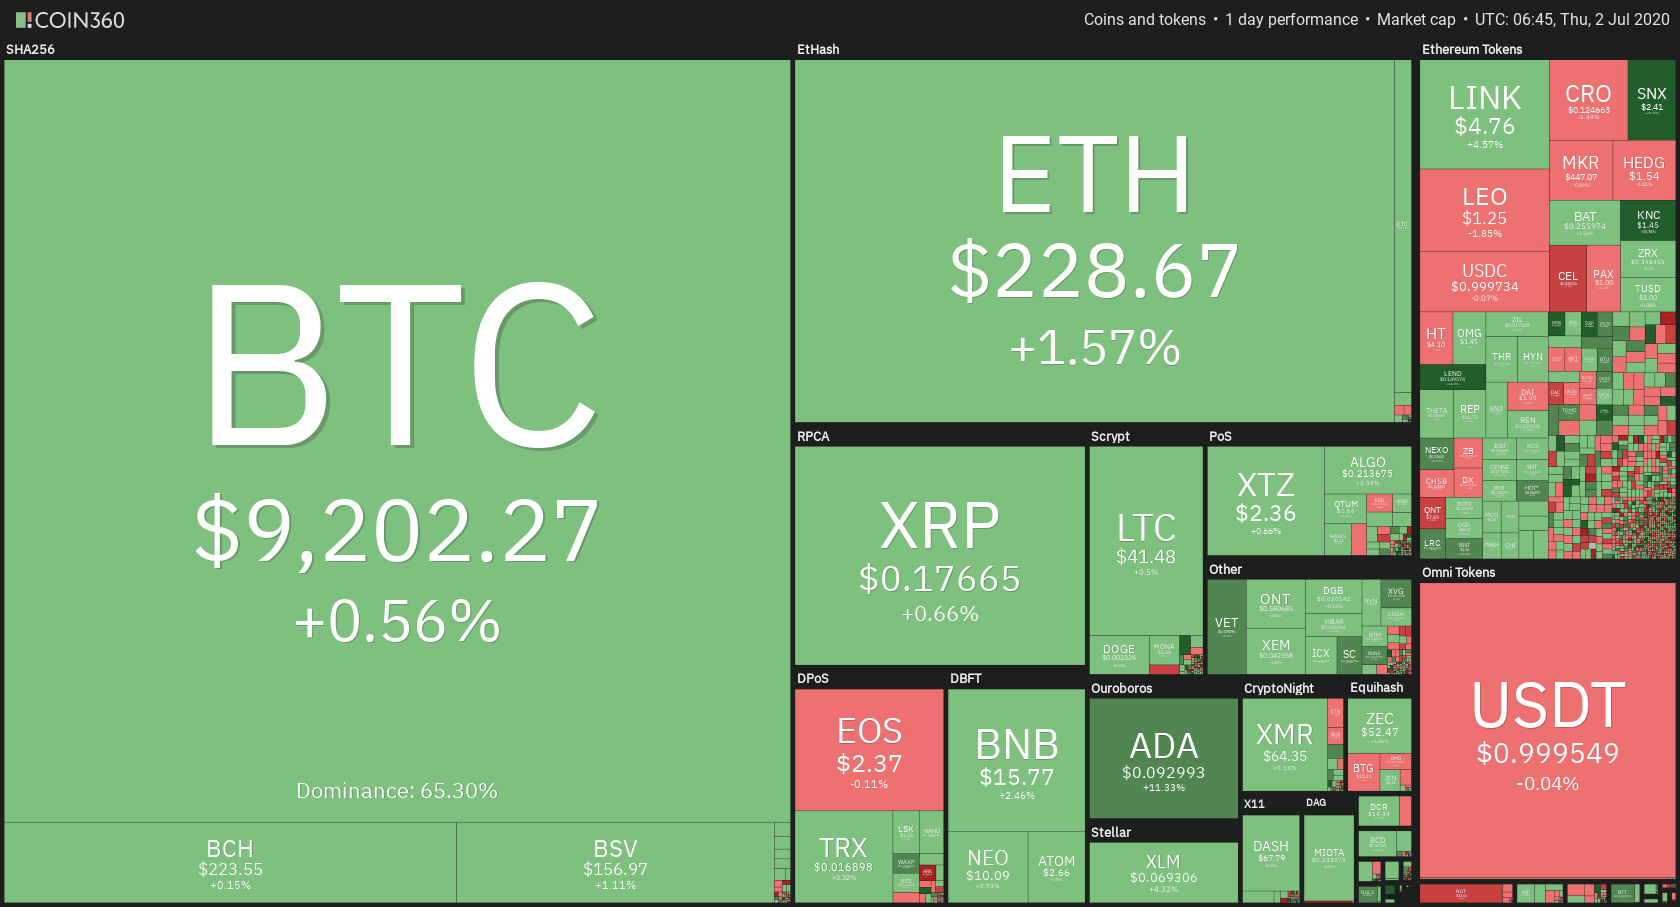
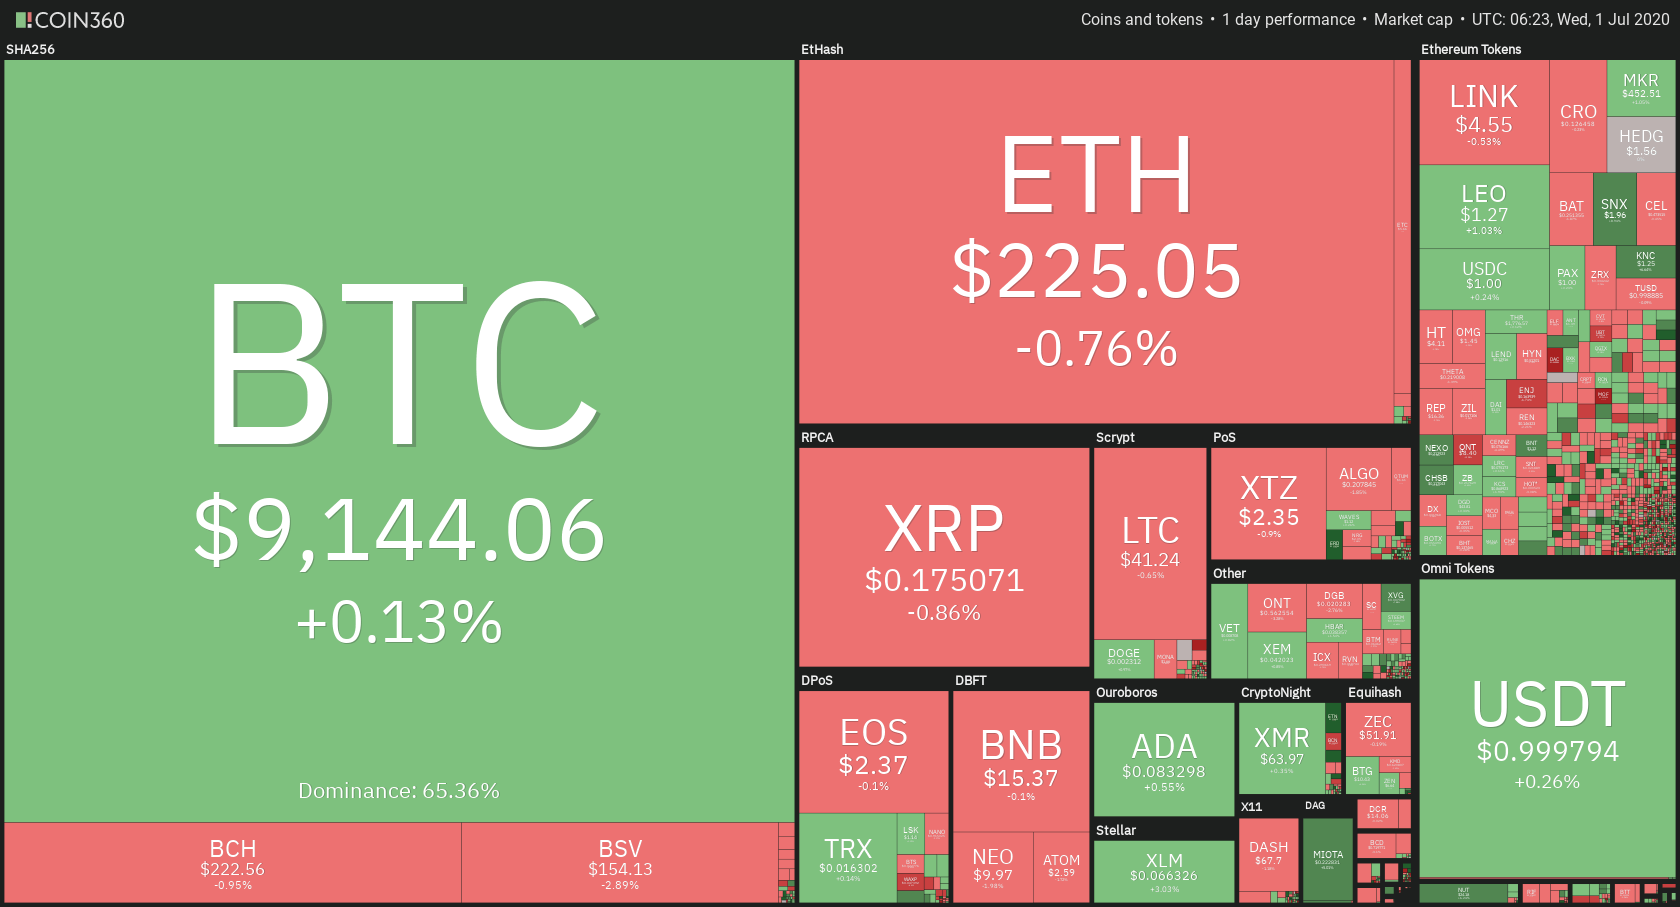
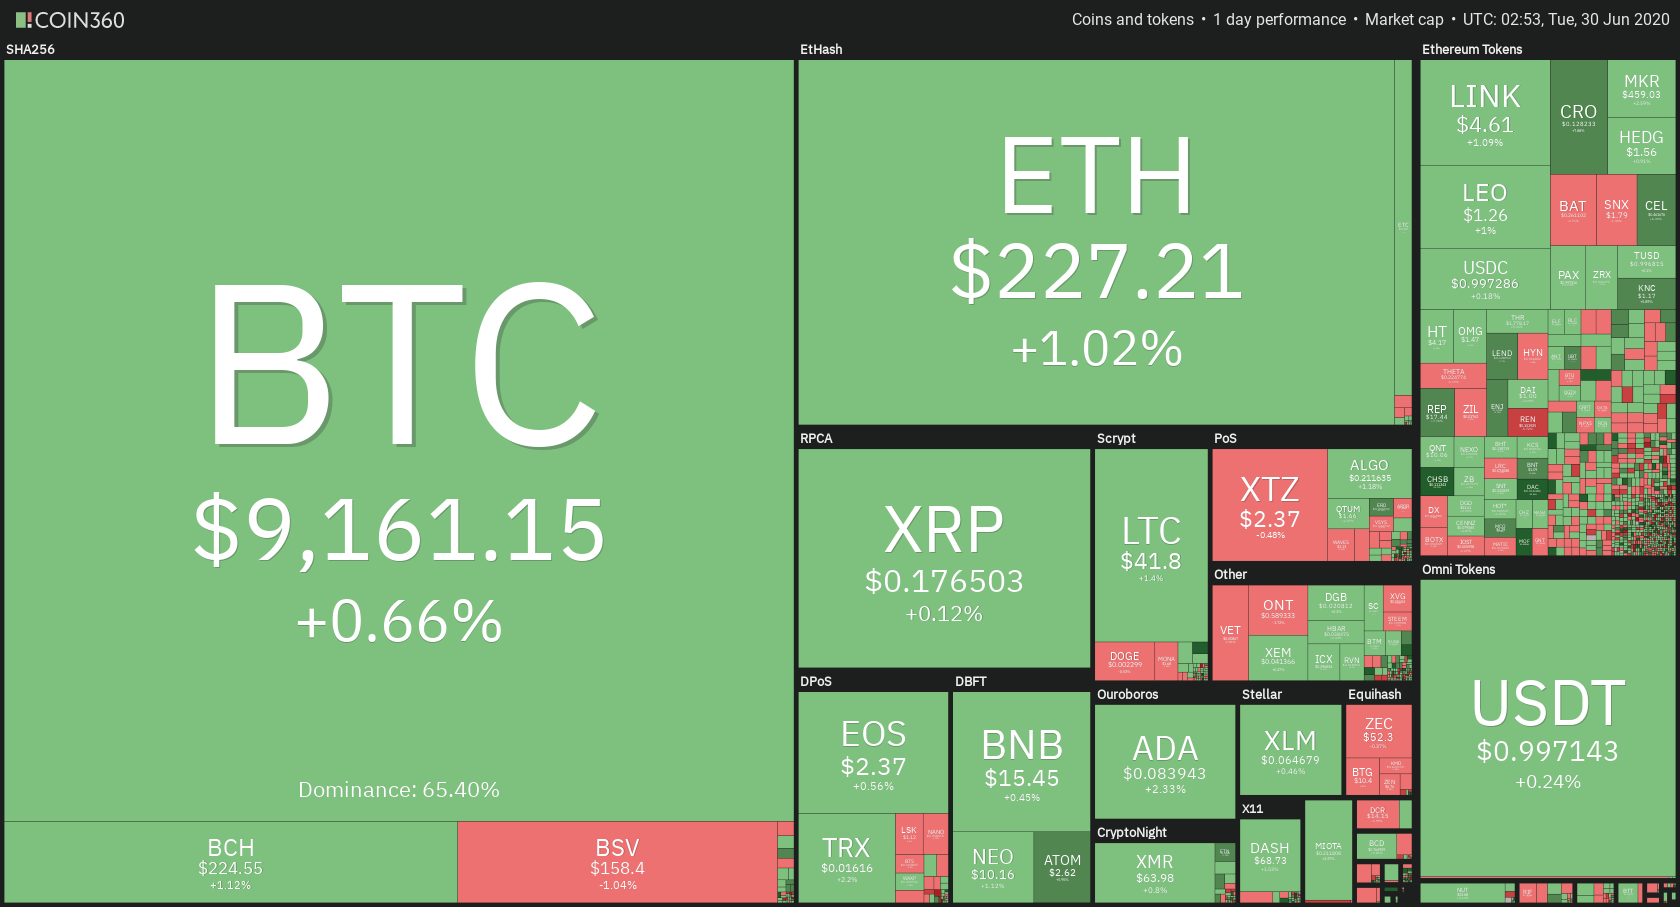
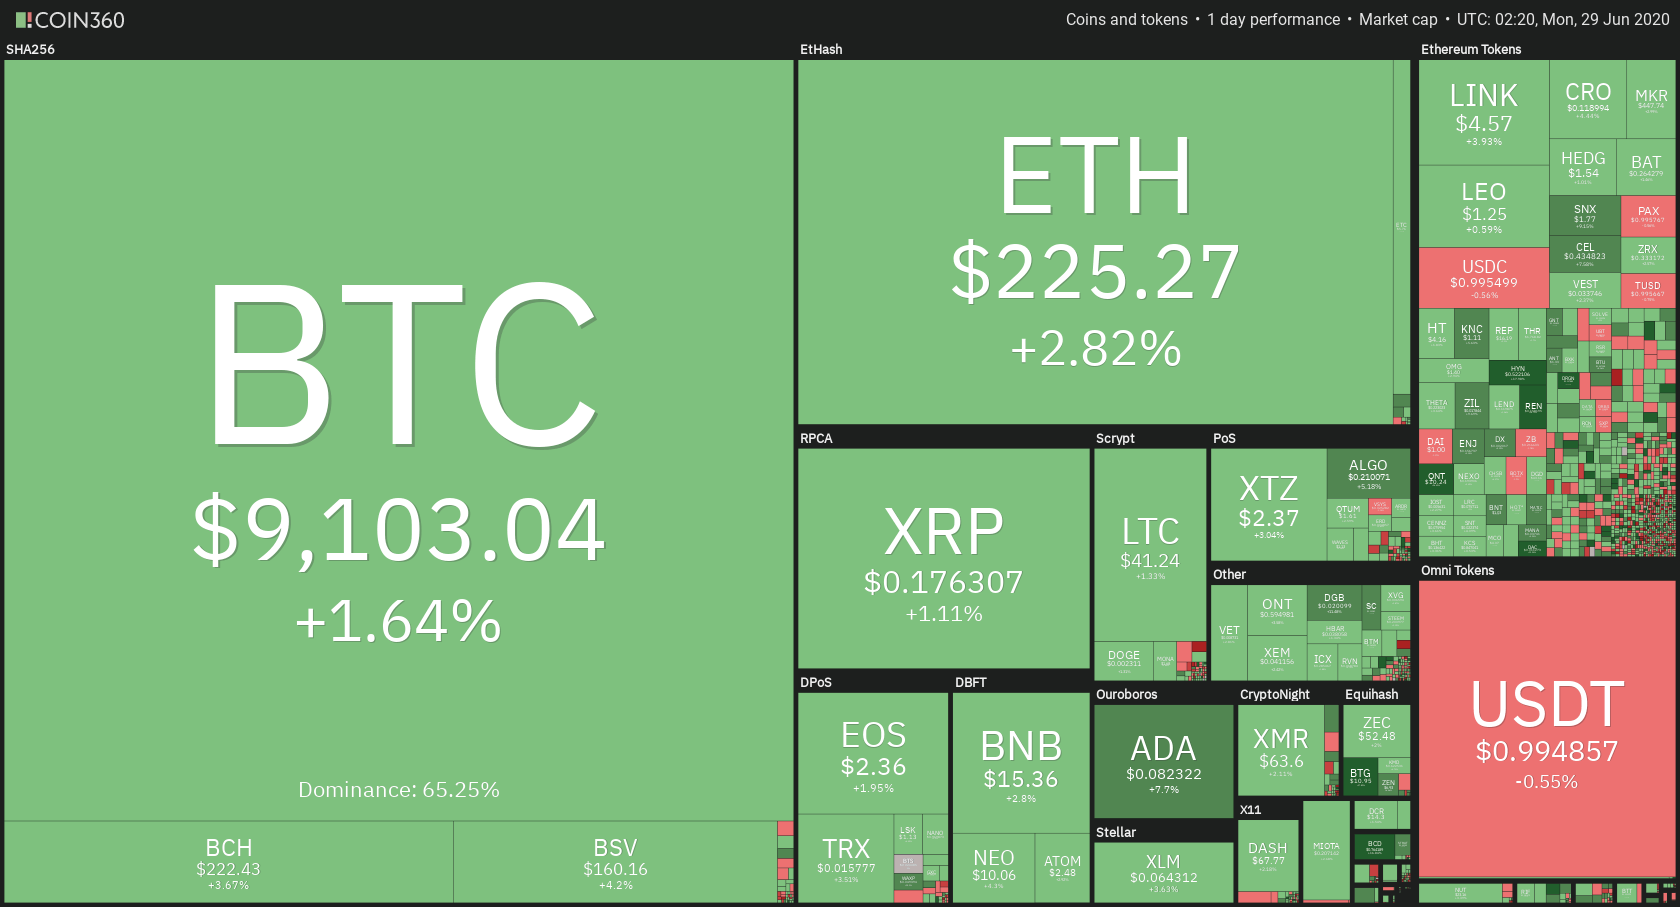
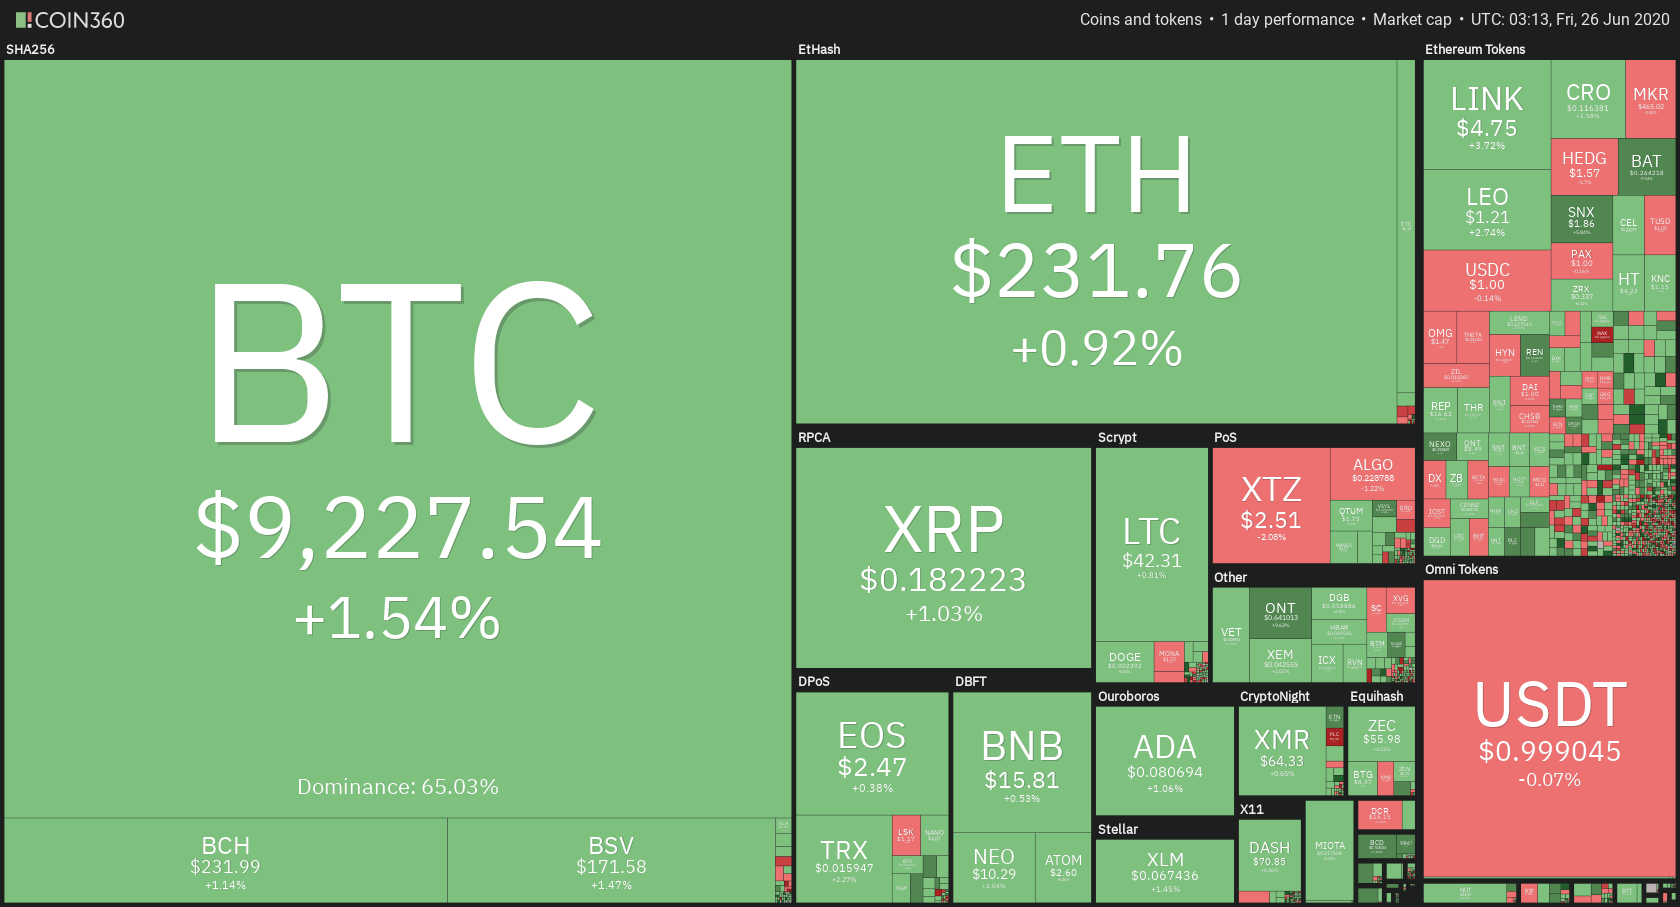
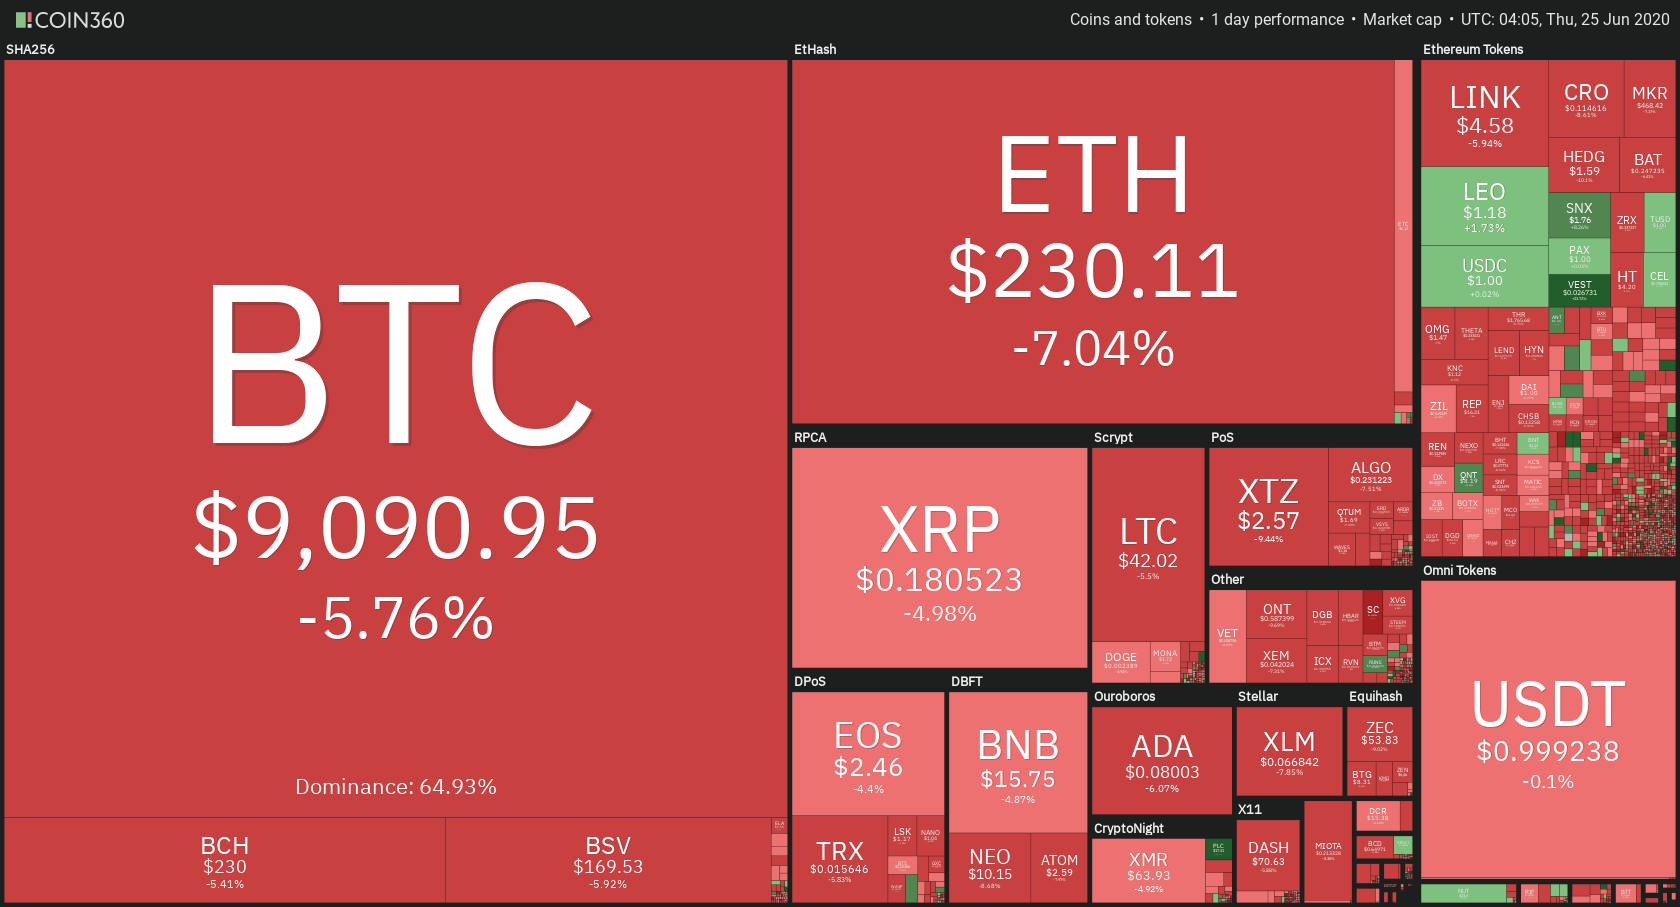
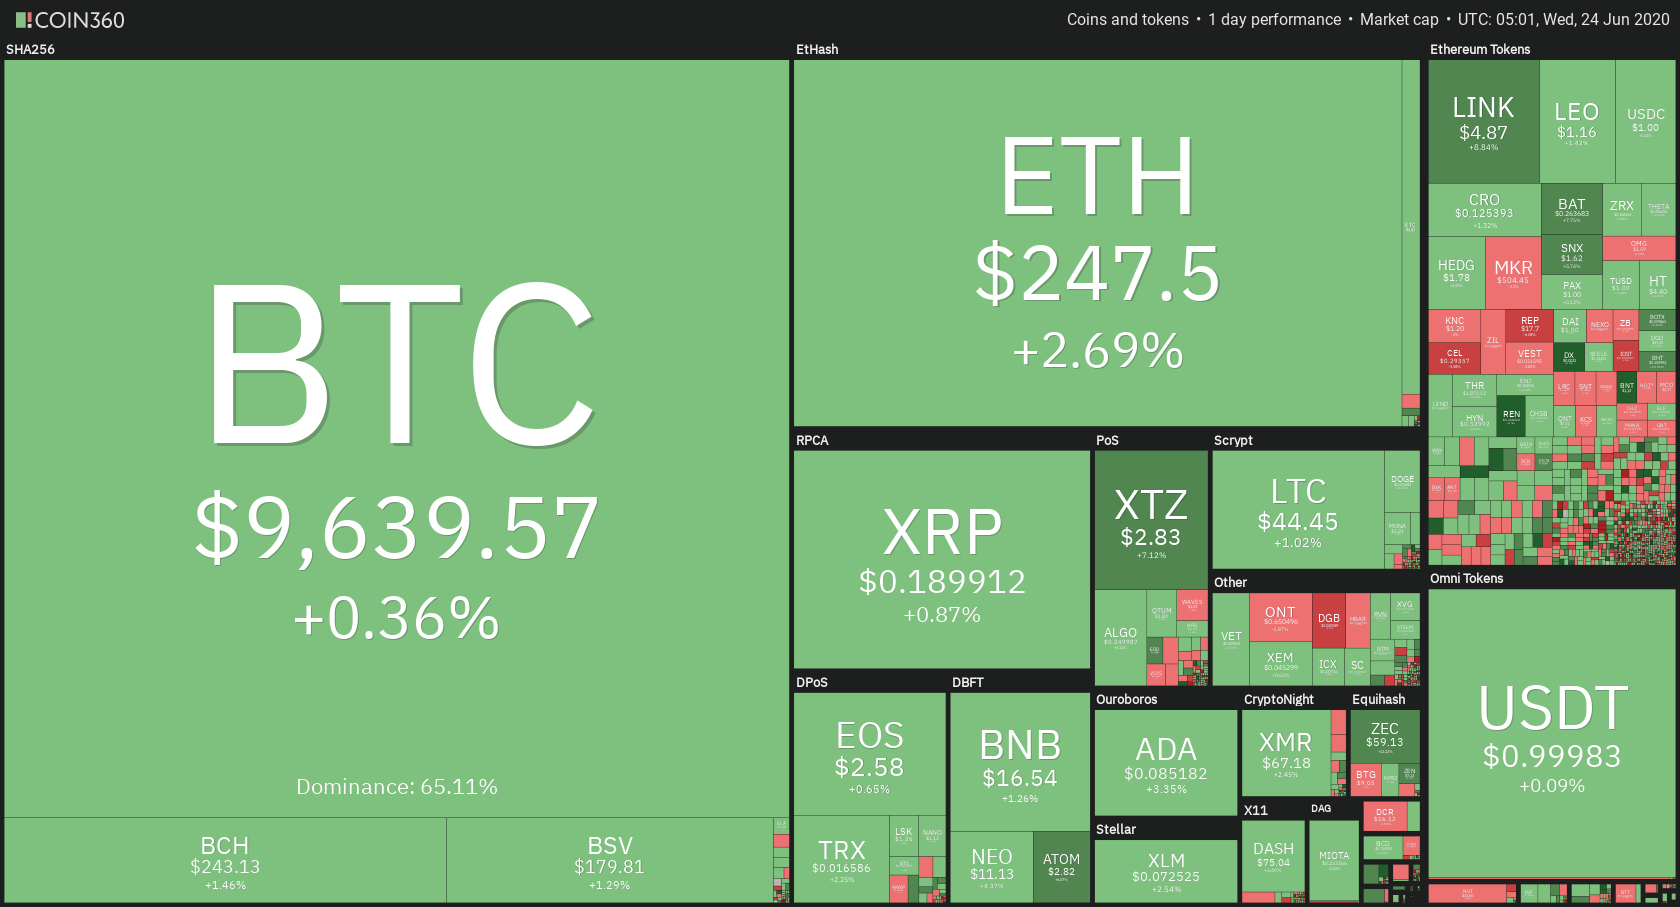
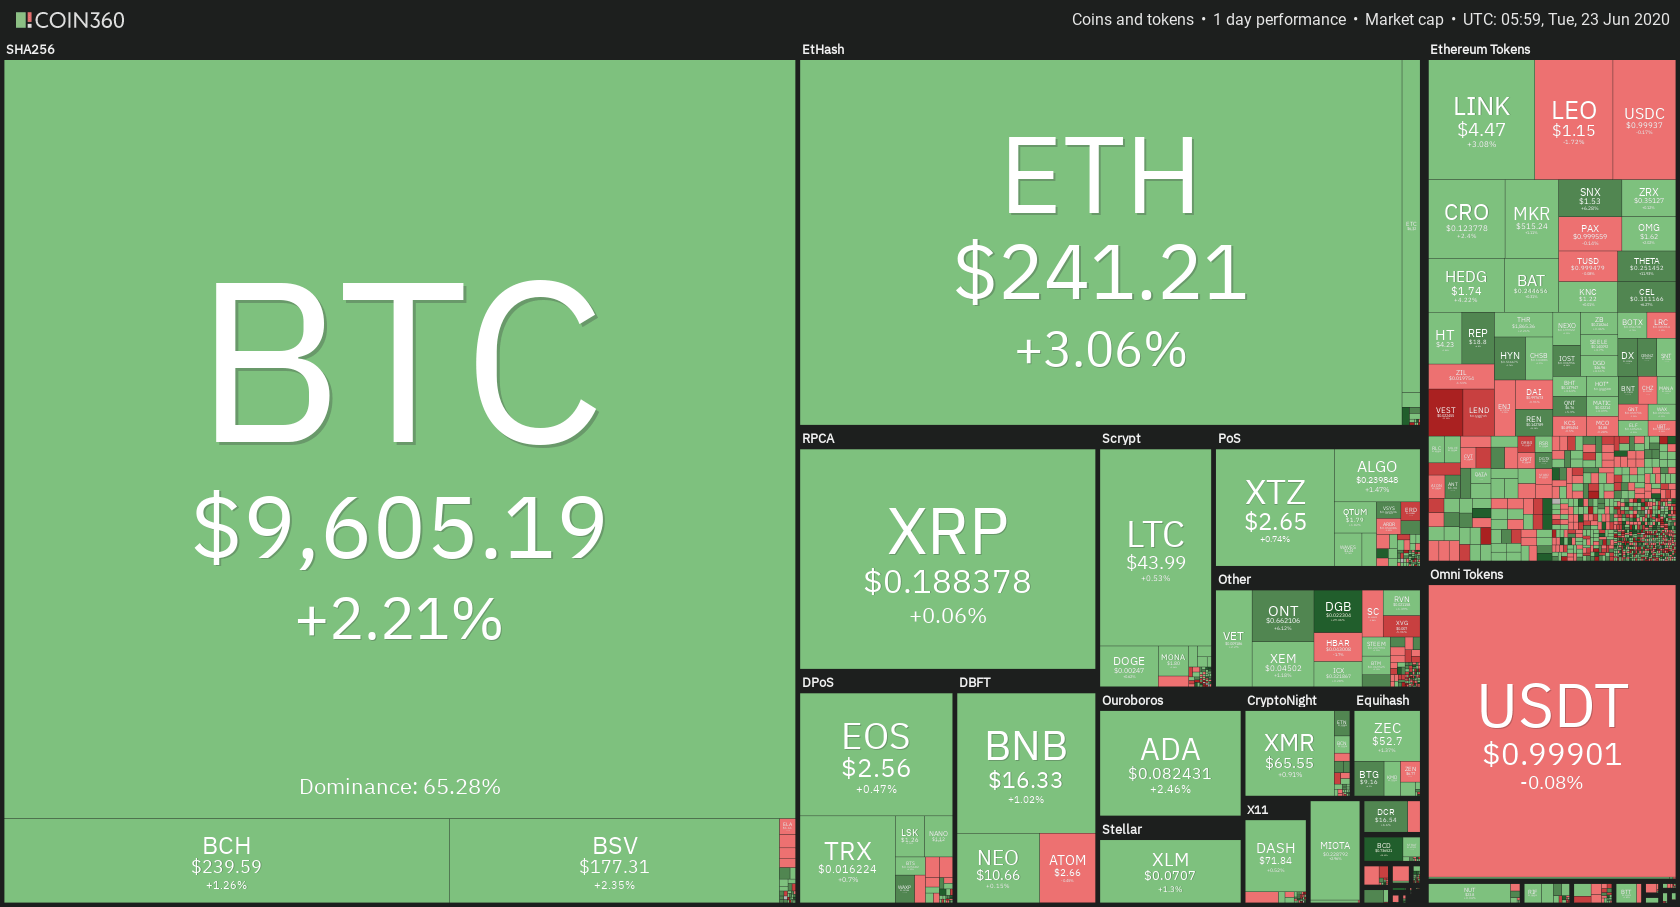
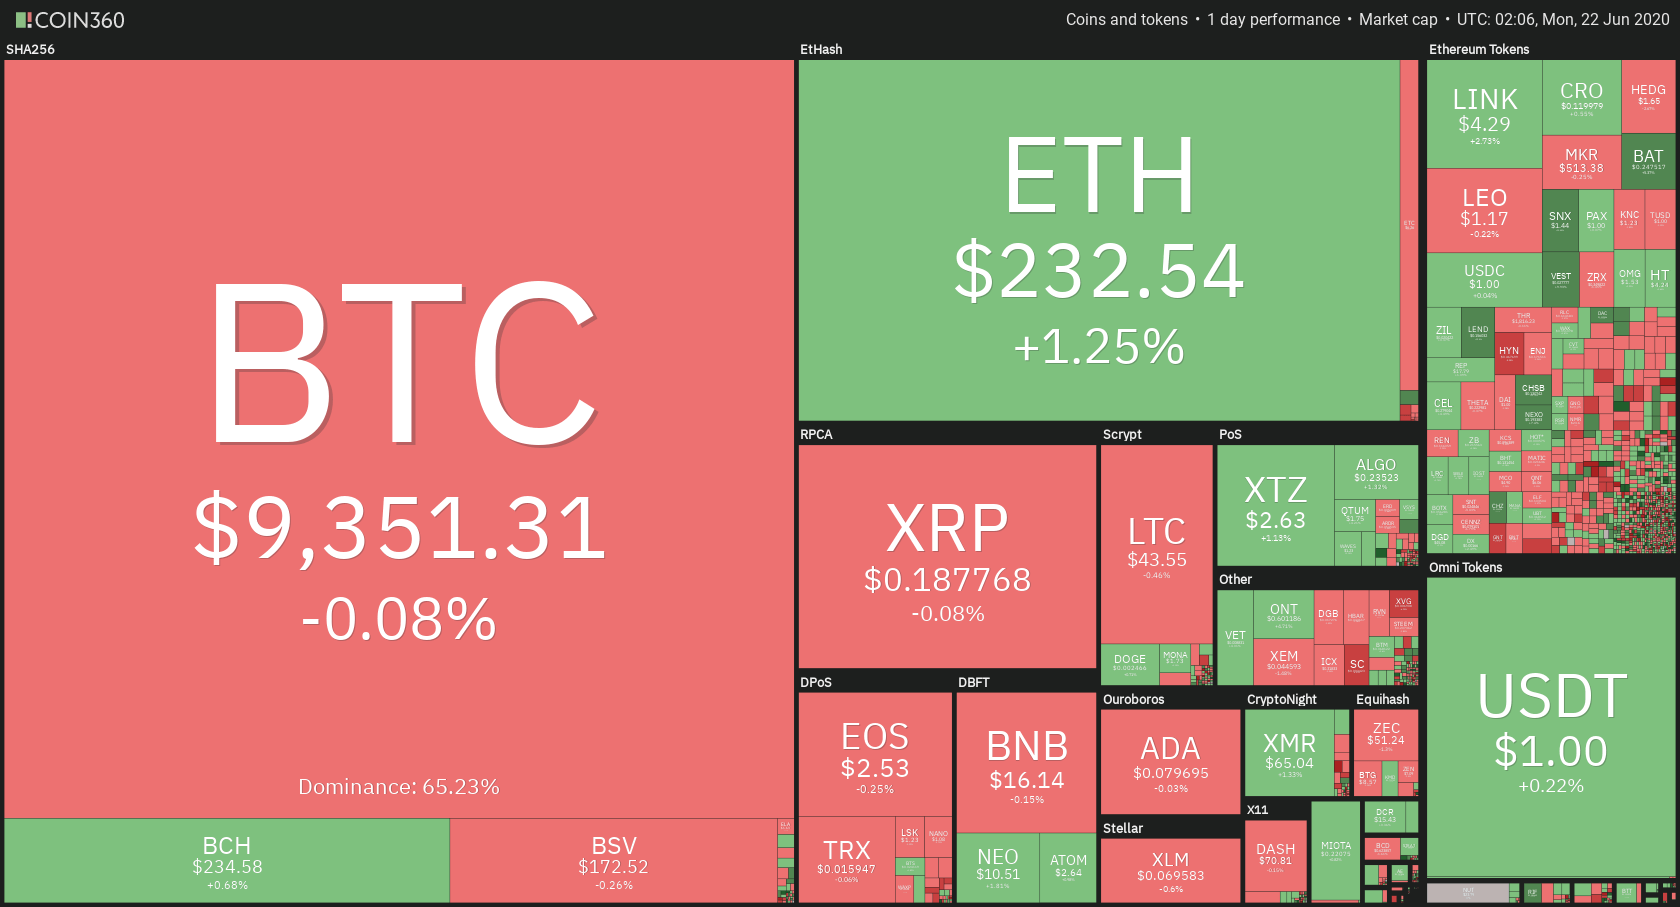
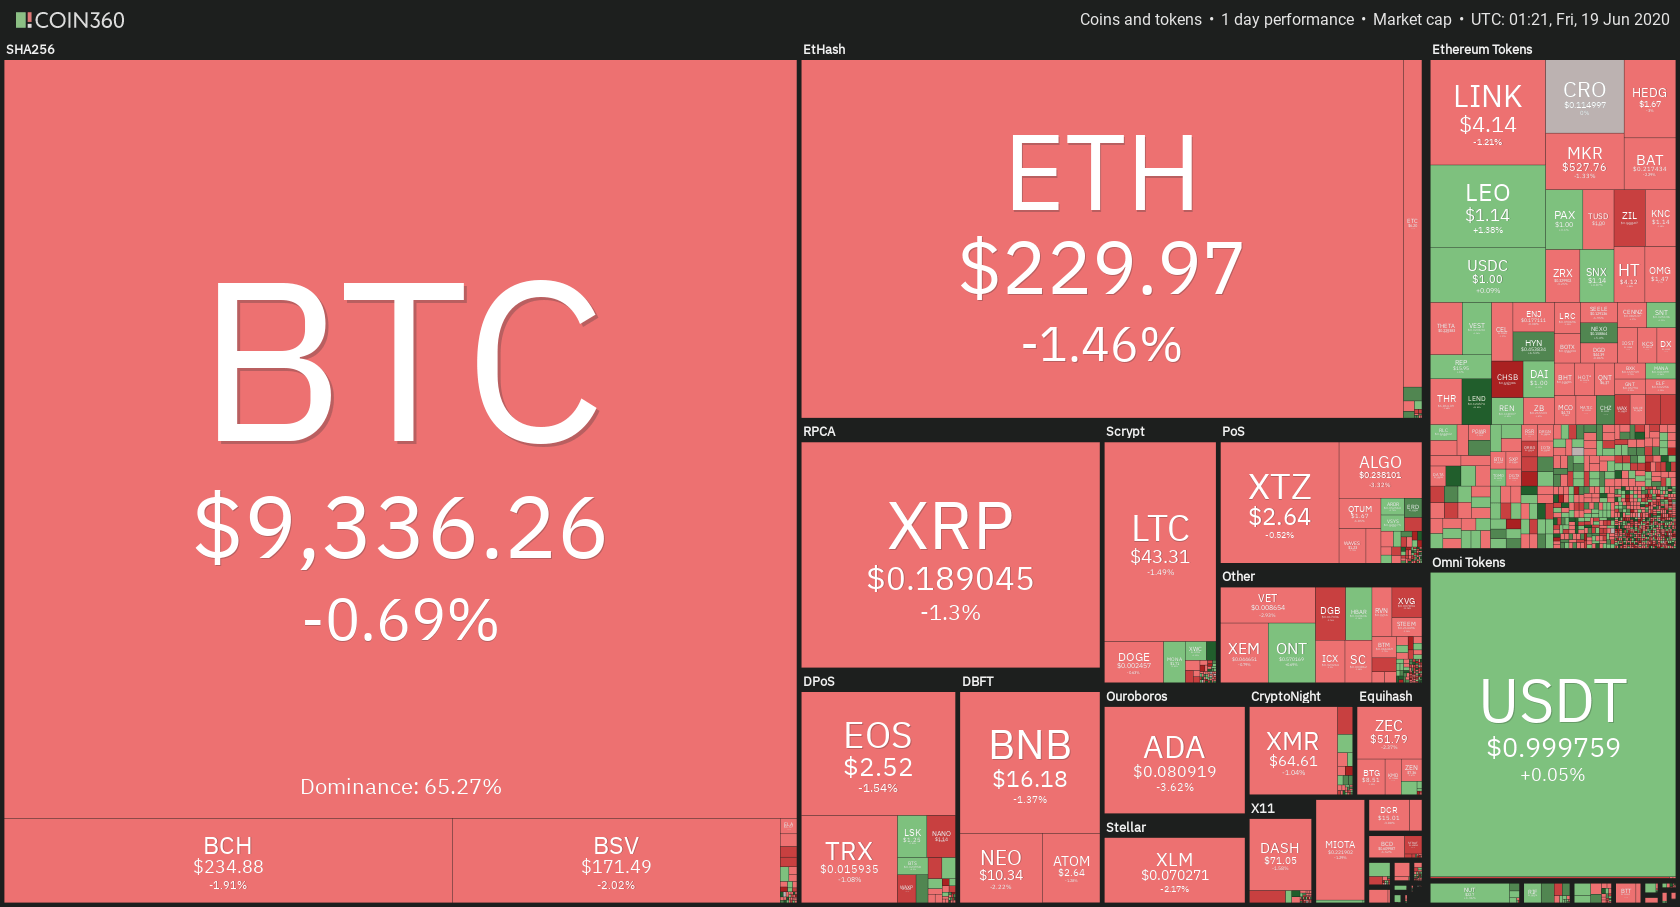
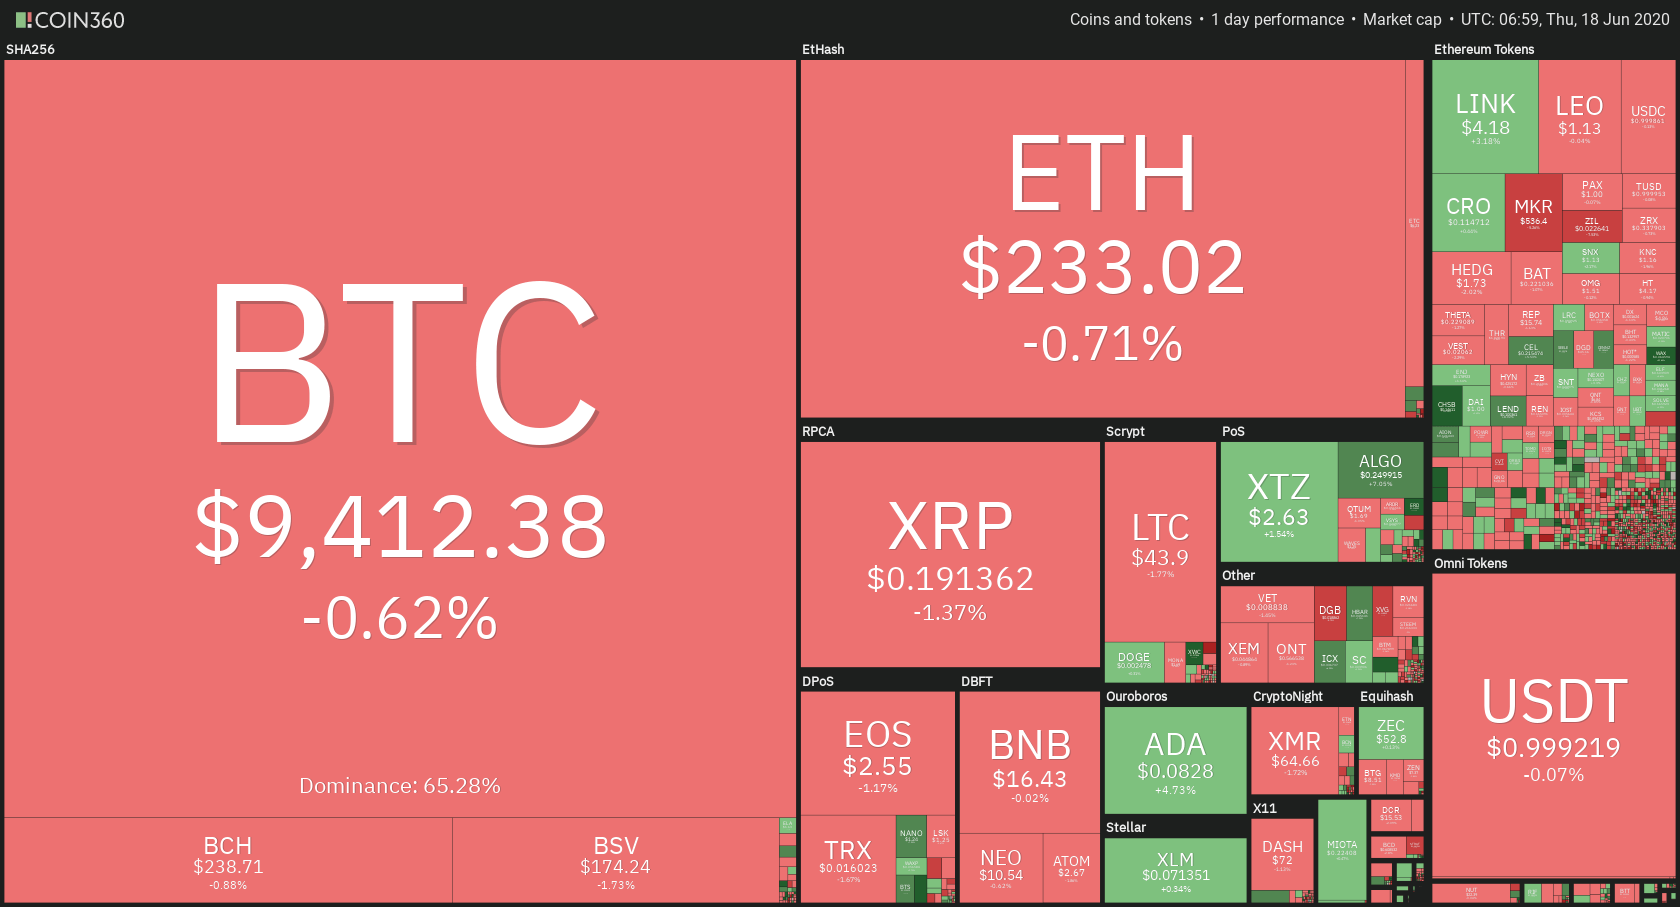
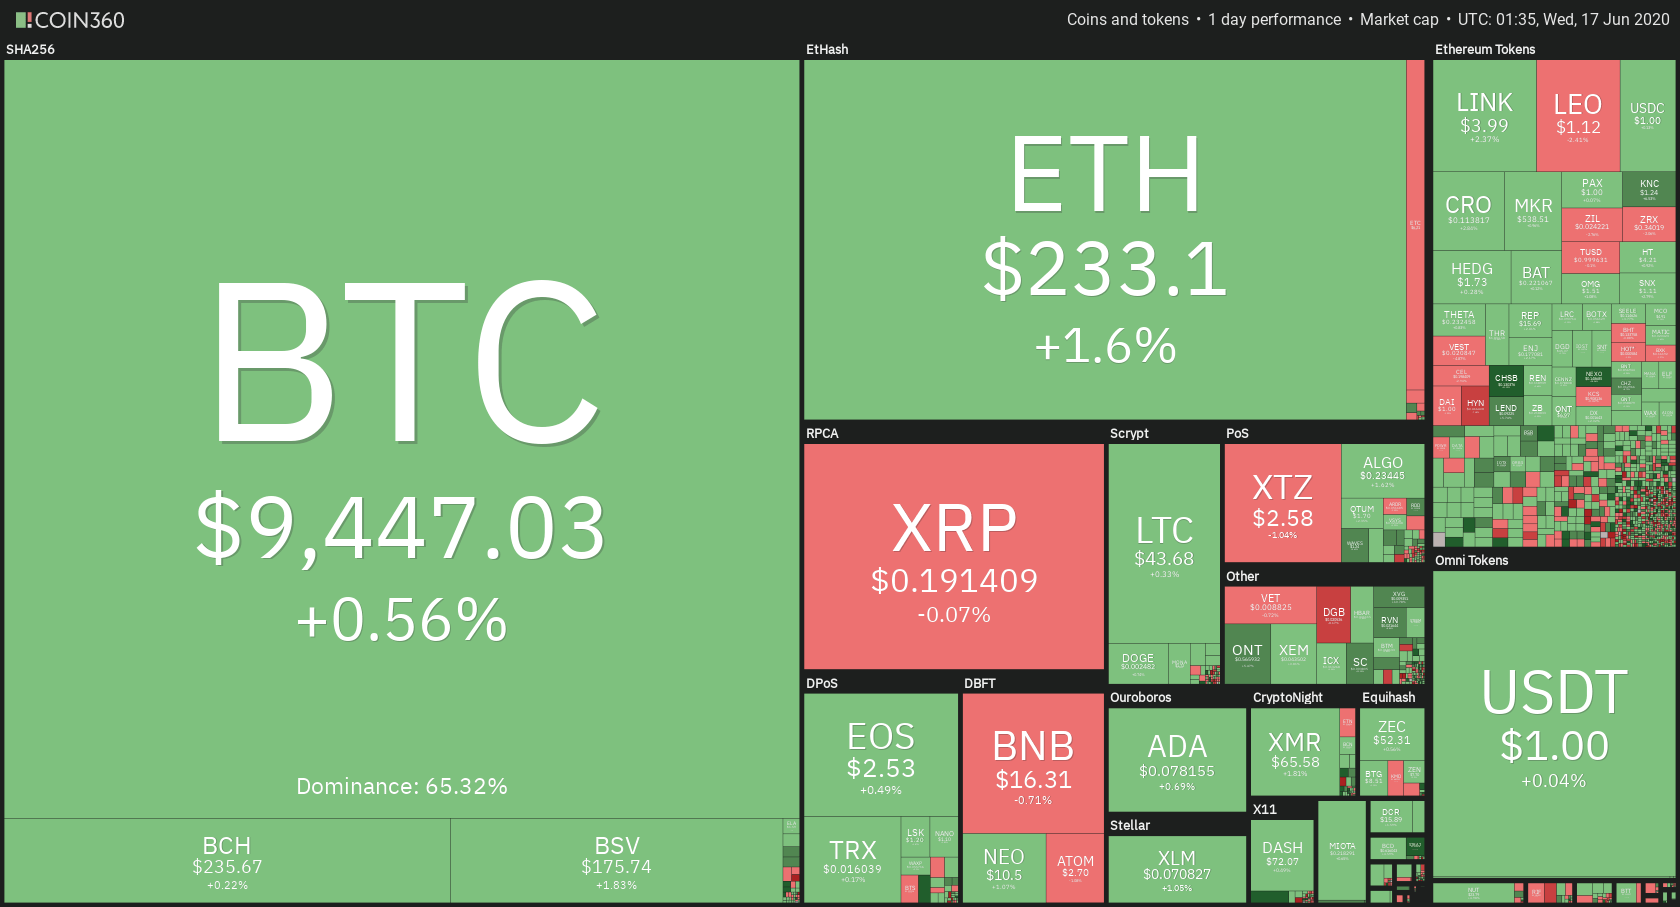
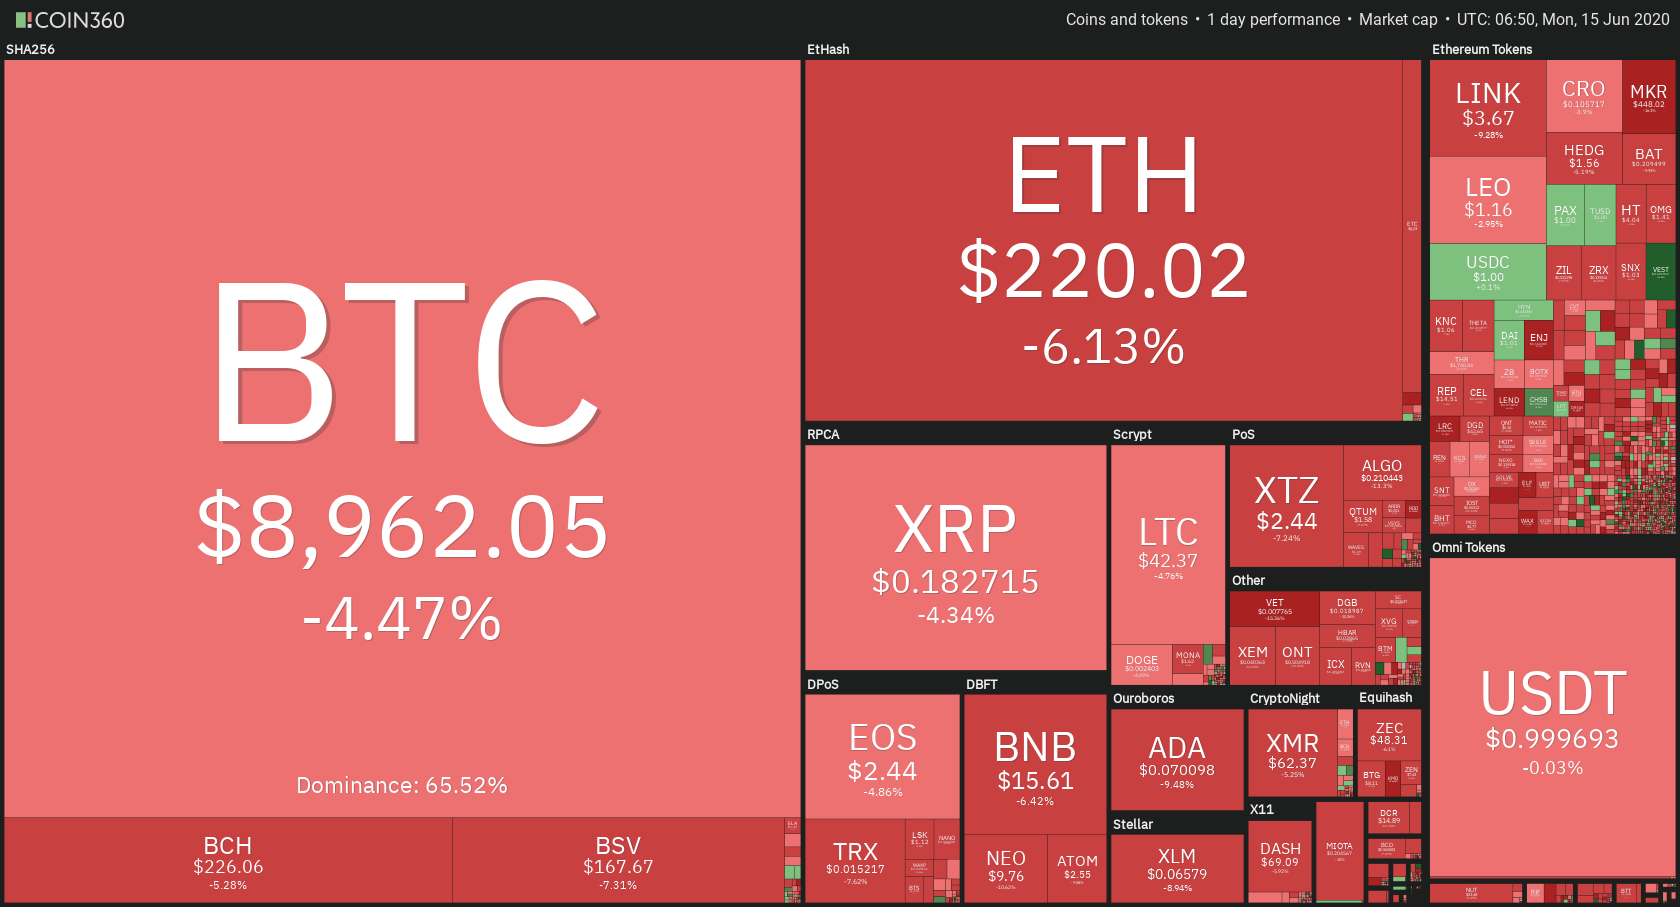
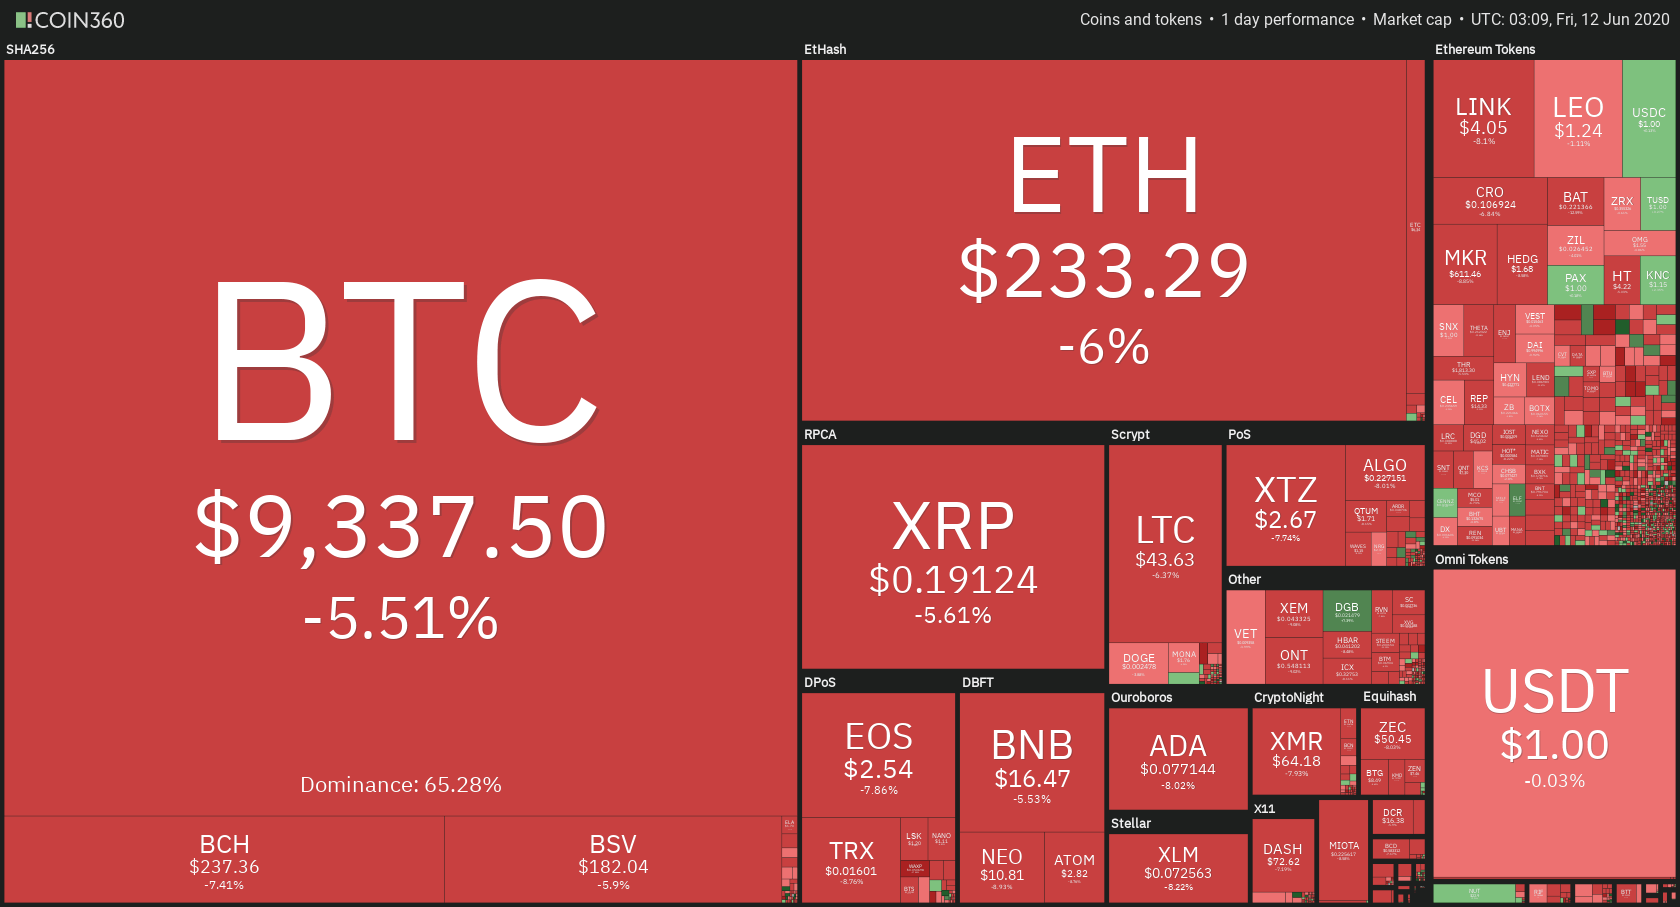
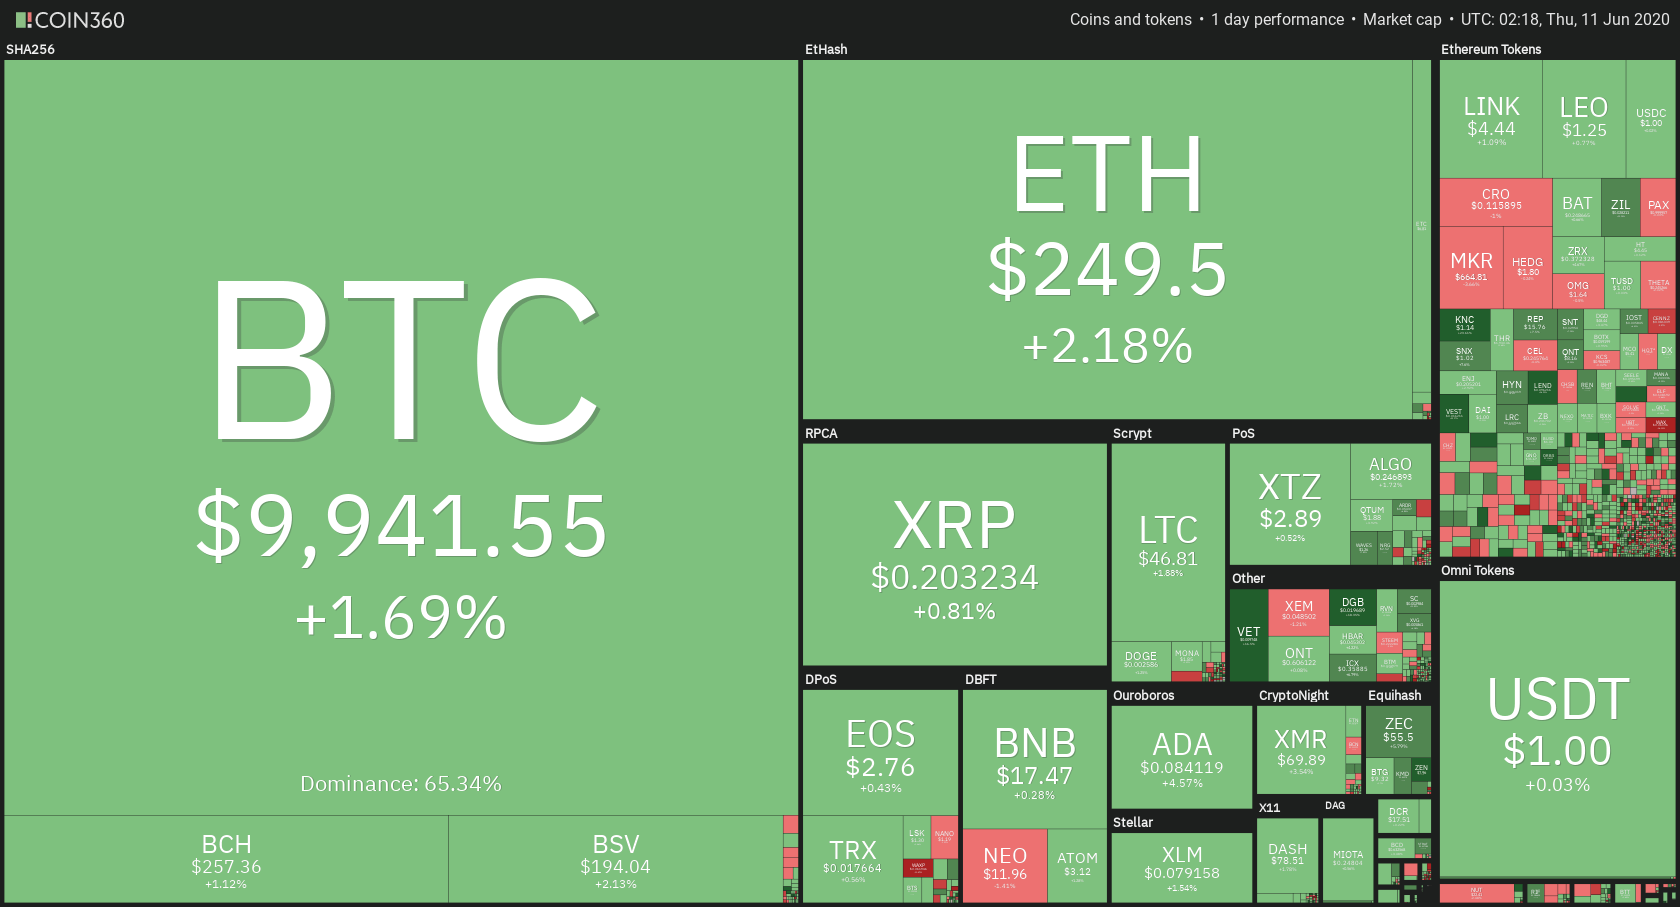
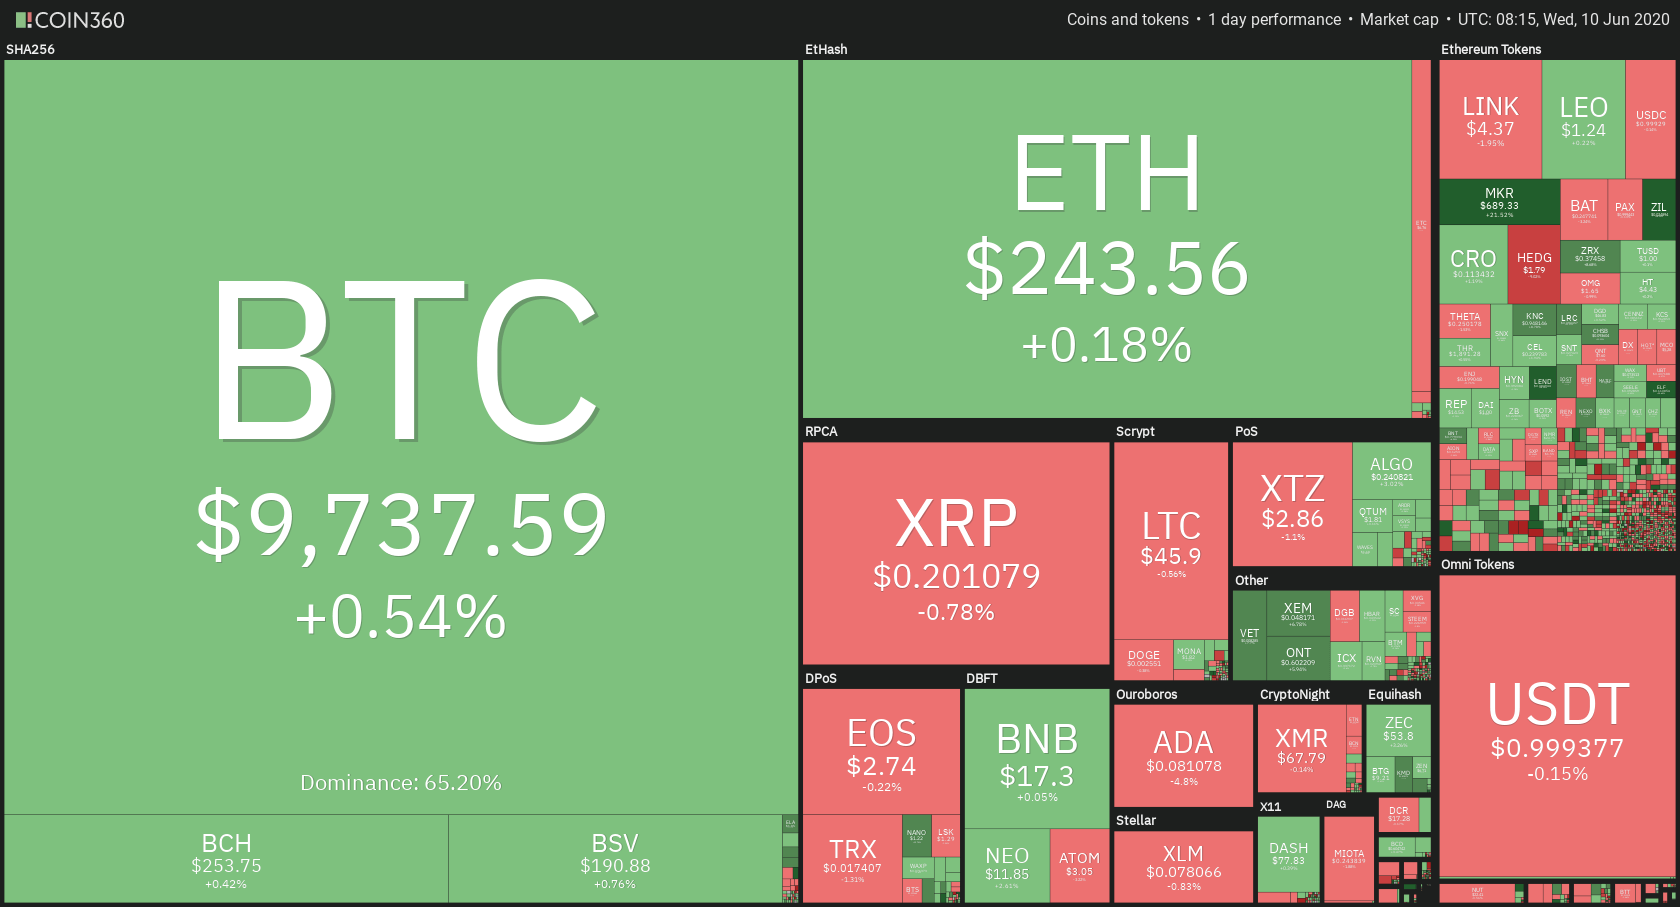
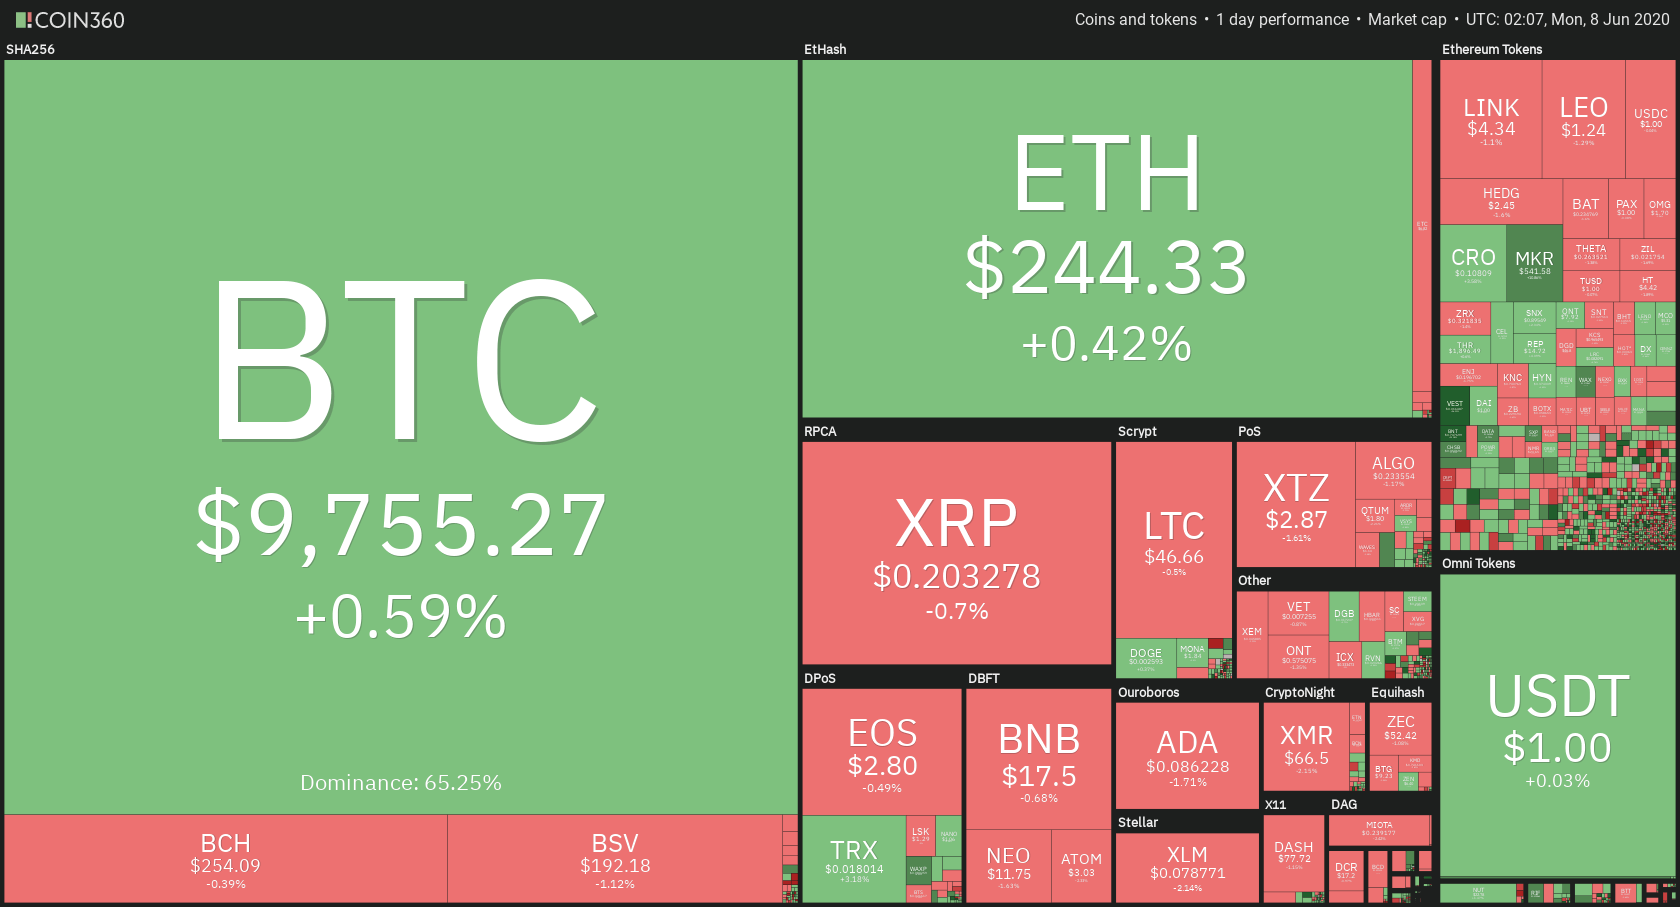
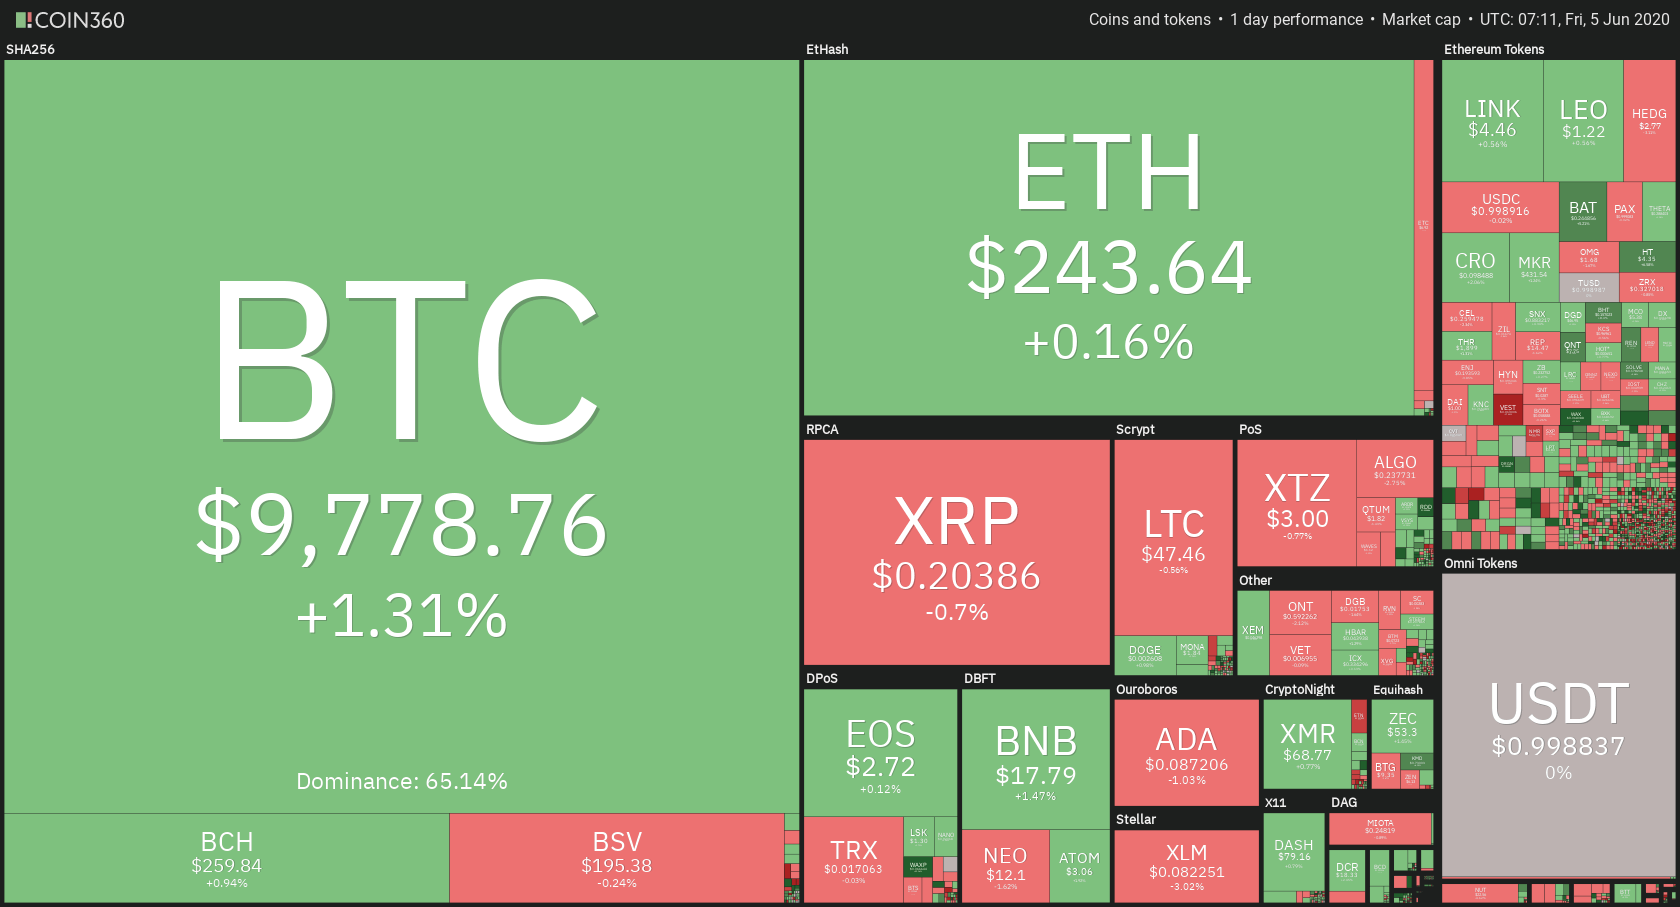
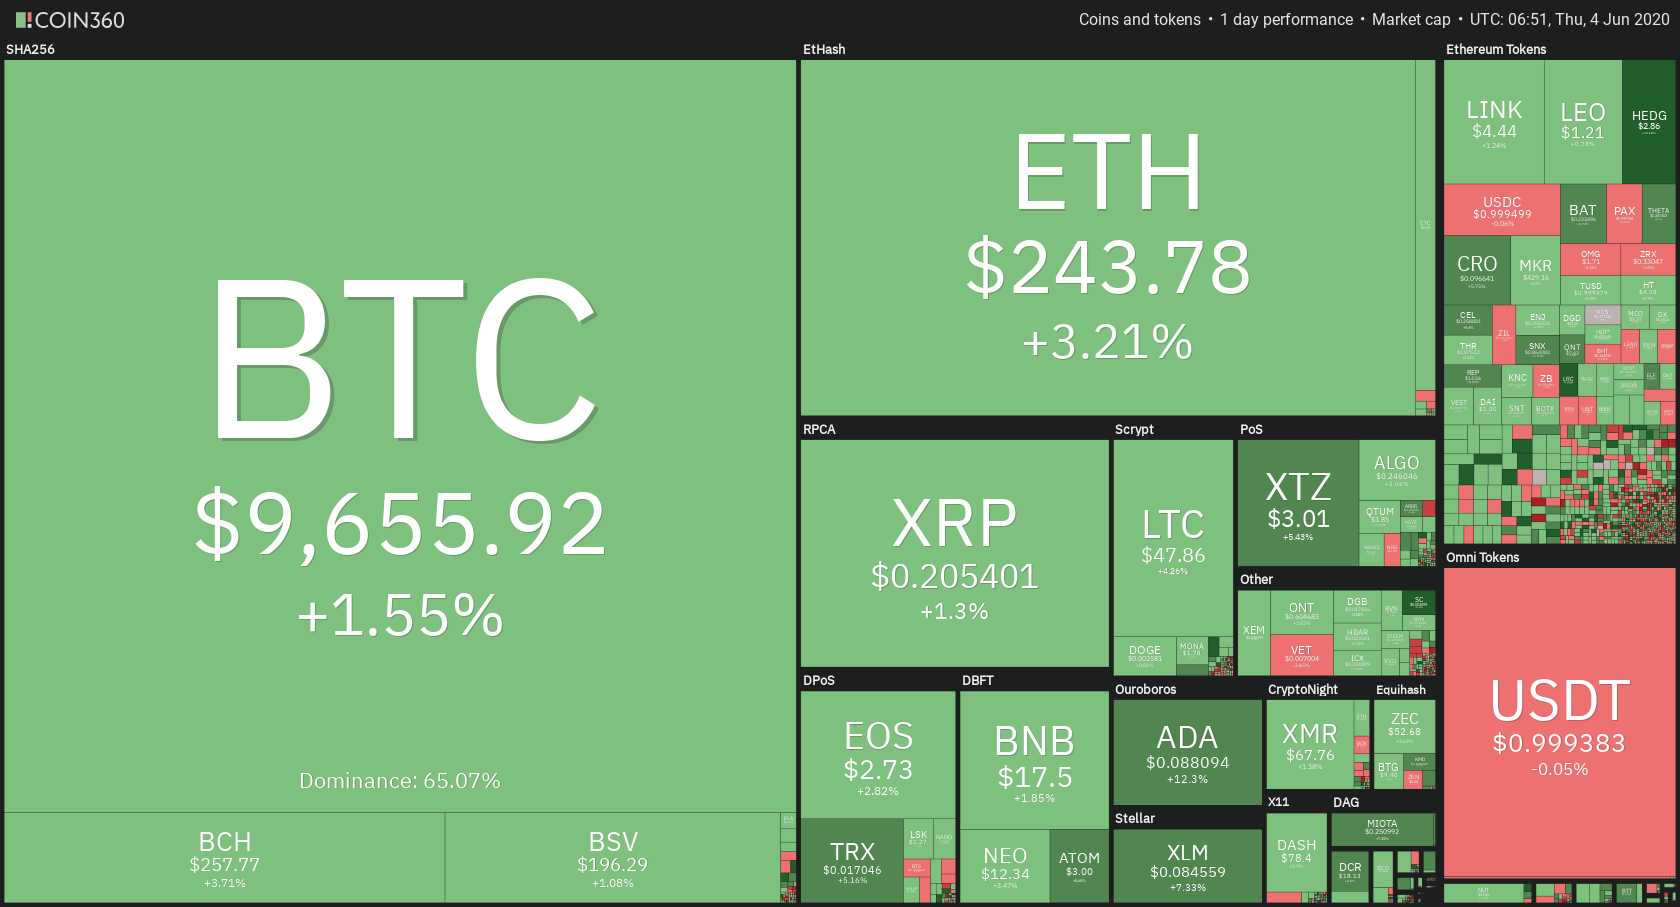
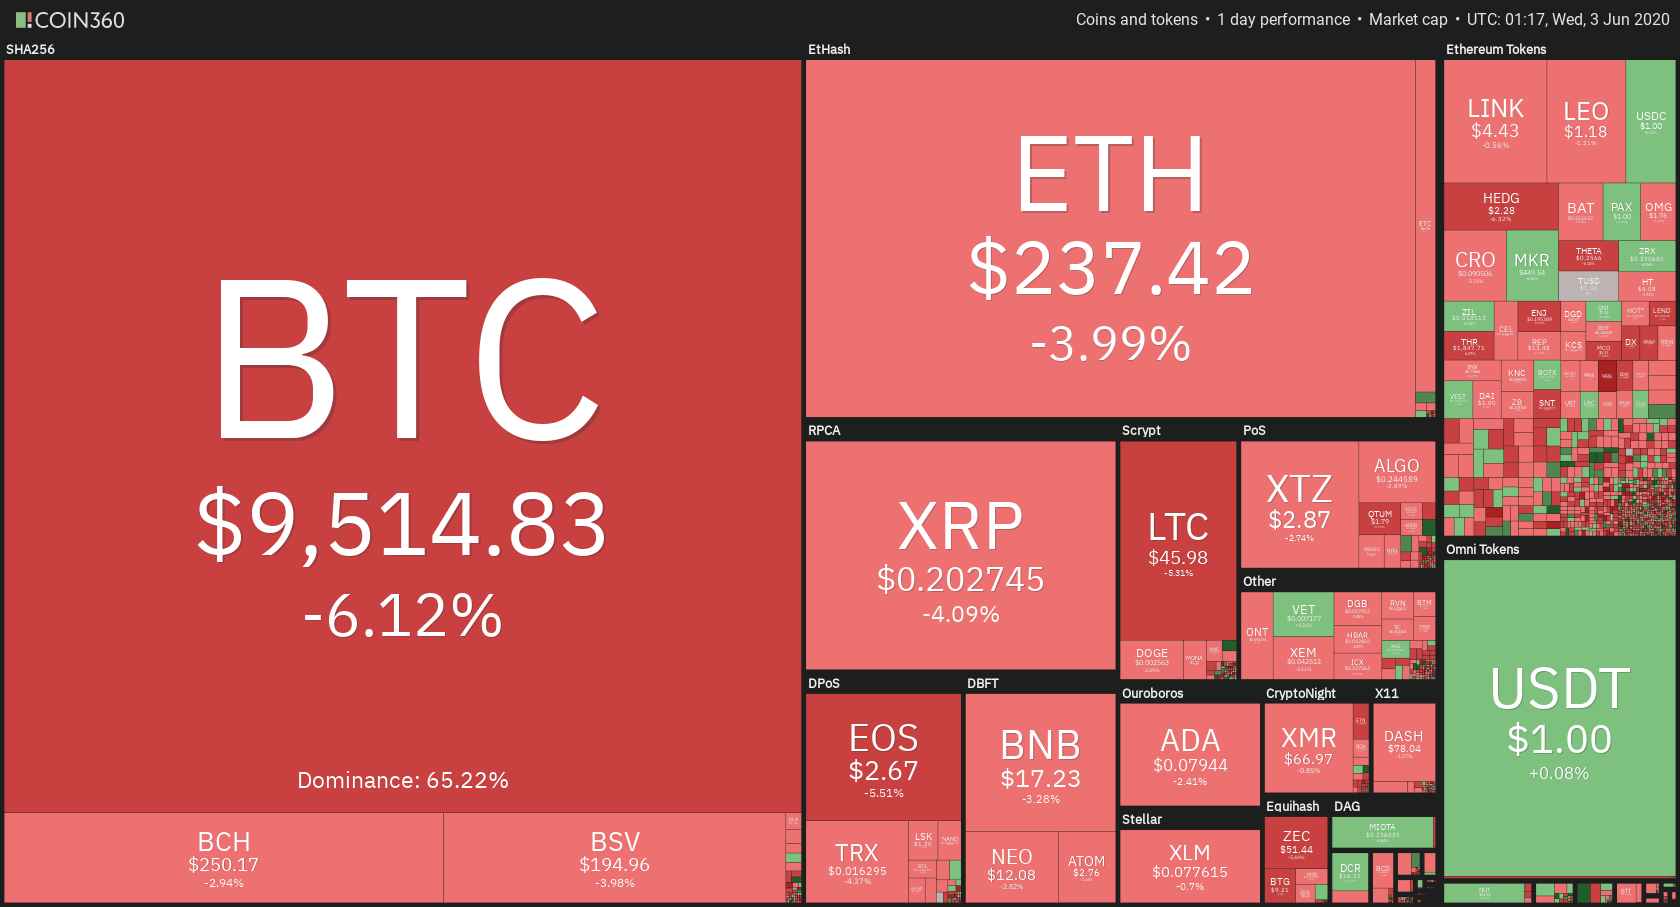
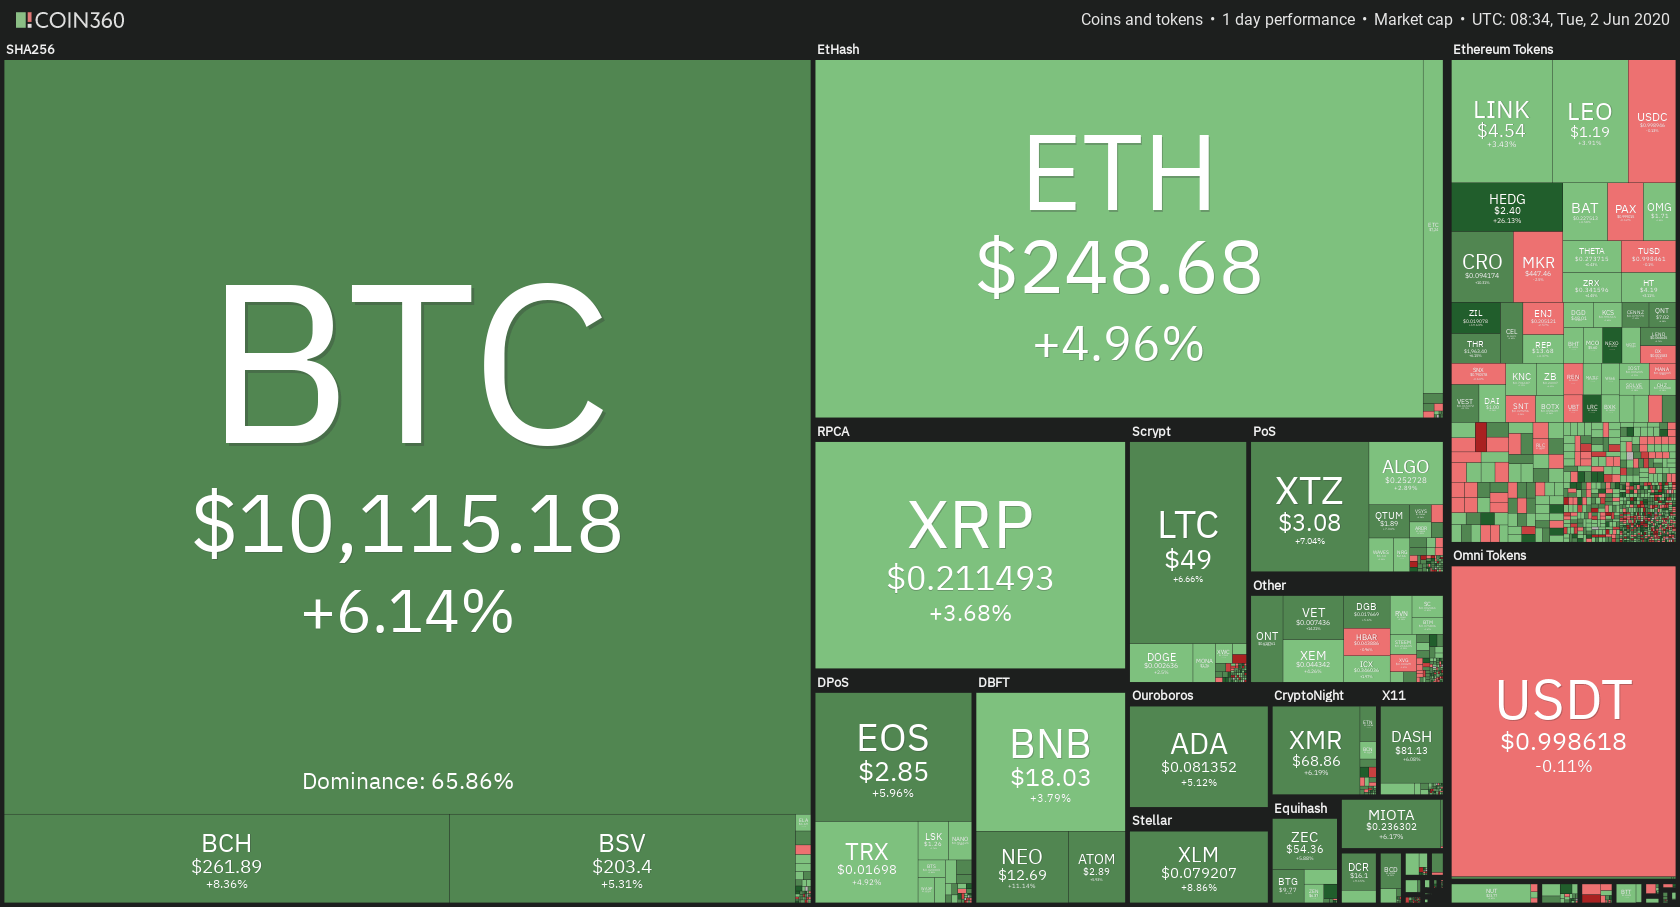
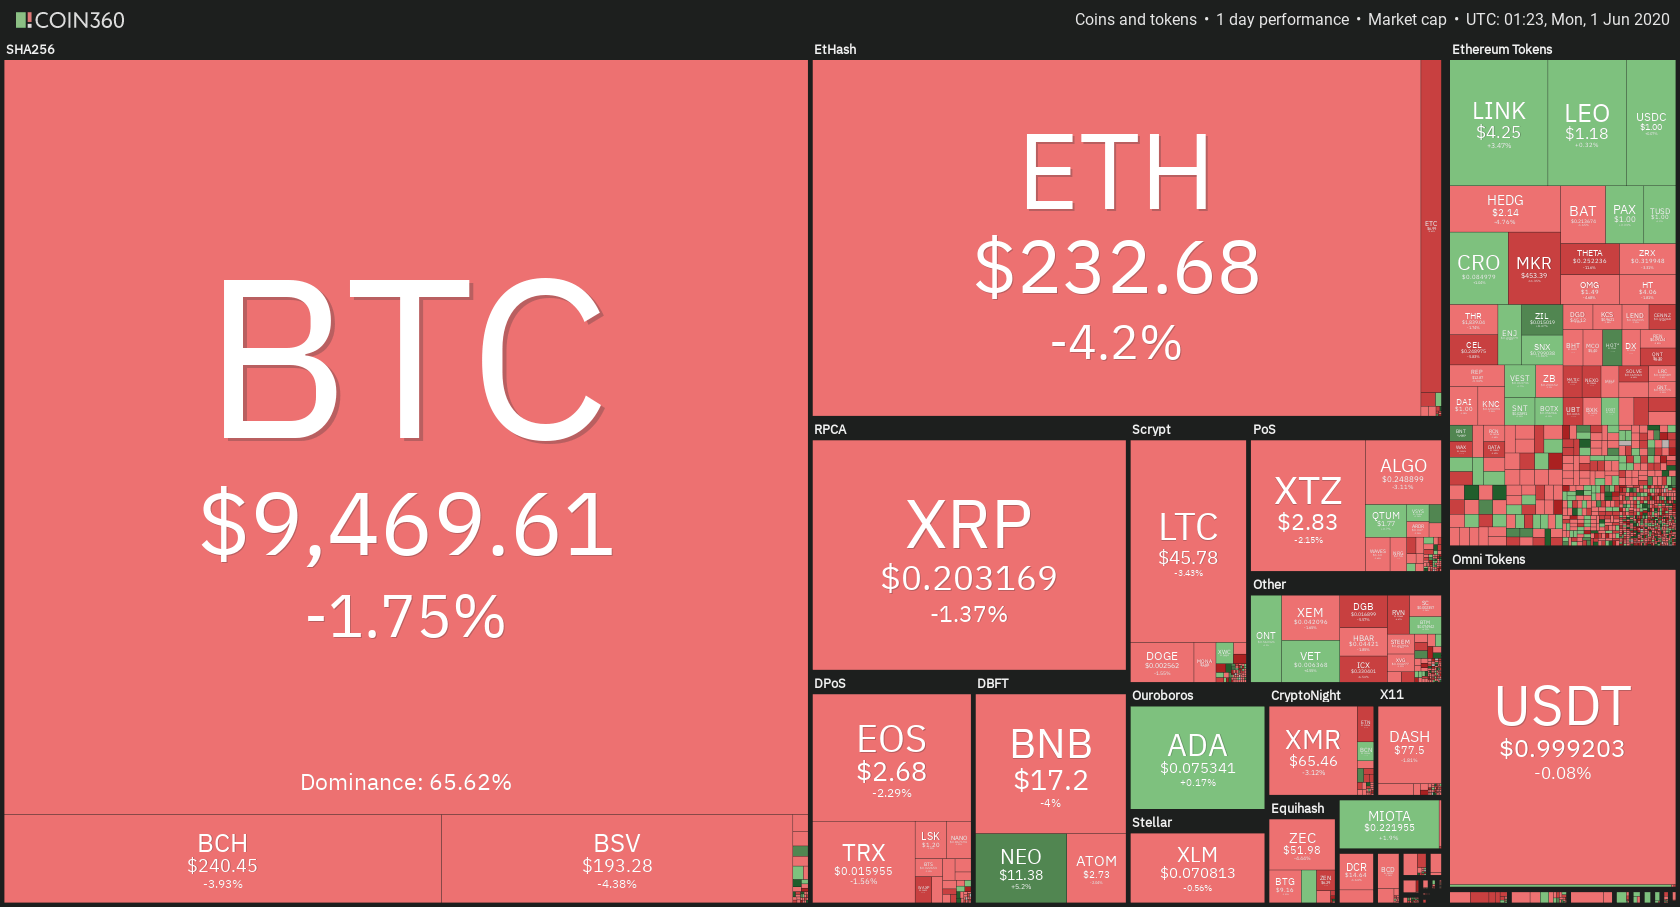
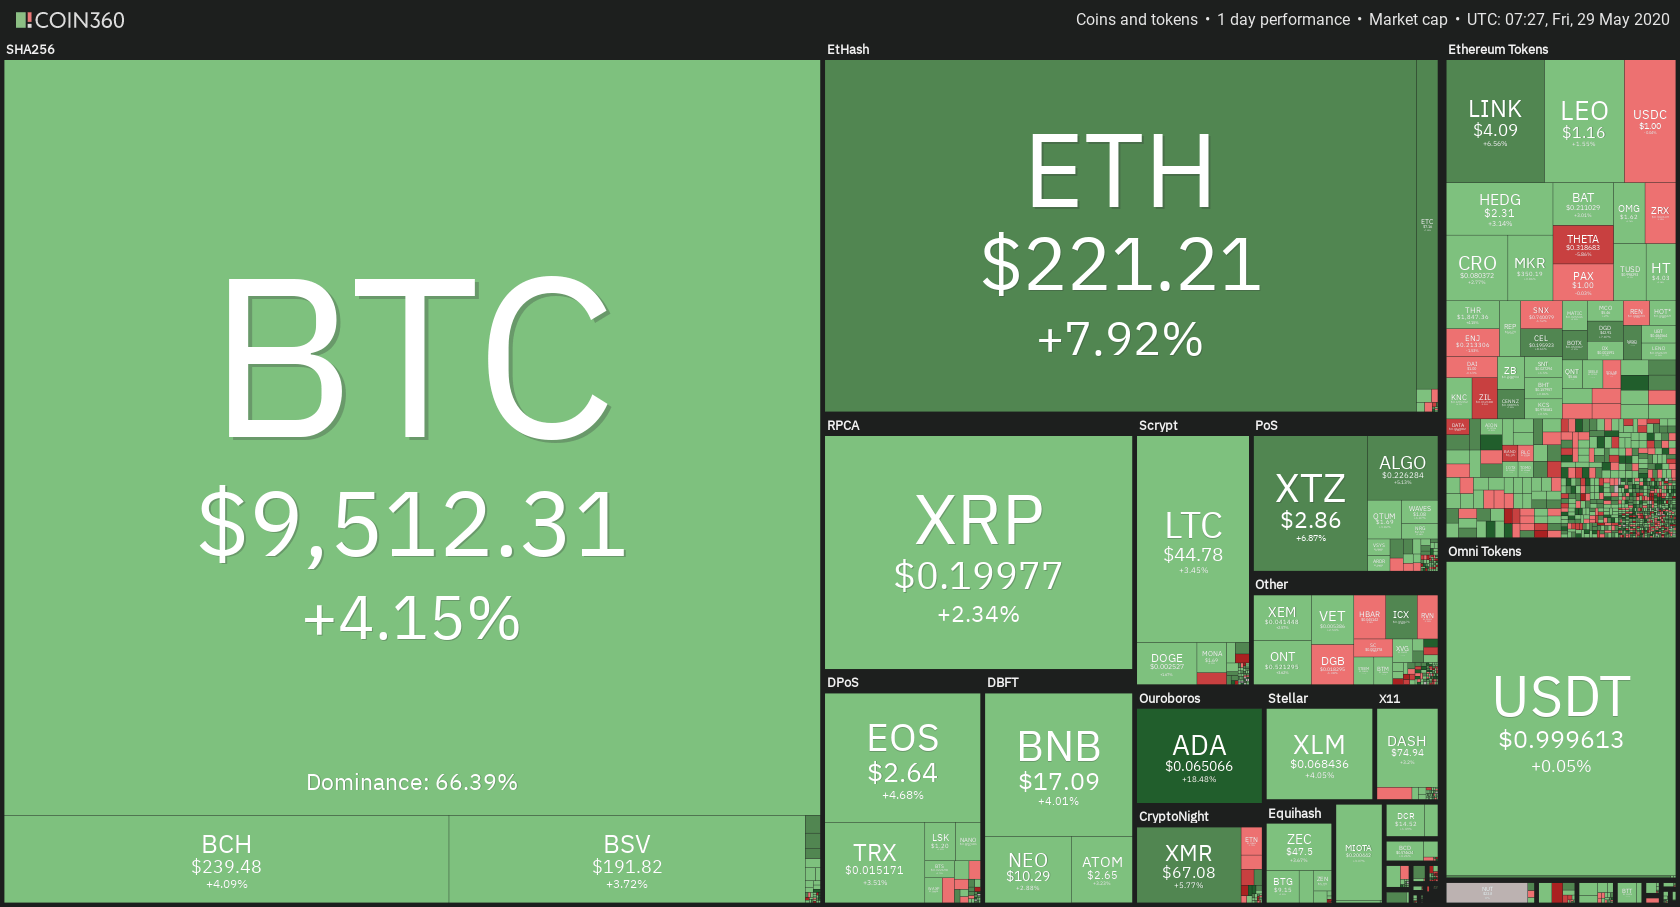
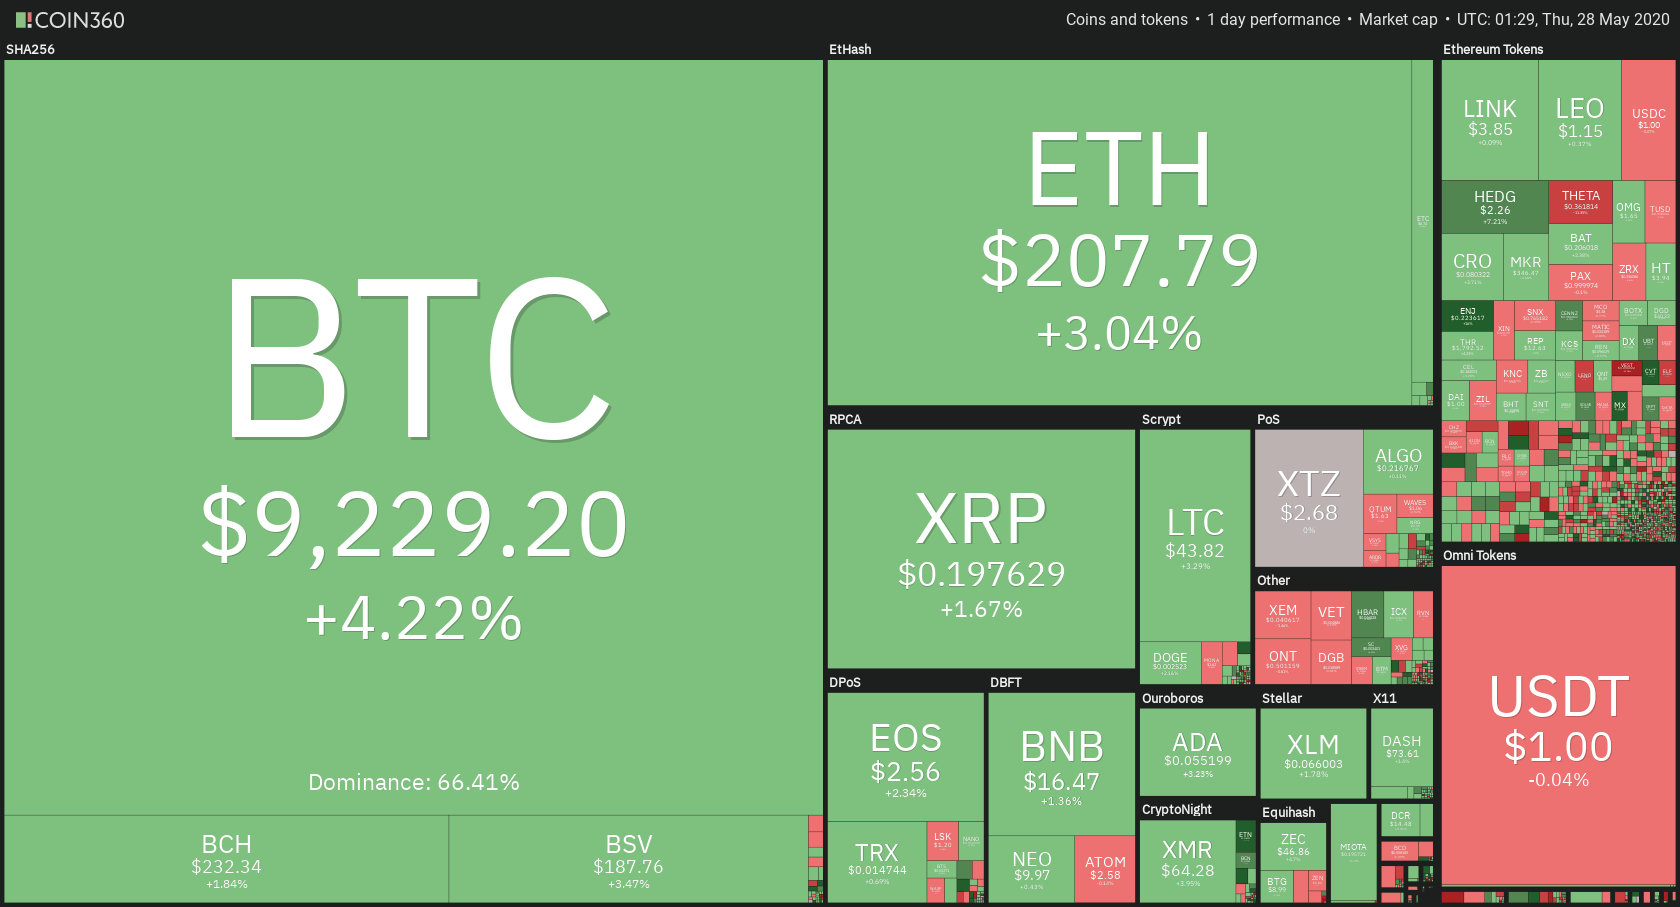
Daily Crypto Sector Heat Map
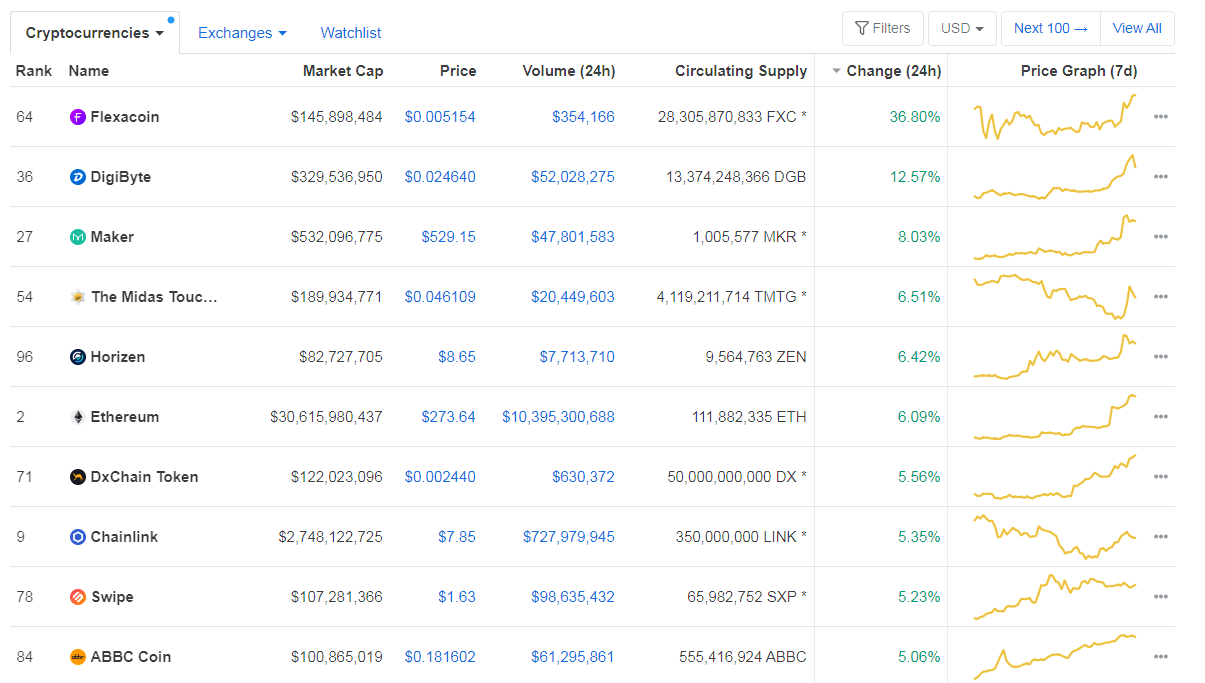
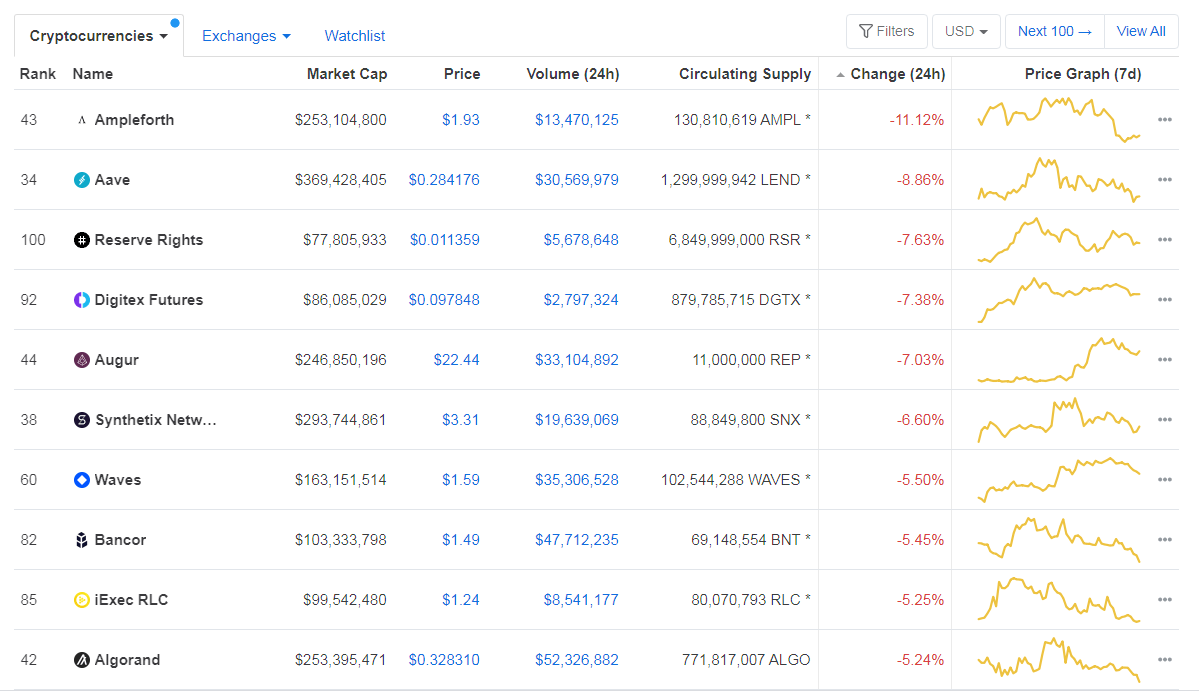
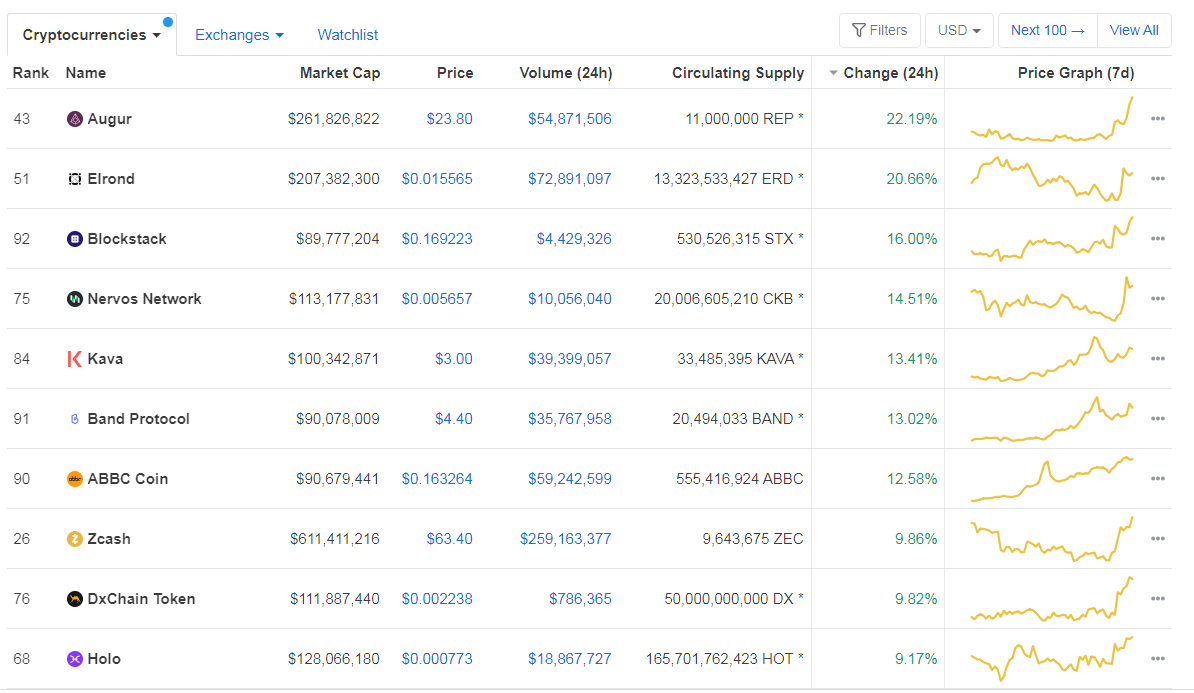
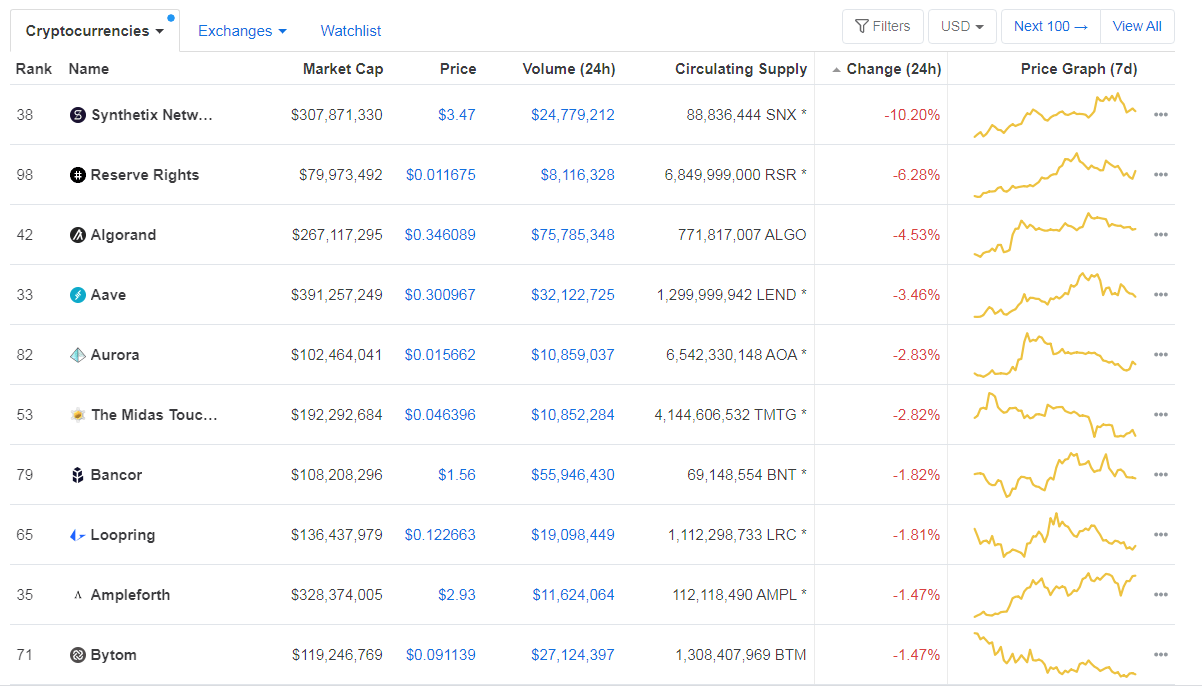
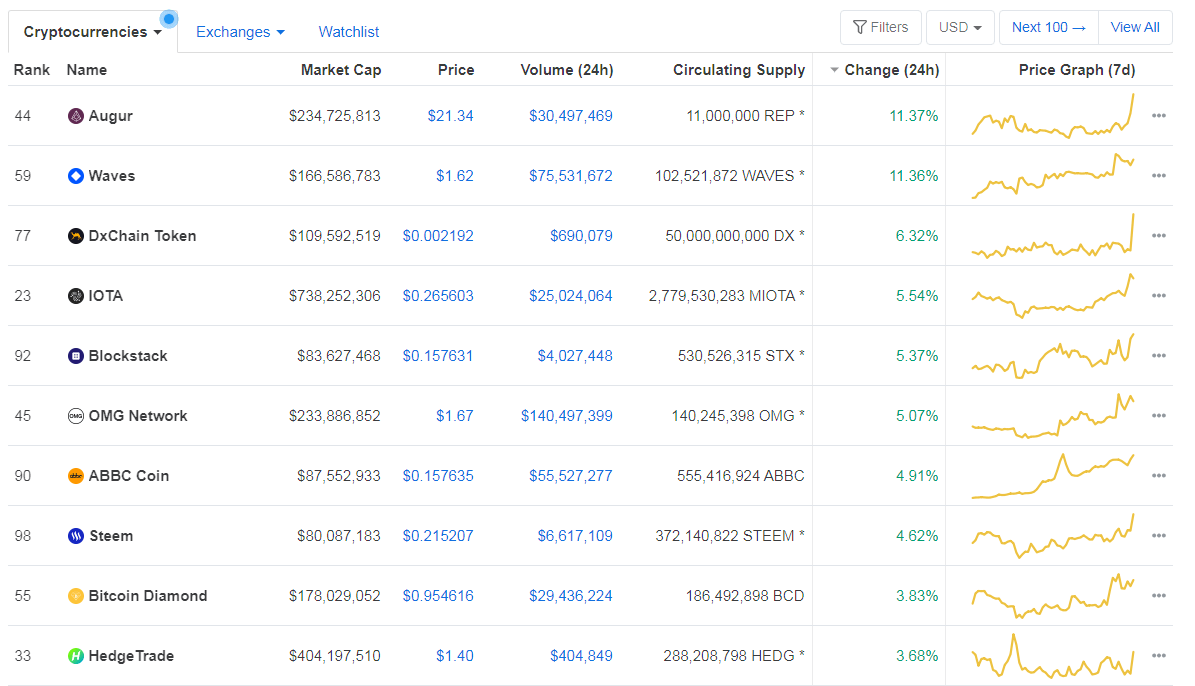
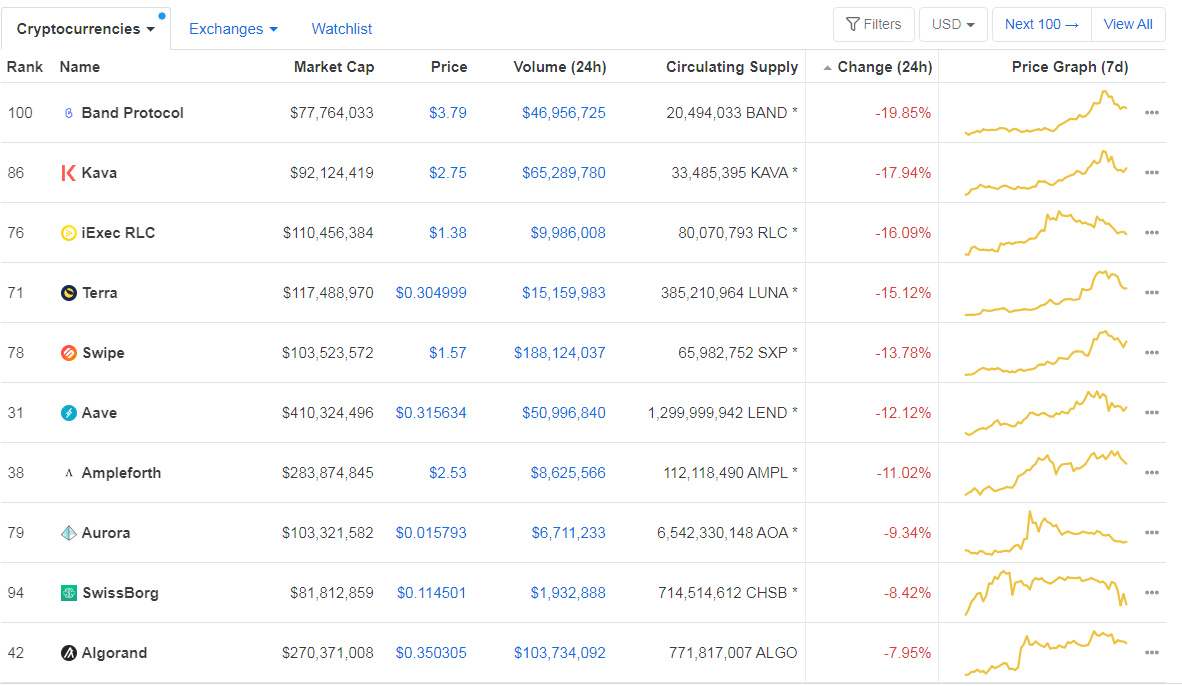
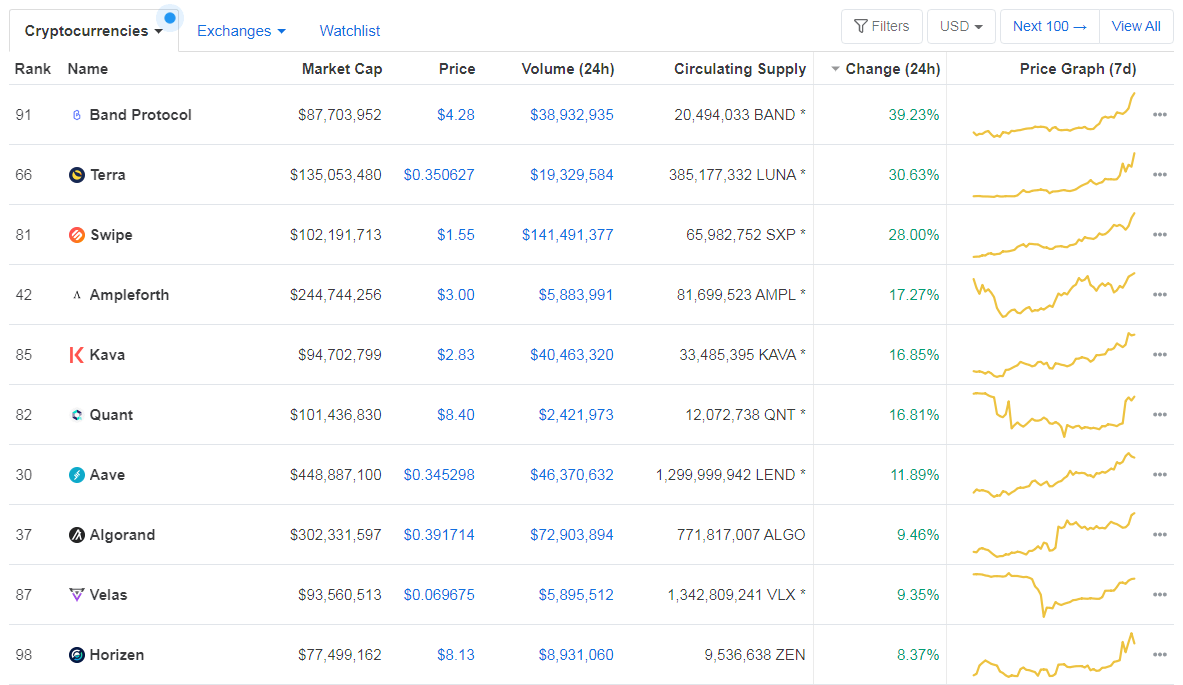
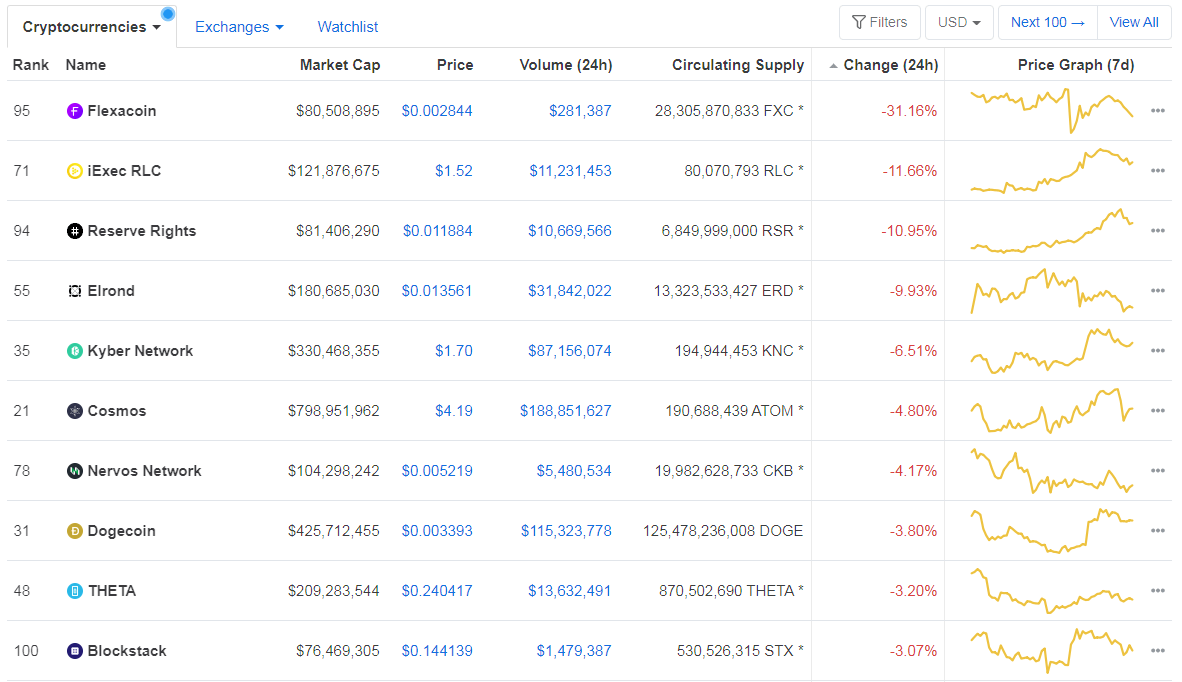
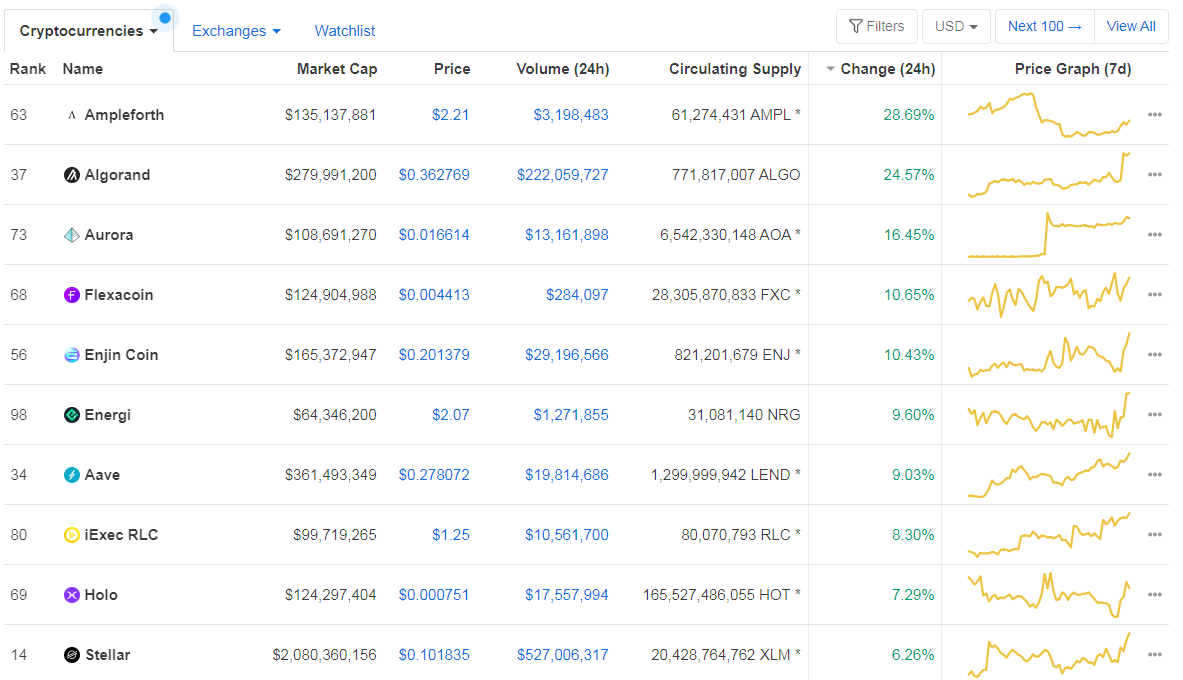
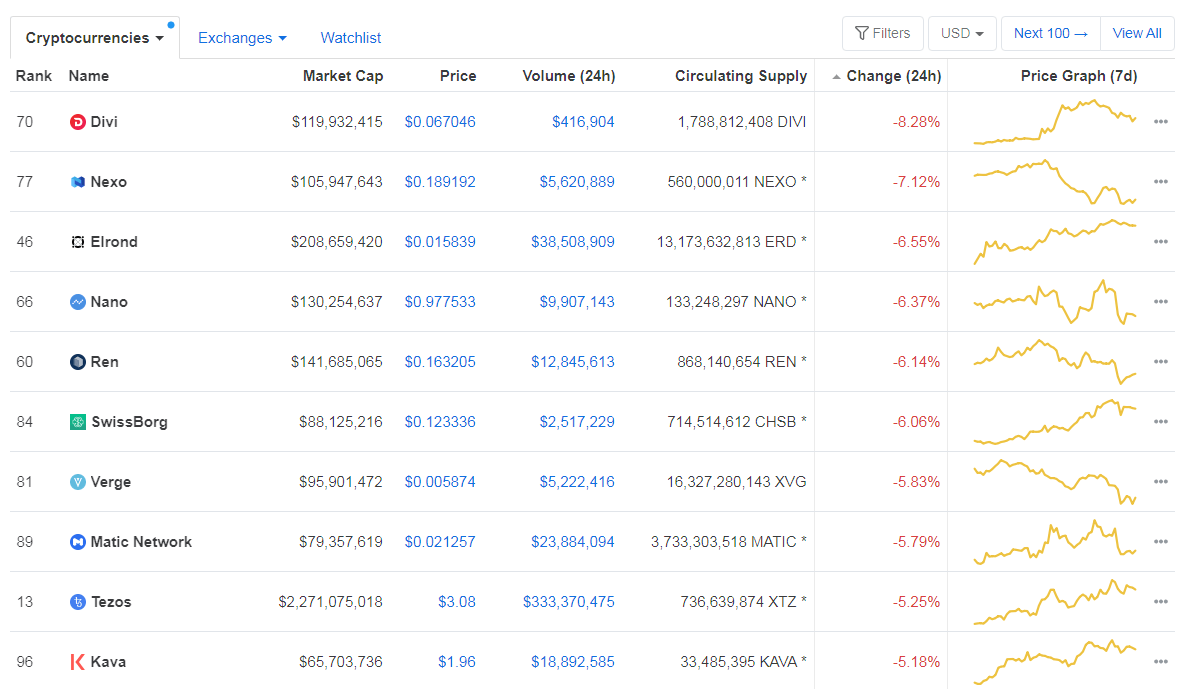
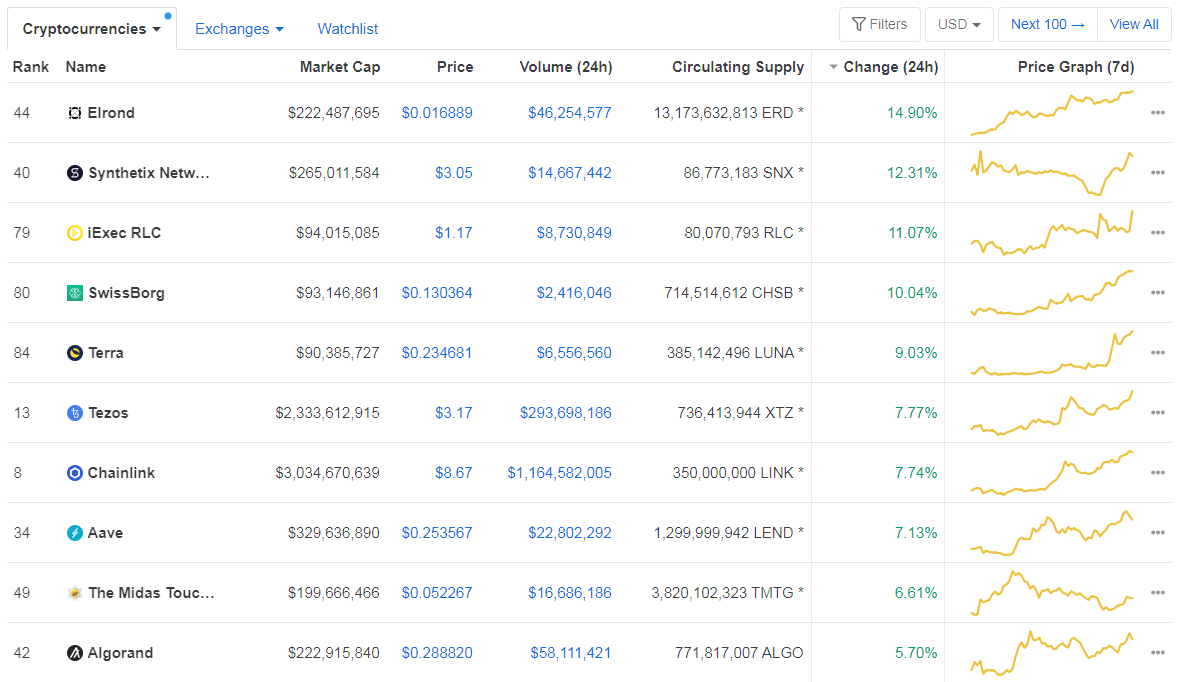
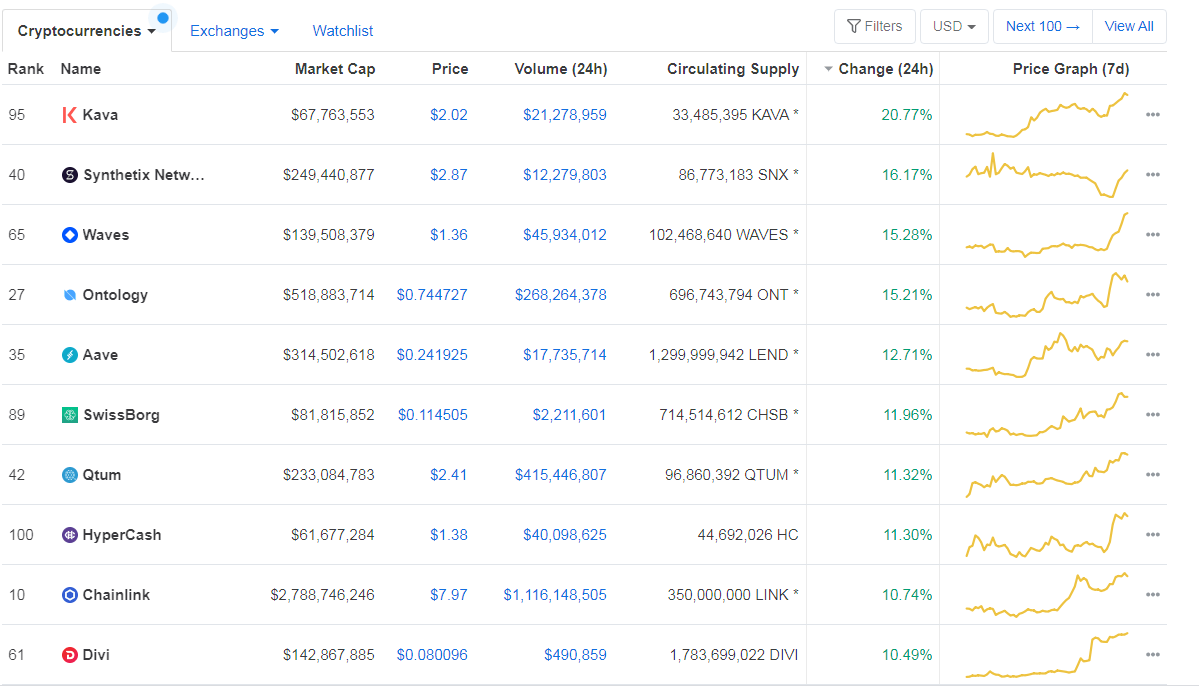
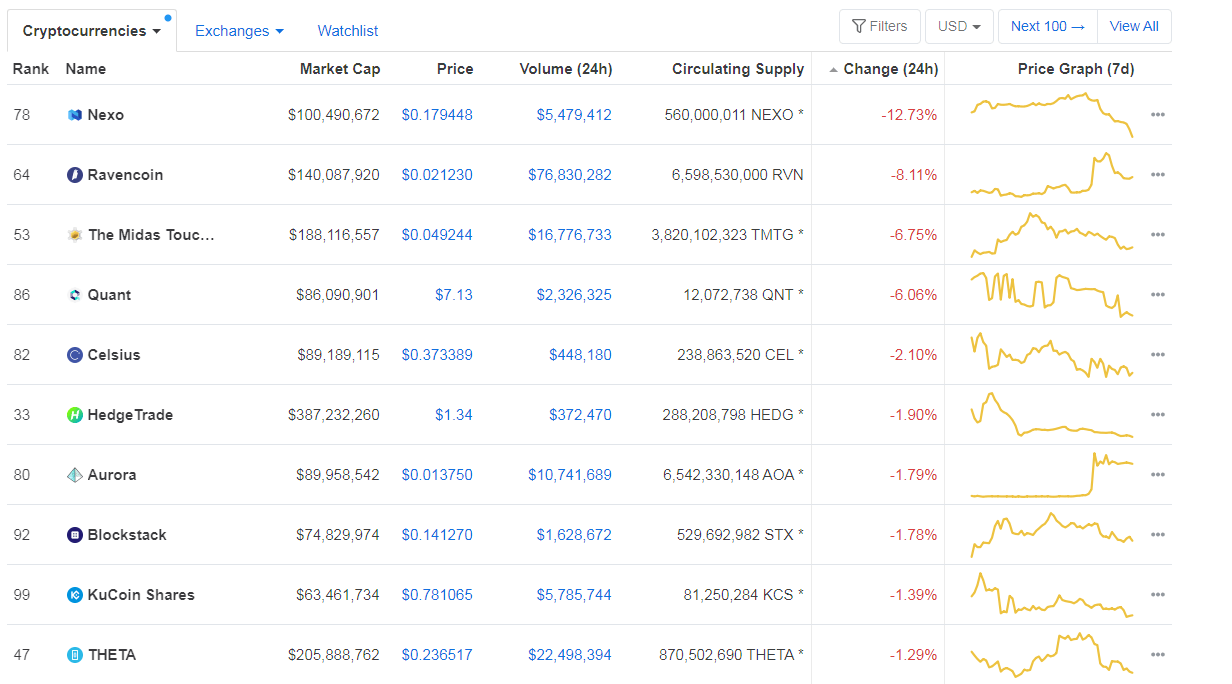
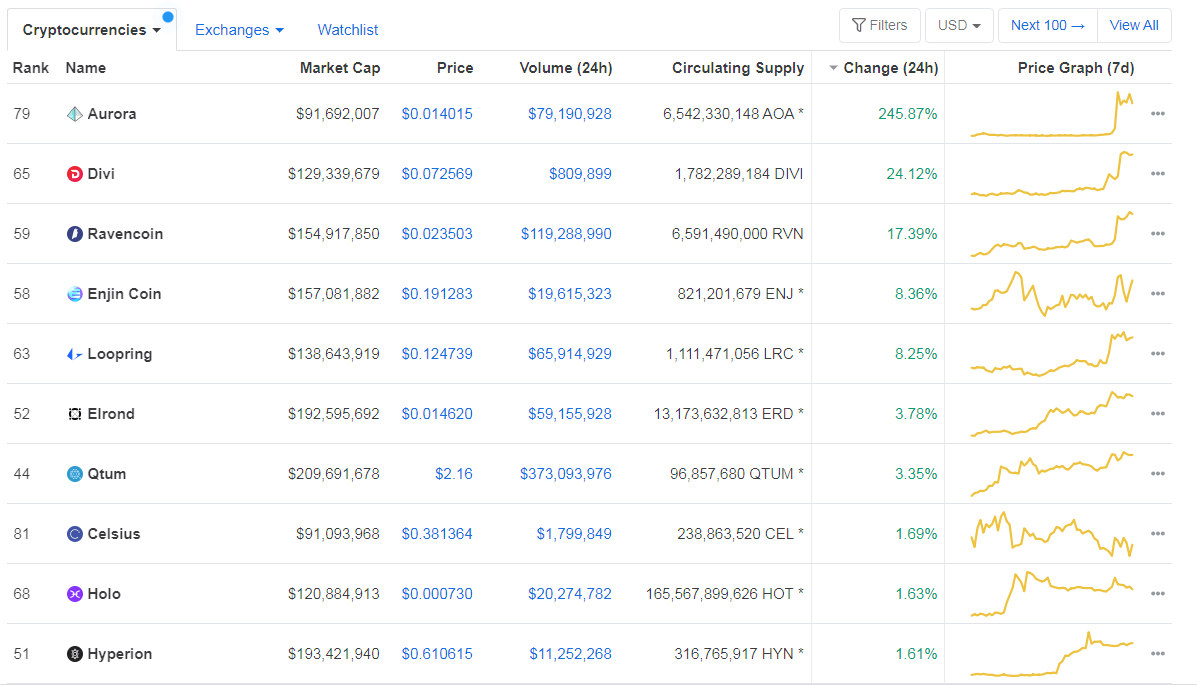
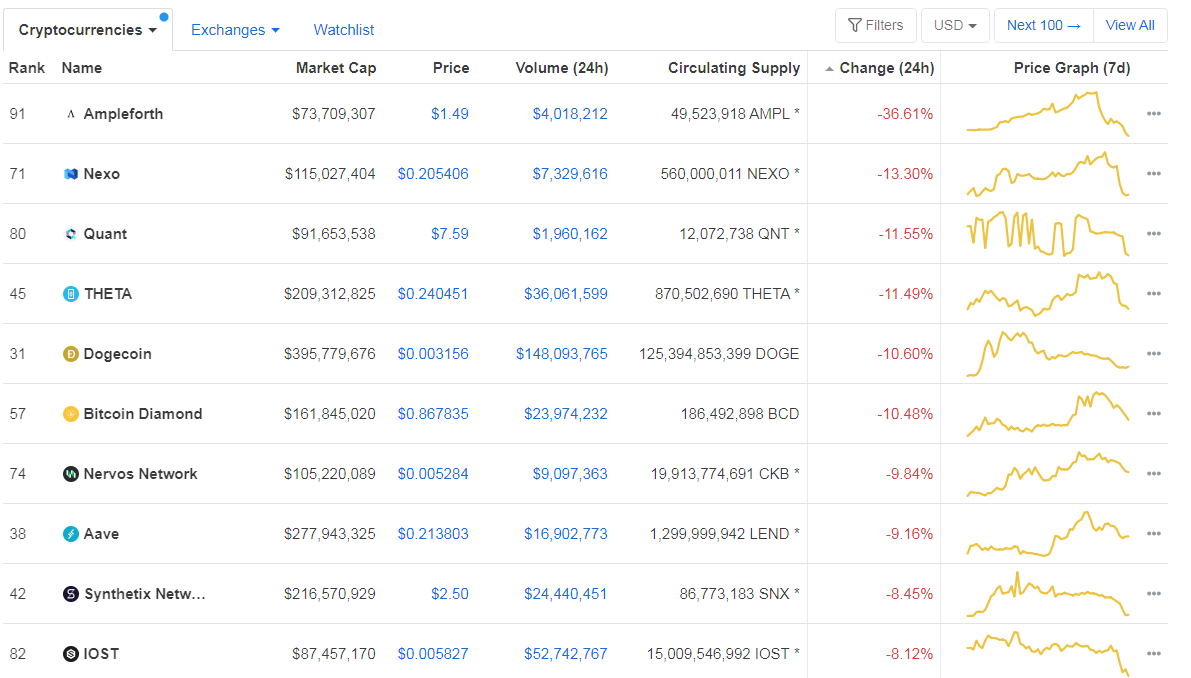
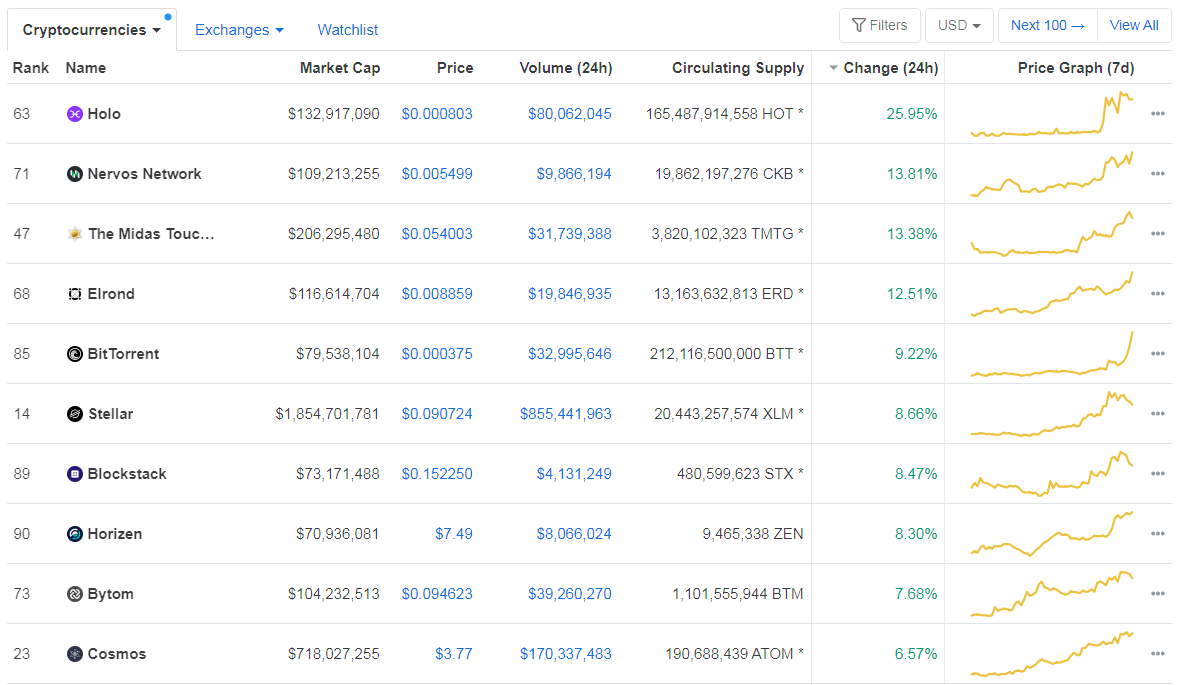
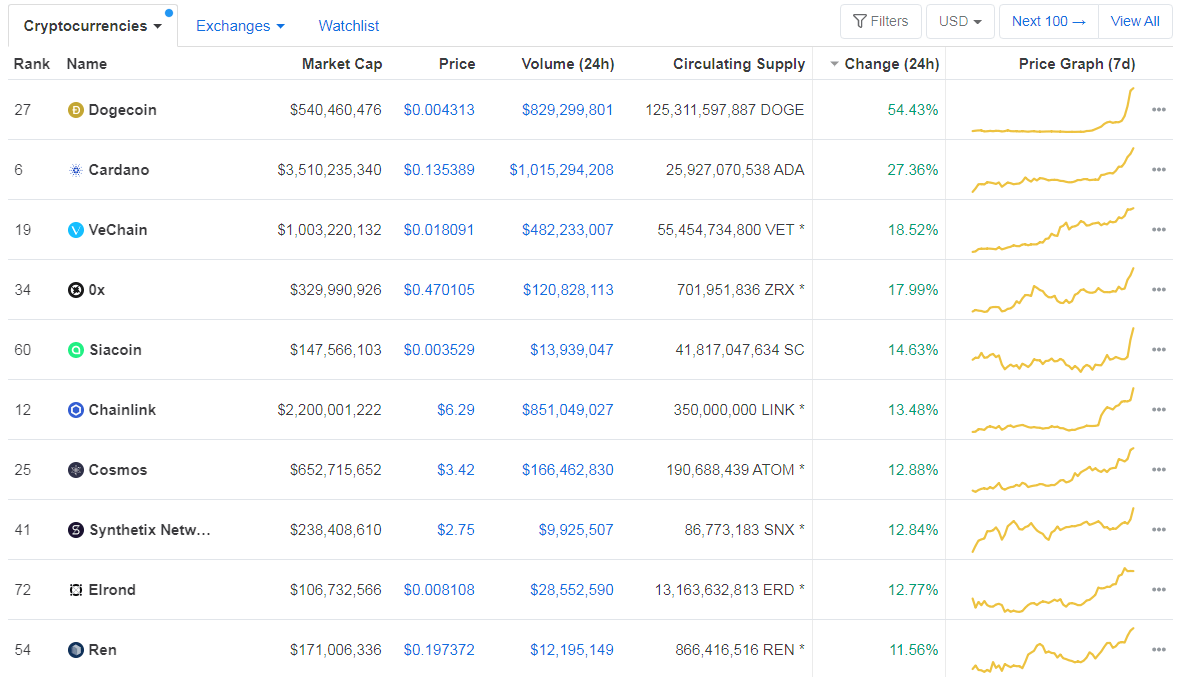
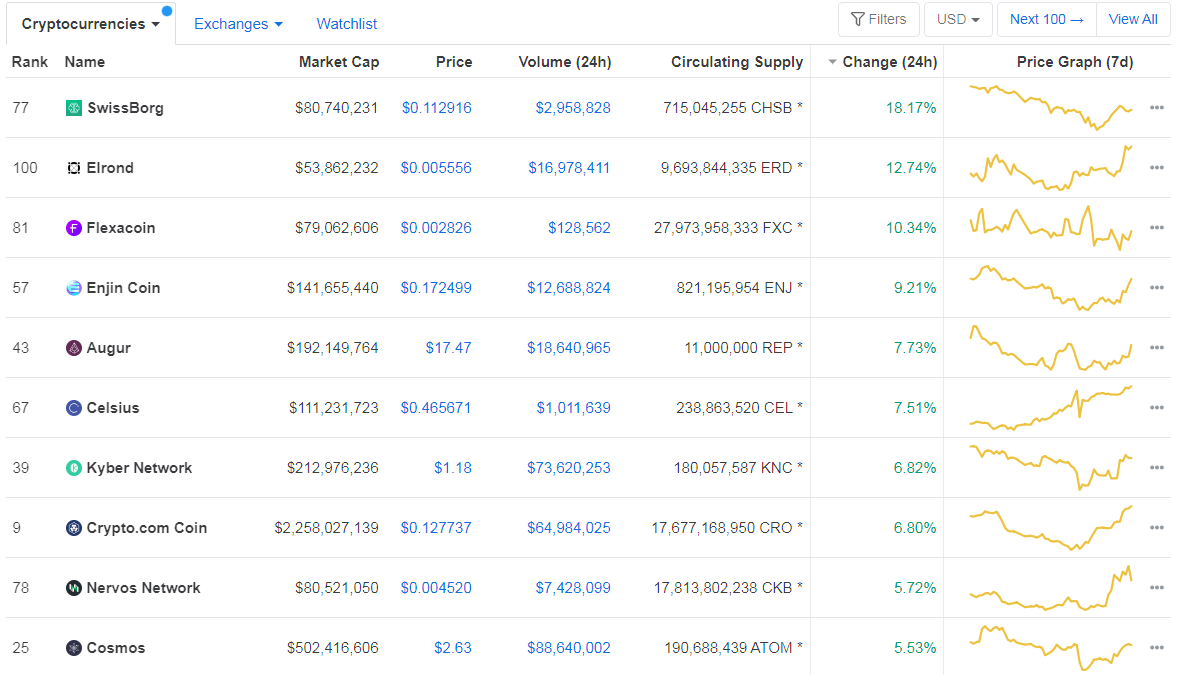
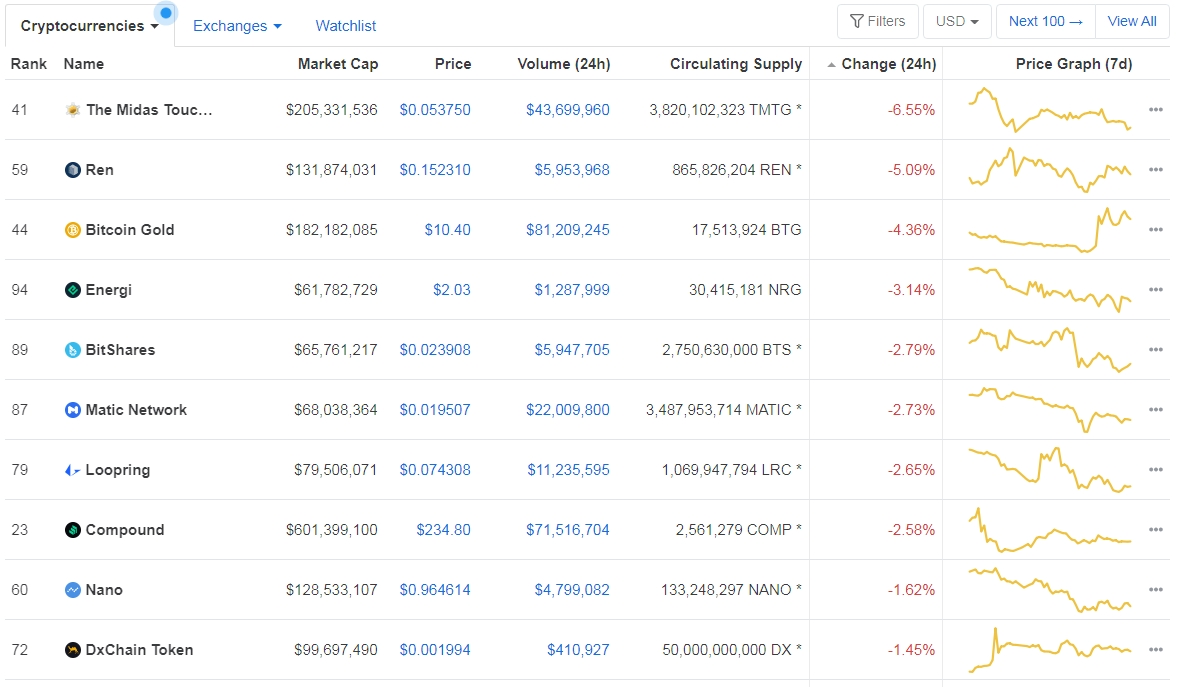
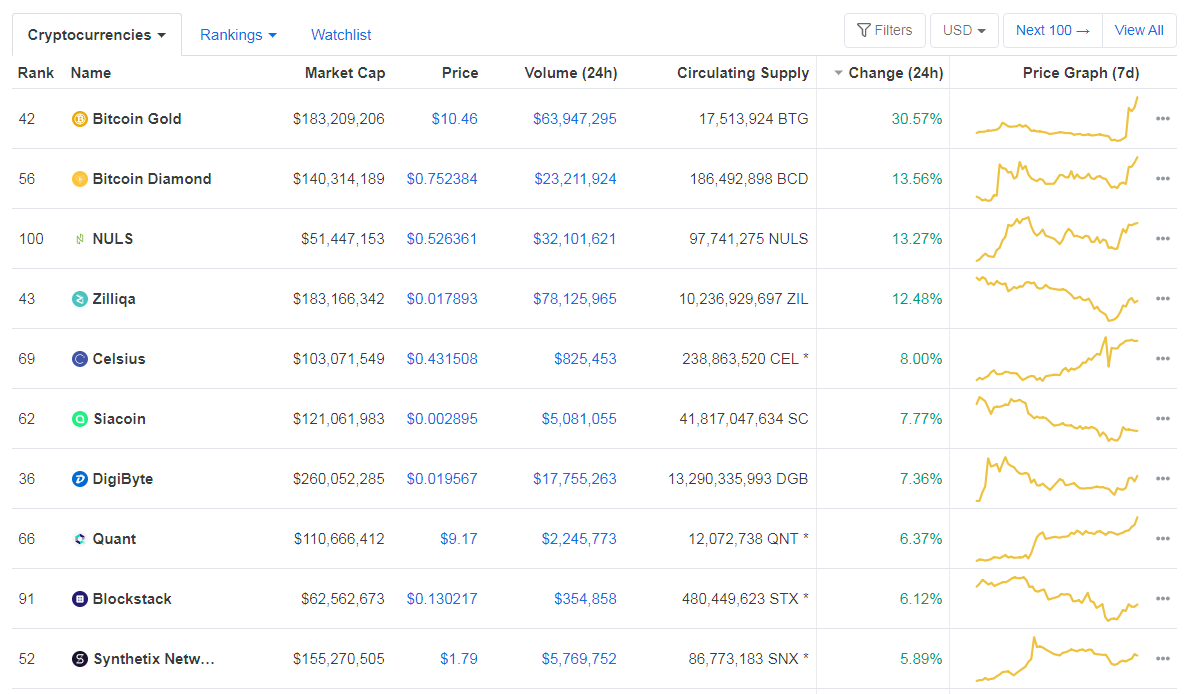
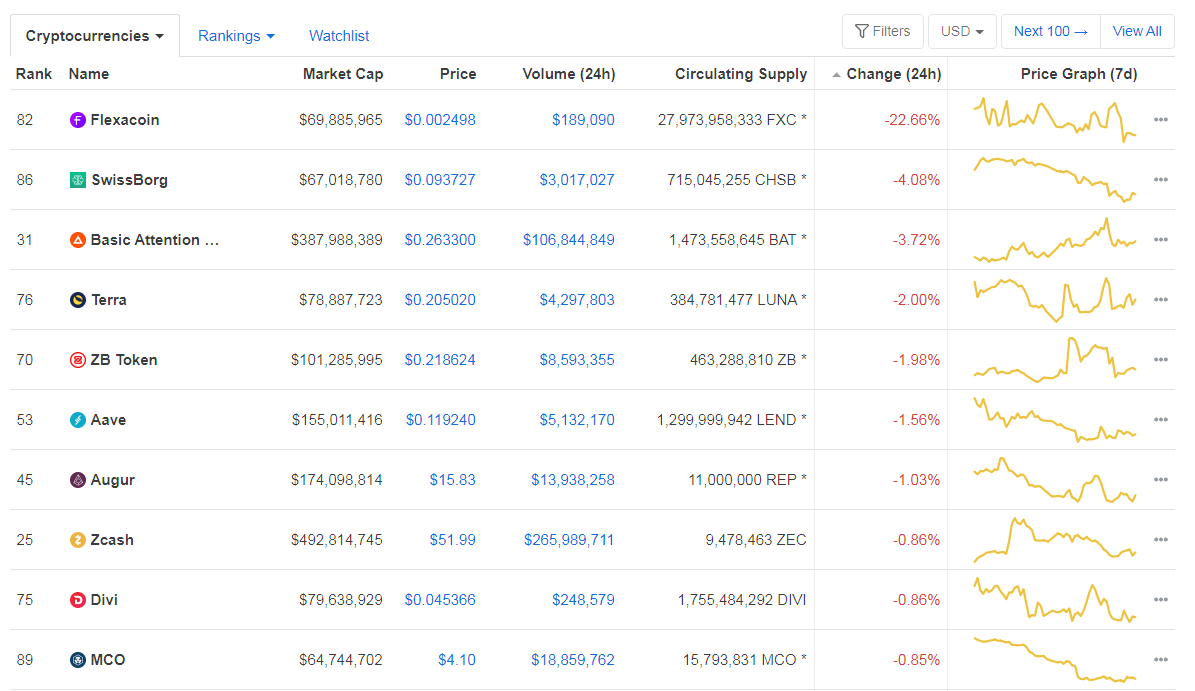
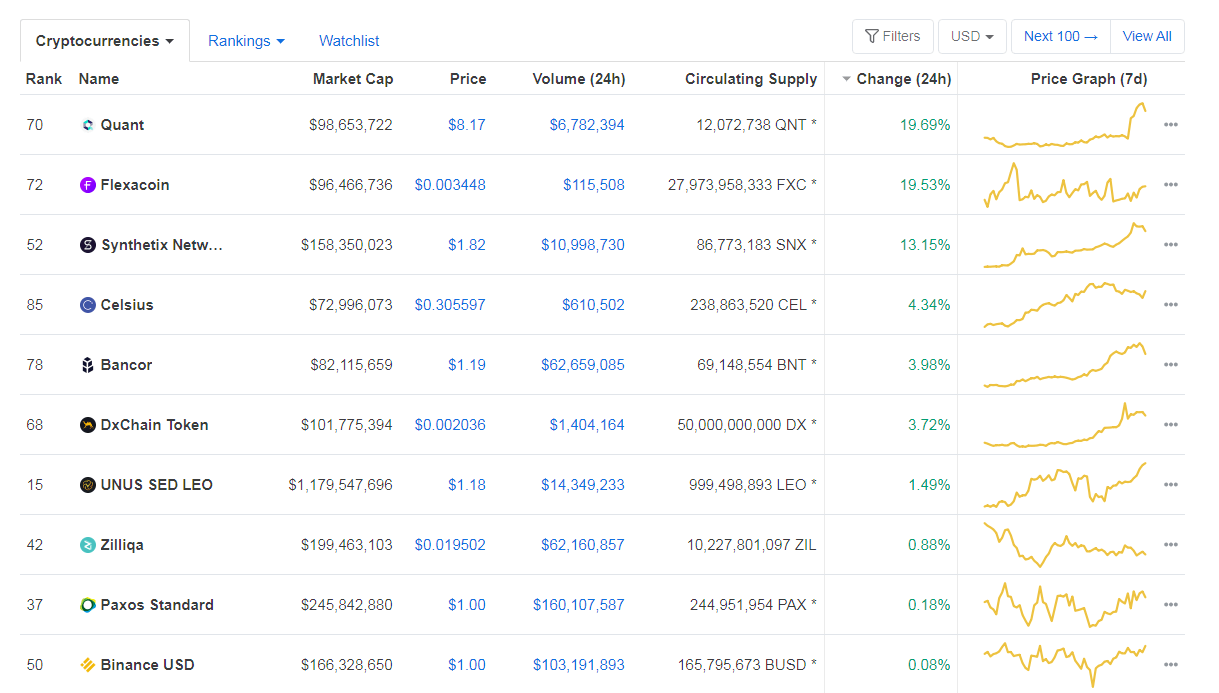
When talking about top100 cryptocurrencies, Elrond gained 22.75% on the day, making it the most prominent daily gainer. Status (10.69%) and Terra (9.44%) also did great. On the other hand, Synthetix Network has lost 10.39%, making it the most prominent daily loser. It is followed by Band Protocol’s loss of 6.95% and Aave’s loss of 6.76%.
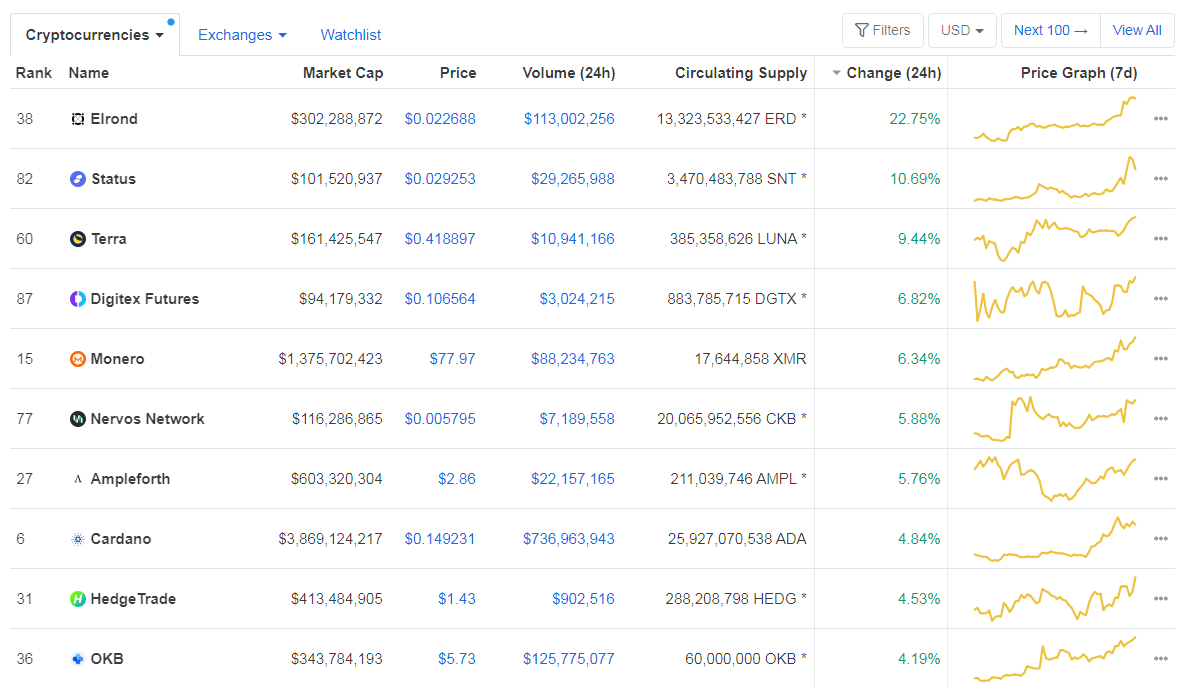
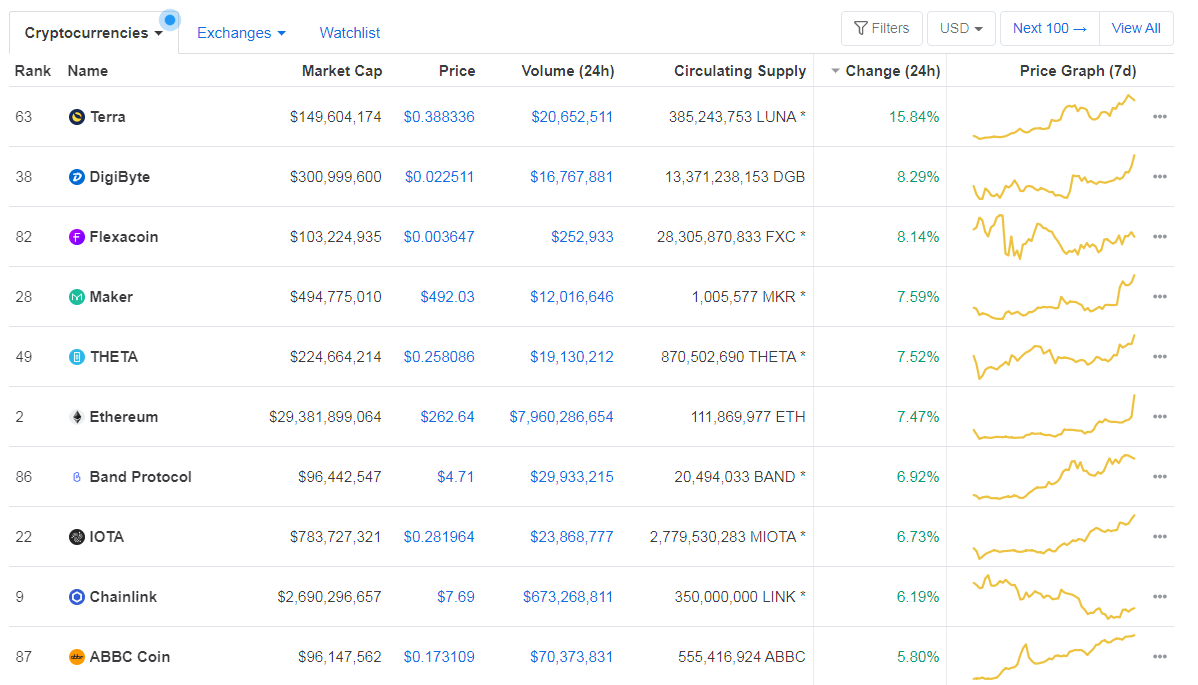
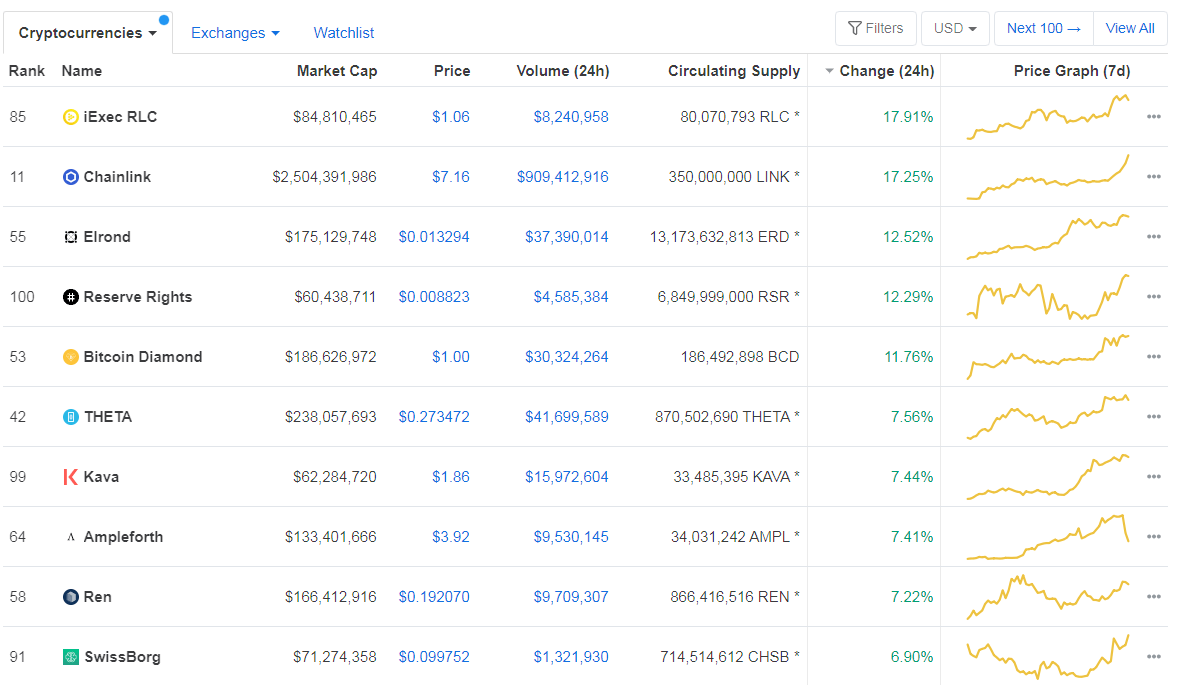
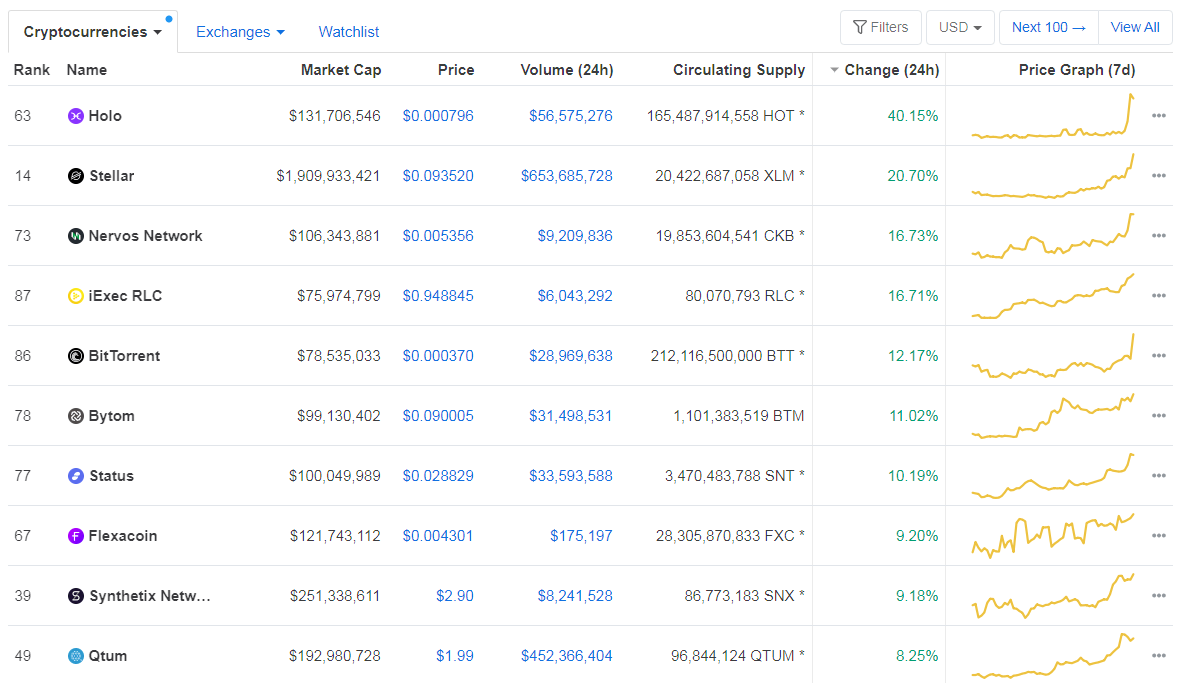
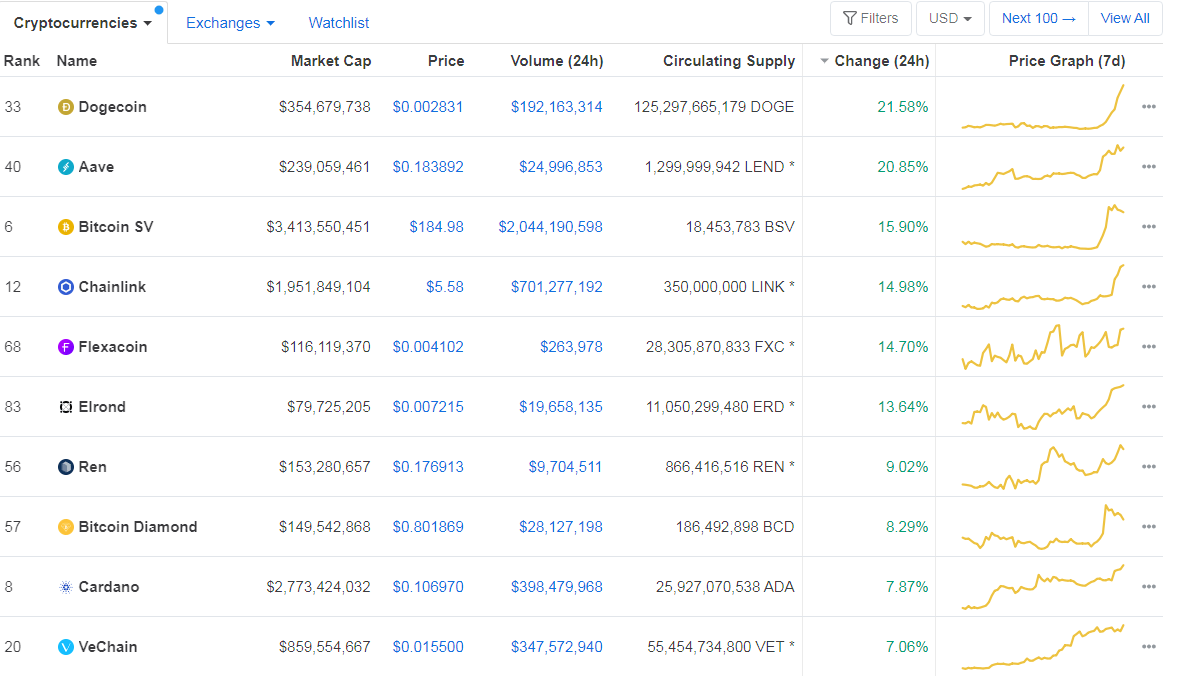
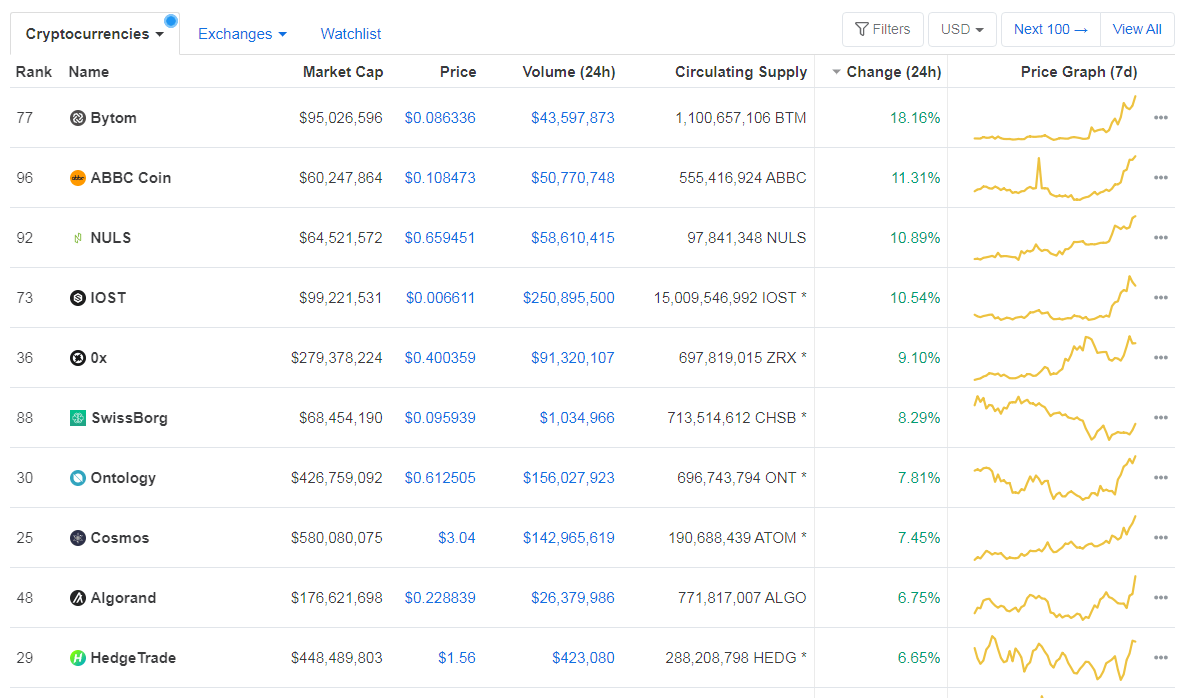
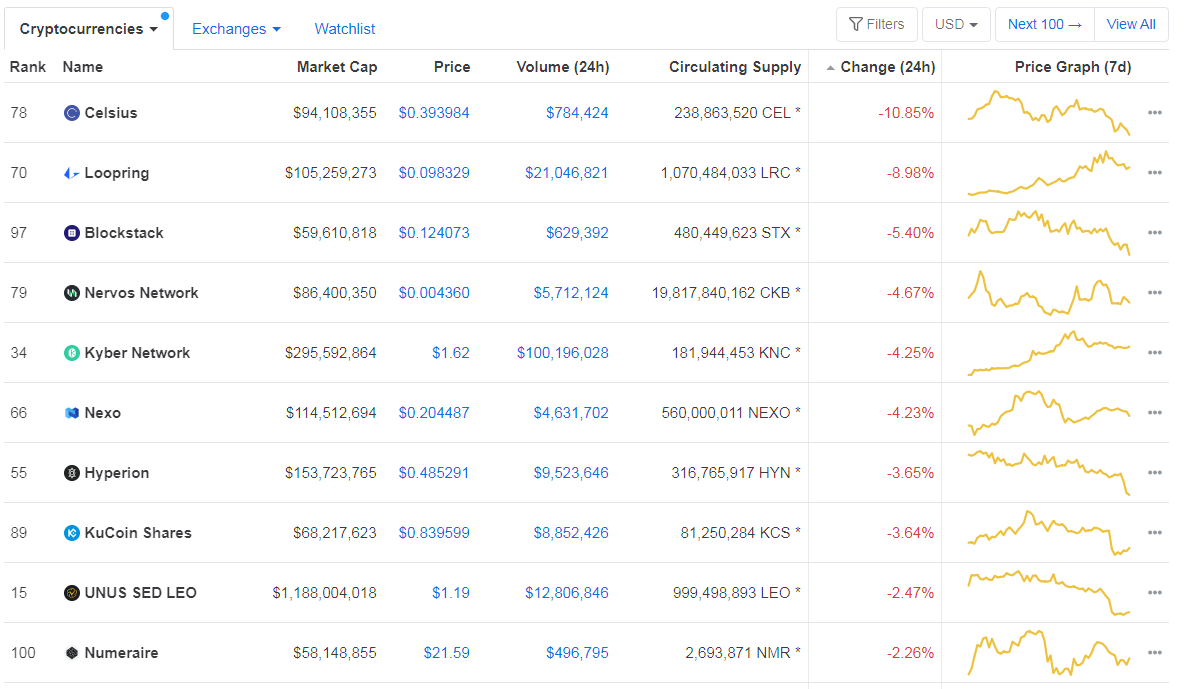
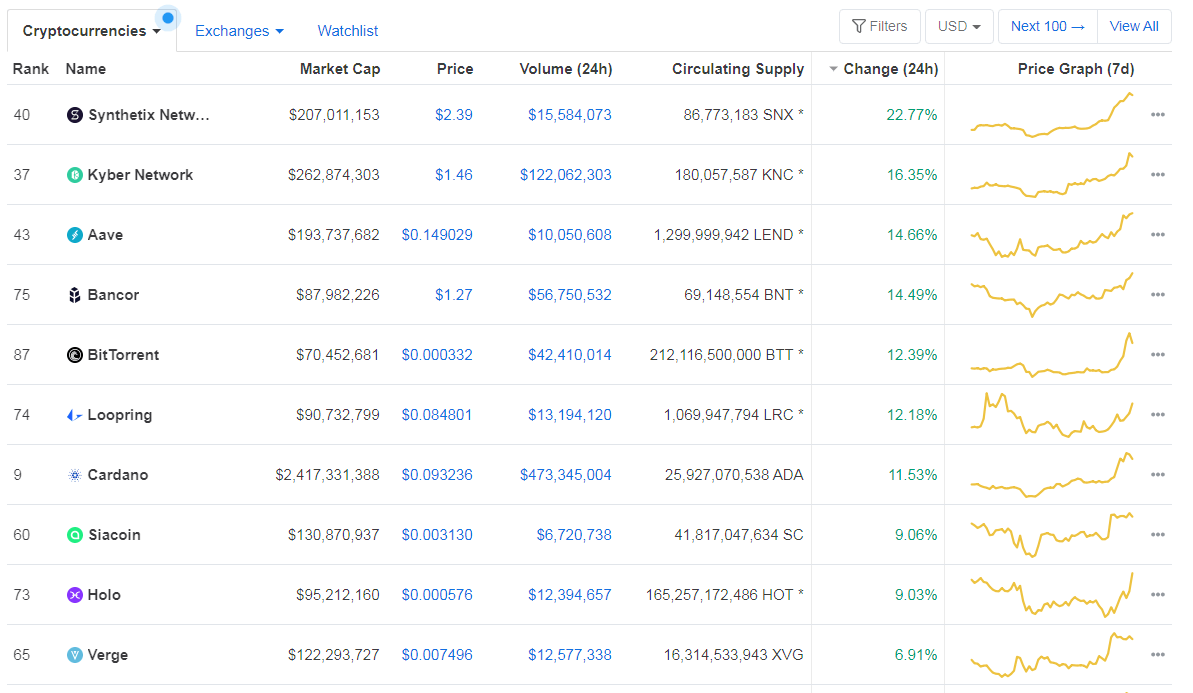
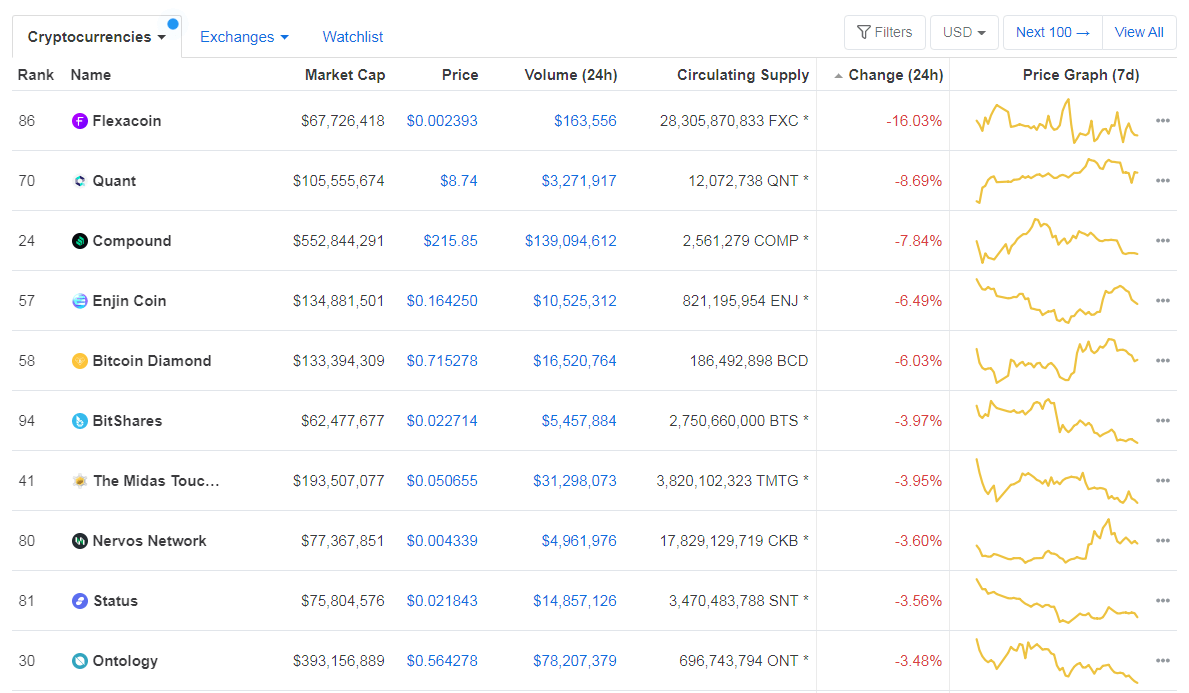
Top 10 24-hour Performers (Click to enlarge)
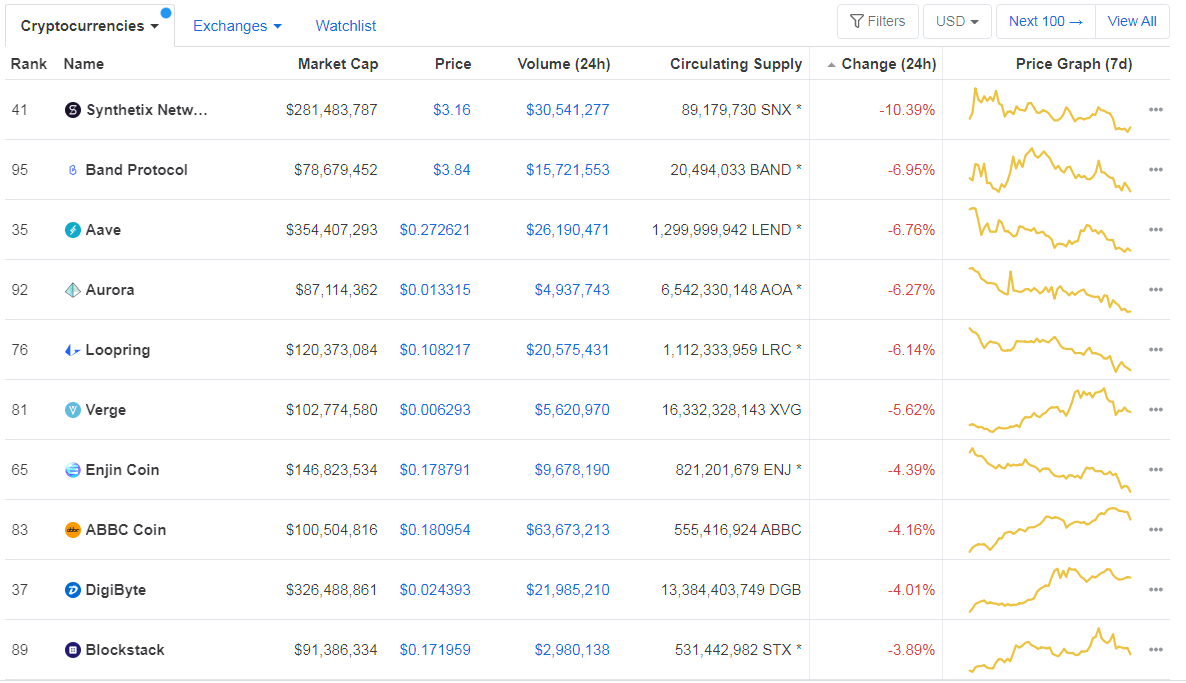
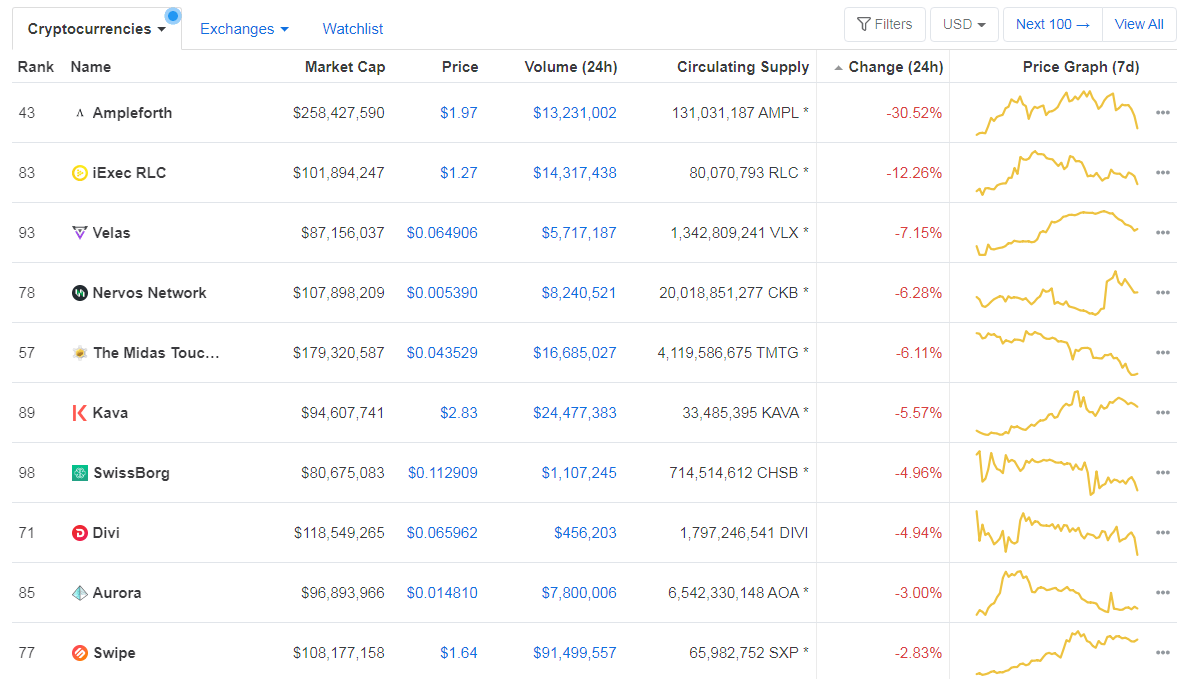
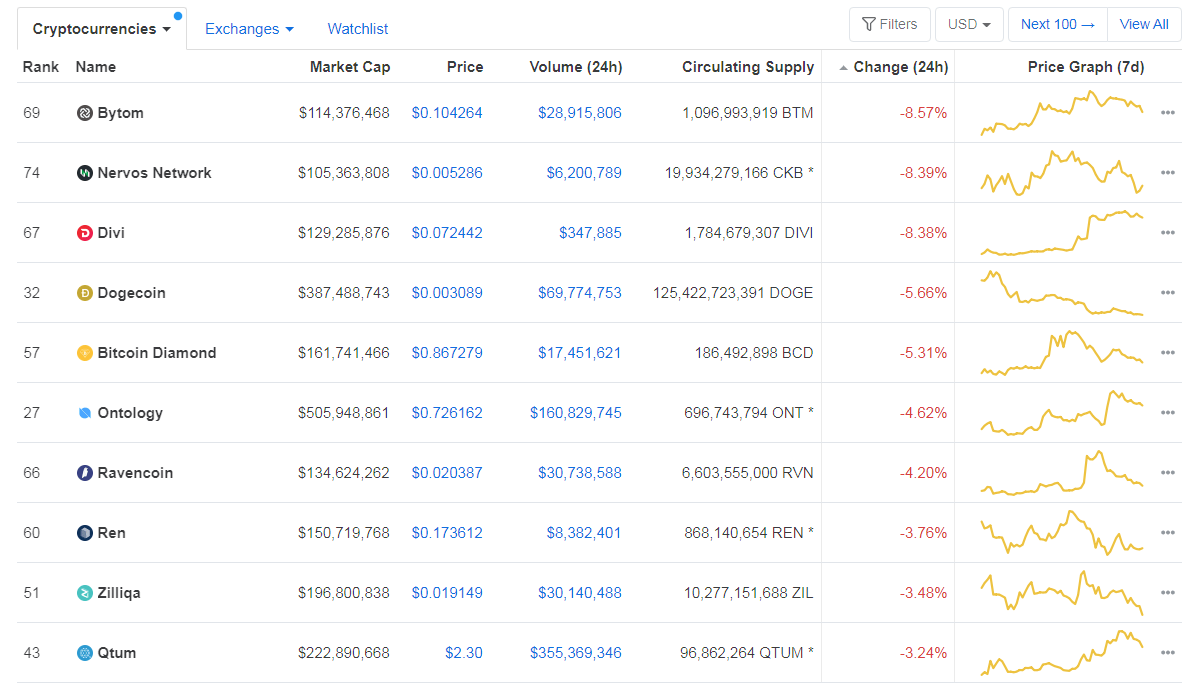
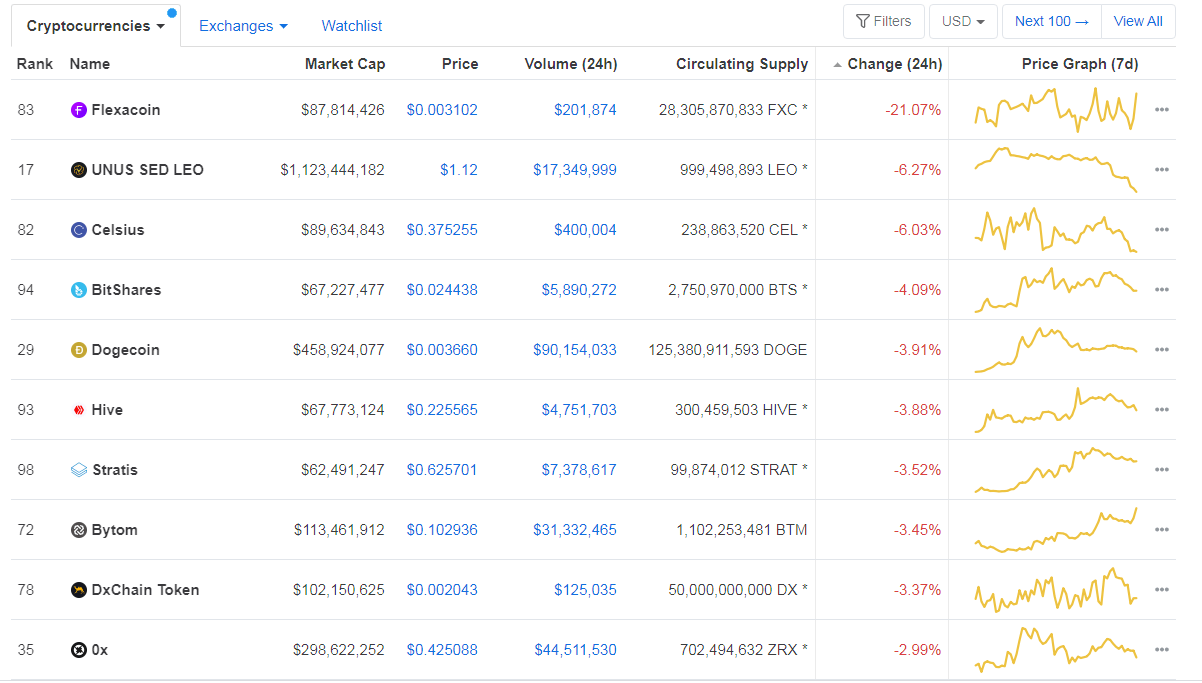
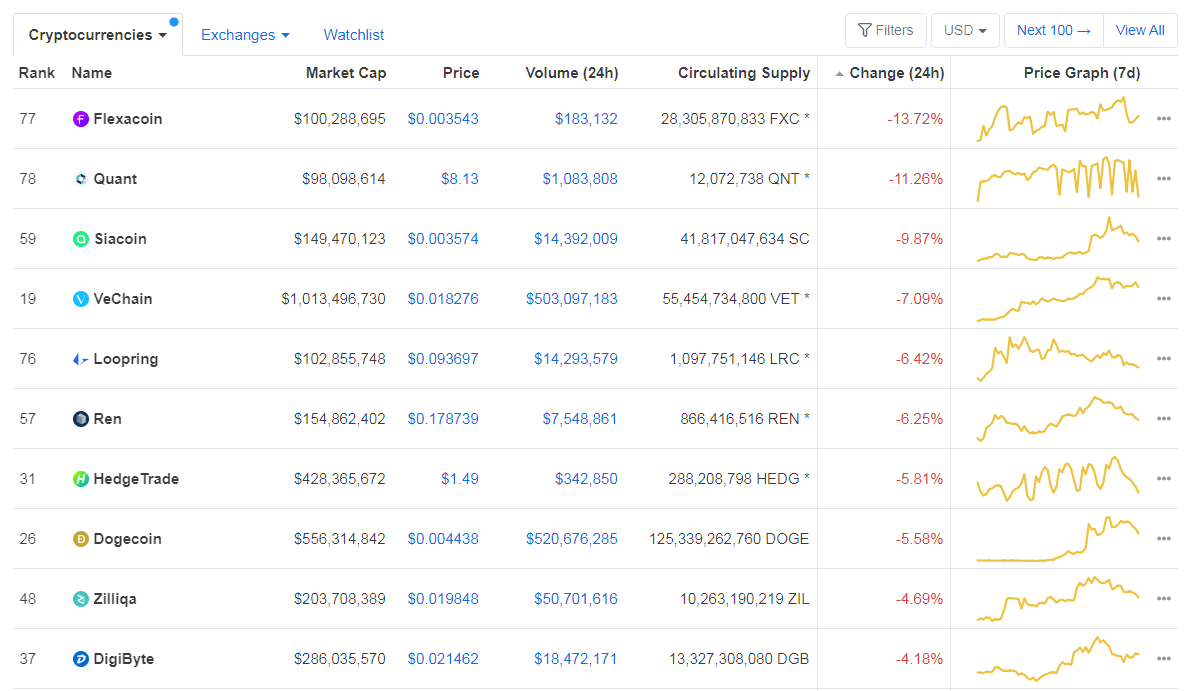
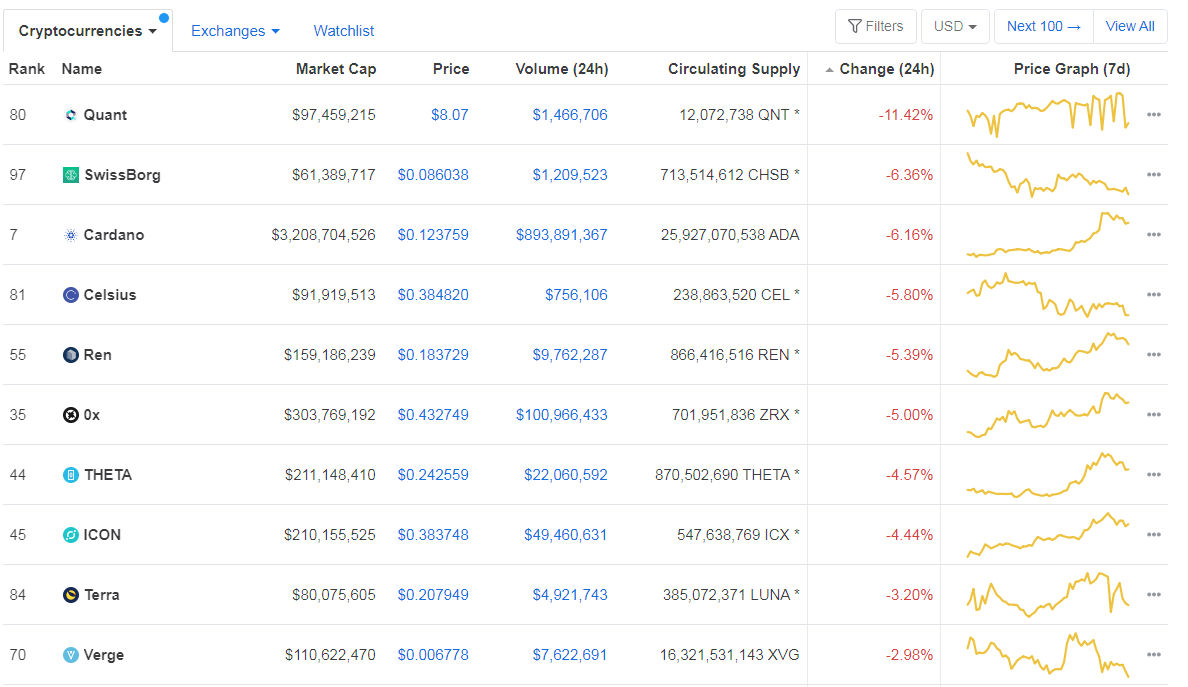
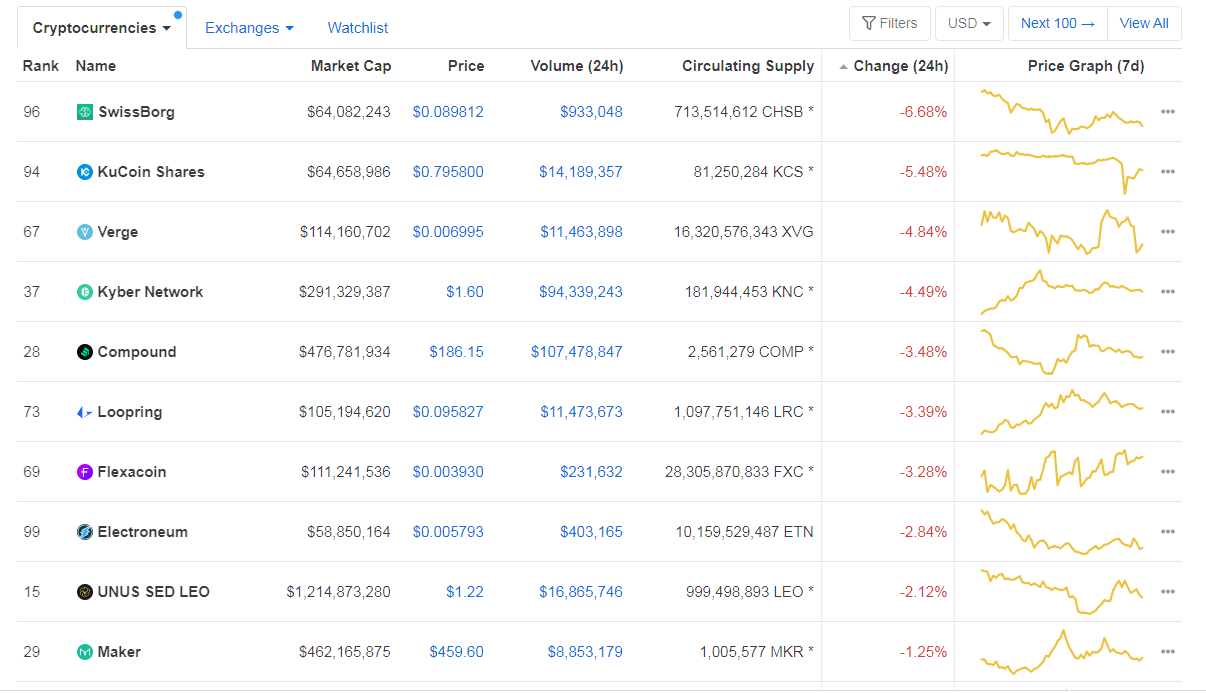
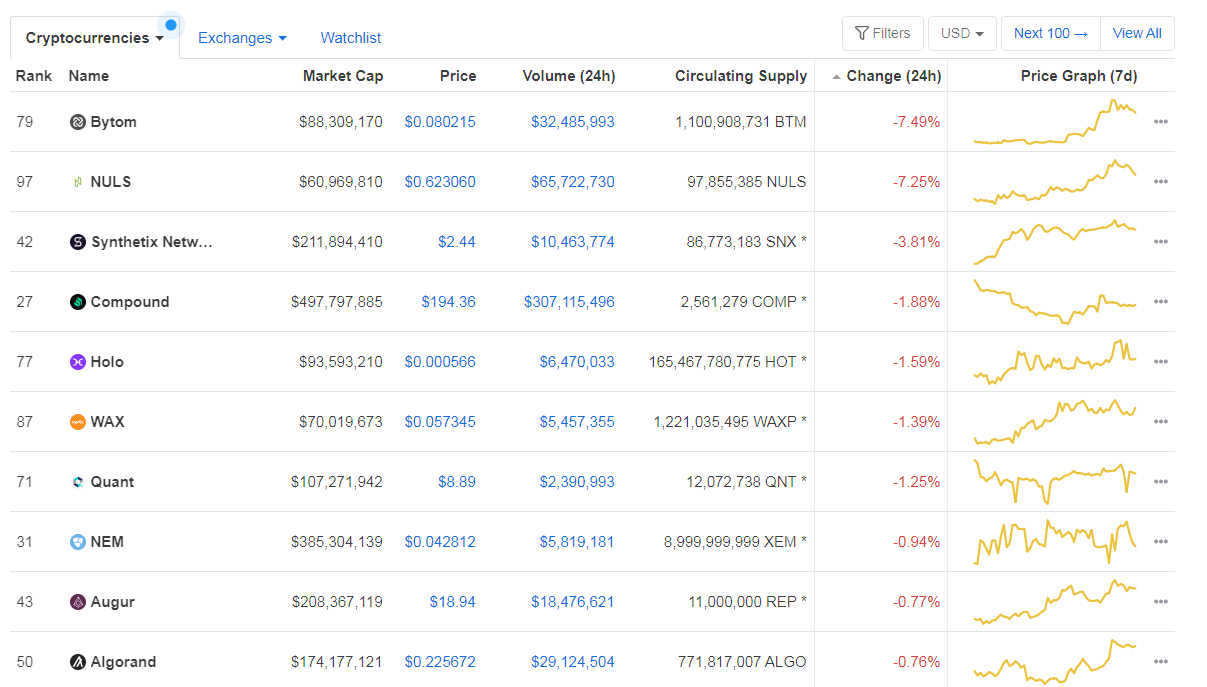
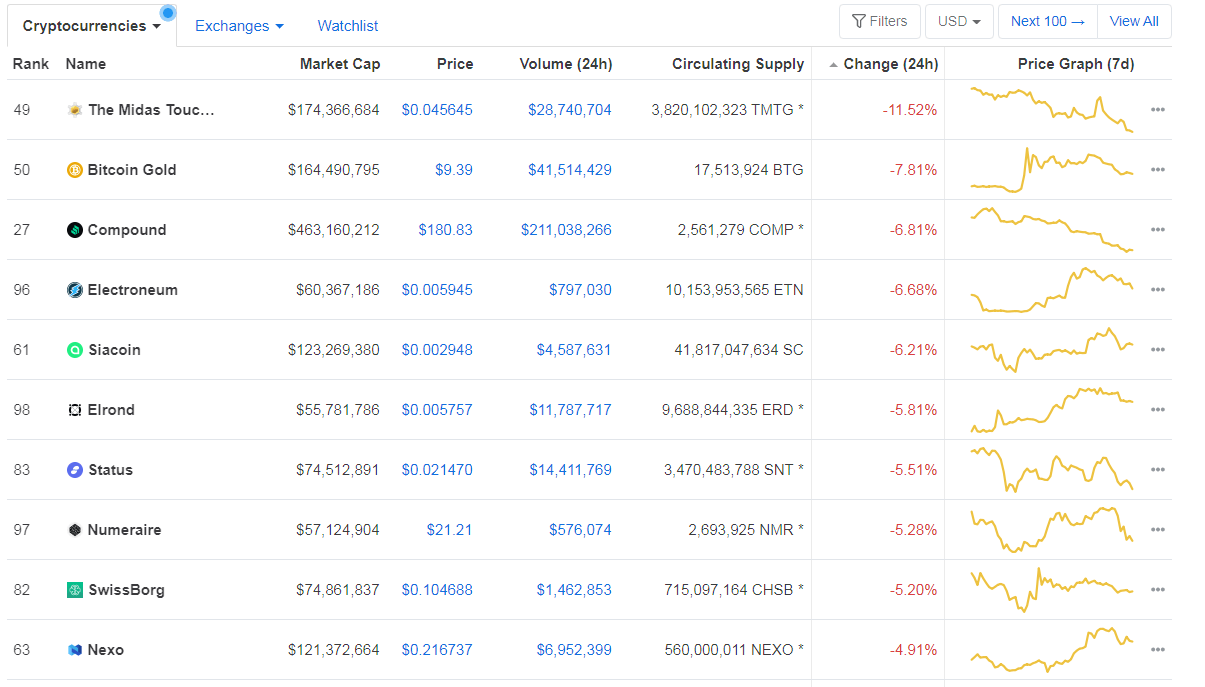
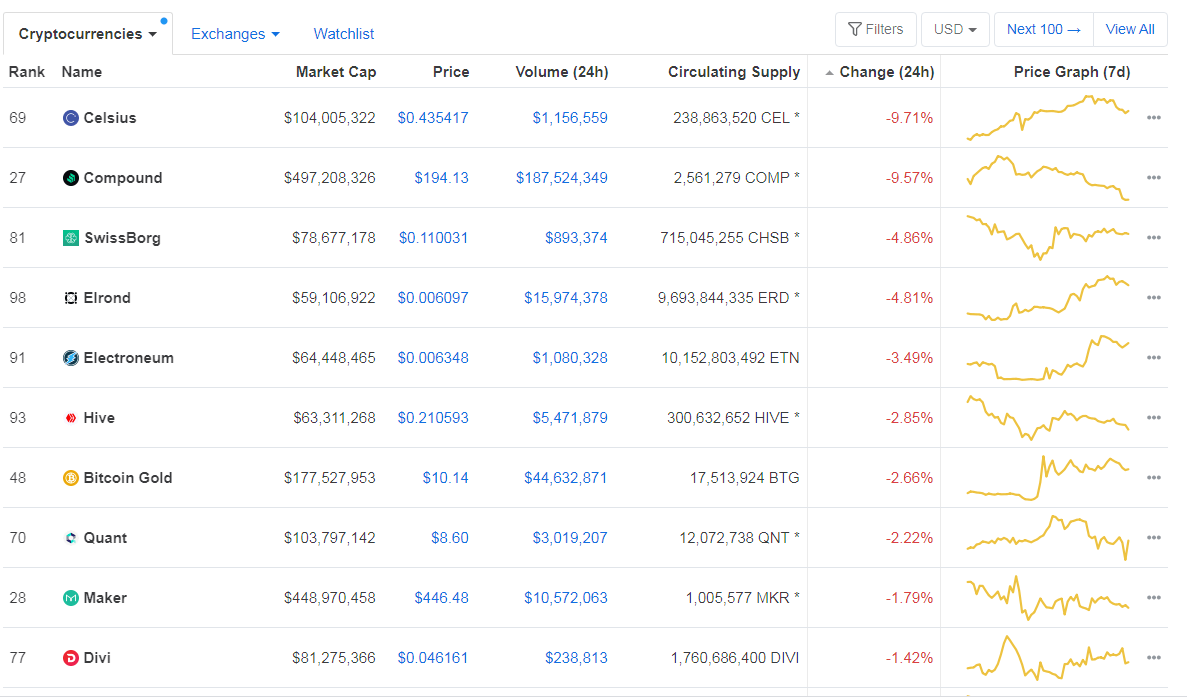
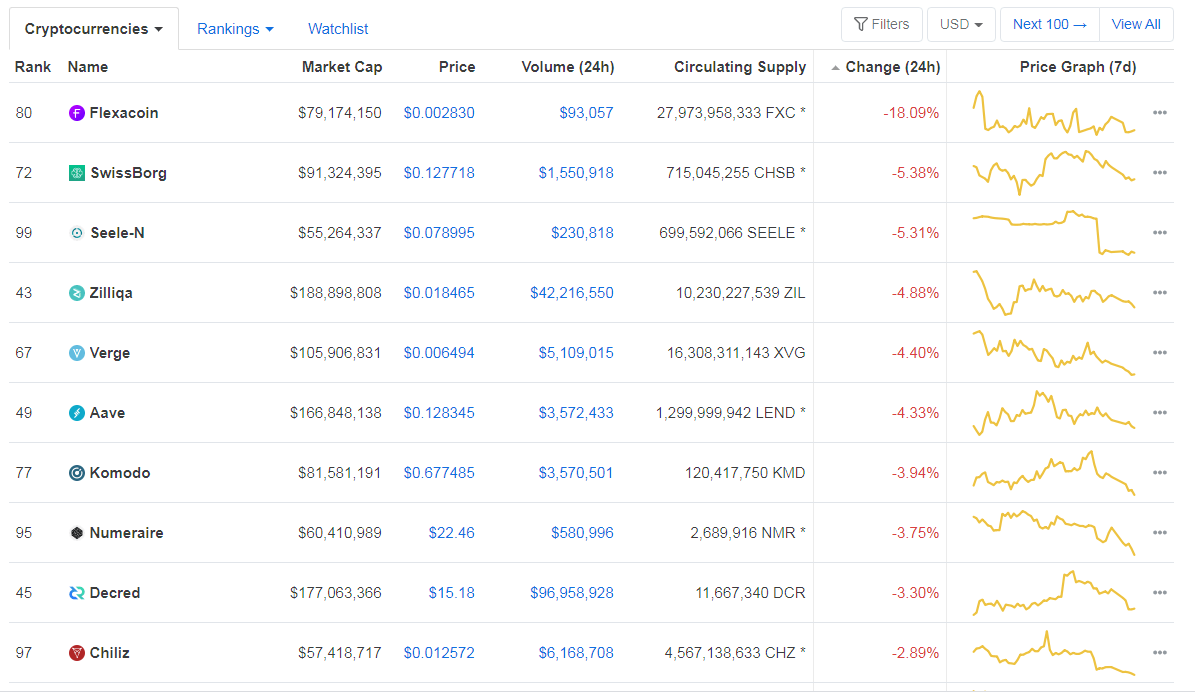
Bottom 10 24-hour Performers (Click to enlarge)
Bitcoin’s dominance level decreased slightly since we last reported, with its value currently at 61.51%. This value represents a 0.78% difference to the downside when compared to Friday’s value.
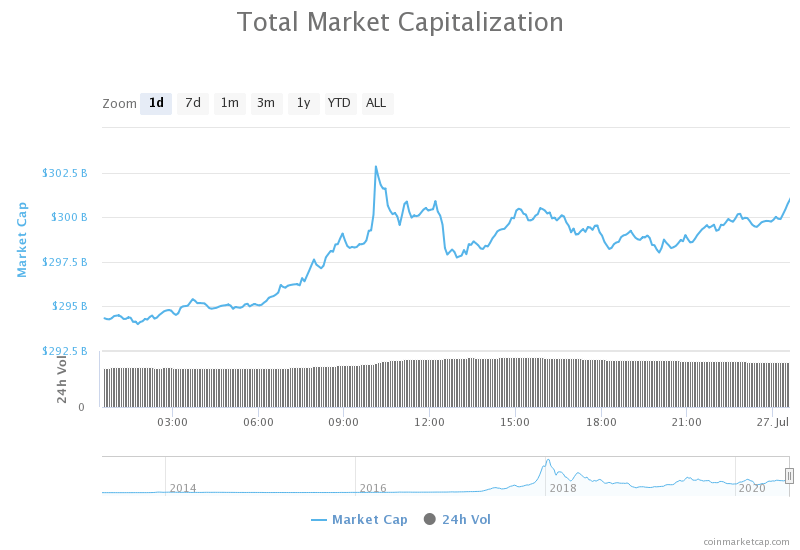
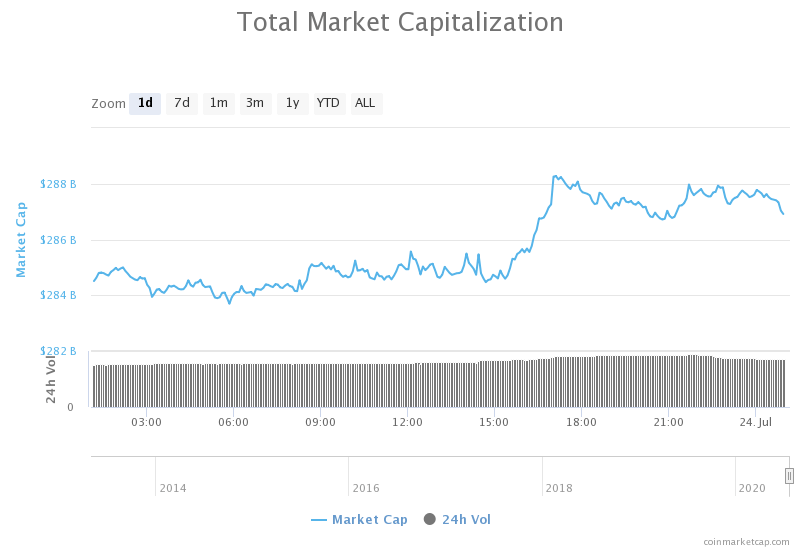
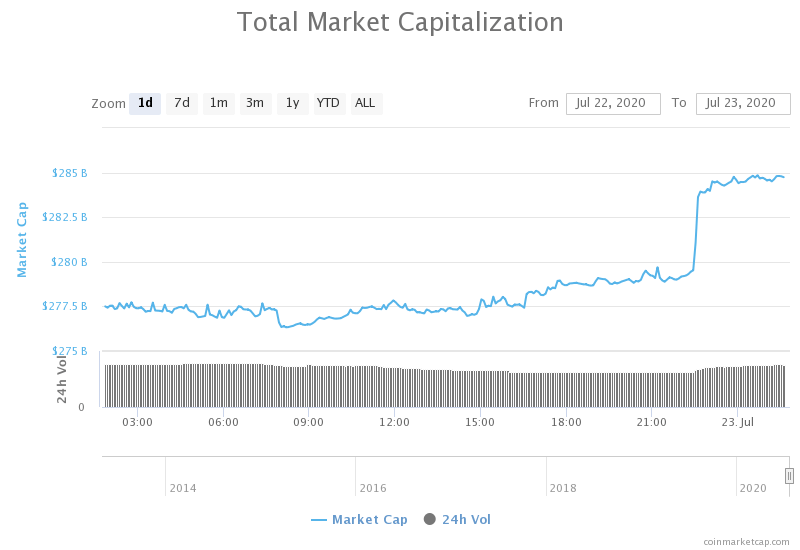
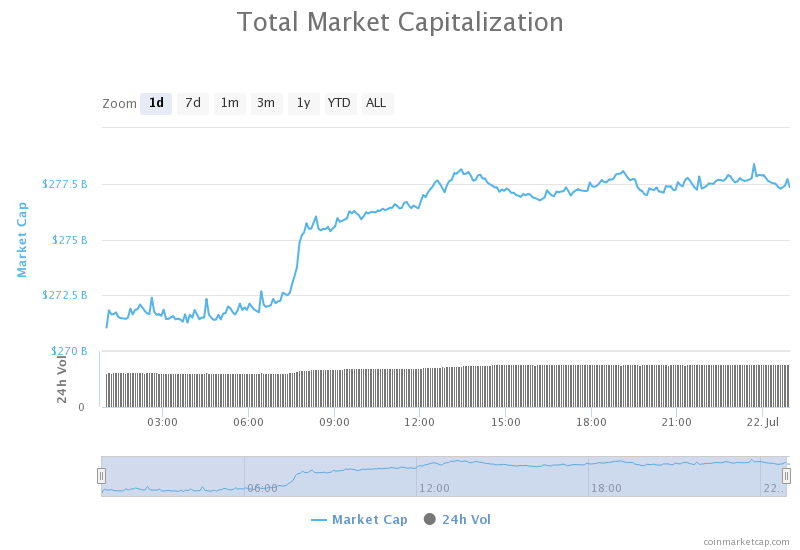
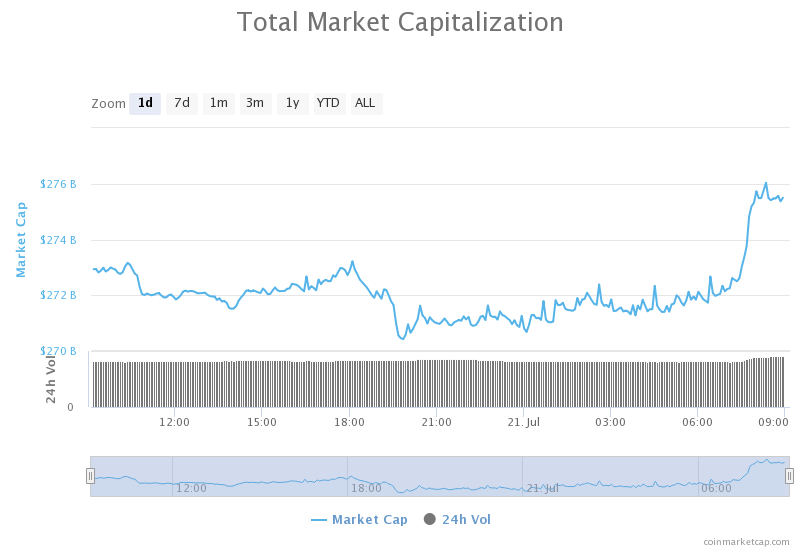
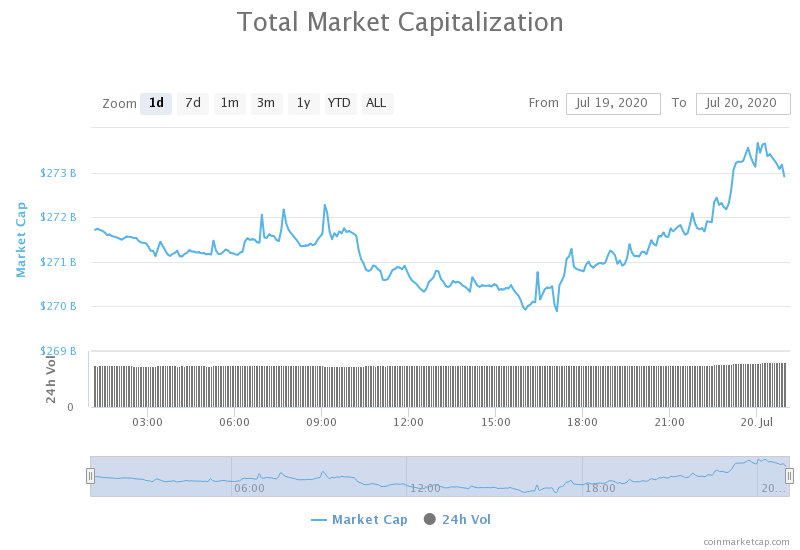
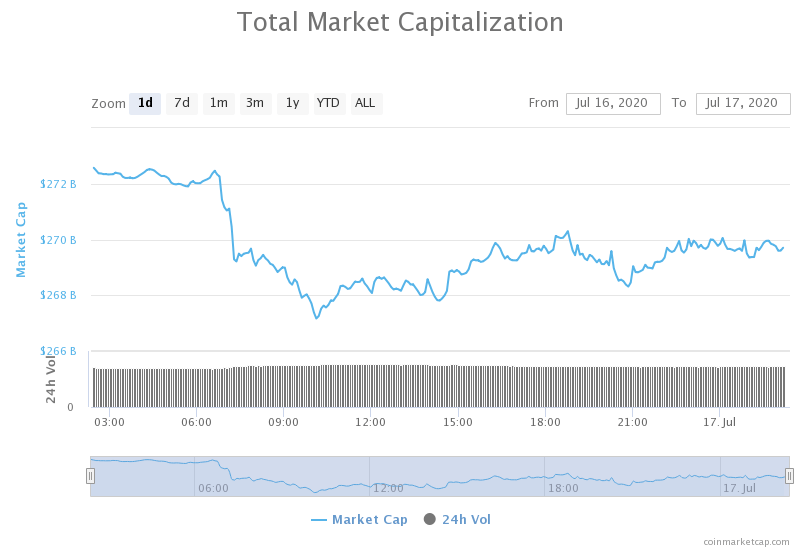
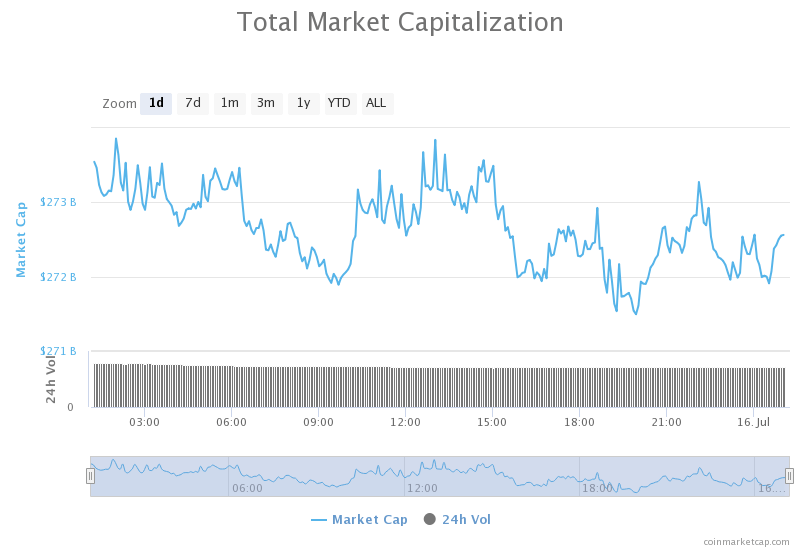
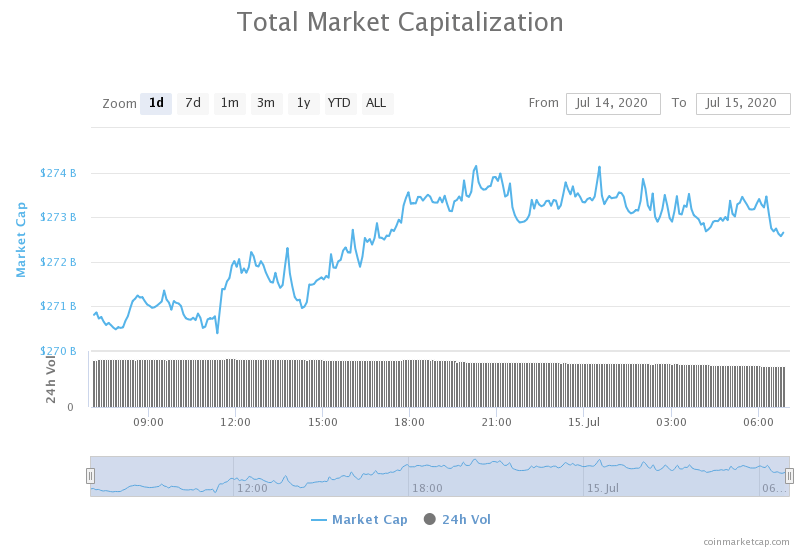
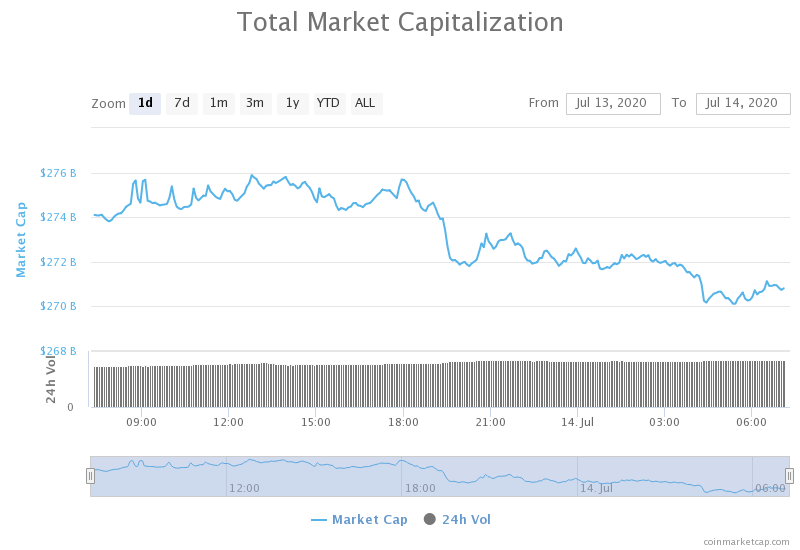
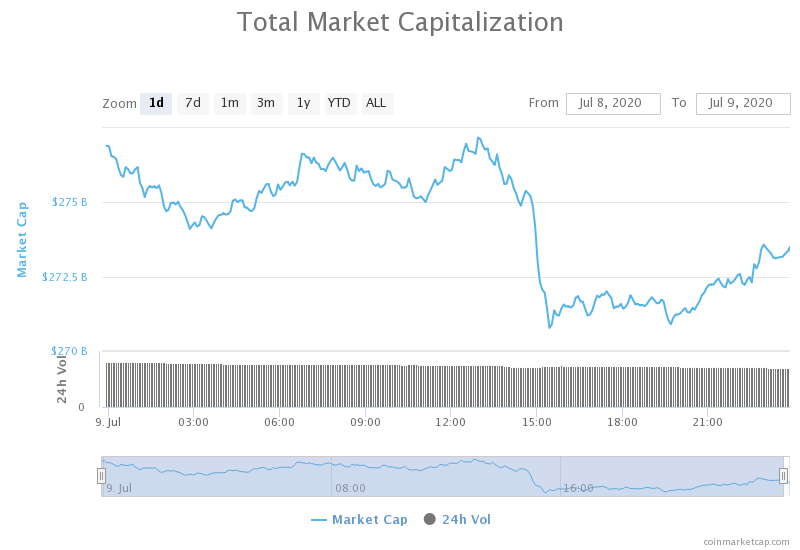
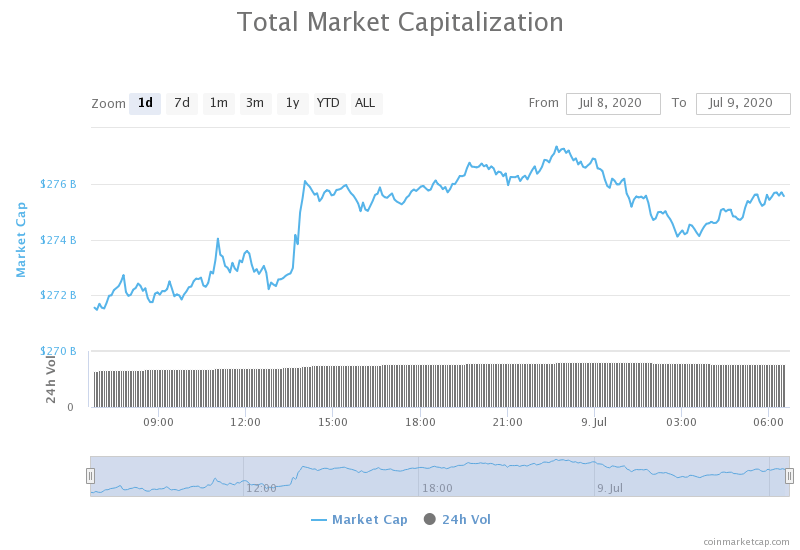
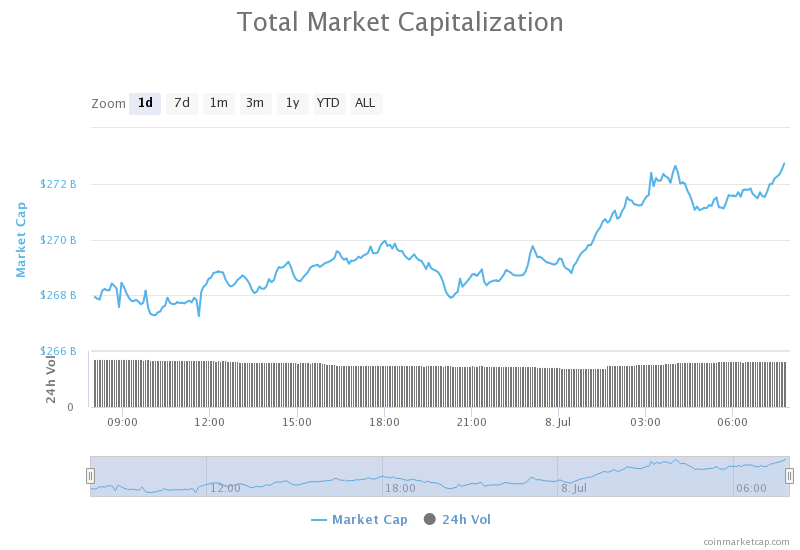
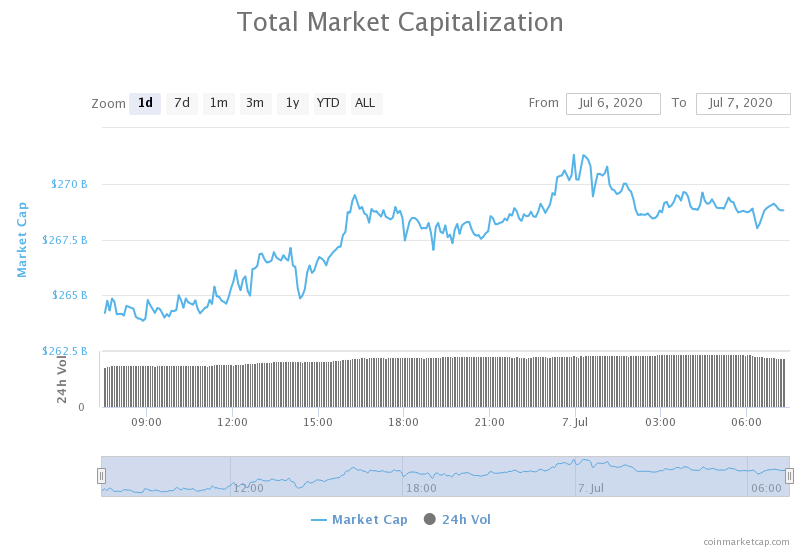
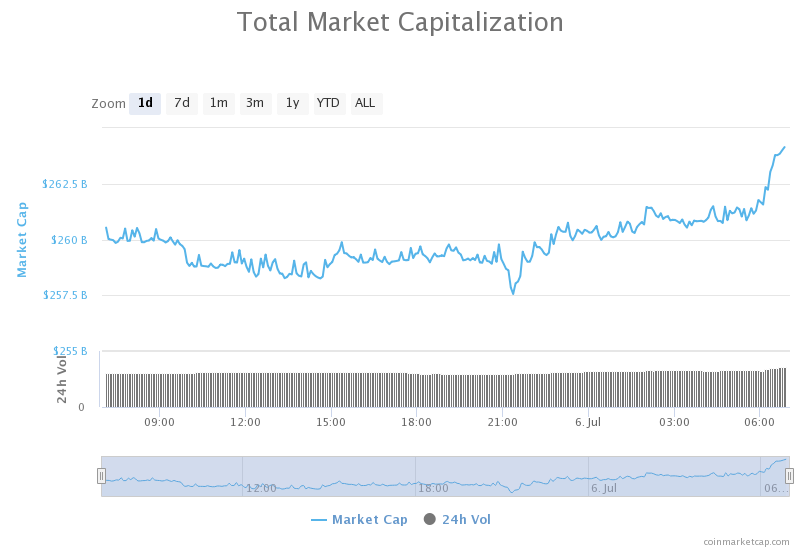
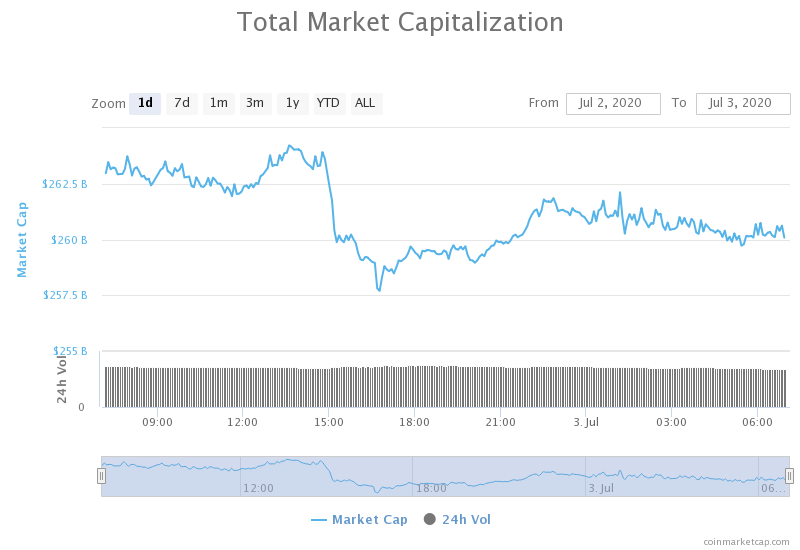
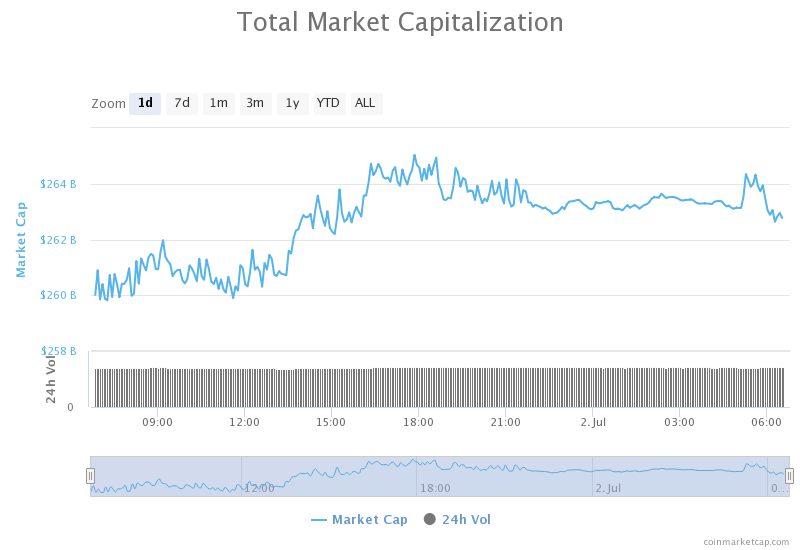
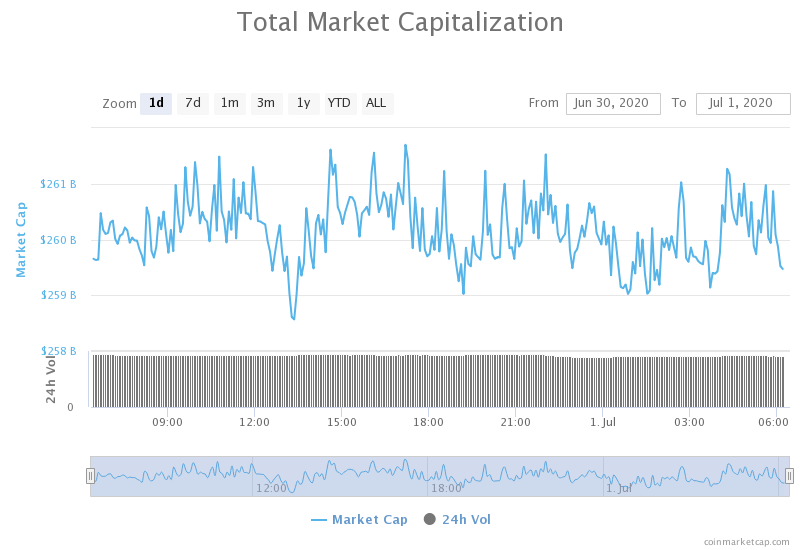
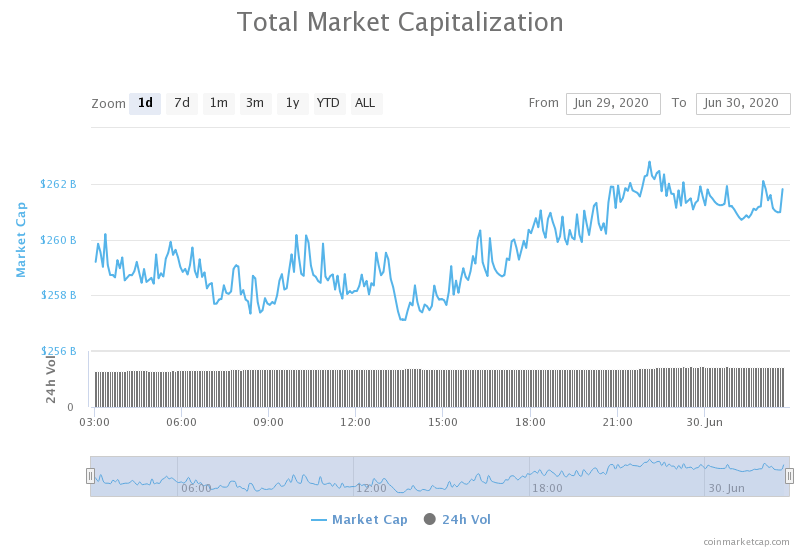
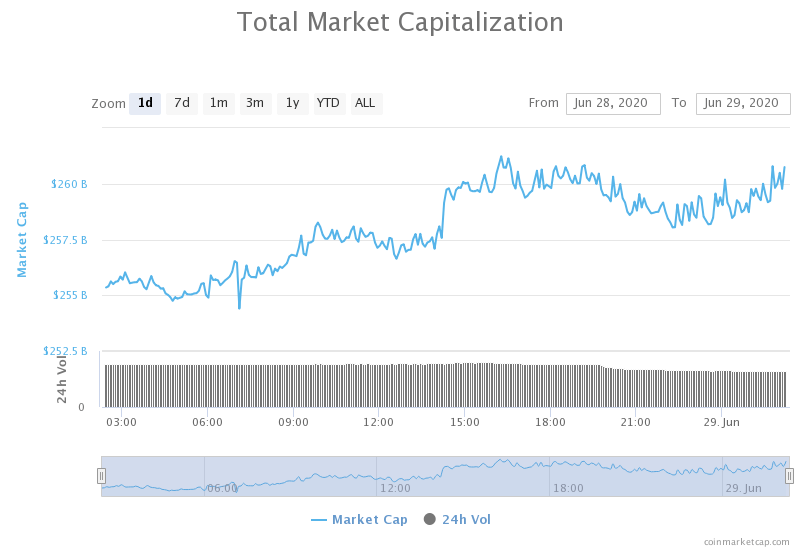
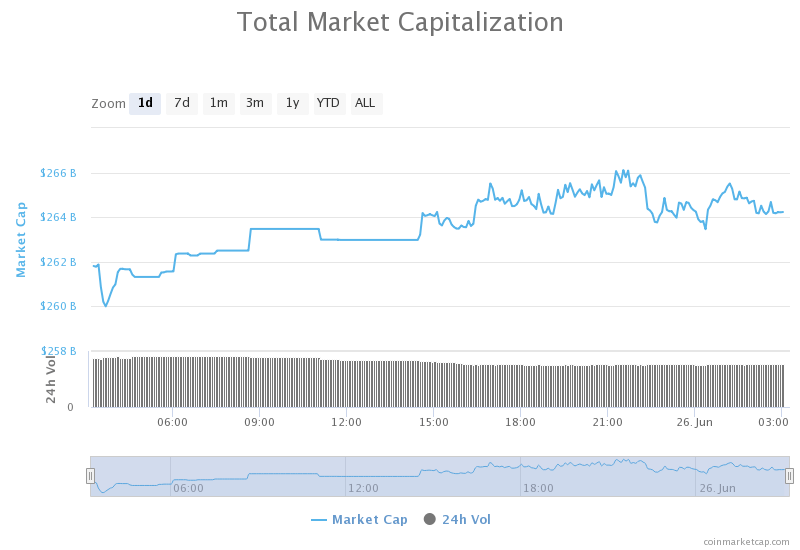
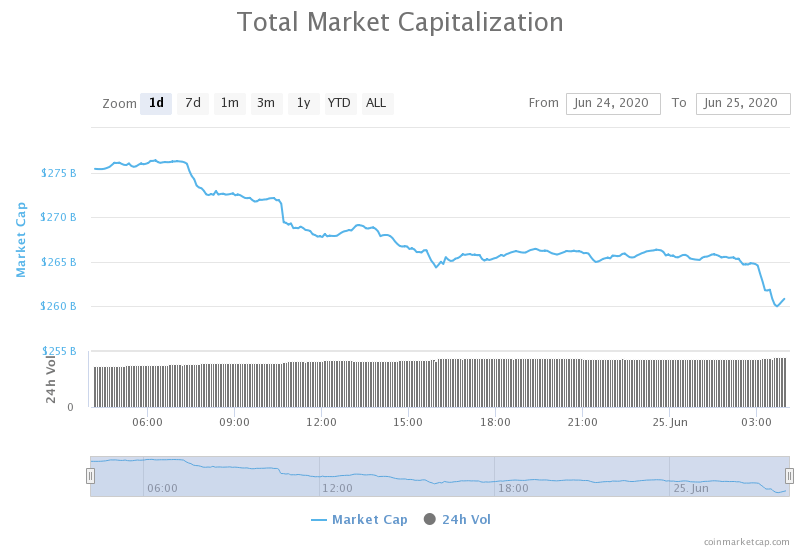
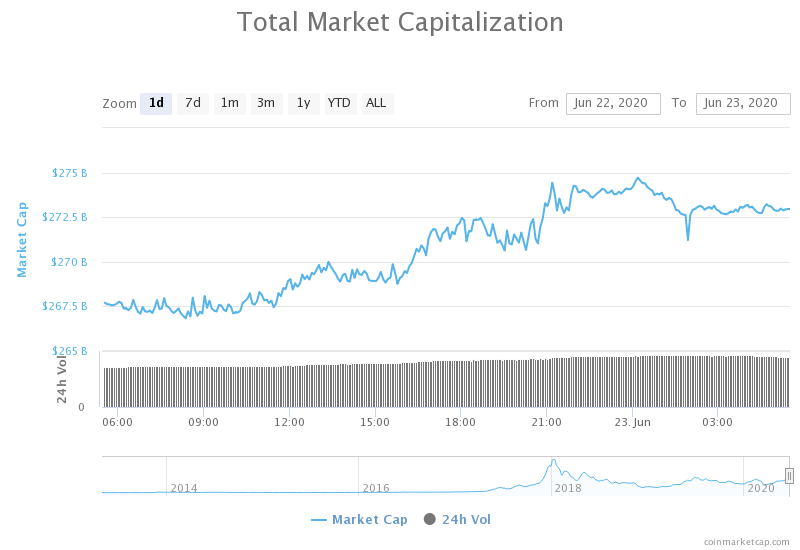
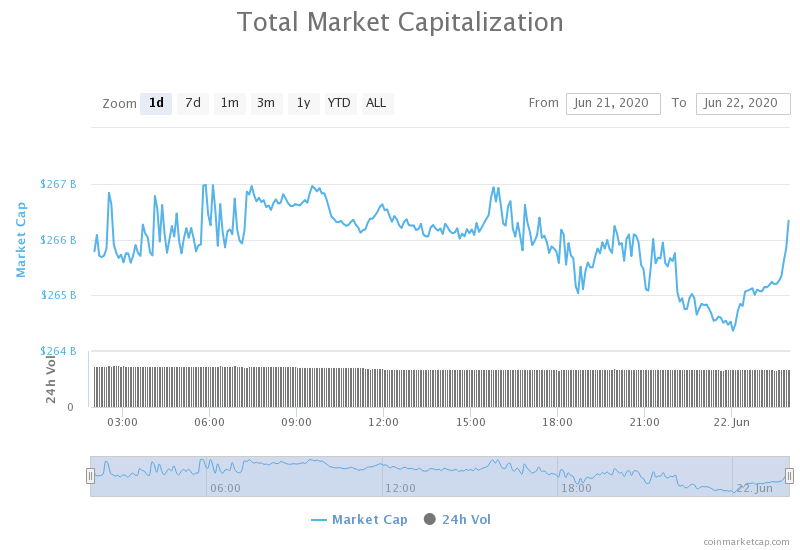
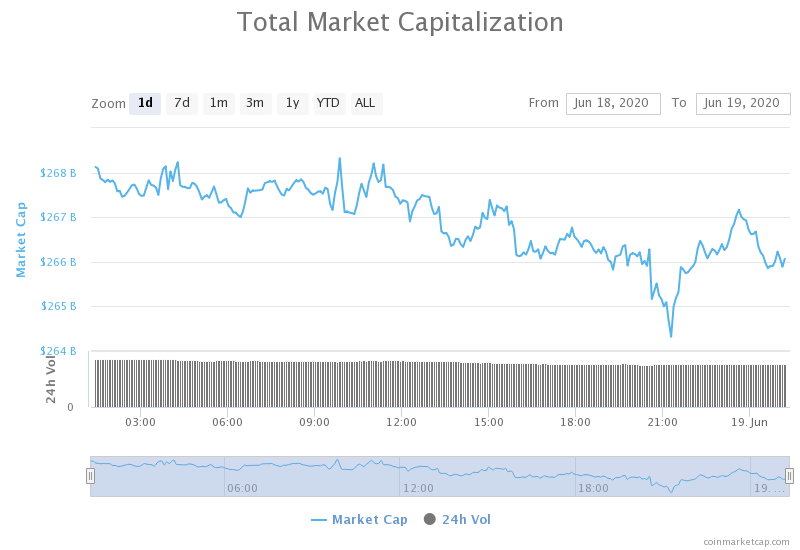
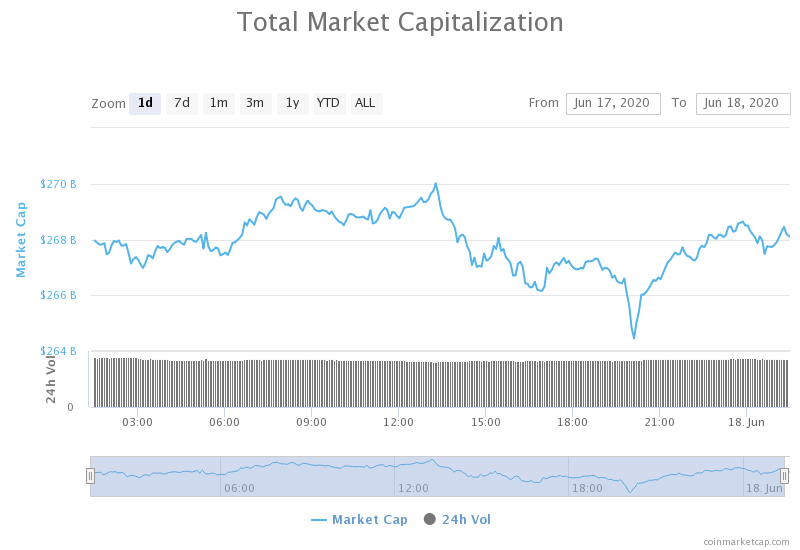
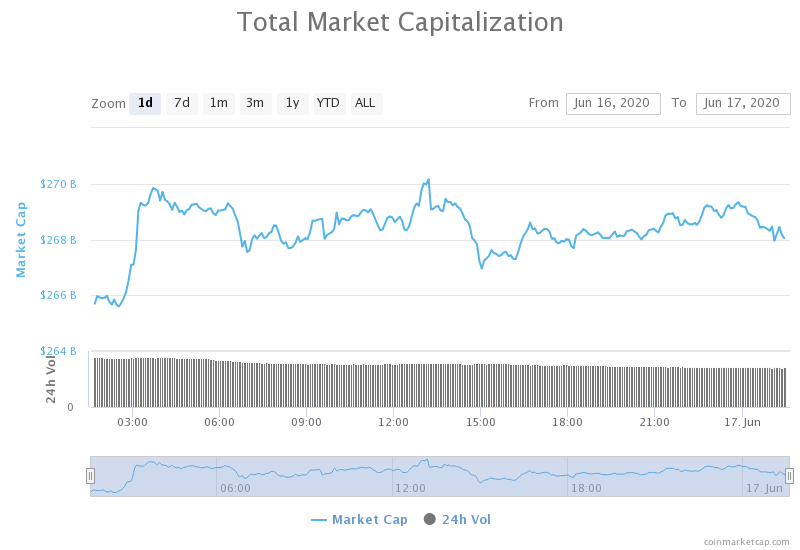
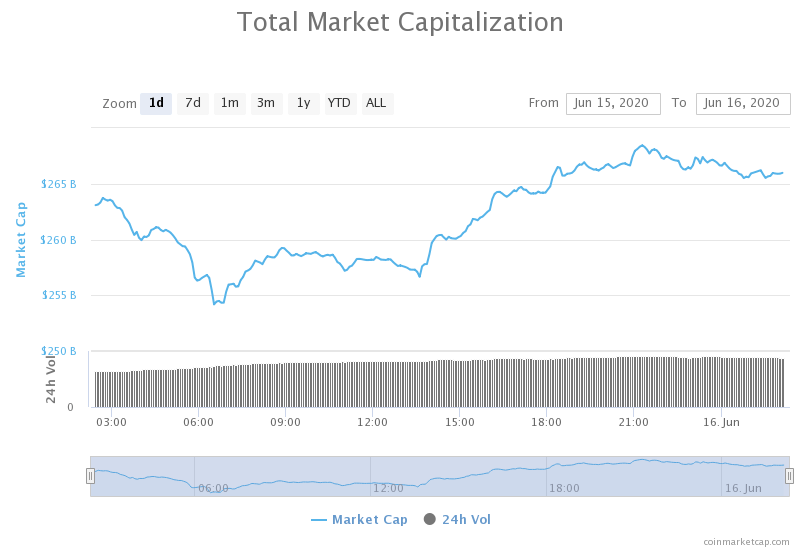
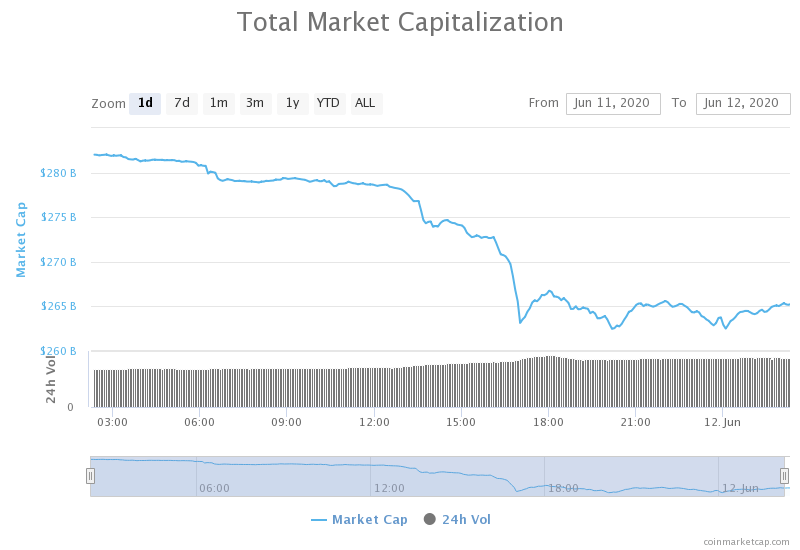
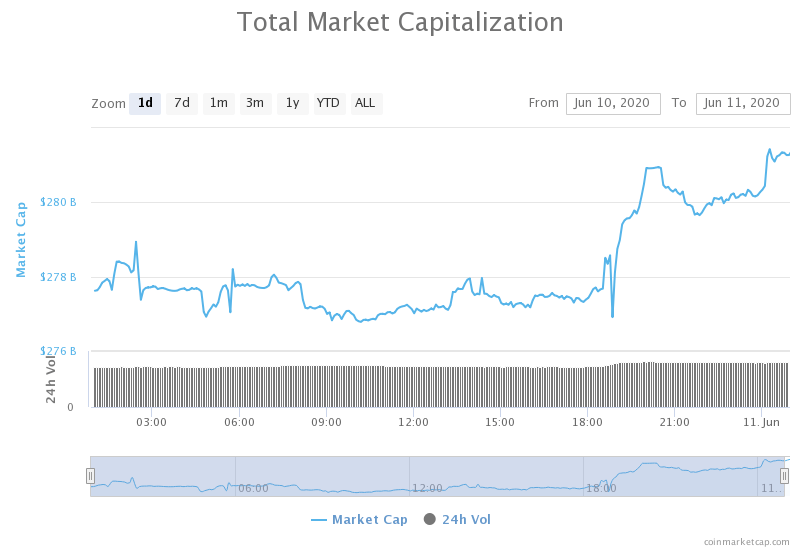
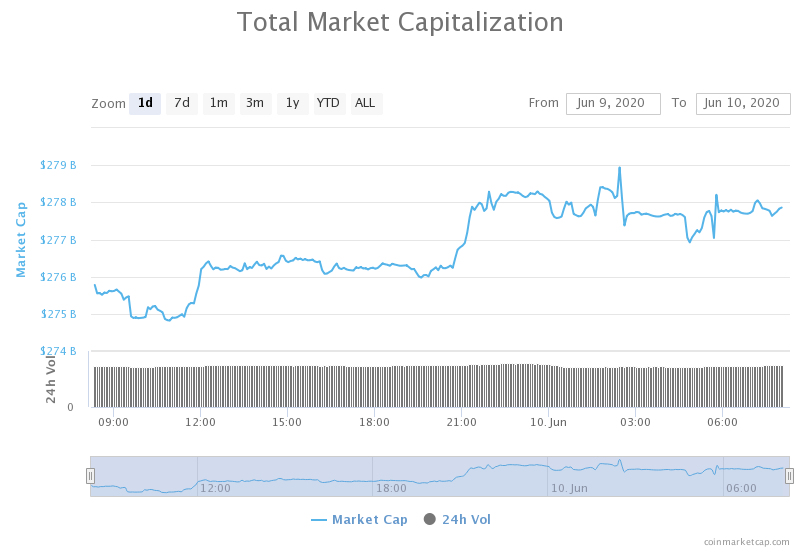
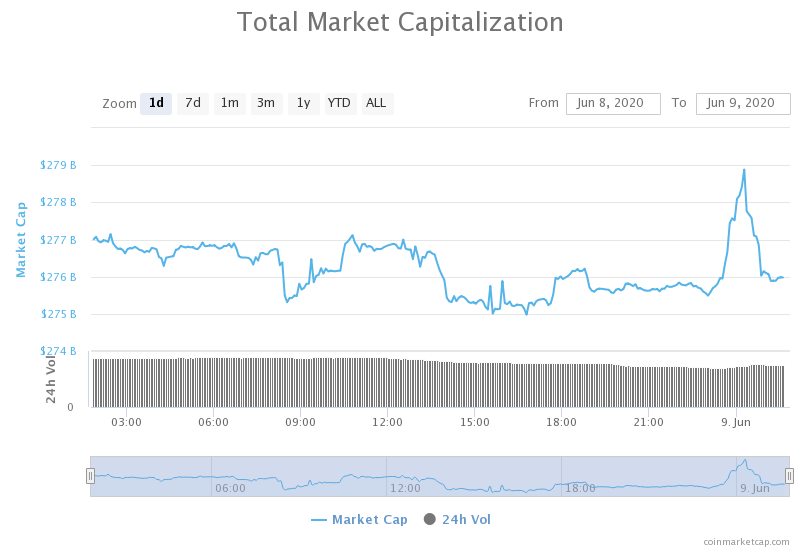
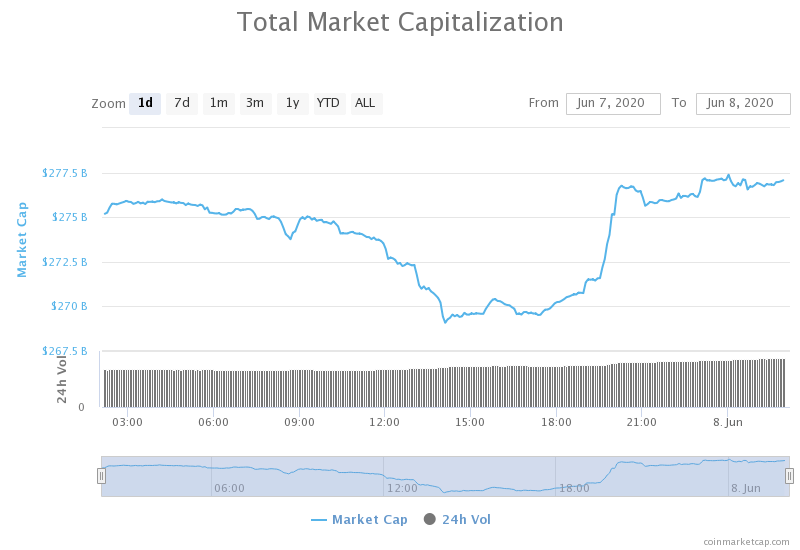
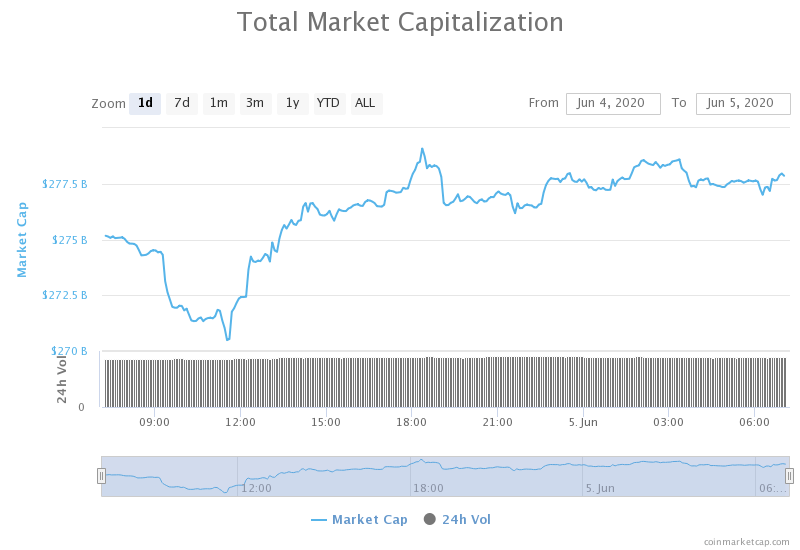
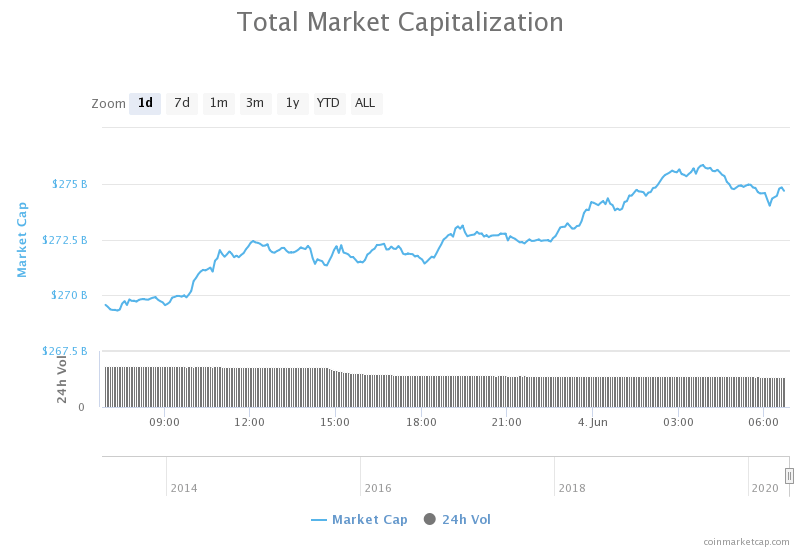
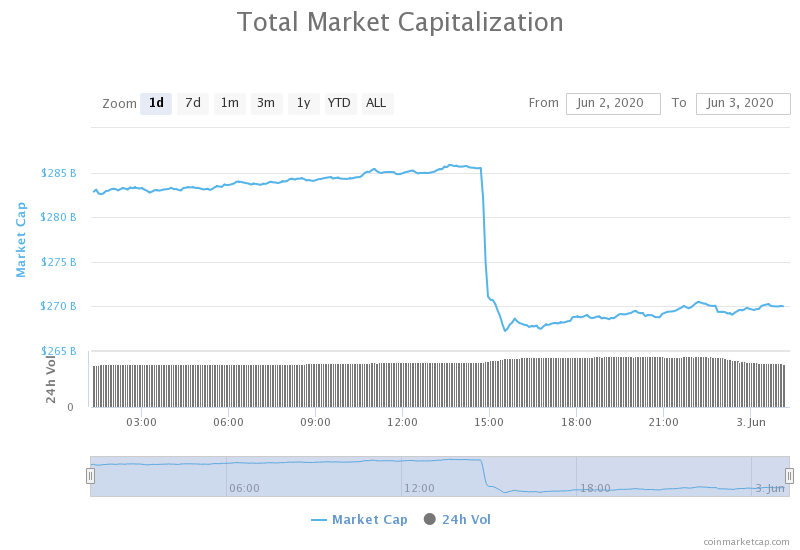
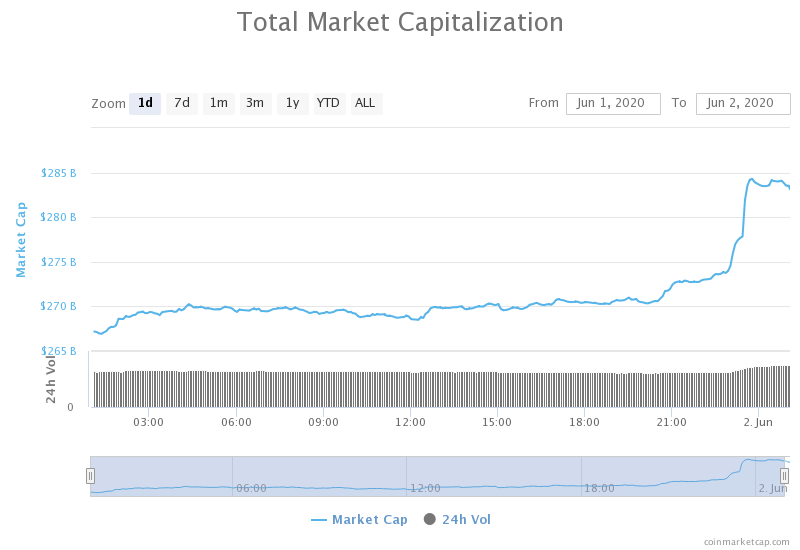
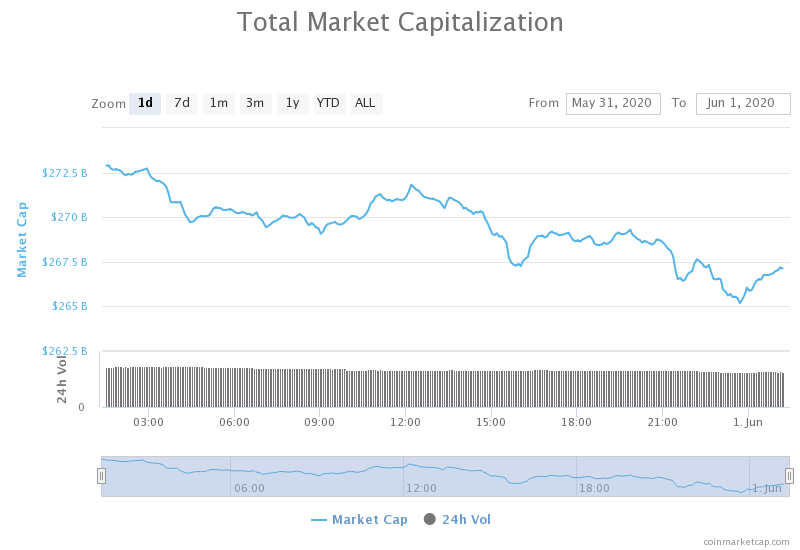
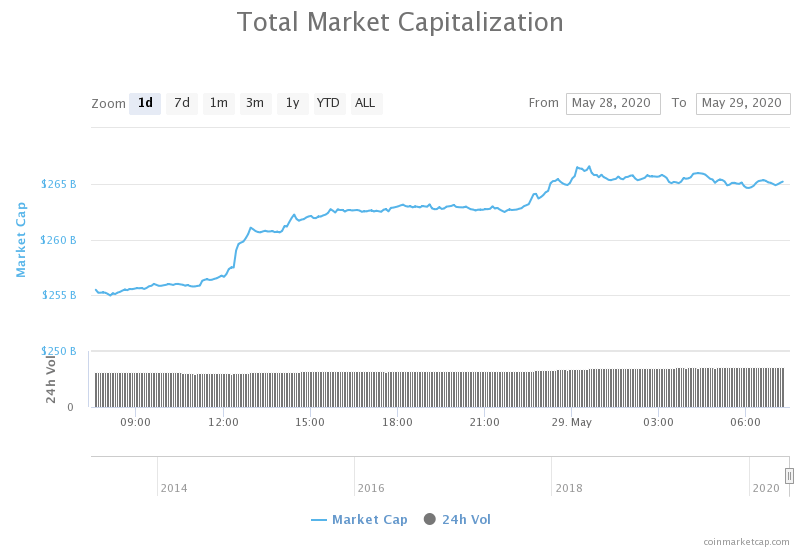
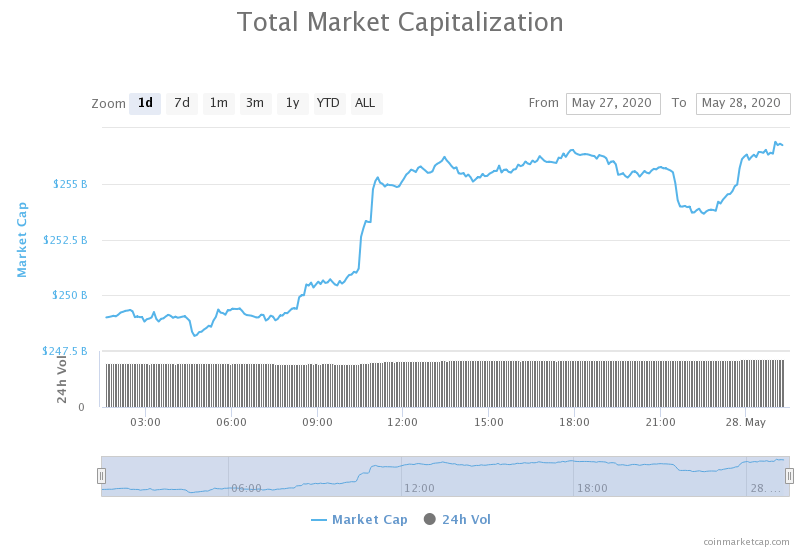
Daily Crypto Market Cap Chart
The cryptocurrency market capitalization skyrocketed and broke the $300 billion mark. Its current value is $300.47 billion, which represents an increase of $13.24 billion when compared to the value it had on Friday.
_______________________________________________________________________
What happened in the past 24 hours?
_______________________________________________________________________
- Clear Governance Key for Enterprise Blockchain to Move Forward (Cointelegraph)
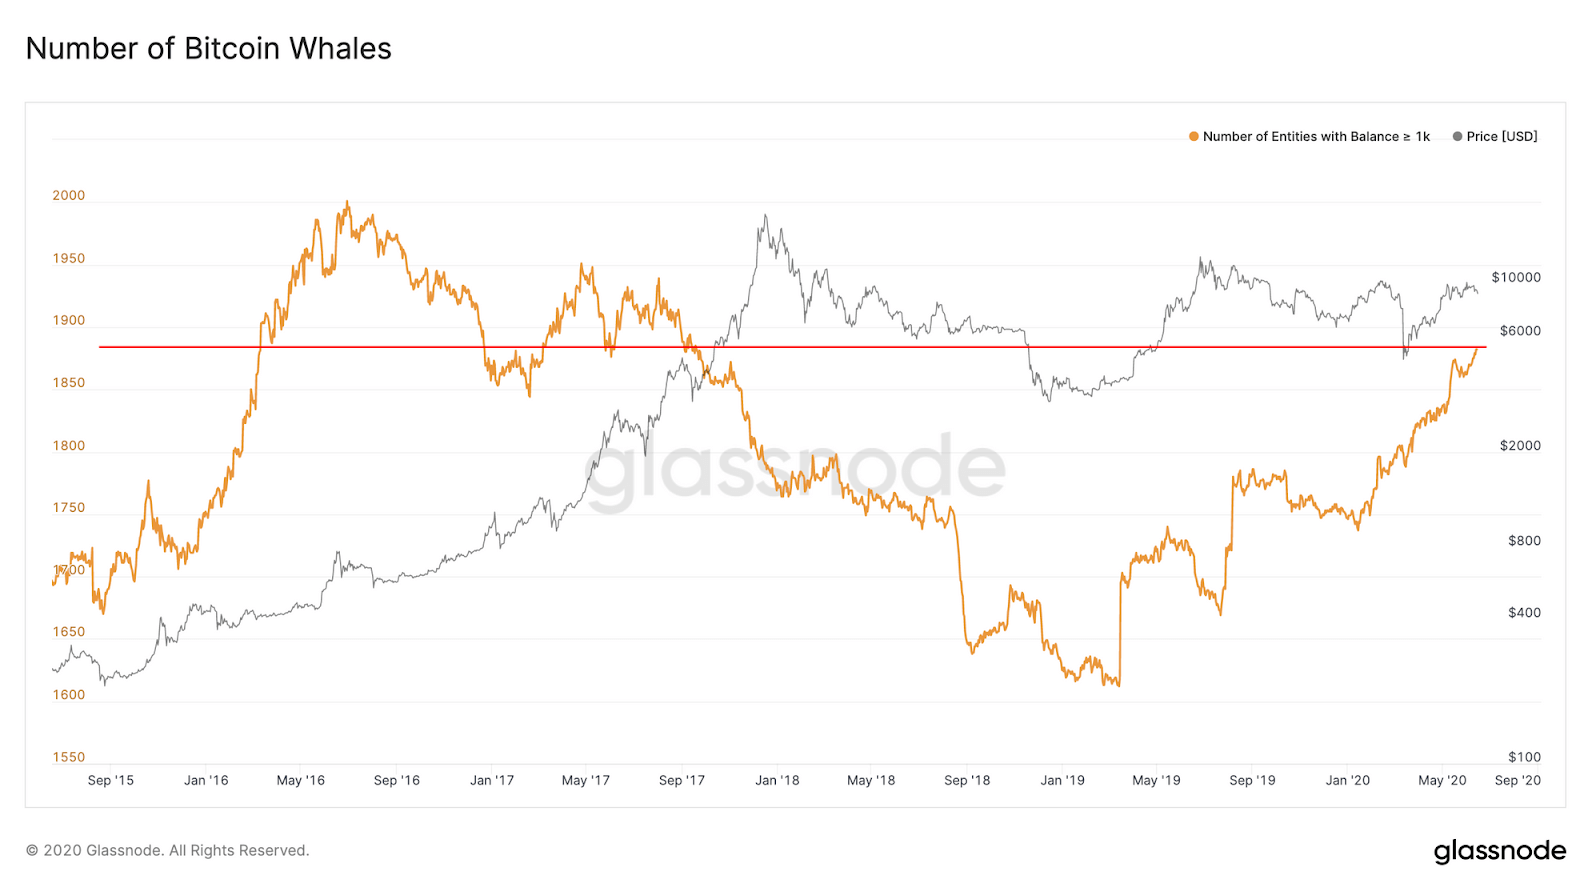
- Bitcoin Price Rally to $10K Has Not Shaken BTC Holders Yet — Data Shows (Cointelegraph)
- Gaming Industry Use of Blockchain May Lead to Mass Adoption (Cointelegraph)
- Money Reimagined: China’s ‘Cold War’ Blockchain Strategy (Coindesk)
- Banks Won’t Rush to Hold Crypto – But OCC’s Regulatory Approval Makes It Harder to Ignore (Coindesk)
- A new Ethereum DeFi token is literally up 100,000% in a week: VC (Cryptoslate)
- DeFi Testing Ethereum’s Transaction Limits, These Solutions Offer Hope for Scaling (Cryptobriefing)
- Visa, Mastercard Won’t Issue Their Own Cryptocurrencies (Cryptobriefing)
- Why Ethereum developers are buzzing about The Graph — even though it’s still centralized (The Block)
- Coinbase’s latest institutional review reveals it has 35 million customers (The Block)
_______________________________________________________________________
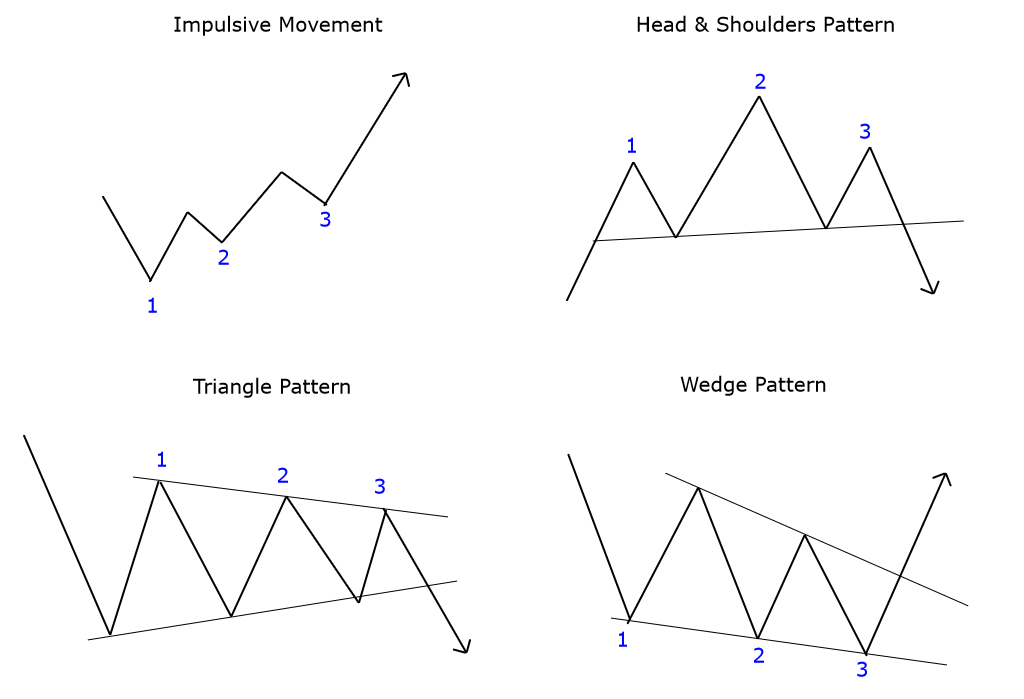
Technical analysis
_______________________________________________________________________
Bitcoin
The largest cryptocurrency by market capitalization had an amazing weekend, which ended with it breaking the $10,000 mark. Bitcoin experienced a steady increase in price for six days now, slowly breaking each obstacle in its path. The final move, which broke $10,000, was a bit hectic as the wall of sellers kept the price down for quite a bit. Bitcoin is now held from going up by the ascending resistance level. However, the “battle” for $10,000 is not over yet, as Bitcoin did not make a strong confirmation move.
BTC traders should look for a trade opportunity after BTC decides whether it will move above or below $10,000.
BTC/USD 4-hour Chart
Technical factors:
- Price is currently above its 50-period EMA and its 21-period EMA
- Price is above its top B.B.
- RSI is in the overbought territory (76.57)
- Volume Increased
Key levels to the upside Key levels to the downside
1: $10,015 1: $9,870
2: $10,505 2: $9,735
3: $10,855 3: $9,580
Ethereum
Ethereum, just like Bitcoin, made some amazing gains as well as broke major resistance levels over the course of the weekend. The second-largest cryptocurrency by market cap spent the past five days rising sharply towards the upside due to its booming fundamentals. The weekend ended with Ethereum moving past $300 and pushing to $325, with the move still continuing. With the RSI being heavily overbought and volume slowly declining, traders can expect the move to end soon.
Ethereum traders should look for a trade opportunity in Ethereum’s pullbacks from the big move towards the upside.
ETH/USD 4-hour Chart
Technical Factors:
- Price is above the 50-period EMA and the 21-period EMA
- Price is above the top B.B.
- RSI severely overbought (82.86)
- Extremely high volume
Key levels to the upside Key levels to the downside
1: $340 1: $302
2: $362 2: $289
3: $278
Ripple
The third-largest cryptocurrency by market cap had a good weekend, though not quite as good as Bitcoin and Ethereum. XRP established its position above $0.214, which is a great mid-term indicator. While the initial bullish move got stopped by the $0.227 and XRP started moving towards the downside, the current position XRP is in is quite good.
XRP traders can look for an opportunity within the range XRP is currently trading in.
XRP/USD 4-hour Chart
Technical factors:
- XRP in a mid-term descending trend (though it broke the trend in the short-term)
- Price above 21-period and the 50-period EMA
- Price is below the top B.B.
- RSI is elevated (64.47)
- Average/slightly higher than average volume
Key levels to the upside Key levels to the downside
1: $0.227 1: $0.214
2: $0.235 2: $0.205
3: $0.245 3: $0.2