Categories
Forex Market Analysis

Safe Haven Gold on Fire – Triangle Pattern Breakout! 

During the early U.S. session, the safe-haven-metal prices extend its 3-day winning streak and rise to a 4-day high level of $1,718.35 while taking rounds to $1,716.50, mainly due to the depressing speech U.S. Federal Reserve Chair Jerome Powell about the economic downturn. Despite the Federal Reserve policymakers’ refusal for the negative rate, the yellow-metal continued to take bids as the U.S. President Donald Trump renewed calls for the negative Fed rates. 

The US-China intensifying tension and the risk of coronavirus second wave also weighed on the risk sentiment, which eventually supported the safe-haven assets like gold. At this moment, the safe-haven-metal prices are currently trading at 1,716.21 and are consolidating in the range between 1,711.21 and 1,719.80.

The Federal Reserve Chair Powell said that negative interest rates were not needed yet. In the meantime, the Cleveland Federal Reserve President Loretta Mester said, we cannot consider “negative rates” as an excellent tool for supporting the economy. If talking about Powell’s speech, the Federal Reserve’s chairman warned about the scope and speed of the continuing economic downturn while comparing the recession pace with the World War II recession. 

The reason behind the risk-off market sentiment is the US-China tussle. It would be worth mentioning that the recent aggressive words from China came after U.S. President Trump directed the board of Federal retirement savings fund to stop investing in the Chinese stocks.


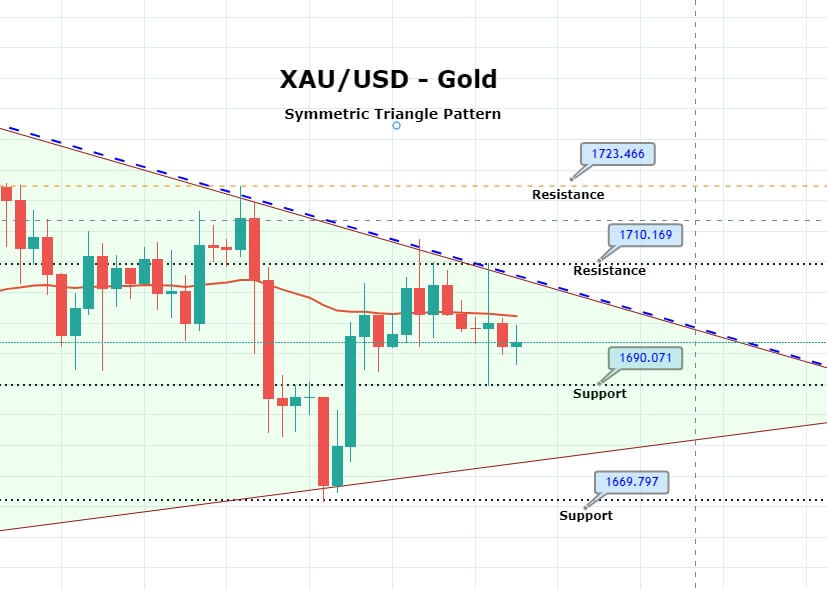
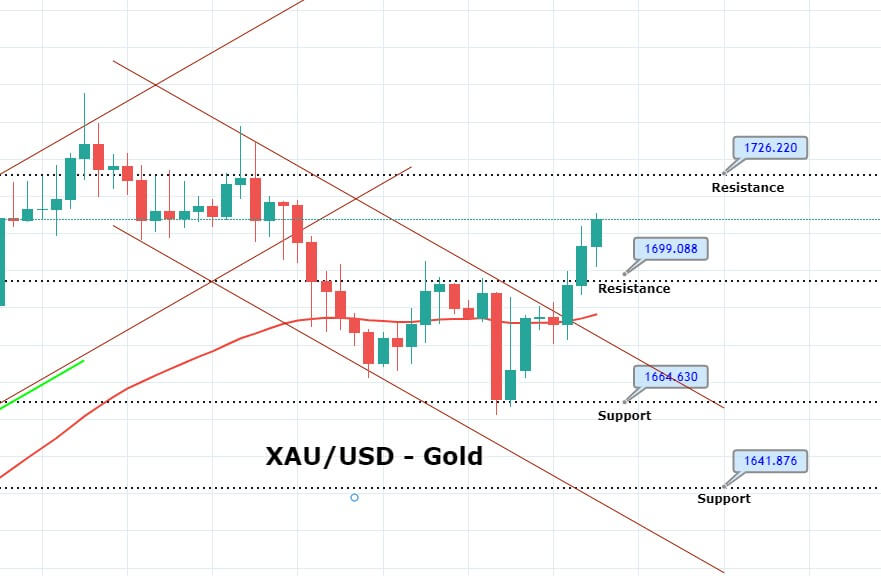
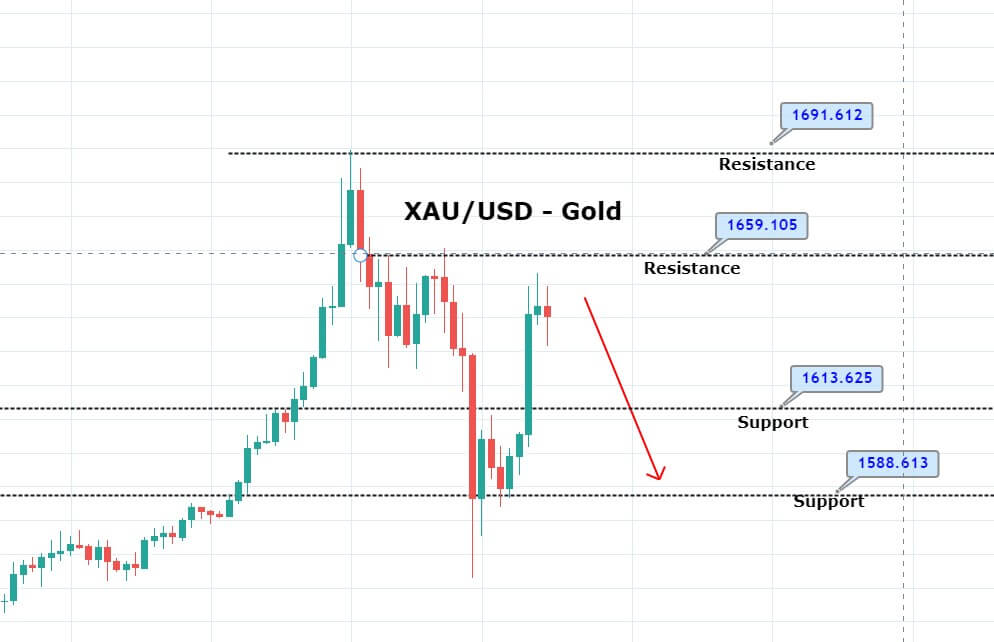
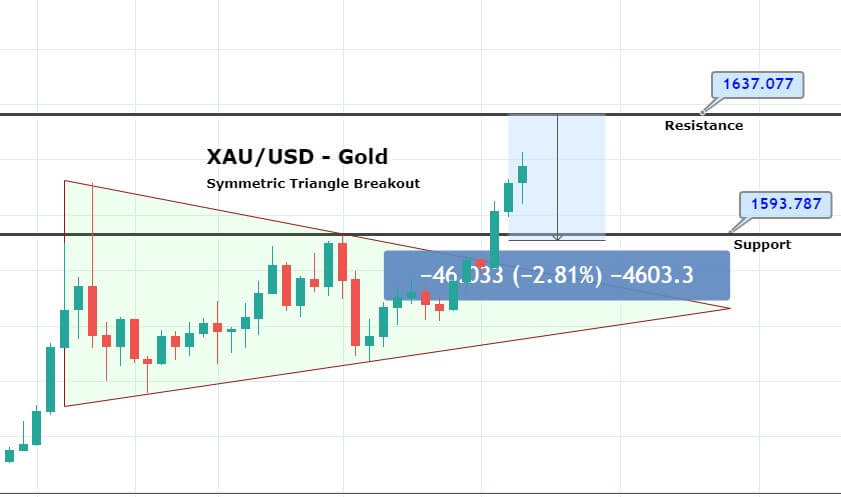
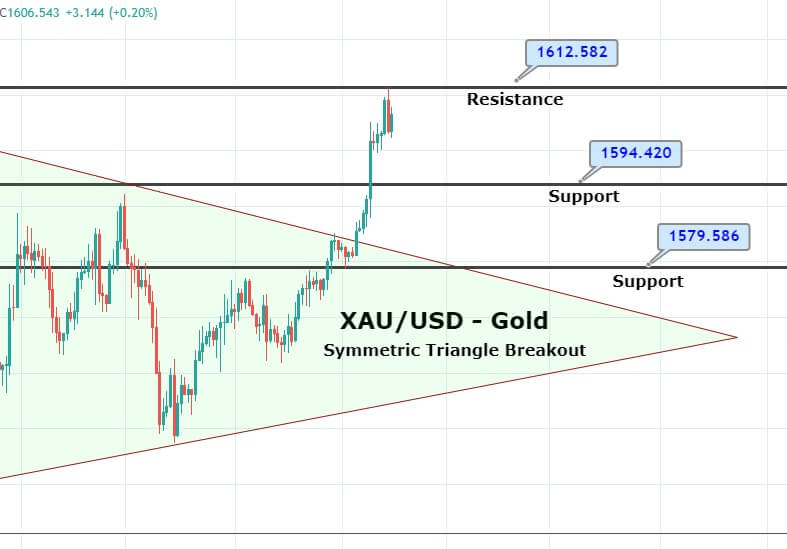
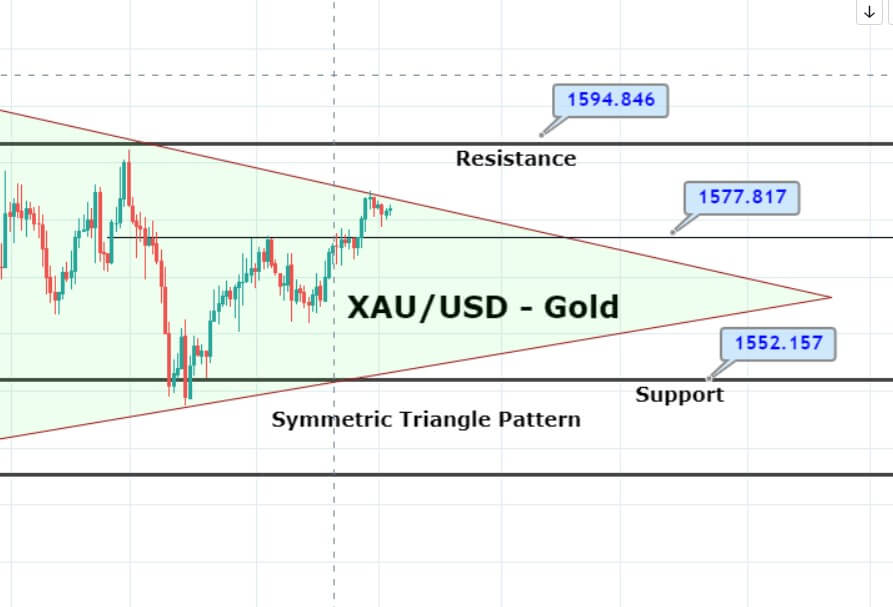
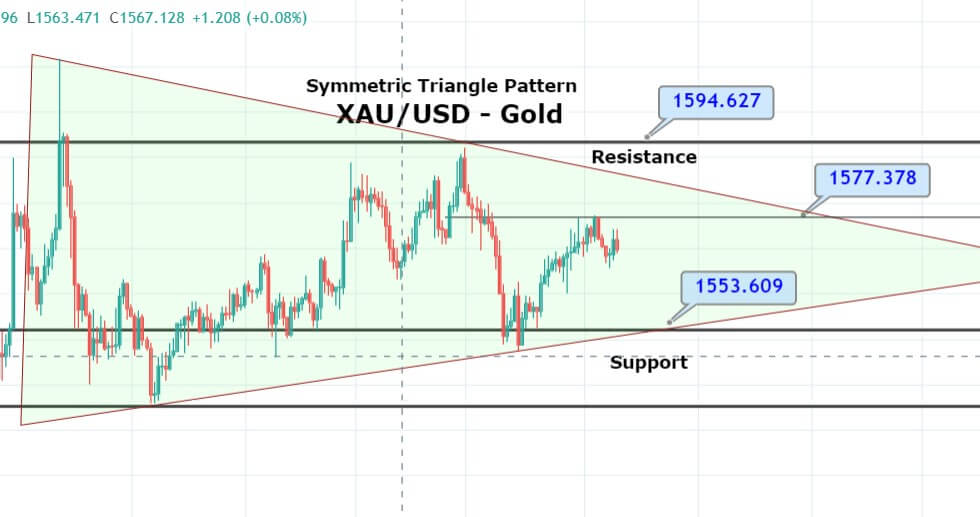
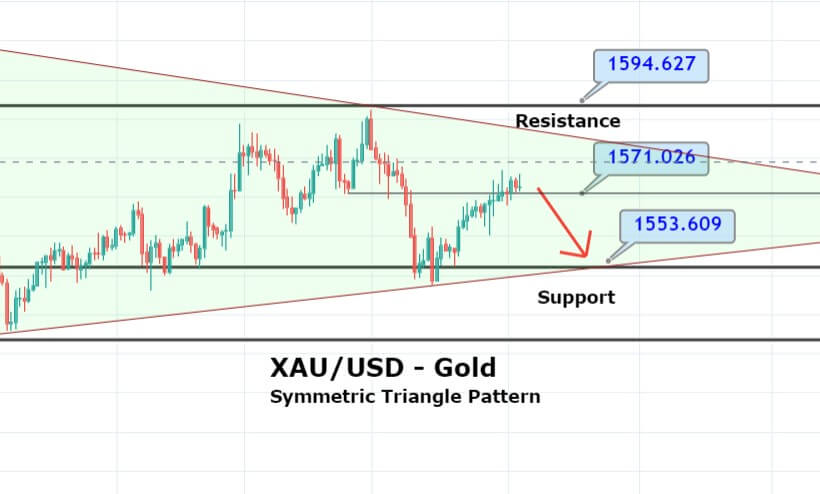
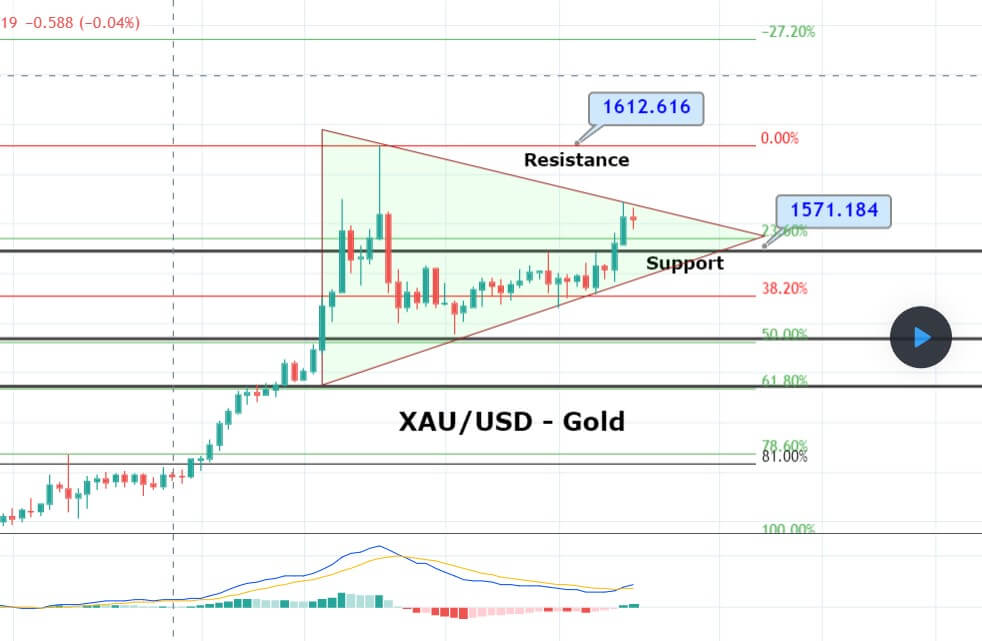
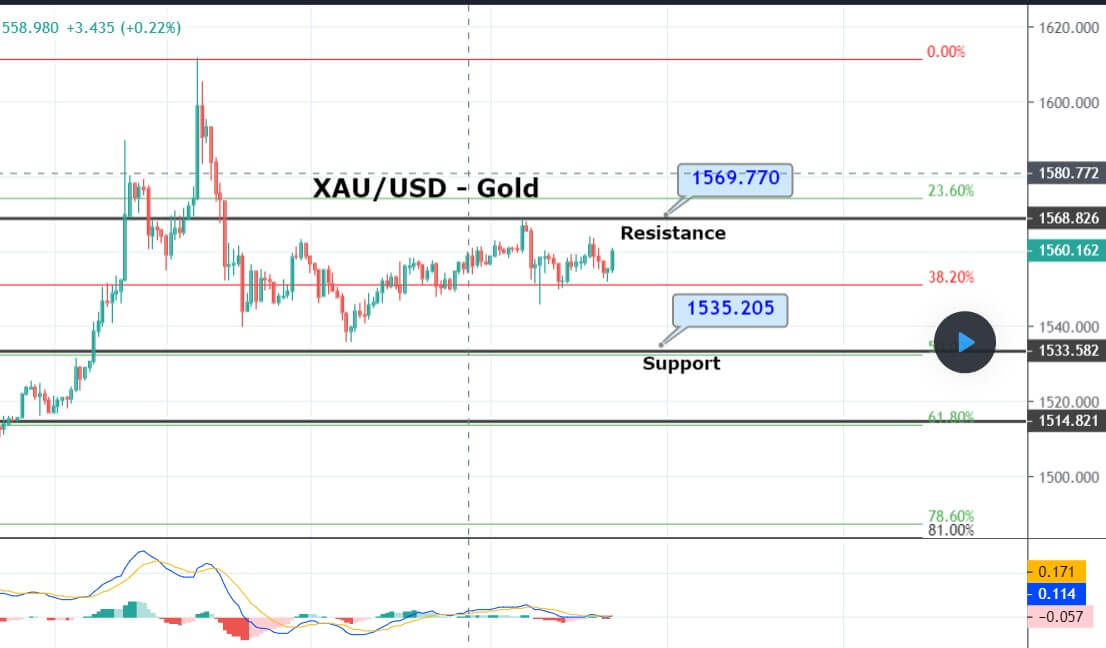
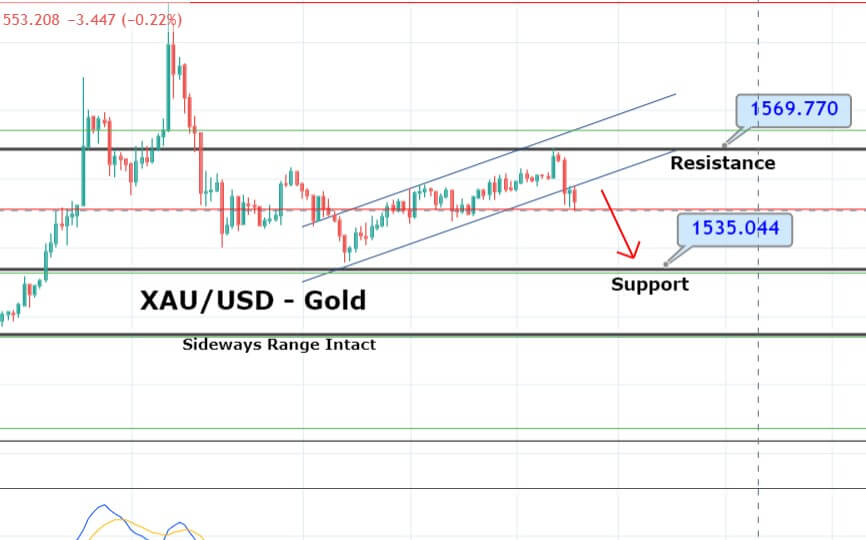
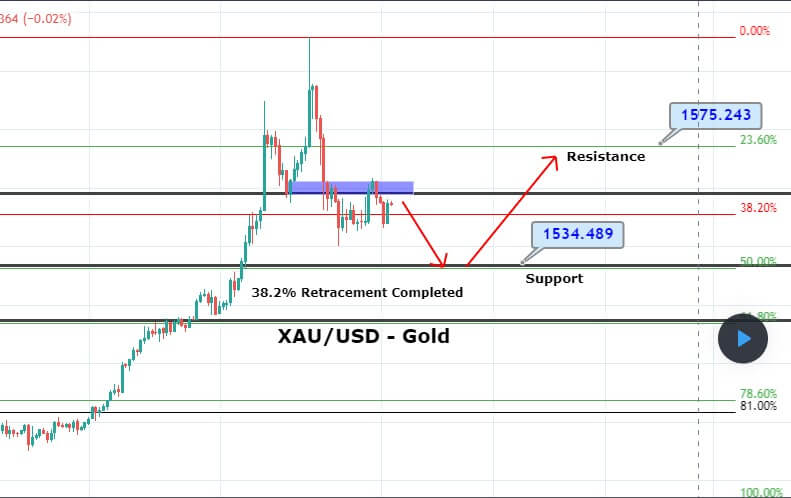
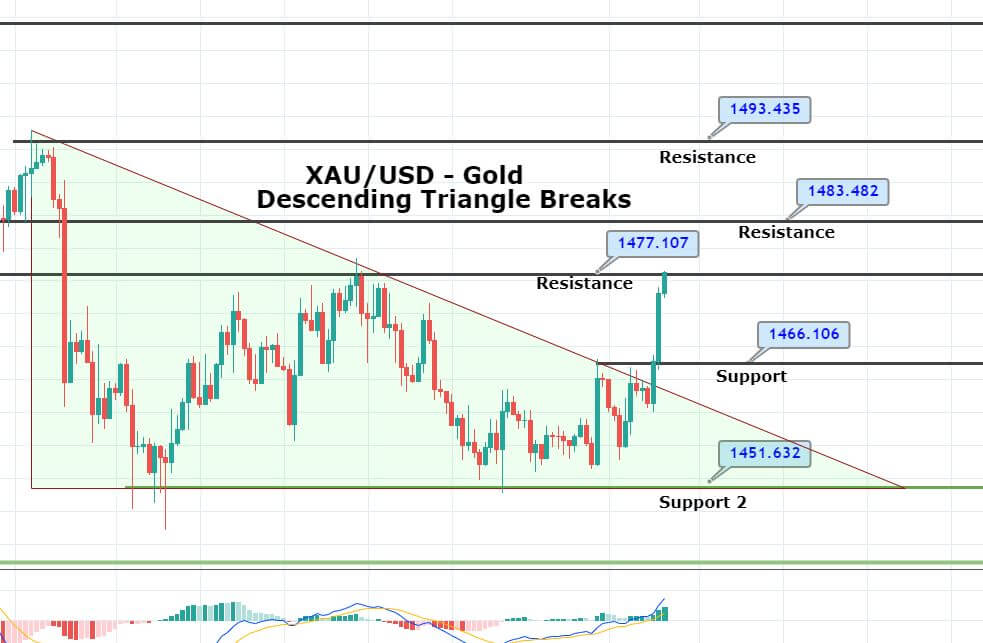
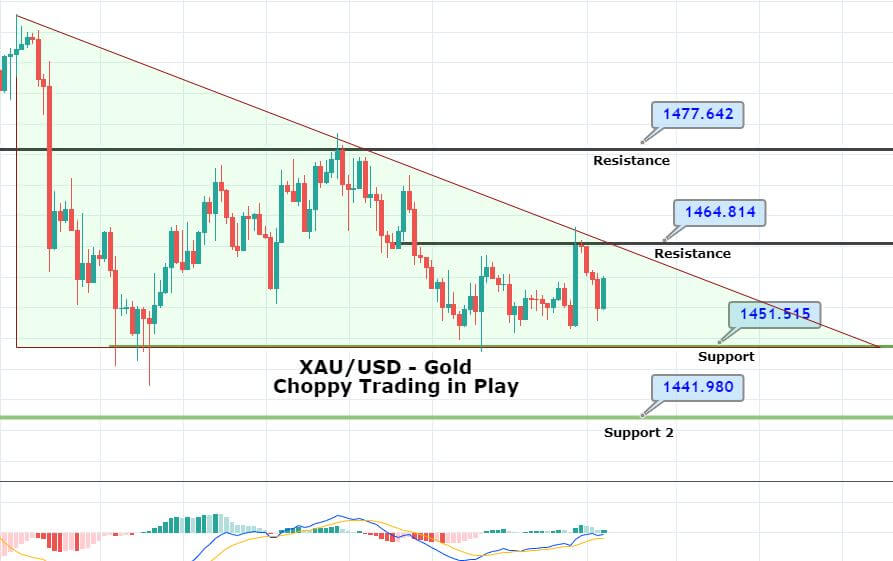
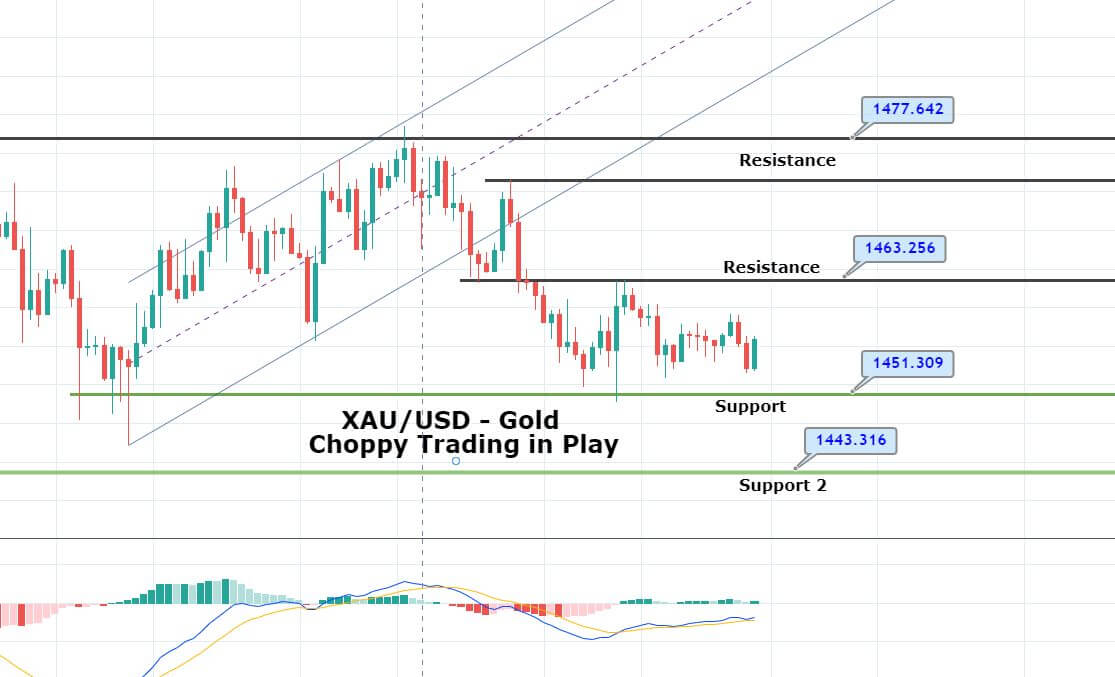
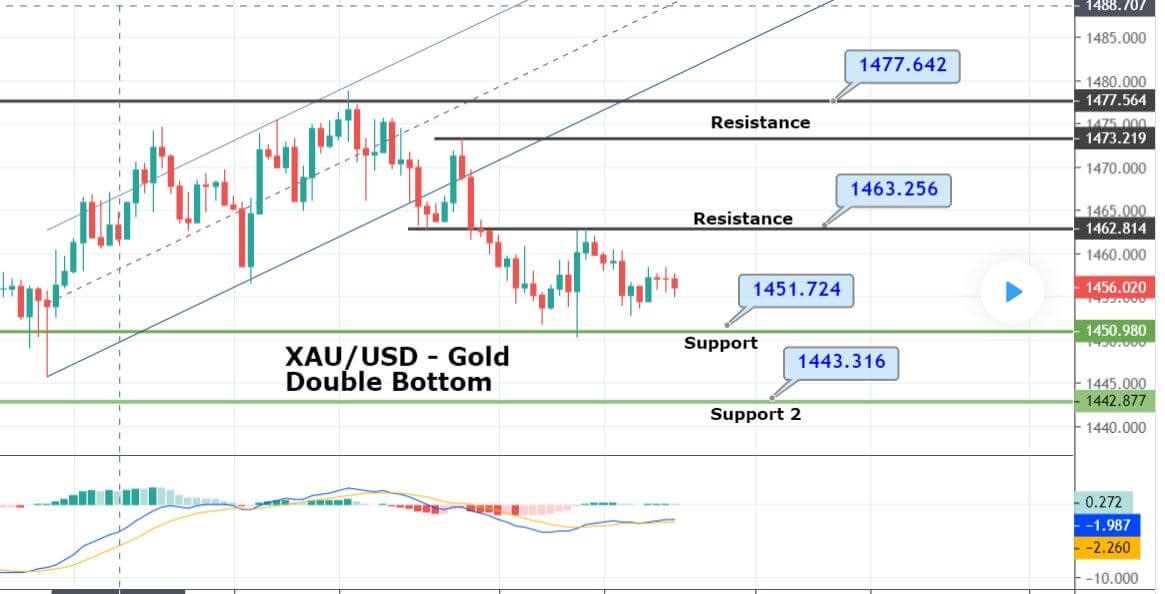
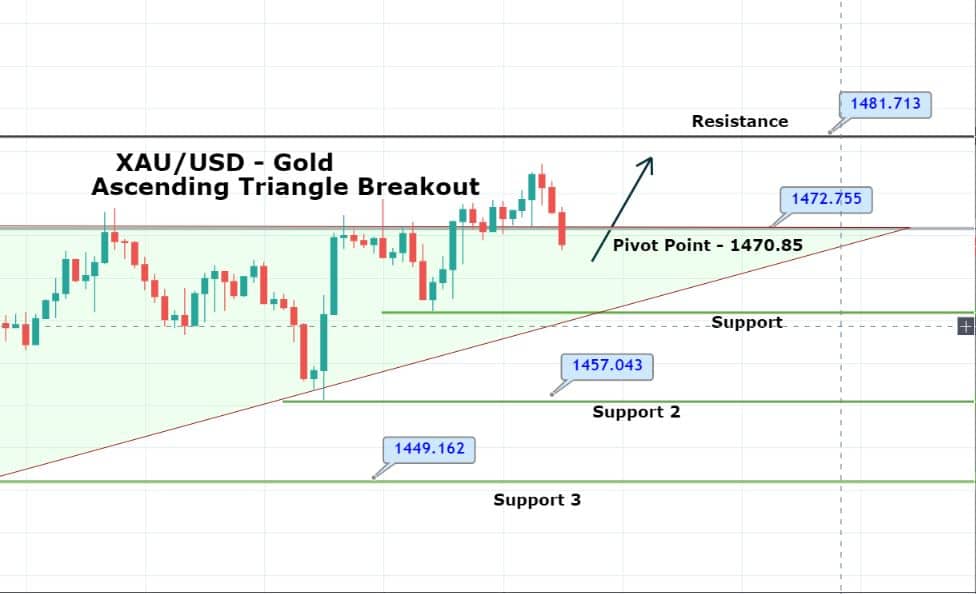
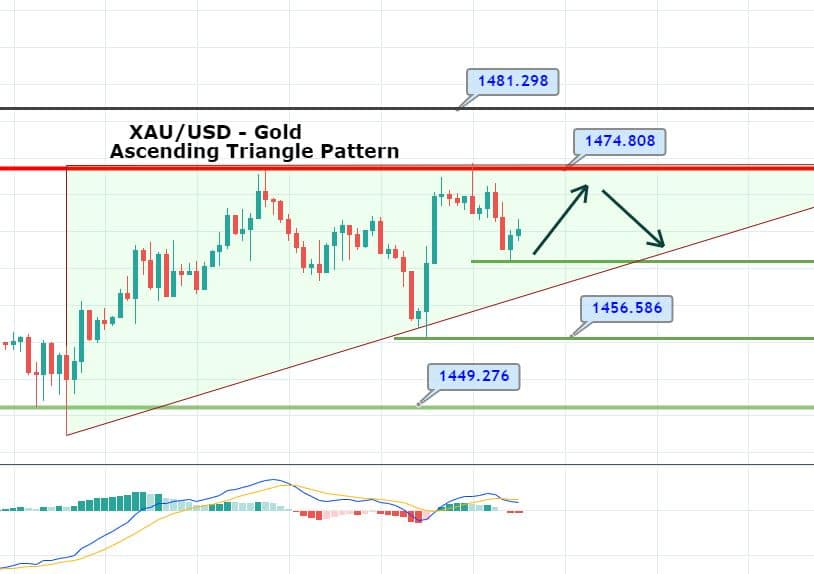
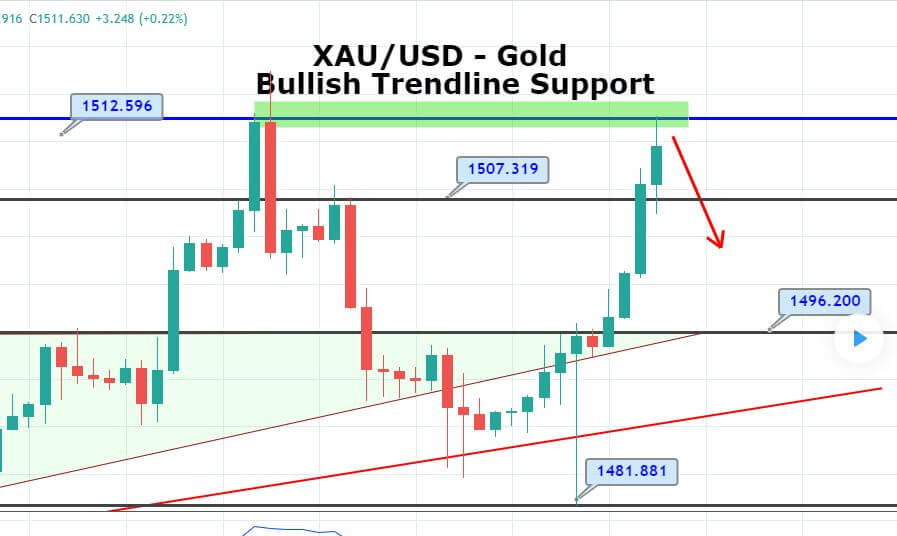
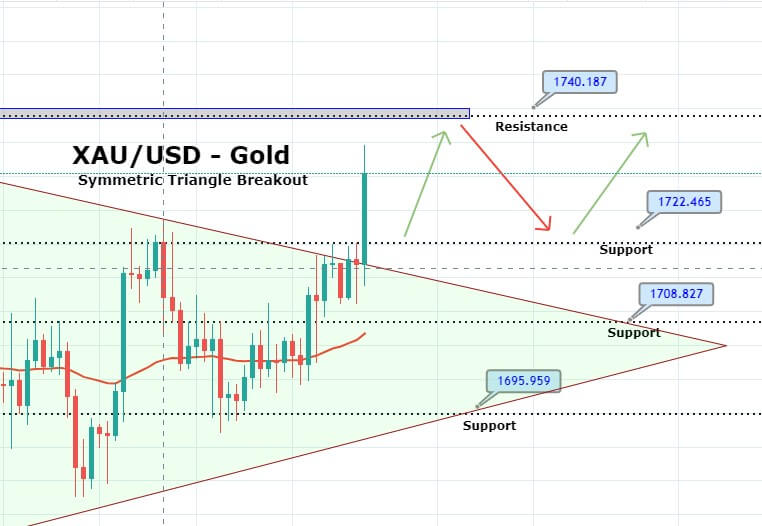
Recently, the XAU/USD broke out of the symmetric triangle pattern, which was providing resistance at 1,718, and now it’s trading bullish at 1,735. The recent bullish trend in gold came in response to worse than expected Jobless claims data from the U.S. As per the U.S. labor department, the advance figure initial claims were 2,981,000, a drop of 195,000 from the prior week’s updated level is reported. A weaker dollar has triggered the bullish trend in gold, and now it’s likely to lead gold prices towards 1,740. Now, we may see bearish correction below 1,740, while further buying trades can be taken above 1,720. All the best! 

Categories
Forex Signals

Gold Symmetric Triangle Pattern – Who’s Up for Choppy Trading?  

Gold prices continue to move in a sideways trading range of 1,710 – 1,690, while the recently formed symmetric triangle pattern is stretching the trading range. The fresh trading range is likely to provide selling below 1,700 and buying above 1,680. The gold prices are exhibiting mixed bias in the wake of mixed risk sentiment as many nations have also joined the United States in this blame-game to China because of the increased number of deaths and the global economic slowdown, both caused by the coronavirus pandemic. 

Britain has asked that China would have to answer about the information it shared about the outbreak. The US is formulating measures to hold China responsible for the damage caused by the pandemic. The measures would probably be the sanctions, new trade policies, and cancelation of US debt obligations.

On the other hand, on Sunda,y the US Secretary of State, Mike Pompeo, said that there was enormous evidence that the COVID-19 pandemic was originated in the Chinese Wuhan laboratory. All of the above news indicates the need for safe-haven and hence, gold surges above $1713 on Monday. Coronavirus has infected almost 3.5M people across the globe, and governments & central banks all over the world have announced considerable monetary and fiscal measures to reduce the economic damage.

On the macroeconomic data side, at 19:00 GMT, the Factory orders of the United States showed a decline of 10.3% in the month of March, which was previously expected to be declined by 9.2%. This weakened the US dollar across the board and added in the upward movement of gold prices.


On the technical front, gold has crossed below 50 periods EMA which is providing resistance around 1,701 level. Recent close of bearish engulfing on the 4-hour timeframe suggesting investor’s bias towards selling. On the higher side, a downward trendline may also extend resistance around 1,705, and below this level, we may see selling until 1,690 and 1,683 level today. 

  • Entry Price: Sell at 1695.83    
  • Take Profit 1683.83
  • Stop Loss 1705.83    

Risk/Reward 1.20

  • Profit & Loss Per Standard Lot = -$1000‬‬/ +$1200‬
  • Profit & Loss Per Micro Lot = -$‭‭100/+$120
Categories
Forex Market Analysis

Gold Descending Triangle Pattern Weights – Quick Sell Setup! 

The safe-haven-metal prices were flashing green and were recovering gradually from the intraday low above $1,700 level, mainly due to the risk-off market sentiment in the wake of intensifying trade tussle between the United States and China. On the other hand, the positive news from Gilead about the vaccine of virus seems to have eased the coronavirus fears in the market, which turned out to be one of the key factors that kept a lid on any additional gains in the gold prices. 

At the press time, the yellow metal prices are currently trading at 1,702.27 and are consolidating in the range between 1,692.34 and 1,702.27. However, when gold slipped to $1,692.30 during the early-Asian session, it was possibly due to US dollar strength.

The good news from Gilead about coronavirus vaccine successful trials which seem to reduce the coronavirus (COVID-19) fears at the start of the week in the market. The company making the vaccine reported that it has been exporting the anti-viral drug to the United States and making it available to US patients with the help of the US government.


Daily Support and Resistance


S1 1621.49

S2 1656.9

S3 1678.78

Pivot Point 1692.32

R1 1714.19

R2 1727.73

R3 1763.15

Gold prices have closed drawing a hanging man pattern, which is keeping the precious metal gold supported 1,692 level. Closing of candles below a downward trendline may keep the gold prices bearish below 1,711 level. On the lower side, gold may find support around 1,692 and 1,681 level. Conversely, a bullish crossover of 1,717 resistance can drive buying until 1,732/36 level. Good luck! 

Categories
Forex Market Analysis

Gold’s Triple Top Resistance Weighs – 23.8% Fibonacci Retracement Holds! 

During the European session, the precious metal gold was trading at 1,718 area. Technically, gold entered the overbought zone and showed a slight bearish retracement at 1,718 region, which marks 23.8% Fibonacci retracement level and can be seen on the chart below. 

As per the latest report from the Centers for Disease Control and Prevention (CDC), the number of COVID19 virus cases rose to 52,459 against the previous day’s 50,439, while the cases surged to 928,619 against 895,766. Despite this, the demand for safe-haven gold is getting hit as investors seem to do profit takings ahead of exhibiting a further bullish bias.

The positive mood around the equity market failed to impressed buyers, which normally weakens the Japanese yen’s safe-haven demand. The reason behind the risk-on market sentiment could be the hopes for the re-start the economy. The certainty about the drug trials for the treatments of the deadly disease keeps the market calm.

Gold – XAU/USD – Daily Technical Levels

Support Resistance 

1,732.65   1,748.95

1,722.9     1,755.5

1,716.35   1,765.25

Pivot Point 1739.2

On the 4 hour timeframe, the precious metal gold has formed a bearish engulfing candle, which is suggesting odds of selling trend in the market below the 1,718 area. Since the overall trend seems bullish, we will try to capture quick sell in gold as soon as gold closes below 1,718, which is 23.8%, and violation of 1,718 level can open further selling until 1,708, which marks 38.2% retracement. Let’s look for selling positions below 1,728 and buying above 1712. Good luck! 

Categories
Forex Signals

Overbought Gold Closes Bearish Engulfing – Brace to Sell! 

During the Asian session, the precious metal gold was trading at 1,713 area. Technically, gold has entered the overbought zone, and it may help show us a slight bearish retracement below 1,718 area until 23.8% Fibonacci retracement level of 1,705 before showing further bullish trends in the market. 

Overall, the fundamental side of the market is suggesting a bullish bias for gold as it’s price soared as much as 1.9% a day before. Most of the bullish bias was seen in the wake of sentiments of additional fiscal and monetary stimulus measures amid massive economic collapse due to stay-at-home and business abandonment orders around the world to restrict the spread of the novel coronavirus.


On the 4 hour timeframe, the precious metal gold has formed a bearish engulfing candle, which is suggesting odds of selling trend in the market below the 1,718 area. Since the overall trend seems bullish, we will try to capture quick sell in gold. Let’s open a sell trade at 1712.52 with a stop loss around 1720.02 and take a profit at 1705.02.

Entry Price: Sell at 1712.52

Take Profit 1705.02    

Stop Loss 1720.02 

Risk/Reward 1.00

Profit & Loss Per Standard Lot = -$‭‭750/ +$750

Profit & Loss Per Micro Lot = -$75/ +$‭75

Categories
Forex Market Analysis

Risk-off Sentiment Triggers Buying in Gold – Channel Breakout

During Wednesday’s European session, the safe-haven metal prices climbed over $1,710 mark mainly because the stocks are reporting losses due to the sharp decline in the oil prices. The intensifying coronavirus fears also keep the gold prices higher as high safe-haven demand in the market. 

The gold is currently trading at 1,710, and it has violated the previously traded consolidation range between the 1,696.20 – 1,713.50. One of the major reasons behind such a dramatic bullish trend is lashing red for a second day due to oil futures dropping in the previous session. The yellow metal is witnessing its prices restore its inverse relationship with stocks because investors prefer safe-haven assets in the wake of coronavirus fears.

At the oil front, crude oil, which started this year near $61, dropped into the negative territory earlier this week due to the oversupply concerns in the wake of coronavirus pandemic, which has caused demand destruction of oil. The risk sentiment is getting worse day by day while the US 10-year Treasury yields declined by 2-basis points (bps) to 0.55%, after dropping 4-bps on Tuesday, while the most stocks in Asia-Pacific flashing losses by the pres time.


Gold – XAU/USD – Daily Technical Levels

Support Resistance 

1,672.4     1,703.07

1,660.04   1,721.39

1,629.37   1,752.07

Pivot Point 1,690.72

Technically, gold is showing sharp bullish movement as its prices are going towards 1,726, while the support stays around 1,700 and 1,710 level. Gold is also forming three white soldiers pattern on the 4-hour chart, which is suggesting chances of a bullish trend continuation in the market. The 50 EMA is suggesting bullish trend continuation, so we should probably look for buying trades above 1,710 level to target 1,726 level. Good luck.  

Categories
Forex Market Analysis

Gold Bullish Correction – Is It Good Time to Go Long?

On Monday, the precious metal gold edged higher from a more than one-week low hit earlier, helped by dwindling share markets as U.S. crude prices plunged and concerns about coronavirus-linked economic damage persisted.

The reason behind the fresh risk-off market sentiment is the rise in the coronavirus (COVID-19) driven death numbers from the U.S. and the U.K. The U.S. President Donald Trump’s indirect attack on China’s struggles to stop the coronavirus outbreak also pushes the risk-off.

On the flip side, U.S. President Donald Trump showed some willingness to deliver another relief plan while also pushing for an economic re-open program but failed to extend the Friday’s risk-on market sentiment. The yellow-metal got mild support earlier by the People’s Bank of China’s (PBOC) rate cut.

The U.S. 10-year Treasury yields drop more than 2-basis points (bps) to 0.634%, whereas Asian stocks also struggle. Looking forward, the traders will keep their eyes on the virus-related headlines for taking fresh directions.

Daily Support and Resistance

  • S1 1629.37
  • S2 1660.04
  • S3 1672.4
    Pivot Point 1690.72
  • R1 1703.07
  • R2 1721.39
  • R3 1752.07

Technically, gold is bouncing off above a strong support area of 1,672 to trade around 1,695 level. Closing of candles below 1,701 levels may drive some bearish correction in the market while the major resistance stays around 1,712. Below this, we may see some selling bias in gold today. The 50 EMA is suggesting buying while the MACD is suggesting selling trend, but histograms are becoming smaller suggestings chances of a bullish reversal. Let’s look for buying trades over 1,686 and selling trades below 1,712 today. Good lucK!

Categories
Forex Market Analysis

Gold Breakout Upward Channel – Can 50 EMA Support?

On Friday, the gold prices fell sharply from 1,724 level to 1,682 level as the demand for safe have assets faded after headlines from STAT news that Gilead Sciences experimental drug witnessed the fast recoveries in fever and respiratory symptoms which are linked with the coronavirus. 

Finally, there is something positive from COVID 19 viewpoint, and it helped reduce the chaos in the market, driving risk-on sentiment. As in result, the market’s risk-tone remains upbeat and supports the U.S. 10-year treasury yields to improve further and to erase the previous day’s losses, currently near 0.67%.

Whereas, the U.S. dollar continues to lose its buying momentum across the board, as the U.S. stocks futures and the Asian equities are reporting green mainly after the renewed hopes for coronavirus treatment. Thus, this extends bearish pressure for precious metal gold. 

On the other hand, the economic event from China, the world’s second-largest economy, had shown a decline in GDP. Chinese economy contracted 6.8% in the quarter year-on-year, slightly more than expected, and 9.8% from the previous quarter, driving selling bias for the gold.


Technically, gold has violated the upward channel, and now it’s trading above 1,685 area. At the same price, the 50 periods EMA is proving it support, and gold has also closed a Doji candle followed by a hammer pattern, which can be seen on the 4-hour chart above. This setup demonstrates that investors are respecting 1,685 support areas, and gold prices may bounce off above this level until the resistance level of 1,700 and 1,709. In contrast, a bearish breakout of 1,685 level can cause further sell-off until 1,668. Good luck! 

Categories
Forex Market Analysis

Safe-Haven-Metal Hit Weekly High $1660 – Recovery In Risk Sentiment Plays! 

The yellow-metal prices broke its early consolidation phase and hit the 1-week high near the $1660 mark in the last hour. Whereas, the gold traders did not give any significant attention to the goodish pickup in the US bond yields as well. The gold is currently trading at 1,665.60 and consolidates in the range between the 1,638.30 – 1,669.95.

The buyers of gold ignored robust recovery in the global risk sentiment, which is supported by a reduction in the number of deaths from COVID-19 and which tends to weaken the metal’s perceived safe-haven demand. Meanwhile, the risk-on sentiment was further strengthened by a strong pickup in the US Treasury bond yields.

On the other hand, the headline recently gave support to the gold prices that the 3-Swiss refineries in Ticino, Europe’s biggest gold refiner, announced yesterday that they got permission to open their factories on the limited basis. Whereas, this statement will ease the supply concerns which are caused by the coronavirus lockdowns and transport stops.

At the coronavirus front, COVID-19 weekend news is flashing recession fears and updates to the debacle, COVID-19, which has risen 1,253,919 global cases, 68,169 deaths, and 257,221 recoveries. 


Daily Support and Resistance

  • S1 1576.16
  • S2 1596.66
  • S3 1607.74

Pivot Point 1617.15

  • R1 1628.24
  • R2 1637.65
  • R3 1658.14

On the technical front, the precious metal gold has violated the ascending triangle which was providing resistance at 1,636 level. Closing of candles above this level is suggesting chances of more buying until the next resistance level of 1,671. While support continues to hold around 1,635. The leading indicator MACD is also supporting the bullish trend in gold. 

Gold seems to close three consecutive bullish candles on the 4-hour timeframe, which will become three white soldiers and will drive more buying until 1,671 level. Consider taking bullish trades over 1,636 levels to target 1,656 and 1,671. Good luck! 


Categories
Forex Market Analysis

Risk-off Sentiment Drives Dramatic Buying in Gold – Quick Trade Plan! 

On Monday, the yellow metal gold prices went to more than seven-year high as a stock market retreat on risks over the widening coronavirus break, and its economic influence drove traders to safe-haven assets, although profit-taking following unwound much of the metal’s rise.

Earlier today, the gold reached its highest since December 2012 at $1,702.56 before falling back 0.5% lower to trade at $1,665.68 per ounce. The U.S. gold futures dropped 0.4% to $1,666.

Over the weekend, the global coronavirus crisis deepened, as the number of cases surged to 7,375 (366 deaths) in Italy, to 7,313 (50 deaths) in South Korea, and 6,566 (194 deaths) in Iran. The situation is also worsening in France (1,126 cases), Germany (1,040 cases), Spain (674 cases), and the U.S. (534 cases). This morning, U.S. stock futures slid over 4%, while spot gold hit the key level of $1,700 an ounce.


Support Resistance
1646.71 1696.48
1619.68 1719.22
1569.91 1768.99
Pivot Point 1669.45

The yellow metal gold prices extend trading sideways, tossing in between green and red in the wake of increased demand for safe-haven assets. It earlier touched 1,702 and now drops to 1,662 level. On the lower side, the precious metal may fund support around 1,660 and 1,647, while resistance continues to stay at 1,670.

Good luck! 

Categories
Forex Market Analysis

Gold Soars Aimed Fed Rate Cut Decision – Quick Trade Plan! 

On Wednesday, the gold prices trade sideways after trading mostly on the higher side on Tuesday. The bullish trend was seen on expectations of interest rate reductions by central banks as influencing policymakers from the Group of Seven (G7) countries gathered to address how to embrace the economic shock from the global coronavirus break.

The Fed made an emergency interest-rate cut, the first one since the global financial crisis of 2008. The cut was of half a percentage point (to a range of 1.00%-1.25%) in response to mounting anxieties about the economic influence of the coronavirus. Fed Chair Jerome Powell pointed out: “The virus and the measures that are being taken to contain it will inevitably weigh on economic activity for some time, both here and abroad, however, we do consider that our work will contribute a meaningful addition to the economy.

Besides, the Reserve Bank of Australia lowered its benchmark interest rate by 25 basis points to a record low of 0.50%, saying that it is prepared to ease monetary policy further to support the economy amid the impact of the coronavirus.

The gold will probably trade higher further as traders seek to park their funds into safe-haven assets such as gold. It is mostly due to concerns over the global economic slowdown. 

The coronavirus is presently expanding faster outside China, and the US Fed’s emergency rate reduction disturbed financial markets; thus, the demand for safe assets like gold will grow.


Daily Support and Resistance

Support    Resistance 

1,606.47    1,662.39

1,572.03    1,683.87

1,516.11    1,739.79

Pivot Point 1,627.95

At the moment, gold is expected to gain a critical resistance near 1,651 level, and breach of this can stretch the bullish trend till 1,662. As we can see on the 4-hour chart above, the gold has formed a Doji candle followed by a strong bullish candle, which is suggesting that there are chances of a bearish retracement below 1,652 level. On the lower side, the immediate support stays around 1,632 and 1,613. Let’s consider staying bullish above 1627.95 and bearish below 1,652 today. Good luck! 

Categories
Forex Market Analysis

Gold Bearish Engulfing In-Play – Is It Gold time to Short Gold?

On Monday, the precious metal gold surged over 1.5%, improving from its most significant one-day drop in almost seven years, on the odds for Fed fund rate cut by the U.S. Federal Reserve to diminish the economic impact from the coronavirus break.

On Friday, the yellow metal slipped dramatically by more than 4.5% for its most significant daily decline since June 2013 as traders liquidated positions to meet margin calls in other securities.

Monday has been a painful start to the week for some investors with further drop-offs in a variety of markets occurring at the market open.

It marks the 6th day of declines in a row, which we have not seen in some time, so traders should prepare themselves for the possibility that this week will likely be filled with negative data, driven by coronavirus fears.

Last weekcoronavirus fear resurfaced, and this helped to trigger a good number of trend line breakout trades, which I hear that some of you have been able to catch.

The virus came back into focus late last week, and this tipped the U.S. major stock indices into negative territory; note how much of Saturday’s CNBC front-page was dedicated to virus-related issues.

XAU/USD – Daily Technical Levels

 Support      Resistance 

1,552.02      1,631.45

1,517.83      1,676.69

1,438.4        1,756.12

Pivot Point 1,597.26

On the technical front, gold has closed a bearish engulfing candle around 1,593. Typically such patterns trigger further selling in the XAU/USD, and we may see gold prices going after the next immediate support level of 1,580. Violation of this level can extend further selling until 1,572. Alternatively, the resistance stays around 1,602. Let’s consider selling trade under 1,597 today. Good luck! 

Categories
Forex Market Analysis

Gold on a Bearish Mode, Coronavirus Continues to Outbreak! 

On Friday, the precious metal gold trades bearish, falling from 1,635 to 1,624 support level. It seems like traders are doing profit-taking ahead of the weekend. The bearish trend in gold continues despite a drop in stock prices. 

Global share prices directed for the most critical week since the world financial crunch in 2008 as traders braced for the disease to shift a pandemic and swiftly spread around the globe. Most of the selling triggered after mainland China had 327 new confirmed cases of infections on Thursday, the National Health Commission announced on Friday. 

Besides, Iran reported that its death toll climbed to 26, by far the highest figures outside China, and the total number of infected people held at 245, which also include several senior officials.


Gold – XAU/USD – Daily Technical Levels

Support Resistance 

1633.48 1658.64

1621.83 1672.15

1596.67 1697.32

Pivot Point 1646.99

On the technical side, the precious metal gold is trading at 1,623 level after violating the double bottom support area of 1,633 level. Looking at the leading technical indicators, the XAU/USD’s MACD has crossed below 0, which is suggesting chances of bearish trend continuation. 

Gold may find immediate support around 1,612 for now, and below this, the 61.8% will remain in focus, which may extend support around 1,602 level. Today, we can look for selling trades below 1,626 area. Good luck!   

Categories
Forex Market Analysis

Overbought gold Seems to Head for 38.2% Fib – Quick Trade Plan! 

Gold prices climbed more than 2.5% to over the seven-year top as the extension of coronavirus outside China, and its potential collision on global economic growth pushed safe-haven buying.

Japan has recorded 837 coronavirus cases, including 691 cases related to the “Diamond Princess” cruise ship, with a fatality number of four. The number of confirmed cases in South Korea surged to 602 (6 deaths) as the country raised its infectious-disease warning to the highest level. 

Italy said there were over 150 cases across five regions (3 deaths). Meanwhile, in China, official numbers showed nearly 77,000 cases and over 2,400 deaths. The World Health Organization announced it is concerned about the growing number of problems without any apparent connection to China. Consequently, investors are moving funds into gold due to its safe-haven demand.

Gold – XAU/USD – Daily Technical Levels

Support     Resistance 

1,629.58    1,653.22

1,615.82    1,663.11

1,592.18    1,686.76

Pivot Point 1,639.47

On the technical side, the XAU/USD is trading at 1,679 and has entered the overbought zone where the chances of bearish corrections pretty solid. On the lower side, gold may show bearish correction until 1,658, which marks 38.2%. On the higher side, resistance continues to stay around 1,690. A bullish breakout of 1,690 may lead to gold prices to prices 1,710 resistance. Let’s consider taking sell trades to capture the correction below 1,680 until 1,670/1,668. Good luck! 


Categories
Forex Market Analysis

Gold’s Symmetric Triangle Breakout – Is It Going After 1,637? 

The precious metal gold is trading dramatically bullish at 1,622 in the wake of boosted safe-haven appeal. The U.S. stocks advanced, buoyed by China’s stance in supporting local businesses amid the impact of the coronavirus outbreak. At the same time, minutes of the Federal Reserve’s last monetary policy meeting showed that officials were optimistic about the U.S. economy.

The U.S. official data showed that the number of housing starts increased to an annualized rate of 1.567 million units in January (1.428 million units expected), and the producer price index (PPI) rose 0.5% on month in January (+0.1% expected). Later today, initial jobless claims for the week ended Feb. 15 (210,000 expected), and the Conference Board Leading Index for January (+0.4% on month expected) will be reported.

European stocks rebounded, as the Stoxx Europe 600 Index rose 0.8%. Germany’s DAX increased by 0.8%, France’s CAC added 0.9%, and the U.K.’s FTSE 100 was up 1.0%. Despite that, the gold’s demand is still at the peak, which is driving its prices higher. Let’s take a look at the technical side of the market. 


Support Resistance 

1,604.59     1,615.98

1,597.42     1,620.2

1,586.03     1,631.59

Pivot Point 1,608.81

Technically, the precious metal gold has violated the symmetric triangle pattern, which was keeping it under pressure at 1,591. A bullish breakout of this level has opened further room for buying until 1,627 and 1,637. While the support can be found around 1,612 now, let’s take with a bullish bias above 1,612 level for the targets mentioned. Good luck! 

Categories
Forex Market Analysis

Gold Prices Inched Up – Eyes On Fed’s Minutes! 

The safe-have-metal prices rose as traders await the U.S. Federal Reserve minutes of its latest meeting, which is scheduled to release later in the day. The gold gained 0.2% to $1,607.25 by the time of writing this update. 

Gold is higher 5.7% during this year because investors evaluate the impact of the disease on economic growth amid thinking that the Federal Reserve will feel increased pressure to deliver the rate cut. Moreover, fears of the new coronavirus and its impact on global growth pushed the safe-haven metal higher.

Official data showed that new cases in China declined for a second straight day. However, the World Health Organization has cautioned there is not enough data to know if the epidemic was being controlled.

China continues to struggle to achieve the identity of manufacturing in the world’s 2nd-largest economy again after imposing substantial travel restriction and city lockdown to control the virus that has killed more than 2000 peoples so far. However, investors still seem confident that the economic impact may be temporary.

The epidemic is expected to impact business in China and drag down its economic growth. Earlier this month, Moody’s Investors Service has lowered the growth forecast for China from 5.8% to 5.2% for 2020.


Daily Support and Resistance

  • S1 1556.92
  • S2 1577.08
  • S3 1589.29

Pivot Point 1597.25

  • R1 1609.46
  • R2 1617.41
  • R3 1637.58

Technically, the gold prices are likely to face resistance around 1,612. Below this, gold prices are expected to gain support around 1,594 area. A bullish breakout of 1,612 can lead to gold prices towards the next resistance area of 1,622. At the moment, we can either wait for bearish retracement until 1,602 to take a buying trade or enter a buy trade above 1,612 level to target 1,620. Good luck! 

Categories
Forex Market Analysis

Gold Symmetric Triangle Continues to Play – Carnivorous Underpins Safe Haven! 

On Monday, the precious metal gold prices were near a two-week high mounted in the past session as doubt prevailed over the influence of the coronavirus disruption on the global economy. Gold is trading sideways around $1,582.08 per ounce, having placed the highest since Feb. 3 at $1,584.65 during the last week.

China advanced to reduce its medium-term lending rate to accommodate the economy against Caronovirus. While the emerging market currencies and stocks began the week on a firm basis as the move is anticipated to ease traders’ concern around the economic thrust from the coronavirus break.

A bullish reversal in the emerging market currencies could put stress on the U.S. Dollar. A weaker U.S. Dollar is suitable for gold rates. It serves to boost foreign trade for the dollar-denominated asset securities. 


Support     Resistance 

1,576.77     1,587.95

1,569.76     1,592.12

1,558.58     1,603.3

Pivot Point 1580.94

Technically, the gold hasn’t changed much as it’s price continues to trade in the symmetric triangle pattern. It’s keeping the gold prices under a resistance level of 1,584. On the lower side, gold’s immediate support stays around 1,577. A bullish breakout of 1,584 can lead to gold prices towards the next target level of 1,590. Conversely, the bearish breakout of 1,570 can lead to gold prices towards 1,560. The MACD is holding in a bullish zone, and it may help us capture a buying trade above 1,580 with a target of 1,588. Good luck! 

Categories
Forex Market Analysis

Gold’s Sideways Trading Continues – Quick Trade Plan Today! 

Gold price edged up to $1,571, an ounce extending its rebound to a fourth session. On Tuesday, the precious metal gold edged lower as European stocks climbed to record highs and the dollar hit a four-month peak, after a fall in the number of new confirmed cases of coronavirus limited the appetite for lower-risk assets and drove buying elsewhere.

The U.S. government bond prices were steady as the benchmark 10-year Treasury yield edged down to 1.574% from 1.578% last Friday.

China’s virus disease may rise in February, and then plateau ere easing, the government’s topmost medical expert on the virus break announced.

The disease is the world’s second-largest marketplace that has hit more than 1,000 so far and frightened the country’s economic extension as companies strived to return to work after an extended Lunar New Year holiday.


Gold is trading sideways within the symmetric triangle pattern, which is keeping gold bearish below 1,583 and bullish above 1,570. The weaker dollar sentiment is keeping gold prices bullish as investors are feeling less confident about the U.S. dollar since the release of worse than the expected unemployment rate, released on Friday. 

Today, we can consider staying bullish above 1,568 as gold prices can soar towards 1,579/1,581. Good luck! 

Categories
Forex Market Analysis

Gold’s Symmetric Triangle Pattern Holds – What’s the Next Plan?

Despite the convincing outcome of the US January labor market report, the price of gold maintains a bullish return up to the $1,574 resistance mark during Friday’s trading session as the precious metal closed the week’s around the $1570 level. 

All this bullish movement came in response to the rising global concerns about the worsening of the situation in China due to the disruption of the Coronavirus. To date, there is no proper vaccine announced to cope up with this disease, and the number of victims is growing, whether by death or disease, and the disease has expanded to more than 20 nations throughout the world besides China.  

As we know, the precious metal gold is an absolute haven for traders during the times of uncertainty, as is the situation now with the world’s interests about Corona. The Chinese government declared that a 1,500-bed hospital was made in two weeks in Wuhan, and another 1,000-bed hospital was created in 10 days during the previous week. The city council, with a people of 11 million, has announced it will launch hygiene operations twice a day for hospitals, markets, public toilets, and other facilities.


Gold – XAU/USD – Daily Technical Levels

Support     Resistance 

1,562.34     1,576.29

1,554.3       1,582.19

1,540.35     1,596.14

Pivot Point 1,568.25

Gold is trading sideways within the symmetric triangle pattern, which is keeping gold bearish below 1,583 and bullish above 1,570. The weaker dollar sentiment is keeping gold prices bullish as investors are feeling less confident about the U.S. dollar since the release of worse than the expected unemployment rate, released on Friday. Today, we can consider staying bullish above 1,568 as gold prices can soar towards 1,579/1,581. Good luck! 

Categories
Forex Market Analysis

Gold Flashing Green – China’s Coronavirus Outbreak Threats! 

The safe-haven-metal prices continued to flash green and rose to $1,588.70, mainly due to the risk-off market sentiment in the wake of China coronavirus outbreak threats. It is worth to mention that the gold prices recently got love from the fears of China’s coronavirus outbreak, as well as the headlines from the Middle East and the global trade news also add in the risk tone in the market.

According to the recent statement, the death toll in China due to coronavirus has risen to more than 80 from the 57. Meanwhile, Chinese authorities have recently updated the number of people affected by coronavirus as 30,400. Besides, more cases are also found in the United States, Japan, and Sydney. Whereas, the World Health Organization is likely to change its statement of delaying to call the coronavirus as International emergency amid the worldwide spread of the virus.

On the other hand, the renewed fears of the United States and Iran war also threatened the market risk-tone after repeated attacks on the US troops in Iraq on Sunday. The Sanctions on Iran from US Trump’s Administration has also added in the risk-off sentiment of the market.

Meanwhile, the US ten-year treasury yields hit the lowest from October 09 to 1.63%, whereas the S&P 500 decline more than 1.0% to 3,258 by the press time.

Looking forward, the traders will keep their eyes only on the trade and geopolitical news for fresh clues due to the lack of major data and events on the economic calendar in the wake of Australia and China’s holiday.

Daily Support and Resistance

  • S3 1529.51
  • S2 1548.81
  • S1 1560.32

Pivot Point 1568.11

  • R1 1579.62
  • R2 1587.41
  • R3 1606.71

On Monday, the boosted safe-haven demand has prompted a huge surge in the gold prices as it has opened with a gap from 1,572 to 1,581. Even now, gold prices are staying over 1,577 support zone, and bearish breakout of such level can prolong bearish trend unto 1,572 level. The general trend is bullish presently, but this gap should be swelled here we see further buying in gold. Good luck! 

Categories
Forex Market Analysis

Gold Rose Slightly As Fear of Virus Continue To Raise – Trade Idea!

The safe-haven-metal prices slightly rose, mainly due to the spread of China’s coronavirus. There were reports that the virus has almost killed 17 people in China, and officials have completely closed the Wuhan city to prevent the infection from further spread. However, China is looking up to other nations as well for finding the cause behind this virus. It has been found so far that the virus is contagious and can be transmitted from person to person, and this has resulted in an increase of risk-tone in the financial market.

The latest coronavirus has refreshed the memories of the SARS virus, which was also started in China in 2002-2003 and resulted in dented economic growth and a slump of the travel business. The market’s risk sentiment has increased due to the possible effects of the virus on the world’s second-largest economy.

At the Sino-US trade font, the uncertainty regarding trade tensions eased around the globe when the US reported that it has decided to roll back some tariffs on Chinese products on Valentine’s Day.

On the other hand, US President Donald Trump gave the warning to impose 25% tariffs on the EU cars if it fails to deliver any trade deal. The EU Chief Von Der Leyen may visit Washington in early February to discuss the possibility of the trade deal.

Whereas, the Lower export figures from Japan in December also supported the safe-haven metal today. As well as the country’s exports fell 6.3% in December from a year earlier, the Ministry of Finance data showed on Thursday. Meanwhile, Imports decreased by 4.9% in the year to December, against the median estimate for a 3.4% decrease. They fell 15.7% in the previous month.


Daily Support and Resistance
S3 1538.86
S2 1547.56
S1 1553.22
Pivot Point 1556.26
R1 1561.92
R2 1564.96
R3 1573.66

Gold is trading with a neutral bias, keeping the trading rangebound within 1,566 – 1,549. On the 4 hour chart, it has produced a series of Doji and Spinning top candles, which indicates uncertainty among investors.

At the moment, gold may find immediate support nearby 1,555 levels, which is expected to keep it in a buying mode until the subsequent resistance level of 1.561.

A bullish violation of this level can encourage more buying to 1,565. On the lower side, the breach of 1,555 support level can spread selling unto 1,551 level today.

Categories
Forex Market Analysis

The Safe-Haven-Metal Prices Rose on IMF Report & China Virus Headlines!

On Tuesday, gold prices inched up mainly due to the International Monetary Fund (IMF) report, which indicated a gloomy outlook for 2020. Gold traded 0.4% to $1,566.65 before falling to 1,555 during the European session.

The IMF decreased its forecast for global growth this year to 3.3% from 3.4% in October. The estimates for the U.S. and Eurozone were both lowered by the same amount. This report sent the prices of the safe-haven metal higher point, whereas the equities to the lower positions.

On the other hand, the safe-haven metal also got some support due to the risk-off market sentiment in the wake of the corona-virus outbreak in China.

Gold prices earlier boosted mainly due to the headlines regarding the China virus, which gained market attention. Because of the virus, four people were reported as dead in China, and an Australian man has also been recently tested for this human transmitted disease. As a precautionary measure, Wuhan has created a Wuhan Pneumonia control center to stop further spread of the disease. Meanwhile, he has also strongly suggested that markets and public transportation stations should be supervised strictly to prevent this virus from spreading further.

At the geopolitical front, unrest in Iraq during the weekend was also in focus, while it did not give any meaningful support to gold prices. At the USD front, the reason behind the greenback strength could be the rising expectations because of upbeat economic events that the economy of the United States will continue to expand.

Daily Support and Resistance

S3 1551.67
S2 1556.16
S1 1558.45
Pivot Point 1560.65
R1 1562.94
R2 1565.14
R3 1569.63

On the 4 hour chart, gold has violated the bullish channel, which was supporting it around 1,553. Violation of this level can extend selling until 1,549. Besides that, gold has formed a bearish engulfing pattern is also suggesting chances of a bearish trend in the gold. The violation of 1,549 can open bearish bias until 1,544 today. Good luck!

Categories
Forex Market Analysis

Gold Sideways Pattern Intact – Brace for a Breakout! 

The safe-haven-metal prices flashed green and rose by 0.6% to $1,553.15, mainly due to fresh uncertainty surrounding the United States and China phase-one trade deal.

At the Sino-US front, the United States decided that it will not remove tariffs on Chinese imports until the 2020 presidential elections. As a result, uncertainty surrounding the signing ceremony of phase one of the trade deal between the US and China emerged in the market. The meeting to sign the agreement is scheduled for today, while no details have yet been revealed regarding the contents of the trade deal.

It should be noted that the market traders are cautious and await for any detail release regarding the Sino-US phase-one trade deal ceremony for taking new directions. The meeting will take place today at the White House between the US & China (reportedly 11:30 am NY time but not confirmed).

The yellow metal rose at the starting of this week in the wake of U.S.-Iran tensions. However, risk sentiment recovered after when the two nations said they did not seek an intensification of the war. Therefore, we can say Iran-US war matter was the big reason behind the bullish gold rally last week.

On the other hand, the declining Treasury bond yields seem to push the greenback lower as well. The US Dollar Index, which tested the 97.50 marks earlier in the day, is now down 0.03% at 97.35. 


Daily Support and Resistance

  • S3 1518.31
  • S2 1531.09
  • S1 1538.79

Pivot Point 1543.86

  • R1 1551.57
  • R2 1556.64
  • R3 1569.41

Gold surged as the US Core CPI number undershot economists anticipate and poorly performed, sending bullish reversal in the gold. Currently, precious metal gold is trading over a strong support level of 1,551, and the extension of trading over this level can encourage further buying in the gold. 

Alternatively, the next resistance is expected to appear nearby 1,556 and 1,559. The breach of 1,551 can lead to gold towards 1,546. The bullish bias remains active today. Good luck! 

Categories
Forex Market Analysis

Gold’s Sideways Range Remain Intact – Brace for Trade Plan!

The safe-haven-metal prices dropped mainly due to the Asian stocks, which traded higher in the wake of optimism surrounding the United States and China trade war.

As we already mentioned that the gold prices dropped on the day because the United States is expected to sign the on-going phase-one trade deal with China this week.

According to the agreement, China will increase imports from the U.S. in exchange for the stop of the December tariffs on Chinese imports to the U.S. and a partial rollback of some existing tariffs.

At the Iran-US front, the situation in Iran is still active due to people’s rally as its citizens protested for a 2nd-night after the government acknowledged on Saturday that it had mistakenly show down a Ukrainian passenger jet, killing all 176 people on board.

On the other hand, the gold prices got some support from the stable bond prices in the wake of unexpectedly weaker December U.S. payroll growth. That sent the interest lower and giving attraction to the non-yielding gold.

Iran’s statement came only after the U.S., U.K., Canada, and Australia said they know that an Iranian missile hit the plane according to our intelligence, but Iran did not accept it first.

Looking forward, further important U.S. macro is scheduled to release this week and will remain under the trader’s focus to take fresh direction. The U.S. economic docket this week shows the release of the latest consumer inflation figures on Tuesday, and monthly retail sales data is scheduled to release on Thursday.

Daily Support and Resistance

S3 1523.29
S2 1540.25
S1 1551.19
Pivot Point 1557.21
R1 1568.15
R2 1574.17
R3 1591.13

Gold continues to consolidate in the same trading range, which it maintains on Friday. The metal is trading around 1,552 level while it’s current trading range appears to be 1,561 – 1,543.

On Monday’, gold’s most important trading level will be 1,556. Beneath this mark, gold can trade with selling bias unto 1,550 and 1,545. Whereas, an upward breakout of 1,555 can stretch the bullish trend until 1,561. Good luck!

Categories
Forex Market Analysis

Gold’s 38.2% Fibonacci Level Holds – What’s Next?

A day before, gold soared to a high of $1,611 an ounce once news about Iran attacking U.S. targets in Iraqi broke out. However, the yellow metal retreated for the rest of the session, over worries about an escalation between the U.S. and Iran. It closed at $1,556, down from $1,574 in the prior session.

The safe-haven-metal prices dropped sharply mainly due to deescalated tension between the United States and Iran war after the U.S. President Trump sluggish speech regarding missile attacks. 

Iran appeared to be standing down, calling it a good thing for all parties concerned. Furthermore, the fact that we have this great military and equipment, therefore, does not mean we have to use it.

It is worth to mention that before U.S. President Donald Trump’s speech, there were already signs rising from Iran for a de-escalation. As of consequence, markets turned into risk-on sentiment and thought that the U.S. would not take any revenge. Whereas, Foreign Minister Mohammad Javad Zarif tweeted that the country does “not try escalation of the war.

However, the main driver behind the gold prices was President Donald Trump’s delayed response to the missile attack yesterday. Once a time, the market was shaken in the wake of Trump’s answer, but no one did know that Trump would deliver a soft speech regarding attacks.


Daily Support and Resistance

S3 1481.81

S2 1524.92

S1 1540.62

Pivot Point 1568.02

R1 1583.73

R2 1611.13

R3 1654.24

On the technical front, the precious metal gold has formed bearish candle at 1,550, which is engulfing the previous candle, suggesting chances of a bearish retracement in gold. In fact, gold has already completed 38.2% Fibo retracement at 1,552 level. 

Closing of the daily candle above 1,550/48 level may drive bullish correction on today and tomorrow until the most awaited NFP is released. At the moment, we can look for selling trades below 1,557 and bullish trades above 1,547 until the breakout occurs. 

Good luck! 

Categories
Forex Market Analysis

Gold Surge Amid Weaker Dollar – A Trade Plan on Thursday!  

Gold prices soared higher on Thursday, staying near to a three-month top as the precious metal gold profited from bent in the greenback. The dollar index, which gauges the worth of the US dollar against the basket of six major currencies, was down with 1.9% in the previous month, which was its lowest level since July. A weaker dollar means cheaper gold for investors and a rise in Yellow metal prices in financial markets.

Investors also stocked gold after the release of PMI from China, where factory activity came in line with the expectations and growth in production at a solid pace was seen. This increased the confidence of traders that global economic outlook has started to get better on the rising trade optimism after the announcement of the phase-one trade deal.

Another factor including in the upbeat movement of the yellow metal was the rising tensions between the US and the Middle East. When the US military carried out airstrikes in Iraq & Syria against Iran-backed Katib Hezbollah, the protestors rallied over the US embassy in Baghdad.

This increased the appeal for safe-haven assets like gold and continued to support gold prices at the starting trading day of New Year.
Investors will be eyeing on the release of Manufacturing PMI & Unemployment Claims data from the United States to further invest in gold.


Gold – XAU/USD – Daily Technical Levels


Support Resistance 

1524.5     1529.5

1522.59   1532.59

1517.59   1537.59

Pivot Point 1527.59

Gold may find next resistance around 1,533 levels as it’s a double top level, which may help sellers with a bearish opportunity. On the lower side, the support stays around 1,523. 

Gold’s RSI and MACD are holding above 0, suggesting odds of further buying in the gold. The inside up bar on the 120 minutes chart is also supporting the bullish bias. But sooner or later, the pair is going to enter an overbought zone, and we may need to look for a selling trade in it. Consider staying bullish above 1,523 and bearish below 1,533 today. Good luck! 

Categories
Forex Market Analysis

Gold’s Ascending Triangle Intact – Investor Awaits Fundamentals! 

On Thursday, the precious metal gold prices inched up to trade around 1,476 after the U.S. House of Representatives chose to challenge President Donald Trump on articles of misuse of authority and obstruction of Congress.    

Impeachment is a two-way process where the removal of a sitting president is decided. In the first stage, the majority of the Democrats will be needed to support the move. If that passes, then a trial would be held in U.S. Senate, which will be dominated by Republicans. 

For that, 2-3rd would have to vote in favor, which is highly unlikely to happen. But if it did happen, Donald Trump would be forced from the White House.

The U.S. Dollar Index advanced to a fresh weekly high near 97.50, which also helped gold prices to gain a slightly bullish trend. Lack of any macroeconomic data left the movement of pair XAU/USD dependant on the technical changes and political news. 

On Friday, the Bureau of Economic Analysis will publish the Q3 Gross Domestic Product (GDP) along with the Personal Consumer Expenditures (PCE) Price Index. 

Gold – XAU/USD – Daily Technical Levels

Support   Resistance 

1,460.28   1,483.1

1,450.74   1,496.37

1,427.92   1,519.18

Pivot Point 1,473.55

Technically, the yellow metal gold has extended an ascending triangle pattern, which is holding the XAU/USD sustained above 1,470 level. A bearish violation of this level of 1,470 can drive additional selling until 1,462. However, no vital drift isn’t anticipated until the release of UoM Consumer Sentiment on Friday. On the upper side, 1,480 is likely to be the resistance for gold. Good luck! 

Categories
Forex Market Analysis

Gold Develops Ascending Triangle Pattern – U.S. Retail Sales in Play! 

On Friday, the precious metal is trading a bit calm after exhibiting dramatic movement, placing a high of around 1,484 to a low of 1,462. Despite weaker than expected macroeconomic data from the United States, the U.S. dollar remained a bit strong on Thursday as the trade optimism increased.  

The U.S. President Donald Trump tweeted on Thursday that “Getting VERY close to a BIG DEAL with China. They want it, and so do we!”. Which raised the hopes for completion of the phase-one trade deal sooner, and riskier assets gained traction.

Besides, another positive gesture by the United States was an offer made to China as part of a phase one deal. The U.S. negotiators offered to cut the existing tariffs and not to impose the latest round of tariffs in exchange for U.S. agricultural purchases from China and better intellectual property rights.

They offered to decrease existing tariffs by half in return for large U.S. agricultural purchases from China. So far, China has not responded but has argued that binding in a written agreement for investments would be against WTO rules and would also harm Chinese companies.

Gold – XAU/USD – Daily Technical Levels

Support     Resistance 

1,460.28     1,483.1

1,450.74     1,496.37

1,427.92     1,519.18

Pivot Point 1,473.55

Technically, gold has formed an ascending triangle pattern, which is keeping the XAU/USD supported over 1,462 level. A bearish breakout of this can trigger further selling until 1,455, but that significant movement isn’t expected on the U.S. retail sales until and unless we see a dramatic deviation in figures. 

On the higher side, 1,480 is likely to be the next resistance area for gold. So we can play within this limited range, selling at the top and buying at the bottom. Good luck! 

Categories
Forex Market Analysis

Gold’s Bullish Bias Continues – Dovish FOMC and U.S. Shino In Play! 

Gold continues to trade bullish around 1,478 as we enter in the U.S. session. Most of the buying came after the dovish reports from the FOMC, as investors’ focus shifts to the trade war.

The Federal Reserve announced that it would proceed to watch the data to see if global developments and the muted inflationary pressure affect the U.S. economy. The fed statement of December meeting had no comments like it had in October’s meeting statement in which it was mentioned that uncertainties about outlook remained.

The latest signals from the Fed in its summary of economic projections gave the sense that the Federal Reserve may not run at all in 2020. When asked whether a hike in interest rates would Fbe seen next year, Chairman Jerome Powell answered that a persistent increase in inflation would be required to withdraw the stimulus Fed added this year. And that was a fairly high bar which he does not think will be met in 2020.

Speaking about the U.S. China trade talks, the director of White House National Economic Council Larry Kudlow said the media that “the reality is those tariffs are still on table, the December 15 tariffs, and the President has intimated if the little strokes that are still prevailing in trade talks do not get sorted out as per Trump’s wish, those tariffs could go back into place”.

XAU/USD – Daily Technical Levels 


Support Resistance 

1465.37 1481.64

1455.92 1488.48

1439.64 1504.76

Pivot Point 1472.2

The technical side of the market remained bullish as the precious metal trades above the strong support level of 1,471. On the higher side, gold is likely to find resistance around 1,483. 

Speaking about the leading indicators, the RSI and MACD are suggesting buying trends. So, we should look for bullish trades today. We will prefer staying bullish over 1,474 levels to target 1,482 today. Good luck! 

Categories
Forex Market Analysis

Steady Movement In Gold – Eyes on FOMC & Fed Rate Decision Today 

On Wednesday, the price of the precious metal gold moved in a tight range as cautious traders back out from big bets before of U.S. Federal Reserve’s monetary policy statement following in the day and amid an imminent tariff deadline.

The Small Business Index from the U.S. National Federation of Independent Business (NIFB) was released. The report showed an increased figure in the month of November to 104.7 from the expected 103.1, which supported the greenback.

At 18:30 GMT, the Revised Non-Farm Productivity for the third quarter was released and came in as -0.2% against the expectations of -0.1%. The Revised Unit Labour Costs for the third quarter from the United States dropped to 2.5% from the expectations of 3.4%.

According to the analysis of Chinese & U.S. data, China has bought more U.S. soybeans between September and November this year, giving an excellent gesture to try to reach an initial agreement on trade. The Chinese imports of U.S. soybeans increased 13 times from the previous year’s same period.

However, Chinese officials are hopeful that the U.S. will delay a threatened tariff increase due on Sunday as both countries are focused on the de-escalation of trade tensions. Traders are keeping an eye on a specific move from China or the U.S. in the development of trade deal to react accordingly.

Investors are also waiting for the forecast of U.S. economic growth from policymakers who are attending a two-day meeting of Federal Reserve, which will end on Wednesday. Federal Reserve is expected to hold its interest rates unchanged in this meeting. On Wednesday, the Consumer Price Index from the United States will be released, which is expected to drop to 0.2% from the previous month’s 0.4%.

Gold – XAU/USD – Trade Plan

This week, the precious metal gold hasn’t exhibited major movements as most of the market awaited the U.S. CPI and FOMC figures. Gold is stuck in a tight trading range of 1,467 – 1,459.  

On the 4-hour timeframe, gold is forming neutral candles within the same range of 1,467 – 1,459, which is signaling a lull before the storm. Gold is also gaining support around 1,459, and it’s extended by a bullish trendline while the RSI and MACD stay around 50 and 0, respectively. 

Gold – XAU/USD – Daily Technical Levels

Support    Resistance 

1,459.88      1,469.07

1,455.37      1,473.74

1,446.19      1,482.92

Pivot Point 1464.56

A bearish breakout of 1,458 can lead to gold prices towards 1,452 level. Alternatively, the bullish breakout of 1,467 can lead it towards 1,471 and even higher. Looks like, traders are going to keep trading choppy session until the CPI and FOMC is released tomorrow. Good luck! 

Categories
Forex Market Analysis

Gold Bounces Off Amid Safe Haven Appeal – What’s Next?

During the Asian and European sessions, the precious metal gold surged as traders hedged against a possible intensification in the U.S.-China trade conflict before a Dec. 15 deadline for fresh U.S. tariffs.

Overall, the precious metal remains under pressure in the wake of a stronger U.S. dollar. The Average Hourly Earnings from the United States Bureau of Labour Statistics was published, which showed a decline in November to 0.2% from the expectations of 0.3% and weighed on the U.S. dollar.

The Non-Farm Employment Change for November showed growth to 266K from expected 181K and supported the U.S. dollar. The Unemployment Rate of the United States also declined in November to 3.5% from previous & expected 3.6% and added in support of the U.S. dollar.

Besides, the Preliminary Consumer Sentiment from the University of Michigan also came in favor of the U.S. dollar as 99.2 against the expectations of 97.0. The Final Wholesale Inventories for October were also in favor of the U.S. dollar when released as 0.1% against the expectation of 0.2%. The Preliminary Inflation Expectations from the University of Michigan showed a drop this month to 2.4% from the previous 2.5%.


Gold – XAU/USD – Daily Technical Levels

Support      Resistance 

1,452.48      1,474.11

1,444.81      1,488.08

1,423.18      1,509.71

Pivot Point 1,466.44

Gold is likely to trade bullish above 1,459, which is working as a horizontal support level. The closing of Doji and Inside up bar patterns are suggesting chances of a bullish reversal in gold. 

It looks like gold is trying to capture a bullish retracement, and it has completed 23.6% Fibo corrections at 1,464. This level is now extending substantial resistance to gold. 

The bearish breakout of 1,459 can lead to gold prices towards 1,450. While bullish trend continuation can lead to gold prices to 1,471, I will be staying bearish below 1,466 today. Good luck! 

Categories
Forex Market Analysis

Gold’s Sideway Range Remains Intact – What’s Next to Expect? 

Gold prices mostly traded in sideways trading range of 1,483 – 1,475 due to lack of market moving fundamentals. Recently, the statement by Trump having no-deadline for the US-China agreement drove US Treasury yields lower and helped in tightening the spread between US Govt. Bond yields & Japanese Govt. Bond Yields. This made gold more attractive that day and hence XAU/USD pair suffered.

A report from Bloomberg turned the table by saying that US & China were moving closer to a trade deal. According to the report, the US & China were under talks to agree on the amount of tariffs that would be rolled back in Phase-one trade deal despite the raised tensions over Hong Kong issue.

China has been continuously demanding the roll back of US tariffs as part of phase-one trade deal which Trump has denied earlier. Yesterday, reports came in favor of trade-deal raised the hopes for phase-one deal completion by mid-December. This happened despite the increased tensions between US & China after the US legislation to punish Chinese officials over human rights issues in Hong Kong. 

Gold – XAU/USD – Trade Plan

Technically, the precious metal gold is stuck in a narrow trading range of 1,483 – 1,467. On the 4 hour timeframe, gold is forming neutral candles above 1,472 mark which is extending an immediate support to gold today. Bearish breakout of this level can extend sell-off until 1,467 level.


Support Resistance 

1469.34 1481.99

1464.07 1489.37

1451.42 1502.02

Pivot Point 1476.72

The RSI and MACD are holding around 50 and 0 respectively, suggesting neutral sentiment of traders. Looks like, traders are going to keep trading choppy session until the NFP is released tomorrow. 

Consider staying bearish 1,480 and bullish above 1,472 today. Good luck! 

Categories
Forex Market Analysis

Gold Sideways Trend Continued – ADP Fails to Drive Price Action! 

These back to backfires from Trump administration are affecting the credibility of the United States. Trump, on Monday, said that giving U.S. legislation to Hong Kong protestors was not making trade negotiations easy with China. However, he believed that Beijing still wanted a deal with the U.S. Trump added that China was having by far the worst year that hey had in 57 years and was still paying for the trade war. He said that in contrast, the U.S. was doing very well, and it can even do better with a flick of a pen.

In October, China has reported its slowest growth in the economy in 27 years when trade tensions with the U.S. hit its manufacturing sector. 

On the other hand, the Wards Total Vehicle Sales from the United States on Tuesday was published and showed growth to 17.1M from expected 16.8M and supported the U.S. Dollar.

Gold continues to gain bullish momentum as the U.S. private employers scored fewer jobs in six months in November, falling below economists forecast. The U.S. companies’ payrolls grew by 67K last month as per the ADP National Employment Report. 


XAU/USD – Daily Technical Levels

Support Resistance 

1,464.34   1,486.32

1,451.14   1,495.1

1,429.16   1,517

Pivot Point 1,473.12

For the U.S. session, gold is likely to trade in a narrow range of 1,474 – 1,483. The chances of a bearish break below 1,474 remain high. Thus, the second bearish target for gold is likely to be 1,467 today. Good luck! 


Categories
Forex Market Analysis

Dramatic Buying In Gold – Trump Inflict Sudden Tariff In Brazil, and Argentina!

On Tuesday, gold prices were trading in a tight area of 1,462 – 1,452 as traders were mostly staying out of the market during the Asian and European sessions. All of a sudden, we noticed a dramatic buying trend in gold, which lead its prices towards 1,472 and even higher. Most of the buying came in response to U.S. President Donald Trump’s action of slapping tariffs on Brazil and Argentina.

Besides this, Construction spending from the United States also dropped to -0.8% from the expectations of 0.3% and weighed on the U.S. dollar. The ISM Manufacturing prices showed a minor drop of 46.7 from expected 47.0.

On the trade deal front, the U.S. dollar remained under pressure after the demand of tariffs removal as a part of the phase-one deal by the Chinese government. Trump, in response, told Commerce Secretary Wilbur Ross, who reported the media that Trump would not back off from tariff hike on December 15 if China would not sign the phase-one deal by then.

Taking a look at the technical side of gold, the metal is trading around 1,474 area with an immediate resistance around 1,476. The precious metal has violated the descending triangle pattern, which is now supporting gold around 1,466 area.


Support Resistance
1,455.8    1,467.31
1,449.15 1,472.18
1,437.64 1,483.69
Pivot Point 1,460.66

On the 240 minutes chart, gold may form three white soldiers pattern, which typically represents chances of a bullish bias among traders. Likewise, the leading indicators, such as RSI and MACD, are also suggesting the odds of a bullish trend in gold. Consider staying bullish above 1,466 and bearish below 1,476/77 today. Good luck!

Categories
Forex Market Analysis

Gold’s Descending Triangle Pattern – U.S. 0 China Trade Talk In Action! 

On Monday, gold prices fell after better-than-expected manufacturing figures from China soothed concerns of a slowdown in global growth while deficit-ridden auto catalyst metal rose to an all-time high.

Trump’s approval to pass the Hong Kong Human Rights & Democracy Act as a law could hurt trade relations because the Chinese Government has warned firm countermeasures against such action by the U.S. 

Ongoing trade talks between both economies were going positively, and the phase-one deal was expected to be signed before December 15. 

If the deal is not approved by then, the fresh tariff from the U.S. on Chinese goods would be imposed, and it would hurt the U.S. economy more than the previous tariff hike. Trump would like to avoid such a decision when he is so eager to get China to buy U.S. soybeans, pork, and other farm products, which is a part of the Phase-one deal.


Gold – XAU/USD – Daily Technical Levels

Support      Resistance 

1,455.89      1,469.43

1,447.72      1,474.8

1,434.18      1,488.34

Pivot Point 1,461.26

Speaking of the technical aspects, gold is stuck in a descending triangle pattern, which is keeping it supported around 1,450. Although gold has closed three black crows on the 4-hour chart, which typically signals a bearish trend, the investors are still looking for a reason to enter the market. The ISM manufacturing PMI may work as a catalyst to drive price action

On the lower side, a bearish breakout of 1,452 can fell to 1,442 while on the upper side, gold may find resistance around 1,464 today. Let’s look for sell trades below 1,462 today. Good luck! 

Categories
Forex Market Analysis

Gold Choppy Trend Continues – What Next to Expect?

On Friday, the precious metal gold trade sideways in the wake of mixed fundamentals. Despite this, gold is still on track to post its most vital monthly drop in 3 years, as traders solicited evidence on the U.S.-China trade progress after the United States withdrew anti-government protesters in Hong Kong.

Earlier, the U.S. Section of Hong Kong law got criticized by China and Hong Kong as well. But we noticed only a limited reaction due to the thanksgiving day holiday in the United States. 

Furthermore, the criticism from the China State Council that Beijing will adequately resolve the trade disputes, and they will step up punishment for intellectual property infringement, seems to have played their role, keeping the safe-haven demand diminished.  

XAU/USD – Daily Technical Levels

Support Resistance 

1454.29    1459.19

1451.77    1461.58

1446.86    1466.48

Pivot Point 1456.67

Gold continues to trade within a narrow trading range of 1,463 – 1,451 as investors await for a fundamental reason to determine further trends in the market. In the meantime, the XAU/USD is likely to continue trading in the same trading range. 

On the downside, gold is presumed to find support at 1,452 area, and the violation of this could initiate further selling unto 1,442. The MACD is still holding in the buying zone, but the latest histograms are smaller than the previous one, signaling chances of a further bearish trend. 

Good luck! 

Categories
Forex Market Analysis

Gold Trade Sideways – Volatility Lacks Amid Thanksgiving!

On Thursday, the precious metal gold traded in a tight $5 range trading range as investors assessed the impact of U.S. support of Hong Kong rebels on its trade agreements with China.

Demand for safe-haven assets like gold, silver, and Japanese yen increased as the U.S. President Trump signed the Hong Kong Human Rights and Democracy Act in early Asia, reaffirming support for Hong Kong’s pro-democracy protests after the majority of the City’s districts turned in favor of pro-democracy candidates with record voter turnout this week.

While China has frequently warned the U.S. administration not to interference in their personal affairs, therefore, President Trump’s move will likely hurt the relationship with China at a time when both sides are trying to reach a “phase one” trade deal.

On the positive side, the United States and China trade deal nearness and the optimism surrounding the United Kingdom December election result supported the market’s riskier assets and moved the greenback.

Besides, the greenback strength was robust U.S. data that decreased market speculations that the excellent time for the world’s largest economy will soon be over.

The traders will have a few data to watch due to the United States holiday regarding thanksgiving data; it means that the trade and political headlines will keep the market active.


Daily Support and Resistance

  • S3 0.6746
  • S2 0.6762
  • S1 0.6769

Pivot Point 0.6779

  • R1 0.6786
  • R2 0.6796
  • R3 0.6813

Choppy dealing in gold remains as the yellow metal still maintains the full range of 1,464 – 1,452. Due to thanksgiving holiday today, we may not see much moves in the market. We can try to cap above 1,452 as below this gold can find next support nearby 1,447. The overall trend is likely to be mixed today.

Categories
Forex Market Analysis

Gold’s Bullish Channel In Test – Can We See a Breakout?

On Thursday, the gold prices y eased from the last session’s two-week high after a report that China has invited top U.S. negotiators for a new round of face-to-face talks, and is seeking to reach a primary trade treaty with the United States.

Safe-haven demand is also dominating the market as it was further disturbed after the U.S. Senate passed a bill against China and in favor of Hong Kong on Wednesday. Both the U.S. House and Senate signed the Bill via a veto-proof majority. 

According to the act, annual certification of Hong Kong’s autonomy would be required, and punishment will be imposed on Beijing against suppressing protestors. China demanded the United States to stop interfering in its internal affairs and said that it would retaliate.

Later, on Wednesday, FOMC October’s Meeting minutes were released and showed that there would not be any further rate cut this year. 

The holding of monetary policy and rate cuts by federal reserve was already expected, so it didn’t make much impact on the precious metal gold. 

Minutes revealed that most officials of Federal Reserve were against the 4th rate cut this year. Some officials supported rate cut but also said that it was a close call. 

Officials were concerned that some banks had decreased the capital buffers when they should be rising. Minutes also revealed that risks to the economic outlook remained tilted to the downside. Many officials said that rate cut was warranted due to global weaknesses and trade uncertainty.


XAU/USD – Technical Levels

Support    Resistance 

1,465.41    1,478.36

1,459.2      1,485.1

1,446.25    1,498.05

Key Trading Level: 1,472.15

On the technical side, gold prices are trading within a bullish channel, which is supporting the XAU/USD above 1,466 level. The MACD and RSI are holding below 0 and 50, respectively, suggesting changes of a bearish breakout. If this happens, gold prices may drop further until the 1,456 level. Therefore, consider taking sell positions below 1,465 level today. 
cript>

Categories
Forex Market Analysis

Gold Set to Test Pivot Point – Buyers Loom Around the Corner! 

On Wednesday, the precious metal gold prices soared to their peak levels in nearly two weeks as U.S. Senate activity on Hong Kong produced a likely obstacle to a trade deal between the United States and China, bending demand for riskier assets.

The Chinese news outlet Global Times reported that U.S. & China had a long way to go to end the trade dispute and to come to terms. 

CNBC reported on Monday that China would wait for the outcomes of 2020 U.S. Presidential elections before signing a trade deal. It was also said that China appeared to set on “wait till Trump out” rather than focusing on the Phase-one deal.

The phase one deal was highly skeptical from the beginning due to red lines of enforcement mechanism, Intellectual properties, and subsidies. Trump, on Tuesday, in response to the Chinese reluctance to sign the deal, gave threats to China that he would impose more duties on Chinese goods by 15 December if the phase-one deal was not signed by then.


Gold – XAU/USD – Technical Outlook

Gold extends to trade in a bullish trend at 1,474 levels in the wake of U.S. China trade risks. On the 4 hour graph, the yellow metal has violated the ascending triangle, which was extending hurdle to gold around 1,472 area. Now, this level is working as a support. 

Support    Resistance
1466.46    1476.85
1460.46    1481.25
1450.06    1491.64
Pivot Point 1470.85

Gold prices still hold over 50 EMA, which is expected to support it near 1,470 marks. The recent bearish trend in gold is likely to from three black crows pattern on gold, which may lead to gold prices below the 1,470 level and even towards 1,466. That’s where we can expect to take a buying trade today. Good luck! 

Categories
Forex Market Analysis

Gold’s Ascending Triangle Plays – Is It Good Time to Buy?

On Tuesday, gold slid erasing profits from 1,470 t0 1,464 level earlier in the session, as a temporary respite from Washington for China’s Huawei increased confidence for a trade agreement between the nations and increased risk sentiment.

The yellow-metal prices dropped during the last week mainly due to the Commerce Secretary Wilbur Ross and White Hosue’s economic adviser Larry Kudlow hinting that the United States and China were close to signing the deal. That sent the three major stocks indexes to record highs on Wall Street.

On the other hand, Donald Trump met with Federal Reserve Chairman Jerome Powell and Treasury Secretary Steven Mnuchin at the White House overnight to discuss the economy and the greenback weakness.

Powell’s remarks were consonant with his statements at his congressional hearings last week the Fed said in a statement released after the meeting. In contrast, the United States President Donald Trump said the meeting was “very good.”

Risk appetite was shaken due to the news that Trump and Fed Chairman Powell had met to discuss the tendency of the dollar. There were rumors of a CNBC report that Chinese officials were involved over prior comments concerning tariffs from Trump.


XAU/USD – Daily Technical Levels

Support Resistance 

1,460.54    1,478.16

1,449.67    1,484.91

1,432.05    1,502.53

Pivot Point 1,467.29

Gold is trading at 1,468 level, bouncing off above 1,464 support level. On the 4 hour timeframe, it has formed an ascending triangle pattern, which is extending its resistance around 1,474. While the bullish trendline is likely to support the pair around 1,464 level. 

The recent bullish closing above 1,464 level is suggesting the market to retrace back upward until 1,472 level. While on the flip side, a bearish breakout of 1,464 can lead gold prices towards 1,456.

All the best!

Categories
Forex Market Analysis

Gold’s Bullish Channel Supports – U.S. China Sentiments Remains Mixed!

On Friday, gold prices declined the demand for safe-haven assets fell remarks from White House economic adviser Larry Kudlow that the United States is pretty close to settling an interim trade agreement with China.

Fresh certainties regarding the United States and China trade deal returned after the goodwill gestures by the Dragon nation as China lifts the restrictions on the United States poultry imports. Additionally, the headlines of the restart trade talks later on the day also improve the risk-on market.

At the Kudlow front, the latest comments from the White House Economic Adviser Kudlow announce that we are very close to getting the trade deal with China, so in the consequences, the bounce-back came in the U.S. Treasury yields and S&P 500 futures.


XAU/USD – Daily Technical Levels
Support Resistance
1,465.42    1,476.06
1,459.45    1,480.73
1,448.81    1,491.37
Pivot Point 1,470.09

On the 2 hour chart, the yellow metal gold is trading in a bullish channel, which is supporting it around 1,461 level along with a resistance level of 1,473. The new 2-hour candle is bullish marabou, which signals the chances of a bullish trend in gold.

The leading indicators, such as MACD and RSI, are still trading below 0 and 50 level, supporting the bearish bias in gold. With that being said, gold prices may drop further until 1,452 level of it manages to give us closing below 1,460 level.

Likewise, the bullish breakout of 1,473 resistance opens further room for buying until 1,479.

Categories
Forex Market Analysis

Gold’s Bearish Channel Breakout Drives Bulls – What’s Next?


On Thursday, the precious metal gold surged to trade around 1,468 level extending gains to a third session, as soft Chinese figures and risk about whether Beijing and Washington will strike a trade agreement anytime soon depressed demand for riskier assets.

China and the United States are enduring “in-depth” talks on a first-phase trade deal, and cutting tariffs is a crucial requirement for settling, the Chinese commerce ministry stated.

The report came from the Wall Street Journal that the United States and China hit a snag over farm purchases. Notably, President Trump recently said that China committed to buying up to $50 billion in U.S. soybeans, pork, and other agricultural products as part of a phase one trade agreement.

However, China is unwilling to quantify its farm purchases now, as in result, instantly activated a risk-off sentiment in the American markets that destroyed the Wall Street party.

XAU/USD – Daily Technical Levels

Support     Resistance
1,458.56      1,467.83
1,453.59      1,472.13
1,444.32      1,481.4
Pivot Point 1,462.86

Gold has crossed over a triple top resistance level of 1,466. CLosing of the bullish candle above this level is suggesting the bullish trend is still strong. While the MACD and RSI are also supporting the buying trend in gold.

At the moment, gold has immediate support around 1,466 and above this, gold has the potential to target 1,472 and 1,479. Let’s consider staying bullish above 1,466 today. All the best!

Categories
Forex Market Analysis

Gold Violates Bearish Channel – Positive CPI Weights 

During the European session, the yellow metal gold prices climbed following a speech by U.S. President Donald Trump. Most of the safe-haven appeal triggered after President Trump denies rolling back tariffs, denting the hopes for a positive indication on a U.S.-China trade agreement, provoking traders to explore safe-haven assets.

Just a few minutes back, the U.S. Consumer Price Index accelerated 0.4% in October on a seasonally adjusted data after being stable in September. 

Over the year, the all items index grew 1.8% ere seasonal changes. The energy index rose 2.7% in October following recent monthly drops and deemed for more than half of the rise in the seasonally adjusted all items index. The positive surge in CPI is weighing on the gold prices, and it may keep gold bearish during the U.S. session until the release of Fed Chair Powell. 

XAU/USD – Daily Technical Levels

Support     Resistance 

1,447.89     1,462.71

1,439.38     1,469.02

1,424.57     1,483.83

Pivot Point 1,454.2

Technically, gold prices have violated the bearish channel, which was extending resistance at 1456 area. The bullish breakout has lead gold prices below 1,466 level, which also marks the double top level. The RSI and MACD here are in favor of a bullish bias. 


So here’s a thing, the buyers may enter for further buying above 1,467 level to target 1,474. Elsewhere, gold can trade bearish below 1,466 level today. On the lower side, support can be seen around 1,454. All the best!  

Categories
Forex Market Analysis

Gold Bearish Channel Dominates – U.S. China Trade Issue Trending!

On Tuesday, the precious metal gold prices edged lower as forecasts of resolute trade discussions between the United States and China supported risk desire, while traders pocketed profits ahead of further updates.

The precious metal gold also sank 0.2%, to $1,454.20 per ounce as investors moved their funds into the stock markets, the higher-yielding assets these days. Consequently, the global stock indices surged higher on Tuesday as traders anticipated a speech by President Trump on trade policy during the U.S. session.

Investors will be closely following Trump’s speech to have a clear stance on the U.S. China tariff rollover, and the EU auto industry tariffs delay.

EU leaders said Trump was supposed to declare this week he was holding the tariff ruling on cars and auto parts shipped from the European Union probably for another six months. That’s raising anticipations about the president’s speech following in the day about the long-drawn trade war with China.

XAU/USD – Daily Technical Levels

Support Resistance
1,452.53    1,469.27
1,446.03    1,479.51
1,429.29    1,496.25
Pivot Point 1,462.77

Gold is trading in a bearish channel, which is keeping it supported around 1,448 level. It’s also extending resistance at 1,456 area. The bearish channel clearly suggests strong chances of further sell-off in the gold prices.

On the lower side, the bearish breakout of 1,448 level can extend selling further until 1,444 level. But for the bearish breakout, we need a solid reason that we can’t expect after looking at today’s economic calendar.

Therefore, consider staying bearish below 1,456 and bullish above 1,448 to capture choppy trading in gold. All the best!

Categories
Forex Market Analysis

Gold’s Bearish Trend Continues – Eyes On Double Bottom Pattern

On Friday, the precious metal gold prices crept lower, exhibiting one of the sharpest weekly drops in two and a half years. The stronger greenback pressured on gold prices while confidence about U.S.-China trade negotiations depressed bullion’s safe-haven bid.

Gold is declining as the buck is performing great, and few traders who purchased gold as a haven are running out. The dollar index was directed for a weekly profit as it profited from the report that China and the United States had admitted to rolling back taxes as part of a possible preliminary agreement to settle their trade war.

Nonetheless, some uncertainties arose as administrators inside and outside the White House rejected the idea of bending up punitive tariffs. The uncertainty limited bullion’s decline.

Meantime, European stock benchmarks departed from the prior session’s speak as contradictory signs from China and the United States on development made in trade discussions collapsed market expectations of a near-term truce.

Gold – XAU/USD – Daily Technical Levels

Support Resistance 

1,484.27    1,495.6

1,477.98    1,500.64

1,466.65    1,511.97

Pivot Point: 1,489.31

On Friday, gold prices may find immediate support around 1,457 level. This level is extended by a double bottom level on the 4-hour chart. The MACD and RSI are exhibiting sharp bearish bias. 

Today, the closing of the 4-hour candle above 1,457 area is likely to offer us a bullish retracement. Until then, we can stay bearish below 1,467 area. All the best! 

Categories
Forex Market Analysis

Gold Heading North for Bullish Retracement – Who’s Up for Buying Trade?

On Wednesday, the yellow metal gold trades bullish, recovering some losses following an almost 2% drop in the previous session. The demand for safe-haven gold seems to pick up again as the bullish rally in stock market delayed, and the result of U.S.-China trade discussions seemed doubtful once more.

Gold prices soared 0.1% to $1,485.07 per ounce, and bullish bias seems pretty solid today. Considering the U.S. -China trade war, the market is still experiencing uncertainty, and we still don’t comprehend if there is a deal yet. 

Besides, the global stock markets are trading neutral following a three-day bullish trend as traders extended to see incoming economic figures and awaited new improvements from U.S.-China trade discussions. Consequently, we may see investors taking their funds out from the stock markets and putting it in the safe-haven assets such as gold. 


Gold – XAU/USD – Daily Technical Levels

Support Resistance 

1472.82 1501.14

1461.98 1518.62

1433.66 1546.93

Pivot Point 1490.3

Technically, the precious metal gold has formed a Doji /test bar on the 4-hour timeframe, which is suggesting chances of a bullish reversal in gold. The MACD and RSI have started to come out of the oversold zone, and now it’s suggesting chances of a bullish reversal in the market. Continuation of a bullish trend may extend further buy until 1,492 today. Consider taking buying positions above 1,482 and selling positions below 1,492 level. All the best! 

Categories
Forex Market Analysis

Gold Retests $1,514 Amid Trade War Concerns – Wait for Breakout! 

On Monday, the precious metal gold prices consolidate below the crucial trading level of 1,514 today. The growing risk appetite amongst traders, encouraged by confidence in U.S.-China trade discussions and diminishing fears of a global economic slowdown. Overall, the precious metal gold dropped 0.1% to $1,511.44 during the Asian session, while gold edged 0.2% higher at $1,513.70.

The U.S. Non-Farm Payroll of US rose above expectations, and the Manufacturing PMI was also increased but came in below expectations. Both these reports were highly awaited by the traders as they were leading indicators of the economy. The increased payrolls in October and modest improvement in the Business activities were notable developments and pointed the calm journey of the US economy in prevailing uncertainties.

Some optimism from US-China Trade talks also appeared in the market after the reports suggested that China & US trade representatives were under a constructive talks session on Friday. The conversation held between Treasury Secretary Mnuchin and Chinese Vice President Liu regarding the next steps in the trade truce phase one deal.

XAU/USD – Daily Technical Levels

Support Resistance 

1506.24 1519.68

1498.06 1524.94

1484.62 1538.38

Pivot Point 1511.5

At the moment, gold is facing substantial resistance at 1,514 level, and this level may decide the fate of precious metal today. Below 1,514 level, we may see gold prices falling towards 1,507, and the violation of 1,507 level can extend sell-off until 1,503. 

All the best! 

Categories
Forex Market Analysis

Gold Triple Top Plays Well – NFP Figures Drive Sell-off! 

On Friday, gold prices slid as influential figures from China faded the risk appetite, while the U.S. labor market figure was robust. U.S. Bureau of Labor Statistics announced total nonfarm payroll (NFP) employment increased by a 128k jobs in October, surpassing forecast of 89k. Besides this, the headline number for the previous month witnessed an upward correction to 180k from 136k. 

Hence, the unemployment rate observed 0.1ppt growth to 3.6%, meeting forecast with the uptick associated with the increase in the labor force participation rate.

Next month, the U.S. & China were supposed to meet at APEC Summit in Chile to discuss a potential Phase-one Trade agreement between both economies. U.S. President Donald Trump and Chinese President Xi Jinping were expected to sign the phase-one deal on that Summit. But due to domestic unrest, the meeting was canceled.

Trump announced that both countries would continue the negotiations and would sign a portion of that deal in the coming weeks.

On Thursday, Chinese Officials showed doubts on the prospects for an agreement and revealed that they were concerned about Trump’s impulsive nature and said that Trump might back out of even a limited deal at the last minute.


Gold – XAU/USD – Daily Technical Levels

Support     Resistance 

1501.56    1519.33

1490.17    1525.71

1472.4      1543.48

Pivot Point 1507.94

Gold is still facing triple top resistance at 1,514, which is keeping gold bearish below this level. On the lower side, gold has already completed 38.2% Fibonacci retracement at 1,50 area. But price reversed right after to close the candle above 23.6% Fibonacci retracement level of 1,507. Therefore, let’s consider staying bearish below 1,513 level today. All the best! 

Categories
Forex Market Analysis

Dramatic Buying in Gold – What’s Good Level to Capture Retracement?

Gold surged as the greenback came under load following the U.S. Federal Reserve decreased interest rates while risk surrounding a U.S.-China trade agreement supported the metal’s demand as a safe-haven investment.

Prices also took additional help after U.S. weekly jobless claims increased more than anticipated last week. Spot gold rose 0.9% to $1,507.98, having briefly soared to an almost one-week high of $1509.80.

On Wednesday, the U.S. central bank lowered interest rates for the third time in 2019 to accommodate the U.S. growth despite retardation in other regions of the world.

At the moment, gold is trading below the healthy resistance level of 1,514 area, which is pretty much likely to drive the bearish trend in the market.

Gold – Daily Technical Levels
Support Resistance
1485.63    1501.21
1475.6      1506.77
1460.02    1522.36

The leading indicators, such as MACD and Stochastics, are staying in the overbought zone, signaling chances of a bearish reversal in the gold.

Consider taking a sell trade below 1,514 area to target 1,507 today. All the Best!

Categories
Forex Market Analysis

Gold’s Bullish Trendline Breaks Lower – What’s Next?

Gold prices were closed at $1492.540 after placing a high of $1508.2 and a low of $1489.96. The overall trend for Gold remained Bearish at the starting day of the week.

At 17:30 GMT, the International Goods Trade Balance of the United States for September came in as -70.4B against the expectations of -73.5B and supported the US Dollar on Monday. The negative Prelim Wholesale Inventories from the United States for September also helped the US Dollar. It showed a decline to -0.3% from the previous month’s 0.2%.

The robust macroeconomic data from the US at the starting day of the week gave strength to the US Dollar and weighed on Yellow Metal prices in Financial Markets.

The drop in Gold Prices was boosted on Monday after the positive comments from US President, Donald Trump on Trade Deal talks between US & China. Trump told the reporters on Monday that he was expecting to sign a significant portion of the Phase-one deal ahead of schedule. Although he did not mention the time for signing the part of the agreement, the hint of pre-schedule deal signing itself created a large fluctuation in the market.


XAU/USD – Daily Technical Levels

Support Resistance 

1,485.65    1,503.9

1,478.72    1,515.22

1,460.47    1,533.47

Pivot Point 1,496.97

Gold has recently violated the bullish trendline, which was extending Gold an excellent support around 1490. Below this, the market is likely to stay bearish below 1490. On the lower side, the additional support stays at 1,481 today. Whereas, the resistance remains at 1,495.

All the best