Introduction
GBPCHF is the abbreviation for the Great Britain pound and the Swiss franc. Since USD is not involved in this pair, it is called a minor currency pair. However, there is an excellent liquidity and volatility in this pair. In this pair, GBP is the base currency, and CHF is the quote currency. GBPCHF is often referred to as “pound Swiss franc.”
Understanding GBP/CHF
The value of GBPCHF determines the Swiss francs required to purchase one pound. It is quoted as 1 GBP per X CHF. For example, if the value of GBPCHF is 1.2740, then one needs to pay 1.2740 Swiss francs to buy a pound.
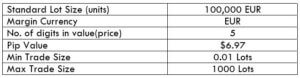
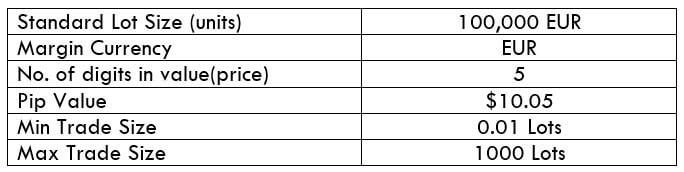
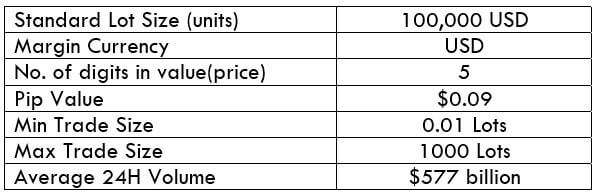
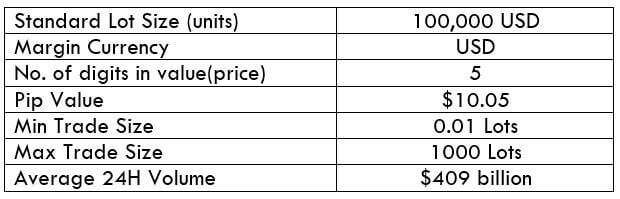
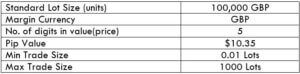
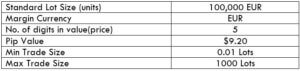
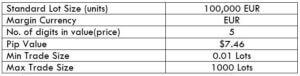
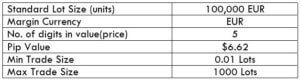
GBP/CHF Specification
Spread
Spread is the difference between the bid price and the ask price in the market. The bid price is the price used for shorting, and the bid price is the price used for buying a currency pair. These prices differ from broker to broker as well as the account type.
ECN: 0.8 | STP: 1.6
Fees
For every trade a trader takes, there is a fee associated with it. This fee is basically the commission charged by the broker. This fee varies from broker to broker. Note that there is no fee on STP accounts, and on ECN accounts, the fee is around 6 to10 pips.
Slippage
Slippage in trading is the difference between the price requested by the trader and the price given by the broker. Due to variation in volatility and the broker’s execution speed, it is not quite possible to get the exact intended price. Slippage happens only on market orders.
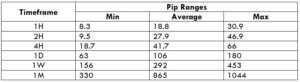
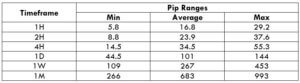
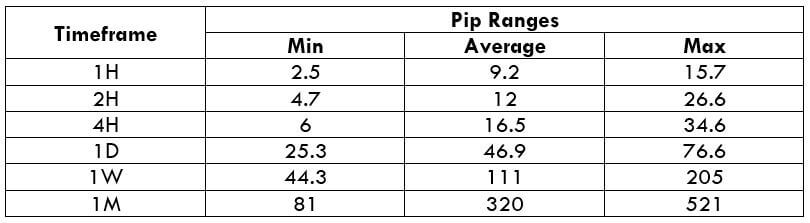
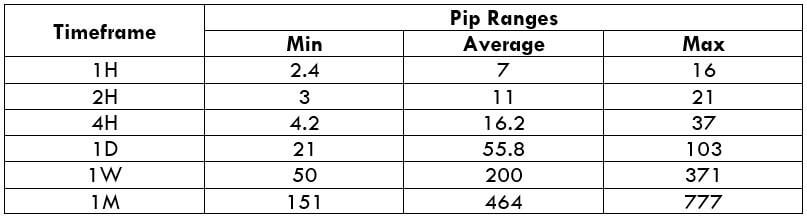
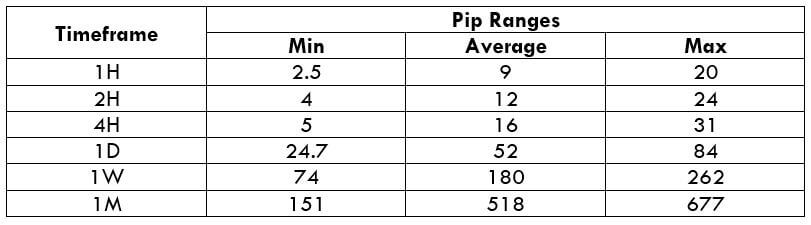
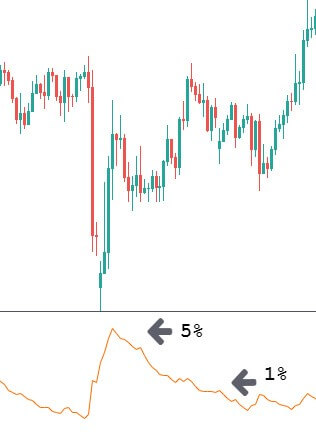
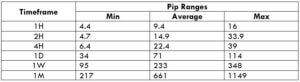
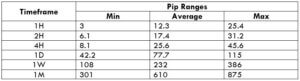
Trading Range in GBP/CHF
Knowing the number of pips the currency pair moved in a given timeframe is a good add-on to a trader’s analysis. This will help them get an idea of the profit/loss that can be made in a specified amount of time. For example, if the average pip movement on the 1D timeframe is 50 pips, then a trader can expect to gain or lose $517.5 (50 pips x 10.35 value per pip).
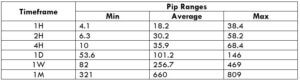
Procedure to assess Pip Ranges
- Add the ATR indicator to your chart
- Set the period to 1
- Add a 200-period SMA to this indicator
- Shrink the chart so you can determine an extensive period
- Select your desired timeframe
- Measure the floor level and set this value as the min
- Measure the level of the 200-period SMA and set this as the average
- Measure the peak levels and set this as Max.
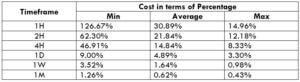
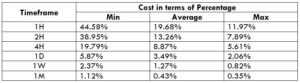
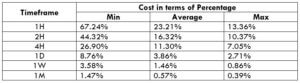
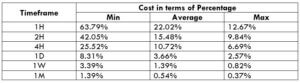
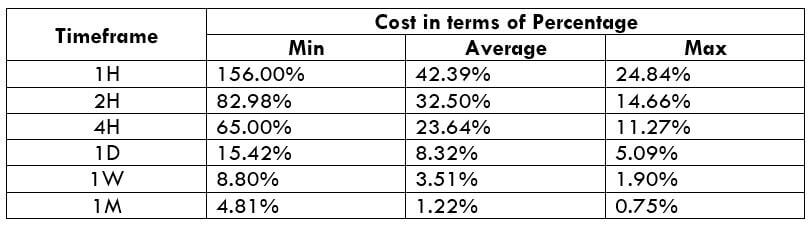
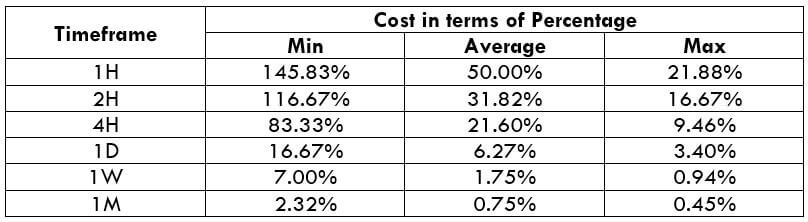
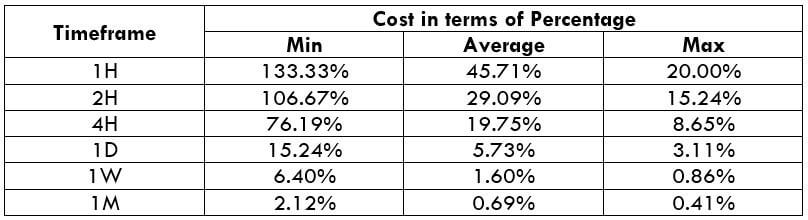
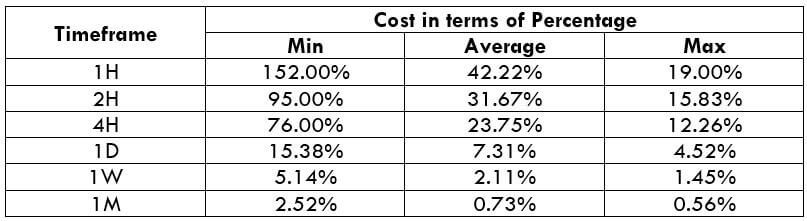
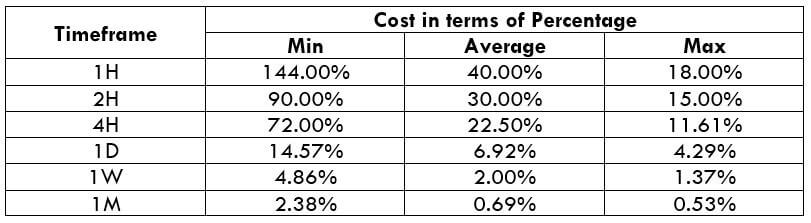
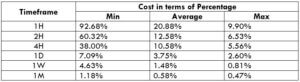
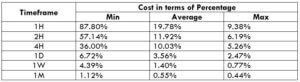
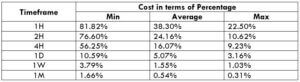
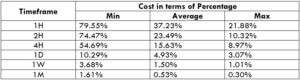
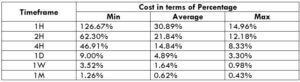
GBP/CHF Cost as a Percent of the Trading Range
The cost as a percent of the trading range depicts the magnitude of the variation in the cost in different timeframes for different variable volatility. The percentages are useful in determining the ideal time to enter into this currency pair with marginal costs. Below are the tables representing the cost percentages for minimum, average, and maximum volatility.
ECN Model Account
Spread = 0.8 | Slippage = 2 |Trading fee = 1
Total cost = Slippage + Spread + Trading Fee = 2 + 0.8 + 1 = 3.8
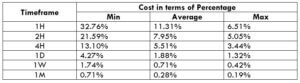
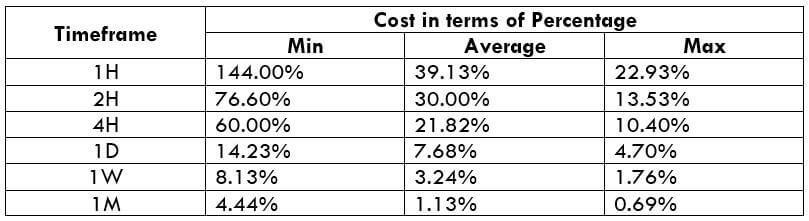
STP Model Account
Spread = 1.6 | Slippage = 2 | Trading fee = 0
Total cost = Slippage + Spread + Trading Fee = 2 + 1.6 + 0 = 3.6
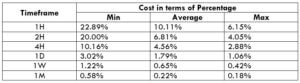
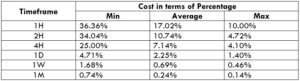
The Ideal way to trade the GBP/CHF
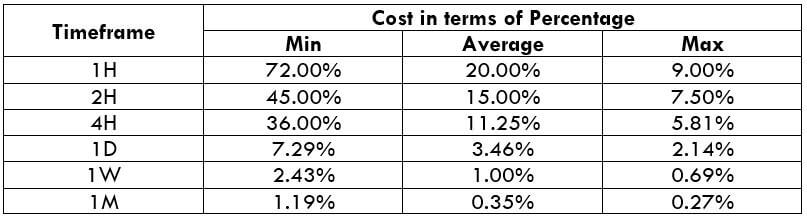
The lower the percentage, the lower are cost on the trade. In the table, we can infer that the costs are on the lower side in the max column. This implies that the cost of the trade is less when the volatility of the market is low and vice versa. Now, when it comes to the best time to trade this pair, it is ideal to pick at times when the volatility is decent, and the costs are affordable. For example, a 1D trader may trade during those times when the volatility is around 100 pips.
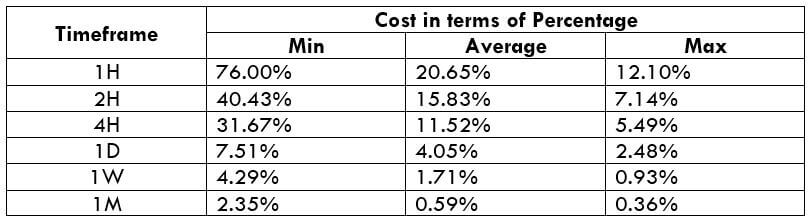
Moreover, the total cost of the trade can be reduced by entering and exiting trades using limit/pending orders. This way, the slippage on the trade will be fully cut off. The impact on the cost percentage when slippage is made 0 is shown below.
Total cost = Spread + trading fee + slippage = 0.8 +1 + 0 = 1.8
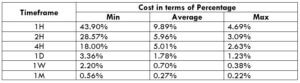
From the above table, it is evident that the costs have reduced by over 50% or so. Hence, it is preferable to trade using limit orders rather than market orders.


 Spread