General overview
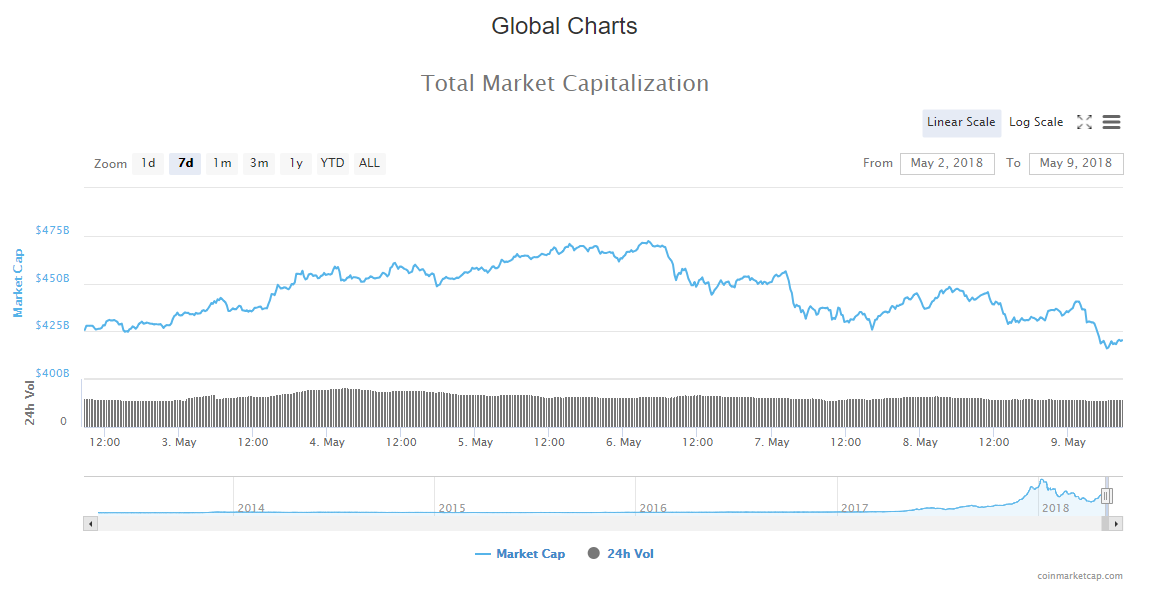
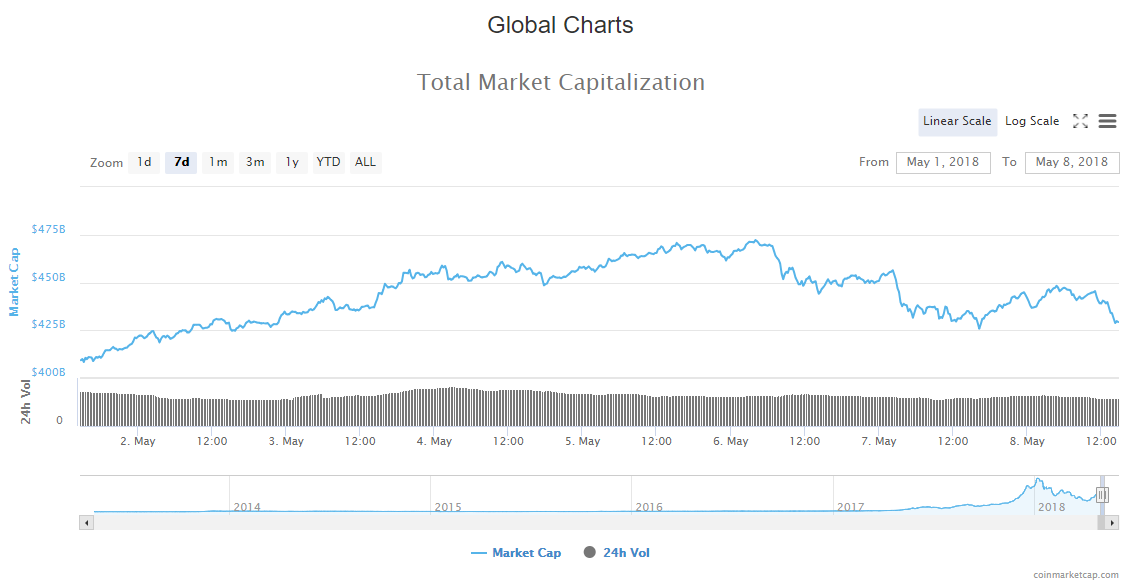
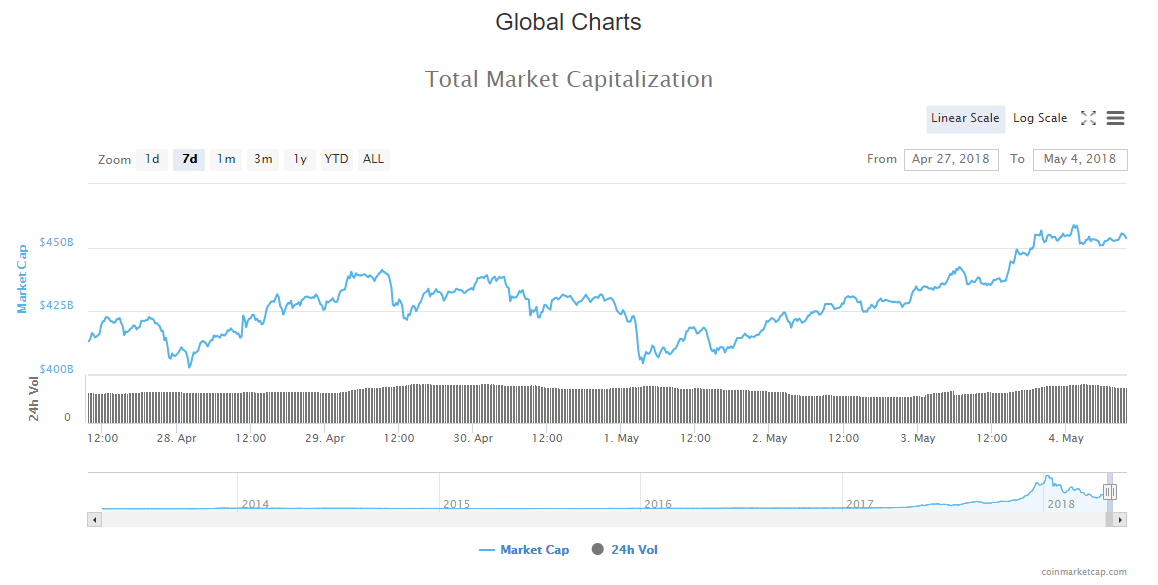
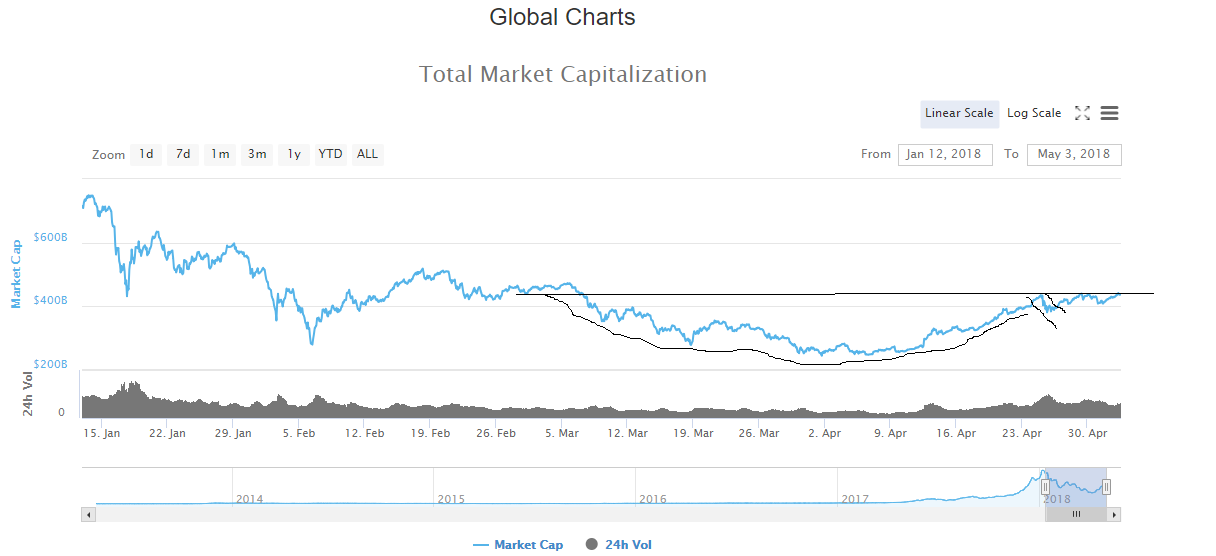
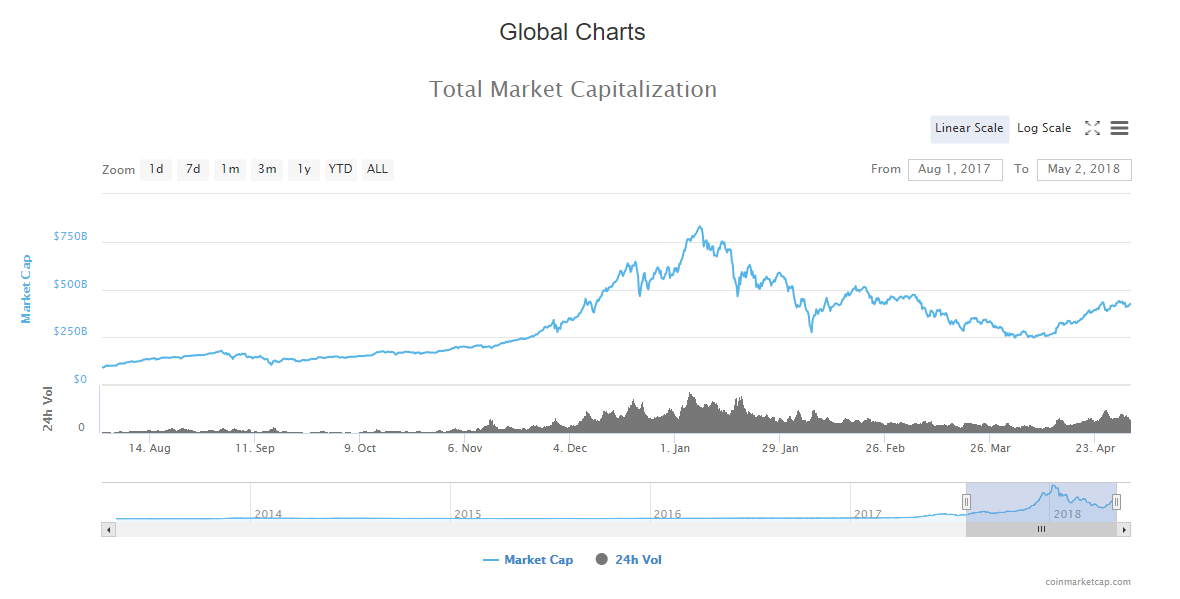
Market Cap: $436,647,549,448
24h Vol: $21,548,371,124
BTC Dominance: 36.5%
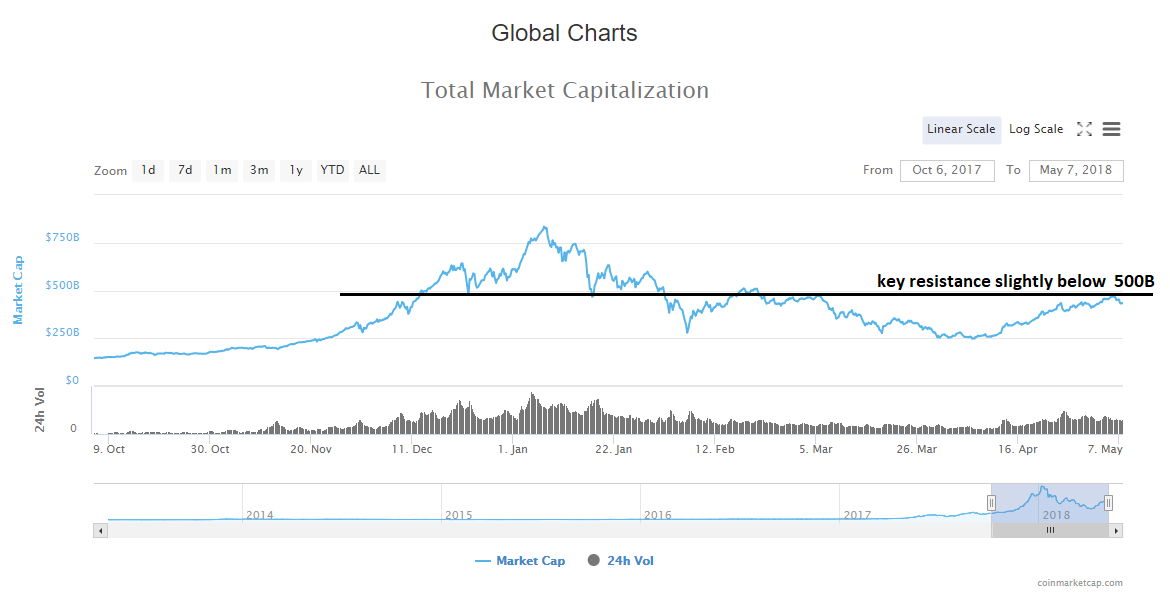
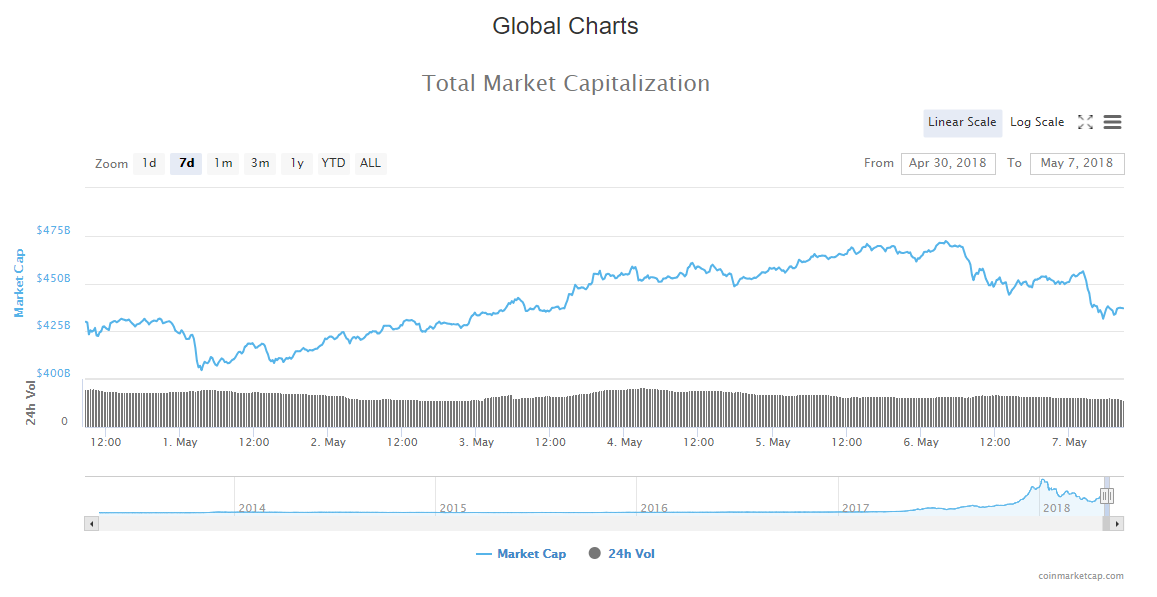
In the last 24 hours cryptocurrency market cap fell from 440,625,000,000$ to 415,985,000,000$ and rose to around 435B where is forming a platoon

News
There’s a lot of positive news that came out regarding adoption and usage of cryptocurrency and blockchain technology in the last 24 hours. These are some of the significant headlines:
- Bloomberg: 7% Of Bitcoin Supply Held In Cold Storage Vaults By One Company
- NYSE’s Plans For ‘Physical Delivery’ Of Bitcoin Pave Way For Major Crypto Adoption, Analysts Say
- Global Telecoms Firms Successfully Test Blockchain System For Inter-Carrier Settlement
- First Version of Ethereum’s Casper Update Has Been Released
- China’s 2nd Largest Bitcoin Mining Hardware Producer Plans To Launch $1 Bln IPO In Hong Kong
- Belarus To Introduce Education, Income Requirements To Invest In ICOs, Crypto
- Winklevoss Twins Gain Fifth Patent For Exchange-Traded Products Using Crypto
- New Report On Crypto Ownership Shows ‘Majority Of Early Adopters Already On Board’
- Bloomberg Partners Novogratz’s Galaxy Digital Capital To Release Crypto Benchmark Index
- Chinese Social App WeChat Suspends Third-party Blockchain App
- Survey: 30% Of Financial Executives To Commit Resources To Blockchain
- US: West Virginia Completes First Blockchain-Supported State Elections
Source: cointelegraph.com
Analysis
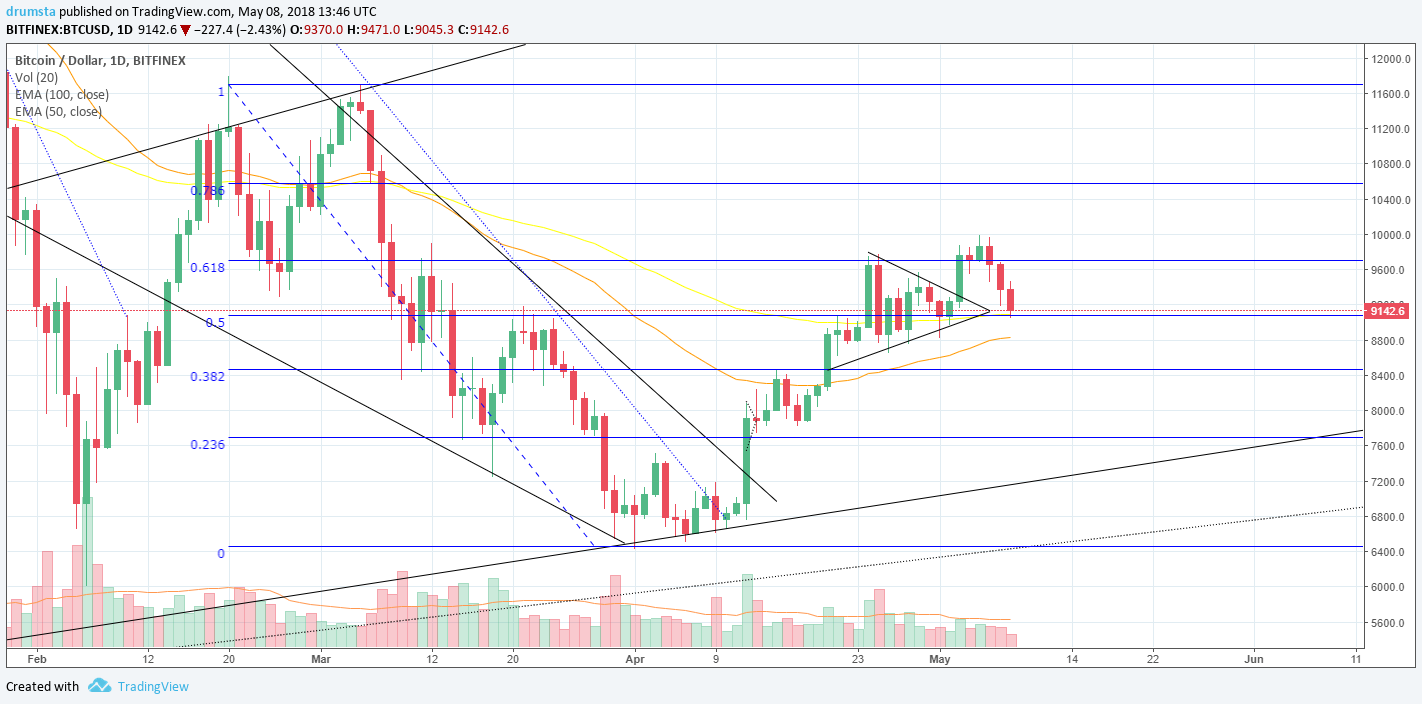
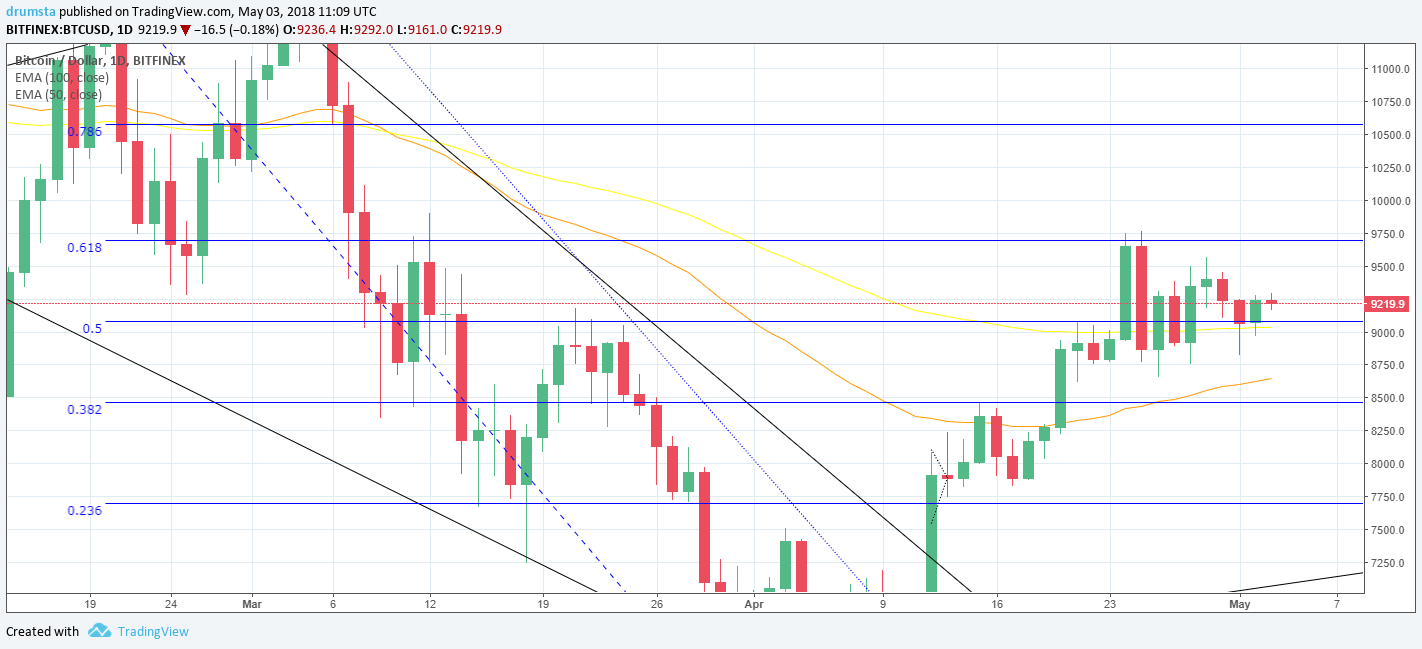
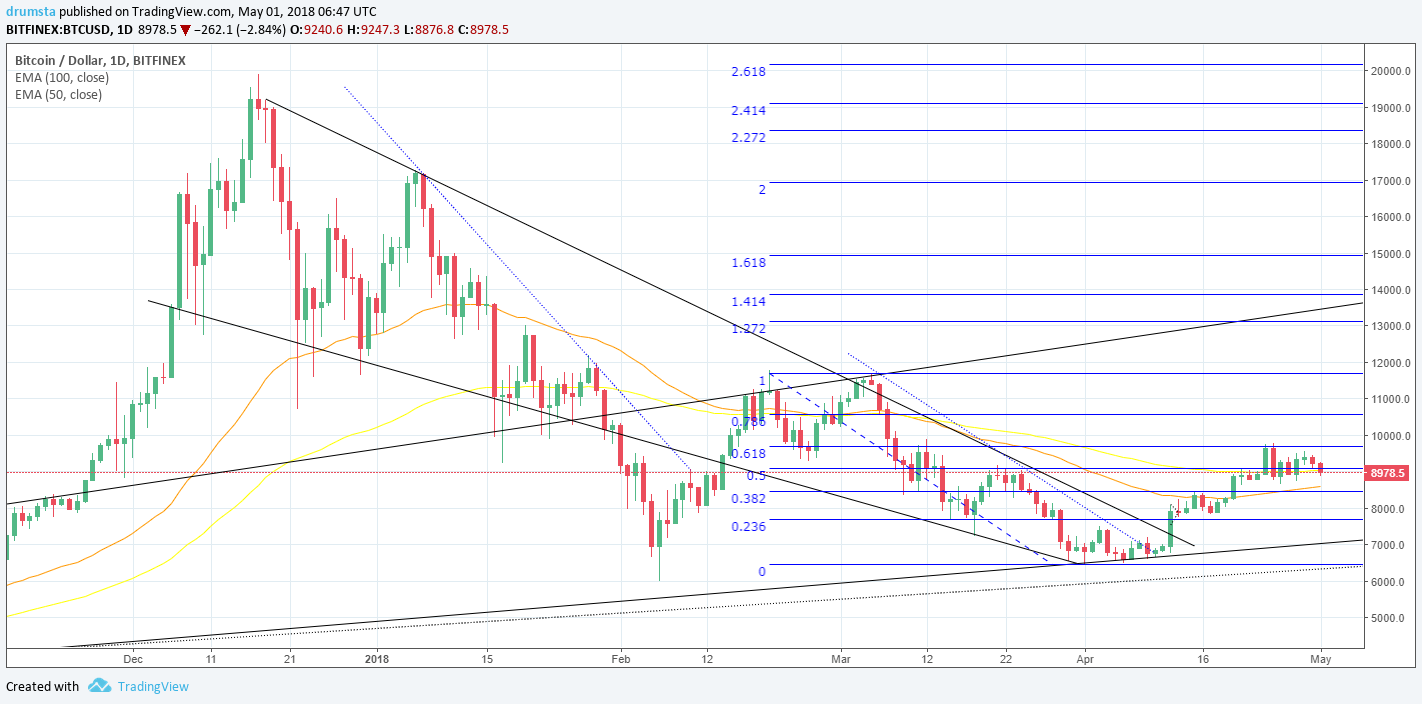
BTC/USD
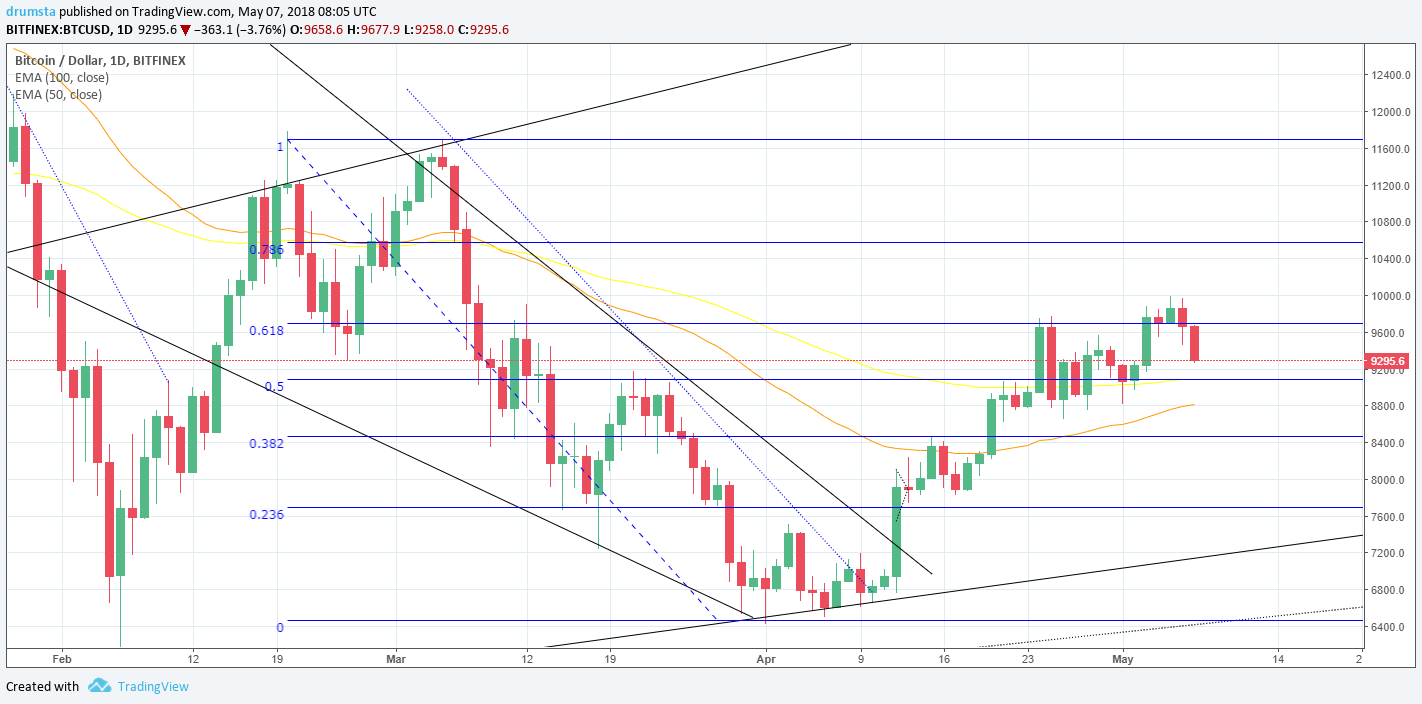
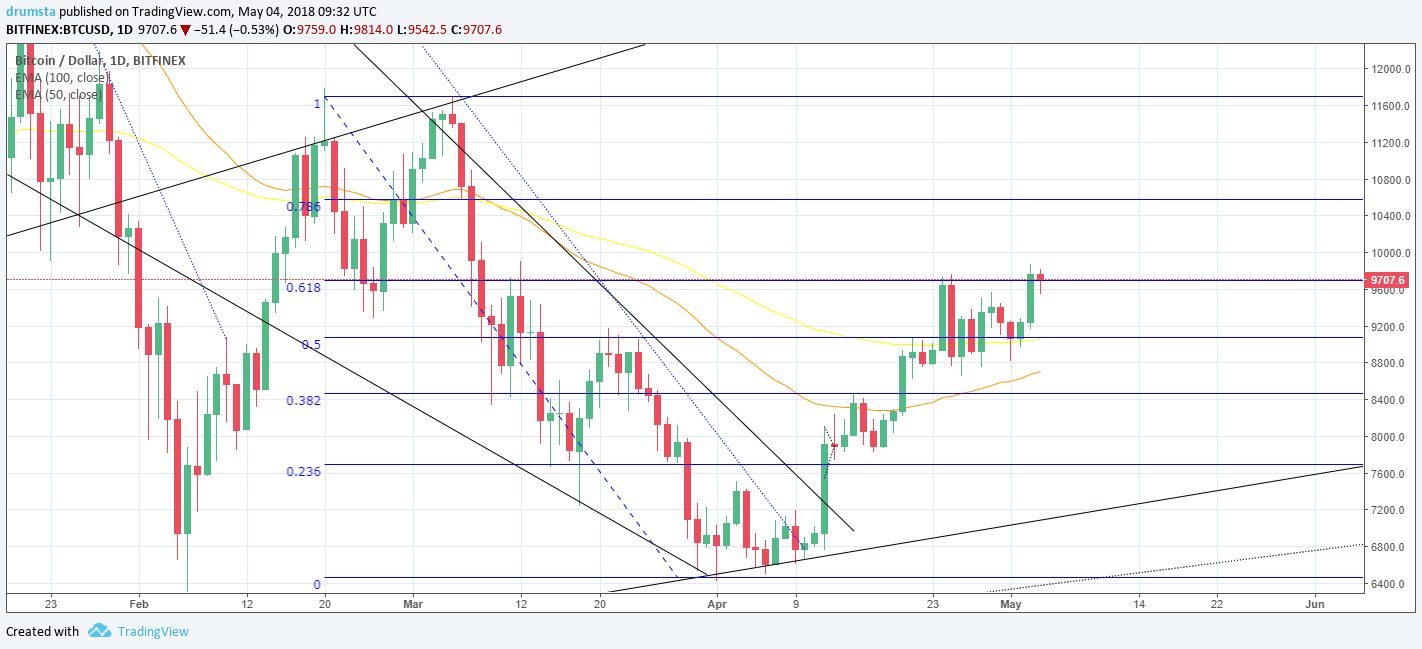
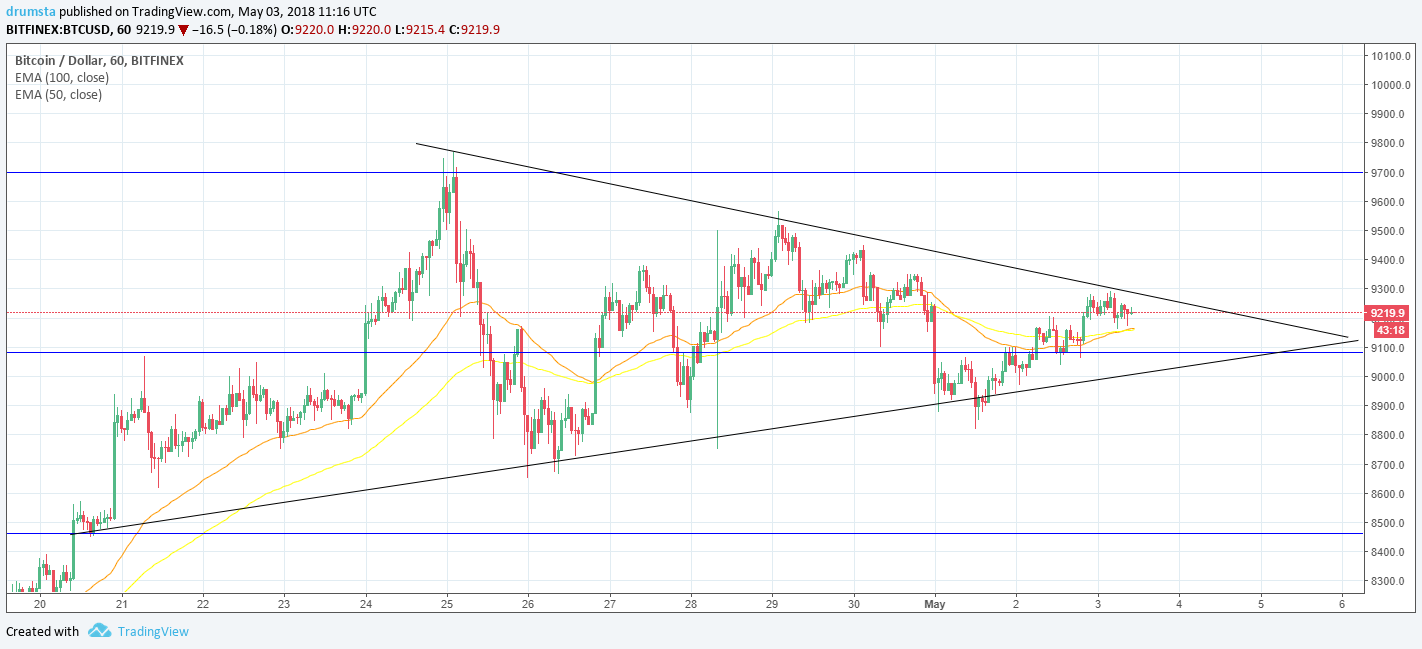
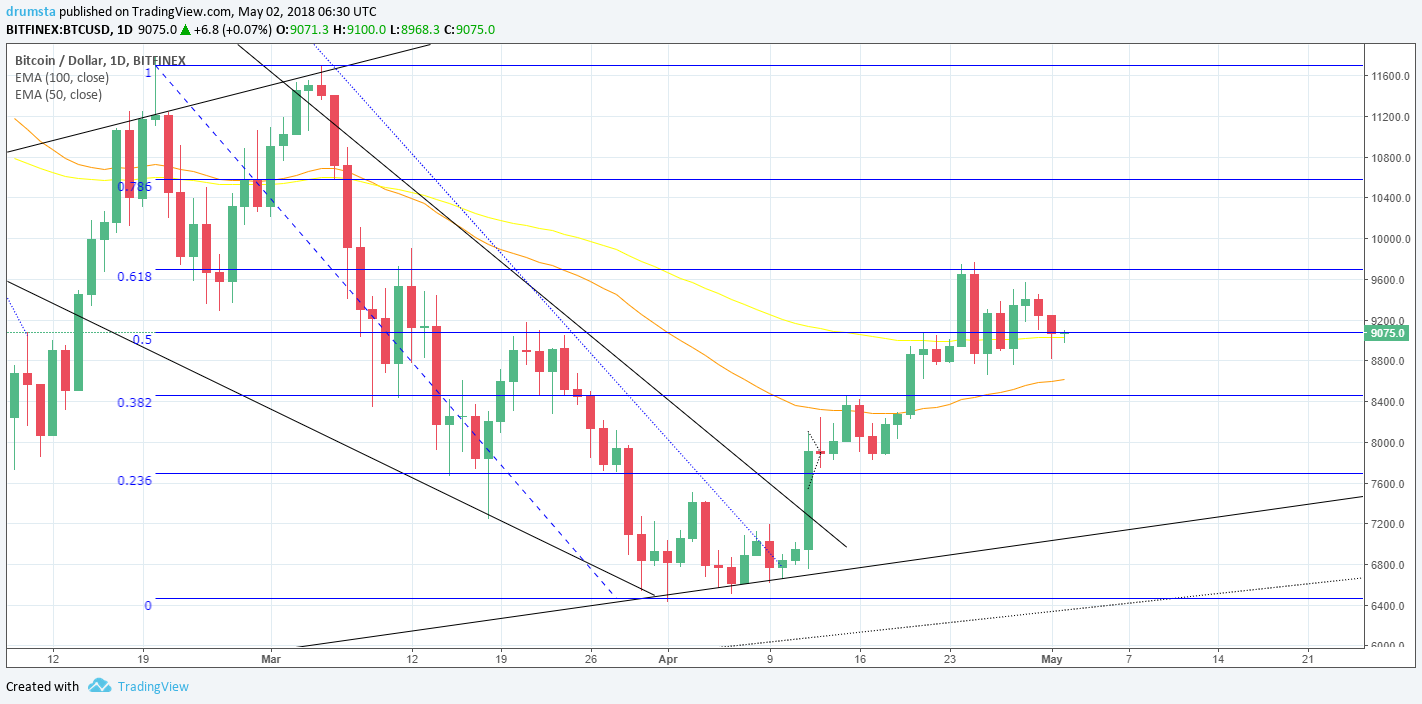
From yesterdays open till now the price of Bitcoin has increased by 2,17% – from 9180$ to 9367 where it is now.
Looking at the daily chart we can see that the price found support at 0.5 Fibonacci level and 100 day EMA, bouncing off of them. The current candle is green and higher than yesterdays which is a bullish sign.
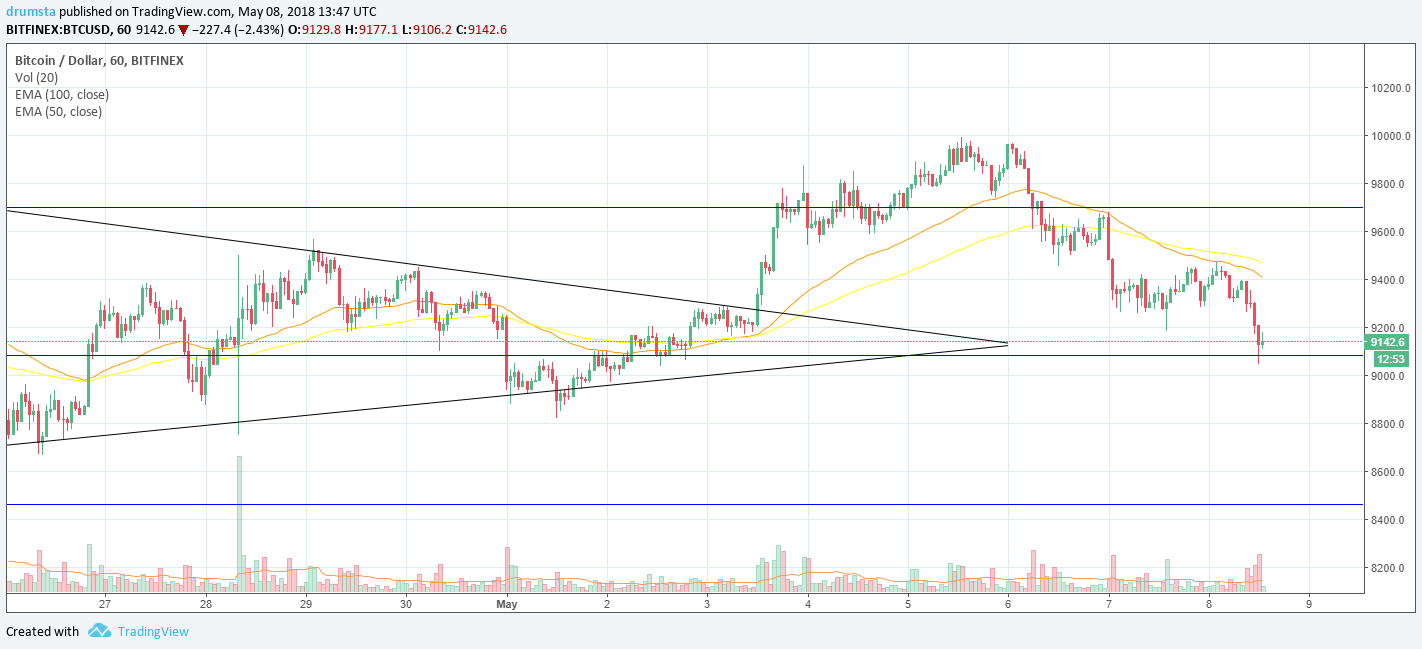
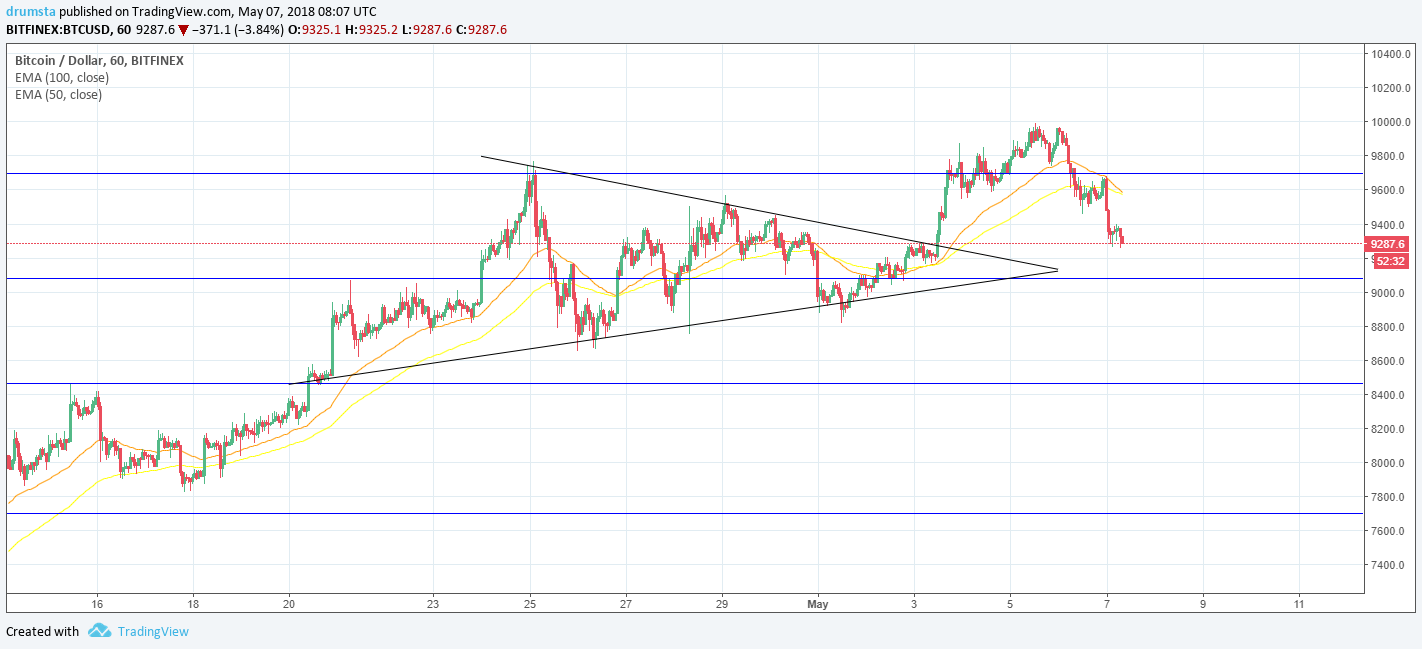
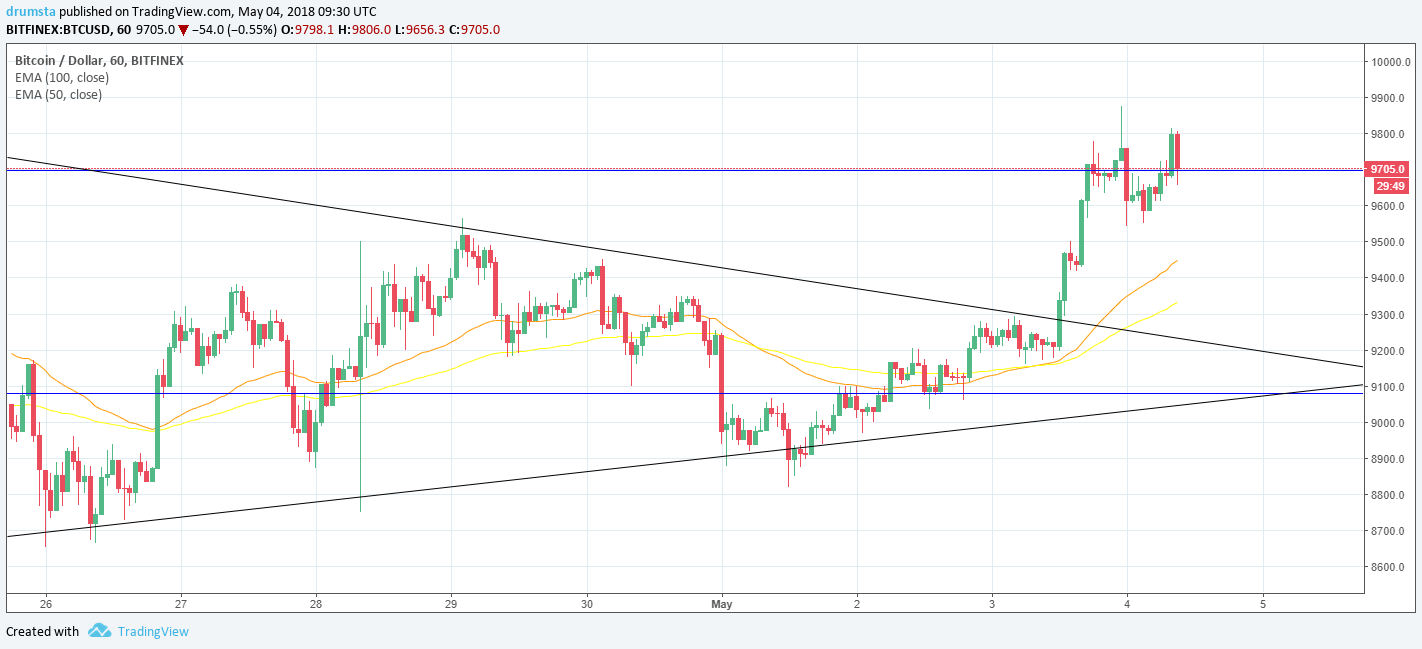
Zooming into an hourly chart, we see that the price is above 0.236 Fibonacci extension level, and above 100 hourly EMA.
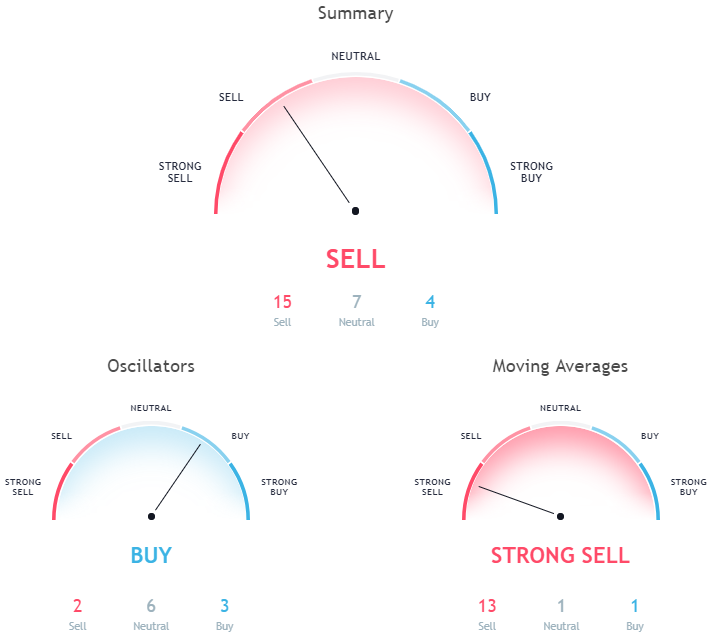
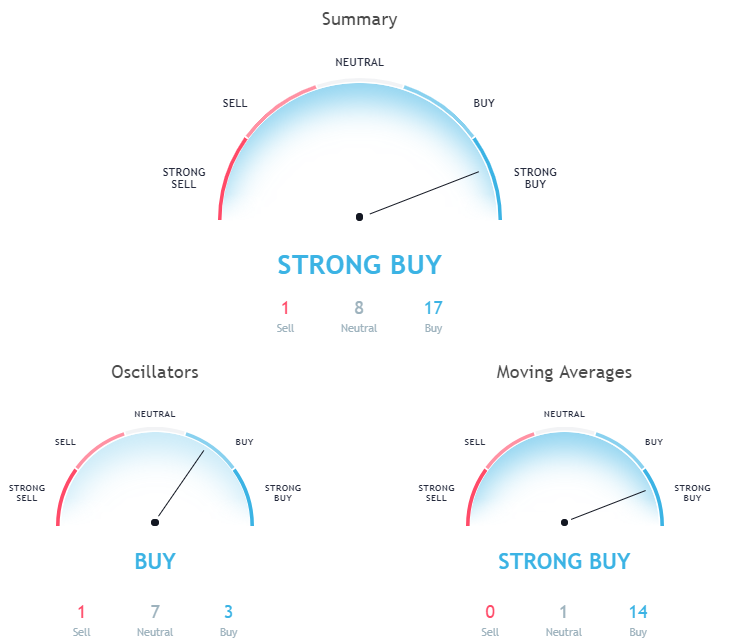
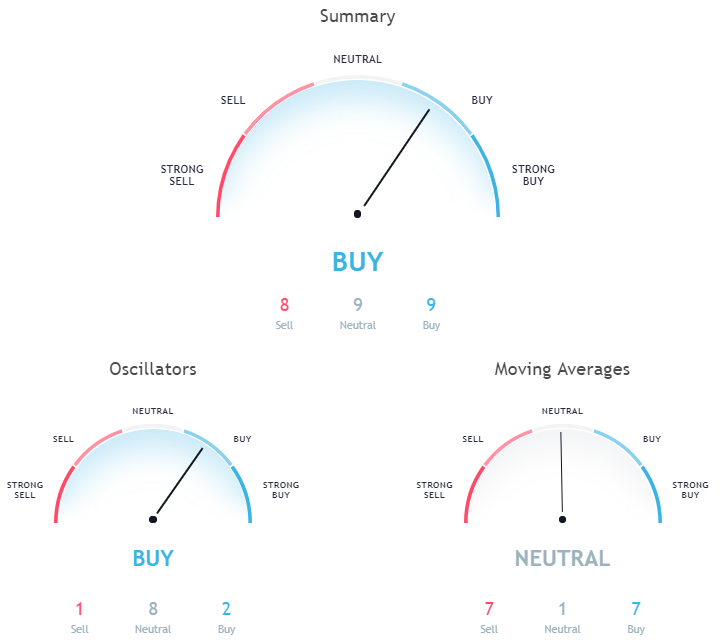
Market Sentiment
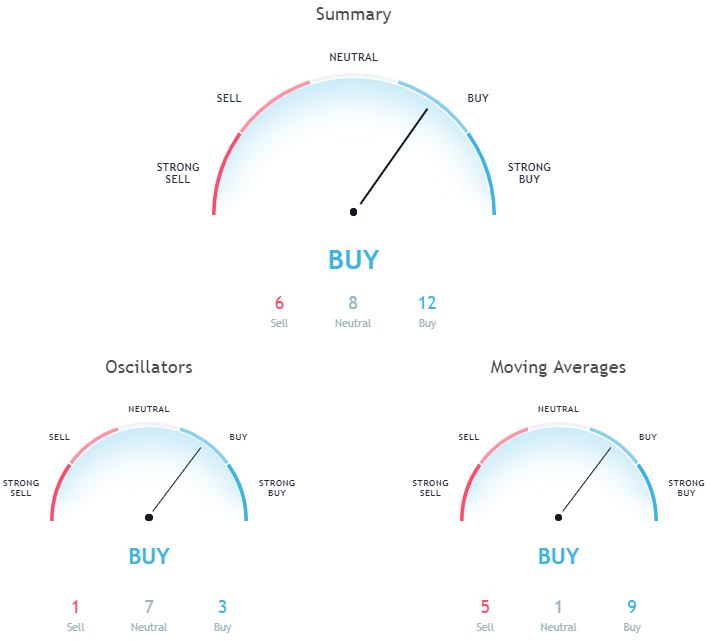
Hourly chart technicals signal a buy.
Pivot points
S3  8433.1
S2  8828.9
S1  9073.5
P   9224.7
R1  9469.3
R2  9620.5
R3 10016.3
ETH/USD
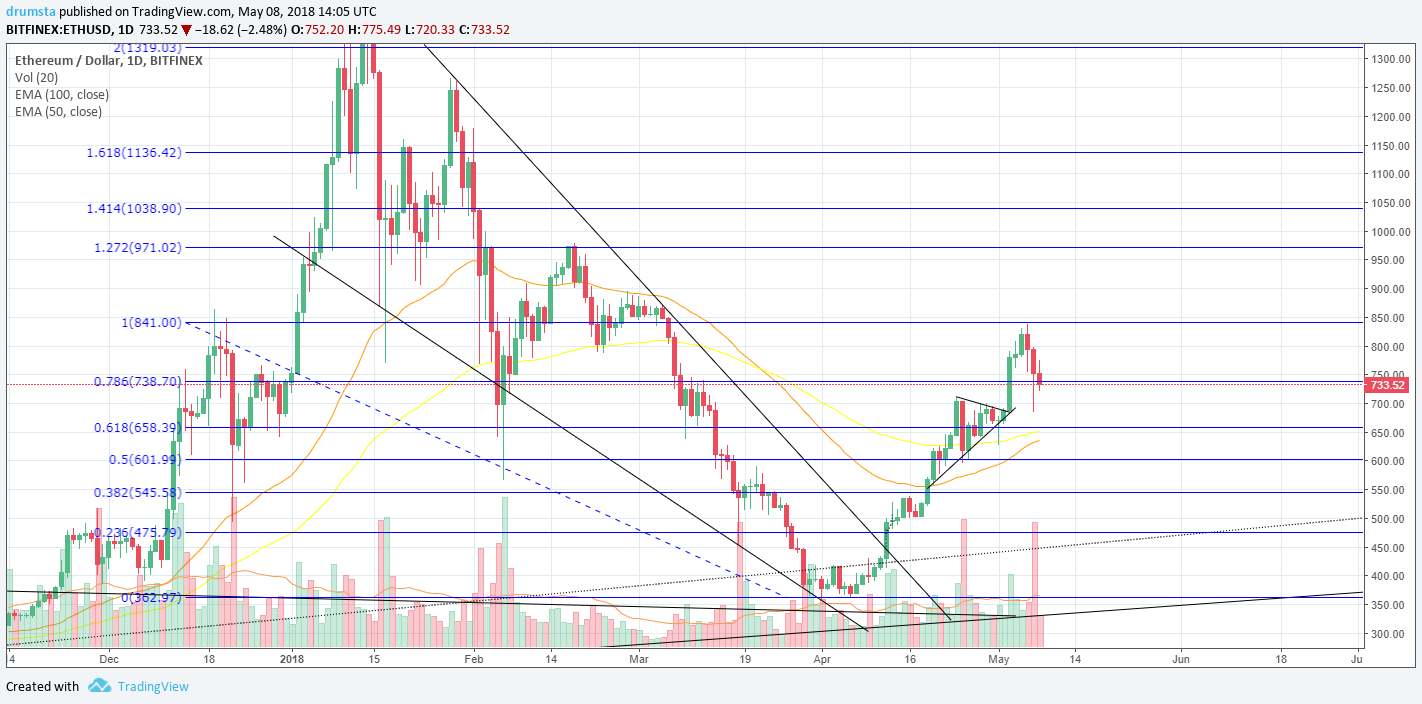
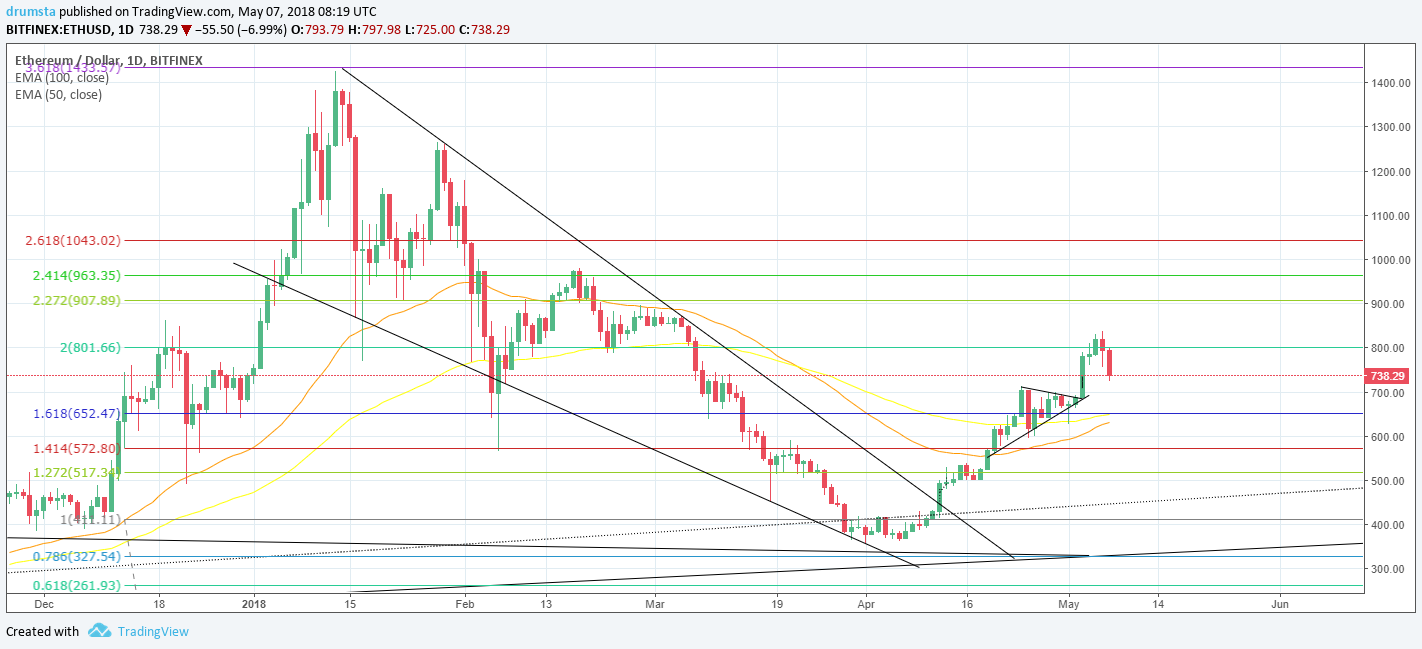
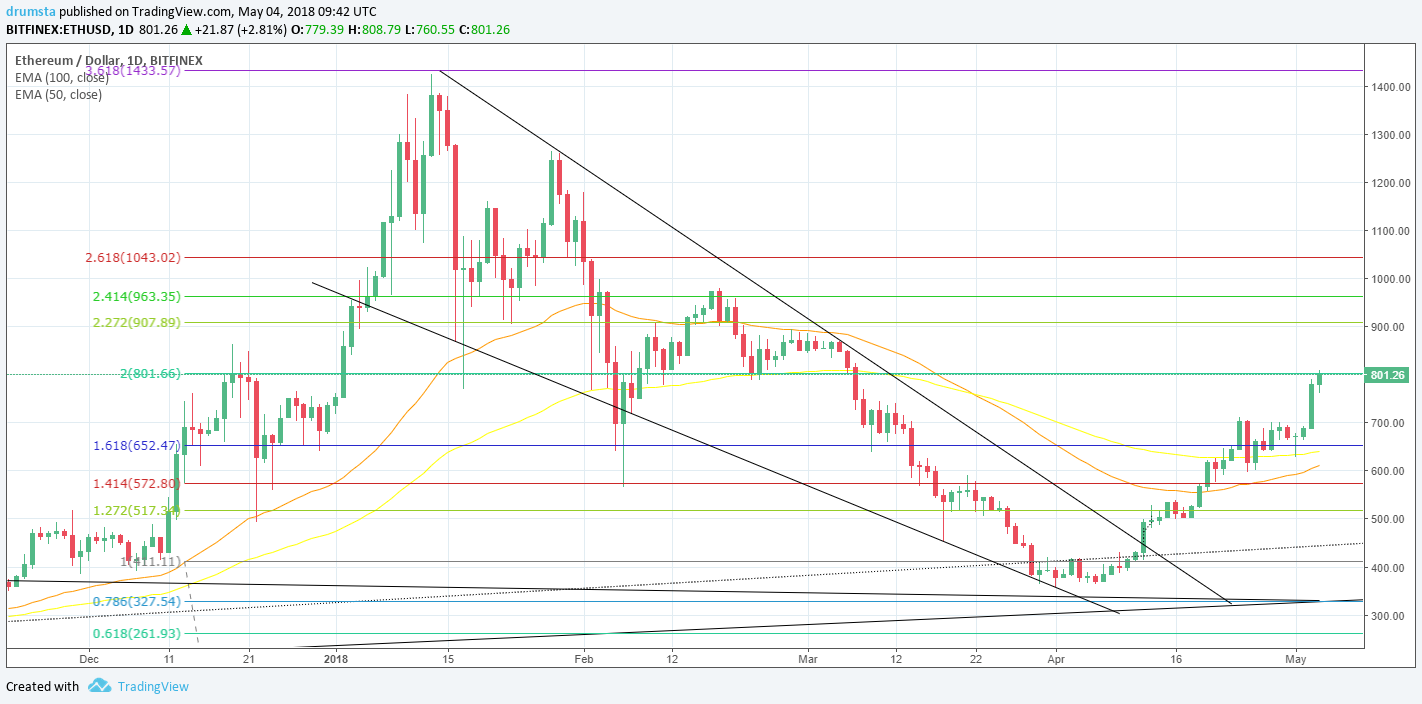
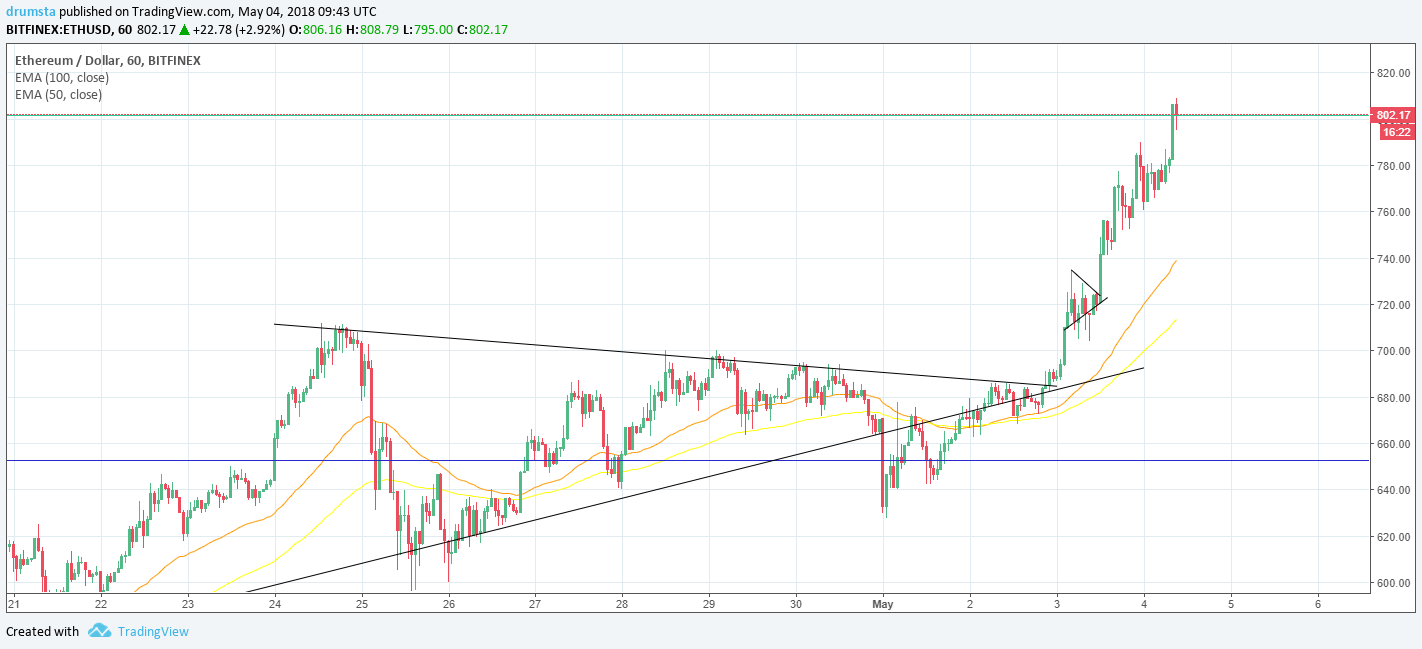
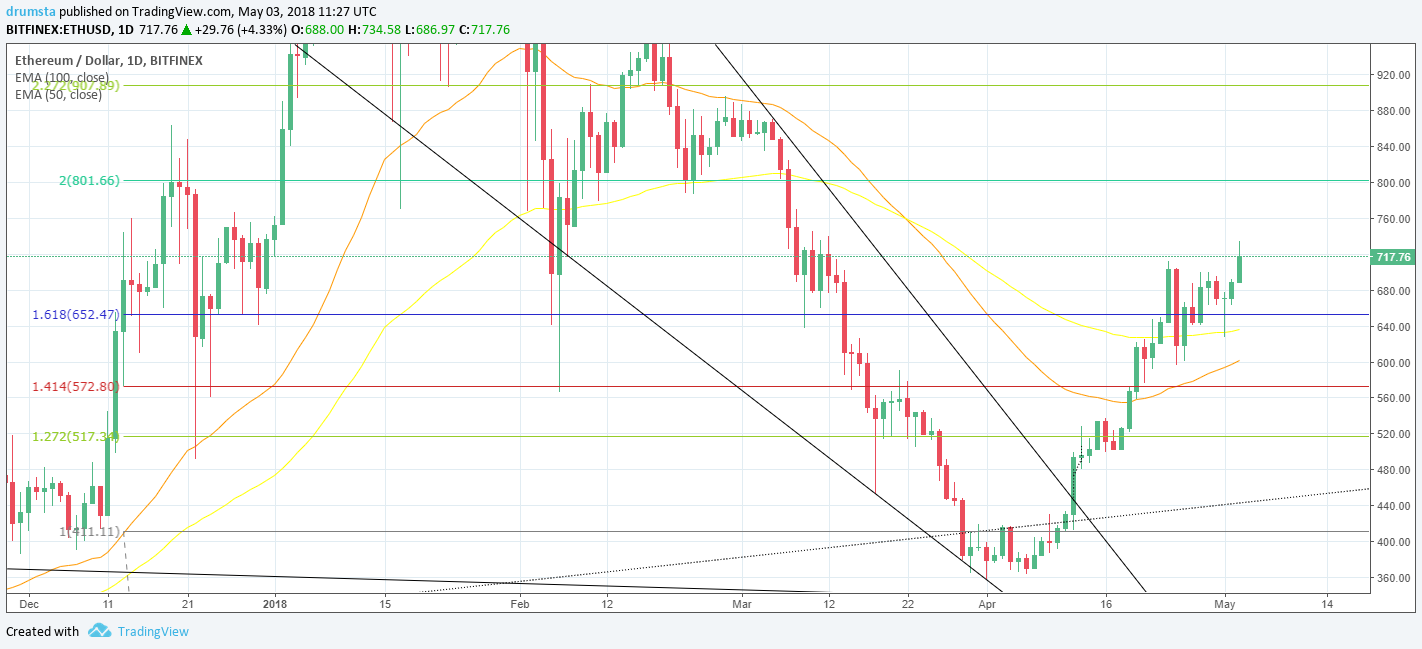
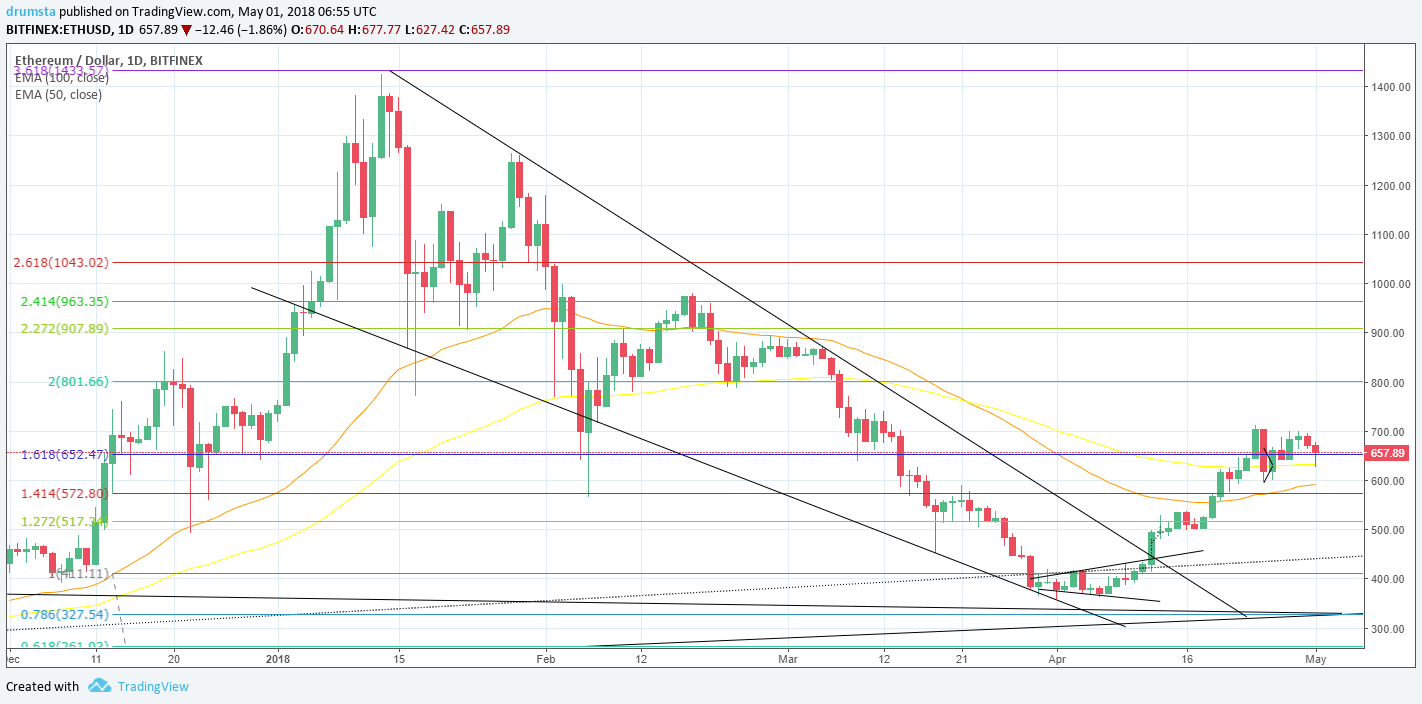
In the last 24 hours the price of Ethereum been going down from 745$ to 715$ and them up to 764$ where it is now sitting, which is an overall increase of 2,17%.
Daily chart looks bullish, as the price found support at 0,618 Fibo level and the yesterday’s candlestick is showing a lot of buying pressure, as indicated by the wicks. It looks like 50 EMA is about to cross the 100 days EMA from above, which would indicate the start of an uptrend.
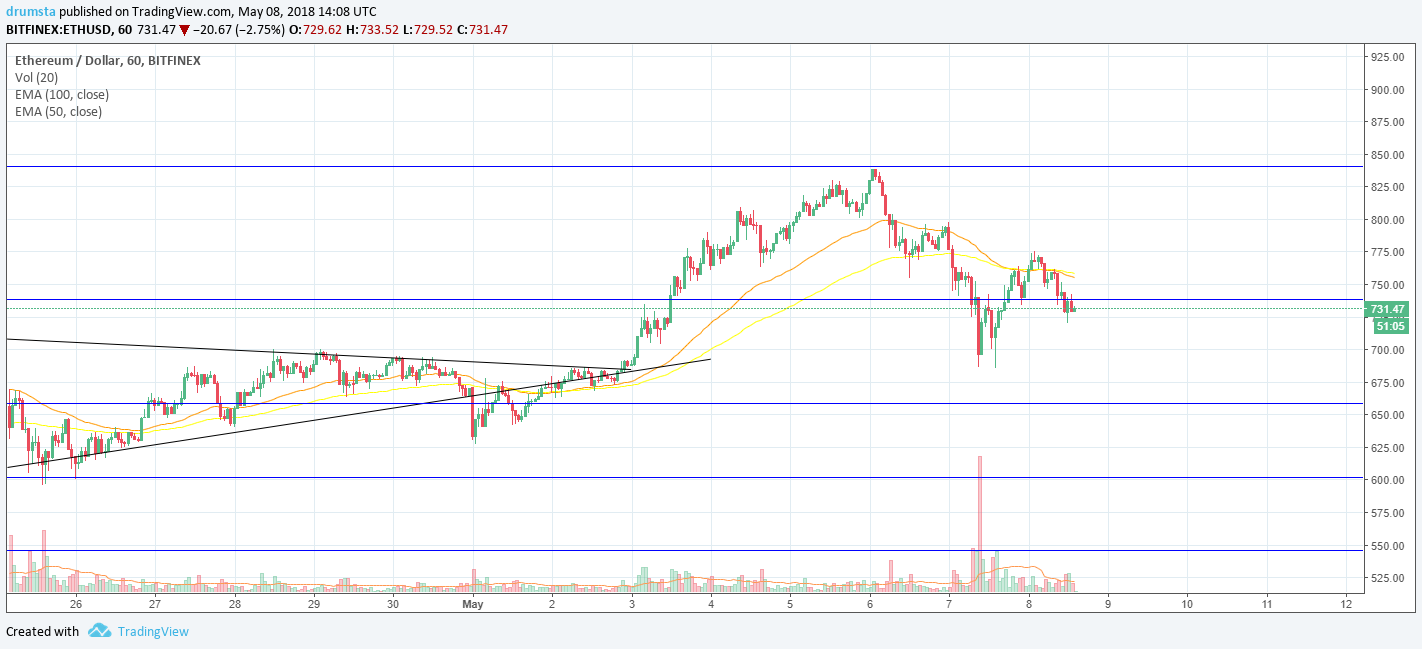
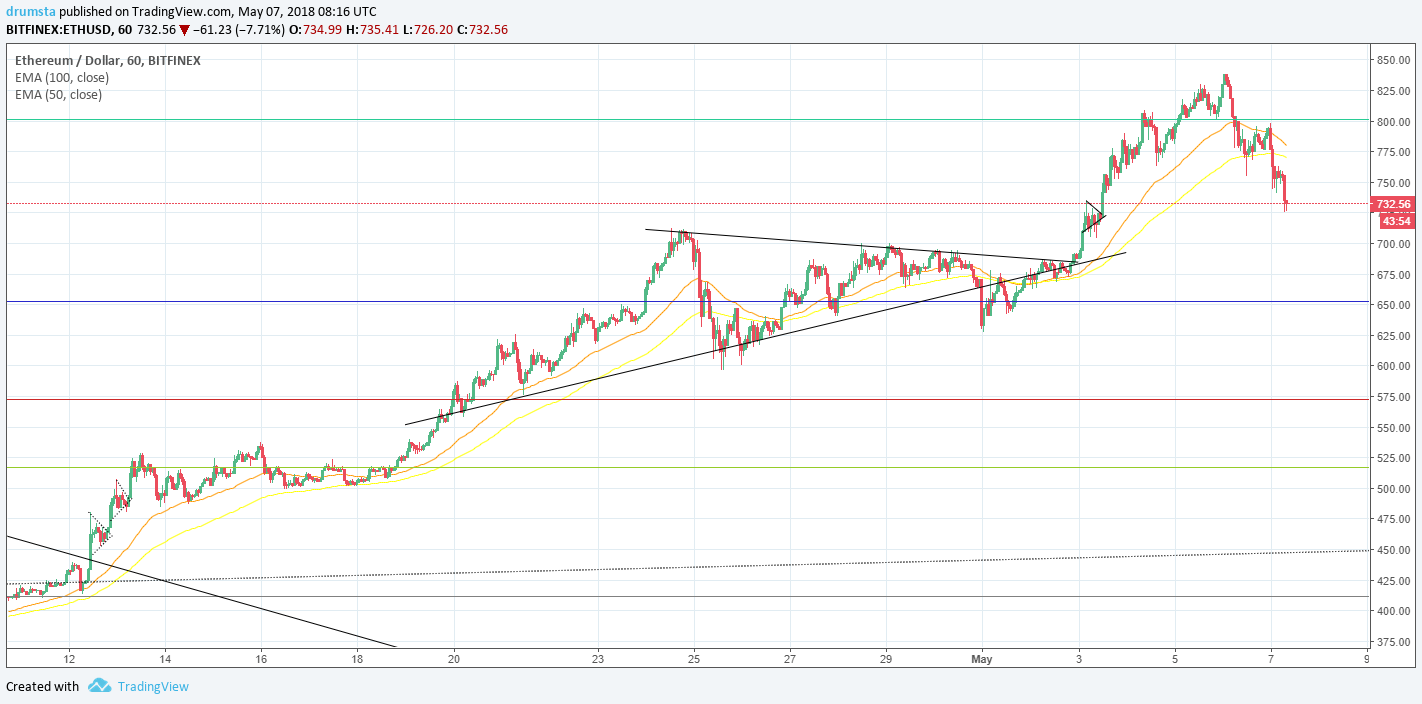
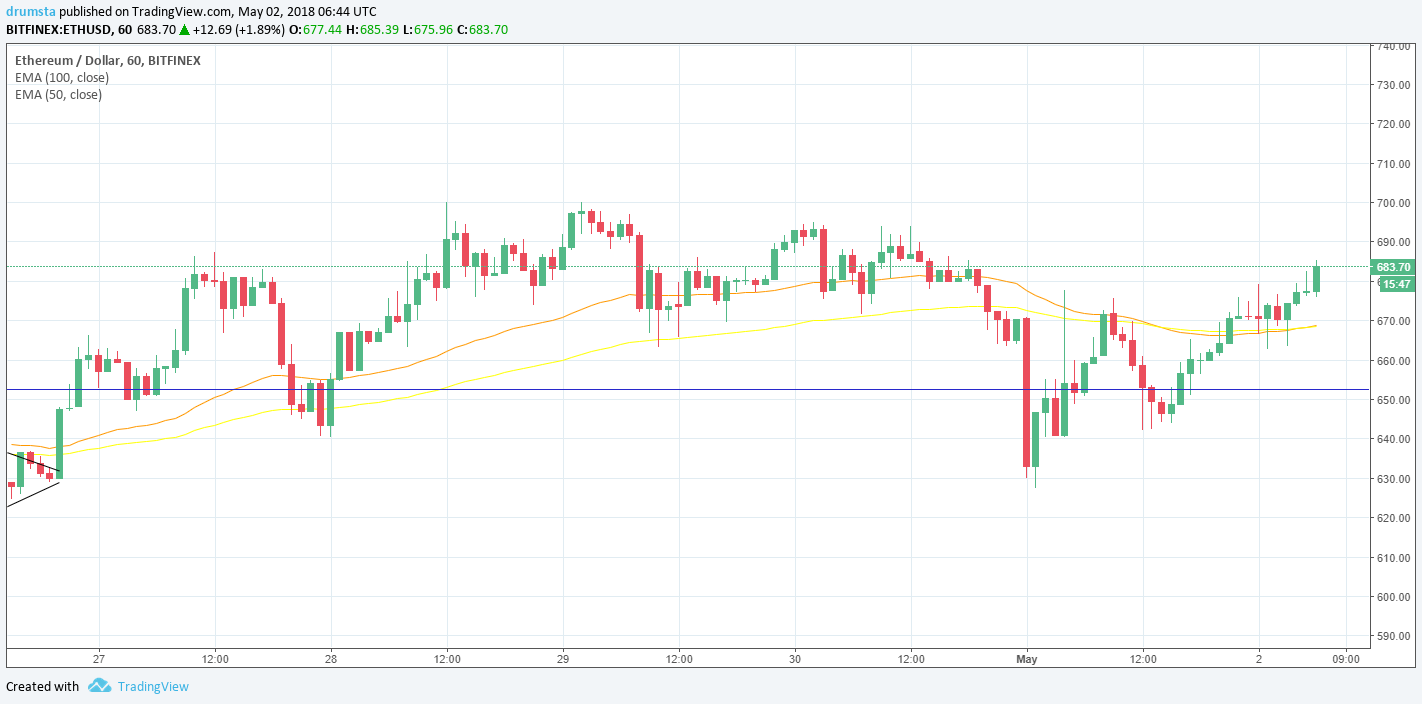
On an hourly chart, there is a triangle in which the price of Ethereum consolidated in what it looks like to be an ABCDE correction. As you can see the price broke out of it, retraced back for a retest and continued back up, which is a bullish sign. Hourly EMA’s are starting to cross, which would signal a start of an uptrend.
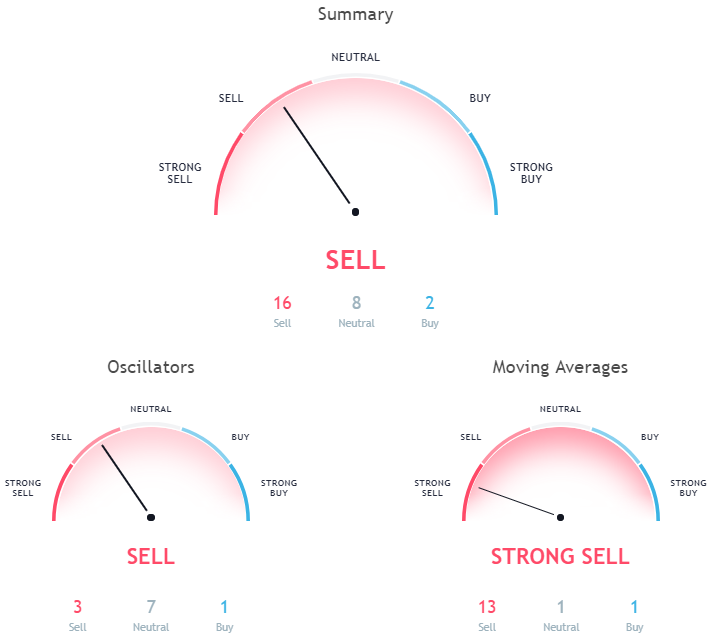
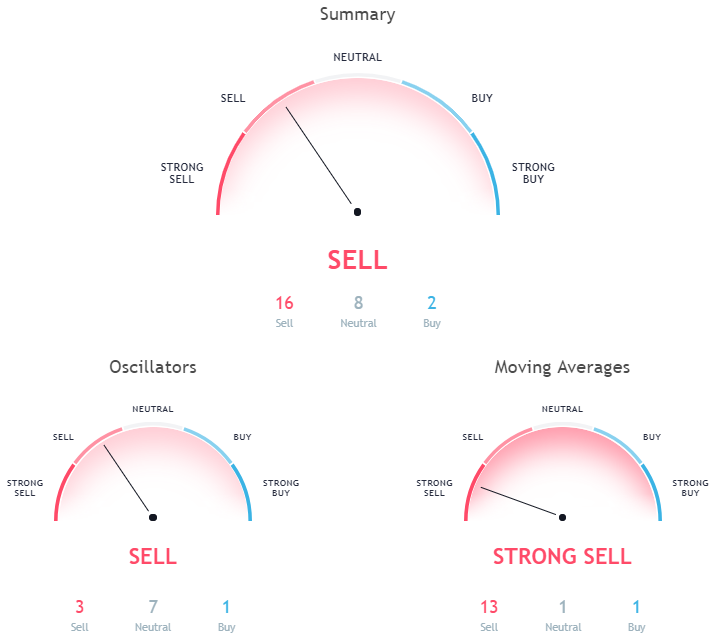
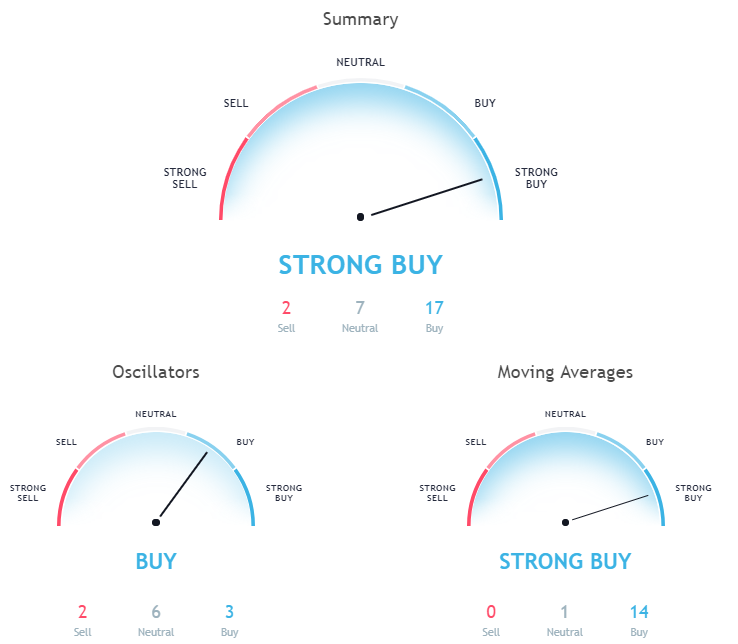
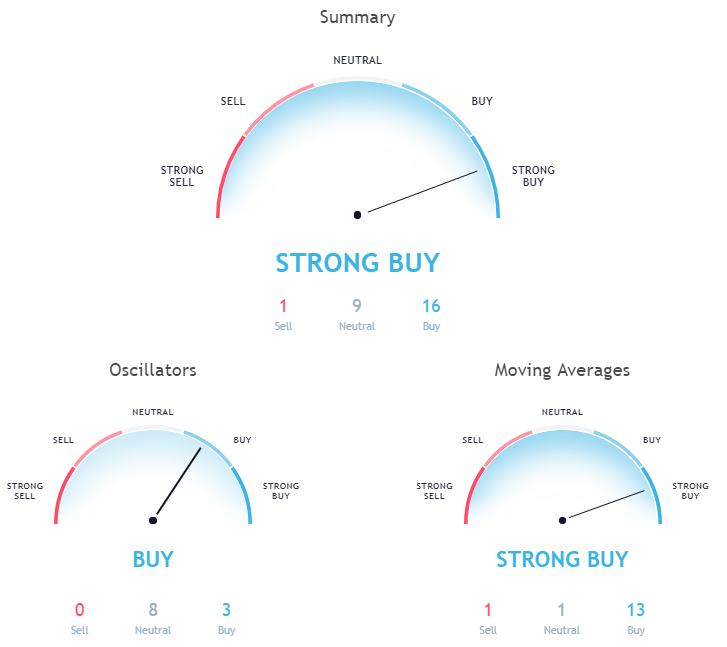
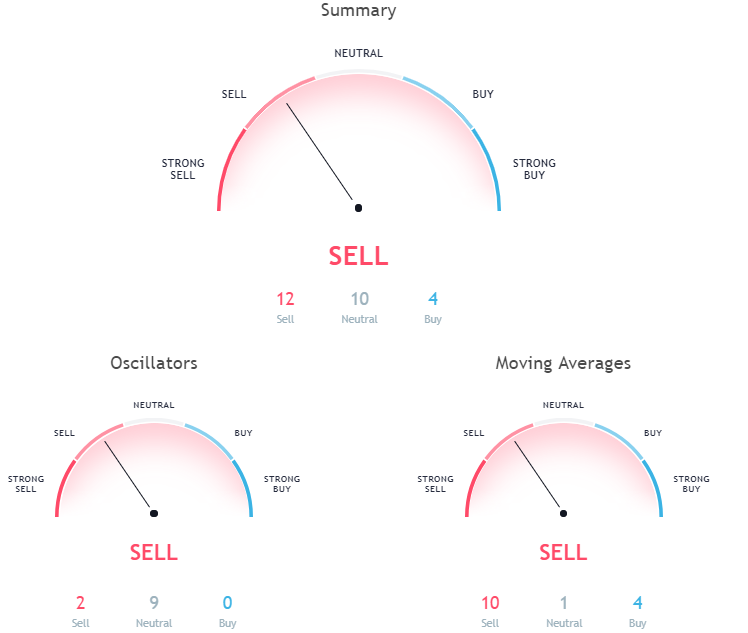
Market Sentiment
Hourly chart signals a buy

Pivot points
S3 639.94
S2 690.35
S1 721.10
P  740.76
R1 771.51
R2 791.17
R3 841.58
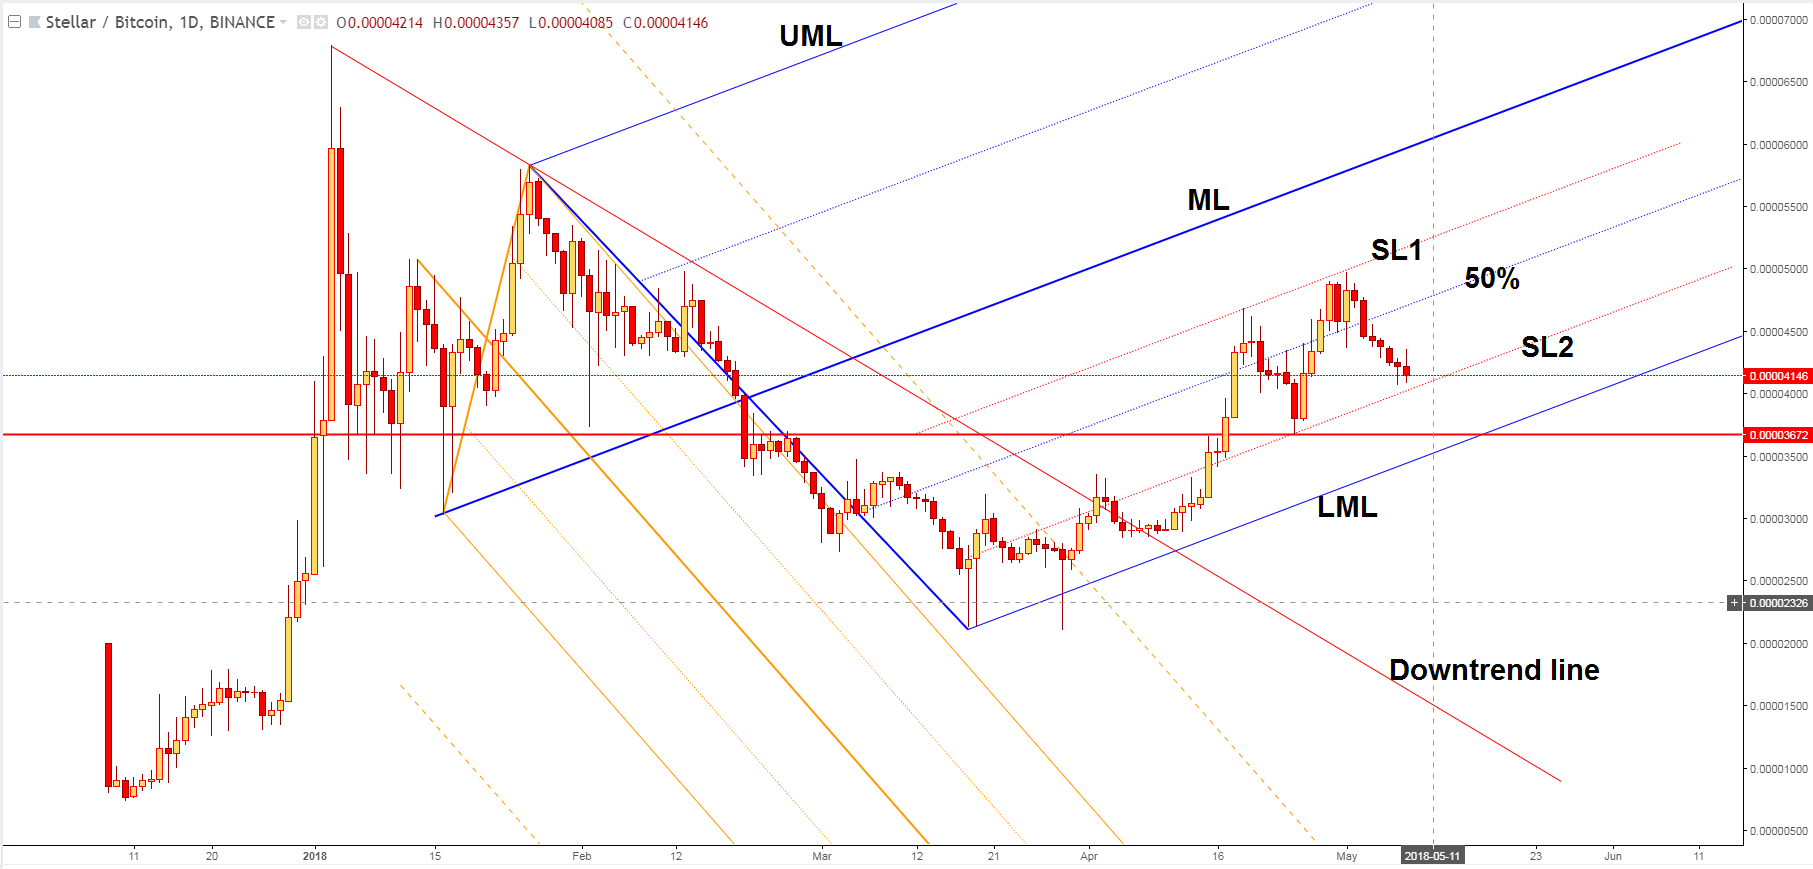
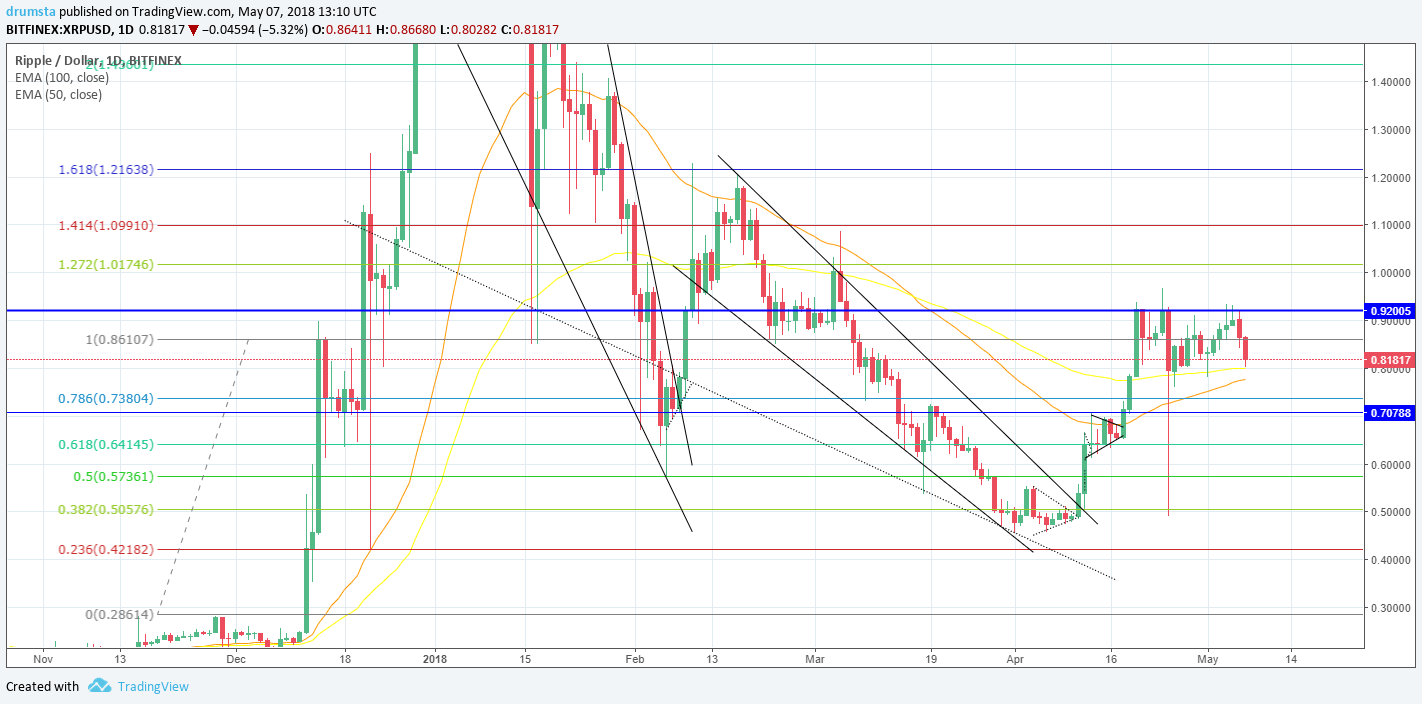
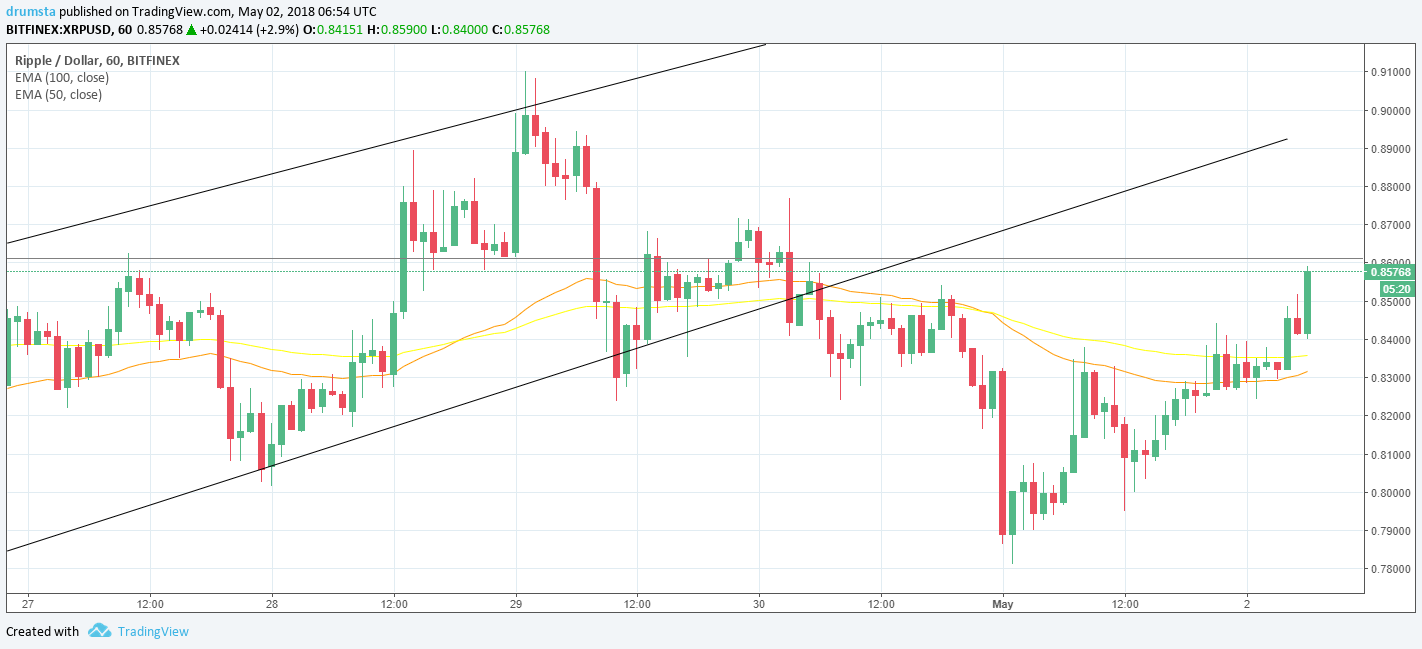
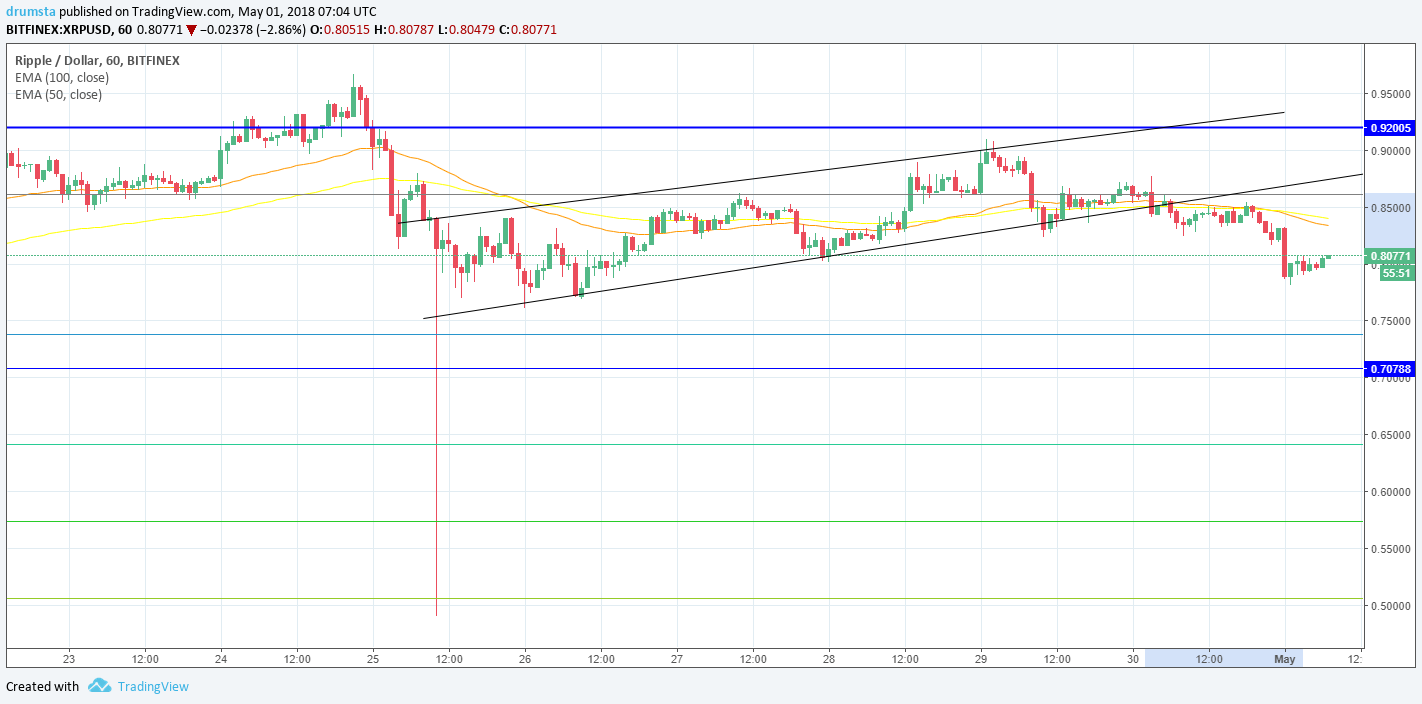
XRP/USD
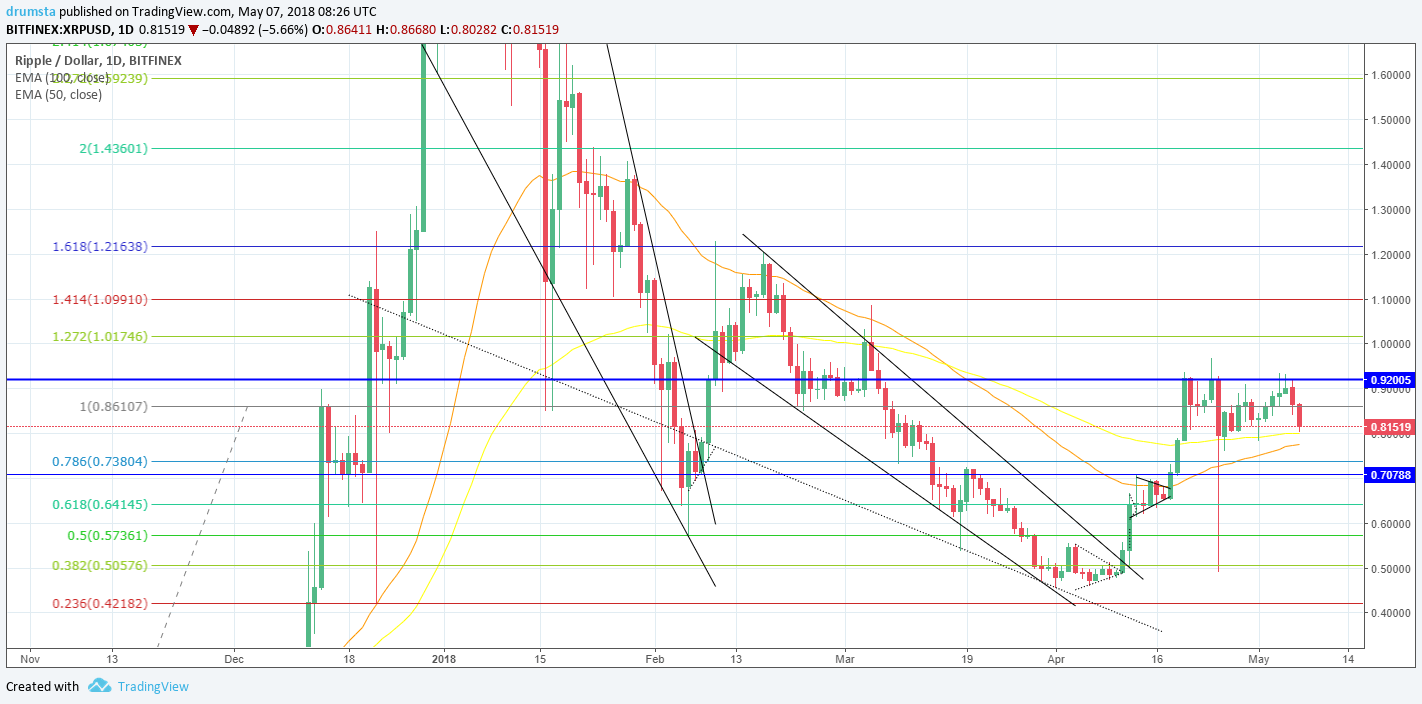
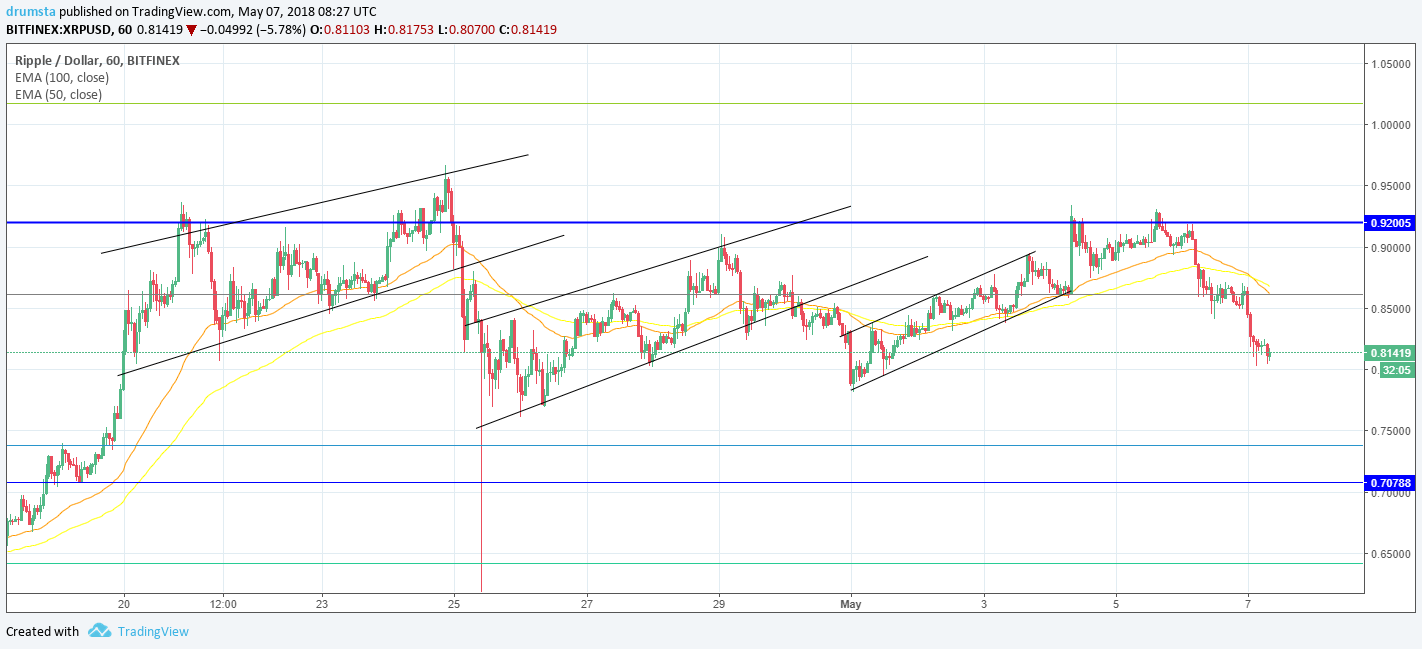
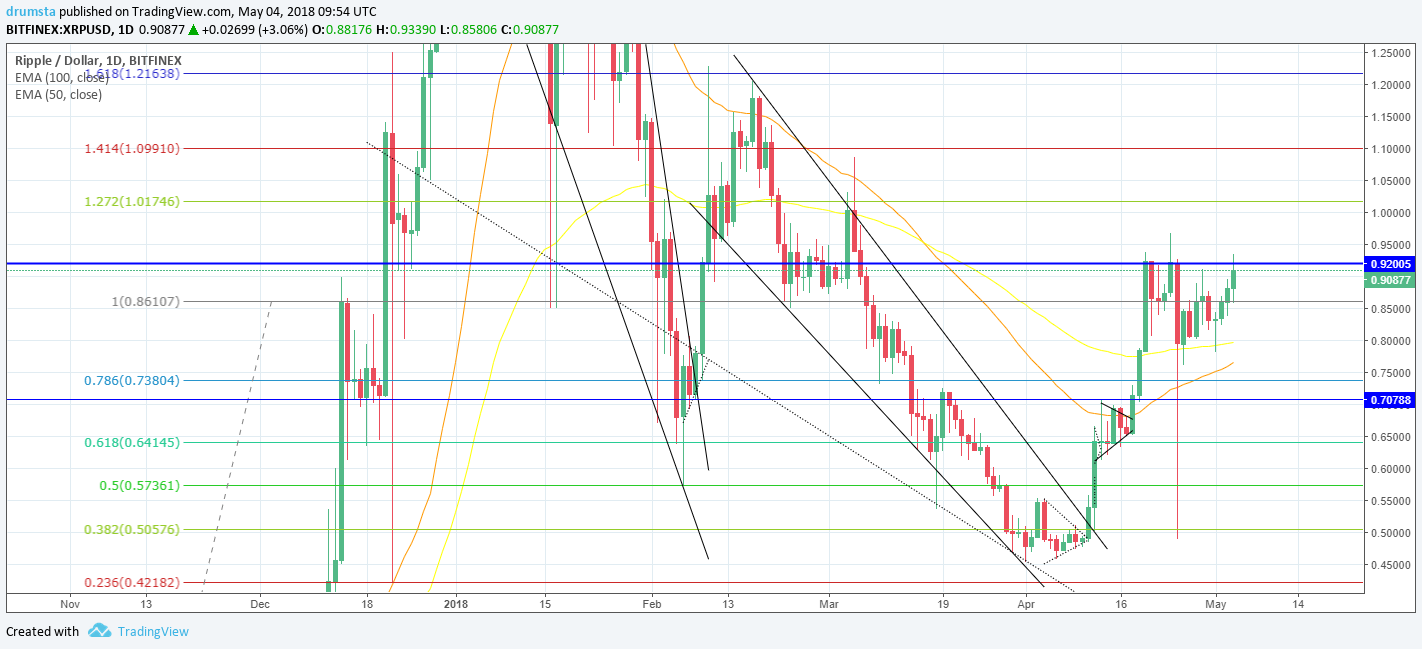
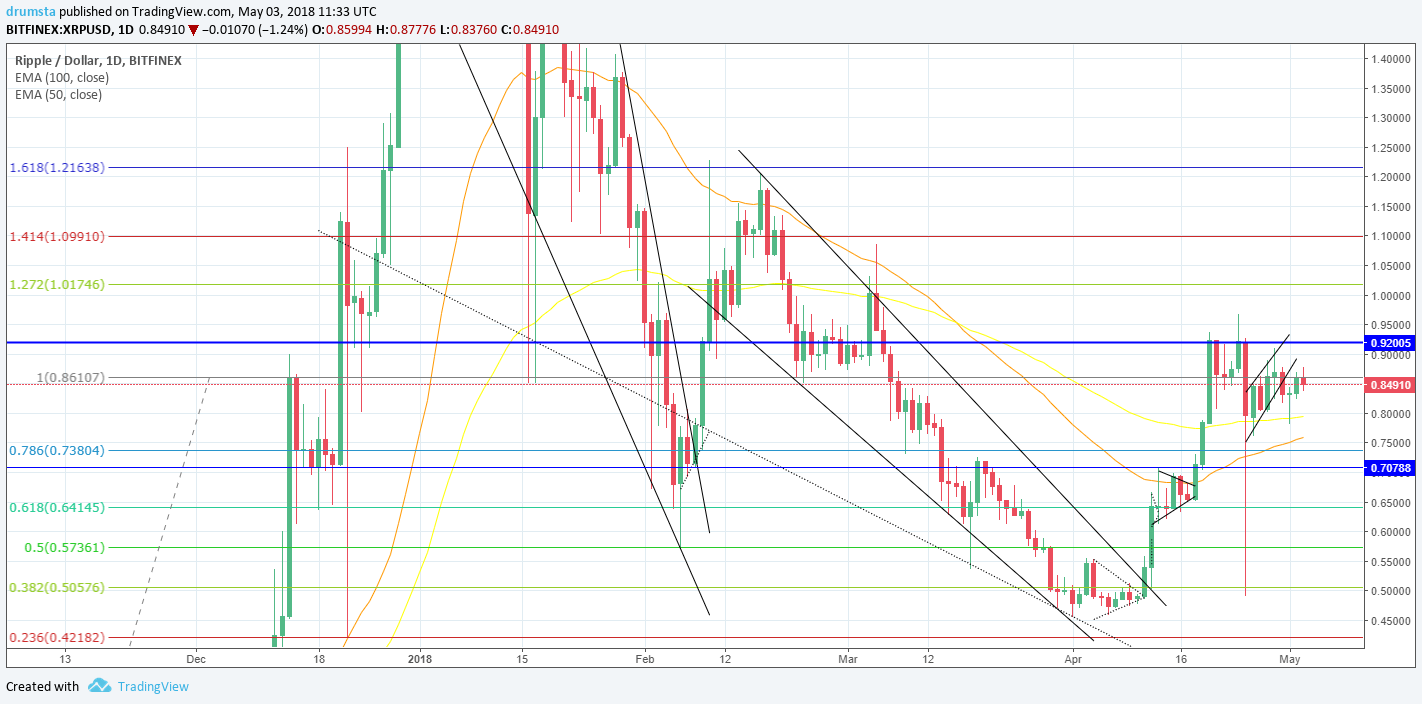
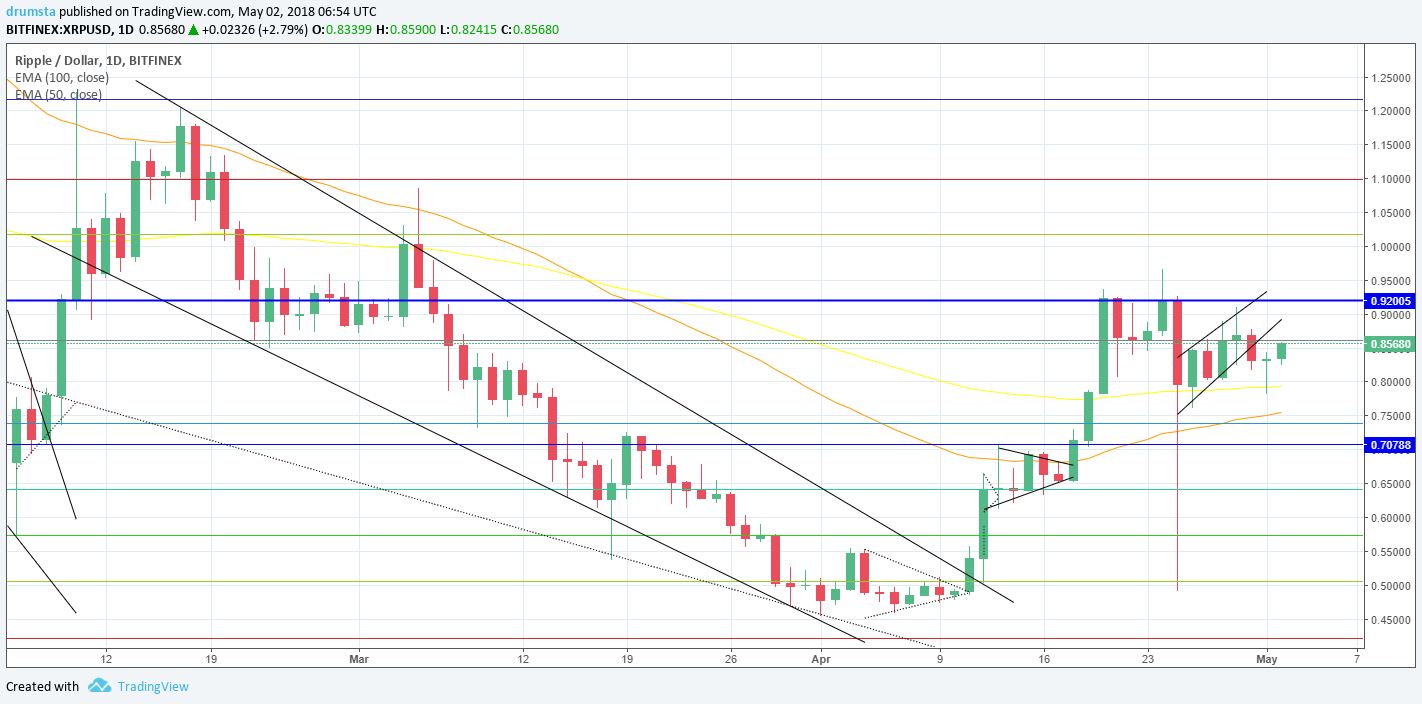
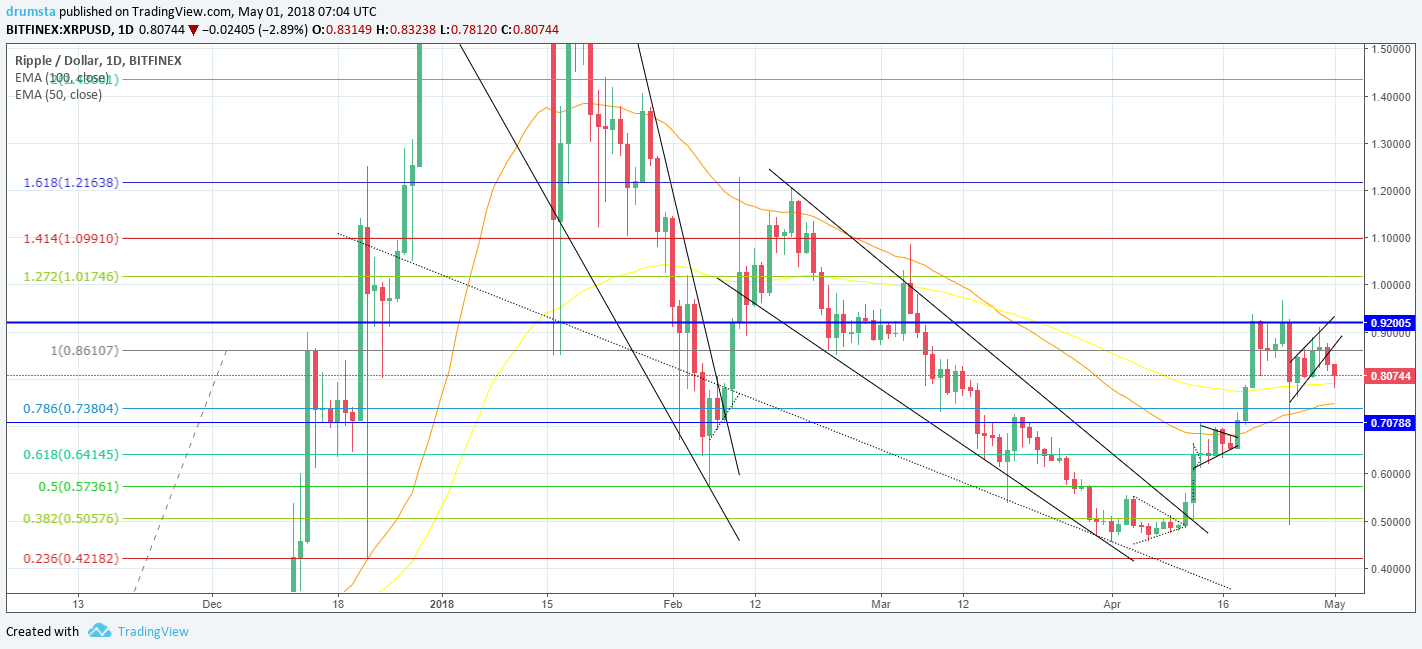
In the last 24 hours, the price of Ripple has been decreasing. It fell from yesterdays open at 0.805$ to 0.762$ and is now at 0.795$.
Looking at the daily chart we can see that the price of Ripple is found some support at the 50 days EMA, but the current doji indicated more potential downside
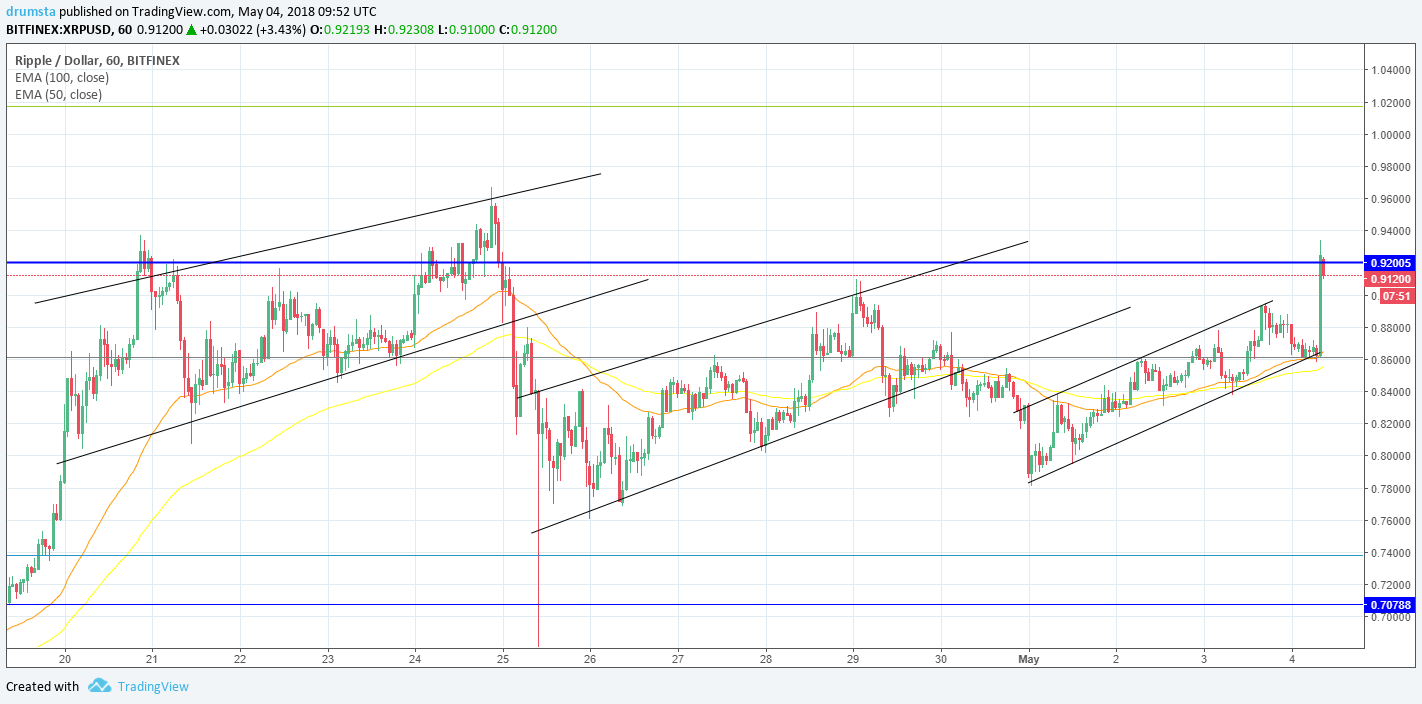
Zooming into an hourly chart we can see that the price is at the same levels as from the starting point of three consecutive upward channels, struggling to find support indicated by the cluster below 50 hourly EMA.
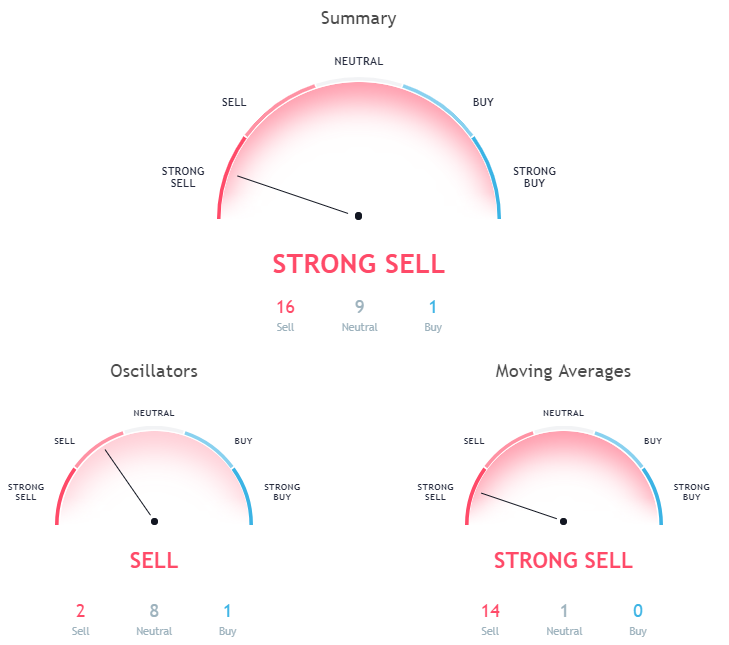
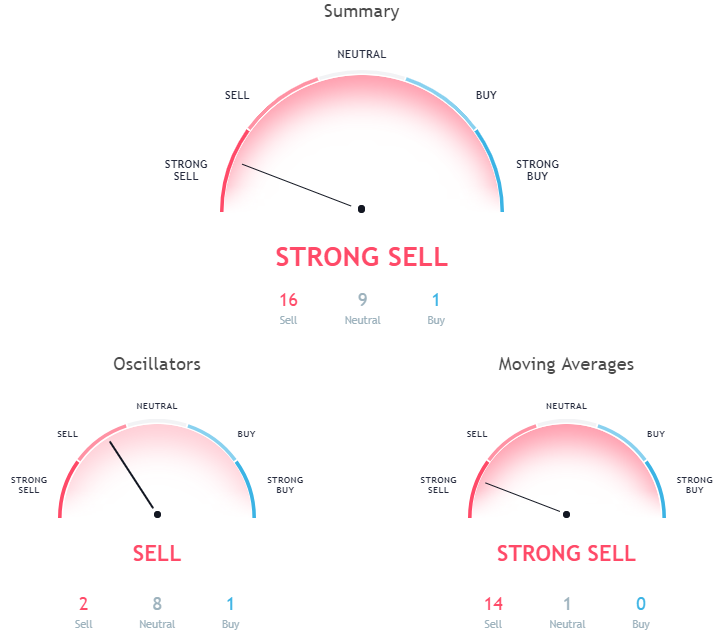
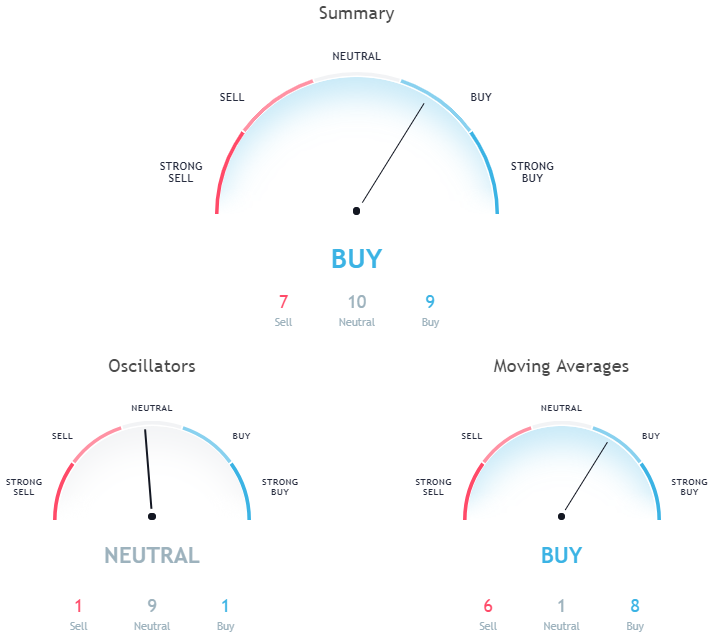
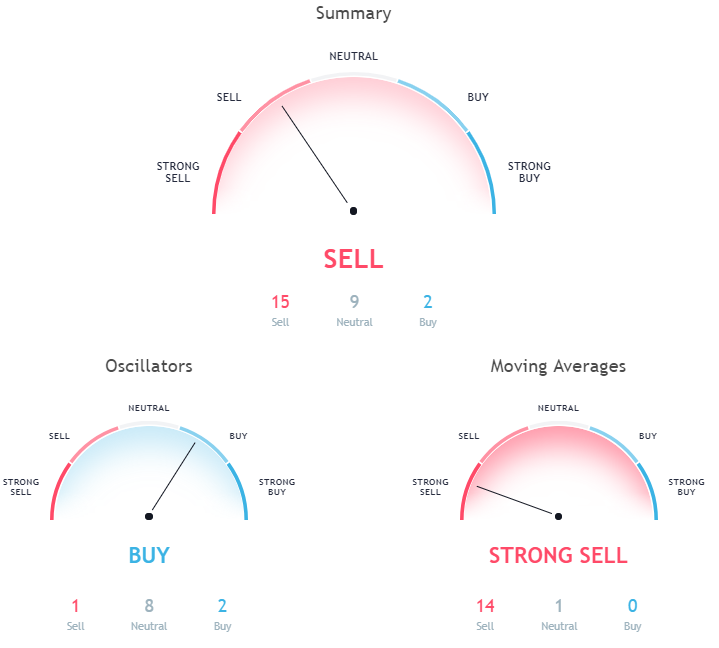
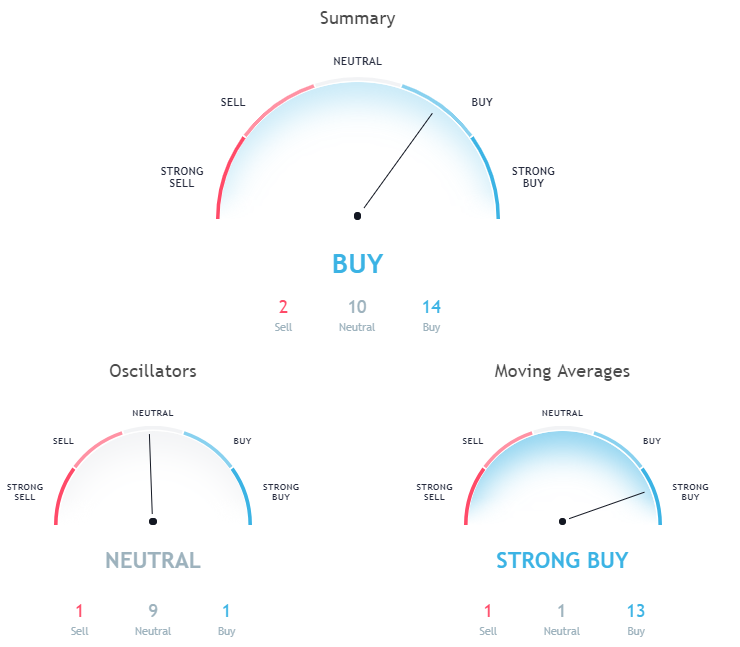
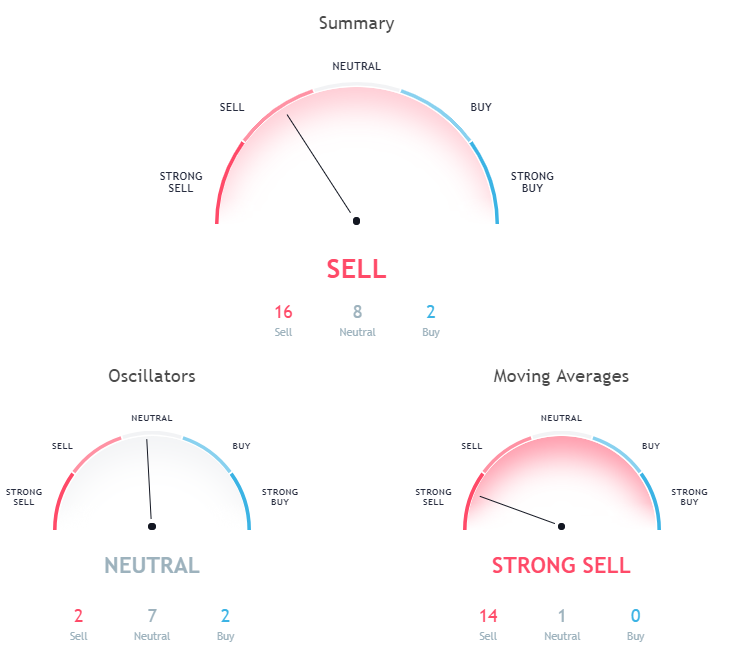
Market Sentiment
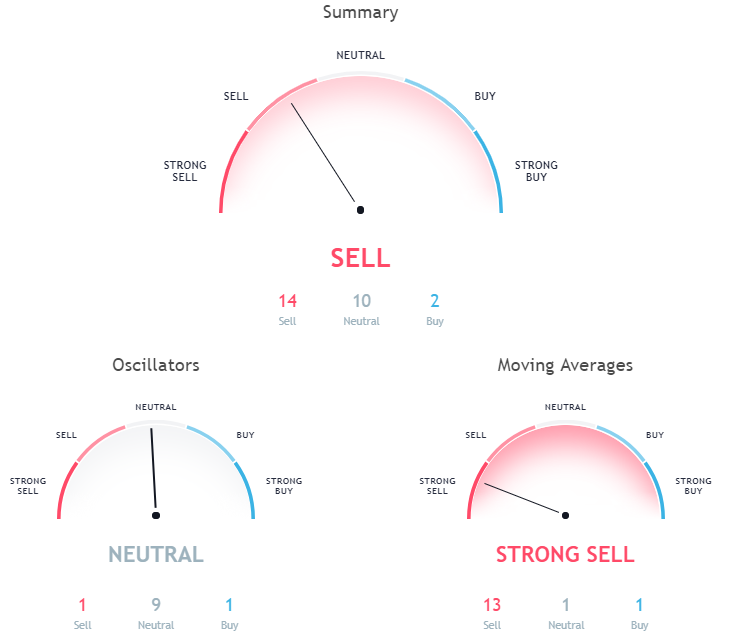
Hourly chart signals a sell, oscillators neutral, moving averages a strong sell.
Pivot points:
S3 0.66808
S2 0.72939
S1 0.76291
P  0.79070
R1 0.82422
R2 0.85201
R3 0.91332
Conclusion
Even though we are seeing some upward movement we are still in a cryptocurrency correction. The prices of Bitcoin and Ethereum haven’t exceeded prior highs and in the case of Ripple, it’s just a straight down move. After this quick bounce back, I am expecting a lower low which would be a wave C out of ABC correction.