Categories
Forex Elliott Wave Forex Market Analysis

USDCHF: Examine These Three Charts Before Taking any Trade


Last week, the USDCHF pair developed a sideways movement pattern that looks like an inverted head and shoulder pattern. However, the primary mid-term trend remains dominated by bearish sentiment. Examine with us these three charts to help you foresee the pair’s potential movements in the coming sessions.

Inverted Head and Shoulder Pattern?

The USDCHF pair illustrated in the following 12-hour chart seems to develop a sideways formation after the accelerated decline observed during the second half of November 2020. After easing from the psychological support of 0.89, the price began to consolidate in a range between 0.8917 and 0.8757.

In the previous chart, the USDCHF seems to be forming an inverse head and shoulder (iH&S) pattern, suggesting a likely bullish reversal movement. According to chartist analysis, the iH&S formation will be confirmed if the price breaks and closes above the neckline located at 0.89171. 

For this reversal scenario, the invalidation level is located below the head, which holds its lowest level at 0.87576, corresponding to the low touched last January 06th.

Elliott Wave View Suggests Exhaustion

The big picture of the USDCHF pair exposed in its daily chart reveals the incomplete bearish impulsive sequence of Minute degree labeled in black, suggesting a limited decline.

As illustrated in the last chart, the USDCHF began a downward impulsive sequence of Minute degree on March 23rd when the price found fresh sellers at 0.99017. The price action reveals the completion of its third extended wave bearish move, which found support at 0.89986 in late August 2020, starting to advance mostly sideways in its wave ((iv)) in black. 

Once the sideways corrective formation corresponding to the fourth wave in black finished, the pair began to continue its declines in the wave ((v)) of Minute degree, which currently seems developing its wave (iv) of Minuette degree identified in blue. 

On the other hand, the timing and momentum oscillator reveals that the bearish pressure still controls the price action. In this context, the price would see a further decline, confirming Elliott Wave’s outlook of a pending fifth wave of Minuette degree.

This bearish continuation scenario’s invalidation level stays at 0.8979, which corresponds to the end of wave (i).

Price Action Reveals Indecision

The USDCHF pair in its daily chart unfolded in the bellow chart shows an indecision candle corresponding to the last Friday’s session, leaving a narrow body and long-tailed candlestick pattern. This market context carries us to expect a pause in the downward movement developed in previous trading sessions.

The confirmation of the bearish scenario will occur if the price closes below the LOD at 0.88385. Conversely, a reversal signal could be established by a Monday 25th session’s close if it exceeds Friday’s high of 0.88662.

In summary, the USDCHF pair develops a sideways formation that looks like an incomplete inverse head and shoulders pattern suggesting the potential bullish reversal sequence if the price soars above the neckline located at 0.89171. However, the Elliott wave outlook suggests further declines, corresponding to a possible wave (v) of Minuette degree labeled in blue. In this context, the price action reveals the indecision of the next direction. If the price decides to continue its decline, the USDCHF could re-test January’s 06 low zone.

Categories
Forex Fundamental Analysis

EUR/CHF Global Macro Analysis – Part 3

EUR/CHF Exogenous Analysis

  • The EU and Switzerland Current Account to GDP differential

The ratio of the current account to GDP helps us determine the level of a country’s participation in the international market. When a country has net exports, it means that it will have a current account surplus; and, the larger the surplus, the higher the current account to GDP ratio. Conversely, a country with higher imports than exports; it means it has a current account deficit, and its current account to GDP ratio will be lower.

The domestic currency will be in higher demand in the forex market when a country is a net exporter.

In 2020, the Swiss Current Account to GDP is projected to reach 7.5% and that of the EU 3.4%. Thus, the current account to GDP differential between the EU and Switzerland is -4.1%. That means we should expect that the CHF will be in higher demand than the EUR. Thus, we assign a score of -5.

The interest rate differential for the EUR/CHF pair determines which of these currencies is preferable to investors and carry traders in the forex market. When the interest rate differential is positive, it means that investors will earn more by buying the EUR. Similarly, carry traders will be bullish on the EUR/CHF pair, thus driving the exchange rate higher. A negative interest rate differential implies that the Swiss Franc will be preferable to investors, while carry traders will be bearish on the pair.

The Swiss National Bank has maintained the interest rate at -0.75% throughout 2020, and the ECB interest rate has been at 0%. The interest rate differential for the EUR/CHF pair is 0.75%. We assign a score of 2.

  • The EU and Switzerland GDP Growth Rate differential

The GDP growth differential is the difference between the rate at which the EU and the Swiss economy are growing. This will help us identify which economy is growing faster. A positive GDP growth differential between the EU and Switzerland will result in a higher exchange rate for the EUR/CHF pair. A negative one will lead to a drop in the exchange rate for the pair.

In the first three quarters of 2020, the EU economy has contracted by 2.9% while the Swiss economy contracted by 1.5%. The GDP growth rate differential is -1.4%. We assign a score of -3.

Conclusion

The exogenous factors between the EUR/CHF pair have a score of -6; which implies that the pair can be expected to be on a downtrend in the short term.

As you can see above, the Technical analysis shows that the weekly chart for the EUR/CHF pair has failed to breach the upper Bollinger band successfully and has bounced off of it supporting our fundamental analysis. All the best.

Categories
Forex Elliott Wave Forex Market Analysis

Is the US Dollar Index Finding A Bottom?

Technical Overview

The US Dollar Index (DXY) continues bouncing in the extreme bearish sentiment zone, testing the resistance at 90.983. The breakout of this resistance level could lead to expect further upsides in the following trading sessions.

The following figure shows the US Dollar Index in its 8-hour timeframe exposing the mid-term market participants’ sentiment unfolded by the 90-day high and low range, revealing the bearish trend’s exhaustion. In this context, the surpassing of the next resistance at 90.983 could warn about the Greenback recovery, which could boost the price until the next resistance is located at 92.236. Likewise, the exhaustion could imply the consolidation of the bearish trend.

On the other hand, the primary mid-term trend plotted in blue shows the bearish pressure that remains in progress and the current since DXY found resistance at 94.742 on September 25th. Likewise, the secondary trend identified with the accelerated green downward trendline shows a pause of the short-term downtrend started at 94.302 on November 04th. In this context, the pause in progress represented by the rising minor trend could develop a limited rally, which could carry the price to test the precious swing at 91.200 reached on December 09th.

Technical Outlook

The short-term Elliott wave view for DXY exposed in the next 4-hour chart reveals the end of the bearish wave ((iii)) of Minute degree labeled in black and the start of wave ((iv)) of the same degree, suggesting the possibility of a corrective rally, which could take until January 20212.

From the previous chart, we distinguish the start of wave ((iv)) identified in black, which began when DXY found support at 89.73 on December 17th, ending the third wave of Minute degree labeled in black. Likewise, the price action surpassed the short-term downward trendline plotted in green, suggesting the bearish sequence’s exhaustion that began at 94.302 on November 04th.

With the short-term trendline piercing, DXY developed the first segment of a corrective wave of Subminuette degree identified as wave a labeled in green, which found resistance in the supply zone between 91.014 and 91.200. Once topped at 91.018, the Greenback retraced, developing its wave b of the same degree, which found support in the intraday demand zone between 90.262 and 90.059. 

The textbook suggests that the price action should develop a third move identified as wave c in green, which could advance until the next supply zone bounded between 91.412 and 91.580. Once the US Dollar Index completes the third segment, the Greenback will complete the wave (a) of Minuette degree identified in blue corresponding to the first segment of the wave ((iv)) in black.

In summary, the US Dollar Index looks starting to develop the first segment of the fourth wave of Minute degree, suggesting the pause of the primary trend’s downtrend, which could last up until January 2021. In this regard, DXY currently found temporary support at 89.730, and the price could develop a new decline corresponding to the fifth wave of Minute degree. The potential next decline could pierce the previous low, being its potential next bearish target located at 88.864. Finally, if the price action surpasses the invalidation level placed at 92.107, the Greenback could start to show recovery signals, which could carry to expect a bullish reversal move.

Categories
Forex Elliott Wave Forex Market Analysis

NZDUSD Could Reach a New Yearly High

The NZDUSD pair continues extending its gains, testing the psychological barrier of 0.71, helped by the US Dollar weakness. The Oceanic currency outperforms over 5.4% during the current year. Also, the pair advances over 27% since it confirmed its bottom on March 22nd at 0.55862.

Technical Overview

The big picture of the NZDUSD illustrated in the following 12-hour chart shows the primary upward trend, its trendline plotted in blue, intact since March 22nd when the price confirmed its bottom at 0.55862 and began the rally that remains in progress to date. Likewise, the secondary trend and its green trendline reveal the acceleration of the price testing by the third time the psychological barrier of 0.71.

Considering that the NZDUSD pair currently re-tests the 0.71 level, the price could extend its gains, reaching a new yearly high, to find resistance in the next psychological resistance of 0.72.

Short-term Technical Outlook

The short-term Elliott wave view for the NZDUSD pair unfolded by its 4-hour chart led us to observe an incomplete impulsive sequence of Minute degree labeled in black, which began on October 22nd price found fresh buyers at 0.65529.

The previous chart illustrates the impulsive structure that continues progressing and looks to develop its fourth wave of Minute degree labeled in black. Moreover, in the chart, we should remark that the third wave, which looks like the extended wave of the incomplete impulsive sequence identified in black, has found resistance at 0.71043 on December 03rd. 

Once the price topped the yearly high at 0.71043, the pair began to develop a sideways corrective formation, still progressing. In this regard, considering both the alternation principle stated by the Elliott Wave Theory and that wave ((ii)) in black looks like a simple corrective pattern, the current wave ((iv)) of the same degree should be complex in terms of price, time, or both.

In this scenario, the price action might retrace until the demand zone bounded between 0.69462 and 0.68970, where the Kiwi could find fresh buyers expecting to boost the pair toward a new yearly high. This high could strike the potential target zone between 0.71618 and 0.7260.

In summary, the short-term Elliott wave perspective for the NZDUSD pair reveals the advance in a bullish trend that currently moves mostly sideways in an incomplete corrective formation. The fourth wave in progress could find support in the demand zone bounded between 0.69462 and 0.68970. Likewise, fresh buyers could boost the price toward 0.71618 and extend its gains until 0.7260. Finally, the invalidation level of the current bullish scenario is located at 0.68106.

Categories
Forex Elliott Wave Forex Technical Analysis

EURJPY Consolidates Expecting the ECB Decision Ahead

The EURJPY cross consolidates in the overnight trading session expecting the ECB interest rate decision statement that will take place before the U.S. opening bell. The analysts’ consensus doesn’t expect changes both in the interest rate that remains at 0.0% and in the deposit facility rate that keeps at -0.50%.

Source: TradingEconomics.com

Technical Overview

The following 8-hour chart shows the EURJPY market participants’ sentiment, where the cross looks consolidating in the extreme bullish zone, developing a flag pattern. This chartist pattern suggests the continuation of the previous movement. In this case, the technical formation could be indicative of further upsides for the following trading sessions.

Moreover, the primary trend identified with the upward trend-line in blue remains on the bullish side. Also, the secondary trendline plotted in green reveals the bullish acceleration of the price action. This market context is confirmed by the EMA(60) to Close Index, with a reading above the level 2.000 that suggests the overbought levels and the potential correction or consolidation of the previous rally.

Short-term Technical Outlook

The EURJPY under the intraday Elliott wave perspective unfolded in its 2-hour chart illustrates the advance in an incomplete corrective rally corresponding to wave ((b)) of Minute degree labeled in black. The internal structure shows the cross advancing in its incomplete wave (c) of Minuette degree marked in blue, suggesting a further upside in the following trading sessions.

At the same time, the previous chart reveals the internal five-wave sequence of wave (c) in blue, which exposes the sideways progress of its fourth wave of Subminuette degree identified in green, which belongs to the wave (c) of Minuette degree. 

In this context, considering that the price action could develop a new upward movement, the cross could advance in its fifth wave in green to the potential target zone between 126.84 and 127.48, where the EURJPY cross could complete the wave (c) in blue, and the wave ((b)) in black. Likewise, once this corrective rally completes, the price could start to develop a downward movement identified as wave ((c)) in black.

In this regard, according to the Elliott Wave theory and considering that the mid-term structure corresponds to an incomplete corrective formation constituted by a three-wave sequence, after the completion of the wave ((b)) in black, the price should start to decline in its wave ((c)) with an internal structure subdivided into a five-wave sequence.

Summarizing, the EURJPY cross currently develops a consolidation pattern, which leads to expect a new upward movement with a potential target between 126.84 and 127.48. Once the price completed its target, the cross may start to decline in a five-wave sequence corresponding to wave ((c)) of Minute degree.

Finally, the invalidation level of the current bullish scenario can be found at 124.566.

Categories
Forex Technical Analysis

The Core Principles of Technical Analysis

Most of the content about the technical analysis will try to give you a narrow view of how we approach this analysis. And there is a reason for that. People will want what they can understand, masses are not amused with complex analysis, only a handful of people will really dive into what this analysis has to say. Therefore, limiting the technical analysis to line drawing, pattern recognition, and candlesticks is also a limitation to what you can learn unless you do your own research. 

Learning technical analysis is not hard to do, it can be as deep and complex as you want or very simple. Interestingly, technical analysis guides and books tend to repeat the same ways and tools of doing it even though it is a very wide concept. When we talk about the basics, the most dominant technical analysis methods are the Price Action patterns, candlesticks, pivots, support and resistance lines, and trend lines. They are regarded as basic since they are derived directly based on what is seen on the chart. We would also like to add they are mostly subjective even with the “rules” that define them. Technical indicators are the second method of chart analysis, also called secondary indicators by some professionals as they calculate based on the original price action data.

Volume or volatility is the third technical dimension, often missed by some analysts but very important to professionals. The last technical analysis dimension we would like to add is the timeframe or time scope. As we move on to each of these concepts, you can find traders who are successful using just the price action or only indicators without much regard to fundamental analysis. The main idea behind this is that they do not want to be distracted by the news that may not be as important or true and only want to keep the analysis based on factual data – historic price movements represented as charts. 

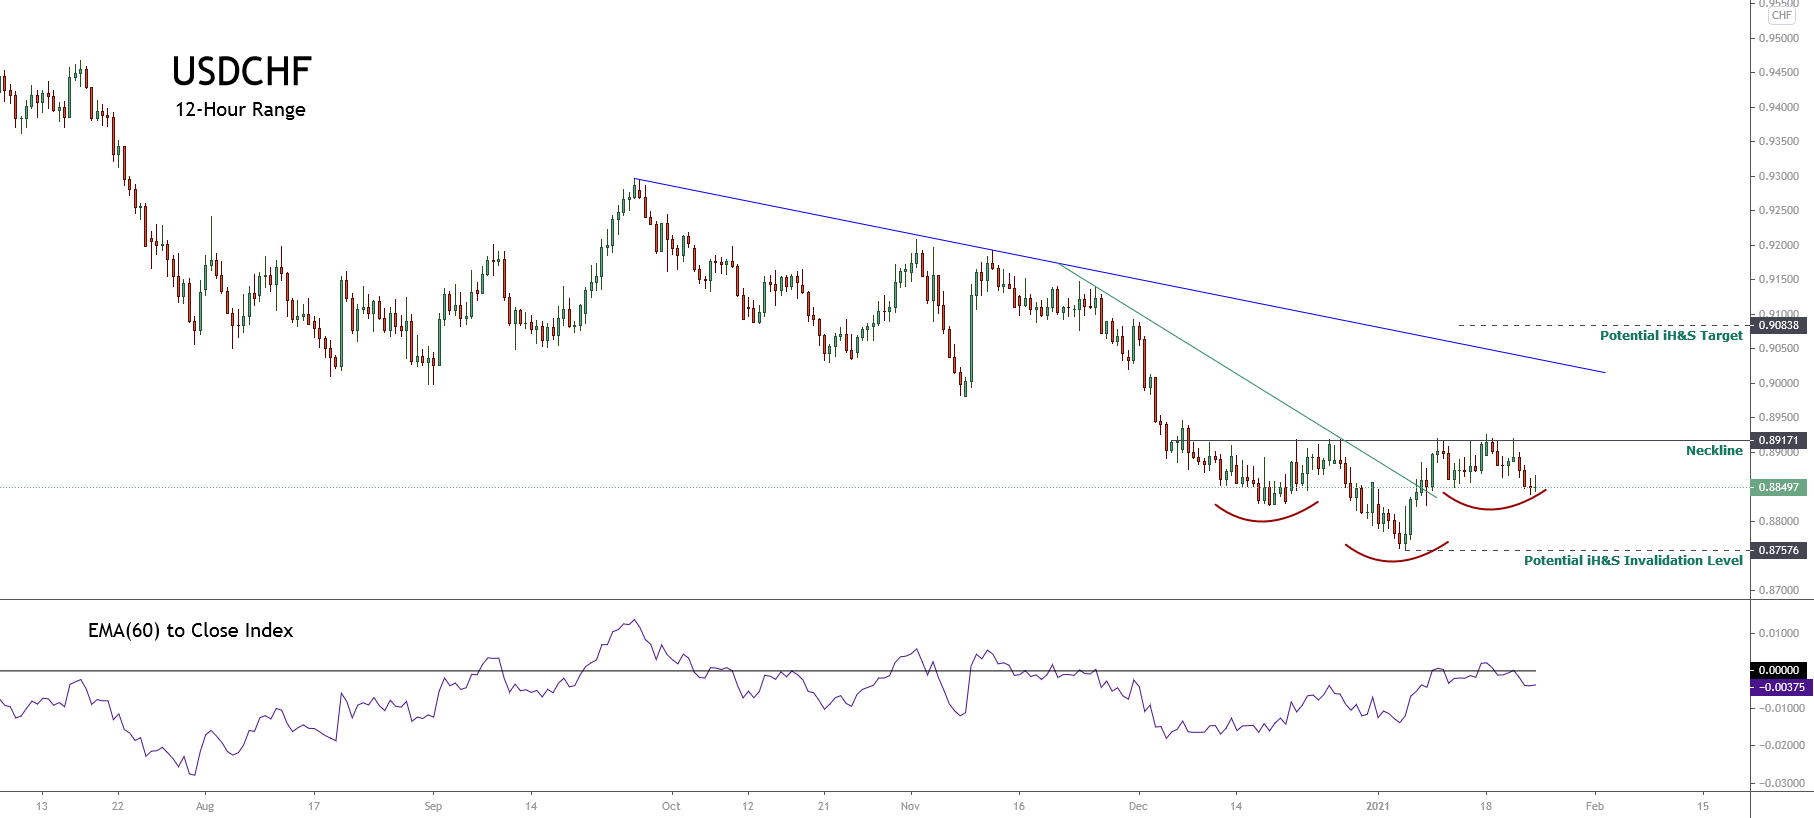
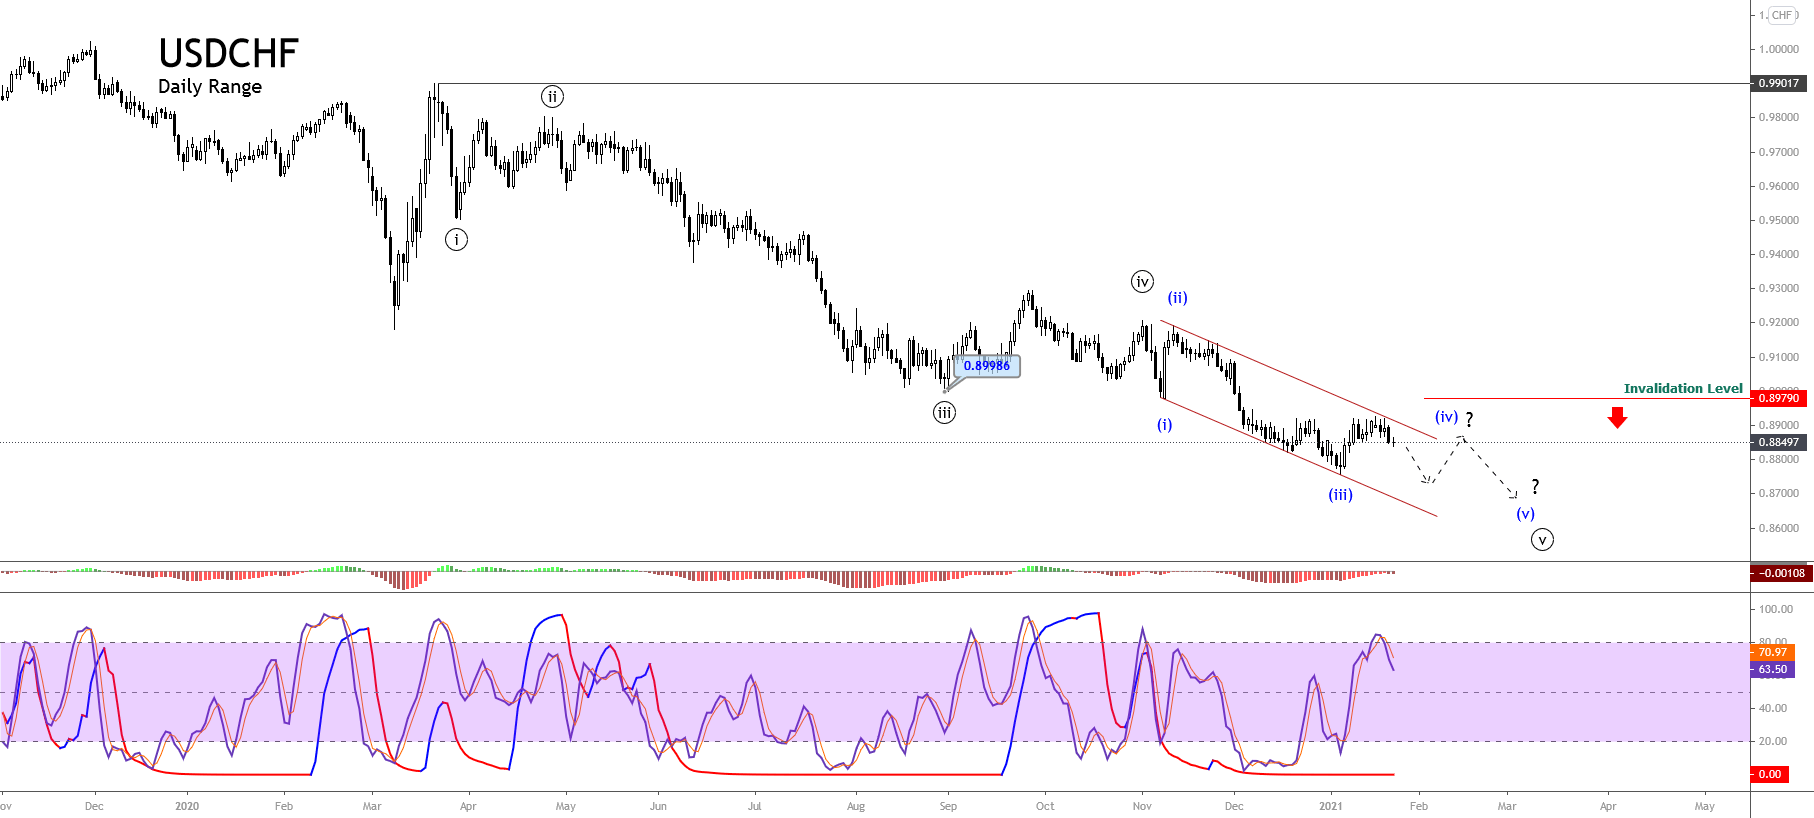
PA patterns are created by the price movement on the y-axis and time on the x-axis. As these shapes and patterns repeated, analysts collected them, making several most popular patterns regarded as most reliable. The patterns serve to predict the future price action once they are formed, all of these patterns point the price will likely go up o down. The most common patterns are double tops and bottoms forming the letter W and M, cup and handle, ascending and descending triangles, and the head and shoulders.

There is no good statistical record of how reliable are these patterns as they are subjective, one analyst can see the pattern others do not, or the patterns can stack one inside the other. However, they are used in conjunction with other tools and timeframes. All this can make you wonder if there is any reason to believe patterns exist or the movement is random, at the end of the day it is just another element to help you decide. The final judge of your technical analysis is the account balance. 

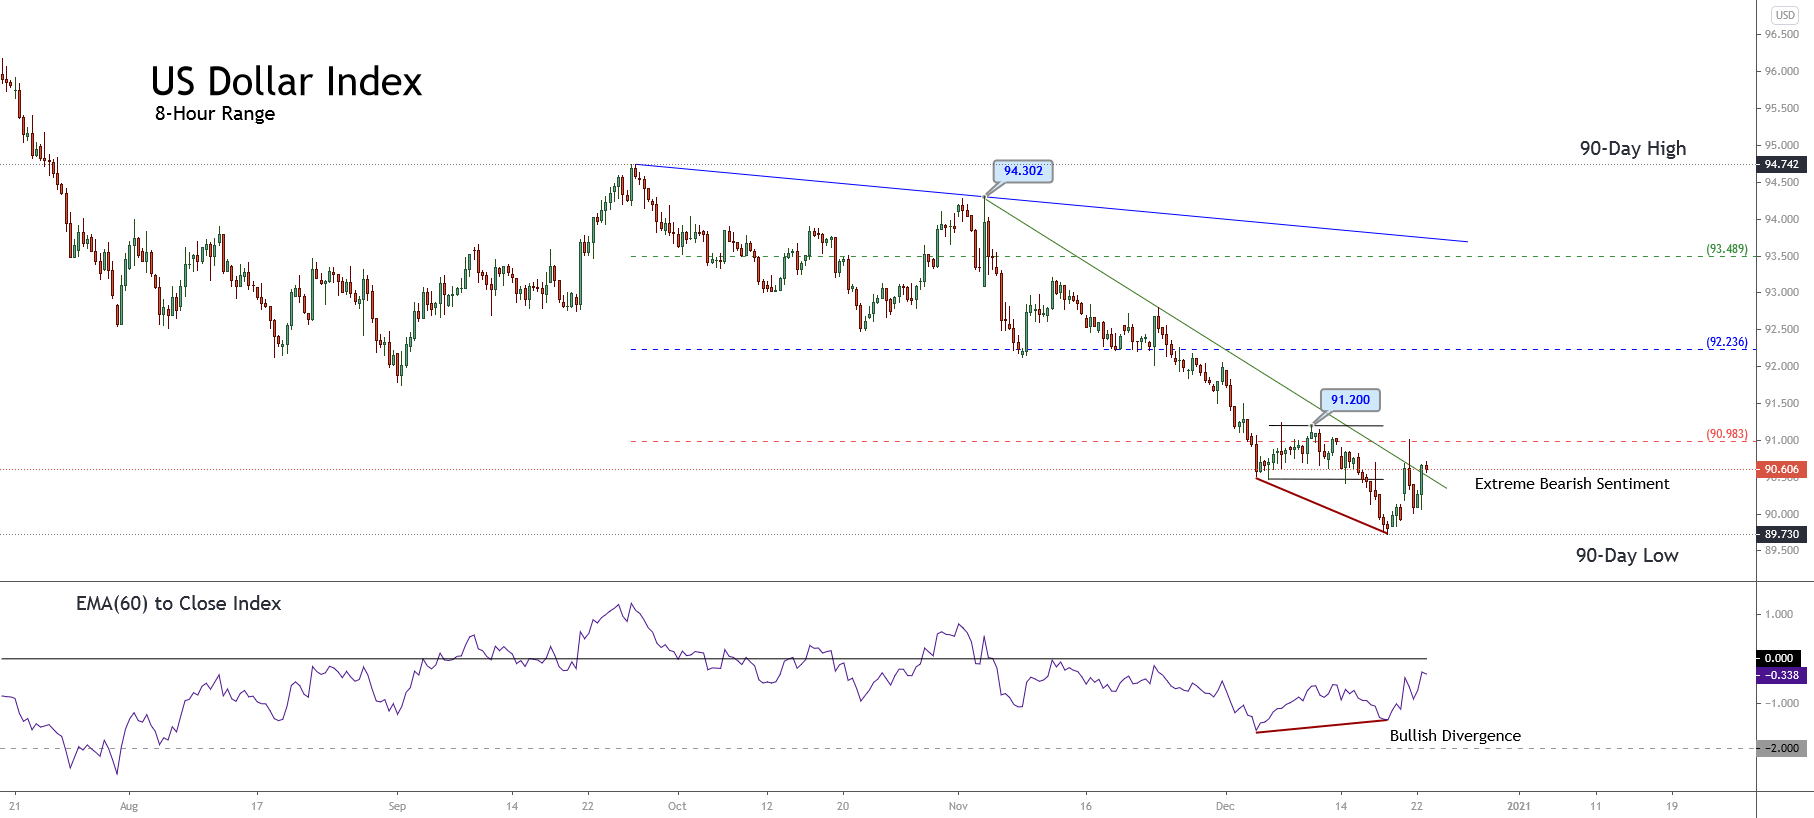
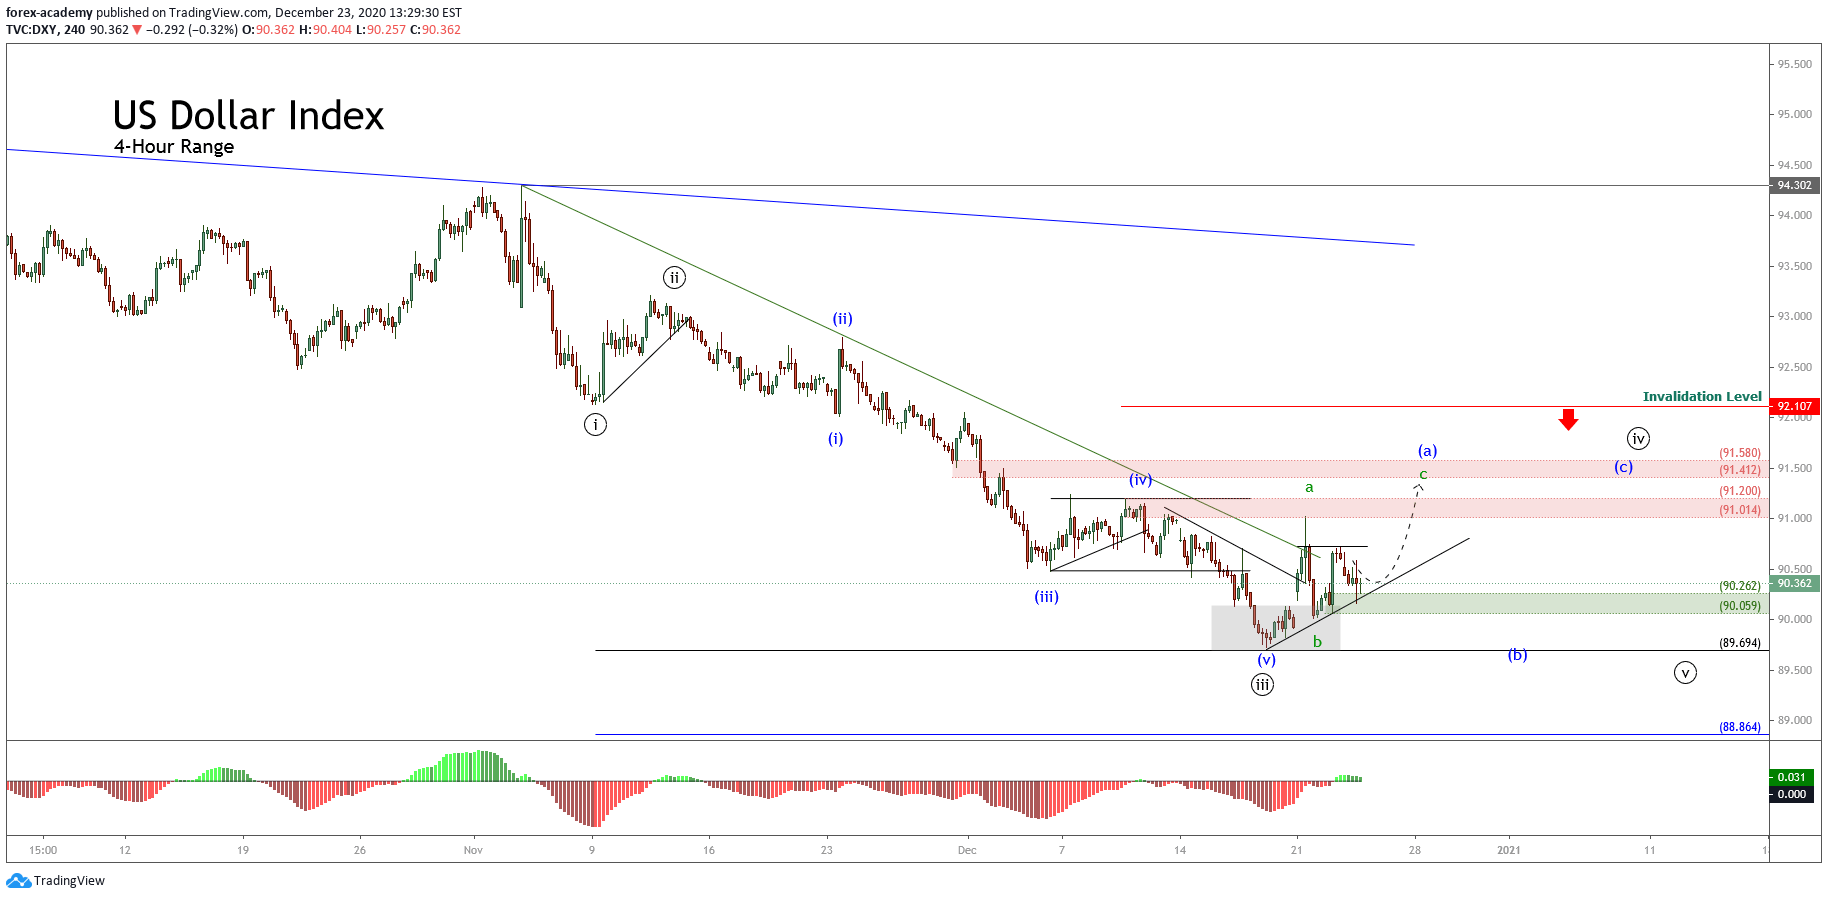
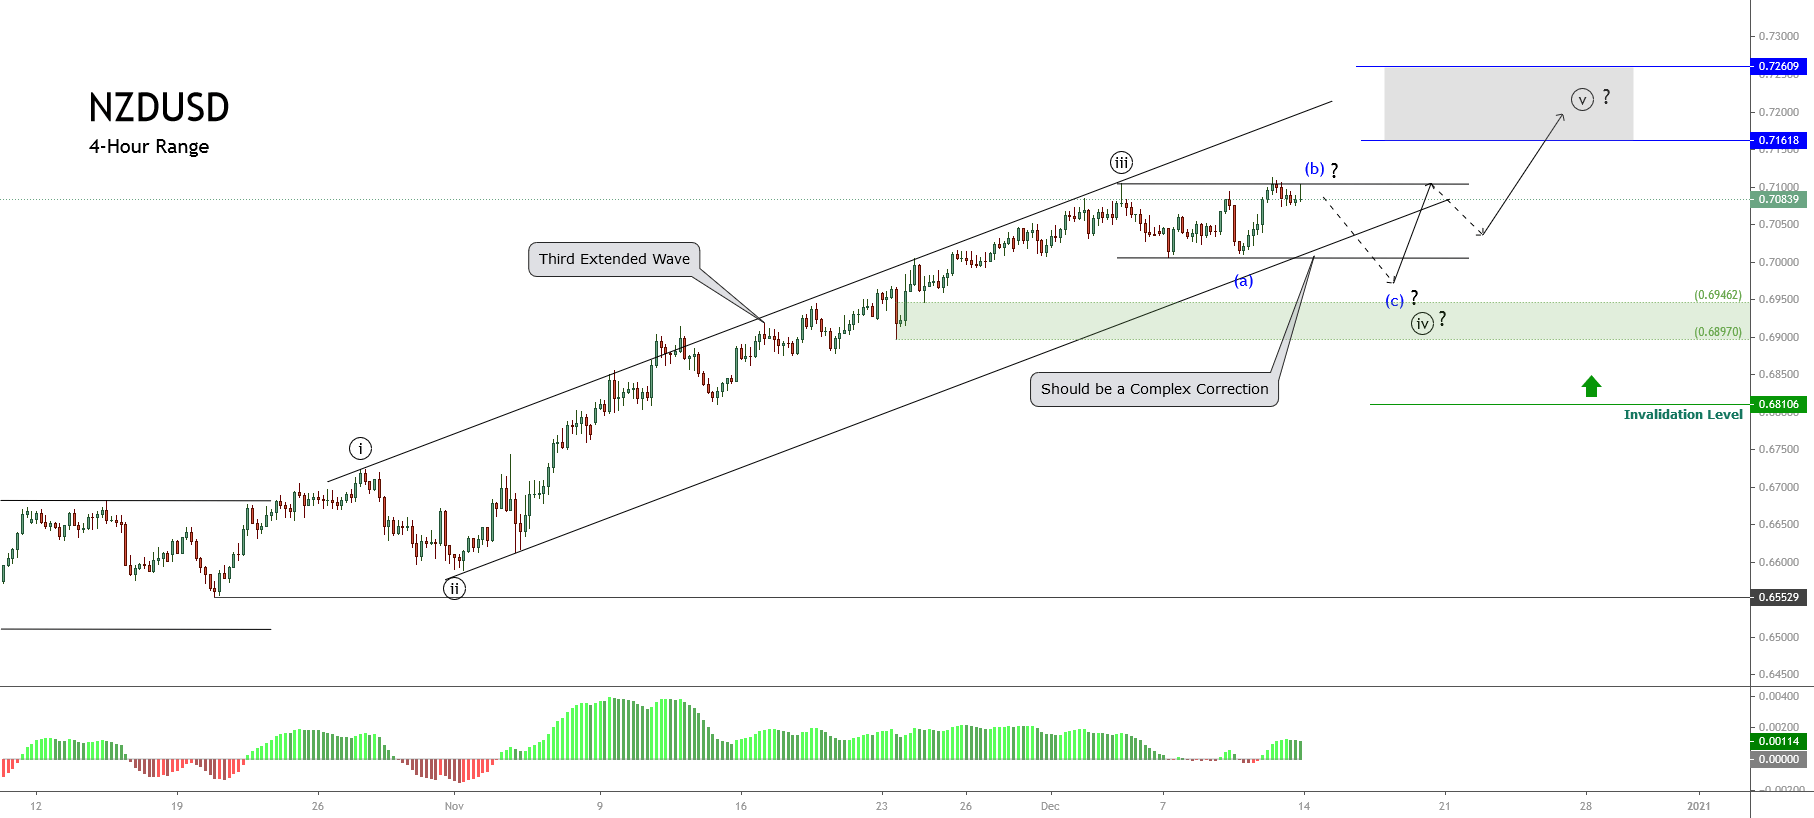
Candlesticks have more information about the price movement than a single line. They have several structural elements: the body color, the wick, and the top and bottom body levels. Based on these, analysts have created a plethora of patterns that aim to predict when a trend or reversal is about. Similar to price action patterns, candlestick patterns reliability cannot be tested objectively, only you can test and fit them in with other indications. Candlesticks are essential to creating pivot points, moments where the price turned in another direction. 

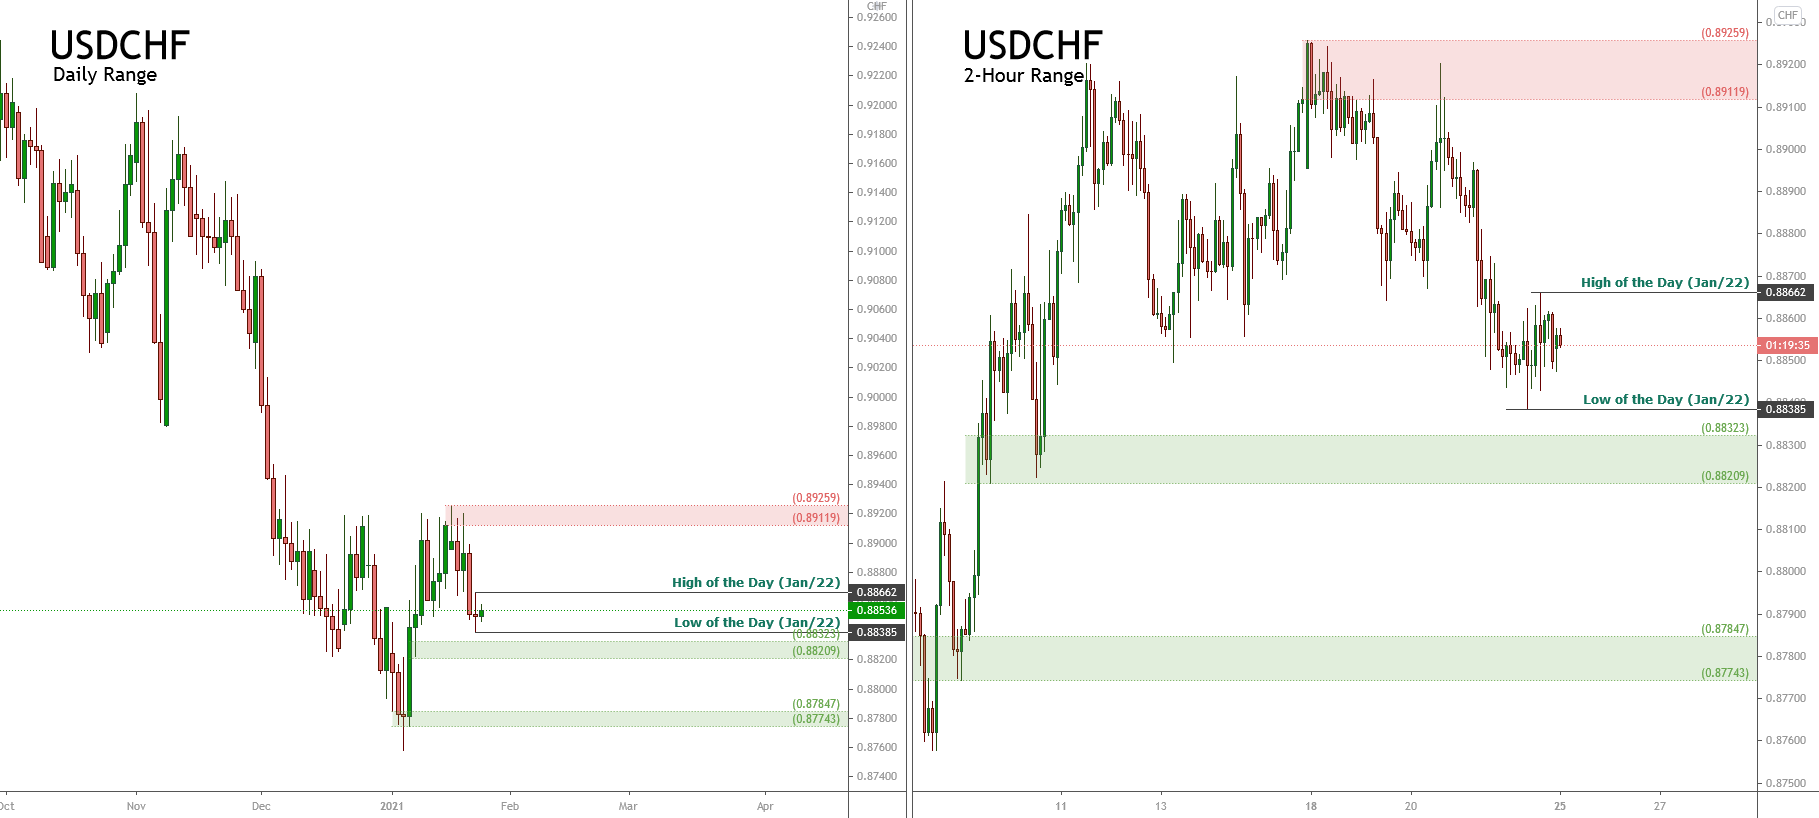
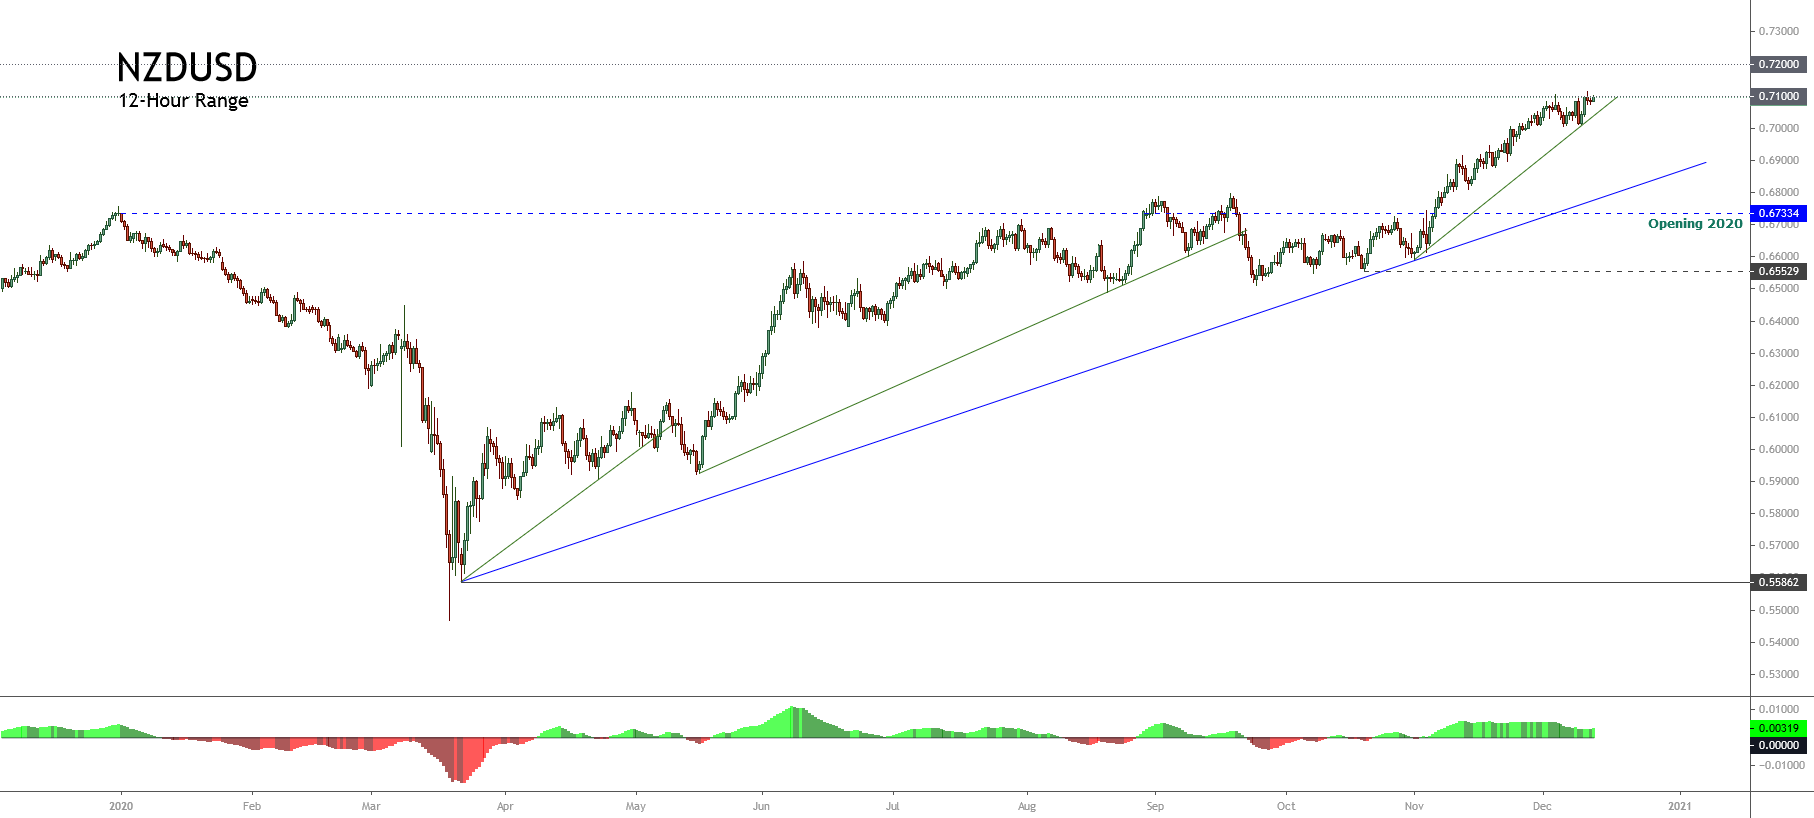
Pivot points consist of at least three candles and they mostly serve to draw lines, be it support and resistance, trend, channel, or Fibonacci retracement lines. Some traders will draw lines where others would not, thus a definitive support or resistance line cannot be drawn for all. The same applies to trend lines and other constructs where their form will depend on the beholder. While support and resistance lines indicate likely price direction reversal once they are reached, their interpretation can also help breakout strategies.

Now traders can get confused about whether they should enter a trade on an S/R line breakout or wait for a reversal. Of course, the price will not exactly break through the support or resistance line or bounce right off it, you will mostly see something in between. Consequently, this presents a question of how reliable can such analysis be. If we use multiple questionable elements for one comprehensive analysis, one can wonder would multiple more reliable elements result in better technical analysis and therefore trading. 

These basic technical analysis elements form the complete picture for a pure PA trader, with the addition of volume. Volume cannot be represented by a candlestick alone, nor by observing PA patterns or any other basic technical analysis element. Volume is measured and is represented as a special tool. Traders mostly use it to confirm a trend is emerging, to confirm a breakout, and also to exit any trades if the market is not active enough. Some trading strategies rely on low volume markets or sessions to avoid surprise movements. If we combine volume with other technical analysis tools, the result is almost always beneficial. Some strategies use volume or volatility to filter losing trades, others use volume for entries. 

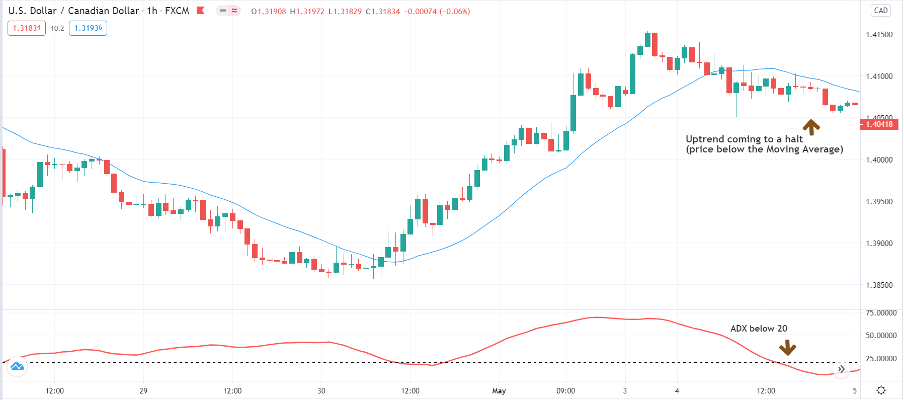
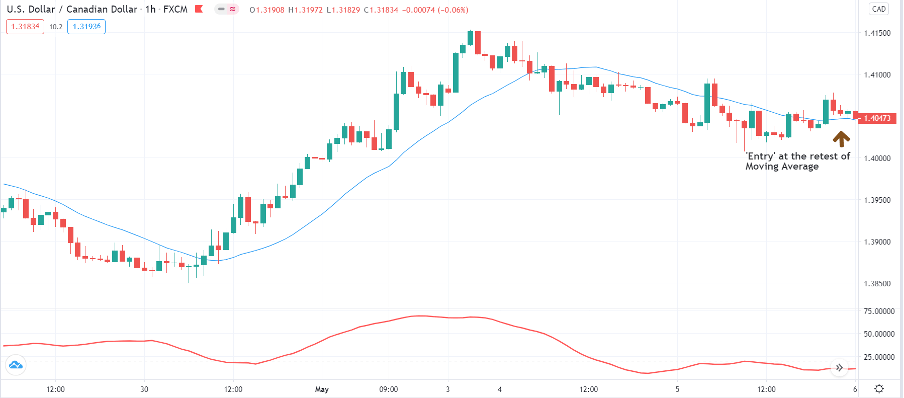
Secondary indicators are derived from the price action statistics, numbers. At its base, they are formulas that give out a number of values. These values can be presented on a chart or in some other form in a separate plane. The basic secondary indicator is the Moving Average. MAs are very common and can be calculated in so many ways to reflect a specific price action interpretation. They can also contain other measurement values in an effort to be more reliable, lag less, and so on. One such example is the Volume Weighted MA where volume is also included in the calculation.

How a trader will use MAs depends on his goals and imagination, adding more different MAs can produce various uses, or, as some professionals do, use the MA and the price on the chart to produce trade signals when they cross. Indicators can be very complex to include many factors derived from the price action, to the point they represent complete trading solutions. Unlike PA patterns, support and resistance lines, and other subjective basic technical analysis tools, indicators are exact since they are based on data numbers. However, this does not mean they are reliable as reliability depends on the formula and how it is interpreted. 

The basic principle of technical analysis is the combination of several indicators. Some professionals just rely on how the chart looks to them and make trade decisions based on that. They do not need anything exact. Others need exact points, values, signals to the point their complete money management is based on this analysis. There are also mixed type analysis, PA lines, and patterns combined with Moving Averages and volatility indicators. The goal is to use the right combination that collectively gives meaning to a particular trader.

It is not only about combining several tools but also combining timeframes. The analysis will likely be more reliable if other time scopes are included. This will help traders to pinpoint optimal trade exits and entries and also see the bigger picture of what is going on in the market. Some strategies may require lower timeframes such as 5 minute or 15-minute candles, while other systems may work only on the daily timeframe. After all, technical analysis will become unique to a particular trader, aimed and aligned to his goals and personality. Also, be wary of over-optimizing and overcomplicating technical analysis, it is not going to result in the best performance.

Categories
Forex Basic Strategies

Reliable ‘ADX’ Trading Strategy To Trade Forex Major Currency Pairs

Introduction 

We have talked a lot about trading strategies involving MACD, RSI, Volume and Stochastic. However, we haven’t covered much about the ADX indicator and its application. Today’s strategy is based on the ADX, which will help us in measuring the strength of a trend on any given time frame. The Average Directional Index (ADX) is a tool that is designed to measure the strength of a trend. When ADX is used in combination with other trading strategies, we get a complete understanding of the market trend and its efficacy.

Learning how to use the ADX is very easy. It ranges from a scale 0-100, 100 indicating a strong trend and 0 indicating a non-existent trend. If the ADX is close to 0, we can expect a sideways action in the market, meaning the market will neither go up or down but stay around the same value for some time. Remember, ADX will tell us about the strength of the trend. It does not guide us in the future direction of the market. For that reason, it is necessary to use concepts of market trend, retracement, and other technical indicators. ADX values of 50 and above are considered high, while ADX values of 20 and below are considered low. Weak trends are indicated by values of 20 and below.

Time Frame

The strategy works well on most time frames, including 15 minutes, 1 hour, 4 hours and Daily. However, we do not recommend applying the strategy on very low time frames due to market noise and liquidity issues.

Indicators

We use the Average Directional Index (ADX) and Simple Moving Average (SMA) indicators in the strategy.

Currency Pairs

The strategy is applicable on most currency pairs listed on the broker’s platform. However, it is advised to apply the strategy on major currency pairs only.

Strategy Concept

The ADX indicator ensures that we only trade when there is a strong trend in the market, regardless of the time frame. Here, even before looking at the candlesticks, we wait for the ADX indicator to show a reading above 60. A reading above 60 signals a strong trend and the likelihood of a trend continuation. We all know that the trend is our friend, but without gauging the strength of the trend, it can be dangerous to be a part of that trend. This is why we use the ADX indicator for trend trading.

The ADX is only limited to understanding the strength of the trend. However, in order to trade a ‘trend’, we also need to look at price action and trend continuation pattern in the market. Therefore, we use the concept of retracement and moving average to time our ‘entries.’ As this a trend trading strategy, we cannot use the rules for catching a reversal in the market.

We determine the take-profit and stop-loss levels based on ‘highs’ and ‘lows’ of the trend and retracement. Let us, straight dive, into the rules of the strategy.

Trade Setup

In order to explain the strategy, we will be executing a ‘long’ trade in USD/CAD currency pair using the rules of the strategy. Here are the steps to execute the strategy.

Step 1: Firstly, we have to plot the ADX and moving average indicators on the chart with their default setting. Before we actually look at the price action of the market, we have to watch the ADX indicator and its indication. Once the ADX crosses above 60, we look at the trend market and wait for an appropriate retracement.

Step 2: After gauging the strength of the trend using the ADX indicator, we need to wait for a suitable price retracement. The retracement, in other words, indicates a halt of the major trend of the market. In an uptrend, if price falls below the moving average and stays there, we say that the market has entered into retracement mode.

In a downtrend, if price rises above the moving average and stays there, we say that the market has entered into retracement mode. At this point, we are not sure if this is a retracement of the trend or is a start of the reversal. In order to confirm that it is a retracement, we again use the ADX indicator and check its reading. An ADX reading below 20 indicates that the ‘halt’ is actually a retracement of the major trend and not reversal.

Step 3: Now that we have got a confirmation from the ADX indicator that the market has gone into retracement mode, we should know how to enter the market. We go ‘long’ in the market when price crosses above the moving average and stays there for at least 4 or 5 candles. Similarly, we go ‘short’ in the market when price crosses below the moving average and stays there for at least 4 or 5 candles. As we just saw, the rule for entering a trade in this strategy is pretty simple and not complex at all.

Step 4: The last step of the strategy is to determine stop-loss and take-profit levels for the trade. We set take-profit near the ‘higher high’ of the uptrend while ‘long’ in the market and near the last ‘lower low’ of the downtrend while ‘short’ in the market. Stop-loss is placed below the previous ‘low’ of the retracement in an uptrend and above the ‘high’ of the retracement in a downtrend.

Strategy Roundup

The new ADX strategy gives very useful information which most of the times we never pay attention to. There are not many indicators which truly tell about the strength of the trend. ADX is one such indicator which tells if the trend is moving in strong fashion or not. At the same time, it is important to consider the strength of the pullback using price action and ADX indicator. Best profits come from catching strong trends, and this strategy helps us in accomplishing that.