Categories
Forex Basic Strategies

Learning The ‘Intraday Strategy’ To Trade The Forex Market

Introduction

In today’s article, we present to you a fairly simple but reliable trading strategy that can be used by all types of traders, irrespective of their style. It is believed that when markets are strongly trending in one direction, it gets impossible to catch the stalling point. It is only difficult to catch the ‘top’ or ‘bottom’ of the market, but it also carries a huge amount of risk. We are going to discuss a trading strategy that is contrary to this common belief. We shall try to catch the highest or the lowest point in the market by using some of the most powerful technical indicators and techniques.

Time Frame

The strategy can be used on the 5 minutes, 15 minutes, and 1-hour time frame chart. An intraday trader would apply the strategy on the 5 or 15 minutes chart, whereas a positional trader would open the 1-hour chart.

Indicators

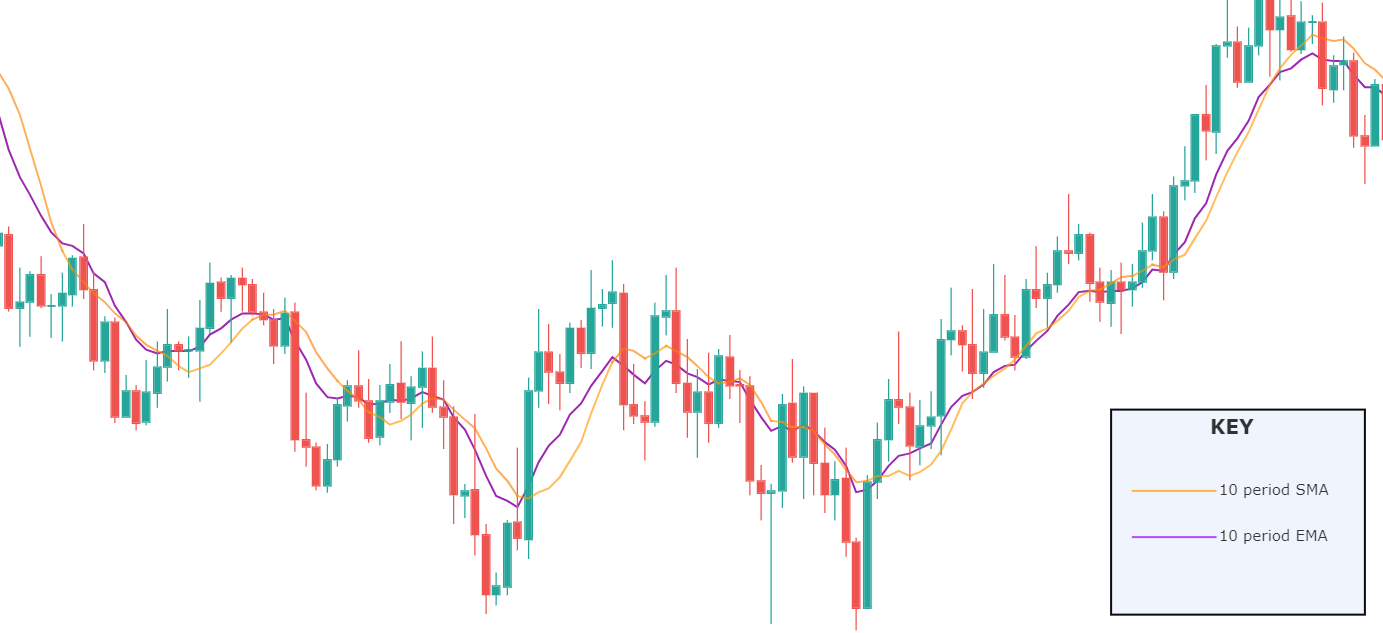
We use the following indicators in the strategy:

  • 5-period Exponential Moving Average (EMA)
  • 10-period Exponential Moving Average (EMA)
  • 14-period Relative Strength Index (RSI)
  • Slow Stochastic Oscillator
  • K and D period – 3

Currency Pairs

This strategy can only be applied on major currency pairs of the forex market. Some of the preferred pairs include EUR/USD, GBP/JPY, GBP/USD, USD/CAD, USD/JPY, EUR/GBP, etc.

Strategy Concept

The rules of the strategy are quite simple and straightforward. We enter the market for a ‘long’ when the 5-period EMA crosses above the 10-period EMA after a prolonged downtrend. But this isn’t enough. Along with this, the RSI should be above the level of 50, and Stochastic slow and fast lines should move in the same direction (upward). Here we need to make sure that the Stochastic does not enter the overbought zone. Similarly, if the 5-period EMA crosses below the 10-period EMA after a prolonged uptrend, we prepare to enter ‘short.’ In this case, the RSI should be below the level of 50, and Stochastic lines should be moving downwards.

We exit the trade when 5-period EMA crosses beyond the 10-period EMA, where this is confirmed by the close of a candle beyond the latter. Another way to exit the trade is when the RSI drops below the 50 level. The several conditions which must be fulfilled in order to execute a trade make the strategy a good filter for trade entries. However, the two EMAs have a drawback as they can get choppy and generate false signals. We can avoid this by carefully monitoring the movement of EMA lines along with the other indicators. When the strategy is executed by following every rule of the strategy, wrong ‘trades’ can be eliminated to a great extent.

Trade Setup

In order to explain the strategy, we have considered the 5 minutes chart of EUR/USD, where we will be illustrating a ‘long’ trade. Here are the steps to execute the strategy.

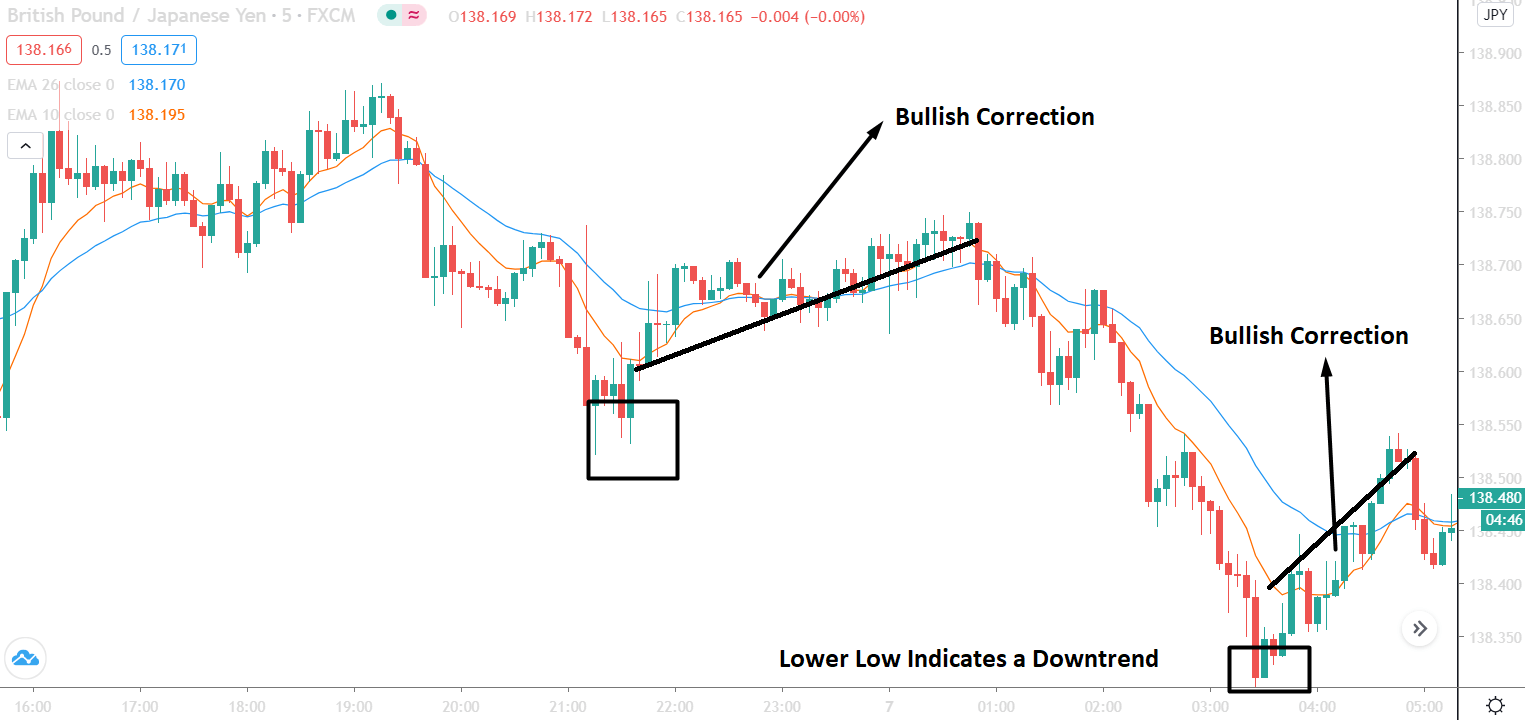
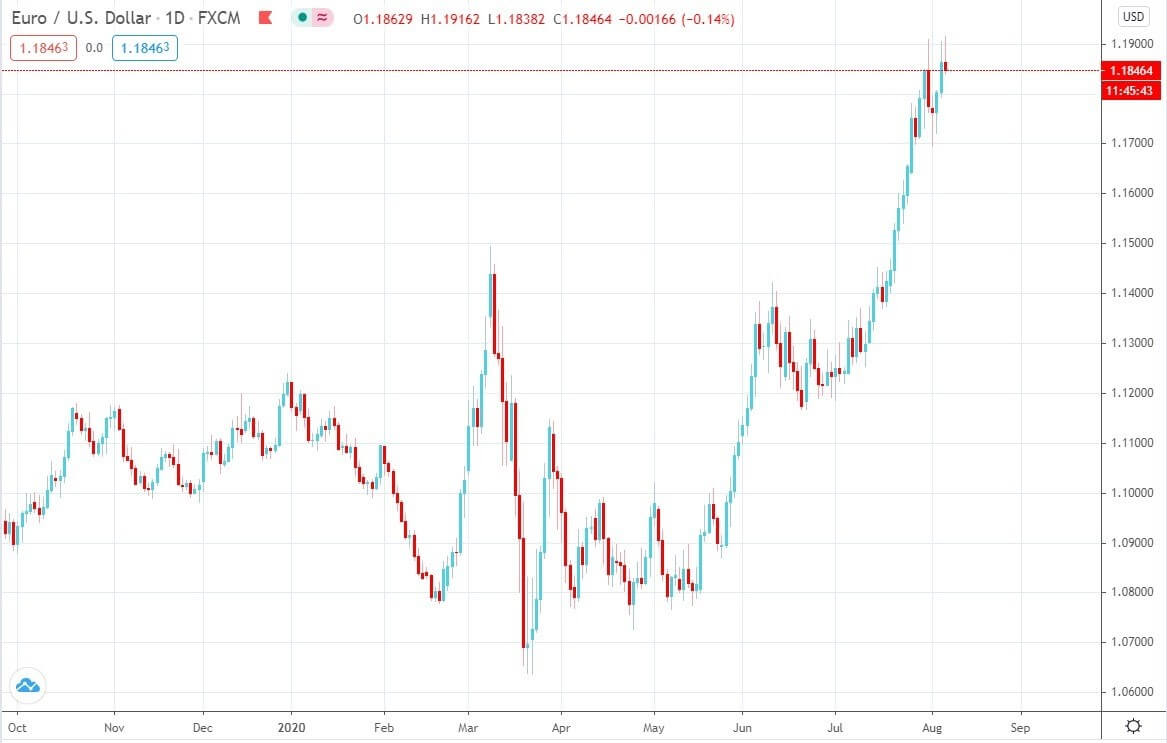
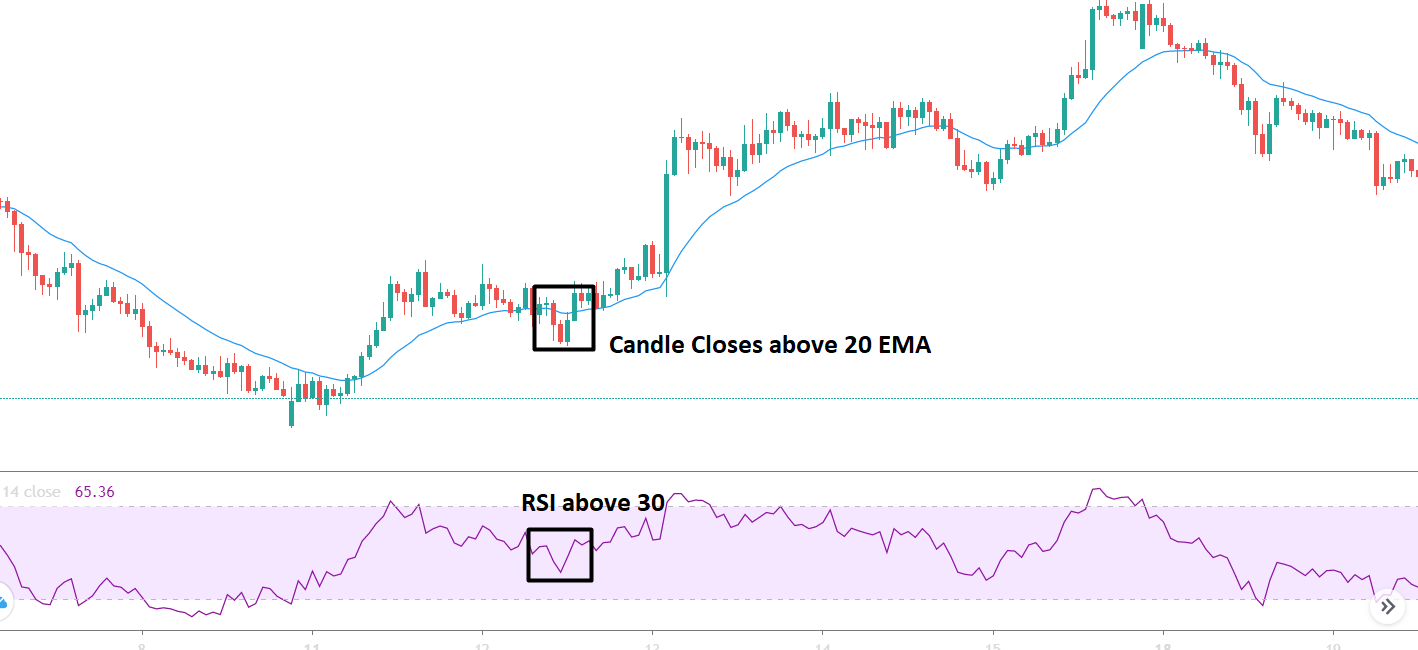
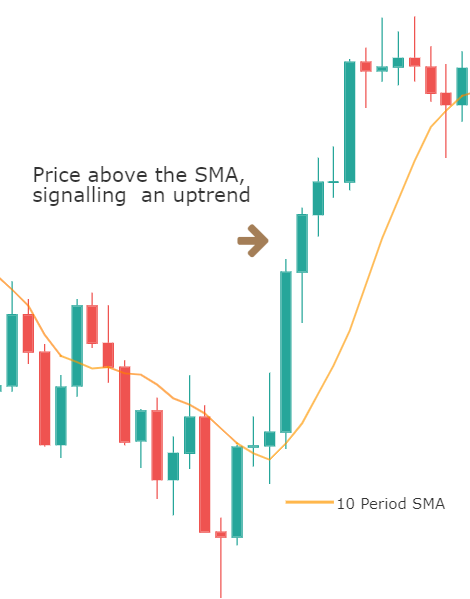
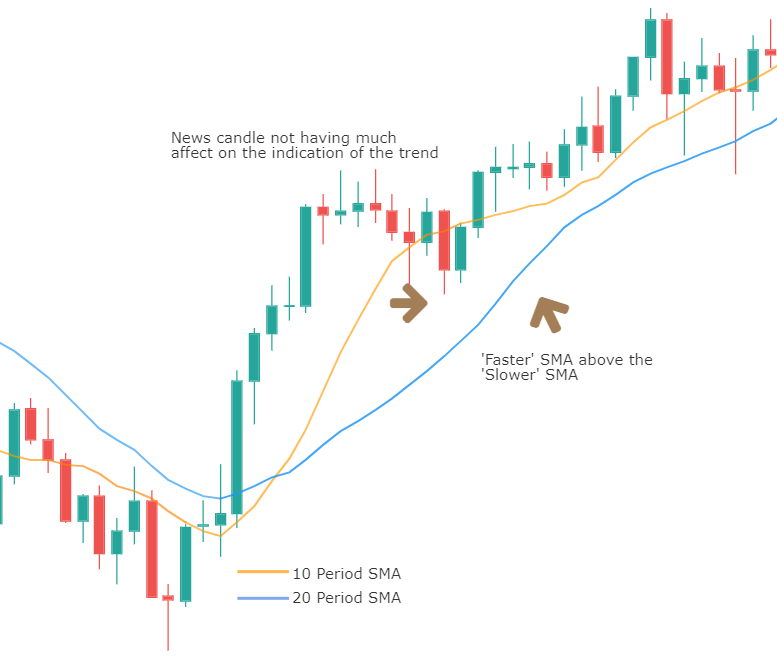
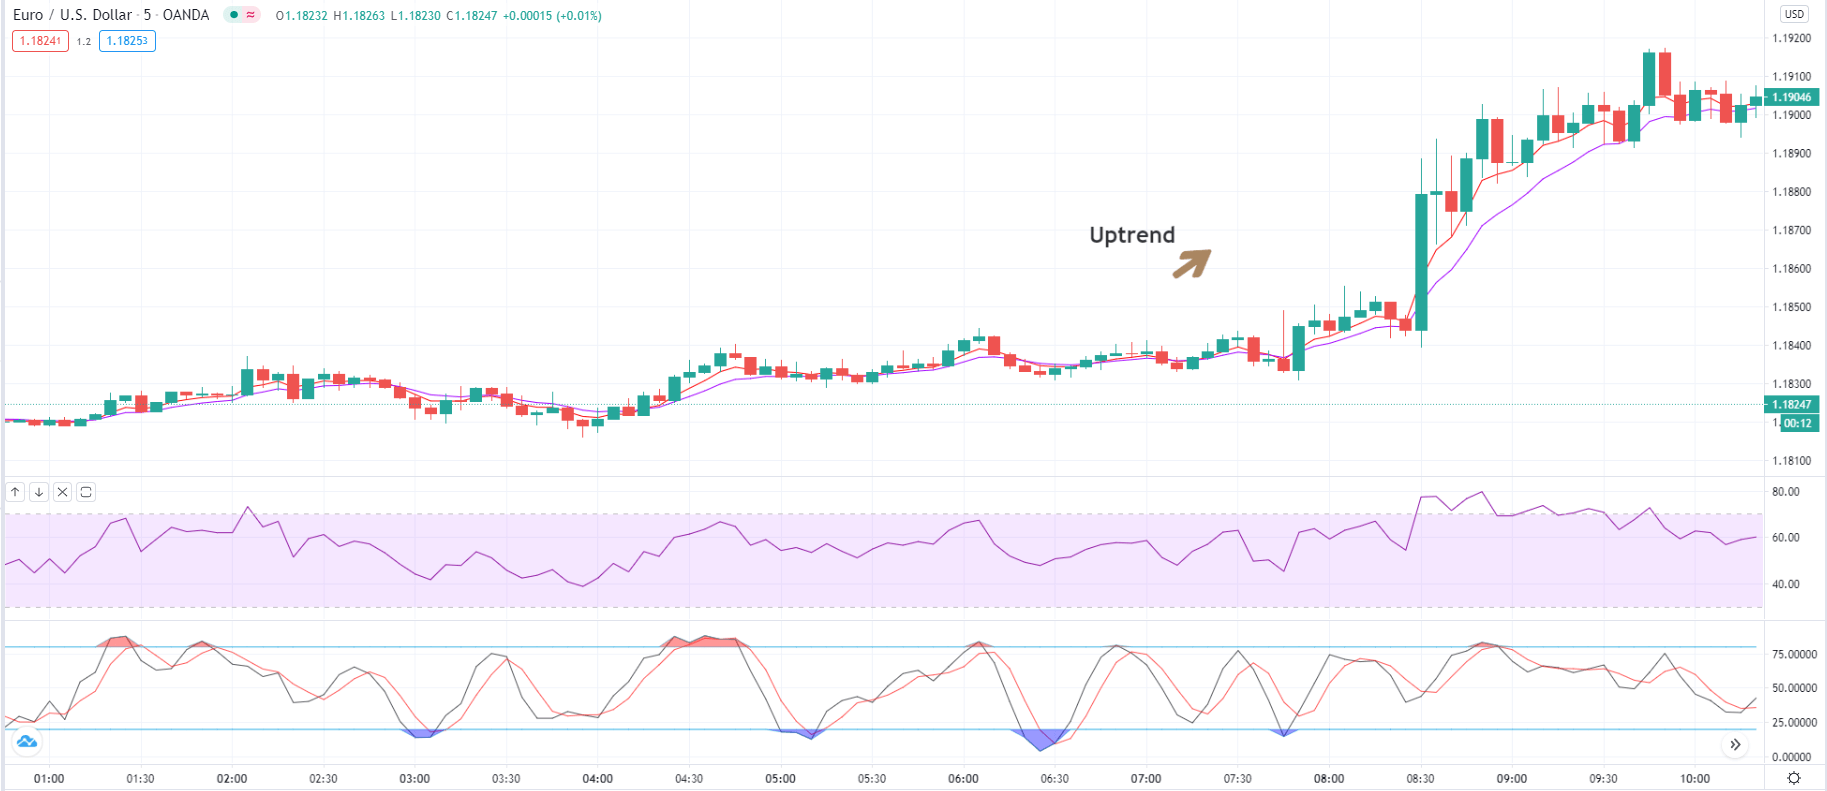
Step 1: The first step is to identify the trend of the market and plot all the indicators on the chart, as mentioned in the above section. An easier way to identify the trend is by looking at the price concerning 5 and 10 period EMA. If the 5-period EMA is above the 10-period EMA, we say that the market is an uptrend. Whereas, if the 5-period EMA is below the 10-period EMA, the market is said to be in a downtrend.

In the example considered, it clear from the below image that the market is in an uptrend, and at the end, the trend seems to be weakening.

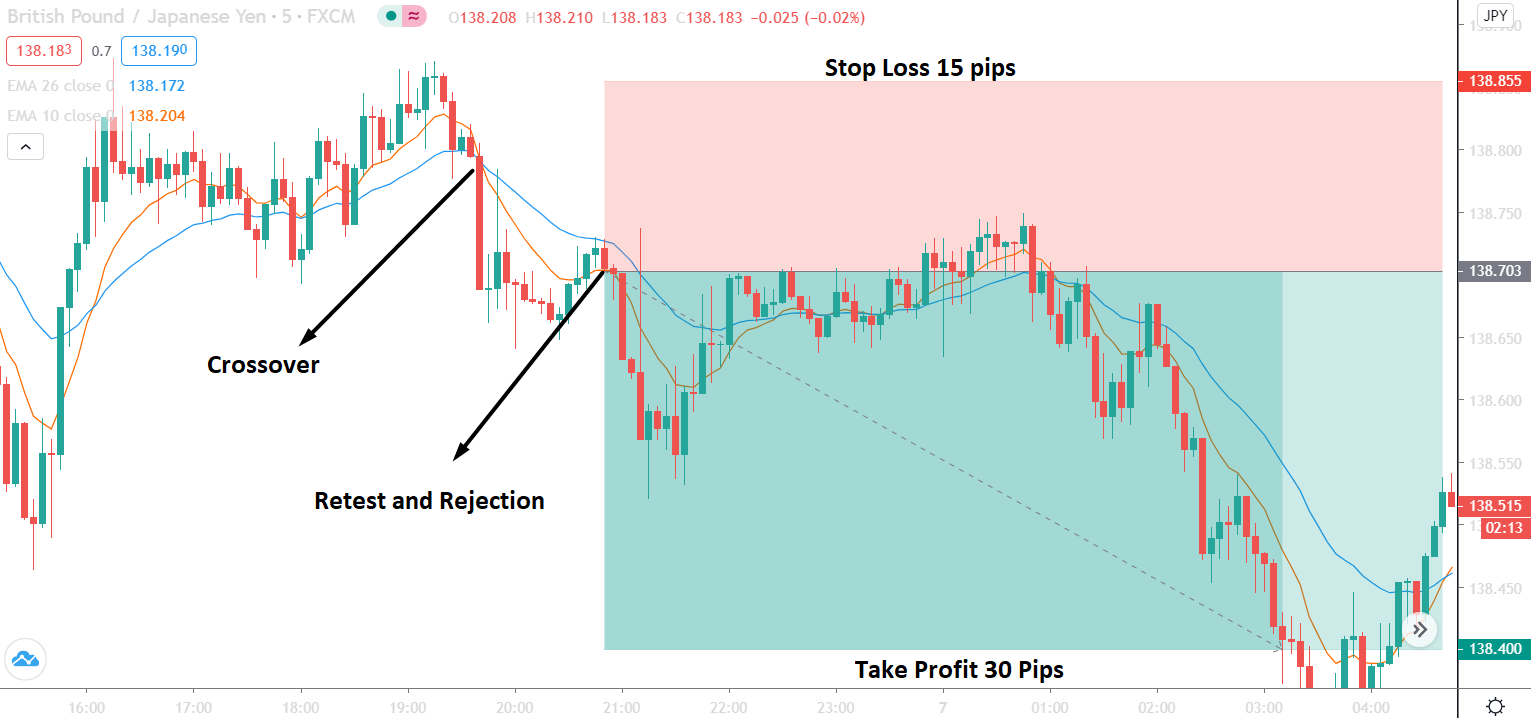
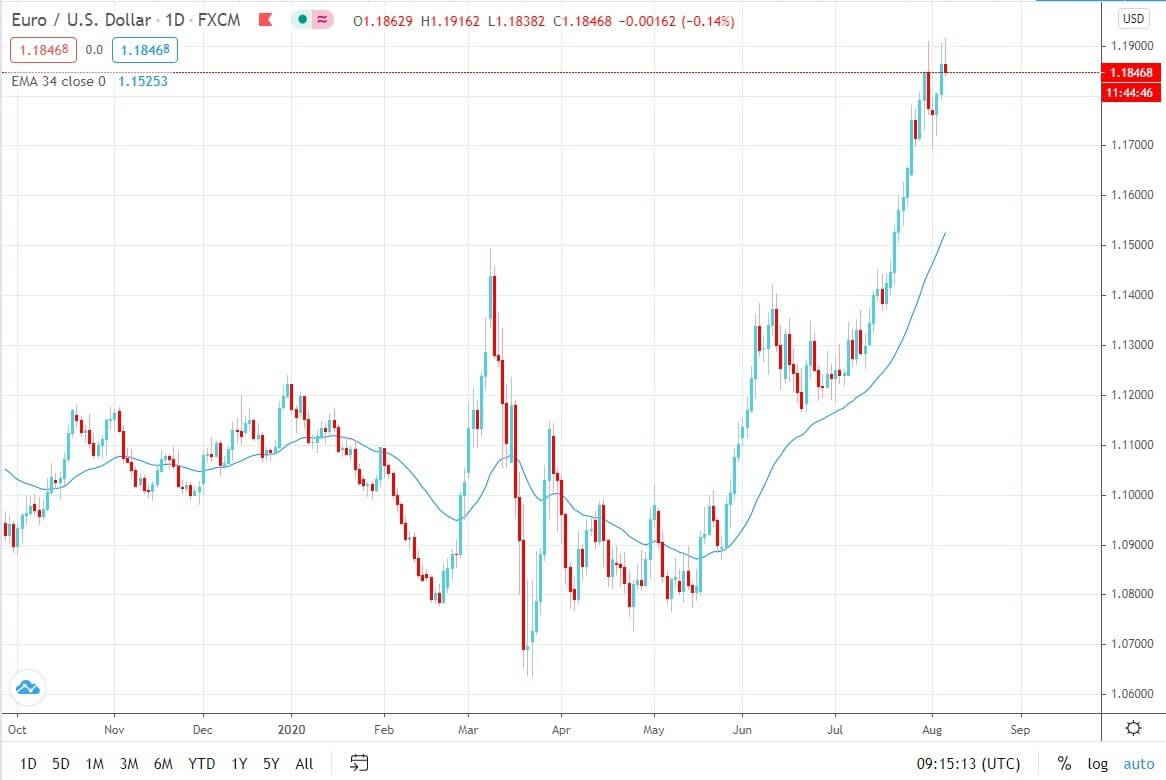
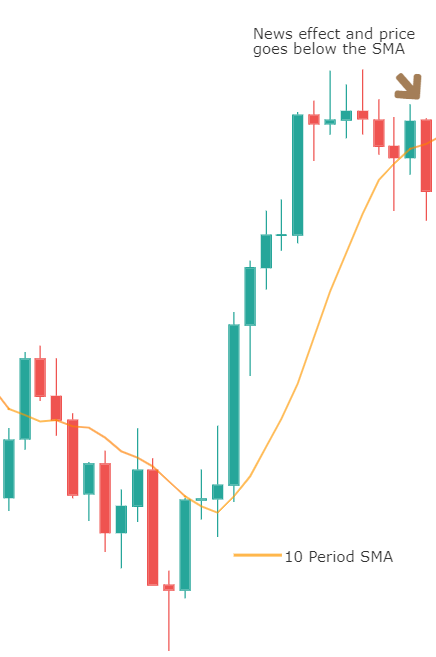
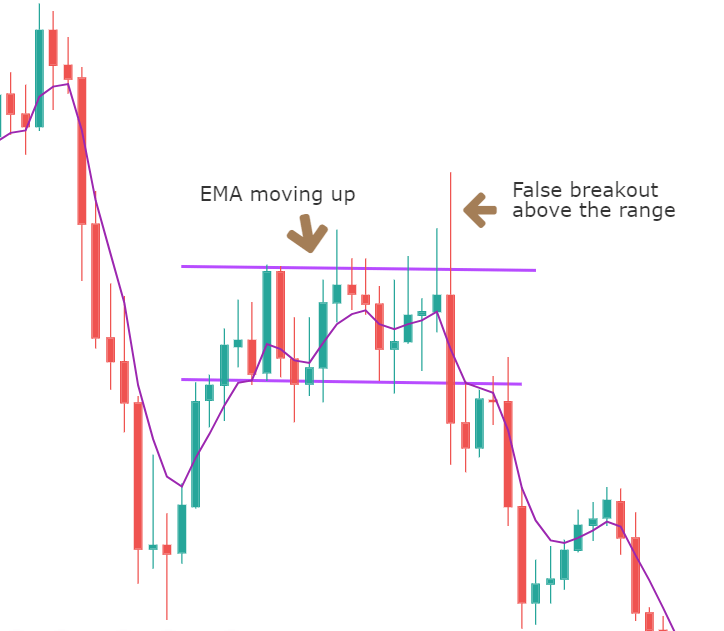
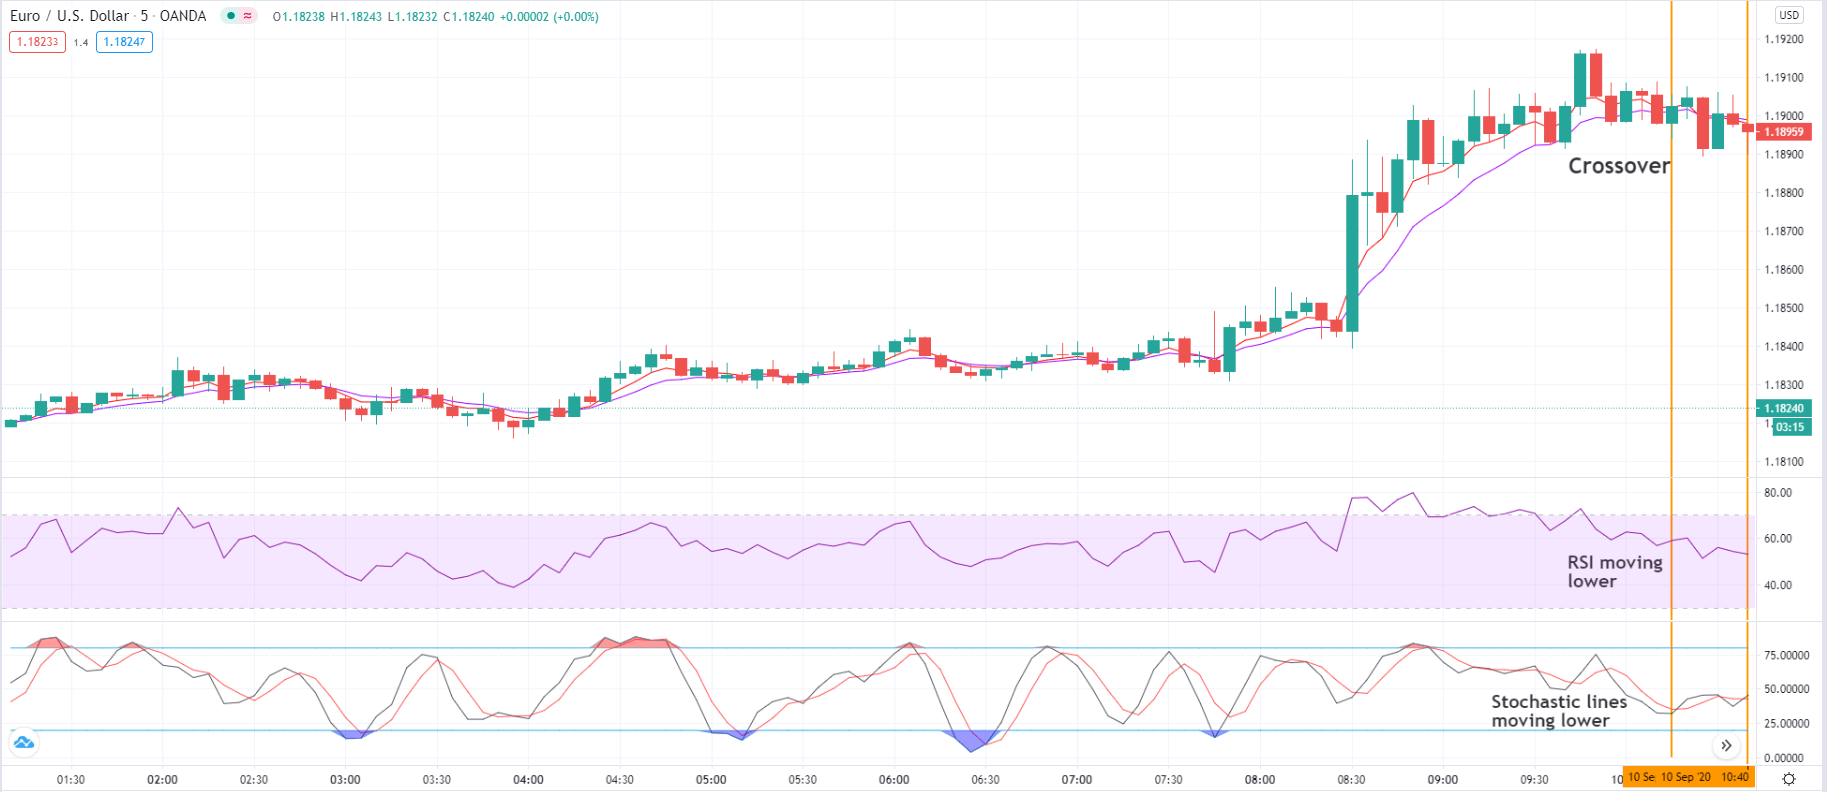
Step 2: This is the most critical step where we combine all the rules of the strategy. Once the trend has been identified, we should wait for a crossover of the 5-period EMA below the 10-period EMA, during the reversal of an uptrend. We say that the market has made a ‘top’ when both RSI and Stochastic lines start moving lower after the crossover. We should make sure that RSI does not move into the oversold zone. In order to catch the reversal of a downtrend, we should see a crossover of the 5-period above the 10-period EMA. At the crossover, the RSI and Stochastic lines should head upwards but so much that they move into the overbought zone.

The below image shows the crossover of both the EMAs that is accompanied by a ‘moving down’ RSI and Stochastic.

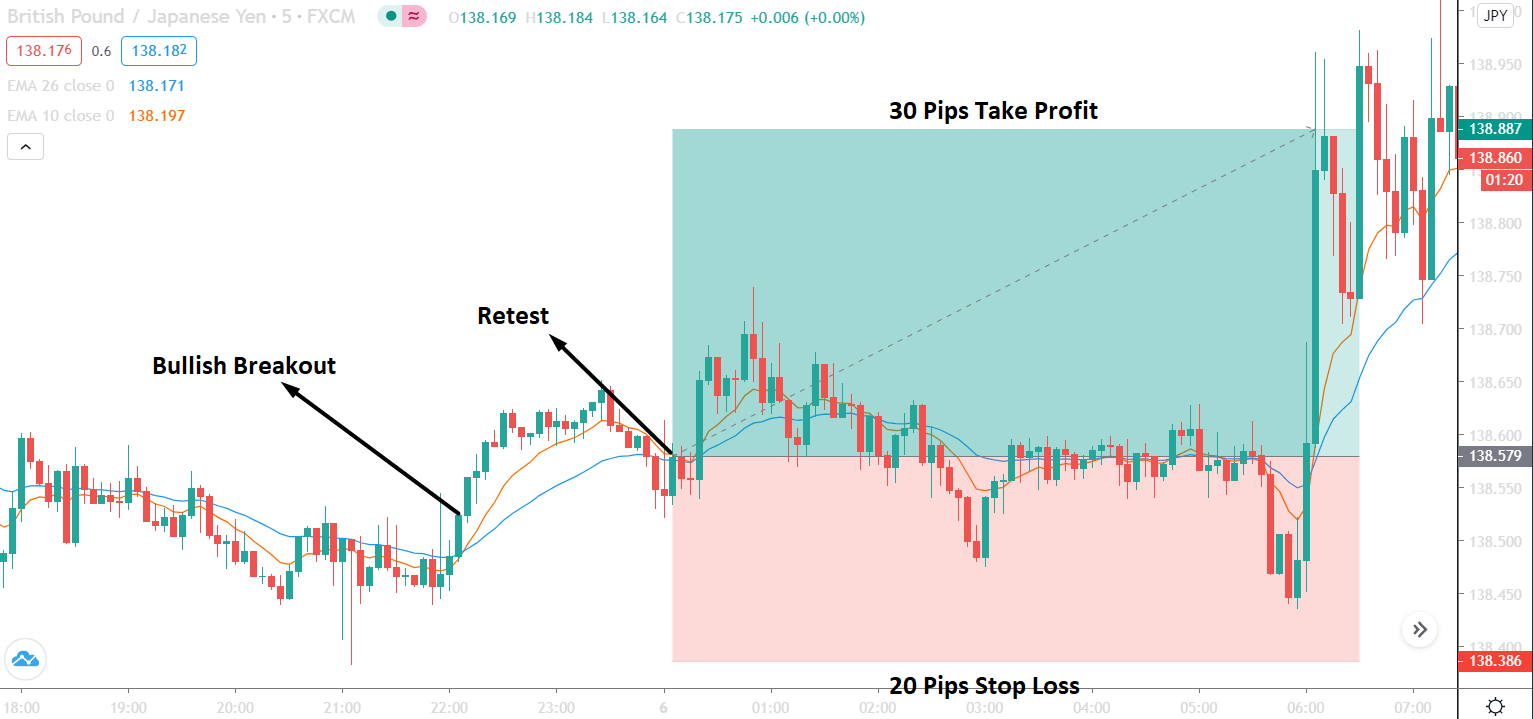
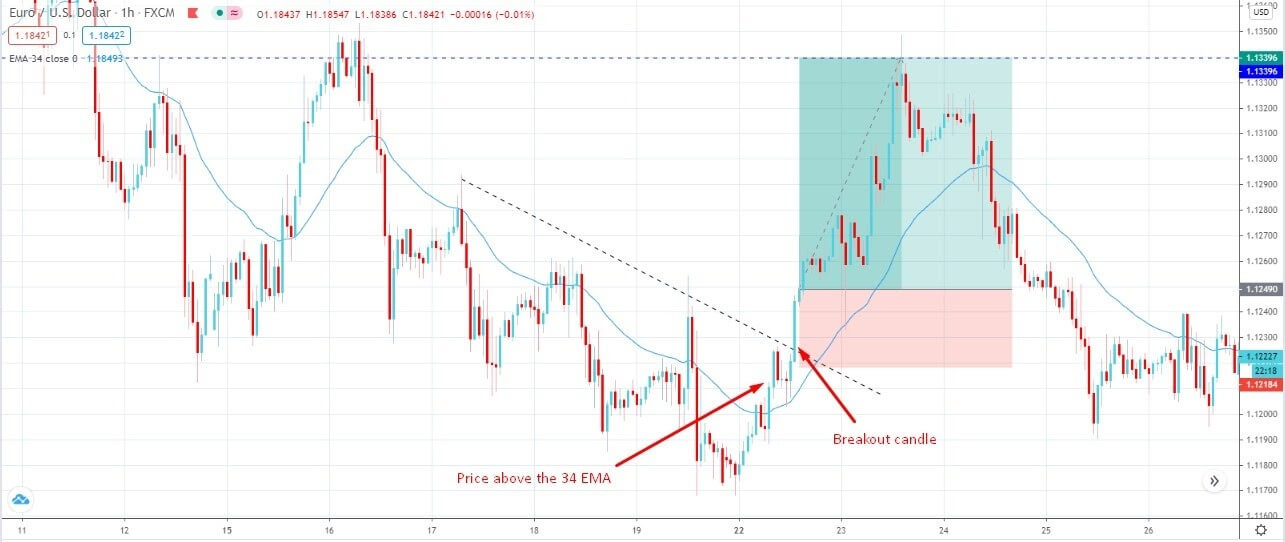
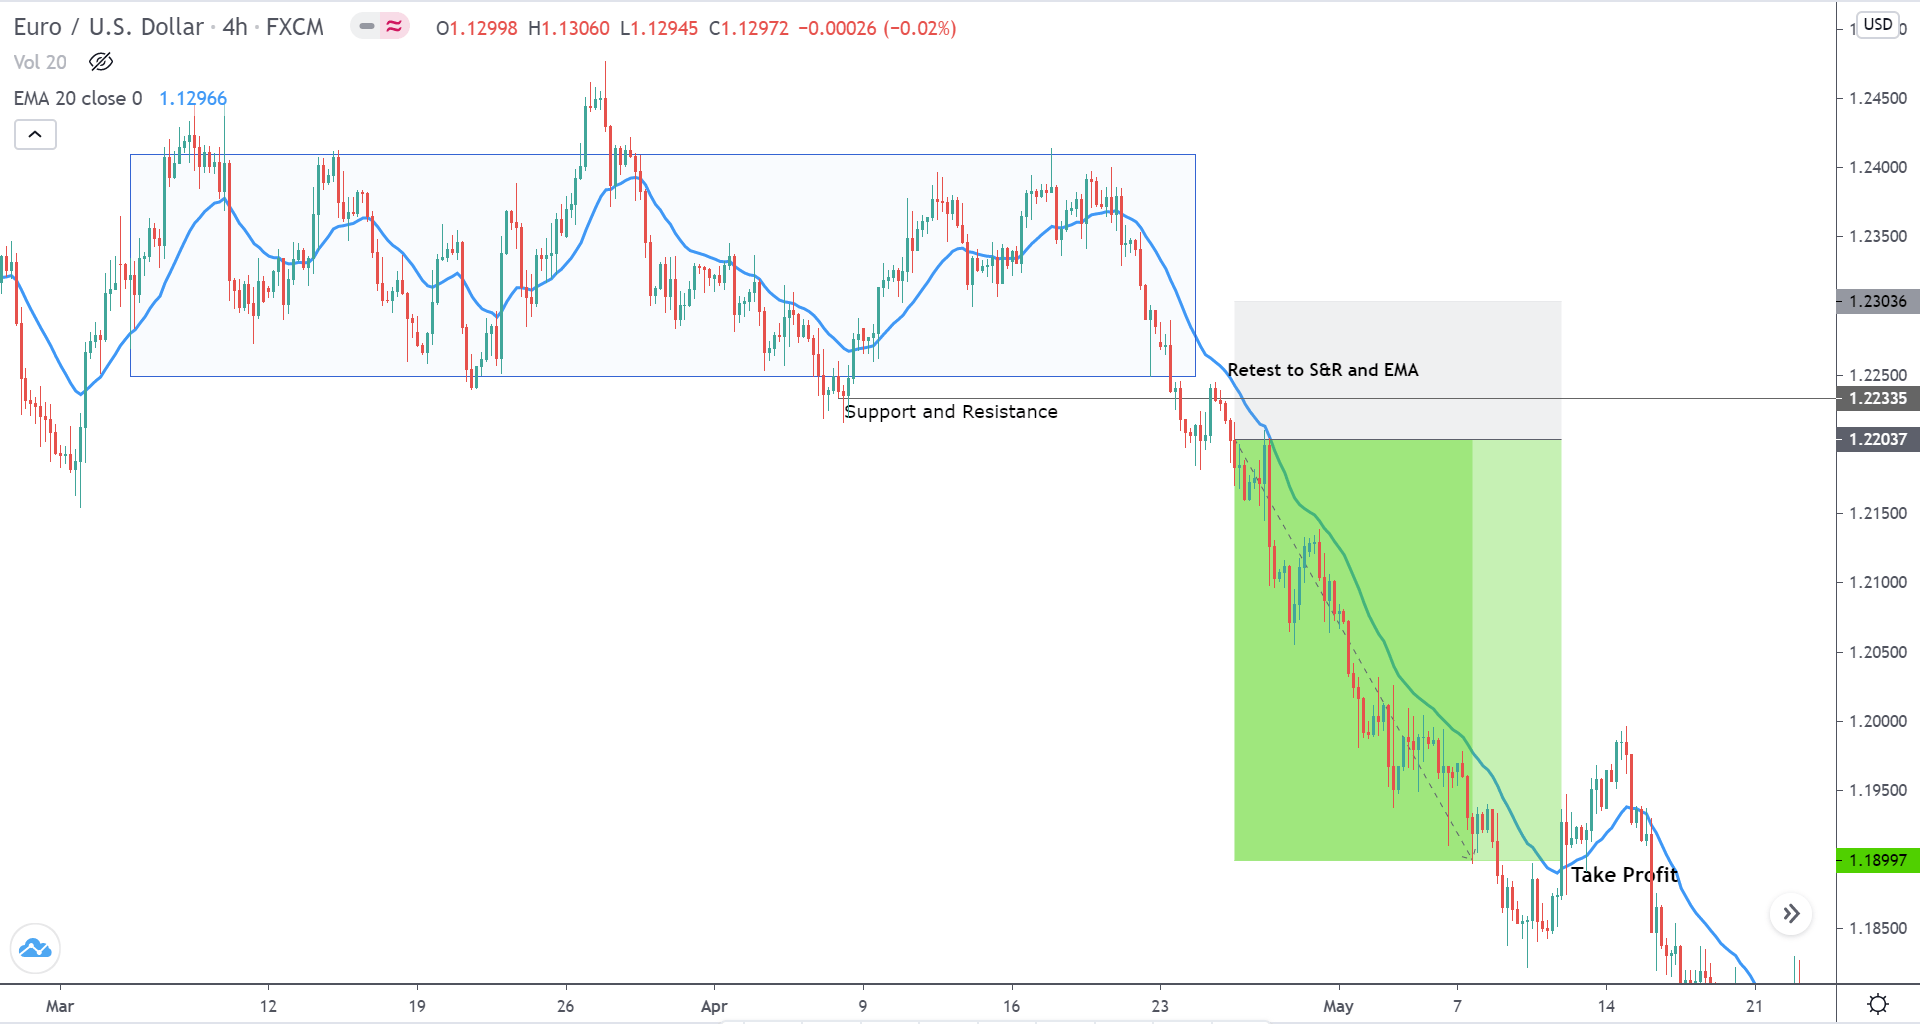
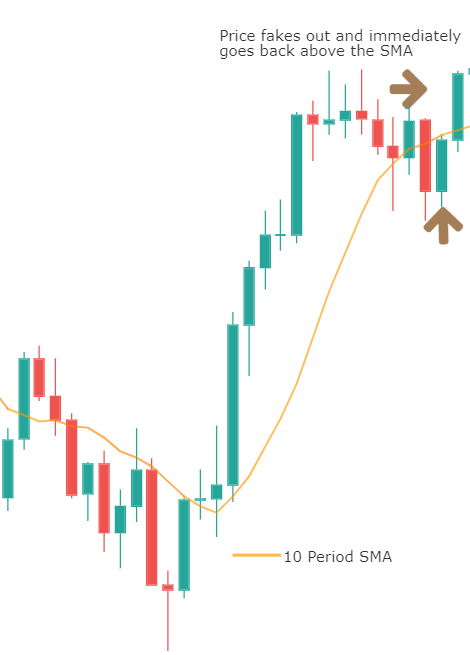
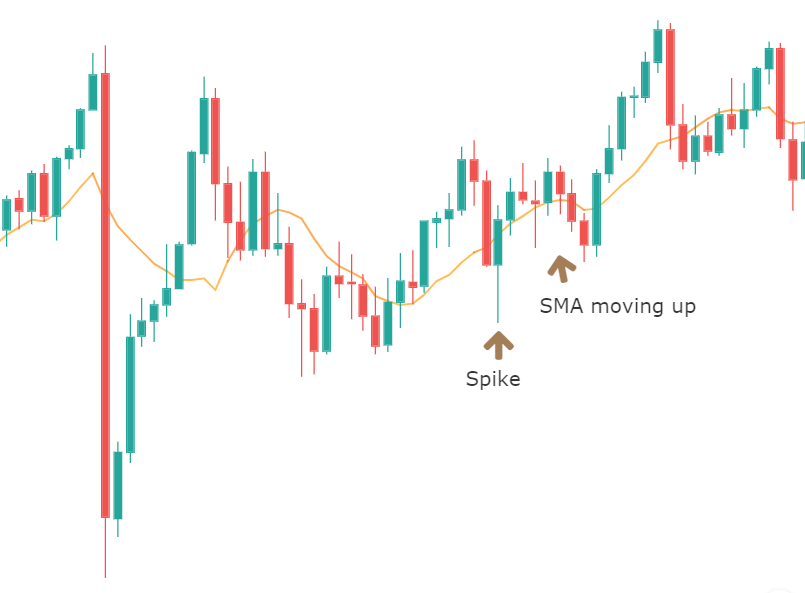
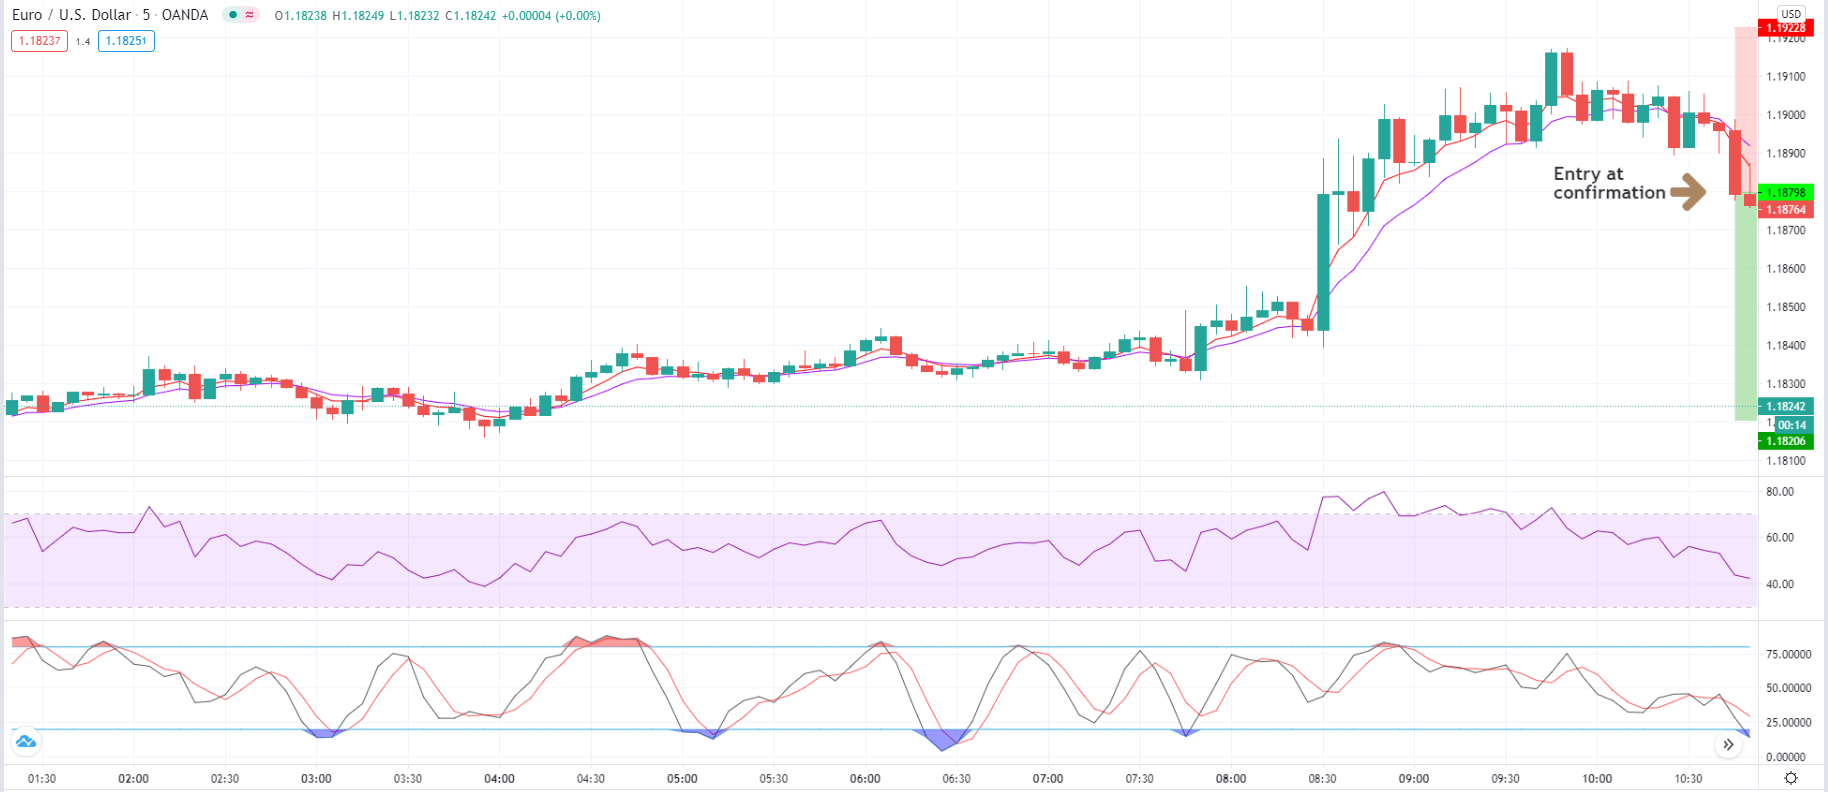
Step 3: Let us discuss the ‘entry’ of the strategy. We enter the market after a confirmation candle in the direction of the reversal. That means we enter ‘short’ after the close a bearish candle below both the EMAs. Similarly, we go ‘long’ after the appearance of a bullish candle, where the price closes above both the EMAs.

We can see in the below image that we are entering the market for a ‘sell’ right after at the close of the price below the 10-period EMA.

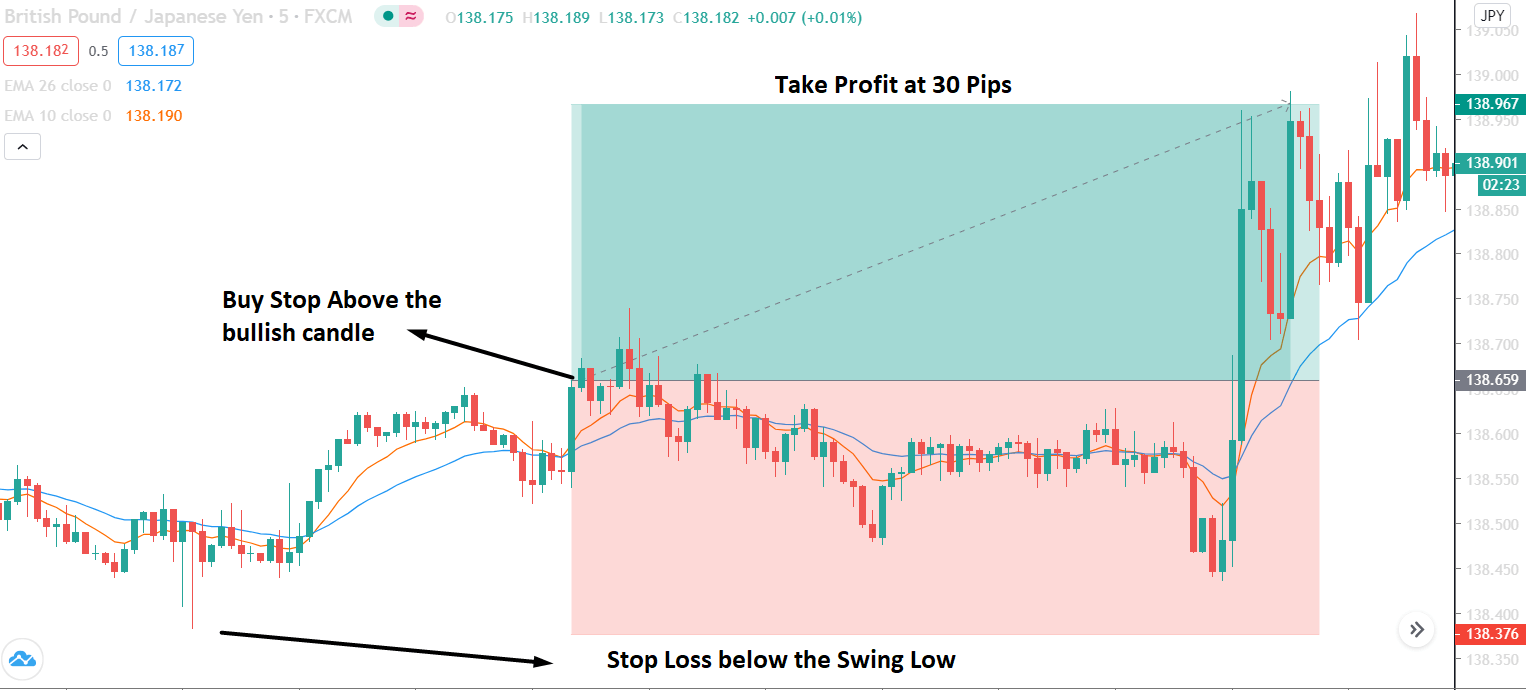
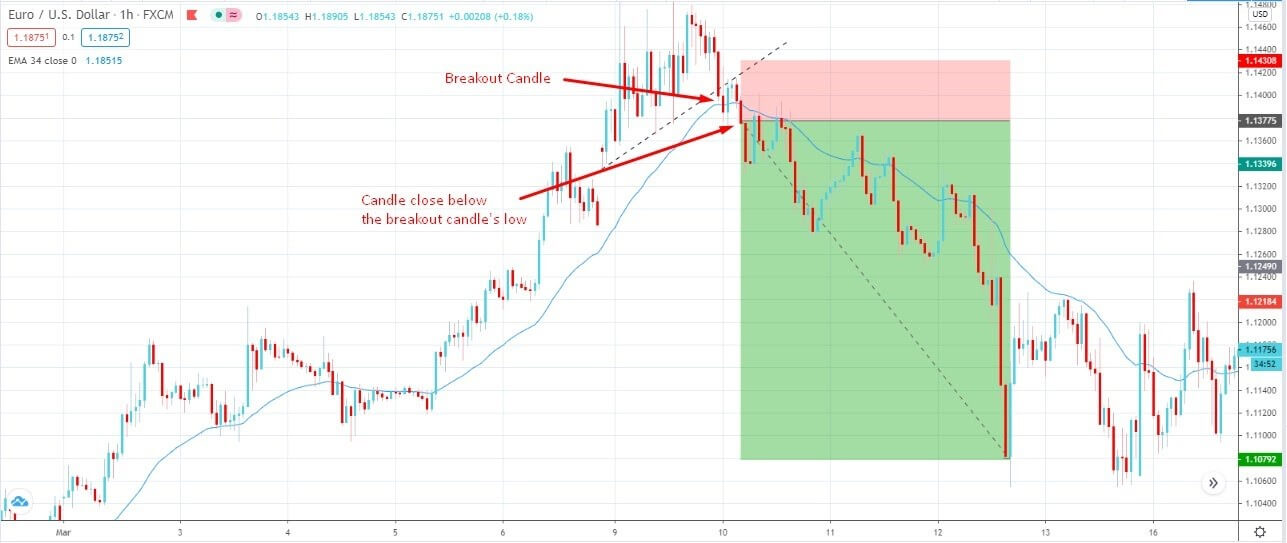
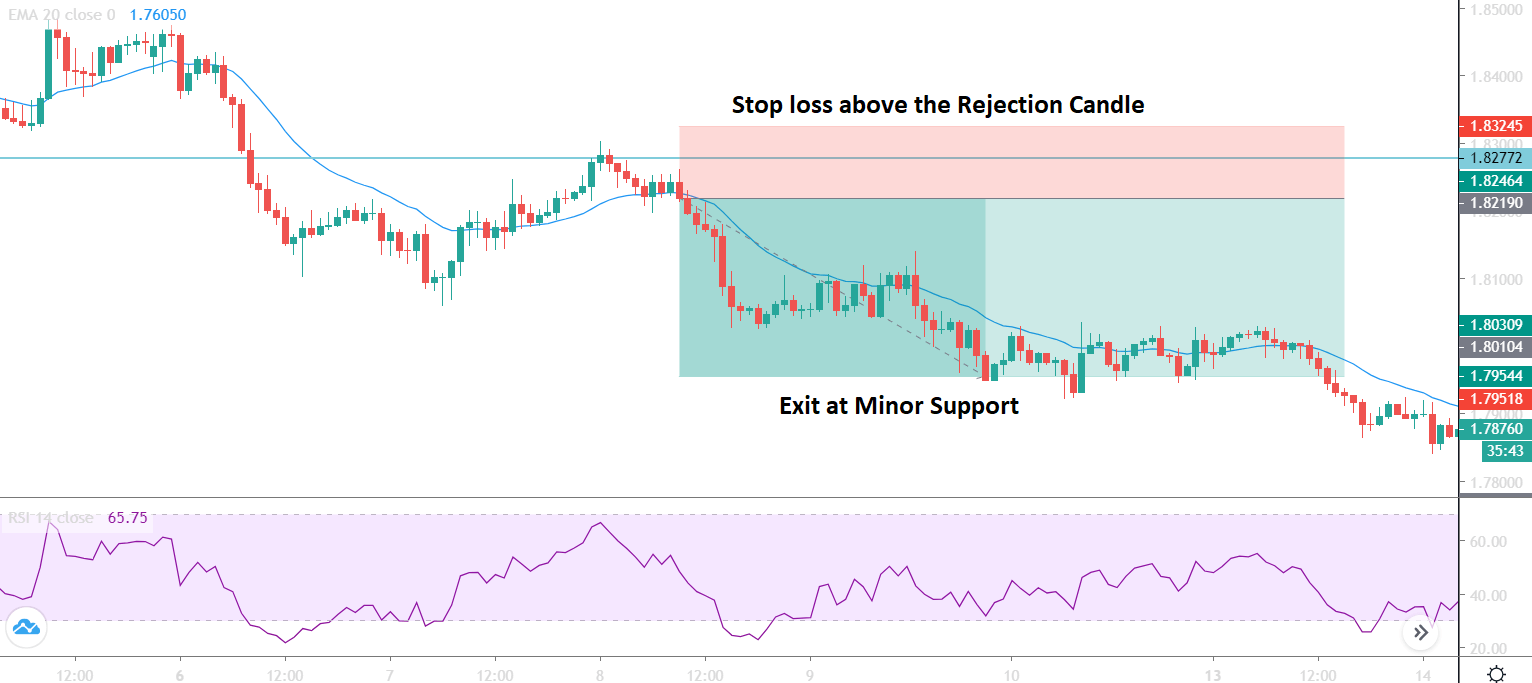
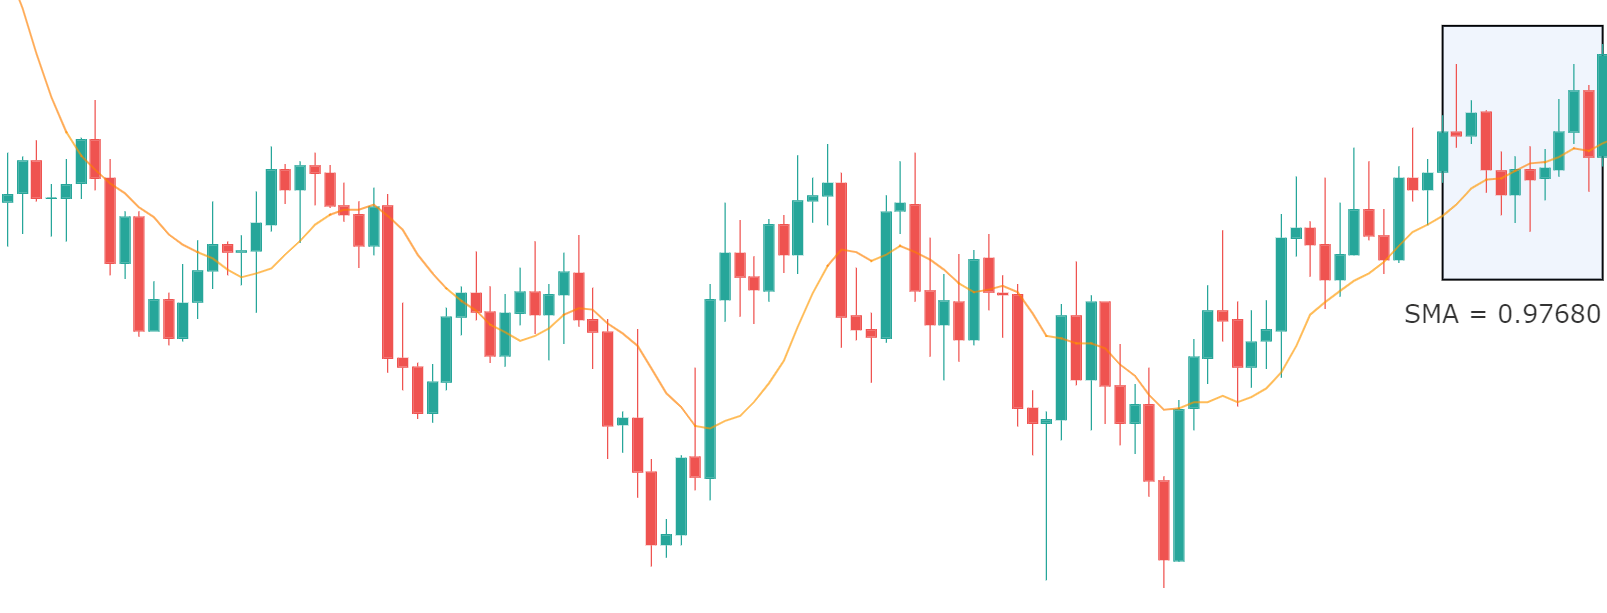
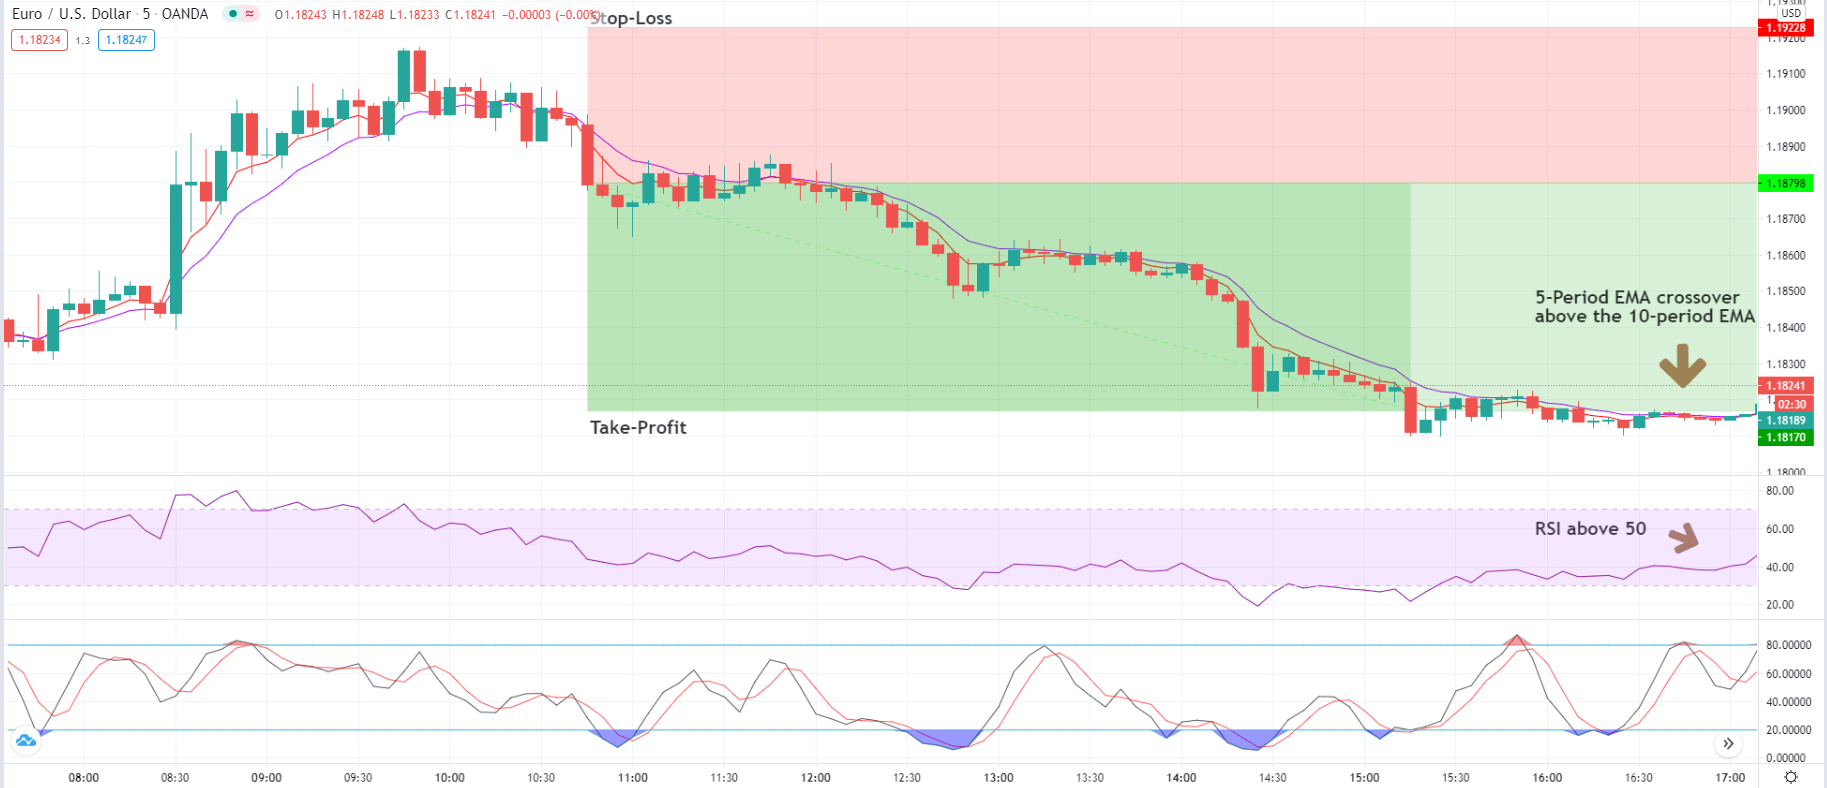
Step 4: In this step, we determine the stop-loss and take-profit for the strategy. The stop-loss is pretty straight forward where we place it just above the ‘highest’ or ‘lowest’ point. We take our profit and exit the position based on the signal provided by RSI. There two ways to exit the strategy. The first signal provided by the market to exit is when the crossover of the EMAs takes place. The second way to exit is when the RSI starts moving higher and crosses above the level of 50.

In the case of EUR/USD, as shown below, we take our profits when both the indicators indicated a reversal of the trend.

Final Words

The strategy actually generates various entry signals, and each of them can at least result in a profit for scalpers, by running very tight stops and keeping risk low. Thus, the strategy makes a reliable reversal trading system which relatively accurately pinpoints reversal points at the end of a trend and, more importantly, the ability to provide high risk-to-reward (RR) trades.

Categories
Forex Basic Strategies

Reliable Way To Make 30-Pips A Day In The Forex Market

Introduction

The 30 pips a day is a trading strategy that is based on market continuation pattern. This strategy is very profitable and has a long history of providing a substantial gain. Therefore, if you can implement this strategy well, you can make a decent profit from the forex market. This strategy is focused on a quick gain from the market; therefore, the currency pair that usually make a fast move is recommended for this strategy.

In this trading strategy, we will use the following elements:

  • 10 EMA and 26 EMA to identify the market direction. The main reason for using the Exponential Moving average over the simple moving average is that it provides the most reliable result in a short timeframe.
  • We will use 5-minute timeframe for trading as our focus is to make a quick gain from a short move.
  • We will implement the strategy in GBPJPY pair as it provides fast move in a short timeframe.

30 Pips a Day Trading System

In this trading strategy, we will consider the trend as an uptrend if the 10 EMA crosses the 26 EMA. Similarly, we will consider the trend as a downtrend if the 10 EMA crosses the 26 EMA. The reason for choosing the GBPJPY pair is that it has a higher daily movement compared to the other major currencies. GBPJPY pair can move 100-200 pips a day while most of the major currency pairs can move 60-100 pips a day.

However, our aim is not to catch every move during the day. Instead, we will focus on a little part of it, like 30 pips. That’s why the name of this trading strategy is 30 pips a day. In this trading strategy, the Potential Trading Zone is significant.

What is the Potential Trading Zone?

It is the zone where we will make trades based on our trading element. It is usually the reversal zone from where the price is likely to reverse from the current direction. Therefore, we will make the buying and selling decision at this zone depending on the current market trend.

In the above example, we can see that the major trend of the currency pair down. Despite the downtrend, the price will move up with a corrective speed, which is a minor counter-trend rally. In the 30 pips a day trading strategy, we will focus on the minor trend reversal movement and wait for the price to return to the major trend.

We can find the same market movement in the uptrend where the price will come down with a corrective speed. Later on, we will focus on the price zone from where the price is likely to resume its major trend.

Sell Setup Using the 30 Pips a Day Trading Strategy

  • Identify the major trend. If the primary trend is down, we will focus on sell trades only.
  • Find the location of price where 10 EMA crosses down the 26 EMA.
  • Do not sell immediately after the crossover. Wait for the price to make a retracement.
  • Enter the sell as soon as the candle crosses the potential trading zone halfway between the 10 and 26 EMA.
  • Stop-loss should be 15-20 pips.
  • Take profit should be 30 pips.

Example of 30 Pips a Day Sell Setup

In the above image, we can see that the 10 EMA crossed below the 26 EMA and moved up. The crossover is the first indication of sell entry. Later on, the trade setup comes as soon as price creates a bearish candle after a bullish rejection.

Buy Setup Using the 30 Pips a Day Trading Strategy

  • Identify the major trend. If the major trend is bullish, we will focus on buy trades only.
  • Find the location of price where 10 EMA crosses above the 26 EMA.
  • Do not buy immediately after the crossover. Wait for the price to make a retracement.
  • Enter the buy as soon as the candle crosses the potential trading zone halfway between the 10 and 26 EMA.
  • Stop-loss should be 15-20 pips.
  • Take profit should be 30 pips.

Example of 30 Pips a Day Buy Setup

In the above image, we can see that the 10 EMA crossed above the 26 EMA and moved down. The crossover is the first indication of buy entry. Later on, the trade setup comes as soon as price creates a bullish candle after a bearish rejection.

Alternative Trading Entry for 30 Pips a Day

  • If you don’t have enough time to manage your trade, you can simply use a pending order.
  • Once the candlestick comes back after the primary crossover, wait for a reversal candle to appear. Later on, place a buy stop or sell stop above or below the reversal candlestick.
  • You can place the stop loss above or below the candle high or low with some buffer. However, you can use the nearest swing points as a stop loss level also. Moreover, to take profit, you can set it to 30 pips.

Pros and Cons of 30 Pips a Day Trading Strategy

Like other trading strategies, 30 pips a day trading strategy has both strength and weakness.

Pros

  • As the GBPJPY pair is very volatile, it is straightforward to make 30 pips daily.
  • In a trending market, this strategy works well.
  • This strategy works well in Asian and London Session.

Cons

Summary

Let’s summarize the 30 pips a day trading strategy:

  • Identify the trending market in the GBPJPY pair.
  • Move to the 5-minute chart and identify a market where 10 EMA crosses the 26 EMA.
  • Wait for correction and enter the trade as soon as market rejects from the potential trading zone.
  • Set stop loss at 15-20 pips and take profit at 30 pips.

In every trading strategy, trade management is an important part. In the forex market, we anticipate the movement of various currency pairs and every pair moves in a different way. Therefore, if you face some consecutive losses, it is better to take a break from trading and enter the trade again as soon as the market starts to move as you expect.

Categories
Forex Basic Strategies

Catch the Breakout with 34 EMA Trading Strategy!

Introduction

The exponential moving average (EMA) is a specialized chart indicator that tracks the value of an asset over time. It is a sort of weighted moving average (WMA) that provides more weighting or significance to ongoing valuable information. As like the simple moving average, the exponential moving average is utilized to see value patterns over time, and observing a few EMAs at one time is simple to do with moving normal rebinds.

What Is an Exponential Moving Average (EMA)?

An exponential moving normal (EMA) is a kind of moving average (MA) that puts a more noteworthy weight and sharpness on the latest information points. The exponential moving average is likewise alluded to as the exponentially weighted moving average. An exponentially weighted moving average responds more essentially to ongoing value changes than a straightforward moving average (SMA), which applies an equivalent weight to all observations in the period.

In the below image, you can see a naked chart of EURUSD

Now let’s plot the exponential moving average in the chart to see how it looks like

The Formula of Exponential Moving Average (EMA)

EMAToday = 
(ValuetToday ∗ (Smoothing / 1+Days)) + EMAyesterday * (1 - (Smoothing / 1+Days))
Where: EMA = Exponential Moving Average 

While there are numerous potential choices for the smoothing factor, the most widely recognised choice is 2

That gives the latest observation exceeding weight. In the event that the smoothing factor is expanded, later observations have more effect on the EMA.

Calculating the EMA

Calculating the EMA needs one more inspection than the SMA. Assume that you need to utilise 34 days as the number of inspections for the EMA. At that point, you should hold up until the 34th day to gain the SMA. On the 35th day, you would then be able to utilise the SMA from the earlier day as the first EMA for yesterday.

The calculation for the SMA is clear. It is essentially the entirety of the stock’s closing prices during a time span, divided by the number of inspections for that period. For instance, a 34-day SMA is only the entirety of the closing value for the previous 34 trading days, parted by 34.

34 EMA with Trendline Breakout Strategy

By combining the exponential moving average indicator with the price action context, the 34 EMA with trend line breakout forex trading strategy has established. In a decent trending market, this forex trading system is an entirely dependable trading strategy that can pull in plenty of pips effectively into your forex trading account.

To demonstrate it, simply proceed to do a little backtest on previous price history, and you will perceive what I’m discussing after you’ve learnt the trading methods and layouts which are additionally clarified underneath.

Timeframes

The 34 exponential moving average trading technique functions admirably in all timeframes from 5 minutes to weekly charts. The higher time frames can give better trading outcomes. However, it is best to stay on the 1 hour to daily chart as it can give high accuracy trades.

Currency Pair

There are no rules to utilise a currency pair. Still, it is good to utilize a forex pair that often remains in the range, for instance, EURUSD. However, all major and minor forex pairs are free to go with this trading technique.

Buy Entry 

  • First, draw a downward trend line and look for an upward breakout.
  • If the breakout has happened, then the price must be residing above the 34 EMA.
  • After the downward trend breakout has happened, look at the highs of the bullish candlestick that form.
  • The signal candle is the candle with a high that is lower than the last candle’s high. So, if the signal candle’s high is broken, at that point, enter a buy trade immediately. On the other hand, you can put in a buy stop order only a couple of pips over the high of that signal candle so if the price breaks signal candle’s high, your order will be placed.
  • If your buy stop order isn’t executed and the candles keep on making lower highs, move your buy stop order to every lower high candle that structures until the price goes up and executes your trade.
  • It’s always better to place a stop loss below the downward trend line breakout candle.

Sell Entry

  • First, draw an upward trend line and look for a downward breakout.
  • If the breakout has happened, then the price must be residing below the 34 EMA.
  • After the upward trend breakout has happened, look at the lows of the bearish candlestick that form.
  • The signal candle is the candle with a low that is higher than the last candle’s low. So, if the signal candle’s low is broken, at that point, enter a sell trade immediately. On the other hand, you can put in a sell stop order only a couple of pips over the low of that signal candle so if the price breaks signal candle’s low, your order will be placed.
  • If your sell stop order isn’t executed and the candles keep on making higher lows, move your sell stop order to every higher low candle that structures until the price goes down and executes your trade.
  • It’s always better to place a stop loss above the upward trend line breakout candle.

Limitations of the EMA

It is hazy whether or more emphasis ought to be put on the latest days in the timeframe. Numerous traders accept that new information better mirrors the current pattern of the asset. Simultaneously, others feel that overweighting current dates makes a preference that prompts to more bogus alarms.

Correspondingly, the EMA depends completely on authentic information. Numerous economists suspect that business sectors are proficient, which implies that current market value meanwhile mirrors all accessible data. If the markets are actually proficient, utilising authentic information should disclose to us nothing about the upcoming movement of security prices.

Summary

Let’s summarise the 34 exponential moving average with trendline breakout trading strategy:

  • You should look for an impulsive trendline breakout.
  • After the trendline breakout has happened, the price must be above or below the 34 EMA (depending on buy and sell entry).
  • It’s always better to put the stop loss below or above the trendline breakout candle.
  • Better money management can give you a better risk/reward ratio.

Moreover, you need to practice this trading strategy until your win ratio reaches above 60 per cent, and you must have to control your emotion and psychology for better outcomes.

Categories
Forex Basic Strategies

Forex Momentum Trading With The Help of RSI & MA Indicators

Introduction

If you are a trader, you should have some good ideas about the forex market. After having the basic knowledge and related stuff, you, as a trader, need to find a profitable forex strategy. After that, you need to find a proven track record of your strategy.

Therefore, you can easily implement it and start earning through your trades within a short time. However, it would help if you kept in mind that the forex is an uncertain and unstable trading market. Therefore, you must have a profitable and excellent trading strategy if you want to sustain here.

If you search on the internet, you will find thousands of proven strategies out there. The good thing is that experienced traders or mathematicians have created most of the strategies. You have to choose the best one for you.

However, the momentum-based strategy is profitable and famous too. Lots of traders are using this one as their primary trading strategy. However, if you find another suitable strategy, you can go for it besides the momentum trading strategy to boost your probability.

What is The Momentum Trading Strategy?

Momentum is a term that refers to buying a currency pair when it goes up and selling when it goes down. It is a very popular trading strategy among most professional traders.

When a big volume starts a movement, it creates a reliable market trend. Therefore, market momentum will be towards the trend that we can identify by reading the chart. In a strong bullish momentum, the price will aggressively create higher highs with a constant speed.

Similarly, in a strong bearish momentum, the price will create lower lows. After identifying the market momentum, we will move to one timeframe lower to take the trade.

However, forex trading always has an uncertain environment. No one can guarantee a 100% movement of price. However, when the market is in a trend, we can make a decent profit by using the momentum-based trading strategy.

Momentum Trading Strategy

Here is the most important part that you are looking for passionately. You will find the best momentum trading strategy for both the newbie and experienced traders. This guideline will answer all your queries.

Let’s have a look at the step by step approach of the momentum trading strategy.

Select the Currency Pair

First, you need to determine the price change from the last three months of some selected currency pairs. Also, don’t forget to do this calculation for the weekend. Once you find the last three months’ price changes, you need to research the last 13 weeks’ price movement.

In terms of currency pair, there is no clear indication of how much pair you should choose. Nevertheless, the ideal and wise option is to go through seven major currency pairs and cross pairs. It is better to put less importance on exotic pairs as they are risky because of their volatility.

After calculating the last three months’ price changes, it’s time to select the currency pair that moved much more than the others. As it is a proven profitable trading strategy, a currency pair can provide a 17% average annual profit. As per the last seven years of market observation, three months’ price has become a reliable factor while selecting the momentum-based strategy.

Entry

As we have a predetermined trend, you need to implement a trend continuation trading strategy to improve your overall trading result better. Moreover, many trend continuation strategies are there for you; you need to select a suitable one. In this trading strategy, we will use 20 Dynamic Exponential Moving Average (EMA) as a trend continuation indicator.

You should enter the trade towards the direction based on market momentum once the price rejects the 20 EMA with its body. Moreover, there is a good and effective solution for determining the trends’ strength: RSI. RSI is a good indicator, as well.

RSI stands for the Relative Strength Index. It has a 0-100 levels indicator. If the price goes below 30 levels, the price is likely to reverse towards the upside. On the other hand, if the price moves above the 70 RSI, it is likely to move down.

For a sell trade follow the following condition:

  • The price is moving towards the direction set in the market momentum.
  • The RSI is moving down from the 70 or 80 levels.
  • Price rejects the 20 EMA with a reversal candlestick formation.

Similarly, for a buy trade follow the following condition:

  • The price is moving towards the direction set in the market momentum.
  • The RSI is moving up from the 20 to 30 levels.
  • Price rejects the 20 EMA with a reversal candlestick formation.

Later on, enter the trade as soon as the candle closes above or below the dynamic level.

Stop Loss and Take Profit

After taking a trade, you need to determine the strength of the trend. You can set the stop loss 15 pips above or below the reversal candle or 20 days Average True Range (ATR).

To set the take profit, you need to determine how strong the running trend is. Moreover, impulsive pressure will indicate that the price may break the near-term support or resistance level. In that case, you can increase your take profit level. Alternatively, you can book some profit once you see the price stalling at the support or resistance levels.

Summary

In a nutshell, the summary of the entire guideline is here-

  • Find out the direction by calculating the last 13 weeks of market momentum.
  • Follow the market direction using a dynamic and hourly candle level of 20 EMA with a proper candlestick pattern.
  • According to the price action or ATR, set your stop-loss.
  • Following the market movement, you can set your take profit.

In this momentum trading strategy, trade management is the most challenging part as it requires to follow the market trend strongly. Since we know the forex market is uncertain, we should follow the market trend robustly. Moreover, you should follow an appropriate money management system that goes with your personality, and for each trade, it is wise to take less than 2% risk.

Categories
Forex Basic Strategies

Trading The Forex Market Using The ‘Bladerunner Strategy’

Introduction

Moving averages are an important piece in analyzing the charts. Some traders simply use to determine the direction of the market, while others have solid trading strategies. The Bladerunner strategy is a powerful trading strategy based on the 20-period Exponential Moving Average (EMA). The best part about the strategy is that it can be applied to any time frame and currency pair. This strategy is given the term “Bladerunner” because the 20-period EMA cuts the price action like a blade.

What is the Bladerunner Forex Trading Strategy?

A market trading above the 20-period EMA indicates a bullish bias, while a bearish bias if it is trading below the 20-period EMA. If the price retests the EMA, traders look to long or short.

If the price is trading above the EMA, one can prepare to buy the currency pair once the drops and tests the EMA line and bounces back up. That said, if the market breaks below the 20-EMA, it can be comprehended as the market has switched directions – uptrend to a downtrend. Thus, traders can look for shorting opportunities.

On the flip side, if the price action is evidently below the EMA, traders may consider short selling the pair after the price retraces up to the EMA. However, if the market manages to break through the 20-EMA, it signifies that the buyers have taken charge of the market, and a potential reversal could happen. Thus, traders can catch the new trend after a proper test to the EMA line.

Criteria to trade the Bladerunner Strategy

Before taking an entry using the Bladerunner strategy, two criteria must be satisfied:

  1. Before entering based on the strategy, the price must breakout from a range or should already be in a strong trend.
  2. After the first criterion is satisfied, the price must successfully retest the 20-EMA. If the market is trading above the EMA, the test should be such that the price drops to the EMA, touches it, and reverses in the predominant trend. Finally, if the candle closes above the EMA, it is an indication that the uptrend is still active and intact. A similar concept applies to a downtrend as well.

These two points are vital to consider before attempting to trigger the order. Besides, traders who require more confirmation may trade those setups where the price bouncing off from the EMA is also a strong Support and Resistance level or a pivot point.

Trading the Bladerunner Forex Trading Strategy

The Bladerunner strategy can be traded in several ways, given the concept applied remains the same. Novice traders enter solely based on the EMA, while more professional traders combine this idea with their analysis and then execute their trade. Here are a couple of Bladerunner strategies designed for traders of all suites.

Buy Example

Below is the price chart of GBP/NZD on the Daily time frame with the 20-period EMA applied to it.

Reading the chart from left-most, it is observed that the market has been moving sideways in a range. During mid-May, the market finally broke above the top of the range. Also, the breakout happened such that the price was well above the 20-period EMA.

At the beginning of June, the market pulled back down to the EMA and left two tails at the bottom. This is an indication that the market is preparing to go north. Thus, a trader can go long as the holds for a couple of candles above the EMA.

Placements

Stop loss

The stop-loss must be placed few pips below the top of the range such that it is below the EMA as well.

Take Profit

There is no fixed take profit point for this strategy. However, the trade can be closed when the price drops below the 20-period EMA.

Sell Example

Below is the price chart of EUR/USD on the 4H time frame. Initially, the market was ranging, but later it was pushed down by the sellers. After the breakout, the price retraced and tested the EMA as well as the S&R. When the sellers pushed the market down yet again, it is an indication that the downtrend is going to continue.  Thus, one can prepare to go short at these levels.

Placements

Stop loss

The stop loss can be placed safely above the Support and Resistance and the bottom of the range.

Take Profit

Since there is no reference to the left, there is no fixed take profit. However, traders must liquidate their positions once the market crosses above the 20-period EMA.

Bonus Example

Consider the below price chart of AUD/USD on the Daily timeframe. We see that the overall trend of the market is down. The level 0.68745 represents the most recent Support and Resistance area.

To trade this market, we wait for the price to retrace up to the S&R level (grey ray) before entering the trade. Below is the same chart of AUD/USD on the 4H time frame. The pullback for the massive downtrend began in September. Observe that the price action of the retracement is above the 20-period EMA.

Once the price approaches the Daily S&R, it begins to consolidate, yet above the EMA. Later, as the market slows down, the price aggressively drops below the 20-period EMA. The price then retests the EMA, tries to go above it, but gets drawn down by a bearish candle. Thus, when another bearish candle appears, one can short sell the pair.

Placements

Stop loss

Since the market took a turnaround at the S&R level, the stop loss can be placed right above this level. Besides, one should ensure that the stop loss is above the EMA.

Take Profit

This strategy is basically a trend pullback trade that incorporates the Bladerunner strategy. Thus, the take profit can be placed at the recent lows.

The Bladerunner is a great strategy and helpful to several traders because it blends with any other strategy. Do try this strategy by combining it with your primary strategy and level up your trading skill. Cheers!

Categories
Forex Course

76. Using Moving Average As Dynamic Support & Resistance

Introduction

In the previous article, we saw how moving averages could be used to find potential trade setups that are essentially based on trend reversal. The next fascinating use of the moving average is that they act as crucial Support and Resistance levels. We know the importance of Support and Resistance levels in technical analysis, and we learned how many indicators can be paired with these levels to generate potential trades.

But in the case of moving averages, this indicator itself acts as a potential support and resistance areas. We need to remember that these levels keep changing as and when the market changes its direction. That is why these levels are known as dynamic support and resistance levels. In this article, let’s understand this concept clearly.

In the below chart, we can see that the market repeatedly takes support at 50-Period EMA and then continues its uptrend.

From the above chart, we can also notice that the price at times is going below the EMA before bouncing off. Also, some times, the price is not precisely touching the EMA. In some cases, it is also possible that the market can just crash downwards without respecting our EMA line.

To overcome this problem, we should plot more than one EMA on the chart and then buy or sell once the price is in the middle of the two moving averages. We can also refer to this as the ‘trading zone.’ Let us see how the above chart will look after plotting another EMA on it.

After plotting 100-period EMA on the chart, we can see the price entering the areas between two MAs before going up and does not even touch the second MA. This means moving averages should never be used as single line support and resistance levels; rather, it is a ‘zone’ from where the market has a high chance of reacting.

When we use the concept of ‘zones,’ we get a clear idea of where to put the ‘stop-loss’ and ‘target.’ For example, the ‘stop-loss’ can be placed below the second MA, and ‘target’ could be the new higher high. When we have such a wide area for our ‘stop-loss,’ there is less chance of us getting stopped out before the trade performs in our favor.

Role Reversal of moving averages as Support and Resistance

Now that we know how moving averages act as support and resistance levels, we need to check if follows all the rules of S&R. One of the most significant rules of S&R is support turning Resistance and vice versa. We shall see if MAs follow that.

Below is a chart that shows how the moving average turns into Resistance after it was previously behaving as support. The yellow-colored arrow marks the point where the price broke through and crashed. Later, it started acting as a dynamic resistance level.

Conclusion

Using moving averages as support and resistance levels can be highly profitable when done with proper trade management. Intraday traders mostly use this technique as they fear of getting stopped out due to spikes. The best part of this application of the moving average is that they’re dynamic, which means we just need to plot them and leave it on the chart. We don’t have to keep looking back to spot support and resistance levels. In the next article, we will summarize all that we have learned about the moving averages. Cheers.

[wp_quiz id=”65911″]
Categories
Forex Course

74. Using Moving Averages To Identify The Trend

Introduction

In the previous lessons, we have understood the two types of Moving Averages and the difference between them. We have also seen which Moving Average should be used in different market conditions and the one that must be preferred most of the time. From this crouse lesson, let’s explore the real-time applications of Moving Averages and how we can find accurate trades using this indicator.

One of the simplest, yet important use of Moving Average is to determine the direction of the trend. This can be done by plotting the indicator on the chart and then deciding the position of candlesticks with respect to the line of Moving Average.

The ideal way of identifying a trend using MA is this – If the price action tends to stay above the moving average line, it usually signals an uptrend. Likewise, if the price action remains below the moving average line, it indicates a downtrend.

This approach of establishing the trend is too simplistic and also has a significant drawback. Let us understand that with the help of an example.

Below is the EUR/USD price chart, and we have added a 10-period MA line to it. According to the rules of MA, since the price is above the MA, we should be going ‘long’ in this currency pair.

Due to a news event, price drops suddenly and closes below the MA (in the below chart). So, this changes our plan, which means now we should be thinking of going ‘short’ in the currency pair. But before we do that, let us see what happens to the price in the next few candles.

The below image shows that the price fakes out and does not continue its downward trend. Hence, if we would have gone short, that would have resulted in the price hitting our stop-loss resulting in a loss. Let’s understand the problem with this setup.

The strategy mentioned above is right, but the problem is that we are using a single period MA line stand-alone and not combining it with any other indicator. The best way to use MA for determining a trend is by plotting an extra Moving Average line on the charts instead of just one. It will give us a clearer idea if the pair is trending up or down depending on the sequence of the MAs.

The best way is to check if the ‘faster’ moving average is above the ‘slower’ moving average for an uptrend, and vice versa for a downtrend. In the below chart, we can see that the ‘faster’ SMA is above the ‘slower’ SMA, and this shows the strength of the uptrend. Also, the fake-outs that happen because of news releases will also have less impact on the indication given by the Moving Averages. Combining this knowledge with trendlines can help us decide if we have to go ‘long’ or ‘short’ in the currency pair.

Conclusion

Moving Averages can be useful for establishing the direction of a trend, but it should never be used stand-alone. If not other indicators, additional moving averages itself can be combined with an existing moving average to decide the direction of the trend. In the next article, we will be discussing how we can enter a trade using moving averages and profit from this indicator.

[wp_quiz id=”65733″]
Categories
Forex Course

73. Simple vs. Exponential Moving Average

Introduction

After having a fair amount of discussion concerning Simple and Exponential Moving Averages, a question that may arise is, which one to use when? Whether SMA gives accurate trading signals, or is it the EMA that is more accurate and reliable than SMA? Let’s try answering these questions in this article.

We mentioned in the previous article that the EMA responds to price action more quickly. So, if we want to determine a short-term trend, EMA is the best way to go. It can undoubtedly help us in catching the early move of a trend and, in fact, profit from it by taking suitable positions in the market. The downside of the EMA is that it gives us the wrong signals during the consolidation periods of the market.

Since the EMA responds very quickly to price movements, we might think that the price has broken out of the range while it could just be a spike. The EMA proves to be too fast, and this is not desirable in such market scenarios.

In the below chart, we see that the market starts to ‘range’ after a retracement of the big downward move. Due to this, the EMA starts moving up, indicating a buy signal. Later, when the last but one candle of the range breaks out above the range, traders might think that the market has reversed, as this is also confirmed by the EMA. In the very next candle, the price makes a long wick at the top of the candle, and the EMA takes a sharp turn on the downside. This is one of the examples where the EMA can give us false signals.

The opposite is true with Simple Moving Average (SMA).

The SMA should be used when we want the moving average to be smooth and respond to price action slower than the real price movement. This characteristic is particularly useful when we are trading longer trading frames, such as daily or weekly. Since SMA responds slowly to price movement, it can possibly save us from such fake outs.

The below chart represents the weekly chart of a Forex currency pair where we can see the SMA moving up even after the occurrence of the spike. Hence the SMA gives an idea of the overall trend by filtering out spikes.

Conclusion

The SMA should be used when we want to protect ourselves from fake-outs and predict the price movement in the longer term. By using SMA, we might miss the opportunity of getting in on the trend early. On the other hand, the EMA is quick to predict the trend, and thus we can be a part of the initial move of the trend. But it carries the risk of getting preoccupied with fake-outs.

The answer to the above question (which one is better?) is that it really depends on the type of trader we are. Our risk appetite, trading time frame, and strategy will influence the type of moving average we should choose. In the upcoming lessons, we will learn how to use moving averages to determine the trend and take a trade. Stay Tuned.

[wp_quiz id=”65651″]
Categories
Forex Course

72. Understanding Exponential Moving Average

Introduction

In the previous course lesson, we understood the first type of Moving Average, which is SMA. We also saw how spikes could distort the SMA. The solution to this distortion is the Exponential Moving Average (EMA); so, let’s discuss this type of MA in our lesson today.

The EMA gives more weightage to the recent change in prices and does not give much importance to previous data. Learning how to calculate and plot EMA on the chart will provide us with a clear understanding of which Moving Average should be used at different times of the market.

We shall take an example to explain the definition of EMA. This example will also show how the EMA overcomes a significant limitation of the SMA. In the below figure, we have plotted a 10-period SMA on the daily chart of a currency pair. Here we have chosen the USD/CHF currency pair as an example.

Since we are calculating the 10 ‘period’ SMA, we need first to note down the closing prices of the last ten periods days. The prices are as follows:

0.97806,0.97986,0.97528,0.97336,0.97536,0.97461,0.97536,0.97829,0.98156,0.97636.

The next step is to add the above-given numbers together and then divide the result by 10. This equals to 9.76804 / 10 = 0.97680. Therefore, the SMA for the last 10 days is 0.97680. The end of the orange SMA line in the above chart points exactly to the price 0.97860.

Now let us consider a case where, on the sixth day, dollar drops drastically due to a news event that was bad for the US economy. If the sixth candle drops to a price around 0.97000 (closing of all other remaining the same) due to the news release, the new SMA will now be calculated as follows:

(0.97806 + 0.97986 + 0.97528 + 0.97336 + 0.97536 + 0.97000 + 0.97536 + 0.97829 + 
0.98156 + 0.97636) / 10 = 0.97654

The resultant SMA is lower than the SMA we had obtained in the previous step. This means when the price dropped on Day 6, it created a notion that the trend is going to reverse, but in reality, it was just a one-time event that was caused by news. We need a mechanism that will filter out these spikes so that we don’t get the wrong idea. This is where EMA comes to our help.

Taking the above example, EMA gives more stress on the recent price movements, such as the closing prices of the last four candles. This means the spike that happened on the sixth day will be of less value and wouldn’t have much effect on the moving average. It is always a smart and better idea to focus on what traders are doing recently rather than what happened long ago. Always remember that the past data is of less significance to us.

The below chart shows the difference between the two moving averages when they are plotted simultaneously.

Notice that the purple line (10-period EMA) appears to be closer to the candles than the orange line (10-period SMA). This means the EMA is more accurate in representing the recent price action, and now we know why. So, the bottom line is to pay attention to the last few candles rather than candles of last week or last month.

Conclusion

That’s about the two types moving averages with their own advantages. The EMA is a better option to use when you are swing trading as it gives precise analysis than SMA due to the reasons mentioned above. EMA, too cannot be used standalone and should be paired with a trading strategy. In the next article, we will discuss the pros and cons of using SMA and EMA.

[wp_quiz id=”65573″]