Categories
Forex Basic Strategies

Four Simple Ways To Improve Your Forex Trading

We are always on the lookout for new ways to improve our trading, this is only natural and something that you should be aiming for throughout your entire trading life. While there are obviously things that they can do to improve your abilities, but sometimes there are other things like being consistent that can help too, so let’s look at what a few of them are.

Review Your Trades

A simple one this, but it is something that a lot of people ignore, it is important to review your trades, both the winning and losing trades. By looking at the trades and what happened is the best way of learning more about them, did you miss anything? Did you deviate from your plan? All of these things enable you to better understand what sort of level you are at and how different changes to the plan or things that you do may affect the outcome and profitabilities of the trades and your overall strategy.

Keep Doing what Works

This may seem obvious, but you would be surprised how many people decide to change something that is already working. If it is still working, why change it? Some people will argue to make it better, which has its merits, however, how do you know that changing it will, in fact, improve it? If it is working stick with it. There are also those that seem to get bored with the trading that they are doing, they change things up because they are bored with the current strategy, this often results in less fortunate results and can lead to a strategy not working at all.

Discover New Skills

Finding new skills takes time and effort, but ultimately it will help to improve your overall trading abilities. However, a new skill when looking at trading could be quite simple, it could be a new currency pair or a new commodity, it could be simply understanding how the markets work on another timeframe. While they are only very small things, each one of these things that you learn will increase your overall understanding and will also help you to adapt to any unforeseen conditions in the future that you otherwise may not have been able to cope with.

Learn Multiple Strategies

While you may only want to use one strategy and if it works then that is perfectly fine, you may still want to look and learn some others, why? The simple fact is that having a broader understanding of different strategies will allow you to be a lot more adaptable in the future. A strategy will never work forever, things change within the markets and so will your strategy, however having an understanding of multiple may allow you to stick to your original strategy but to implement features of another one, this way adapting your own strategy to keep it running longer and more successfully.

So learning skills takes time, it can be a lot of effort, but as with anything in life, if you put the effort in you will ultimately start to benefit from it, especially in the long run.

Categories
Forex Basic Strategies

Buy and Hold FX Trading Strategies

In this article, we will discuss and explore options you have once you are already trading on Forex. It is also for beginner traders so they can understand all the benefits of becoming a consistent, successful trader. At one point, as an established professional Forex trader, you would need to consider options with the capital you can extract from Forex. The skills traders gain in their career are universal. They do not apply only to Forex. It is not only the mindset, but it is also the system(s) they have built. This way they can use the money from one business and use to invest in another. The money will be multiplied many times over throughout their life. Of course, some people may not be interested in this, and they are probably not reading this as motivated future traders. However, this group will most likely have only one way of winning, while Forex traders have many ways to win.

Buy and Hold strategies are not very well presented and the people that talk about them do not give you anything substantial traders can use. There are a couple of them and in this article, we will discuss some applicable to Forex traders. Also, why to Buy and Hold Strategies are important, the number of people who have one is so small compared to the ones who do not. Forex traders have a huge advantage to those who are investing long term. This advantage will be discussed later. Note this is just an opinion and observation by certain professional prop traders.

People come to Forex for the most attractive reason, to gain a lot of money in the short term. This is possible although very unlikely. Forex is therefore interesting to those who do not have much to invest. However, the sooner you have, the better. It is imperative to start using the Buy and Hold strategy at the beginning of your life or as soon as you can. Regret you did not will come after many years. The long game or long term investing is not popular. The rewards are late. Sometimes too far for us to consider it as a solution to our present problems. We give present problems priority even if we have a solution for our future problems in the present. Part of this mindset is the same reason why many fail to trade on Forex. It is finding a quick fix for their financial and career problems, they want to quit their captivating job and break free.

This might be a good idea if your life expectancy is short, although for most it Is not. Having an early start will be very soothing for the future you, the longer you delay, the Buy and Hold strategy will have a diminishing effect. Once the strategy is started, it keeps snowballing and you will start to make good decisions that are lifechanging. Feeling secure in your future will relieve you of stress and you will feel the security few people do. So, from another view, you already have something right away, peace of mind. Another reason Buy and Hold investment may be unappealing in the fact many people are tied to the money they made by working hard, the idea they need to start investing stirs fear, they are hanging to the money they have. This is not a wise decision.
The book “The Richest Man In Babylon” by George S. Clason is a classic but the most interesting part is when a poor man comes to the rich and asks him how to become rich. The answer is first you need to earn 10 coins a month, then, put one away. Make this a rule you will not break. The poor guy protested, stating he will not have anything left at the end of the month, he needs every penny. This is not an option, however, to become rich you will need to make this step. After a while, the poor man came back and said there is no difference except now he has some savings, and that he never felt better.

Even if you are a good, profitable trader, earning money in one way is the same as saying you are putting all eggs in one basket. Not wise, you should play the offense and defense at the same time. The defense analogy part is known as Passive Income. The best teams play both sides, why not you. While you are making nice gains off Forex, do not spend the whole batch, set one part aside, and create your evergrowing capital. This move will take trading anxiety away because even when your trading comes to a halt, you will have the Passive side still working behind the scene. Imagine that terrible month where all of your previous year gains are negated, it feels like a year is wasted. But if you have that other Passive side, it will not feel that bad.

The Mystery of Buy and Hold Strategies

Buy and Hold strategies are not explained and not present on the internet, because the internet places the most popular first, not the most beneficial to you. So how we can use our forex trading skills to become better than most of the population who is doing this? Some common sense takeaways are often overlooked with this strategy and we, as forex traders will know what to do better. There is a lot of ways you cad do a Buy and Hold strategy. They are not all great but let us start with the Buy and Hold Forever idea. This one is not too bad to follow, there are a good argument and logic behind this strategy. When you look at the stocks or Indexes history, they just rise up and up, even when they crash a bit they end up recovering and rising again. The history will repeat, cycles will do their thing until the repetition does not hold and something new occurs.

That equities rally may just stop rising, you simply do not know. All you have are the odds. The odds imply that it does not matter when you enter the market with the Buy and Hold forever strategy as long you keep that forever mentality. This means if you invest in Gold and it starts to decline in price, you do not blink, do not bailout. On the contrary, this is an opportunity to buy more, you are playing the long haul. The plan is set here to hold the asset for a very very long time as the price moves up and up. Withdrawal is not set in the plan and it is not uncommon people never withdraw. They might come to the point of old age where all that money is not very useful to them and pass it on to their kids. There are many iterations of this approach and there is nothing wrong with it.

The Buy and Hold until you cash out big is the one with many weak spots, and here is why. The plan is to collect all the investments and put everything into the pocket. This form of Buy and Hold is very common, especially with the people who are into investments. They may have an idea to wait until the price is very high (high relative to what?) and cash it out, then use the money for something else or just count the bills. This plan is not a good one. Until you have a precise number when this investment ends, it is not a good plan. Now, for example, if we take an excited blackjack player who comes with just $100 and lifts his game to $40.000, he will just keep playing. He will play $40,000 for more until he is back to $100 all in one day. These people did not have a plan.

The same people who bought Bitcoin when it was just $1000, hyping when it reached almost $20,000. Then the talk about the BTC made millionaires circles, but the truth is only about 40 out of hundreds of thousands of people got out at the right time. The majority let the hype run and when it is over some may even go with the Buy and Hold Forever strategy. Od course, they would for sure sell near the $20,000 mark and buy it back when it went down if this option is available. After all, just be sure to avoid this strategy.

Forex would like the approach with a structure, even in the Buy and Hold strategy. This is a type where investors Buy and Hold and cash out along the way. Where are the points in time and level where you cash out, is subjective. It depends on the investor’s tolerance, how long to hold, and what is the asset held. Forex traders will have a plan and structure for this. Again, having a passive income element is very important as your trading will not be as great as before.

Long-Term Swing Trading

Long-term Swing trading types may not really be in the category of the Buy and Hold idea, but it is also very interesting for forex traders who have a plan and a system. More on this strategy later. Just to point out what makes forex traders better right off the bat is their Money Management structure. Without Money Management, there is no money. If you are strictly following the Buy and Hold Forever strategy then you probably do not need to worry about Money Management.

However, people who follow this strategy fail with their psychology trading element. When you think of it, all they have to do is invest and do nothing. The do-nothing part is a very hard thing to do it seems. Warren Buffet can do it but most cannot. When the markets stir up with volatility, their fears kick in as their asset is going down. Then they get out at the wrong time. Trading by fee is the worst possible way to trade, and it is often what beginner traders do, not just forex traders. So it can be said that all decision making is just better when the emotions are not in the way. Forex traders beat this with their systems. Unfortunately, others do not have the system. The rules for forex trading is easy. Trade according to your system, then go away, and repeat.

Taking the above into consideration, we can create some common-sense rules you can follow. Just by using these general pointers and then create your strategies over time, you will probably do very well with the Buy and Hold investing. Have a plan. Most do not have one, which gives you an advantage right away. Execute the plan. Write it down and follow it like it is holy. Writing it down will also write it in your mind. This will make a psychological effect that helps to obey the plan. A forex trader can also use their trading platforms to set Take Profit levels, etc.

You may be caught in a mania, an emotional excitement when your asset shoots up. There will be an urge to move that TP level higher or cancel it altogether just to see where is the limit of this fortune. If your plan set the TP, then messing around with it is not an option, no exceptions. There are no regrets, as another opportunity always shows up. Regret is another emotion that may cause bad decisions so enjoy your cool just by following the plan no matter what. At the begging, you will have these urges, but in time it will vanish.

Buy and Hold Cash Out

Now let us go back to that Buy and Hold and cash out along the way strategy where you can apply the plan. Forex traders already have their Money Management plan so they can set a Stop Loss if it is not a Buy and Hold Forever type. How deep the SL level will be is on the trader to determine, but have one in place. Have a Take Profit level too at some nice gain point, at least one, and then move your SL to breakeven when TP gets hit. This is all basic common sense and an example you should already know if you are a forex trader. In the Buy and Hold strategies, it is also applicable.

Since in this type you cash out along the way, you can put multiple TP levels and leave that little bit in the asset. That little bit can be saved for your potential “flyer” rally breaking the sky limits with the trailing stop so you do not miss those life-changing investments. It may not be amazing that just a part of your initial investment captured that rally but you can rest easy, you have a system that is making it all happen again. This basic plan will get you in the top 95-99% of investors, and it can even get better.

So we know we have great odds in our favor by having a plan, but nowadays we also have the ability to go short, not just long. We can do it on gold, commodities, ETFs, and many more assets. This almost double our odds, there is no need now to sit out the drops. Surprisingly, many people do not use this ability and there is no reason why forex traders should too. Further improvement of the forex trader odds is by selecting the assets that almost have no chance of dropping to zero or going so low they do not have a chance of recovery. These assets are stocks, some companies do not have chances of recovery, for example like Sears. Gold is an asset that will probably not going to drop to zero, Energy ETF baskets too. The final and great advantage forex traders have is their technical analysis system. With the well made and tested system forex traders have better odds than investors and even financial advisors.

Now you need to decide do you want to Sell and Hold or Buy. There are many inverted ETFs that will allow you to short indexes. So are we in the seller’s market or the buyer’s market now? If you think we are in the cyclic bubble right now then you may go in the selling direction but know that you might be wrong. This means you should not go all-in on the short side. Also, the algorithm will tell when is the right time to make a trade. The timeframe used for trading is not optimal for long term investment so increasing to monthly is recommended.

For that Long term Swing trading strategy, the weekly timeframe is the most optimal. Swing trading on this timeframe is not really considered Buy and Hold but it is for those who want to participate in the price action. If you have the system that works universally on every timeframe, then why not use it to squeeze more. Whatsmore, trading on a weekly will relieve you of the trouble if the market is in the sellers or buyers zone.

Categories
Forex Basic Strategies Forex Daily Topic

An Old Theory about Support/Resistance

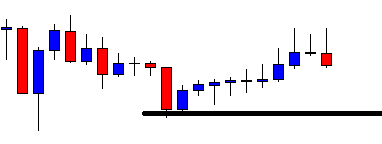
In price action trading, traders rely on support/resistance a lot. Beginners often ask a question of whether they are predetermined. In answer to this, they are predetermined to some extent. A trader can guess level/levels that may work as support/resistance. The idea is simple. Support becomes resistance, and resistance becomes support. In today’s lesson, we are going to demonstrate an example of this.

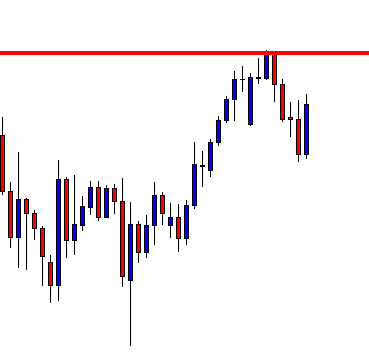
The price has a bounce at the drawn level and heads towards the North. The last candle comes out as a bearish engulfing candle. The price may head towards the South. If that happens, the sellers are to wait for a breakout at the drawn level. Let us proceed to find out what happens next.

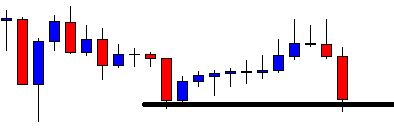
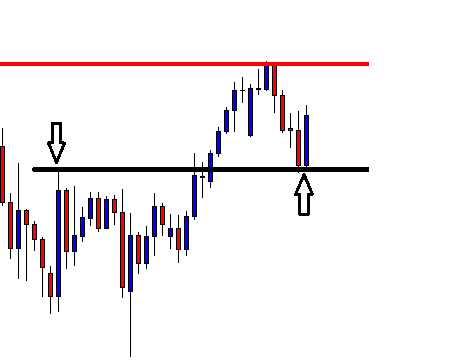
The next candle comes out as a bearish candle as well. However, it does not make a breakout. This is an interesting chart for both the buyers and the sellers. The buyers may wait to get a bullish reversal. Since this is the level where the price has bounce earlier, this may become double bottom support. On the contrary, if the price makes a bearish breakout at the drawn level, the sellers dominate in the pair.

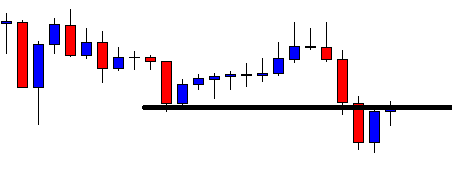
The bear wins. The last candle closes well below the drawn level. This is an explicit breakout. The sellers are to wait for the breakout confirmation. If the chart produces another bearish candle closing below the last candle, the price may find its next resistance at another significant level. In most cases, the price usually goes back and finds its resistance at the breakout level, which was the level of support earlier.

Look at the chart. The price goes back to the breakout level and creates a doji candle. Do you notice the doji candle is produced right at the drawn level? This means the level may drive the price towards the South by being the level of resistance.

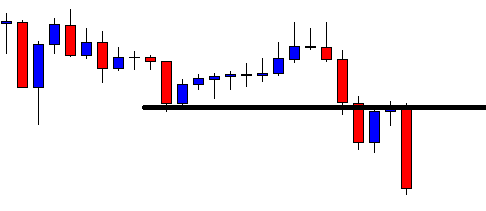
The level produces a bearish engulfing candle closing below consolidation support (This may become resistance later as well). The last candle suggests that the price may head towards the South with good bearish momentum. The sellers have found the new resistance.

As expected, the price heads towards the South for one more candle. It usually happens when support/resistance produces an engulfing candle as a reversal candle. In the end, a level of support flips and becomes a level of resistance. If we closely observe, we find this is what happens almost every time. Support becomes resistance, and vice versa. By obeying the theory, experienced traders spot out the levels of support/resistance well ahead.

Categories
Forex Basic Strategies Forex Daily Topic

Partial Profit-taking and Decision-making

Traders on major charts such as the daily and the H4 often take partial profits and let the rest of the trade run to earn more profit. This is an effective way to earn more pips without any doubt. Yes, to do that, traders need to have good ideas about price action and enough experience to interpret the market’s language. In today’s lesson, we are going to demonstrate an example of partial profit-taking and a situation where traders to make a decision. Let us get started.

This is an H4 chart. The price heads towards the North with good bullish momentum. It then consolidates and produces a bullish engulfing candle. The buyers may trigger a long entry right after the last candle closes. Typically, the buyers shall aim to earn 1R.

The next candle comes out as a bullish candle as well. Things look suitable for buyers. It seems they do not have to wait too long to achieve 1R. Let us proceed to the next chart.

Things do not go according to the buyers’ expectations. However, the price hits their 1R target. Look at the last candle. It comes out as a bullish engulfing candle. Thus, the buyers may consider taking partial profit and let the rest of the trade run. Let us assume that the buyers take out their 50% trade. With 1R, they have free trade running.

After two more candles, things look a bit different. Anyway, the buyers must be patient and hold their positions. Overall, price action has been very bullish biased.

After a long while, the price does not know where to go. It gets trapped within two horizontal levels. Have a guess. What should you do here? It is an H4 chart, and the price action has been very choppy recently.

Yes, traders may close the rest of the entry as well. The price is at the breakeven (a bit above). Traders get ½ R here. In most cases, partial profit-taking rewards more. However, in some cases, it may not give us the maximum reward. Another important thing with partial profit-taking is it is to be applied when we trade only on the major charts. We may not consider taking partial profit if we trade on the 5M, the 15M, or the H1 chart. With partial profit-taking, we need to be well acquainted with using trailing stops as well. Only that is when we will be able to make the most out of it.

Categories
Forex Basic Strategies

No Breakout Confirmation or No Consolidation Means No Entry

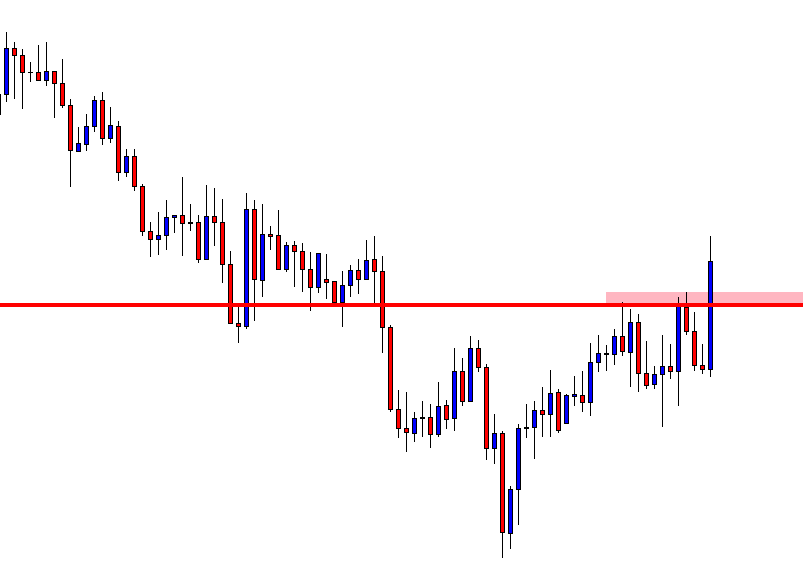
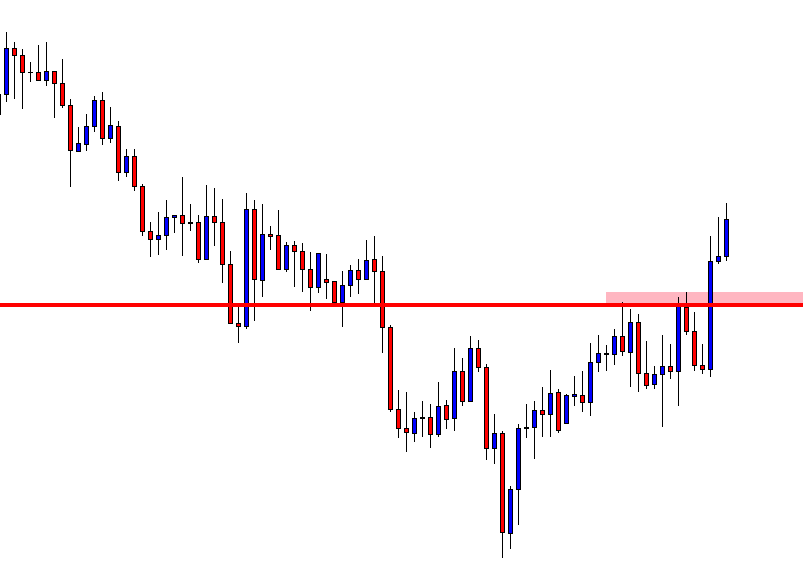
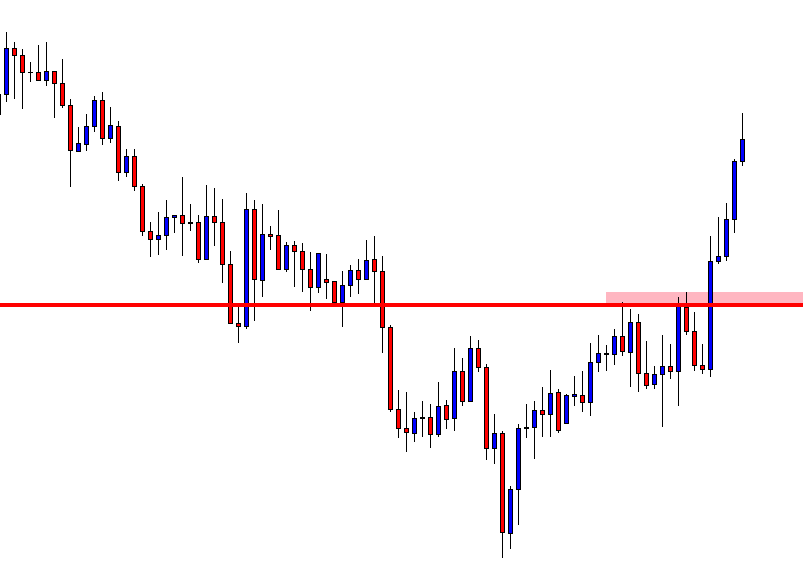
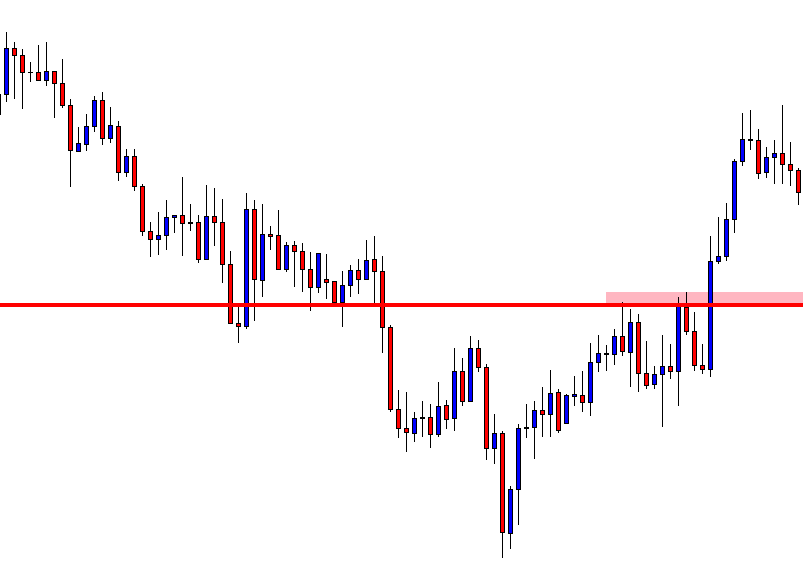
Price Action traders crave for the breakout. Breakout is one of the most important components of price action trading. However, there is another equally important thing, which is breakout confirmation. Since the Forex market is very action-packed, it is often found that the price does not come up to the breakout level to confirm the breakout. It consolidates and produces a reversal candle to offer entry. The question is, does it always consolidate and offer an entry.

Let us find out.

The price headed towards the South and seems to have found its support. It has been heading towards the North now. The price is at the last swing high. Thus, the buyers are to wait for an upside breakout and breakout confirmation to take a long entry.

The price makes a breakout, but at the time of confirmation, it comes back in. Thus, the breakout is void. It goes towards the upside again. This time it gets rejected from the last swing high. Thus, the price does not make any breakout here.

This time it does. A huge bullish engulfing candle breaches the last swing high. That is a Double Top resistance as well. The buyers are to wait for the price to come back at the breakout level and get a bullish reversal candle right there. Alternatively, it may consolidate somewhere in between the highest high and the breakout level.

It keeps going up. Let us not give up but keep eyeing on the pair. It has gone too far up. It may not come back at the breakout level. It may rather consolidate. Let us find out what it does.

It keeps going towards the North. There is no sign of consolidation yet. A swing high on the chart is evident, which is nearby. As things stand, risk-reward is getting less lucrative.

As expected, the price has found its resistance before the level of the last swing high. The price action gets choppy. Traders are to wait for the price to give them the next direction. In a word, price action traders do not keep this kind of chart on their watch list.

The Bottom Line

A chart looked extremely good and was about to give us an entry ended up being a choppy chart. What more frustrating is it went towards the desired direction, but it did not offer us entry. Some traders may think it would be good if an entry is taken. At least some pips can be achieved. Please note, do not even think about it. After breakout, the price must confirm the breakout or consolidate. To sum up the whole equation, no confirmation or no consolidation means no entry.

Categories
Forex Basic Strategies

Is Drawing One Trendline Enough?

The Trendline is an excellent trading tool that the price action traders love using on their charts. Drawing trendline as accurate as it can get and adjustment with spikes are two factors that traders are to look after before using trendline. Another factor trendline traders often need to do is drawing multiple trendlines on the same chart. In this lesson, we are going to demonstrate an example of that.

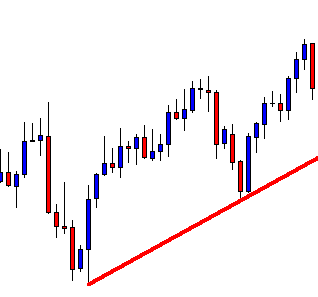
The chart shows that the price after finding its support at the trendline heads towards the North and makes a new highest high. Thus, this is a valid trendline. Ideally, the buyers are to wait for the price to come back to the trendline again and to produce a bullish reversal candle to go long on the pair. Let us proceed to find out what happens next.

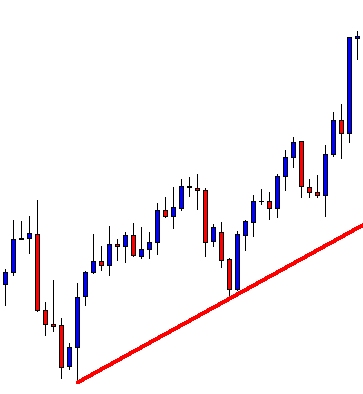
The price does not come at the trendline. It finds its support well above the trendline and heads towards the North again. This is annoying, is not it? Do not get annoyed. Concentrate on the chart. Do you see anything interesting? Have a look at the next chart.

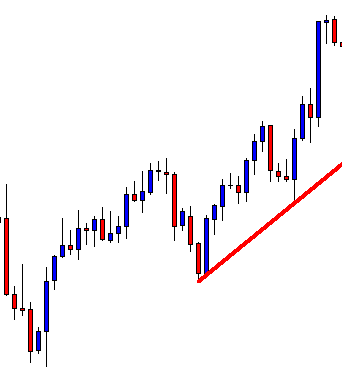
We can draw another trendline on the same chart since the price has a bounce and makes a new highest high. Traders are to wait again for the price to come back at the trendline and to produce a bullish reversal candle to offer them a long entry.

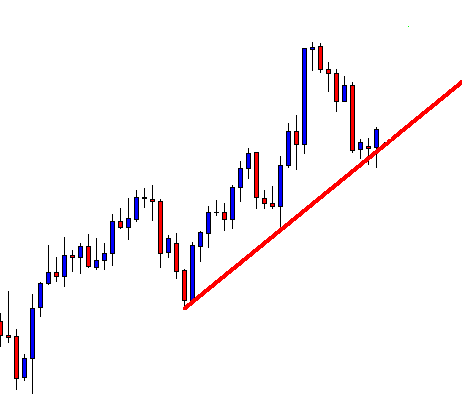
Wow, this time, the price comes at the trendline and produces a bullish reversal candle. Traders have been waiting for such price action. By flipping over to the next chart and an upside breakout, traders may grab some green pips.

The chart shows that the price comes back near the trendline’s support again, then heads towards the North. It consolidates hard on the minor charts, as it seems. The point here is that the price does not come at the first drawn trendline or produces a bullish reversal candle. It comes at the second drawn line, and this time, it creates the bullish reversal candle right at the trendline’s support. It heads towards the North and may have offered entry as well.

The Bottom Line

In most cases, the price does not come at the first drawn trendline. It has the tendency to come at the second drawn trendline more. It is often seen that the price obeys the third drawn trendline as well. Thus, if we are to trade on the trendline, we may keep an eye on the chart to draw a trendline as many times as we need to.

Categories
Forex Basic Strategies

The H4-H1, an Action-Packed Combination

In today’s lesson, we are going to demonstrate an example of the H4 and the H1 chart combination for taking entries. Both are intraday charts. A large number of traders do the job using those two charts. Thus, it is an excellent combination to trade in the Forex market.

Let us get started.

This is an H4 chart. The chart shows that the price heads towards the North. On its way, it made an upside breakout, which may play a vital role in pushing the price towards the North further. Despite having a long lower shadow, the last candle comes out as an Engulfing candle. The price may start its correction this time.

As expected, the price comes down to the flipped support and produces a bullish engulfing candle. The last swing high is far enough to offer a 1:1 risk-reward. However, we do not take an entry right after the candle H4 closes. We rather switch over to the H1 chart.

This is how the H1 chart looks. It shows that the price starts having correction by producing a Doji candle. An engulfing bullish candle closing above the Doji candle is the signal to go long here. Let us wait for a Marubozu bullish candle.

This is one good-looking Marubozu bullish candle. However, it closes right at the resistance zone. Risk-reward is 100:0 here. We must wait for an H1 consolidation and breakout towards the upside to take a long entry.

Here they come. The price consolidates and produces an H1 bullish candle, which closes above the resistance. Traders may trigger a long entry right after the candle closes by setting stop loss below the last support. The H1 chart does not show any resistance nearby. Thus, the price may head towards the North with good bullish momentum. It may get us 1:2 risk-reward or even more. Usually, the price reverses once 1:1 risk-reward is achieved. Let us find out what happens here.

The price consolidates much earlier than our expectations. Our reward is not achieved. Thus, we keep holding our position. We are risking a loss here. However, we must keep our patience.

The price makes another upside breakout and heads towards the North. The wave gets us our expected reward and starts having a pullback. If we have not set our take profit, we may manually close it; or we may use a trailing stop loss. We will demonstrate some examples of using trailing stop loss in this combination in upcoming lessons.

The Bottom Line

The H4-H1 combination is an eventful combination. A Trader needs to have skill, expertise, experience, and patience to handle it. Once he learns it well, it may have his hands full in making money by trading.

Categories
Forex Basic Strategies Forex Daily Topic

A Story of an Early Exit

Risk-Reward is a factor, which every successful trader takes care of. Before choosing a chart to take an entry, the first thing that is to be considered is the trend, then the risk-reward factor. Once we have set our Take Profit and Stop Loss level, we shall leave the entry either to hit the Stop Loss or the Profit Target. However, today, we are going to demonstrate an example of an early exit.

This is an H4 chart. The chart shows that the price has found its support as well as a resistance zone. After having a final rejection, it makes a move towards the downside. Then, it heads towards the North now (see the next image). Another rejection and bearish reversal candle at the resistance zone may produce a short entry.

The last H4 candle is bullish. However, the candle closes within the resistance zone. It may go either way. The buyers may get an upside breakout; the sellers may get a bearish reversal. Let us proceed to find out what happens next.

In the above chart, we can see one good-looking bearish Marubozu candle. The candle suggests that the sellers may wait for consolidation and downside breakout to take a short entry. The candle forms at a Double Top resistance as well. The price may consolidate around the neckline level.

As expected, the price starts having correction around the neckline level. It needs to find its resistance and produce an H4 bearish reversal candle along with a breakout at the neckline.

Here it comes. The last candle engulfs all the candles by closing below the neckline. An entry may be triggered right after the candle closes. The price has enough space to travel down to the red-marked line, which allows an excellent risk-reward. However, there is a support level in between, that may hold the price for a while.

The price heads towards that level with good bearish momentum. The way it has been going, it may hit the red-marked level within four/five H4 candles. This means one more trading day may be required to hit the original Take-Profit level.

The in-between level is a vital level, which produces the H4 bullish reversal candle. The price has reacted several times at that level earlier. Usually, we must stick with our original Profit-taking target. However, it is also legit to close our entry right after the last candle closes. A question may be raised “why do we close our entry here?”

Reasons for Early Exit

There are two reasons

  1. The support level is significantly strong
  2. The current bar is the last H4 Friday’s candle, which means the market closes once the candle is finished.

The Bottom Line

When using the Weekly and the Daily charts, traders are to let their opened positions to reach the target during the weekend. However, intraday traders should consider closing their floating trade before the week’s end. Mondays often start with a big gap, which may hurt intraday Stop Losses.


Categories
Forex Basic Strategies

Even a Choppy Price Action Offers Entries

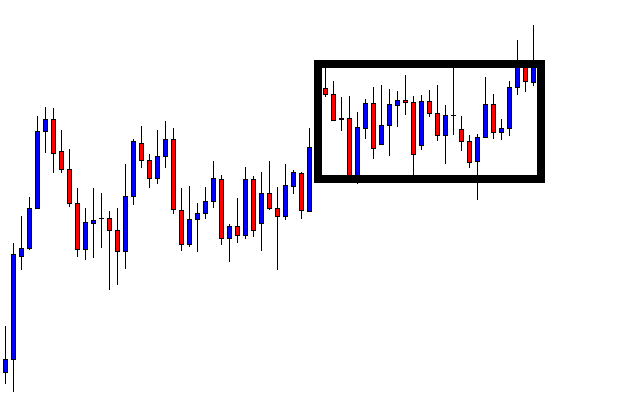
The market moves in three ways upward, downward, and sideways. In today’s lesson, we are going to demonstrate an example of a Rectangle breakout and an entry from a choppy price action. Let us have a look at the chart below.

The price action is choppy in this chart. Typically, traders avoid this kind of price movement. However, if we want to take trading as a full-time business, we are to widen our eyes. An entry can be found even in this market. Concentrate on the rectangle drawn here. After all these bounces, rejections the price finds its support and resistance within the rectangle.

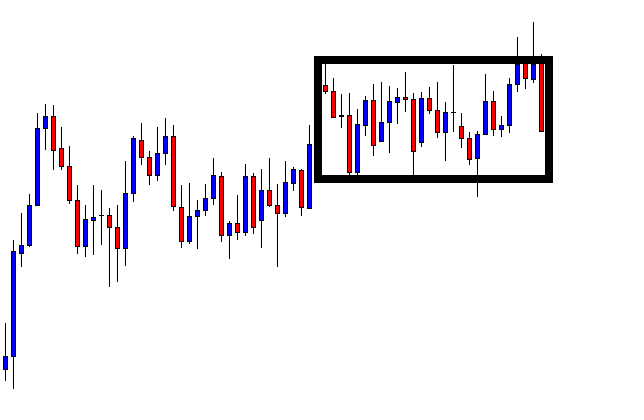
The chart produces a bearish engulfing candle right at the resistance of the rectangle. This is a sign that something may happen. Let us assume a bearish move may occur. The first candle of the bearish trend looks good. A downside breakout with good momentum is the second thing that the sellers may wait to get.

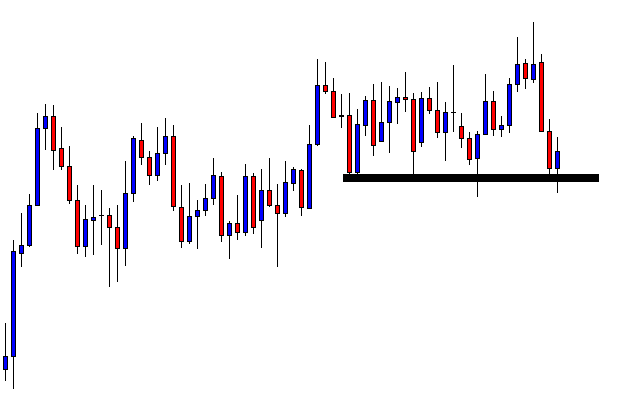
The next candle comes out as a bearish candle followed by an Inside Bar. Things are getting better for the sellers. A bearish engulfing candle closing below the support would be the signal to go short for the sellers.

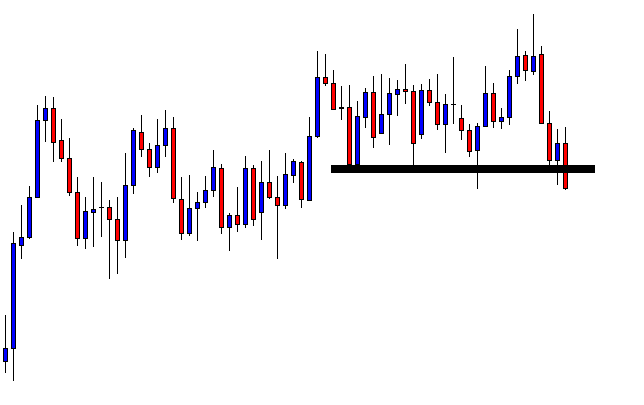
Here it is. The breakout candle is a bearish Marubozu candle. We may trigger a short entry right after the candle closes. Let us find out where we will set our Stop Loss.

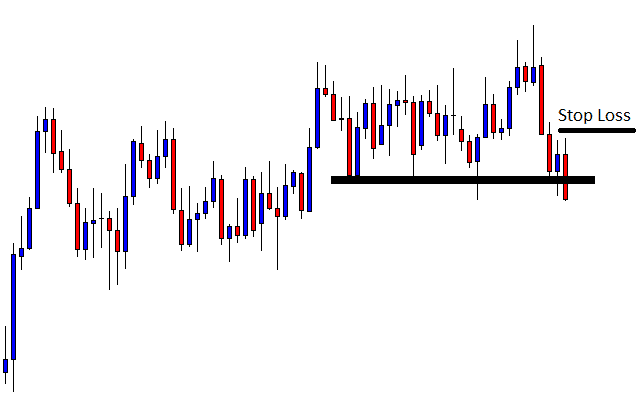
Many traders may suggest setting the Stop Loss above the resistance of the rectangle and setting the Take Profit with the same distance. This is a good idea. However, we may set our stop-loss just above the resistance of the last consolidation. The reason is the price consolidates before making the breakout at the support. If the price made a breakout without the consolidation, we would have set our Stop Loss differently. By setting Stop Loss above the last consolidation’s resistance, we are to keep an eye with our Take Profit level.

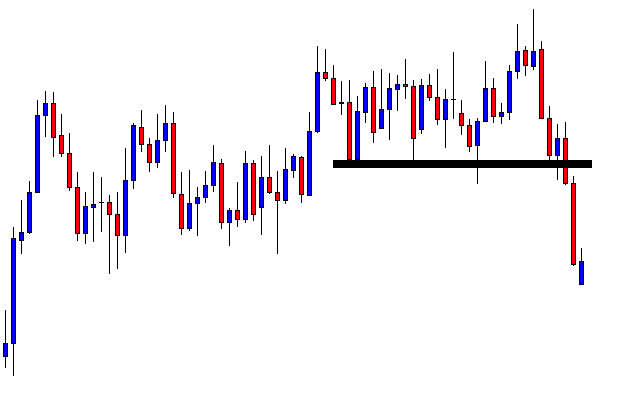
We may set our Take Profit all the way down at the last swing low. The price may have kept going towards the major support. Look at the chart above. What do you think? The price is still very bearish but it produces a bullish reversal. That is too with a gap. The price action traders do not like price gaps. Considering the fact that we have set our Stop Loss as close as it can get, thus it may be the time to close our trade and come out with the profit.

The Bottom Line

Even a choppy market ends up producing an excellent trading signal. Our first choice shall be trending markets to look for entries. However, if we can spot out some entries from the choppy market, it would surely make us be more profitable.

Categories
Forex Basic Strategies

A Twist in the Tale

The Forex market can be very unpredictable. It is a game of probability. With more experience and knowledge, a trader increases the chance to be right in making a trading decision. Having immaculate risk management is another aspect that keeps a trader safe with his investment. In today’s lesson, we are going to talk about the unpredictability of the market.

Let us start with a daily chart of a Forex pair.

The price makes a bullish move and finds its resistance. After four daily candles, the daily chart produces a bullish engulfing daily candle. This is a powerful bullish reversal candle, which forms right at a flipped support. Have a look at the chart below.

The chart above shows that the bullish engulfing candle forms at the flipped support. This means buyers on this chart are to go long on a chart pattern called ‘ABC’ or ‘123’. This is a lucrative and consistent chart pattern, which price action traders love to trade. Let us find out what happens next.

The price stalls and has a rejection at the same level. The buyers would love to get a breakout here to go long and grab some green pips. However, the chart produces a bearish engulfing candle instead. What do you think a trader should do here?

He shall start looking for short opportunities. This is the daily chart. Thus, he shall flip over to the H4 chart to find out a short opportunity.

This is how the H4 chart looks. A very strong bearish candle followed by a little Inside Bar. The trader (the seller) is to wait for consolidation and a bearish reversal candle to go short.

The price consolidates more. It produces a good-looking bullish candle. Let us find out how the next candle comes out. Do not forget that the sellers are waiting to get a bearish reversal candle breaching the lowest low.

This is it. A bearish engulfing candle closes below the level of support. The sellers have been waiting to get a signal candle like this. A short entry may be triggered right after the last candle closes. Let us find out what happens next.

As expected, the price heads towards the South with good bearish momentum. We see the first H4 bullish reversal candle forming at the daily support as well. This may be time to take out the profit.

The Bottom Line

Do you notice how things change within a candle? Before that bearish engulfing daily candle, the pair looks extremely good for the buyers. An upside breakout would make them go long on the pair and push the price towards the North. However, that does not happen, but the price comes down instead. This is what I call “Twist in the tale.” Forex traders often get these twists.

Categories
Forex Basic Strategies

Moving Average Strategies: Three Simple Moving Averages Part 2

In the article “Moving Average Strategies: Three Simple Moving Averages Part 1”, we have come to know how three simple moving averages on a chart help us detect a trend. In this article, we will demonstrate how and where to take entries with the help of ‘Three SMAs”.

A Moving Average is an indicator that shows trends as well as it acts as support/resistance. In a buying market, it acts as support whereas it serves as a resistance in a selling market. Let us have a look at how it works as resistance and offers us entries in a selling market.

We have inserted “Three SMAs” with the value of 200, 100 and 50 on this chart. The chart shows that the price has been down-trending nicely as far as “Three SMAs” rules are concerned. Please notice that every time the price goes back to the 50- Period Simple Moving Average, it comes down. However, in some cases, the price makes a bit bigger move than the others. We need to understand which one is to make a bigger move and offers us an entry. Can you spot out the differences?

Have a look at the same chart below.

Look at the arrowed candle. The price comes down with a better pace and travels more after those marked candles. There are several reasons for this.

  1. The price goes back to the 50- Period Simple Moving Average; touches (or very adjacent to it).
  2. The bearish reversal candles are engulfing candle.

In some cases, the price starts down-trending without touching the 50-Period Simple Moving Average, it does not travel a good distance towards the downside. It rather goes back again; touches it and then makes a bigger move.

At the very left, the first arrowed candle, the bearish engulfing candle does not touch the Moving Average, but one of the bullish candles has had rejection at the 50-Period Simple Moving Average, thus this is an entry. However, see the very next candle comes out as a corrective candle. This means the sellers are not that sanguine since the bearish reversal candle is not produced right at the 50-Period Simple Moving Average.

With the second and third arrowed candles, they are produced right at the 50-Period Simple Moving Average and both of them are bearish engulfing candles. Those two are perfect entries as far as ‘Three SMAs’ is concerned.

At the very right, the last arrowed candle is very adjacent to the 50-Period Simple Moving Average and produces a bearish engulfing candle.  Most likely, the price would head towards the South again. However, “Three SMAs” does not recommend that we shall take an entry here.

We will learn more strategies with Moving Average in our fore coming articles. Keep in touch.


Categories
Forex Basic Strategies

Moving Average Strategies: Three Simple Moving Averages Part 1

Moving Average (MA) is the most widely used indicator which has long been used by the traders in the financial markets. It is a trend detecting indicator. Since detecting trends is one of the most important key components of trading, visual representation of a trend by Moving Average makes it be a favorite indicator among the financial traders.

There are multiple Moving Average strategies used by traders. In this lesson, we are going to learn a strategy called “Three SMAs”. It is a strategy with three Simple Moving Averages; these are Simple Moving Average 200, Simple Moving Average 100 and Simple Moving Average 50.

Let us now have a look at how a chart looks like with “Three SMAs”.

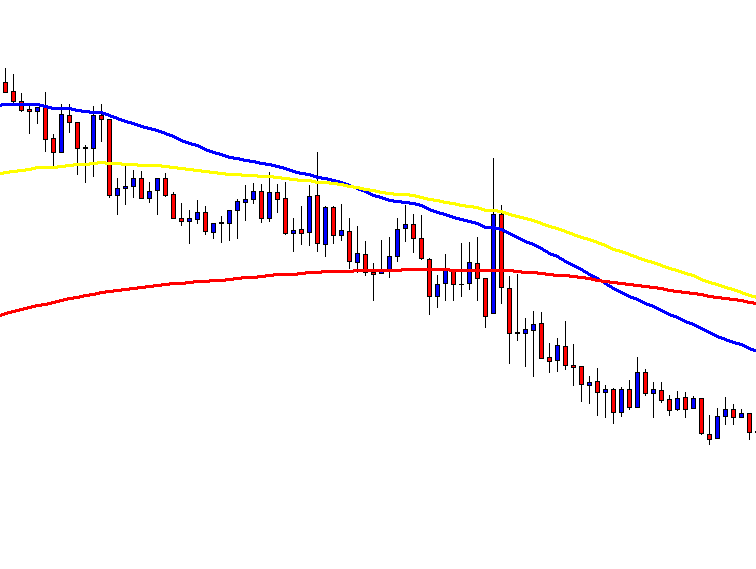
This is how the charts look like most of the time. The red one is 200-period Simple Moving Average, the yellow one is the 100-period SMA and the blue one is  50-period SMA. It is better to use different colors so that we can identify them easily.

In the chart above, we see that the price gets caught in between those Moving Averages to start with. The price comes further down, but the 50-SMA stays between the100-SMA and the 200-SMA. What does “Three SMAs” suggest to us here? It suggests that the price does not have a solid trend.

In the naked eyes, the price action suggests that the asset is down-trending. However, by having “Three SMAs”, we can identify solid down-trend has not been established yet. This is why many price action traders use “Three SMA’s” to be sanguine about the trend. Ideally, this is not a chart that we should look for entries.

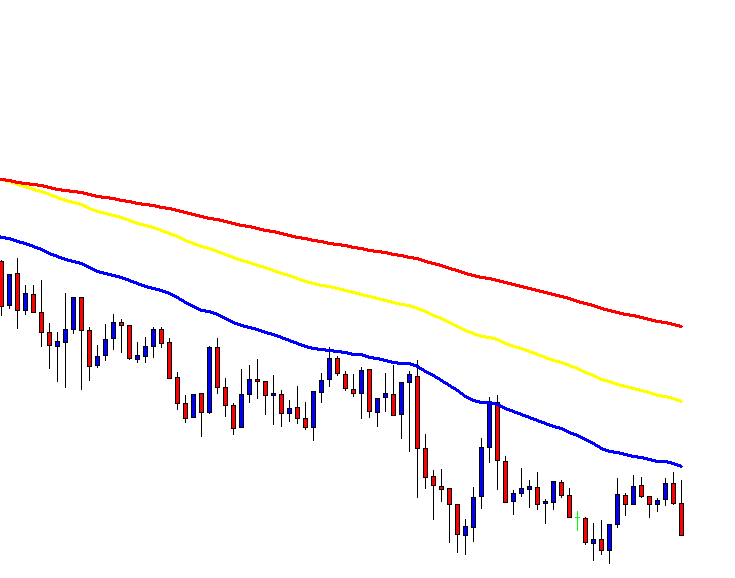
The question is how a trading chart should look like with “Three SMAs” to look for entries. Let us have a look at the chart below.

The difference is very evident here. See how they have been lined up. Moving Average 200 stays on the top; Moving Average 100 stays in between; Moving Average 50 stays at the bottom. This is an ideal chart with “Three SAM’s” to look for short entries.

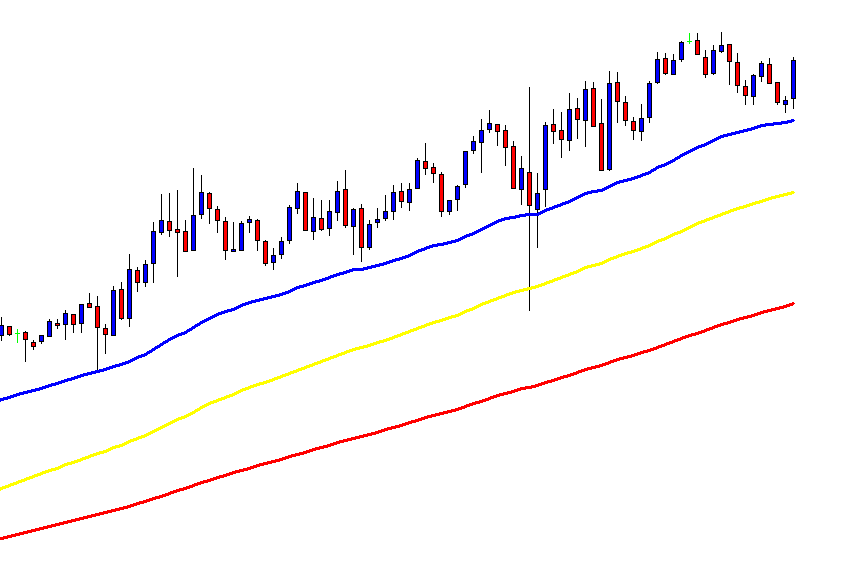
In the case of price is up-trending, this is how it looks like.

In a buying market, they are to be lined up just another way round than the selling market. Look at the chart above. The Moving Average 200 stays at the bottom, Moving Average 100 stays in between and Moving Average 50 stays at the top. In this chart, we shall look for long entries.

“Three SMAs” indicators work wonderfully well with intraday trading. In this lesson, we have used a 15-minute chart and three SMAs with periods of 50,100 and 200. If we want to use other charts such as H1 or H4, we have to change the values. However, the best combination for “Three SMAs” is Moving Averages of 50,100 and 200 on the 15M chart.

We now understand how “Three SMA’s” may help us understand the trend.  Thus, “Three SMA’s” may be integrated with any other strategies for taking entries. Moreover, only “Three SMAs” itself offers us entries as well. In our next article, we will demonstrate how entries are to be taken based on “Three SMAs”.  Stay tuned.